LUND UNIVERSITY
PO Box 117221 00 Lund+46 46-222 00 00
Methods to Improve and Evaluate Spatial Data Infrastructures
Toomanian, Ara
2012
Link to publication
Citation for published version (APA):Toomanian, A. (2012). Methods to Improve and Evaluate Spatial Data Infrastructures. Department of PhysicalGeography and Ecosystem Science, Lund University.
General rightsCopyright and moral rights for the publications made accessible in the public portal are retained by the authorsand/or other copyright owners and it is a condition of accessing publications that users recognise and abide by thelegal requirements associated with these rights.
• Users may download and print one copy of any publication from the public portal for the purpose of private studyor research. • You may not further distribute the material or use it for any profit-making activity or commercial gain • You may freely distribute the URL identifying the publication in the public portalTake down policyIf you believe that this document breaches copyright please contact us providing details, and we will removeaccess to the work immediately and investigate your claim.

Methods to Improve and Evaluate Spatial Data Infrastructures
Ara Toomanian
Centre for Geographical Information Systems (GIS Centre), Department of Physical Geography and Ecosystem Science, Lund University, Sweden
2012

A doctoral thesis at a university in Sweden is produced either as a monograph or as a collection of papers. In the latter case, the introductory part constitutes the formal thesis, which summarizes the accompanying papers already published or manuscripts at various stages (in press, submitted or in preparation).
Copyright © Ara Toomanian
Cover:© Iman Khayatan Centre for Geographical Information Systems (GIS Centre), Department of Physical Geography and Ecosystem Science, Faculty of Science ISBN 978-91-85793-26-6 Printed in Sweden by Media-Tryck, Lund University Lund 2012
Abstract This thesis mainly focuses on methods for improving and evaluating Spatial Data Infrastructures (SDIs). The aim has been threefold: to develop a framework for the management and evaluation of an SDI, to improve the accessibility of spatial data in an SDI, and to improve the cartography in view services in an SDI.
Spatial Data Infrastructure has been identified as an umbrella covering spatial data handling procedures. The long-term implementation of SDI increases the need for short/middle term feedbacks from different perspectives. Thus, a precise strategic plan and accurate objectives have to be defined for the implementation of an efficient environment for spatial data collection and exchange in a region.
In this thesis, a comprehensive study was conducted to review the current methods in the business management literature to approach to an integrated framework for the implementation and evaluation of SDIs. In this context, four techniques were described and the usability of each technique in several aspects of SDI implementation was discussed.
SDI evaluation has been considered as one of the main challenges in recent years. Lack of a general goal oriented framework to assess an SDI from different perspectives was one of the main concerns of this thesis. Among a number of the current methods in this research area, we focused on the Balanced Scorecard (BSC) as a general evaluation framework covering all perspectives in an SDI.
The assessment study opened a window to a number of important issues that ranged from the technical to the cartographic aspects of spatial data exchange in an SDI. To access the required datasets in an SDI, clearinghouse networks have been developed as a gateway to the data repositories. However, traditional clearinghouse networks do not satisfy the end user requirements. By adding a number of functionalities, we proposed a methodology to increase the percentage of accessing required data. These methods were based on predefined rules and additional procedures within web processing services and service composition subjects to develop an expert system based clearinghouses.
From the cartography viewpoint, current methods for spatial data presentation do not satisfy the user requirements in an SDI environment. The main presentation problem occurs when spatial data are integrated from different sources. For appropriate cartography, we propose a number

of methods, such as the polygon overlay method, which is an icon placement approach, to emphasize the more important layers and the color saturation method to decrease the color saturation of the unimportant layers and emphasize the foreground layer according to the visual hierarchy concept.
Another cartographic challenge is the geometrical and topological conflicts in data shown in view services. The geometrical inconsistency is due to the artificial discrepancy that occurs when displaying connected information from different sources, which is caused by inaccuracies and different levels of details in the datasets. The semantic conflict is related to the definition of the related features, i.e., to the information models of the datasets. To overcome these conflicts and to fix the topological and geometric conflicts we use a semantic based expert system by utilizing an automatic cartography core containing a semantic rule based component. We proposed a system architecture that has an OWL (Web Ontology Language) based expert system to improve the cartography by adjusting and resolving topological and geometrical conflicts in geoportals.

Svensk sammanfattning
Denna avhandling är inriktad på metoder för att förbättra och utvärdera infrastrukturer för geografiska data (eng. Spatial Data Infrastructure). Syftet har varit trefaldigt: att utveckla ett ramverk för hantering och utvärdering av en infrastruktur, att förbättra tillgängligheten av geografiska data i en infrastruktur, och för att förbättra kartografi i visningstjänster i en infrastruktur.
En infrastruktur för geografiska data har identifierats som ett paraply som täcker hela hanteringen av geografiska data. Det långsiktiga genomförandet av en infrastruktur ökar behovet för återkopplingar från skilda perspektiv både på kort och medellång sikt. I grunden behövs en strategisk plan med konkreta mål för effektiv datainsamling och bra utbyte av geografiska data.
Den första studien i denna avhandling granskar hur metoder inom företagsutveckling kan användas för utveckling och utvärdering av en geografisk infrastruktur. Sammanlagt har fyra tekniker studerats och deras relevans för arbete med en geografisk infrastruktur diskuterats. För utvärdering av en geografisk infrastruktur rekommenderas användning av Balanced Scorecard (BSC). Fördelen med denna utvärderingsmetod är att den bildar ett ramverk där man kan studera infrastrukturen från flera perspektiv och även studera hur olika utvärderingsparametrar kan på påverka varandra över tiden. Detta studeras närmare i den andra studien i avhandlingen.
Ett huvudsyfte med en geografisk infrastruktur är att skapa en portal för distribution av geografiska data till användarna. Till denna portal, som ofta benämns geoportal, kopplas producenternas karttjänster, dvs. en användare ska kunna nå alla producenternas data via portalen. I den tredje studien utvecklade vi metoder för att bearbeta producenternas data för att bättre svara mot slutanvändarnas behov. Dessa metoder integrerades i en portalmiljö. På så sätt skapas en geoportal som har ett större utbud av data.
En användare ska kunna studera geografiska data i en geoportal. Detta leder ofta till problem i de fall då data kommer från olika producenter; data är helt enkelt inte anpassade till sampresentation. I de två avslutande studierna utvecklar vi ett antal kartografiska metoder för sampresentation av data. I fjärde studien inriktar vi oss på problemet hur tillämpningsdata kan överlagra en baskarta utan informationsförlust. I den femte studien

utvecklas en metod för korrekt geometrisk och topologisk integrering av data.

Acknowledgments
During my study there were many people who, without their help, I could not be in this situation and finalize my PhD. Therefore, I would like to take the opportunity to express my deepest gratitude to all of the people who supported me in my study and research work.
First and foremost, I offer my sincerest gratitude to my first supervisor, Lars Harrie. I greatly appreciate him because he improved and shaped my research skills. Without his encouragement, I could not have finished my research. Truly, I greatly admire his style of supervision. I am also thankful for my second supervisor, Ali Mansourian. He opened a new window in my scientific life, which is continuously improving even now. Ali, you are very creative and always full of positive energy which increased my productivity. I will never forget your kind and responsible manner. Additionally, I would like to express my deepest gratitude to my third supervisor, Petter Pilesjö. Aside from being my co-supervisor, he is the one that supports me from A to Z! He always has a solution for any problem and I think that he is one of the heroes of Lund University!
This study was financed by the European Union funding program, Erasmus Mundus “External cooperation Window- lot 7”and Lund University. I am thankful for their support.
I would like to express my gratitude to my parents, my lovely sister, her husband, my dear nephew and my cute niece for supporting me for my entire life. Without their unlimited help, I could not have finished my research.
I am deeply indebted to my lovely wife and her family for their cooperation and support. I will never forget their positive influence on my work during the time that I was far from home.
I want to thank my colleagues and fellow PhD students at the department of physical geography and ecosystem sciences, the GIS Center staff (Karin, Micael, Roger, Mitch, Hanna, Andreas). GIS Center has a positive atmosphere where any scientific mission can be accomplished successfully due to the brilliant and professional synergy among the staff. I also appreciate the department kansli staff for their support, with special thanks to Petra Anderssson.
Special thanks also to all co-authors (Lars, Ali, Petter, Per-Ola, Anders, and Ebrahim), and organizations and authorities (Lantmäteriet, Lund and
I want to thank my colleagues and fellow PhD students at the department of physi-cal geography and ecosystem sciences, the GIS Center staff (Karin, Micael, Roger, Mitch, Hanna, Andreas, Ulrik, Jing and Abdulghani). GIS Center has a positive atmosphere where any scientific mission can be accomplished successfully due to the brilliant and professional synergy among the staff. I also appreciate the department kansli staff for their support, with special thanks to Petra Anderssson.

Helsingborg municipalities), which without their contributions, the research was impossible to be conducted.
I would like to give special thanks to my friends and fellow country mates; without your spiritual support, it would have been difficult for me to stay abroad. I had a very nice time with you during my four years of study in Sweden and learned many things from you, which is a valuable asset for me.
1 Introduction 1
1.1 Background 1
1.2 Problem statement 2
1.3 Objectives 2
1.4 Thesis structure 3
2 Spatial Data Infrastructure fundamental concepts 5
2.1 Introduction 5
2.2 Spatial data 5
2.3 User requirement of spatial data 7
2.4 Spatial data sharing 10
2.5 Spatial Data Infrastructure -SDI 11
2.6 SDI components and nature 13
2.7 Clearinghouse networks 15
2.8 INSPIRE: European SDI initiative 18
3 SDI management and evaluation 20
3.1 Introduction 20
3.2 Overview of SDI evaluation research 20
4 Spatial web service composition 24
4.1 Introduction 24
4.2 Web processing service applications 25
4.3 Applications of service composition 26
4.4 Semantic web services 27
4.5 Methods to increase accessibility 28
5 Cartographic aspects of SDI 31
5.1 Fundamentals of cartography 31
Contents

5.2 Map design and symbolization 31
5.3 OGC standards for web cartography 36
5.4 Cartographic challenges in view services 37
6 Summary of papers 41
6.1 Paper I 41
6.2 Paper II 43
6.3 Paper III 45
6.4 Paper IV 46
6.5 Paper V 48
7 Conclusions 49
8 References 51
1
1 Introduction
1.1 Background
With the development of technology, digital spatial data have become increasingly important. The public sector, private companies and the public attempt to collect and produce spatial data a decision making tool. Strategic planning, risk analysis, site selection, and route finding are some of the major applications.
The collection and production of spatial data are time consuming and costly. Additionally, the production of spatial data from spatial raw data requires professionals, experts and advanced skills. A number of important challenges in this area influence spatial data collection, such as lack of coordination and collaboration, duplicate or parallel activities, and spatial data collection within two or several organizations. These types of duplicated work waste both financial and human resources.
To overcome different aspects of the current challenges in spatial data handling, a Spatial Data Infrastructure (SDI) has been introduced. An SDI is a collaborative environment for managing, storing, and exchanging spatial data. An SDI includes technical, social, institutional and political issues as well as financial challenges; hence SDI is an umbrella concept covering the entire spatial data handling domain (Groot and McLaughlin, 2000).
Currently, SDIs are implemented in numerous countries due to the high demand for spatial data exchange. Moreover, SDI implementations cross national borders and a number of regional borders. In several cases, continental agreements for regional level SDIs exist.
One of the major characteristics of an SDI is the long-term implementation procedure, which needs proper short/middle term feedbacks from different perspectives. In many countries, even one or two decades are not sufficient to implement all of the SDI components. Therefore, a precise strategic plan must be defined, with proper objectives and initiatives to reach the goal
1
according to the needs of the country by the evaluation and the refinement of the progress of an SDI.
In this thesis, we propose new ideas to evaluate and improve spatial data infrastructures from different aspects to implement a more effective and operative spatial data sharing framework for a wide range of users.
1.2 Problem statement
The SDI evaluation has been considered one of the foremost challenges in recent years. The main problem is the lack of a general goal oriented framework to assess an SDI from different perspectives. Among a number of the current methods in this research area, we focused on business management methods from a strategic viewpoint to investigate problems with performance measurement issues in the context of SDI implementation and evaluation. During the assessment study, we found that various problems exist from several technical and cartographic aspects of spatial data exchange in an SDI.
Current methods for spatial data presentation are not sufficient for an SDI environment. In particular, problems occurs spatial data stems from different sources. In this case, semantic, geometrical and topological heterogeneities must be resolved.
1.3 Objectives
The general aim of this thesis is to improve spatial data infrastructures. There are three specific objectives:
1. Develop a framework for the management and evaluation of an SDI.
2. Improve the accessibility of spatial data in an SDI.
3. Improve the cartography in the view services in an SDI.
2
3
1.4 Thesis structure
This thesis has a summary part followed by five papers. Due to the diverse nature of SDIs and also the broad range of topics for this research, a number of subjects are described in the summary part. The second chapter provides a general overview of spatial data infrastructure concepts. The third chapter is a literature review of current evaluation and implementation methods. In this chapter, we discuss the relevant subjects for Papers I and II. The fourth chapter contains an overview of methods used for spatial data exchange workflow. This chapter reviews the methods of web service processes that publish spatial data. The fifth chapter provides a general overview of the cartographic background of spatial data. The chapter includes theory regarding visualization techniques and several of the current challenges from a cartographic viewpoint. Chapter six provides a summary of the papers. Finally, chapter seven presents the conclusions of the thesis.
The papers are sorted according to their subjects:
Paper I Toomanian, A., Mansourian, A., (2009). An Integrated Framework for the Implementation and Continuous Improvement of Spatial Data Infrastructures, In SDI Convergence. Research, Emerging Trends, and Critical Assessment. B. van Loenen, J.W.J. Besemer, J.A. Zevenbergen (Editors). Nederlandse Commissie voor Geodesie, Netherlands Geodetic Commission 48, pp 161-173, 2009.
Paper II Toomanian, A., Mansourian, A., Harrie, L., Rydén, A., (2011). Using Balanced Scorecard for Evaluation of Spatial Data Infrastructures: a Swedish Case Study in accordance with INSPIRE. International Journal of Spatial Data Infrastructures Research, 6, pp 311-343.
Paper III Mansourian, A., Omidi, E., Toomanian, A., Harrie, L., (2010). Expert System to Support Functionality of Clearinghouse Services. Computers, Environment and Urban Systems, 35(2), pp159-172.
Paper IV Toomanian, A., Harrie, L., Olsson, P., (2012). Automatic symbolization methods for geoportals. The Cartographic Journal (In Press).
Paper V Toomanian, A., Harrie, L., Mansourian, A., Pilesjo, P., (2012). Automatic integration of spatial data in viewing services using a semantic based Expert System (Submitted).
3

In Paper I, the author made the main part of the study and the writing. The idea behind the study is shared with the co-author.
In Paper II, the author made the main part of the data collection and analysis from the authorities, and together with the co-authors investigated the Swedish NSDI implementation progress in accordance to the INSPIRE directive.
In Paper III, the author contributed the literature review, defined the case studies and different scenarios and prepared the theoretical background of the implementation.
In Paper IV, the author studied different methods for map visualization and implemented the cartographic methods. The study and writing were performed together with the co-authors.
In Paper V, the author conducted the implementation and wrote the manuscript. The ideas were developed with co-authors.
4
5
2 Fundamental concepts of Spatial Data Infrastructure
2.1 Introduction
This chapter addresses the fundamental concepts of Spatial Data Infrastructure (SDI). An SDI includes the rules, laws, standards and the data that are used to improve the access of spatial data. SDI indicates a type of soft infrastructure. The soft infrastructure is a main complement to the concept and is as important as but not the same as hard infrastructure, which addresses physical installations such as roads and water pipelines. In soft infrastructure as such, spatial data are crucial to reach a sustainable development.
The structure of this chapter is as follows: First, we provide an overview of spatial data. Next, we discuss the current state of spatial data sharing. The next section concerns the basic components of an SDI and SDI hierarchy. Finally, this chapter discusses important parameters of SDI development and current models for SDI funding.
2.2 Spatial data
More than 80% of the data used in most organizations and institutions activities, planning and management have a spatial nature and characteristics (Budic et al., 1999; Lemmens, 2001; Rhind, 1999). Spatial data, also known as geospatial data or geographic information, are defined as data associated with a specific location on the earth, particularly information regarding natural phenomena, and cultural and human resources (Williamson et al., 2003). Spatial data include maps, aerial and satellite images.
There are three types of spatial data in the geo community. Traditionally, the main part of the spatial data have been collected and produced by the
5
public sector. In the last decade, due to substantial financial benefits in the spatial data market, companies have made great investments that have generated the second type of commercial spatial data. Finally, in recent years, a third type of spatial data sets joined this community, which is volunteered spatial data. These data are the results of web 2.0 techniques and attempts to overcome the licensing issues for public sector and commercial data. This thesis focuses on public sector data.
Spatial data in conjunction with geographic information systems are utilized for visualization and analysis. Spatial data have wide ranging uses because any human activity takes place within a specific location or particular area, and therefore, the impacts of activity are more meaningful and more practical from a spatial viewpoint. Finally, spatial data are crucial for the improvement and development of economic and financial situations and for the protection of natural resources (Executive Order, 1994).
A substantial portion of all decisions made by national and local agencies are dependent on a location or have a spatial impact (Albaredes, 1992). When an analyst has a proper background about the study region, a more efficient and well-organized result is reached, and the decision-making process is improved for any location-based research. Additionally, spatial knowledge allows the user to connect various related information existing in the same location and collects the data in an integrated spatial database.
In this regard, logistics study and planning, environmental management and protection, society planning, crisis management and road network design are several applications of spatial data on local, national and international scales (Bernard et al., 2005; Williamson et al., 2003; Masser, 1998).
As a result, spatial data and related techniques lead to spatial knowledge that is important in the decision making processes. Using spatial data and techniques, the results of any location-based analysis can be properly understood. Additionally, collaboration and positive synergy increases among various domains across governmental, private and academic sectors. Furthermore, spatial knowledge has a direct and effective impact on economic, social and environmental development and is regarded as one of the major elements for sustainable development (Mansourian, 2006).
Spatial data collection and maintenance are expensive and require complex techniques and team work. Moreover, spatial data or service production from spatial raw data requires advanced skills and proficiency (van Leonen, 2003). Therefore, lack of coordination and collaboration, and thus duplicate or parallel activities in spatial data collection from two or several
6
7
organizations, is stated as one of the major challenges in this area (Chan et al., 2001; Nebert, 2001; When de Montalvo, 2000). These types of duplicate work waste both financial and human resources.
Proper documentation of spatial data is an essential aspect of data sharing. Similar datasets with different spatial and temporal accuracies without any documentation make data selection more challenging for any user. Also, other major problems are less attention to metadata production from the spatial data producers’ side as well as standards for metadata in producing procedures (Nebert, 2001; van Leonen, 2003).
Applying different local standards for spatial datasets is another major problem. Several challenges involve the use of various standards to produce and store spatial data and the use of inappropriate standards without considering the user requirements. In this context, there are a number of problems:
Challenges in the spatial data integration produced by different organizations.
The spatial data produced may be inappropriate for the end users because it does not fit the user requirements.
2.3 User requirements for spatial data
Several challenges in spatial data collection, storage and distribution influence spatial data usage. To analyze and describe the current bottlenecks in using spatial data, the status of spatial data required for end users are discussed according to the data functions theory and modern theory for decision flow. This theory is categorized into four categories: availability, accessibility, applicability and usability (Mansourian, 2006; Nedovic-Budic et al., 2004; Feeney and Williamson, 2003):
2.3.1 Availability
Availability addresses with the existence of spatial data. The main concern is whether the required spatial data can be found. Other important parameters affecting the result of end users analysis are the quality and the specifications of the available data.
7
In reality, a number of scenarios emerge from the availability viewpoint:
The data may be available in the same organization where the user works or another organization that produces the data.
The data exist in multiple sources or do not exist at all.
There exist old versions of data or exist for some parts, and
Inaccurate data exist.
Occasionally, the situation is even worse because of a combination of the mentioned probabilities, e.g., the data exist in multiple sources with less accuracy and do not cover the entire region (Mansourian, 2006).
2.3.2 Accessibility
This term describes the context end user authentication and limitations regarding data access. The required data may be available in an organization but are not accessible. In this context, numerous factors can hindrance data accessibility (Feeney and Williamson, 2003):
Administrative constraints: To obtain a dataset, complex, time consuming, and bureaucratic procedures occasionally must be overcome in many organizations on the part of both data producers and data holders.
Inappropriate announcement: Occasionally, data holders do not announce available data, end users are not aware of spatial datasets and thus do not ask about them. Furthermore, the insufficient amount of advertisements from data holder due to the smaller revenue and benefits that is available in these markets.
Cultural issues: Some organizations do not distribute available data to keep quality and accuracy problems within the organization. Some organizations keep data to maintain power in negotiations and inter-organizational discussions. Finally, lack of the copyright regulations can cases cause inappropriate data sharing by data producers.
Security: In a number of situations, there are limitations for releasing data because of military usage or national security threats caused by spatial data.
Pricing policies: In some cases, the cost of a spatial dataset is too high and it is not cost effective for end users to purchase the data.
8
9
2.3.3 Applicability
Applicability is the percentage of accessible spatial data that is compatible with current standards and end user needs (Feeney and Williamson, 2003). The data should be applicable for high performance and in hardware and software environments. Occasionally, available and accessible data encounter problems regarding format, geometrical structure, context, data definition and classification, quality, etc. Consequently, the data they do not fit the end user requirements, and therefore, the user must perform time-consuming procedures to edit and prepare the data for use.
Several parameters affect the spatial data applicability:
Standards and data characteristics: Differences among standards in various datasets can cause complexity in data integration. Additionally, the existing classes and categories for features in addition to the dataset scale sometimes do not fit the user requirements. Finally, in many cases, the accessible data are not topologically well structured.
Data quality: Low quality data can affect any project, and sometimes inaccurate data are not used by the end user. Additionally, the quality of an update data sometimes does not satisfy the end user in compare to the quality of previous versions.
2.3.4 Usability
Usability refers to the amount of usage and the quality of use for the end user. In many cases, applicable data are not used in an efficient way.
Two primary factors affect the degree of spatial data usage. If the available or accessible data do not satisfy the needs of end users, the users do not use the data in their analysis. In this context, lack of metadata and the low awareness of data characteristics are other bottlenecks that influence the amount of data usage.
Organizational culture also changes the degree of spatial data usage. Many organizations act as both data producers and end users. These organizations minimize data sharing because of organizational resistance or other limitations. Additionally, inter-organizational conflicts and disagreement among employees sometimes lead to chaotic conditions and as a result the data are not useful for any purpose. Lack of awareness concerning the advantages of using datasets in decision making issues,
9
planning and analysis is one of the main restrictions on spatial data usability (Thellufsen et al., 2009).
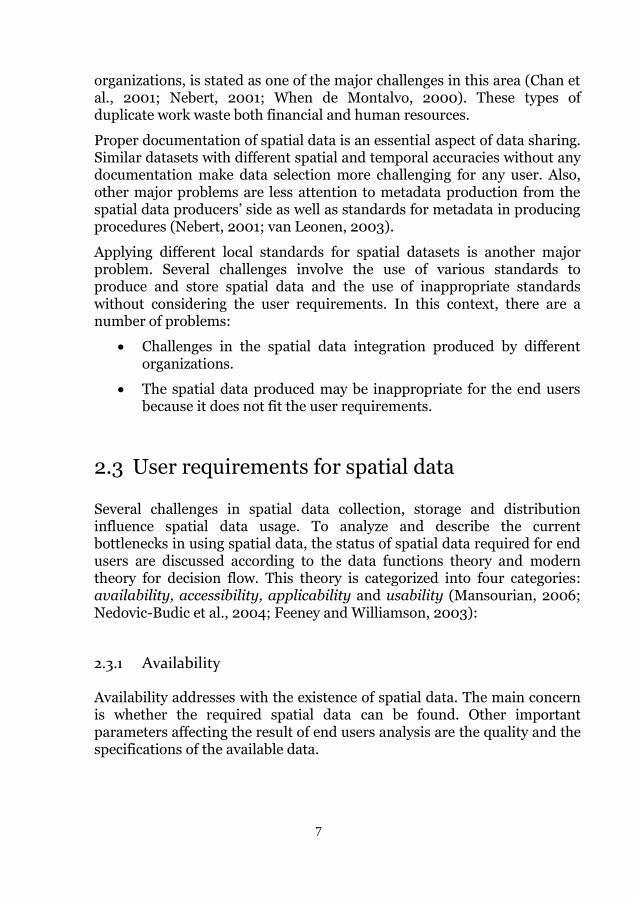
According to the aforementioned descriptions and concepts, in an ideal situation, 100% of the spatial data requirements are available, accessible, applicable and usable for the end users. However, due to parallel projects, limitations and other challenges, only a small percentage of the required data are usable for various applications (Figure 2.1). The primary goal of a spatial data infrastructure is enhance the status of spatial data usage in a certain situation.
Figure 2.1. User requirements for spatial data (cf. Feeney et al., 2003).
2.4 Spatial data sharing
Many GIS projects require a large amount of spatial data for which the collection and production are time consuming and costly. Spatial data sharing is essential to avoid unnecessary costs from duplicate production procedures. Spatial data sharing is also required to increase the benefits of
10
11
spatial data usage and to encourage multiple usages of spatial data that have been collected for a specific purpose. Data sharing also increases data quality when many people work on a specific task and try to discover and edit errors within the data (Williamson et al., 2003). Hence, data sharing promotes both financial and human resources savings.
The concept of data sharing affects decisions and development issues through better harmonization and coordination on the management level. Spatial data in an organization are considered as an infrastructure for other organizations for better collaboration and cooperation in future projects.
Spatial data sharing has many advantages, but technical, social, economic, legal, political and organizational obstacles must be circumvented. Spatial Data Infrastructure is the key to facilitate spatial data sharing by providing essential collaboration and cooperation among different organizations.
2.5 Spatial Data Infrastructure -SDI
2.5.1 Definition
The history of Spatial Data Infrastructure (SDI) is long, but SDI became important in the 1980s due to great demand for cooperation and spatial data sharing. National SDI discussions began among academics in the US. The subject was officially confirmed with the President’s executive command in 1994 (Executive Order, 1994). Statistics show that more than 120 countries have implemented a national SDI (Crompvoets et al., 2004; Crompvoets and Bregt, 2001). Currently, more countries are developing this infrastructure due to improvements and demand for spatial data.
The definition and interpretation of SDI differ among nations due to the specific conditions in each country. A number of definitions in the literature from major contributors in this area exist (e.g., Stojanovic et al., 2010; GSDI, 2009; CGDI, 2004; Lemmens, 2001; Chan et al., 2001; Masser, 1998). According to the Office of Management and Budget in the US, “SDI is a framework of spatial data, metadata, users and tools that are interactively connected to use spatial data in an efficient and flexible way” (OMB, 2002). The Federal Geographic Data Committee defined National Spatial Data Infrastructure (NSDI) as: “An umbrella covering policies, standards, organizational procedures and technologies where is used to use, manage, and produce spatial data” (FGDC, 1997, p. 106).
11
2.5.2 Specifications
The SDI concept is generally used to avoid gaps within spatial datasets and duplication in data production in addition to other well-known spatial data problems (van Leonen and Kok, 2004). SDIs are also an innovative way that aims to design an environment for collaboration and cooperation. Specifically, an SDI provides a dynamic internal and external cooperation among organizations that responds to the collaboration needs of data providers and end users. An SDI is also a method to prepare and expand a mechanism for sharing and developing spatial datasets. In this way, data holders communicate with the current technologies to achieve various degrees of political organizational purposes in an efficient way (Chan et al., 2001). This environment is created via mechanisms that facilitate the sharing, access and use of spatial data in different communities.
SDIs are used to overcome the user requirement limitations mentioned in previous section by facilitating the availability, accessibility, applicability and usability of spatial data. Users can use the proper networks to find the available data easily within an SDI and can follow common procedures to access to the data. Moreover, with an SDI, the data may become more applicable with respect to the quality, format and other specifications. Finally, an SDI helps to increase the collaboration and cooperation among organizations in addition to the effective use of data for any application. In this regard, SDIs provide several benefits:
SDIs remove unnecessary tasks, duplicate activities and parallel procedures.
SDIs create an appropriate spatial data market.
SDIs facilitate process-based management for spatial data.
In recent years, SDIs have been implemented as platforms or basic spatial data frameworks in numerous countries. SDIs are used not only to facilitate spatial data access but also to integrate spatial data in numerous situations. SDIs facilitate the integration of spatial datasets and aim to design a proper interface for data sharing among organizations, private sectors and end users. Another major goal of SDIs is to integrate and harmonize the spatial data collected from different sources and/or stored in different databases. This framework decreases both access time and cost for end users. Finally, all technical and organizational solutions help and facilitate SDI component relationships to benefit society (Rajabifard et al., 2003a; Rajabifard et al., 2003b).
12
13
A variety of aspects must be considered, such as organizational restructuring, legislation frameworks, cultural improvements, economic considerations and business factors. Consequently, SDI implementation requires skills and specific experiments (Remkes, 2000). Furthermore, SDI development needs detailed collaboration and communication among the different levels of governmental authorities and private sectors, which creates new types of responsibilities for any type of institute. Consequently, SDIs effectively provide the opportunity for all collaborators to access all current spatial datasets for use in internal, local, national and regional decisions. Finally, SDIs are mechanisms to support the results of spatial data activities and benefit from cooperation.
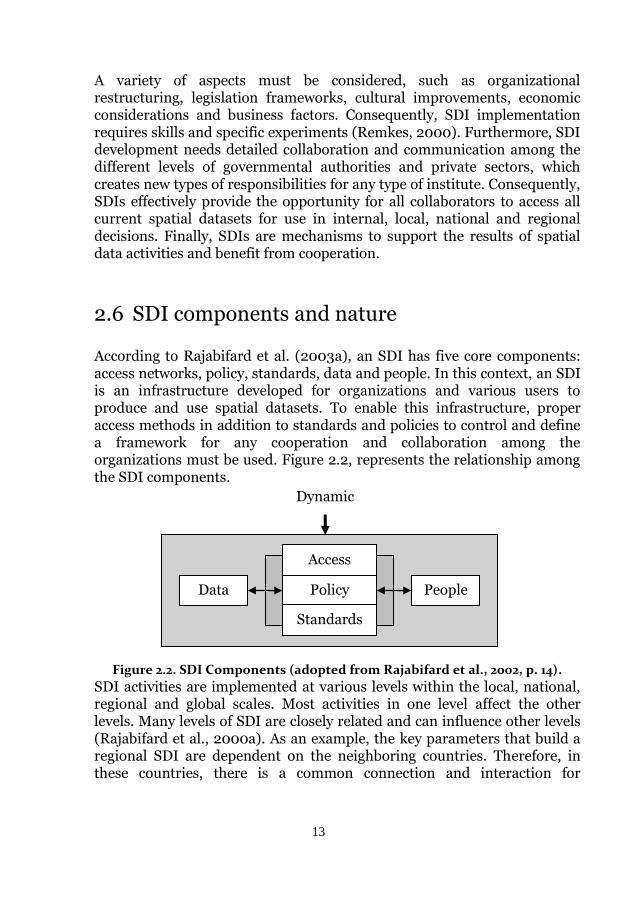
2.6 SDI components and nature
According to Rajabifard et al. (2003a), an SDI has five core components: access networks, policy, standards, data and people. In this context, an SDI is an infrastructure developed for organizations and various users to produce and use spatial datasets. To enable this infrastructure, proper access methods in addition to standards and policies to control and define a framework for any cooperation and collaboration among the organizations must be used. Figure 2.2, represents the relationship among the SDI components.
Figure 2.2. SDI Components (adopted from Rajabifard et al., 2002, p. 14).
SDI activities are implemented at various levels within the local, national, regional and global scales. Most activities in one level affect the other levels. Many levels of SDI are closely related and can influence other levels (Rajabifard et al., 2000a). As an example, the key parameters that build a regional SDI are dependent on the neighboring countries. Therefore, in these countries, there is a common connection and interaction for
Access Network
Policy
Standards
Data People
Dynamic
13
exchanging knowledge and experiences from previous related work in spatial datasets.
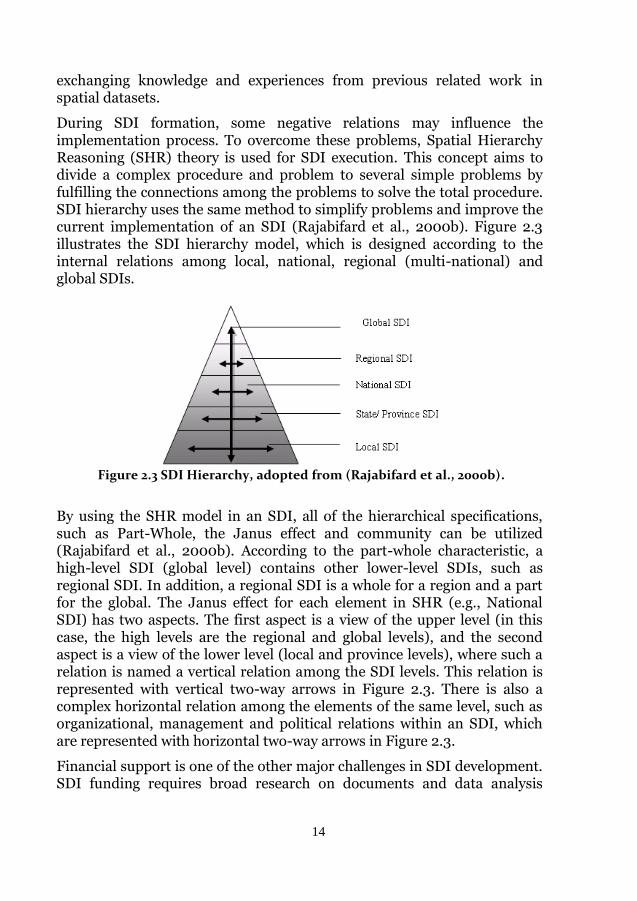
During SDI formation, some negative relations may influence the implementation process. To overcome these problems, Spatial Hierarchy Reasoning (SHR) theory is used for SDI execution. This concept aims to divide a complex procedure and problem to several simple problems by fulfilling the connections among the problems to solve the total procedure. SDI hierarchy uses the same method to simplify problems and improve the current implementation of an SDI (Rajabifard et al., 2000b). Figure 2.3 illustrates the SDI hierarchy model, which is designed according to the internal relations among local, national, regional (multi-national) and global SDIs.
Figure 2.3 SDI Hierarchy, adopted from (Rajabifard et al., 2000b).
By using the SHR model in an SDI, all of the hierarchical specifications, such as Part-Whole, the Janus effect and community can be utilized (Rajabifard et al., 2000b). According to the part-whole characteristic, a high-level SDI (global level) contains other lower-level SDIs, such as regional SDI. In addition, a regional SDI is a whole for a region and a part for the global. The Janus effect for each element in SHR (e.g., National SDI) has two aspects. The first aspect is a view of the upper level (in this case, the high levels are the regional and global levels), and the second aspect is a view of the lower level (local and province levels), where such a relation is named a vertical relation among the SDI levels. This relation is represented with vertical two-way arrows in Figure 2.3. There is also a complex horizontal relation among the elements of the same level, such as organizational, management and political relations within an SDI, which are represented with horizontal two-way arrows in Figure 2.3.
Financial support is one of the other major challenges in SDI development. SDI funding requires broad research on documents and data analysis
14
15
according to different economic models. SDI funding also requires proper models for financial issues in addition to testing and evaluation of the model (Giff and Coleman, 2003). A number of basic issues must be discussed in SDI funding to understand the financial support for the SDI implementation (Giff and Coleman, 2002; Groot, 2001; Rhind, 2000). However, these models are beyond the aim of this thesis.
2.7 Clearinghouse networks
Considering the technical structure of an SDI, a gateway for a better data sharing interface among the data holders, users and different clients must be developed. Currently, this infrastructure plays a major role in data exchange in a spatial context due to the network access development and internet improvements.
Clearinghouse networks are established to facilitate efficient access to spatial data resources to decrease the cost caused by the duplicate collection of spatial data (Crompvoets et al., 2004; FGDC, 2000b; Rhind, 1999). The early generation of clearinghouses provided users with either information about the data, which was termed metadata, or a link to the data producer web site and hints for accessing the data (Philips et al., 1999). To search for a spatial data layer, a user sets search parameters, e.g., geographic boundary, data theme, and data layer name in the clearinghouse user interface. If any data exist according to the search criteria, data retrieval addresses were presented to the user as an output (Radwan, 2002).
The development of internet technology and the advancement of spatial web services set up a new generation of clearinghouses that are based on geoportals in addition to catalogue and spatial services (Bernard et al., 2005; FGDC, 2009; Bell, 2008). These clearinghouses provide users with standard and proper methods for searching and accessing required spatial data. In the next section, we describe the details of a clearinghouse.
2.7.1 Main components of clearinghouses
As mentioned above, the new generation of clearinghouse networks is based on geoportals as a gateway to access spatial data. A portal is a website that acts as a gateway or entrance point to the world wide web and
15
contains useful pages, hyperlinks, application links search engines, news and other services (Granić et al., 2011).
A portal in the spatial data infrastructure domain is called a geoportal. There is no definition of a geoportal in the ISO classification for spatial services, but a geoportal can be explained in the form of user interaction needed services (ISO/TC-211, 2009). One of the reasons for the recent development of SDIs is the creation of web-based metadata services, which are considered to be primary components of geoportals. These services are able to resolve user requirements to access the complementary information in spatial fields. The improvement in spatial services created web-based facilities and capabilities for better use of metadata systems and better solutions to find proper datasets (Tait, 2005).
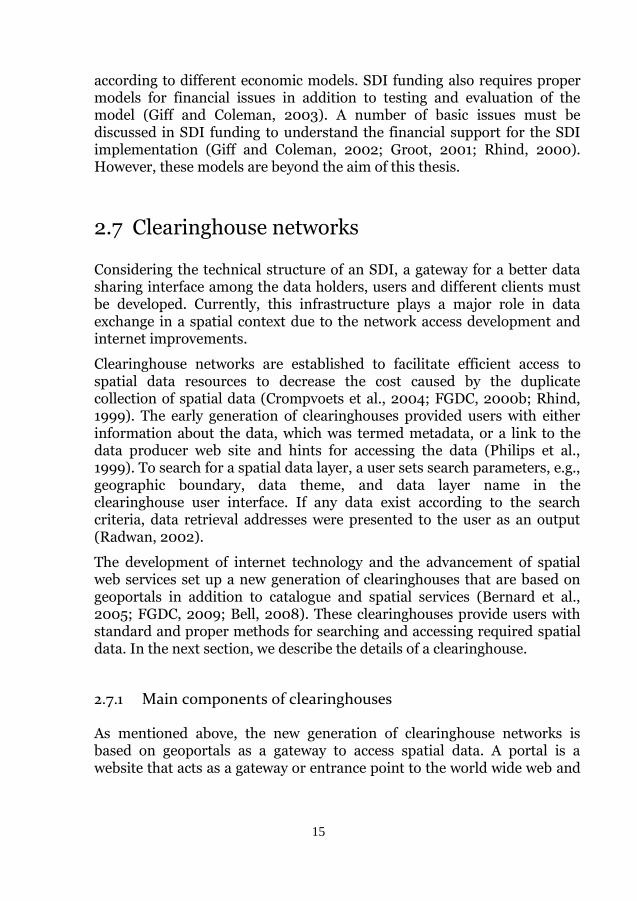
Current clearinghouse networks have a number of basic components in addition to the geoportal (Figure 2.4). Catalogue services provide the functionality to publish metadata on spatial data resources and to search and query metadata (Bernard et al., 2005). A metadata repository is where information about spatial data is stored. Spatial services, which are connected to data servers, provide clients with the capability of viewing and/or downloading spatial data. Some of the major spatial services that are used in clearinghouse architecture consist of visualization services (Beaujardiere, 2006), download services (Vretanos, 2005), coverage services (Whiteside and Evans, 2008) and processing services (Schut, 2007). Registry services are where spatial services and catalogue services are registered to be discoverable by a geoportal.
Figure 2.4. Architecture and elements of a clearinghouse (from Paper III).
As Figure 2.4 shows, in a clearinghouse, a user requests data via a geoportal and sets the search parameters. Subsequently, the geoportal searches metadata repositories through catalogue services to discover the required data if they are available. After finding the data, if the relevant data server(s) support (or provide) spatial services, such as visualization or download services, the data can be viewed or downloaded by the user.
16
17
2.7.2 Standards for gateways
The main standards utilized for current gateways in spatial data handling are currently specified by the Open Geospatial Consortium (OGC) in cooperation with the International Organization for Standardization (ISO). OGC offers several specifications for web services. In this thesis the WMS, WFS and WPS standards are used.
WMS: Web Map Service (WMS) is an OGC standard that enables a user to view a map from a remote server over the internet. Hence, this standard is used for view services. It is important to know how a map is defined in this context. OGC describes a map as “a portrayal of geographic information as a digital image file suitable for display on a computer screen’’. Therefore, the output of a WMS is a visual representation of the spatial data in raster format (PNG, GIF or JPEG) or in vector based graphical formats, e.g., Scalable Vector Graphics (SVG) (Beaujardiere, 2006, pp vii).
There are three main operations in WMS which together arrange the entire rendering procedure. The GetCapabilities operation, delivers the metadata existing in the servers; The GetMap operation provides the user with the requested map. Finally, the GetFeatureInfo returns the specific information related to a selected points shown on a map.
Since the map is an image it cannot be used for further GIS-analyses. For a user that needs the spatial data, there are OGC standards for download services, which are Web Feature Service (WFS) for vector data and Web Coverage Service (WCS) for coverage (raster) data.
WFS: Web Feature Service (WFS) is an OGC standard that facilitates the distribution of geographic data in vector format throughout the internet. Data are distributed and encoded in the Geography Markup Language (GML). The WFS allows a client to retrieve and update spatial data encoded in GML from multiple Web Feature Services for which each server must be a WFS.
WFS contains three compulsory operations. GetCapabilities describes the capabilities of the existing dataset or its metadata, DescribeFeatureType expresses the structure of any feature type that the service can obtain. Finally, the GetFeature operation retrieves data upon request and fetches any relevant query results from the user (WFS, 2005). WFS also contains request for editing data, but these functions are not used in this thesis.
WPS: The OGC Web Processing Service (WPS) defines a standardized interface that facilitates the publishing of spatial processes and the discovery of and binding to those processes by users. Some examples of a
17
process are transformation services and analysis services. Publishing implies making machine readable information available, apart from the human readable metadata, which allows for service discovery and use (Schut, 2007; Bergenheim et al., 2009).
According to OGC specifications there are three mandatory operations in WPS procedure. Similar to the other spatial web services the first operation is GetCapabilities where it describes the capabilities of the server implementation as well as metadata documents; DescribeProcess returns the servers processes that the WPS can handle; and Execute which lets the client run a specific process that is implemented within WPS procedure applying relevant input parameters and getting appropriate outputs.
2.8 INSPIRE: A European SDI initiative
In this section, we present the current regional SDI for Europe. In 2002, the EU commission launched the Infrastructure for Spatial Information in Europe (INSPIRE) as the major activities related to the environmental and spatial datasets within Europe. The INSPIRE directive aims to create a European Union (EU) spatial data infrastructure (Directive, 2007). This infrastructure enables the sharing of environmental spatial information among public sector organizations and facilitates public access to spatial information across Europe (INSPIRE, 2009a).
A European spatial data infrastructure assists in policy-making across boundaries (Masser, 2010). Therefore, the spatial information considered under the directive is extensive and includes a great variety of technical themes, including not only environmental monitoring as the main purpose but also other disciplines, such as agriculture and transportation system. This activity addresses current technical standards, protocols, organizational threads and coordination, data policies such as how to access to datasets, and the production and maintenance of spatial information.
Using this infrastructure, environmental spatial datasets are available not only for the public citizens but also for governmental organizations. Also, spatial data can be shared among data producers and end users inside the European Union. This harmonized infrastructure helps to make better decisions within EU borders andattain more accurate environmental analyses.
18

19
The fundamental and common principles of INSPIRE are as follows (INSPIRE, 2009a):
Data should be collected only once and kept where it can be maintained most effectively.
It should be possible to combine seamless spatial data from different sources across Europe and share it among many users and applications.
It should be possible for data collected at one level/scale to be shared with all levels/scales; detailed for thorough investigations, general for strategic purposes.
Spatial data that are necessary for good governance at all levels should be readily and transparently available.
It should be easy to find what spatial data are available, how the data can be used to meet a particular need, and under which conditions the data can be acquired and used.
To guarantee a common European SDI all member states are responsible for implementing their national SDI in accordance with INSPIRE. This infrastructure includes common regulations related to metadata (INSPIRE, 2009b), data attributes, characteristics and specifications, network services, sharing services and data, and finally control and reporting (INSPIRE, 2009a).
In this thesis we utilize INSPIRE as a best practice environment in Europe. The INSPIRE regulations from different perspectives assist in making a suitable framework for further development of SDIs. INSPIRE also acts as a proper basis for generating indicators for SDI assessment according to the regional and global levels.
19
3 SDI management and evaluation
3.1 Introduction
The development and usage of proper frameworks for the implementation, evaluation and continuous improvement of spatial data infrastructures (SDIs) are currently important research topics. A wide range of methods from different disciplines are used in this research topics (Grus et al., 2010; Georgiadou et al., 2005, Kok and van Loenen, 2005; Najar et al., 2006, Van Loenen, 2006; Luzet, 2004). In this respect, methods and techniques related to performance measurement and evaluation techniques from business management (BM) literature are not yet considered in many research areas (Paper I).
In this chapter, SDI evaluation is described. Current methods for evaluating in the SDI literature are reviewed.
3.2 Overview of SDI evaluation research
During the last decade, evaluation has been counted as one of the major challenges in the SDI field (Budhathoki and Nedovic-Budic, 2007) and researchers have suggested different models and approaches for the evaluation of SDIs (Harvey and Tulloch, 2006). There is a comprehensive literature review in Crompvoets et al. (2008) with nine approaches. This research was proposed by a number of studies conducted such as the multi-view framework for evaluating SDIs developed by Grus et al. (2007). The researchers described the theoretical basics of the multi-view framework for SDIs assessment by expressing the need for a better understanding of the objectives, complexity, multi-faceted nature, dynamics and current uses of SDIs in the context of SDI evaluation in addition to the demands for SDI assessments and the necessity to develop a framework to evaluate
20

21
SDIs. According to these studies, SDI evaluation approaches are categorized into nine categories, which stress different dimensions of the SDI: the NSDI readiness index, clearinghouse suitability, the INSPIRE state of play, an organizational perspective, a framework based on land administration systems, SDI Performance Based Management, a legal approach, and SDI effectiveness from a user perspective.
The national SDI readiness index has been studied by Fernández et al. (2008) where they state it as an important factor to be taken into account for SDI implementation. In this regard, aside from the technological issues, organizational, informational, financial and human factors are composite integrators in the creation of the readiness index.
Another approach is the suitability of national clearinghouses which was calculated twice (2002 and 2007) based on seventeen characteristics. The result suitability index is defined as a measurement of the quality and performance of this electronic facility (Crompvoets et al., 2008). Sustainability index evaluation in different time stamps is a proper clearinghouse performance indicator that supports the managers in developing successful strategies in national clearinghouse implementation and enhances national clearinghouses and national SDIs in many countries.
Vandenbroucke et al. (2008) evaluated INSPIRE on the following six elements: organization, legal framework and funding mechanisms, spatial data, metadata, access and other services and standards, and characterization of the components of the European SDI and in particular the INSPIRE directive.
The organizational perspective approach was studied by van Loenen and van Rij (2008). The authors proposed a model that focuses on the classification of SDIs in the four stages of SDI development: stand-alone/initiation, exchange/standardization, intermediary and network. However, according to this model, SDI development has to be mature.
Steudler et al. (2008) assessed an SDI based on measuring indicators determined for five assessment areas: policy level, management level, operational level, other influencing factors and assessment of performance, which originally come from land administration systems. Such a model of comparison and evaluation provides better understanding of the various aspects, finds best practice for certain tasks of an SDI and improves the entire system.
SDI performance based management was described as a systematic approach by Giff (2008). This technique facilitates infrastructure
21
practitioners to operate an infrastructure to identify, analyze and manage its strengths and weaknesses. The technique uses indicators for performance improvement by developing a framework for key performance indicators within an ongoing process of establishing strategic performance objectives and measuring performance.
Another approach for SDI evaluation was the essential legal framework for developing an SDI developed by Janssen (2008). The assessment is not based on empirical evidence but primarily uses legislation, case law and jurisprudence. The assessment distinguishes three levels of legal assessment: compliance, coherence and quality. The final approach is the SDI effectiveness from a user perspective, which focuses on the effective use of SDIs by recognizing both the current and potential users and attempting to fulfill their needs regarding data and services by determining contextual factors and outcomes (Nedović-Budić et al., 2008).
Giff and Crompvoets (2008) present a structured concept of SDI assessment. The authors use an in-depth analysis of performance indicators (PI) based on an eleven-step conceptual framework for designing PI for assessing SDIs in Canada. They also present and critically analyze a framework to guide SDI coordinators in the intricate task of designing PIs for their initiatives.
Another study conducted on evaluation strategy for SDIs is based on a maturity matrix (Van Loenen, 2006). The maturity of the SDI was evaluated according to several technical (e.g. data and metadata), non-technical (e.g. organizational) and policy (free data policy or cost recovery policy) measures. Based on this strategy, Van Loenen evaluated several SDIs in Europe and United States. Geudens et al. (2009) used a multi-criteria analysis to evaluate SDI policy strategies, which takes into account all the different criteria and actors involved in the complex SDI decision-making context in an integrated framework.
Despite several SDI assessment approaches, there is still lack of an integrated method which covers different aspects of an SDI assessment that can measure the progress of an SDI. Moreover, a limited number of assessment approaches are able to demonstrate whether SDIs realize the intended goals (Grus et al., 2010). Therefore, a comprehensive goal-oriented SDI evaluation should be based on the evaluation of several dimensions in a common framework, which must be defined within a long-term project to control the progress of an SDI. In this thesis, two studies are presented based on current techniques and methodologies from business management literature. The first study is an integrated framework for the implementation and continuous improvement of SDIs, which is
22

23
utilized based on Six Sigma, ABC (Activity Based Costing), BSC (Balanced Scorecard) and TQM (Total Quality Management). This study describes the business management techniques and provides an integrated framework, based on these techniques, for the implementation and continuous improvement of SDIs (Paper I). The second study is an evaluation of the SDI Balanced Scorecard (BSC) including a case study in accordance with the INSPIRE directive. A general framework for the evaluation of the Swedish NSDI according to the INSPIRE directive is depicted. The case study demonstrates that BSC is applicable for Swedish NSDI evaluation, and the results can be used by other SDIs (Paper II).
23
4 Spatial web service composition
4.1 Introduction
The Open Geospatial Consortium (OGC) has published a number of standards to provide the end user with spatial data, maps or spatial processes. Other types of standards exist to publish spatial processes and the discovery of and binding to those processes by users. However, with the various combined web service applications developed in recent years, there has been a demand for combining these services, and the demand for increasingly complex functions has indicated the limitations of the single operations of services. Thus, a single web service cannot handle the user requests, and a combination of services is necessary to fulfill the user requirements.
The need for combining specific functions was inevitable due to the new requirements and to the need for a chain of services for executing more complex processes. According to the definition of ISO (2005), Service chaining (composition) is referred to as a set of dependent, combined services to achieve larger tasks. Service composition is considered one of the benefits of SDIs through combining simple spatial data services generating value-added service chains (Einspanier et al., 2003). This procedure implements a workflow of automatic business processes by applying within a part of or an entire action, according to a set of rules that sequentially pass the tasks from one process to another (ISO, 2005).
Two types of general patterns for service changing are identified by Friis-Christensen et al. (2009): centralized and cascaded. The centralized pattern contains a central component that controls the requests for the services used. Therefore, the execution workflow is controlled by a central component.
In the cascaded method, service chaining is controlled with a backward approach. In this structure, the end result service is called directly.
24
25
Subsequently, the invoked service handles the other service(s) required to retrieve the input processes/ parameter. The procedure continues in the same manner until it reaches the last service in the chain.
In this chapter, we discuss three main components of service composition, which is followed by an example of their application in this thesis (Paper III). First, a number of web processing service (WPS) applications are discussed because they play an important role in a service composition. Next, service composition usages are described in more complex applications for which a single WPS cannot handle the entire procedure. Finally, semantic web services are discussed as another component linked to the service composition chain. Any of these three components can be used for increasing the accessibility of spatial data, as discussed in the following section.
4.2 Web processing service applications
Web processing service has been broadly utilized in various applications to facilitate any type of processes that publishes spatial data. Different applications make use of a WPS for analyzing spatial data through the web. In this section, we describe several of the applications that use a single WPS. Bergenheim et al. (2009) used WPS for on line generalization. The authors implemented a real-time generalization service, so called WPS PHP Server, to dynamically generalize roads. This web service is based on an existing GIS platform (GRASS). The result shows that such a WPS-based interface is not only useful in allowing remote access to spatial data, but it is also an appropriate solution for GIS processing, specifically under limitations such as computing power for field work data collection.
From a specification viewpoint, Walenciak and Zipf (2010) proposed a WPS application profile for spatial analysis in business marketing. The authors described methods to enhance the current specification regarding the application profiles. Additionally the authors presented a specific application domain to be examined for use in spatial analysis and in the transferring of results to an application scheme.
Researchers also proposed applications for WPS in 3D processing analysis (Lanig and Zipf, 2010). They The authors classified and defined specific functions related to 3D data. In this regard, they the authors represented the domain- specific WPS application profiles for 3D city models and identified some several applications for 3D processing operations, such as disaster management.
25
There are more complex applications that a single WPS is not able to handle, and a combination of processing services is required for such applications. In the next section, we discuss the application of service composition as a solution for more complex usage of WPSs and other web services.
4.3 Applications of service composition
A number of studies on chaining spatial web services have been conducted in recent years. Granell et al. (2005) proposed a methodology based on the abstract description of services and workflows. The method contains three processes, which are the service abstraction process, service composition process and translation process. These processes share two aspects as an integrated component: a composition of complex services and a set of workflow patterns. The authors propose a novel model for implementing the steps of a suggested methodology using an efficient technique for developing service compositions.
Later, Lemmens et al. (2006) used the same method for ontology-based service composition approaches. The authors stated the integration of different spatial services from various resources was one of the primary challenges in geo community due to the complexity and heterogeneity of spatial data. They also identified a GIS workflow approach to use semantic and syntactic service descriptions inside a service chain. By using these types of service chains expert users can link geoservices remotely to develop complex services and the analysis of spatial data. Such methods also simplify XML based description languages to build a service reuse architecture based on ontology and service descriptions. In a follow up study (Lemmens et al., 2007) they introduced a deep service description as a semantic and syntactic service description in service chaining by combining two prototypes. One prototype addressed geoservice discovery abstract composition, and another prototype supported concrete composition and the execution of geoservices.
Kiehle et al. (2007) considered SDI an environment to exchange spatial data among organizations, in which the spatial web services play a major role. The authors address the problems of service chaining by providing a system architecture to implement complex geo processing models and workflows based on web services using web service orchestration. They also proposed methods based on geo community standards to establish a generic web service architecture to be used in all SDIs. Zhang et al. (2008)
26
27
also proposed an OGC-standard-based spatial data service chaining process.
All of the aforementioned studies indicate the complexity of applications and that service chaining can be an appropriate solution to exchange spatial data within the SDI community. In this regard, one type of web services addresses the definition and description of the web services that substantially influence for new developments in web services. In the next section, we describe semantic web services as a prominent concept for SDIs.
4.4 Semantic web services
Semantic web services (SWS) include specific description of properties and capabilities in a computer interpretable way and consequently provide interoperability between them (Mcllraith and Zeng, 2001). Semantic web services are software components that can be re-used and are self-contained, independently. The services can fulfill any demand and/or combine with other web services for more complex processes. SWSs have a modular structure and can be published, located, or called through the web.
Many improvements in the semantic web services field have been occurred in the last decade. Lemmans (2006) specified four different approaches in SWSs as the OWL-Services (Martin et al., 2004), the Semantic Web Services Framework (W3C, 2005), the Internet Reasoning Service (Motta et al., 2005) and the Meteor-S (Patil et al., 2005). Ermolayev et al. (2004) presented an agent enabled framework for semantic web service composition. The authors introduced their methodology based on the semantic web as an agent capability containing proper ontological description. In this research they proposed a method to compose web services by the dynamic composition of agents, which perform any collaborative task that a service requests. They initiated a middle agent layer to conduct service request to task transformation, agent-enabled cooperative task decomposition and performance. Later, Kumar and Mishra (2008) employed the same style framework for more untouched issues and utilized cognitive parameters and quality of service (QoS) parameters in service provider selection. They used this method in education planning and admission-process for higher-education.
27
4.5 Methods to increase accessibility
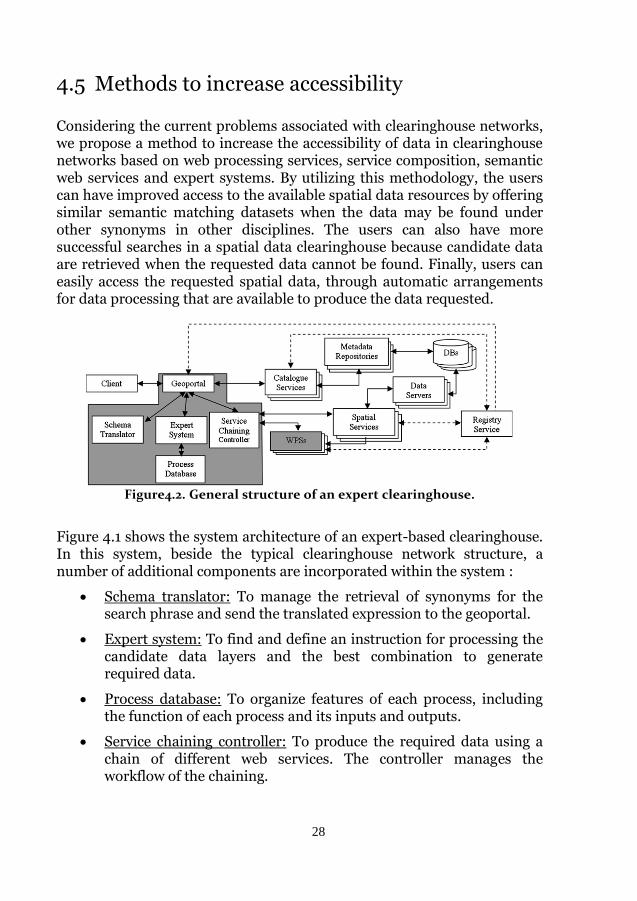
Considering the current problems associated with clearinghouse networks, we propose a method to increase the accessibility of data in clearinghouse networks based on web processing services, service composition, semantic web services and expert systems. By utilizing this methodology, the users can have improved access to the available spatial data resources by offering similar semantic matching datasets when the data may be found under other synonyms in other disciplines. The users can also have more successful searches in a spatial data clearinghouse because candidate data are retrieved when the requested data cannot be found. Finally, users can easily access the requested spatial data, through automatic arrangements for data processing that are available to produce the data requested.
Figure4.2. General structure of an expert clearinghouse.
Figure 4.1 shows the system architecture of an expert-based clearinghouse. In this system, beside the typical clearinghouse network structure, a number of additional components are incorporated within the system :
Schema translator: To manage the retrieval of synonyms for the search phrase and send the translated expression to the geoportal.
Expert system: To find and define an instruction for processing the candidate data layers and the best combination to generate required data.
Process database: To organize features of each process, including the function of each process and its inputs and outputs.
Service chaining controller: To produce the required data using a chain of different web services. The controller manages the workflow of the chaining.
28
29
Web processing services: To implement the instructions of expert search engines, which consist of retrieving output from the expert search engine, subsequently accessing the data servers to get data layers, and finally conducting desired processes on the data layers to generate the required data.
An expert clearinghouse follows a workflow. The user connects to a geoportal to search for the required data and sets the search parameters. The geoportal searches in the metadata repositories in catalogue services. If the required data are not discovered, the geoportal connects to schema translator to determine synonyms of the required data layer and subsequently searches through its synonym phrases (semantic matching). If nothing is found, the geoportal connects to the expert system to identify candidate data layers in the region. To do this, the geoportal passes the search results to the expert system to determine a proper combination of candidate data layers, among existing layers. The expert system also determines the required processes using the process database. The results are then sent to the geoportal. The geoportal searches for the processing services, which offer the required processes. The service chaining controller sends data processing requests to the proper processing services. Finally, the processing services retrieve the data through data services and process them to generate the required data.
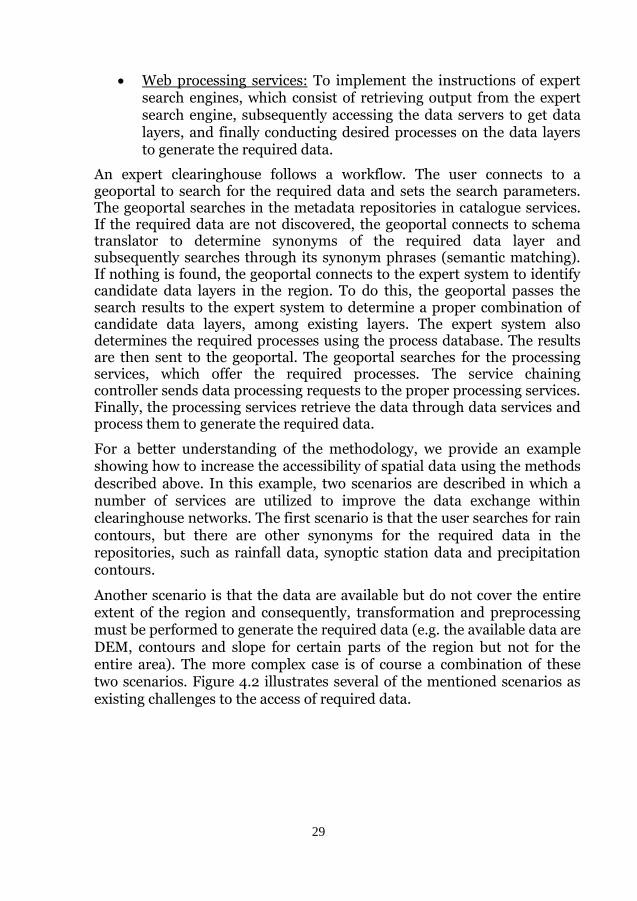
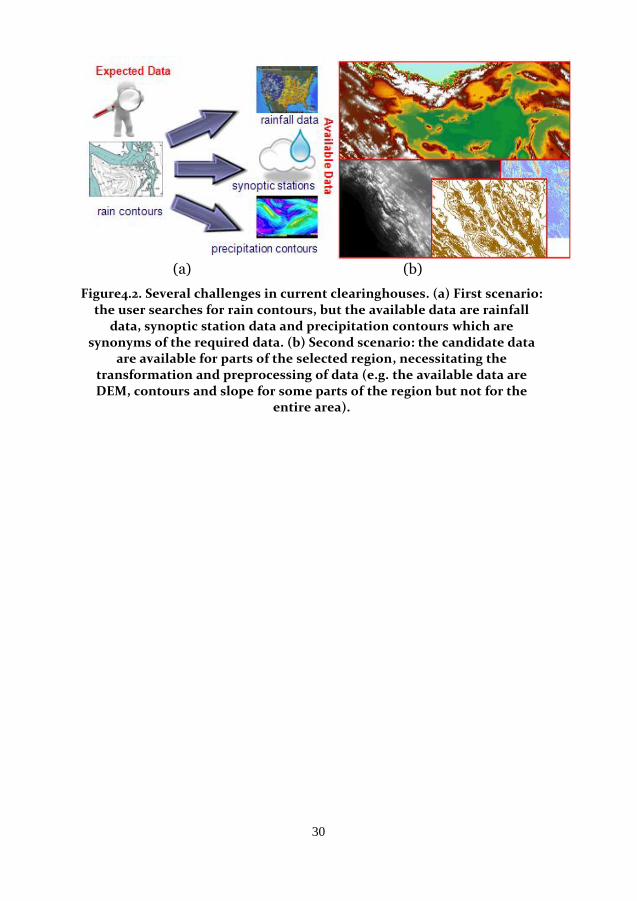
For a better understanding of the methodology, we provide an example showing how to increase the accessibility of spatial data using the methods described above. In this example, two scenarios are described in which a number of services are utilized to improve the data exchange within clearinghouse networks. The first scenario is that the user searches for rain contours, but there are other synonyms for the required data in the repositories, such as rainfall data, synoptic station data and precipitation contours.
Another scenario is that the data are available but do not cover the entire extent of the region and consequently, transformation and preprocessing must be performed to generate the required data (e.g. the available data are DEM, contours and slope for certain parts of the region but not for the entire area). The more complex case is of course a combination of these two scenarios. Figure 4.2 illustrates several of the mentioned scenarios as existing challenges to the access of required data.
29
(a) (b)
Figure4.2. Several challenges in current clearinghouses. (a) First scenario: the user searches for rain contours, but the available data are rainfall
data, synoptic station data and precipitation contours which are synonyms of the required data. (b) Second scenario: the candidate data
are available for parts of the selected region, necessitating the transformation and preprocessing of data (e.g. the available data are DEM, contours and slope for some parts of the region but not for the
entire area).
30
31
5 Cartographic aspects of SDI
5.1 Fundamentals of cartography
It is difficult to obtain a complete and general definition of cartography. However, according to the International Cartographic Association (ICA) cartography is “the art, science and technology of making maps together with their study as scientific documents and works of art” (ICA, 1973 p. 1). This definition implies that using certain techniques and following specific rules is not sufficient to create a “good” map. Artistry also plays an important role in cartography (Keates, 1996).
Currently, maps are specific and focus on important information visualization. Maps are application-oriented and the main purpose of a map changes the type of data and the symbol design. In a great deal of modern maps, the application-oriented, user-demanded information (e.g., navigation instructions) is emphasized, whereas less dominant data (e.g., base map) must be blurred as a base map only to convey a general perception of the region. Meanwhile, unnecessary information must not be included. In general, cartography addresses the process of selecting the essential data to be shown and symbolizing those data within a map.
From an SDI perspective cartography is important, for example for view services in geoportals. Consequently, it is vital to briefly describe the primary cartographic aspects and address the problems existing in the SDI field. In this chapter, we describe several basic components of cartography followed by a number of cartographic challenges from an SDI perspective.
5.2 Map design and symbolization
Map design refers to the layout of a map in which elements, such as the title and legend, are added (Robinson et al., 1995). Aside from the standard map elements such as the scale bar, north arrow and other basic
31

components that each influence the visual appearance, the symbolization of data layers affects the visual output.
Symbolization refers to the design procedure for symbols and the text used to visualize the spatial data. Symbolization is not an isolated process; creating a map is an iterative process that is repeated until the cartographer is satisfied with the map.
For a better understanding of the concept of map design and symbolization, we describe several of terms in the cartographic literature. Graphic elements and visual variables play a major role in creating maps. Depending on the scale and type of map, a feature may be represented in different ways. Consequently, a brief explanation on the basic components is useful for further discussions.
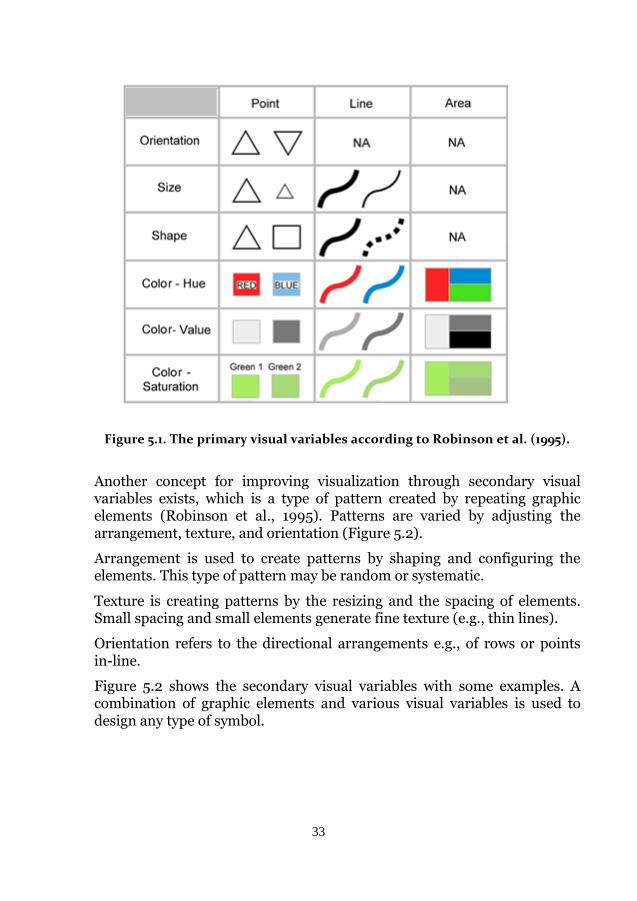
5.2.1 Visual variables
Four different types of visual variables make the graphic element of maps prominent. According to Robinson et al. (1995), these variations are called the primary variables. Several of the variables refer to object shape, but several objects have color variations:
Orientation refers to the direction of elements, e.g., lines and elongated symbols.
Size refers to the dimension (e.g., length, height, width) of a symbol.
Shape refers to the form of a symbol and may be figurative or geometric.
Color is used with different variations to invoke differences and similarities, end emphasize or deemphasize information. The three dimensions of color are (Dent, 1999):
o color hue
o color value
o color saturation
Figure 5.1 illustrates the primary visual variables mentioned above.
32
33
Figure 5.1. The primary visual variables according to Robinson et al. (1995).
Another concept for improving visualization through secondary visual variables exists, which is a type of pattern created by repeating graphic elements (Robinson et al., 1995). Patterns are varied by adjusting the arrangement, texture, and orientation (Figure 5.2).
Arrangement is used to create patterns by shaping and configuring the elements. This type of pattern may be random or systematic.
Texture is creating patterns by the resizing and the spacing of elements. Small spacing and small elements generate fine texture (e.g., thin lines).
Orientation refers to the directional arrangements e.g., of rows or points in-line.
Figure 5.2 shows the secondary visual variables with some examples. A combination of graphic elements and various visual variables is used to design any type of symbol.
33
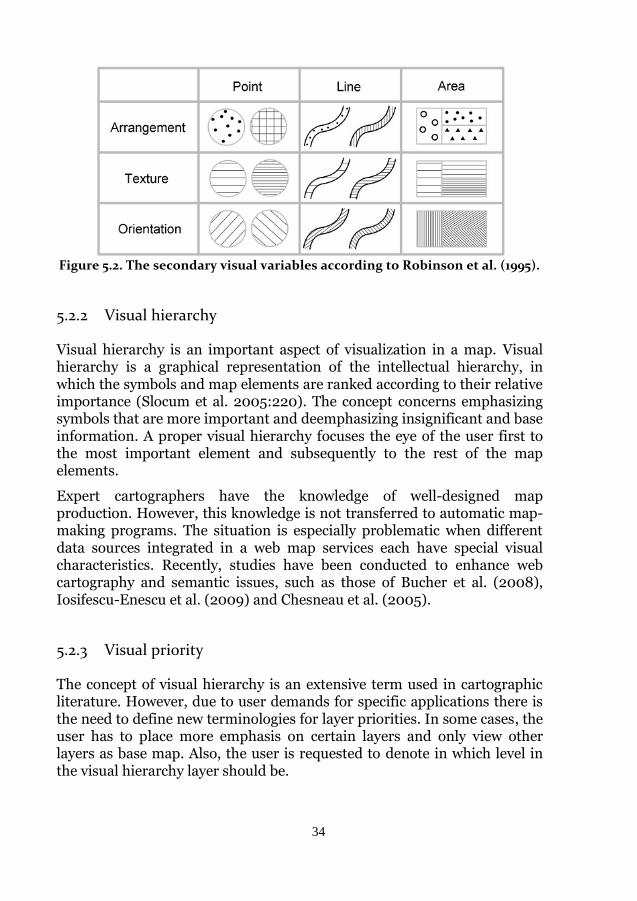
Figure 5.2. The secondary visual variables according to Robinson et al. (1995).
5.2.2 Visual hierarchy
Visual hierarchy is an important aspect of visualization in a map. Visual hierarchy is a graphical representation of the intellectual hierarchy, in which the symbols and map elements are ranked according to their relative importance (Slocum et al. 2005:220). The concept concerns emphasizing symbols that are more important and deemphasizing insignificant and base information. A proper visual hierarchy focuses the eye of the user first to the most important element and subsequently to the rest of the map elements.
Expert cartographers have the knowledge of well-designed map production. However, this knowledge is not transferred to automatic map-making programs. The situation is especially problematic when different data sources integrated in a web map services each have special visual characteristics. Recently, studies have been conducted to enhance web cartography and semantic issues, such as those of Bucher et al. (2008), Iosifescu-Enescu et al. (2009) and Chesneau et al. (2005).
5.2.3 Visual priority
The concept of visual hierarchy is an extensive term used in cartographic literature. However, due to user demands for specific applications there is the need to define new terminologies for layer priorities. In some cases, the user has to place more emphasis on certain layers and only view other layers as base map. Also, the user is requested to denote in which level in the visual hierarchy layer should be.
34
35
The following levels are defined as visual priorities (Paper IV):
Foreground – Additional information layers that are of high relevance for the application.
Middle ground – Data layers in the base map that are essential for the application.
Background – Less prominent data layers in the base map.
The order of the layers in the final map follows certain rules that are derived from particular basic cartographic instructions:
A layer in the foreground is always on top of a layer in the middle ground, and a layer in the middle ground is always on top of a layer in the background.
Within each level (back-, middle- and foreground) point layers are on top, line layers are in between and polygon layers are at the bottom.
5.2.4 Symbolization in web cartography
Web cartography is the procedure of designing maps published on the internet. In these situations, the maps are called screen maps. In many respects, screen maps are similar to maps printed on paper, and most of the principles described above should be followed. Most traditional cartographic rules are also applicable in the web environment but a few components differ:
Point symbols: Pictorial symbols are more common for internet maps because they attract less experienced map readers (Van den Worm, 2001). However, maps may be viewed on screens with limited resolution, so complex symbols should be avoided.
Line symbols: For line symbols, the possible limited resolution of screens must be considered. Lines should be wide, and visual variables such as orientation and texture are less suitable (Van den Worm, 2001).
Area symbols: According to Van den Worm (2001) many web design programs suggest tools to design complex area symbols but due to many reasons and limitations, the file size should be kept small.
35
5.3 OGC standards for web cartography
In our studies of cartographic solutions for SDI, we rely on OGC standards. The two most important standards in this area are the Styled Layer Descriptor and Symbology Encoding.
5.3.1 Styled Layer Descriptor - SLD
The SLD implementation specification standardizes the process of defining feature symbolization and data coverage, which is an important standard for cartography (Müller and MacGill 2005). SLD is an XML-based description language for extending web services such as Web Map Services (WMS) and Web Feature Services (WFS). Several of the key specifications of SLD are the structuring of the style attributes and the understandability for computers and for users. Each layer is symbolized with user-defined styles.
The appearance of any map in a web map service is defined with styled layers. In this regard, every layer, depending on the design conditions has one or many styles in the case that a map contains a number of layers (SLD, 2007). More specifically, every layer can be a transparent layer, and all of the features can be styled in a selected form. Consequently, by applying an SLD for a map, each layer may have a specific graphical representation and style, which enhances the map legibility and readability.
There are three options in using the current OGC WMS standard for map styling. In the first method, cartography and styling is decided by the service provider. The second option is that the user selects a style from a number of predefined symbolization styles. Finally, in the third option, the user defines the symbolization using an SLD.
5.3.2 Symbology Encoding - SE
The SE specification is the direct follow-up to SLD (Müller, 2006). SE is the most recent OGC standard for the portrayal of spatial data and is a language that describes how a style is rendered. SE is used in conjunction with SLD in a WMS-service. SLD dictates which styles to use, and SE describes how the styles are portrayed.
36
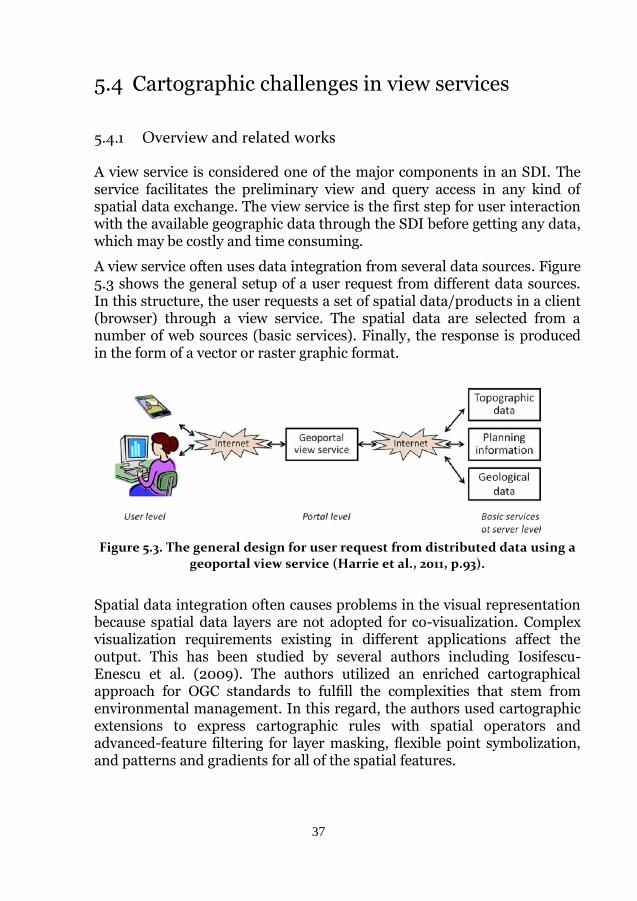
37
5.4 Cartographic challenges in view services
5.4.1 Overview and related works
A view service is considered one of the major components in an SDI. The service facilitates the preliminary view and query access in any kind of spatial data exchange. The view service is the first step for user interaction with the available geographic data through the SDI before getting any data, which may be costly and time consuming.
A view service often uses data integration from several data sources. Figure 5.3 shows the general setup of a user request from different data sources. In this structure, the user requests a set of spatial data/products in a client (browser) through a view service. The spatial data are selected from a number of web sources (basic services). Finally, the response is produced in the form of a vector or raster graphic format.
Figure 5.3. The general design for user request from distributed data using a geoportal view service (Harrie et al., 2011, p.93).
Spatial data integration often causes problems in the visual representation because spatial data layers are not adopted for co-visualization. Complex visualization requirements existing in different applications affect the output. This has been studied by several authors including Iosifescu-Enescu et al. (2009). The authors utilized an enriched cartographical approach for OGC standards to fulfill the complexities that stem from environmental management. In this regard, the authors used cartographic extensions to express cartographic rules with spatial operators and advanced-feature filtering for layer masking, flexible point symbolization, and patterns and gradients for all of the spatial features.
37
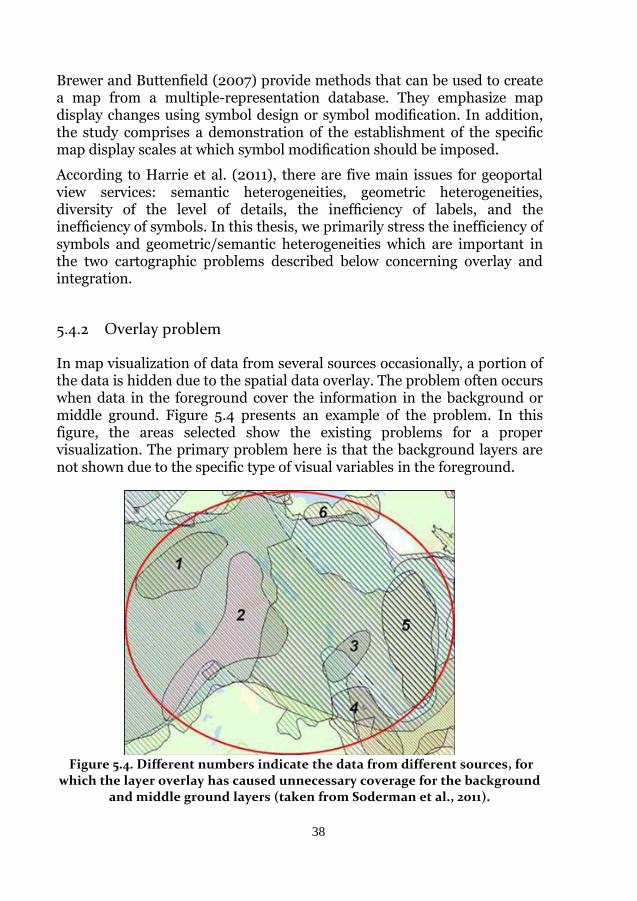
Brewer and Buttenfield (2007) provide methods that can be used to create a map from a multiple-representation database. They emphasize map display changes using symbol design or symbol modification. In addition, the study comprises a demonstration of the establishment of the specific map display scales at which symbol modification should be imposed.
According to Harrie et al. (2011), there are five main issues for geoportal view services: semantic heterogeneities, geometric heterogeneities, diversity of the level of details, the inefficiency of labels, and the inefficiency of symbols. In this thesis, we primarily stress the inefficiency of symbols and geometric/semantic heterogeneities which are important in the two cartographic problems described below concerning overlay and integration.
5.4.2 Overlay problem
In map visualization of data from several sources occasionally, a portion of the data is hidden due to the spatial data overlay. The problem often occurs when data in the foreground cover the information in the background or middle ground. Figure 5.4 presents an example of the problem. In this figure, the areas selected show the existing problems for a proper visualization. The primary problem here is that the background layers are not shown due to the specific type of visual variables in the foreground.
Figure 5.4. Different numbers indicate the data from different sources, for which the layer overlay has caused unnecessary coverage for the background
and middle ground layers (taken from Soderman et al., 2011).
38
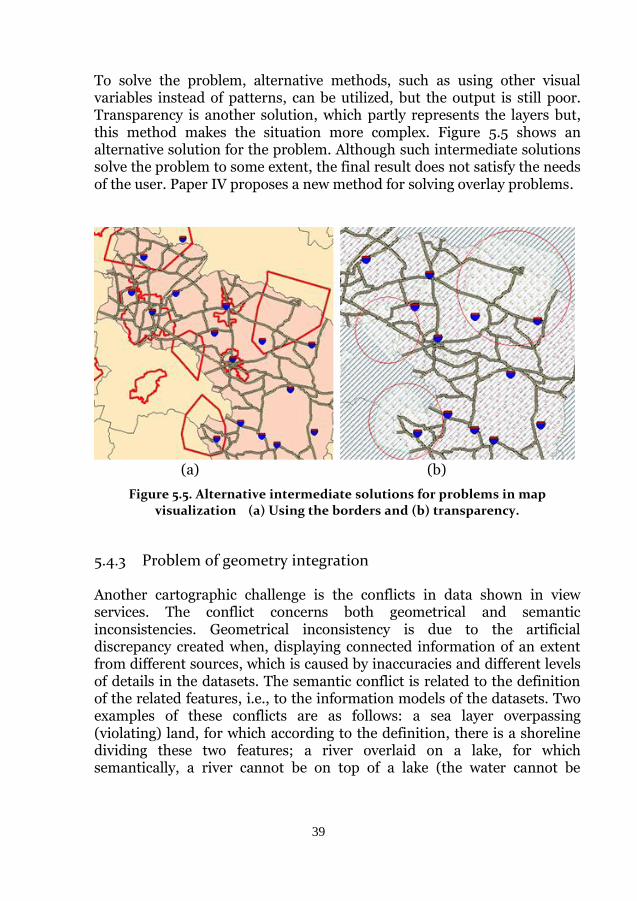
39
To solve the problem, alternative methods, such as using other visual variables instead of patterns, can be utilized, but the output is still poor. Transparency is another solution, which partly represents the layers but, this method makes the situation more complex. Figure 5.5 shows an alternative solution for the problem. Although such intermediate solutions solve the problem to some extent, the final result does not satisfy the needs of the user. Paper IV proposes a new method for solving overlay problems.
(a) (b)
Figure 5.5. Alternative intermediate solutions for problems in map visualization (a) Using the borders and (b) transparency.
5.4.3 Problem of geometry integration
Another cartographic challenge is the conflicts in data shown in view services. The conflict concerns both geometrical and semantic inconsistencies. Geometrical inconsistency is due to the artificial discrepancy created when, displaying connected information of an extent from different sources, which is caused by inaccuracies and different levels of details in the datasets. The semantic conflict is related to the definition of the related features, i.e., to the information models of the datasets. Two examples of these conflicts are as follows: a sea layer overpassing (violating) land, for which according to the definition, there is a shoreline dividing these two features; a river overlaid on a lake, for which semantically, a river cannot be on top of a lake (the water cannot be
39
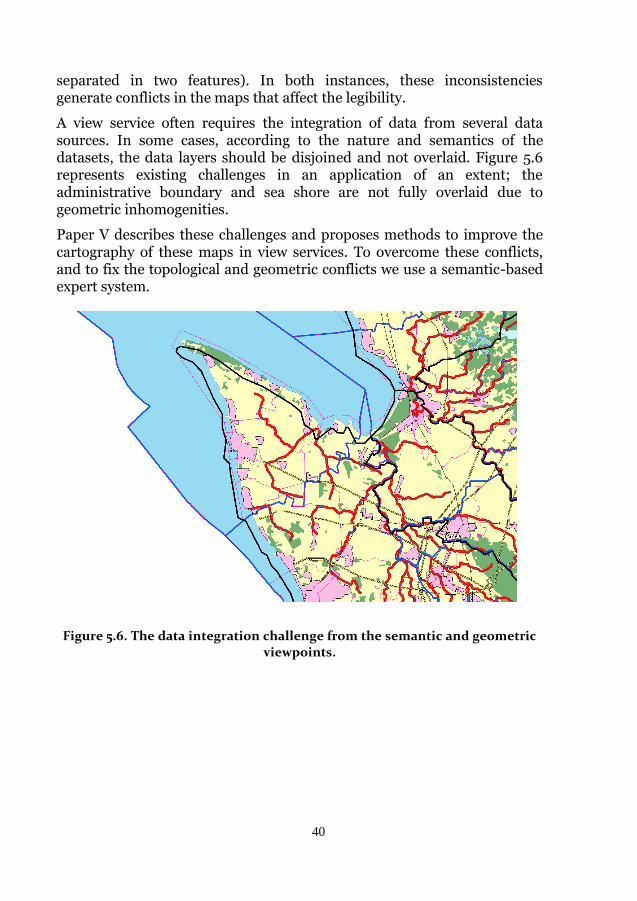
separated in two features). In both instances, these inconsistencies generate conflicts in the maps that affect the legibility.
A view service often requires the integration of data from several data sources. In some cases, according to the nature and semantics of the datasets, the data layers should be disjoined and not overlaid. Figure 5.6 represents existing challenges in an application of an extent; the administrative boundary and sea shore are not fully overlaid due to geometric inhomogenities.
Paper V describes these challenges and proposes methods to improve the cartography of these maps in view services. To overcome these conflicts, and to fix the topological and geometric conflicts we use a semantic-based expert system.
Figure 5.6. The data integration challenge from the semantic and geometric viewpoints.
40

41
6 Summary of papers
6.1 Paper I
An integration of business management concepts for the SDI implementation
The study aims to review current methods within the business management literature, which triggers to an integrated framework for the implementation and evaluation of SDIs. The applicability of each technique is described, and the usability of each technique in several aspects of SDI implementation is discussed.
In this paper, we reviewed four methods: Six Sigma (Folaron, 2003), Activity Based Costing (ABC) (Cooper and Kaplan, 1991), Balanced Scorecard (BSC) (Kaplan and Norton, 2000; Kaplan and Norton, 1996) and Total Quality Management (TQM) (Sashkin and Kiser, 1993).
The paper proposes the advantages and disadvantages of the use of BM techniques in SDI implementation. SDI is a collaborative development where various organizations and institutions are involved; therefore, teamwork and joint activities are important in the achievement of various SDI objectives. Six Sigma, as a core methodology in the integrated framework, facilitates team building and teamwork in addition to creating a collaborative environment, which is one of the main requirements of SDI development. Moreover, Six Sigma simplifies the spatial data production and updating procedures, inter-and intra-organizational data sharing, managing databases and web services, which are several examples of existing challenges within SDI implementation.
Several weak points of Six Sigma must be considered, such as the need for quality data for the measurement and prioritization of projects. However, these weaknesses are common for most evaluation and improvement methods, and because SDI implementation has a clear priority for major activities, it is not vital to use Six Sigma for SDI implementation and continuous improvement.
41
SDI funding is a complex task due to the diverse activities required for SDI implementation. In this respect, a proper financial framework is necessary for calculating the costs associated with each activity and relevant overheads. The framework should also monitor SDI funding for each activity, based on the mentioned estimations. ABC can satisfy these requirements. This framework is also well integrated with other continuous improvement techniques.
The weak points of ABC are related to the cost and time. In general, most monitoring and evaluation approaches have the same limitation related to the time. In addition, the ABC implementation cost is a small percentage of the financial resources comparing to the total costs required for SDI implementation.
SDI development has a complex and multi-dimensional nature, and its evaluation and monitoring must be based on a multi-perspective framework. This framework must link financial and non-financial indicators, internal and external aspects, and performance drivers and outcomes. BSC not only has the advantage of linking these factors; it can highlight inevitable trade-offs among them. Therefore, BSC can be a proper framework for the implementation and evaluation of SDIs.
In most organizations, financial measures have a higher priority than other indicators, and this issue can be counted as a weakness of BSC. However, in SDI, one of the primary goals is to benefit the society. Therefore, the non-financial benefits of spatial data use in decision making and planning are also in valuable. SDI development aims to promote society and better life for citizens.
Finally, TQM supports and encourages effective participation by involving employees in decision making process for the development of SDIs. In addition, TQM improves the quality of their work environment and provides users with a sense of value and purpose. Similar to the other methods, TQM is also a long-term procedure, and implementation of TQM requires much time and effort, which can be stated as one of the weaknesses of this method.
6.1.1 Paper contribution
The contribution of this paper is to define a structured framework for SDI implementation based on specific methods in the context of an SDI. The paper proposes Six Sigma as a core methodology. For implementing an SDI, the DMAIC (Define–Measure–Analyze–Improve–Control) approach
42

43
can be used, ABC (Activity Based Costing) can be used for the economic management of SDI, BSCs (Balanced Scorecards) can be used for monitoring the progress of an SDI and TQM (Total Quality Management) can be used for the quality management of the entire procedure of SDI implementation.
6.2 Paper II
Using BSC for Evaluation of SDI: A Case Study for INSPIRE
The aim of this study is to use the Balanced Scorecard (BSC) method, which is described in Paper I, for the development of frameworks to monitor and evaluate SDIs. According to the BSC description, the concept has a variety of elements that need to be adopted in the research. In this framework, the BSC perspectives are adapted in accordance with SDIs:
Learning & Growth: This perspective measures capacity building involved in SDI implementation at the individual (people) level.
Internal Process: This perspective evaluates internal processes for implementing SDIs. Standardization activities, data management affairs, establishing accessing networks and spatial web services, institutional arrangements and collaborative activities are some examples of the objectives to be measured.
Customer: The customer is a key factor in SDI evaluation. Investments and technological developments within an SDI ideally deliver spatial data products to the user. Therefore, customer satisfaction is an important factor to be measured in SDI evaluation (Albert, 2002; Band, 2000; Fornell, 1992; Hackl et al., 2000).
Benefit and economy: The main target of an SDI is to benefit various sections of society. Meanwhile, the economic perspective also keeps SDI active and updated according to financial challenges.
In addition to the four perspectives mentioned above, the BSC model requires other elements for the BSC framework for SDI evaluation:
Objective and description: Objectives are derived from the strategic plan and vision of an SDI. In this case study, the objectives are taken from the INSPIRE directive, the Swedish National Geodata Strategy and the general SDI goals to obtain a broad SDI evaluation framework. For each objective, several descriptions are also offered to highlight different aspects of the objective for the measurement.
43
Cause and effect linkage: The cause and effect linkage describes the cause and effect relationships between the objectives. The linkage initiates from the Learning and growth perspective, in which the skilled staff and managers are well-aware of SDI support and internal processes for implementing SDIs. Subsequently, proper internal processes for data management and sharing apply to a wide range of data usage and analysis by customers. Regarding user satisfaction with the data and services of an SDI, managers and decision makers use SDIs for better decision-making and planning, which results in social benefits and economic success.
Measures: Measures are quantifiable values to calculate the progress of tasks in any objectives. In this study, INSPIRE indicators and other SDI evaluation researches are used to design measures.
Targets: A target is defined as a quantifiable goal for any measure and is set during SDI strategic planning. Ideally, a combination of all the targets illustrates the general goal of an organization.
Initiatives: Initiatives are midterm programs to facilitate progression of the strategic plan. Initiatives must be defined when a strategic plan is developed. The INSPIRE directive can be considered one of the initiatives for a national SDI.
Based on the aforementioned BSC structural elements, a comprehensive model is proposed for SDI evaluation. In the data collection step, some indicators were collected directly, whereas others required extra calculation. In some cases, there were limitations and changes to the original indicators, especially if there was no obvious method for establishing a target value. Subsequently, the selected datasets are integrated into the related BSC software, and the possible results, charts and cause and effect linkages are produced as the primary output for the BSC model for SDI implementation. Using a Balanced Scorecard framework to evaluate the progress of an SDI, a clear pattern emerges from the existing situation. This pattern can be used as feedback for SDI coordinators to define strategies and set objectives, goals and visions. The adapted method provides an appropriate overview of the status of the various success factors that must be met for coordination to be successful and contribute to the development of the Swedish NSDI.
6.2.1 Paper contribution
BSC helps to evaluate SDIs from both the data producers and the users (customers) point of views. Using BSC, a general and flexible SDI
44
45
evaluation framework can be established for SDI activities. This framework considers both individual (learning and growth) and organizational levels (internal process). Finally, financial affairs and benefit achievements (benefits and economy) are an essential component of the evaluation.
The contribution of this paper is to propose a comprehensive method for SDI evaluation based on a structured business management framework for SDI implementation. As an outcome of this study a variant of this approach is operational at the Swedish national mapping agency (Lantmäteriet).
6.3 Paper III
Expert system to support functionality of clearinghouse services
The aim of this study is to use different technologies and methods to increase the functionality of clearinghouse services as a gateway to share data. Spatial data clearinghouses are considered a major component of a spatial data infrastructure (SDI). Yet, different studies indicate that national clearinghouses are not yet 100% efficient and do not function well, because the existing spatial data resources are not satisfactorily accessed or used in an optimal way. For the more efficient use of a clearinghouse, we propose an extended version of a clearinghouse, together with expert systems and semantic matching methods. The expert system aims to facilitate the identification of available data sets automatically and convert the available data to the required data based on the needs of the user. A schema translator is also used to find similar data that may be used in other disciplines or other datasets by semantic matching. We have developed a method of identifying available data and methods for data conversion according to the needs of the user. The methodology is implemented using standardized map services. In practical assess we introduce two scenarios to test, the methodology and demonstrate how an extended clearinghouse can significantly increase user satisfaction regarding accessing available data according to the requirements.
6.3.1 Paper contribution
The functionality of clearinghouses is important for a well-functioning spatial data infrastructure. This paper proposes the use of expert systems to enhance the functionality of clearinghouses. The expert system provides
45
the possibility to convert data in current form to a form that is sought by the user.
The practical implementation and testing of a prototype system shows that an expert spatial data clearinghouse, with the capability of identifying candidate data layers and processing them to generate users required data produces a number of benefits:
Provides for a better use of available spatial data resources.
Increases the number of successful searches in a spatial data clearinghouse, by suggesting candidate data to users, when the required data are not found,
Facilitate the access of users to their required spatial data by the automatic arrangement of the processing available data to produce the required data.
The contribution of this paper is the use of an expert system for the improvement of clearinghouses which is an important step forward in building future SDIs.
6.4 Paper IV
Automatic symbolization methods for geoportals
The general aim of this study is to improve the visualization of data in an SDI environment. More specifically the study aims at improving the visualization of datasets in a view service and solving the overlay problem described in chapter 5. Visualization is often problematic when the final map contains data from different sources. In this paper, we propose the concept of layer priorities as fore-, middle-, or background and two methods to enhance the symbolization: the polygon overlay and color saturation methods.
There are different approaches to handle cartography in a view service of a geoportal. First, there are predefined symbologies available for all layers, where the end user is limited to symbologies without any changes. Second, the end-user is allowed to set the relative importance of each layer (e.g. if a layer is placed in the background, middle ground or foreground in the visual hierarchy) to provide him/ her with more capabilities. Third, there is the possibility to define several symbologies on the geoportal, and the end-user can choose these between different symbologies. The fourth approach is to allow the end-user create his own symbology for each data layer. This
46
47
paper uses the second approach, in which three priorities are defined for the user.
In this study, we implemented a prototype system of a cartographic enhanced geoportal. This implementation consists of a client, a cartographic enhanced geoportal and external web services within the java programming language in an eclipse environment. The communication between the components follows the OGC WMS standard, but because a user needs to define the visual hierarchy an additional parameter is added to the GetMap request. Our prototype system contains two methods: polygon overlay and color saturation. In the polygon overlay method, we utilized an icon placement approach using the displacement, distribution and removal cost functions to calculate the total cost for a random symbolization. In the second method, we decrease the color saturation of the unimportant layers to emphasize the foreground layer, according to the visual hierarchy concept. The optimization of the cost function is based on a simulated annealing approach.
By implementing the system architecture and applying the methods to different scenarios, the results show that these methods are appropriate techniques to visualize overlaying layers without data loss.
The results from two case studies show that the methods can satisfy end user requirements. We believe that these types of methods will be increasingly important to improve the cartographic quality of future view services in geoportals.
6.4.1 Paper contribution
The contribution of this paper is to improve the presentation of spatial data from a technical viewpoint in the context of SDI and data sharing in the web. In this context, a wide area of web based applications has initiated the requirement to disseminate spatial data to end users by the use of geoportals. An advantage of the proposed techniques is the possibility to overlay geospatial data layers from different sources with new symbolization methods that support visual integration. One important issue is the visual hierarchy that ranks various data according to their relative importance; that is, data layers that are more important for the application should be visually emphasized. Another important issue is that information in one layer should not obscure or hide vital information in other layers.
47
6.5 Paper V
Automatic web cartography enhancement using semantic based expert system
In recent years, substantial research has been conducted on improving web cartography. Special cartographic concerns must be considered, especially, for example when the data are from e.g. a view service that is taken from more than one source. In view services based on several basic services, there are various semantic, topological and geometrical heterogeneities within distributed data that hinder the final maps not only to be fully legible but also the layers to be properly overlaid. To solve the problem in current geoportals and generate high quality maps, one approach is to utilize an automatic cartography core. This system contains a semantic rule based component to fix existing conflicts automatically for the integration of spatial data. We propose a system architecture that has an OWL (Web Ontology Language) based expert system to improve the cartography by adjusting and resolving topological and geometrical conflicts in geoportals. To test the methodology, we used a case study for adding a historical border on top of a base map. The results show that the historical border is overlaid without conflicts on top of the base map and a legible map is generated as an output.
6.5.1 Paper contribution
In this study, we utilize cartographic methods implemented in the geoportal to resolve geometrical and topological conflicts. These methods are based on several principles:
1. Semantic labels of the data in the basic services
2. Semantic rule base in the portal level
3. Geometrical and topological methods in the portal level
Using these methods, the end user can obtain a proper output in view services with a good cartography when the data are from different sources. Consequently, this method leads to an increase of user satisfaction with a spatial data exchange in an SDI.
48
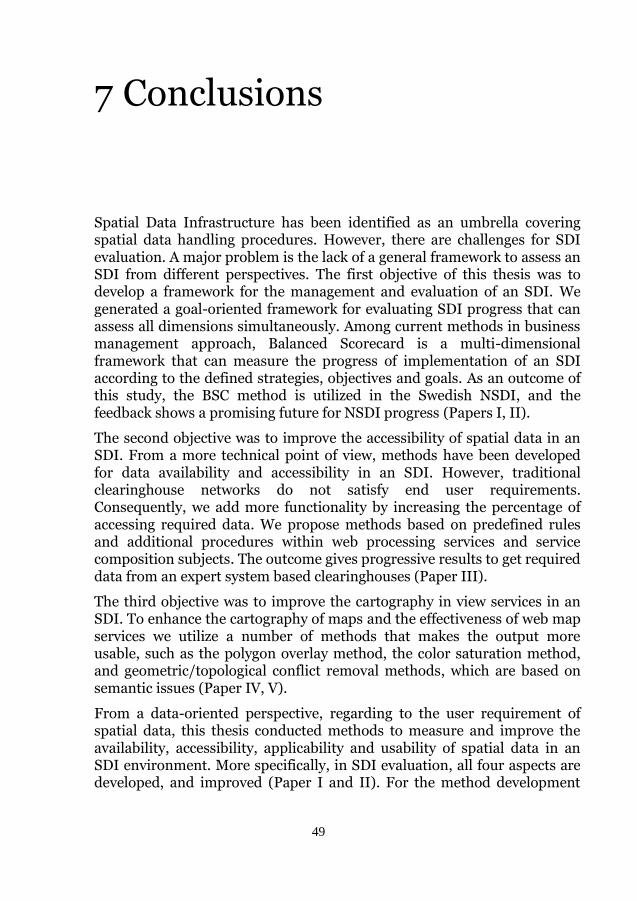
49
7 Conclusions
Spatial Data Infrastructure has been identified as an umbrella covering spatial data handling procedures. However, there are challenges for SDI evaluation. A major problem is the lack of a general framework to assess an SDI from different perspectives. The first objective of this thesis was to develop a framework for the management and evaluation of an SDI. We generated a goal-oriented framework for evaluating SDI progress that can assess all dimensions simultaneously. Among current methods in business management approach, Balanced Scorecard is a multi-dimensional framework that can measure the progress of implementation of an SDI according to the defined strategies, objectives and goals. As an outcome of this study, the BSC method is utilized in the Swedish NSDI, and the feedback shows a promising future for NSDI progress (Papers I, II).
The second objective was to improve the accessibility of spatial data in an SDI. From a more technical point of view, methods have been developed for data availability and accessibility in an SDI. However, traditional clearinghouse networks do not satisfy end user requirements. Consequently, we add more functionality by increasing the percentage of accessing required data. We propose methods based on predefined rules and additional procedures within web processing services and service composition subjects. The outcome gives progressive results to get required data from an expert system based clearinghouses (Paper III).
The third objective was to improve the cartography in view services in an SDI. To enhance the cartography of maps and the effectiveness of web map services we utilize a number of methods that makes the output more usable, such as the polygon overlay method, the color saturation method, and geometric/topological conflict removal methods, which are based on semantic issues (Paper IV, V).
From a data-oriented perspective, regarding to the user requirement of spatial data, this thesis conducted methods to measure and improve the availability, accessibility, applicability and usability of spatial data in an SDI environment. More specifically, in SDI evaluation, all four aspects are developed, and improved (Paper I and II). For the method development
49

issues, Paper III contributes by improving the accessibility, Paper IV develops the usability, and finally, Paper V proposes methods to increase the applicability and usability of spatial data.
50
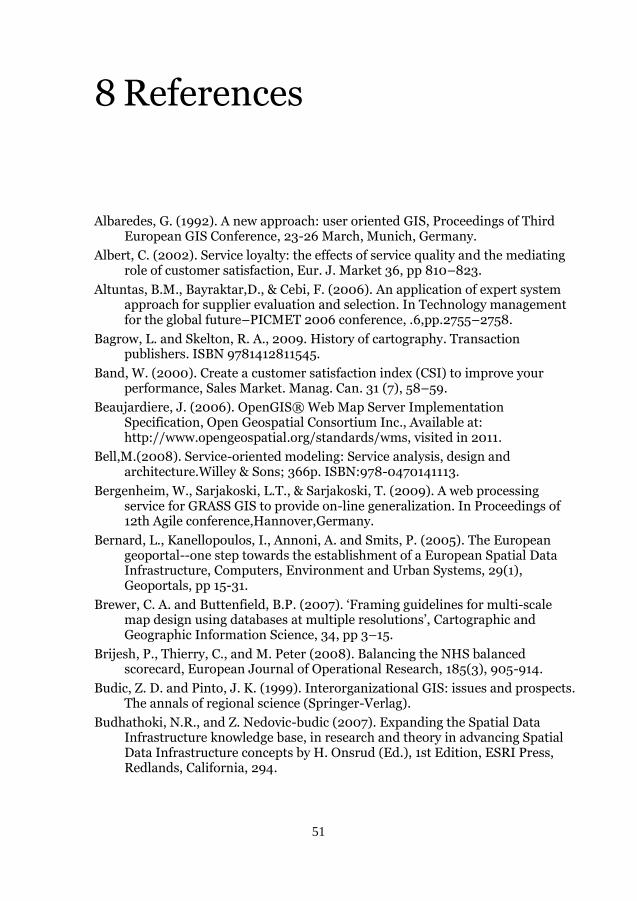
51
8 References
Albaredes, G. (1992). A new approach: user oriented GIS, Proceedings of Third European GIS Conference, 23-26 March, Munich, Germany.
Albert, C. (2002). Service loyalty: the effects of service quality and the mediating role of customer satisfaction, Eur. J. Market 36, pp 810–823.
Altuntas, B.M., Bayraktar,D., & Cebi, F. (2006). An application of expert system approach for supplier evaluation and selection. In Technology management for the global future–PICMET 2006 conference, .6,pp.2755–2758.
Bagrow, L. and Skelton, R. A., 2009. History of cartography. Transaction publishers. ISBN 9781412811545.
Band, W. (2000). Create a customer satisfaction index (CSI) to improve your performance, Sales Market. Manag. Can. 31 (7), 58–59.
Beaujardiere, J. (2006). OpenGIS® Web Map Server Implementation Specification, Open Geospatial Consortium Inc., Available at: http://www.opengeospatial.org/standards/wms, visited in 2011.
Bell,M.(2008). Service-oriented modeling: Service analysis, design and architecture.Willey & Sons; 366p. ISBN:978-0470141113.
Bergenheim, W., Sarjakoski, L.T., & Sarjakoski, T. (2009). A web processing service for GRASS GIS to provide on-line generalization. In Proceedings of 12th Agile conference,Hannover,Germany.
Bernard, L., Kanellopoulos, I., Annoni, A. and Smits, P. (2005). The European geoportal--one step towards the establishment of a European Spatial Data Infrastructure, Computers, Environment and Urban Systems, 29(1), Geoportals, pp 15-31.
Brewer, C. A. and Buttenfield, B.P. (2007). ‘Framing guidelines for multi-scale map design using databases at multiple resolutions’, Cartographic and Geographic Information Science, 34, pp 3–15.
Brijesh, P., Thierry, C., and M. Peter (2008). Balancing the NHS balanced scorecard, European Journal of Operational Research, 185(3), 905-914.
Budic, Z. D. and Pinto, J. K. (1999). Interorganizational GIS: issues and prospects. The annals of regional science (Springer-Verlag).
Budhathoki, N.R., and Z. Nedovic-budic (2007). Expanding the Spatial Data Infrastructure knowledge base, in research and theory in advancing Spatial Data Infrastructure concepts by H. Onsrud (Ed.), 1st Edition, ESRI Press, Redlands, California, 294.
51
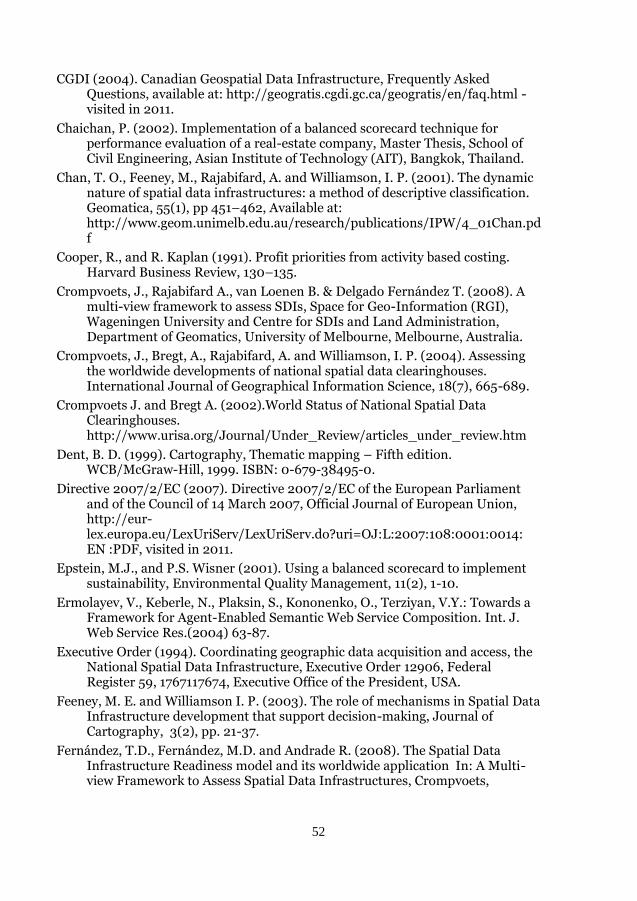
CGDI (2004). Canadian Geospatial Data Infrastructure, Frequently Asked Questions, available at: http://geogratis.cgdi.gc.ca/geogratis/en/faq.html - visited in 2011.
Chaichan, P. (2002). Implementation of a balanced scorecard technique for performance evaluation of a real-estate company, Master Thesis, School of Civil Engineering, Asian Institute of Technology (AIT), Bangkok, Thailand.
Chan, T. O., Feeney, M., Rajabifard, A. and Williamson, I. P. (2001). The dynamic nature of spatial data infrastructures: a method of descriptive classification. Geomatica, 55(1), pp 451–462, Available at: http://www.geom.unimelb.edu.au/research/publications/IPW/4_01Chan.pdf
Cooper, R., and R. Kaplan (1991). Profit priorities from activity based costing. Harvard Business Review, 130–135.
Crompvoets, J., Rajabifard A., van Loenen B. & Delgado Fernández T. (2008). A multi-view framework to assess SDIs, Space for Geo-Information (RGI), Wageningen University and Centre for SDIs and Land Administration, Department of Geomatics, University of Melbourne, Melbourne, Australia.
Crompvoets, J., Bregt, A., Rajabifard, A. and Williamson, I. P. (2004). Assessing the worldwide developments of national spatial data clearinghouses. International Journal of Geographical Information Science, 18(7), 665-689.
Crompvoets J. and Bregt A. (2002).World Status of National Spatial Data Clearinghouses. http://www.urisa.org/Journal/Under_Review/articles_under_review.htm
Dent, B. D. (1999). Cartography, Thematic mapping – Fifth edition. WCB/McGraw-Hill, 1999. ISBN: 0-679-38495-0.
Directive 2007/2/EC (2007). Directive 2007/2/EC of the European Parliament and of the Council of 14 March 2007, Official Journal of European Union, http://eur-lex.europa.eu/LexUriServ/LexUriServ.do?uri=OJ:L:2007:108:0001:0014: EN :PDF, visited in 2011.
Epstein, M.J., and P.S. Wisner (2001). Using a balanced scorecard to implement sustainability, Environmental Quality Management, 11(2), 1-10.
Ermolayev, V., Keberle, N., Plaksin, S., Kononenko, O., Terziyan, V.Y.: Towards a Framework for Agent-Enabled Semantic Web Service Composition. Int. J. Web Service Res.(2004) 63-87.
Executive Order (1994). Coordinating geographic data acquisition and access, the National Spatial Data Infrastructure, Executive Order 12906, Federal Register 59, 1767117674, Executive Office of the President, USA.
Feeney, M. E. and Williamson I. P. (2003). The role of mechanisms in Spatial Data Infrastructure development that support decision-making, Journal of Cartography, 3(2), pp. 21-37.
Fernández, T.D., Fernández, M.D. and Andrade R. (2008). The Spatial Data Infrastructure Readiness model and its worldwide application In: A Multi-view Framework to Assess Spatial Data Infrastructures, Crompvoets,
52
53
J.W.H.C.; Rajabifard, A.; Loenen, B. van; Delgado Fernandez, T., Melbourne, Australia : The Melbourne University Press, pp 117 – 134.
Fernandes K.J., Raja V., and A. Whalley (2006). Lessons from implementing the balanced scorecard in a small and medium size manufacturing organization, Technovation, (26), 623-634.
FGDC (2009). FGDC registry and geoportal one stop (GOS) resources, available at: http://registry.fgdc.gov, visited in. 2011.
FGDC (2000a). Financing the NSDI, A report prepared by Urban Logic for FGDC, available at: http://www.fgdc.gov/funding/urbanlogic.pdf - visited in. 2011.
FGDC (2000b). Questions and answers about clearinghouses. Washington, DC: Federal Geographic Data Committee.
FGDC (1997). Framework, introduction and guide. (Washington: Federal Geographic Data Committee).
Folaron, J. (2003). The evolution of Six Sigma. Six Sigma Forum Magazine, 2(4): 38-44.
Fornell, C. (1992). A national customer satisfaction barometer: the Swedish experience, J. Market, (56), 6–21 (January).
Friis-Christensen, A.,Lucchi, R., Lutz, M., & Ostländer, N. (2009). Service chaining architectures for applications implementing distributed geographic information processing. International Journal of Geographical Information Science, 23, pp 561–580.
GeoConnections (2007). GeoConnections Program for CGDI. available at: http://www.geoconnections.org/publications/Technical_Manual/html_e/s1_ch3.html.
Georgiadou, Y., Puri, S.K., and Sahay, S. (2005). Towards a potential research agenda to guide the implementation of spatial data infrastructures - A case study from India, International journal of geographic information science, (19), 113-1130.
Geudens, T., Macharis, C., Crompvoets, J. and F. Plastria (2009). Assessing Spatial Data Infrastructure Policy Strategies Using the Multi-Actor Multi-Criteria Analysis, International Journal of Spatial Data Infrastructures Research, 4, pp 265-297.
Giarratano J. & Riley G. (1989). Expert Systems: Principles and Programming, PWS-Kent Publishing Co, Boston, MA, 597 pages.
Giff (2008). A Framework for Designing Performance Indicators for Spatial Data Infrastructure Assessment In: A Multi-view Framework to Assess Spatial Data Infrastructures, Crompvoets, J.W.H.C.; Rajabifard, A.; Loenen, B. van; Delgado Fernandez, T., Melbourne, Australia : The Melbourne University Press, pp 211 – 230.
Giff, G. A., and J. Crompvoets (2008). Performance indicators a tool to support Spatial Data Infrastructure assessment, Computers, Environment and Urban Systems, 32, pp 365–376.
Giff, G., and Coleman, D. (2003). Financing SDI development: examining alternative funding models, in Williamson, I.P., Rajabifard, A., and Feeney,
53
M.E.F. (eds.), Developing Spatial Data Infrastructures: from concept to reality, London and New York: Taylor & Francis.
Giff, G., and Coleman, D. (2002). Spatial data infrastructure funding models: a necessity for the success of SDIs in emerging countries, FIG XXII International Congeress, 19-26 April, Washington, D.C., USA.
Granell, C., Gould, M., & Ramos, F. (2005). Service composition for SDIs: Integrated components creation. In Sixteenth international workshop on database and expert systems applications, 26 August 2005 pp475 –479. Copenhagen, Denmark: IEEE.
Granić, A., Mitrović, I., Marangunić, N. (2011). Exploring the usability of web portals: A Croatian case study, International Journal of Information Management, Volume 31, Issue 4, August 2011, Pages 339-349,
Groot, R. (2001). Economic issues in the evolution of national geo-spatial data infrastructure, 7th United Nations Regional Cartographic Conference for the America, New York, USA.
Groot R and J. McLaughlin (2000). Geospatial Data Infrastructures. Oxford, Oxford University Press.
GSDI (2009). Global Spatial Data Infrastructure Association, available at: http://www.gsdi.org/ - visited in 2011.
Grus,L., Castelein, W., Crompvoets, J., Overduin, T., van Loenen, B., van Groenestijn, A., Rajabifard, A., Bregt, A. K., (2010). An assessment view to evaluate whether Spatial Data Infrastructures meet their goals, Computers, Environment and Urban Systems, 35(3), pp 217-229.
Grus, L., Crompvoets, J., and A. Bregt (2007). Multi-view SDI assessment framework, International Journal of Spatial Data Infrastructures Research, 2, pp 33-53.
Hackl, P., Kristensen, P.K., and A. H. Westlund (2000). Customer satisfaction: theory and measurement. Special Issue of Journal of Total Quality Management.
Harrie, L., Mustiere, S., Stigmar, H. (2011). Cartographic Quality Issues for View Services in Geoportals, Cartographica 46(2), 2011, pp 92–100.
Harvey F and D. Tulloch (2006). Local-government data sharing: Evaluating the foundations of spatial data infrastructures. International Journal of Geographical Information Science 20: 743–68
Hunter, J. (2001). MetaNet – a metadata term thesaurus to enable semantic interoperability between metadata domains. Journal of Digital Information 1 (8). available at: http://journals.tdll.org/jodi/article/view/33/34. visited in 2011.
ICA, 1973. Multilingual Dictionary of Technical Terms in Cartography. Franz Steiner Verlag GMBH.
Idalina, D-S., Lucas, R., and A. Paula (2007). Developing sustainability balanced scorecards for environmental services: A study of three large Portuguese companies, Environmental Quality Management, 16(4), pp 13-34.
54
55
INSPIRE (2009a). Infrastructure for Spatial Information in Europe, available at: http://inspire.jrc.ec.europa.eu/ visited in 2011.
INSPIRE (2009b). INSPIRE Metadata Implementing Rules: Technical Guidelines based on EN ISO 19115 and EN ISO 19119, http://inspire.jrc.ec.europa.eu/reports/ImplementingRules/metadata/MD_IRand_ISO_20090218.pdf , visited in 2011.
Iosifescu-Enescu, I., Hugentobler, M. and Hurni, L.(2009).‘Web cartography with open standards–a solution to cartographic challenges of environmental management’, Environmental Modelling&Software,25,pp.988–999.
ISO/TC-211 (2009). Geographic information/Geomatics, available at: http://www.isotc211.org, visited in 2011.
ISO (2005). ISO 19119: 2005 geographic information–Services,international standard, ISOTC211.
Janssen, K. (2008). A legal approach to assessing Spatial Data Infrastructures, In: A Multi-view Framework to Assess Spatial Data Infrastructures, Crompvoets, J.W.H.C.; Rajabifard, A.; Loenen, B. van; Delgado Fernandez, T., Melbourne, Australia : The Melbourne University Press, ISBN 9780732516239, pp 255 –272.
Kaplan, R. S., and D. P. Norton (2000). Having trouble with your strategy? Then map it. Harvard Business Review (September-October): pp 167-176.
Kaplan, R.S., and D. P. Norton (1996). Using the balanced scorecard as a strategic management system, Harvard Business Review, 74(1),pp 75–85.
Kavouras M and Kokla M, 2008, Theories of Geographic Concepts: Ontological Approaches to Semantic Integration. CRC Press, Boca Raton, FL, USA.
Keates, J. S., 1996. Understanding Maps – 2nd edition. Longman, 1996. ISBN 0-582-23927-3.
Kiehle,C., Greve,K., & Heier,C. (2007). Requirements for next generation spatial data infrastructures – standardized web based geoprocessing and webservice orchestration. Transactions in GIS, 11, pp 819–834.
Kok, B. and van Loenen, B. (2005). How to assess the success of National Spatial Data Infrastructures? , Computers, Environment and Urban Systems, 29(6), pp 699-717.
Kumar, S., & Mishra, R. B. (2008). A Framework Towards Semantic Web Service Composition Based on Multi-Agent System. International Journal of Information Technology and Web Engineering (IJITWE), 3(4), 59-81.
Lanig S. & A. Zipf (2010): Proposal for a Web Processing Services (WPS) Application Profile for 3D Processing Analysis. GEOProcessing 2010 - The Second International Conference on Advanced Geographic Information Systems, Applications, and Services. Netherlands Antilles.
Lantmäteriet (2010). Geodata project, www.geodata.se, visited in 2010.
Lantmäteriet (2008). A National Geodata Strategy. http://www.lantmateriet.se/upload/filer/om_lantmateriet/Infrastruktur_goedata/Geodata_Strategy_2008.pdf, visited in 2011.
55

Lemmens, R., de By, R., Gould, M.,Wytzisk, A., Granell, C., & van Oosterom, P. (2007). Enhancing geo-service chaining through deep service descriptions. Transactions inGIS, 11, pp 849–871.
Lemmens, R., Granell, C., Wytzisk, A., de By, R., Gould, M., & van Oosterom, P. (2006). Integrating semantic and syntactic descriptions to chain geographic services. IEEE Internet Computing, 10, pp 42–52.
Lemmens, R.L.G. (2006). Semantic interoperability of distributed geo - services. PhD Thesis, Delft University of Technology, ITC Dissertation 138.
Lemmens, M. J. P. M. (2001). A European perspective on Geo-Information Infrastructure (GII) issues, available at: http://www.gisdevelopment.net/policy/international/interna011.htm – visited in 2011.
Luzet, C. (2004). Geospatial data development: building data for multiple uses, In D. Nebert (Ed.), developing spatial data infrastructure: The SDI Cook Book, 13-23, at: http://www.gsdi.org/docs2004/Cookbook/cookbookV2.0.pdf, visited 2011.
McIlraith, S.A., Son, T.C., & Zeng, H. (2001). Semantic Web Services. IEEE Intelligent Systems 16(2), 46-53.
Masser, I. (2010). Building European Spatial Data Infrastructures. Redlands: ESRI Press.
Masser, I. (1998). The first generation of national geographic information strategies, Selected Conference Papers of the 3rd Global Spatial Data Infrastructure Conference, 17-19 November 1998, Canberra, Australia.
Mansourian, A., Omidi, E., Toomanian, A., Harrie, L., (2010), Expert System to Support Functionality of Clearinghouse Services, Computers, Environment and Urban Systems, 35(2), pp 159-172, Paper III.
Mansourian, A. and Valadan Zoej, M. J. (2008.). Iran SDI initiative: study phase of NSDI, The International Archives of the Photogrammetry, Remote Sensing and Spatial Information Sciences. Vol. XXXVII. Part B4. Beijing.
Mansourian, A., Rajabifard, A., Valadan Zoej, M.J., Williamson, I. (2006). Using SDI and web-based system to facilitate disaster management, Computers & Geosciences, Volume 32, Issue 3, April, pp 303-315, ISSN 0098-3004.
Mansourian A. (2005). Development of an SDI Conceptual Model and Web-based GIS to Facilitate Disaster Management, PhD Thesis, Faculty of Geodesy & Geomatics Eng., K.N.Toosi University of Technology, Tehran, Iran
Mapping Science Committee (1997). The future of Spatial Data and Society, Washington D.C.: National Academic Press.
Martin, D., Burstein, M., Hobbs, J., Lassila, O., McDermott, D., McIlraith, S., Narayanan, S., Paolucci, M., Parsia, B., Payne, T., Sirin, E., Srinivasan, N., and Sycara, K. OWL-S: Semantic Markup for Web Services. W3C Member Submission, expository document, World Wide Web Consortium, November 2004. Available at http://www.w3.org/Submission/2004/07/.
Motta, E., Domingue, J., Cabral, L., and Gaspari, M. (2003). IRS-II: A Framework and Infrastructure for Semantic Web Services. In Proceedings The
56

57
SemanticWeb - ISWC 2003 Second International SemanticWeb Conference (Sanibel Island, FL, USA, 2003), J. M. Dieter Fensel, Katia Sycara, Ed., vol. Lecture Notes in Computer Science Volume 2870 / 2003, Springer- Verlag Heidelberg.
Müller M. (2006). Symbology Encoding Descriptor Implementation Specification, Open Geospatial Consortium.
Müller M and MacGill J.(2005). OpenGIS® Styled Layer Descriptor Profile of the Web Map Service Implementation Specification, Open Geospatial Consortium.
Najar, C., Rajabifard, A., Williamson, I., and Giger, C. (2006). A Framework for Comparing Spatial Data Infrastructures, an Australian-Swiss Case Study In: GSDI 9 - International Conference for Global Spatial Data Infrastructure, 3-11 Nov 2006, Santiago, Chile.
Nebert (2001). SDI Cookbook: Developing Spatial Data Infrastructure: The SDI Cookbook, Ver 1.1, Global Spatial Data Infrastructure (GSDI), Editor: Douglas D. Nebert, Technical Working Group Chair, GSDI.
Nedović-Budić, Z., Pinto, J. K. and Budhathoki, N. R. (2008). SDI Effectiveness from the User Perspective, In: A Multi-view Framework to Assess Spatial Data Infrastructures, Crompvoets, J.W.H.C.; Rajabifard, A.; Loenen, B. van; Delgado Fernandez, T., Melbourne, Australia : The Melbourne University Press, pp 273 – 303.
Nedović-Budić, Z.,Feeney, M, F., Rajabifard, A. And Williamson, I (2004). Are SDIs serving the needs of local planning? Case study of Victoria, Australia and Illinois,USA, Computers, Environment and Urban Systems, 28, pp 329-351.
OMB (2002). To the heads of executive departments and establishments, Circular No. A-16, August 19, 2002. available at: http://www.whitehouse.gov/omb/rewrite/circulars/a016/print/a016_rev.html, - visited in 2011.
Patil, A., Oundhakar, S., Sheth, A., and Verma, K. (2004). METEOR-S Web service Annotation Framework. WWW 2004, May 1722, 2004, New York, New York, USA.
Phillips, A., Williamson, I.P. and Ezigbalike, I.C. (1999). Spatial Data Infrastructure Concepts, The Australian Surveyor, 44(1), pp 20-28.
Radwan, M. (2002). The Development of Geographic Information Infrastructure ‘GDI/SDI’ to Support Access to Spatial data in Distributed Environment. Enschede, the Netherlands.
Rajabifard A. and Williamson I. P. (2003a). Asia-Pacific Region and SDI activities, Journal of GIS Development, July 2003, Vol. 7, Issues 7.
Rajabifard A, Feeney M F, and I. Williamson, (2003b). Spatial Data Infrastructures: Concept, nature and SDI hierarchy. In Williamson I, Rajabifard A, and Feeney M F (Eds.) Developing Spatial Data Infrastructures: From Concept to Reality. Boca Raton, FL, CRC Press: pp 17–40.
57

Rajabifard, A., Feeney, M. E. and Williamson I. P. (2002). Future directions for SDI development, International Journal of Applied Earth Observation and Geoinformation, 4(1), pp 11-22, ISSN 0303-2434.
Rajabifard, A., Williamson, I. P., Holland, P. and Johnstone, G. (2000a). From Local to Global SDI initiatives: a pyramid building blocks, proceedings of the 4th Global Spatial Data Infrastructure Conference, 13-15 March 2000, Cape Town, South Africa.
Rajabifard, A., Escobar, F. and Williamson, I.P. (2000b). Hierarchical Spatial Reasoning Applied to Spatial Data Infrastructures, Journal of spatial science, 29 (2), pp.41-50, Australia.
Remkes, J. W. (2000). Foreword in geospatial data infrastructure: cases, concepts and good practices, Edited by Groot, R. and McLaughlin J, New York: Oxford University Press.
Rhind, D. (2000). Funding and NGDI, in Groot R., and McLaughlin J. (eds), Geospatial data infrastructure concepts: cases and good practices, New York: Oxford University Press.
Rhind, D. (1999). Key economic characteristics of information, Ordnance Survey, U.K.
Robinson, A. H., Morrison, J. L., Muehrcke, P. C., and Guptil, S. C. (1995). Elements of cartography – sixth edition. John Wiley and sons, Inc., ISBN: 0-471-55579-7.
Sandgren, U. (2010). Lantmäteriet; project leader of the Swedish Geodata strategy. Personal communication.
Sashkin, M. and K.J. Kiser (1993). Putting total quality management to work. San Francisco: Berrett-Koehler.
Schut, P. (2007). OpenGIS Web processing service, Open Geospatial Consortium Inc., Reference number: OGC 05-007r7, available at: http://www.opengeospatial.org/standards/wps, visited in 2011.
Silk, S. (1998). Automating the balanced scorecard. Management Accounting, 79 (11),pp 38–44.
Shea, K. S. and McMaster, R. B., 1989. Cartographic generalization in a digital environment: When and how to Generalize. Proceedings of 9th International Symposium on Computer-Assisted Cartography (Auto-Carto9) 1989.
Slocum A, McMaster R, Kessler F, Howard, H. (2005). Thematic Cartography and Geographic Visualization, second ed. Pearson Education Inc, 518pp.
SLD (2007). Styled Layer Descriptor profile of the Web Map Service Implementation Specification - Version: 1.1.0 (revision 4). Open Geospatial Consortium Inc., 2007-06-29. Available online: http://www.opengeospatial.org/standards/sld , visited in 2011.
Soderman, A., Dahlbergm, M. (2011). Methods for visualization enhencement in multi source web mapping services using basic cartographic rules. In Proceedings of the 25th International Cartographic Conference, Paris, 3–8 July 2011.
58

59
Steudler, D., Rajabifard, A. and Williamson, I. (2008). Evaluation and Performance Indicators to Assess Spatial Data Infrastructure Initiatives, In: A Multi-view Framework to Assess Spatial Data Infrastructures, Crompvoets, J.W.H.C.; Rajabifard, A.; Loenen, B. van; Delgado Fernandez, T., Melbourne, Australia : The Melbourne University Press, ISBN 9780732516239, pp 193 –210.
Stojanovic,T., Green, D. R., Lymbery,G. (2010). Approaches to knowledge sharing and capacity building: The role of local information systems in marine and coastal management, Ocean & Coastal Management, 53(12), pp 805-815.
Sydenham, P.H. & Thorn, R. (2005). Handbook of Measuring System Design, Rule-based Expert Systems, Wiley & Sons, USA, 1648 Pages.
Tait, M.G. (2005). Implementing geoportals: applications of distributed GIS, Computer, environment and urban systems, 29, pp 33-47.
Thellufsen, C., Rajabifard, A., Enemark, S. and Williamson, I (2009). Awareness as a foundation for developing effective spatial data infrastructures, Land Use Policy, 26(2), pp 254-261
Toomanian, A., Harrie, L., Olsson, P., (2011), Automatic symbolization methods for geoportals, The Cartographic Journal, Accepted, DOI: 10.1179/1743277411Y.0000000028, Paper IV.
Toomanian, A. Mansourian, A. , Harrie, L. and A. Rydén (2011).Using Balanced Scorecard for Evaluation of Spatial Data Infrastructures: A Case Study in Accordance with INSPIRE, International Journal of Spatial Data Infrastructures Research, Vol. 6, Paper II.
Toomanian, A. and Mansourian, A. (2009). An Integrated Framework for the Implementation and Continuous Improvement of Spatial Data Infrastructures. SDI Convergence. Research, Emerging Trends, and Critical Assessment. B. van Loenen, J.W.J. Besemer, J.A. Zevenbergen (Editors). Nederlandse Commissie voor Geodesie Netherlands Geodetic Commission 48, Paper I.
Van den Worm, J. (2001). Chapter 7, Web map design in practise. In Kraak, M-J. and Brown, A. (Eds.). Web Cartography – developments and prospects. Taylor and Francis Inc. ISBN 074840869X.
Vandenbroucke, D., K. Janssen and J. Van Orshoven (2008). INSPIRE State of Play: Generic approach to assess NSDI. In Crompvoets, J., A. Rajabifard, B. van Loenen and T. Delgada (Eds.). A Multi-View Framework to Assess National Spatial Data Infrastructures, Melbourne University Press, Australia, pp 145 - 172.
van Loenen, B. and van Rij, E. (2008). Assessment of Spatial Data Infrastructures From an Organizational Perspective, In: A Multi-view Framework to Assess Spatial Data Infrastructures, Crompvoets, J.W.H.C.; Rajabifard, A.; Loenen, B. van; Delgado Fernandez, T. (Eds.), Melbourne, Australia: The Melbourne University Press, pp 173 – 192.
Van Loenen, B. (2006). Developing geographic information infrastructures; the role of information policies. Dissertation. Delft University of Technology. Delft: DUP Science.
59
Van Leonen, B. and Kok, B. C. (2004). Spatial Data Infrastructure and policy development in Europe and United States, Delft University of Technology, The Netherlands: DUP Science.
Van Leonen, B. (2003). Free charge or revenue generation? (invited reply: cost recovery policy irrational but understandable), in: GM International 2, 17, pp. 45-46.
Vretanos, P.A. (2005). Web Feature Service Implementation Specification; Open Geospatial Consortium (OGC), OGC 04-094, available at: http://www.opengeospatial.org/standards/wfs, visited in 2011.
W3C (2005).Semantic Web Services Framework (SWSF) Overview. W3c member submission, World Wide Web Consortium.
Walenciak, G. and Zipf, A. (2010). Designing a Web Processing Service application Profile for Spatial Analysis in Business Marketing 13th AGILE International Conference on Geographic Information Science 2010 pp Guimarães, Portugal.
WFS (2005). Web Feature Service Implementation Specification - Version: 1.1.0. Open Geospatial Consortium Inc., 3 May 2005. Available online: http://www.opengeospatial.org/standards/wfs, visited in 2011.
When de Montalvo, U. (2000). Access to spatial data – what determine the willingness of organizations to share it?, 4th GSDI Conference, Cape Town, South Africa.
Whiteside, A. and Evans, D. J. (2008). Web Coverage Service (WCS) Implementation Standard, Open Geospatial Consortium (OGC), OGC 07-067r5, 2008, available at: http://www.opengeospatial.org/standards/wcs, visited in 2011.
Williamson I. P., Rajabifard, A. and Feeney, M. E. (2003). Developing spatial data infrastructures: from concept to reality, CRC Press, ISBN 041530265X
Zhang,D.-H.,Xie,B.,Yu,L.,&DI,L.-P.(2008).Open geospatial information services chaining based on OGC specifications and processing model. In International workshop on education technology and training & international workshop on geoscience and remote sensing, 21–22 December 2008, Shanghai, China.
60
Recommended


