578 | AUGUST 2004 | VOLUME 5 www.nature.com/reviews/genetics
R E V I E W S
The construction of a whole-genome physical map hasbeen an essential component of numerous genome pro-jects initiated since the inception of the HumanGenome Project (HGP). The production and integra-tion of genetic, physical, gene and sequence maps wasthe goal of the HGP1. Although genetic mapping hasbeen pursued in plants and animals for decades, it isonly relatively recently that advances in cloning andclone fingerprinting have allowed the construction ofphysical maps. A physical map is an ordered set of DNAfragments, among which the distances are expressed inphysical distance units (base pairs). These days, a physi-cal map usually comprises a set of ordered large-insertclones such as BACTERIAL ARTIFICIAL CHROMOSOMES (BACs)2,which have largely replaced YEAST ARTIFICIAL CHROMOSOMES3
as the preferred building blocks of a physical map.Physical maps can be independent of genetic informationbut are more valuable if linked to genetically mappedmarkers, and are even more powerful if integrated withgenomic sequence data.
Much progress has been made in the development oftechnologies and strategies for whole-genome sequenc-ing, but these strategies still depend on the developmentof a physical map. In the clone-by-clone whole-genomesequencing method, the physical map is constructedfirst, and a MINIMAL TILING PATH of clones is then selected forseparate shotgun sequencing of each clone in the path4.
An alternative to the clone-by-clone method is whole-genome shotgun (WGS) sequencing, which uses assem-bled sequence data generated randomly from the entiregenome4,5. In theory, WGS sequencing makes obsoletethe process of physical mapping because it should con-struct overlapping contiguous segments (contigs) ofsequence data. However, it is not yet clear whether WGSsequencing alone is sufficient to produce a linearlyordered set of sequences if the sequence contigs are notcoupled to a robust physical map4,6–9. Therefore, a hybridstrategy of the two methods for whole-genome sequenc-ing will probably prove to be most productive4.With thishybrid approach, WGS sequence data are aligned withmapped BAC-end sequences, and these assembled con-tigs are anchored to a physical map scaffold that com-prises ordered and orientated BACs that include mappedmolecular markers10,11.
The lack of high-quality physical maps could rapidlybecome one of the limiting factors in assembling newlygenerated WGS sequences for large genomes. Theproductivity of large sequencing centres has alreadyoutstripped the ability of physical mapping laboratoriesto provide ordered sequence maps. Without the linearorder that physical maps provide, the marginal advan-tage that WGS sequencing projects have over a compre-hensive EST or a full-length cDNA sequencing effortdoes not justify the considerable increase in costs.
MAPPING AND SEQUENCINGCOMPLEX GENOMES: LET’S GETPHYSICAL!Blake C. Meyers*, Simone Scalabrin‡§ and Michele Morgante‡
Physical maps provide an essential framework for ordering and joining sequence data,genetically mapped markers and large-insert clones in eukaryotic genome projects. A goodphysical map is also an important resource for cloning specific genes of interest, comparinggenomes, and understanding the size and complexity of a genome. Although physical maps areusually taken at face value, a good deal of technology, molecular biology and statistics goes intotheir making. Understanding the science behind map building is important if users are tocritically assess, use and build physical maps.
BACTERIAL ARTIFICIAL
CHROMOSOME
(BAC). A cloning vector derivedfrom a single-copy F-plasmid ofEscherichia coli. Large genomicfragments (100–200 Kb) can becloned into BACs, making themuseful for constructing genomiclibraries.
*Department of Plant andSoil Sciences and DelawareBiotechnology Institute,University of Delaware,Newark, Delaware 19711,USA.‡Dipartimento di ScienzeAgrarie ed Ambientali,§Dipartimento diMatematica ed Informatica,Universita’ di Udine,Via delle Scienze 208,I-33100 Udine, Italy.Correspondence to M.M.e-mail: [email protected]:10.1038/nrg1404
NATURE REVIEWS | GENETICS VOLUME 5 | AUGUST 2004 | 579
R E V I E W S
YEAST ARTIFICIAL
CHROMOSOME
(YAC). A cloning vector system that can accommodate large genomic fragments (500–1,000 Kb).YACs are grown in yeast, and can beunstable and difficult to isolatein comparison to BACs.
sequence. Some resources, such as RADIATION HYBRID CELL
LINES, were used extensively in the construction of physicalmaps of mammals, but have so far proved difficult orimpossible to develop for other species12,13. Several alter-native strategies are now being considered to obtain genicsequences in species with large genomes14. Two of thesestrategies, METHYLATION FILTRATION and HIGH C
OT SELECTION,
have recently been applied to maize and shown to bevalid alternatives to traditional approaches to genomicsequencing15,16. However, sequence contigs that are gen-erated by these approaches will have to be ordered onthe basis of a genomic scaffold, and this will require arobust physical map. Even in the absence of a whole-genome sequence assembly, a densely populated physi-cal map allows map-based cloning and comparativegenomics. Physical maps are also being built for wildrelatives of species with a sequenced genome for com-parative purposes; this provides a shortcut to addresscertain questions for which re-sequencing a genome isimpractical.
The goal of this review is to provide guidance bothin the evaluation of previously constructed physicalmaps and in the choice of methods used to build a physical map de novo. Here, we discuss the differentphysical mapping techniques and their advantages anddisadvantages. In particular, we focus on methods thatorder large-insert clones rather than those that ordermarkers such as radiation hybrid (RH) mapping17 orHAPPY MAPPING18. Physical maps are often made availablethrough the Internet before publication in refereed jour-nals, and before critical evaluation. Moreover, primaryresearch publications do not evaluate techniques orapproaches in a critical or comparative fashion. Here, weaim to address this deficit in critical evaluation to allowpotential users to take full advantage of the maps and tohelp them to understand the science and statistics that liebehind the physical mapping process.
Fingerprinting technologies for physical mappingBanding patterns on chromosomes might be consideredto be the earliest and least detailed form of a physicalmap, with the complete nucleotide sequence of anorganism representing the other extreme. Current phys-ical maps are based on technologies to detect overlapsamong BACs. Two distinct approaches are used to iden-tify the overlap among clones, and numerous tech-niques have been applied for each approach. The firstapproach is to screen the clones to assess the presence ofDNA landmarks. Screening techniques include PCRamplification of short fragments known as ‘SEQUENCE-
TAGGED SITES’ (STSs)19,20, and hybridization of labelledcDNA clones or short, gene-specific oligonucleotides21
(see, for example, REF. 22). This approach is laborious,and if used alone to construct a physical map, requiresan extremely high density of markers that is impracticalfor most applications.
Here, we focus on the second approach to physicalmapping, which is to use DNA fingerprinting andessentially to perform restriction mapping at awhole-genome level23. This approach is better suitedto relatively unexplored genomes and is more amenable
Large-scale mapping and sequencing is underway orplanned for many diverse organisms. However, most ofthese efforts will need to proceed without the vast molec-ular and financial resources that support organisms suchas human, mouse and rat. Physical maps can now be builtquickly for many species in which complete genomesequences will not be available soon because a map can beobtained at a fraction of the cost of a whole-genome
Separation Detection Band calling
20,000 bp10,000 bp
4,000 bp4,500 bp
2,000 bp
1,200 bp800 bp
Pairwise comparisonsHigh-stringencyassembly
Low-stringency and manual re-assembly
Verification and map alignmente
BAC clone
Digestion
BAC clone library, 7–30 genome equivalents, inserts produced with 1 or more restriction enzymes
b
c
a
d
Gel well
Figure 1 | The DNA fingerprinting approach to building a whole-genome physical map.a | A bacterial artificial chromosome (BAC) library. A BAC library that represents from 7 to 30 (ormore) genome equivalents is constructed. Use of multiple libraries produced with differentrestriction enzymes will result in better genome coverage. b | DNA fingerprinting of BAC clones.Each clone is restriction-enzyme-digested and the resultant fragments are subjected toelectrophoresis to produce the DNA fingerprints. Sizes of all DNA fragments detected on gel areestimated for each clone. c | Automated assembly. Using appropriate software, a full pairwisecomparison of all clones is performed to detect the proportion of shared bands among each pairof clones. Overlapping clones are identified and placed into contigs on the basis of a setthreshold (SULSTON CUTOFF SCORE) of a minimum proportion of shared bands. A clone-orderingalgorithm is then used to find the most likely relative order of BAC clones within each contig. Thishigh-stringency assembly process results in some overlaps that are not detected (the blue bandindicates gaps in the assembly). d | Manual curation and assembly. End clones from each contigcan be compared with one another at a relaxed cutoff score to detect smaller overlaps that wentundetected at the more stringent cutoff score used in the automated assembly (that is, to identifyassembly gaps). Misassembled clones can also be detected and removed from the assembly, orcontigs can be split if deemed unreliable. e | Map alignment and verification. The contigs arealigned to the genetic map or radiation hybrid map using shared markers to verify the map and tofurther merge contigs.The pink boxes indicate BAC-end sequences that have been used asgenetic markers to align contigs to the genetic map.

580 | AUGUST 2004 | VOLUME 5 www.nature.com/reviews/genetics
R E V I E W S
commercially produced by Molecular Probes, Inc.,Eugene, Oregon, USA) (FIG. 2b). This third method dif-fers substantially from those described above, becausenearly all restriction fragments that are produced from aclone are visible on the agarose gel, whereas the abovemethods visualize only a subset of fragments that havebeen labelled and require sequencing gels. The advan-tage of observing all fragments that result from a cloneis that the integrity of the overlap among clones can beverified easily and the size of the overlapping region canbe directly estimated rather than just inferred on thebasis of the proportion of shared fragments, as with thetwo other methods. The agarose fingerprinting methodhas since been widely applied because of its relative sim-plicity and low costs. This method also has several fur-ther advantages that derive from the fact that it is the
to high-throughput methods than the STS/hybridiza-tion mapping approach. In the fingerprinting approach(see FIG. 1), each clone is digested into fragments withrestriction enzymes, which are then separated anddetected. Overlapping clones derived from the samegenomic region produce patterns of shared restrictionfragments, seen as bands on a gel. The proportion ofshared bands is indicative of the degree of overlap. Theoverlap across numerous clones is then used to orderthe clones into contigs. Highly repetitive genomes canconfound the fingerprinting process, because the repeti-tive elements can produce identical band sizes and gen-erate false overlaps. Combining information aboutthousands of DNA landmarks, or markers, that areassigned an order on the chromosomes (throughgenetic mapping, for example) with the presence ofthose DNA landmarks on the contigs can allow thesecontigs to be assembled into a genome-wide physicalmap. Finishing work to identify clones that span pre-dicted gaps between adjacent contigs will coalesce thecontigs into larger scaffolds.
Fingerprinting methods. Modern fingerprintingmethods are derivations of classic techniques thatused restriction enzymes for early genome projectsincluding Escherichia coli, Saccharomyces cervisiae andCaenorhabditis elegans. The first application of whole-genome fingerprinting was the construction of a physi-cal map of the C. elegans genome using cosmid clones24.In this study, radioactively labelled restriction frag-ments were separated on polyacrylamide sequencing gels(FIG. 2a). HindIII — a 6-bp-recognizing enzyme (a ‘rarecutter’) — was used for the initial digestion of the cloneinto fragments, which are then end-labelled. Anotherdigestion with Sau3AI — a restriction enzyme that rec-ognizes 4 bp (a ‘frequent cutter’) — produces smallerfragments that are suitable for separation and detectionon sequencing gels. The subset of these fragments thathave labelled HindIII-ends can be detected24.
Brenner and Livak proposed a second fingerprintingmethod25 that uses automated sequencers. This methodtook advantage of properties of the type IIS restrictionenzymes that cut at a precisely defined distance fromtheir recognition site, leaving single-stranded overhangsof variable composition. The overhangs are filled inusing unlabelled deoxynucleotides (dNTPs) and fluo-rescently labelled dideoxynucleotides (ddNTPs) to pro-duce bands that automated sequencers can detect. Thesemachines can resolve band sizes at high resolution anddetermine the sequence of the 3′ fluorescently labelledbases. The availability of the terminal sequence of thesefragments markedly increases the information contentof fingerprints compared with the older radioactivemethods. This in turn allows more reliable identificationof shared fragments.
In a substantially different method26, large-insertclones are digested with a restriction enzyme — oftenHindIII — that recognizes 6 bp, and the resulting frag-ments are detected on agarose gels stained with ethid-ium bromide or in a more recent modification withSYBR Green27 (a highly sensitive DNA dye that is
MINIMAL TILING PATH
A minimal set of overlappingclones that together providescomplete coverage across agenomic region.
SULSTON CUTOFF SCORE
A score that expresses theprobability that the number ofbands matched between any twoclones being fingerprinted is acoincidence. Clones areconsidered to overlap if the scoreis below a user-suppliedthreshold (cutoff).
RADIATION HYBRID CELL LINES
A collection of cell lines, each ofwhich is a clonal population ofcells that are derived by thefusion of lethally X-irradiateddonor cells with mammaliancells. Such cell lines can be usedto create a physical map of thedonor genome.
METHYLATION FILTRATION
A method that takes advantageof higher DNA methylation inrepetitive than in low-single-copy sequences to selectivelyclone in Escherichia coli the latter (hypomethylated) ones that usually represent agene-enriched fraction.
HIGH COT SELECTION
A method that takes advantageof faster re-naturation ofrepetitive than of low-single-copy sequences to select first and then clone in Escherichia colithe latter ones that represent agene-enriched fraction.
HAPPY MAPPING
A simple method for orderingmarkers and determining thephysical distances between themthat uses subhaploid equivalentsof randomly sheared DNA andrequires the use of whole-genome amplification methodsto perform multiple PCRreactions.
SEQUENCE-TAGGED SITES
(STS). Short (for example,<1,000 bp), unique sequencethat is associated with a PCRassay that can be used to detectthat site in the genome.
a
b
BAC clone
Digestion (rare cutter, HindIII)and radioactive labelling
Digestion (frequent cutter, Sau3AI)
BAC clone
Digestion (rare cutter, HindIII)
Separation on agarose gel;DNA staining by ethidiumbromide or SYBR Green
Separation on acrylamide gel; detection by autoradiography
Figure 2 | Two main DNA fingerprinting methods.a | Schematic overview of the Coulson et al. fingerprintingmethod24. BAC clone DNA is digested with the rare cutterHindIII. The HindIII-fragment ends are labelled with [32P]dATPusing a DNA polymerase or reverse transcriptase. After heatinactivation of the enzymes, fragments are cut again using afrequent cutter, Sau3AI, so that they can be separated assingle-stranded molecules on a denaturing polyacrylamidegel. Only fragments with at least 1 end produced by HindIIIand that are ~50–600 bp will be visible; fragments with bothends produced by Sau3AI (grey fragments) or that are outsidethis size range will not be detected. A single DNA strand islabelled for each fragment, unless both ends of the fragmentare produced by HindIII, in which case two labelled fragmentsof the same size are produced. b | Schematic overview of theagarose fingerprinting method24. BAC clone DNA is digestedwith the rare cutter HindIII. Restriction fragments areseparated on agarose gels as double-stranded molecules.Detection is achieved by staining the gel with either ethidiumbromide24 or SYBR Green24. All fragments will be visibleexcept those that fall outside the resolution range of the gel(grey fragment in the figure), which is between 600 and25,000 bp. In both methods, external size markers are usedto size the fragments. Note that the two panels are not drawnto the same scale.
NATURE REVIEWS | GENETICS VOLUME 5 | AUGUST 2004 | 581
R E V I E W S
Which method? The three methods and their variations(see BOX 1) described above are clearly different in termsof the reaction biochemistry, the information contentand the separation medium. The best direct comparisonof these physical mapping approaches would involveconstructing maps with each method using identicalclone libraries and evaluating the resulting assemblies.In lieu of whole-genome experimental comparisons,we carried out simulations using sequenced clones tocompare the methods. The in silico digestion results ofa set of 19 sequenced rice BACs show that all the fluo-rescent methods produced more than 100 bands onaverage, and these bands are divided among 3 or 4
only one that can detect almost all fragments within aclone. First, BAC-clone insert sizes can be determineddirectly and individually for each clone. This can beimportant when incorporating BAC-end sequences intogenomic assemblies, as well as when assessing the align-ment of BAC-end sequence to genome sequence.Second, fingerprint data obtained using this methodcan be used to verify the accuracy of the sequenceassembly, which is an important quality-control step.Finally, deleted or otherwise rearranged BACs might bemore reliably detected with agarose gel-based finger-prints, which is pertinent for selecting clones for sequenc-ing that faithfully represent the genome.
INTERNAL SIZE STANDARD
A set of DNA fragments ofknown size that are run in thesame lane as the sample to besized but distinguishable fromthe fragments of unknown size.Unlike the external sizestandards normally used onDNA gels, internal size standardsallow for greater accuracy insizing because they are notaffected by lane-to-lanevariation in the migration rate.
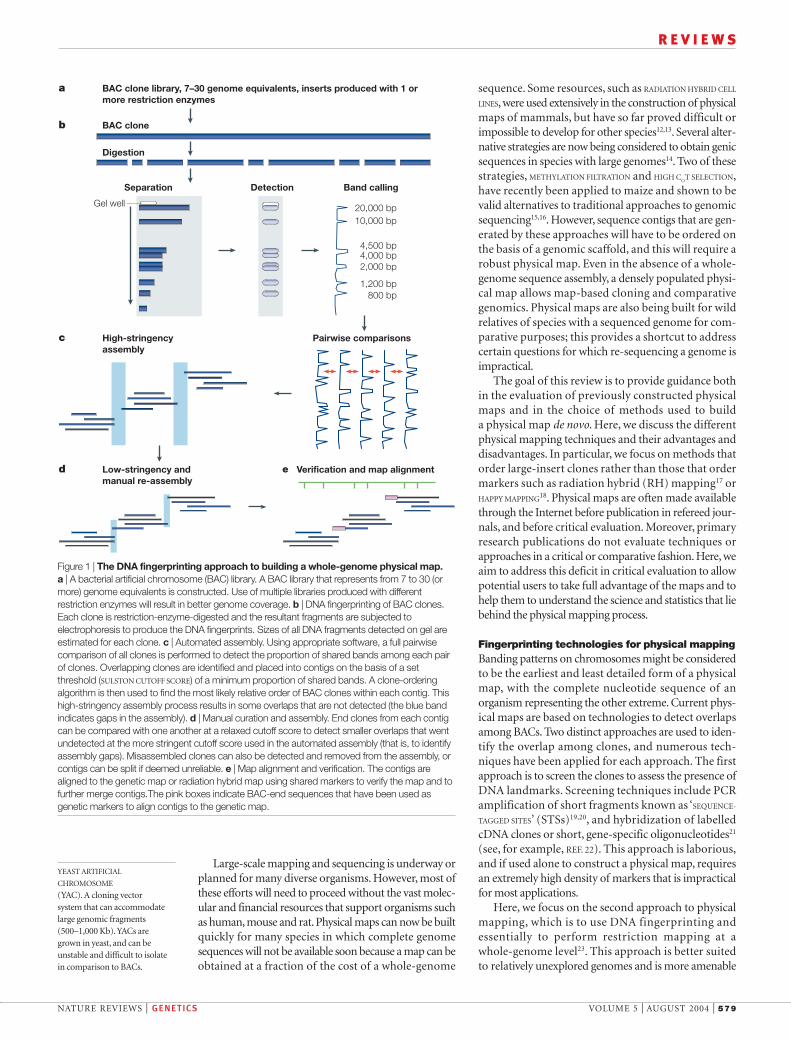
Box 1 | Variations on a theme: fingerprinting BAC clones on automated DNA sequencers
Several modifications to the basic fingerprinting methods(see FIG. 2) have been proposed. The possibility of increasedthroughput, sizing accuracy and/or information content offingerprinting motivated such developments, as did thepossibility of more efficient exploitation of the potential ofautomated sequencing machines. Initially, the Coulsonmethod was refined to allow high-throughput fingerprintingof rice BAC clones46,47. To further refine this method, Kleinet al.48 and Tao et al.30 used a frequent cutter that leaves bluntends (HaeIII) in place of Sau3AI to allow simultaneousdigestion and radioactive labelling.Gregory et al.49 adaptedthe original Coulson method24 for use on automatedsequencers. These authors took advantage of the increasedsizing accuracy owing to the use of INTERNAL SIZE STANDARDS
and of the possibility of simultaneously digesting with thetwo enzymes and labelling the fragments. ddATP that waslabelled with one of three fluorescent dyes was used tofingerprint three different BAC clones in a single lane, withfragments from each clone labelled with a different dye49.This does not increase information content per clone, butreduces the total number of lanes required. Ding et al.50
multiplexed reactions on an automated sequencer: theycombined three different double-enzyme digests from asingle BAC clone into one lane. The three digests areperformed separately, each using HindIII paired with adifferent frequent cutter; the fragments from each digestionare differentially labelled and the three reactions arecombined before electrophoresis50. The informationcontent is not substantially increased because many of thebands are redundant among the three digests due to the factthat the same HindIII sites are analysed.
The Brenner and Livak25 method has also been modified.Faller et al.51,52 (see figure part a) used a different enzymecombination (EarI as type IIS enzyme and TaqI asfrequent cutter) and introduced simultaneous labelling and digestion. A single-base extension reaction that involved thevariable overhang produced by a type IIS enzyme was used to label the restriction fragments with one of threefluorescently labelled ddNTPs (ddATPs, ddGTPs, ddTTPs). Unlabelled ddCTP is also added to fill in the frequent-cutterends without the incorporation of dyes that would make these bands visible on gels. The fourth fluorescent colour wasused for the internal size standard. This approach varies from the Brenner and Livak method in that only the first base inthe overhang, rather than four bases, is sequenced. This lowers the information content per band but increases thenumber of bands that can be distinguished on an automated sequencer. Ding et al.28 took advantage of the availability offive different fluorochromes to further modify the Faller et al. method (see figure part b). Five fluorochromes can be usedto detect all four nucleotides plus the internal size standard. Luo et al.42 introduced another modification that involveddigesting the clones with four rare cutting enzymes and a frequent cutter (see figure part c). Each of the rare cutters leavesa different single-stranded overhang that can be filled in with a distinct, labelled ddNTP. The fingerprinting reaction takesplace in two steps: digestion followed by labelling. Again, a fifth fluorochrome is used for the internal size standard.
b
c
a
BAC clone
Separation and detection on acrylamide gel (using an automated sequencer)
Separation and detection on acrylamide gel (using a capillary-automated sequencer)
Digestion (with a type IIS, HgaI and a frequent cutter, RsaI) and fluorescent labelling (ddNTPs)
BAC clone
Digestion (with four rare cutters, EcoRI, BamHI, XhoI, XbaI and a frequent cutter, HaeIII)
Fluorescent labelling (ddNTPs)
BAC clone
Separation and detection on acrylamide gel (using an automated sequencer)
Digestion (with a type IIS, EarI and a frequent cutter, TaqI) and fluorescent labelling (ddATP, ddGTP, ddTTP)
582 | AUGUST 2004 | VOLUME 5 www.nature.com/reviews/genetics
R E V I E W S
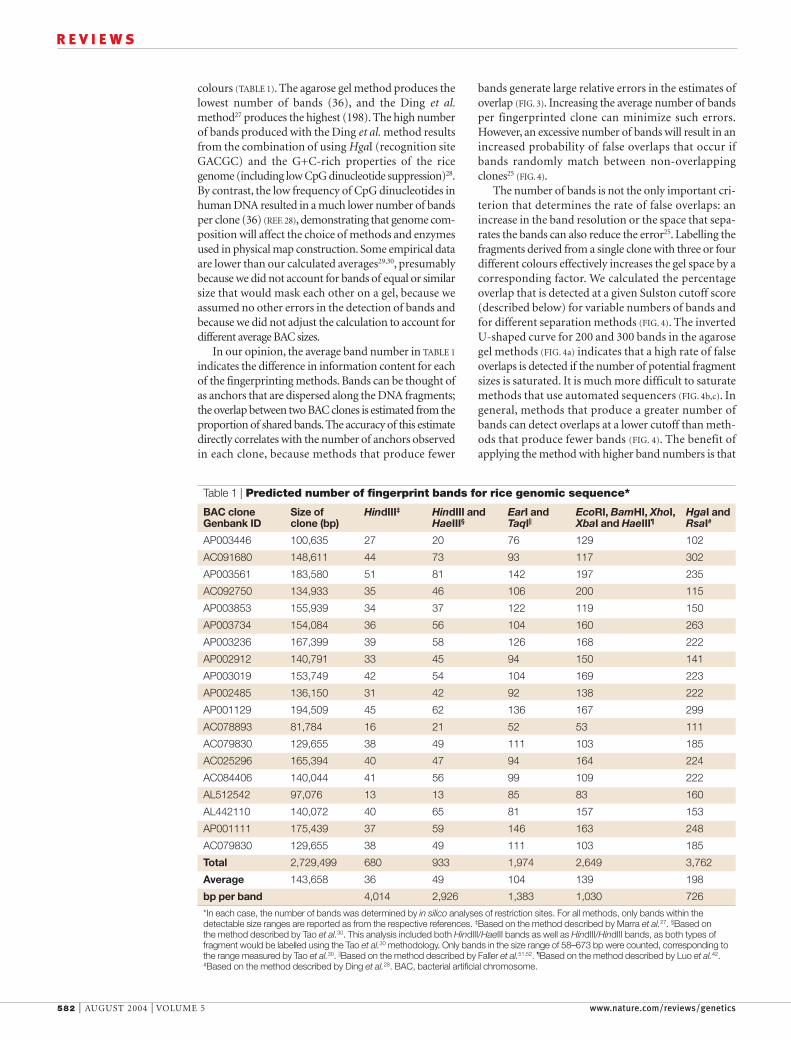
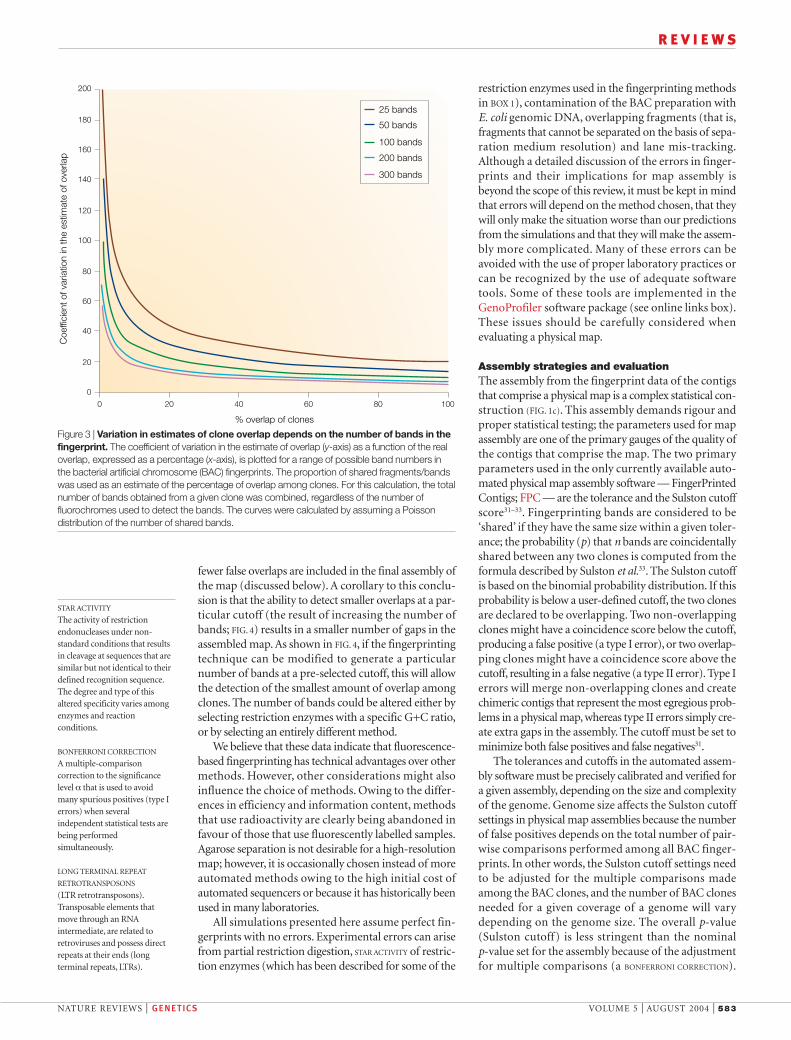
bands generate large relative errors in the estimates ofoverlap (FIG. 3). Increasing the average number of bandsper fingerprinted clone can minimize such errors.However, an excessive number of bands will result in anincreased probability of false overlaps that occur ifbands randomly match between non-overlappingclones25 (FIG. 4).
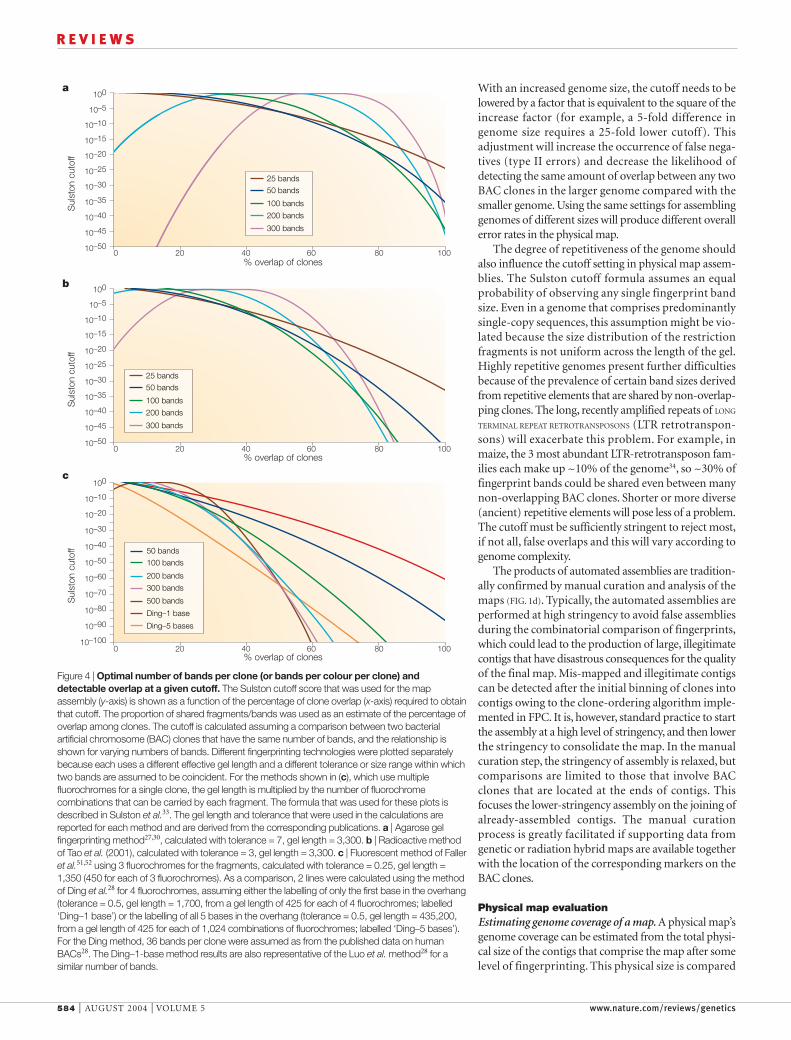
The number of bands is not the only important cri-terion that determines the rate of false overlaps: anincrease in the band resolution or the space that sepa-rates the bands can also reduce the error25. Labelling thefragments derived from a single clone with three or fourdifferent colours effectively increases the gel space by acorresponding factor. We calculated the percentageoverlap that is detected at a given Sulston cutoff score(described below) for variable numbers of bands andfor different separation methods (FIG. 4). The inverted U-shaped curve for 200 and 300 bands in the agarosegel methods (FIG. 4a) indicates that a high rate of falseoverlaps is detected if the number of potential fragmentsizes is saturated. It is much more difficult to saturatemethods that use automated sequencers (FIG. 4b,c). Ingeneral, methods that produce a greater number ofbands can detect overlaps at a lower cutoff than meth-ods that produce fewer bands (FIG. 4). The benefit ofapplying the method with higher band numbers is that
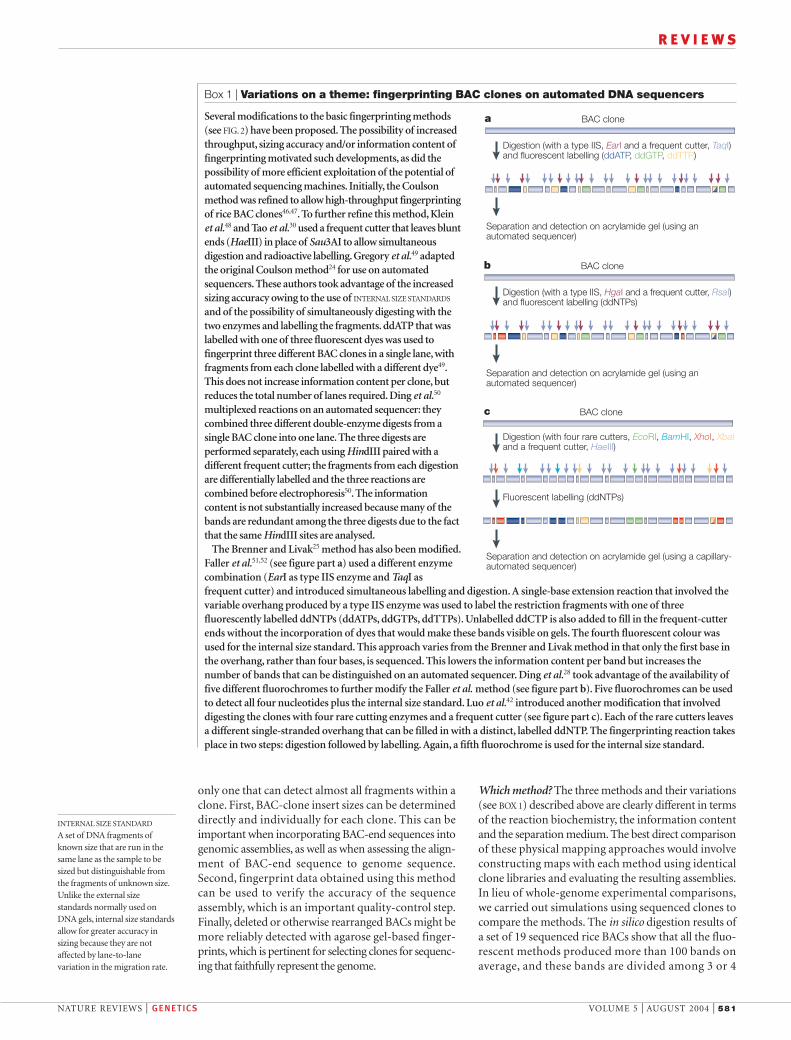
colours (TABLE 1). The agarose gel method produces thelowest number of bands (36), and the Ding et al.method27 produces the highest (198). The high numberof bands produced with the Ding et al. method resultsfrom the combination of using HgaI (recognition siteGACGC) and the G+C-rich properties of the ricegenome (including low CpG dinucleotide suppression)28.By contrast, the low frequency of CpG dinucleotides inhuman DNA resulted in a much lower number of bandsper clone (36) (REF. 28), demonstrating that genome com-position will affect the choice of methods and enzymesused in physical map construction. Some empirical dataare lower than our calculated averages29,30, presumablybecause we did not account for bands of equal or similarsize that would mask each other on a gel, because weassumed no other errors in the detection of bands andbecause we did not adjust the calculation to account fordifferent average BAC sizes.
In our opinion, the average band number in TABLE 1
indicates the difference in information content for eachof the fingerprinting methods. Bands can be thought ofas anchors that are dispersed along the DNA fragments;the overlap between two BAC clones is estimated from theproportion of shared bands. The accuracy of this estimatedirectly correlates with the number of anchors observedin each clone, because methods that produce fewer
Table 1 | Predicted number of fingerprint bands for rice genomic sequence*
BAC clone Size of HindIII‡ HindIII and EarI and EcoRI, BamHI, XhoI, HgaI and Genbank ID clone (bp) HaeIII§ TaqI|| XbaI and HaeIII¶ RsaI#
AP003446 100,635 27 20 76 129 102
AC091680 148,611 44 73 93 117 302
AP003561 183,580 51 81 142 197 235
AC092750 134,933 35 46 106 200 115
AP003853 155,939 34 37 122 119 150
AP003734 154,084 36 56 104 160 263
AP003236 167,399 39 58 126 168 222
AP002912 140,791 33 45 94 150 141
AP003019 153,749 42 54 104 169 223
AP002485 136,150 31 42 92 138 222
AP001129 194,509 45 62 136 167 299
AC078893 81,784 16 21 52 53 111
AC079830 129,655 38 49 111 103 185
AC025296 165,394 40 47 94 164 224
AC084406 140,044 41 56 99 109 222
AL512542 97,076 13 13 85 83 160
AL442110 140,072 40 65 81 157 153
AP001111 175,439 37 59 146 163 248
AC079830 129,655 38 49 111 103 185
Total 2,729,499 680 933 1,974 2,649 3,762
Average 143,658 36 49 104 139 198
bp per band 4,014 2,926 1,383 1,030 726
*In each case, the number of bands was determined by in silico analyses of restriction sites. For all methods, only bands within thedetectable size ranges are reported as from the respective references. ‡Based on the method described by Marra et al.27. §Based on the method described by Tao et al.30. This analysis included both HindIII/HaeIII bands as well as HindIII/HindIII bands, as both types offragment would be labelled using the Tao et al.30 methodology. Only bands in the size range of 58–673 bp were counted, corresponding tothe range measured by Tao et al.30. ||Based on the method described by Faller et al.51,52. ¶Based on the method described by Luo et al.42.#Based on the method described by Ding et al.28. BAC, bacterial artificial chromosome.
NATURE REVIEWS | GENETICS VOLUME 5 | AUGUST 2004 | 583
R E V I E W S
restriction enzymes used in the fingerprinting methodsin BOX 1), contamination of the BAC preparation with E. coli genomic DNA, overlapping fragments (that is,fragments that cannot be separated on the basis of sepa-ration medium resolution) and lane mis-tracking.Although a detailed discussion of the errors in finger-prints and their implications for map assembly isbeyond the scope of this review, it must be kept in mindthat errors will depend on the method chosen, that theywill only make the situation worse than our predictionsfrom the simulations and that they will make the assem-bly more complicated. Many of these errors can beavoided with the use of proper laboratory practices orcan be recognized by the use of adequate softwaretools. Some of these tools are implemented in theGenoProfiler software package (see online links box).These issues should be carefully considered whenevaluating a physical map.
Assembly strategies and evaluationThe assembly from the fingerprint data of the contigsthat comprise a physical map is a complex statistical con-struction (FIG. 1c). This assembly demands rigour andproper statistical testing; the parameters used for mapassembly are one of the primary gauges of the quality ofthe contigs that comprise the map. The two primaryparameters used in the only currently available auto-mated physical map assembly software — FingerPrintedContigs; FPC — are the tolerance and the Sulston cutoffscore31–33. Fingerprinting bands are considered to be‘shared’ if they have the same size within a given toler-ance; the probability (p) that n bands are coincidentallyshared between any two clones is computed from theformula described by Sulston et al.33. The Sulston cutoffis based on the binomial probability distribution. If thisprobability is below a user-defined cutoff, the two clonesare declared to be overlapping. Two non-overlappingclones might have a coincidence score below the cutoff,producing a false positive (a type I error), or two overlap-ping clones might have a coincidence score above thecutoff, resulting in a false negative (a type II error). Type Ierrors will merge non-overlapping clones and createchimeric contigs that represent the most egregious prob-lems in a physical map, whereas type II errors simply cre-ate extra gaps in the assembly. The cutoff must be set tominimize both false positives and false negatives31.
The tolerances and cutoffs in the automated assem-bly software must be precisely calibrated and verified fora given assembly, depending on the size and complexityof the genome. Genome size affects the Sulston cutoffsettings in physical map assemblies because the numberof false positives depends on the total number of pair-wise comparisons performed among all BAC finger-prints. In other words, the Sulston cutoff settings needto be adjusted for the multiple comparisons madeamong the BAC clones, and the number of BAC clonesneeded for a given coverage of a genome will varydepending on the genome size. The overall p-value(Sulston cutoff) is less stringent than the nominal p-value set for the assembly because of the adjustmentfor multiple comparisons (a BONFERRONI CORRECTION).
fewer false overlaps are included in the final assembly ofthe map (discussed below). A corollary to this conclu-sion is that the ability to detect smaller overlaps at a par-ticular cutoff (the result of increasing the number ofbands; FIG. 4) results in a smaller number of gaps in theassembled map. As shown in FIG. 4, if the fingerprintingtechnique can be modified to generate a particularnumber of bands at a pre-selected cutoff, this will allowthe detection of the smallest amount of overlap amongclones. The number of bands could be altered either byselecting restriction enzymes with a specific G+C ratio,or by selecting an entirely different method.
We believe that these data indicate that fluorescence-based fingerprinting has technical advantages over othermethods. However, other considerations might alsoinfluence the choice of methods. Owing to the differ-ences in efficiency and information content, methodsthat use radioactivity are clearly being abandoned infavour of those that use fluorescently labelled samples.Agarose separation is not desirable for a high-resolutionmap; however, it is occasionally chosen instead of moreautomated methods owing to the high initial cost ofautomated sequencers or because it has historically beenused in many laboratories.
All simulations presented here assume perfect fin-gerprints with no errors. Experimental errors can arisefrom partial restriction digestion, STAR ACTIVITY of restric-tion enzymes (which has been described for some of the
STAR ACTIVITY
The activity of restrictionendonucleases under non-standard conditions that resultsin cleavage at sequences that aresimilar but not identical to theirdefined recognition sequence.The degree and type of thisaltered specificity varies amongenzymes and reactionconditions.
BONFERRONI CORRECTION
A multiple-comparisoncorrection to the significancelevel α that is used to avoidmany spurious positives (type Ierrors) when severalindependent statistical tests arebeing performedsimultaneously.
LONG TERMINAL REPEAT
RETROTRANSPOSONS
(LTR retrotransposons).Transposable elements thatmove through an RNAintermediate, are related toretroviruses and possess directrepeats at their ends (longterminal repeats, LTRs).
0
20
40
60
80
100
120
140
160
180
200
0 20 40 60 80 100
25 bands
50 bands
100 bands
200 bands
300 bands
% overlap of clones
Coe
ffici
ent o
f var
iatio
n in
the
estim
ate
of o
verla
p
Figure 3 | Variation in estimates of clone overlap depends on the number of bands in thefingerprint. The coefficient of variation in the estimate of overlap (y-axis) as a function of the realoverlap, expressed as a percentage (x-axis), is plotted for a range of possible band numbers inthe bacterial artificial chromosome (BAC) fingerprints. The proportion of shared fragments/bandswas used as an estimate of the percentage of overlap among clones. For this calculation, the totalnumber of bands obtained from a given clone was combined, regardless of the number offluorochromes used to detect the bands. The curves were calculated by assuming a Poissondistribution of the number of shared bands.
584 | AUGUST 2004 | VOLUME 5 www.nature.com/reviews/genetics
R E V I E W S
With an increased genome size, the cutoff needs to belowered by a factor that is equivalent to the square of theincrease factor (for example, a 5-fold difference ingenome size requires a 25-fold lower cutoff). Thisadjustment will increase the occurrence of false nega-tives (type II errors) and decrease the likelihood ofdetecting the same amount of overlap between any twoBAC clones in the larger genome compared with thesmaller genome. Using the same settings for assemblinggenomes of different sizes will produce different overallerror rates in the physical map.
The degree of repetitiveness of the genome shouldalso influence the cutoff setting in physical map assem-blies. The Sulston cutoff formula assumes an equalprobability of observing any single fingerprint bandsize. Even in a genome that comprises predominantlysingle-copy sequences, this assumption might be vio-lated because the size distribution of the restrictionfragments is not uniform across the length of the gel.Highly repetitive genomes present further difficultiesbecause of the prevalence of certain band sizes derivedfrom repetitive elements that are shared by non-overlap-ping clones. The long, recently amplified repeats of LONG
TERMINAL REPEAT RETROTRANSPOSONS (LTR retrotranspon-sons) will exacerbate this problem. For example, inmaize, the 3 most abundant LTR-retrotransposon fam-ilies each make up ~10% of the genome34, so ~30% offingerprint bands could be shared even between manynon-overlapping BAC clones. Shorter or more diverse(ancient) repetitive elements will pose less of a problem.The cutoff must be sufficiently stringent to reject most,if not all, false overlaps and this will vary according togenome complexity.
The products of automated assemblies are tradition-ally confirmed by manual curation and analysis of themaps (FIG. 1d). Typically, the automated assemblies areperformed at high stringency to avoid false assembliesduring the combinatorial comparison of fingerprints,which could lead to the production of large, illegitimatecontigs that have disastrous consequences for the qualityof the final map. Mis-mapped and illegitimate contigscan be detected after the initial binning of clones intocontigs owing to the clone-ordering algorithm imple-mented in FPC. It is, however, standard practice to startthe assembly at a high level of stringency, and then lowerthe stringency to consolidate the map. In the manualcuration step, the stringency of assembly is relaxed, butcomparisons are limited to those that involve BACclones that are located at the ends of contigs. Thisfocuses the lower-stringency assembly on the joining ofalready-assembled contigs. The manual curationprocess is greatly facilitated if supporting data fromgenetic or radiation hybrid maps are available togetherwith the location of the corresponding markers on theBAC clones.
Physical map evaluationEstimating genome coverage of a map. A physical map’sgenome coverage can be estimated from the total physi-cal size of the contigs that comprise the map after somelevel of fingerprinting. This physical size is compared
a
10–50
10–45
10–40
10–35
10–30
10–25
10–20
10–15
10–10
10–5
100
10–50
10–45
10–40
10–35
10–30
10–25
10–20
10–15
10–10
10–5
100
Sul
ston
cut
off
0 20 40 60 80 100
25 bands
50 bands
100 bands
200 bands
300 bands
b
Sul
ston
cut
off
0 20 40 60 80 100
25 bands
50 bands
100 bands
200 bands
300 bands
c
Sul
ston
cut
off
0 20 40 60 80 100
50 bands
100 bands
200 bands
300 bands
500 bands
Ding–1 base
Ding–5 bases
% overlap of clones
% overlap of clones
% overlap of clones
10–100
10–90
10–80
10–70
10–60
10–50
10–40
10–30
10–20
10–10
100
Figure 4 | Optimal number of bands per clone (or bands per colour per clone) anddetectable overlap at a given cutoff. The Sulston cutoff score that was used for the mapassembly (y-axis) is shown as a function of the percentage of clone overlap (x-axis) required to obtainthat cutoff. The proportion of shared fragments/bands was used as an estimate of the percentage ofoverlap among clones. The cutoff is calculated assuming a comparison between two bacterialartificial chromosome (BAC) clones that have the same number of bands, and the relationship isshown for varying numbers of bands. Different fingerprinting technologies were plotted separatelybecause each uses a different effective gel length and a different tolerance or size range within whichtwo bands are assumed to be coincident. For the methods shown in (c), which use multiplefluorochromes for a single clone, the gel length is multiplied by the number of fluorochromecombinations that can be carried by each fragment. The formula that was used for these plots isdescribed in Sulston et al.33. The gel length and tolerance that were used in the calculations arereported for each method and are derived from the corresponding publications. a | Agarose gelfingerprinting method27,30, calculated with tolerance = 7, gel length = 3,300. b | Radioactive methodof Tao et al. (2001), calculated with tolerance = 3, gel length = 3,300. c | Fluorescent method of Falleret al.51,52 using 3 fluorochromes for the fragments, calculated with tolerance = 0.25, gel length =1,350 (450 for each of 3 fluorochromes). As a comparison, 2 lines were calculated using the methodof Ding et al.28 for 4 fluorochromes, assuming either the labelling of only the first base in the overhang(tolerance = 0.5, gel length = 1,700, from a gel length of 425 for each of 4 fluorochromes; labelled‘Ding–1 base’) or the labelling of all 5 bases in the overhang (tolerance = 0.5, gel length = 435,200,from a gel length of 425 for each of 1,024 combinations of fluorochromes; labelled ‘Ding–5 bases’).For the Ding method, 36 bands per clone were assumed as from the published data on humanBACs28. The Ding–1-base method results are also representative of the Luo et al. method28 for asimilar number of bands.
NATURE REVIEWS | GENETICS VOLUME 5 | AUGUST 2004 | 585
R E V I E W S
The pulsed field gel estimates provide only rough esti-mates of the average insert size, which might be suffi-ciently accurate for measurements of small sets ofclones; however, the extrapolation of the whole-genomecoverage of a library can be confirmed and refined usingadditional data. The physical map itself is a significantresource for estimating BAC insert sizes. The map pro-vides at least three parameters that can be used to verifyBAC insert sizes: first, the average number of positivesidentified by each single-copy probe; second, the pro-portion of single-copy probes that are found in thelibraries; and third, the number of fingerprinting bandsobserved per clone. The frequency of positive clones is adirect measurement of the representation of a singlelocus. These results averaged over many single-copy lociprovide a robust measurement of genomic coverage.The observed percentage of the markers that are identi-fied in the library can be entered into the Lander andWaterman6 formula to determine the clone coverage.The average frequency of positive clones per probe isrelated to the percentage of single-copy probes found inthe library, but is a more direct measurement of genomecoverage. The insert size of the BAC clones can also beestimated from the number of fingerprinting bandsobserved per clone. The observed number of bands mustbe combined with the calculated frequency of restric-tion sites in genomic DNA, but this can provide anaccurate estimate for insert size. Therefore, estimates ofBAC insert sizes and library coverage might be derivedfrom diverse and independent data sets, and these
with the C-value (or DNA content) of a haploidgenome to determine genome coverage. The total num-ber of contigs in the map will result from both ‘assem-bly’ and ‘physical’ gaps. Assembly gaps result from thefalse-negative rate that is determined with the choice ofthe cutoff and correspond to our inability to detect exist-ing overlaps between clones. Physical gaps result fromregions that are not covered in the clone collection.Because clone distribution is mainly random, the finalmap will probably contain both densely covered regionsand significant gaps. Increasing the number of genomeequivalents that are represented in the library willdecrease the number of assembly and physical gaps.Physical maps are usually built from libraries that con-tain at least ten genome equivalents. Methods with lowinformation content might require more genomeequivalents in the library because they fail to detectsmall overlaps. A biased set of clones, such as those pro-duced by restriction enzyme digestion, will have evenlarger gaps and deeper coverage in some regions of thegenome than a set of clones produced in a completelyrandom way, such as through mechanical shearing.The use of different libraries produced by digestinggenomic DNA with different enzymes will reduce phys-ical gaps that might result from biased restriction sitedistribution.
The average insert size in a BAC library is a crucialvalue in the calculation of library coverage. Too often, thissize estimate is obtained on the basis of only a small sam-ple of BACs that have been sized using PULSED FIELD GELS.
PULSED FIELD GEL
Agarose electrophoresis gel thatis run by periodically changingthe orientation of the electricfield applied to the gel to achieveseparation of large fragments ofDNA (>20 Kb and up to 10 Mb).
Table 2 | Assembly parameters for physical maps that are finished and underway*
Published physical maps
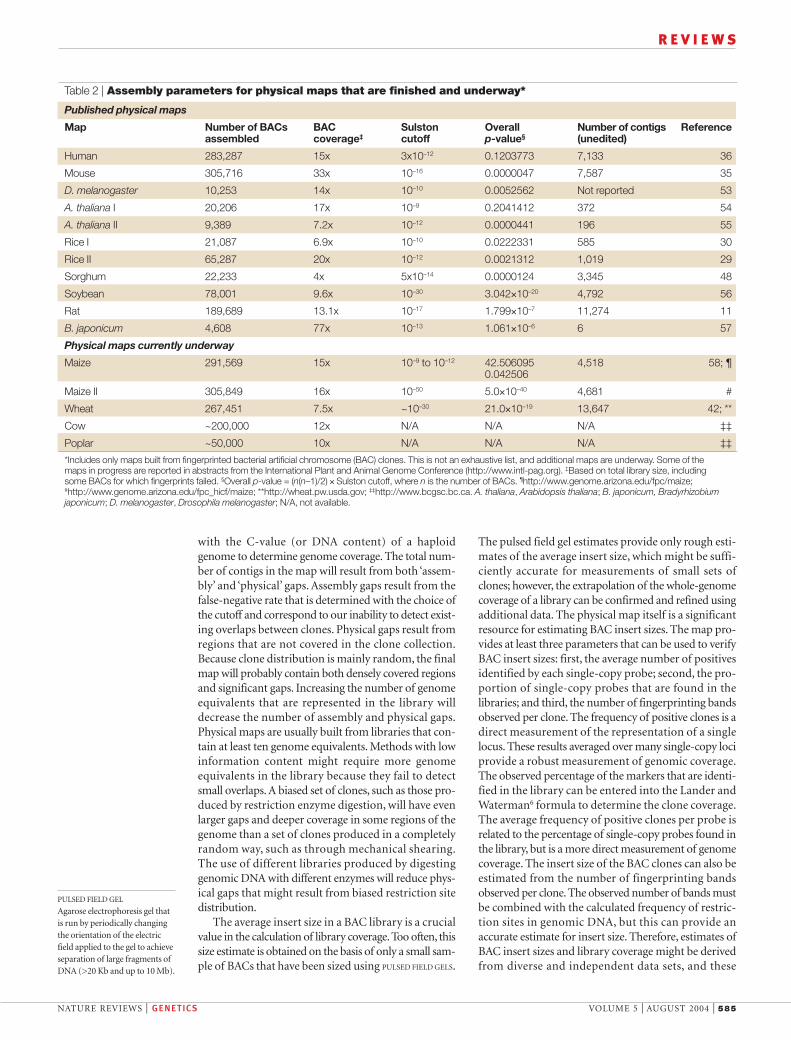
Map Number of BACs BAC Sulston Overall Number of contigs Referenceassembled coverage‡ cutoff p-value§ (unedited)
Human 283,287 15x 3x10–12 0.1203773 7,133 36
Mouse 305,716 33x 10–16 0.0000047 7,587 35
D. melanogaster 10,253 14x 10–10 0.0052562 Not reported 53
A. thaliana I 20,206 17x 10–9 0.2041412 372 54
A. thaliana II 9,389 7.2x 10⁻¹² 0.0000441 196 55
Rice I 21,087 6.9x 10⁻¹⁰ 0.0222331 585 30
Rice II 65,287 20x 10–12 0.0021312 1,019 29
Sorghum 22,233 4x 5x10–14 0.0000124 3,345 48
Soybean 78,001 9.6x 10⁻³⁰ 3.042×10⁻²⁰ 4,792 56
Rat 189,689 13.1x 10⁻¹⁷ 1.799×10⁻⁷ 11,274 11
B. japonicum 4,608 77x 10–13 1.061×10⁻⁶ 6 57
Physical maps currently underway
Maize 291,569 15x 10–9 to 10–12 42.506095 4,518 58; ¶0.042506
Maize II 305,849 16x 10–50 5.0×10–40 4,681 #
Wheat 267,451 7.5x ~10–30 21.0×10⁻¹⁹ 13,647 42; **
Cow ~200,000 12x N/A N/A N/A ‡‡
Poplar ~50,000 10x N/A N/A N/A ‡‡
*Includes only maps built from fingerprinted bacterial artificial chromosome (BAC) clones. This is not an exhaustive list, and additional maps are underway. Some of the maps in progress are reported in abstracts from the International Plant and Animal Genome Conference (http://www.intl-pag.org). ‡Based on total library size, including some BACs for which fingerprints failed. §Overall p-value = (n(n–1)/2) × Sulston cutoff, where n is the number of BACs. ¶http://www.genome.arizona.edu/fpc/maize;#http://www.genome.arizona.edu/fpc_hicf/maize; **http://wheat.pw.usda.gov; ‡‡http://www.bcgsc.bc.ca. A. thaliana, Arabidopsis thaliana; B. japonicum, Bradyrhizobiumjaponicum; D. melanogaster, Drosophila melanogaster; N/A, not available.
586 | AUGUST 2004 | VOLUME 5 www.nature.com/reviews/genetics
R E V I E W S
Some genomes present unique mapping opportuni-ties that can take advantage of specific biologicalresources. For example, FISH, applied to the large POLYTENE
CHROMOSOMES of the salivary glands of Anopheles gambiae(mosquito), was used to assign the sequence scaffoldsthat were generated by the whole-genome sequence tochromosomal locations37. Chromosome-addition linesare available for some plant species such as oat–maizeaddition lines12. Hexaploid wheat tolerates chromoso-mal deletions, and these ANEUPLOID lines can similarlyfacilitate mapping38,39. Only plants that have undergonerecent polyploidization can generally tolerate thesetypes of chromosomal aberration, so these resourcesare available in only a small number of important cropplants. The main limitation of any of these chromoso-mal variants is that the resolution is limited to entirechromosomes, compared with the sub-chromosomalresolution of the radiation hybrid maps available inanimal systems13.
Future prospectsPhysical maps are often the starting point for laboriousand expensive undertakings such as chromosomewalks and genome sequencing. Poorly executed whole-genome efforts are little better than no mapping at all, asmis-assembly of a small fraction of clones can endangerthe entire project, potentially requiring it to be repeated.These maps are difficult to verify, and represent ‘one-of-a-kind’ experiments because of the cost and labourinvolved. However, owing to advances in technology, itcould be possible to add a second level of more accuratefingerprinting data on top of an initial round of finger-printing. For example, if a low-resolution fingerprintingmethodology identifies highly overlapping and redun-dant clones, a high-resolution method could be usedselectively to assemble ‘singletons’ (unassembled indi-vidual clones), contigs with poor coverage and end-clones of robustly assembled contigs. This second phaseof fingerprinting would require clone selection, andalthough further handling of clones always increaseserror rates, it would improve the assembly. Alternatively,the entire library of clones could be re-fingerprinted atextra cost but with reduced error rates. More focusedmapping projects might be possible in localized regionsof particular interest, using BACs identified by screeningwith co-localized markers. The fingerprinting of thissubset of BACs could be used to develop sequence-ready contigs in a region of particular interest. Althoughthe focused approaches are useful for specific projects,they might be redundant with whole-genome effortsthat could not avoid re-assembling these regions. Webelieve that the best strategy for physical mapping is touse the most information-rich technology with large-insert BACs that provide deep coverage of a genome,such as the tenfold coverage or more used in mostgenome projects (TABLE 2; for a more formal discussionof the consequences of different genome coverages onthe assembly gaps, see REFS 6,40). A powerful, but as-yet untried strategy would be to take advantage of thesizing accuracy of automated sequencers to combinefingerprint data and band sizes with sequence data to
parameters are directly relevant to the construction andevaluation of the physical map.
Assessing physical map quality. There are several robustmethods that use genetic data to assess the quality ofphysical map assemblies. For example, genetically linkedmarkers can be localized on BAC clones by hybridiza-tion21, and these markers should co-localize on large con-tigs (FIG. 1e). The corollary is also true: geneticallyunlinked or distant markers should not co-localize onthe physical map. Genetic mapping can also be applied a posteriori to validate physical maps; by using sequencesfrom both ends of large contigs, markers can bedesigned that should genetically co-segregate, verify-ing that the DNA that is contained in the clones iscontiguous in the genome. Collinearity between theorder of markers placed on the contigs in the physicalmap and their order on genetic or radiation hybridmaps is a good way to assess the correctness of anassembly. Sequence duplications that involve genes arefrequent in higher eukaryotes, and can make compar-isons of collinearity more difficult; a sequence orprobe might detect multiple locations on the physicalmap but only those that are polymorphic can beplaced on a genetic map.
Physical maps of plant and animal genomes At least nine whole-genome physical maps have beenreported that use fingerprinting for a significant por-tion of the map construction (TABLE 2). Additionalmaps are underway in several organisms. The assem-bly of the human and mouse genomic sequencesrelied heavily on combined resources of a physicalmap, genetic maps, radiation hybrid data and SYNTENY
analyses for assembly35,36 (FIG. 1e). For example, after aninitial contig assembly based on fingerprint data,305,716 mouse BAC clones produced 7,587 contigs35.Integration of genetic and comparative genomic dataallowed these contigs to be further collapsed. BAC-end sequences from these clones were simultaneouslyobtained and then compared with the assembledhuman sequences, creating a human–mouse homol-ogy clone map. Such maps might be possible in someplant species (for example, rice–maize or Arabidopsisthaliana–Brassica spp.), but the diversity of mostgenomes for which physical maps are needed couldconfound cross-genome comparison efforts. Integrationof mapped mouse markers from already-constructedgenetic and radiation hybrid maps, followed by man-ual contig editing, reduced the mouse clone map to296 contigs35. The result of this integrative and com-parative effort is striking in that it produced a 25-foldreduction in the number of contigs; however, thismight not be possible in many other genomes becauseit requires the concurrent availability of dense geneticor physical STS maps and genomics resources as well asconsiderable manual intervention. It is preferable tomake the a priori decision to use the most information-rich fingerprinting method available to reduce thenumber of contigs that are produced after fingerprintassembly.
SYNTENY
The conservation of the relativeorder of genes (or of other DNAsequences) in the chromosomesof different species.
FISH
(Fluorescence in situhybridization). A technique inwhich a fluorescently labelledDNA probe is used to detect andlocalize a particular sequence ona chromosome with the help offluorescence microscopy.
POLYTENE CHROMOSOMES
A giant chromosome that isformed by many rounds ofreplication of the DNA. Thereplicated DNA moleculestightly align side-by-side inparallel register, which creates anon-mitotic chromosome that isvisible by light microscopy.
ANEUPLOID
Having an unbalancedchromosome number (owing toextra or missing chromosomes).An example is trisomy.
NATURE REVIEWS | GENETICS VOLUME 5 | AUGUST 2004 | 587
R E V I E W S
small but heavily automated laboratory.A team of 3 peo-ple can easily process 1,600 clones per day using a singlenew-generation automated sequencer such as theApplied Biosystems 3730 (Applera, California) (M.M.,unpublished observations). At this rate, a physical mapcan be constructed for many genomes in a matter ofweeks rather than months or years. Such technicaladvances will decrease costs and improve the efficiency ofphysical map construction.
Software development has kept pace with technol-ogy development. The availability of a parallelized ver-sion of the map assembly program FPC represents aclear advantage in terms of the ability to quickly buildmultiple assemblies at different stringencies for evalua-tion and comparison purposes43. New tools have beendeveloped to facilitate the viewing of fingerprint maps,such as internet Contig Explorer (iCE)44, but physicalmap viewers are still a limiting factor, as most of theavailable genome browsers are sequence-centred and donot allow for an easy link of the physical and geneticmaps through shared markers.
Physical maps will be fundamental components offuture genome-sequencing projects in many species. Foreukaryotic species that do not receive enough supportfor complete genome sequencing, physical maps will beinvaluable resources for the cloning of genes of impor-tance. The molecular basis of quantitative variation isstill largely unknown and untapped; the discovery of thegenes that underlie this variation is currently feasibleonly through positional cloning efforts45. Physical maps,when not contributing to genomic sequencing efforts,will accelerate positional cloning projects in manygenomes.
co-assemble physical maps with contigs from whole-genome shotgun sequencing. Regardless of the methodused for characterizing clones, it is essential that physicalmaps are accurately assembled and that rigorous andexplicit criteria are applied for their assessment and eval-uation. The time spent in producing and verifying arobust physical map is well-spent because it provides aninvaluable tool for molecular studies in a genome ofinterest that can be readily transferred across laboratories.For example, research in crop plants and domesticatedanimals will benefit immeasurably from the productionof physical maps in key species of interest.
Technological advances in sequencing technologieshave provided the means for parallel advances in fin-gerprinting. These advances, and specifically the devel-opment of capillary sequencers using multi-colouredfluorescent dyes for labelling DNA, should make theconstruction of physical maps much easier, faster andcheaper. Although these advances were recognizedand anticipated more than 14 years ago25, it is onlyrecently that they have been incorporated into large-scale physical mapping projects. Most of the recentlypublished physical maps have used agarose gels andconventional DNA stains. This low-resolution methodhas been shown to be useful and has recently beenimproved through the development of software for auto-mated analysis of DNA fingerprinting gels41; however, inthe era of capillary sequencers, this method is rapidlybecoming outdated. The advent of high-throughput fluo-rescent methods25,42 is a boon to future physical mappingprojects, as the high-resolution data will reduce the num-ber of contigs produced before manual assembly andbecause the work can be done with only a few people in a
1. Collins, F. & Galas, D. A new five-year plan for the U.S.Human Genome Project. Science 262, 43–46 (1993).
2. Shizuya, H. et al. Cloning and stable maintenance of 300-kilobase-pair fragments of human DNA in Escherichiacoli using an F-factor-based vector. Proc. Natl Acad. Sci.USA 89, 8794–8797 (1992).
3. Burke, D. T., Carle, G. F. & Olson, M. V. Cloning of largesegments of exogenous DNA into yeast by means of artificialchromosome vectors. Science 236, 806–812 (1987).
4. Green, E. D. Strategies for the systematic sequencing ofcomplex genomes. Nature Rev. Genet. 2, 573–583 (2001).
5. Venter, J. C. et al. The sequence of the human genome.Science 291, 1304–1351 (2001).
6. Lander, E. S. & Waterman, M. S. Genomic mapping byfingerprinting random clones: a mathematical analysis.Genomics 2, 231–239 (1988).
7. Istrail, S. et al. Whole-genome shotgun assembly andcomparison of human genome assemblies. Proc. NatlAcad. Sci. USA 101, 1916–1921 (2004).
8. Myers, E. W., Sutton, G. G., Smith, H. O., Adams, M. D. &Venter, J. C. On the sequencing and assembly of the humangenome. Proc. Natl Acad. Sci. USA 99, 4145–4146 (2002).
9. Waterston, R. H., Lander, E. S. & Sulston, J. E. On thesequencing of the human genome. Proc. Natl Acad. Sci.USA 99, 3712–3716 (2002).
10. Rat Genome Sequencing Project Consortium. Genomesequence of the Brown Norway rat yields insights intomammalian evolution. Nature 428, 493–521 (2004).A good example of the use of multiple types ofinformation, including those obtained from a physicalmap, in a hybrid approach to assemble the sequenceof a complex eukaryotic genome.
11. Krzywinski, M. et al. Integrated and sequence-ordered BAC- and YAC-based physical maps for the rat genome.Genome Res. 14, 766–779 (2004).
12. Kynast, R. G., Okagaki, R. J., Rines, H. W. & Phillips, R. L.Maize individualized chromosome and derived radiationhybrid lines and their use in functional genomics. Funct.Integr. Genomics 2, 60–69 (2002).
13. Wardrop, J., Snape, J., Powell, W. & Machray, G. C.Constructing plant radiation hybrid panels. Plant J. 31,223–228 (2002).
14. Mayer, K. & Mewes, H. W. How can we deliver the largeplant genomes? Strategies and perspectives. Curr. Opin.Plant Biol. 5, 173–177 (2002).
15. Palmer, L. E. et al. Maize genome sequencing bymethylation filtration. Science 302, 2115–2117 (2003).
16. Whitelaw, C. A. et al. Enrichment of gene-coding sequences inmaize by genome filtration. Science 302, 2118–2120 (2003).
17. Lawrence, S., Morton, N. E. & Cox, D. R. Radiation hybridmapping. Proc. Natl Acad. Sci. USA 88, 7477–7480 (1991).
18. Dear, P. H. & Cook, P. R. Happy mapping: linkage mappingusing a physical analogue of meiosis. Nucleic Acids Res. 21,13–20 (1993).
19. Olson, M., Hood, L., Cantor, C. & Botstein, D. A commonlanguage for physical mapping of the human genome.Science 245, 1434–1435 (1989).
20. Green, E. D. & Green, P. Sequence-tagged site (STS)content mapping of human chromosomes: theoreticalconsiderations and early experiences. PCR Methods Appl.1, 77–90 (1991).
21. Ross, M. T., Labire, S. M., McPherson, J. & Stanton, J., V. in Current Protocols in Human Genetics (ed. Boyl, A.)5.6.1–5.6.52 (Wiley, New York, 1999).
22. Mozo, T. et al. A complete BAC-based physical map of theArabidopsis thaliana genome. Nature Genet. 22, 271–275(1999).
23. Smith, C. L. & Cantor, C. R. Evolving strategies for makingphysical maps of mammalian chromosomes. Genome 31,1055–1058 (1989).
24. Coulson, A., Sulston, J., Brenner, S. & Karn, J. Toward aphysical map of the genome of the nematodeCaenorhabditis elegans. Proc. Natl Acad. Sci. USA 83,7821–7825 (1986).A pioneering paper that outlined the general strategyto produce DNA fingerprints from large-insert clones,and applied it to a small eukaryotic genome,effectively providing the first contig map.
25. Brenner, S. & Livak, K. J. DNA fingerprinting by sampledsequencing. Proc. Natl Acad. Sci. USA 86, 8902–8906(1989).Another pioneering paper that exploited theproperties of type IIS restriction enzymes todifferentiate fingerprint fragments not only by theirsize, but also by their terminal sequence.
26. Olson, M. V. et al. Random-clone strategy for genomicrestriction mapping in yeast. Proc. Natl Acad. Sci. USA 83,7826–7830 (1986).
27. Marra, M. A. et al. High throughput fingerprint analysis oflarge-insert clones. Genome Res. 7, 1072–1084 (1997).The original paper that described the large-scaleapplication of BAC fingerprinting on agarose gels,which has since found widespread use and producedmany physical maps.
28. Ding, Y. et al. Five-color-based high-information-contentfingerprinting of bacterial artificial chromosome clones usingtype IIS restriction endonucleases. Genomics 74, 142–154(2001).
29. Chen, M. et al. An integrated physical and genetic map ofthe rice genome. Plant Cell 14, 537–545 (2002).
30. Tao, Q. et al. Bacterial artificial chromosome-based physicalmap of the rice genome constructed by restrictionfingerprint analysis. Genetics 158, 1711–1724 (2001).
31. Soderlund, C., Humphray, S., Dunham, A. & French, L.Contigs built with fingerprints, markers, and FPC V4.7.Genome Res. 10, 1772–1787 (2000).A paper that presents the FPC (FingerPrinted Contigs)software, which is the only software that is used forthe assembly of physical maps, and extends thetheoretical framework put forward in reference 32.
32. Soderlund, C., Longden, I. & Mott, R. FPC: a system forbuilding contigs from restriction fingerprinted clones.Comput. Appl. Biosci. 13, 523–535 (1997).
33. Sulston, J. et al. Software for genome mapping byfingerprinting techniques. Comput. Appl. Biosci. 4, 125–132(1988).
588 | AUGUST 2004 | VOLUME 5 www.nature.com/reviews/genetics
R E V I E W S
34. Meyers, B. C., Tingey, S. V. & Morgante, M. Abundance,distribution, and transcriptional activity of repetitive elementsin the maize genome. Genome Res. 11, 1660–1676 (2001).
35. Gregory, S. G. et al. A physical map of the mouse genome.Nature 418, 743–750 (2002).The construction of this physical map shows theadvantages of having multiple types of data availablein the assembly and editing of the map, including theavailability of the genome sequence of a syntenicspecies.
36. McPherson, J. D. et al. A physical map of the humangenome. Nature 409, 934–941 (2001).
37. Holt, R. A. et al. The genome sequence of the malariamosquito Anopheles gambiae. Science 298, 129–149(2002).
38. Endo, T. & Gill, B. The deletion stocks of common wheat. J. Hered. 87, 295–307 (1996).
39. Akhunov, E. D. et al. The organization and rate of evolutionof wheat genomes are correlated with recombination ratesalong chromosome arms. Genome Res. 13, 753–763(2003).
40. Wendl, M. C. & Waterston, R. H. Generalized gap model forbacterial artificial chromosome clone fingerprint mapping andshotgun sequencing. Genome Res. 12, 1943–1949 (2002).
41. Fuhrmann, D. R. et al. Software for automated analysis ofDNA fingerprinting gels. Genome Res. 13, 940–953 (2003).
42. Luo, M. C. et al. High-throughput fingerprinting of bacterialartificial chromosomes using the snapshot labeling kit andsizing of restriction fragments by capillary electrophoresis.Genomics 82, 378–389 (2003).
43. Ness, S. R., Terpstra, W., Krzywinski, M., Marra, M. A. &Jones, S. J. Assembly of fingerprint contigs: parallelizedFPC. Bioinformatics 18, 484–485 (2002).
44. Fjell, C. D., Bosdet, I., Schein, J. E., Jones, S. J. & Marra, M. A. Internet Contig Explorer (iCE) — a tool forvisualizing clone fingerprint maps. Genome Res. 13,1244–1249 (2003).
45. Morgante, M. & Salamini, F. From plant genomics tobreeding practice. Curr. Opin. Biotechnol. 14, 214–219(2003).
46. Zhang, H. B. & Wing, R. A. Physical mapping of the rice genome with BACs. Plant Mol. Biol. 35, 115–127 (1997).
47. Hong, G. A rapid and accurate strategy for rice contig mapconstruction by combination of fingerprinting andhybridization. Plant Mol. Biol. 35, 129–133 (1997).
48. Klein, P. E. et al. A high-throughput AFLP-based method forconstructing integrated genetic and physical maps:progress toward a sorghum genome map. Genome Res.10, 789–807 (2000).
49. Gregory, S. G., Howell, G. R. & Bentley, D. R. Genomemapping by fluorescent fingerprinting. Genome Res. 7,1162–1168 (1997).
50. Ding, Y. et al. Contig assembly of bacterial artificialchromosome clones through multiplexed fluorescence-labeled fingerprinting. Genomics 56, 237–246 (1999).
51. Faller et al. Construction of a contig-based physical map ofcorn using fluorescent fingerprinting technology. The Plantand Animal Genome VIII Conference, San Diego [online],<http://www.intl-pag.org/pag/8/abstracts/pag8265.html>(2000).
52. Faller, M. L. et al. in Genome Sequencing and Biology (edsBogusk, M., Brown, S. & Gibbs, R.) 72 (Cold Spring HarborLaboratory Press, Cold Spring Harbor, New York, 2000).
53. Hoskins, R. A. et al. A BAC-based physical map of themajor autosomes of Drosophila melanogaster. Science 287,2271–2274 (2000).
54. Marra, M. et al. A map for sequence analysis of theArabidopsis thaliana genome. Nature Genet. 22, 265–270(1999).
55. Chang, Y. L. et al. An integrated map of Arabidopsis thalianafor functional analysis of its genome sequence. Genetics159, 1231–1242 (2001).
56. Wu, C. et al. A BAC- and BIBAC-based physical map of thesoybean genome. Genome Res. 14, 319–326 (2004).
57. Tomkins, J. P. et al. A marker-dense physical map of theBradyrhizobium japonicum genome. Genome Res. 11,1434–1440 (2001).
58. Coe, E. et al. Access to the maize genome: an integratedphysical and genetic map. Plant Physiol. 128, 9–12 (2002).
AcknowledgementsWe thank many colleagues at DuPont Crop Genetics–Genomicsfor helpful discussions on physical mapping. The physical mappingwork in M.M.’s laboratory is supported by funding from ProvinciaAutonoma di Trento.
Competing interests statementThe authors declare that they have no competing financial interests.
Online links
FURTHER INFORMATIONFPC: http://www.genome.arizona.edu/software/fpc/GenoProfiler:http://wheat.pw.usda.gov/PhysicalMapping/tools/genoprofiler/genoprofiler.htmliCE: http://www.bcgsc.ca/bioinfo/iceAccess to this links box is available online.
O N L I N E
Author biographiesBlake Meyers is an assistant professor in the Department of Plant andSoil Sciences at the University of Delaware, USA, with a laboratory in theDelaware Biotechnology Institute. He received his B.A. from theUniversity of Chicago, USA, where he first started research in plant biol-ogy in the laboratories of Deborah Charlesworth and Manfred Ruddat.He earned an M.S. and a Ph.D. in genetics at the University of California(UC) at Davis, USA. At UC Davis, he worked in Richard Michelmore’slaboratory, chromosome walking and physical mapping in the region ofthe Dm3 disease-resistance gene in lettuce. He then moved to theDuPont Genomics group in Wilmington, Delaware, and worked onphysical mapping and genome composition in maize. He later movedback to Richard Michelmore’s laboratory to study disease-resistancegenes in the model plant Arabidopsis thaliana. At present, his laboratoryfocuses on gene-expression analysis using massively parallel signaturesequencing and his laboratory continues to study plant disease-resis-tance genes.
Simone Scalabrin received his masters degree in computer science atthe Universita’ di Udine, Italy, and has worked in bioinformatics on aphysical mapping project in the grape genome, developing software fordata acquisition and analysis. At present, he is a Ph.D. student in com-puter science in the Department of Mathematics and Computer Scienceat the Universita’ di Udine, developing methods to identify regulatorymotifs in DNA sequences.
Michele Morgante is Professor of Genetics in the Dipartimento diScienze Agrarie ed Ambientali at the Universita’ di Udine, Italy. Aftergraduating from the Universita’ di Padova, he spent two years as a post-doctoral researcher in the DuPont Genomics group in Wilmington,Delaware, USA, focusing on microsatellite analysis and applications inplants. He then joined the Dipartimento di Produzione Vegetale at theUniversita’ di Udine, and after a few years, he moved back to DuPontGenomics as a senior scientist, working on genome organization andphysical mapping in the maize genome. Since moving back to Italy oncemore, his laboratory has focused on genome analysis in plants, includingphysical mapping and genome-evolution studies, and on sequence-diversity analysis and association mapping. He is particularly interestedin new approaches to investigating complex traits and in developing thegenomics technologies needed for this.
Online summary• Whole-genome sequencing, positional cloning and comparative
genomics mainly depend on the construction of high-quality physicalmaps.
• Current physical maps have been developed using agarose gel-basedor, more recently, acrylamide gel-based techniques for fingerprintinglarge-insert clones.
• Fingerprinting methods based on fluorescent labelling are rich ininformation, have high throughput and produce more robust physicalmaps than traditional agarose gel-based methods.
• The use of high-throughput capillary electrophoresis machines andfluorescent fingerprinting methods makes physical map constructionfast, efficient and largely automated.
• The proper use of statistics is required to produce high-quality physi-cal maps, taking into account genome size and sequence complexity.
• There are methods to properly evaluate the quality and coverage ofphysical maps. The presence of undetected mis-assembled contigs canrepresent a serious problem if such methods are not applied.
• There are no non-model animal and plant species for which the same
number and types of genomic resource are available as there are forhumans, mice, rats, Arabidopsis thaliana and rice. This poses new chal-lenges for the construction of whole-genome physical maps thatrequire the adoption of refined clone-fingerprinting technologies.
Online linksFurther information
FPChttp://www.genome.arizona.edu/software/fpc/
GenoProfilerhttp://wheat.pw.usda.gov/PhysicalMapping/tools/genoprofiler/geno-profiler.html
iCEhttp://www.bcgsc.ca/bioinfo/ice
Recommended