Philipp WackerbeckPeter GassmannRobert Fiedler
Perspective
Managing Liquidity in a New Regulatory EraThe Tactical and Strategic Challenges for Banks

Booz & Company
Contact Information
AmsterdamDavid [email protected]
BeirutDr. Mazen [email protected]
DCJack [email protected]
DubaiGeorge [email protected]
Florham Park, NJRamesh [email protected]
FrankfurtDr. Peter [email protected]
LondonAlan GemesSenior [email protected]
MilanStefano [email protected]
Roberto BartocettiExecutive [email protected]
MunichDr. Johannes BussmannPartner [email protected]
Dr. Philipp [email protected]
New YorkPaul HydeSenior Partner +1-212-551-6069 [email protected]
Gauthier VincentSenior Executive [email protected]
São PauloIvan de SouzaSenior [email protected]
Gustavo RoxoSenior Executive [email protected]
Shanghai Andrew [email protected]
SydneyVanessa [email protected]
ZurichDr. Daniel [email protected]

1Booz & Company
EXECUTIVE SUMMARY
First, there are tactical and opera-tional measures that banks’ treasury departments need to consider. These include managing the liquidity cover-age ratio (LCR) and the net stable funding ratio (NSFR) set by Basel III.
Second are strategic funding issues. Before the crisis, liquidity was gener-ally so cheap and available that banks could easily fund new business. That is no longer the case. At many banks, funding has become a significant brake on new business generation. Banks need to analyze the impact of the new liquidity environment on their ability to pursue their business models. It’s not only the regulators
that are forcing banks to rethink their funding strategies; key stakeholders such as investors, rating agencies, and business partners increasingly expect banks to demonstrate sufficient and reasonably priced funding.
Those banks that fail to develop alter-native sources of funding will need to adjust their business models signifi-cantly. In the pre-crisis era, banks had the luxury of pursuing purely asset-driven business models, but we expect to see a widespread switch toward liability-driven business models. On both the tactical and strategic fronts, Booz & Company proposes several options for banks to consider.
During their meeting in Seoul in November 2010, to strengthen the resilience of the global financial industry, the G-20 countries approved the new rules for banking regulation known as Basel III. Since then, industry leaders have hotly debated the capital and risk management aspects of the new rules, and banks in many jurisdictions have taken steps to increase their capital bases and enhance risk management frameworks. Less discussed have been the equally important provisions governing bank funding and liquidity management. These rules will have a more fundamental impact on banks’ business models than many executives expect.

2 Booz & Company
The Basel Committee on Banking Supervision (BCBS) issued a global regulatory framework, known as Basel III, in December 2010 to create more resilient banks and banking systems.
Although Basel III’s new liquidity management requirements phase in over several years, with some portions not coming into effect until 2018, time is growing short.
The capital markets expect banks to comply with the new regulations far ahead of the official regulatory deadlines. This means that the treasury departments in many financial services institutions must adjust their operations as soon as possible.
Basel III requires that a bank meet both short-term and longer-term liquidity ratios. These ratios measure the bank’s potential cash outflows against hypothetical inflows from assets considered repossessable or salable. Exhibit 1 shows the domains that the BCBS established for changes to the liquidity management framework.
The Liquidity Coverage Ratio (LCR)To determine LCR, the shorter-
term measure, the bank compares its highly liquid assets (HLAs) to its total net cash outflow (TNCO) over 30 calendar days. The TNCO represents all expected cash flows from the bank’s outstanding balances (liabilities or off balance sheet commitments) that mature within 30 days multiplied by expected runoff/drawdown rates.
The overall TNCO ratio is expressed as follows:
Under the new framework, HLAs can be neither encumbered nor re-hypothecated. They are assumed to be easily converted into cash,
THE TACTICAL LIQUIDITY CHALLENGES
31%
30%
17%
13%
IT breakdown/information security breach
Large-scale natural catastrophe in area of operations
Loss of key people
Nonphysical disruptions to owned facility8
16
12
Step 3: Determine the number of common capabilities across all the segments the company serves.
This score is mapped against EBIT margin to determine the coherence premium.
Portfolio Coherence Score
80604020
2008 2009 2010 2011 2012 2013 2014 2015
3,0302,785
2,5082,252
1,865
1,463 1,493
0
Kraft Foods
Unilever
PepsiCo
Sara Lee
Heinz
Kimberly-Clark
ConAgra Foods
GLOBAL DEVICE SALES FORECAST, 2008–15 [M #/YEAR]
4
Size of Bubble = Revenue
Cloud Architecture
Standard phones
Smartphones
Tablets
NotebooksPC
The particular cloud service architectuability to meet relevant security requirem
Frequency of calculation and reporting- Reporting of LCR at least monthly—weekly or daily reports during stressed situations- Maximum permissible reporting time lag of two weeks
Scope of application- All international banks on a consolidated basis (as set out in Part I of Basel II)- Differences in home/host liquidity requirements to be included
Liquid asset pool composition- Currency composition of liquid asset pool needs to reflect operational footprint of bank
Observation periods and transitional arrangements for standards- LCR and NSFR to be reported as of January 1, 2012- Revisions of LCR at the latest by mid-2013 and of the NSFR by mid-2016- LCR becomes minimum requirement in 2015, NSFR in 2018
ts
0
500
1,000
1,500
2,000
2,500
3,000
3,500
921 895
285 271362
458
280
561
265445
465390
6777761,220
1,4291,494
1,5351,540
1,570
2520
150140
0
138175
18
146210
65
151245
120 190340
156 159 158 157
ACCUMULATED DIGITAL CONTENT PER HOUSEHOLD 40
5
10
25
15
02020201520102006
30
35
20
Personal Data
Home Backup
Gaming
Retail Home Video
Home Entertainment
Terabytes/Household
Regulatory Standards Monitoring Tools Further Implementation Guidelines
�
LCR by currency- Monitors potential currency mismatches
Liquidity Coverage Ratio- Promotes short-term resilience for severe liquidity stress scenario - Requires adequate level of unencumbered liquid assets to cover net cash outflows during 30-day period
Net Stable Funding Ratio- Enhances long-term resilience of banking institution and reduces funding mismatches- Ensures funding of long- term assets with a minimum amount of stable liabilities in relation to their liquidity risk profiles
Available unencumbered assets- Indicates potential use of assets as collaterals during liquidity/funding stress scenarios
Market-related data- Serves as early warning indicators for liquidity difficulties
Contractual maturity mismatch- Identifies gaps within contractual inflows and outflows
Concentration of funding- Identifies liquidity problems due to withdrawal of funding
Source: Basel Committee on Banking Supervision
Exhibit 1 BCBS Global Liquidity Management Framework
highly liquid assets
total net cash outflows over the next 30 calendar days
>100%
3Booz & Company
31%
30%
17%
13%
IT breakdown/information security breach
Large-scale natural catastrophe in area of operations
Loss of key people
Nonphysical disruptions to owned facility8
16
12
Step 3: Determine the number of common capabilities across all the segments the company serves.
This score is mapped against EBIT margin to determine the coherence premium.
Portfolio Coherence Score
80604020
2008 2009 2010 2011 2012 2013 2014 2015
3,0302,785
2,5082,252
1,865
1,463 1,493
0
Kraft Foods
Unilever
PepsiCo
Sara Lee
Heinz
Kimberly-Clark
ConAgra Foods
GLOBAL DEVICE SALES FORECAST, 2008–15 [M #/YEAR]
4
Size of Bubble = Revenue
Cloud Architecture
Standard phones
Smartphones
Tablets
NotebooksPC
The particular cloud service architectuability to meet relevant security requirem
ts
0
500
1,000
1,500
2,000
2,500
3,000
3,500
921 895
285 271362
458
280
561
265445
465390
6777761,220
1,4291,494
1,5351,540
1,570
2520
150140
0
138175
18
146210
65
151245
120 190340
156 159 158 157
ACCUMULATED DIGITAL CONTENT PER HOUSEHOLD 40
5
10
25
15
02020201520102006
30
35
20
Personal Data
Home Backup
Gaming
Retail Home Video
Home Entertainment
Terabytes/Household
�
LCR: TACTICAL IMPROVEMENTS
LCR =HLAs/TNCO
Decrease Total Net Outflow
Purchase Additional HLA
Exchange Existing Asset
Possible Decrease of HLA
Refinancing of Purchased HLA
Decrease Existing Assets
Increase Existing Liabilities
Non-HLA
HLA
Level 2
Level 1Sell Repo Shorten Tenor New Liabilities Extend Tenor
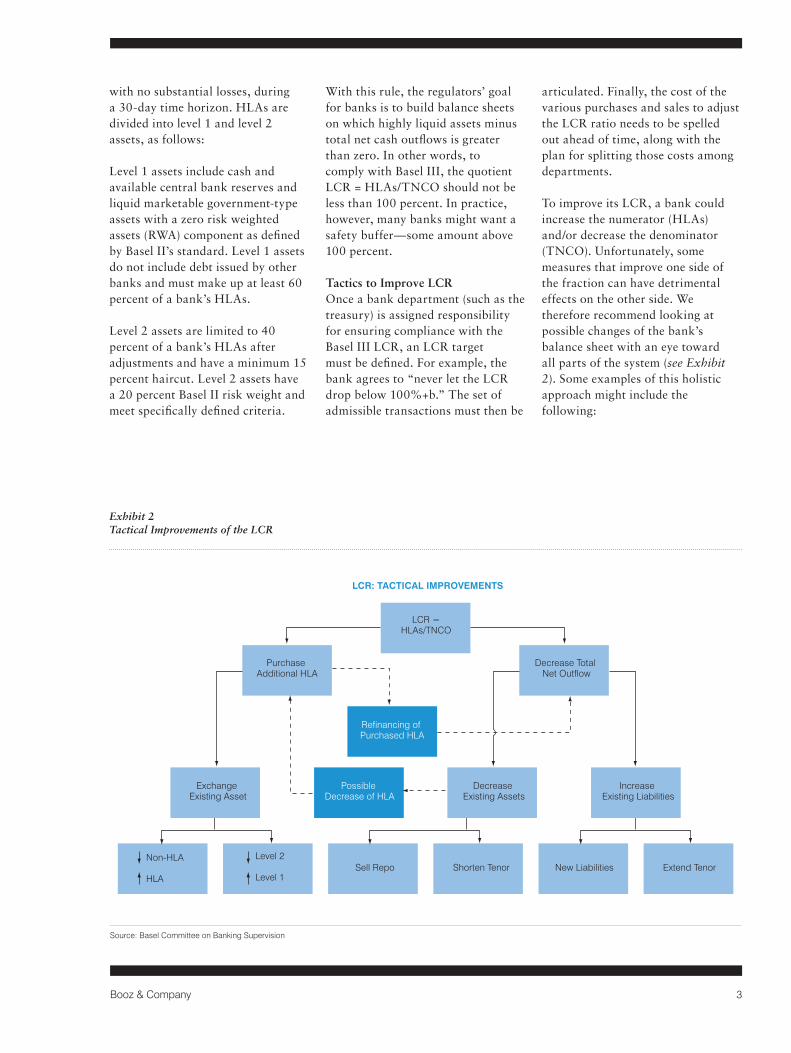
with no substantial losses, during a 30-day time horizon. HLAs are divided into level 1 and level 2 assets, as follows:
Level 1 assets include cash and available central bank reserves and liquid marketable government-type assets with a zero risk weighted assets (RWA) component as defined by Basel II’s standard. Level 1 assets do not include debt issued by other banks and must make up at least 60 percent of a bank’s HLAs.
Level 2 assets are limited to 40 percent of a bank’s HLAs after adjustments and have a minimum 15 percent haircut. Level 2 assets have a 20 percent Basel II risk weight and meet specifically defined criteria.
With this rule, the regulators’ goal for banks is to build balance sheets on which highly liquid assets minus total net cash outflows is greater than zero. In other words, to comply with Basel III, the quotient LCR = HLAs/TNCO should not be less than 100 percent. In practice, however, many banks might want a safety buffer—some amount above 100 percent.
Tactics to Improve LCROnce a bank department (such as the treasury) is assigned responsibility for ensuring compliance with the Basel III LCR, an LCR target must be defined. For example, the bank agrees to “never let the LCR drop below 100%+b.” The set of admissible transactions must then be
articulated. Finally, the cost of the various purchases and sales to adjust the LCR ratio needs to be spelled out ahead of time, along with the plan for splitting those costs among departments.
To improve its LCR, a bank could increase the numerator (HLAs) and/or decrease the denominator (TNCO). Unfortunately, some measures that improve one side of the fraction can have detrimental effects on the other side. We therefore recommend looking at possible changes of the bank’s balance sheet with an eye toward all parts of the system (see Exhibit 2). Some examples of this holistic approach might include the following:
Source: Basel Committee on Banking Supervision
Exhibit 2 Tactical Improvements of the LCR

4 Booz & Company
A bank increases its current balance sheet by purchasing additional HLA-eligible assets and refinances them. The HLAs increase the numerator, while their redemption flows do not affect the TNCO and thus leave the denominator unchanged. The bank decreases its current balance sheet. It sells assets to repay liabilities that would otherwise mature within 30 days and thus would detrimentally affect the outflows. The benefit depends on the 75 percent cap. To reflect the uncertain nature of inflows, the sum of these inflows is capped at 75 percent of the actual outflows per day. Thus, in the best case the TNCO is fully enhanced by the sold amount. The bank leaves its balance sheet size unchanged. It can
sell existing non-HLAs in exchange for new HLAs. As no new liabilities originate, the TNCO remains unchanged. Or the bank can pay back existing liabilities that mature within 30 days and purchase longer-term liabilities, thus improving the TNCO. Of course, this depends on existing counterparties’ willingness to accept an early redemption of the funds and the bank’s ability to acquire longer-term liabilities.
The Net Stable Funding Ratio (NSFR)A longer-term measure, the NSFR requires a bank to compare assumptions about its required stable funding (RSF) and its available stable funding (ASF) in a one-year
time horizon. The ratio is expressed as follows:
The ASF is the bank’s current liabilities that are assumed to be available to the bank within one year. Regulators have categorized these liabilities as shown in Exhibit 3.
The bank must assign its equity and liabilities to one of these categories, determine the current total amount for each category, and multiply by its corresponding ASF factor.
available amount of stable funding
required amount of stable funding>100%
2008 2009 2010 2011 2012 2013 2014 2015
3,0302,785
2,5082,252
1,865
1,463 1,493
Standard phones
Smartphones
Tablets
NotebooksPC
Capital (Tier 1 and 2)
Preferred stock ≥ 1 year
Liabilities with effective maturity ≥ 1 year
Non-maturing / term deposits (< 1 year) – definition as in the LCR Stable Less stable
Stable portion of wholesale funding (<1 year)
Rest
0
500
1,000
1,500
2,000
2,500
3,000
3,500
921 895
285 271362
458
280
561
265445
465390
6777761,220
1,4291,494
1,5351,540
1,570
2520
150140
0
138175
18
146210
65
151245
120 190340
156 159 158 157
ACCUMULATED DIGITAL CONTENT PER HOUSEHOLD 40
5
10
25
15
02020201520102006
30
35
20
Personal Data
Home Backup
Gaming
Retail Home Video
Home Entertainment
Terabytes/Household
AVAILABLE STABLE FUNDING (ASF)
No
HL
FactorCapital (Tier 1 and 2)Preferred stock ≥ 1 year 100%Liabilities with effective maturity ≥1 yearNon-maturing / term deposits (< 1year) – definition as in the LCR•Stable 90%•Less stable 80%Stable portion of wholesalefunding (<1 year) 50%Rest 0%
CATEGORY FACTOR
100%
90%80%
50%
0%
Source: Basel Committee on Banking Supervision
Exhibit 3 Available Stable Funding (ASF)

5Booz & Company
The RSF comprises the bank’s current assets and off balance sheet (OBS) exposures. They are categorized by their assumed ability to fund themselves, as shown in Exhibit 4.
As with the ASF, to determine RSF the bank needs to assign its assets and OBS items to a category, determine the current total amount for each category, and multiply this by the corresponding RSF factor.
Tactics to Improve NSFRIf the bank’s NSFR is too low, the average maturity of its liabilities might be too short. Unfortunately, it is difficult to lengthen these liabilities, since capital is a very small portion of a bank’s balance sheet and savings deposits already amount to 90 percent of the face value and thus almost match-fund the attributed assets. For example, at the end of the third quarter of 2011, Deutsche Bank reported assets of €2,282 billion and capital of €51.8 billion—a ratio of less than 2.3 percent.
On the asset side, a low NSFR might be caused by illiquid assets or assets that are not adequate collateral for secured borrowing. Unfortunately, changing the asset mix is difficult without changing the business model. Purchasing additional assets with a low RSF factor might be an option for a liability-driven bank (which would otherwise have bought assets with less liquidity but higher return). But banks that focus on small business loans cannot suddenly switch to residential mortgages, even if their RSF factor would improve from 85 to 65 percent.
The simplest but possibly most expensive measure to improve the NFSR is to match every asset with new funds until the end of its tenure. (In other words, every outflow would be mirrored with an accordant inflow.) The NFSR can be fixed with funding that is slightly longer than one year, but the positive effect will diminish when maturity drops below one year. The negative effect will be
preserved until the asset matures, unless the borrowing is prolonged.
The specific impact of match-funding depends, of course, on the individual bank’s balance sheet. But generally speaking, the NFSR is enhanced if more stable funding replaces less stable funding and if assets that require more stable funding are replaced with assets that require less stable funding.
As a consequence, institutions that fail to adjust their funding structure to their business profile will have to adjust their business models and strategy. Given that institutions can no longer easily access liquidity to fund an asset-driven business model, we believe that many institutions will shift toward a liability-driven model in which the available funding mix determines the business portfolio they can execute on the asset side.
2008 2009 2010 2011 2012 2013 2014 2015
3,0302,785
2,5082,252
1,865
1,463 1,493
Standard phones
Smartphones
Tablets
NotebooksPC
Unencumbered assets ≤ 1 year and securities in a reverse repo
Unencumbered marketable securities 0% Basel II risk weight 20% Basel II risk weight
Unencumbered corporate/covered bonds (≥ AA - & ≥ 1 year)
Unencumbered gold, equities, and other corporate/covered bonds
Unencumbered residential mortgages
Unencumbered other (non-official) loans (≤ 35% risk weight in Basel II)
Unencumbered retail/small business loans
Conditionally (ir-)revocable credit and liquidity facilities
Other contingent funding obligations/x% tbd by national supervisors
Rest
0
500
1,000
1,500
2,000
2,500
3,000
3,500
921 895
285 271362
458
280
561
265445
465390
6777761,220
1,4291,494
1,5351,540
1,570
2520
150140
0
138175
18
146210
65
151245
120 190340
156 159 158 157
ACCUMULATED DIGITAL CONTENT PER HOUSEHOLD 40
5
10
25
15
02020201520102006
30
35
20
Personal Data
Home Backup
Gaming
Retail Home Video
Home Entertainment
Terabytes/Household
REQUIRED STABLE FUNDING (RSF)
No
HL
FactorCapital (Tier 1 and 2)Preferred stock ≥ 1 year 100%Liabilities with effective maturity ≥1 yearNon-maturing / term deposits (< 1year) – definition as in the LCR•Stable 90%•Less stable 80%Stable portion of wholesalefunding (<1 year) 50%Rest 0%
CATEGORY FACTOR
0%
5%20%
50%
65%
85%
5%
X/x%
100%
Source: Basel Committee on Banking Supervision
Exhibit 4 Required Stable Funding (RSF)

6 Booz & Company
There are attractive opportunities in commercial lending. To capitalize on them, access to unsecured funding is key.
Beyond the tactical challenges described above, banks also face strategic challenges related to liquidity. They must find ways to guarantee access to unsecured funding at a reasonable cost. These issues are especially acute for non-retail banks without stable deposits, such as pure-play wholesale banks and commercial real estate lenders.
As major economies recover from the crisis and many emerging markets continue their growth, there are attractive opportunities in commercial lending. To capitalize on them, access to unsecured funding is key. Unfortunately, many banks face a strategic funding gap due to their limited ability to borrow in an unsecured way. The
THE STRATEGIC LIQUIDITY CHALLENGE
7Booz & Company
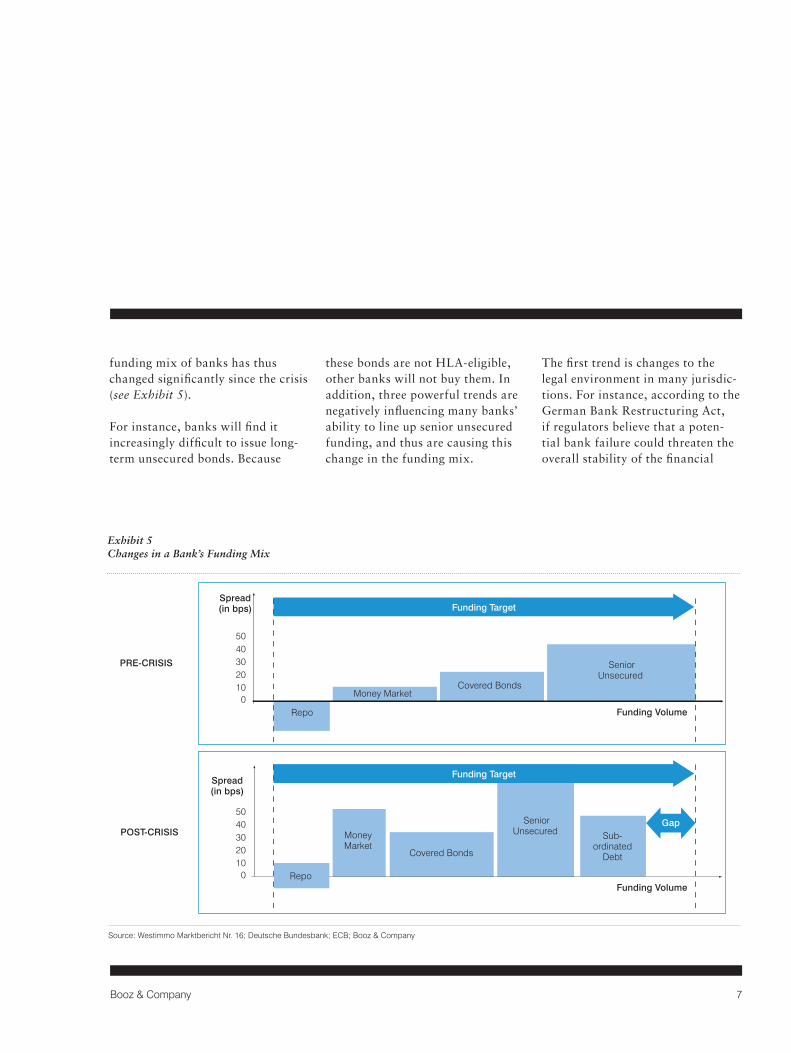
funding mix of banks has thus changed significantly since the crisis (see Exhibit 5).
For instance, banks will find it increasingly difficult to issue long-term unsecured bonds. Because
these bonds are not HLA-eligible, other banks will not buy them. In addition, three powerful trends are negatively influencing many banks’ ability to line up senior unsecured funding, and thus are causing this change in the funding mix.
The first trend is changes to the legal environment in many jurisdic-tions. For instance, according to the German Bank Restructuring Act, if regulators believe that a poten-tial bank failure could threaten the overall stability of the financial
Funding Volume0
1020304050
Repo
Funding Volume
Spread(in bps)
01020304050
Gap
Spread(in bps) Funding Target
Funding Target
PRE-CRISIS
POST-CRISIS
31%
30%
17%
13%
IT breakdown/information security breach
Large-scale natural catastrophe in area of operations
Loss of key people
Nonphysical disruptions to owned facility8
16
12
Step 3: Determine the number of common capabilities across all the segments the company serves.
This score is mapped against EBIT margin to determine the coherence premium.
Portfolio Coherence Score
80604020
2008 2009 2010 2011 2012 2013 2014 2015
3,0302,785
2,5082,252
1,865
1,463 1,493
0
Kraft Foods
Unilever
PepsiCo
Sara Lee
Heinz
Kimberly-Clark
ConAgra Foods
GLOBAL DEVICE SALES FORECAST, 2008–15 [M #/YEAR]
4
Size of Bubble = Revenue
Cloud Architecture
Standard phones
Smartphones
Tablets
NotebooksPC
The particular cloud service architectuability to meet relevant security requirem
ts
0
500
1,000
1,500
2,000
2,500
3,000
3,500
921 895
285 271362
458
280
561
265445
465390
6777761,220
1,4291,494
1,5351,540
1,570
2520
150140
0
138175
18
146210
65
151245
120 190340
156 159 158 157
ACCUMULATED DIGITAL CONTENT PER HOUSEHOLD 40
5
10
25
15
02020201520102006
30
35
20
Personal Data
Home Backup
Gaming
Retail Home Video
Home Entertainment
Terabytes/Household
�
Repo
SeniorUnsecured
SeniorUnsecured Sub-
ordinatedDebt
Covered Bonds
Covered Bonds
Money Market
MoneyMarket
Source: Westimmo Marktbericht Nr. 16; Deutsche Bundesbank; ECB; Booz & Company
Exhibit 5 Changes in a Bank’s Funding Mix

8 Booz & Company
system, they can order reorganiza-tion proceedings. In such a case, regulators might force the bank to restructure its obligations; this possibility has already dampened investors’ interest in buying bank obligations.
Second, the new regulations for insurance companies operating in the European Union, known as Solvency II, could diminish insurance companies’ appetite for bank debt. Insurers are usually one of the largest buyers of bank debt; in markets such as Germany, they invest about 50 percent of their
assets directly into different forms of bank debt. But that may change. Under Solvency II, insurance companies must put aside more capital for bank bonds. This makes the bonds less attractive, both in absolute terms and in comparison to government bonds, which still require no capital.
Third, persistent uncertainty in the financial markets is prompting some insurance asset managers to reduce their exposure to the banking sector. A number of large insurers have actually stopped buying any new bank debt for more than a year.
Given this deteriorating funding environment, banks need to develop alternative sources of funding. But how? There are several promising funding options that asset-driven banks can use to align their busi-ness models and strategies with the new funding reality. We see three different approaches to broaden the funding mix:
1. Acquire Deposits to Increase Independence from Wholesale FundingBefore the financial crisis, many considered the deposit business a slow-growth, rather unattractive
Given the deteriorating funding environment, banks need to develop alternative sources of funding.

9Booz & Company
business model. But the picture has changed dramatically, in part because of the way that resilient financial institutions with strong deposit businesses have performed. Now many institutions with little or no access to the retail market are studying how to tap the market. There are basically three options: buy a retail player, build a business, or expand a small existing opera-tion. An acquisition can be espe-cially compelling today, given low industry valuations. For instance, Deutsche Bank recently bought Deutsche Postbank.
If a bank would rather take the greenfield approach, one strategy is to set up a direct bank to offer
accounts as well as term depos-its. Commercial lenders IKB and Royal Bank of Scotland have taken this route recently, and others are working on similar initiatives. The approach can be very successful. At least one new direct banking franchise has acquired €3 billion in its first year of operation in the German market. This strategy is doubly attractive because it’s relatively simple to set up a retail direct bank. The key capabilities are product management and advertis-ing; the rest can be outsourced to specialized providers.
On the downside, direct banks can be costly and riskier than a tradi-tional branch-based retail business.
New direct banks usually offer comparatively high interest rates to attract deposits. Even so, these deposits are not “sticky.” Online customers are bargain hunters who are quick to switch institutions for a better deal.
But launching a direct bank is not the only organic growth option. Banks that already have a retail operation could ramp up their deposit gathering by introducing competitive pricing. For example, they could pay new customers higher interest rates or pay higher rates in the last month of a fixed-term deposit to increase the sticki-ness of funds.

10 Booz & Company
Product differentiation and creative marketing are other ways to acquire retail deposits. Some banks offer nonfinancial benefits instead of simply raising rates. Others combine deposit products with broader prod-uct packages that include various financial and nonfinancial services as well as card products. In some countries, lotteries are being used to attract new deposits. Under these programs, customers who deposit a certain amount for a defined period
of time can participate in a drawing for attractive prizes.
2. Develop Secured Financing InstrumentsCovered bonds, especially the German Pfandbrief, have proven to be resilient during the crisis because investors trusted the legal framework and the quality of the collateral—and perhaps because of the implicit guarantee by the gov-ernment. In the midst of the crisis,
spreads on covered bonds increased to 70 to 80 basis points above swap rates, but they quickly tightened to about 30 to 40 basis points.
We believe that covered instruments, at least as funding for commercial real estate, will remain an important refinancing tool for banks. Spreads between covered and unsecured instruments remain high (see Exhibit 6), making covered bonds a relatively attractive funding Funding Volume
01020304050
Repo
Funding Volume
Spread(in bps)
01020304050
Gap
Spread(in bps) Funding Target
Funding Target
PRE-CRISIS
AFTER-CRISIS
31%
30%
17%
13%
IT breakdown/information security breach
Large-scale natural catastrophe in area of operations
Loss of key people
Nonphysical disruptions to owned facility8
16
12
Step 3: Determine the number of common capabilities across all the segments the company serves.
This score is mapped against EBIT margin to determine the coherence premium.
Spread (in basis points)
80604020
2008 2009 2010 2011 2012 2013 2014 2015
3,0302,785
2,5082,252
1,865
1,463 1,493
0
Kraft Foods
Unilever
PepsiCo
Sara Lee
Heinz
Kimberly-Clark
ConAgra Foods
CDS SPREADS OVER COVERED BOND SPREADS*
4
Size of Bubble = Revenue
Cloud Architecture
Standard phones
Smartphones
Tablets
NotebooksPC
The particular cloud service architectuability to meet relevant security requirem
Indicative Corridor forSecured Financing Spreads
ts
0
500
1,000
1,500
2,000
2,500
3,000
3,500
921 895
285 271362
458
280
561
265445
465390
6777761,220
1,4291,494
1,5351,540
1,570
2520
150140
0
138175
18
146210
65
151245
120 190340
156 159 158 157
ACCUMULATED DIGITAL CONTENT PER HOUSEHOLD 40
5
10
25
15
02020201520102006
30
35
20
Personal Data
Home Backup
Gaming
Retail Home Video
Home Entertainment
Terabytes/Household
Repo
SeniorUnsecured
SeniorUnsecured Sub-
ordinatedDebt
Covered Bonds
Covered Bonds
Money Market
MoneyMarket
1/2005 1/20131/2006 1/2007 1/2008 1/2009 1/2010 1/2011 1/20120
20406080
100120140160180200220240260280300320340
* The historic spread is calculated as an average of CDS spreads of selected German banks, minus Vdp-covered bond spreads. Source: Bloomberg, VdP
Exhibit 6 Credit Default Swap Spreads over Covered Bond Spreads

11Booz & Company
option. In fact, more banks have recently applied for licenses to issue covered bonds.
This sustained spread has created an opportunity for a new hybrid instrument to fill the gap between covered and unsecured instruments. This new instrument could be collateralized by attractive assets a bank has on its balance sheet, such as a portfolio of commercial real estate financings. The idea is to create an instrument that is secured but less restrictive than a typical covered bond. Instead of issuing covered bonds governed by a special law, banks could issue asset-backed securities in order to pick up a better spread without being so strictly regulated. From an investor perspective, this hybrid is less risky than unsecured instruments while
offering a more attractive yield than the typical covered bonds.
Depending on the availability of appropriate assets for collateral, this kind of secured financing could help banks address their funding needs and restart the vital securitization market in many jurisdictions. In France, for example, there are already two kinds of covered bond issuers: the issuers of “obligations foncières” (under the covered bond law) such as CFF or Dexia, and the ones outside the covered bond law (“French covered bonds”) such as BNP Paribas.
3. Develop Segment-Specific Investment Products Rather Than Funding InstrumentsThe regulatory pressure to develop alternative sources of funding
might have a silver lining. It could push banks to concentrate more on investors’ needs. Banks that analyze investors’ preferences and develop targeted solutions to address these needs could differentiate themselves in the funding market. If such products leverage the asset side of a bank’s balance sheet, that bank could further improve its ability to self-fund its lending business.
For instance, consider segment-specific investment products such as sustainable bonds, which are linked to green initiatives, and Sharia-compliant recurring income products, which some Muslim investors prefer. Such products fill specific investment needs for particular investors and thus offer value beyond risk and return.
The sustained spread has created an opportunity for a new hybrid instrument to fill the gap.

12 Booz & Company
The new regulatory regime’s impact on liquidity management poses significant challenges for banks. Notwithstanding the long transition period before the new Basel III standards are fully enforced, market pressure is growing on banks to comply with the new rules sooner rather than later. In response, banks should be thinking both tactically and strategically. On a tactical level, the treasury departments need to adjust their operations to conform
to new, tougher liquidity ratios. On a strategic level, senior management must thoroughly assess the long-term implications of shifting from an asset-driven to a liability-driven business model and think creatively about how to develop alternative sources of funding. The transition won’t be easy for most banks, but the competitive advantage will be significant for those that strike the right balance and take early, appropriate action.
CoNCLUSIoN

13Booz & Company
About the Authors
Dr. Peter Gassmann is a part-ner with Booz & Company’s financial services practice. Based in Frankfurt, he heads the company’s global risk and capital management platform to support banks and other financial institutions. He has 15 years of experience in financial services as a management consultant and as a bank executive in senior risk man-agement positions.
Dr. Philipp Wackerbeck is a principal with the financial services practice of Booz & Company. Based in Munich, he is a member of the leadership team of the global risk and capital management platform and has gained extensive experience in liquidity management and developing alternative funding strategies. Philipp has worked on various engagements for banks, asset managers, and insurance companies in Europe, the United States, and Asia.
Dr. Robert Fiedler is a principal and managing director with Liquidity Risk Corp., a specialist consultancy focused on the development and implementation of liquidity management instruments and methodologies. He has 20 years of experience in the banking industry, working in various executive roles in treasury, liquidity, and risk management.

Booz & Company is a leading global management consulting firm, helping the world’s top businesses, governments, and organizations. Our founder, Edwin Booz, defined the profession when he estab-lished the first management consulting firm in 1914.
Today, with more than 3,300 people in 60 offices around the world, we bring foresight and knowledge, deep functional expertise, and a practical approach to building capabilities and delivering real impact. We work closely with our clients to create and deliver essential advantage. The independent White Space report ranked Booz & Company #1 among consult-ing firms for “the best thought leadership” in 2011.
For our management magazine strategy+business, visit strategy-business.com. Visit booz.com to learn more about Booz & Company.
The most recentlist of our officesand affiliates, withaddresses andtelephone numbers,can be found onour website,booz.com.
Worldwide Offices
AsiaBeijingDelhiHong KongMumbaiSeoulShanghaiTaipeiTokyo
Australia,New Zealand & Southeast AsiaAucklandBangkok
BrisbaneCanberraJakartaKuala LumpurMelbourneSydney
EuropeAmsterdamBerlinCopenhagenDublinDüsseldorfFrankfurt
HelsinkiIstanbulLondonMadridMilanMoscowMunichParisRomeStockholmStuttgartViennaWarsawZurich
Middle EastAbu DhabiBeirutCairoDohaDubaiRiyadh
North AmericaAtlantaBostonChicagoClevelandDallasDC
DetroitFlorham ParkHoustonLos AngelesMexico CityNew York CityParsippanySan Francisco
South AmericaBuenos AiresRio de JaneiroSantiagoSão Paulo
©2012 Booz & Company Inc.
Recommended