ACTAUNIVERSITATIS
UPSALIENSISUPPSALA
2017
Digital Comprehensive Summaries of Uppsala Dissertationsfrom the Faculty of Science and Technology 1585
Magnetic Materials for CoolApplications
Relations between Structure and Magnetism in RareEarth Free Alloys
JOHAN CEDERVALL
ISSN 1651-6214ISBN 978-91-513-0123-5urn:nbn:se:uu:diva-331762

Dissertation presented at Uppsala University to be publicly examined in Häggsalen,Ångströmlaboratoriet, Lägerhyddsvägen 1, Uppsala, Friday, 8 December 2017 at 09:00 forthe degree of Doctor of Philosophy. The examination will be conducted in English. Facultyexaminer: Prof. Paul Henry (The ISIS Facility, STFC Rutherford Appleton Laboratory).
AbstractCedervall, J. 2017. Magnetic Materials for Cool Applications. Relations between Structureand Magnetism in Rare Earth Free Alloys. Digital Comprehensive Summaries of UppsalaDissertations from the Faculty of Science and Technology 1585. 70 pp. Uppsala: ActaUniversitatis Upsaliensis. ISBN 978-91-513-0123-5.
New and more efficient magnetic materials for energy applications are a big necessity forsustainable future. Whether the application is energy conversion or refrigeration, materials basedon sustainable elements should be used, which discards all rare earth elements. For energyconversion, permanent magnets with high magnetisation and working temperature are neededwhereas for refrigeration, the entropy difference between the non-magnetised and magnetisedstates should be large. For this reason, magnetic materials have been synthesised with hightemperature methods and structurally and magnetically characterised with the aim of makinga material with potential for large scale applications. To really determine the cause of thephysical properties the connections between structure (crystalline and magnetic) and, mainly,the magnetic properties have been studied thoroughly.
The materials that have been studied have all been iron based and exhibit properties withpotential for the applications in mind. The first system, for permanent magnet applications,was Fe5SiB2. It was found to be unsuitable for a permanent magnet, however, an interestingmagnetic behaviour was studied at low temperatures. The magnetic behaviour arose from achange in the magnetic structure which was solved by using neutron diffraction. Substitutionswith phosphorus (Fe5Si1-xPxB2) and cobalt (Fe1-xCox)5PB2 were then performed to improve thepermanent magnet potential. While the permanent magnetic potential was not improved withcobalt substitutions the magnetic transition temperature could be greatly controlled, a realbenefit for magnetic refrigeration. For this purpose AlFe2B2 was also studied, and there it wasfound, conclusively, that the material undergoes a second order transition, making it unsuitablefor magnetic cooling. However, the magnetic structure was solved with two different methodsand was found to be ferromagnetic with all magnetic moments aligned along the crystallographica-direction. Lastly, the origin of magnetic cooling was studied in Fe2P, and can be linked to theinteractions between the magnetic and atomic vibrations.
Keywords: Magnetism, Diffraction, X-ray scattering, Neutron Scattering, Permanent magnets,Magnetocalorics
Johan Cedervall, Department of Chemistry - Ångström, Box 523, Uppsala University,SE-75120 Uppsala, Sweden.
© Johan Cedervall 2017
ISSN 1651-6214ISBN 978-91-513-0123-5urn:nbn:se:uu:diva-331762 (http://urn.kb.se/resolve?urn=urn:nbn:se:uu:diva-331762)

”That which does not kill us makes us stronger.”- Friedrich Nietzsche


List of papers
This thesis is based on the following papers, which are referred to in the textby their roman numerals.
I Magnetostructural transition in Fe5SiB2 observed with neutron
diffraction
J. Cedervall, S. Kontos, T. C. Hansen, O. Balmes, F. J.Martinez-Casado, Z. Matej, P. Beran, P. Svedlindh, K. Gunnarsson, M.Sahlberg.Journal of Solid State Chemistry, 235, 113-118 (2016)
II Magnetic properties of the Fe5SiB2-Fe5PB2 system
D. Hedlund, J. Cedervall, A. Edström, M. Werwinski, S. Kontos, O.Eriksson, J. Rusz, P. Svedlindh, M. Sahlberg, K. Gunnarsson.Physical Review B. 96 094433 (2017)
III Influence of cobalt substitution on the magnetic properties of
Fe5PB2
J. Cedervall, E. Nonnet, D. Hedlund, L. Häggström, T. Ericsson, A.Edström, M. Werwinski, J. Rusz, P. Svedlindh, K. Gunnarsson, M.Sahlberg.Submitted
IV Magnetic structure of the magnetocaloric compound AlFe2B2
J. Cedervall, M. S. Andersson, T. Sarkar, E. K. Delczeg-Czirjak, L.Bergqvist, T. C. Hansen, P. Beran, P. Nordblad, M. Sahlberg.Journal of Alloys and Compounds, 664, 784-791 (2016)
V Mössbauer study of the magnetocaloric compound AlFe2B2
J. Cedervall, L. Häggström, T. Ericsson, M. Sahlberg.Hyperfine Interactions, 237, 18 (2016)
VI Magnetic and mechanical effects of Mn substitutions in AlFe2B2
J. Cedervall, M. S. Andersson, P Berastegui, S. Shafeie, U. Jansson, P.Nordblad, M. Sahlberg.In manuscript

VII Towards an understanding of the magnetocaloric effect in Fe2P
J. Cedervall, M. S. Andersson, E. K. Delczeg-Czirjak, D. Iusan, M.Pereiro, P. Roy, T. Ericsson, L. Häggström, W. Lohstroh, H. Mutka, M.Sahlberg, P. Nordblad, P. P. Deen.In manuscript
Reprints were made with permission from the publishers.

My contributions to the papers
The authors contribution to the papers in this thesis:
Paper I. I planned the study, synthesised the samples and performed all struc-tural characterisations, except for the representational analysis. I wrotethe main part of the manuscript and was involved in all discussions.
Paper II. I was involved in the planning of the study, synthesised the samplesand performed all structural characterisations. I was involved in all dis-cussions and approved the final manuscript.
Paper III. I planned the study, synthesised the samples and performed allstructural characterisations. I wrote the main part of the manuscript andwas involved in all discussions.
Paper IV. I planned the study, synthesised the samples and performed allstructural characterisations, except for the representational analysis. Iwrote the main part of the manuscript and was involved in all discus-sions.
Paper V. I, together with the other authors, planned the study. I synthesisedthe samples and performed all structural characterisations. I was in-volved in the writing of the manuscript and all discussions.
Paper VI. I planned the study, synthesised the samples and performed allstructural and mechanical characterisations. I wrote the main part ofthe manuscript and was involved in all discussions.
Paper VII. I synthesised the samples and performed all structural character-isations. I took part in the neutron experiments and was involved in thedata analysis. I also took part in the writing of the manuscript and alldiscussions.

Other publications to which the author has contributed.
i Irreversible structure change of the as prepared FeMnP1-xSix- struc-
ture on the initial cooling through the curie temperature
V. Höglin, J. Cedervall, M. S. Andersson, T. Sarkar, P. Nordblad, M.Sahlberg.Journal of Magnetism and Magnetic Materials, 374, 455-458 (2015)
ii Phase diagram, structures and magnetism of the FeMnP1-xSixV. Höglin, J. Cedervall, M. S. Andersson, T. Sarkar, M. Hudl, P. Nord-blad, Y. Andersson, M. Sahlberg.RSC Advances, 5, 8278-8284 (2015)
iii Directly obtained τ-phase MnAl, a high performance magnetic ma-
terial for permanent magnets
H. Fang, S. Kontos, J. Ångström, J. Cedervall, P. Svedlindh, K. Gun-narsson, M. Sahlberg.Journal of Solid State Chemistry 237, 300-306 (2016)
iv Low temperature magneto-structural transitions in Mn3Ni20P6
J. Cedervall, P. Beran, M. Vennström, T. Danielsson, S. Ronneteg, V.Höglin, D. Lindell, O. Eriksson, G. André, Y. Andersson, P. Nordblad,M. Sahlberg.Journal of Solid State Chemistry 237, 343-348 (2016)
v Magnetic properties of Fe5SiB2 and its alloys with P, S, and Co
M. Werwinski, S. Kontos, K. Gunnarsson, P. Svedlindh, J. Cedervall, V.Höglin, M. Sahlberg, A. Edström, O. Eriksson, J. Rusz.Physical Review B, 93, 174412 (2016)
vi Short-range magnetic correlations and spin dynamics in the para-
magnetic regime of (Mn,Fe)2(P,Si)
X. F. Miao, L. Caron, J. Cedervall, P. C. M. Gubbens, P. Dalmas deRéotier, A. Yaouanc, F. Qian, A. R. Wildes, H. Luetkens, A. Amato, N.H. van Dijk, E. Brück.Physical Review B 94, 014426 (2016)
vii Insights into formation and stability of τ-MnAlZx (Z = C and B)
H. Fang, J. Cedervall, F. J. Martinez-Casado, Z. Matej, J. Bednarcik, J.Ångström, P. Berastegui, M. Sahlberg.Journal of Alloys and Compounds 692, 198-203 (2017)

viii AlM2B2 (M=Cr, Mn, Fe, Co, Ni): a group of nanolaminated materi-
als
K. Kádas, D. Iusan, J. Hellsvik, J. Cedervall, P. Berastegui, M. Sahlberg,U. Jansson, O. Eriksson.Journal of Physics: Condensed Matter 29, 155402 (2017)


Contents
1 Introduction . . . . . . . . . . . . . . . . . . . . . . . . . . . . . . . . . . . . . . . . . . . . . . . . . . . . . . . . . . . . . . . . . . . . . . . . . . . . . . . . . . . . . . . . . . . . . . . . 151.1 Magnetic materials . . . . . . . . . . . . . . . . . . . . . . . . . . . . . . . . . . . . . . . . . . . . . . . . . . . . . . . . . . . . . . . . . . . . . . . . . 16
1.1.1 Magnetostructural properties . . . . . . . . . . . . . . . . . . . . . . . . . . . . . . . . . . . . . . . . . . 181.1.2 Permanent magnets . . . . . . . . . . . . . . . . . . . . . . . . . . . . . . . . . . . . . . . . . . . . . . . . . . . . . . . . . . 191.1.3 Magnetic refrigeration . . . . . . . . . . . . . . . . . . . . . . . . . . . . . . . . . . . . . . . . . . . . . . . . . . . . . 20
1.2 Studied materials . . . . . . . . . . . . . . . . . . . . . . . . . . . . . . . . . . . . . . . . . . . . . . . . . . . . . . . . . . . . . . . . . . . . . . . . . . . . 211.2.1 M5XB2 . . . . . . . . . . . . . . . . . . . . . . . . . . . . . . . . . . . . . . . . . . . . . . . . . . . . . . . . . . . . . . . . . . . . . . . . . . . . . . 211.2.2 AlM2B2 . . . . . . . . . . . . . . . . . . . . . . . . . . . . . . . . . . . . . . . . . . . . . . . . . . . . . . . . . . . . . . . . . . . . . . . . . . . . 221.2.3 Fe2P . . . . . . . . . . . . . . . . . . . . . . . . . . . . . . . . . . . . . . . . . . . . . . . . . . . . . . . . . . . . . . . . . . . . . . . . . . . . . . . . . . 23
2 Scope of the thesis . . . . . . . . . . . . . . . . . . . . . . . . . . . . . . . . . . . . . . . . . . . . . . . . . . . . . . . . . . . . . . . . . . . . . . . . . . . . . . . . . . . . . 25
3 Methods . . . . . . . . . . . . . . . . . . . . . . . . . . . . . . . . . . . . . . . . . . . . . . . . . . . . . . . . . . . . . . . . . . . . . . . . . . . . . . . . . . . . . . . . . . . . . . . . . . . . . . 273.1 Synthesis . . . . . . . . . . . . . . . . . . . . . . . . . . . . . . . . . . . . . . . . . . . . . . . . . . . . . . . . . . . . . . . . . . . . . . . . . . . . . . . . . . . . . . . . . 27
3.1.1 Arc melting . . . . . . . . . . . . . . . . . . . . . . . . . . . . . . . . . . . . . . . . . . . . . . . . . . . . . . . . . . . . . . . . . . . . . . 273.1.2 Drop synthesis . . . . . . . . . . . . . . . . . . . . . . . . . . . . . . . . . . . . . . . . . . . . . . . . . . . . . . . . . . . . . . . . . 273.1.3 Heat treatment . . . . . . . . . . . . . . . . . . . . . . . . . . . . . . . . . . . . . . . . . . . . . . . . . . . . . . . . . . . . . . . . . . 283.1.4 Post annealing treatments . . . . . . . . . . . . . . . . . . . . . . . . . . . . . . . . . . . . . . . . . . . . . . . 28
3.2 Diffraction . . . . . . . . . . . . . . . . . . . . . . . . . . . . . . . . . . . . . . . . . . . . . . . . . . . . . . . . . . . . . . . . . . . . . . . . . . . . . . . . . . . . . . 283.3 Characterisation by diffraction techniques . . . . . . . . . . . . . . . . . . . . . . . . . . . . . . . . . . . 31
3.3.1 X-ray powder diffraction . . . . . . . . . . . . . . . . . . . . . . . . . . . . . . . . . . . . . . . . . . . . . . . . . 313.3.2 Neutron powder diffraction . . . . . . . . . . . . . . . . . . . . . . . . . . . . . . . . . . . . . . . . . . . . . 323.3.3 Determination of lattice parameters . . . . . . . . . . . . . . . . . . . . . . . . . . . . . . . 323.3.4 Full pattern refinement using the Rietveld method . . . . . . . 323.3.5 Representational analysis . . . . . . . . . . . . . . . . . . . . . . . . . . . . . . . . . . . . . . . . . . . . . . . . 33
3.4 Inelastic neutron experiments . . . . . . . . . . . . . . . . . . . . . . . . . . . . . . . . . . . . . . . . . . . . . . . . . . . . . . . . 343.5 Magnetic characterisations . . . . . . . . . . . . . . . . . . . . . . . . . . . . . . . . . . . . . . . . . . . . . . . . . . . . . . . . . . . . 343.6 Mössbauer spectroscopy . . . . . . . . . . . . . . . . . . . . . . . . . . . . . . . . . . . . . . . . . . . . . . . . . . . . . . . . . . . . . . . . 353.7 Electronic structure calculations . . . . . . . . . . . . . . . . . . . . . . . . . . . . . . . . . . . . . . . . . . . . . . . . . . . 36
4 Results and discussion . . . . . . . . . . . . . . . . . . . . . . . . . . . . . . . . . . . . . . . . . . . . . . . . . . . . . . . . . . . . . . . . . . . . . . . . . . . . . . . 374.1 M5XB2 . . . . . . . . . . . . . . . . . . . . . . . . . . . . . . . . . . . . . . . . . . . . . . . . . . . . . . . . . . . . . . . . . . . . . . . . . . . . . . . . . . . . . . . . . . . . 37
4.1.1 Magnetic structure of Fe5SiB2 . . . . . . . . . . . . . . . . . . . . . . . . . . . . . . . . . . . . . . . 374.1.2 Fe5SiB2 as a permanent magnet . . . . . . . . . . . . . . . . . . . . . . . . . . . . . . . . . . . . . 394.1.3 Phosphorus substitutions in Fe5SiB2 . . . . . . . . . . . . . . . . . . . . . . . . . . . . . . 404.1.4 Cobalt substitutions in Fe5PB2 . . . . . . . . . . . . . . . . . . . . . . . . . . . . . . . . . . . . . . . 43
4.2 AlM2B2 . . . . . . . . . . . . . . . . . . . . . . . . . . . . . . . . . . . . . . . . . . . . . . . . . . . . . . . . . . . . . . . . . . . . . . . . . . . . . . . . . . . . . . . . . . . 464.2.1 Crystalline structure of AlFe2B2 . . . . . . . . . . . . . . . . . . . . . . . . . . . . . . . . . . . . 46

4.2.2 Magnetocaloric properties of AlFe2B2 . . . . . . . . . . . . . . . . . . . . . . . . . . 464.2.3 Magnetic structure of AlFe2B2 . . . . . . . . . . . . . . . . . . . . . . . . . . . . . . . . . . . . . . . 484.2.4 Manganese substitutions . . . . . . . . . . . . . . . . . . . . . . . . . . . . . . . . . . . . . . . . . . . . . . . . . 52
4.3 Fe2P . . . . . . . . . . . . . . . . . . . . . . . . . . . . . . . . . . . . . . . . . . . . . . . . . . . . . . . . . . . . . . . . . . . . . . . . . . . . . . . . . . . . . . . . . . . . . . . . . 554.3.1 Characterisations of Fe2P . . . . . . . . . . . . . . . . . . . . . . . . . . . . . . . . . . . . . . . . . . . . . . . . 554.3.2 Magnetic diffraction . . . . . . . . . . . . . . . . . . . . . . . . . . . . . . . . . . . . . . . . . . . . . . . . . . . . . . . . 554.3.3 Inelastic neutron scattering . . . . . . . . . . . . . . . . . . . . . . . . . . . . . . . . . . . . . . . . . . . . . 57
5 Summary and conclusions . . . . . . . . . . . . . . . . . . . . . . . . . . . . . . . . . . . . . . . . . . . . . . . . . . . . . . . . . . . . . . . . . . . . . . . . 59
6 Sammanfattning på svenska . . . . . . . . . . . . . . . . . . . . . . . . . . . . . . . . . . . . . . . . . . . . . . . . . . . . . . . . . . . . . . . . . . . . . . 61
7 Acknowledgements . . . . . . . . . . . . . . . . . . . . . . . . . . . . . . . . . . . . . . . . . . . . . . . . . . . . . . . . . . . . . . . . . . . . . . . . . . . . . . . . . . . 64
Bibliography . . . . . . . . . . . . . . . . . . . . . . . . . . . . . . . . . . . . . . . . . . . . . . . . . . . . . . . . . . . . . . . . . . . . . . . . . . . . . . . . . . . . . . . . . . . . . . . . . . . . . 66
Abbreviations
A list of the abbreviations used in this thesis:
ΔSmag Magnetic entropy changeDFT Density functional theoryDTA Differential thermal analysisEDS Energy dispersive X-ray spectrometryEFG Electric field gradientFWHM Full width at half maximumH Magnetic field strengthHc Coercive fieldINS Inelastic neutron scatteringIR Irreducible representationsμB Bohr magnetonM MagnetisationMsat Saturation magnetisationMAE Magnetocrystalline anisotropy energyMC Monte CarloMCE Magnetocaloric effectMPMS Magnetic property measurement systemMS Mössbauer spectroscopyNPD Neutron powder diffractionPPMS Physical property measurement systemRA Representational analysisRT Room temperatureSEM Scanning electron microscopeSQUID Superconducting quantum interference deviceTC Curie temperatureVSM Vibrating sample magnetometerXRD X-ray diffraction


1. Introduction
”Not all those who wander are lost.”- J.R.R. Tolkien
Materials have been used, and their properties studied, throughout all exist-ence of mankind. A historic sign of this is the different ages of men, which arenamed after the typical preferred material. For example, stones were used astools at the Stone Age, bronze tools at the Bronze Age and iron at the Iron Age.Since the Bronze Age, when enough heat could be produced to melt copperand tin to form an alloy (∼2000 B.C.) [1], compounds and alloys have beenstudied more and more to improve people’s quality of life. More advancedalloys gave capability of new, more complex, ways of material fabrication.This has resulted in an exponential development of more complex alloys andcompounds until the advanced materials used today.
The materials studied within this thesis are all based on synthesis of inter-metallic compounds. Intermetallic compounds are compounds with metallicbonding and with different crystal structures than the respective crystal struc-tures of the original elements [2]. When mixing two elements the structuraland physical properties will be composition dependant. When examining alldifferent compositions in the alloy a phase diagram can be built. The phasediagram is then used to extract which crystal structures an alloy will have at acertain composition and temperature. To build up a complete phase diagram isa tedious and time consuming task to do experimentally, which is why compu-tational studies are mostly used for this today. Commonly, phase diagrams arebuilt for mixing two or three elements and are therefore referred to as binaryor ternary for two or three elements, respectively. In the binary phase diagramfor iron and silicon different intermetallic compounds (e.g. Fe3Si and Fe5Si3)can be found, all with different crystal structures than the ones for iron (bccat room temperature) and silicon (diamond type) [3]. Very often the physicalproperties for intermetallics differ from the starting elements and are thereforeinteresting to study. Some of the many interesting applications for intermetal-lic compounds include hydrogen storage, superconductivity, energy storage(e.g. batteries) and magnetism [4]. The origin of magnetism in intermetalliccompounds arises due to the magnetic moments of the metallic atoms, or ions,they contain.
15

1.1 Magnetic materialsMagnetism is an invisible force that since ancient times has fascinated andpuzzled mankind. For example, the discovery that needle shaped magnetic”stones” on a water film always points north was the birth of the compass inthe 11th century [5]. Today, many functions in daily life are based on magnets,often without recognition. Some examples include hard disk drives, electricmotors and generators [6]. The magnetic properties in a magnetic materialcomes from unpaired electrons that are rotating and thus inducing a magneticmoment [7]. The direction of the rotation of the electron will thus determinethe direction of the magnetic moment. The possibility of a direction of themagnetic moment lead to it being referred to as a magnetic spin. Adding sev-eral magnetic moments together in a structured way (e.g. in a crystalline struc-ture) gives possibilities of magnetic structures. If the magnetic moments areunaffected by each other, all pointing randomly in space, it is defined as para-magnetism. If the magnetic moments feel the presence of each other, calledcoupling, they can start to arrange themselves in different magnetic structures.If the magnetic moments orient themselves all in parallel, it is defined as fer-romagnetism and the compound is said to be ferromagnetic, figure 1.1 (a).The spins can also couple in anti-parallel with each other and the total mag-netisation will then be zero. This is called anti-ferromagnetism, figure 1.1 (b).A special case of anti-ferromagnetism is ferrimagnetism, which has the samecoupling mechanism as anti-ferromagnetism but non-equal magnitudes of themagnetic moments for the different directions, figure 1.1 (c), which in turngives the material a net-magnetisation. For the applications aimed at in thisthesis ferromagnetic materials are of most importance, however, ferrimagnet-ism can also be of importance.
Nothing is ever static over a period of time, atoms are constantly movingin a gas, and at least vibrating in a solid structure. The same goes for mag-
(a) (b) (c)
(d) (e)
Figure 1.1. General illustrations for magnetic coupling in two dimensions for ferro-magnetism (a), anti-ferromagnetism (b), ferrimagnetism (c), incommensurate magnet-ism (d) and frustrated magnetism (e).
16
netic spins. Independent of the strength of the magnetic coupling the spinswill always rotate and result in a fluctuating net magnetisation. Temperaturewill also affect the fluctuations of the magnetic moments. If a ferromagneticmaterial is heated, the magnetic moments will vibrate increasingly, until theydo not couple to each other at all. At this point the material will have lostits magnetic properties and become paramagnetic. The critical temperature ofthis transition is called the Curie temperature (TC). How quick this transitionis defines if the transition is said be first or second order. If it is a very sharptransition, almost a step function, it is defined as a first order transition. If it isa continuous transition when going through TC, the transition is of the secondorder.
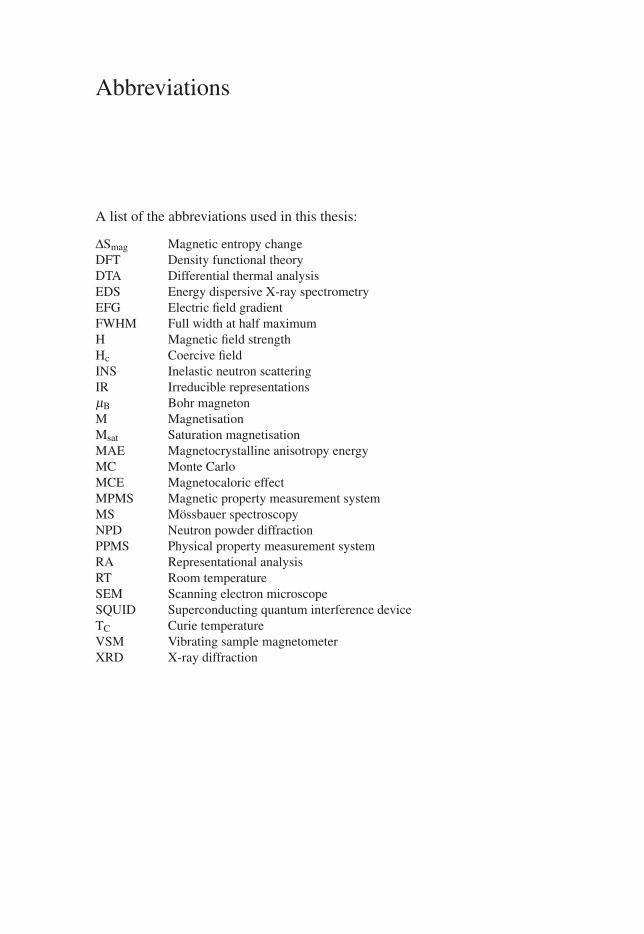
Ferromagnetic compounds are often divided in two categories; hard and softmagnets. The difference becomes apparent when the hysteresis loop, obtainedfrom plotting magnetisation as a function of applied magnetic field (appliedfrom an external source), is studied, figure 1.2. The hard magnet (red curve)has a broad hysteresis when sweeping the magnetic field, whereas the softmagnet (black curve) increases its magnetisation linearly up until the pointwhere the magnetisation is saturated (Msat). For a hard magnet, the demagnet-isation curve is sometimes presented on its own. This is a part of the magnet-isation curve between zero applied field and zero magnetisation at a negativeapplied field.
Today magnets are used in a large number of applications, not only to holdpostcards and notes on refrigerators. The main uses are in energy applica-tions, e.g. generators harvesting energy from wind or water, or in electricvehicles [8]. Soft magnets are used to enhance the magnetic properties of thehard magnets, and also for magnetic shielding in transformers and for mag-
Applied magnetic field
Magnetisation
Msat
Mr
Hc
Figure 1.2. Schematic magnetisation loops for hard magnets (red curve) and softmagnets (black curve).
17

netic cooling. This makes all magnetic materials important for efficient energyproduction and consumption [8].
1.1.1 Magnetostructural propertiesThe structures in the solid state can, in general terms, be either crystalline oramorphous. In both cases the nearest surrounding of an atom will be determ-ined by composition, chemical bonding and so on. This is often referred to as”short-range ordering” [9]. The difference between an amorphous and crys-talline material is the ”long-range ordering”, where the same local structuresrepeat themselves to, ideally, infinity. The repetitions in a crystalline materialmake it possible to describe the whole crystal with just a small part as the restis just repetitions, the small part is defined as the unit cell. The same structuralreasoning also applies to magnetic structures. Below the ordering temperaturein a crystalline magnetic compound the magnetic moments can have long-range order, and subsequently repetitions of the magnetic spins. In this waya magnetic unit cell can be formed and for the simplest cases (figure 1.1 (a)-(c)) the magnetic unit cell can coincide, or be related to an integer numberof the crystalline unit cell. For these simple cases the magnetic structure issaid to be commensurate. If the number of crystalline unit cells to describethe magnetic unit cell is not an integer, the structure is said to be incommen-surate. An example for an incommensurate magnetic structure is representedin figure 1.1 (d), where the magnetic moments follow a sinusoidal behaviour.Sometimes the magnetic coupling mechanisms can lead to frustration and dif-ferent magnetic structures can arise, in figure 1.1 (e) this is represented in twodimensions. In the description of a normal crystal, a space group is assignedwhich indicates what symmetry elements exist in the unit cell. From the spacegroup the whole unit cell can be constructed if having only a few atomic posi-tions from which the rest can be generated. The same, again, goes for magneticstructures, but the symmetry elements used for conventional space groups arenot valid to describe magnetic structures. Therefore Shubnikov groups (mag-netic space groups) exist so that magnetic structures can be described in anequivalent way [10].
When describing ferromagnetic structures there are certain directions in thecrystal that will be preferable (energetically) for the alignment of the magneticspins. This comes from the coupling mechanisms between the spinning elec-tron and the crystal electric field. For uniaxial structures this coupling resultsin that the magnetic moments are aligning preferably along the uniaxial axisor in the plane perpendicular to it. If the total magnetic energy for aligningthe magnetic moments is lowest along the uniaxial direction that direction iscalled an easy axis. If the energy is lowest for a direction perpendicular tothat axis that is defined as an easy plane. That there are certain directions in amagnetic structure with lower energy than others is a sign of magnetocrystal-
18

line anisotropy. The energy it would take to rotate a magnetic moment awayfrom an easy direction (which can be done with large enough external mag-netic fields) is defined as the magnetocrystalline anisotropy energy (MAE).In bulk samples, with no special shapes, the magnetocrystalline anisotropy iswhat gives coercivity. The coercivity is defined from the coercive field (Hc),which is the negative field required to demagnetise a hard magnet (figure 1.2).
1.1.2 Permanent magnetsTo reduce losses in electric motors, actuators and generators and thereforefurther a sustainable future society, development of better rare earth free per-manent magnets is a necessity [8]. When quantifying the performance of amagnetic material for permanent magnet applications the saturation magnet-isation and the coercivity are two of the most discussed properties. However,the property that really should be optimised is the energy product (BHmax) ofthe magnet [11]. BHmax is a value of how much energy a permanent magnetcan store. Here B is the magnetic flux density, i.e. the magnetisation that amagnet can give away for an area at a given distance from the magnet. Themagnetic flux density is related to the magnetisation (M) and magnetic fieldstrength (H) (figure 1.2) via
B = μ0(M+H) (1.1)
where μ0 is the magnetic constant. If a plot of B vs. H would be done, BHmaxwould be found as the area of the biggest possible rectangle that can be fittedin the demagnetisation curve. To really improve BHmax, the remanent magnet-isation (Mr), the magnetisation value at zero applied field after Msat, and thecoercivity, all need to be as large as possible. Since coercivity is dependenton the anisotropy in the material anisotropy is studied frequently. Anisotropyin general can come from several things. Thin films have a big directional an-isotropy due to one very short axis, the same goes for needle and disk shapedmaterials. In such materials the magnetic easy axis tends to be along the needleor out of plane from the disk. In a bulk material without any preferred shapethe magnetic moments more easily align themselves along an easy axis (mag-netocrystalline anisotropy). When the magnetocrystalline anisotropy is thedominant anisotropy form it can, for uniaxial materials, be expressed as:
Eanis = K1 cos2 θ +K2 cos4 θ (1.2)
where θ is the angle between the magnetisation and the easy axis of magnet-isation and K1 and K2 are anisotropic constants. Often K2 << K1 and the termK2 cos4 θ can therefore be disregarded. The anisotropy energy can be estim-ated from M vs. H curves with the law of approach to saturation, where K1 isoften expressed as the effective anisotropy constant (Keff) [12].
19

1.1.3 Magnetic refrigerationCooling devices, such as refrigerators or air conditioner units, consume lotsof energy to keep a constant temperature in their surroundings. If a magneticcooling device could be used instead the energy consumption could be loweredby 20-30% [13]. A magnetic cooling device exploits the magnetocaloric effect(MCE) [14] which means that the material will change its temperature underthe action of a magnetic field under adiabatic conditions. The temperaturechange upon magnetisation is reversible, meaning that the temperature changewill have opposite signs if a magnetic field is applied or removed. The MCEcan be quantified with two parameters, the magnetic entropy change (ΔSmag)and the adiabatic temperature change (ΔTad) [15]. ΔSmag is the entropy differ-ence for an isothermal field change when exposing the material to a change inmagnetic field (H) from an initial field Hi to a final magnetic field Hf (Hi < Hf).In the same way, ΔTad is the difference in temperature upon a magnetic fieldchange from Hi to Hf under adiabatic conditions.
Figure 1.3 shows the concept used in a magnetic cooling device. Initially(1) the magnetic moments are randomly oriented and the temperature is Ti.After applying a magnetic field the magnetic moments order (2) and the tem-perature in the material rises. After removal of the heat produced the materialis ordered and at Ti (3); removing the magnetic field will make the mater-ial disordered and cool down (4). The final step will take heat from insidethe refrigerator, which then in turn will cool down, heating the material andtherefore close the refrigeration cycle. To avoid energy losses throughout thecooling cycle, soft magnetic materials should be used. The discovery of thegiant magnetocaloric effect (GMCE) [16] was a trigger for the research intonew sustainable materials for magnetic cooling devices.
1 2
34
Expelled heat
Expelled heat
Heat load
(refridgerator)
Magnetic field off
Magnetic field on
Figure 1.3. Schematic view of the magnetic refrigeration cycle.
20

1.2 Studied materialsThe materials studied in this thesis are all intermetallic compounds made fromabundant and cheap elements. For all applications considered uniaxial crys-talline structures are beneficial, or at least structures with one unique axis thatis different from the others. Therefore, tetragonal or hexagonal systems arepreferred. However, orthorhombic structures with one unit cell axis that dif-fers significantly from the others will also satisfy the criteria. In the studiedsystems iron is the main magnetic element and the other elements are thereto provide appropriate atomic and magnetic structure and to tune the physicalproperties.
1.2.1 M5XB2M5XB2 (M = Mn, Fe, Co and X = P, Si) belongs to a tetragonal materialsystem that crystallises within the Cr5B3-type structure (space group I4/mcm)[17, 18] where the c-axis is almost the double length of the a-axis. The generalstructure is shown in figure 1.4 where the two different metal positions areclearly visible. The two different metallic positions in the crystal structure, one16-fold, 16l (M(1)), and one in a 4-fold, 4c (M(2)), will affect the magneticproperties individually, especially if substitutions can be made on either of thetwo sites. The X and B atoms occupy the 4a and 8h positions, respectively.
a b
c
Figure 1.4. The crystal structure of M5XB2 viewed along the a-direction. The differentatomic positions are represented with light brown, dark brown, teal and red for M(1),M(2), X and B, respectively.
21

In 1959 [17] studies of Fe5SiB2 had already been performed. It was foundthat the compound adopts the tetragonal structure described in figure 1.4 [17–19] with the unit cell parameters 5.5498 and 10.3324 Å for a and c, respect-ively. Later, it was found to be a suitable candidate for studies as a perman-ent magnet material due to its ferromagnetic behaviour below its high Curietemperature of 784 K [20, 21]. Low temperature Mössbauer spectroscopy in-vestigations also indicated that a spin-reorientation occurs at 140 K where themagnetisation falls from the c-axis to the ab-plane, when going down belowthe spin-reorientation temperature [22].
The sister compound of Fe5SiB2, Fe5PB2, was discovered at almost thesame time, is slightly smaller due to the size difference of silicon and phos-phorus [19]. Fe5PB2 is also ferromagnetic with TC ranging between 615 and639 K depending on the composition [23, 24], slightly lower than Fe5SiB2.Similar to Fe5SiB2, the magnetic moments were found to point along the tet-ragonal c-direction in Fe5PB2 [20] however, there was no spin reorientationat low temperatures. The composition dependency of TC comes from phos-phorus vacancies or a mixing between phosphorus and boron on the two sites.This was shown with Mössbauer spectroscopy where the peak due to Fe(1)gets split into two. The magnetocrystalline energy constant (K1) for Fe5PB2was studied with single crystals and was found to be 0.50 MJm−3 at 2 K [25],too low to give any coercivity suitable for permanent magnetic applications.
To increase the coercivity substitutions that alter the magnetic interactionscould be employed. Therefore, the effects have been studied, for the wholerange Fe5Si1-xPxB2 and (Fe1-xCox)5SiB2, by first principle calculations [26].Also, experimentally, partial substitutions (Fe4CoPB2, Fe4CoSiB2) [27] havebeen employed.
1.2.2 AlM2B2AlM2B2 (M = Cr, Mn, Fe) are compounds with an orthorhombic layered struc-ture (space group Cmmm) where slabs of M2B2 are alternated with sheetsof aluminium [28–30]. The layers are stacked along the b-direction in thecrystal structure, figure 1.5, which is more than double the length of the aand c axes (for AlFe2B2 it is 2.9233, 11.0337 and 2.8703 Å for a, b andc, respectively [30]), making the structure pseudo-uniaxial. When there isonly iron on the metal site it exhibits ferromagnetic behaviour with a Curietransition close to room temperature, ranging between 282 and 320 K [31–33]. It was also shown that the magnetic transition should be first order [34],making the compound an interesting candidate for magnetic refrigeration. Inaddition, substitutions on the metal site have been performed to study thechanges in magnetic properties. It has been found that for high amountsof manganese in Al(Fe1-xMnx)2B2, TC drops drastically, down to 43 K forAl(Fe0.4Mn0.6)2B2 [33]. Also substitutions with cobalt have been tested, even
22

a
b
c
Figure 1.5. The crystal structure of AlM2B2 represented with two unit cells viewedalong the c-direction. The different atomic positions are represented with white,brown, and red for Al, M and B, respectively.
though no ternary phase in the Al-Co-B phase diagram has been reported. Itwas found that TC decreases linearly with cobalt content down to 205 K forAl(Fe0.7Co0.3)2B2 [35].
The orthorhombic AlM2B2 structure could also be categorised within a big-ger class of materials, the MAB-phases [36]. Which has big similarities withthe more familiar MAX-phases where transition metal-carbides or nitrides arestacked between aluminium layers. The similarity becomes even more ap-parent when comparing the deformation mechanisms. When deformed, the(M2B2)-slabs in AlM2B2 slides over the Al-layers creating a visible delamina-tion (in an electron microscope) [37]. Also similar to the MAX-phases are thelow hardness values (10.4(3), 7.3(3) and 9.5(3) GPa for AlCr2B2, AlMn2B2and AlFe2B2, respectively [37]). These are significantly lower than the typicalvalues for metal borides (20-30 GPa) [38].
1.2.3 Fe2PFe2P crystallises in a hexagonal structure (P62m) with two iron and two phos-phorus sites, figure 1.6 [39]. The four atomic positions in the structure make ita real playground for chemists to tune the properties via substitutions. Severaldifferent substitutions have been performed to enhance the magnetic prop-erties, most of which have involved the substitution of iron for manganeseto increase the total magnetic moment, and substituting phosphorus with sil-
23

c
ba
Figure 1.6. The crystal structure of Fe2P with the different atomic positions represen-ted with light brown, dark brown, light purple and dark purple for Fe(1), Fe(2), P(1)and P(2), respectively.
icon or arsenic to enhance TC [40–44]. These substitutions were performedto make the compound more suitable for magnetic refrigeration applications,since pure Fe2P has a Curie temperature of 216 K [45], much too low forroom temperature applications. At TC, Fe2P undergoes a first order magnetictransition with a discontinuity in the unit cell parameters at the transition. Thediscontinuity is also observable with Mössbauer spectroscopy indicating thatthe local environment of the iron atoms is changing upon magnetisation [46].The magnetic moments of the iron atoms are oriented in the hexagonal c-direction [47] and polarized neutron diffraction experiments have shown thatthe magnetic moments are 0.92(2) and 1.70(2) μB for Fe(1) and Fe(2), respect-ively [48].
24

2. Scope of the thesis
”Do what you can, with what you have, where you are.”- Theodore Roosevelt
Motivation of the studiesTo understand the magnetic behaviour in a material it is a necessity to firstunderstand the structural properties. The structures (both atomic and mag-netic) will effect how the material behaves when exposed to external stimuli,e.g. magnetic fields. When examining materials for magnetic applications itis therefore of utmost importance to understand not only the macro and micro-structure, but also (and more importantly), the crystalline structure. Therefore,within this thesis, the links between structure and physical properties havebeen studied, whether it is the magnetic or crystalline structure that effects themagnetic or other, more macroscopic, physical properties (hardness, elasticityetc.).
For these reasons, the crystalline structures have been studied with X-raydiffraction and complementary studies with neutron diffraction have also beenperformed to investigate the magnetic structures. These analysed structureshave been linked to the magnetic properties which mainly have been studiedwith magnetometry. To achieve a deeper understanding of the results first prin-ciple calculations have been performed when necessary. Complementary tech-niques, such as Mössbauer spectroscopy and inelastic neutron scattering havealso been performed to get information that would be hard (or impossible) toget from other techniques.
The results from all studies have been evaluated in a perspective of the de-sired applications, that is permanent magnets or magnetic refrigeration, to seeif the material meets the criteria of these applications. However, full focus hasnot always been upon the applications since the basic scientific understandinghas always been highly regarded in the work included in this thesis.
Aim of the thesisThe applications studied within this thesis have been evaluated from a crystal-lographic perspective. I have focused on uniaxial structures made from cheapand abundant elements where iron have always been present. The main fo-cus and goal have always been if the physical properties can be improved bychanging the chemistry of the studied compounds. Therefore, answers for thequestions that arises have been investigated. Typical research questions canthen be formulated, like:
25

• How is the structure of a compound affected by chemical substitutions?• How will the magnetism change based on the changed chemistry?• What parameters are most important for a potential application?• Can given magnetic parameters be controlled by altering the chemistry?
By trying to answer such questions the focus is shifted away slightly from theintended application and more towards general science. Therefore, it becomesmore interesting to study the origin of the physical phenomena. For instance,why a material behaves the way it does under certain conditions (temperat-ure, mechanical pressure, magnetic changes). One example of this is studyingthe origin of the magnetocaloric effect, i.e. why does a material change itstemperature when being subjected to a magnetic field? When answering suchquestions the focus shifts to structure-magnetism relations. Relations that arevery important to be aware of if one desires to control the physical properties.
26

3. Methods
”I solemnly swear that I am up to no good.”- J.K. Rowling
3.1 SynthesisAll samples in this thesis were prepared with the high temperature synthesistechniques described below. However, a post annealing treatment step wasonly necessary for the samples discussed in papers IV and V. For the samplesin papers I and IV both natural boron as well as isotopically pure 11B wereused.
3.1.1 Arc meltingIn an arc furnace an electric arc is produced by a discharge involving a highvoltage/low current between two electrodes. The discharge causes gaseousatoms to ionise (a plasma carrying the current). Electrically conducting ma-terials can therefore be melted or rapidly sintered using this technique. Allsamples in papers I-VI in this thesis were (completely or partially) synthes-ised in an arc furnace, figure 3.1 (a), equipped with a tungsten rod (electrode1) and a water cooled copper plate (electrode 2) upon which the samples wereplaced. Argon gas was used as both a protective atmosphere and to producethe current carrying plasma. Upon synthesis the samples were melted andremelted five times and turned in between each melting to ensure maximumhomogeneity. To ensure that samples were free from oxygen contaminationsa titanium ”getter” was first melted for 5 minutes.
3.1.2 Drop synthesisFor highly volatile elements, such as phosphorus and manganese, arc meltingis not a good synthesis option due to the rapid evaporation of these elements.Therefore, the drop synthesis technique [49], figure 3.1 (b), was instead em-ployed in papers II, III, and VII. In this technique the non-volatile elements(e.g. iron) were placed in an alumina crucible and melted in an induction fur-nace. When the melt was stable small pieces of phosphorus were dropped intothe melt where they reacted instantaneously and the desired compound couldbe formed.
27

(a) (c)(b)
Figure 3.1. Schematic setup for the high temperature synthesis route used in the thesis,including arc melting (a), drop synthesis (b) and heat treatment of a pellet inside anevacuated silica ampoule inside a pit furnace (c).
3.1.3 Heat treatmentDue to the nature of the arc melting technique (which generates very hightemperatures and high cooling rates) heat treatment is often necessary to im-prove the crystallinity and phase homogeneity of the samples. Most samplesin this thesis were crushed, pressed into pellets and heat treated in evacuatedsilica ampoules, figure 3.1 (c). Some samples where heat treated as crushedpieces for better evaluation of mechanical properties. To evacuate the silicatubes an oil-vacuum pump was used, the duration of the pumping was at least30 minutes. Afterwards the tubes were sealed and placed in a pit furnace forthe heat treatment. After a sufficient time in the furnace the ampoules weretaken out and quenched in water.
3.1.4 Post annealing treatmentsFor the samples in papers IV and V and a post annealing treatment was ne-cessary to enhance the phase purity. This was done by etching the samplesin ∼6 mol/dm3 hydrochloric acid (HCl) for ten minutes. By doing this theamount of secondary phases in the samples could be reduced.
3.2 DiffractionX-ray diffraction (XRD) is one of the most commonly used techniques whenstudying condensed matter, especially crystalline materials. The diffractionphenomenon was discovered in 1912 [9] when X-rays were diffracted by adiamond crystal. The technique is based on waves that scatter elastically froma sample. If the sample is ordered in any way (long range or short range) con-structive and destructive interference will occur and give a recordable pattern,a diffraction pattern. The wavelength, λ , of the incoming wave should be well
28

defined and of the same length scale of the ordered objects to be studied. Dif-fraction is, however, not only a X-ray method. It also works with electrons orneutrons, if they are accelerated to suitable velocities (due to the particle/waveduality).
Diffraction conditionsA crystal can be completely described as a repetition in all dimensions of thesmallest unit that contains all of the crystals symmetry elements. This smallestunit is called the unit cell. The dimensions of the unit cell can be describedwith 6 parameters, 3 unit cell edges (a, b and c) and the angles between them(α , β and γ). If a transformation from direct space into reciprocal space isperformed the crystal structure will be transformed into a reciprocal lattice (aset of mathematical points). The reciprocal unit cell can be described with thereciprocal vectors (a∗, b∗ and c∗) where |a∗| = 1/a, |b∗| = 1/b and |c∗| = 1/c.The scattering that occurs inside the crystal can be described by waves thatscatter from the reciprocal lattice. Scattering of an incident wave can occurfrom any point in the reciprocal lattice and in all directions. However, toobtain constructive interference producing a Bragg peak the scattered wavemust hit a lattice point on the surface of a sphere (named the Ewald sphere)from the point of scattering where the radius hits the origin of the reciprocallattice. This is illustrated in two dimensions in figure 3.2 but is also valid inthree dimensions. The radius of the Ewald sphere is 1/λ and that is equal tothe length of both the incident beam (k0) as well as the scattered beam (k1),hence
|k0|= |k1|= 1/λ (3.1)
is valid. The angle and the length of the vector between k0 and k1 are 2θ andd∗
hkl (marked in red in figure 3.2) respectively. This infers that the distancebetween the origin and the diffracted lattice point is d∗
hkl in reciprocal space,which would correspond to dhkl in normal space (|d∗
hkl | = 1/dhkl). If normalvector addition is performed for k1 it is found that
k1 = k0 +d∗hkl (3.2)
which also gives
|k1|sinθ = |k0|sinθ =12|d∗
hkl | (3.3)
and with some rearrangement gives
2dhkl sinθ = λ (3.4)
which is well known as the Bragg equation, or Bragg’s law. If a fixed wavelengthexperiment is performed, the lattice points that intersects the Ewald sphere willshow up when the angle is scanned in a diffraction experiment. From equa-tion 3.4 the distance between the planes of lattice points can also be extracted,since
d∗hkl = ha∗+ kb∗+ lc∗ (3.5)
29

OriginIncidentbeam
Diffractedbeam
1/λ
k0
kf
2θ
d*
Figure 3.2. The basics of the diffraction phenomena with the circle giving a twodimensional cut of the Ewald sphere.
where h, k and l are integers indexing the lattice planes that the diffracted peakbelongs to.
Structure factorFrom equation 3.4 the lattice parameters can be determined but this does notshow where the atoms are located. For that the relative intensities in a diffrac-tion pattern needs to be taken into consideration. The intensity is proportionalto the scattering power of the atoms in the structure. The scattering power inthe crystal can be described with the structure form factor, Fhkl:
Fhkl =n
∑j=1
g jt j(
sinθhkl
λ
)f j(
sinθhkl
λ
)e2πi(hx j+ky j+lz j) (3.6)
where n is the total number of atoms; θhkl and λ are the angle and wavelengthrespectively; g j, t j
(sinθhkl
λ
)and f j
(sinθhkl
λ
)are the occupation, the displace-
ment and the atomic scattering factor for the jth atom while x j, y j and z j arethe fractional coordinates for the jth atom. The factor f j
(sinθhkl
λ
)is highly
dependent on the radiation used in the experiment.
X-rays vs. neutronsX-rays interact with the electrons of the atoms in a sample. An effect of this isthat the scattering power will be stronger the more electrons the atoms have,which can be seen in the upper part of figure 3.3. As a consequence, heavyelements will scatter stronger than light elements which makes it hard to crys-tallographically locate light elements (e.g. H, Li, B), especially in a structurecontaining heavy elements.
If neutrons are used instead of X-rays different results will be obtained.Since neutrons mainly interacts with the nuclei of the atoms and therefore
30

X-rays
Neutrons
H D OLi Al Si Mn Fe
Figure 3.3. The difference in elastic coherent cross section of X-rays (upper) andneutrons (lower). The green and red colours for neutron scattering correspond to thenegative and positive scattering lengths respectively.
are sensitive to isotopic differences (compare hydrogen and deuterium in fig-ure 3.3). Figure 3.3 also shows a that the scattering power for different nuc-lei appears more random for neutrons, and the scattering length can even benegative (due to a phase shift of the beam). This randomness is not only ob-served for the scattering cross section, but also for the absorption cross section,which can also be seen for different isotopes of the same element, for exampleboron. The isotope 10B has an absorption cross section value of 3835 barn(1 barn = 10−28 m2 = 100 fm2) compared to the 11B-isotopes absorption of0.0055 barn, making the absorption cross section value for natural boron (with20% 10B) 767 barn. An effect of this is that isotopically pure 11B is preferredwhen performing an experiment with neutrons. Another characteristic of neut-rons (except for them having no electronic charge) is their magnetic moment.Therefore they can interact with magnetic electrons in a sample and is an ex-cellent tool for mapping magnetic structures and effects in a sample.
3.3 Characterisation by diffraction techniques3.3.1 X-ray powder diffractionThe XRD experiments were performed with two different set-ups, one in-house and one synchrotron based. The in-house experiments were performedwith a Bruker D8 diffractometer equipped with a Lynx-eye position sensitivedetector (PSD, 4◦ opening) using CuKα1 radiation (λ = 1.540598 Å). Thisset-up also have the possibility to vary the temperature from 16 K to 300 K,making temperature dependent XRD experiments possible.
The synchrotron based experiments were performed at the I711 beamline[50] at the Max II synchrotron of the Max IV laboratory (Lund, Sweden). Thehigh resolution XRD-patterns were recorded in transmission mode, at 298 K,in 0.3 mm spinning capillaries, using a Newport diffractometer equipped witha Pilatus 100K area detector mounted 76.5 cm from the sample (λ = 0.9940 Å).
31

The detector was scanned continuously, from 5◦ to 125◦ in approx. 6-10 min,recording 62.5 images/◦ (step size 0.016◦ ) for each measurement. The true2θ position of each pixel was recalculated, yielding an average number of100000 pixels contributing to each 2θ value. Integration, applying no correc-tions for the tilt of the detector, provided FWHM values of 0.03-0.08◦ from 5to 125◦.
3.3.2 Neutron powder diffractionTo study magnetic structures neutron powder diffraction (NPD) experimentswere performed in double-walled, cylindrical, vanadium containers. This con-tainer shape was used to minimise absorption from boron in the sample.Diffraction patterns were recorded at the D1B instrument at ILL (Grenoble,France). A pyrolytic graphite monochromator (reflection 002) was used, giv-ing a wavelength of 2.52 Å.
3.3.3 Determination of lattice parametersLattice parameters can be determined from the peak positions of a diffractionpattern if the Bravais lattice is known. Determination of the lattice parametersis done via a least square fit of the expected peak positions (calculated withBragg’s law, equation 3.4) to the observed peaks. In this thesis, the programUnitCell [51] was used to precisely determine the lattice parameters.
3.3.4 Full pattern refinement using the Rietveld methodTo determine the contents of a unit cell of a structure that is at least partiallyknown a full pattern refinement can be used. This was first done in 1969by H. M. Rietveld [52], and hence this method is often called the Rietveldmethod. The method refines a calculated pattern to an experimental diffractionpattern by fitting the structural and profile parameters using the least squaremethod [53].
In agreement with Bragg’s law (equation 3.4) peaks should appear at givenpositions, however, that is not always the case. This is due to imperfectionsin the experimental set-up, such as sample displacement or absorption. Thismakes determination of background and instrumental parameters necessary inthe refinement process. The integrated peak intensities (Ihkl) are dependent ofFhkl (for a definition of Fhkl see equation 3.6) and a number of other parametersand are calculated as:
Ihkl = K phklLθ Pθ Aθ ThklEhkl |Fhkl |2 (3.7)
where K is a constant known as the scale factor that is proportional to theamount of the phase, measurement time and the flux of the incident radiation;
32

phkl is the multiplicity for the specific reflection; Lθ , Pθ and Aθ are multipliersthat correct for geometry, partial polarisation of the scattered electromagneticwave and absorption of both the incident and diffracted beam; Thkl is the pre-ferred orientation factor and Ehkl is an extinction multiplier (which is usuallynot important for small crystals.
The shape of the peaks are often described with a Voigt profile, a convolu-tion of a Gaussian and a Lorentzian function. Due to computational expensea pseudo-Voigt function is normally used which is a linear combination of theGaussian and the Lorentzian functions. The width of the peaks is defined athalf intensity of the peak, or the full width at half maximum (FWHM), and isdependent of θ according to:
FWHM =√
U tan2 θ +V tanθ +W (3.8)
where U , V and W are constants.As a reference to how good a refined pattern is compared to the experi-
mental diffraction pattern a number of agreement indices (or R values) areobtained in the refinement [54]. The weighted-profile R value, Rwp, is definedas:
Rwp =
{∑
iwi[yi(obs)− yi(calc)]2/∑
iwi[yi(obs)]2
}1/2
(3.9)
where yi(obs) and yi(calc) are the observed and calculated intensity at step iand wi is the weight. In an ideal Rietveld refinement the Rwp should approchthe statistically expected R value, Rexp:
Rexp =
[(N −P)/
N
∑i
wiyi(obs)2
]1/2
(3.10)
where N is the number of observations and P the number of refined parameters.Rexp is a value for the quality of the data and the ratio between Rexp and Rwpgives another goodness-of-fit parameter, χ2,
χ2 = Rwp/Rexp (3.11)
which should approach 1. However, this is not always the case, e.g. if the datahave been ”over-collected” (Rexp is very small) then χ2 will be much largerthan 1 even though the refinement is very good. In this thesis all structural(nuclear and magnetic) determination and phase analyses were done using theprogram FullProf [55].
3.3.5 Representational analysisDeterminations of magnetic structures can be very time consuming if done bytrial and error. If a systematic approach is applied, so that only magnetic struc-tures based on symmetry requirements are tested, the number of possibilities
33

can be reduced. This is done with representational analysis (RA) based on theLandau thermodynamic theory of second-order transitions [56] and involvesthe systematic decomposition of a magnetic representation Γ into irreduciblerepresentations (IR) of the space group. The number of magnetic structuresallowed by symmetry will be the number of all non-zero IR in the final de-composition of Γ. In this thesis the magnetic space groups in papers I, IV andVII were found with the program SARAh [57].
3.4 Inelastic neutron experimentsTo study dynamical effects (e.g. vibrations) in a sample diffraction techniquesis not a good tool, therefore spectroscopic methods are necessary. One spec-troscopy method, using neutrons, for identifying crystal as well as magneticvibrations is inelastic neutron scattering (INS). In INS a sample is placed ina neutron beam where the sample-neutron interaction is, as suggested by thename, inelastic. The incoming neutron can give or lose energy to the sample,and the energy gain or loss can be detected by measuring the neutrons flighttime from the sample to the detector. By doing this the intensity of scatteredneutrons can be measured both as a function of scattering angle and energy.Around zero energy (no interaction with the sample) the elastic line can beextracted (with the same characteristics as a ”normal” diffraction pattern), andat non-zero energies other phenomena can be recorded. In paper VII this wasdone to record the temperature dependence of the crystalline (phonons) andmagnetic (magnons) vibrations. These experiments were performed at the in-struments IN5 (ILL, Grenoble, France) and TOFTOF (MLZ, Hamburg, Ger-many) at different wavelengths to get different energy resolutions.
3.5 Magnetic characterisationsMagnetometry is a common method to determine the magnetic properties of asample. If a magnetic sample passes through a coil it will induce an elec-tric current that can be measured. This can be done with either a vibrat-ing sample magnetometer (VSM) or a superconducting quantum interferencedevice (SQUID). In the VSM the sample is vibrating inside an electromag-net which records a current proportional to the magnetic moment. A SQUIDmeasures the magnetic moments based on the quantisation of magnetic flux ina closed loop of superconducting materials using Josephson junctions. Whilea VSM is more easily available a SQUID has a benefit of higher probing fieldssince it is based on superconducting magnets. However, the SQUID has tobe cooled down using liquid Helium, making it more expensive and requiringmore care.
34

Since magnetisation (M) is dependent on both temperature (T) and appliedmagnetic field (H), M = f (H,T ), it is useful to measure M as a function ofH (T) at a constant T (H). From measurements versus temperature magneticordering temperatures, TC or other magnetic transitions, can be determined.For field dependent measurements properties like Msat, Mr and Hc can be ex-tracted directly from the magnetic hysteresis curve. Also anisotropy constantscan be estimated using the M vs. H curves. ΔSmag can also be calculatedfrom a number of M vs. H curves at different temperatures close to the Curietransition using
ΔSmag = μ0
Hf∫Hi
(∂M∂T
)H
dH (3.12)
based on the Maxwell relations. In this thesis magnetic measurements wereperformed with using a LakeShore 7400 VSM equipped with a high temper-ature option, a Quantum Design PPMS using the VSM option or a QuantumDesign MPMS SQUID magnetometer.
3.6 Mössbauer spectroscopyMössbauer spectroscopy (MS) is based on the recoil-free absorption and emis-sion of γ-rays from nuclei in solids [58]. When a γ-photon emitted from aγ-ray source hits a Mössbauer active nuclei in a solid it might be absorbed ifthe energy of the γ-photon is right. The nuclei then gets excited and can emita γ-photon of the same energy, since the position of the nuclei is locked in thesolid the recoil for sending out the γ-photon is taken up by the whole crystal.The reemitted γ-photon can then be detected to record a Mössbauer spectrum.One common nuclei for this is 57Fe, an isotope suitable although its low nat-ural abundance (2.2%). A γ-photon emitter with the right energy for 58Fe is57Co. Iron MS is a powerful technique since it is sensitive to the chemicalenvironment of the Fe-atoms. Different crystallographic environments givesdifferent peaks in the spectrum, and also, the local environments give splittingof the peaks (quadrupole splitting) to a doublet-peak. Also magnetic splittingcan occur if the Fe-atoms are magnetically ordered. This will be seen as asextet peak due to the hyperfine splitting. All these split peaks can be used toextract information about the local and magnetic environments in the sample[59]. In papers III, V and VII Mössbauer absorption spectra were obtainedwith a spectrometer equipped with a constant acceleration type vibrator and a57CoRh γ-ray source.
35

3.7 Electronic structure calculationsTo further try to understand solid magnetic systems theoretical modelling is agood tool. This is performed by solving the Schrödinger equation for the sys-tem. However, since exact solutions for is not available for systems with morethan one electron models for the Hamiltonian are necessary. Density func-tional theory (DFT) provides a way to model large systems computationallyby replacing the complex wavefunctions with electron densities and therebyreducing the computational complexity of the calculations. The electronicand magnetic properties in this thesis (papers II-IV) were modelled with DFTcalculations in the generalized gradient approximation (GGA) [60] using thespin polarised relativistic Korringa-Kohn-Rostoker (SPR-KKR) method [61].Curie temperatures were also estimated with theoretical calculations usingMonte Carlo (MC) simulations [62] (papers II and III). To calculate theoret-ical phonon spectra in paper VII, first principles calculation using the projectoraugmented wave method as implemented in the Vienna Ab initio SimulationPackage (VASP) have been performed [63].
36

4. Results and discussion
”If you can’t explain it to a six year old, you don’t understand it yourself.”- Albert Einstein
4.1 M5XB2The tetragonal compounds M5XB2 (M = Mn, Fe, Co and X = P, Si) wereinvestigated as starting point for new potential permanent magnet materials.This tetragonal, and therefore uniaxial, structure, figure 1.4, with its two metalpositions, is an interesting system with respect to high Curie temperatures andferromagnetic behaviour for high iron concentrations.
4.1.1 Magnetic structure of Fe5SiB2The first material to be synthesised in the M5XB2 system was Fe5SiB2. Itwas chosen for its high TC and large magnetisation. Therefore this was thesubject of study in paper I. Since earlier Mössbauer studies had indicated aspin reorientation at low temperatures [22] two samples were synthesised, onewith boron with extremely high chemical purity and one with isotopically pure11B. In both cases arc melting followed by prolonged heat treatments wereused for the synthesis, figure 3.1. Synthesis of the 11B sample was done be-cause of the high neutron absorption in 10B and could therefore be used forneutron diffraction experiments. The two high resolution XRD patterns forthe two samples, figure 4.1, reveal that the desired main phase is obtained forboth samples. There is, however, a secondary phase in both samples. Thesample with natural boron contains Fe3Si (<2%) and the 11B sample containsFe4.7Si2B (∼5%). The wight percents of the secondary phases come from theRietveld refinements.
When examining the magnetic behaviour as a function of temperature, fig-ure 4.2, it was found that the Curie temperature was indeed as high as inprevious studies [20, 21] with a value of 760 K. Also, as seen earlier withMössbauer spectroscopy [22], a strange magnetic behaviour was observed atlow temperatures. In figure 4.2 this can be seen as a kink in the magnetisa-tion curve centred around 172 K. With low temperature XRD no structuraltransition could be observed, except for the expected shrinking of the unit cellupon cooling, and hence, the transition observed from magnetometry can beconcluded to be a pure magnetic reordering.
37

(a) (b)
Figure 4.1. Powder XRD patterns of for two samples of Fe5SiB2, one with naturalboron (a) and one with isotopically pure 11B (b), refined with the Rietveld method.Black dots, red and blue lines, and black bars correspond to the observed, calculatedpattern, differences between observed and calculated data and the theoretical Braggpeak positions, respectively. λ = 0.9940 Å.
Figure 4.2. Fe5Si11B2 low field susceptibility χ = M/H vs. T, H = 40 kA/m. The insetshows a detailed view of χ at TC.
To study the reordering of the magnetic structure, neutron powder diffrac-tion was performed on the Fe5Si11B2 sample. This was done continuouslyfrom 16 K up to 500 K, with longer measurements for specific temperatures.The diffractions patterns collected at 16 K and 300 K are shown in figure 4.3.The differences between the temperatures only becomes apparent when look-ing at specific reflections, as is shown on the right in figure 4.3. The refine-ments on the left of figure were performed with different models for the mag-netic structure based on the irreducible representation analysis, and the bestfit was obtained for the models in figure 4.4. There at 300 K, the magneticmoments are 1.72(5) and 2.06(7) μB for the Fe(1) and Fe(2) positions, re-spectively, aligned along the crystallographic c-axis. For 16 K, a rotation ofthe magnetic spins have occurred resulting in moments aligned along the a-axis of the unit cell with moment sizes of 2.10(4) and 2.31(6) μB for Fe(1) and
38

Fe(2). This spin flip is well in agreement with what was earlier observed withMössbauer spectroscopy [22].
20 40 60 80 100 120
Yobs
Ycalc
Ycalc-Yobs
Bragg reflections
300 K
Intensity
(arb.units)
2-theta (deg)
Yobs
Ycalc
Ycalc-Yobs
Bragg reflections
16 K
Norm
aliz
ed in
tens
ity
(arb
.u.)
0
5
10
15
20
Diffraction angle 2θ ( ° )58 60 62 64 66 68 70 72 74
16K Yobs16K Ycalc 16K magnetic300K Yobs300K Ycalc 300K magnetic
004
114
202
211
Figure 4.3. Neutron powder diffraction patterns of Fe5Si11B2. Patterns refined withthe Rietveld method at 300 K (upper) and 16 K (lower) in the left part of the figure.The right part of the figure shows an enlargement of the strongest magnetic reflectionsrevealing the magnetic transition. λ = 2.52 Å.
Figure 4.4. Magnetic structures for Fe5SiB2 at 300 K (left) and 16 K (right). Thelength of the arrows corresponds to the size of the magnetic moments.
4.1.2 Fe5SiB2 as a permanent magnetApart from a high Curie temperature, a square hysteresis loop in magnetisa-tion as a function of applied magnetic field is ideal for a permanent magnet, asstated in figure 1.2. Therefore that behaviour was evaluated for Fe5SiB2, withthe magnetisation curves summarised in figure 4.5. There it can be seen thatthe curves are far from square shaped, with no measurable coercivity, givingthe material very soft magnetic behaviour. However, the maximum magnetisa-tion is fairly high (1.10 MA/m at 10 K) and with calculated magnetic moments
39

Figure 4.5. M vs. H curves for all samples, Fe5SiB2 at 10 K (solid black line) and300 K (solid red line); Fe5Si11B2 at 10 K (dashed black line) and 300 K (dashed redline).
corresponding well with the model from neutron diffraction (1.87 and 2.14 μBfor models of Msat and NPD, respectively).
Low coercivity in a material can be explained with a number of parameters.For example, particles that are too large, the shape of the particles and mag-netocrystalline anisotropy (MAE) that is too low, among other things [11]. Totry to explain this the magnitude of the anisotropy was estimated with the lawof approach to saturation [12] based on the magnetisation curve when it isapproaching saturation. A fit is then made to the expression
MMsat
=
(1− b
H2
)(4.1)
where b is a fitting parameter that includes the magnetocrystalline anisotropyenergy constant (K1), more details on these calculations can be found in pa-per I. The values of K1 by this estimation are very low (∼0.3 MJm−3) whichexplains the non-existing coercivity in the magnetic measurements makingthe sample less suitable for permanent magnetic materials. However, the dif-ference in magnitude of the magnetocrystalline anisotropy energy constant atdifferent temperatures supports the observed spin rotation, figure 4.4, since arotation would result in change of the sign of MAE and would be observableas K1 becoming zero before taking a new value.
4.1.3 Phosphorus substitutions in Fe5SiB2To enhance the low coercivity in Fe5SiB2 first principle calculations suggestthat the MAE can be increased with phosphorus substitutions [26]. Therefore,samples throughout the whole compositional range in Fe5Si1-xPxB2 were syn-thesised with steps of x = 0.1, and studied in paper II. In figure 4.6 it is shownthat the samples crystallise within the desired phase and that the mixing of
40

30 40 50 60 70 80 90 30 40 50 60 70 80 90
30 40 50 60 70 80 90 0.0 0.2 0.4 0.6 0.8 1.0
5.50
5.52
5.54
5.56
10.34
10.36
(b)
Intensity
(arb.units)
2-theta (deg)
Yobs
Ycalc
Ycalc-Yobs
Bragg reflections
(a)
Intensity
(arb.units)
2-theta (deg)
Yobs
Ycalc
Ycalc-Yobs
Bragg reflections
(d)(c)
Intensity
(arb.units)
2-theta (deg)
Yobs
Ycalc
Ycalc-Yobs
Bragg reflections
Unitcellparam
eter(Å)
Phosphorus content
cc (Werwinski (2016))aa (Werwinski (2016))
Figure 4.6. Refined XRD patterns of the samples (a) Fe5SiB2, (b) Fe5Si0.5P0.5B2and (c) Fe5PB2, with the refined unit cell parameters for the whole range (d). Thesecondary phase is Fe3Si in (a) and (b) and Fe2P in (c). λ = 1.540598 Å.
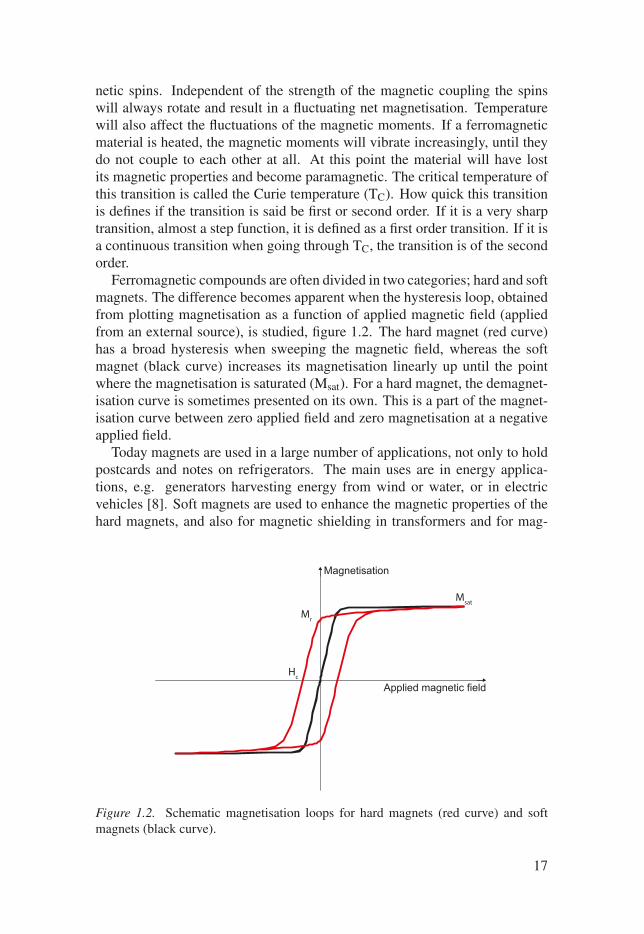
the sites is possible, as shown for the refinement of the Fe5Si0.5P0.5B2 samplein figure 4.6. Further evidence of successful chemical substitution is the lin-ear decreased of the a-axis and minimal change of the c-axis throughout thesample series. The decrease of the a-axis is linear throughout the sample seriesand that the c-axis is not changing much also indicates that the substitutionsreally take place. Also, the unit cell parameters correspond rather well with thetheoretically predicted values from DFT calculations. When considering themelting temperatures extracted from the differential thermal analysis (DTA)data, figure 4.7, it becomes more clear that the substitutional effect is real.This is because the melting temperature of Fe5Si0.5P0.5B2 is in between thoseof Fe5SiB2 (lowest) and Fe5PB2 (highest).
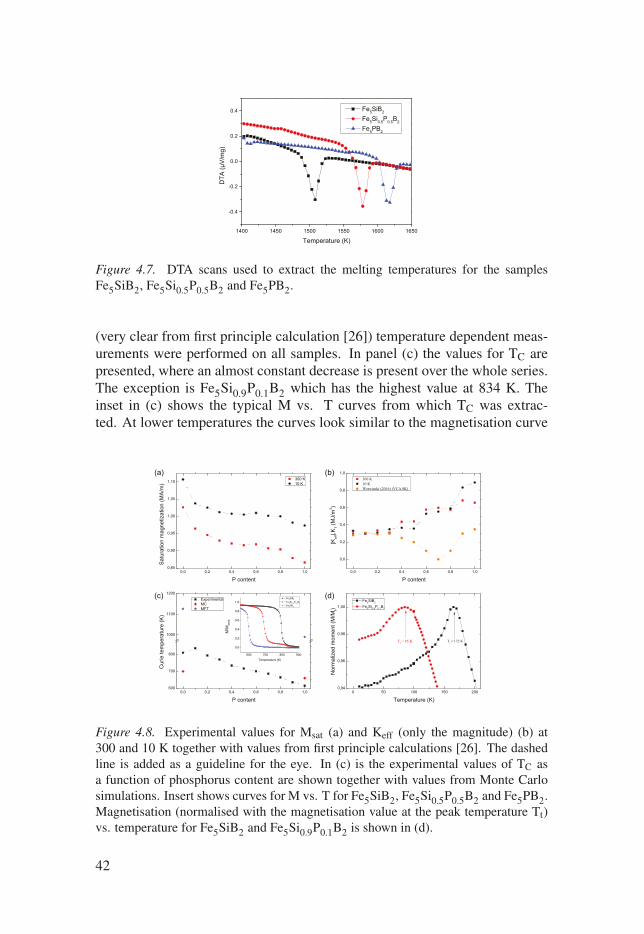
In figure 4.8 all the changes in the magnetic properties due to the phos-phorus substitutions are summarised. In panel (a) it is shown that the values ofthe saturated magnetic moments continuously decrease with addition of phos-phorus both at RT and 10 K. This is in agreement with previously reported res-ults [25, 27]. The more interesting property with the application of permanentmagnets is the MAE, which is shown in panel (b) with the presented valuesof Keff. When comparing these values with the previous results [25, 26] thereis a slight difference, however, this difference is not unreasonably big sincethe law of approach to saturation only estimates the value of K1. The mainissue is that the values are too low overall for any practical use in perman-ent magnet applications. Since there exists a zero crossing in the K1 values
41
1400 1450 1500 1550 1600 1650
-0.4
-0.2
0.0
0.2
0.4
DTA
(μV/mg)
Temperature (K)
Fe5SiB2
Fe5Si0.5P0.5B2
Fe5PB2
Figure 4.7. DTA scans used to extract the melting temperatures for the samplesFe5SiB2, Fe5Si0.5P0.5B2 and Fe5PB2.
(very clear from first principle calculation [26]) temperature dependent meas-urements were performed on all samples. In panel (c) the values for TC arepresented, where an almost constant decrease is present over the whole series.The exception is Fe5Si0.9P0.1B2 which has the highest value at 834 K. Theinset in (c) shows the typical M vs. T curves from which TC was extrac-ted. At lower temperatures the curves look similar to the magnetisation curve
0,0 0,2 0,4 0,6 0,8 1,00,85
0,90
0,95
1,00
1,05
1,10
0,0 0,2 0,4 0,6 0,8 1,0
0,0
0,2
0,4
0,6
0,8
1,0
0,0 0,2 0,4 0,6 0,8 1,0600
700
800
1000
1100
1200
600 700 800 900
0,0
0,2
0,4
0,6
0,8
1,0
0 50 100 150 2000,94
0,96
0,98
1,00
300 K10 K
Saturationmagnetization(MA/m)
P content
(a)300 K10 KWerwinski (2016) (VCA 0K)
|Keff|,K 1
(MJ/m
3 )
P content
(d)
(b)
ExperimentalMCMFT
Curietemperature(K)
P content
M/M
300K
Temperature (K)
Fe5SiB2
Fe5Si0.5P0.5B2
Fe5PB2
(c)
Normalized
mom
ent(M/M
t)
Temperature (K)
Fe5SiB2
Fe5Si0.9P0.1B2
Tt = 172 KTt = 85 K
Figure 4.8. Experimental values for Msat (a) and Keff (only the magnitude) (b) at300 and 10 K together with values from first principle calculations [26]. The dashedline is added as a guideline for the eye. In (c) is the experimental values of TC asa function of phosphorus content are shown together with values from Monte Carlosimulations. Insert shows curves for M vs. T for Fe5SiB2, Fe5Si0.5P0.5B2 and Fe5PB2.Magnetisation (normalised with the magnetisation value at the peak temperature Tt)vs. temperature for Fe5SiB2 and Fe5Si0.9P0.1B2 is shown in (d).
42

for Fe5SiB2 (figure 4.2), however, when increasing the phosphorus content thespin reorientation temperature (Tt) is lowered and for Fe5Si0.8P0.2B2 the trans-ition is very broad in the interval of 4-10 K. These curves are shown in panel(d) of figure 4.8 for the samples Fe5SiB2 and Fe5Si0.9P0.9B2. The result of sub-stituting phosphorus for silicon is then that phosphorus prohibits the magneticspin reorientation and promotes easy-axis behaviour at all temperatures.
4.1.4 Cobalt substitutions in Fe5PB2Since first principle calculations also predicted an increase of the MAE withCo-substitutions in Fe5SiB2 [26] this was considered for an experimental study.However, when looking at the ternary phase diagram for Co-Si-B, the de-sired composition (Co5SiB2) is missing [64], and hence all synthesis attemptswere unsuccessful. However, Co-substitutions into the Fe5PB2 analogue werepossible. These were carried out in paper III. As shown in figure 4.9, thiswas at least partially successful for a substitution concentration up to 70%.All samples above (Fe0.3Co0.7)5PB2 decomposed to other crystalline phases.Evidence for chemical substitution is provided by the continuous decrease ofthe unit cell volume with increasing amount of cobalt. A unit cell decrease isreasonable since the cobalt atom is slightly smaller than iron. It is noteworthythat the a-axis is responsible for almost all the change in the unit cell volumesince the c-axis is almost constant with increased substitution.
The existence of two crystallographic unique metal positions in M5XB2creates a possibility for preferred site occupancy when performing cobalt sub-stitutions. The isotopic sensitivity of Mössbauer spectroscopy makes the tech-nique ideal for this analysis since the recorded signals are only coming fromiron. Since the spectral intensities from the two iron positions should be com-pared in this analysis MS was performed in the paramagnetic regime. Thereason is only that the comparison is easier to perform from doublets then thesextets magnetic splitting would give. It was observed that the spectral intens-ities start to deviate from the values found for Fe5PB2 when increasing thecobalt content (x ≥ 0.4). The lowering is found on the M(2)-site which corres-ponds to higher occupancy of cobalt there compared to the M(1)-position.
The magnetic properties are expected to change as well with cobalt sub-stitutions in Fe5PB2. The dramatic change for the saturated magnetisation in(Fe1-xCox)5PB2 (0 ≤ x ≤ 0.7) is shown in figure 4.11 (a), where the sampleswith x ≥ 0.6 exhibit paramagnetic behaviour at 300 K. For the dataset meas-ured at 3 K, Msat decreases continuously for an increased amount of cobalt.This can be somewhat explained by the lower magnetic moment that cobaltcarries due to fewer unpaired electrons. However, the effect would not beas high as ∼ 0.6 MA/m for a cobalt content of 70%. It therefore must alsoarise from coupling between the orbitals for the d-electrons in iron and co-balt which, in this system, might not favour strong ferromagnetic interactions.
43

30 40 50 60
���
••
Intensity
(arb.units)
2-theta (°)
(Fe0.3Co0.7)5PB2
(Fe0.4Co0.6)5PB2
(Fe0.5Co0.5)5PB2
(Fe0.6Co0.4)5PB2
(Fe0.7Co0.3)5PB2
(Fe0.8Co0.2)5PB2
(Fe0.9Co0.1)5PB2
Fe5PB2
•
• • •
� � �
� � �
� � �
� � �
� � �
§§§§§
§§§§§
§§§§§
§§§§§
Figure 4.9. XRD patterns for (Fe1-xCox)5PB2 for x = 0 (bottom) to 0.7 (top) in stepsof 0.1. Tick marks indicate the Bragg positions for Fe5PB2. The peaks beloning tothe secondary phases are marked with • (Fe2P), † (Fe3P0.64B0.36) and § (Co2P). λ =1.540598 Å.
Preferred site occupancy might also contribute, and thus, for a random site oc-cupation, the magnetic interactions might become different. DFT calculationsof the magnetic moments for each metal site show high magnetic values forFe5PB2 which decrease to essentially zero in Co5PB2. For the intermediatecompounds the first principle calculation models and the experimental valuesare in excellent agreement. The DFT calculations thus strengthen the argu-ment that strong ferromagnetism in this system might be improbable whensubstituting iron with cobalt.
The Curie temperature, figure 4.11 (b), changes drastically with cobalt sub-stitutions in this system. As for Msat, TC decreases with increasing cobaltcontent, from 620 K (Fe5PB2) to 107 K ((Fe0.3Co0.7)5PB2). The loweringof TC is also supported by the first principle calculations which qualitativelyindicates the same trend.
The lowering of both Msat and TC with increasing cobalt content are notvery favourable for the application that was considered (permanent magnets).
44

0.95
1.00
0.95
1.00
0.95
1.00
0.95
1.00
0.95
1.00
0.95
1.00
-2 0 2
0.95
1.00
Relativeabsorption
x=0.1580 K
524 K
437 K
402 K
298 K
298 K
298 K
x=0.2
x=0.3
x=0.4
x=0.5
x=0.6
Velocity (mm/s)
x=0.7
Figure 4.10. Mössbauer spectra of (Fe1-xCox)5PB2 in the paramagnetic state. Indi-vidual patterns emanating from Fe(1) and Fe(2) in blue and green respectively, andthe summed envelopes are shown in red. Patterns due to secondary phases are shownin orange.
0.0 0.2 0.4 0.6 0.80.0
0.2
0.4
0.6
0.8
1.0
0.0 0.2 0.4 0.6 0.8100
200
300
400
500
600
700(b)
Saturationmagnetization(MA/m)
Cobalt content
3 K300 K
Paramagnetic at 300 K
(a)
Curietemperature
(K)
Cobalt content
Figure 4.11. Msat at 3 and 300 K (a) and TC (H = 0.01 T) (b) for (Fe1-xCox)5PB2(0 ≤ x ≤ 0.7). Lines are intended as guides to the eye.
45

However, the tuneability of the Curie temperature is a big benefit for the otherapplication discussed in this thesis (magnetic cooling). And since the mag-netocaloric effect is largest close to TC [65], a compound with a Curie tem-perature around 300 K would be interesting to study further. When examiningfigure 4.11, there should be a composition close to (Fe0.45Co0.55)5PB2 thatfulfils this requirement. However, the real usage of this compound as a mag-netic coolant might be limited by the low magnetisation at high cobalt con-tents. Nevertheless, this might be an interesting start to find new materialsfor magnetocalorics, if the magnetisation can be boosted by further chemicalsubstitutions.
4.2 AlM2B2The compound class AlM2B2 (M = Cr, Mn, Fe), figure 1.5, is pseudo-uniaxial,even though it is orthorhombic, because of the dominant b-axis of the unitcell. With iron as the only metal it has been found to have properties suit-able for magnetic refrigeration applications [31–34], which were the startingpoint for the investigations of the compound. The possibility of substitutionsare intriguing for studies, especially when performed on the metal site in thestructure.
4.2.1 Crystalline structure of AlFe2B2In accordance with previous results [30] AlFe2B2 was found to crystallisewithin the space group Cmmm with the unit cell parameters a = 2.9256(4) Å,b = 11.0247(4) Å and c = 2.8709(2) Å. XRD experiments in reflection modefound that the powder is highly textured, figure 4.12. The texture shows up inthe diffraction pattern with extra intensities in the (0 k 0) reflections comparedto a non-textured sample. It is indicated from the Rietveld refinements thatthe particles are shaped like platelets which can be explained from the particlegrowth. That is, since it is a layered structure, it is more energy efficient for aparticle to grow in the direction of the plane, instead of stacking new crystalplanes on top of existing ones. Therefore the preferred growth is in the ac-plane, which also explains the extra scattering from the (0 k 0) directions inthe diffraction experiment.
4.2.2 Magnetocaloric properties of AlFe2B2The discrepancies in the reports of the magnetic properties for AlFe2B2 (e.g.TC ranging from 282 to 320 K [31–33]) provided motivation for the thoroughexamination in paper IV. From the derivative of the low field magnetisationvs. temperature measurement in figure 4.13, TC was estimated to be 285 K.
46

20 30 40 50 60 70 80 90
Yobs
Ycalc
Ycalc-Yobs
Bragg reflections
080
060
040
32 33
2-theta (deg)
Intensity
(arb.units)
2-theta (deg)
040
Figure 4.12. XRD pattern and refinements with the Rietveld method of AlFe2B2shown in the upper part of the figure. The texture in the sample is visualised bycomparing the observed XRD intensities for the sample (black dots) and the calcu-lated powder pattern without texture (red line) in the lower part of the figure, the insetshows an enlargement of the 040-peak. λ = 1.540598 Å.
This temperature is close to the values reported previously [31–33] but a littlelow to be optimal for magnetic refrigeration purposes. The saturated magneticmoment at 10 K was estimated to 0.9 μB/Fe-atom, which corresponds wellwith the results from first principle calculations (1.1 μB). In figure 4.14 (a) anumber of magnetisation curves as a function of field are presented at differenttemperatures close to the magnetic transition. Using the Maxwell relationsthe magnetisation curves were used to calculate the magnetic entropy change(ΔSmag) at different magnetic fields. In figure 4.14 (c) the ΔSmag curves arepresented for the field change of 0 → 800 kA/m (0 → 2 T) and 0 → 4000 kA/m(0 → 5 T). The maximum magnetic entropy change occurs around 285 K(= TC) and yields the values -1.3 and -4.5 J/kg K, respectively, for the twotransitions. The values for ΔSmag are, however, around an order of magnitudelower than for the best magnetocaloric materials studied today with ΔSmag ≈15-30 J/kg K for a 0 to 2 T field change [66].
The measurements in figure 4.13 were performed at two different fields (4and 800 kA/m) using both field cooled cooling (FCC) and field cooled warm-ing (FCW) protocols to determine if any hysteresis would be obtained. Tem-perature hysteresis would be a clear sign of the first order magnetic transitionthat has been reported previously for this system [34]. Another sign of a firstorder magnetic transition is a big shift in the unit cell parameters at TC. There-fore, temperature dependant XRD measurements were performed with focuson the evaluation of unit cell parameters, figure 4.15. The cell parameters varysmoothly with temperature, and especially so at TC, which indicates that itis not a first order magnetic transition. Another measure of the order of this
47

T (K)270 280 290 300
dM/d
T
x 10-3
-3
-2
-1
0
T (K)270 280 290 300
dM/d
T
-0.02
-0.01
0
a b
Figure 4.13. FCC and FCW magnetisation as a function of temperature using a fieldof (a) 4 kA/m and (b) 800 kA/m. The insets show the temperature derivative of theFCC magnetisation.
H/M (kg/m3)0 200 000 400 000
M2 (A
2 m4 /k
g2 )
0
500
1000
1500a b c260 K
305 K
Figure 4.14. (a) Magnetisation as a function of magnetic field at temperatures between260 and 305 K (steps of 2.5 K). (b) An Arrot plot of the data shown in (a). (c) ΔSmagas function of temperature estimated using the data shown in (a) for a field change of0 → 800 kA/m and 0 → 4000 kA/m.
0 50 100 150 200 250 30092.35
92.40
92.45
92.50
92.55
92.60
92.65
0 50 100 150 200 250 3002.870
2.875
2.880
2.915
2.920
2.925 abc
Temperature (K)
Unitcellparam
eter(Å)
10.985
10.990
10.995
11.000
11.005
11.010
11.015
11.020
11.025
11.030
Unitcellparam
eter(Å)
Unitcellvolum
e(Å
3 )
Temperature (K)
V
Figure 4.15. The development of the unit cell parameters (left) and unit cell volume(right) as a function of temperature. The vertical dashed line marks TC.
transition is an Arrot plot (figure 4.14 (b)) was made from the magnetisationcurves in (a). The positive slopes in the Arrot plot is also a clear sign that itis a second order magnetic transition for AlFe2B2. Therefore, AlFe2B2 doesindeed undergo a second order transition, which sadly, is not ideal for the ap-plication. it does however explain the low ΔSmag value.
4.2.3 Magnetic structure of AlFe2B2Neutron modelIn paper IV the magnetic structure of AlFe2B2 was studied with the use ofneutron diffraction. The neutron diffraction powder pattern, figure 4.16, showed
48

20 40 60 80 100 120
Yobs
Ycalc
Ycalc-Yobs
Bragg reflections
320 K
Intensity
(arb.units)
2-theta (deg.)
Yobs
Ycalc
Ycalc-Yobs
Bragg reflections
20 K
Figure 4.16. Neutron powder diffraction patterns of AlFe112B2 refined with the Ri-
etveld method at 320 K (upper) and 20 K (lower). The black bars indicate the posi-tions of the Bragg reflections for the phases AlFe11
2B2 (upper) and B (lower); at 20 Kblack bars for the magnetic phase are also included. Gaps in the patterns are regionsthat were excluded during the refinements. λ = 2.52 Å.
that the sample contains additional phases that could not be identified with X-rays. The most significant secondary phase (∼5%) was identified as tetragonalboron (a = 8.917(2) Å, c = 5.025(7) Å, with the space group P4n2 [67]). An-other unidentified phase could also be found and indexed using a orthorhombicunit cell (a = 17.081(7) Å, b = 11.354(8) Å, c = 2.288(1) Å, space groupPnma). However, this phase could not be identified even though all reportedphases in the Al-Fe-B system were tested, as well as their oxides, hydroxidesand chlorides. Although, for the purpose of solving the magnetic structure,this was not found to be to problematic, since the only difference between thenon-magnetic and magnetic diffraction patterns was observed at the nuclearpeak positions for AlFe2B2.
In figure 4.17 the difference curves are shown for the diffraction patternsat 320 and 20 K (a), as well as a comparison of all tested symmetry allowed
(a) (b)
Figure 4.17. Difference curve for the temperatures 320 K and 20 K, the 20 K data-set has been shifted by -0.2◦ to compensate for thermal expansion effects (a) and acomparison of the refinements for the different magnetic models (b). λ = 2.52 Å.
49
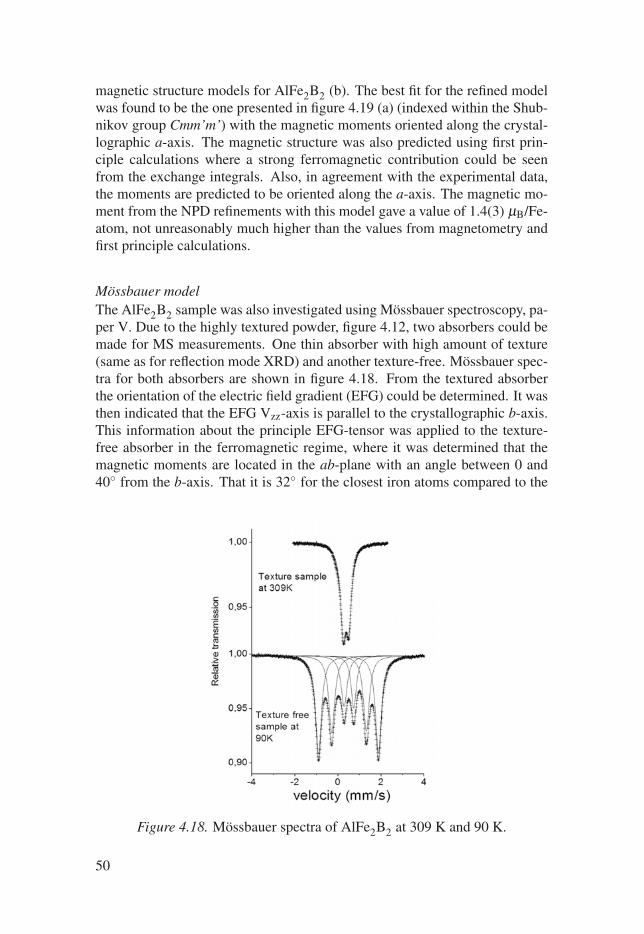
magnetic structure models for AlFe2B2 (b). The best fit for the refined modelwas found to be the one presented in figure 4.19 (a) (indexed within the Shub-nikov group Cmm’m’) with the magnetic moments oriented along the crystal-lographic a-axis. The magnetic structure was also predicted using first prin-ciple calculations where a strong ferromagnetic contribution could be seenfrom the exchange integrals. Also, in agreement with the experimental data,the moments are predicted to be oriented along the a-axis. The magnetic mo-ment from the NPD refinements with this model gave a value of 1.4(3) μB/Fe-atom, not unreasonably much higher than the values from magnetometry andfirst principle calculations.
Mössbauer modelThe AlFe2B2 sample was also investigated using Mössbauer spectroscopy, pa-per V. Due to the highly textured powder, figure 4.12, two absorbers could bemade for MS measurements. One thin absorber with high amount of texture(same as for reflection mode XRD) and another texture-free. Mössbauer spec-tra for both absorbers are shown in figure 4.18. From the textured absorberthe orientation of the electric field gradient (EFG) could be determined. It wasthen indicated that the EFG Vzz-axis is parallel to the crystallographic b-axis.This information about the principle EFG-tensor was applied to the texture-free absorber in the ferromagnetic regime, where it was determined that themagnetic moments are located in the ab-plane with an angle between 0 and40◦ from the b-axis. That it is 32◦ for the closest iron atoms compared to the
Figure 4.18. Mössbauer spectra of AlFe2B2 at 309 K and 90 K.
50

b-axis is in favour of the suggested direction of the magnetic moments. Thesuggested model is visualised in figure 4.19 (b).
The Curie temperature was also estimated from Mössbauer spectroscopymeasurements. The temperature when the magnetic sextet and the non-magneticdoublet had the same area relation was said to be TC. By this method TC wasfound to be 299 K, quite close to the findings from magnetometry in paper IV.
Discussion about the modelsThe two models of the magnetic structure from neutron powder diffractionand Mössbauer spectroscopy, figure 4.19, are similar but not exactly the same.Both models predict that the magnetic moments are oriented in the ab-plane,with no component in the c-direction. This is very clear from the increaseof the (001) peak in figure 4.17, since the neutron only scatters from com-ponents that are perpendicular to the scattering vector. The difference in theproposed models is the component b-direction component from MS which isnon-existent in the NPD model. In the NPD refinements a number of modelswere tested and the one with the best fit, as well as the best R-factors, was se-lected. It might not be entirely correct since the unidentified secondary phasecould potentially alter the fit due to overlapping peaks. However, this is notlikely to effect the obtained results, especially since the first principle calcu-lations are in agreement with the neutron model. Based on these arguments itseems like the model in figure 4.17 (a) is the most appropriate. To resolve thisconflict between the studies in paper IV and V, single crystal measurements
a
b
ca
b
c
(a) (b)
Figure 4.19. Models of the magnetic structure of AlFe2B2 obtained with neutrondiffraction (a) and Mössbauer spectroscopy (b).
51

should be utilised, since these would provide more reliable structure data forboth diffraction and Mössbauer spectroscopy measurements.
4.2.4 Manganese substitutionsSince AlFe2B2 also belongs to the newly discovered materials class, MAB-phases [36], it was interesting to study the effects on the magnetic and mech-anic effects of substitutions on the metal position. This was undertaken in pa-per VI. To avoid the etching step in the synthesis the samples were synthesisedfrom stoichiometric amounts of pure elements for the compositions AlFe2B2,AlFeMnB2 and AlMn2B2. The XRD patterns for all compositions are sum-marised in figure 4.20 and show that all samples contained secondary phases(<6%) which were not the case with the samples in paper IV and V. However,fewer synthesis steps is favourable in industrial manufacturing. To ensure thatthe manganese substitutes iron in the structure XRD are no sufficient, sinceiron and manganese have similar X-ray scattering lengths. Therefore, thermalanalyses were performed, figure 4.21, to extract the melting points of the threesamples. The melting point of AlFe2B2 was found to be highest in this system
20 40 60 80 100 120
20 40 60 80 100 120
20 40 60 80 100 120
Intensity
(arb.units)
2-theta (deg.)
Yobs
Ycalc
Ycalc-Yobs
Bragg reflections
Intensity
(arb.units)
2-theta (deg.)
Yobs
Ycalc
Ycalc-Yobs
Bragg reflections
Intensity
(arb.units)
2-theta (deg.)
Yobs
Ycalc
Ycalc-Yobs
Bragg reflections
Figure 4.20. XRD patterns for AlFe2B2 (top), AlFeMnB2 (middle) and AlMn2B2(bottom). λ = 1.540598 Å.
52

1250 1300 1350 1400 1450 1500 1550
-0,4
-0,2
0,0
0,2
0,4
0,6
0,8
1,0
1515 K1472 K
1440 K
1371 KDTA
(μV/mg)
Temperature (K)
AlFe2B2
AlFeMnB2
AlMn2B2
1313 K
Figure 4.21. DTA curves for AlFe2B2, AlFeMnB2 and AlMn2B2 with the onset tem-peratures for endothermic reactions indicated.
at 1515 K. With increasing amounts of manganese in the samples the meltingtemperature decreased, which is a good indication that the substitution wassucessful. However, for both AlMn2B2 and AlFeMnB2 double peaks appearupon melting, which could come from the secondary phases. That secondaryphases would cause that is unlikely, since the low amount of secondary phaseswould not give such strong DTA-signal. The most probable reason for thetwo peaks is that these phases are not melting congruently. An incongruentlymelting alloy would also explain why the syntheses of samples containingchromium were unsuccessful.
Mechanical effectsWhen performing the manganese substitutions the mechanical properties donot change drastically. The values for the hardness are 9.3(3), 10.6(2) and7.2(3) GPa for AlFe2B2, AlFeMnB2 and AlMn2B2, respectively, all in verygood agreement with previously reported results [37]. However, it is difficultto determine if the differences arise due to the substitutions or precipitations ofsecondary phases in the samples. The values are, however, significantly lowerthan the values normally achieved for metal borides [36]. The micrographs(from scanning electron microscopy (SEM)) with indents from a diamond tipfor AlFeMnB2 is shown in figure 4.22. The deformation shows similar beha-viour as previously reported in this system [37], which could indicate that upondeformation, the different layers in the MAB-phase slide over each other. Withenergy dispersive X-ray spectrometry (EDS) manganese and iron were foundto be almost evenly distributed in the AlFeMnB2-sample. The small mismatchcould come from precipitates of secondary phases or different grains with dif-ferent degrees of Fe/Mn substitutions. In all, the EDS analysis further supportsthe possibility of mangansese substitution in this system.
53

Figure 4.22. SEM micrographs with delamination from indents in different directionsfor AlFeMnB2.
Magnetic effectsUpon manganese substitutions in AlFe2B2 the magnetism changes drastically.From figure 4.23, it can be seen that this synthesis method yields a TC of300 K for AlFe2B2, whereas the manganese analogue is found to be antifer-
0
20
40
60
80
M (A
m2 /k
g)
0 100 200 300 400T (K)
0
1
2
3
4
5
M (A
m2 /k
g)
* 10-3
ZFCFC
0 100 200 300 400T (K)
0
0.05
0.1
0.15
0.2
0.25
0.3
M (A
m2 /k
g)
0
5
10
15
20
25
M (A
m2 /k
g)
AlFe2B2
AlMnFeB2
(a1)
1 T 5 mT
5 mT
5 mT
1 T
1 T
AlFe2B2
AlMn2B2
0
1
2
3
M (A
m2 /k
g)
ZFCFC
0
1
2
3
4
M (A
m2 /k
g)
ZFCFC
(a2) (a3)AlFe2B2
(b1) (b2) (b3)AlMnFeB2 AlMnFeB2
AlMn2B2 AlMn2B2(c1) (c2) (c3)
Figure 4.23. Magnetisation as a function of temperature and applied magnetic field. Incolumn (x1), x = a, b or c, magnetisation vs. temperature using an applied magneticfield μ0H = 1 T is presented for the three samples. In column (x2) the low field(μ0H = 5 mT) magnetisation vs. temperature is shown. In column (x3) magnetisationvs. applied magnetic field at 10 K. (c3) also includes a measurement at 300 K.
54

romagnetic (TN = 300 K). From the low field magnetisation vs. temperaturemeasurements, it can be seen that AlFeMnB2 behaves differently comparedto both the other AlM2B2-samples. This might come from an introduction ofcompeting ferro- and antiferromagnetic interactions that leads to a decrease insaturation magnetisation as well as a decrease in TC (∼200 K). Further, thisimplies that AlFeMnB2 is a frustrated ferrimagnet.
4.3 Fe2PThe hexagonal compound class based on Fe2P, figure 1.6, has been thoroughlystudied for usage in magnetic refrigeration applications. With substitutions of,for example, silicon, arsenic or boron on the phosphorus site, the Curie tem-perature can be increased dramatically [40, 41]. And with manganese substi-tutions on the iron site the magnetic moment can be increased. Despite thefact that the pseudo-quaternary phase diagram has been heavily explored, nostudies have been done on why the material has this large magnetocaloric ef-fect. For this reason, the prototype compound, Fe2P was studied in paper VII,with inelastic neutron scattering.
4.3.1 Characterisations of Fe2PThe crystalline quality of the synthesised sample was studied with XRD, withthe refined powder pattern shown in figure 4.24 (a). The sample is of thehighest quality with no traces of secondary phases and with the refined unit cellparameters a = 5.8696(1) Å and c = 3.4594(1) Å at 300 K. In figure 4.24 (b),the change of unit cell parameters on cooling can be seen which significantlychanges around TC. This magnetostriction comes from the first order mag-netic transition this compound exhibits. The ordering of the magnetic momentalong the c-axis gives favourable interactions between the atomic layers andtherefore shortens the c-axis.
The Curie temperature for this sample was determined from the temperaturederivative (figure 4.24 (c)) to 220 K. This is in good agreement with previousfindings on single crystals [45]. The saturated magnetic moments were ex-tracted from magnetisation vs. applied field, and for 2 K it corresponds to2.5(1) μB. This value is a bit low as an applied field of 4000 kA/m (5 T) is notenough to saturate a powder sample of Fe2P [68].
4.3.2 Magnetic diffractionThe elastic line of the inelastic neutron experiment at 3.2 Å was integrated todiffraction patterns. All diffraction patterns were refined to a model contain-ing both crystalline as well as magnetic structures, using the oxidation states
55

0 100 200 300 400Temperature (K)
0
0.1
0.2
0.3
0.4
0.5
Mag
netis
atio
n (A
m2 /k
g)
H = 0.4 kA/m
(c) (d)
(a) (b)
0 50 100 150 200 250 3005.868
5.870
5.872
5.874
5.876
5.878
5.880
5.882
ac
Temperature (K)
a (Å
)
3.43
3.44
3.45
3.46
3.47
c (Å
)
200 210 220 230 240 250Temperature (K)
-0.01
-0.005
0
dM/d
T
Figure 4.24. (a) Refined XRD pattern for Fe2P plotted against the scattering vector(Q), λ = 1.540598 Å. (b) Evaluation of the unit cell parameters with respect to tem-perature around TC, which is marked with a dashed line. (c) Temperature dependenceof the magnetisation under an external field of 0.4 kA/m. Inset shows the temperaturederivative used to determine TC. (d) Magnetisation as a function of applied magneticfield for T = 2, 100 and 350 K.
0 and 4+ for Fe(1) and Fe(2), respectively. The magnetic moments at 10 Kwere found to be 0.84(6) μB for Fe(1) and 2.04(3) μB for Fe(2), all in goodagreement with the measured values from magnetometry and previous find-ings from polarized neutron diffraction [48]. Figure 4.25 shows the temper-ature dependence of the magnetic moments as well as the integrated intensityfor the (1 0 0) and (0 0 1) peaks. The increase in the (0 0 1) peak close to TC infigure 4.25 (a) indicates that a magnetic contribution develops in the ab-plane,even though earlier NPD studies have shown that Fe2P only has its momentsin the c-direction. From the structural refinements, a canting of the magneticmoments at TC is found, shown in the inset of figure 4.25 (b). The magneticmoments decreases at TC, and also turns ∼10◦ away from the c-axis towardsthe a-direction. This canting of the magnetic moments at TC is also indicatedfrom Mössbauer spectroscopy measurements, supporting these findings.
56

0 100 200 300Temperature (K)
Inte
grat
ed In
tens
ity (a
.u.)
(1 0 0)(0 0 1)
(a) (b)
0 50 100 150 200 250 300
0.0
0.5
1.0
1.5
2.0
Fe1Fe2Rmag
Temperature (K)
Mag
netic
mom
ent (μ B
)
0
2
4
6
8
10
Rm
ag
210 220 230 240 2500
5
10
Can
ting
angl
e (d
eg.)
Temperature (K)
Figure 4.25. (a) Integrated intensity of the (1 0 0) and (0 0 1) peaks. For the (1 0 0)peak the structural contribution to the intensity from 300 K has been subtracted toemphasize the magnetic contribution. (b) Temperature dependence of the size of themagnetic moments with respect to temperature. The Rmag-values are shown in bluefor each temperature. Inset shows the canting angle for temperatures above TC. Thedashed lines represent the Curie temperature for Fe2P.
4.3.3 Inelastic neutron scatteringThe inelastic signal, S(Q, ω), measured with an incident neutron beam of 5 Å,at selected temperatures between 100 and 220 K is shown in figure 4.26. AtQ = 1.2 Å−1 and 1.8 Å−1 the (1 0 0) and (0 0 1) peaks are located and areof special interest. Since for the lowest temperatures, scattering from magnonexcitations will only bee seen at (1 0 0), and phonon exitations will only con-tribute to the (0 0 1) peak. Integrated intensities from the low angle scattering,short range correlations of different lengthscales can be extracted. There areindications of complex nanostructures that couple antiferromagnetically below200 K and ferromagnetically above 220 K. To understand the finer details ofthese interactions measurements with small angle neutron scattering or mag-netic pair distribution function are required.
From the lowest temperatures (below 220 K = TC), a gap between the elasticline and the magnon and phonon excitations are visible (figure 4.26). A gappedexcitation is a sign of an energy barrier in the sample, which can often beassigned to a large anisotropy. Large anisotropy has previously been shown inthis system from single crystals [45, 68]. The gap in the acoustic phonon mode(from the (0 0 1) peak) also implies an enhanced electron mobility, whichwould then begin to explain the heating of a material upon magnetisation.
57

Figure 4.26. S(Q, ω) dependence for a range of temperatures (a) 100 K, (b) 180 K,(c) 200 K and (d) 220 K.
58

5. Summary and conclusions
”Reality continues to ruin my life.”- Bill Watterson
New iron rich compounds have been successfully synthesised and theirstructural and magnetic properties have been evaluated. It has been shownthat the physical properties are highly dependent on the structures of the ma-terials, where e.g. small differences in interatomic distances produces largedifferences in the magnetic response of the compounds. Not only has thestructure itself been demonstrated to be of importance, the composition alsohas a big impact on the physical properties. A substitution of one elementfor another will change the physical behaviour. Lastly the compounds use-fulness as permanent magnets or in magnetic refrigeration applications havebeen evaluated.
For the tetragonal system M5XB2 the interest started with the high saturatedmagnetisation and high Curie temperature of Fe5SiB2 making it interesting asa permanent magnet. Neutron diffraction studies revealed that a spin reorienta-tion occurs at low temperatures, where the magnetic moments change from anout-of-plane to an in-plane orientation. However, the usefulness in that applic-ation as a permanent magnet was limited due to very low coercivity. Therefore,the substitutional effects were studied with the aim of boosting coercivity, thiswas investigated indirectly by studying the magnetocrystalline energy. Twosample series were investigated, Fe5Si1-xPxB2 and (Fe1-xCox)5PB2. While theusefulness as a permanent magnet did not increase, the magnetocrystalline an-isotropy could be somewhat changed with the substitutions. For Fe5Si1-xPxB2,the change in magnetic properties (both Msat and TC) were decreasing as theunit cell volume decreased with increasing x. The conclusion can thus bedrawn that the distances between the iron atoms are important to consited ifthe maximum possible magnetisation is to be achieved. In addition, the spinreorientation at low temperatures was inhibited with increasing phosphorusconcentrations. For (Fe1-xCox)5PB2, the change in TC is more dramatic whenthe Co concentration increases. Increased Co content effectively reduces themagnetic properties, both Msat and TC drops drastically. At a value of x = 0.55,TC is very close to room temperature, making it fulfil some criteria as a mag-netocaloric material. Therefore, it would be interesting to investigate its use-fulness in such applications, however, there are indications that the magnet-isation is too low for it to be really useful. If the magnetic moment can beboosted somehow it would quickly become interesting for further studies inthe field of magnetocalorics.
59

The pseudo-uniaxial orthorhombic system that AlM2B2 belongs to was firstinvestigated for its function in the field of magnetic cooling. It has been shownhere that the magnetic transition in AlFe2B2 is of the second order making itless useful as a magnetocaloric material. However, the neutron diffraction andMössbauer spectroscopy studies both reveal that the magnetic moments arelocated in the ab-plane even though the two techniques give rise to slightly dif-ferent models for the magnetic structure. The best model based on the neutrondiffraction data gives magnetic moments in the a-direction while Mössbauerspectroscopy suggests a model with the moments aligned in the ab-plane alongthe shortest iron-iron distances. To study the substitutional effects the pseudo-binary phase diagram of AlM2B2 (M = Mn, Fe) was explored with regardto crystalline structures as well as physical properties, such as magnetic aswell as mechanical (hardness and delamination). It was observed that substi-tutions are possible and that these have an effect on the melting point of thecompounds. In addition, non-congruently melting with an increased amountof manganese. The mechanical properties are otherwise very similar to whatwould be expected from a layered crystal structure. The magnetic behaviouris more drastic with manganese substitutions, as the material goes from ferro-magnetic to anitferromagnetic via ferrimagnetic with an increased manganesecontent.
Since substituted variants of Fe2P (hexagonal structure) have the best pos-sibilities at the moment for implementation in a working magnetic coolingdevice pure Fe2P was studied to examine the origin of the magnetocaloriceffect. Therefore, inelastic neutron spectroscopic measurements were per-formed. The experiment showed that at the Curie transition (on heating), themagnetic moment of both crystallographic sites are still present above TC, al-though smaller, and with a canting of ∼10◦ away from the crystallographicc-axis. Several lengthscales are present in this system, however, small anglenetron scattering or pair distribution function experiments would be necessaryto confirm this. The gapped excitations implies that there is a strong correl-ation between magnetic and acoustic phonon modes in this system giving anenhanced electron mobility. There is therefore a strong electron-phonon coup-ling leading to the mechanism for the magnetocaloric effect.
60

6. Sammanfattning på svenska
”Utan tvivel är människan inte klok.”- Tage Danielsson
Sedan människans tidigaste historia har material använts för att få en dräg-ligare vardag. Till exempel användes redan på stenåldern stenverktyg såsompilar och yxor för jakt och byggnationer. Ett tydligt exempel på utvecklingenhos material är de olika historiska tidsåldrarna vilka namngetts av de resursersom fanns att tillgå, sten på stenåldern, brons på bronsåldern och järn på järn-åldern. Sedan järn började brukas kom magnetiska material till människanskännedom (om än utan vetskap om magnetismens ursprung). De magnetis-ka egenskaperna fascinerade eftersom den är en osynlig kraft som ännu inteförstås helt och fullt, men ändå har funnit en mängd användningsområden.Magnetiska nålformade stenar (bestående av magnetit) upptäcktes ställa in sigenligt jordens magnetfält om de flöt på vatten och blev starten för kompas-sen vilken länge var oumbärlig vid navigation till sjöss. I dagens samhälleanvänds magnetiska material till en rad applikationer, både mer och mindrevälkända. Den mest synliga användningen är kylskåpsmagneter, vilka finns ide flesta hem för att fästa små budskap, teckningar eller andra viktiga lappar.Till de mindre kända hör till exempel hårddiskar, generatorer och elmotorer,vilka utan magnetism inte skulle fungera. I den här avhandlingen har mag-netiska material studerats för tilltänkta funktioner i energiapplikationer såsomexempelvis vindkraftverk, elmotorer och kylskåp.
En kylskåpsmagnet har ett permanent magnetiserat tillstånd och sägs därförvara en permanentmagnet. Permanentmagneter används inom de flesta energi-applikationer, framförallt i generatorer där de ingår som viktiga komponenterför att omvandla en energiform till en annan (till exempel rörelseenergi tillelektrisk energi). Ett annat användningsområde för magnetiska material somkommer bli allt viktigare med global uppvärmning är kylapplikationer, dvs.kylskåp och luftkonditionering. Med ett kylskåp drivet av magnetiska mate-rial, och den magnetokaloriska effekten, kan upp till 20-30% energi sparasjämfört med dagens teknologi. Den magnetokaloriska effekten som ger upp-hov till det beskrivs i figur 6.1. Genom att utnyttja att ett material värms uppom det utsätts för ett yttre magnetfält ((1)→(2) i figur 6.1) och sedan kyls nernär magnetfältet avlägsnas ((3)→(4)) erhålls ett cykliskt förlopp.
En grundförutsättning för att ett material ska fungera som en bra perma-nentmagnet är att det har en hög övergångstemperatur (även kallad Curietem-peratur (TC)). Ämnet tappar sina magnetiska egenskaper om denna temperatur
61

1 2
34
Avledd värme
Avledd värme
Kylskåp
Magnetiskt fält slås av
Magnetiskt fält slås på
Figur 6.1. Schematisk skiss över magnetisk kylning.
överskrids. En annan viktig egenskap är dess förmåga att uppbära höga magne-tiska moment på sina magnetiska element. Ett material som studerats för per-manentmagnetapplikationer är Fe5SiB2, vilket uppfyller de nämnda kraven.Tyvärr så kan inte materialet motstå att bli avmagnetiserat när ett yttre magnet-fält avlägsnas. Vid studierna av de magnetiska egenskaperna hittades ett intres-sant beteende vid låga temperaturer. Det föranledde studier av de magnetiskastrukturerna vid rumstemperatur och låga temperaturer. Resultatet blev att detfascinerande magnetiska beteendet kan förklaras med en omorientering av demagnetiska momenten, det vill säga, en ändring i den magnetiska strukturen.För att försöka förbättra de magnetiska egenskaperna för permanentmagne-tapplikationer undersöktes om kisel kunde ersättas med fosfor. Det visade sigatt även om substitutionerna var möjliga så förbättrades inte egenskaperna till-räckligt mycket för applikationen som permanentmagnet. Däremot upptäcktesatt den magnetiska strukturen vid låga temperaturer hos Fe5SiB2 förhindradesvid fosforsubstitutionen. Ytterligare försök för att förbättra materialet för an-vändning som permanentmagnet gjordes genom att byta ut järnet mot kobolt.Då uppdagades att det magnetiska momentet försvann mer och mer vid högrekobolthalter. Detsamma skedde med TC, vilken sjönk från flera hundra gradertill under rumstemperatur. Att kunna kontrollera övergångstemperaturen, spe-ciellt kring rumstemperatur, är dock optimalt för applikationer som bygger påmagnetisk kylning. Det eftersom den magnetokaloriska effekten är som störsti närheten av TC.
Även andra materialsystem har studerats för magnetisk kylning. Ett av demär AlFe2B2, vilket är intressant mycket tack vare en övergångstemperatur närarumstemperatur. Noggranna studier av den magnetiska strukturen genomför-des med två olika analysmetoder och resultaten utvärderades oberoende avvarandra. De modeller som framtogs var delvis överensstämmande men ha-de vissa avvikelser. Avvikelsen kan antas bero på en sämre noggrannhet förden ena analysmetoden. Den sammantagna slutsatsen blir, när även teoretiskaberäkningar tas i beaktande, att den magnetiska strukturen lösts för AlFe2B2,
62

med resultatet att den ferromagnetiska strukturen har alla magnetiska momentsamlade i den kristallografiska a-axeln. Även försök med andra grundämnenän järn har utförts med samma struktur som AlFe2B2. Dock framkom det attdå mangan används istället för järn, helt eller delvis, så uppstår andra typer avmagnetiska effekter. Det gör att ett tillstånd gynnsamt för magnetisk kylninginte uppnås då materialet inte klarar kravet för parallella magnetiska moment,ett krav visualiserat i figur 6.1.
Fe2P, en moderstruktur för användbara material för magnetisk kylning, stu-derades med avsikten att förklara temperaturändringen hos materialet när detmagnetiseras. Det visade sig att vibrationerna i strukturen har större inflytan-de när materialet är magnetiserat. Elektronerna i materialet har således lättareatt röra sig genom strukturen i ett magnetiskt tillstånd, vilket leder till att vär-me kan skapas och materien värms upp. Det innebär att den magnetokaloriskaeffekten kan förklaras, i alla fall delvis.
Sammanfattningsvis så har olika materialsystem studerats i syfte att kunnaanvändas kommersiellt. Tyvärr är det inget av materialen som uppfyller kravenför just de applikationer de studerats för. Däremot har systematiska studierföranlett en förståelse för hur framtida material ska designas för att erhålla ettgångbart resultat för industriella applikationer.
63

7. Acknowledgements
”One good thing about music, when it hits you, you feel no pain.”- Bob Marley
First of all, to Martin, thank you for everything I have learnt from you overthe last five years. That you have always been available for questions eitherregarding some furnace, for very detailed FullProf analysis or just to chat arereally appreciable. Also, how to behave on conferences, teaching or super-vising students are also skills that you have shared. In short, I am really gladto have had you as my supervisor, and I am hoping that our collaboration willcontinue in some form in the future. To my co-supervisors, Ulf and Per, I amreally glad for all discussions with you in various projects and for teaching mea lot of things, especially Per for your magnetism expertise. To Lennart andTore; it has been so nice when you have shared your knowledge and enthusi-asm for Mössbauer spectroscopy, which I am truly thankful for.
I would also like to thank all people I have worked alongside with in thefurnace room (past and present). So to the ”Dungeon trolls”, Yvonne, Pedro,Viktor, Jonas Å, Ocean, Dennis, Samrand, Gustav and Victor, thank you forthe good times in the basement lab! Also, thank you for the company onvarious trips to MAXlab, PetraIII or ILL. To the students I have supervisedand tried to learn to see the beauty in the basement, Maxim, Elise and Sarah,also to Andreas T for the work you did over the summers, thank you and Ihope you will do great yourself in the future.
When having problems with equipment it is nice to have the support fromknowledgeable people, therefore, Mikael O, Anders and Leif E, thanks foralways taking care of the instruments and being around for my, sometimesstupid, questions. And speaking of stupid questions, I would like to thankthe administrative staff, for taking care of my invoices, computers and otherthings that I simply cannot do on my own. To Will and Leif N; thank you forproofreading and approving this thesis.
The work included in this thesis is a real team effort. Therefore, to everycollaborator in Ångström laboratory working with magnetism, Mikael, Sofia,Daniel, Klas, Peter, Mirek, Alexander, Erna and Olle, thank you for very fruit-ful collaborations. It has always felt easier knowing that we all have strivedfor the same goals. To all co-authors outside of Ångström; thank you for yourhard work! Especially to Pascale and Premek for always sharing your know-ledge and creating a nice atmosphere when you are around!
The past five years would not have gone so smoothly if not for all wonderfulcolleagues at this department. First, to Linus and Tim: It has been a pleasure
64

doing this journey alongside you and I am really glad that we can finish ourtime as Ph.D-students roughly at the same time. The friendship we have builtwill not be forgotten! To the rest of you in ”Kaffegruppen” and the regularsin ”Das Kontor”, Kristina, David, Gärd, Fabian, Ernesto and Sarmad, thanksfor all the after works and all fun, crazy and weird stuff we have done outsidework.
To stay in good physical shape has made it easier for me to cope witheverything as well. Therefore, for the ”Jobbgympa” and ”Run Forest Run”I am also truly grateful, and for the fantastic people that have participated:Ronnie, Andreas B, Julia, Steven, Christoffer and Jonas M, to mention theones not already mentioned above. To Alina and Mahsa, thank you for beingso lovely office mates. And Hanna; thank you for the nice coffee-breaks, bothat and outside Ångström, and for the help with the design of the cover of thisthesis. I would also like to thank all other colleagues for all great coffee breaksand creating the wonderful atmosphere around the department.
I would also like to thank Teknophonorqestern Tupplurarna, SvenskaShoworkestern Phontrattarne, Swingkatten and all the wonderful people I havemet there for sharing and developing my love for jazz and swing music. With-out these distractions I would not have been able to handle all the stress andthe heavy workload that comes for a Ph.D-student.
To my wonderful family, thank you for your love and support! This thesiswould not have been as easy to write without your continuous support andencouragement. And, last but definitely not least, to Carin; thank you for allyour support over the last few months, I am truly grateful to have you in mylife!
65

Bibliography
[1] V. F. Buchwald, Iron and steel in ancient times. Copenhagen : Det KongeligeDanske Videnskabernes Selskab, 2005.
[2] W. E. Wallace, “The Solid State: Intermetallic Compounds,” Annual Review ofPhysical Chemistry, vol. 15, no. 1, pp. 109–130, 1964.
[3] F. Lihl and H. Ebel, “Röntgenographische Untersuchungen über den Aufbau dereisenreichen Legierungen des Systems Eisen-Silizium,” Archiv für dasEisenhüttenwesen, vol. 32, pp. 489–491, 1961.
[4] N. Stoloff, C. Liu, and S. Deevi, “Emerging applications of intermetallics,”Intermetallics, vol. 8, no. 9 - 11, pp. 1313 – 1320, 2000.
[5] E. G. R. Taylor, “Early charts and the origin of the compass rose,” Journal ofNavigation, vol. 4, no. 4, pp. 351–356, 1951.
[6] J. Coey, “Permanent magnets: Plugging the gap,” Scripta Materialia, vol. 67,no. 6, pp. 524 – 529, 2012. Viewpoint Set No. 51: Magnetic Materials forEnergy.
[7] A. Aharoni, Introduction to the Theory of Ferromagnetism. International seriesof monographs on physics, Clarendon Press, 1996.
[8] O. Gutfleisch, M. A. Willard, E. Brück, C. H. Chen, S. G. Sankar, and J. P. Liu,“Magnetic Materials and Devices for the 21st Century: Stronger, Lighter, andMore Energy Efficient,” Advanced Materials, vol. 23, no. 7, pp. 821–842, 2011.
[9] C. Hammond, The Basics of Crystallography and Diffraction. IUCr texts oncrystallography, Oxford University Press, 2001.
[10] S. A.V. and B. N.V., Colored symmetry. Pergamon Press, New York, 1964.[11] J. Coey, “Hard Magnetic Materials: A Perspective,” IEEE Transactions on
magnetics, vol. 47, pp. 4671–4681, Dec 2011.[12] S. Andreev, M. Bartashevich, V. Pushkarsky, V. M. L. Pamyatnykh, E. Tarasov,
N. Kudrevatykh, and T. Goto, “Law of approach to saturation in highlyanisotropic ferromagnets Application to Nd-Fe-B melt-spun ribbons,” Journalof Alloys and Compounds, vol. 260, no. 1 - 2, pp. 196 – 200, 1997.
[13] K. A. Gschneidner, Jr. and V. K. Pecharsky, “Thirty years of near roomtemperature magnetic cooling: Where we are today and future prospects,”International Journal of Refrigeration, vol. 31, no. 6, pp. 945 – 961, 2008.
[14] P. Weiss and A. Piccard, “Sur un nouveau phénomène magnétocalorique,”Comptes Rendus Hebdomadaires des Séances de l’Académie des Sciences,vol. 166, p. 352, 1918.
[15] A. Tishin and Y. Spichkin, The Magnetocaloric Effect and its Applications.Condensed Matter Physics, CRC Press, 2003.
[16] V. K. Pecharsky and K. A. Gschneidner, Jr., “Giant Magnetocaloric Effect inGd5(Si2Ge2),” Physical Review Letters, vol. 78, pp. 4494–4497, Jun 1997.
[17] B. Aronsson and G. Lundgren, “X-Ray Investigations on Me-Si-B Systems (Me= Mn, Fe, Co),” Acta Chemica Scandinavica, vol. 13, pp. 433–441, 1959.
66

[18] B. Aronsson and I. Engström, “X-Ray Investigations on Me-Si-B Systems (Me= Mn, Fe, Co) Some features of the Fe-Si-B and Mn-Si-B Systems,” ActaChemica Scandinavica, vol. 14, pp. 1403–1413, 1960.
[19] S. Rundqvist, “X-Ray Investigations of the Ternary System Fe-P-B. SomeFeatures of the Systems Cr-P-B, Mn-P-B, Co-P-B and Ni-P-B,” Acta ChemicaScandinavica, vol. 16, pp. 1–19, 1962.
[20] L. Häggström, R. Wäppling, T. Ericsson, Y. Andersson, and S. Rundqvist,“Mössbauer and X-ray studies of Fe5PB2,” Journal of Solid State Chemistry,vol. 13, pp. 84 – 91, 1975.
[21] R. Wäppling, T. Ericsson, L. Häggström, and Y. Andersson, “MagneticProperties of Fe5SiB2 and Related Compounds,” Le Journal de PhysiqueColloques, vol. 37, no. C6, pp. 591–593, 1976.
[22] T. Ericsson, L. Häggström, and R. Wäppling, “Spin Rotation in Fe5SiB2,”Physica Scripta, vol. 17, no. 2, p. 83, 1978.
[23] E. Fruchart, A.-M. Triquet, R. Fruchart, and A. Michel, “Chimie Minerale -Deux Composes Ferromagnetiques Nouveaux Dans Le Systeme TernaireFer-Phosphore-Bore,” Comptes Rendus Hebdomadaires des Seances de lAcademie des Sciences, vol. 255, pp. 931 – 933, 1962.
[24] A.-M. Blanc, E. Fruchart, and R. Fruchart, “Etude magnetique etchristallographique des solutions solides (Fe1−xCrx)3P et de la phaseferromagnetique Fe5B2P,” Annales de Chimie (Paris), vol. 2, no. 5, pp. 251 –254, 1967.
[25] T. N. Lamichhane, V. Taufour, S. Thimmaiah, D. S. Parker, S. L. Bud’ko, andP. C. Canfield, “A study of the physical properties of single crystalline Fe5B2P,”Journal of Magnetism and Magnetic Materials, vol. 401, pp. 525 – 531, 2016.
[26] M. Werwinski, S. Kontos, K. Gunnarsson, P. Svedlindh, J. Cedervall, V. Höglin,M. Sahlberg, A. Edström, O. Eriksson, and J. Rusz, “Magnetic properties ofFe5SiB2 and its alloys with P, S, and Co,” Physical Review B, vol. 93,p. 174412, May 2016.
[27] M. A. McGuire and D. S. Parker, “Magnetic and structural properties offerromagnetic Fe5PB2 and Fe5SiB2 and effects of Co and Mn substitutions,”Journal of Applied Physics, vol. 118, no. 16, 2015.
[28] N. Chaban and Y. Kuz’ma, “Ternary systems Cr-Al-B and Mn-Al-B,” IzvestiyaAkademii Nauk SSSR, Neorganicheskie Materialy, vol. 9, pp. 1908–1911, 1973.
[29] H. J. Becher, K. Krogmann, and E. Peisker, “Über das ternäre Borid Mn2AlB2,”Zeitschrift für anorganische und allgemeine Chemie, vol. 344, no. 3-4,pp. 140–147, 1966.
[30] W. Jeitschko, “The crystal structure of Fe2AlB2,” Acta CrystallographicaSection B, vol. 25, pp. 163–165, Jan 1969.
[31] M. ElMassalami, D. da S. Oliveira, and H. Takeya, “On the ferromagnetism ofAlFe2B2,” Journal of Magnetism and Magnetic Materials, vol. 323, no. 16,pp. 2133 – 2136, 2011.
[32] X. Tan, P. Chai, C. M. Thompson, and M. Shatruk, “Magnetocaloric Effect inAlFe2B2: Toward Magnetic Refrigerants from Earth-Abundant Elements,”Journal of the American Chemical Society, vol. 135, no. 25, pp. 9553–9557,2013.
67

[33] P. Chai, S. A. Stoian, X. Tan, P. A. Dube, and M. Shatruk, “Investigation ofmagnetic properties and electronic structure of layered-structure boridesAlT2B2 (T=Fe, Mn, Cr) and AlFe2−xMnxB2,” Journal of Solid State Chemistry,vol. 224, no. 0, pp. 52 – 61, 2015.
[34] L. Lewis, R. Barua, and B. Lejeune, “Developing magnetofunctionality:Coupled structural and magnetic phase transition in AlFe2B2,” Journal of Alloysand Compounds, vol. 650, pp. 482 – 488, 2015.
[35] S. Hirt, F. Yuan, Y. Mozharivskyj, and H. Hillebrecht, “AlFe2−xCoxB2 (x =0-0.30): TC Tuning through Co Substitution for a Promising MagnetocaloricMaterial Realized by Spark Plasma Sintering,” Inorganic Chemistry, vol. 55,no. 19, pp. 9677–9684, 2016. PMID: 27622951.
[36] M. Ade and H. Hillebrecht, “Ternary Borides Cr2AlB2, Cr3AlB4, and Cr4AlB6:The First Members of the Series (CrB2)nCrAl with n = 1, 2, 3 and a UnifyingConcept for Ternary Borides as MAB-Phases,” Inorganic Chemistry, vol. 54,no. 13, pp. 6122–6135, 2015. PMID: 26069993.
[37] K. Kádas, D. Iusan, J. Hellsvik, J. Cedervall, P. Berastegui, M. Sahlberg,U. Jansson, and O. Eriksson, “AlM2B2 (M = Cr, Mn, Fe, Co, Ni): a group ofnanolaminated materials,” Journal of Physics: Condensed Matter, vol. 29,no. 15, p. 155402, 2017.
[38] H. Holleck, “Material selection for hard coatings,” Journal of Vacuum Science &Technology A: Vacuum, Surfaces, and Films, vol. 4, no. 6, pp. 2661–2669, 1986.
[39] S. Rundqvist and J. Jellinek, “The Structures of Ni6Si2B, Fe2P and SomeRelated Phases,” Acta Chemica Scandinavica, vol. 13, no. 3, 1959.
[40] V. Höglin, J. Cedervall, M. S. Andersson, T. Sarkar, M. Hudl, P. Nordblad,Y. Andersson, and M. Sahlberg, “Phase diagram, structures and magnetism ofthe FeMnP1−xSix-system,” Royal Society of Chemistry Advances, vol. 5,pp. 8278–8284, 2015.
[41] X. F. Miao, L. Caron, P. Roy, N. H. Dung, L. Zhang, W. A. Kockelmann, R. A.de Groot, N. H. van Dijk, and E. Brück, “Tuning the phase transition intransition-metal-based magnetocaloric compounds,” Physical Review B, vol. 89,p. 174429, May 2014.
[42] V. Höglin, M. Hudl, L. Caron, P. Beran, M. H. Sörby, P. Nordblad,Y. Andersson, and M. Sahlberg, “Detailed study of the magnetic ordering inFeMnP0.75Si0.25,” Journal of Solid State Chemistry, vol. 221, pp. 240 – 246,2015.
[43] V. Höglin, M. Hudl, M. Sahlberg, P. Nordblad, P. Beran, and Y. Andersson, “Thecrystal and magnetic structure of the magnetocaloric compound FeMnP0.5Si0.5,”Journal of Solid State Chemistry, vol. 184, no. 9, pp. 2434 – 2438, 2011.
[44] X. F. Miao, L. Caron, J. Cedervall, P. C. M. Gubbens, P. Dalmas de Réotier,A. Yaouanc, F. Qian, A. R. Wildes, H. Luetkens, A. Amato, N. H. van Dijk, andE. Brück, “Short-range magnetic correlations and spin dynamics in theparamagnetic regime of (Mn,Fe)2(P,Si),” Physical Review B, vol. 94,p. 014426, Jul 2016.
[45] L. Lundgren, G. Tarmohamed, O. Beckman, B. Carlsson, and S. Rundqvist,“First Order Magnetic Phase Transition in Fe2P,” Physica Scripta, vol. 17,no. 1, p. 39, 1978.
68
[46] R. Wäppling, L. Häggström, T. Ericsson, S. Devanarayanan, E. Karlsson,B. Carlsson, and S. Rundqvist, “First order magnetic transition, magneticstructure, and vacancy distribution in Fe2P,” Journal of Solid State Chemistry,vol. 13, no. 3, pp. 258 – 271, 1975.
[47] D. Scheerlinck and E. Legrand, “Neutron diffraction study of the magneticstructure of Fe2P,” Solid State Communications, vol. 25, no. 3, pp. 181 – 184,1978.
[48] H. Fujii, S. Komura, T. Takeda, T. Okamoto, Y. Ito, and J. Akimitsu, “PolarizedNeutron Diffraction Study of Fe2P Single Crystal,” Journal of the PhysicalSociety of Japan, vol. 46, no. 5, pp. 1616–1621, 1979.
[49] B. Carlsson, M. Gölin, and S. Rundqvist, “Determination of the homogeneityrange and refinement of the crystal structure of Fe2P,” Journal of Solid StateChemistry, vol. 8, no. 1, pp. 57 – 67, 1973.
[50] Y. Cerenius, K. Ståhl, L. A. Svensson, T. Ursby, Å. Oskarsson, J. Albertsson,and A. Liljas, “The crystallography beamline I711 at MAXII,” Journal ofSynchrotron Radiation, vol. 7, pp. 203–208, Jul 2000.
[51] T. J. B. Holland and S. A. T. Redfern, “Unit cell refinement from powderdiffraction data; the use of regression diagnostics,” Mineralogical Magazine,vol. 61, no. 1, pp. 65–77, 1997.
[52] H. M. Rietveld, “A profile refinement method for nuclear and magneticstructures,” Journal of Applied Crystallography, vol. 2, pp. 65–71, Jun 1969.
[53] R. Young, The Rietveld Method. IUCr monographs on crystallography, OxfordUniversity Press, 1995.
[54] L. B. McCusker, R. B. Von Dreele, D. E. Cox, D. Louër, and P. Scardi,“Rietveld refinement guidelines,” Journal of Applied Crystallography, vol. 32,pp. 36–50, Feb 1999.
[55] J. Rodriguez-Carvajal, “Recent advances in magnetic structure determination byneutron powder diffraction,” Physica B: Condensed Matter, vol. 192, no. 1 - 2,pp. 55 – 69, 1993.
[56] Y. Izyumov and V. Naish, “Symmetry analysis in neutron diffraction studies ofmagnetic structures,” Journal of Magnetism and Magnetic Materials, vol. 12,no. 3, pp. 239 – 248, 1979.
[57] A. Wills, “A new protocol for the determination of magnetic structures usingsimulated annealing and representational analysis (SARAh),” Physica B:Condensed Matter, vol. 276 - 278, pp. 680 – 681, 2000.
[58] P. Gütlich, E. Bill, and A. X. Trautwein, Mössbauer Spectroscopy andTransition Metal Chemistry: Fundamentals and Applications. Springer BerlinHeidelberg, 2011.
[59] V. Ovchinnikov, Mössbauer Analysis of the Atomic and Magnetic Structure ofAlloys. Cambridge International Science Publishing, 2007.
[60] J. P. Perdew, K. Burke, and M. Ernzerhof, “Generalized GradientApproximation Made Simple,” Physical Review Letters, vol. 77,pp. 3865–3868, Oct 1996.
[61] H. Ebert, D. Ködderitzsch, and J. Minár, “Calculating condensed matterproperties using the KKR-Green’s function method-recent developments andapplications,” Reports on Progress in Physics, vol. 74, no. 9, p. 096501, 2011.
69

[62] B. Skubic, J. Hellsvik, L. Nordström, and O. Eriksson, “A method for atomisticspin dynamics simulations: implementation and examples,” Journal of Physics:Condensed Matter, vol. 20, no. 31, p. 315203, 2008.
[63] G. Kresse and J. Furthmüller, “Efficient iterative schemes for ab initiototal-energy calculations using a plane-wave basis set,” Phys. Rev. B, vol. 54,pp. 11169–11186, Oct 1996.
[64] K. Maex, G. Ghosh, L. Delaey, V. Probst, P. Lippens, L. van den Hove, and R. F.De Keersmaecker, “Stability of As and B doped Si with respect to overlayingCoSi2 and TiSi2 thin films,” Journal of Materials Research, vol. 4, no. 5,pp. 1209 – 1217, 1989.
[65] V. K. Pecharsky and K. A. Gschneidner Jr, “Magnetocaloric effect and magneticrefrigeration,” Journal of Magnetism and Magnetic Materials, vol. 200, no. 1,pp. 44 – 56, 1999.
[66] E. Brück, “Developments in magnetocaloric refrigeration,” Journal of PhysicsD: Applied Physics, vol. 38, no. 23, pp. R381 – R391, 2005.
[67] J. L. Hoard, S. Geller, and R. E. Hughes, “On the structure of elementaryboron,” Journal of the American Chemical Society, vol. 73, no. 4,pp. 1892–1893, 1951.
[68] L. Caron, M. Hudl, V. Höglin, N. H. Dung, C. P. Gomez, M. Sahlberg, E. Brück,Y. Andersson, and P. Nordblad, “Magnetocrystalline anisotropy and themagnetocaloric effect in Fe2P,” Phys. Rev. B, vol. 88, p. 094440, Sep 2013.
70


Acta Universitatis UpsaliensisDigital Comprehensive Summaries of Uppsala Dissertationsfrom the Faculty of Science and Technology 1585
Editor: The Dean of the Faculty of Science and Technology
A doctoral dissertation from the Faculty of Science andTechnology, Uppsala University, is usually a summary of anumber of papers. A few copies of the complete dissertationare kept at major Swedish research libraries, while thesummary alone is distributed internationally throughthe series Digital Comprehensive Summaries of UppsalaDissertations from the Faculty of Science and Technology.(Prior to January, 2005, the series was published under thetitle “Comprehensive Summaries of Uppsala Dissertationsfrom the Faculty of Science and Technology”.)
Distribution: publications.uu.seurn:nbn:se:uu:diva-331762
ACTAUNIVERSITATIS
UPSALIENSISUPPSALA
2017
Recommended