LPI®: Leadership Practices Inventory®
JAMES M. KOUZES & BARRY Z. POSNER
Individual Feedback Report
Prepared for Amanda Lopez | May 1, 2017
LPI Sample Report
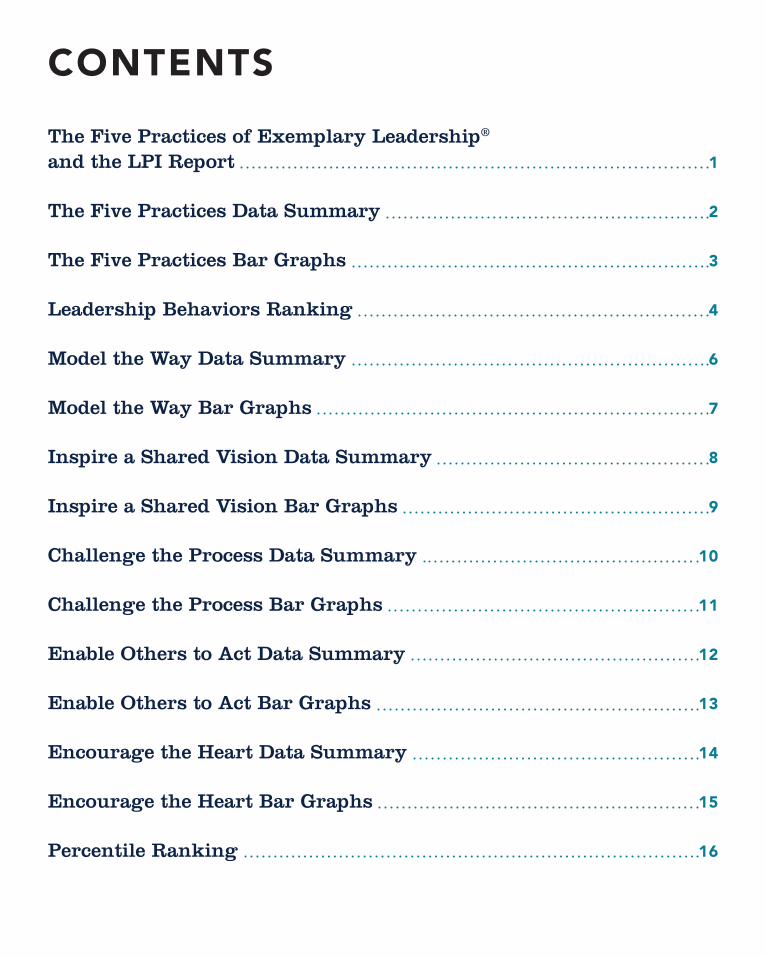
CONTENTS
The Five Practices of Exemplary Leadership® and the LPI Report 1
The Five Practices Data Summary 2
The Five Practices Bar Graphs 3
Leadership Behaviors Ranking 4
Model the Way Data Summary 6
Model the Way Bar Graphs 7
Inspire a Shared Vision Data Summary 8
Inspire a Shared Vision Bar Graphs 9
Challenge the Process Data Summary 10
Challenge the Process Bar Graphs 11
Enable Others to Act Data Summary 12
Enable Others to Act Bar Graphs 13
Encourage the Heart Data Summary 14
Encourage the Heart Bar Graphs 15
Percentile Ranking 16
LPI INDIVIDUAL REPORT
Copyright © 2017 by James M. Kouzes and Barry Z. Posner. Published by The Leadership Challenge, A Wiley Brand. All rights reserved. www.leadershipchallenge.com.
Profi le for Amanda LopezIndividual Report
May 1, 2017
PAGE 1
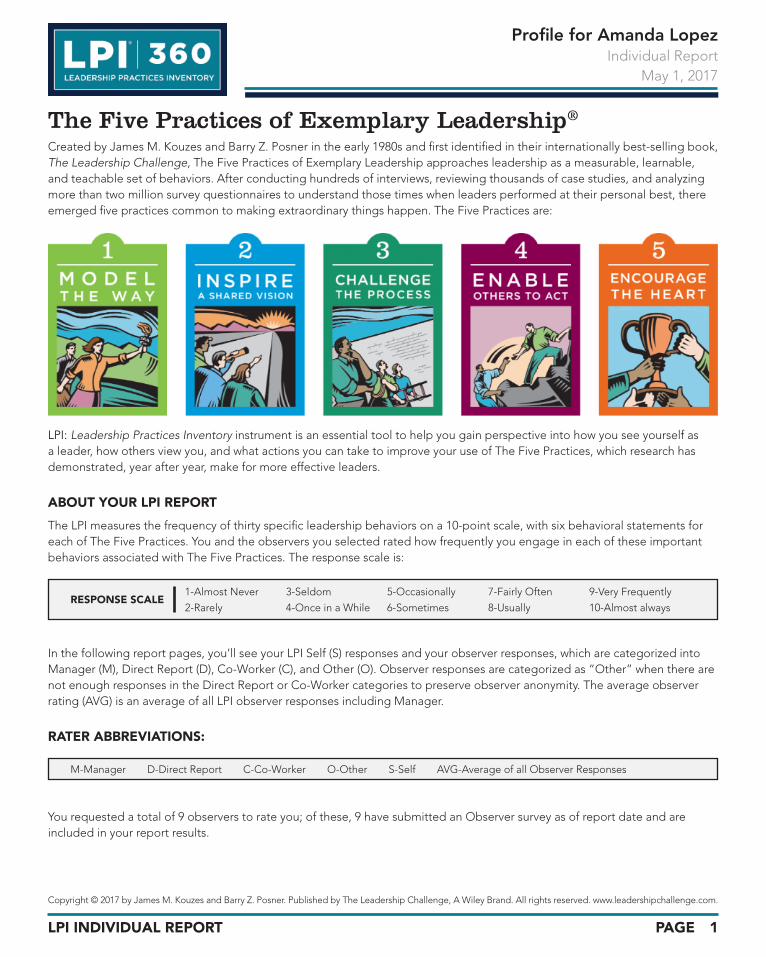
The Five Practices of Exemplary Leadership®
Created by James M. Kouzes and Barry Z. Posner in the early 1980s and fi rst identifi ed in their internationally best-selling book, The Leadership Challenge, The Five Practices of Exemplary Leadership approaches leadership as a measurable, learnable, and teachable set of behaviors. After conducting hundreds of interviews, reviewing thousands of case studies, and analyzing more than two million survey questionnaires to understand those times when leaders performed at their personal best, there emerged fi ve practices common to making extraordinary things happen. The Five Practices are:
LPI: Leadership Practices Inventory instrument is an essential tool to help you gain perspective into how you see yourself as a leader, how others view you, and what actions you can take to improve your use of The Five Practices, which research has demonstrated, year after year, make for more effective leaders.
ABOUT YOUR LPI REPORT
The LPI measures the frequency of thirty specifi c leadership behaviors on a 10-point scale, with six behavioral statements for each of The Five Practices. You and the observers you selected rated how frequently you engage in each of these important behaviors associated with The Five Practices. The response scale is:
In the following report pages, you’ll see your LPI Self (S) responses and your observer responses, which are categorized into Manager (M), Direct Report (D), Co-Worker (C), and Other (O). Observer responses are categorized as “Other” when there are not enough responses in the Direct Report or Co-Worker categories to preserve observer anonymity. The average observer rating (AVG) is an average of all LPI observer responses including Manager.
RATER ABBREVIATIONS:
You requested a total of 9 observers to rate you; of these, 9 have submitted an Observer survey as of report date and are included in your report results.
M-Manager D-Direct Report C-Co-Worker O-Other S-Self AVG-Average of all Observer Responses
RESPONSE SCALE 1-Almost Never 3-Seldom 5-Occasionally 7-Fairly Often 9-Very Frequently
2-Rarely 4-Once in a While 6-Sometimes 8-Usually 10-Almost always
LPI INDIVIDUAL REPORT
Copyright © 2017 by James M. Kouzes and Barry Z. Posner. Published by The Leadership Challenge, A Wiley Brand. All rights reserved. www.leadershipchallenge.com.
Profi le for Amanda LopezIndividual Report
May 1, 2017
PAGE 2
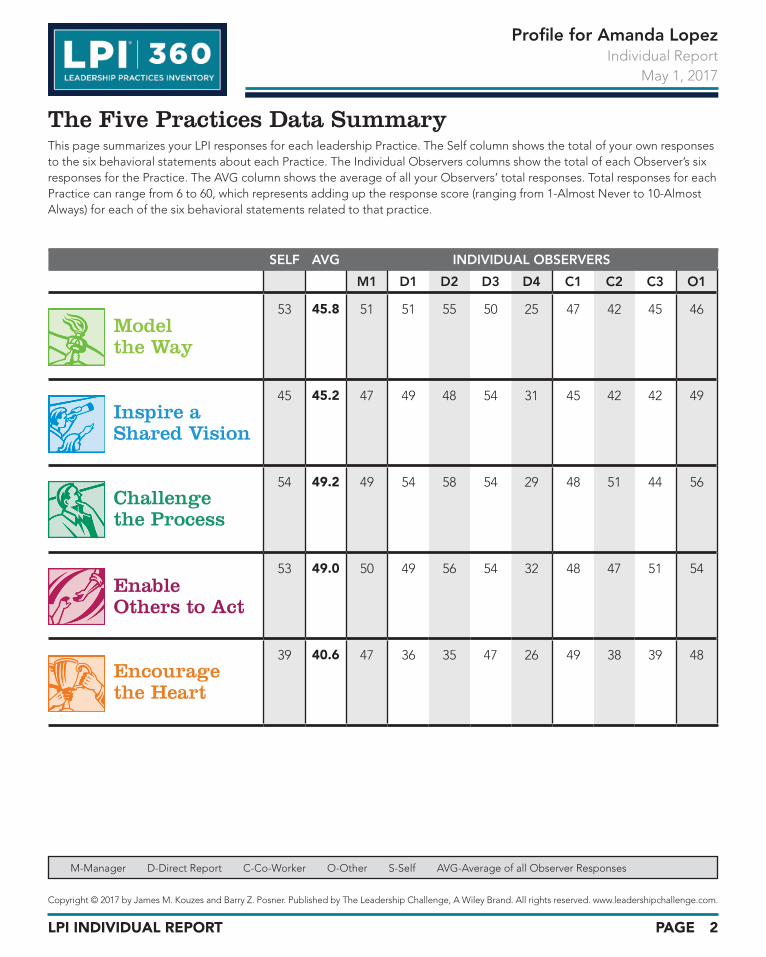
The Five Practices Data SummaryThis page summarizes your LPI responses for each leadership Practice. The Self column shows the total of your own responses to the six behavioral statements about each Practice. The Individual Observers columns show the total of each Observer’s six responses for the Practice. The AVG column shows the average of all your Observers’ total responses. Total responses for each Practice can range from 6 to 60, which represents adding up the response score (ranging from 1-Almost Never to 10-Almost Always) for each of the six behavioral statements related to that practice.
SELF AVG INDIVIDUAL OBSERVERS
M1 D1 D2 D3 D4 C1 C2 C3 O1
53 45.8 51 51 55 50 25 47 42 45 46
45 45.2 47 49 48 54 31 45 42 42 49
54 49.2 49 54 58 54 29 48 51 44 56
53 49.0 50 49 56 54 32 48 47 51 54
39 40.6 47 36 35 47 26 49 38 39 48
M-Manager D-Direct Report C-Co-Worker O-Other S-Self AVG-Average of all Observer Responses
Modelthe Way
Inspire aShared Vision
Challengethe Process
EnableOthers to Act
Encouragethe Heart
LPI INDIVIDUAL REPORT
Copyright © 2017 by James M. Kouzes and Barry Z. Posner. Published by The Leadership Challenge, A Wiley Brand. All rights reserved. www.leadershipchallenge.com.
Profi le for Amanda LopezIndividual Report
May 1, 2017
PAGE 3
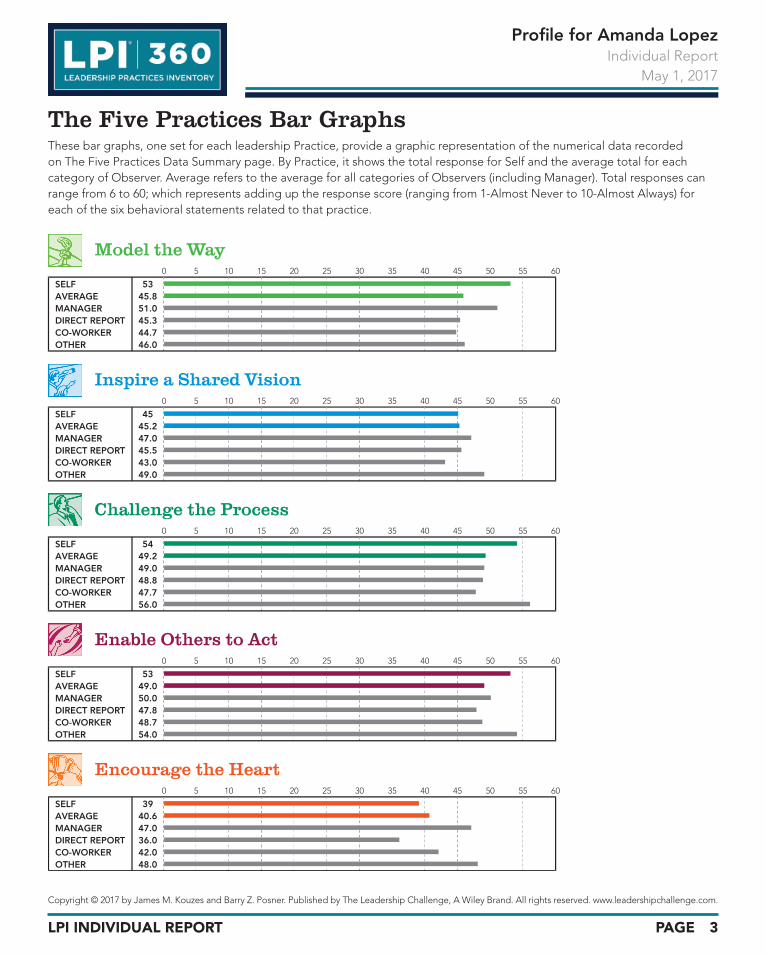
The Five Practices Bar GraphsThese bar graphs, one set for each leadership Practice, provide a graphic representation of the numerical data recorded on The Five Practices Data Summary page. By Practice, it shows the total response for Self and the average total for each category of Observer. Average refers to the average for all categories of Observers (including Manager). Total responses can range from 6 to 60; which represents adding up the response score (ranging from 1-Almost Never to 10-Almost Always) for each of the six behavioral statements related to that practice.
0 5 10 15 20 25 30 35 40 45 50 55 60
SELF 53AVERAGE 45.8MANAGER 51.0DIRECT REPORT 45.3CO-WORKER 44.7OTHER 46.0
0 5 10 15 20 25 30 35 40 45 50 55 60
SELF 45AVERAGE 45.2MANAGER 47.0DIRECT REPORT 45.5CO-WORKER 43.0OTHER 49.0
0 5 10 15 20 25 30 35 40 45 50 55 60
SELF 54AVERAGE 49.2MANAGER 49.0DIRECT REPORT 48.8CO-WORKER 47.7OTHER 56.0
0 5 10 15 20 25 30 35 40 45 50 55 60
SELF 53AVERAGE 49.0MANAGER 50.0DIRECT REPORT 47.8CO-WORKER 48.7OTHER 54.0
0 5 10 15 20 25 30 35 40 45 50 55 60
SELF 39AVERAGE 40.6MANAGER 47.0DIRECT REPORT 36.0CO-WORKER 42.0OTHER 48.0
LPI INDIVIDUAL REPORT
Copyright © 2017 by James M. Kouzes and Barry Z. Posner. Published by The Leadership Challenge, A Wiley Brand. All rights reserved. www.leadershipchallenge.com.
Profi le for Amanda LopezIndividual Report
May 1, 2017
PAGE 4
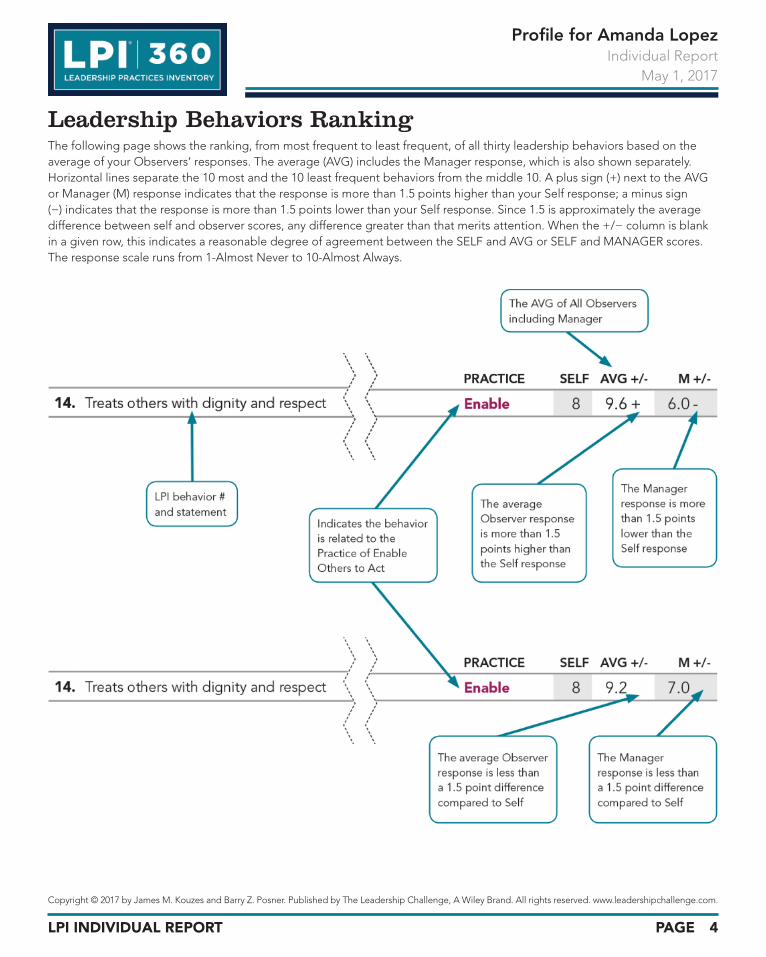
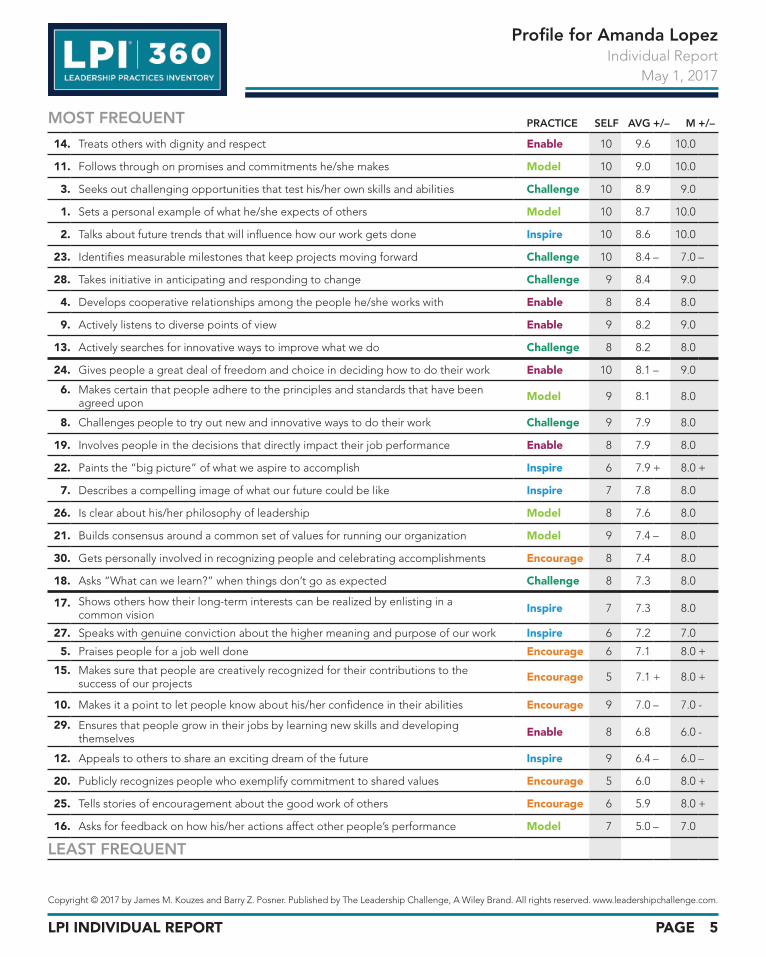
Leadership Behaviors RankingThe following page shows the ranking, from most frequent to least frequent, of all thirty leadership behaviors based on the average of your Observers’ responses. The average (AVG) includes the Manager response, which is also shown separately. Horizontal lines separate the 10 most and the 10 least frequent behaviors from the middle 10. A plus sign (+) next to the AVG or Manager (M) response indicates that the response is more than 1.5 points higher than your Self response; a minus sign (−) indicates that the response is more than 1.5 points lower than your Self response. Since 1.5 is approximately the average difference between self and observer scores, any difference greater than that merits attention. When the +/− column is blank in a given row, this indicates a reasonable degree of agreement between the SELF and AVG or SELF and MANAGER scores. The response scale runs from 1-Almost Never to 10-Almost Always.
LPI INDIVIDUAL REPORT
Copyright © 2017 by James M. Kouzes and Barry Z. Posner. Published by The Leadership Challenge, A Wiley Brand. All rights reserved. www.leadershipchallenge.com.
Profi le for Amanda LopezIndividual Report
May 1, 2017
PAGE 5
PRACTICE SELF AVG +/– M +/–
14. Treats others with dignity and respect Enable 10 9.6 10.0
11. Follows through on promises and commitments he/she makes Model 10 9.0 10.0
3. Seeks out challenging opportunities that test his/her own skills and abilities Challenge 10 8.9 9.0
1. Sets a personal example of what he/she expects of others Model 10 8.7 10.0
2. Talks about future trends that will influence how our work gets done Inspire 10 8.6 10.0
23. Identifi es measurable milestones that keep projects moving forward Challenge 10 8.4 – 7.0 –
28. Takes initiative in anticipating and responding to change Challenge 9 8.4 9.0
4. Develops cooperative relationships among the people he/she works with Enable 8 8.4 8.0
9. Actively listens to diverse points of view Enable 9 8.2 9.0
13. Actively searches for innovative ways to improve what we do Challenge 8 8.2 8.0
24. Gives people a great deal of freedom and choice in deciding how to do their work Enable 10 8.1 – 9.0
6. Makes certain that people adhere to the principles and standards that have been agreed upon Model 9 8.1 8.0
8. Challenges people to try out new and innovative ways to do their work Challenge 9 7.9 8.0
19. Involves people in the decisions that directly impact their job performance Enable 8 7.9 8.0
22. Paints the “big picture” of what we aspire to accomplish Inspire 6 7.9 + 8.0 +
7. Describes a compelling image of what our future could be like Inspire 7 7.8 8.0
26. Is clear about his/her philosophy of leadership Model 8 7.6 8.0
21. Builds consensus around a common set of values for running our organization Model 9 7.4 – 8.0
30. Gets personally involved in recognizing people and celebrating accomplishments Encourage 8 7.4 8.0
18. Asks “What can we learn?” when things don’t go as expected Challenge 8 7.3 8.0
17. Shows others how their long-term interests can be realized by enlisting in a common vision Inspire 7 7.3 8.0
27. Speaks with genuine conviction about the higher meaning and purpose of our work Inspire 6 7.2 7.0
5. Praises people for a job well done Encourage 6 7.1 8.0 +
15. Makes sure that people are creatively recognized for their contributions to the success of our projects Encourage 5 7.1 + 8.0 +
10. Makes it a point to let people know about his/her confidence in their abilities Encourage 9 7.0 – 7.0 -
29. Ensures that people grow in their jobs by learning new skills and developing themselves Enable 8 6.8 6.0 -
12. Appeals to others to share an exciting dream of the future Inspire 9 6.4 – 6.0 –
20. Publicly recognizes people who exemplify commitment to shared values Encourage 5 6.0 8.0 +
25. Tells stories of encouragement about the good work of others Encourage 6 5.9 8.0 +
16. Asks for feedback on how his/her actions affect other people’s performance Model 7 5.0 – 7.0
LEAST FREQUENT
MOST FREQUENT
LPI INDIVIDUAL REPORT
Copyright © 2017 by James M. Kouzes and Barry Z. Posner. Published by The Leadership Challenge, A Wiley Brand. All rights reserved. www.leadershipchallenge.com.
Profi le for Amanda LopezIndividual Report
May 1, 2017
PAGE 6
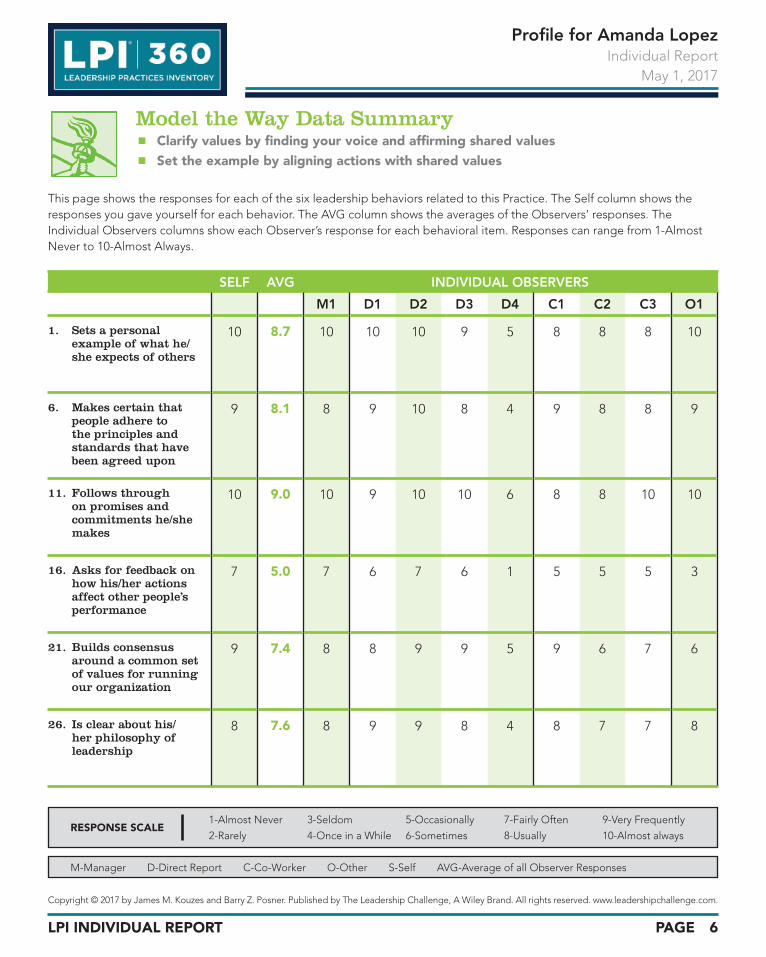
Model the Way Data Summary◾ Clarify values by fi nding your voice and affi rming shared values◾ Set the example by aligning actions with shared values
This page shows the responses for each of the six leadership behaviors related to this Practice. The Self column shows the responses you gave yourself for each behavior. The AVG column shows the averages of the Observers’ responses. The Individual Observers columns show each Observer’s response for each behavioral item. Responses can range from 1-Almost Never to 10-Almost Always.
SELF AVG INDIVIDUAL OBSERVERS
M1 D1 D2 D3 D4 C1 C2 C3 O1
1. Sets a personal example of what he/she expects of others
10 8.7 10 10 10 9 5 8 8 8 10
6. Makes certain that people adhere to the principles and standards that have been agreed upon
9 8.1 8 9 10 8 4 9 8 8 9
11. Follows through on promises and commitments he/she makes
10 9.0 10 9 10 10 6 8 8 10 10
16. Asks for feedback on how his/her actions affect other people’s performance
7 5.0 7 6 7 6 1 5 5 5 3
21. Builds consensus around a common set of values for running our organization
9 7.4 8 8 9 9 5 9 6 7 6
26. Is clear about his/her philosophy of leadership
8 7.6 8 9 9 8 4 8 7 7 8
M-Manager D-Direct Report C-Co-Worker O-Other S-Self AVG-Average of all Observer Responses
RESPONSE SCALE 1-Almost Never 3-Seldom 5-Occasionally 7-Fairly Often 9-Very Frequently
2-Rarely 4-Once in a While 6-Sometimes 8-Usually 10-Almost always
LPI INDIVIDUAL REPORT
Copyright © 2017 by James M. Kouzes and Barry Z. Posner. Published by The Leadership Challenge, A Wiley Brand. All rights reserved. www.leadershipchallenge.com.
Profi le for Amanda LopezIndividual Report
May 1, 2017
PAGE 7
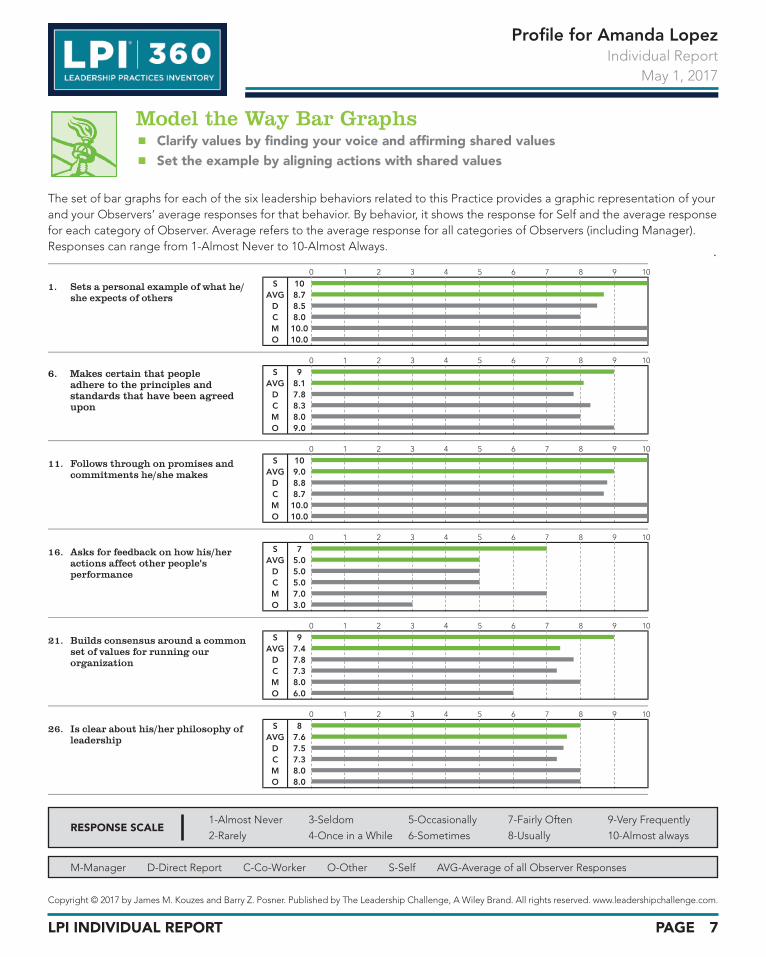
Model the Way Bar Graphs◾ Clarify values by fi nding your voice and affi rming shared values◾ Set the example by aligning actions with shared values
The set of bar graphs for each of the six leadership behaviors related to this Practice provides a graphic representation of your and your Observers’ average responses for that behavior. By behavior, it shows the response for Self and the average response for each category of Observer. Average refers to the average response for all categories of Observers (including Manager). Responses can range from 1-Almost Never to 10-Almost Always.
M-Manager D-Direct Report C-Co-Worker O-Other S-Self AVG-Average of all Observer Responses
RESPONSE SCALE 1-Almost Never 3-Seldom 5-Occasionally 7-Fairly Often 9-Very Frequently
2-Rarely 4-Once in a While 6-Sometimes 8-Usually 10-Almost always
0 1 2 3 4 5 6 7 8 9 10
S 10AVG 8.7
D 8.5C 8.0M 10.0O 10.0
0 1 2 3 4 5 6 7 8 9 10
S 9AVG 8.1
D 7.8C 8.3M 8.0O 9.0
0 1 2 3 4 5 6 7 8 9 10
S 10AVG 9.0
D 8.8C 8.7M 10.0O 10.0
0 1 2 3 4 5 6 7 8 9 10
S 7AVG 5.0
D 5.0C 5.0M 7.0O 3.0
0 1 2 3 4 5 6 7 8 9 10
S 9AVG 7.4
D 7.8C 7.3M 8.0O 6.0
0 1 2 3 4 5 6 7 8 9 10
S 8AVG 7.6
D 7.5C 7.3M 8.0O 8.0
LPI INDIVIDUAL REPORT
Copyright © 2017 by James M. Kouzes and Barry Z. Posner. Published by The Leadership Challenge, A Wiley Brand. All rights reserved. www.leadershipchallenge.com.
Profi le for Amanda LopezIndividual Report
May 1, 2017
PAGE 8
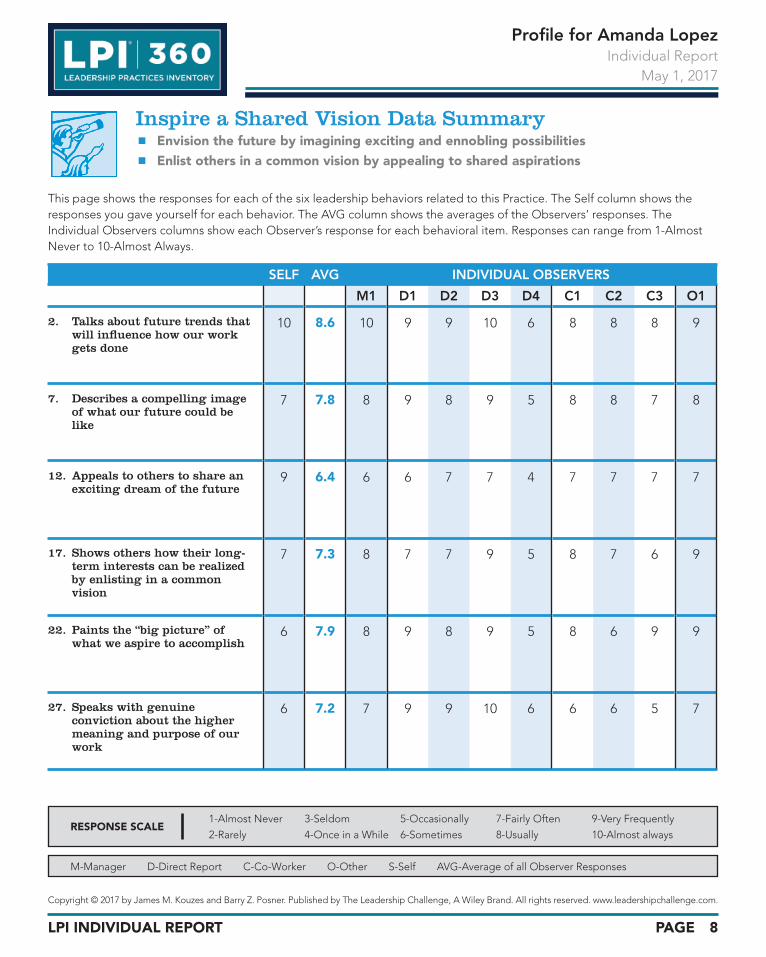
Inspire a Shared Vision Data Summary◾ Envision the future by imagining exciting and ennobling possibilities◾ Enlist others in a common vision by appealing to shared aspirations
This page shows the responses for each of the six leadership behaviors related to this Practice. The Self column shows the responses you gave yourself for each behavior. The AVG column shows the averages of the Observers’ responses. The Individual Observers columns show each Observer’s response for each behavioral item. Responses can range from 1-Almost Never to 10-Almost Always.
SELF AVG INDIVIDUAL OBSERVERS
M1 D1 D2 D3 D4 C1 C2 C3 O1
2. Talks about future trends that will infl uence how our work gets done
10 8.6 10 9 9 10 6 8 8 8 9
7. Describes a compelling image of what our future could be like
7 7.8 8 9 8 9 5 8 8 7 8
12. Appeals to others to share an exciting dream of the future
9 6.4 6 6 7 7 4 7 7 7 7
17. Shows others how their long-term interests can be realized by enlisting in a common vision
7 7.3 8 7 7 9 5 8 7 6 9
22. Paints the “big picture” of what we aspire to accomplish
6 7.9 8 9 8 9 5 8 6 9 9
27. Speaks with genuine conviction about the higher meaning and purpose of our work
6 7.2 7 9 9 10 6 6 6 5 7
M-Manager D-Direct Report C-Co-Worker O-Other S-Self AVG-Average of all Observer Responses
RESPONSE SCALE1-Almost Never 3-Seldom 5-Occasionally 7-Fairly Often 9-Very Frequently
2-Rarely 4-Once in a While 6-Sometimes 8-Usually 10-Almost always
LPI INDIVIDUAL REPORT
Copyright © 2017 by James M. Kouzes and Barry Z. Posner. Published by The Leadership Challenge, A Wiley Brand. All rights reserved. www.leadershipchallenge.com.
Profi le for Amanda LopezIndividual Report
May 1, 2017
PAGE 9
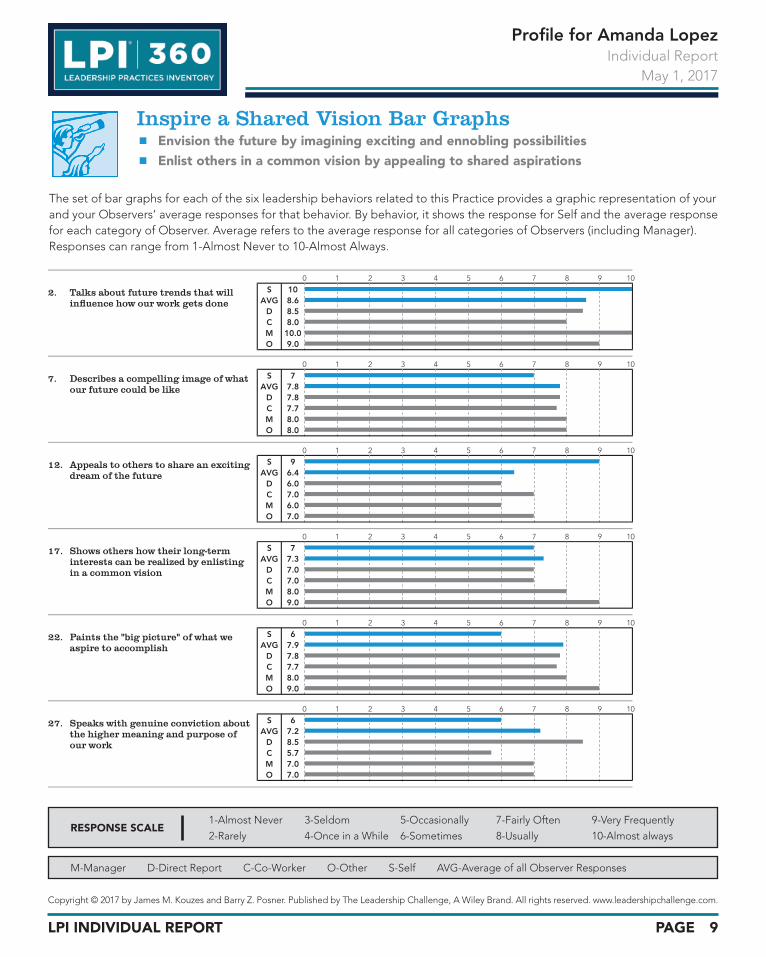
Inspire a Shared Vision Bar Graphs◾ Envision the future by imagining exciting and ennobling possibilities◾ Enlist others in a common vision by appealing to shared aspirations
The set of bar graphs for each of the six leadership behaviors related to this Practice provides a graphic representation of your and your Observers’ average responses for that behavior. By behavior, it shows the response for Self and the average response for each category of Observer. Average refers to the average response for all categories of Observers (including Manager). Responses can range from 1-Almost Never to 10-Almost Always.
M-Manager D-Direct Report C-Co-Worker O-Other S-Self AVG-Average of all Observer Responses
RESPONSE SCALE 1-Almost Never 3-Seldom 5-Occasionally 7-Fairly Often 9-Very Frequently
2-Rarely 4-Once in a While 6-Sometimes 8-Usually 10-Almost always
0 1 2 3 4 5 6 7 8 9 10
S 10AVG 8.6
D 8.5C 8.0M 10.0O 9.0
0 1 2 3 4 5 6 7 8 9 10
S 7AVG 7.8
D 7.8C 7.7M 8.0O 8.0
0 1 2 3 4 5 6 7 8 9 10
S 9AVG 6.4
D 6.0C 7.0M 6.0O 7.0
0 1 2 3 4 5 6 7 8 9 10
S 7AVG 7.3
D 7.0C 7.0M 8.0O 9.0
0 1 2 3 4 5 6 7 8 9 10
S 6AVG 7.9
D 7.8C 7.7M 8.0O 9.0
0 1 2 3 4 5 6 7 8 9 10
S 6AVG 7.2
D 8.5C 5.7M 7.0O 7.0
LPI INDIVIDUAL REPORT
Copyright © 2017 by James M. Kouzes and Barry Z. Posner. Published by The Leadership Challenge, A Wiley Brand. All rights reserved. www.leadershipchallenge.com.
Profi le for Amanda LopezIndividual Report
May 1, 2017
PAGE 10
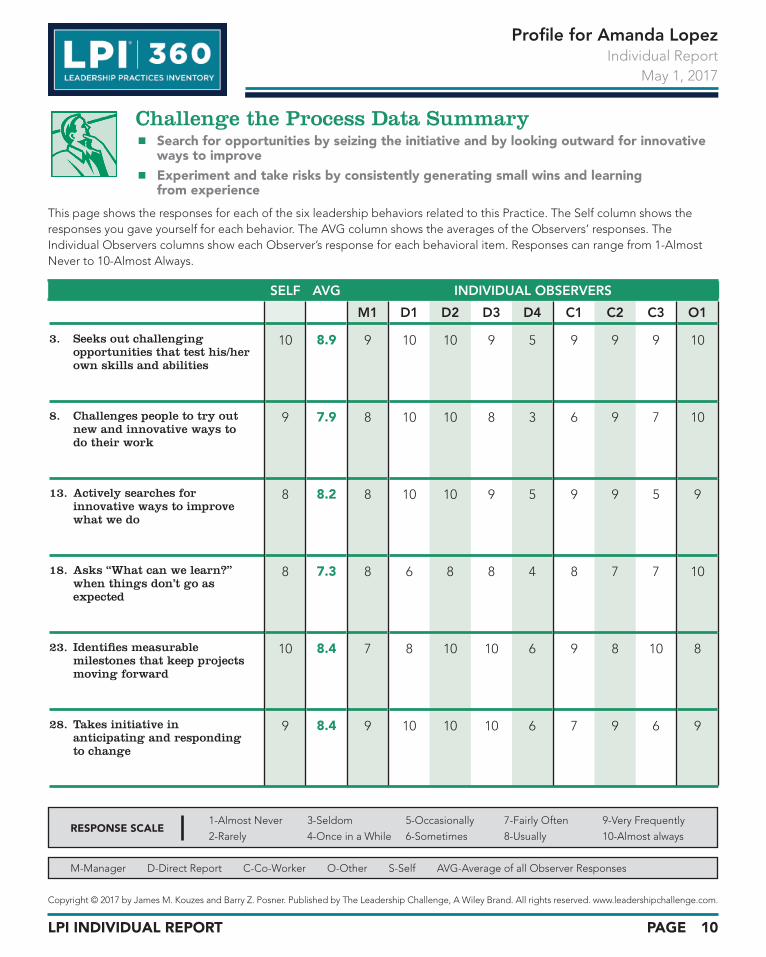
Challenge the Process Data Summary◾ Search for opportunities by seizing the initiative and by looking outward for innovative
ways to improve◾ Experiment and take risks by consistently generating small wins and learning
from experience
This page shows the responses for each of the six leadership behaviors related to this Practice. The Self column shows the responses you gave yourself for each behavior. The AVG column shows the averages of the Observers’ responses. The Individual Observers columns show each Observer’s response for each behavioral item. Responses can range from 1-Almost Never to 10-Almost Always.
SELF AVG INDIVIDUAL OBSERVERS
M1 D1 D2 D3 D4 C1 C2 C3 O1
3. Seeks out challenging opportunities that test his/her own skills and abilities
10 8.9 9 10 10 9 5 9 9 9 10
8. Challenges people to try out new and innovative ways to do their work
9 7.9 8 10 10 8 3 6 9 7 10
13. Actively searches for innovative ways to improve what we do
8 8.2 8 10 10 9 5 9 9 5 9
18. Asks “What can we learn?” when things don’t go as expected
8 7.3 8 6 8 8 4 8 7 7 10
23. Identifi es measurable milestones that keep projects moving forward
10 8.4 7 8 10 10 6 9 8 10 8
28. Takes initiative in anticipating and responding to change
9 8.4 9 10 10 10 6 7 9 6 9
M-Manager D-Direct Report C-Co-Worker O-Other S-Self AVG-Average of all Observer Responses
RESPONSE SCALE1-Almost Never 3-Seldom 5-Occasionally 7-Fairly Often 9-Very Frequently
2-Rarely 4-Once in a While 6-Sometimes 8-Usually 10-Almost always
LPI INDIVIDUAL REPORT
Copyright © 2017 by James M. Kouzes and Barry Z. Posner. Published by The Leadership Challenge, A Wiley Brand. All rights reserved. www.leadershipchallenge.com.
Profi le for Amanda LopezIndividual Report
May 1, 2017
PAGE 11
M-Manager D-Direct Report C-Co-Worker O-Other S-Self AVG-Average of all Observer Responses
RESPONSE SCALE 1-Almost Never 3-Seldom 5-Occasionally 7-Fairly Often 9-Very Frequently
2-Rarely 4-Once in a While 6-Sometimes 8-Usually 10-Almost always
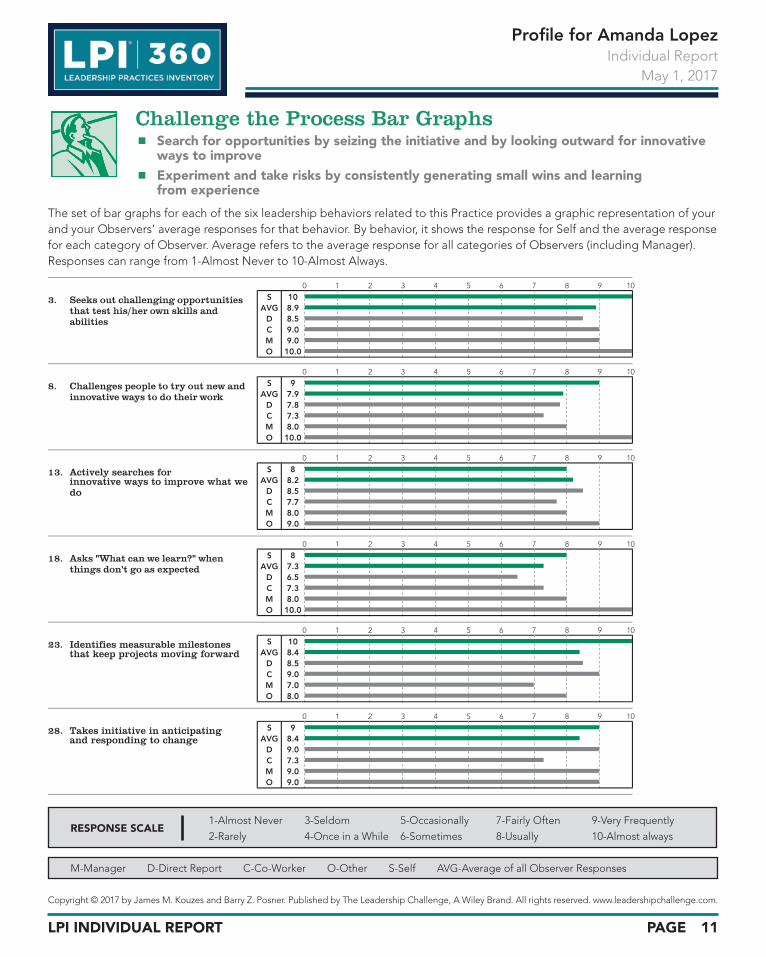
Challenge the Process Bar Graphs◾ Search for opportunities by seizing the initiative and by looking outward for innovative
ways to improve◾ Experiment and take risks by consistently generating small wins and learning
from experience
The set of bar graphs for each of the six leadership behaviors related to this Practice provides a graphic representation of your and your Observers’ average responses for that behavior. By behavior, it shows the response for Self and the average response for each category of Observer. Average refers to the average response for all categories of Observers (including Manager). Responses can range from 1-Almost Never to 10-Almost Always.
0 1 2 3 4 5 6 7 8 9 10
S 10AVG 8.9
D 8.5C 9.0M 9.0O 10.0
0 1 2 3 4 5 6 7 8 9 10
S 9AVG 7.9
D 7.8C 7.3M 8.0O 10.0
0 1 2 3 4 5 6 7 8 9 10
S 8AVG 8.2
D 8.5C 7.7M 8.0O 9.0
0 1 2 3 4 5 6 7 8 9 10
S 8AVG 7.3
D 6.5C 7.3M 8.0O 10.0
0 1 2 3 4 5 6 7 8 9 10
S 10AVG 8.4
D 8.5C 9.0M 7.0O 8.0
0 1 2 3 4 5 6 7 8 9 10
S 9AVG 8.4
D 9.0C 7.3M 9.0O 9.0
LPI INDIVIDUAL REPORT
Copyright © 2017 by James M. Kouzes and Barry Z. Posner. Published by The Leadership Challenge, A Wiley Brand. All rights reserved. www.leadershipchallenge.com.
Profi le for Amanda LopezIndividual Report
May 1, 2017
PAGE 12
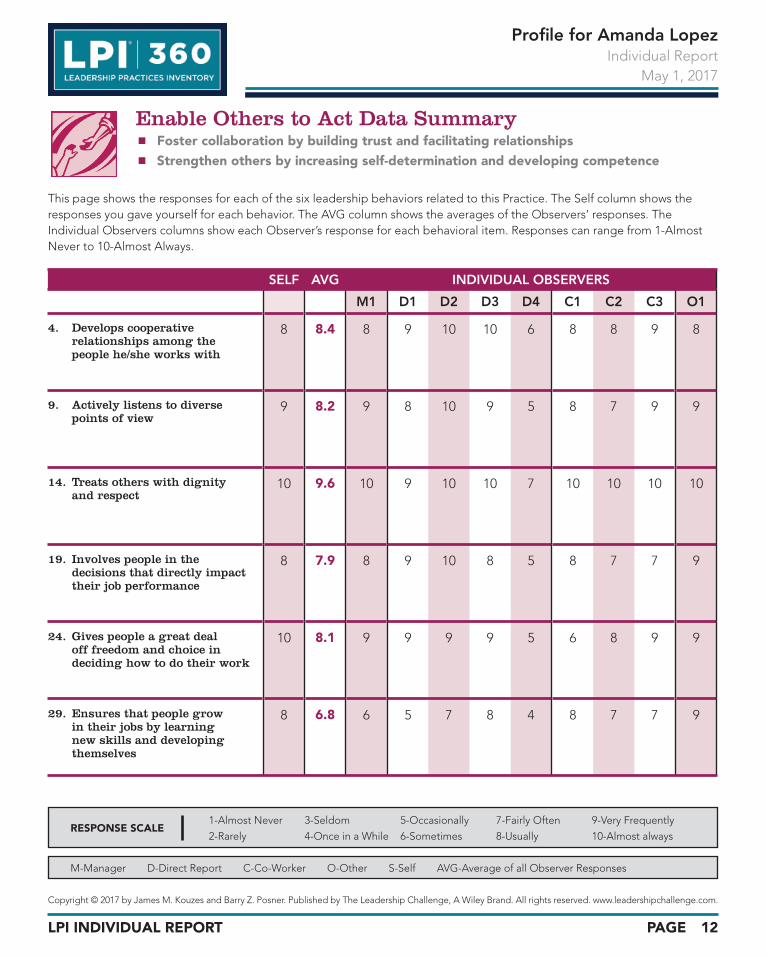
Enable Others to Act Data Summary◾ Foster collaboration by building trust and facilitating relationships◾ Strengthen others by increasing self-determination and developing competence
This page shows the responses for each of the six leadership behaviors related to this Practice. The Self column shows the responses you gave yourself for each behavior. The AVG column shows the averages of the Observers’ responses. The Individual Observers columns show each Observer’s response for each behavioral item. Responses can range from 1-Almost Never to 10-Almost Always.
SELF AVG INDIVIDUAL OBSERVERS
M1 D1 D2 D3 D4 C1 C2 C3 O1
4. Develops cooperative relationships among the people he/she works with
8 8.4 8 9 10 10 6 8 8 9 8
9. Actively listens to diverse points of view
9 8.2 9 8 10 9 5 8 7 9 9
14. Treats others with dignity and respect
10 9.6 10 9 10 10 7 10 10 10 10
19. Involves people in the decisions that directly impact their job performance
8 7.9 8 9 10 8 5 8 7 7 9
24. Gives people a great deal off freedom and choice in deciding how to do their work
10 8.1 9 9 9 9 5 6 8 9 9
29. Ensures that people grow in their jobs by learning new skills and developing themselves
8 6.8 6 5 7 8 4 8 7 7 9
M-Manager D-Direct Report C-Co-Worker O-Other S-Self AVG-Average of all Observer Responses
RESPONSE SCALE1-Almost Never 3-Seldom 5-Occasionally 7-Fairly Often 9-Very Frequently
2-Rarely 4-Once in a While 6-Sometimes 8-Usually 10-Almost always
LPI INDIVIDUAL REPORT
Copyright © 2017 by James M. Kouzes and Barry Z. Posner. Published by The Leadership Challenge, A Wiley Brand. All rights reserved. www.leadershipchallenge.com.
Profi le for Amanda LopezIndividual Report
May 1, 2017
PAGE 13
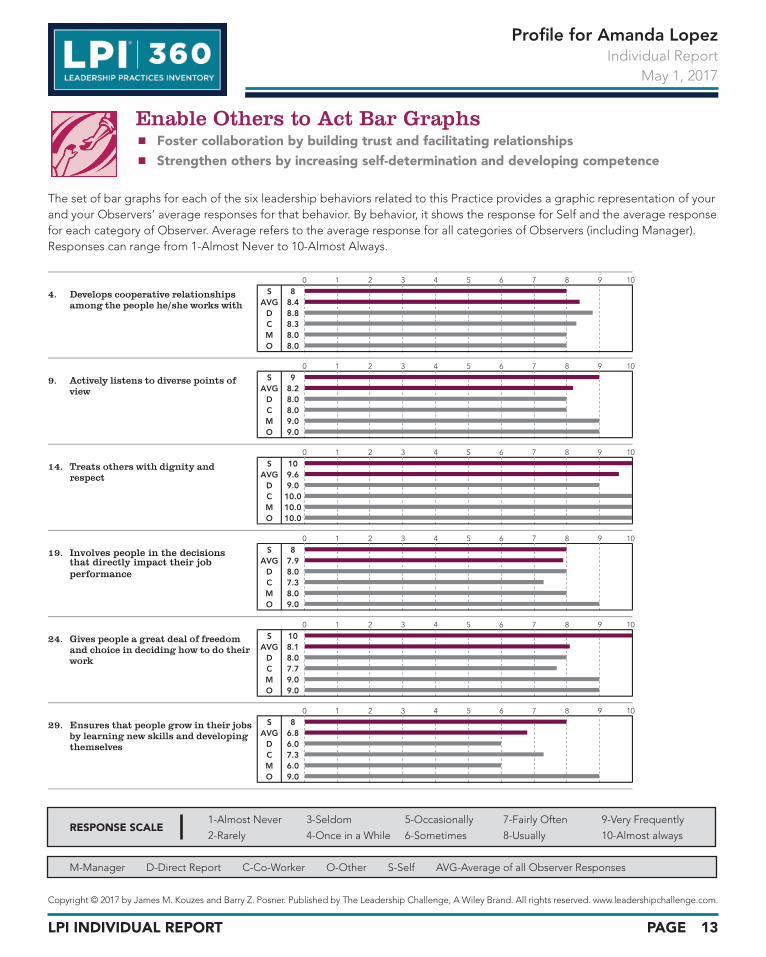
Enable Others to Act Bar Graphs◾ Foster collaboration by building trust and facilitating relationships◾ Strengthen others by increasing self-determination and developing competence
The set of bar graphs for each of the six leadership behaviors related to this Practice provides a graphic representation of your and your Observers’ average responses for that behavior. By behavior, it shows the response for Self and the average response for each category of Observer. Average refers to the average response for all categories of Observers (including Manager). Responses can range from 1-Almost Never to 10-Almost Always.
M-Manager D-Direct Report C-Co-Worker O-Other S-Self AVG-Average of all Observer Responses
RESPONSE SCALE1-Almost Never 3-Seldom 5-Occasionally 7-Fairly Often 9-Very Frequently
2-Rarely 4-Once in a While 6-Sometimes 8-Usually 10-Almost always
0 1 2 3 4 5 6 7 8 9 10
S 8AVG 8.4
D 8.8C 8.3M 8.0O 8.0
0 1 2 3 4 5 6 7 8 9 10
S 9AVG 8.2
D 8.0C 8.0M 9.0O 9.0
0 1 2 3 4 5 6 7 8 9 10
S 10AVG 9.6
D 9.0C 10.0M 10.0O 10.0
0 1 2 3 4 5 6 7 8 9 10
S 8AVG 7.9
D 8.0C 7.3M 8.0O 9.0
0 1 2 3 4 5 6 7 8 9 10
S 10AVG 8.1
D 8.0C 7.7M 9.0O 9.0
0 1 2 3 4 5 6 7 8 9 10
S 8AVG 6.8
D 6.0C 7.3M 6.0O 9.0
LPI INDIVIDUAL REPORT
Copyright © 2017 by James M. Kouzes and Barry Z. Posner. Published by The Leadership Challenge, A Wiley Brand. All rights reserved. www.leadershipchallenge.com.
Profi le for Amanda LopezIndividual Report
May 1, 2017
PAGE 14
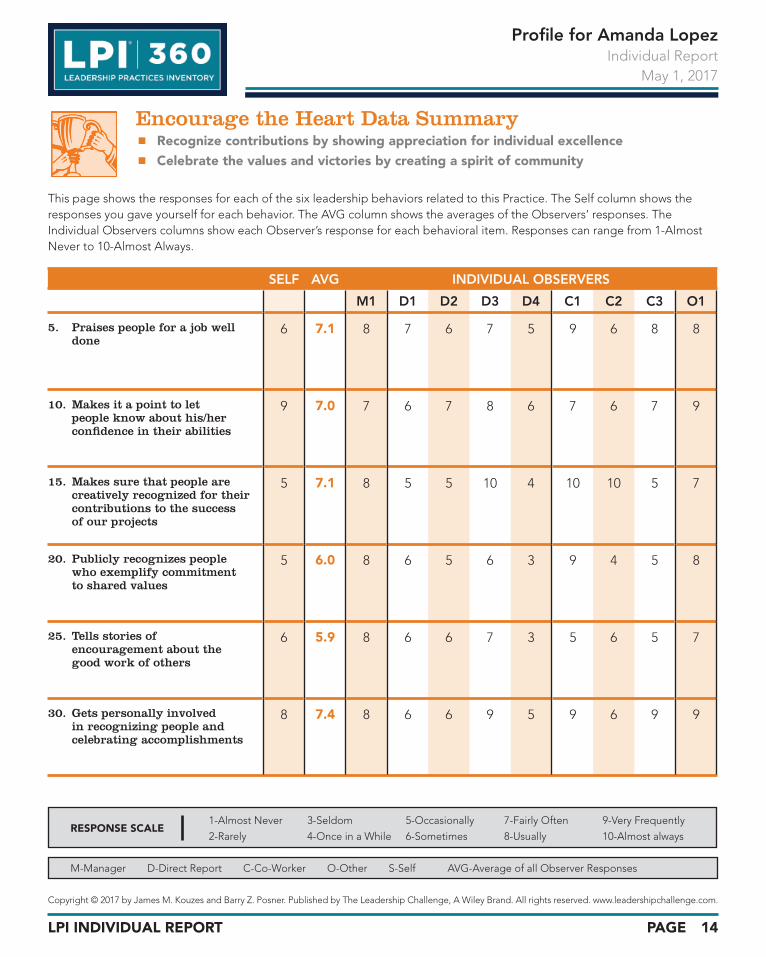
Encourage the Heart Data Summary◾ Recognize contributions by showing appreciation for individual excellence◾ Celebrate the values and victories by creating a spirit of community
This page shows the responses for each of the six leadership behaviors related to this Practice. The Self column shows the responses you gave yourself for each behavior. The AVG column shows the averages of the Observers’ responses. The Individual Observers columns show each Observer’s response for each behavioral item. Responses can range from 1-Almost Never to 10-Almost Always.
SELF AVG INDIVIDUAL OBSERVERS
M1 D1 D2 D3 D4 C1 C2 C3 O1
5. Praises people for a job well done
6 7.1 8 7 6 7 5 9 6 8 8
10. Makes it a point to let people know about his/her confi dence in their abilities
9 7.0 7 6 7 8 6 7 6 7 9
15. Makes sure that people are creatively recognized for their contributions to the success of our projects
5 7.1 8 5 5 10 4 10 10 5 7
20. Publicly recognizes people who exemplify commitment to shared values
5 6.0 8 6 5 6 3 9 4 5 8
25. Tells stories of encouragement about the good work of others
6 5.9 8 6 6 7 3 5 6 5 7
30. Gets personally involved in recognizing people and celebrating accomplishments
8 7.4 8 6 6 9 5 9 6 9 9
M-Manager D-Direct Report C-Co-Worker O-Other S-Self AVG-Average of all Observer Responses
RESPONSE SCALE1-Almost Never 3-Seldom 5-Occasionally 7-Fairly Often 9-Very Frequently
2-Rarely 4-Once in a While 6-Sometimes 8-Usually 10-Almost always
LPI INDIVIDUAL REPORT
Copyright © 2017 by James M. Kouzes and Barry Z. Posner. Published by The Leadership Challenge, A Wiley Brand. All rights reserved. www.leadershipchallenge.com.
Profi le for Amanda LopezIndividual Report
May 1, 2017
PAGE 15
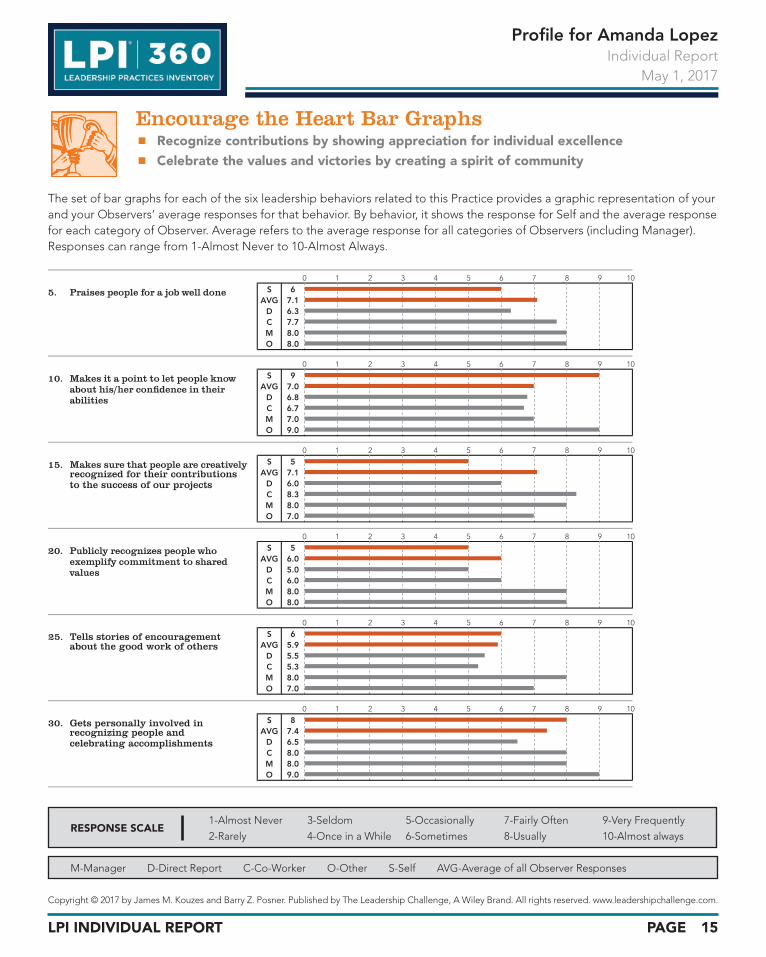
Encourage the Heart Bar Graphs◾ Recognize contributions by showing appreciation for individual excellence◾ Celebrate the values and victories by creating a spirit of community
The set of bar graphs for each of the six leadership behaviors related to this Practice provides a graphic representation of your and your Observers’ average responses for that behavior. By behavior, it shows the response for Self and the average response for each category of Observer. Average refers to the average response for all categories of Observers (including Manager). Responses can range from 1-Almost Never to 10-Almost Always.
M-Manager D-Direct Report C-Co-Worker O-Other S-Self AVG-Average of all Observer Responses
RESPONSE SCALE1-Almost Never 3-Seldom 5-Occasionally 7-Fairly Often 9-Very Frequently
2-Rarely 4-Once in a While 6-Sometimes 8-Usually 10-Almost always
0 1 2 3 4 5 6 7 8 9 10
S 6AVG 7.1
D 6.3C 7.7M 8.0O 8.0
0 1 2 3 4 5 6 7 8 9 10
S 9AVG 7.0
D 6.8C 6.7M 7.0O 9.0
0 1 2 3 4 5 6 7 8 9 10
S 5AVG 7.1
D 6.0C 8.3M 8.0O 7.0
0 1 2 3 4 5 6 7 8 9 10
S 5AVG 6.0
D 5.0C 6.0M 8.0O 8.0
0 1 2 3 4 5 6 7 8 9 10
S 6AVG 5.9
D 5.5C 5.3M 8.0O 7.0
0 1 2 3 4 5 6 7 8 9 10
S 8AVG 7.4
D 6.5C 8.0M 8.0O 9.0
LPI INDIVIDUAL REPORT
Copyright © 2017 by James M. Kouzes and Barry Z. Posner. Published by The Leadership Challenge, A Wiley Brand. All rights reserved. www.leadershipchallenge.com.
Profi le for Amanda LopezIndividual Report
May 1, 2017
PAGE 16
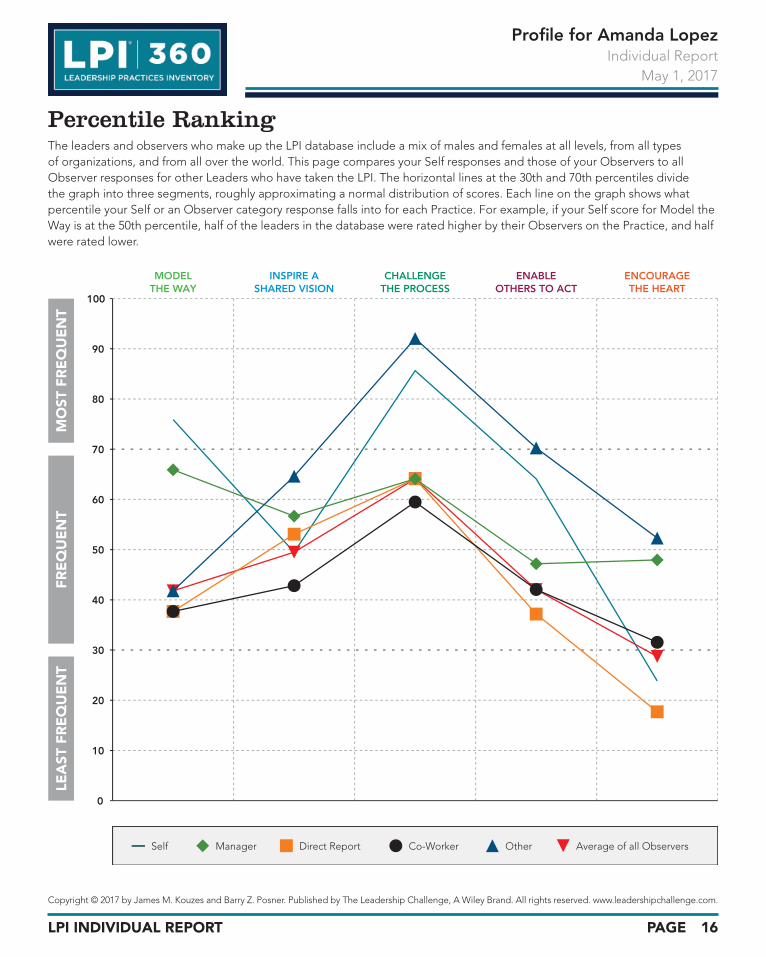
Percentile RankingThe leaders and observers who make up the LPI database include a mix of males and females at all levels, from all types of organizations, and from all over the world. This page compares your Self responses and those of your Observers to all Observer responses for other Leaders who have taken the LPI. The horizontal lines at the 30th and 70th percentiles divide the graph into three segments, roughly approximating a normal distribution of scores. Each line on the graph shows what percentile your Self or an Observer category response falls into for each Practice. For example, if your Self score for Model the Way is at the 50th percentile, half of the leaders in the database were rated higher by their Observers on the Practice, and half were rated lower.
0
10
20
30
40
50
60
70
80
90
100
MODELTHE WAY
INSPIRE ASHARED VISION
CHALLENGETHE PROCESS
ENABLEOTHERS TO ACT
ENCOURAGETHE HEART
LEA
ST F
RE
QU
EN
TFR
EQ
UE
NT
MO
ST F
RE
QU
EN
T
Self Manager Direct Report Co-Worker Other Average of all Observers
Recommended