Ain Shams Engineering Journal (2014) 5, 647–655
Ain Shams University
Ain Shams Engineering Journal
www.elsevier.com/locate/asejwww.sciencedirect.com
CIVIL ENGINEERING
Liquefaction analysis of alluvial soil deposits
in Bedsa south west of Cairo
* Tel.: +20 1001525472.
E-mail address: [email protected].
Peer review under responsibility of Ain Shams University.
Production and hosting by Elsevier
2090-4479 � 2014 Production and hosting by Elsevier B.V. on behalf of Ain Shams University.
http://dx.doi.org/10.1016/j.asej.2014.02.001
Kamal Mohamed Hafez Ismail Ibrahim *
Civil Engineering Dep., Suez Canal University, Egypt
Received 20 August 2013; revised 30 January 2014; accepted 1 February 2014
Available online 1 March 2014
KEYWORDS
Soil liquefaction;
Settlement;
Lateral spreading;
Earthquake;
Alluvial deposits
Abstract Bedsa is one of the districts in Dahshour that lays south west of Cairo and suffered from
liquefaction during October 1992 earthquake, Egypt. The soil profile consists of alluvial river Nile
deposits mainly sandy mud with low plasticity; the ground water is shallow. The earthquake hypo-
center was 18 km far away with local magnitude 5.8; the fault length was 13.8 km, as recorded by
the Egyptian national seismological network (ENSN) at Helwan. The analysis used the empirical
method introduced by the national center for earthquake engineering research (NCEER) based
on field standard penetration of soil. It is found that the studied area can liquefy since there are sat-
urated loose sandy silt layers at depth ranges from 7 to 14 m. The settlement is about 26 cm. The
probability of liquefaction ranges between 40% and 100%. The presence of impermeable surface
from medium cohesive silty clay acts as a plug resisting and trapping the upward flow of water dur-
ing liquefaction, so fountain and spouts at weak points occurs. It is wise to use point bearing piles
with foundation level deeper than 14 m beyond the liquefiable depth away from ground slopes,
otherwise liquefaction improving techniques have to be applied in the area.� 2014 Production and hosting by Elsevier B.V. on behalf of Ain Shams University.
1. Introduction
Liquefaction was first initiated by Seed [1] through experimen-tal studies on sand samples. It is the process of reduction ofshear strength for low plastic loose cohesionless soil. Pore pres-
sure buildup due to static or cyclic stress applications. The soillooses contact between its grains and upward flow of watertakes place. If the magnitude of pore-water pressure generated
equals the total vertical stress, the effective stress becomes zero
and the soil is said to have liquefied. The possibility of itsoccurrence depends on the initial void ratio or relative densityof sand and the confining pressure (Seed [1]). Formation of
sand boils and mud-spouts at the ground surface by seepageof water through ground cracks or in some cases by the devel-opment of quick sand conditions over substantial areas (Seed
and Idriss [2]). Housner and Jennings [3] discussed the forma-tion of sand boils in terms of soil porosity, permeability, elas-ticity, and degree of consolidation. Sand boils were attributedto non-homogeneity in permeability near the ground surface.
Scott and Zuckerman [4] presented both experimental andanalytical studies on the mechanics of liquefaction and sandboil formation in sandy soil deposits. They found that the pres-
ence of silt or a similar fine grained layer at the surface (above
648 K.M.H.I. Ibrahim
the liquefied layer) is conducive to the generation of sand boils.In contrast to ‘‘piping’’, sand boils were observed to propagatefrom the source of pressure to the outlet by a mechanism of
cavity formation. Adalier [5] also demonstrated that stratifiedsoil profiles are conducive to sand boil formation. It wasshown that low permeability and cohesion of an overlying
upper layer may lead to the formation of large sand boils, asthe extruded water mainly travels through cracks and weakzones within this upper layer.
Cyclic testing of a wide range of soils found to liquefy inAdapazari during the Kocaeli earthquake confirmed that thesefine-grained soils were susceptible to liquefaction. It is not theamount of ‘‘clay-size’’ particles in the soil; rather, it is the
amount and type of clay minerals in the soil that best indicateliquefaction susceptibility (Bray et al. [6]).
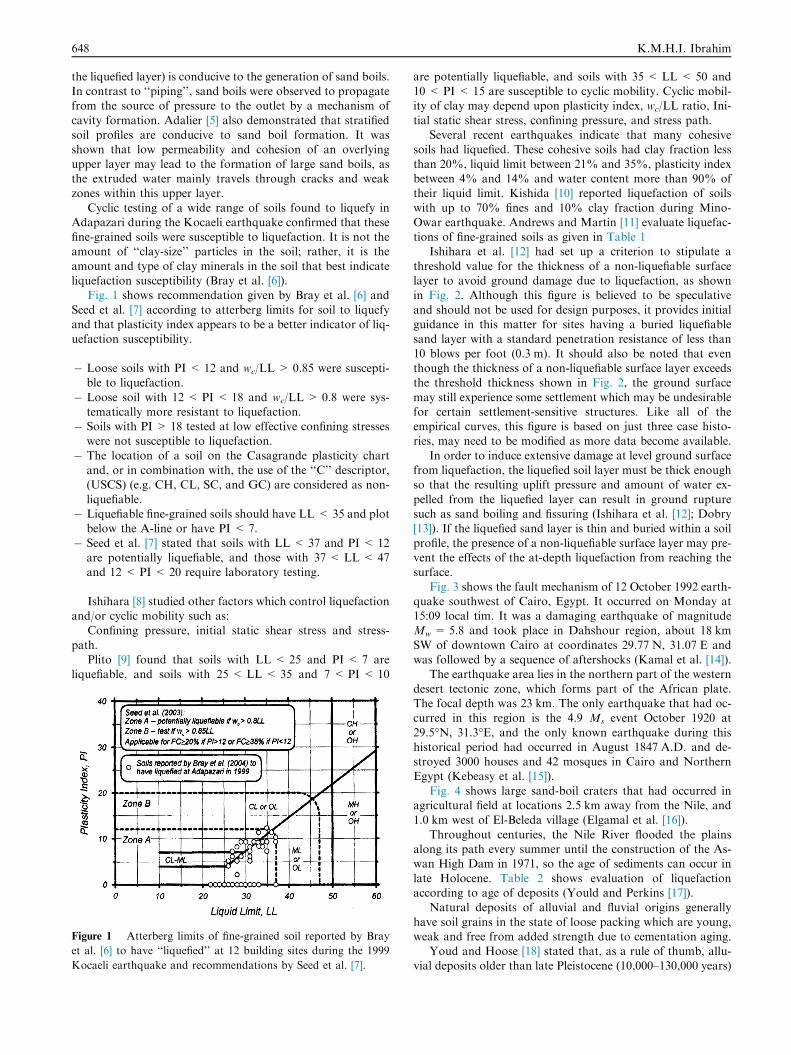
Fig. 1 shows recommendation given by Bray et al. [6] and
Seed et al. [7] according to atterberg limits for soil to liquefyand that plasticity index appears to be a better indicator of liq-uefaction susceptibility.
� Loose soils with PI < 12 and wc/LL > 0.85 were suscepti-ble to liquefaction.
� Loose soil with 12 < PI < 18 and wc/LL > 0.8 were sys-tematically more resistant to liquefaction.
� Soils with PI > 18 tested at low effective confining stresseswere not susceptible to liquefaction.
� The location of a soil on the Casagrande plasticity chartand, or in combination with, the use of the ‘‘C’’ descriptor,(USCS) (e.g. CH, CL, SC, and GC) are considered as non-
liquefiable.� Liquefiable fine-grained soils should have LL < 35 and plot
below the A-line or have PI < 7.
� Seed et al. [7] stated that soils with LL < 37 and PI < 12are potentially liquefiable, and those with 37 < LL< 47and 12 < PI < 20 require laboratory testing.
Ishihara [8] studied other factors which control liquefactionand/or cyclic mobility such as:
Confining pressure, initial static shear stress and stress-
path.Plito [9] found that soils with LL < 25 and PI < 7 are
liquefiable, and soils with 25 < LL< 35 and 7 < PI < 10
Figure 1 Atterberg limits of fine-grained soil reported by Bray
et al. [6] to have ‘‘liquefied’’ at 12 building sites during the 1999
Kocaeli earthquake and recommendations by Seed et al. [7].
are potentially liquefiable, and soils with 35 < LL < 50 and10 < PI < 15 are susceptible to cyclic mobility. Cyclic mobil-ity of clay may depend upon plasticity index, wc/LL ratio, Ini-
tial static shear stress, confining pressure, and stress path.Several recent earthquakes indicate that many cohesive
soils had liquefied. These cohesive soils had clay fraction less
than 20%, liquid limit between 21% and 35%, plasticity indexbetween 4% and 14% and water content more than 90% oftheir liquid limit. Kishida [10] reported liquefaction of soils
with up to 70% fines and 10% clay fraction during Mino-Owar earthquake. Andrews and Martin [11] evaluate liquefac-tions of fine-grained soils as given in Table 1
Ishihara et al. [12] had set up a criterion to stipulate a
threshold value for the thickness of a non-liquefiable surfacelayer to avoid ground damage due to liquefaction, as shownin Fig. 2. Although this figure is believed to be speculative
and should not be used for design purposes, it provides initialguidance in this matter for sites having a buried liquefiablesand layer with a standard penetration resistance of less than
10 blows per foot (0.3 m). It should also be noted that eventhough the thickness of a non-liquefiable surface layer exceedsthe threshold thickness shown in Fig. 2, the ground surface
may still experience some settlement which may be undesirablefor certain settlement-sensitive structures. Like all of theempirical curves, this figure is based on just three case histo-ries, may need to be modified as more data become available.
In order to induce extensive damage at level ground surfacefrom liquefaction, the liquefied soil layer must be thick enoughso that the resulting uplift pressure and amount of water ex-
pelled from the liquefied layer can result in ground rupturesuch as sand boiling and fissuring (Ishihara et al. [12]; Dobry[13]). If the liquefied sand layer is thin and buried within a soil
profile, the presence of a non-liquefiable surface layer may pre-vent the effects of the at-depth liquefaction from reaching thesurface.
Fig. 3 shows the fault mechanism of 12 October 1992 earth-quake southwest of Cairo, Egypt. It occurred on Monday at15:09 local tim. It was a damaging earthquake of magnitudeMw = 5.8 and took place in Dahshour region, about 18 km
SW of downtown Cairo at coordinates 29.77 N, 31.07 E andwas followed by a sequence of aftershocks (Kamal et al. [14]).
The earthquake area lies in the northern part of the western
desert tectonic zone, which forms part of the African plate.The focal depth was 23 km. The only earthquake that had oc-curred in this region is the 4.9 Ms event October 1920 at
29.5�N, 31.3�E, and the only known earthquake during thishistorical period had occurred in August 1847 A.D. and de-stroyed 3000 houses and 42 mosques in Cairo and NorthernEgypt (Kebeasy et al. [15]).
Fig. 4 shows large sand-boil craters that had occurred inagricultural field at locations 2.5 km away from the Nile, and1.0 km west of El-Beleda village (Elgamal et al. [16]).
Throughout centuries, the Nile River flooded the plainsalong its path every summer until the construction of the As-wan High Dam in 1971, so the age of sediments can occur in
late Holocene. Table 2 shows evaluation of liquefactionaccording to age of deposits (Yould and Perkins [17]).
Natural deposits of alluvial and fluvial origins generally
have soil grains in the state of loose packing which are young,weak and free from added strength due to cementation aging.
Youd and Hoose [18] stated that, as a rule of thumb, allu-vial deposits older than late Pleistocene (10,000–130,000 years)
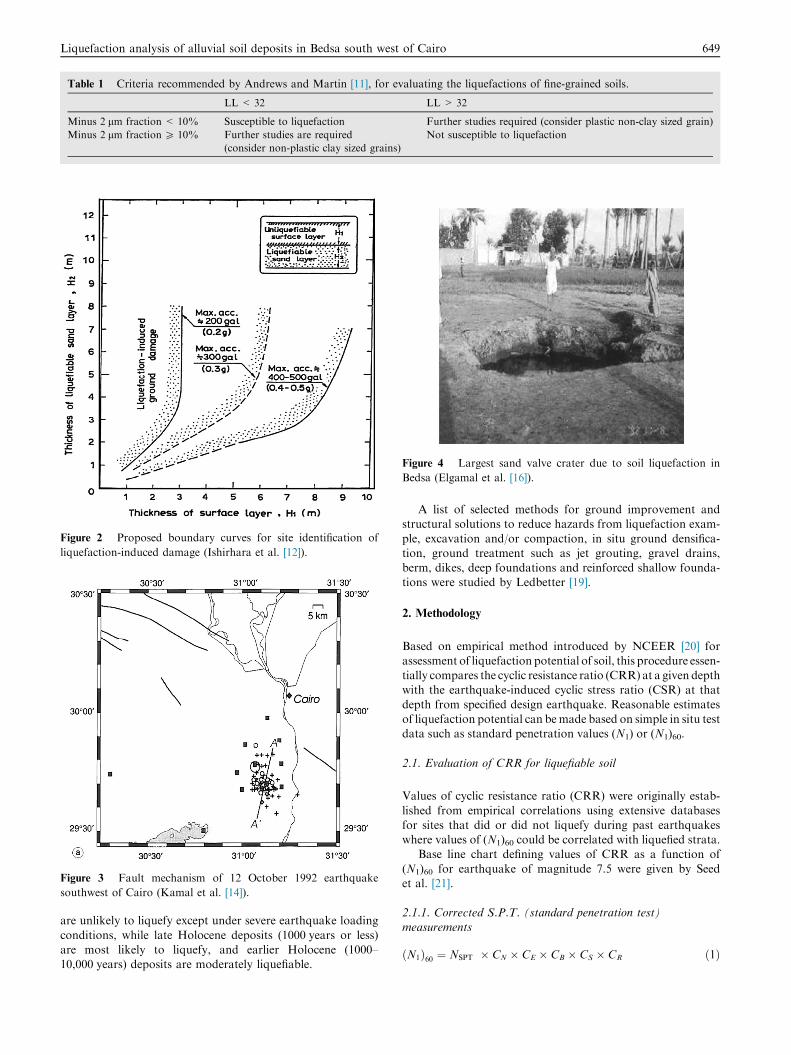
Figure 2 Proposed boundary curves for site identification of
liquefaction-induced damage (Ishirhara et al. [12]).
Figure 3 Fault mechanism of 12 October 1992 earthquake
southwest of Cairo (Kamal et al. [14]).
Figure 4 Largest sand valve crater due to soil liquefaction in
Bedsa (Elgamal et al. [16]).
Table 1 Criteria recommended by Andrews and Martin [11], for evaluating the liquefactions of fine-grained soils.
LL < 32 LL > 32
Minus 2 lm fraction < 10% Susceptible to liquefaction Further studies required (consider plastic non-clay sized grain)
Minus 2 lm fraction P 10% Further studies are required
(consider non-plastic clay sized grains)
Not susceptible to liquefaction
Liquefaction analysis of alluvial soil deposits in Bedsa south west of Cairo 649
are unlikely to liquefy except under severe earthquake loading
conditions, while late Holocene deposits (1000 years or less)are most likely to liquefy, and earlier Holocene (1000–10,000 years) deposits are moderately liquefiable.
A list of selected methods for ground improvement andstructural solutions to reduce hazards from liquefaction exam-
ple, excavation and/or compaction, in situ ground densifica-tion, ground treatment such as jet grouting, gravel drains,berm, dikes, deep foundations and reinforced shallow founda-tions were studied by Ledbetter [19].
2. Methodology
Based on empirical method introduced by NCEER [20] forassessment of liquefaction potential of soil, this procedure essen-tially compares the cyclic resistance ratio (CRR) at a given depthwith the earthquake-induced cyclic stress ratio (CSR) at that
depth from specified design earthquake. Reasonable estimatesof liquefaction potential can bemade based on simple in situ testdata such as standard penetration values (N1) or (N1)60.
2.1. Evaluation of CRR for liquefiable soil
Values of cyclic resistance ratio (CRR) were originally estab-
lished from empirical correlations using extensive databasesfor sites that did or did not liquefy during past earthquakeswhere values of (N1)60 could be correlated with liquefied strata.
Base line chart defining values of CRR as a function of
(N1)60 for earthquake of magnitude 7.5 were given by Seedet al. [21].
2.1.1. Corrected S.P.T. (standard penetration test)measurements
ðN1Þ60 ¼ NSPT � CN � CE � CB � CS � CR ð1Þ
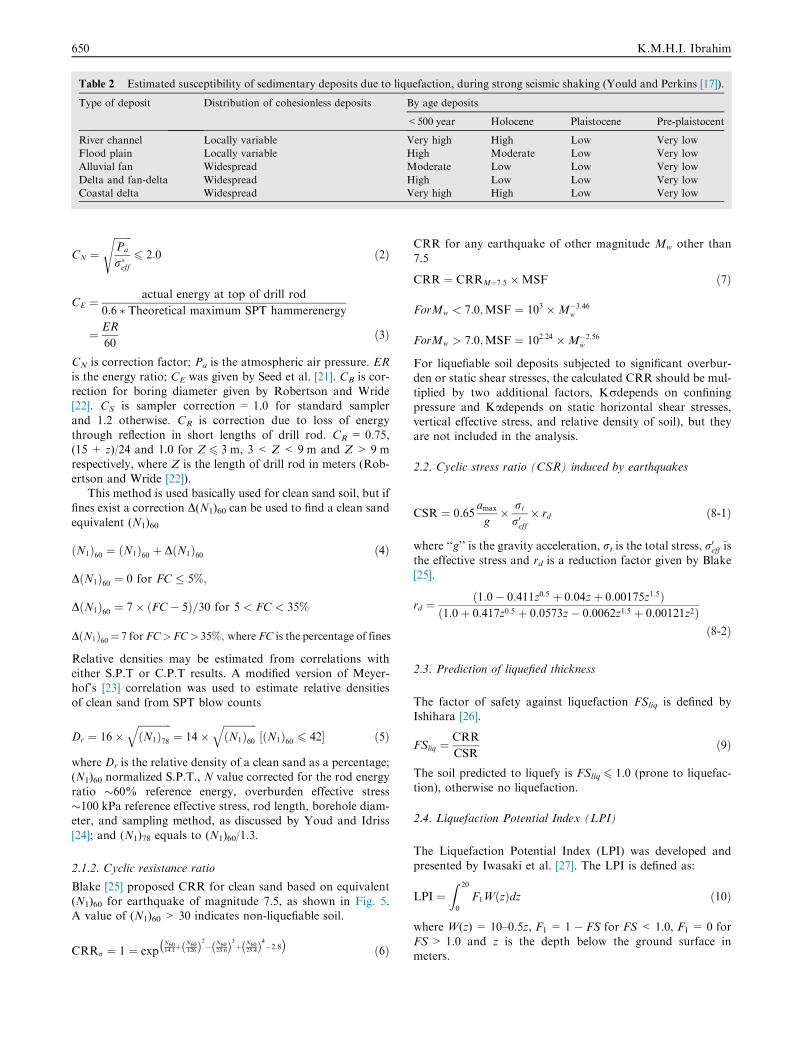
Table 2 Estimated susceptibility of sedimentary deposits due to liquefaction, during strong seismic shaking (Yould and Perkins [17]).
Type of deposit Distribution of cohesionless deposits By age deposits
<500 year Holocene Plaistocene Pre-plaistocent
River channel Locally variable Very high High Low Very low
Flood plain Locally variable High Moderate Low Very low
Alluvial fan Widespread Moderate Low Low Very low
Delta and fan-delta Widespread High Low Low Very low
Coastal delta Widespread Very high High Low Very low
650 K.M.H.I. Ibrahim
CN ¼ffiffiffiffiffiffiffiPa
r�eff
s6 2:0 ð2Þ
CE ¼actual energy at top of drill rod
0:6 � Theoretical maximum SPT hammerenergy
¼ ER
60ð3Þ
CN is correction factor; Pa is the atmospheric air pressure. ER
is the energy ratio; CE was given by Seed et al. [21]. CB is cor-rection for boring diameter given by Robertson and Wride[22]. CS is sampler correction = 1.0 for standard samplerand 1.2 otherwise. CR is correction due to loss of energy
through reflection in short lengths of drill rod. CR = 0.75,(15 + z)/24 and 1.0 for Z 6 3 m, 3 < Z< 9 m and Z> 9 mrespectively, where Z is the length of drill rod in meters (Rob-
ertson and Wride [22]).This method is used basically used for clean sand soil, but if
fines exist a correction D(N1)60 can be used to find a clean sand
equivalent (N1)60
ðN1Þ60 ¼ ðN1Þ60 þ DðN1Þ60 ð4Þ
DðN1Þ60 ¼ 0 for FC � 5%;
DðN1Þ60 ¼ 7� ðFC� 5Þ=30 for 5 < FC < 35%
DðN1Þ60¼ 7 for FC>FC> 35%; where FC is the percentage of fines
Relative densities may be estimated from correlations witheither S.P.T or C.P.T results. A modified version of Meyer-hof’s [23] correlation was used to estimate relative densitiesof clean sand from SPT blow counts
Dr ¼ 16�ffiffiffiffiffiffiffiffiffiffiffiffiffiðN1Þ78
q¼ 14�
ffiffiffiffiffiffiffiffiffiffiffiffiffiðN1Þ60
q½ðN1Þ60 6 42� ð5Þ
where Dr is the relative density of a clean sand as a percentage;(N1)60 normalized S.P.T., N value corrected for the rod energy
ratio �60% reference energy, overburden effective stress�100 kPa reference effective stress, rod length, borehole diam-eter, and sampling method, as discussed by Youd and Idriss
[24]; and (N1)78 equals to (N1)60/1.3.
2.1.2. Cyclic resistance ratio
Blake [25] proposed CRR for clean sand based on equivalent
(N1)60 for earthquake of magnitude 7.5, as shown in Fig. 5.A value of (N1)60 > 30 indicates non-liquefiable soil.
CRRr ¼ 1 ¼ expN6014:1þ
N60126ð Þ
2� N60
23:6ð Þ3þ N60
25:4ð Þ4�2:8
� �ð6Þ
CRR for any earthquake of other magnitude Mw other than
7.5
CRR ¼ CRRM¼7:5 �MSF ð7Þ
ForMw < 7:0;MSF ¼ 103 �M�3:46w
ForMw > 7:0;MSF ¼ 102:24 �M�2:56w
For liquefiable soil deposits subjected to significant overbur-den or static shear stresses, the calculated CRR should be mul-
tiplied by two additional factors, Krdepends on confiningpressure and Kadepends on static horizontal shear stresses,vertical effective stress, and relative density of soil), but theyare not included in the analysis.
2.2. Cyclic stress ratio (CSR) induced by earthquakes
CSR ¼ 0:65amax
g� rt
r0eff� rd ð8-1Þ
where ‘‘g’’ is the gravity acceleration, rt is the total stress, r0eff isthe effective stress and rd is a reduction factor given by Blake[25].
rd ¼1:0� 0:411z0:5 þ 0:04zþ 0:00175z1:5ð Þ
ð1:0þ 0:417z0:5 þ 0:0573z� 0:0062z1:5 þ 0:00121z2Þð8-2Þ
2.3. Prediction of liquefied thickness
The factor of safety against liquefaction FSliq is defined byIshihara [26].
FSliq ¼CRR
CSRð9Þ
The soil predicted to liquefy is FSliq 6 1.0 (prone to liquefac-tion), otherwise no liquefaction.
2.4. Liquefaction Potential Index (LPI)
The Liquefaction Potential Index (LPI) was developed and
presented by Iwasaki et al. [27]. The LPI is defined as:
LPI ¼Z 20
0
F1WðzÞdz ð10Þ
where W(z) = 10–0.5z, F1 = 1 � FS for FS< 1.0, F1 = 0 for
FS> 1.0 and z is the depth below the ground surface inmeters.
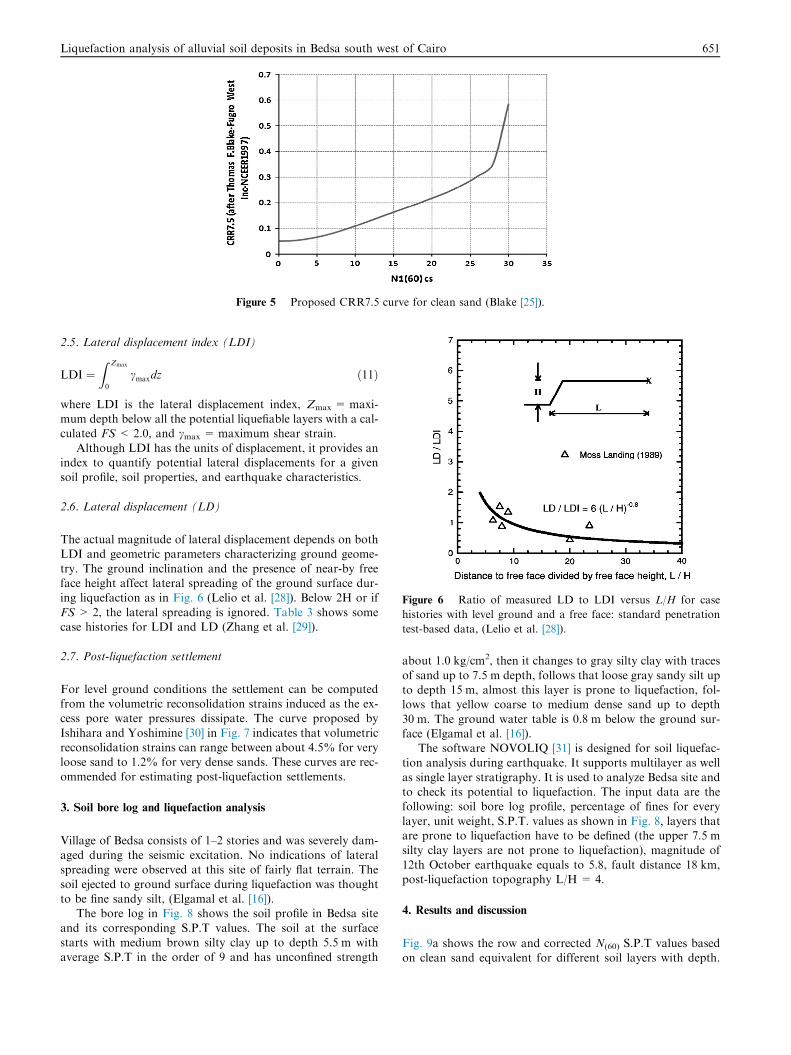
Figure 6 Ratio of measured LD to LDI versus L/H for case
histories with level ground and a free face: standard penetration
test-based data, (Lelio et al. [28]).
Figure 5 Proposed CRR7.5 curve for clean sand (Blake [25]).
Liquefaction analysis of alluvial soil deposits in Bedsa south west of Cairo 651
2.5. Lateral displacement index (LDI)
LDI ¼Z Zmax
0
cmaxdz ð11Þ
where LDI is the lateral displacement index, Zmax = maxi-mum depth below all the potential liquefiable layers with a cal-culated FS < 2.0, and cmax = maximum shear strain.
Although LDI has the units of displacement, it provides anindex to quantify potential lateral displacements for a givensoil profile, soil properties, and earthquake characteristics.
2.6. Lateral displacement (LD)
The actual magnitude of lateral displacement depends on bothLDI and geometric parameters characterizing ground geome-
try. The ground inclination and the presence of near-by freeface height affect lateral spreading of the ground surface dur-ing liquefaction as in Fig. 6 (Lelio et al. [28]). Below 2H or if
FS > 2, the lateral spreading is ignored. Table 3 shows somecase histories for LDI and LD (Zhang et al. [29]).
2.7. Post-liquefaction settlement
For level ground conditions the settlement can be computedfrom the volumetric reconsolidation strains induced as the ex-cess pore water pressures dissipate. The curve proposed by
Ishihara and Yoshimine [30] in Fig. 7 indicates that volumetricreconsolidation strains can range between about 4.5% for veryloose sand to 1.2% for very dense sands. These curves are rec-
ommended for estimating post-liquefaction settlements.
3. Soil bore log and liquefaction analysis
Village of Bedsa consists of 1–2 stories and was severely dam-aged during the seismic excitation. No indications of lateralspreading were observed at this site of fairly flat terrain. The
soil ejected to ground surface during liquefaction was thoughtto be fine sandy silt, (Elgamal et al. [16]).
The bore log in Fig. 8 shows the soil profile in Bedsa site
and its corresponding S.P.T values. The soil at the surfacestarts with medium brown silty clay up to depth 5.5 m withaverage S.P.T in the order of 9 and has unconfined strength
about 1.0 kg/cm2, then it changes to gray silty clay with traces
of sand up to 7.5 m depth, follows that loose gray sandy silt upto depth 15 m, almost this layer is prone to liquefaction, fol-lows that yellow coarse to medium dense sand up to depth
30 m. The ground water table is 0.8 m below the ground sur-face (Elgamal et al. [16]).
The software NOVOLIQ [31] is designed for soil liquefac-tion analysis during earthquake. It supports multilayer as well
as single layer stratigraphy. It is used to analyze Bedsa site andto check its potential to liquefaction. The input data are thefollowing: soil bore log profile, percentage of fines for every
layer, unit weight, S.P.T. values as shown in Fig. 8, layers thatare prone to liquefaction have to be defined (the upper 7.5 msilty clay layers are not prone to liquefaction), magnitude of
12th October earthquake equals to 5.8, fault distance 18 km,post-liquefaction topography L/H = 4.
4. Results and discussion
Fig. 9a shows the row and corrected N(60) S.P.T values basedon clean sand equivalent for different soil layers with depth.
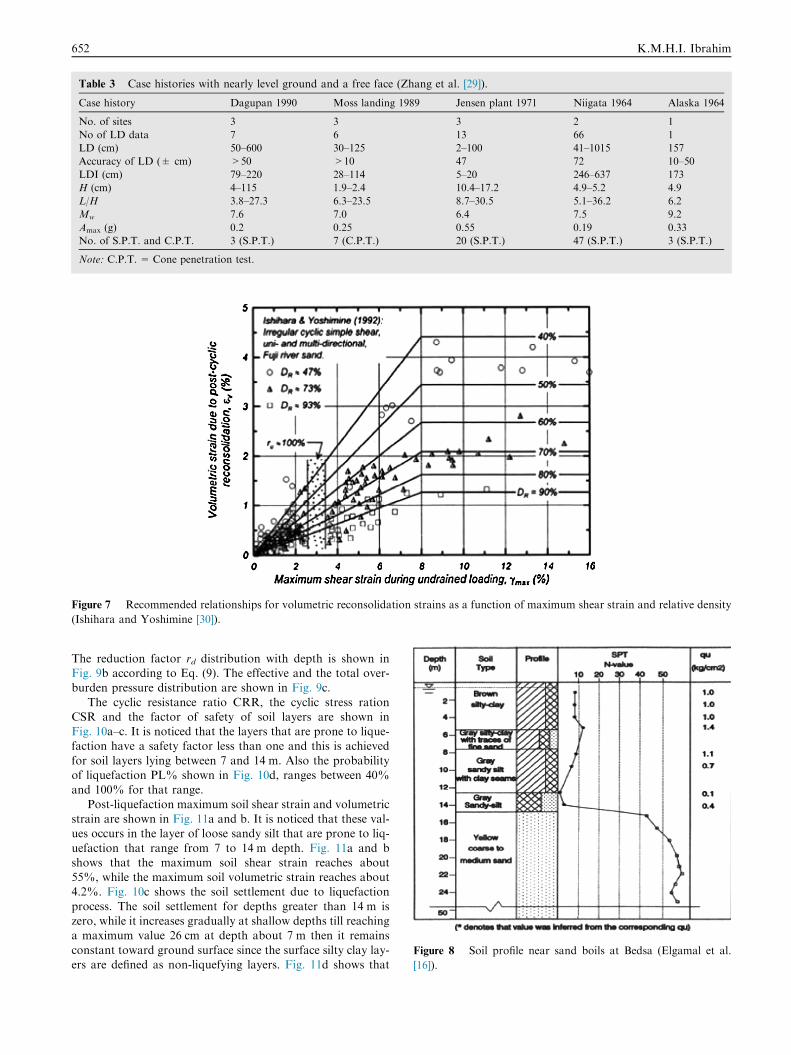
Table 3 Case histories with nearly level ground and a free face (Zhang et al. [29]).
Case history Dagupan 1990 Moss landing 1989 Jensen plant 1971 Niigata 1964 Alaska 1964
No. of sites 3 3 3 2 1
No of LD data 7 6 13 66 1
LD (cm) 50–600 30–125 2–100 41–1015 157
Accuracy of LD (± cm) >50 >10 47 72 10–50
LDI (cm) 79–220 28–114 5–20 246–637 173
H (cm) 4–115 1.9–2.4 10.4–17.2 4.9–5.2 4.9
L/H 3.8–27.3 6.3–23.5 8.7–30.5 5.1–36.2 6.2
Mw 7.6 7.0 6.4 7.5 9.2
Amax (g) 0.2 0.25 0.55 0.19 0.33
No. of S.P.T. and C.P.T. 3 (S.P.T.) 7 (C.P.T.) 20 (S.P.T.) 47 (S.P.T.) 3 (S.P.T.)
Note: C.P.T. = Cone penetration test.
Figure 7 Recommended relationships for volumetric reconsolidation strains as a function of maximum shear strain and relative density
(Ishihara and Yoshimine [30]).
Figure 8 Soil profile near sand boils at Bedsa (Elgamal et al.
[16]).
652 K.M.H.I. Ibrahim
The reduction factor rd distribution with depth is shown inFig. 9b according to Eq. (9). The effective and the total over-burden pressure distribution are shown in Fig. 9c.
The cyclic resistance ratio CRR, the cyclic stress rationCSR and the factor of safety of soil layers are shown inFig. 10a–c. It is noticed that the layers that are prone to lique-faction have a safety factor less than one and this is achieved
for soil layers lying between 7 and 14 m. Also the probabilityof liquefaction PL% shown in Fig. 10d, ranges between 40%and 100% for that range.
Post-liquefaction maximum soil shear strain and volumetricstrain are shown in Fig. 11a and b. It is noticed that these val-ues occurs in the layer of loose sandy silt that are prone to liq-
uefaction that range from 7 to 14 m depth. Fig. 11a and bshows that the maximum soil shear strain reaches about55%, while the maximum soil volumetric strain reaches about4.2%. Fig. 10c shows the soil settlement due to liquefaction
process. The soil settlement for depths greater than 14 m iszero, while it increases gradually at shallow depths till reachinga maximum value 26 cm at depth about 7 m then it remains
constant toward ground surface since the surface silty clay lay-ers are defined as non-liquefying layers. Fig. 11d shows that
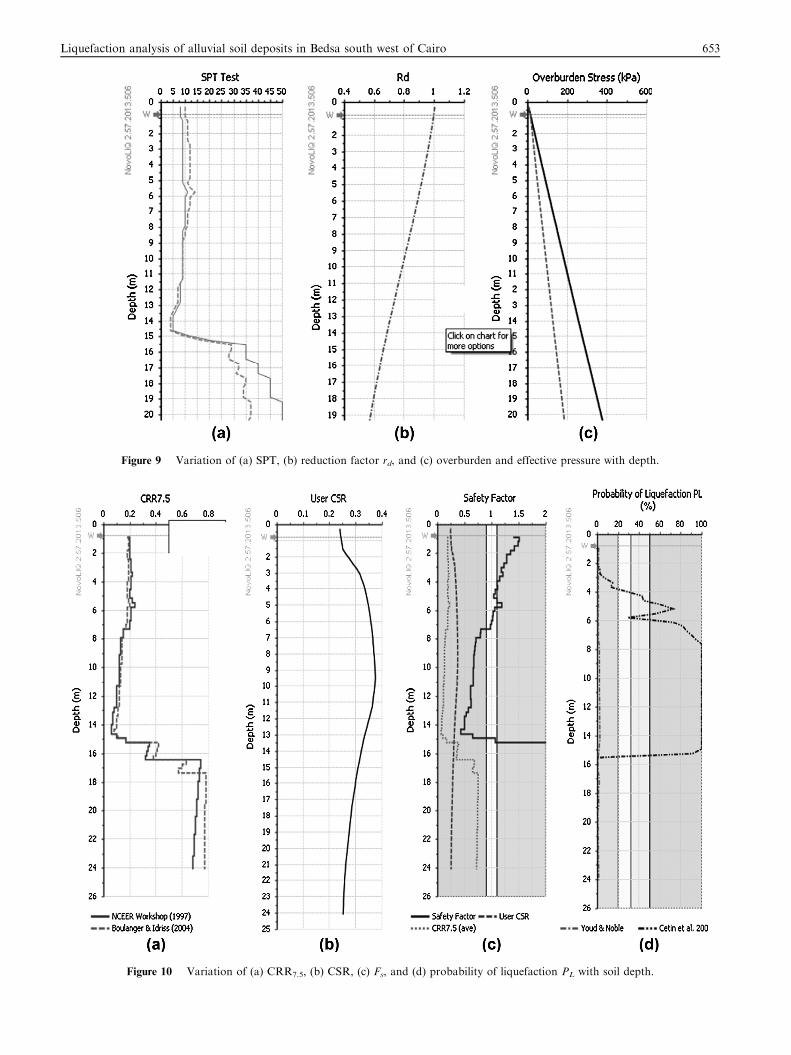
Figure 9 Variation of (a) SPT, (b) reduction factor rd, and (c) overburden and effective pressure with depth.
Figure 10 Variation of (a) CRR7.5, (b) CSR, (c) Fs, and (d) probability of liquefaction PL with soil depth.
Liquefaction analysis of alluvial soil deposits in Bedsa south west of Cairo 653
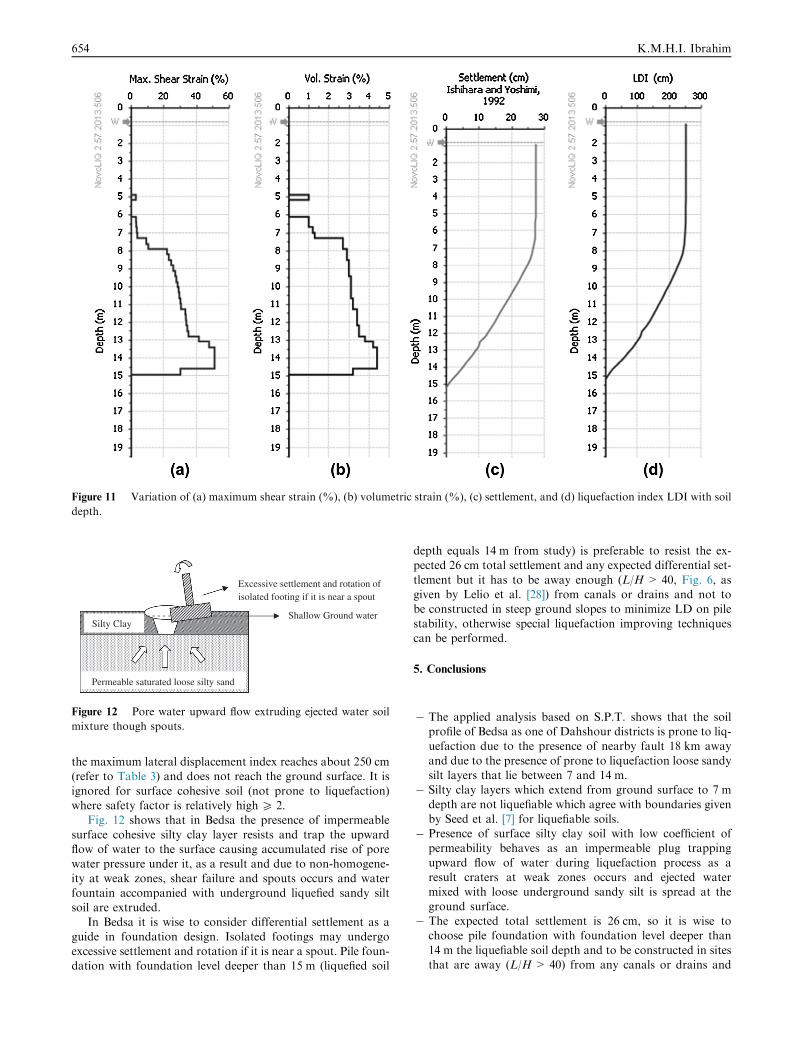
Figure 11 Variation of (a) maximum shear strain (%), (b) volumetric strain (%), (c) settlement, and (d) liquefaction index LDI with soil
depth.
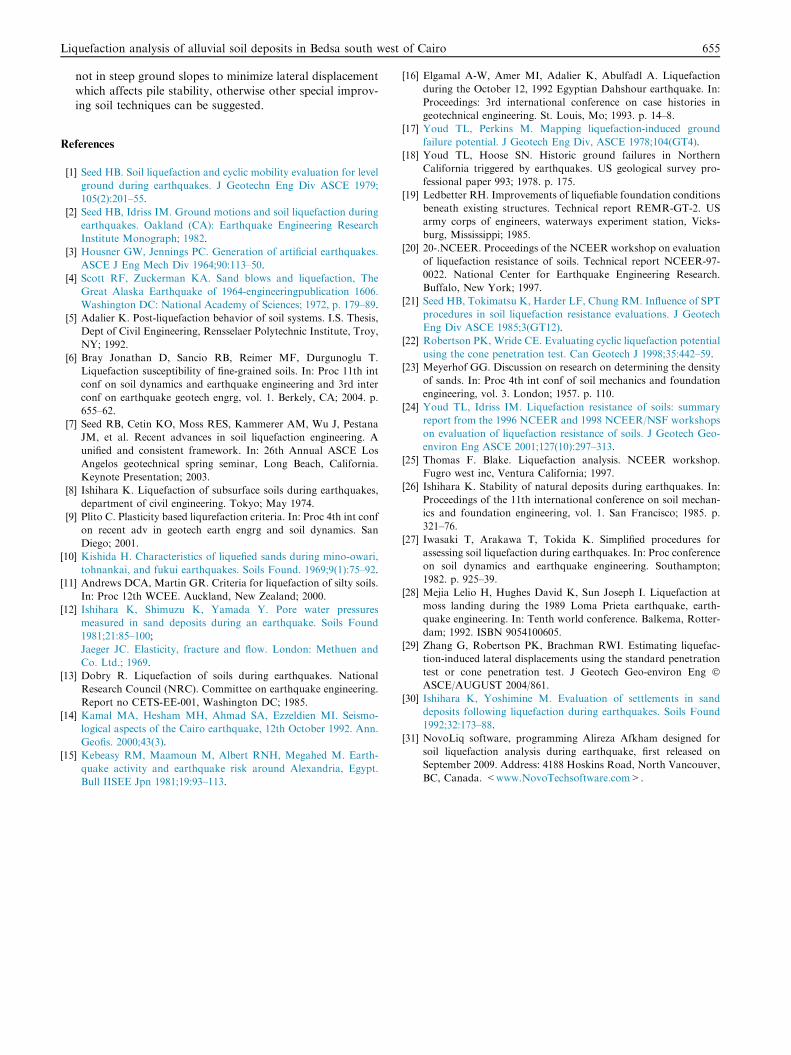
Figure 12 Pore water upward flow extruding ejected water soil
mixture though spouts.
654 K.M.H.I. Ibrahim
the maximum lateral displacement index reaches about 250 cm(refer to Table 3) and does not reach the ground surface. It is
ignored for surface cohesive soil (not prone to liquefaction)where safety factor is relatively high P 2.
Fig. 12 shows that in Bedsa the presence of impermeable
surface cohesive silty clay layer resists and trap the upwardflow of water to the surface causing accumulated rise of porewater pressure under it, as a result and due to non-homogene-
ity at weak zones, shear failure and spouts occurs and waterfountain accompanied with underground liquefied sandy siltsoil are extruded.
In Bedsa it is wise to consider differential settlement as a
guide in foundation design. Isolated footings may undergoexcessive settlement and rotation if it is near a spout. Pile foun-dation with foundation level deeper than 15 m (liquefied soil
depth equals 14 m from study) is preferable to resist the ex-pected 26 cm total settlement and any expected differential set-
tlement but it has to be away enough (L/H > 40, Fig. 6, asgiven by Lelio et al. [28]) from canals or drains and not tobe constructed in steep ground slopes to minimize LD on pile
stability, otherwise special liquefaction improving techniquescan be performed.
5. Conclusions
� The applied analysis based on S.P.T. shows that the soilprofile of Bedsa as one of Dahshour districts is prone to liq-uefaction due to the presence of nearby fault 18 km away
and due to the presence of prone to liquefaction loose sandysilt layers that lie between 7 and 14 m.
� Silty clay layers which extend from ground surface to 7 m
depth are not liquefiable which agree with boundaries givenby Seed et al. [7] for liquefiable soils.
� Presence of surface silty clay soil with low coefficient ofpermeability behaves as an impermeable plug trapping
upward flow of water during liquefaction process as aresult craters at weak zones occurs and ejected watermixed with loose underground sandy silt is spread at the
ground surface.� The expected total settlement is 26 cm, so it is wise to
choose pile foundation with foundation level deeper than
14 m the liquefiable soil depth and to be constructed in sitesthat are away (L/H > 40) from any canals or drains and
Liquefaction analysis of alluvial soil deposits in Bedsa south west of Cairo 655
not in steep ground slopes to minimize lateral displacement
which affects pile stability, otherwise other special improv-ing soil techniques can be suggested.
References
[1] Seed HB. Soil liquefaction and cyclic mobility evaluation for level
ground during earthquakes. J Geotechn Eng Div ASCE 1979;
105(2):201–55.
[2] Seed HB, Idriss IM. Ground motions and soil liquefaction during
earthquakes. Oakland (CA): Earthquake Engineering Research
Institute Monograph; 1982.
[3] Housner GW, Jennings PC. Generation of artificial earthquakes.
ASCE J Eng Mech Div 1964;90:113–50.
[4] Scott RF, Zuckerman KA. Sand blows and liquefaction, The
Great Alaska Earthquake of 1964-engineeringpublication 1606.
Washington DC: National Academy of Sciences; 1972, p. 179–89.
[5] Adalier K. Post-liquefaction behavior of soil systems. I.S. Thesis,
Dept of Civil Engineering, Rensselaer Polytechnic Institute, Troy,
NY; 1992.
[6] Bray Jonathan D, Sancio RB, Reimer MF, Durgunoglu T.
Liquefaction susceptibility of fine-grained soils. In: Proc 11th int
conf on soil dynamics and earthquake engineering and 3rd inter
conf on earthquake geotech engrg, vol. 1. Berkely, CA; 2004. p.
655–62.
[7] Seed RB, Cetin KO, Moss RES, Kammerer AM, Wu J, Pestana
JM, et al. Recent advances in soil liquefaction engineering. A
unified and consistent framework. In: 26th Annual ASCE Los
Angelos geotechnical spring seminar, Long Beach, California.
Keynote Presentation; 2003.
[8] Ishihara K. Liquefaction of subsurface soils during earthquakes,
department of civil engineering. Tokyo; May 1974.
[9] Plito C. Plasticity based liqurefaction criteria. In: Proc 4th int conf
on recent adv in geotech earth engrg and soil dynamics. San
Diego; 2001.
[10] Kishida H. Characteristics of liquefied sands during mino-owari,
tohnankai, and fukui earthquakes. Soils Found. 1969;9(1):75–92.
[11] Andrews DCA, Martin GR. Criteria for liquefaction of silty soils.
In: Proc 12th WCEE. Auckland, New Zealand; 2000.
[12] Ishihara K, Shimuzu K, Yamada Y. Pore water pressures
measured in sand deposits during an earthquake. Soils Found
1981;21:85–100;
Jaeger JC. Elasticity, fracture and flow. London: Methuen and
Co. Ltd.; 1969.
[13] Dobry R. Liquefaction of soils during earthquakes. National
Research Council (NRC). Committee on earthquake engineering.
Report no CETS-EE-001, Washington DC; 1985.
[14] Kamal MA, Hesham MH, Ahmad SA, Ezzeldien MI. Seismo-
logical aspects of the Cairo earthquake, 12th October 1992. Ann.
Geofis. 2000;43(3).
[15] Kebeasy RM, Maamoun M, Albert RNH, Megahed M. Earth-
quake activity and earthquake risk around Alexandria, Egypt.
Bull IISEE Jpn 1981;19:93–113.
[16] Elgamal A-W, Amer MI, Adalier K, Abulfadl A. Liquefaction
during the October 12, 1992 Egyptian Dahshour earthquake. In:
Proceedings: 3rd international conference on case histories in
geotechnical engineering. St. Louis, Mo; 1993. p. 14–8.
[17] Youd TL, Perkins M. Mapping liquefaction-induced ground
failure potential. J Geotech Eng Div, ASCE 1978;104(GT4).
[18] Youd TL, Hoose SN. Historic ground failures in Northern
California triggered by earthquakes. US geological survey pro-
fessional paper 993; 1978. p. 175.
[19] Ledbetter RH. Improvements of liquefiable foundation conditions
beneath existing structures. Technical report REMR-GT-2. US
army corps of engineers, waterways experiment station, Vicks-
burg, Mississippi; 1985.
[20] 20-.NCEER. Proceedings of the NCEER workshop on evaluation
of liquefaction resistance of soils. Technical report NCEER-97-
0022. National Center for Earthquake Engineering Research.
Buffalo, New York; 1997.
[21] Seed HB, Tokimatsu K, Harder LF, Chung RM. Influence of SPT
procedures in soil liquefaction resistance evaluations. J Geotech
Eng Div ASCE 1985;3(GT12).
[22] Robertson PK, Wride CE. Evaluating cyclic liquefaction potential
using the cone penetration test. Can Geotech J 1998;35:442–59.
[23] Meyerhof GG. Discussion on research on determining the density
of sands. In: Proc 4th int conf of soil mechanics and foundation
engineering, vol. 3. London; 1957. p. 110.
[24] Youd TL, Idriss IM. Liquefaction resistance of soils: summary
report from the 1996 NCEER and 1998 NCEER/NSF workshops
on evaluation of liquefaction resistance of soils. J Geotech Geo-
environ Eng ASCE 2001;127(10):297–313.
[25] Thomas F. Blake. Liquefaction analysis. NCEER workshop.
Fugro west inc, Ventura California; 1997.
[26] Ishihara K. Stability of natural deposits during earthquakes. In:
Proceedings of the 11th international conference on soil mechan-
ics and foundation engineering, vol. 1. San Francisco; 1985. p.
321–76.
[27] Iwasaki T, Arakawa T, Tokida K. Simplified procedures for
assessing soil liquefaction during earthquakes. In: Proc conference
on soil dynamics and earthquake engineering. Southampton;
1982. p. 925–39.
[28] Mejia Lelio H, Hughes David K, Sun Joseph I. Liquefaction at
moss landing during the 1989 Loma Prieta earthquake, earth-
quake engineering. In: Tenth world conference. Balkema, Rotter-
dam; 1992. ISBN 9054100605.
[29] Zhang G, Robertson PK, Brachman RWI. Estimating liquefac-
tion-induced lateral displacements using the standard penetration
test or cone penetration test. J Geotech Geo-environ Eng �ASCE/AUGUST 2004/861.
[30] Ishihara K, Yoshimine M. Evaluation of settlements in sand
deposits following liquefaction during earthquakes. Soils Found
1992;32:173–88.
[31] NovoLiq software, programming Alireza Afkham designed for
soil liquefaction analysis during earthquake, first released on
September 2009. Address: 4188 Hoskins Road, North Vancouver,
BC, Canada. <www.NovoTechsoftware.com>.
Recommended