
Investigating Ways to Prevent Electrical Arc Flash
2
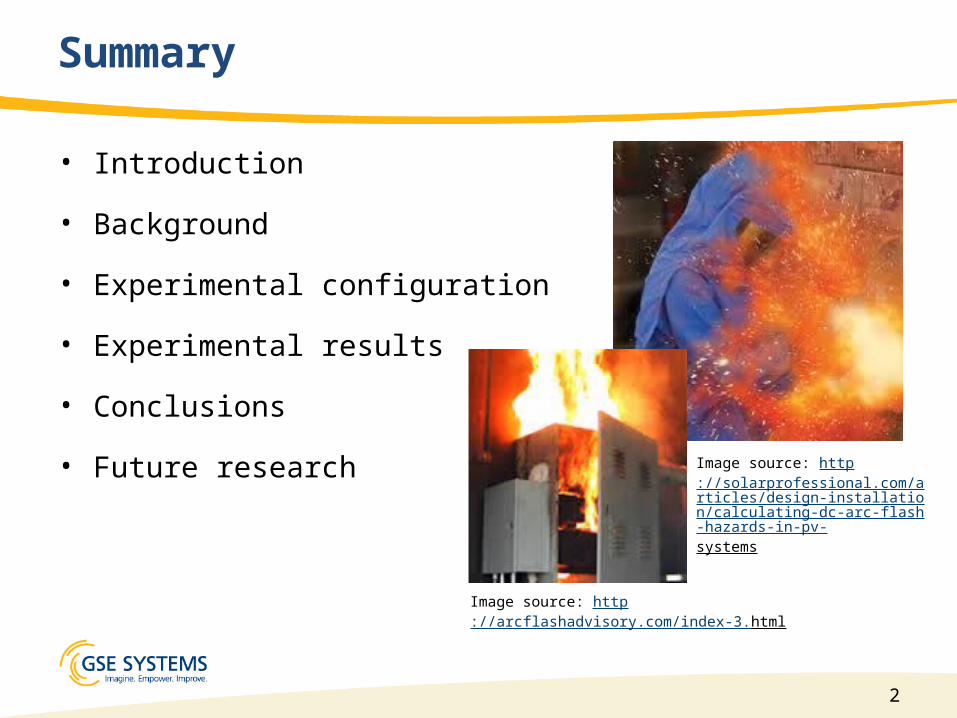
Summary
• Introduction
• Background
• Experimental configuration
• Experimental results
• Conclusions
• Future research
Image source: http://arcflashadvisory.com/index-3.html
Image source: http://solarprofessional.com/articles/design-installation/calculating-dc-arc-flash-hazards-in-pv-systems
3
Introduction
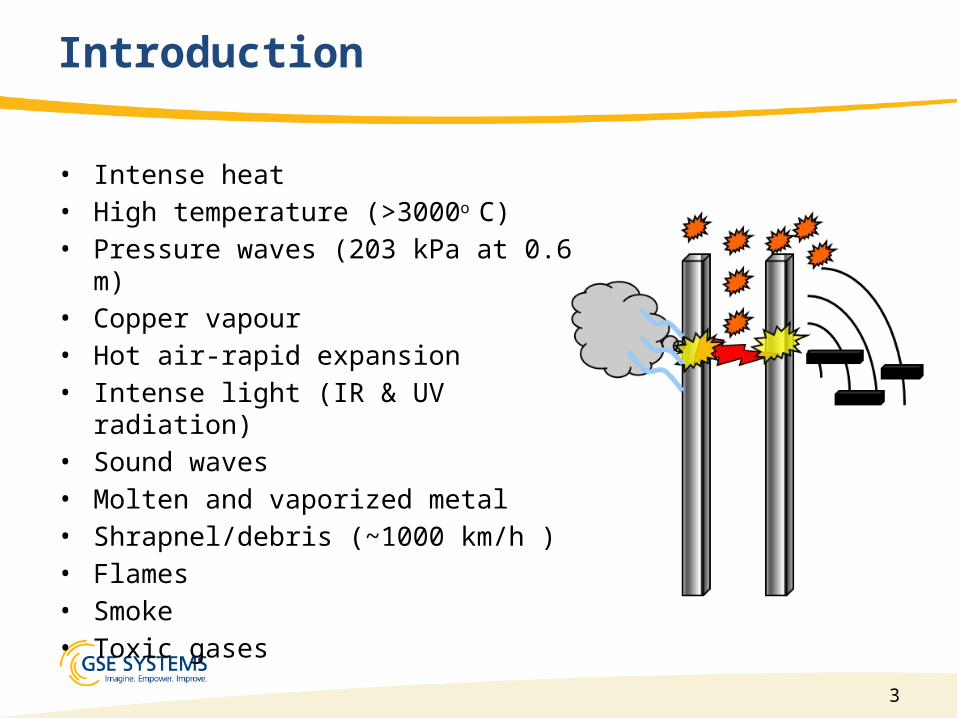
• Intense heat• High temperature (>3000o C)• Pressure waves (203 kPa at 0.6 m)• Copper vapour• Hot air-rapid expansion• Intense light (IR & UV radiation)• Sound waves • Molten and vaporized metal• Shrapnel/debris (~1000 km/h )• Flames• Smoke• Toxic gases
4
Arc Flash Severity
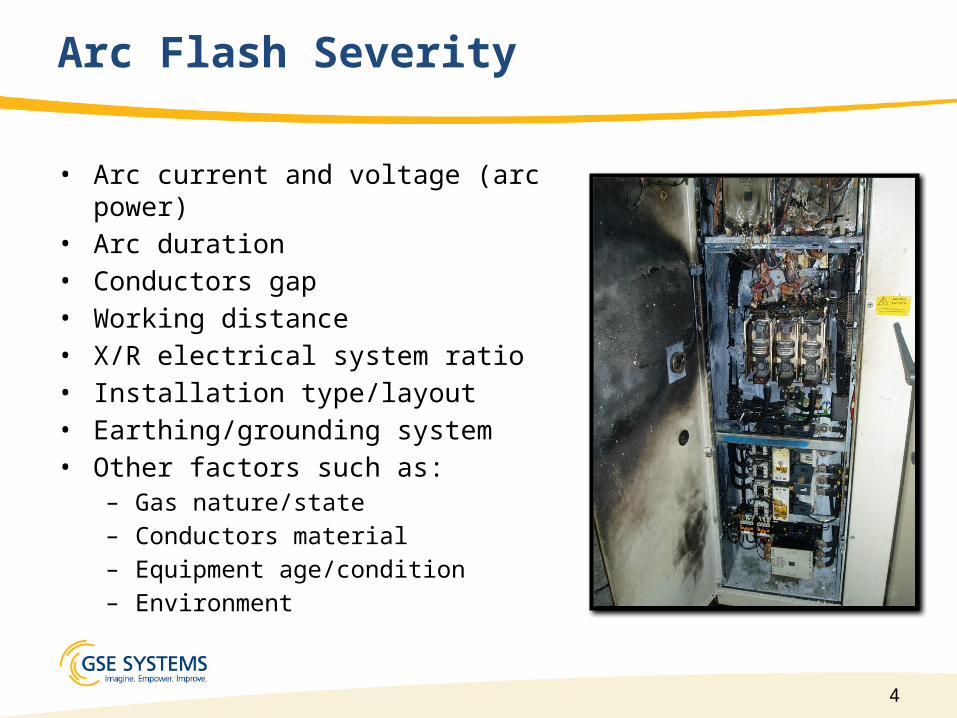
• Arc current and voltage (arc power)• Arc duration • Conductors gap• Working distance• X/R electrical system ratio• Installation type/layout• Earthing/grounding system• Other factors such as:
– Gas nature/state – Conductors material– Equipment age/condition– Environment
5
Comprehensive System to Manage Arc Flash Hazards
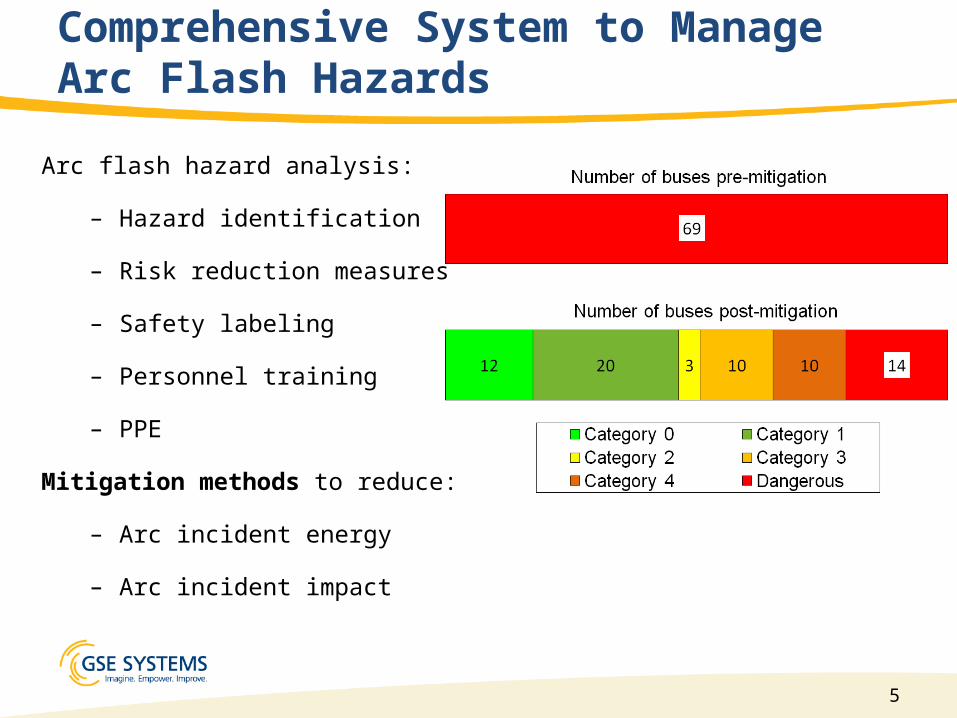
Arc flash hazard analysis:
– Hazard identification
– Risk reduction measures
– Safety labeling
– Personnel training
– PPE
Mitigation methods to reduce:
– Arc incident energy
– Arc incident impact
6
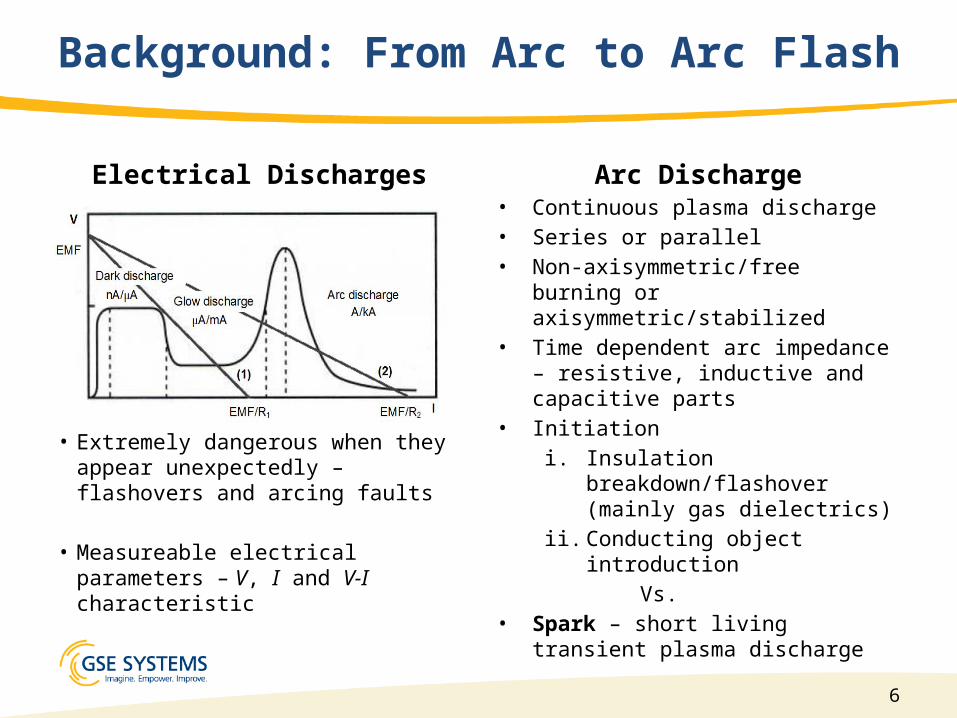
Background: From Arc to Arc Flash
Electrical Discharges
• Extremely dangerous when they appear unexpectedly – flashovers and arcing faults
• Measureable electrical parameters – V, I and V-I characteristic
Arc Discharge• Continuous plasma discharge• Series or parallel• Non-axisymmetric/free burning or
axisymmetric/stabilized• Time dependent arc impedance –
resistive, inductive and capacitive parts
• Initiationi. Insulation
breakdown/flashover (mainly gas dielectrics)
ii. Conducting object introduction
Vs.• Spark – short living transient
plasma discharge
7
Arc Flash Initiation
Focus on arc onset to increase our understanding about how an arc evolves into an arc flash event
Experimental investigation on short time scale arcs (sparks)
Evaluation of the electrical characteristics of the transient plasma discharge
Possible mitigation means of the risk of arc initiation under a given set of conditions
8
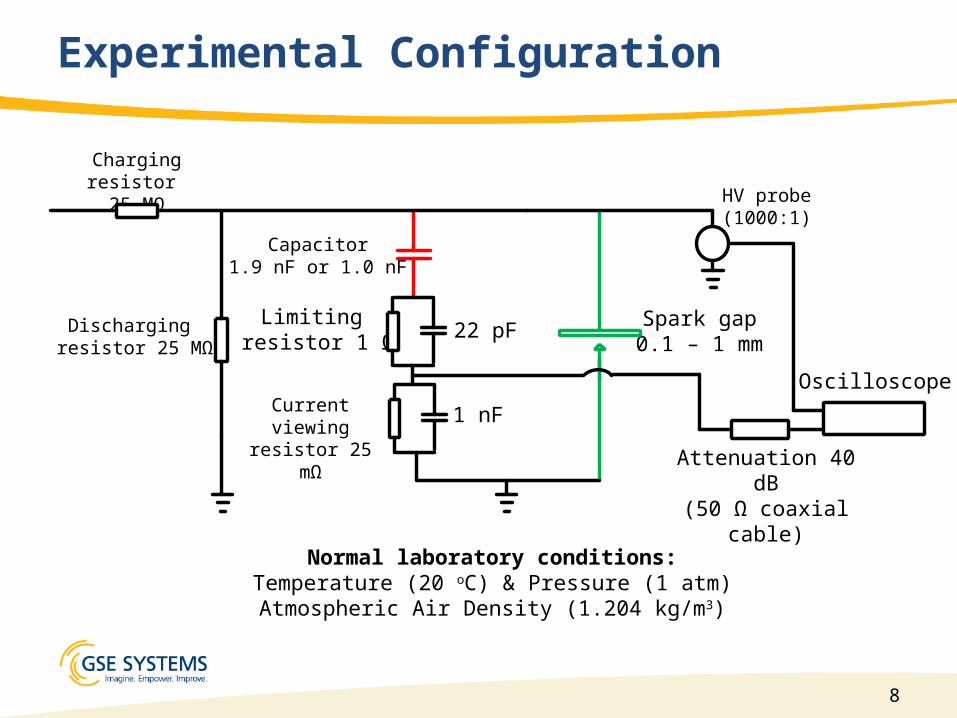
Experimental Configuration
Charging resistor 25 MΩ
Discharging resistor 25 MΩ
Capacitor1.9 nF or 1.0 nF
Limiting resistor 1 Ω
Current viewingresistor 25 mΩ
22 pF
1 nF
HV probe(1000:1)
Spark gap0.1 – 1 mm
Attenuation 40 dB(50 Ω coaxial cable)
Oscilloscope
Normal laboratory conditions: Temperature (20 oC) & Pressure (1 atm) Atmospheric Air Density (1.204 kg/m3)
9
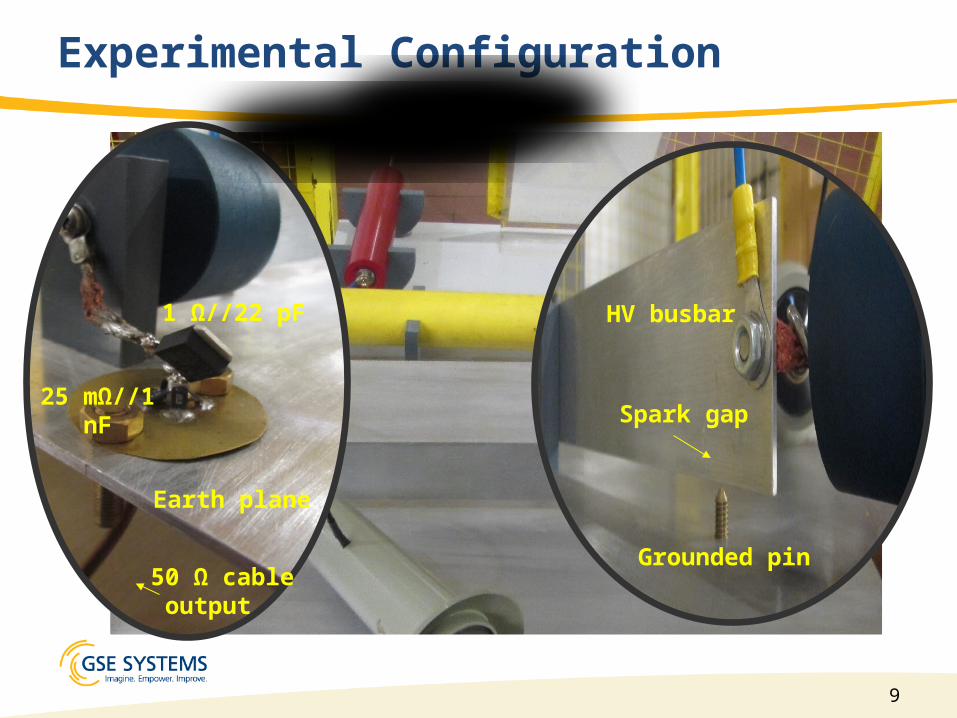
Experimental Configuration
1 Ω//22 pF
25 mΩ//1 nF
Earth plane
50 Ω cable output
HV busbar
Spark gap
Grounded pin
10
Experimental Configuration
• Focus on the initiation: Electrical properties of spark/arc may help to mitigate arc flash in a wider context
• Accurate measurements with challenging conditions:– High level of the current and very fast rise time– Small experimental rig dimensions in order to limit total inductance
• Custom designed current shunt method: directly electrically inserted in the circuit – Very fast rise time response and measuring accuracy
• V and I measurements• Vspark, Ispark, Rspark and Espark accurate calculations
• Inductance of the current viewing resistor according to the manufacturer datasheet ~ 0.7 nH
• Theoretical calculated inductance of the circuit branch that includes the spark gap ~ 90 nH
11
Experimental Results
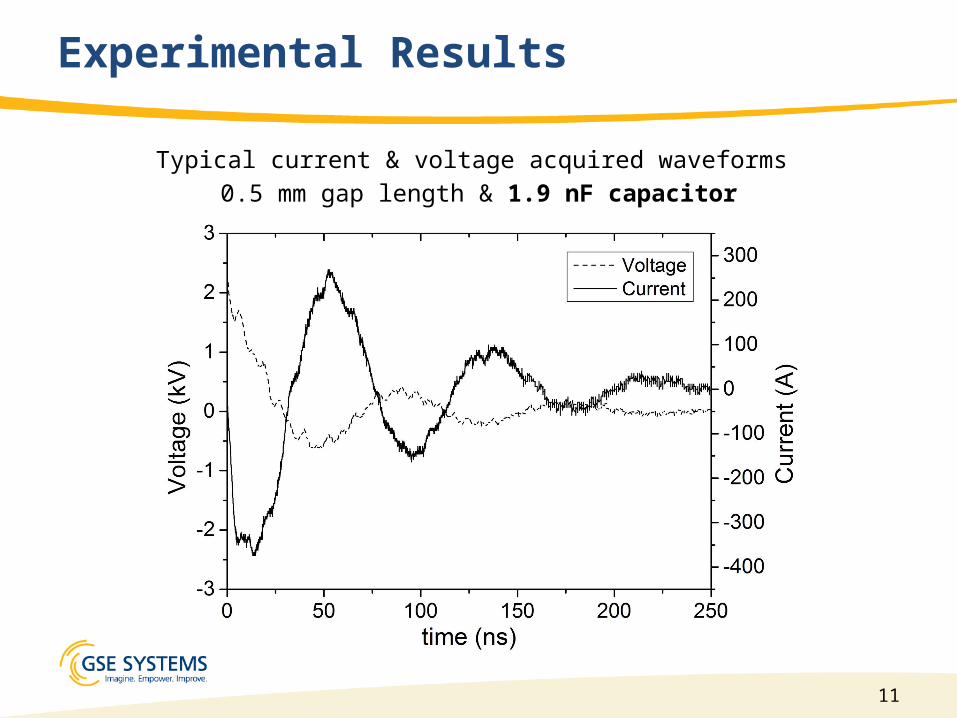
Typical current & voltage acquired waveforms 0.5 mm gap length & 1.9 nF capacitor
12
Experimental Results
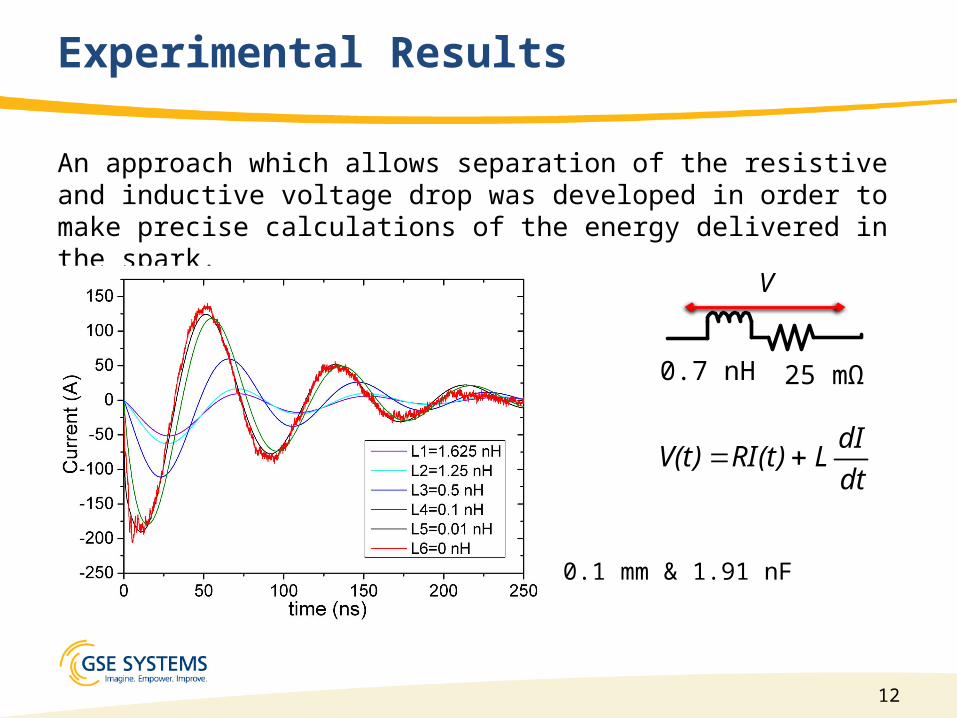
An approach which allows separation of the resistive and inductive voltage drop was developed in order to make precise calculations of the energy delivered in the spark.
0.7 nH 25 mΩ
V
dt
dILRI(t)V(t)
0.1 mm & 1.91 nF
13
Experimental Results
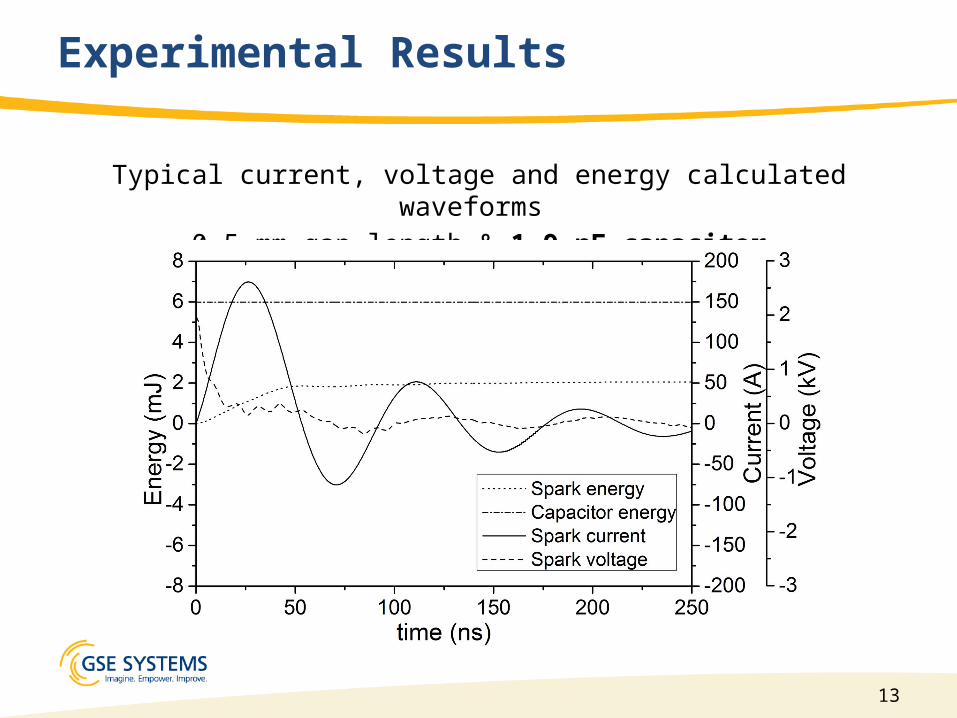
Typical current, voltage and energy calculated waveforms 0.5 mm gap length & 1.9 nF capacitor
14
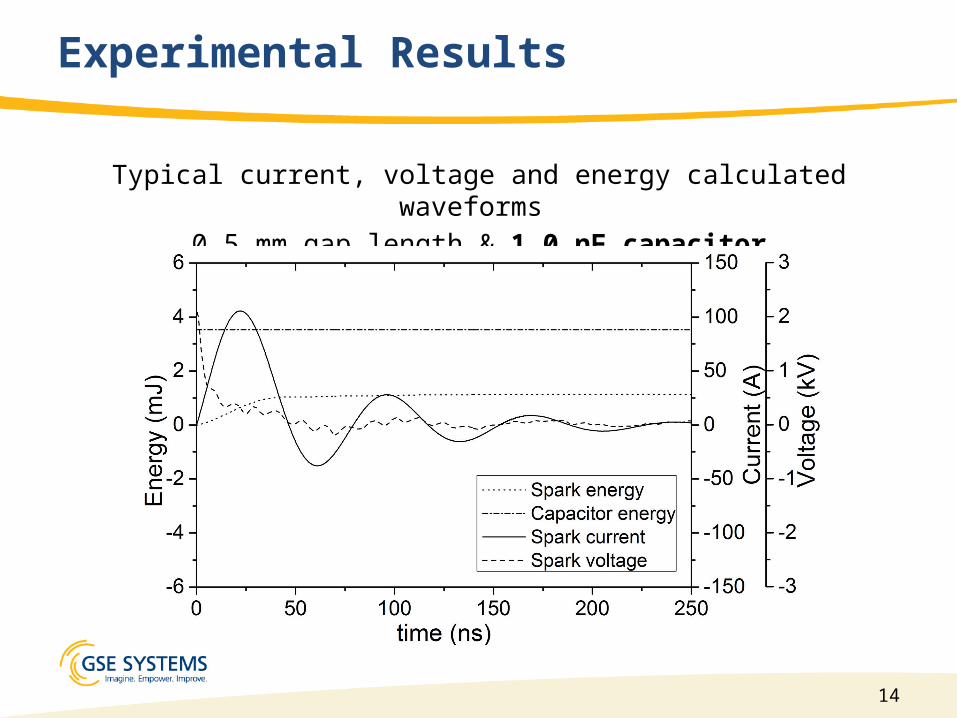
Experimental Results
Typical current, voltage and energy calculated waveforms 0.5 mm gap length & 1.0 nF capacitor

15
Experimental Results
Temporal development of spark energy 1.9 nF capacitor
16
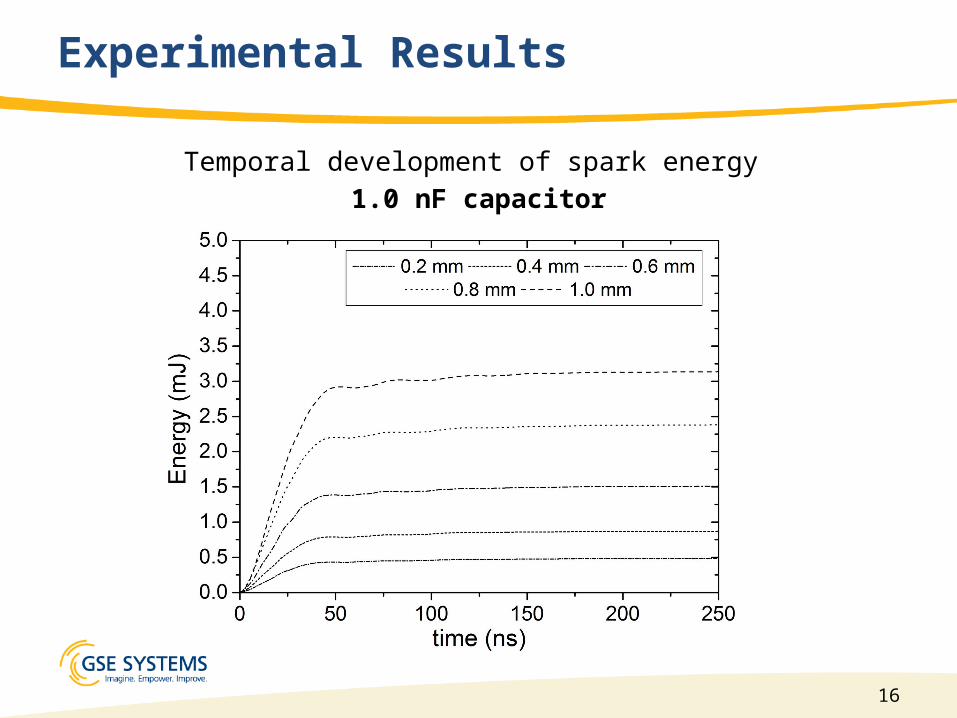
Experimental Results
Temporal development of spark energy 1.0 nF capacitor
17
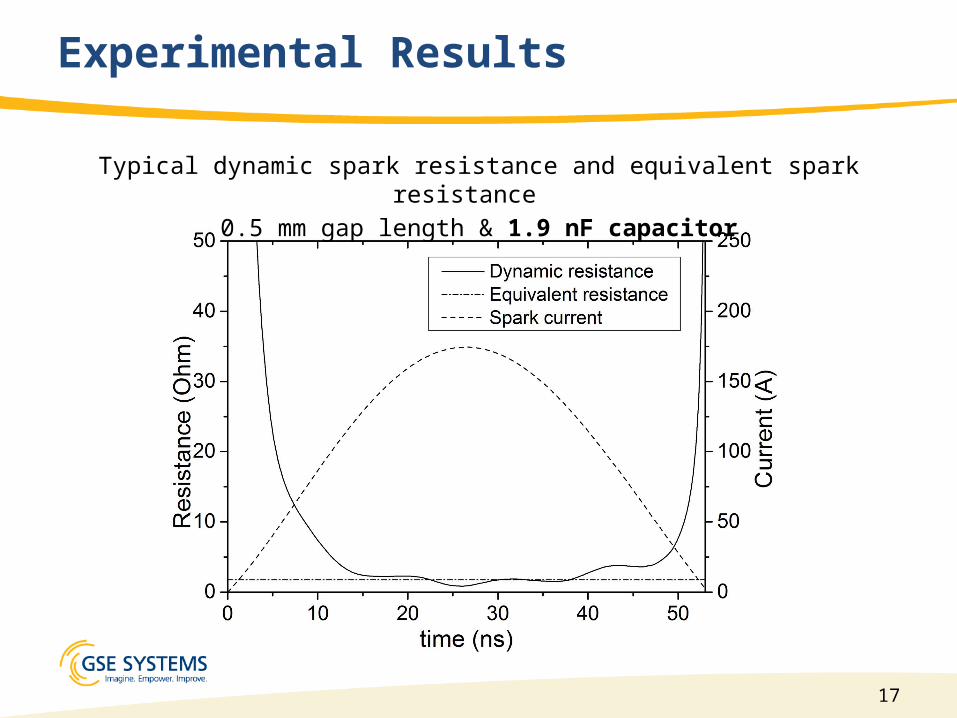
Experimental Results
Typical dynamic spark resistance and equivalent spark resistance 0.5 mm gap length & 1.9 nF capacitor
18
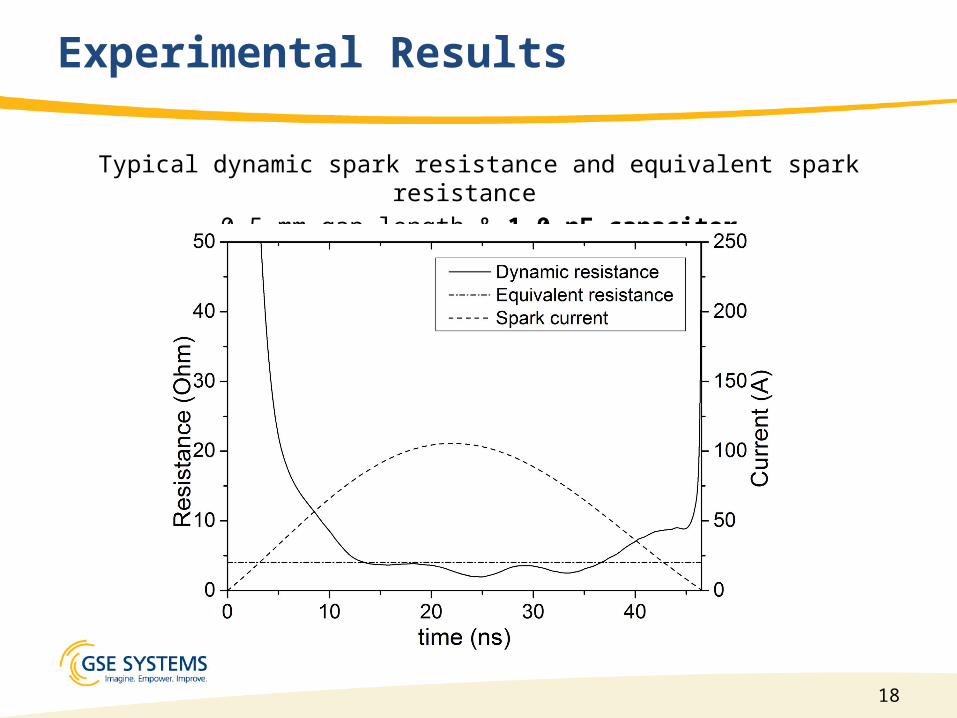
Experimental Results
Typical dynamic spark resistance and equivalent spark resistance 0.5 mm gap length & 1.0 nF capacitor
19
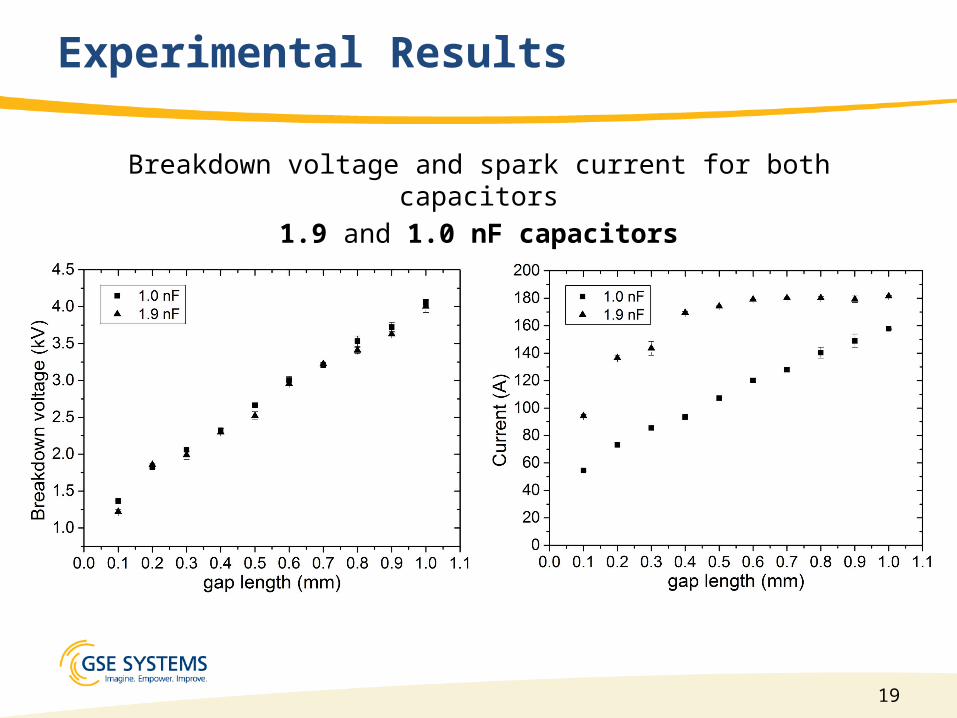
Experimental Results
Breakdown voltage and spark current for both capacitors1.9 and 1.0 nF capacitors
20
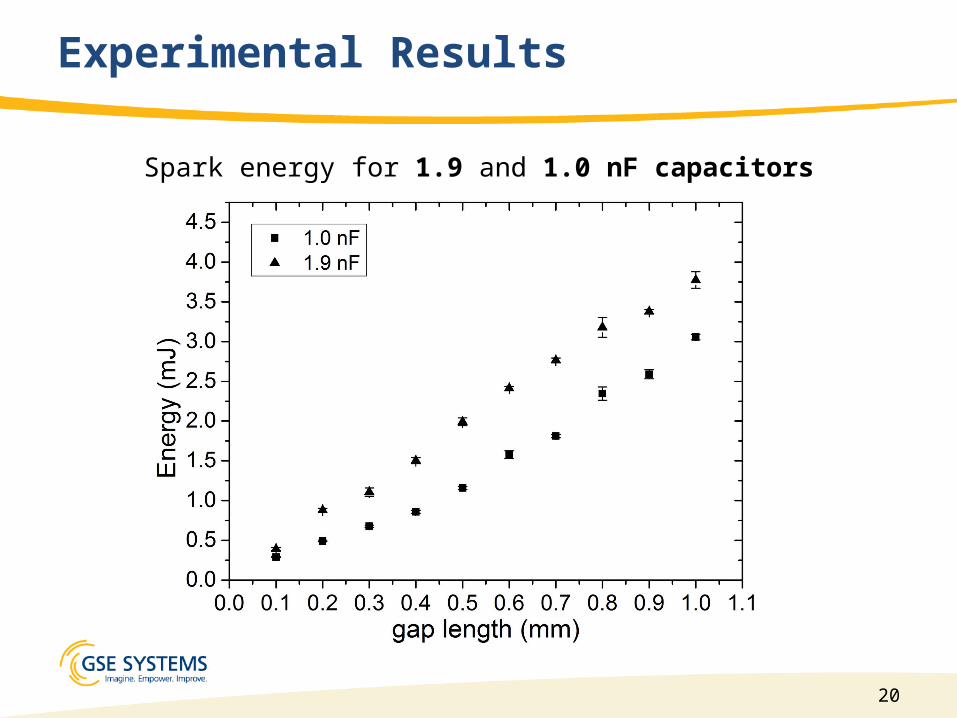
Experimental Results
Spark energy for 1.9 and 1.0 nF capacitors
21
Conclusions
• Spark (short living transient plasma discharge): an early time process in the arc
• Gap length increase: spark current increases and dissipation energy intensifies
• Electrical energy stored in the system increase: energy dissipation and spark current increase
• Geometrical characteristics of the electrical system & electrical energy stored in the circuit physically close to the arc: This affects arc initiation and should be taken into consideration during the design phase of the electrical installation.
• Future investigations – Arc power determination during the transition from transient to
steady-state phases and a comparison between them– Energy partition of the electrical energy delivered in the
spark/arc

For more information:
Go to: www.GSES.com
Call: +1 800.638.7912
Email: [email protected]
Follow us on:
Twitter @GSESystems
Facebook.com/GSESystems
Recommended