International Comparison of Medicines Usage: Quantitative Analysis
Phill O’Neill, Jon Sussex

Contents
List of abbreviations 2
Executive summary 3
1. Introduction and background 4
2. Method 5 2.1 Selection of comparator countries and therapy areas 5 2.2 Data used in the study 6 2.3 Analysis and presentation 9 2.4 Limitations in the presentation of the analysis 10
3. Results 11
3.1 Overview 11 3.2 Results by therapy area 13 Cancer 14 Statins 16 Acute myocardial infarction 16 Alteplase for stroke 17 Novel oral anti-coagulants 17 2nd generation anti-psychotics 18 Dementia 18 Multiple sclerosis 19 Osteoporosis 19 TNF medicines 20 Hepatitis C 20 Respiratory distress syndrome 21 Respiratory syncytial virus 22 Wet age-related macular degeneration 22
3.3 Summary of the results by therapy area 23
References 27
Appendix 1: Benchmarking usage of HIV and diabetes medicines 2012/13 28
Appendix 2: List of medicines included in the analysis 30
1

List of abbreviations
ABPI Association of the British Pharmaceutical Industry
Acute MI Acute myocardial infarction
ATC Anatomic therapeutic chemical coding
DDD Defined daily dose
DH Department of Health
DPP-4 inhibitors Dipeptidyl peptidase-4 inhibitor medicines
DTP Direct to pharmacy distribution model
EphMRA European Pharmaceutical Market Research Association
EU5 France, Germany, Italy, Spain, UK
GLP-1 agonists Glucagon-like peptide-1 agonist medicines
HIV Human immunodeficiency virus
IMS Intercontinental Medical Statistics
NICE National Institute for Health and Care Excellence
NOAC Novel oral anti-coagulant medicine
OHE Office of Health Economics
PPRS Pharmaceutical Price Regulation Scheme
RDS Respiratory distress syndrome
RSV Respiratory syncytial virus
TNF Anti-tumour necrosis factor medicine
Wet AMD Wet age-related macular degeneration
2

Executive summary
• This report was commissioned by the Association of the British Pharmaceutical Industry (ABPI) and updates to 2012/13 the quantitative analysis of UK usage of medicines per head of total population compared to that in other countries in 2008/09 which was published in the 2010 Richards Report: Extent and causes of international variations in drug usage, a report for the Secretary of State for Health by Professor Sir Mike Richards CBE.
• The Department of Health (DH) has commissioned a separate qualitative analysis of the reasons for the differences in usage revealed by this report.
• In the absence of internationally comparable data on the quantities of medicines actually used by patients, we have proxied usage by IMS sales volume data.
• The method we adopted replicates that used in the Richards Report to benchmark usage. IMS Midas data reporting sales volumes in each country were adjusted so that each class of medicines had a comparable unit of volume, for example defined daily doses (DDDs). For cancer medicines this was not possible and un-weighted ranking scores were combined. Total volume usage was adjusted for the total population in each country. Mean usage per head was calculated for the five largest EU markets and for the whole sample of comparator countries, in both cases including the UK in the comparison group as this was the method used in the Richards Report. UK usage per head was then calculated as a percent of the average of the EU5 and of all 13 comparator countries respectively. Individual country data are also presented as a ranking: a country with the highest per capita usage is given a rank of 1, the second highest has a rank of 2, and so on.
• On the basis of the same classes of medicines as in the Richards Report and the same group of comparator countries (excluding Denmark for which up to date data were not available):• In 2012/13 the UK’s overall ranking across all of the medicines studied for usage per person remains ninth
highest of 13 high income countries.• UK usage per person is below the international average in 2012/13 for 11 out of 16 classes of medicines and
above average for five.• The UK’s relative usage of medicines is slightly higher when compared to the other five largest EU
economies (France, Germany, Italy, Spain and UK): UK usage per person in 2012/13 was below the EU5 average for nine out of 16 classes of medicines and above for seven.
• Comparing 2012/13 to 2008/09:
• UK usage per head of population has increased relative to the international average in 11 out of 16 classes of medicines:• In seven of these 11 classes UK usage nevertheless remains below the international average in 2012/13:
cancer medicines less than five years old, alteplase for stroke, second generation anti-psychotics, dementia, multiple sclerosis, pegylated interferons for hepatitis C and respiratory syncytial virus.
• In four of these 11 classes UK usage exceeds the international average in 2012/13: cancer medicines 10+ years old, osteoporosis, respiratory distress syndrome and wet age-related macular degeneration.
• In five out of 16 classes UK usage as a percentage of the international average has fallen:• In four of those five classes UK usage is below the international average: cancer medicines 6-10 years
old, hormonal cancer medicines, thrombolytics to treat acute myocardial infarction and TNF medicines used against rheumatoid arthritis.
• For statins, the fifth of those classes, although UK use has fallen relative to the international average, it remains above 100% of that average.
• For two sub-classes of medicines for which a comparison with 2008/09 is not possible – novel oral anti-coagulants and protease inhibitors for hepatitis C – UK usage is less than half of the average of the comparator countries.
• Results for two classes of medicines – HIV and diabetes – where there have been the greatest sales of
newly launched medicines internationally are presented in an appendix to the present report. UK usage of HIV medicines is close to the average of comparator countries. For diabetes, usage of medicines in new classes is around a third of that in the comparator countries, close to the average of comparator countries for insulins, and significantly above the international average for older diabetes medicines.
3

1. Introduction and background
Medicines are an essential part of health care and new medicines are being developed all the time, leading to improvements in patient outcomes. Ensuring appropriate usage of medicines is an important part of delivering high-quality health care to the population. Measuring the extent to which medicines are used in health care systems, and how that usage varies between countries, can throw light on the efficiency, quality and fairness of health services (Richards, 2010).
As part of the 2009 Pharmaceutical Price Regulation Scheme (PPRS) agreement, the Department of Health (DH) and the Association of the British Pharmaceutical Industry (ABPI) committed to producing analyses benchmarking the use of medicines positively appraised by the National Institute for Health and Care Excellence (NICE) (Department of Health, 2008). The agreement noted that “The UK should compare itself with other countries if it is to deliver a world-class NHS. The industry and the Department will work together to define a set of measures that allow comparison of the usage of all new medicines with major EU economies and, more specifically, to provide international benchmarks and trends for the usage of NICE-approved technologies.” (Department of Health, 2008, p9).
The first, and currently only, publication to meet this commitment was the 2010 report: Extentandcausesofinternationalvariationsindrugusage. A report for the Secretary of State for Health by Professor Sir Mike Richards CBE (hereafter referred to as the Richards Report). The Richards Report combined a quantitative analysis for the financial year 2008/09 measuring UK usage of medicines in 16 therapy areas relative to 13 other high-income countries and a qualitative component characterising factors that may explain differences in usage in the UK relative to the comparator countries.
Comparing the usage of any group of medicines across any group of countries is not a straightforward undertaking. The more comparator countries are involved, the greater the complexity. This may explain the paucity of published empirical evidence on the subject. We have not been able to find any other comparisons of medicines uptake for a range of individual disease areas across a range of countries similar to that in the Richards Report, since that report was published in 2010. (Although OECD’s annual HealthataGlance report includes indicators showing defined daily doses per 1,000 people per day for four broad disease areas – anti-hypertensives, anti-cholesterols, anti-diabetics and anti-depressants – for a number of OECD member countries, excluding Austria, New Zealand and the USA of the countries included in the Richards Report. See OECD 2013, for example.)
The Office of Health Economics (OHE) was commissioned by the ABPI in late 2013 to update to financial year 2012/13 the quantitative component of the Richards Report. The rest of this document describes the method we have used to update the quantitative analysis and the results of doing so. At appropriate points we also describe the main challenges in undertaking such comparison, owing to the limitations of the data available. We have replicated the methods used in the Richards Report in order to permit as far as possible direct comparison between the two sets of results.
The purpose of this report is to inform discussion between the ABPI and DH with the aim of achieving agreement about how to progress the commitment in the 2009 PPRS agreement to benchmark the relative usage of NICE positively appraised medicines comparing the UK with other countries (Department of Health, 2008). That commitment was reinforced in the 2014 PPRS agreement (Department of Health, 2013).
A wide range of factors is likely to be driving observed differences between usage per head of population in the UK and other countries. There is a large literature on this topic; a helpful review of the drivers of differences between countries in usage of medicines was produced following the Richards Report by Nolte and colleagues in 2010 for some of the disease areas included in the Richards Report and hence also in this report (Nolte et al., 2010). An updated report on reasons for international differences in medicines usage has been commissioned by the DH from RAND Europe to complement this report.
4

2. Method
2.1 Selection of comparator countries and therapy areas
The countries for comparison were selected in the Richards Report based on two criteria: that relatively robust data on medicines use were available and that the countries were broadly similar to the UK in terms of economic development. This led to a sample of 13 countries against which to compare the UK, as listed in Table 1.
Table 1. Countries included in the Richards Report
Five large European countries Five smaller European countries Other countriesFrance Austria AustraliaGermany Denmark CanadaItaly Norway New ZealandSpain Sweden USAUK Switzerland
In our analysis we have included all of these countries except Denmark, for which usage data were not available for 2012/13.
The selection of therapy areas to focus on in the Richards Report took account of the following factors:
• high incidence, prevalence and/or mortality• causing significant long-term morbidity• incurring high levels of expenditure• where significant developments in prevention or treatment had been made in the last 10 years• affecting different age groups• where medicines have been through health technology assessment processes, as well as where they have not• some that are managed predominantly in primary care and others which are managed predominantly in
secondary care.
The resulting list of therapy areas included in the Richards Report is shown in Table 2 below. Appendix 2 lists the individual medicines in each therapy area.
Table 2. Disease areas and categories of drugs included in the 2010 Richards Report
Condition CategoryCancer Drugs licensed within the past 5 years*
Drugs licensed 6–10 years ago*Drugs licensed more than 10 years ago*Hormonal treatments
Cardiovascular (coronary heart disease and stroke) StatinsThrombolytics, used to treat acute myocardial infarction (acute MI)Thrombolytics, used to treat stroke
Mental health Second-generation antipsychoticsDementia
Long-term conditions Multiple sclerosisOsteoporosisRheumatoid arthritis biologics
Infections Hepatitis CConditions affecting children Respiratory distress syndrome (RDS)
Respiratory syncytial virus (RSV)Other Wet age-related macular degeneration (wet AMD)
* Based on time since UK launch as at March 2009.
5

We have analysed the same classes of medicines as in the Richards Report, but with March 2013 (rather than March 2009) as the reference date when identifying cancer drugs licensed in the past five years, six to 10 years ago, and more than 10 years ago. Classes of medicines were identified using the European Pharmaceutical Market Research Association (EphMRA) Anatomic Therapeutic Chemical (ATC) coding.
We extracted sales volumes for all countries by class from IMS data (see below for more details). In many cases the portfolio of medicines for a specific class will differ between countries. There are some medicines not launched in the UK or not launched in one or more of the comparator countries. But it is reasonable to match usage for the whole class as these will be the available clinical options.
We have also included in the present analysis two ATC subclasses where groups of medicines have been introduced since the publication of the Richards Report: protease inhibitors for hepatitis C and novel oral anti-coagulants (NOACs). We present these separately so as not to affect the comparison of medicines usage between 2012/13 and 2008/09.
Finally, as requested by the ABPI, we have additionally included, in Appendix 1 to this report, analysis of two classes of medicines that were not included in the previous report: HIV and diabetes medicines. These have been analysed as they represent the two classes with the greatest UK sales for medicines that were launched in the five years to 2013 and are not already included in the Richards Report.
2.2 Data used in the study
Internationally comparable data on usage of medicines are not available. We, like the Richards Report, use sales data as a proxy for usage. The source for the medicines sales data in our analysis is IMS Midas (http://www.imshealth.com/deployedfiles/imshealth/Global/Content/Information/Applications/Pharma%20Market%20Measurement/MIDAS%20Slim%20Jim%20BrEv%200113_spread_final.pdf). This database collates sales data from individual countries. In each country IMS populates the database by data collection throughout the supply chain, including manufacturers, wholesalers and pharmacists. The data are standardised by linking national data entities to international definitions, for example local brand names are converted to an international name. This enables comparisons between countries.
The period covered for the data extract was the 12 months to March 2013, inclusive. Volume data for number of packs and weight or international units were extracted for both primary care and hospital markets, and combined. These volume data were matched to IMS salt factor data to adjust reported weight for weight of the active ingredient. In the Richards Report, IMS volume data were also used and were validated by manufacturers. The final dataset in the Richards Report comprised around 90% IMS data and 10% manufacturer data (Richards, 2010, p13). Validation of data with (and possible replacement of data by) manufacturers is a time intensive activity and was beyond the scope of this exercise. The following results are, therefore, based 100% on IMS data.
It was recognised in the Richards Report that there were instances where IMS is not able to monitor medicines usage in parts of the supply chain. Figure 1 shows a schema of the various possible routes for the movement of medicines from the manufacturer to eventual administration to the patient. Each transaction between actors in the supply chain presents an opportunity to capture information but also to lose track of movements. The specific nature of a supply chain in each country will reflect its healthcare system, for example the balance between, and roles of, specialist and generalist clinicians. The ability of IMS to elicit data from each of the actors in the supply chain varies between countries. There will also be differences in the quality of the data elicited. (These considerations relate to the central collection of supply chain data and not, notably, to the systems in place to maintain the integrity and safety of the supply chain).
To explore the specific issues associated with central collection of supply chain data we discuss each of the actors in the UK. For the UK, IMS aims to maximise coverage of activity at the level prior to where administration to the patient takes place, such as the pharmacy or homecare provider. From these levels of data IMS build up local, regional and national audits to match the needs of their customers. Data elicited from other actors in the supply chain are used to validate these audits.
6
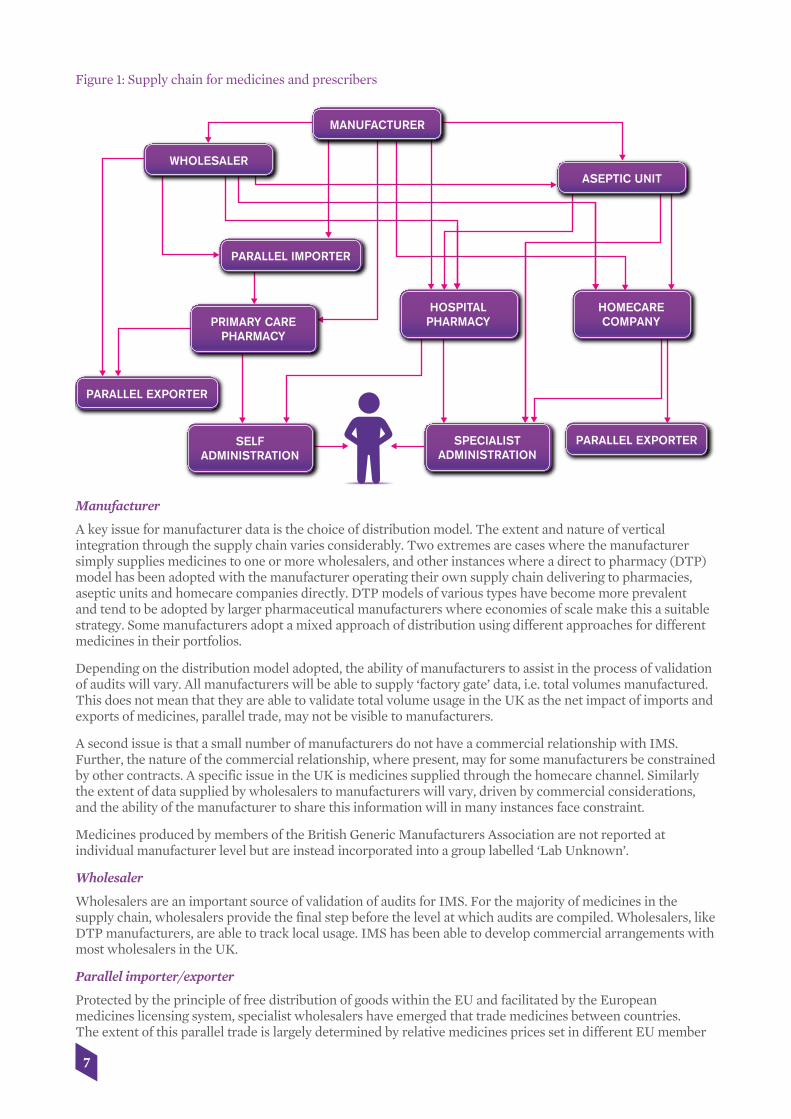
Figure 1: Supply chain for medicines and prescribers
Manufacturer
A key issue for manufacturer data is the choice of distribution model. The extent and nature of vertical integration through the supply chain varies considerably. Two extremes are cases where the manufacturer simply supplies medicines to one or more wholesalers, and other instances where a direct to pharmacy (DTP) model has been adopted with the manufacturer operating their own supply chain delivering to pharmacies, aseptic units and homecare companies directly. DTP models of various types have become more prevalent and tend to be adopted by larger pharmaceutical manufacturers where economies of scale make this a suitable strategy. Some manufacturers adopt a mixed approach of distribution using different approaches for different medicines in their portfolios.
Depending on the distribution model adopted, the ability of manufacturers to assist in the process of validation of audits will vary. All manufacturers will be able to supply ‘factory gate’ data, i.e. total volumes manufactured. This does not mean that they are able to validate total volume usage in the UK as the net impact of imports and exports of medicines, parallel trade, may not be visible to manufacturers.
A second issue is that a small number of manufacturers do not have a commercial relationship with IMS. Further, the nature of the commercial relationship, where present, may for some manufacturers be constrained by other contracts. A specific issue in the UK is medicines supplied through the homecare channel. Similarly the extent of data supplied by wholesalers to manufacturers will vary, driven by commercial considerations, and the ability of the manufacturer to share this information will in many instances face constraint.
Medicines produced by members of the British Generic Manufacturers Association are not reported at individual manufacturer level but are instead incorporated into a group labelled ‘Lab Unknown’.
Wholesaler
Wholesalers are an important source of validation of audits for IMS. For the majority of medicines in the supply chain, wholesalers provide the final step before the level at which audits are compiled. Wholesalers, like DTP manufacturers, are able to track local usage. IMS has been able to develop commercial arrangements with most wholesalers in the UK.
Parallel importer/exporter
Protected by the principle of free distribution of goods within the EU and facilitated by the European medicines licensing system, specialist wholesalers have emerged that trade medicines between countries. The extent of this parallel trade is largely determined by relative medicines prices set in different EU member
7
MANUFACTURER
ASEPTIC UNIT
HOMECARECOMPANY
HOSPITALPHARMACY
SPECIALISTADMINISTRATION
SELFADMINISTRATION
PRIMARY CAREPHARMACY
WHOLESALER
PARALLEL IMPORTER
PARALLEL EXPORTER
PARALLEL EXPORTER

states and movements in exchange rates. In the UK there is an incentive for primary care pharmacists to seek medicines supplied at prices lower than reimbursement rates.
For the UK, parallel importing of medicines grew rapidly in the late 1990s. Typically this activity covered on-patent high volume primary care medicines. IMS has increased the extent of commercial arrangements with parallel importers, thus improving its data. Also the share of the primary care market covered by parallel imports has decreased in recent years and now represents approximately 10% of UK primary care medicines sales by value.
Parallel exporting is a more recent phenomenon in the UK, increasing rapidly in 2008. The characteristic business model is different to parallel imports, involving specialist secondary care medicines collected from individual pharmacies. It was estimated that the value of medicines moving through this route was about £30 to £50m per month in 2008. During the period covered in this report, IMS monitored medicines sold into pharmacy and did not have commercial relationships with parallel exporters. To address this weakness in the data, a series of algorithms were developed to capture unusual patterns in purchasing behaviour by pharmacists. Where such patterns were detected, sales were excluded from audits. Because it was unusual to find specialist medicines in a primary care setting this should not represent a significant factor for data error for 2013 data.
Homecare provider
For the UK a particular issue noted in the Richards Report was medicines administered to patients through a homecare arrangement. In 2012 OHE audited IMS data for homecare medicines with companies. We found that there had been considerable improvement in IMS collection of sales via homecare at a national level since 2009. A factor driving this has been greater co-operation between pharmaceutical manufacturers and IMS, validating IMS national data with company ‘factory gate’ data.
Aseptic unit
In specialist care there are medicines that have complex posology. For example, an oncology medicine may have dosage determined by the patient’s bodyweight or be administered as part of a combination with another medicine. It may also be the case that medicines that require compounding can most efficiently be made in large batches, rather than each time a request is made. Where this is the case, medicines are initially processed in an aseptic unit. During this process some medicines volumes may be discarded, for example if part of a vial is used and the remainder cannot be stored. Where IMS are not able to track this, if the compound does not pass through the hospital pharmacy but is instead delivered directly from the aseptic unit to the ward, then reported usage may be slightly overstated. However for the period analysed in this report IMS had commercial relationships with almost all NHS Trusts operating aseptic units.
Primary care pharmacy
Primary care pharmacies are the source of data for the UK IMS audit of medicines usage in primary care, the British Pharmaceutical Index. IMS has commercial relationships with most primary care pharmacies and pharmacy chains in the UK, and regularly reports coverage statistics to clients. For the period analysed in this report sales were measured using invoices and therefore it was not possible to track whether the medicine was ultimately dispensed against a prescription. Apart from parallel exports (discussed earlier) this should not represent a significant issue for the medicines covered in the report.
Hospital pharmacy
Hospital pharmacies are the source of data for the UK IMS audit of medicines usage in secondary care, the Hospital Pharmacy Audit Index. To measure coverage, IMS report the total number of hospital beds for the NHS Trusts from whom they collect data as a percent of the total number of beds in the specific geography. There is some variation in coverage between the UK countries. For the UK for the period analysed in this report coverage estimated in this way was around 90%.
The data captured in the hospital audit are taken from hospital pharmacy information systems at the point when the medicine is dispensed. Where usage is not recorded, such as homecare and where medicines are delivered directly to hospital wards from aseptic units, some usage may be overlooked at this level.
Self-administration
When a patient collects a prescription from a pharmacy or hospital to self-administer it may still be the case that ultimately the medicine is not used. The ratio of medicines collected versus used is known as the adherence rate. This step of the process is not captured in the IMS audits for any country. It is therefore not possible to determine if adherence rates differ between countries and hence to what extent differences in
8

reported sales mean that greater or less benefit is being delivered to patients.
Specialist Administration
In a specialist setting there are instances where some of the volume of a medicine is not administered to the patient. Where a patient requires a volume that means that the healthcare professional has to adapt a standard dosage, such as a part of a vial, then not all of the volume ends up in the patient. This is currently not captured in IMS audits.
Adjustments to UK National Audits
Where IMS is able to identify gaps in the local audited data through validation elsewhere in the supply chain, reported national data are used to augment national audits. This is the case with homecare previously discussed. Where IMS is able to identify a coverage issue such as parallel exports, national data are extrapolated. This approach is also used in secondary care to extrapolate for the approximately 10% of NHS Trusts who do not have a commercial arrangement with IMS.
For its two UK market audits (primary care and secondary care respectively) IMS reports coverage but uses validation elsewhere in the supply chain and extrapolation where possible to improve the nationally reported figures. IMS also relies on their commercial relationships to ensure that the data captured is accurate.
2.3 Analysis and presentation
The stages in our analysis, as for the Richards Report, were as follows:
1. For each medicine for each country total usage was calculated and adjusted by population. This was done in the Richards Report, we are simply presenting medicines usage per head of total population in each country.
2. Medicines were grouped using the categories in the Richards Report.
3. Population adjusted volume of sales of medicines in each category was then compared across the total sample of 13 countries and across the sub-sample of the largest five EU economies (France, Germany, Italy, Spain, UK).
4. For each category of medicines the UK was compared with the other countries in two ways:
I. UK population total usage per class (or medicine) as a percentage of average population adjusted usage for the other 12 comparator countries, or for the EU4 (the other four large EU economies)
II. All countries were ranked based on total population adjusted usage, from highest to lowest, and the UK rank was noted.
5. A composite ranking of rankings score for each country was also calculated. The average rank score across categories for a country was calculated and this was then used to rank countries overall.
Stage 1 – For each country convert medicines usage into a population weighted usage figure:
a) For each medicine total volume of sales for each country was converted into a single measure. For example a statin with strengths of 20mg and 40mg was converted into a defined daily dose (DDD) of 20mg and each 40mg dose would have a value of two DDDs. Where a DDD was not suitable a comparable volume measure was used, generally milligrams. For each medicine total usage, by the single measure by country, was then calculated.
b) The total sales figure was divided by the total population for that country. This mitigates variation in absolute usage due to different sizes in population.
Stage 2 – Grouping medicines into categories:
a) Using the same categories as in the Richards Report, medicines were grouped using ATC classification.
b) Where usage (proxied by sales) was measured using DDDs, usage was combined for all medicines in the class.
c) Otherwise an un-weighted average of the percentage per capita use of each medicine in the group was calculated, as volumes measured in different units cannot be combined.
9

Stages 3, 4 and 5 – Comparing population-adjusted usage:
a) UK usage per capita for each group of medicines was compared with the average for the EU4 (France, Germany, Italy, Spain) and for all 12 comparator countries, with UK usage per person expressed as a percentage of the average of comparator countries’ usage per person. (Note that Denmark, although included in the Richards Report analyses, was excluded from our analysis due to lack of up-to-date data.)
b) The UK was also ranked for total usage per class compared with all other countries.
2.4 Limitations in the presentation of the analysis
In addition to the issues discussed earlier that arise from the difficulty of collecting comprehensive data, the Richards Report identified the following more general issues with the presentation of the analysis:
a) Where a medicine is used to treat more than one disease, it can be difficult to disaggregate usage. In many cases, therefore, the usage shown for a particular country may overestimate actual usage in the particular indication being studied. For the purposes of this report this adjustment remained beyond our scope. For most classes studied this is not a major issue. But, for example, cetuximab has both cancer and non-cancer indications, but in the analyses reported in the Richards Report and here has been included under the heading of cancer. Similarly, the TNF medicines are reported as rheumatoid arthritis biologics but they are also indicated for other autoimmune diseases although not all TNFs have the same other indications.
b) Differences in dosage may explain some of the variations between countries. For example, clinicians in different countries may adopt different treatment protocols which nonetheless involve the same drug. For the Richards Report preliminary analysis was carried out for a number of the countries by IMS Health for the dementia products, statins and second-generation antipsychotics. The differences seen did not have any explanatory power but the same may not be the case in other therapy areas.
c) The absence of a method for standardising usage for cancer products means that country-level comparisons may reveal rather less than they should. Low-volume products are given equal weighting to high-volume products. In terms of service provision, if relative usage of the high-volume product is low, this may be more significant than high relative usage of the low-volume product. Equally, if relative usage of a high-volume product is high, this may be more significant than low relative usage of a low-volume product. Our samples include medicines indicated for first-line use in cancers with significant prevalence as well as those in lower prevalence cancers and used second, third or later line.
10

3. Results
3.1 Overview
In order to present an overall comparison of usage in the UK with comparator countries, the Richards Report included a summary benchmark: a ranking of rankings. For each class of medicines each country was ranked according to its population adjusted usage from highest usage (rank = 1) to lowest (rank = 13, as there are 13 countries in the comparison in all). These rank numbers were then summed and a mean ranking across therapy areas was calculated for each country. A country that ranked 1 for all therapy areas would have a mean ranking of 1, for example. Thus the mean ranking can take any value from 1 to 13. The country with the highest mean ranking (= lowest average rank score) was then ranked overall first in the ranking of rankings. This mean ranking is reported at the foot of each of the Tables 3a and 3b below.
Richards noted that “In general, the picture is very varied within any individual country … with high usage in some disease areas, intermediate in others and low in others.” (p18). The Richards Report cautioned against drawing conclusions about overall usage of medicines in each country. Tables 3a and 3b below compare the results from the Richards Report with our updated figures. Note that we have recalculated the 2008/09 figures from the Richards Report to exclude Denmark and thereby enable a valid comparison with the 2012/13 rankings.
The UK’s mean rank score is very similar in 2012/13 and 2008/09 and its overall rank among the comparator countries has remained the same. The 2008/09 average ranking score of 7.4 compares with a score of 7.3 in 2012/13, and the UK remained in ninth position overall (out of 13 countries) based on this score.
Table 3a. Summary table of international rankings by therapy area – 2008/09 and 2012/13 top 5 ranked countries and UK
France Spain USA Austria Italy UK
2009 2013 2009 2013 2009 2013 2009 2013 2009 2013 2009 2013Acute MI 6 9 4 1 12 12 10 6 11 7 1 8Antipsychotics 9 13 2 7 1 8 5 1 13 11 10 9Dementia 2 5 3 1 1 2 5 3 12 10 10 8Hepatitis C 3 2 2 5 6 3 4 4 1 1 13 11Multiple sclerosis 10 7 7 10 3 5 11 11 2 3 12 12Osteoporosis 2 7 1 2 3 10 11 5 5 4 6 3RDS 6 6 7 9 1 1 3 4 2 5 4 2Rheumatoid arthritis 8 6 6 7 1 4 7 12 11 11 9 8Statins 7 3 9 8 3 1 12 11 13 10 2 4Wet AMD 3 3 9 10 7 8 11 12 12 11 4 5Cancer <5 years* 1 5 5 10 3 8 2 1 8 11 11 7Cancer 6–10 years* 1 1 4 4 7 6 3 2 5 3 8 12Cancer >10 years* 1 3 3 1 7 12 6 7 2 2 9 4Cancer hormones 4 7 2 2 12 1 6 10 1 5 5 9
Total ranking points 63 77 64 77 67 81 96 89 98 94 104 102Mean ranking 4.5 5.5 4.6 5.5 4.8 5.8 6.9 6.4 7.0 6.7 7.4 7.3Overall rank 1 1 2 2 3 3 5 4 6 5 9 9
Notes:RSV and stroke were excluded from this analysis in the Richards Report. This was due to commercial confidentiality concerns regarding data for a single medicine being presented. To ensure that results could be compared these have been excluded from the updated analysis.* Based on time since UK launch as at March 2009 for the 2008/09 data and as at March 2013 for the 2012/13 data.
11

Table 3b. Summary table of international rankings by therapy area – 2008/09 and 2012/13 countries ranked 6 to 13
Canada Switzer-land
Australia UK Germany Norway Sweden New Zealand
2009 2013 2009 2013 2009 2013 2009 2013 2009 2013 2009 2013 2009 2013 2009 2013Acute MI 9 2 n/a 13 3 5 1 8 8 10 7 4 5 11 2 3Antipsychotics 3 2 7 4 4 3 10 9 11 5 8 10 12 12 6 6Dementia 4 4 9 11 11 12 10 8 8 9 6 7 7 6 13 13Hepatitis C 11 13 9 6 5 10 13 11 8 8 10 9 7 7 12 12Multiple sclerosis 4 9 8 2 9 8 12 12 1 1 5 6 6 4 13 13Osteoporosis 9 1 4 9 8 6 6 3 7 11 10 8 12 12 13 13RDS 12 13 13 12 5 3 4 2 8 8 11 11 10 10 9 7Rheumatoid arthritis 4 1 5 3 10 9 9 8 12 10 2 2 3 5 13 13Statins 4 6 8 2 1 5 2 4 11 12 5 7 10 13 6 9Wet AMD 5 4 2 1 1 2 4 5 8 6 10 9 6 7 13 13Cancer <5 years* 12 9 6 2 10 12 11 7 4 3 9 4 7 6 13 13Cancer 6–10 years* 11 10 2 7 9 9 8 12 6 5 12 11 10 8 13 13Cancer >10 years* 10 10 5 11 12 6 9 4 4 9 11 13 8 5 13 8Cancer hormones 10 12 9 13 11 11 5 9 3 8 8 4 7 3 13 6
Total ranking points 108 96 87 96 99 101 104 102 99 105 114 105 110 109 152 142Mean rankings 7.7 6.9 6.7 6.9 7.1 7.2 7.4 7.3 7.1 7.5 8.1 7.5 7.9 7.8 10.9 10.1Overall rank 10 6 4 7 8 8 9 9 7 10 12 11 11 12 13 13
Notes:RSV and stroke were excluded from this analysis in the Richards Report. This was due to commercial confidentiality concerns regarding data for a single medicine being presented. To ensure that results could be compared these have been excluded from the updated analysis.* Based on time since UK launch as at March 2009 for the 2008/09 data and as at March 2013 for the 2012/13 data.
Chart 1 simplifies the rather complicated picture presented in Tables 3a and 3b. A low mean ranking score for a country indicates that its usage of medicines is higher for the total sample of medicines relative to most or all of the other countries in the comparison. To ease interpretation we have reversed the scale on the vertical axis. Comparing the average ranking scores by country, there has been a relative decrease since 2008/09 in the score for the three highest ranked countries on the left of the chart – France, Spain and USA – and a relative increase in the next three highest ranked countries, Austria, Italy and Canada. Overall, comparing 2012/13 with 2008/09, the relative positions of the countries have not changed much but their ranking scores have converged somewhat to become more similar: there is less variation in average ranking scores across the sample of countries.
12

Chart 1: Mean ranking of rankings scores by country 2008/09 and 2012/13
3.2 Results by therapy area
Looking at changes in each therapy area separately reveals a more varied story. If, instead of ranking, UK usage per head of population is benchmarked as a percentage of the average usage in all comparator countries then there have been significant changes in most classes of medicine included in the analysis. In all instances a score of 100% would mean that UK usage is identical to the average population weighted use for the comparator countries.
The following tables provide results for each of the individual classes of medicines in turn, in the same format as Annex 3 of the Richards Report, albeit with results for both 2008/09 and 2012/13. For each class of medicine, the first table lists the rank order of usage per capita for individual countries. This is followed by a table where the UK usage per head of population is expressed as a percentage of that of the EU5 countries (France, Germany, Italy, Spain and UK) and of all the comparator countries. (Note that the latter comparison in usage is with 12 other countries in 2012/13 but with 13 countries in the 2008/09 figures as it was not possible to access the raw data used to make the calculations to exclude Denmark from the older figures.)
The tables showing the details for each individual class of medicines in turn are then followed by an overall summary of the UK’s relative usage compared to the other countries and how that has changed between 2008/09 and 2012/13 across all of the classes of medicines.
13
France
Mea
n ra
nkin
g of
ran
king
s
12.00
10.00
8.00
6.00
4.00
2.00
0.00
Spain
US
A
Austria
Italy
Canada
Sw
itzerland
Australia
2009
2013
UK
Germ
any
Norw
ay
Sw
eden
New
Zealand

Cancer
Table 4a. Cancer medicines 0-5 years* ranking of usage
Rank 2013 Country Rank 2009 Country
1 Austria 1 France
2 Switzerland 2 Austria
3 Germany 3 USA
4 Norway 4 Germany
5 France 5 Spain
6 Sweden 6 Switzerland
7 UK 7 Sweden
8 USA 8 Italy
9 Canada 9 Norway
10 Spain 10 Australia
11 Italy 11 UK
12 Australia 12 Canada
13 New Zealand 13 New Zealand
Table 4b. Cancer medicines 0-5 years* UK relative usage
UK DDD rank UK usage as a percentage of EU5 average
UK usage as a percentage of all countries average
2013 8 94% 92%
2009 11 41% 45%
* Based on time since UK launch as at March 2009 for the 2008/09 data and as at March 2013 for the 2012/13 data.
Table 5a. Cancer medicines 6-10 years* ranking of usage
Rank 2013 Country Rank 2009 Country
1 France 1 France
2 Austria 2 Switzerland
3 Italy 3 Austria
4 Spain 4 Spain
5 Germany 5 Italy
6 USA 6 Germany
7 Switzerland 7 USA
8 Sweden 8 UK
9 Australia 9 Australia
10 Canada 10 Sweden
11 Norway 11 Canada
12 UK 12 Norway
13 New Zealand 13 New Zealand
Table 5b. Cancer medicines 6-10 years* UK relative usage
UK DDD rank UK usage as a percentage of EU5 average
UK usage as a percentage of all countries average
2013 12 44% 54%
2009 8 107% 94%
* Based on time since UK launch as at March 2009 for the 2008/09 data and as at March 2013 for the 2012/13 data.
14

Table 6a. Cancer medicines 10+ years* ranking of usage
Rank 2013 Country Rank 2009 Country
1 Spain 1 France
2 Italy 2 Italy
3 France 3 Spain
4 UK 4 Germany
5 Sweden 5 Switzerland
6 Australia 6 Austria
7 Austria 7 USA
8 New Zealand 8 Sweden
9 Germany 9 UK
10 Canada 10 Canada
11 Switzerland 11 Norway
12 USA 12 Australia
13 Norway 13 New Zealand
Table 6b. Cancer medicines 10+ years* UK relative usage
UK DDD rank UK usage as a percentage of EU5 average
UK usage as a percentage of all countries average
2013 4 103% 124%
2009 9 78% 87%
* Based on time since UK launch as at March 2009 for the 2008/09 data and as at March 2013 for the 2012/13 data.
Table 7a. Hormonal cancer medicines ranking of usage
Rank 2013 Country Rank 2009 Country
1 USA 1 Italy
2 Spain 2 Spain
3 Sweden 3 Germany
4 Norway 4 France
5 Italy 5 UK
6 New Zealand 6 Austria
7 France 7 Sweden
8 Germany 8 Norway
9 UK 9 Switzerland
10 Austria 10 Canada
11 Australia 11 Australia
12 Canada 12 USA
13 Switzerland 13 New Zealand
Table 7b. Hormonal cancer medicines UK relative usage
UK DDD rank UK usage as a percentage of EU5 average
UK usage as a percentage of all countries average
2013 9 68% 73%
2009 5 92% 93%
* Based on time since UK launch as at March 2009 for the 2008/09 data and as at March 2013 for the 2012/13 data.
15
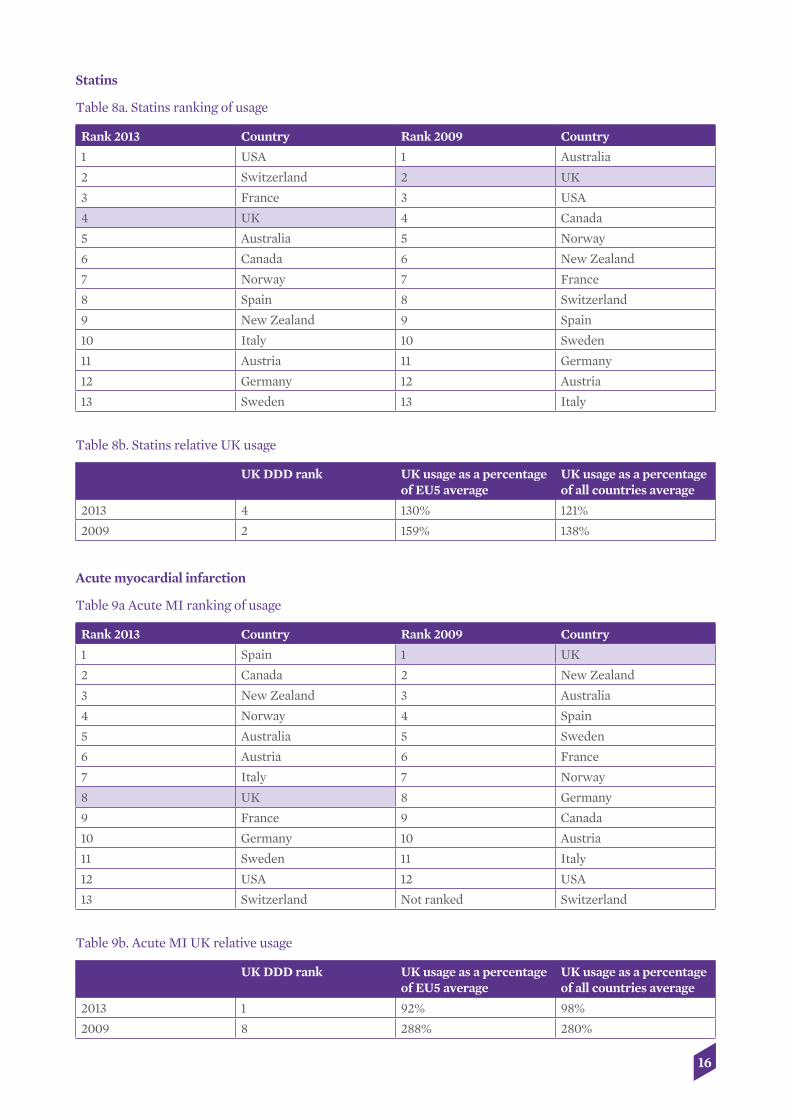
Statins
Table 8a. Statins ranking of usage
Rank 2013 Country Rank 2009 Country
1 USA 1 Australia
2 Switzerland 2 UK
3 France 3 USA
4 UK 4 Canada
5 Australia 5 Norway
6 Canada 6 New Zealand
7 Norway 7 France
8 Spain 8 Switzerland
9 New Zealand 9 Spain
10 Italy 10 Sweden
11 Austria 11 Germany
12 Germany 12 Austria
13 Sweden 13 Italy
Table 8b. Statins relative UK usage
UK DDD rank UK usage as a percentage of EU5 average
UK usage as a percentage of all countries average
2013 4 130% 121%
2009 2 159% 138%
Acute myocardial infarction
Table 9a Acute MI ranking of usage
Rank 2013 Country Rank 2009 Country
1 Spain 1 UK
2 Canada 2 New Zealand
3 New Zealand 3 Australia
4 Norway 4 Spain
5 Australia 5 Sweden
6 Austria 6 France
7 Italy 7 Norway
8 UK 8 Germany
9 France 9 Canada
10 Germany 10 Austria
11 Sweden 11 Italy
12 USA 12 USA
13 Switzerland Not ranked Switzerland
Table 9b. Acute MI UK relative usage
UK DDD rank UK usage as a percentage of EU5 average
UK usage as a percentage of all countries average
2013 1 92% 98%
2009 8 288% 280%
16

Alteplase for stroke
Table 10a Stroke (alteplase) ranking of usage
Rank 2013 Country
1 Germany
2 Sweden
3 USA
4 Austria
5 Norway
6 Canada
7 UK
8 Switzerland
9 New Zealand
10 France
11 Australia
12 Spain
13 Italy
Note: In the Richards Report ranking for this medicine was not reported for all countries.
Table 10b. Stroke (alteplase) UK relative usage
UK DDD rank UK usage as a percentage of EU5 average
UK usage as a percentage of all countries average
2013 7 110% 86%
2009 8 84% 58%
Novel oral anti-coagulants
Note that this new sub-class of medicines was not in the Richards Report.
Table 11a. Novel oral anti-coagulant medicines ranking of usage
Rank 2013 Country
1 Germany
2 Canada
3 Switzerland
4 USA
5 Austria
6 France
7 Norway
8 Spain
9 Sweden
10 UK
11 New Zealand
12 Australia
13 Italy
17
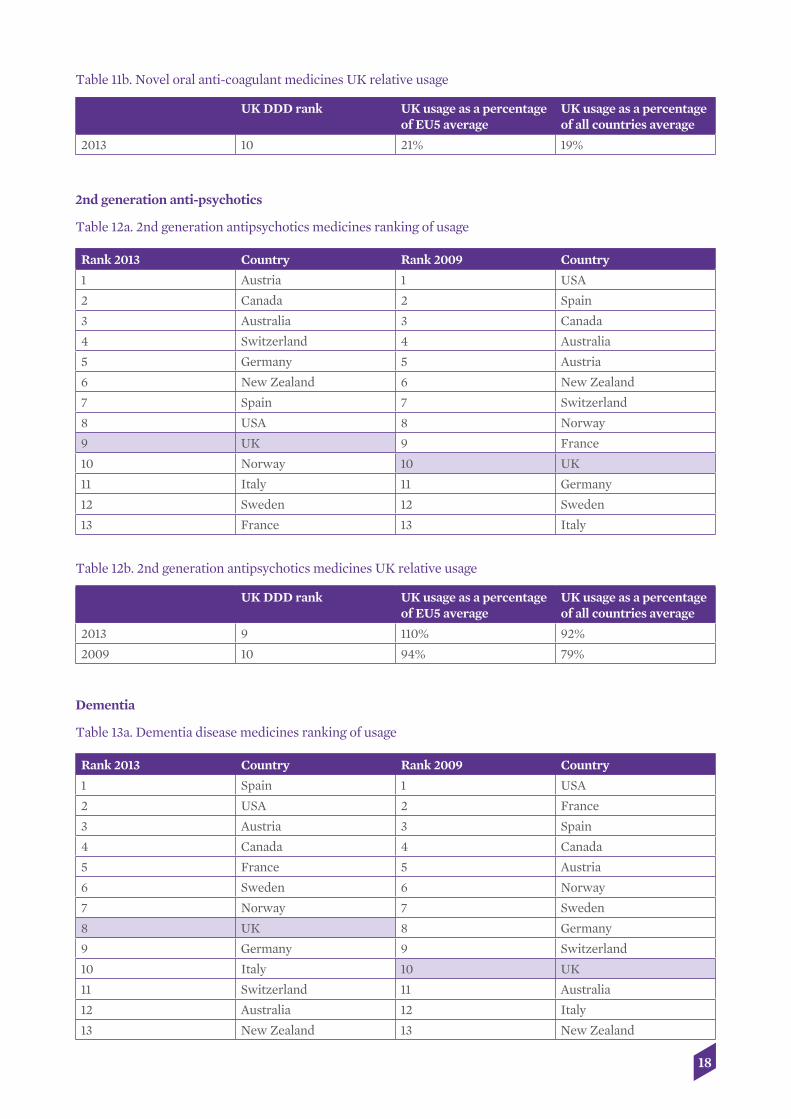
Table 11b. Novel oral anti-coagulant medicines UK relative usage
UK DDD rank UK usage as a percentage of EU5 average
UK usage as a percentage of all countries average
2013 10 21% 19%
2nd generation anti-psychotics
Table 12a. 2nd generation antipsychotics medicines ranking of usage
Rank 2013 Country Rank 2009 Country
1 Austria 1 USA
2 Canada 2 Spain
3 Australia 3 Canada
4 Switzerland 4 Australia
5 Germany 5 Austria
6 New Zealand 6 New Zealand
7 Spain 7 Switzerland
8 USA 8 Norway
9 UK 9 France
10 Norway 10 UK
11 Italy 11 Germany
12 Sweden 12 Sweden
13 France 13 Italy
Table 12b. 2nd generation antipsychotics medicines UK relative usage
UK DDD rank UK usage as a percentage of EU5 average
UK usage as a percentage of all countries average
2013 9 110% 92%
2009 10 94% 79%
Dementia
Table 13a. Dementia disease medicines ranking of usage
Rank 2013 Country Rank 2009 Country
1 Spain 1 USA
2 USA 2 France
3 Austria 3 Spain
4 Canada 4 Canada
5 France 5 Austria
6 Sweden 6 Norway
7 Norway 7 Sweden
8 UK 8 Germany
9 Germany 9 Switzerland
10 Italy 10 UK
11 Switzerland 11 Australia
12 Australia 12 Italy
13 New Zealand 13 New Zealand
18

Table 13b. Dementia disease medicines UK relative usage
UK DDD rank UK usage as a percentage of EU5 average
UK usage as a percentage of all countries average
2013 8 83% 86%
2009 10 66% 64%
Multiple sclerosis
Table 14a. Multiple sclerosis medicines ranking of usage
Rank 2013 Country Rank 2009 Country
1 Germany 1 Germany
2 Switzerland 2 Italy
3 Italy 3 USA
4 Sweden 4 Canada
5 USA 5 Norway
6 Norway 6 Sweden
7 France 7 Spain
8 Australia 8 Switzerland
9 Canada 9 Australia
10 Spain 10 France
11 Austria 11 Austria
12 UK 12 UK
13 New Zealand 13 New Zealand
Table 14b. Multiple sclerosis UK relative usage
UK DDD rank UK usage as a percentage of EU5 average
UK usage as a percentage of all countries average
2013 12 32% 35%
2009 12 27% 27%
Osteoporosis
Table 15a. Osteoporosis medicines ranking of usage
Rank 2013 Country Rank 2009 Country
1 Canada 1 Spain
2 Spain 2 France
3 UK 3 USA
4 Italy 4 Switzerland
5 Austria 5 Italy
6 Australia 6 UK
7 France 7 Germany
8 Norway 8 Australia
9 Switzerland 9 Canada
10 USA 10 Norway
11 Germany 11 Austria
12 Sweden 12 Sweden
13 New Zealand 13 New Zealand
19

Table 15b. Osteoporosis medicines UK relative usage
UK DDD rank UK usage as a percentage of EU5 average
UK usage as a percentage of all countries average
2013 3 118% 128%
2009 6 41% 71%
TNF medicines
Table 16a. TNF medicines ranking of usage
Rank 2013 Country Rank 2009 Country
1 Canada 1 USA
2 Norway 2 Norway
3 Switzerland 3 Sweden
4 USA 4 Canada
5 Sweden 5 Switzerland
6 France 6 Spain
7 Spain 7 Austria
8 UK 8 France
9 Australia 9 UK
10 Germany 10 Australia
11 Italy 11 Italy
12 Austria 12 Germany
13 New Zealand 13 New Zealand
Table 16b. TNF medicines UK relative usage
UK DDD rank UK usage as a percentage of EU5 average
UK usage as a percentage of all countries average
2013 8 93% 63%
2009 9 106% 73%
Hepatitis C
Table 17a. Peg-interferons for hepatitis C ranking of usage
Rank 2013 Country Rank 2009 Country
1 Italy 1 Italy
2 France 2 Spain
3 USA 3 France
4 Austria 4 Austria
5 Spain 5 Australia
6 Switzerland 6 USA
7 Sweden 7 Sweden
8 Germany 8 Germany
9 Norway 9 Switzerland
10 Australia 10 Norway
11 UK 11 Canada
12 New Zealand 12 New Zealand
13 Canada 13 UK
20

Table 17b. Peg-interferons for hepatitis C UK relative usage
UK DDD rank UK usage as a percentage of EU5 average
UK usage as a percentage of all countries average
2013 11 59% 73%
2009 13 43% 56%
Note that this new sub-class of medicines, protease inhibitors for hepatitis C, was not in the Richards Report.
Table 18a. Protease inhibitors for hepatitis C ranking of usage
Rank 2013 Country
1 USA
2 France
3 Norway
4 Austria
5 Spain
6 Germany
7 Canada
8 Switzerland
9 Sweden
10 UK
11 Italy
12 Australia
13 New Zealand
Table 18b. Protease inhibitors for hepatitis C UK relative usage
UK DDD rank UK usage as a percentage of EU5 average
UK usage as a percentage of all countries average
2013 10 48% 49%
Respiratory distress syndrome
Table 19a. Respiratory distress syndrome ranking of usage
Rank 2013 Country Rank 2009 Country
1 USA 1 USA
2 UK 2 Italy
3 Australia 3 Austria
4 Austria 4 UK
5 Italy 5 Australia
6 France 6 France
7 New Zealand 7 Spain
8 Germany 8 Germany
9 Spain 9 New Zealand
10 Sweden 10 Sweden
11 Norway 11 Norway
12 Switzerland 12 Canada
13 Canada 13 Switzerland
21
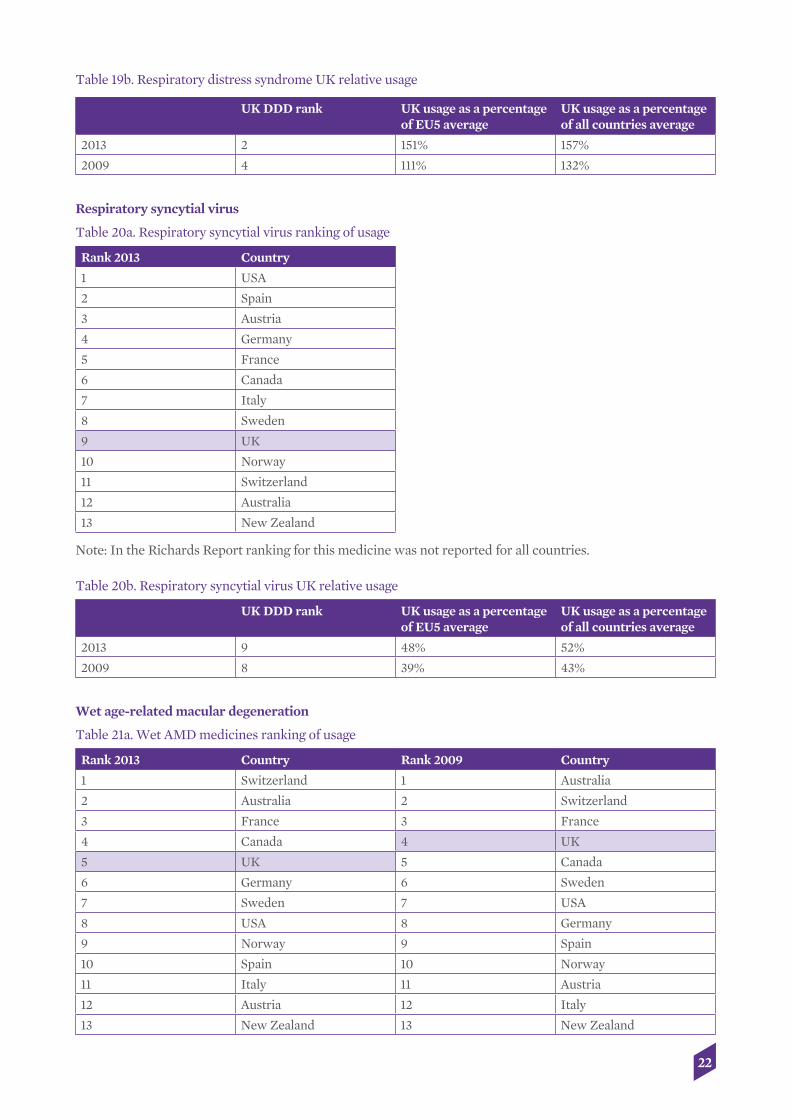
Table 19b. Respiratory distress syndrome UK relative usage
UK DDD rank UK usage as a percentage of EU5 average
UK usage as a percentage of all countries average
2013 2 151% 157%
2009 4 111% 132%
Respiratory syncytial virus
Table 20a. Respiratory syncytial virus ranking of usage
Rank 2013 Country
1 USA
2 Spain
3 Austria
4 Germany
5 France
6 Canada
7 Italy
8 Sweden
9 UK
10 Norway
11 Switzerland
12 Australia
13 New Zealand
Note: In the Richards Report ranking for this medicine was not reported for all countries.
Table 20b. Respiratory syncytial virus UK relative usage
UK DDD rank UK usage as a percentage of EU5 average
UK usage as a percentage of all countries average
2013 9 48% 52%
2009 8 39% 43%
Wet age-related macular degeneration
Table 21a. Wet AMD medicines ranking of usage
Rank 2013 Country Rank 2009 Country
1 Switzerland 1 Australia
2 Australia 2 Switzerland
3 France 3 France
4 Canada 4 UK
5 UK 5 Canada
6 Germany 6 Sweden
7 Sweden 7 USA
8 USA 8 Germany
9 Norway 9 Spain
10 Spain 10 Norway
11 Italy 11 Austria
12 Austria 12 Italy
13 New Zealand 13 New Zealand
22

Table 21b. Wet AMD medicines UK relative usage
UK DDD rank UK usage as a percentage of EU5 average
UK usage as a percentage of all countries average
2013 5 137% 131%
2009 4 115% 99%
3.3 Summary of the results by therapy area
The following tables and charts summarise the results across all of the medicine classes included in the exercise, comparing UK usage with average usage for the EU5 and for all country comparators.
Tables 22 and 23 below show the classes where relative UK usage as a percentage of the (all country) international average has respectively increased or decreased between 2008/09 and 2012/13. Table 24 reports UK usage where a comparison over time cannot be made due to a sub-class not having been included in the 2010 Richards Report.
In 11 of the 16 classes of medicines where comparison over time is possible, UK usage is higher in 2012/13 relative to the average of all other comparator countries than it was in 2008/09. In five of the 16 classes it is lower.
Table 22. Classes of medicines where relative UK usage is showing an increase from 2008/09 to 2012/13
UK 2009 rank UK 2013 rank UK usage as a percentage of all countries 2009
UK usage as a percentage of all countries 2013
Cancer medicines 0-5 years* 11 7 45% 92%
Cancer medicines 10+ years* 9 4 87% 124%
Alteplase for stroke 8 7 58% 86%
2nd generation anti-psychotics
10 9 79% 92%
Dementia 10 8 64% 86%
Multiple Sclerosis 12 12 27% 35%
Osteoporosis 6 3 71% 128%
Peg-Interferons for Hep C 13 11 56% 73%
Respiratory distress syndrome 4 2 132% 157%
Respiratory syncytial virus 8 9 43% 52%
Wet AMD 4 5 99% 131%
* Based on time since UK launch as at March 2009 for the 2008/09 data and as at March 2013 for the 2012/13 data.
Table 23. Classes of medicines where relative UK usage is showing a decrease from 2008/09 to 2012/13
UK 2009 rank UK 2013 rank UK usage as a percentage of all countries 2009
UK usage as a percentage of all countries 2013
Cancer medicines 6-10 years* 8 12 94% 54%
Hormonal cancer medicines 5 9 93% 73%
Statins 2 4 138% 121%
Acute MI 2 8 280% 98%
TNF medicines 9 8 73% 63%
* Based on time since UK launch as at March 2009 for the 2008/09 data and as at March 2013 for the 2012/13 data.
23

Table 24. Sub-classes where a comparison cannot be made between 2008/09 and 2012/13
UK 2013 rank UK usage as a percentage of all countries 2013
NOACs 10 19%
Protease inhibitors for Hep C 10 49%
Caution needs to be exercised when interpreting these results. As a relative measure is being calculated here it may be the case that UK usage in absolute terms has changed by more, or by less, than the relative score might suggest, depending on how absolute usage has changed on average in the comparator countries. Chart 2 plots UK usage relative to the EU5 countries (Germany, France, Italy, Spain and the UK) in 2008/09 and 2012/13. In 2012/13 UK usage relative to the EU5 was below the 100% benchmark in 9 of 16 classes of medicines and above 100% in 7. Chart 2 also shows that in 11 of 16 classes UK usage increased relative to the average for the EU5 between 2008/09 and 2012/13.
Chart 2: UK usage as percentage of EU5 average usage
24
UK
pop
ulat
ion
usag
e as
a p
erce
ntag
e of
usa
ge in
EU
5 200%
180%
160%
140%
120%
100%
80%
60%
40%
20%
0%
Mul
tiple
scle
rosis
RSV
Cance
r 6-1
0 ye
ars
Rheu
mat
oid
arth
ritis
Cance
r hor
mon
es
Hep
atitis
C
Demen
tia
Stro
keAn
tipsy
chot
ics
Cance
r <5
year
s
Acut
e M
I
Stat
ins
Cance
r >10
year
s
Osteo
poro
sis
Wet
AM
D
RDS
27% 32
% 39% 48
%
43%
41%
41%
59%
92%
94%
68%
66%
83%
78%
103% 11
0%
110% 11
8%
159%
130% 13
7%11
5%
111%
151%
94%
84%92
%
93%10
6%
288%
107%
44%
2009
2013

Chart 3 makes the same comparisons but between the UK and all other comparator countries. In 2012/13 UK usage was below the 100% benchmark in 11 of 16 classes. UK usage relative to the average of all the other countries increased between 2008/09 and 2012/13 in 11 of the 16 classes.
Chart 3: UK usage as percentage of all country average
Between 2008/09 and 2012/13, whenever UK usage has increased/fallen relative to the EU5 it has likewise increased/fallen relative to the full comparator set of 13 countries, and by a similar order of magnitude. This can be seen in Chart 4, where the absolute changes in UK benchmarked scores are plotted for the EU5 comparator and for all of the comparator countries taken together.
Chart 4: Absolute % change in usage for UK between 2008/09 and 2012/13 relative to EU5 and relative to all comparator countries
-200%
-150%
-100%
-50%
0%
50%
100%
Cha
nge
in r
elat
ive
UK
usa
ge A
BS
OLU
TE p
erce
nt
Acut
e M
ICan
cer 6
-10
year
sCan
cer h
orm
ones
Stat
ins
Rheu
mat
oid
arth
ritis
Mul
tiple
scle
rosis
RSV
Antip
sych
otics
Hep
atitis
CDem
entia
RDS
Stro
keW
et A
MD
Cance
r >10
year
sCan
cer <
5 ye
ars
Osteo
poro
sis
-182
%-1
96%
-40%
-20%
-24% -1
7%-2
9%
-10%
-13%
8% 9% 9% 13% 16%
17%
16%
22%
17% 25
% 28%
26% 32
%22
%
37%
25%
47% 53
% 57%
77%
40%
5%
-63%
ALL
EU5
25
UK
pop
ulat
ion
usag
e as
a p
erce
ntag
e of
usa
ge in
com
para
tor
coun
trie
s
200%
180%
160%
140%
120%
100%
80%
60%
40%
20%
0%
Mul
tiple
scle
rosis
RSV
Cance
r 6-1
0 ye
ars
Rheu
mat
oid
arth
ritis
Cance
r hor
mon
esH
epat
itis C
Demen
tiaSt
roke
Antip
sych
otics
Cance
r <5
year
sAc
ute
MI
Stat
ins
Cance
r >10
year
sOst
eopo
rosis
Wet
AM
D
RDS
27% 35
%
94%
54%
73% 79
% 87%
63%
93%
92%
73%
56%
73%
64%
45%
92% 98
%
121%
124%
71%
128% 131%
99%
132%
157%
138%
280%
86%
86%
58%
43% 52
%
2009
2013

By way of an overall summary of the UK’s comparative position in 2012/13, Table 25 shows for each of the disease areas covered in the analyses of both 2008/09 and 2012/13, those disease areas where UK medicines usage is respectively above or below the all comparator country average and according to whether the UK usage level has increased of fallen relative to that comparator country average between 2008/09 and 2012/13. Out of the 16 disease areas where comparisons across time are possible:
• UK usage per head of population relative to the all country average was above average in 2012/13 and had increased in relative terms since 2008/09 in four therapy areas.
• It was above the all-country average in 2012/13 but had fallen in relative terms since 2008/09 in just one therapy area.
• UK usage was below the all-country average in 2012/13 but had increased in relative terms since 2008/09 in seven therapy areas, in other words the UK has got closer to the international average in these seven areas.
• And it was below the all-country average in 2012/13 having fallen in relative terms since 2008/09 in four therapy areas.
The picture is mixed both with respect to the level of UK usage and how it has changed over time: it was more often below the international average than above average in 2012/13, but it had more often increased than fallen since 2008/09.
Table 25. UK usage relative to the all comparator country average in 2012/13 and whether relative usage increased or fell 2008/09-2012/13
UK medicine usage below or above all country average in 2012/13
Below average Above average
2008/09 to 2012/13 change in UK usage as % of all country average
Increased
Cancer 0-5 yrs*
Alteplase for stroke
2nd generation anti-psychotics
Dementia
Multiple sclerosis
Peg interferons for Hep C
RSV
Cancer 10+ yrs*
Osteoporosis
RDS
Wet AMD
Fell
Cancer 6-10 yrs*
Hormonal cancer
Acute MI
TNF medicines
Statins
* Based on time since UK launch as at March 2009 for the 2008/09 data and as at March 2013 for the 2012/13 data.
26
References
Department of Health, 2008. The 2009 Pharmaceutical Price Regulation Scheme. London: Department of Health. Available at: http://webarchive.nationalarchives.gov.uk/+/www.dh.gov.uk/en/Healthcare/Medicinespharmacyandindustry/Pharmaceuticalpriceregulationscheme/2009PPRS/index.htm
Department of Health, 2013. The 2014 Pharmaceutical Price Regulation Scheme. London: Department of Health. Available at: https://www.gov.uk/government/publications/pharmaceutical-price-regulation-scheme-2014
European Pharmaceutical Marketing Research Association, 2014. EphMRA Anatomical Classification (ATC and NFC). Manchester: European Pharmaceutical Marketing Research Association. Available at: http://www.ephmra.org/Classification
Nolte, E., Newbould, J. and Conklin, A., 2010. International variation in the usage of medicines. A review of the literature. RAND Europe Technical Report. Cambridge: RAND Europe. Available at: http://www.rand.org/content/dam/rand/pubs/technical_reports/2010/RAND_TR830.pdf
OECD, 2013. Health at a glance 2013: OECD indicators. Paris: OECD. Available at: http://www.oecd.org/els/health-systems/Health-at-a-Glance-2013.pdf
Richards, M., 2010. Extent and causes of international variations in drug usage. A report for the Secretary of State for Health by Professor Sir Mike Richards CBE. London: Department of Health. Available at: https://www.gov.uk/government/uploads/system/uploads/attachment_data/file/216249/dh_117977.pdf
WHO Collaborating Centre for Drug Statistics Methodology, 2014. DDD definitions. Oslo: WHO Collaborating Centre for Drug Statistics Methodology. Available at: http://www.whocc.no/ddd/definition_and_general_considera/#DDDs
27

Appendix 1: Benchmarking usage of HIV and diabetes medicines 2012/13
The ABPI commissioned analysis of these two classes of medicines – HIV and diabetes – as there have been launches of big-selling medicines in both areas since the Richards Report analysis. This reflects the perspective in the 2014 PPRS agreement explicitly linking innovation and benchmarking (Department of Health, 2013). Tables A1a,b present the results for HIV medicines.
For diabetes medicines, in Tables A2a,b, there have been two new classes of medicines introduced since 2009. These are Dipeptidyl peptidase-4 inhibitors (DPP-4 inhibitors) and Glucagon-like peptide-1 agonists (GLP-1 agonists), and results for these are presented separately from other anti-diabetic medicines. Insulins have also been presented separately as their use is discrete from other diabetes medicines.
Table A1a. HIV medicines ranking of usage
Rank 2013 Country
1 Spain
2 USA
3 Switzerland
4 France
5 Italy
6 UK
7 Canada
8 Australia
9 Germany
10 Norway
11 Austria
12 Sweden
13 New Zealand
Table A1b. HIV medicines UK relative usage
UK DDD rank UK usage as a percentage of EU5 average
UK usage as a percentage of all countries average
2013 6 79% 95%
Table A2a. Diabetes medicines ranking of usage
Country Insulins rank Country Other anti-diabetics rank
Country DPP-4 inhibitors and GLP 1 agonists rank
Germany 1 Spain 1 Italy 1
Sweden 2 UK 2 Spain 2
USA 3 Italy 3 France 3
Canada 4 New Zealand 4 Germany 4
UK 5 France 5 Switzerland 5
Australia 6 USA 6 Austria 6
Norway 7 Australia 7 USA 7
Spain 8 Canada 8 Norway 8
France 9 Austria 9 Canada 9
New Zealand 10 Germany 10 Australia 10
Italy 11 Switzerland 11 UK 11
Austria 12 Norway 12 Sweden 12
Switzerland 13 Sweden 13 New Zealand 13
28

Table A2b. diabetes medicines UK relative usage
UK DDD rank UK usage as a percentage of EU5 average
UK usage as a percentage of all countries average
2013 DPP-4 inhibitors and GLP 1 agonists
11 19% 33%
2013 insulins 5 102% 104%
2013 other medicines for diabetes
2 122% 156%
29

Appendix 2: List of medicines included in the analysis
Therapy area In Richards Report 2010 AdditionsAcute myocardial infarction Reteplase Urokinase
Tenecteplase Streptokinase
Alzheimer’s Disease Donepezil
Galantamine Memantine Rivastigmine Tacrine
Hep C Peginterferon alfa-2a Boceprevir Peginterferon alfa-2b TelaprevirMS Glatiramer acetate
Interferon beta-1a Interferon beta-1b Natalizumab
Osteoporosis Alendronic acid Denosumab
Clodronic acid (IM) IpriflavoneEtidronic acid Neridronic acidIbandronic acid Tiludronic acidPamidronic acid Parathyroid hormone Raloxifene Risedronic acid Strontium ranelate Teriparatide Zoledronic acid
Respiratory distress syndrome Beractant
Calfactant Poractant alfa Surfactant (bovine lung)
Respiratory syncytial virus Palivizumab TNF medicines Abatacept Certolizumab pegol
Adalimumab GolimumabAnakinra CanakinumabEtanercept BelimumabInfliximab Rituximab Tocilizumab
New anti-psychotics Amisulpride Asenapine
Aripiprazole LurasidoneClozapine Olanzapine Paliperidone Quetiapine Risperidone
30

Therapy area In Richards Report 2010 Additions
Sertindole Ziprasidone Zotepine
Statins Amlodipine/atorvastatin Ezetimibe/ atorvastatin
Atorvastatin Ezetimibe Ezetimibe/simvastatin Fluvastatin Lovastatin Lovastatin/nicotinic acid Pravastatin Rosuvastatin Simvastatin Simvastatin
Stroke Alteplase Apixaban
Rivaroxaban Dabigatran etexilate
Wet AMD Anecortave Aflibercept
Pegaptanib Ranibizumab Verteporfin
Cancer Medicines
In Richards Report 2010:
Cancer 0-5 years Cancer 6-10 years Cancer 10+ years Cancer hormone
Bevacizumab Alemtuzumab Calcium folinate + levofolinate
Abarelix
Bortezomib Bexarotene Carboplatin Anastrozole
Cetuximab Capecitabine Carmustine Bicalutamide
Dasatinib Drug molecule Chlorambucil Bicalutamide + goserelin
Erlotinib Ibandronic acid Cisplatin Buserelin
Lapatinib Imatinib Cyclophosphamide Cyproterone
Lenalidomide Oxaliplatin Docetaxel Exemestane
Nilotinib Rituximab Doxorubicin Flutamide
Panitumumab Tegafur Epirubicin Fulvestrant
Pemetrexed Tegafur uracil Etoposide Gonadorelin
Sorafenib Trastuzumab Fludarabine Goserelin
Sunitinib Zoledronic acid Fluorouracil Goserelin + bicalutamide
Temsirolimus Gemcitabine Letrozole
Thalidomide Hydroxycarbamide Leuprorelin
Trabectedin Idarubicin Nafarelin
Ifosfamide Nilutamide
Irinotecan Tamoxifen
31

Cancer 0-5 years Cancer 6-10 years Cancer 10+ years Cancer hormone
Isosfamide + mesna Triptorelin
Lanreotide
Mitoxantrone
Octreotide
Paclitaxel
Pamidronic acid
Raltitrexed
Temozolomide
Topotecan
Vincristine
Vinorelbine
In the current (2014) report:
Cancer 0-5 years Cancer 6-10 years Cancer 10+ years Cancer 10+ years Cancer hormone drugs
Abiraterone Acetate Arsenic Alemtuzumab Irinotecan Abarelix
Aflibercept Bevacizumab Amsacrine Isosfamide + Mesna
Anastrozole
Aminolevulinic Acid Bortezomib Bexarotene Lanreotide Bicalutamide
Axitinib Busulfan Bleomycin Lomustine Bicalutamide + Goserelin
Azacitidine Cetuximab Calcium Folinate + Levofolinate
Melphalan Buserelin
Bendamustine Cladribine Calcium Levofolinate Mercaptopurine Cyproterone
Brentuximab Vedotin Clofarabine Capecitabine Mitomycin Exemestane
Cabazitaxel Dasatinib Carboplatin Mitoxantrone Flutamide
Catumaxomab Daunorubicin Carmustine Nafarelin Fulvestrant
Crizotinib Erlotinib Chlorambucil Octreotide Goserelin
Decitabine Ibritumomab Tiuxetan
Cisplatin Oxaliplatin Letrozole
Eribulin Lenalidomide Clodronic Acid Paclitaxel Leuprorelin
Everolimus Aminolevulinic Acid Cyclophosphamide Pamidronic Acid Nilutamide
Gefitinib Mitotane Cytarabine Pentostatin Tamoxifen
Ipilimumab Nelarabine Dacarbazine Porfimer Sodium Triptorelin
Lapatinib Pemetrexed Docetaxel Procarbazine Celecoxib
Nilotinib Sorafenib Doxorubicin Raltitrexed Degarelix
Ofatumumab Sunitinib Epirubicin Rituximab Diethylstilbestrol
Panitumumab Temoporfin Estramustine Tegafur Fosfestrol
Pazopanib Vindesine Etoposide Tegafur Uracil Histrelin
Pertuzumab Fludarabine Temozolomide Medroxyprogesterone
Regorafenib Fluorouracil Tioguanine Megestrol
Ruxolitinib Gemcitabine Topotecan Polyestradiol Phosphate
Tasonermin Gonadorelin Trastuzumab Toremifene
Temsirolimus Goserelin + Bicalutamide
Treosulfan
Thalidomide Hydroxycarbamide Tretinoin
32

Cancer 0-5 years Cancer 6-10 years Cancer 10+ years Cancer 10+ years Cancer hormone drugs
Thiotepa Ibandronic Acid Vinblastine
Trabectedin Idarubicin Vincristine
Vandetanib Ifosfamide Vinorelbine
Vemurafenib Imatinib Zoledronic Acid
Vinflunine
33

34
About ABPI
We represent innovative research-based biopharmaceutical companies, both large and small, leading an exciting new era of biosciences in the UK.
Our industry, a major contributor to the economy of the UK, brings life-saving and life-enhancing medicines to patients. Our members supply 90per cent of all medicines used by the NHS, and are researching anddeveloping over two-thirds of the current medicines pipeline, ensuring that the UK remains at the forefront of helping patients prevent and overcome diseases.
The ABPI is recognised by government as the industry body negotiating on behalf of the branded pharmaceutical industry, for statutory consultation requirements including the pricing scheme for medicines in the UK.
Association of the British Pharmaceutical Industry 7th Floor, Southside, 105 Victoria Street, London SW1E 6QT Tel: +44 (0)870 890 4333 [email protected]
ABPI Cymru Wales Floor 4, 2 Caspian Point, Pierhead Street, Cardiff Bay CF10 4DQ Tel: +44 (0) 870 890 4333
ABPI Northern Ireland The Mount, 2 Woodstock Link, Belfast BT6 8DD Tel: +44 (0) 870 890 4333
ABPI Scotland 3rd Floor Crichton House, 4 Crichton’s Close, Edinburgh EH8 8DT Tel: +44 (0)870 890 4333
About OHE
Founded in 1962, the OHE’s terms of reference are to:
• commission and undertake research on the economics of health and health care• collect and analyse health and health care data for the UK and other countries• disseminate the results of this work and stimulate discussion of them and their policy implications.
The OHE’s work is supported by research grants and consultancy revenues from a wide range of UK and international sources.
Office of Health Economics 7th Floor, Southside, 105 Victoria Street, London SW1E 6QT Tel: +44 (0)20 7747 8850 www.ohe.org

AssociationoftheBritishPharmaceuticalIndustry 7th Floor, Southside, 105 Victoria Street, London SW1E 6QT t +44 (0)870 890 4333 [email protected]
abpi.org.uk
Recommended