Interaction between Vinyl Acetate-Ethylene Latex stabilized
with Polyvinyl Alcohol and Portland Cement
vorgelegt von
M. Sc. Yu Jin
aus Wuhan, V.R. China
von der Fakultät VI – Planen Bauen Umwelt
der Technischen Universität Berlin
zur Erlangung des akademischen Grades
Doktor der Ingenieurwissenschaften
- Dr. -Ing. -
genehmigte Dissertation
Promotionsausschuss:
Vorsitzender: Prof. Dr. Frank U. Vogdt
Gutachter: Prof. Dr. habil. Oliver Weichold
Gutachter: Prof. Dr. habil. Dietmar Stephan
Gutachter: Dr. habil. Wolf-Dieter Hergeth
Tag der wissenschaftlichen Aussprache: 07.10.2015
Berlin 2016

Acknowledgements
First I would like to express my heartfelt gratitude to Prof. Dr. Dietmar Stephan for giving me
the opportunity to conduct my doctoral work at the chair of building materials and construction
chemistry at TU Berlin, especially I experienced a dark period before that. I acknowledge him
for all the supervision, supports and valuable discussion throughout my thesis, as well as the
confidence he placed on my work. I also owe my gratitude to my second supervisor Dr. Dieter-
Wolf Hergeth from Wacker Chemie AG for his unreserved pass of knowledge. Many part of
the thesis would not have been possible without his support and guidance. I benefit a lot from
their supervisions and experienced considerable progress on how to conduct scientific work.
I also would like to thank DAAD (Deutscher Akademischer Austauschdienst) for financial
assistance during my study. Personally, I deeply appreciate the support from David Hildebrand
when he worked at DAAD.
I like to take this opportunity to express my thanks to the following people at the chair:
Jessica Grewe, Anja Städtke, David Dahnacke for their technical assistance; Agnieszka
Kowalczyk from Kiwa for help on ICP; Annekathrin Aisch for all the administrative stuffs; Dr.
Christian Lehmann for his guidance, especially on XRD; Gerrit Land for his help on isothermal
calorimetry and TGA; Kai Amrhein, Ricarda Tänza, Sameena Kamaruddin, Dr. Sang-Yeop
Chung, Dr. Mohamed Abd Elrahman, Henning von Daake, Clemens Ehm, Veronika Märkl,
Claudia Schatz, Nick Schneider, Kasra Shafiei, Sandra Wiegel for the nice collegial
atmosphere; in special, Kai Foth and Maria Grüneberger for all the help as well as those
pleasant conversations.
I also like to take this opportunity to express my thanks to the following people at Wacker
Chemie AG when I carried out my experiments there:
Dr. Ulf Dietrich, Dr. Ingo Müller, Stephan Hesel for the helpful discussions and advices;
Alexander Kraft for the help on ESEM and AFm; Barbara Hager, Gabriele Weibel, Florian
Braunsperger for their help in the lab.
Serina Ng, Mirko Gruber, Elina Dubina, Ahmed Habbaba, Oksana Storcheva, many thanks to
their encouragement and help which make me survive through all the bad times in Munich.
Likewise, all the good times with them are memorable. Yuanyuan Zhang, Jianwei Mao, Huiran
Tang, Xiaohan Liu, Yue Liu, many thanks to their friendship to make my stay here such a
pleasant experience.
Lastly, I would like to thank my parents for their understanding and always support, especially
I go to a far distance where I am not able to pay my due services to them. I owe my gratitude
to my parents in law for their understanding and support, especially they take the responsibility

to raise my son, as in my absence. I also owe my deeply gratitude to my lovely wife Xueye
Zheng for all her sacrifice and love. Without all of you, this would have been possible.
Abstract
The purpose of this thesis was to investigate the interaction between the Vinyl-Acetate
Ethylene (VAE) latex stabilised with Polyvinyl Alcohol (PVOH) and Portland cement. This
interaction was divided into three stages: (1) colloidal interaction at the beginning, (2) hydration
of cement in the presence of polymers, and (3) film formation of the latex in cementitious
environment.
In the first stage, the colloidal interaction between two VAE latices stabilized by PVOH and
Portland cement, including its main mineral phases, was investigated. The non-ionic VAE latex
particles showed negative charge but had no affinity to Ca2+ by means of charge titration.
Adsorption profiles were determined via the depletion method; the results indicated the
analogous Langmuir type adsorption. The Zeta potential results showed a negligible effect of
the VAE latex particles, indicating that the non-electrostatic interaction was dominant.
Meanwhile, PVOH revealed preferential interaction with the aluminate phase. As a
consequence, the strong interaction led to the flocculation of the latices in some extreme cases,
e.g. in the C3A suspension.
In the second stage, the divergent influence of the latex particles and PVOH on the hydration
kinetics was confirmed by means of isothermal heat flow calorimetry, ICP-OES as well as in-
situ XRD measurements. In accordance with the initial interaction, latex particles influenced
the silicate phase hydration principally, while PVOH affected the aluminate hydration.
Although the equilibrium concentration of SO42- was lower in the presence of polymers during
the first few hours, the strong ‘sulfate depletion’ peak in the heat flow calorimetry was
subjected to the enhanced reaction between the aluminate and sulphate carrier, which was
hindered by PVOH at the beginning.
In the third stage, the latex formed a film in the cementitious environment. Film formation was
characterized in terms of its surface morphology, which was investigated by means of
environmental scanning electron microscopy and atomic force microscopy. The coalescence
of the polymer was indicated by its redispersibility. The latex films were stored under 85%
relative humidity (R.H.), or coated on cement substrate under 50% R.H., or casted from the
dispersions in synthetic cement pore solution (SCPS). Results showed that film formation was
accelerated in the cementitious environment and that removal of PVOH in the vicinity of the
latex particles by the interaction with cement was essential for polymer interdiffusion and
coalescence.
Zusammenfassung
Das Ziel dieser Arbeit war, die Wechselwirkung zwischen der Vinyl-Acetat-Ethylen (VAE)
Polymerdispersion mit Polyvinylalkohol (PVOH) als Schutzkolloid und Portlandzement zu
untersuchen. Die Wechselwirkung wurde in drei Phasen unterteilt: (1) kolloidale
Wechselwirkung am Anfang, (2) Hydratation des Zements in Gegenwart von Polymeren, und
(3) Filmbildung der Polymerdispersionen in zementhaltiger Umgebung.
In der ersten Phase wurde die kolloidale Wechselwirkung zwischen zwei VAE Dispersionen
mit PVOH und Portlandzement untersucht. Die nichtionischen VAE Partikel wiesen negative
Ladung, aber keine während der Ladungstitration nachweisbare Affinität zu Ca2+ auf. Die
Adsorptionsprofile wurden mittels Verarmungsmethode gemessen und waren analog zum
Adsorptionsprofil nach Langmuir. Dabei war die an Zementminerale adsorbierte Menge
unabhängig von der Ladungsdichte. Außerdem zeigte das Ergebnis der Zeta-
Potentialmessung eine vernachlässigbare Wirkung der Polymerpartikel, was auf eine
Dominanz der nicht-elektrostatischen Wechselwirkung hinweist. PVOH hingegen
wechselwirkt vorzugsweise mit der Aluminatphase. In einigen extremen Fällen führen die
starken Wechselwirkungen zu einer Flockung der Polymerdisperisonen, z. B. bei der C3A-
Suspension.
In der zweiten Phase konnten mittels isothermer Wärmeflusskalorimetrie, ICP-OES und in situ
XRD-Messungen die unterschiedlichen Einflüsse von Polymerpartikeln und PVOH auf die
Hydratationskinetik nachgewiesen werden. Wie die Ergebnisse aus Phase (1) vermuten
lassen, beeinflussten die Polymerpartikel hauptsächlich die Hydratation des Silikats, während
PVOH Auswirkungen auf die Hydratation des Aluminats hatte. Obwohl die
Gleichgewichtskonzentration von SO42- in der Gegenwart von Polymeren in den ersten
Stunden niedriger war, wurde der starke Sulfatpeak der der Wärmeflusskalorimetrie durch die
verbesserte Reaktion zwischen Aluminat und Sulfatträger hervorgerufen, die zu Beginn durch
PVOH behindert wurde.
In der dritten Phase wurde der Polymerfilm in zementhaltiger Umgebung gebildet. Die
Filmbildung wurde in Bezug auf die Oberflächenmorphologie charakterisiert, die mittels
Environmental Scanning Electron Microscope und Rasterkraftmikroskopie untersucht wurde.
Dabei wurde das Zusammenwachsen des Polymers auf seine Redispergierbarkeit
hingewiesen. Die Polymerfilme wurden unter 85% relativer Feuchte (r. F.) aufbewahrt, bei 50%
als Schicht auf den Zementstein aufgebracht oder aus den Dispersionen in synthetischen
Porenlösung gegossen. Die Ergebnisse zeigten, dass die Filmbildung in zementhaltiger
Umgebung beschleunigt wurde und das Entfernen von PVOH aus der Umgebung der

Polymerpartikel durch die Wechselwirkung mit Zement unerlässlich für den Prozess des
Zusammenwachsens des Polymers war.
Abbreviation and Symbols
Γ Adsorption amount
ε Dielectric constant
ε0 Permittivity of free space
ζ Zeta potential
η Dynamic viscosity
θ Surface coverage
μ Mobility
μe Electrical mobility
ρ Density
σ Surface charge density
Ψ Surface potential
A Hamaker constant
a Radius of spherical particles
ci Molarity of the i th ion
kB Boltzmann constant
NA Avogadro’s number
R Gas constant
zi Valence of the i th ion
AFM Atomic Force Microscopy
AMPS 2-Acrylamido-2-methylpropane sulfonic acid
BET Brunauer-Emmett-Teller
C Coulomb
c Concentration
DP Degree of Polymerization
DLVO Derjaguin-Landau-Verwey-Overbeek
DSC Differential Scanning Calorimetry
E Ethylene
ESEM Environmental Scanning Electron Microscopy
FTIR Fourier Transfer Infrared spectroscopy
h Hour
IAP Ion activity products
ICP-AES Inductively Coupled Plasma - Atomic Emission Spectroscopy
MFFT Minimum Film Formation Temperature
min Minute
mol Molar
mV Millivolt
Mw weight-average molecular weight
p/c Polymer cement ratio
PCC Polymer Cement Concrete
PCD Particle Charge Detector
PDADMAC Poly(diallyldimethylammoniumchloride)
PMC Polymer Modified Cement
p/m Polymer mineral ratio
PS Polystyrene
PSD Particle Size Distribution
PVA Poly(Vinyl Alcohol)
PVAL Poly(Vinyl Alcohol)
PVOH Partially hydrolyzed poly(vinyl acetate -co- vinyl alcohol)
RH Hydrodynamic radius
rpm Revolutions per minute
SCPS Synthetic Cement Pore Solution
SEM Scanning Electron Microscopy
SI Saturation Indices
Tg Glass transition temperature
TGA Thermogravimetric Analysis
TOC Total Organic Carbon
VA Vinyl Acetate homopoylmer
VAE Vinyl Acetate-Ethylene copolymer
VDW Van der Waals force
VeoVa Vinyl versatate
w/c Water cement ratio
w/m Water mineral ratio
w/s Water solid ratio
XRD X-ray Diffraction
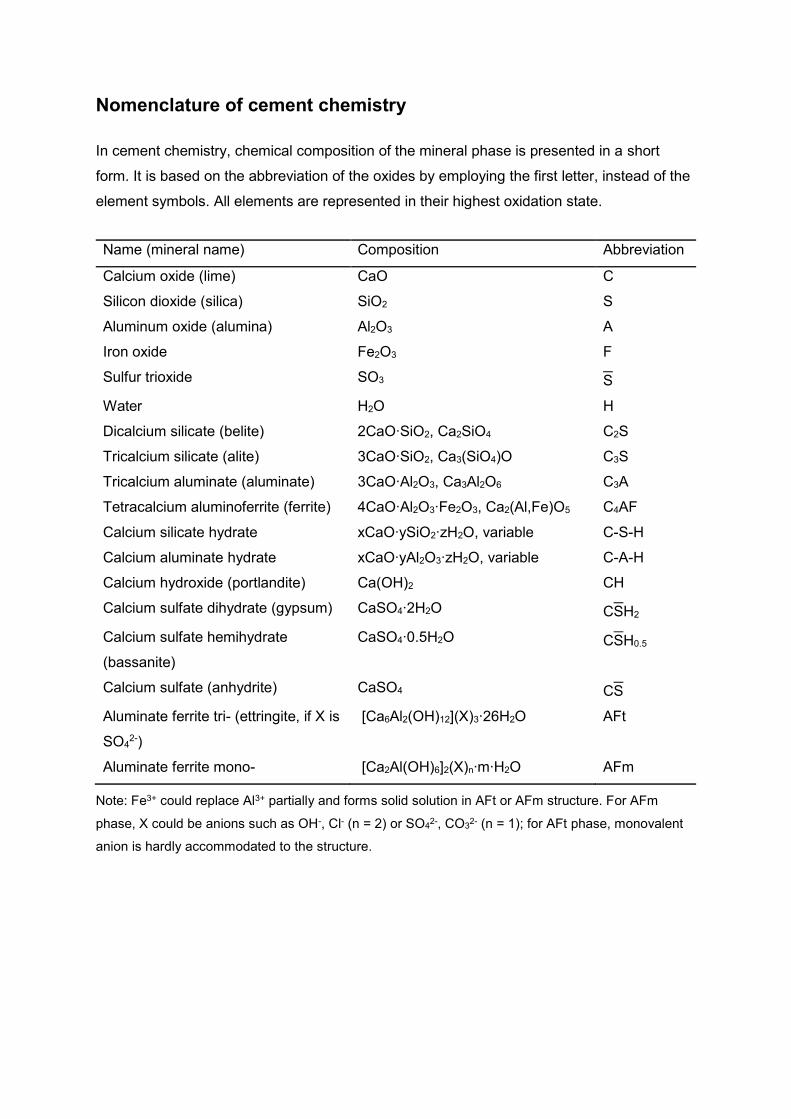
Nomenclature of cement chemistry
In cement chemistry, chemical composition of the mineral phase is presented in a short
form. It is based on the abbreviation of the oxides by employing the first letter, instead of the
element symbols. All elements are represented in their highest oxidation state.
Note: Fe3+ could replace Al3+ partially and forms solid solution in AFt or AFm structure. For AFm
phase, X could be anions such as OH-, Cl- (n = 2) or SO42-, CO3
2- (n = 1); for AFt phase, monovalent
anion is hardly accommodated to the structure.
Name (mineral name) Composition Abbreviation
Calcium oxide (lime) CaO C
Silicon dioxide (silica) SiO2 S
Aluminum oxide (alumina) Al2O3 A
Iron oxide Fe2O3 F
Sulfur trioxide SO3 S
Water H2O H
Dicalcium silicate (belite) 2CaO∙SiO2, Ca2SiO4 C2S
Tricalcium silicate (alite) 3CaO∙SiO2, Ca3(SiO4)O C3S
Tricalcium aluminate (aluminate) 3CaO∙Al2O3, Ca3Al2O6 C3A
Tetracalcium aluminoferrite (ferrite) 4CaO∙Al2O3∙Fe2O3, Ca2(Al,Fe)O5 C4AF
Calcium silicate hydrate xCaO∙ySiO2∙zH2O, variable C-S-H
Calcium aluminate hydrate xCaO∙yAl2O3∙zH2O, variable C-A-H
Calcium hydroxide (portlandite) Ca(OH)2 CH
Calcium sulfate dihydrate (gypsum) CaSO4∙2H2O CSH2
Calcium sulfate hemihydrate
(bassanite)
CaSO4∙0.5H2O CSH0.5
Calcium sulfate (anhydrite) CaSO4 CS
Aluminate ferrite tri- (ettringite, if X is
SO42-)
[Ca6Al2(OH)12](X)3∙26H2O AFt
Aluminate ferrite mono- [Ca2Al(OH)6]2(X)n∙m∙H2O AFm
Table of Contents i
Table of contents
1 Introduction ....................................................................................... 1
2 Scientific Background ....................................................................... 3
2.1 Latex ............................................................................................................ 3
2.1.1 Latex particles ....................................................................................... 3
2.1.2 Protective colloid - Polyvinyl Alcohol (PVA) ........................................ 10
2.2 Film formation of latex ................................................................................ 13
2.3 Portland cement ......................................................................................... 15
2.3.1 Cement ............................................................................................... 15
2.3.2 Minerals .............................................................................................. 16
2.4 Interaction between latex and cement ....................................................... 17
2.4.1 Adsorption of latex polymer at solid/liquid interface ............................ 19
2.4.2 Hydration kinetics of cement ............................................................... 22
2.4.3 Film formation in cement environment ................................................ 26
3 Materials and Methods.................................................................... 27
3.1 Characterization methods .......................................................................... 27
3.1.1 Laser granulometry ............................................................................. 28
3.1.2 Particle charge titration ....................................................................... 28
3.1.3 Differential scanning calorimetry (DSC) .............................................. 28
3.1.4 Thermogravimetric analysis (TGA) ..................................................... 29
3.1.5 Surface tension (Wilhelmy plate method) ........................................... 29
3.1.6 Kofler bank .......................................................................................... 29
3.1.7 Brunauer-Emmett-Teller method (BET) .............................................. 30
3.1.8 Blaine test ........................................................................................... 30
3.1.9 Fourier-transfer infrared spectrometry (FTIR) ..................................... 30
3.1.10 UV-vis spectrophotometry (adsorption isotherm) ................................ 31
ii Table of Contents
3.1.11 Total organic carbon (TOC) (adsorption isotherm) ............................. 32
3.1.12 Zeta potential (electroacoustic method) .............................................. 32
3.1.13 Isothermal calorimetry......................................................................... 33
3.1.14 ICP-AES (for ions concentration) ........................................................ 33
3.1.15 X-ray diffraction (XRD) ........................................................................ 36
3.1.16 Environmental scanning electron microscopy (ESEM) ....................... 36
3.1.17 Atomic force microscopy (AFM) .......................................................... 36
3.2 Chemicals and Materials ............................................................................ 37
3.2.1 Chemicals ........................................................................................... 37
3.2.2 Polymer ............................................................................................... 37
3.2.3 Cement minerals ................................................................................. 43
3.3 Sample preparation .................................................................................... 44
3.3.1 Latex film formation ............................................................................ 44
3.3.2 Hydration of C3A ................................................................................. 45
4 Initial interaction between latex and cement ................................... 47
4.1 Surface and electrokinetic properties of the latices .................................... 47
4.2 Initial interaction between latex and cement minerals ................................ 49
4.3 Initial interaction between PVOH and clinker phases ................................. 55
4.4 Initial interaction between the VAE latex and cement: the role of PVOH ... 56
5 Hydration kinetics of cement affected by latex ................................ 59
5.1 Rate of cement hydration affected by polymers ......................................... 59
5.2 Influence of polymers on the pore solution during induction period ........... 65
5.3 Hydration products formation affected by polymers ................................... 72
6 Film formation of the VAE latex stabilized with PVOH in cement
environment .......................................................................................... 77
6.1 Stability of the latex in high electrolytes concentration ............................... 77
6.2 Redispersibility of the VAE latex film .......................................................... 79
Table of Contents iii
6.3 Influence of high humidity on film formation ............................................... 80
6.4 Influence of cement matrix on film formation.............................................. 85
6.5 Influence of cement pore solution on film formation ................................... 86
6.6 Film formation in cement matrix: influence of polymer/cement ratio .......... 88
7 Conclusion and Outlook .................................................................. 91
Appendix A ........................................................................................... 94
Appendix B ........................................................................................... 99
References ......................................................................................... 102

Chapter 1
1 Introduction
Cementitious material is the most widely used man-made materials in the world. However,
this material has some weaknesses, such as low tensile strength, high permeability, low
chemical resistance, amongst others. For this purpose, synthetic polymer has been used to
improve its weakness for many years 1,2. Polymer cement concrete (PCC) or labelled as
polymer modified cement (PMC) is thereof a composite material thereof with two binders:
cement and polymer. Polymer in the context here is narrowly defined as polymer emulsion or
its derivative form redispersible polymer powder 3. Compared to ordinary cementitious material,
PMC improves workability of the fresh material as well as the elastic modulus, adhesion,
impact resistance, and abrasion resistance, of the hardened end product 4.
PMC has various applications in the construction field. These include, but are not limited to,
floor screed, water proofing, tile adhesive, decorative finish and repair mortar for the concrete
structure, and so forth 1. Though the formulations of PMC in these applications are complex,
the synergetic effect from the combination of cement and polymer is the key for the desired
performance. This composite is an invaluable element in the development of sustainable
construction materials 3 and mechanistic investigations, particularly related to the
microstructure of PMC have been intensively carried out 5–9. Despite of the extensive research,
the main outcomes from such work generally depicted a general model where the influence of
polymers on the cement hydration is shown, as accompanied by film formation. The
physicochemical nature of the polymers that drives the mechanisms is however ignored. As a
result, interpretation of mechanisms driving the change in rheology 10,11, differences in the
ability to undergo film formation 12,13, and alteration on hydration kinetics 14,15 of the composite
materials are often left unnoticed or hypothesized. Therefore, there is a need to decrease this
gap in knowledge to meet future demand.
Recently, further specific research has been performed in this area, whereby investigations
were conducted to understand the interaction between cement and polymer, especially in
colloidal systems 16–19. The advantage of these studies is apparent as physicochemical
interaction among them can be comprehensively elaborated. On the other hand, the
disadvantage is the demanding nature of such experimental work, where case by case studies
must be performed due to the variety of the polymers.
In the literature 20–22, a commonly employed polymer – poly(vinyl acetate -co- ethylene) (VAE,
abbreviated as EVA in these literatures) – in the adhesive and construction industries has not
sufficiently understood. The uniqueness of this polymer is the incorporation of polyvinyl alcohol
(poly(vinyl acetate -co- vinyl alcohol), accurately), which acts as a protective colloid, especially
2 Chapter 1 Introduction
in its powder form 23. This polymer is made up of a combination of the macromolecule particle
and poly(vinyl acetate -co- vinyl alcohol), while the polyvinyl alcohol is either adsorbed/grafted
on the particle or dissolved in the medium 24–26. The presence of poly(vinyl acetate -co- vinyl
alcohol) endues the polymer high mechanical properties as well as its tackiness 27. Additionally,
the film formed by the VAE copolymer stabilized with polyvinyl alcohol can be dispersible in
water, if it contains sufficient amounts of polyvinyl alcohol, polyacrylamide, starch, or dextrins
28. However, due to its water solubility, undesired redispersion may occur and be fatal in some
cases, e.g. adhesion failure by water immersion.
Since there is a gap between the physicochemical nature of the VAE polymer and the
microstructure of the polymer modified cement, this work is aimed at comprehensively
understanding the interaction between the VAE polymer and Portland cement. This work is
divided into 6 chapters, whereby the interactions of these polymers in their colloid state,
alteration on hydration kinetics and film formation in the cementitious environment are studied,
with emphasis on the physicochemical properties of the polymer. Chapter 2 focuses on the
background of this work, including the raw materials and their interaction with water, i.e. film
formation and cement hydration. Besides, current knowledge of the interaction between the
polymer and cement will be introduced afterwards. In chapter 3, characterization of the raw
materials as well as the methods will be presented. In chapter 4, surface and electrical
properties of the polymer as well as initial adsorption in a diluted colloid system are discussed,
and the initial interaction mechanism is speculated from the results. Based on the initial
interaction in the colloid system, the influences of the polymer on the hydration kinetics of
Portland cement are discussed in chapter 5. In this chapter, the influence of different polymers
on ion composition in cement pore solution, and hydration products are monitored. In order to
reveal the effect of the interaction on the film-forming, a polymer film formed in the
cementitious environment is simulated and studied by means of ESEM and AFM in chapter 6,
while its relation to redispersibility is also indicated. Finally, a conclusion and short outlook
from this work will be given in chapter 7.
Chapter 2
2 Scientific Background
In this chapter, an overview of the physical and chemical properties of polymer and cement is
provided. In particular, their interactions with water, i.e. film formation or cement hydration
respectively, will be highlighted. Finally, a state-of-the-art study concerning the interaction
between the polymer and cement is introduced.
2.1 Latex
2.1.1 Latex particles
2.1.1.1 Introduction
The terms ‘latex’, ‘polymer dispersion’, ‘emulsion polymer’, ‘emulsion’ are used as the
synonymous 29. According to IUPAC, latex or polymer dispersion is recommended as its name
and defined as ‘colloidal dispersion of polymer particles in a liquid’ 30. In general, any particle
that has some liner dimension between 10-9 m (1 nm) and 10-6 m (1 µm) is considered as a
colloid 31.
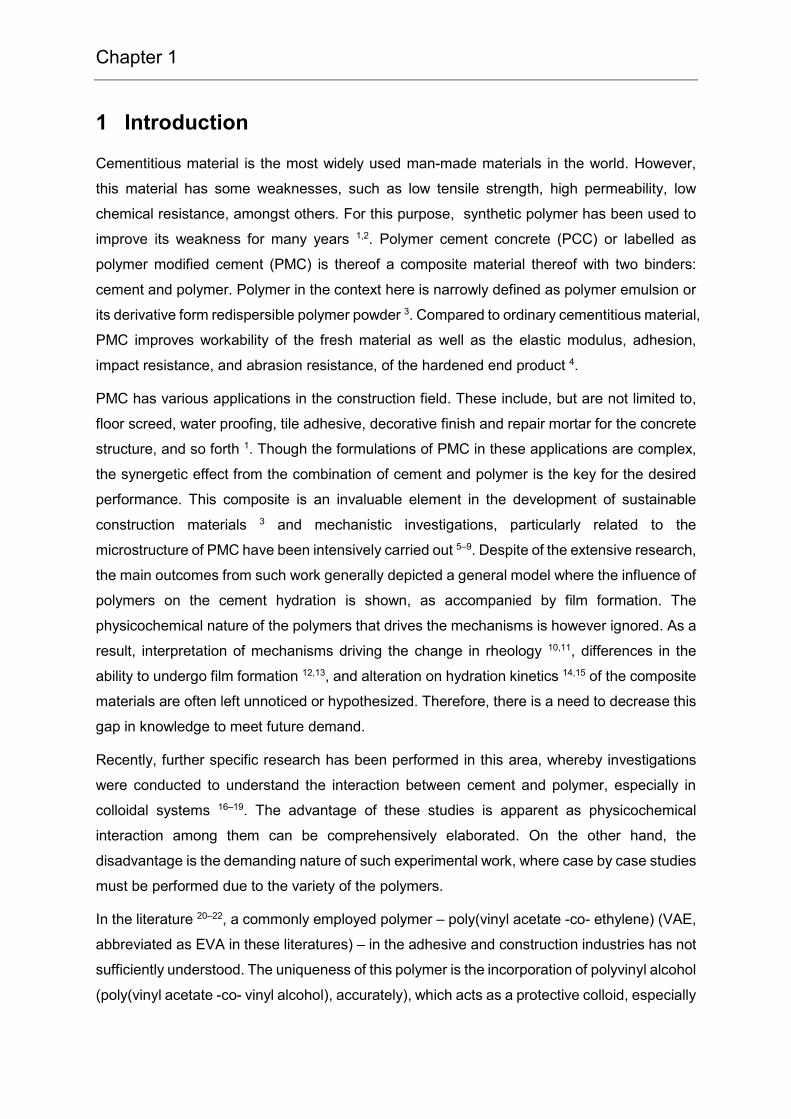
Figure 2.1 Illustration of latex by its hierarchies 29
Normally, a latex possesses a solid content of 40-60 wt.-%, in which, 1 mL latex contains ~
1015 particles while one particle is composed of 1-10000 macromolecules, as illustrated in
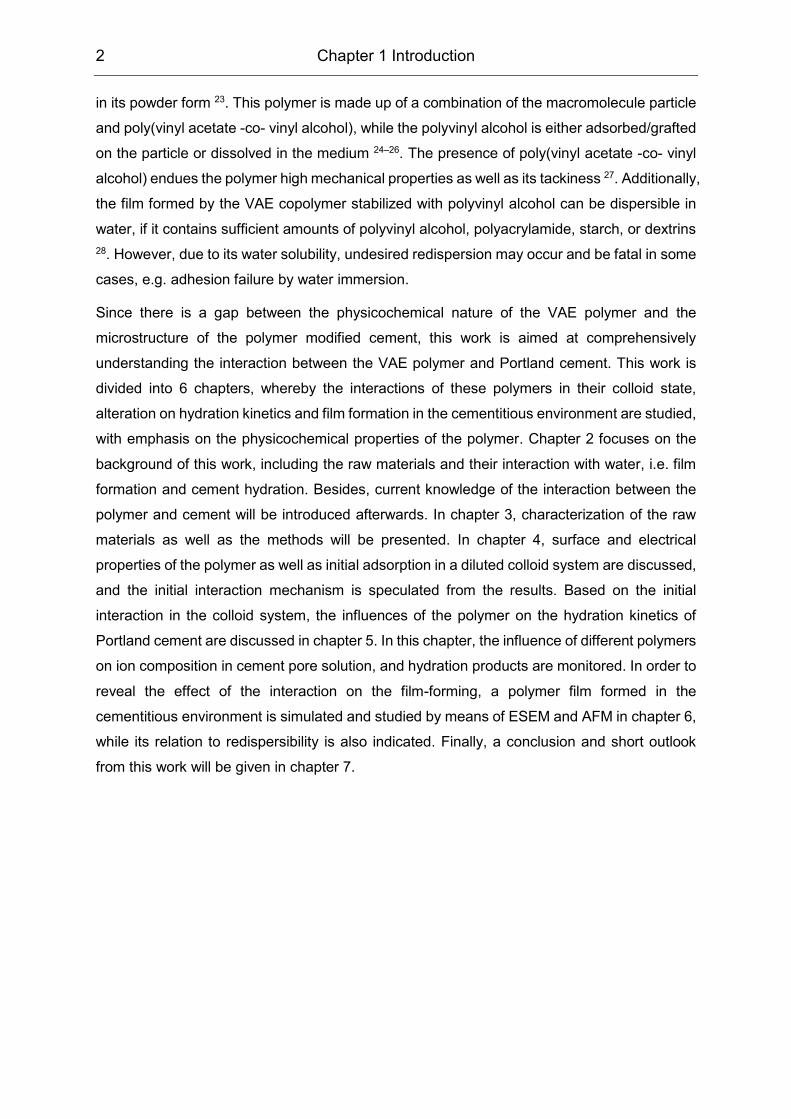
Figure 2.1. The inner particle structure could be observed by cryo-SEM via fracturing, as
reported by Ma et al. (Figure 2.2) 32. Latex particles have various morphologies, including
simple homogeneous spherical particles, core-shell type, or much more complex structure,
such as raspberry or moon-like 33–35. Nevertheless, as a complex system, complexity of a latex
arises in part from its nature as lyophobic sols and in part from the polymeric nature of the
4 Chapter 2 Scientific Background
disperse phase 36. In other words, colloidal properties as well as composed polymer are two
significant characteristics of the latex.
Figure 2.2 Cryo-SEM image of an acrylic latex particle that was fractured 32
2.1.1.2 Colloid
When defining colloids, one of the most important features of colloidal particles is the
dimension. Colloidal particles come in all shapes and sizes. Among which, monodisperse
spheres with a well-defined mean particle size are not only uniquely easy to characterize, but
are also very rarely encountered. In practice, particles are either characterized by a high
degree of symmetry like a sphere, or asymmetry like an ellipsoid 31. Actually, most common
particle size methods measure an equivalent spherical diameter (ESD) 37. This is the diameter
the particle would have if it was a sphere and can be based on volume to yield an equivalent
volume diameter or surface to yield a sphere having equivalent surfaces. Normally, a concise
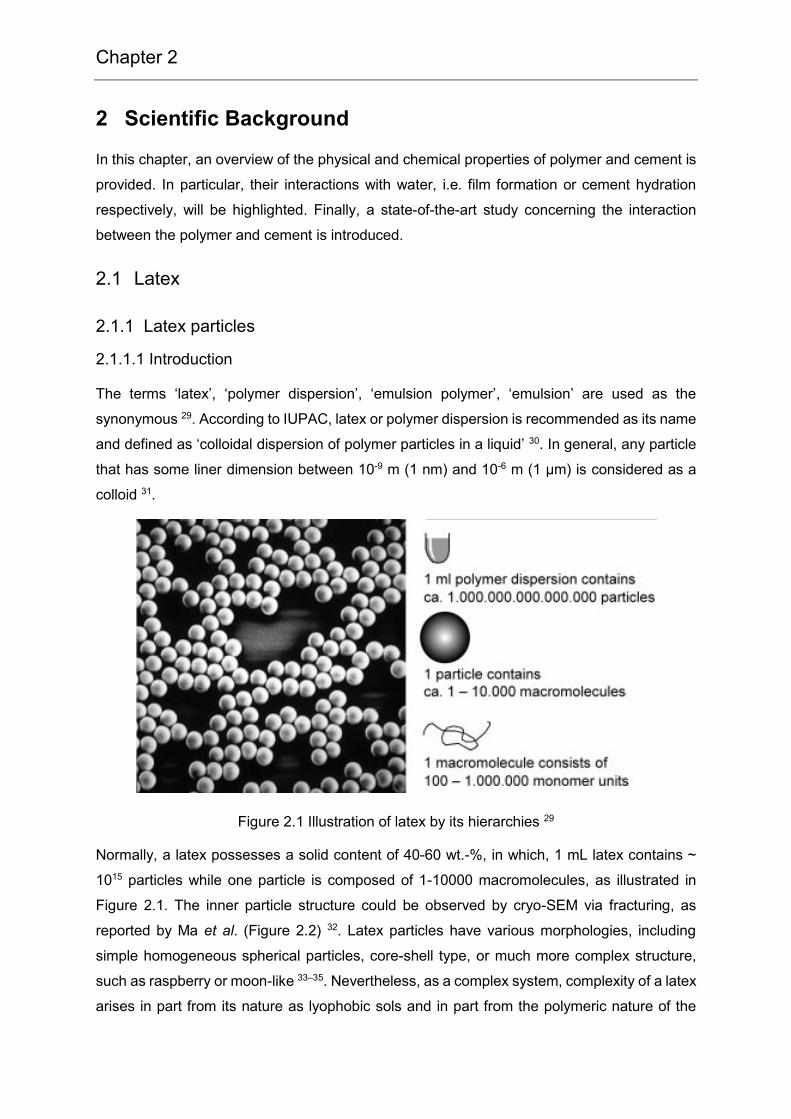
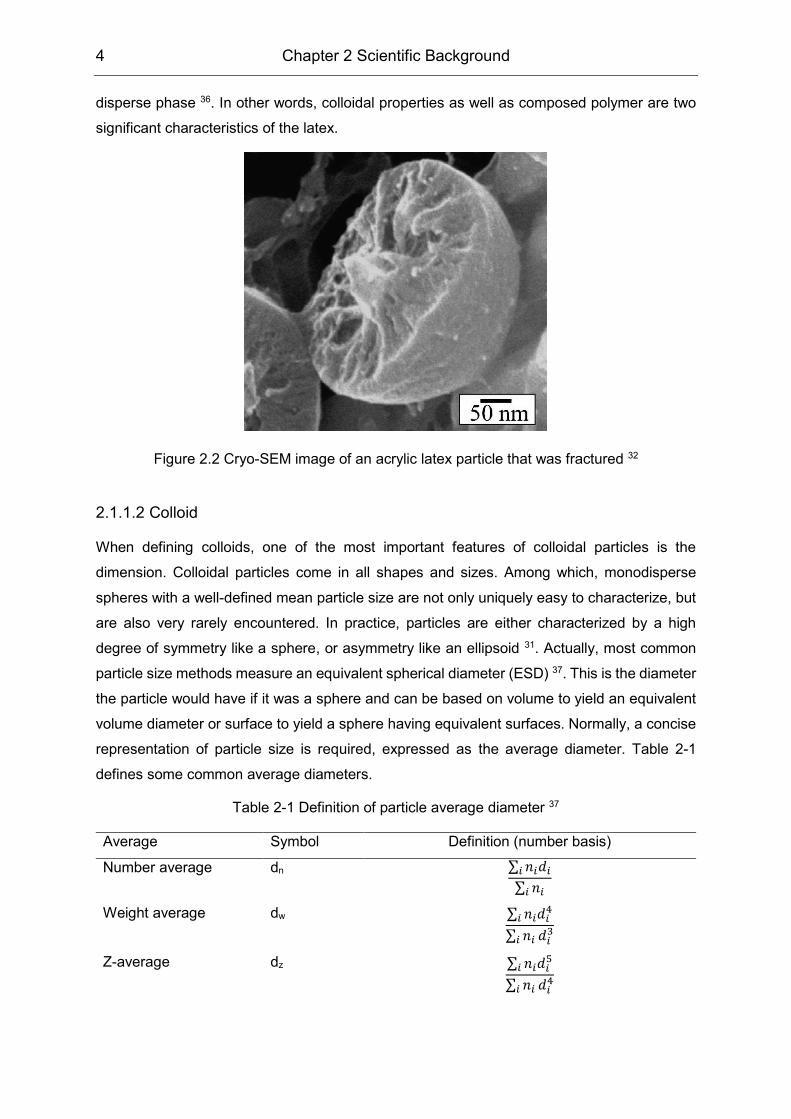
representation of particle size is required, expressed as the average diameter. Table 2-1
defines some common average diameters.
Table 2-1 Definition of particle average diameter 37
Average Symbol Definition (number basis)
Number average dn ∑ 𝑛𝑖𝑑𝑖𝑖
∑ 𝑛𝑖𝑖
Weight average dw ∑ 𝑛𝑖𝑑𝑖4
𝑖
∑ 𝑛𝑖𝑖 𝑑𝑖3
Z-average dz ∑ 𝑛𝑖𝑑𝑖5
𝑖
∑ 𝑛𝑖𝑖 𝑑𝑖4
Chapter 2 Scientific Background 5
(continued)
Surface average ds ∑ 𝑛𝑖𝑑𝑖3
𝑖
∑ 𝑛𝑖𝑖 𝑑𝑖2
Volume average dv (
∑ 𝑛𝑖𝑖 𝑑𝑖3
∑ 𝑛𝑖𝑖)
1/3
Sauter d32 𝑑𝑣3
𝑑𝑠2
Where ni is the number of particles with diameter di.
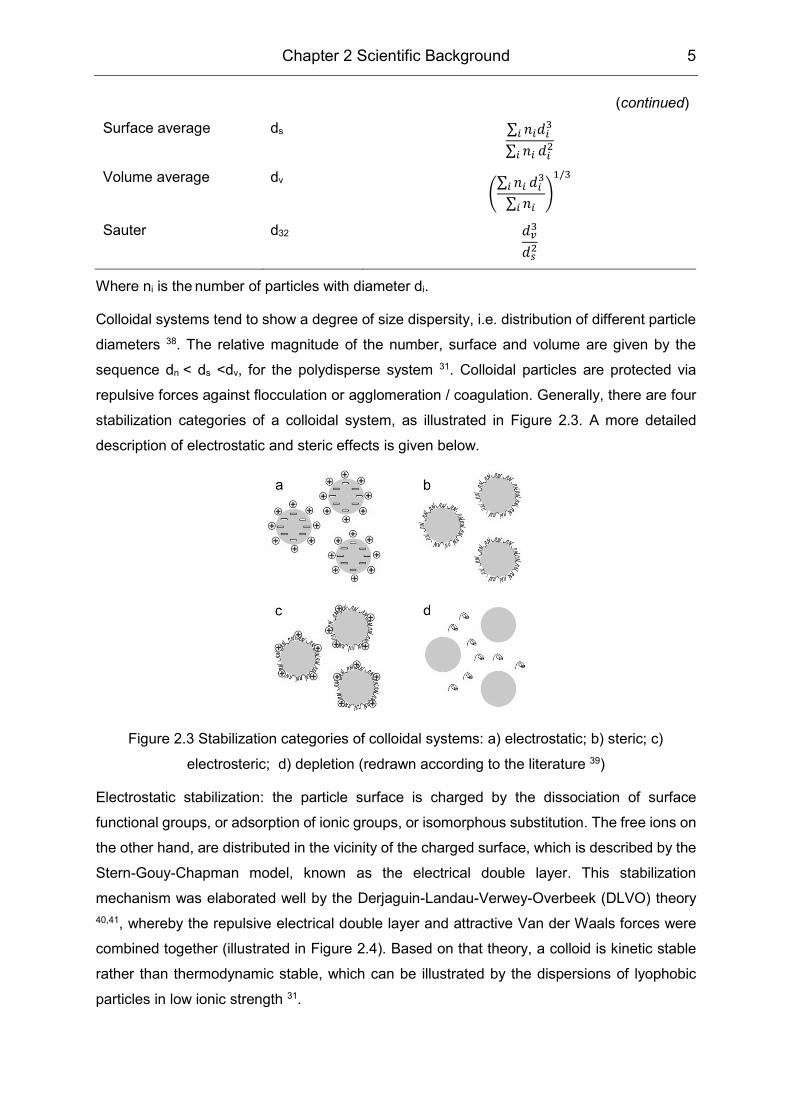
Colloidal systems tend to show a degree of size dispersity, i.e. distribution of different particle
diameters 38. The relative magnitude of the number, surface and volume are given by the
sequence dn < ds <dv, for the polydisperse system 31. Colloidal particles are protected via
repulsive forces against flocculation or agglomeration / coagulation. Generally, there are four
stabilization categories of a colloidal system, as illustrated in Figure 2.3. A more detailed
description of electrostatic and steric effects is given below.
Figure 2.3 Stabilization categories of colloidal systems: a) electrostatic; b) steric; c)
electrosteric; d) depletion (redrawn according to the literature 39)
Electrostatic stabilization: the particle surface is charged by the dissociation of surface
functional groups, or adsorption of ionic groups, or isomorphous substitution. The free ions on
the other hand, are distributed in the vicinity of the charged surface, which is described by the
Stern-Gouy-Chapman model, known as the electrical double layer. This stabilization
mechanism was elaborated well by the Derjaguin-Landau-Verwey-Overbeek (DLVO) theory
40,41, whereby the repulsive electrical double layer and attractive Van der Waals forces were
combined together (illustrated in Figure 2.4). Based on that theory, a colloid is kinetic stable
rather than thermodynamic stable, which can be illustrated by the dispersions of lyophobic
particles in low ionic strength 31.
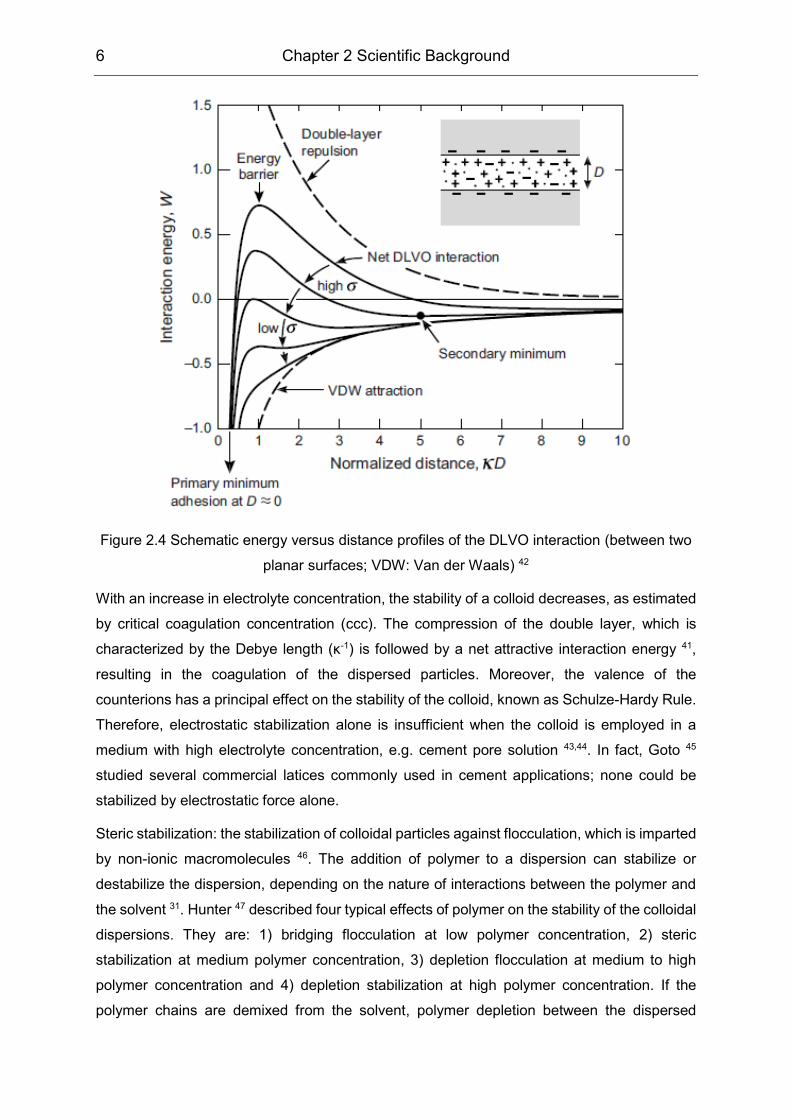
6 Chapter 2 Scientific Background
Figure 2.4 Schematic energy versus distance profiles of the DLVO interaction (between two
planar surfaces; VDW: Van der Waals) 42
With an increase in electrolyte concentration, the stability of a colloid decreases, as estimated
by critical coagulation concentration (ccc). The compression of the double layer, which is
characterized by the Debye length (κ-1) is followed by a net attractive interaction energy 41,
resulting in the coagulation of the dispersed particles. Moreover, the valence of the
counterions has a principal effect on the stability of the colloid, known as Schulze-Hardy Rule.
Therefore, electrostatic stabilization alone is insufficient when the colloid is employed in a
medium with high electrolyte concentration, e.g. cement pore solution 43,44. In fact, Goto 45
studied several commercial latices commonly used in cement applications; none could be
stabilized by electrostatic force alone.
Steric stabilization: the stabilization of colloidal particles against flocculation, which is imparted
by non-ionic macromolecules 46. The addition of polymer to a dispersion can stabilize or
destabilize the dispersion, depending on the nature of interactions between the polymer and
the solvent 31. Hunter 47 described four typical effects of polymer on the stability of the colloidal
dispersions. They are: 1) bridging flocculation at low polymer concentration, 2) steric
stabilization at medium polymer concentration, 3) depletion flocculation at medium to high
polymer concentration and 4) depletion stabilization at high polymer concentration. If the
polymer chains are demixed from the solvent, polymer depletion between the dispersed
Chapter 2 Scientific Background 7
particles may occur. However, this demixing process is thermodynamically unfavourable in
good solvents, inducing depletion stabilization 31. In other words, polymer stabilized colloids
could be affected by the polymer concentration as well as the state of the solvent, while the
latter was described by Flory-Huggins theory 48. In poor solvents, polymer induced stabilization
could be eliminated, since polymer-polymer interaction is attractive in this condition 49,50.
Generally, with the increase in salt ions, colloidal stability should decrease with decreasing
polymer solvency, though there are some exceptions 51.
If the colloid is stabilized by polyelectrolytes, a combination of the electrostatic effect as well
as the effect that arises solely from the polymeric nature occurs, effect which is referred to as
electrosteric stabilization 31.
2.1.1.3 Polymer
The size and shape of polymers are intimately connected to their properties. Generally, the
structure of polymers is described and can be characterized at four level structurally: primary
structure with a precise sequence of the individual atoms of the polymer chain; secondary
structure with molecular shape or conformation of the polymer chain (e.g. linear, comb,
branched, etc.); tertiary structure with shaping or folding of the polymer (crosslinking, lamellar,
etc.); and quaternary structure with the overall shape of tertiary structures 52. In general, a
polymer is classified into natural and synthetic, organic and inorganic 52; whereas, only
synthetic organic polymers will be discussed in this section. For latex polymer, molecular mass
and molecular mass distribution, chemical composition and its distribution, intramolecular
microstructure such as tacticity, sequence distribution etc. are significant 53. In other words,
the primary structure of the macromolecule is the main concern when it comes to the
characterization of the latex polymer.
One of the important characterizations of a polymer is its chemical composition of the
repeating units. For chain-growth polymers, a copolymer refers to that composed of two kinds
of repeat units, while a homopolymer is composed of only one repeat unit. Similarly, there are
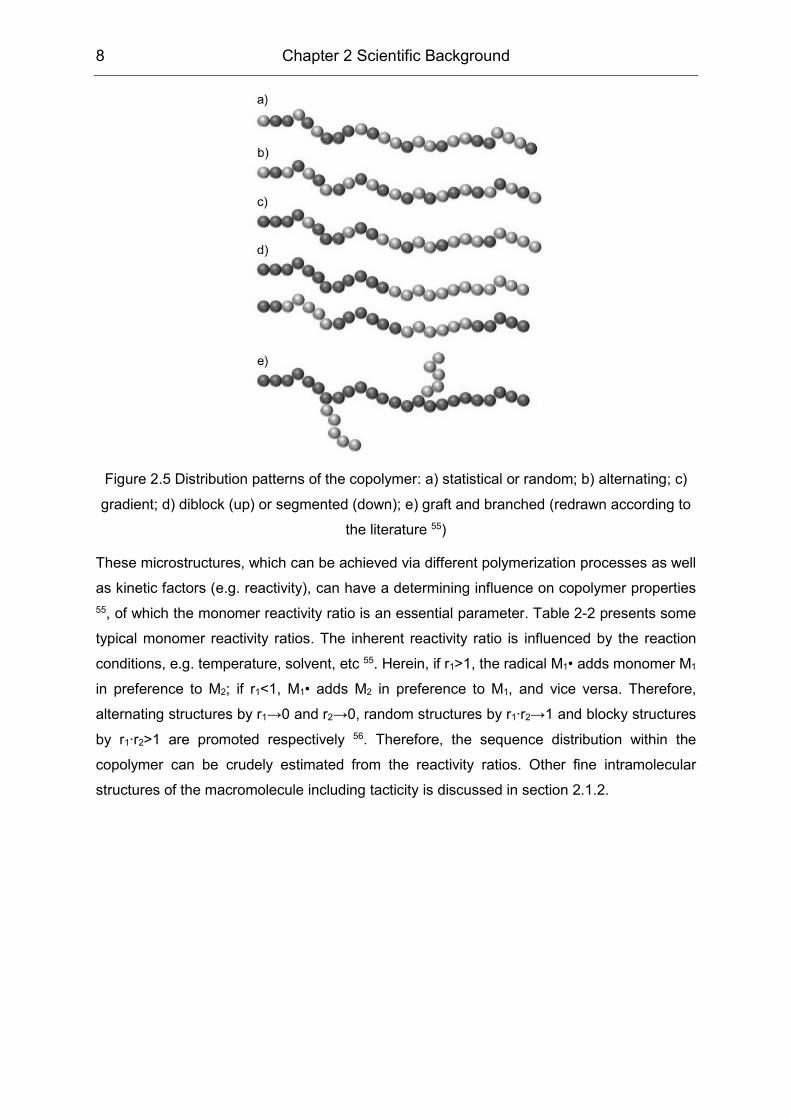
also terpolymer and multicomponent copolymer with more than three repeat units 54.
Accordingly, distribution patterns can be obtained in copolymers starting from two kinds of
repeat units, as illustrated in Figure 2.5.
8 Chapter 2 Scientific Background
Figure 2.5 Distribution patterns of the copolymer: a) statistical or random; b) alternating; c)
gradient; d) diblock (up) or segmented (down); e) graft and branched (redrawn according to
the literature 55)
These microstructures, which can be achieved via different polymerization processes as well
as kinetic factors (e.g. reactivity), can have a determining influence on copolymer properties
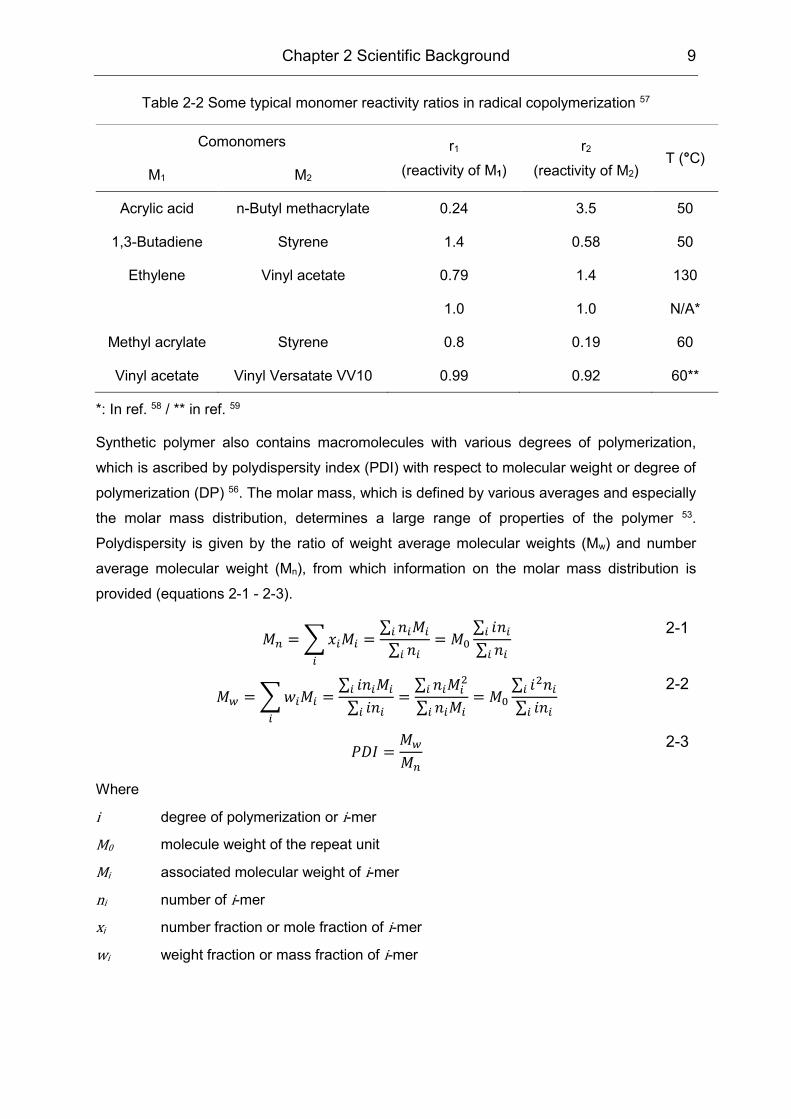
55, of which the monomer reactivity ratio is an essential parameter. Table 2-2 presents some
typical monomer reactivity ratios. The inherent reactivity ratio is influenced by the reaction
conditions, e.g. temperature, solvent, etc 55. Herein, if r1>1, the radical M1• adds monomer M1
in preference to M2; if r1<1, M1• adds M2 in preference to M1, and vice versa. Therefore,
alternating structures by r1→0 and r2→0, random structures by r1∙r2→1 and blocky structures
by r1∙r2>1 are promoted respectively 56. Therefore, the sequence distribution within the
copolymer can be crudely estimated from the reactivity ratios. Other fine intramolecular
structures of the macromolecule including tacticity is discussed in section 2.1.2.
Chapter 2 Scientific Background 9
Table 2-2 Some typical monomer reactivity ratios in radical copolymerization 57
Comonomers r1
(reactivity of M1)
r2
(reactivity of M2) T (°C)
M1 M2
Acrylic acid n-Butyl methacrylate 0.24 3.5 50
1,3-Butadiene Styrene 1.4 0.58 50
Ethylene Vinyl acetate 0.79 1.4 130
1.0 1.0 N/A*
Methyl acrylate Styrene 0.8 0.19 60
Vinyl acetate Vinyl Versatate VV10 0.99 0.92 60**
*: In ref. 58 / ** in ref. 59
Synthetic polymer also contains macromolecules with various degrees of polymerization,
which is ascribed by polydispersity index (PDI) with respect to molecular weight or degree of
polymerization (DP) 56. The molar mass, which is defined by various averages and especially
the molar mass distribution, determines a large range of properties of the polymer 53.
Polydispersity is given by the ratio of weight average molecular weights (Mw) and number
average molecular weight (Mn), from which information on the molar mass distribution is
provided (equations 2-1 - 2-3).
𝑀𝑛 = ∑ 𝑥𝑖𝑀𝑖 =
∑ 𝑛𝑖𝑀𝑖𝑖
∑ 𝑛𝑖𝑖= 𝑀0
∑ 𝑖𝑛𝑖𝑖
∑ 𝑛𝑖𝑖𝑖
2-1
𝑀𝑤 = ∑ 𝑤𝑖𝑀𝑖 =
∑ 𝑖𝑛𝑖𝑀𝑖𝑖
∑ 𝑖𝑛𝑖𝑖=
∑ 𝑛𝑖𝑀𝑖2
𝑖
∑ 𝑛𝑖𝑀𝑖𝑖= 𝑀0
∑ 𝑖2𝑛𝑖𝑖
∑ 𝑖𝑛𝑖𝑖𝑖
2-2
𝑃𝐷𝐼 =
𝑀𝑤
𝑀𝑛
2-3
Where Whe
i degree of polymerization or i-mer
M0 molecule weight of the repeat unit
Mi associated molecular weight of i-mer
ni number of i-mer
xi number fraction or mole fraction of i-mer
wi weight fraction or mass fraction of i-mer
10 Chapter 2 Scientific Background
The dry content of polymer dispersions only contributes approximately 4 wt.-% of total polymer
production, about 7.5 million tons by the year of 2001 29. Emulsion polymerization has
developed into a widely used process for the production of synthetic latex / polymer
dispersions 60. This kind of polymerization refers to a unique process employed for radical
chain polymerizations, which involves the polymerization of monomers in the form of
emulsions (i.e., colloidal dispersions) 57. The advantage of the process is that it is capable of
producing high molecular weight polymers at low viscosity, while its disadvantage is the
presence of stabilizers in the final products.
Vinyl acetate homo- and copolymers, polyacrylates and styrene butadiene copolymers are the
major categories of synthetic latices 29. Emulsion copolymers of vinyl acetate (VAc) are
increasingly used in numerous applications due to the advantageous combination of good
durability and wide availability at low cost 58. Polyvinyl acetate emulsion is less valuable and
usually requires plasticization, either external plasticizer like o-phthalic diesters or an internal
one such as comonomers, e.g. vinyl esters, the fumaric and maleic diesters or the acrylic
esters 61. Ethylene copolymerized with VAc under normal circumstances enters the polymer
backbone only and provides neither bulky nor long chain side group. Its primary contribution
to the plasticization is by increasing intra-chain mobility, making the backbone more flexible
61. As a result, the VAE copolymer offers considerable advantages over PVAc due to its lower
glass transition temperature (Tg), which is mainly related to the ethylene content 62. VAE
copolymer characterization has been studied intensively 63–66. However, as an industrial
important emulsion polymer, only a few kinetic investigations on VAE emulsion have been
published 67. Nevertheless, Scott et al. carried out a series of studies on semi-batch emulsion
copolymerization of VAE 67–69, discussing the influence of redox initiator system, co-solvent,
temperature, VAc feed rate, emulsifier type and pressure on the microstructure of the
copolymer. These industrially significant VAE emulsions are currently stabilized via both
surfactant and partially hydrolyzed polyvinyl alcohol (PVOH), which could also affect the
polymer structure and hence its final physical properties 70. The continuous emulsion
copolymerization process has a significant influence on the physical properties of VAE
emulsion polymer, i.e. its polymer structure has been altered thereof 71.
2.1.2 Protective colloid - Polyvinyl Alcohol (PVA)
Polyvinyl alcohol (abbreviated as PVA instead of PVAL normally) is widely used industrially
as a protective colloid in the emulsions of VAc homopolymer and copolymers 27. PVA
stabilized latices show better emulsion fluidity such as Newtonian flow or structural viscosity,
superior wet primary tackiness as adhesives, good mechanical film properties such as higher
tensile strength and creep resistance, excellent mechanical stability, and higher freeze-thaw
Chapter 2 Scientific Background 11
stability compared to latices stabilized with low molecular weight surfactants 72. Accordingly,
the performance of the emulsion stabilized by PVA is largely dependent on the fine chemical
structure of PVA used in polymerization 73.
2.1.2.1 Structure of polyvinyl alcohol
PVA is commercially manufactured by the alkaline hydrolysis of poly(vinyl acetate) 74. Its
physical properties such as melting and glass transition temperature, solubility and
mechanical properties are greatly dependent on the two major parameters: molecular weight
and hydrolysis degree 74,75. For ease of elaboration, PVA is defined as the fully hydrolyzed
polymer (i.e. degree of hydrolysis ≥ 96% 76) or general description while PVOH is assigned to
the partially hydrolyzed one in the following description, though they are synonymous 77.
Despite the industrial interest on molecular weight and hydrolysis degree, the intra- and
intermolecular structure affects the polymer properties, e.g. glass transition temperature and
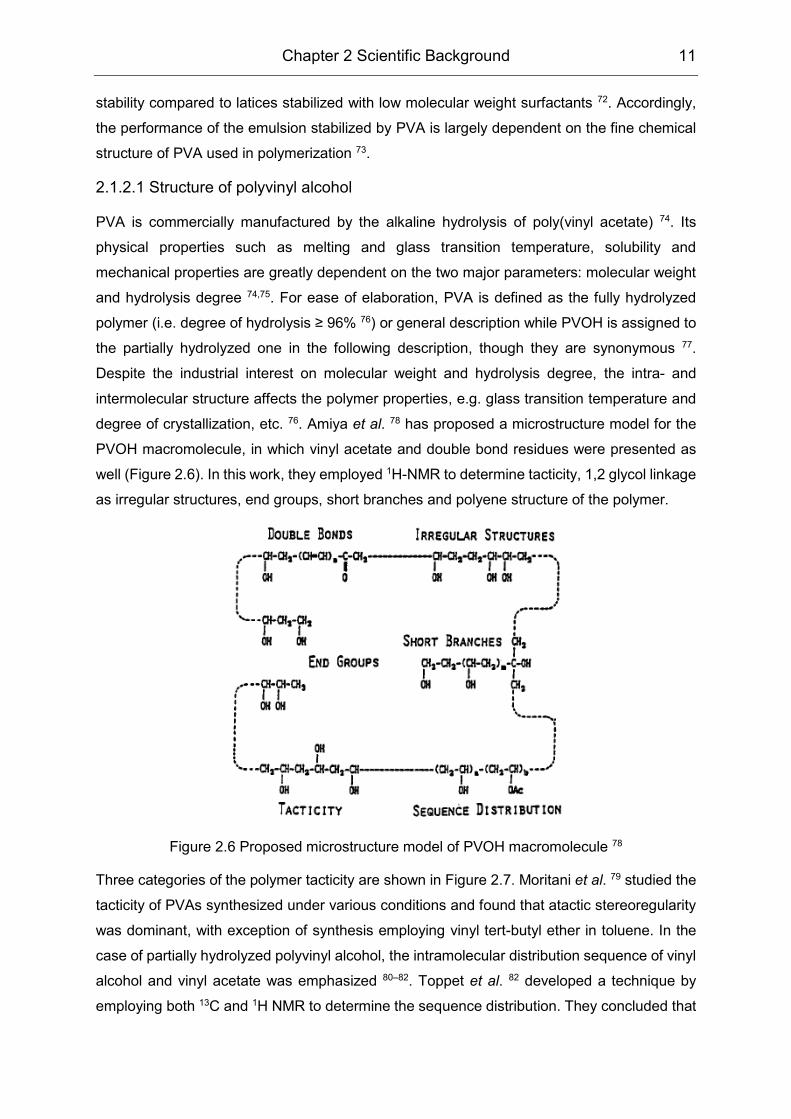
degree of crystallization, etc. 76. Amiya et al. 78 has proposed a microstructure model for the
PVOH macromolecule, in which vinyl acetate and double bond residues were presented as
well (Figure 2.6). In this work, they employed 1H-NMR to determine tacticity, 1,2 glycol linkage
as irregular structures, end groups, short branches and polyene structure of the polymer.
Figure 2.6 Proposed microstructure model of PVOH macromolecule 78
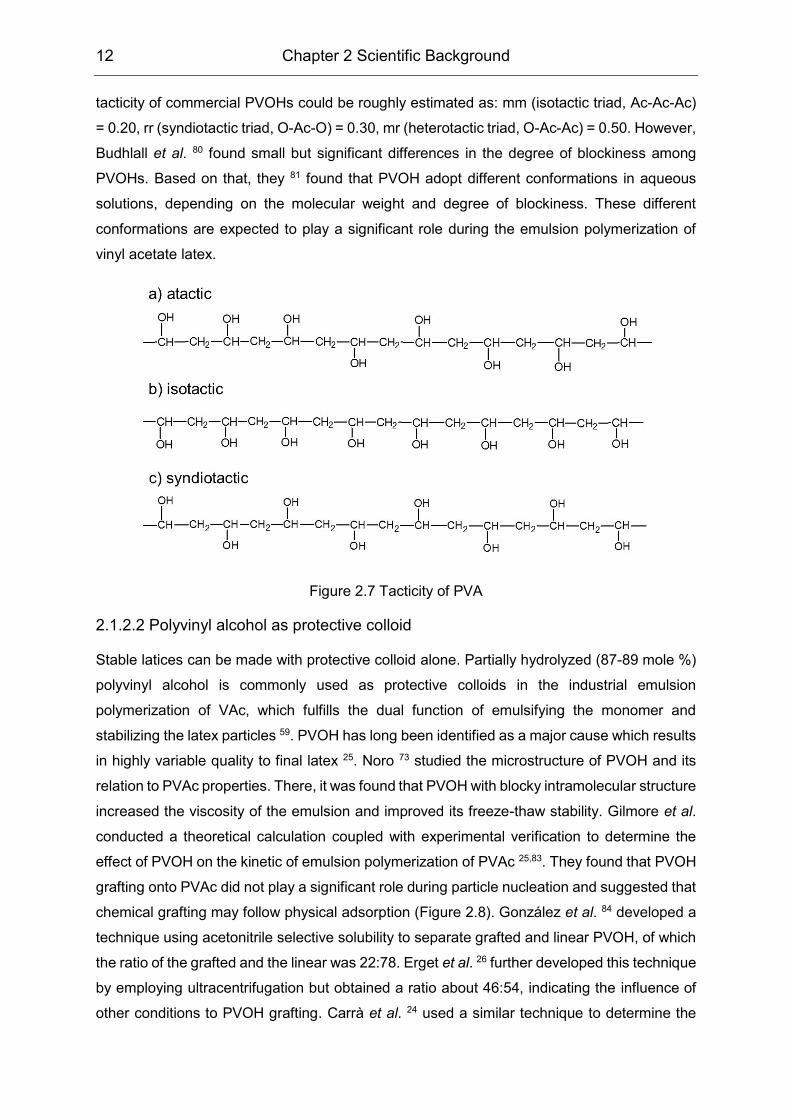
Three categories of the polymer tacticity are shown in Figure 2.7. Moritani et al. 79 studied the
tacticity of PVAs synthesized under various conditions and found that atactic stereoregularity
was dominant, with exception of synthesis employing vinyl tert-butyl ether in toluene. In the
case of partially hydrolyzed polyvinyl alcohol, the intramolecular distribution sequence of vinyl
alcohol and vinyl acetate was emphasized 80–82. Toppet et al. 82 developed a technique by
employing both 13C and 1H NMR to determine the sequence distribution. They concluded that
12 Chapter 2 Scientific Background
tacticity of commercial PVOHs could be roughly estimated as: mm (isotactic triad, Ac-Ac-Ac)
= 0.20, rr (syndiotactic triad, O-Ac-O) = 0.30, mr (heterotactic triad, O-Ac-Ac) = 0.50. However,
Budhlall et al. 80 found small but significant differences in the degree of blockiness among
PVOHs. Based on that, they 81 found that PVOH adopt different conformations in aqueous
solutions, depending on the molecular weight and degree of blockiness. These different
conformations are expected to play a significant role during the emulsion polymerization of
vinyl acetate latex.
Figure 2.7 Tacticity of PVA
2.1.2.2 Polyvinyl alcohol as protective colloid
Stable latices can be made with protective colloid alone. Partially hydrolyzed (87-89 mole %)
polyvinyl alcohol is commonly used as protective colloids in the industrial emulsion
polymerization of VAc, which fulfills the dual function of emulsifying the monomer and
stabilizing the latex particles 59. PVOH has long been identified as a major cause which results
in highly variable quality to final latex 25. Noro 73 studied the microstructure of PVOH and its
relation to PVAc properties. There, it was found that PVOH with blocky intramolecular structure
increased the viscosity of the emulsion and improved its freeze-thaw stability. Gilmore et al.
conducted a theoretical calculation coupled with experimental verification to determine the
effect of PVOH on the kinetic of emulsion polymerization of PVAc 25,83. They found that PVOH
grafting onto PVAc did not play a significant role during particle nucleation and suggested that
chemical grafting may follow physical adsorption (Figure 2.8). González et al. 84 developed a
technique using acetonitrile selective solubility to separate grafted and linear PVOH, of which
the ratio of the grafted and the linear was 22:78. Erget et al. 26 further developed this technique
by employing ultracentrifugation but obtained a ratio about 46:54, indicating the influence of
other conditions to PVOH grafting. Carrà et al. 24 used a similar technique to determine the
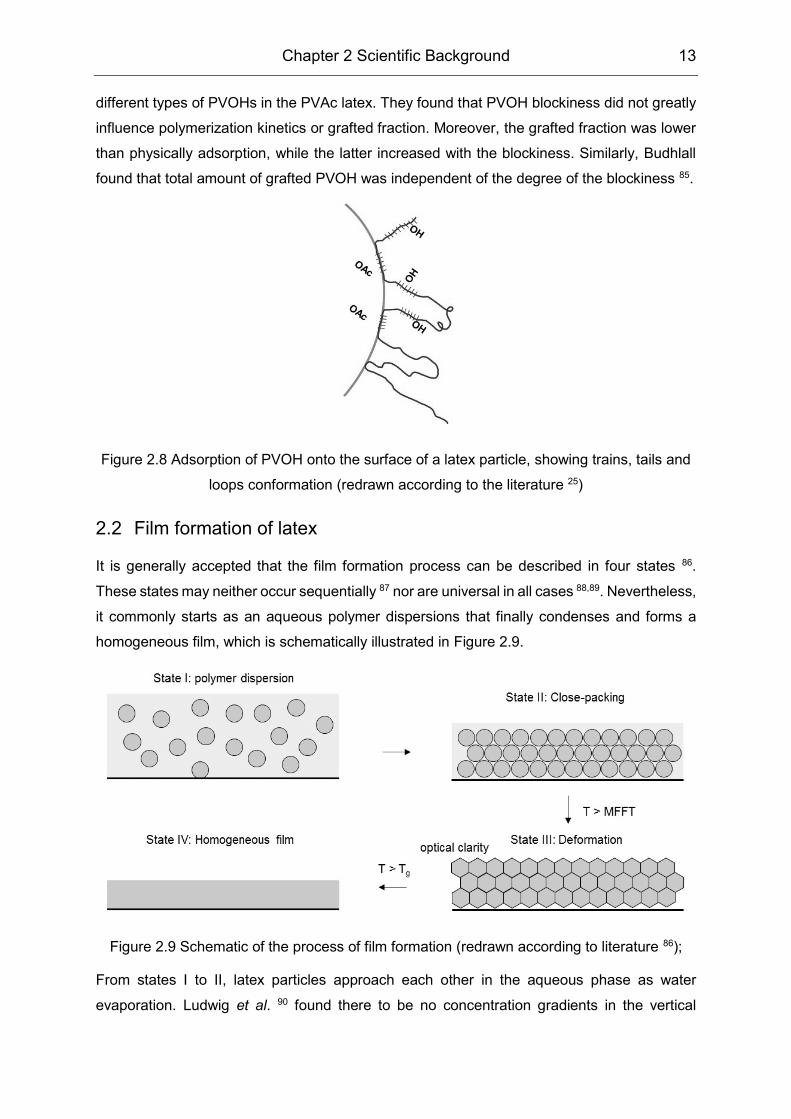
Chapter 2 Scientific Background 13
different types of PVOHs in the PVAc latex. They found that PVOH blockiness did not greatly
influence polymerization kinetics or grafted fraction. Moreover, the grafted fraction was lower
than physically adsorption, while the latter increased with the blockiness. Similarly, Budhlall
found that total amount of grafted PVOH was independent of the degree of the blockiness 85.
Figure 2.8 Adsorption of PVOH onto the surface of a latex particle, showing trains, tails and
loops conformation (redrawn according to the literature 25)
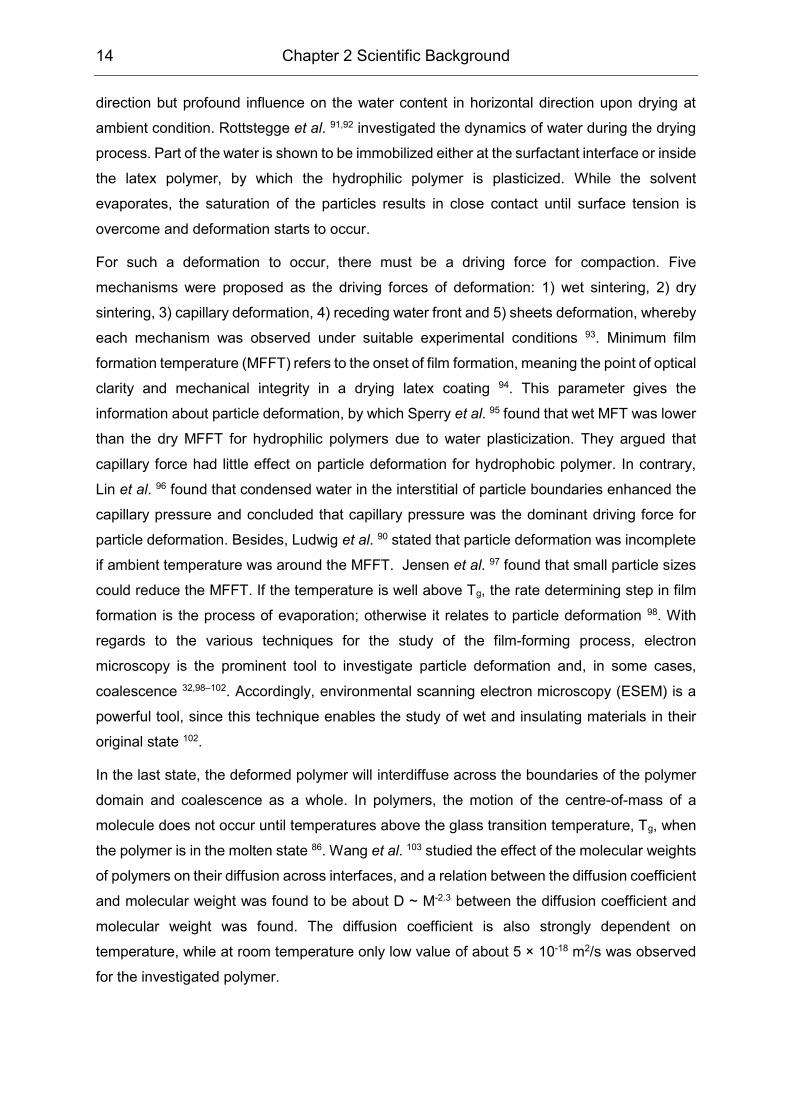
2.2 Film formation of latex
It is generally accepted that the film formation process can be described in four states 86.
These states may neither occur sequentially 87 nor are universal in all cases 88,89. Nevertheless,
it commonly starts as an aqueous polymer dispersions that finally condenses and forms a
homogeneous film, which is schematically illustrated in Figure 2.9.
Figure 2.9 Schematic of the process of film formation (redrawn according to literature 86);
From states I to II, latex particles approach each other in the aqueous phase as water
evaporation. Ludwig et al. 90 found there to be no concentration gradients in the vertical
14 Chapter 2 Scientific Background
direction but profound influence on the water content in horizontal direction upon drying at
ambient condition. Rottstegge et al. 91,92 investigated the dynamics of water during the drying
process. Part of the water is shown to be immobilized either at the surfactant interface or inside
the latex polymer, by which the hydrophilic polymer is plasticized. While the solvent
evaporates, the saturation of the particles results in close contact until surface tension is
overcome and deformation starts to occur.
For such a deformation to occur, there must be a driving force for compaction. Five
mechanisms were proposed as the driving forces of deformation: 1) wet sintering, 2) dry
sintering, 3) capillary deformation, 4) receding water front and 5) sheets deformation, whereby
each mechanism was observed under suitable experimental conditions 93. Minimum film
formation temperature (MFFT) refers to the onset of film formation, meaning the point of optical
clarity and mechanical integrity in a drying latex coating 94. This parameter gives the
information about particle deformation, by which Sperry et al. 95 found that wet MFT was lower
than the dry MFFT for hydrophilic polymers due to water plasticization. They argued that
capillary force had little effect on particle deformation for hydrophobic polymer. In contrary,
Lin et al. 96 found that condensed water in the interstitial of particle boundaries enhanced the
capillary pressure and concluded that capillary pressure was the dominant driving force for
particle deformation. Besides, Ludwig et al. 90 stated that particle deformation was incomplete
if ambient temperature was around the MFFT. Jensen et al. 97 found that small particle sizes
could reduce the MFFT. If the temperature is well above Tg, the rate determining step in film
formation is the process of evaporation; otherwise it relates to particle deformation 98. With
regards to the various techniques for the study of the film-forming process, electron
microscopy is the prominent tool to investigate particle deformation and, in some cases,
coalescence 32,98–102. Accordingly, environmental scanning electron microscopy (ESEM) is a
powerful tool, since this technique enables the study of wet and insulating materials in their
original state 102.
In the last state, the deformed polymer will interdiffuse across the boundaries of the polymer
domain and coalescence as a whole. In polymers, the motion of the centre-of-mass of a
molecule does not occur until temperatures above the glass transition temperature, Tg, when
the polymer is in the molten state 86. Wang et al. 103 studied the effect of the molecular weights
of polymers on their diffusion across interfaces, and a relation between the diffusion coefficient
and molecular weight was found to be about D ~ M-2.3 between the diffusion coefficient and
molecular weight was found. The diffusion coefficient is also strongly dependent on
temperature, while at room temperature only low value of about 5 × 10-18 m2/s was observed
for the investigated polymer.
Chapter 2 Scientific Background 15
Nevertheless, film formation of latices stabilized with a protective colloid which are widely used
in the adhesive or construction industries 104, has been less well reported. Kast 105 investigated
OsO4 stained ultramicrotome section of vinyl acetate/ethylene (VAE) copolymer film and found
that PVOH formed a continuous network throughout the film, by which latex polymer particles
were separated. Budhlall et al. 106 used Atomic Force Micoscopy (AFM) to investigated PVAc
latex film incorporated with different PVOHs. They found the surface morphology of the films
to be strongly dependent on the degree of blockiness and molecular weight of PVOHs, i.e.
PVOH in a medium could migrate to the surface during water evaporation, resulting in a hills-
valley structure depending on the unbound amount of PVOH. Du Chesne et al. 28 added
sodium dodecylsulfate (SDS) and non-ionic ethoxylated fatty alcohols (Genapol T250) into the
VAE latex. They found that polymer particle interdiffusion was feasible due to the break-up of
the surrounding PVOH membrane. Baueregger et al. 13 investigated both the polymer
dispersions and its powder form of VAE and SBR, finding that the presence of kaolin in the
powders accelerated the film-forming process.
2.3 Portland cement
2.3.1 Cement
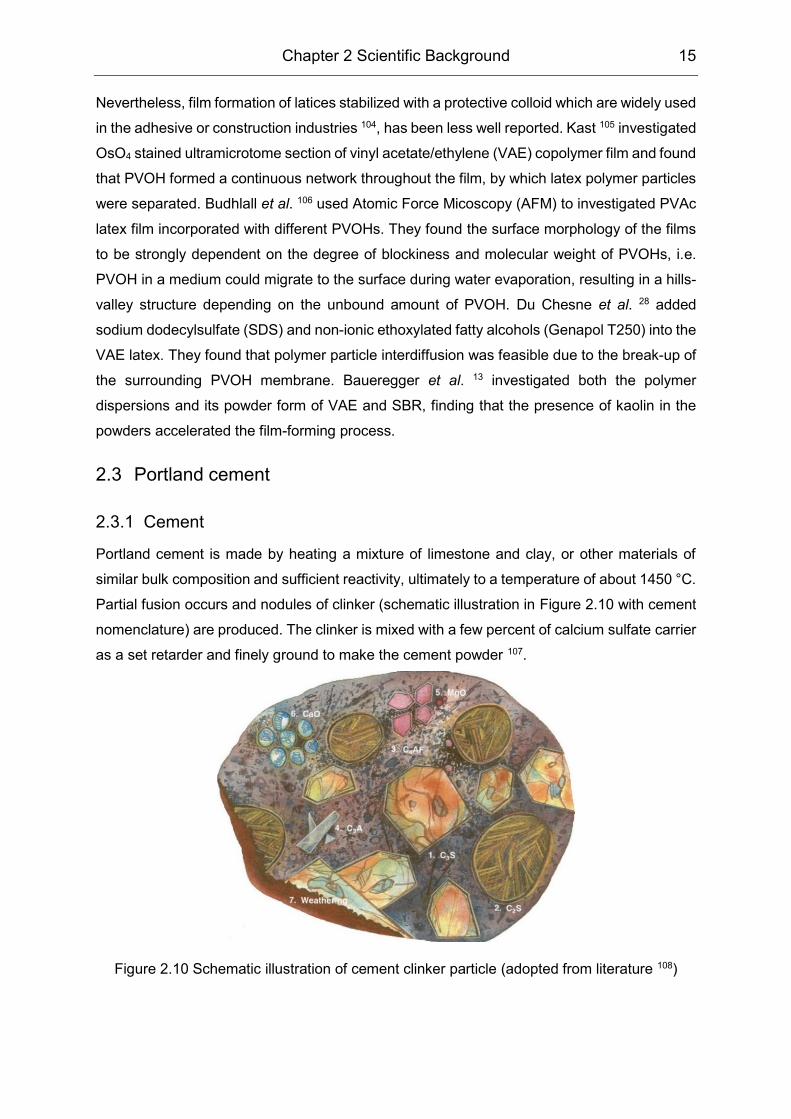
Portland cement is made by heating a mixture of limestone and clay, or other materials of
similar bulk composition and sufficient reactivity, ultimately to a temperature of about 1450 °C.
Partial fusion occurs and nodules of clinker (schematic illustration in Figure 2.10 with cement
nomenclature) are produced. The clinker is mixed with a few percent of calcium sulfate carrier
as a set retarder and finely ground to make the cement powder 107.
Figure 2.10 Schematic illustration of cement clinker particle (adopted from literature 108)
16 Chapter 2 Scientific Background
Portland cement powder has a wide particle size distribution (PSD), from about 0.1-100 µm.
Holzer et al. 109 used volume equivalent spherical diameter (VESD) to compare the shape of
smaller (0.4-2 µm) and larger (20-60 µm) particles. They found that both ranges of particles
presented prolate shapes. However, the smaller particles were more prolate than the larger
ones, with a greater average length and average length to width ratio. Erdoğan et al 110 used
a X-ray computed tomography to study the relation between particle shape and mineralogy.
Cement with high amount of belite tended to have a higher equi-axed shapes at the length
scale of 20-60 µm. They also found that actual cement particle size tended to be smaller than
that measured by laser granulometry.
The clinker typically has a composition in the region of 67 wt.-% CaO, 22 wt.-% SiO2, 5 wt.-%
Al2O3, 3 wt.-% Fe2O3 and 3 wt.-% other components, and normally contains four major phases,
called Alite (C3S), Belite (C2S), Aluminate (C3A) and Ferrite (C4AF). 107. In the last few decades,
quantitative phase analysis of anhydrous Portland cements by X-ray powder diffraction (XRPD)
and whole profile fitting methods such as the Rietveld method have become standard practice
in cement phase characterization 111–115. Though amorphous phase 113 and reproducibility 114
could affect the accuracy of the results, it is far less labour-intensive than the microscope point
counting (MPC) method 112. However, the MPC method could provide surface phase fraction
which is of interest in early cement hydration 116, where, aluminate (C3A) and especially
gypsum presented a much higher surface fraction than their weight fraction. Scrivener 117 also
found that the proportions of interstitial phases exposed on the surfaces of the particles were
significantly greater than those by volume in the bulk material.
2.3.2 Minerals
The polymorph structure of tricalcium silicate (3CaO∙SiO2, C3S) has been refined by many
researchers and C3S doped with foreign ions such as Mg is needed to stabilize the structure
at ambient temperature 118–123.
Dicalcium silicate (2CaO∙SiO2, C2S) is another main constituent phases of cement mineral. It
is usually consist of five polymorphs 107, among which only γ form is stable at room temperature.
However, in the presence of small amount of impurities as low as 0.1 wt.-%, the β form is
stable and the conversion from ß to γ is prohibited in cement clinker 124.
Pure tricalcium aluminate (3CaO∙Al2O3, C3A) does not exhibit polymorphism. The structure is
built from Ca2+ ions and rings of six AlO4 tetrahedra of formular Al6O1818- 125. The aluminate
present in cement clinker is a solid solution of C3A with several foreign oxides like MgO, SiO2,
Fe2O3, Na2O and K2O. Only when doped with Na2O will the symmetry of this mineral will
change from cubic to orthorhombic. The influence of Na2O amount on C3A symmetry is
summarized as below 126:
Chapter 2 Scientific Background 17
0-1.9 wt.-% Na2O cubic
1.9-3.7 wt.-% Na2O cubic + orthorhombic
3.7-4.6 wt.-% Na2O orthorhombic
4.6-5.9 wt.-% Na2O monoclinic
The composition of the ferrite phase can be described by a limited solid solution between
Ca2Fe2O5 and Ca2Al1.33Fe0.67O5 with Ca2(AlxFe1-x)2O5 (C4AF), 0<x<0.7 126.
Gypsum is added to the cement clinker during the grinding, where the heat produced can
cause partial conversion of gypsum into hemihydrate (CaSO4∙0.5H2O) or γ-CaSO4 107. Here,
hemihydrate refers to ß-CaSO4∙0.5H2O, while its α-form is only made under saturated steam.
Further dehydration could result in the formation of soluble anhydrite (γ-CaSO4, but not truly
anhydrous) at ~ 120 °C, while insoluble anhydrite (β-CaSO4) is formed above 200-300 °C 127.
2.4 Interaction between latex and cement
Ohama 1 firstly proposed an interaction model between latex and cement. In this model, the
cement hydration generally precedes the polymer film formation process by the coalescence
of polymer particles in polymer latices. In due course, a co-matrix phase is formed between
both the hydrated cement and the formed polymer film. The co-matrix phase is generally
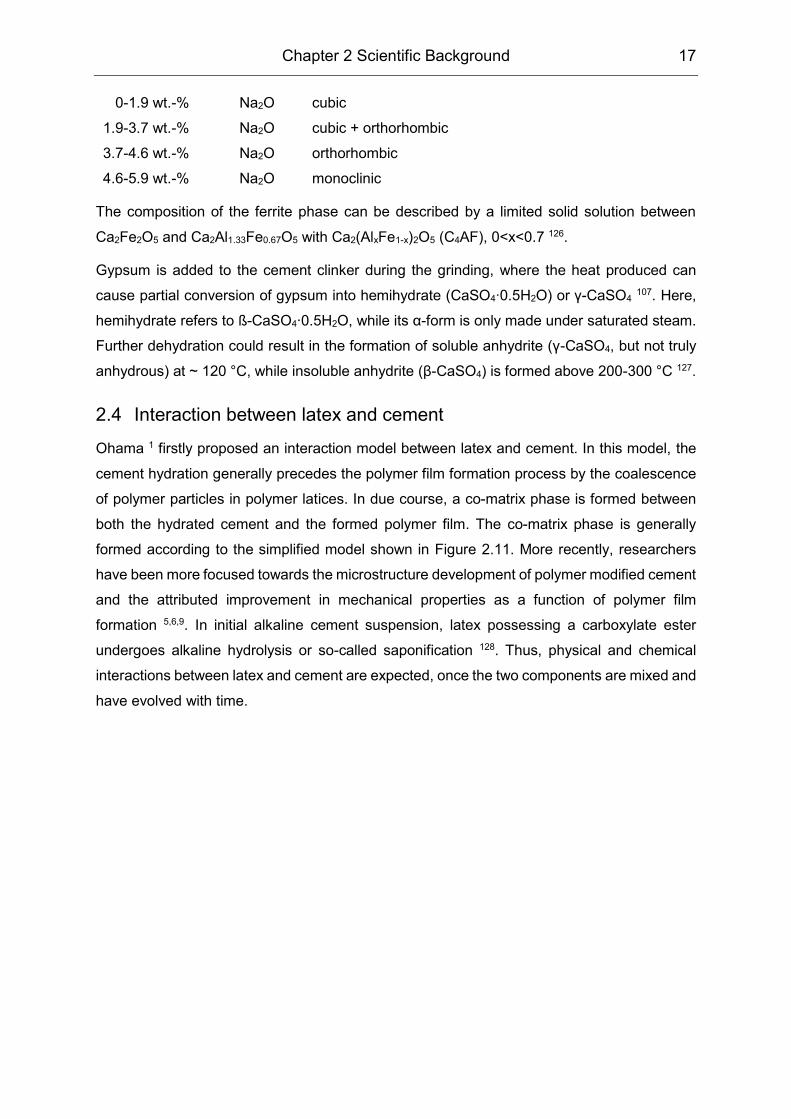
formed according to the simplified model shown in Figure 2.11. More recently, researchers
have been more focused towards the microstructure development of polymer modified cement
and the attributed improvement in mechanical properties as a function of polymer film
formation 5,6,9. In initial alkaline cement suspension, latex possessing a carboxylate ester
undergoes alkaline hydrolysis or so-called saponification 128. Thus, physical and chemical
interactions between latex and cement are expected, once the two components are mixed and
have evolved with time.
18 Chapter 2 Scientific Background
Figure 2.11 Ohama model of formation of polymer cement co-matrix (redrawn after the
literature 1)
Atkins et al. 129 studied polyvinyl acetate (PVAc) polymer powder, acrylic ester dispersions,
polyvinylidene chloride (PVDC) dispersions, polystryrene acrylate (SA) dispersions and
polystyrene butadiene (SBR) dispersions with Portland cement. They found that SBR had little
chemical interaction with the cement, whereas PVAc and SA were either fully or partially
hydrolyzed in cement pore solution. Larbi et al. 130 investigated the interaction between SA or
PVDC dispersions and pore solution. They found that all the polymer dispersions influenced
the ions concentration in the pore solution: SA dispersions decreased Ca2+ concentration while
increasing both the SO42- and OH- concentration; PVDC dispersions decreased Ca2+ and OH-
in the long term. Pöllmann et al. 131 investigated the saponification of different polymer powders
in cement based material, finding that styrene acrylate copolymer exhibited lower
saponification than vinyl acetate-versatate copolymer and vinyl acetate ethylene at high pH.
16 Merlin et al. 19 investigated a methyl methacrylate (MMA) and butyl acrylate (BA) latex with
non-ionic surfactant and found the latex adsorbed on cement minerals. Boutti et al. 18
investigated a low fraction of SA latex with cement and they concluded that there was no
evidence of a latex-cement interaction. Plank et al. 17 studied the interaction between anionic
or cationic latex and cement. They found that a charged latex particle adsorbed onto the
surface of cement minerals. Ma et al. 132 also observed the adsorption of anionic polyacrylate
latex on cement. Kaufmann et al. 16 determined the interaction between cationic polyacrylate
latex, vinyl acetate latex, two VAE latex and vinyl acetate/vinyl versatate/butyl acrylate
terpolymer latex and cement by means of zeta potential. They speculated that adsorption
Chapter 2 Scientific Background 19
between latex and cement mineral surface was weak, considering that the addition of polymer
dispersions to cement leads to minor changes of the charge situation only.
Nevertheless, many researchers found that latex modifies hydration kinetics, though there has
been variation in chemical composition, surfactant types or different additives 6,14,15,20–22,129,133.
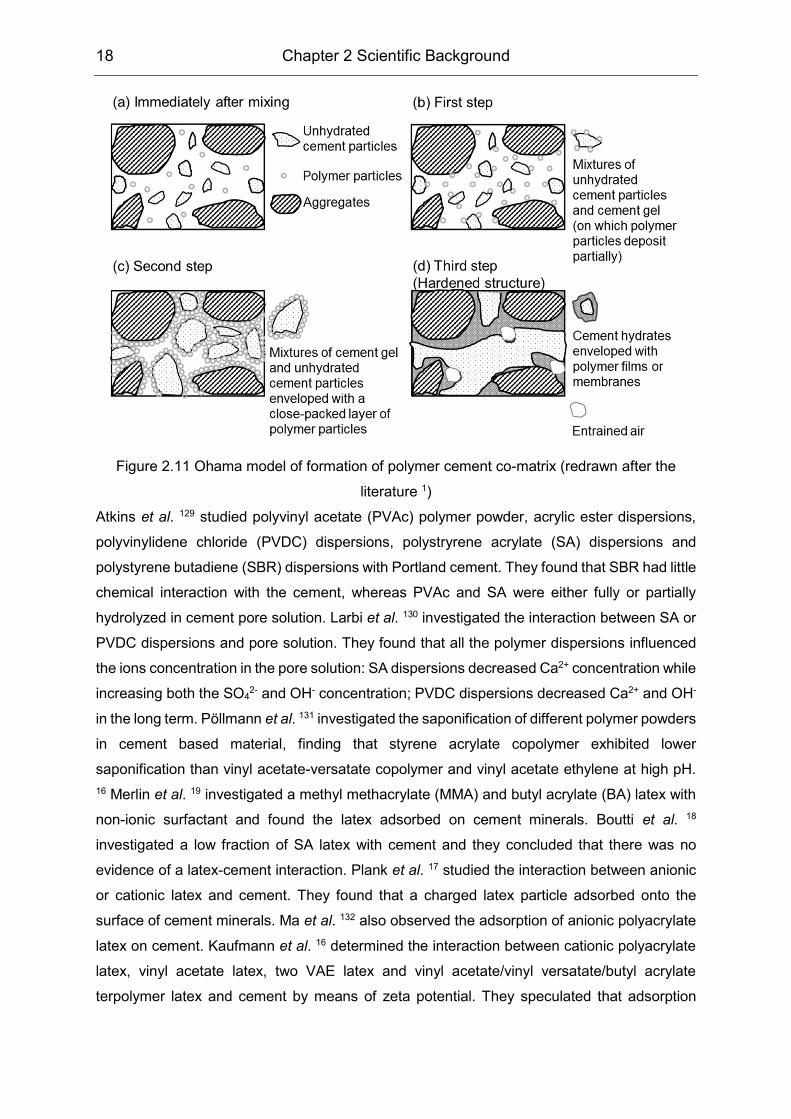
In summary, the interaction between latex and cement can be generally divided into three
phases: interaction in colloid state (adsorption if any), alteration on hydration kinetics due to
physicochemical interactions and film formation in cement environments (Figure 2.12).
Figure 2.12 Schematic illustration of Interaction between latex and cement
2.4.1 Adsorption of latex polymer at solid/liquid interface
Adsorption can be defined as ‘an increase in the concentration of a dissolved substance at
the interface of a condensed phase and a liquid phase due to the operation of surface forces’
134. When this condensed phase is solid, it is referred to as the adsorbent and the adsorbed
material the adsorbate. In consideration of the adsorption processes, there are two aspects
that must be addressed: 1) thermodynamic – the effect of the adsorption process on the final
equilibrium interfacial energy of the system and 2) kinetics – the rate at which the adsorption
process occurs 135.
Possibly the most favoured approach to the theoretical aspects of all adsorption systems is
the study of the isotherm, in which the amount adsorbed is plotted against the pressure or
concentration in the external phase, at constant temperature, and usually under equilibrium
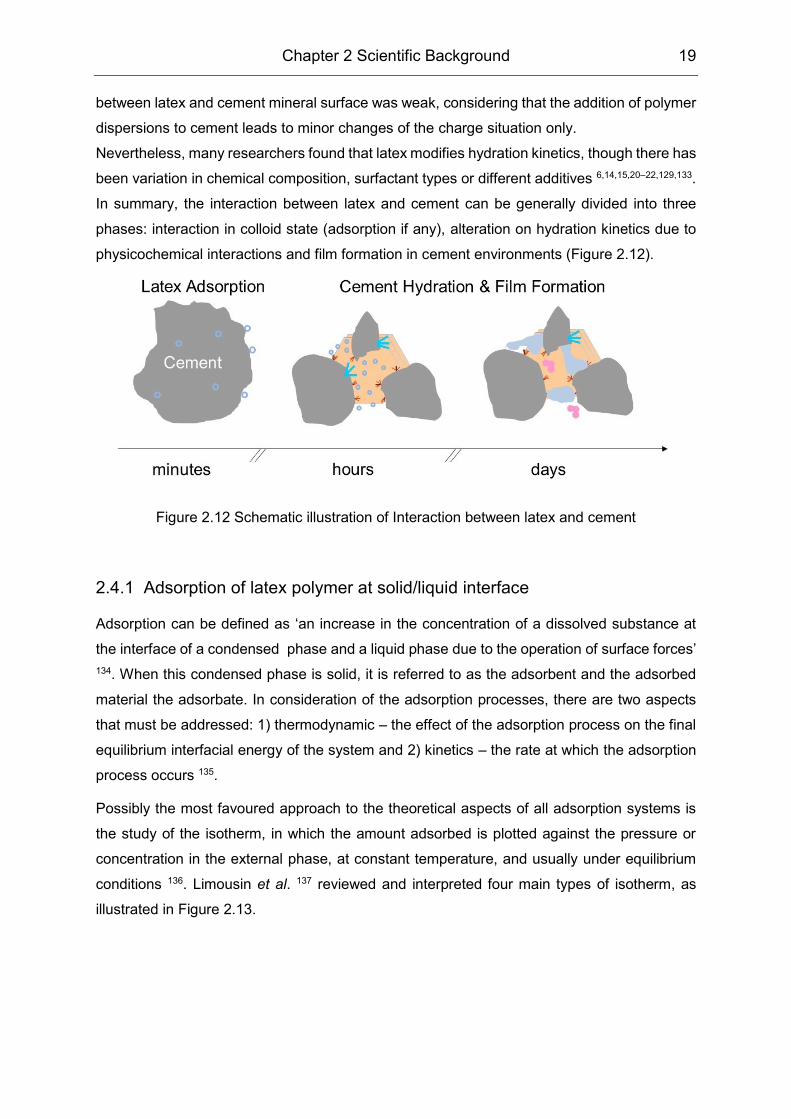
conditions 136. Limousin et al. 137 reviewed and interpreted four main types of isotherm, as
illustrated in Figure 2.13.
20 Chapter 2 Scientific Background
Figure 2.13 The four main types of adsorption isotherm 137
The ‘C’ isotherm means that the ratio between the concentration of the compound remaining
in solution and adsorbed on the solid is the same at any concentration. However, the simplicity
of this isotherm must not justify its use without verification. The ‘L’ isotherm means that the
ratio between the concentration of the compound remaining in solution and adsorbed on the
solid decreases when the solute concentration increases, which suggests a progressive
saturation of the adsorbate. This isotherm is usually divided into two sub-groups, one with a
strict asymptotic plateau and the other without any plateau. The ‘H’ isotherm could be
considered as a particular case of the ‘L’ isotherm, where the initial slope is very high. The ‘S’
isotherm shows a sigmoidal shape with a point of inflection. This type has two causes: 1)
solute–solute attractive forces at the surface may cause cooperative adsorption which leads
to the S-shape and 2) the sorption of a solute may be inhibited by a competing reaction within
the solution, such as a complexation reaction with a ligand 138.
The type ‘L’ and ‘H’ isotherms can be assigned to the Langmuir or Freundlich isotherms 138.
Compared to the empirical Freundlich isotherm, the Langmuir isotherm is both theoretically
easy to understand and widely applicable to experimental data 31. The adsorption isotherm
can be easily derived with following assumptions:
1) all the adsorption sites are assumed to be identical;
2) each site retains one molecule of the adsorbate;
3) all the sites are energetically and sterically independent
Then, the equilibrium constant could be written as:
𝐾′ =
𝑎2𝑖 𝑎1
𝑏
𝑎1𝑖 𝑎2
𝑏
2-4
Where, Whe
Chapter 2 Scientific Background 21
𝐾′ equilibrium constant of adsorption/desorption
𝑎2𝑖 activity of solute or adsorbate at solid/solvent interface
𝑎1𝑏 activity of solvent in the bulk solution
𝑎1𝑖 activity of solvent at solid/solvent interface
𝑎2𝑏 activity of solute in the bulk solution
If the activity of both solute and solvent by the mole fraction x are replaced, Equation 2-4 can
be written as:
𝐾′ =
𝑥2𝑖 𝑎1
𝑏
𝑥1𝑖 𝑎2
𝑏
2-5
Since x1i + x2
i = 1, Equation 2-5 is rearranged to:
𝐾′ =
𝑥2𝑖 𝑎1
𝑏
(1 − 𝑥2𝑖 )𝑎2
𝑏 → 𝑥2
𝑖 =𝐾′ 𝑎2
𝑏 𝑎1𝑏⁄
𝐾′ 𝑎2𝑏 𝑎1
𝑏⁄ + 1
2-6
In dilute solutions the activity of the solvent is essentially constant, so the ratio 𝐾′ 𝑎1𝑏⁄ can be
defined to equal a new constant K, and the equation becomes:
𝑥2
𝑖 =𝐾𝑎2
𝑏
𝐾𝑎2𝑏 + 1
2-7
If the x2i is replaced by the fraction of maximum surface coverage θ and a2
b is substituted by
solute concentration c, the equation could be written as a more common form:
𝜃 =
𝐾𝑐
𝐾𝑐 + 1
2-8
However, many systems that definitely do not conform to the Langmuir assumptions – the
adsorption of polymers for example – nevertheless display an experimental isotherm fitted
with Langmuir isotherm 31. Accordingly, the constant in Equation 2-8 is empirical without
physical significance thereof. In general, one can assume that the adsorption of polymer at
the interface will be monomolecular, since the thickness of the first polymer layer will make
attraction for a second layer negligible 135. In the case of latex particle, this monolayer
adsorption is also valid generally, where adsorption is defined in a broad sense as both
deposition (irreversible adsorption) and adhesion (chemical contact) 139.
For nonionic water soluble polymers, hydrogen-bonding and solvation forces are important.
Though Pattanayek et al. 140 successfully established a model using hydrogen bonding to
predict the adsorption of non-ionic polymers. However, various conditions may alter the
adsorption behavior 141–144. Chibowski et al. 141 studied the influence of residual acetate group
of PVOH on adsorption to TiO2. The hydrophobic acetate group presented a high affinity to
22 Chapter 2 Scientific Background
the TiO2 particle surface but less relevance to pH in the range of 3-10. Backfolk et al. 142
studied the PVOH adsorption on silica surface at pH = 8.5 and found negligible adsorption.
They also found that pre-adsorbed sodium polyacrylate or sodium polyphosphate increased
PVOH adsorption. Santiya et al. 143 found that the adsorption of PVOH on alumina increased
with pH in the range of 3-11. However, in the presence of polyacrlic acid, the adsorption of
PVOH decreased significantly. Labidi et al. 144 studied the adsorption of PVA on calcite at pH
7-10 and found that adsorption increased in the presence of sodium oleate, i.e. the PVA-
surfactant interaction enhanced PVA accumulation in the vicinity of the mineral surface.
With respect to latex adsorption, a more accurate description of the irreversible interaction is
random sequential adsorption (RSA) 145. Johnson et al. 146 verified the RSA theory by
employing AFM to investigate the adsorption of a positively charged latex particles adsorbed
on mica surface. There, it was found that the compression of the electrostatic double layer of
the particles reduced the excluded area, i.e. an increase in the adsorbed amount of latex
particles and surface coverage. Filby et al. 147 studied the adsorption between carboxylated
latex and various minerals and found that the adhesion between them fitted well with DLVO
theory, even when the hydration force was not taken into consideration. Adamczyk 148 also
discussed the role of electrostatic interaction on particle adsorption and concluded that the
electrical double layer affected the interaction range, maximum coverage, and deposition
kinetics etc. Besides, he and his coworkers 149 investigated the influence of heterogeneous
surfaces on particle adsorption, by covering freshly cleaved mica sheets with colloid iron oxide
(i.e. Hematite). They found that the initial adsorption rate increased abruptly with the hematite
covered surface. Similarly, Shen et al. 150 theoretically investigated the adsorption of a
negatively charged particle on a negative planar surface in the presence of a positively
charged square patch with regard to the chemical heterogeneity of the surfaces. They found
that a critical patch size (commonly at the nanoscale) is required for the adsorption at a given
ionic strength. Moreover, this critical size decreases with the increase in ionic strength.
2.4.2 Hydration kinetics of cement
The reaction of various types of cements and their components with water is an exothermic
process. Measurement of the total heat and rate of heat development provides information on
the kinetics of hydration 151. The exothermic process could be roughly divided into: I – initial
period; II – induction period; III – acceleration period; IV – deceleration period 152. As a complex
system, the hydration of the mineral phases of cement is ongoing under different kinetics at
ambient temperature 153.
Chapter 2 Scientific Background 23
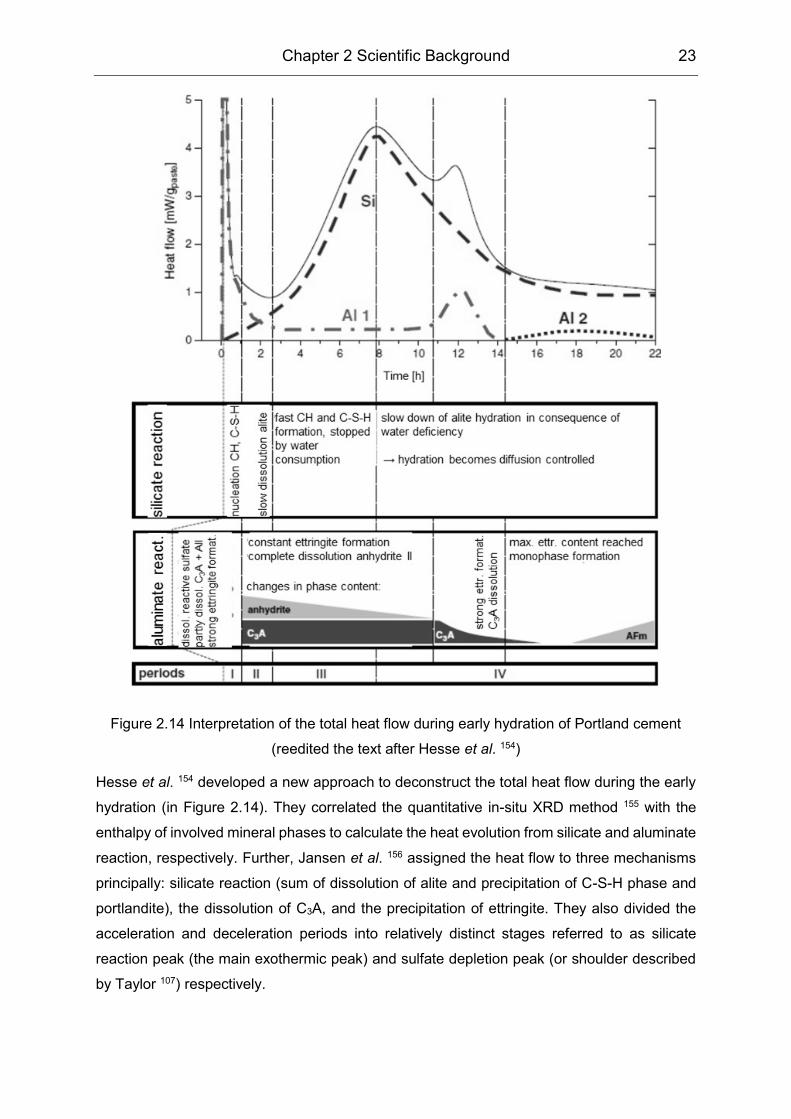
Figure 2.14 Interpretation of the total heat flow during early hydration of Portland cement
(reedited the text after Hesse et al. 154)
Hesse et al. 154 developed a new approach to deconstruct the total heat flow during the early
hydration (in Figure 2.14). They correlated the quantitative in-situ XRD method 155 with the
enthalpy of involved mineral phases to calculate the heat evolution from silicate and aluminate
reaction, respectively. Further, Jansen et al. 156 assigned the heat flow to three mechanisms
principally: silicate reaction (sum of dissolution of alite and precipitation of C-S-H phase and
portlandite), the dissolution of C3A, and the precipitation of ettringite. They also divided the
acceleration and deceleration periods into relatively distinct stages referred to as silicate
reaction peak (the main exothermic peak) and sulfate depletion peak (or shoulder described
by Taylor 107) respectively.
24 Chapter 2 Scientific Background
Upon contact with water, a series of rapid reactions 157 begins which involves mainly the clinker
interstitial phases (i.e. the aluminates and aluminoferrites, alkali sulphates, and free lime), plus
the calcium sulphates (gypsum, hemihydrate and / or anhydrite) which have been interground
with the cement. The aluminate phases (including the aluminoferrites in most cases) react
very rapidly and exothermically, giving a flush of calcium and aluminate ions into solution. In
the initial dissolution, protons are transferred from water molecules to the surface oxide
compound of C3S, accompanied by partially dissolution of Ca2+ and H2SiO42- 158.
Simultaneously, ettringite precipitates within seconds 159, showing a preferred location on the
clinker surface with an agglomeration tendency 160. The initial precipitation of ettringite could
be considered as the result of its low solubility product, which has been intensively investigated
by Matschei et al. 161 with the CaO-Al2O3-SiO2-CaSO4-CaCO3-H2O system. Following the first
rapid reaction, the slow-down of the hydration or induction period has been the subject of
considerable debate over the years with many proposed hypotheses 157. In a recent reviews
on the mechanism of cement hydration 152,153, two main hypotheses were discussed. The
metastable barrier, however, was suspected and challenged with recent simulation of
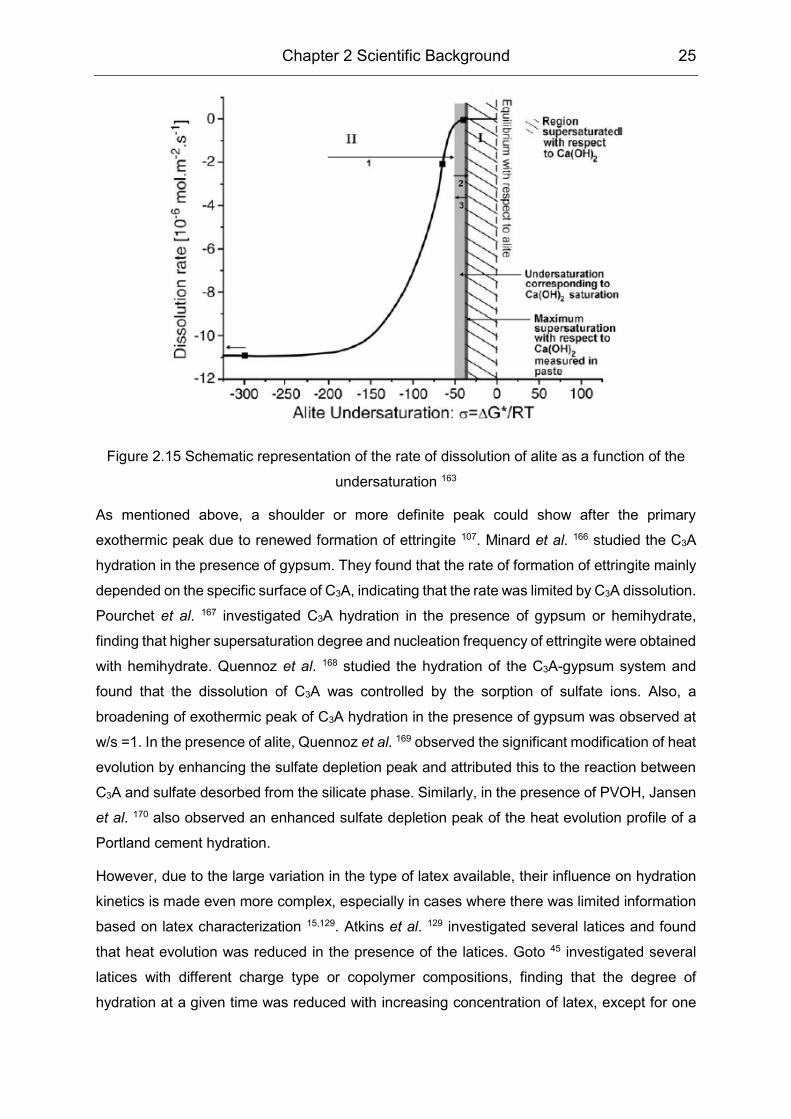
thermodynamics of C3S hydration 162. In contrast, dissolution theory applied to alite hydration
163 seems to be a promising interpretation for the driving mechanism. In this hypothesis, the
slow-down of alite dissolution rate was accounted for by the near equilibrium state, while the
rate-controlling process was highly related to undersaturation degree (shown in Figure 2.15).
Nicoleau et al. 163 developed a sophisticated experimental set-up to study the dissolution rate
of C3S and C2S and verified the hypothesis of dissolution theory proposed by Juilland et al.
163. Nevertheless, Gartner 164 questioned this hypothesis and stated that the difference
between the concentration of the solution when the dissolution rate slows down and the
equilibrium solubility of C3S calculated from bulk thermodynamics, is extremely large
compared to the difference seen in other minerals. Moreover, unlike simplified ions
concentration in C3S-lime system, the cement system is much more complex. Thus, Nicoleau
et al. 165 investigated the ion-specific effects on C3S dissolution and found that divalent Ca2+
and especially SO42- had a significant influence on surface charge and therefore the solubility.
Further, they found that the Si-O-Al covalent bond was formed in low alkaline conditions and
was stabilized by calcium ions in the coordination sphere of aluminum ions. Although the
mechanism causing the acceleration of hydration is still not agreed due to the simultaneous
occurrence of portlandite precipitation and C-S-H growth 153, it is generally accepted to be a
nucleation and growth mechanism 152. At the end of acceleration period, the primary peak is
achieved and the deceleration was considered to be related to the formation of hydration layer;
further reaction was controlled by diffusion 152.
Chapter 2 Scientific Background 25
Figure 2.15 Schematic representation of the rate of dissolution of alite as a function of the
undersaturation 163
As mentioned above, a shoulder or more definite peak could show after the primary
exothermic peak due to renewed formation of ettringite 107. Minard et al. 166 studied the C3A
hydration in the presence of gypsum. They found that the rate of formation of ettringite mainly
depended on the specific surface of C3A, indicating that the rate was limited by C3A dissolution.
Pourchet et al. 167 investigated C3A hydration in the presence of gypsum or hemihydrate,
finding that higher supersaturation degree and nucleation frequency of ettringite were obtained
with hemihydrate. Quennoz et al. 168 studied the hydration of the C3A-gypsum system and
found that the dissolution of C3A was controlled by the sorption of sulfate ions. Also, a
broadening of exothermic peak of C3A hydration in the presence of gypsum was observed at
w/s =1. In the presence of alite, Quennoz et al. 169 observed the significant modification of heat
evolution by enhancing the sulfate depletion peak and attributed this to the reaction between
C3A and sulfate desorbed from the silicate phase. Similarly, in the presence of PVOH, Jansen
et al. 170 also observed an enhanced sulfate depletion peak of the heat evolution profile of a
Portland cement hydration.
However, due to the large variation in the type of latex available, their influence on hydration
kinetics is made even more complex, especially in cases where there was limited information
based on latex characterization 15,129. Atkins et al. 129 investigated several latices and found
that heat evolution was reduced in the presence of the latices. Goto 45 investigated several
latices with different charge type or copolymer compositions, finding that the degree of
hydration at a given time was reduced with increasing concentration of latex, except for one
26 Chapter 2 Scientific Background
non-ionic VAE/Veova latex. Silva et al. 15 investigated the cement hydration in the presence
of EVA polymer powder in diluted suspensions by soft-XRD and found that the formation of
acicular ettringite was retarded for several hours.
2.4.3 Film formation in cement environment
In cement paste, electrolytes, high humidity and a charged surface can influence the film
formation to some extent 9,39,171. Gretz et al. 171 investigated the film formation of negatively
charged styrene acrylate latex in deionized water or synthetic cement pore solution and found
that the presence of electrolytes delayed the film formation and resulted in more fractured film.
Beeldens et al. 9 found that the relative humidity influenced the film formation of high Tg
polymer by direct relation with the drying rate. Gretz 39 also found that at low p/c ratios (~ 0.08),
no film formation was observed for, for which polymer adsorption on cement minerals should
be responsible.
Chapter 3
3 Materials and Methods
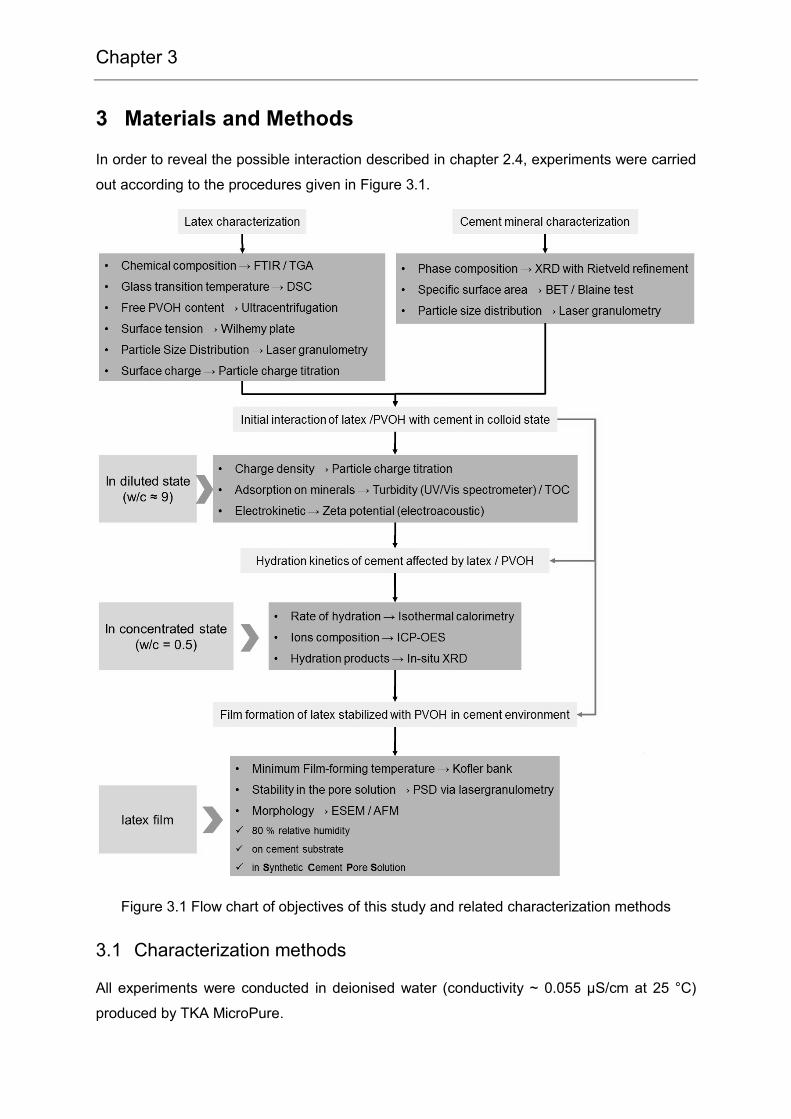
In order to reveal the possible interaction described in chapter 2.4, experiments were carried
out according to the procedures given in Figure 3.1.
Figure 3.1 Flow chart of objectives of this study and related characterization methods
3.1 Characterization methods
All experiments were conducted in deionised water (conductivity ~ 0.055 µS/cm at 25 °C)
produced by TKA MicroPure.
28 Chapter 3 Materials and Methods
3.1.1 Laser granulometry
Laser granulometry was conducted via Mastersizer 2000 from Malvern, in which the particle
sizes of range from 20 nm to 2000 μm could be measured. For latex, the dispersions were
diluted to 0.1 wt.-% by deionized water; for the cement or clinker phase, it was measured in
isopropanol as a medium, subjected to ultrasonic dispersion for 30 s. The particle size
distribution curve was calculated automatically by computer software based on the Mie
scattering theory.
3.1.2 Particle charge titration
The streaming potential of latices as a function of pH was determined by titration with either
0.1 mol/L HCl or NaOH to a 10 mL diluted latex dispersion (c = 0.1 wt.-%). Its dependence on
the cationic ion concentration was determined by titration with 0.1 mol/L NaCl, KCl and CaCl2
solution to a 10 mL diluted latex dispersion (c = 0.1 wt.-%), either in deionized water or in
alkaline solution (adjusted by NaOH solution to pH = 12.5) using Mütek PCD 03 from BTG
Instruments. The particle charge densities of the latices were determined by titratiing 15 mL
of 0.1 wt.-% polymer dispersions against 0.01 mol/L cationic PDADMAC
(polydiallyldimethylammonium chloride). This corresponds to a charge amount of 0.01 eq/L.
With the volumetric consumption of PDADMAC solution, which is needed to reach the
Isoelectric Point (IEP) of the streaming potential, the amount of charge can be calculated.
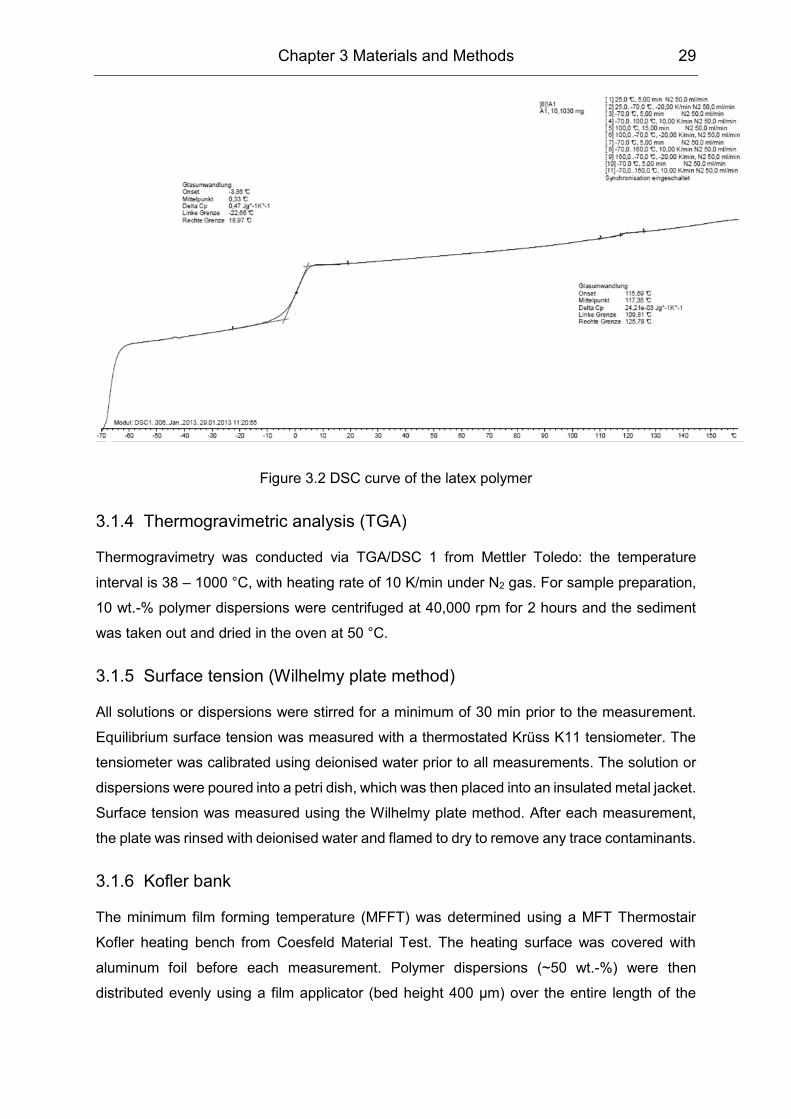
3.1.3 Differential scanning calorimetry (DSC)
To determine the glass transition temperature (Tg) of a latex polymer, aqueous polymer
dispersions were dropped on a clean stainless steel plate. For evaporation of the water, dry
film was transferred to a drying cabinet for at least 24 hours. Then, 10 mg of the sample was
cut and weighed in an aluminium pan with a pinhole lid. Sample measurement was conducted
by DSC 1 from Mettler-Toledo at a heating rate of 10 K/min from -70 to 160 °C. Tg was
determined from the second heating curve (shown in Figure 3.2). If no specification is given,
the Tg of the latex polymer is defined as the middle point of the transition zone.
Chapter 3 Materials and Methods 29
Figure 3.2 DSC curve of the latex polymer
3.1.4 Thermogravimetric analysis (TGA)
Thermogravimetry was conducted via TGA/DSC 1 from Mettler Toledo: the temperature
interval is 38 – 1000 °C, with heating rate of 10 K/min under N2 gas. For sample preparation,
10 wt.-% polymer dispersions were centrifuged at 40,000 rpm for 2 hours and the sediment
was taken out and dried in the oven at 50 °C.
3.1.5 Surface tension (Wilhelmy plate method)
All solutions or dispersions were stirred for a minimum of 30 min prior to the measurement.
Equilibrium surface tension was measured with a thermostated Krüss K11 tensiometer. The
tensiometer was calibrated using deionised water prior to all measurements. The solution or
dispersions were poured into a petri dish, which was then placed into an insulated metal jacket.
Surface tension was measured using the Wilhelmy plate method. After each measurement,
the plate was rinsed with deionised water and flamed to dry to remove any trace contaminants.
3.1.6 Kofler bank
The minimum film forming temperature (MFFT) was determined using a MFT Thermostair
Kofler heating bench from Coesfeld Material Test. The heating surface was covered with
aluminum foil before each measurement. Polymer dispersions (~50 wt.-%) were then
distributed evenly using a film applicator (bed height 400 µm) over the entire length of the
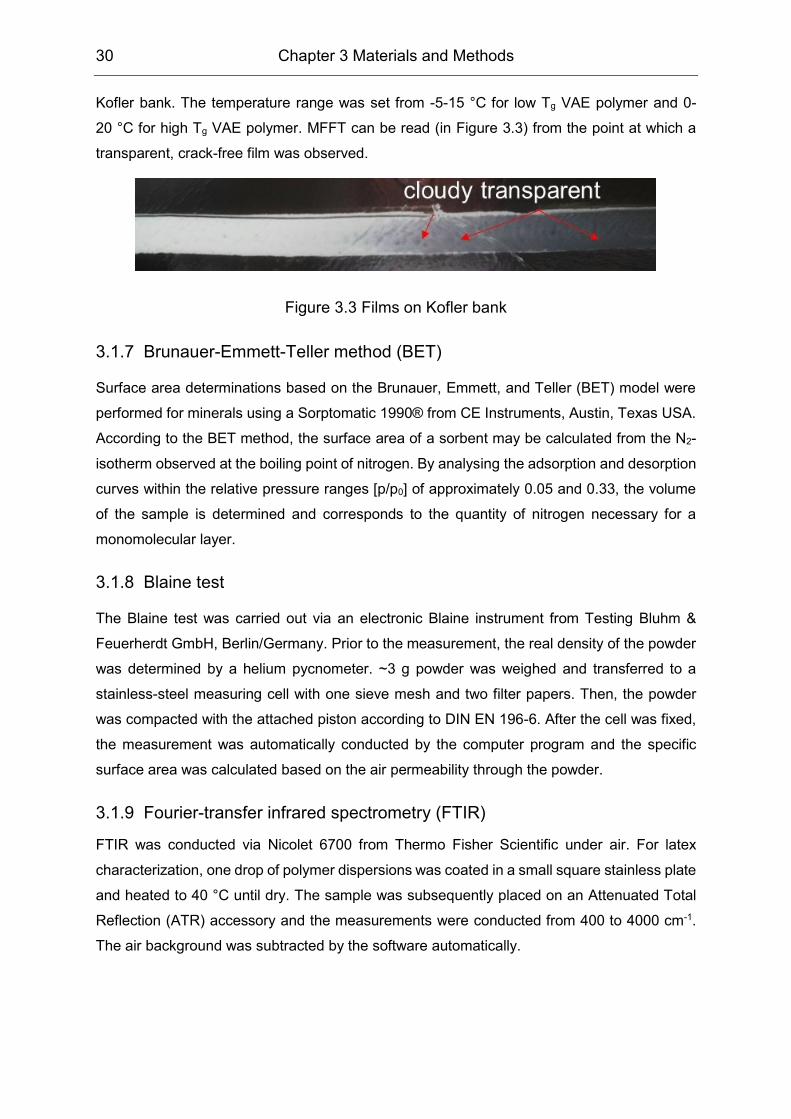
30 Chapter 3 Materials and Methods
Kofler bank. The temperature range was set from -5-15 °C for low Tg VAE polymer and 0-
20 °C for high Tg VAE polymer. MFFT can be read (in Figure 3.3) from the point at which a
transparent, crack-free film was observed.
Figure 3.3 Films on Kofler bank
3.1.7 Brunauer-Emmett-Teller method (BET)
Surface area determinations based on the Brunauer, Emmett, and Teller (BET) model were
performed for minerals using a Sorptomatic 1990® from CE Instruments, Austin, Texas USA.
According to the BET method, the surface area of a sorbent may be calculated from the N2-
isotherm observed at the boiling point of nitrogen. By analysing the adsorption and desorption
curves within the relative pressure ranges [p/p0] of approximately 0.05 and 0.33, the volume
of the sample is determined and corresponds to the quantity of nitrogen necessary for a
monomolecular layer.
3.1.8 Blaine test
The Blaine test was carried out via an electronic Blaine instrument from Testing Bluhm &
Feuerherdt GmbH, Berlin/Germany. Prior to the measurement, the real density of the powder
was determined by a helium pycnometer. ~3 g powder was weighed and transferred to a
stainless-steel measuring cell with one sieve mesh and two filter papers. Then, the powder
was compacted with the attached piston according to DIN EN 196-6. After the cell was fixed,
the measurement was automatically conducted by the computer program and the specific
surface area was calculated based on the air permeability through the powder.
3.1.9 Fourier-transfer infrared spectrometry (FTIR)
FTIR was conducted via Nicolet 6700 from Thermo Fisher Scientific under air. For latex
characterization, one drop of polymer dispersions was coated in a small square stainless plate
and heated to 40 °C until dry. The sample was subsequently placed on an Attenuated Total
Reflection (ATR) accessory and the measurements were conducted from 400 to 4000 cm-1.
The air background was subtracted by the software automatically.
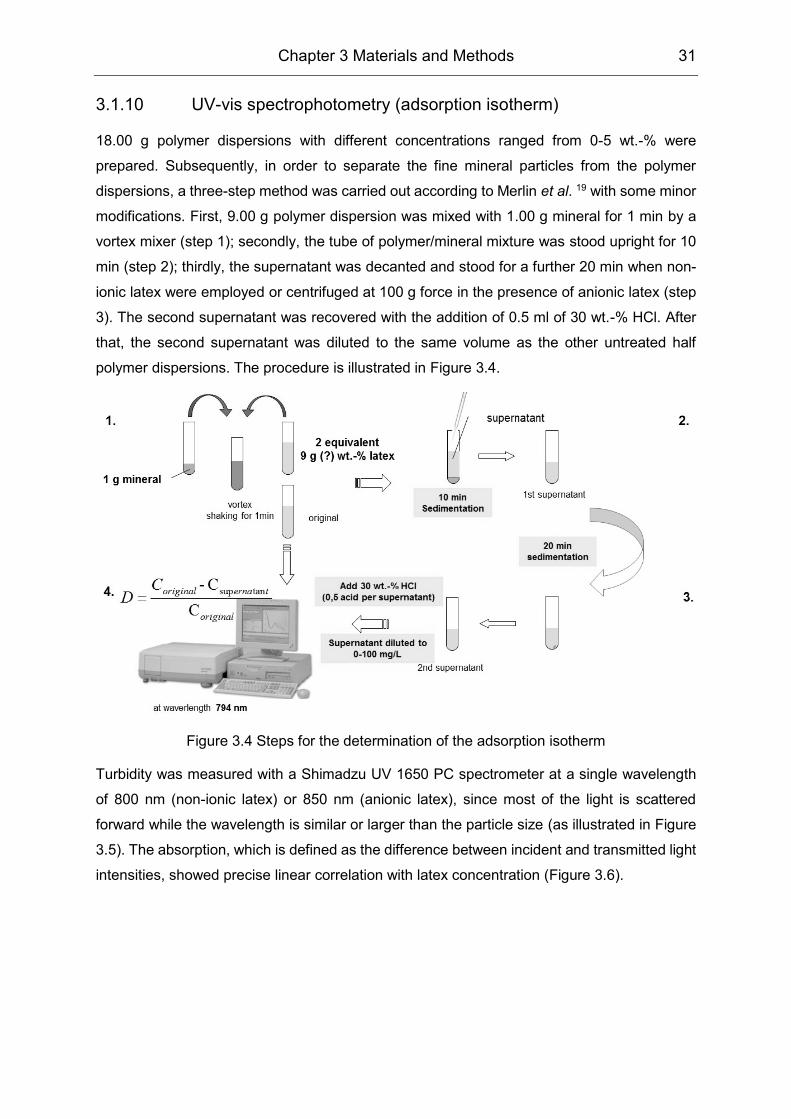
Chapter 3 Materials and Methods 31
3.1.10 UV-vis spectrophotometry (adsorption isotherm)
18.00 g polymer dispersions with different concentrations ranged from 0-5 wt.-% were
prepared. Subsequently, in order to separate the fine mineral particles from the polymer
dispersions, a three-step method was carried out according to Merlin et al. 19 with some minor
modifications. First, 9.00 g polymer dispersion was mixed with 1.00 g mineral for 1 min by a
vortex mixer (step 1); secondly, the tube of polymer/mineral mixture was stood upright for 10
min (step 2); thirdly, the supernatant was decanted and stood for a further 20 min when non-
ionic latex were employed or centrifuged at 100 g force in the presence of anionic latex (step
3). The second supernatant was recovered with the addition of 0.5 ml of 30 wt.-% HCl. After
that, the second supernatant was diluted to the same volume as the other untreated half
polymer dispersions. The procedure is illustrated in Figure 3.4.
Figure 3.4 Steps for the determination of the adsorption isotherm
Turbidity was measured with a Shimadzu UV 1650 PC spectrometer at a single wavelength
of 800 nm (non-ionic latex) or 850 nm (anionic latex), since most of the light is scattered
forward while the wavelength is similar or larger than the particle size (as illustrated in Figure
3.5). The absorption, which is defined as the difference between incident and transmitted light
intensities, showed precise linear correlation with latex concentration (Figure 3.6).

32 Chapter 3 Materials and Methods
Figure 3.5 Scattered light intensity as a function of latex concentration
Figure 3.6 Linear relationship between concentration and absorption
Finally, depletion was calculated directly based on the ratio between the value of the
supernatant and that of untreated polymer dispersions (step 4).
3.1.11 Total organic carbon (TOC) (adsorption isotherm)
PVOH adsorption was investigated only on the clinker phases. 2.7 g polymer solution with
different concentrations ranging from 0-0.20 wt.-% were prepared. Then, the solution was
mixed with 0.3 g mineral for 1 min and centrifuged for another 15 min at 3,000 g force. The
supernatant was extracted by a syringe and filtered with a 0.4 µm syringe filter. 20 µl of 30
wt.-% HCl was added to the filtrate and diluted to 20 ml. The final solution was measured by
TOC-L from Shimadzu. The filtrates, as well as known PVOH concentrations were also
measured for the calculation of PVOH depletion.
3.1.12 Zeta potential (electroacoustic method)
Unlike other techniques, Zeta potential determined by the electroacoustic method can be
measured at very high solid concentrations. In this study, the Zeta potential was measured
Chapter 3 Materials and Methods 33
using DT310 from Dispersion Technology. The Zeta potential was calculated from the colloidal
vibration current (CVI) that was induced by ultrasound propagation through the suspension.
The principle of this method as well as its applications were described in detail elsewhere 172.
Though this method is able to measure high solid ratio specimen, high water/cement ratio
suspensions were performed in accordance with adsorption protocol.
The actual ratio between cement and polymer dispersions was equal to 9. Polymer
concentrations ranged from 0-1 wt.-%. Regarding the high ionic background of cement
suspensions, filtration via a Buchner funnel was measured to subtract the background (i.e.
ionic vibration current) from the CVI. The Zeta potential was calculated by the software based
on the recorded electric signal.
3.1.13 Isothermal calorimetry
10 g cement was filled into 10 mL plastic vials, mixed with the specific amount of diluted latex
or PVOH at a w/c ratio of 0.5. It was homogenized for 1 min by vortex vibration and the fresh
sample was placed into the isothermal calorimeter from C3 Prozess und Analysentechnik
GmbH, Haar/Germany. The temperature was set to 20 °C. Heat flow data logging was
recorded for 48 hours with an interval of 30 s.
3.1.14 ICP-AES (for ions concentration)
ICP-AES, also referred to as Inductively Coupled Plasma Optical Emission Spectrometry (ICP-
OES) was employed to analyze the ions’ composition in cement pore solution. Solution
samples were measured via Spectro ciros vision from SPECTRO Analytical Instruments
GmbH.
Latex or PVOH was firstly diluted to achieve a w/c ratio of 0.5. The polymer dispersions or
solutions were mixed with 40 g cement manually for 1 min. The pore fluid was extracted at
different intervals by vacuum filtration using qualitative filter paper (pore size of 4-7 µm) and
the pHs of the extracts were measured immediately. The fluid was further filtered by a 0.22
µm PVDF syringe membrane and acidified to pH ~ 2 with 30 wt.-% HCl. The whole procedure
is illustrated in Figure 3.7. The clear solution was stored in sealed 50 ml plastic tubes and put
into a refrigerator (~ 3~5 °C) until analysis. For Ca, S, Na, K elemental analysis, further dilution
of a factor of 20 was applied to keep the concentration of those elements below 200 mg/L (20
mg/L for Ca).
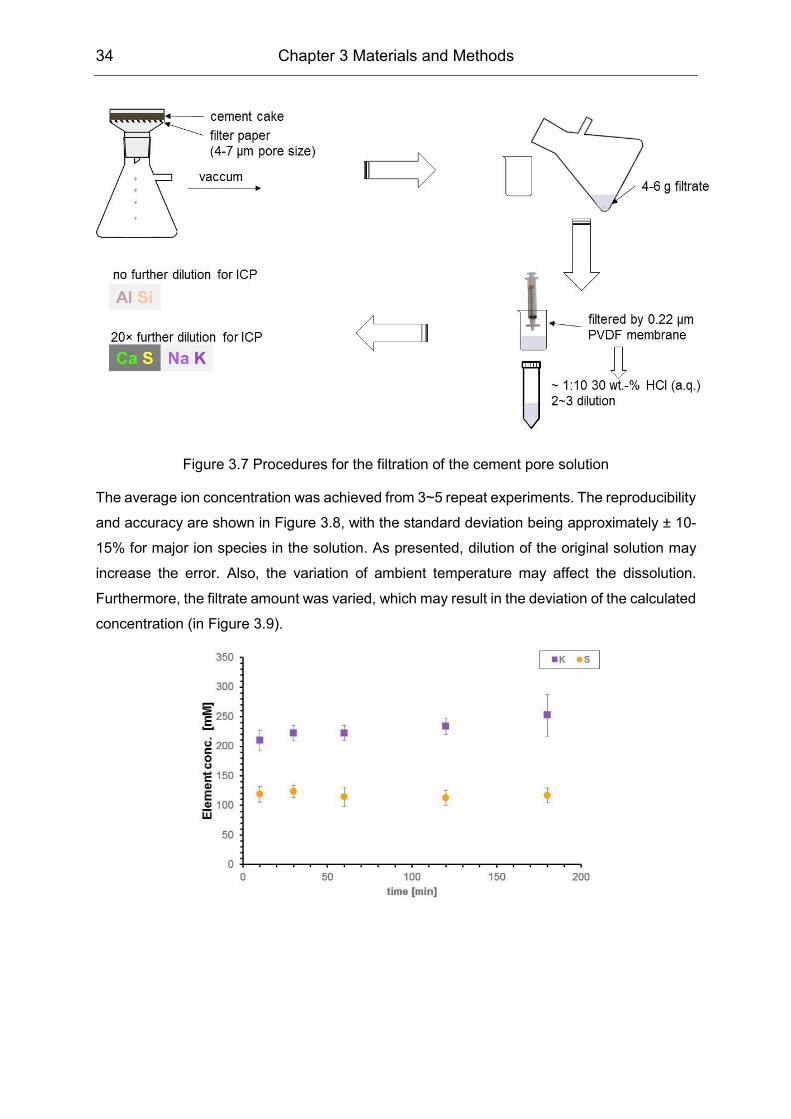
34 Chapter 3 Materials and Methods
Figure 3.7 Procedures for the filtration of the cement pore solution
The average ion concentration was achieved from 3~5 repeat experiments. The reproducibility
and accuracy are shown in Figure 3.8, with the standard deviation being approximately ± 10-
15% for major ion species in the solution. As presented, dilution of the original solution may
increase the error. Also, the variation of ambient temperature may affect the dissolution.
Furthermore, the filtrate amount was varied, which may result in the deviation of the calculated
concentration (in Figure 3.9).
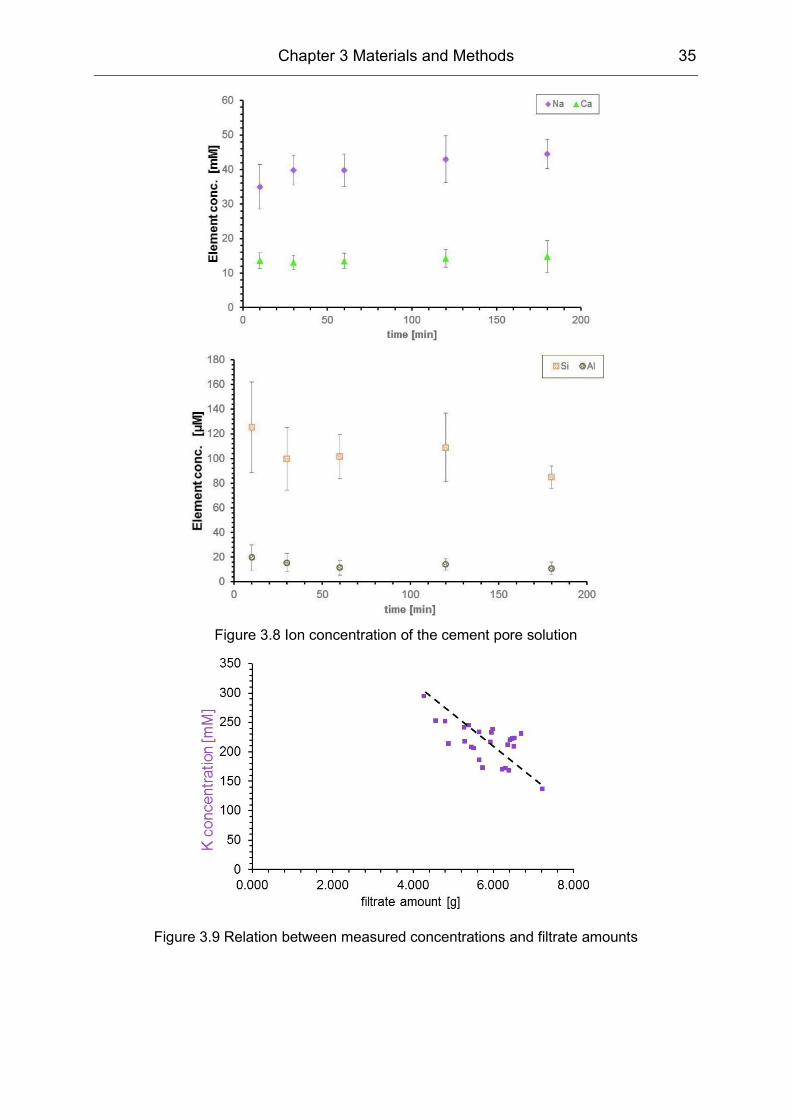
Chapter 3 Materials and Methods 35
Figure 3.8 Ion concentration of the cement pore solution
Figure 3.9 Relation between measured concentrations and filtrate amounts

36 Chapter 3 Materials and Methods
3.1.15 X-ray diffraction (XRD)
Cement powder was measured at room temperature on a Bruker AXS D8 instrument, utilizing
a Bragg-Bretano geometry. Step size was set to 0.017 ° 2θ and accumulated time per step of
29.8 s. The X-ray tube (Cu Kα) operated at a voltage of 45 kV and a current of 40 mA. A nickel
filter was setup for the incident beams, and an aperture slit of 0.5° was utilized. The scan
range was set from 6-70° 2θ. Rietveld refinement of the X-ray diffractogram was analyzed by
using the TOPAS 4.0 software.
For the cement paste, in-situ XRD measurement was conducted via PANalytical Empyrean
with an interval of 15 min for 24 hours, 2θ degree ranged from 5-65° at a voltage of 40 kV and
a current of 40 mA. Samples were prepared at a w/c of 0.5 by vortex vibration for 1 min. The
fresh sample was covered by a Kapton™ film to inhibit water evaporation and the sample
holder was connected to a Peltier stage to keep the ambient temperature at 20 °C.
3.1.16 Environmental scanning electron microscopy (ESEM)
For wet samples, 20 μL of the sample was deposited on a concave Al disk sample holder. For
observation of microstructure of the latex film, the sample was transferred into a Quanta 200
F (FEI, Eindhoven/Netherlands) ESEM equipped with a peltier cooling stage and a gaseous
secondary electron detector. The Al disk was placed on the cooling stage in the chamber at <
-2 °C. A gentle pump-down sequence was performed automatically by the software to prevent
water evaporation while reducing the chamber pressure. Once the water vapor purging cycle
was completed, a water vapor pressure of 6.5 – 7.5 mbar was set for wet samples. To allow
high resolution imaging, the pressure was lowered to dehydrate the surface layer for a very
short time. Wet samples were investigated under water vapor pressure from 3.0-5.0 mbar.
Imaging was carried out at accelerating voltages of 20.0 kV, and at working distances of 6-8
mm. To minimize the influence of the electron beam, the imaging area was shifted ~ 20 µm
from the focus area.
For dry samples, small pieces were cut from long side of the dry film and fixed to the Al disk
sample holder by adhesive tabs. Then, the reduced water vapour pressure condition (1.0 to
2.0 mbar) was applied. Imaging was carried out at accelerating voltages of 10.0 kV, and at
working distances of 8-11 mm.
3.1.17 Atomic force microscopy (AFM)
AFM images were obtained in ScanAsyst™ mode using a Dimension Icon from Bruker,
Billerica, MA/USA. This ScanAsyst™ mode is based on PeakForce™ tapping mode but with
advanced algorithms to monitor image quality and to make the appropriate parameter
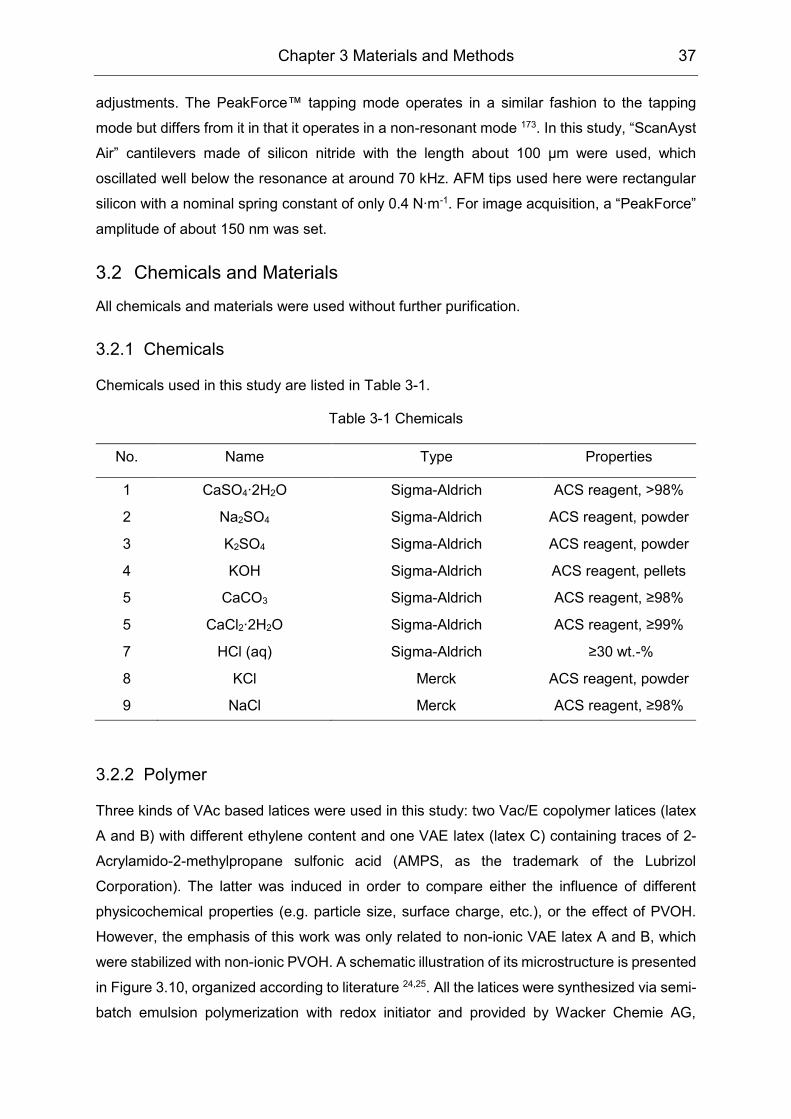
Chapter 3 Materials and Methods 37
adjustments. The PeakForce™ tapping mode operates in a similar fashion to the tapping
mode but differs from it in that it operates in a non-resonant mode 173. In this study, “ScanAyst
Air” cantilevers made of silicon nitride with the length about 100 µm were used, which
oscillated well below the resonance at around 70 kHz. AFM tips used here were rectangular
silicon with a nominal spring constant of only 0.4 N∙m-1. For image acquisition, a “PeakForce”
amplitude of about 150 nm was set.
3.2 Chemicals and Materials
All chemicals and materials were used without further purification.
3.2.1 Chemicals
Chemicals used in this study are listed in Table 3-1.
Table 3-1 Chemicals
No. Name Type Properties
1 CaSO4∙2H2O Sigma-Aldrich ACS reagent, >98%
2 Na2SO4 Sigma-Aldrich ACS reagent, powder
3 K2SO4 Sigma-Aldrich ACS reagent, powder
4 KOH Sigma-Aldrich ACS reagent, pellets
5 CaCO3 Sigma-Aldrich ACS reagent, ≥98%
5 CaCl2∙2H2O Sigma-Aldrich ACS reagent, ≥99%
7 HCl (aq) Sigma-Aldrich ≥30 wt.-%
8 KCl Merck ACS reagent, powder
9 NaCl Merck ACS reagent, ≥98%
3.2.2 Polymer
Three kinds of VAc based latices were used in this study: two Vac/E copolymer latices (latex
A and B) with different ethylene content and one VAE latex (latex C) containing traces of 2-
Acrylamido-2-methylpropane sulfonic acid (AMPS, as the trademark of the Lubrizol
Corporation). The latter was induced in order to compare either the influence of different
physicochemical properties (e.g. particle size, surface charge, etc.), or the effect of PVOH.
However, the emphasis of this work was only related to non-ionic VAE latex A and B, which
were stabilized with non-ionic PVOH. A schematic illustration of its microstructure is presented
in Figure 3.10, organized according to literature 24,25. All the latices were synthesized via semi-
batch emulsion polymerization with redox initiator and provided by Wacker Chemie AG,
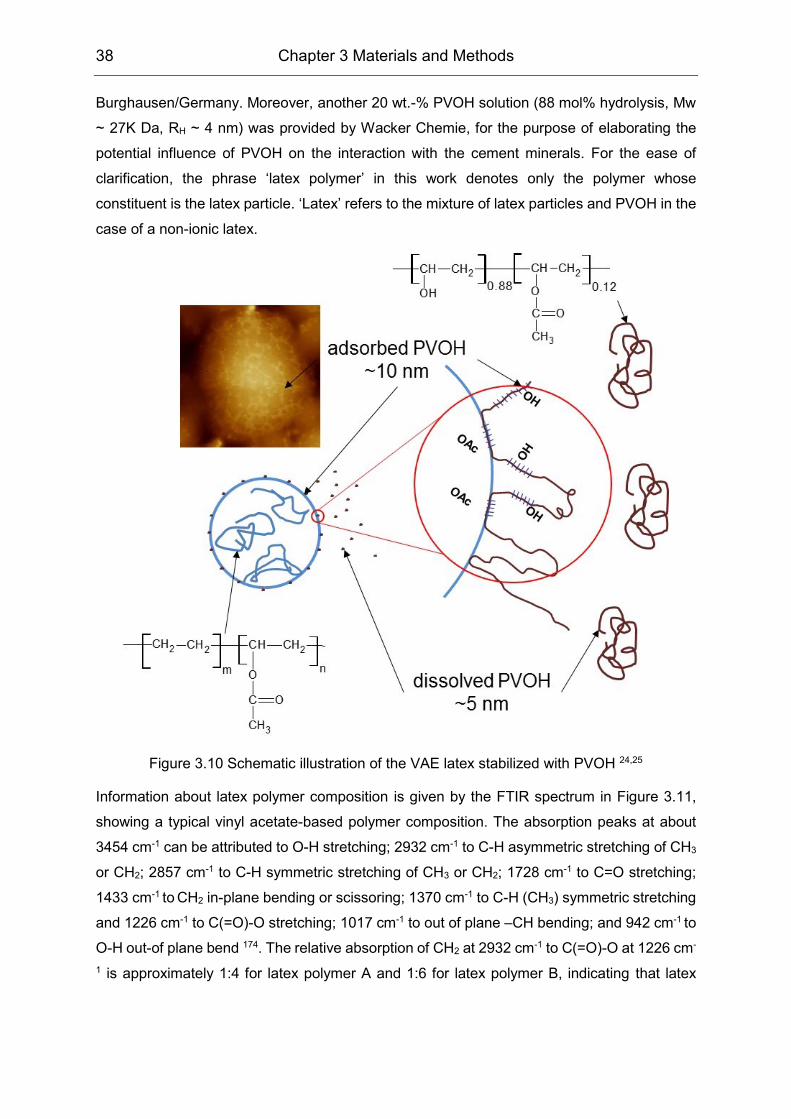
38 Chapter 3 Materials and Methods
Burghausen/Germany. Moreover, another 20 wt.-% PVOH solution (88 mol% hydrolysis, Mw
~ 27K Da, RH ~ 4 nm) was provided by Wacker Chemie, for the purpose of elaborating the
potential influence of PVOH on the interaction with the cement minerals. For the ease of
clarification, the phrase ‘latex polymer’ in this work denotes only the polymer whose
constituent is the latex particle. ‘Latex’ refers to the mixture of latex particles and PVOH in the
case of a non-ionic latex.
Figure 3.10 Schematic illustration of the VAE latex stabilized with PVOH 24,25
Information about latex polymer composition is given by the FTIR spectrum in Figure 3.11,
showing a typical vinyl acetate-based polymer composition. The absorption peaks at about
3454 cm-1 can be attributed to O-H stretching; 2932 cm-1 to C-H asymmetric stretching of CH3
or CH2; 2857 cm-1 to C-H symmetric stretching of CH3 or CH2; 1728 cm-1 to C=O stretching;
1433 cm-1 to CH2 in-plane bending or scissoring; 1370 cm-1 to C-H (CH3) symmetric stretching
and 1226 cm-1 to C(=O)-O stretching; 1017 cm-1 to out of plane –CH bending; and 942 cm-1 to
O-H out-of plane bend 174. The relative absorption of CH2 at 2932 cm-1 to C(=O)-O at 1226 cm-
1 is approximately 1:4 for latex polymer A and 1:6 for latex polymer B, indicating that latex
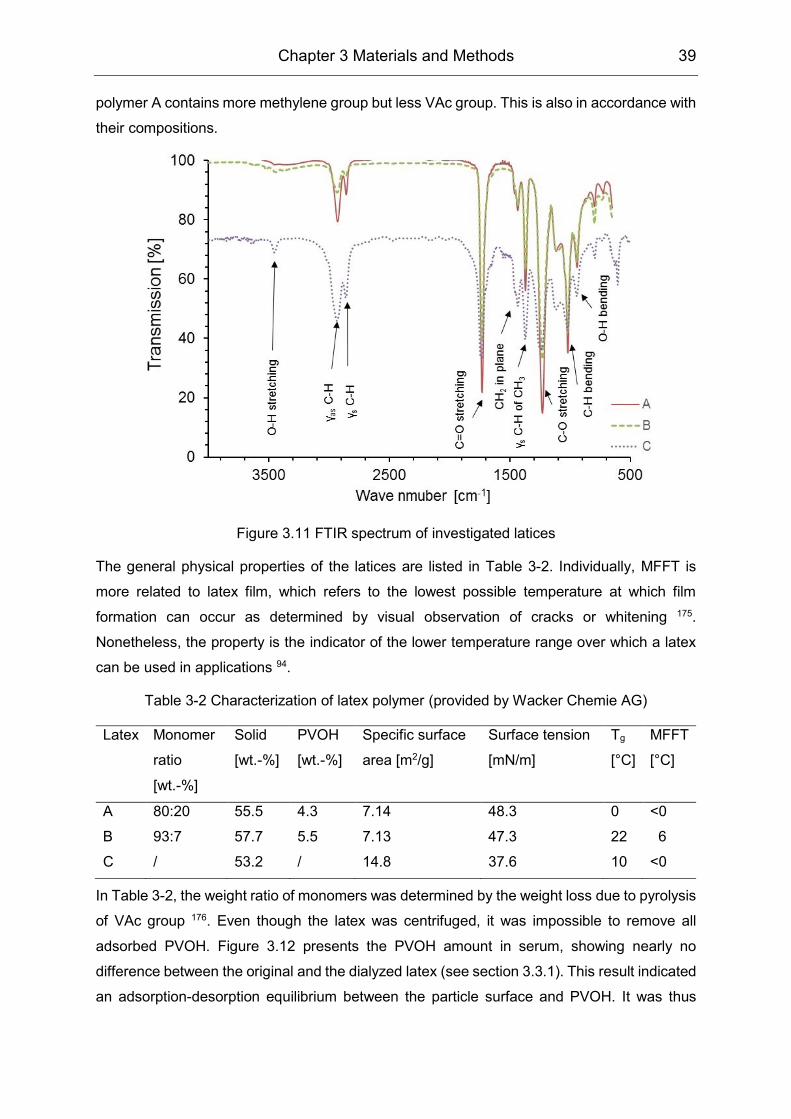
Chapter 3 Materials and Methods 39
polymer A contains more methylene group but less VAc group. This is also in accordance with
their compositions.
Figure 3.11 FTIR spectrum of investigated latices
The general physical properties of the latices are listed in Table 3-2. Individually, MFFT is
more related to latex film, which refers to the lowest possible temperature at which film
formation can occur as determined by visual observation of cracks or whitening 175.
Nonetheless, the property is the indicator of the lower temperature range over which a latex
can be used in applications 94.
Table 3-2 Characterization of latex polymer (provided by Wacker Chemie AG)
Latex Monomer
ratio
[wt.-%]
Solid
[wt.-%]
PVOH
[wt.-%]
Specific surface
area [m2/g]
Surface tension
[mN/m]
Tg
[°C]
MFFT
[°C]
A 80:20 55.5 4.3 7.14 48.3 0 <0
B 93:7 57.7 5.5 7.13 47.3 22 6
C / 53.2 / 14.8 37.6 10 <0
In Table 3-2, the weight ratio of monomers was determined by the weight loss due to pyrolysis
of VAc group 176. Even though the latex was centrifuged, it was impossible to remove all
adsorbed PVOH. Figure 3.12 presents the PVOH amount in serum, showing nearly no
difference between the original and the dialyzed latex (see section 3.3.1). This result indicated
an adsorption-desorption equilibrium between the particle surface and PVOH. It was thus
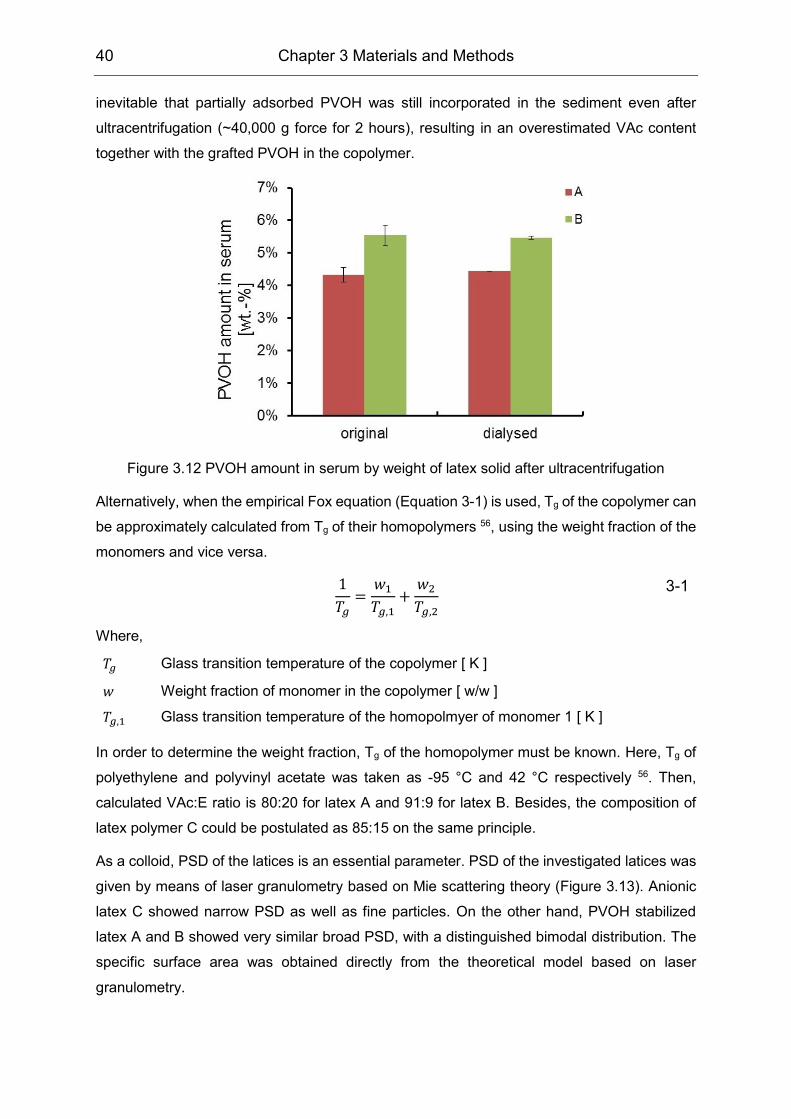
40 Chapter 3 Materials and Methods
inevitable that partially adsorbed PVOH was still incorporated in the sediment even after
ultracentrifugation (~40,000 g force for 2 hours), resulting in an overestimated VAc content
together with the grafted PVOH in the copolymer.
Figure 3.12 PVOH amount in serum by weight of latex solid after ultracentrifugation
Alternatively, when the empirical Fox equation (Equation 3-1) is used, Tg of the copolymer can
be approximately calculated from Tg of their homopolymers 56, using the weight fraction of the
monomers and vice versa.
1
𝑇𝑔=
𝑤1
𝑇𝑔,1+
𝑤2
𝑇𝑔,2
3-1
Where, Whe
𝑇𝑔 Glass transition temperature of the copolymer [ K ]
𝑤 Weight fraction of monomer in the copolymer [ w/w ]
𝑇𝑔,1 Glass transition temperature of the homopolmyer of monomer 1 [ K ]
In order to determine the weight fraction, Tg of the homopolymer must be known. Here, Tg of
polyethylene and polyvinyl acetate was taken as -95 °C and 42 °C respectively 56. Then,
calculated VAc:E ratio is 80:20 for latex A and 91:9 for latex B. Besides, the composition of
latex polymer C could be postulated as 85:15 on the same principle.
As a colloid, PSD of the latices is an essential parameter. PSD of the investigated latices was
given by means of laser granulometry based on Mie scattering theory (Figure 3.13). Anionic
latex C showed narrow PSD as well as fine particles. On the other hand, PVOH stabilized
latex A and B showed very similar broad PSD, with a distinguished bimodal distribution. The
specific surface area was obtained directly from the theoretical model based on laser
granulometry.
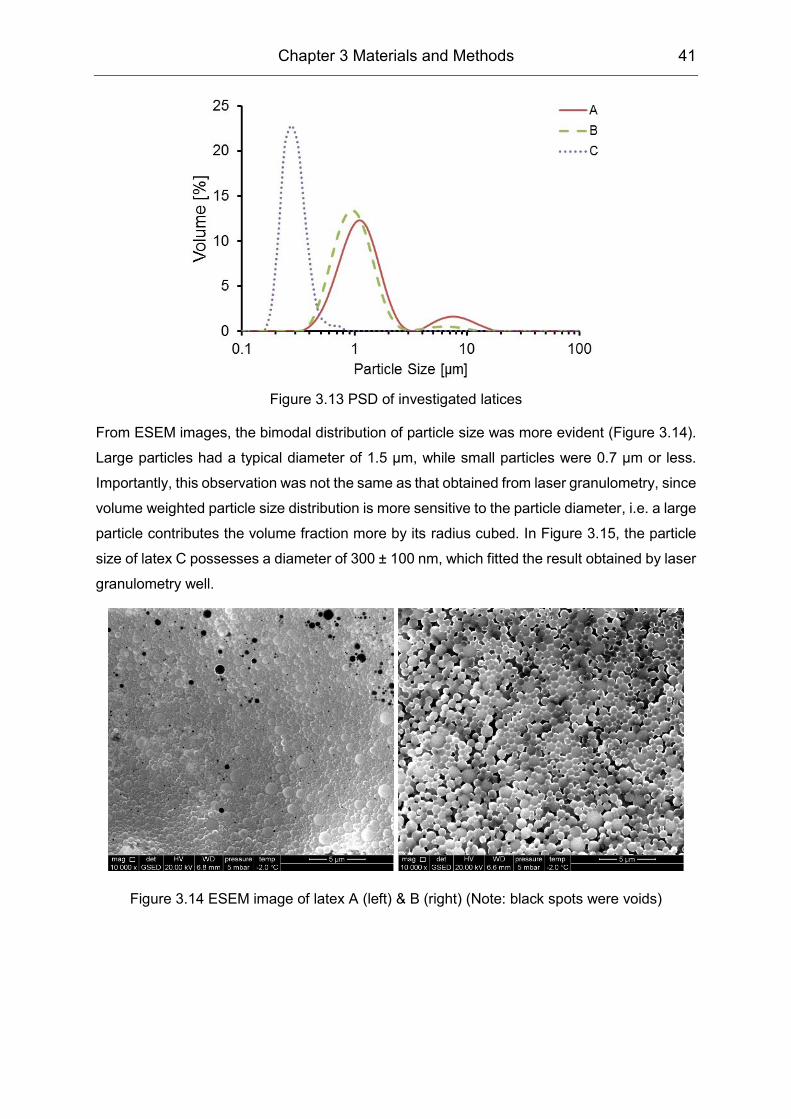
Chapter 3 Materials and Methods 41
Figure 3.13 PSD of investigated latices
From ESEM images, the bimodal distribution of particle size was more evident (Figure 3.14).
Large particles had a typical diameter of 1.5 µm, while small particles were 0.7 µm or less.
Importantly, this observation was not the same as that obtained from laser granulometry, since
volume weighted particle size distribution is more sensitive to the particle diameter, i.e. a large
particle contributes the volume fraction more by its radius cubed. In Figure 3.15, the particle
size of latex C possesses a diameter of 300 ± 100 nm, which fitted the result obtained by laser
granulometry well.
Figure 3.14 ESEM image of latex A (left) & B (right) (Note: black spots were voids)
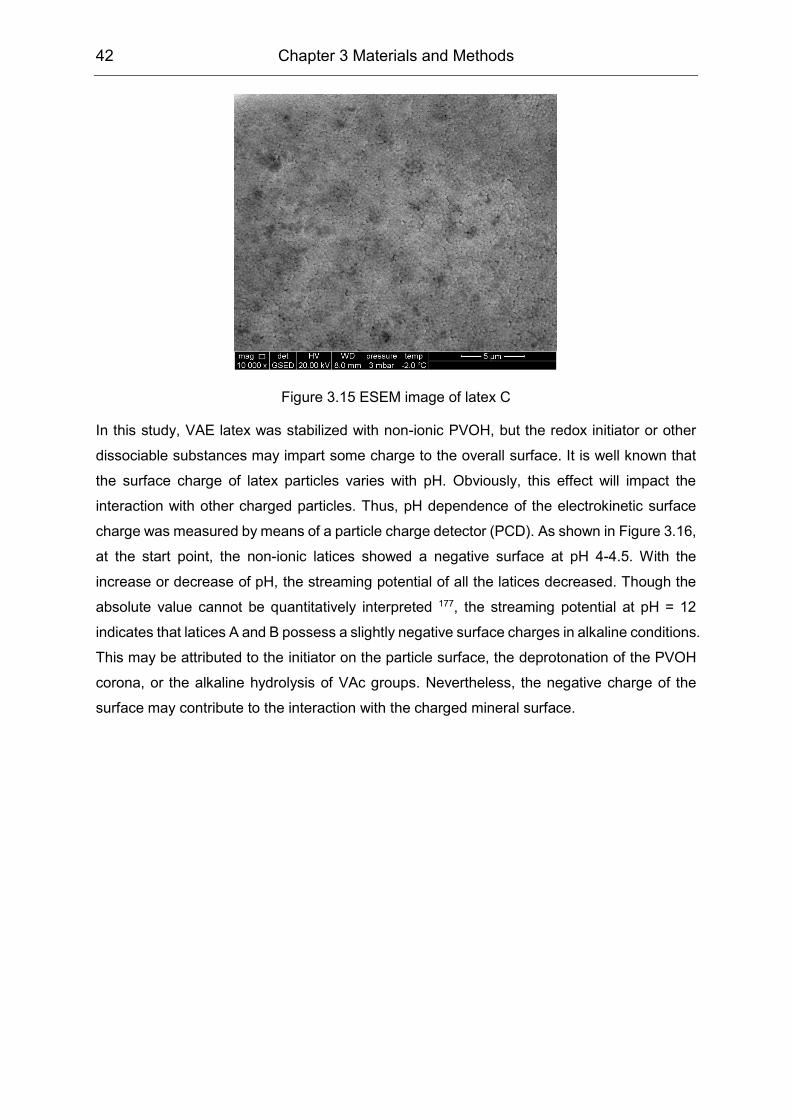
42 Chapter 3 Materials and Methods
Figure 3.15 ESEM image of latex C
In this study, VAE latex was stabilized with non-ionic PVOH, but the redox initiator or other
dissociable substances may impart some charge to the overall surface. It is well known that
the surface charge of latex particles varies with pH. Obviously, this effect will impact the
interaction with other charged particles. Thus, pH dependence of the electrokinetic surface
charge was measured by means of a particle charge detector (PCD). As shown in Figure 3.16,
at the start point, the non-ionic latices showed a negative surface at pH 4-4.5. With the
increase or decrease of pH, the streaming potential of all the latices decreased. Though the
absolute value cannot be quantitatively interpreted 177, the streaming potential at pH = 12
indicates that latices A and B possess a slightly negative surface charges in alkaline conditions.
This may be attributed to the initiator on the particle surface, the deprotonation of the PVOH
corona, or the alkaline hydrolysis of VAc groups. Nevertheless, the negative charge of the
surface may contribute to the interaction with the charged mineral surface.
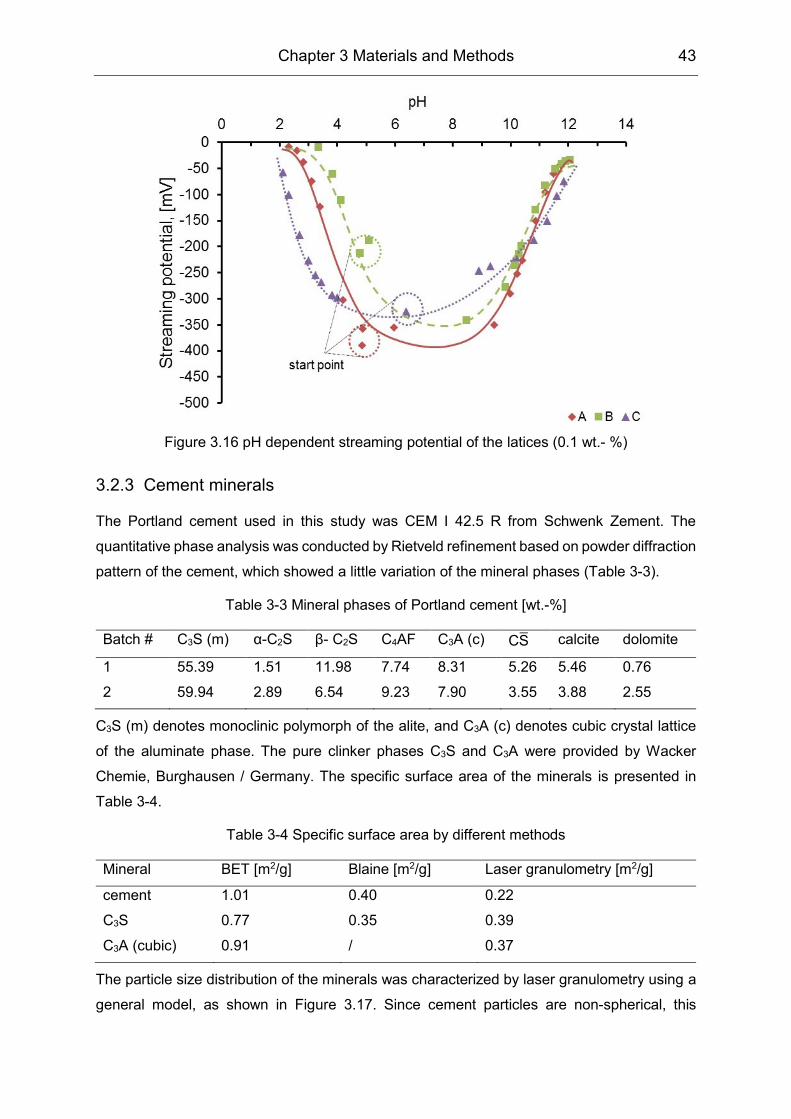
Chapter 3 Materials and Methods 43
Figure 3.16 pH dependent streaming potential of the latices (0.1 wt.- %)
3.2.3 Cement minerals
The Portland cement used in this study was CEM I 42.5 R from Schwenk Zement. The
quantitative phase analysis was conducted by Rietveld refinement based on powder diffraction
pattern of the cement, which showed a little variation of the mineral phases (Table 3-3).
Table 3-3 Mineral phases of Portland cement [wt.-%]
Batch # C3S (m) α-C2S β- C2S C4AF C3A (c) CS̅ calcite dolomite
1 55.39 1.51 11.98 7.74 8.31 5.26 5.46 0.76
2 59.94 2.89 6.54 9.23 7.90 3.55 3.88 2.55
C3S (m) denotes monoclinic polymorph of the alite, and C3A (c) denotes cubic crystal lattice
of the aluminate phase. The pure clinker phases C3S and C3A were provided by Wacker
Chemie, Burghausen / Germany. The specific surface area of the minerals is presented in
Table 3-4.
Table 3-4 Specific surface area by different methods
Mineral BET [m2/g] Blaine [m2/g] Laser granulometry [m2/g]
cement 1.01 0.40 0.22
C3S 0.77 0.35 0.39
C3A (cubic) 0.91 / 0.37
The particle size distribution of the minerals was characterized by laser granulometry using a
general model, as shown in Figure 3.17. Since cement particles are non-spherical, this
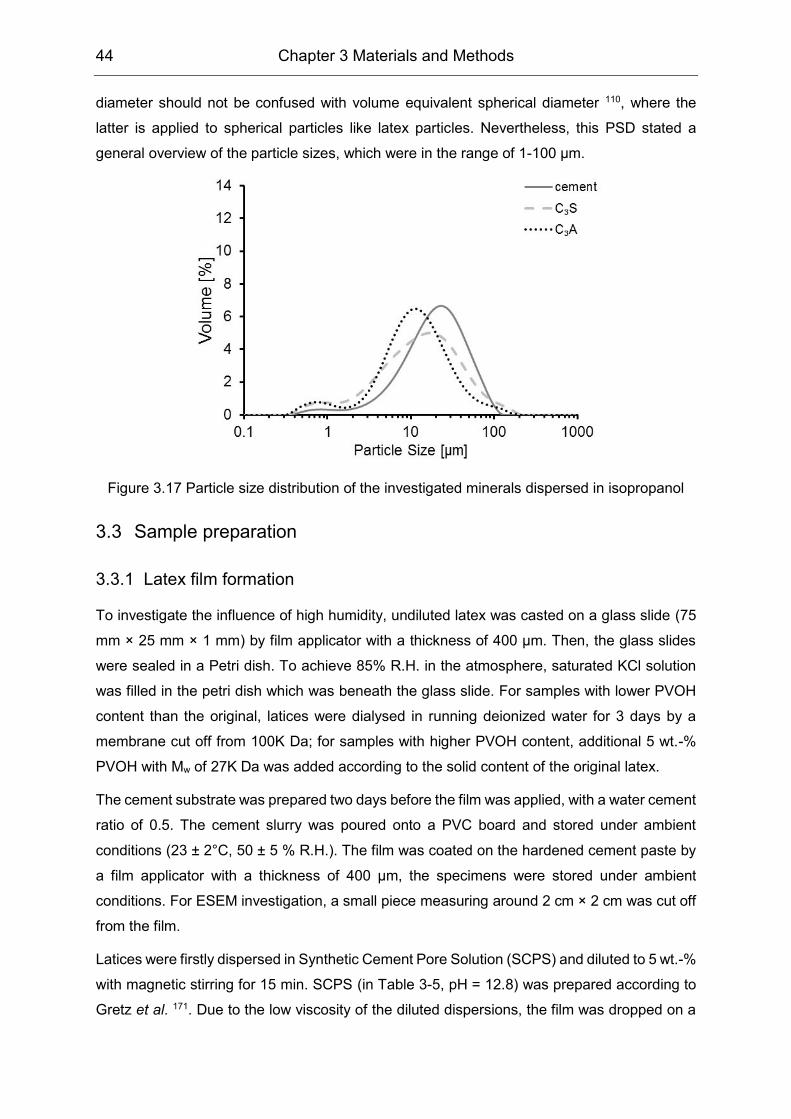
44 Chapter 3 Materials and Methods
diameter should not be confused with volume equivalent spherical diameter 110, where the
latter is applied to spherical particles like latex particles. Nevertheless, this PSD stated a
general overview of the particle sizes, which were in the range of 1-100 µm.
Figure 3.17 Particle size distribution of the investigated minerals dispersed in isopropanol
3.3 Sample preparation
3.3.1 Latex film formation
To investigate the influence of high humidity, undiluted latex was casted on a glass slide (75
mm × 25 mm × 1 mm) by film applicator with a thickness of 400 µm. Then, the glass slides
were sealed in a Petri dish. To achieve 85% R.H. in the atmosphere, saturated KCl solution
was filled in the petri dish which was beneath the glass slide. For samples with lower PVOH
content than the original, latices were dialysed in running deionized water for 3 days by a
membrane cut off from 100K Da; for samples with higher PVOH content, additional 5 wt.-%
PVOH with Mw of 27K Da was added according to the solid content of the original latex.
The cement substrate was prepared two days before the film was applied, with a water cement
ratio of 0.5. The cement slurry was poured onto a PVC board and stored under ambient
conditions (23 ± 2°C, 50 ± 5 % R.H.). The film was coated on the hardened cement paste by
a film applicator with a thickness of 400 µm, the specimens were stored under ambient
conditions. For ESEM investigation, a small piece measuring around 2 cm × 2 cm was cut off
from the film.
Latices were firstly dispersed in Synthetic Cement Pore Solution (SCPS) and diluted to 5 wt.-%
with magnetic stirring for 15 min. SCPS (in Table 3-5, pH = 12.8) was prepared according to
Gretz et al. 171. Due to the low viscosity of the diluted dispersions, the film was dropped on a
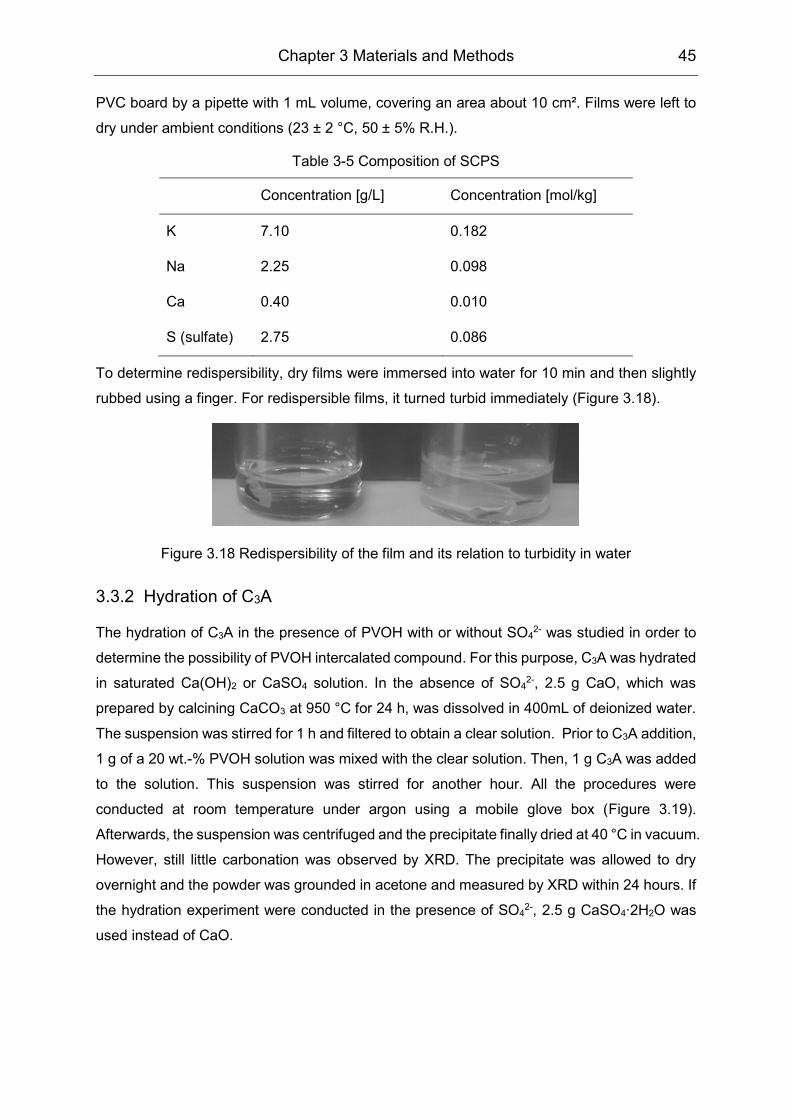
Chapter 3 Materials and Methods 45
PVC board by a pipette with 1 mL volume, covering an area about 10 cm². Films were left to
dry under ambient conditions (23 ± 2 °C, 50 ± 5% R.H.).
Table 3-5 Composition of SCPS
Concentration [g/L] Concentration [mol/kg]
K 7.10 0.182
Na 2.25 0.098
Ca 0.40 0.010
S (sulfate) 2.75 0.086
To determine redispersibility, dry films were immersed into water for 10 min and then slightly
rubbed using a finger. For redispersible films, it turned turbid immediately (Figure 3.18).
Figure 3.18 Redispersibility of the film and its relation to turbidity in water
3.3.2 Hydration of C3A
The hydration of C3A in the presence of PVOH with or without SO42- was studied in order to
determine the possibility of PVOH intercalated compound. For this purpose, C3A was hydrated
in saturated Ca(OH)2 or CaSO4 solution. In the absence of SO42-, 2.5 g CaO, which was
prepared by calcining CaCO3 at 950 °C for 24 h, was dissolved in 400mL of deionized water.
The suspension was stirred for 1 h and filtered to obtain a clear solution. Prior to C3A addition,
1 g of a 20 wt.-% PVOH solution was mixed with the clear solution. Then, 1 g C3A was added
to the solution. This suspension was stirred for another hour. All the procedures were
conducted at room temperature under argon using a mobile glove box (Figure 3.19).
Afterwards, the suspension was centrifuged and the precipitate finally dried at 40 °C in vacuum.
However, still little carbonation was observed by XRD. The precipitate was allowed to dry
overnight and the powder was grounded in acetone and measured by XRD within 24 hours. If
the hydration experiment were conducted in the presence of SO42-, 2.5 g CaSO4∙2H2O was
used instead of CaO.
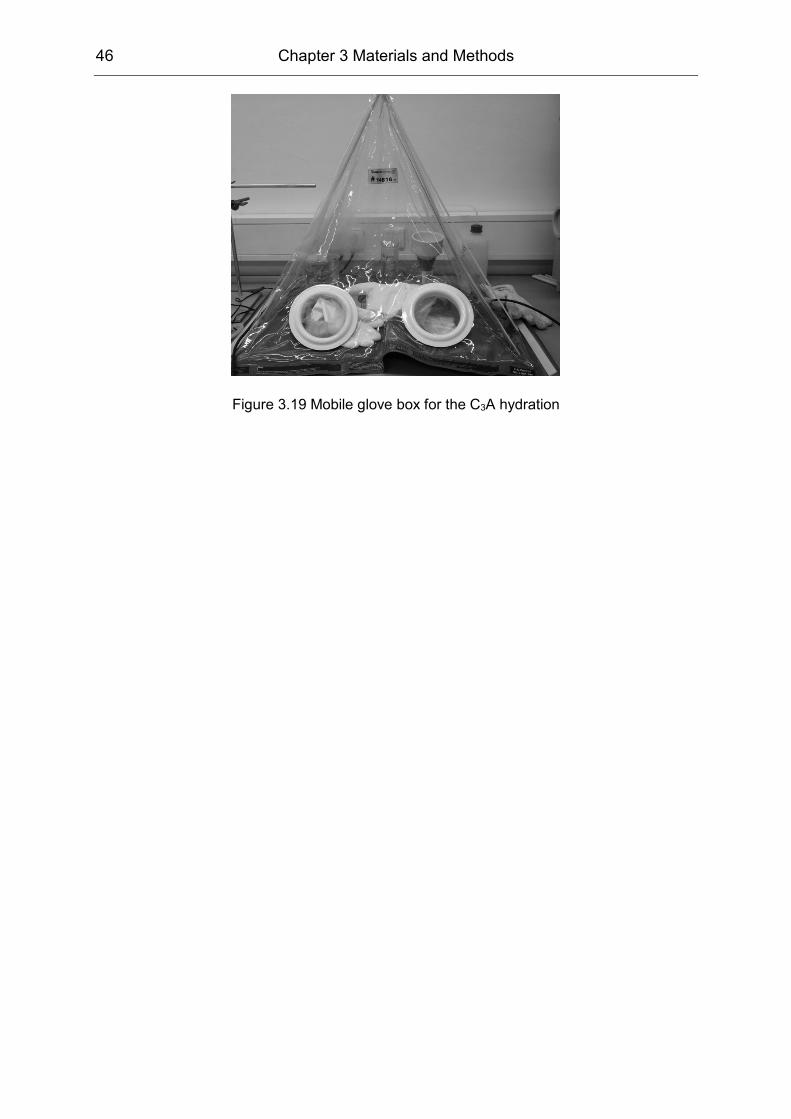
46 Chapter 3 Materials and Methods
Figure 3.19 Mobile glove box for the C3A hydration
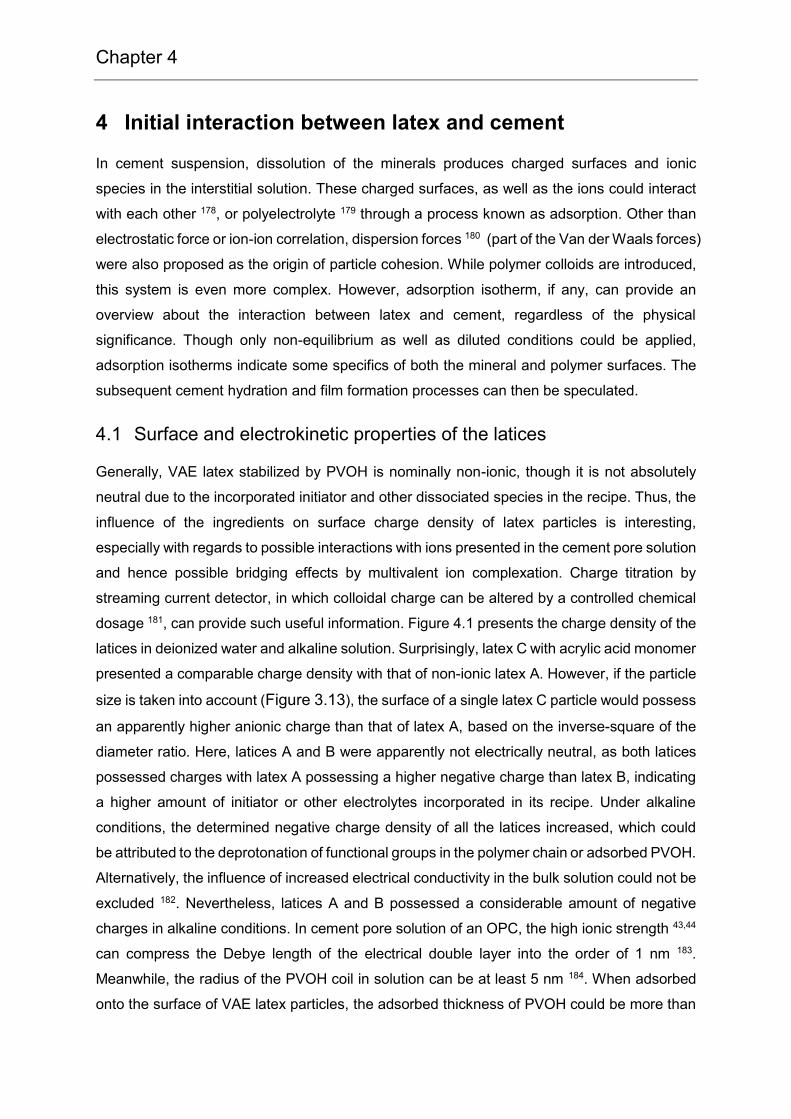
Chapter 4
4 Initial interaction between latex and cement
In cement suspension, dissolution of the minerals produces charged surfaces and ionic
species in the interstitial solution. These charged surfaces, as well as the ions could interact
with each other 178, or polyelectrolyte 179 through a process known as adsorption. Other than
electrostatic force or ion-ion correlation, dispersion forces 180 (part of the Van der Waals forces)
were also proposed as the origin of particle cohesion. While polymer colloids are introduced,
this system is even more complex. However, adsorption isotherm, if any, can provide an
overview about the interaction between latex and cement, regardless of the physical
significance. Though only non-equilibrium as well as diluted conditions could be applied,
adsorption isotherms indicate some specifics of both the mineral and polymer surfaces. The
subsequent cement hydration and film formation processes can then be speculated.
4.1 Surface and electrokinetic properties of the latices
Generally, VAE latex stabilized by PVOH is nominally non-ionic, though it is not absolutely
neutral due to the incorporated initiator and other dissociated species in the recipe. Thus, the
influence of the ingredients on surface charge density of latex particles is interesting,
especially with regards to possible interactions with ions presented in the cement pore solution
and hence possible bridging effects by multivalent ion complexation. Charge titration by
streaming current detector, in which colloidal charge can be altered by a controlled chemical
dosage 181, can provide such useful information. Figure 4.1 presents the charge density of the
latices in deionized water and alkaline solution. Surprisingly, latex C with acrylic acid monomer
presented a comparable charge density with that of non-ionic latex A. However, if the particle
size is taken into account (Figure 3.13), the surface of a single latex C particle would possess
an apparently higher anionic charge than that of latex A, based on the inverse-square of the
diameter ratio. Here, latices A and B were apparently not electrically neutral, as both latices
possessed charges with latex A possessing a higher negative charge than latex B, indicating
a higher amount of initiator or other electrolytes incorporated in its recipe. Under alkaline
conditions, the determined negative charge density of all the latices increased, which could
be attributed to the deprotonation of functional groups in the polymer chain or adsorbed PVOH.
Alternatively, the influence of increased electrical conductivity in the bulk solution could not be
excluded 182. Nevertheless, latices A and B possessed a considerable amount of negative
charges in alkaline conditions. In cement pore solution of an OPC, the high ionic strength 43,44
can compress the Debye length of the electrical double layer into the order of 1 nm 183.
Meanwhile, the radius of the PVOH coil in solution can be at least 5 nm 184. When adsorbed
onto the surface of VAE latex particles, the adsorbed thickness of PVOH could be more than
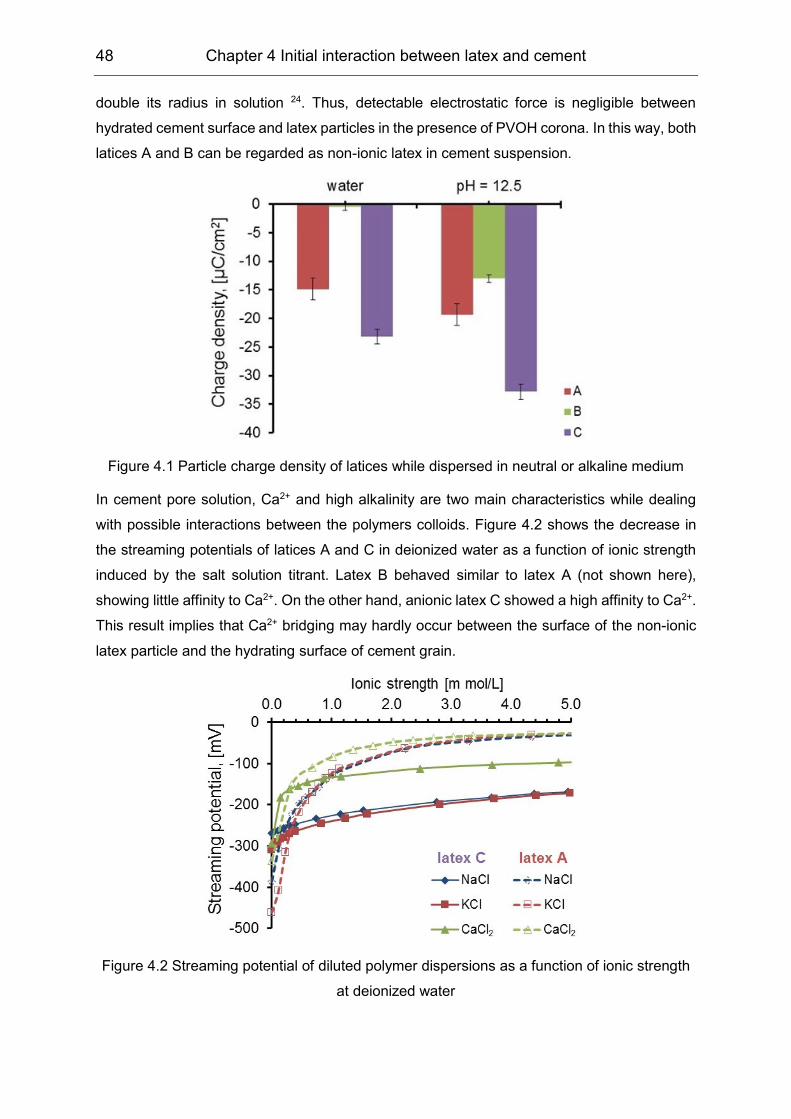
48 Chapter 4 Initial interaction between latex and cement
double its radius in solution 24. Thus, detectable electrostatic force is negligible between
hydrated cement surface and latex particles in the presence of PVOH corona. In this way, both
latices A and B can be regarded as non-ionic latex in cement suspension.
Figure 4.1 Particle charge density of latices while dispersed in neutral or alkaline medium
In cement pore solution, Ca2+ and high alkalinity are two main characteristics while dealing
with possible interactions between the polymers colloids. Figure 4.2 shows the decrease in
the streaming potentials of latices A and C in deionized water as a function of ionic strength
induced by the salt solution titrant. Latex B behaved similar to latex A (not shown here),
showing little affinity to Ca2+. On the other hand, anionic latex C showed a high affinity to Ca2+.
This result implies that Ca2+ bridging may hardly occur between the surface of the non-ionic
latex particle and the hydrating surface of cement grain.
Figure 4.2 Streaming potential of diluted polymer dispersions as a function of ionic strength
at deionized water
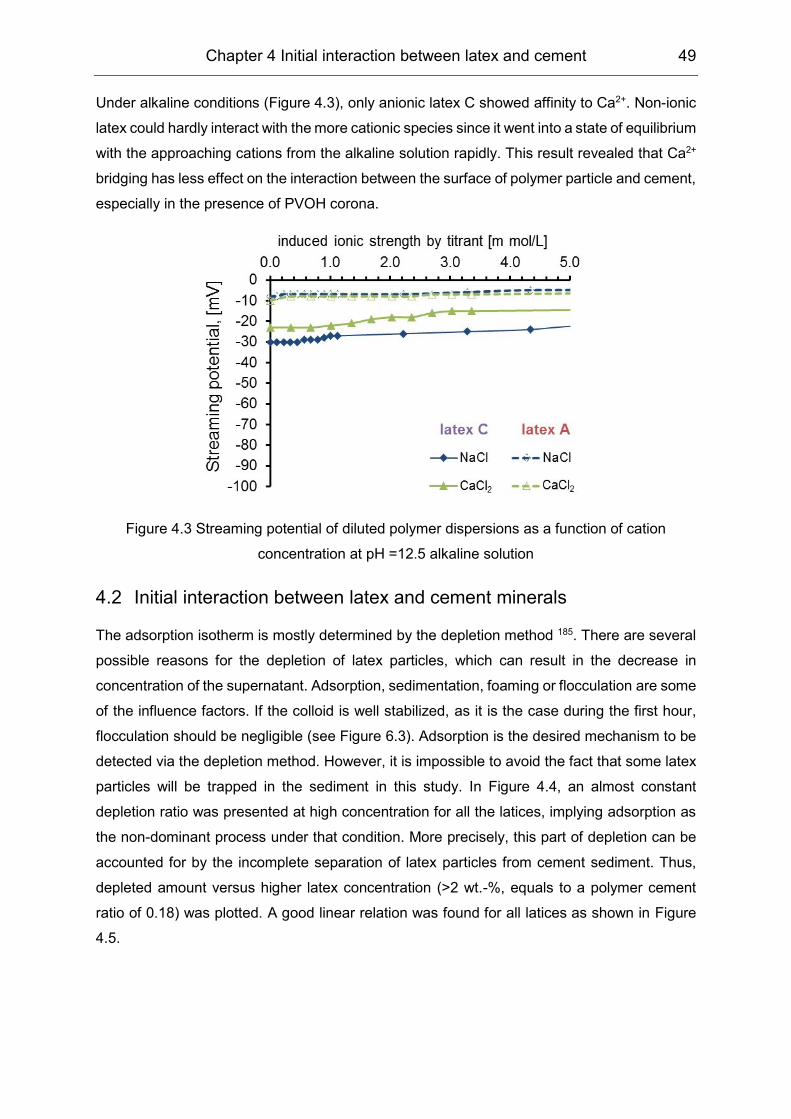
Chapter 4 Initial interaction between latex and cement 49
Under alkaline conditions (Figure 4.3), only anionic latex C showed affinity to Ca2+. Non-ionic
latex could hardly interact with the more cationic species since it went into a state of equilibrium
with the approaching cations from the alkaline solution rapidly. This result revealed that Ca2+
bridging has less effect on the interaction between the surface of polymer particle and cement,
especially in the presence of PVOH corona.
Figure 4.3 Streaming potential of diluted polymer dispersions as a function of cation
concentration at pH =12.5 alkaline solution
4.2 Initial interaction between latex and cement minerals
The adsorption isotherm is mostly determined by the depletion method 185. There are several
possible reasons for the depletion of latex particles, which can result in the decrease in
concentration of the supernatant. Adsorption, sedimentation, foaming or flocculation are some
of the influence factors. If the colloid is well stabilized, as it is the case during the first hour,
flocculation should be negligible (see Figure 6.3). Adsorption is the desired mechanism to be
detected via the depletion method. However, it is impossible to avoid the fact that some latex
particles will be trapped in the sediment in this study. In Figure 4.4, an almost constant
depletion ratio was presented at high concentration for all the latices, implying adsorption as
the non-dominant process under that condition. More precisely, this part of depletion can be
accounted for by the incomplete separation of latex particles from cement sediment. Thus,
depleted amount versus higher latex concentration (>2 wt.-%, equals to a polymer cement
ratio of 0.18) was plotted. A good linear relation was found for all latices as shown in Figure
4.5.
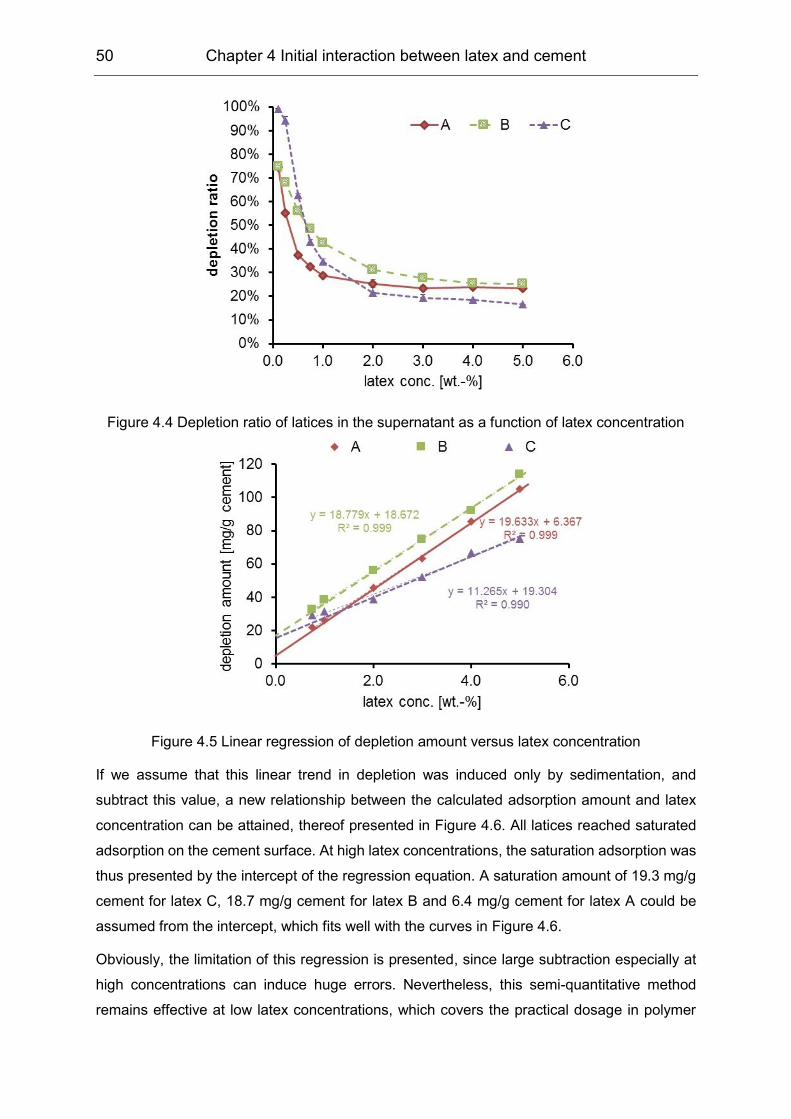
50 Chapter 4 Initial interaction between latex and cement
Figure 4.4 Depletion ratio of latices in the supernatant as a function of latex concentration
Figure 4.5 Linear regression of depletion amount versus latex concentration
If we assume that this linear trend in depletion was induced only by sedimentation, and
subtract this value, a new relationship between the calculated adsorption amount and latex
concentration can be attained, thereof presented in Figure 4.6. All latices reached saturated
adsorption on the cement surface. At high latex concentrations, the saturation adsorption was
thus presented by the intercept of the regression equation. A saturation amount of 19.3 mg/g
cement for latex C, 18.7 mg/g cement for latex B and 6.4 mg/g cement for latex A could be
assumed from the intercept, which fits well with the curves in Figure 4.6.
Obviously, the limitation of this regression is presented, since large subtraction especially at
high concentrations can induce huge errors. Nevertheless, this semi-quantitative method
remains effective at low latex concentrations, which covers the practical dosage in polymer
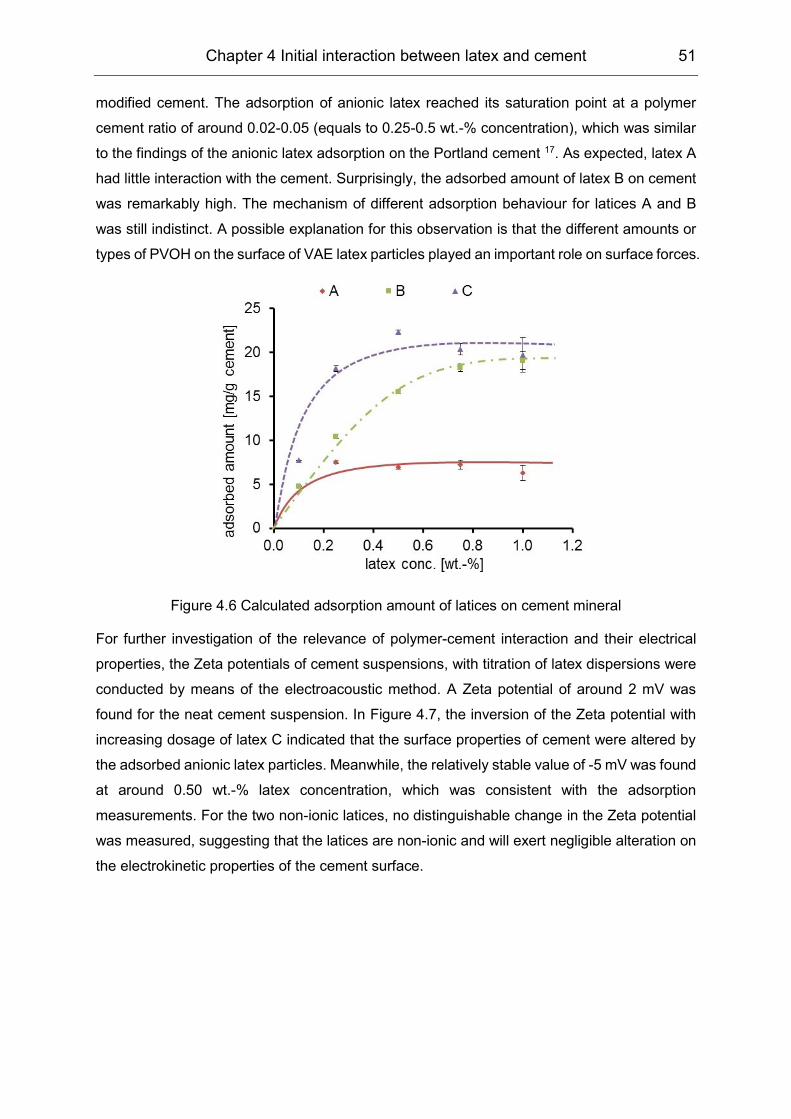
Chapter 4 Initial interaction between latex and cement 51
modified cement. The adsorption of anionic latex reached its saturation point at a polymer
cement ratio of around 0.02-0.05 (equals to 0.25-0.5 wt.-% concentration), which was similar
to the findings of the anionic latex adsorption on the Portland cement 17. As expected, latex A
had little interaction with the cement. Surprisingly, the adsorbed amount of latex B on cement
was remarkably high. The mechanism of different adsorption behaviour for latices A and B
was still indistinct. A possible explanation for this observation is that the different amounts or
types of PVOH on the surface of VAE latex particles played an important role on surface forces.
Figure 4.6 Calculated adsorption amount of latices on cement mineral
For further investigation of the relevance of polymer-cement interaction and their electrical
properties, the Zeta potentials of cement suspensions, with titration of latex dispersions were
conducted by means of the electroacoustic method. A Zeta potential of around 2 mV was
found for the neat cement suspension. In Figure 4.7, the inversion of the Zeta potential with
increasing dosage of latex C indicated that the surface properties of cement were altered by
the adsorbed anionic latex particles. Meanwhile, the relatively stable value of -5 mV was found
at around 0.50 wt.-% latex concentration, which was consistent with the adsorption
measurements. For the two non-ionic latices, no distinguishable change in the Zeta potential
was measured, suggesting that the latices are non-ionic and will exert negligible alteration on
the electrokinetic properties of the cement surface.
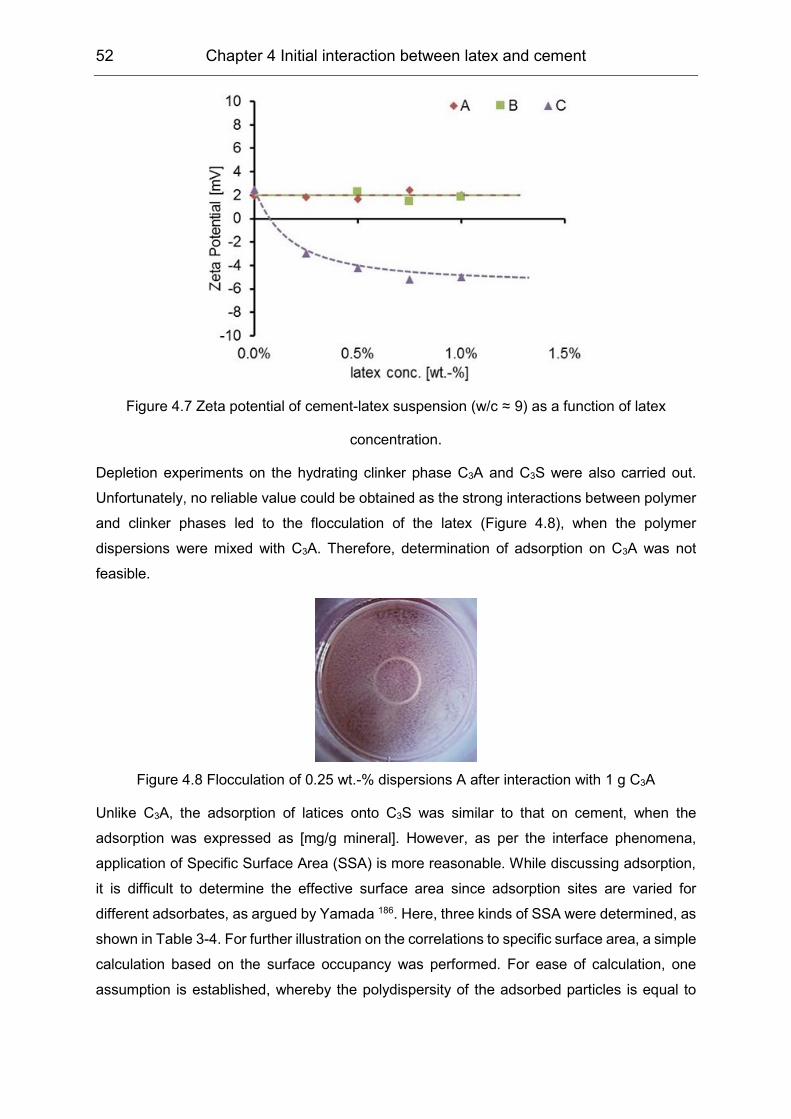
52 Chapter 4 Initial interaction between latex and cement
Figure 4.7 Zeta potential of cement-latex suspension (w/c ≈ 9) as a function of latex
concentration.
Depletion experiments on the hydrating clinker phase C3A and C3S were also carried out.
Unfortunately, no reliable value could be obtained as the strong interactions between polymer
and clinker phases led to the flocculation of the latex (Figure 4.8), when the polymer
dispersions were mixed with C3A. Therefore, determination of adsorption on C3A was not
feasible.
Figure 4.8 Flocculation of 0.25 wt.-% dispersions A after interaction with 1 g C3A
Unlike C3A, the adsorption of latices onto C3S was similar to that on cement, when the
adsorption was expressed as [mg/g mineral]. However, as per the interface phenomena,
application of Specific Surface Area (SSA) is more reasonable. While discussing adsorption,
it is difficult to determine the effective surface area since adsorption sites are varied for
different adsorbates, as argued by Yamada 186. Here, three kinds of SSA were determined, as
shown in Table 3-4. For further illustration on the correlations to specific surface area, a simple
calculation based on the surface occupancy was performed. For ease of calculation, one
assumption is established, whereby the polydispersity of the adsorbed particles is equal to
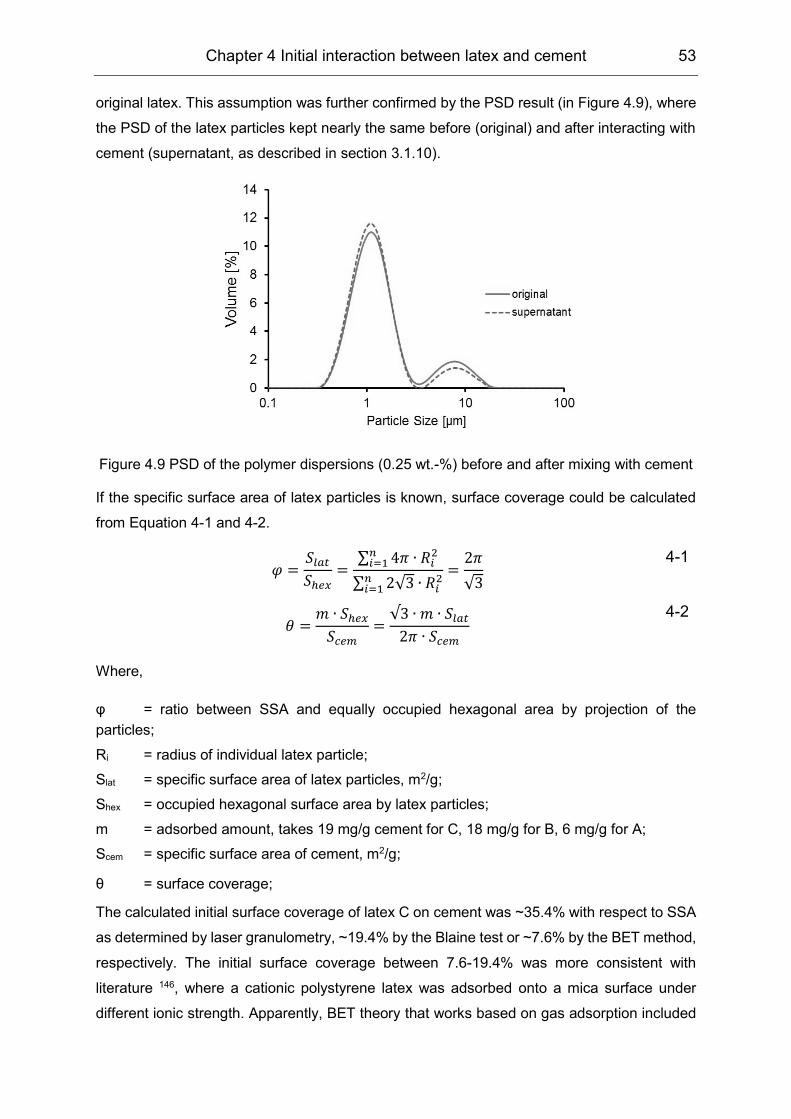
Chapter 4 Initial interaction between latex and cement 53
original latex. This assumption was further confirmed by the PSD result (in Figure 4.9), where
the PSD of the latex particles kept nearly the same before (original) and after interacting with
cement (supernatant, as described in section 3.1.10).
Figure 4.9 PSD of the polymer dispersions (0.25 wt.-%) before and after mixing with cement
If the specific surface area of latex particles is known, surface coverage could be calculated
from Equation 4-1 and 4-2.
𝜑 =
𝑆𝑙𝑎𝑡
𝑆ℎ𝑒𝑥=
∑ 4𝜋 ∙ 𝑅𝑖2𝑛
𝑖=1
∑ 2√3𝑛𝑖=1 ∙ 𝑅𝑖
2=
2𝜋
√3
4-1
𝜃 =
𝑚 ∙ 𝑆ℎ𝑒𝑥
𝑆𝑐𝑒𝑚=
√3 ∙ 𝑚 ∙ 𝑆𝑙𝑎𝑡
2𝜋 ∙ 𝑆𝑐𝑒𝑚
4-2
Where,
φ = ratio between SSA and equally occupied hexagonal area by projection of the
particles;
Ri = radius of individual latex particle;
Slat = specific surface area of latex particles, m2/g;
Shex = occupied hexagonal surface area by latex particles;
m = adsorbed amount, takes 19 mg/g cement for C, 18 mg/g for B, 6 mg/g for A;
Scem = specific surface area of cement, m2/g;
θ = surface coverage;
The calculated initial surface coverage of latex C on cement was ~35.4% with respect to SSA
as determined by laser granulometry, ~19.4% by the Blaine test or ~7.6% by the BET method,
respectively. The initial surface coverage between 7.6-19.4% was more consistent with
literature 146, where a cationic polystyrene latex was adsorbed onto a mica surface under
different ionic strength. Apparently, BET theory that works based on gas adsorption included
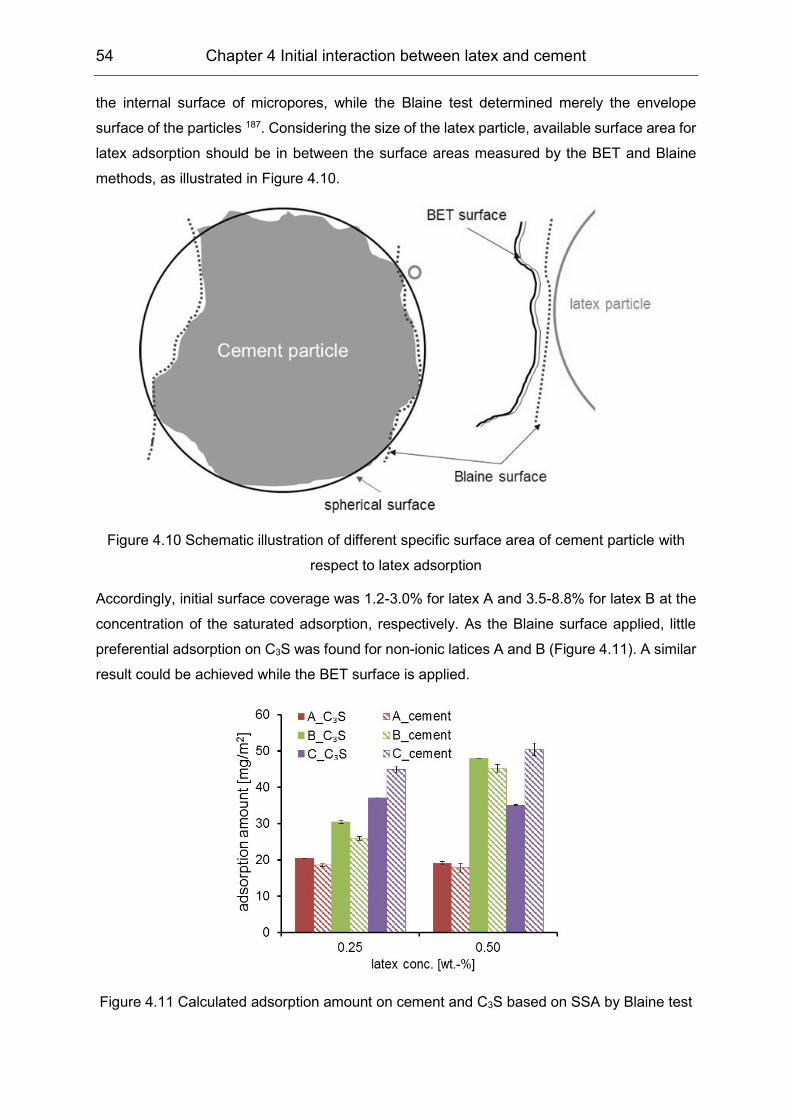
54 Chapter 4 Initial interaction between latex and cement
the internal surface of micropores, while the Blaine test determined merely the envelope
surface of the particles 187. Considering the size of the latex particle, available surface area for
latex adsorption should be in between the surface areas measured by the BET and Blaine
methods, as illustrated in Figure 4.10.
Figure 4.10 Schematic illustration of different specific surface area of cement particle with
respect to latex adsorption
Accordingly, initial surface coverage was 1.2-3.0% for latex A and 3.5-8.8% for latex B at the
concentration of the saturated adsorption, respectively. As the Blaine surface applied, little
preferential adsorption on C3S was found for non-ionic latices A and B (Figure 4.11). A similar
result could be achieved while the BET surface is applied.
Figure 4.11 Calculated adsorption amount on cement and C3S based on SSA by Blaine test
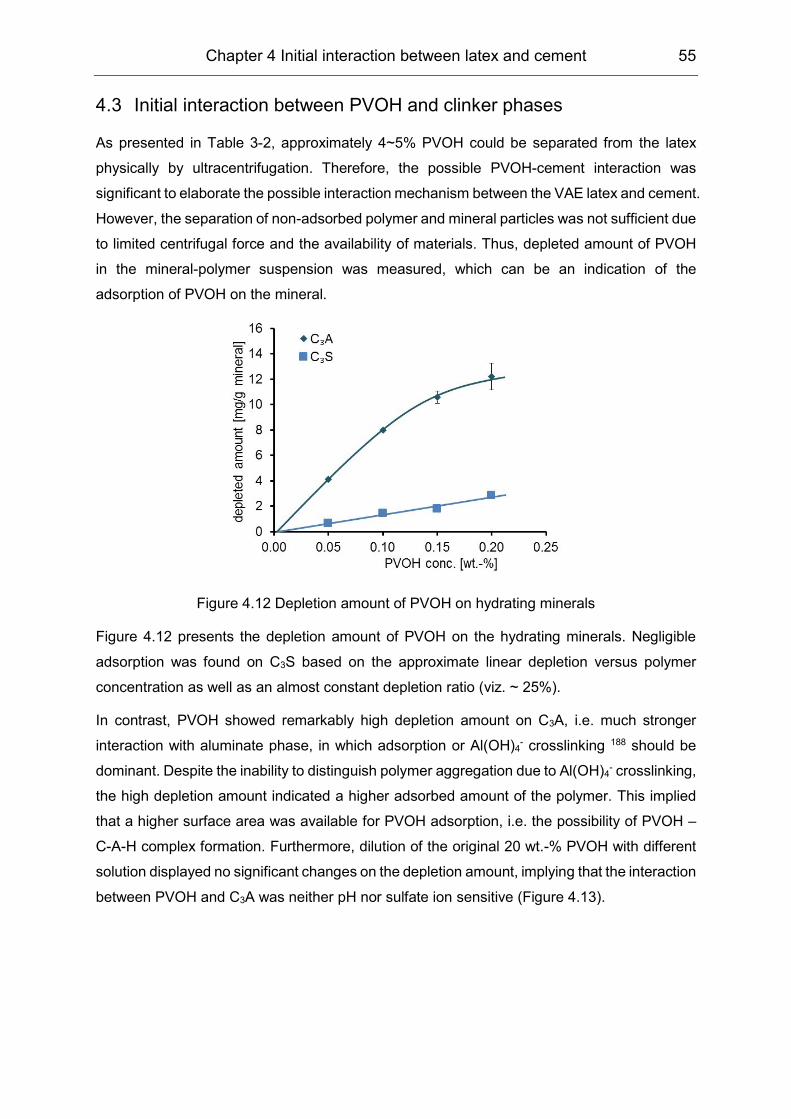
Chapter 4 Initial interaction between latex and cement 55
4.3 Initial interaction between PVOH and clinker phases
As presented in Table 3-2, approximately 4~5% PVOH could be separated from the latex
physically by ultracentrifugation. Therefore, the possible PVOH-cement interaction was
significant to elaborate the possible interaction mechanism between the VAE latex and cement.
However, the separation of non-adsorbed polymer and mineral particles was not sufficient due
to limited centrifugal force and the availability of materials. Thus, depleted amount of PVOH
in the mineral-polymer suspension was measured, which can be an indication of the
adsorption of PVOH on the mineral.
Figure 4.12 Depletion amount of PVOH on hydrating minerals
Figure 4.12 presents the depletion amount of PVOH on the hydrating minerals. Negligible
adsorption was found on C3S based on the approximate linear depletion versus polymer
concentration as well as an almost constant depletion ratio (viz. ~ 25%).
In contrast, PVOH showed remarkably high depletion amount on C3A, i.e. much stronger
interaction with aluminate phase, in which adsorption or Al(OH)4- crosslinking 188 should be
dominant. Despite the inability to distinguish polymer aggregation due to Al(OH)4- crosslinking,
the high depletion amount indicated a higher adsorbed amount of the polymer. This implied
that a higher surface area was available for PVOH adsorption, i.e. the possibility of PVOH –
C-A-H complex formation. Furthermore, dilution of the original 20 wt.-% PVOH with different
solution displayed no significant changes on the depletion amount, implying that the interaction
between PVOH and C3A was neither pH nor sulfate ion sensitive (Figure 4.13).
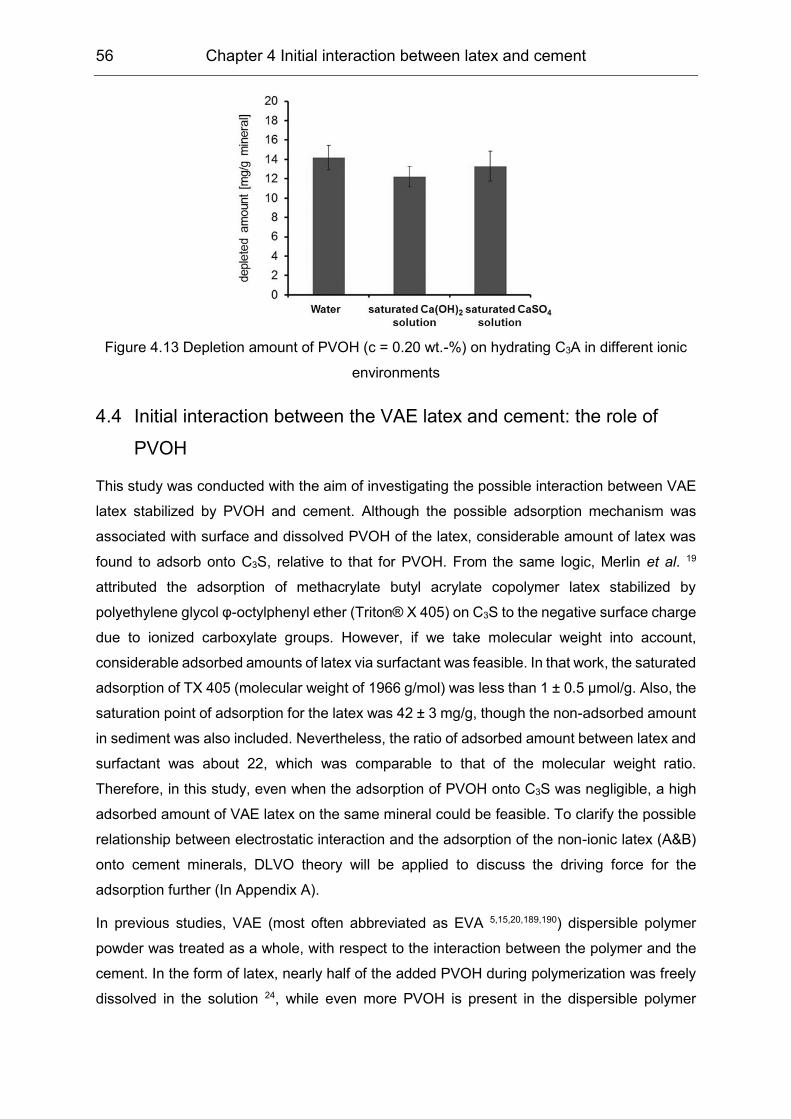
56 Chapter 4 Initial interaction between latex and cement
Figure 4.13 Depletion amount of PVOH (c = 0.20 wt.-%) on hydrating C3A in different ionic
environments
4.4 Initial interaction between the VAE latex and cement: the role of
PVOH
This study was conducted with the aim of investigating the possible interaction between VAE
latex stabilized by PVOH and cement. Although the possible adsorption mechanism was
associated with surface and dissolved PVOH of the latex, considerable amount of latex was
found to adsorb onto C3S, relative to that for PVOH. From the same logic, Merlin et al. 19
attributed the adsorption of methacrylate butyl acrylate copolymer latex stabilized by
polyethylene glycol φ-octylphenyl ether (Triton® X 405) on C3S to the negative surface charge
due to ionized carboxylate groups. However, if we take molecular weight into account,
considerable adsorbed amounts of latex via surfactant was feasible. In that work, the saturated
adsorption of TX 405 (molecular weight of 1966 g/mol) was less than 1 ± 0.5 µmol/g. Also, the
saturation point of adsorption for the latex was 42 ± 3 mg/g, though the non-adsorbed amount
in sediment was also included. Nevertheless, the ratio of adsorbed amount between latex and
surfactant was about 22, which was comparable to that of the molecular weight ratio.
Therefore, in this study, even when the adsorption of PVOH onto C3S was negligible, a high
adsorbed amount of VAE latex on the same mineral could be feasible. To clarify the possible
relationship between electrostatic interaction and the adsorption of the non-ionic latex (A&B)
onto cement minerals, DLVO theory will be applied to discuss the driving force for the
adsorption further (In Appendix A).
In previous studies, VAE (most often abbreviated as EVA 5,15,20,189,190) dispersible polymer
powder was treated as a whole, with respect to the interaction between the polymer and the
cement. In the form of latex, nearly half of the added PVOH during polymerization was freely
dissolved in the solution 24, while even more PVOH is present in the dispersible polymer
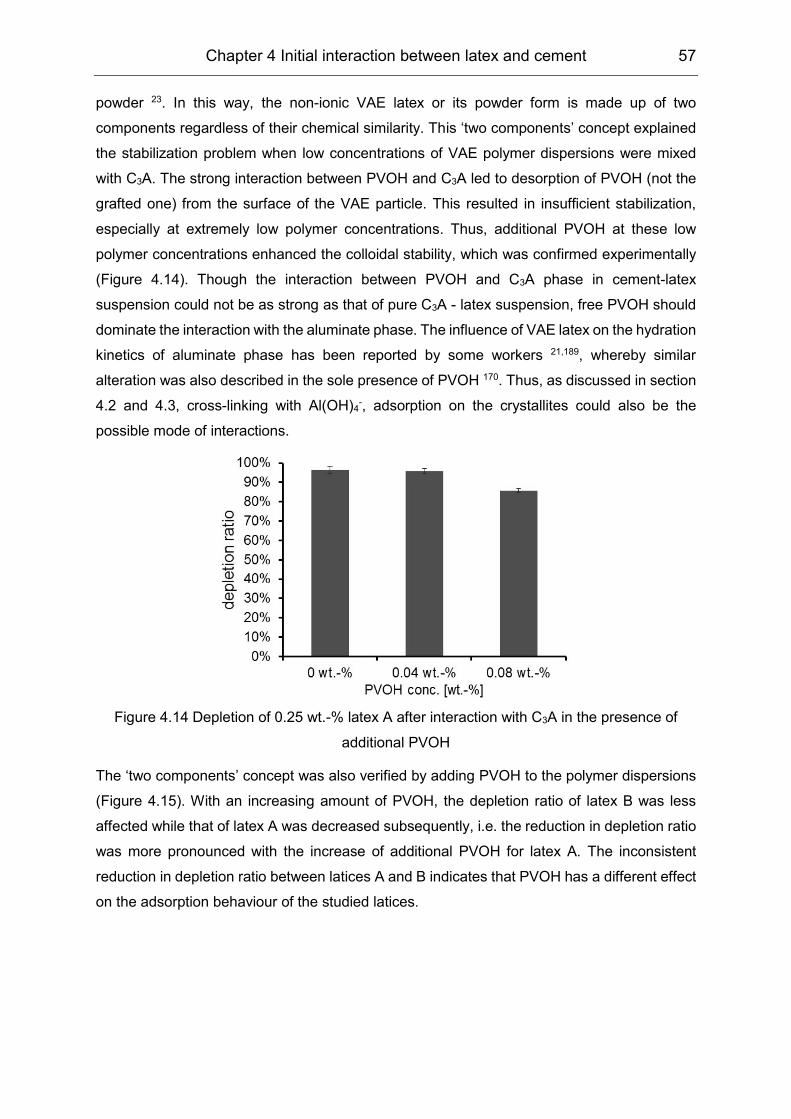
Chapter 4 Initial interaction between latex and cement 57
powder 23. In this way, the non-ionic VAE latex or its powder form is made up of two
components regardless of their chemical similarity. This ‘two components’ concept explained
the stabilization problem when low concentrations of VAE polymer dispersions were mixed
with C3A. The strong interaction between PVOH and C3A led to desorption of PVOH (not the
grafted one) from the surface of the VAE particle. This resulted in insufficient stabilization,
especially at extremely low polymer concentrations. Thus, additional PVOH at these low
polymer concentrations enhanced the colloidal stability, which was confirmed experimentally
(Figure 4.14). Though the interaction between PVOH and C3A phase in cement-latex
suspension could not be as strong as that of pure C3A - latex suspension, free PVOH should
dominate the interaction with the aluminate phase. The influence of VAE latex on the hydration
kinetics of aluminate phase has been reported by some workers 21,189, whereby similar
alteration was also described in the sole presence of PVOH 170. Thus, as discussed in section
4.2 and 4.3, cross-linking with Al(OH)4-, adsorption on the crystallites could also be the
possible mode of interactions.
Figure 4.14 Depletion of 0.25 wt.-% latex A after interaction with C3A in the presence of
additional PVOH
The ‘two components’ concept was also verified by adding PVOH to the polymer dispersions
(Figure 4.15). With an increasing amount of PVOH, the depletion ratio of latex B was less
affected while that of latex A was decreased subsequently, i.e. the reduction in depletion ratio
was more pronounced with the increase of additional PVOH for latex A. The inconsistent
reduction in depletion ratio between latices A and B indicates that PVOH has a different effect
on the adsorption behaviour of the studied latices.
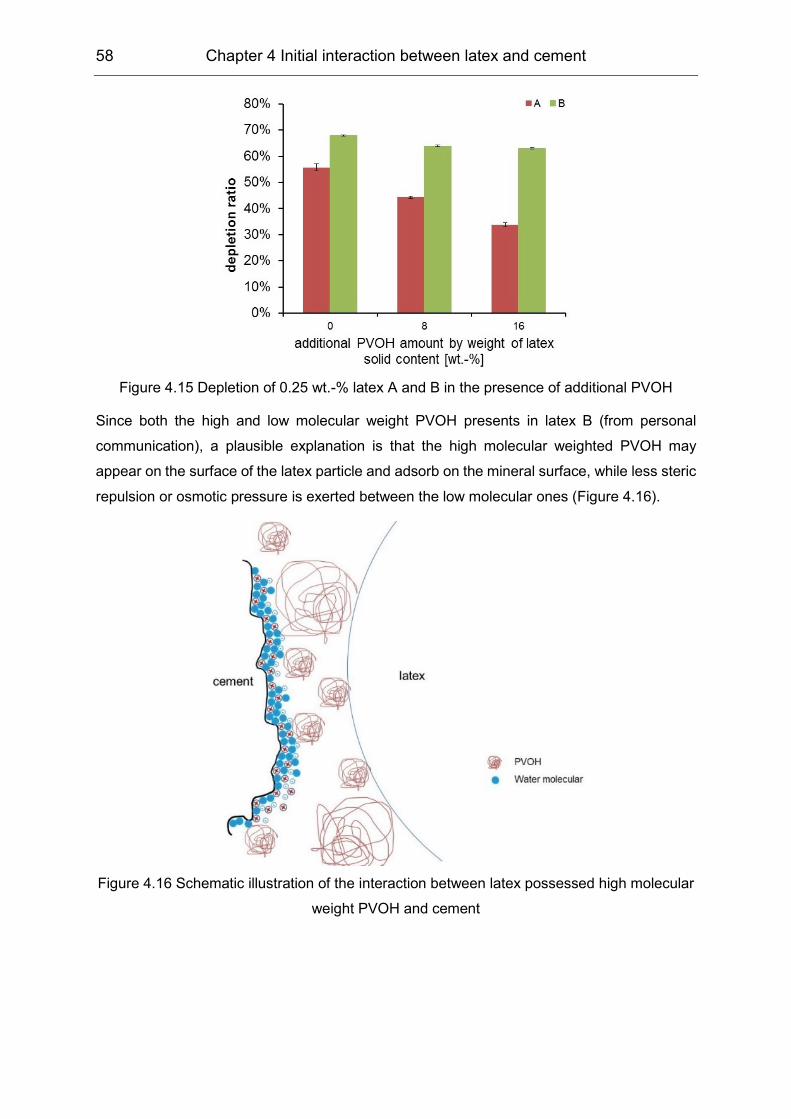
58 Chapter 4 Initial interaction between latex and cement
Figure 4.15 Depletion of 0.25 wt.-% latex A and B in the presence of additional PVOH
Since both the high and low molecular weight PVOH presents in latex B (from personal
communication), a plausible explanation is that the high molecular weighted PVOH may
appear on the surface of the latex particle and adsorb on the mineral surface, while less steric
repulsion or osmotic pressure is exerted between the low molecular ones (Figure 4.16).
Figure 4.16 Schematic illustration of the interaction between latex possessed high molecular
weight PVOH and cement
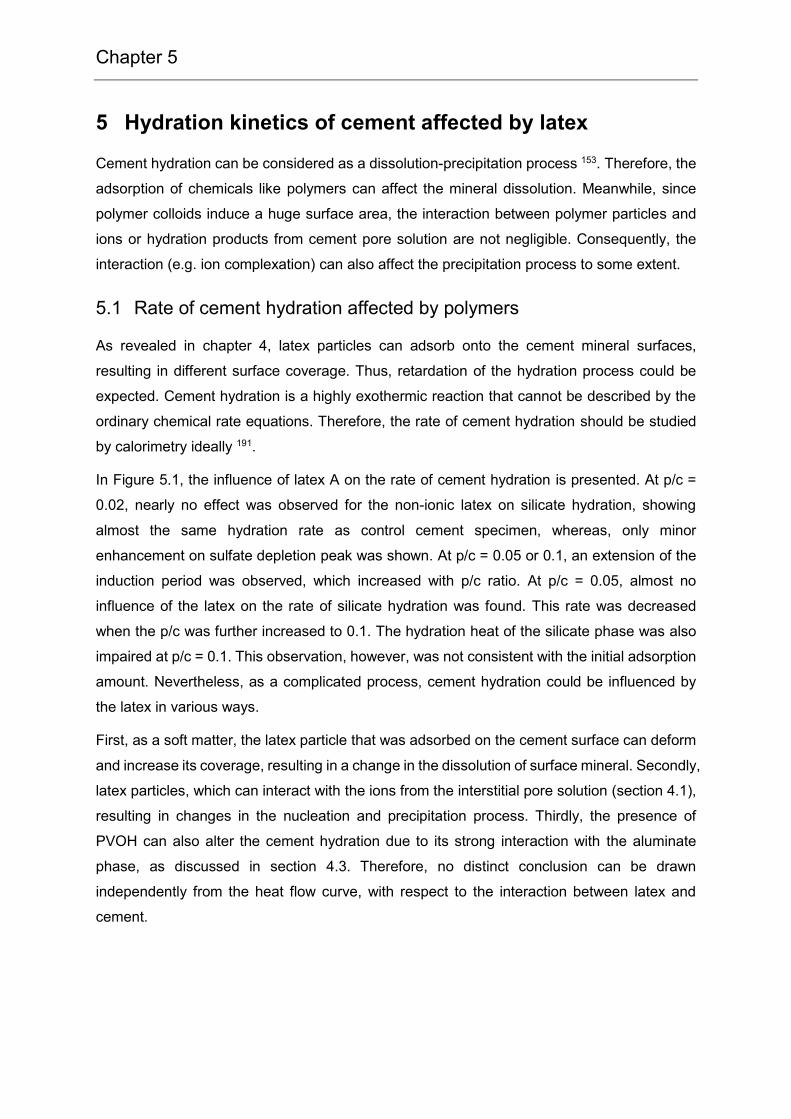
Chapter 5
5 Hydration kinetics of cement affected by latex
Cement hydration can be considered as a dissolution-precipitation process 153. Therefore, the
adsorption of chemicals like polymers can affect the mineral dissolution. Meanwhile, since
polymer colloids induce a huge surface area, the interaction between polymer particles and
ions or hydration products from cement pore solution are not negligible. Consequently, the
interaction (e.g. ion complexation) can also affect the precipitation process to some extent.
5.1 Rate of cement hydration affected by polymers
As revealed in chapter 4, latex particles can adsorb onto the cement mineral surfaces,
resulting in different surface coverage. Thus, retardation of the hydration process could be
expected. Cement hydration is a highly exothermic reaction that cannot be described by the
ordinary chemical rate equations. Therefore, the rate of cement hydration should be studied
by calorimetry ideally 191.
In Figure 5.1, the influence of latex A on the rate of cement hydration is presented. At p/c =
0.02, nearly no effect was observed for the non-ionic latex on silicate hydration, showing
almost the same hydration rate as control cement specimen, whereas, only minor
enhancement on sulfate depletion peak was shown. At p/c = 0.05 or 0.1, an extension of the
induction period was observed, which increased with p/c ratio. At p/c = 0.05, almost no
influence of the latex on the rate of silicate hydration was found. This rate was decreased
when the p/c was further increased to 0.1. The hydration heat of the silicate phase was also
impaired at p/c = 0.1. This observation, however, was not consistent with the initial adsorption
amount. Nevertheless, as a complicated process, cement hydration could be influenced by
the latex in various ways.
First, as a soft matter, the latex particle that was adsorbed on the cement surface can deform
and increase its coverage, resulting in a change in the dissolution of surface mineral. Secondly,
latex particles, which can interact with the ions from the interstitial pore solution (section 4.1),
resulting in changes in the nucleation and precipitation process. Thirdly, the presence of
PVOH can also alter the cement hydration due to its strong interaction with the aluminate
phase, as discussed in section 4.3. Therefore, no distinct conclusion can be drawn
independently from the heat flow curve, with respect to the interaction between latex and
cement.
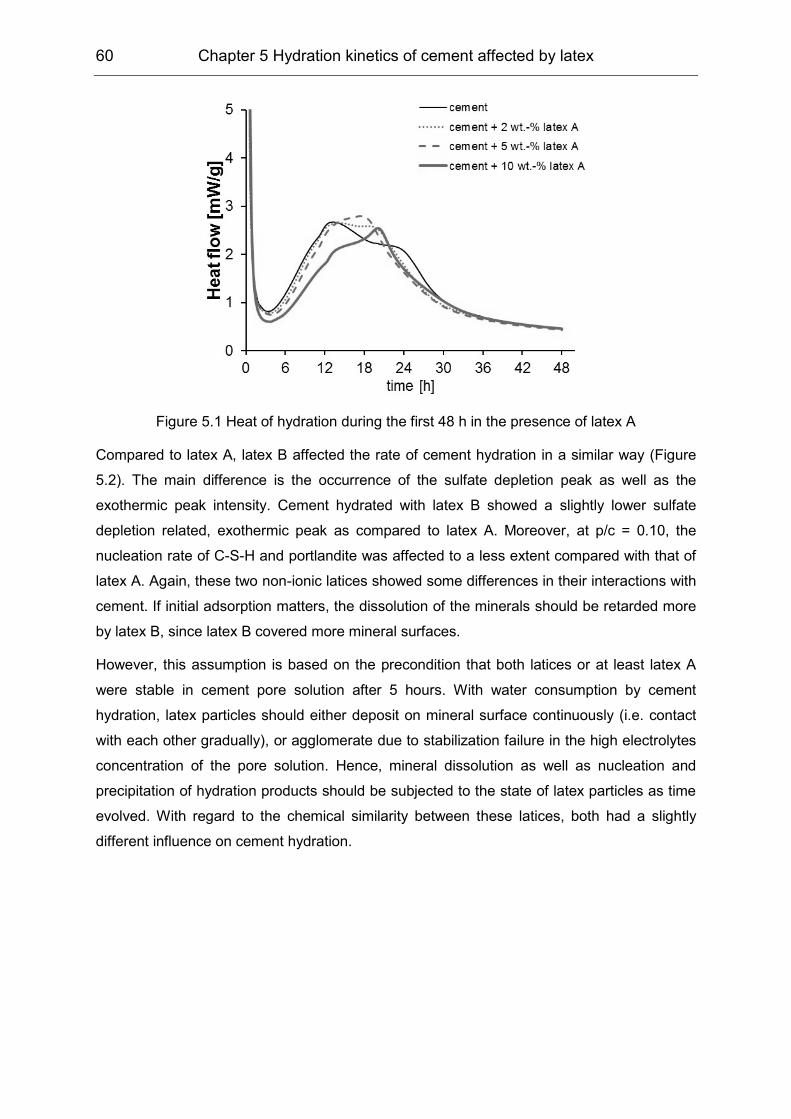
60 Chapter 5 Hydration kinetics of cement affected by latex
Figure 5.1 Heat of hydration during the first 48 h in the presence of latex A
Compared to latex A, latex B affected the rate of cement hydration in a similar way (Figure
5.2). The main difference is the occurrence of the sulfate depletion peak as well as the
exothermic peak intensity. Cement hydrated with latex B showed a slightly lower sulfate
depletion related, exothermic peak as compared to latex A. Moreover, at p/c = 0.10, the
nucleation rate of C-S-H and portlandite was affected to a less extent compared with that of
latex A. Again, these two non-ionic latices showed some differences in their interactions with
cement. If initial adsorption matters, the dissolution of the minerals should be retarded more
by latex B, since latex B covered more mineral surfaces.
However, this assumption is based on the precondition that both latices or at least latex A
were stable in cement pore solution after 5 hours. With water consumption by cement
hydration, latex particles should either deposit on mineral surface continuously (i.e. contact
with each other gradually), or agglomerate due to stabilization failure in the high electrolytes
concentration of the pore solution. Hence, mineral dissolution as well as nucleation and
precipitation of hydration products should be subjected to the state of latex particles as time
evolved. With regard to the chemical similarity between these latices, both had a slightly
different influence on cement hydration.
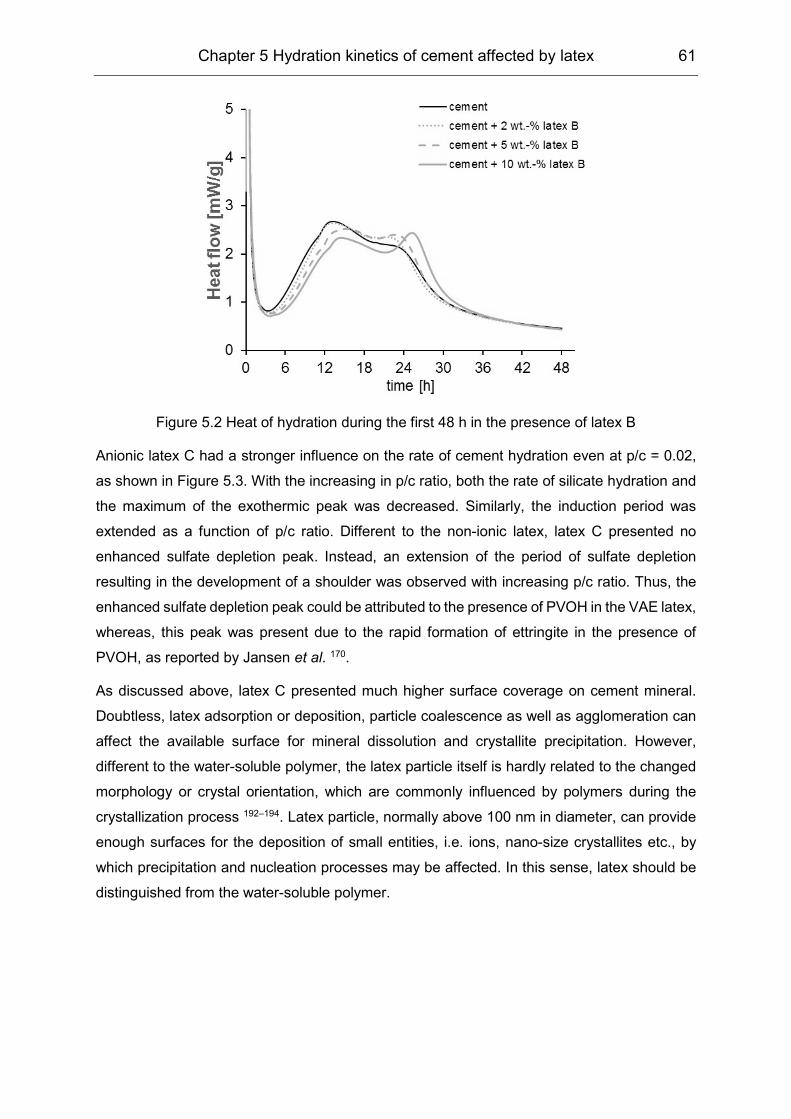
Chapter 5 Hydration kinetics of cement affected by latex 61
Figure 5.2 Heat of hydration during the first 48 h in the presence of latex B
Anionic latex C had a stronger influence on the rate of cement hydration even at p/c = 0.02,
as shown in Figure 5.3. With the increasing in p/c ratio, both the rate of silicate hydration and
the maximum of the exothermic peak was decreased. Similarly, the induction period was
extended as a function of p/c ratio. Different to the non-ionic latex, latex C presented no
enhanced sulfate depletion peak. Instead, an extension of the period of sulfate depletion
resulting in the development of a shoulder was observed with increasing p/c ratio. Thus, the
enhanced sulfate depletion peak could be attributed to the presence of PVOH in the VAE latex,
whereas, this peak was present due to the rapid formation of ettringite in the presence of
PVOH, as reported by Jansen et al. 170.
As discussed above, latex C presented much higher surface coverage on cement mineral.
Doubtless, latex adsorption or deposition, particle coalescence as well as agglomeration can
affect the available surface for mineral dissolution and crystallite precipitation. However,
different to the water-soluble polymer, the latex particle itself is hardly related to the changed
morphology or crystal orientation, which are commonly influenced by polymers during the
crystallization process 192–194. Latex particle, normally above 100 nm in diameter, can provide
enough surfaces for the deposition of small entities, i.e. ions, nano-size crystallites etc., by
which precipitation and nucleation processes may be affected. In this sense, latex should be
distinguished from the water-soluble polymer.
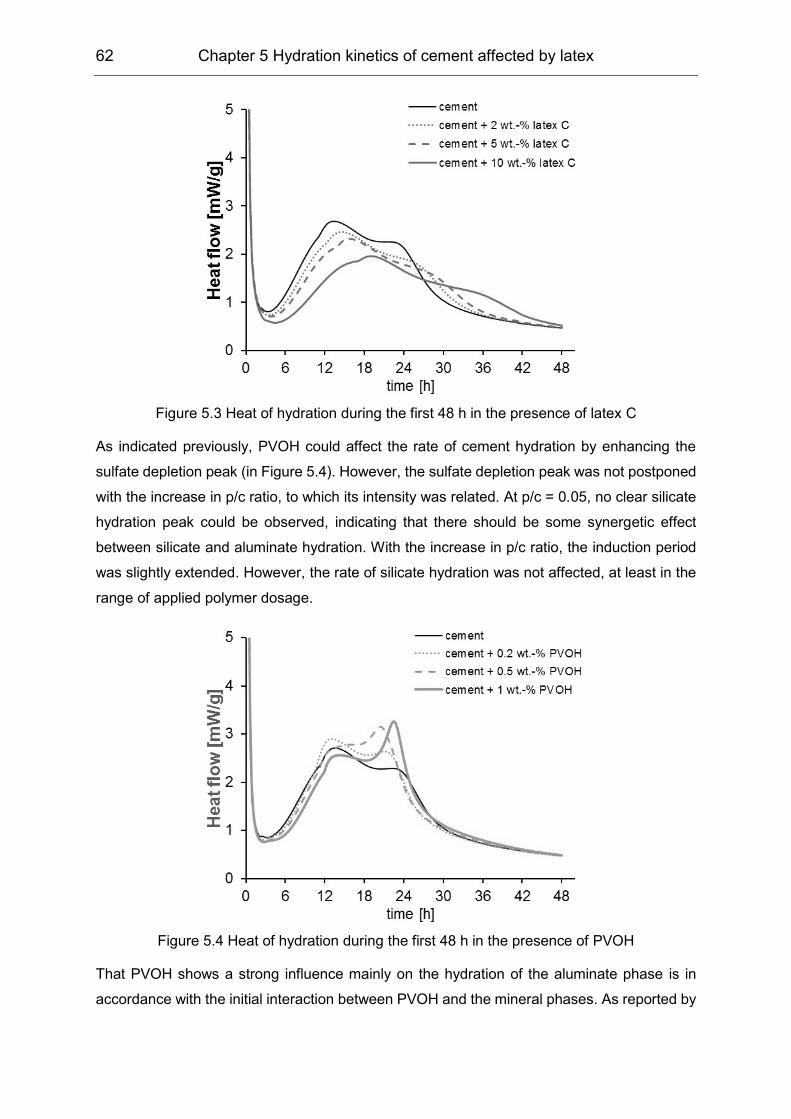
62 Chapter 5 Hydration kinetics of cement affected by latex
Figure 5.3 Heat of hydration during the first 48 h in the presence of latex C
As indicated previously, PVOH could affect the rate of cement hydration by enhancing the
sulfate depletion peak (in Figure 5.4). However, the sulfate depletion peak was not postponed
with the increase in p/c ratio, to which its intensity was related. At p/c = 0.05, no clear silicate
hydration peak could be observed, indicating that there should be some synergetic effect
between silicate and aluminate hydration. With the increase in p/c ratio, the induction period
was slightly extended. However, the rate of silicate hydration was not affected, at least in the
range of applied polymer dosage.
Figure 5.4 Heat of hydration during the first 48 h in the presence of PVOH
That PVOH shows a strong influence mainly on the hydration of the aluminate phase is in
accordance with the initial interaction between PVOH and the mineral phases. As reported by
Chapter 5 Hydration kinetics of cement affected by latex 63
Jansen et al. 170, PVOH can influence initial dissolution of C3A and promote ettringite formation
after sulfate depletion. Also, it has only a minor influence on the induction period, which
appears to exist as a distinct stage only when chemical retarders are added or materials have
been annealed 152. The PVOH used in this study is partially hydrolyzed poly (vinyl alcohol -co-
vinyl acetate) copolymer, which could undergo further alkaline hydrolysis in cement pore
solution as follows:
The solubility of Ca(OH)2 in NaOH solution decayed exponentially in the range of 0 - 0.1 mol/L
concentration 195 i.e. the pH of the solution approaches 13. Thus, the hydrolysis reaction
should affect the degree of undersaturation through the change in the pH of the solution.
Hence, it is of interest to discuss the possible influence of the hydrolysis reaction, since the
rate controlling process of the alite dissolution (induction period) was highly related to
undersaturation degree, which was proposed by recently developed dissolution theory 163.
To investigate the possible influence of hydrolysis reaction, the pH change of the pore solution
extracted from cement/polymer mixes has been investigated. In Figure 5.5, a very slightly
increase in the pH of the control cement specimen was observed between 10 and 180 min.
Low dosages of latices A and B respectively showed a limited influence on pH of the pore
solutions. In contrast, PVOH showed a considerable influence on the pH of the pore solution,
especially during the initial hydration period. The relatively low pH of the pore solution in the
presence of PVOH could be first maintained for at least 30 min, indicating that the hydrolysis
reaction in cement paste is similar to a buffer system. Additionally, slower alkaline hydrolysis
of the ester group from latex polymer is predicted here. This could explain why latices A and
B showed less of an effect on the pH of the pore solutions at low dosages.
H
O
H+CH CH2 CH CH2
OH O
C
CH3
O
0.88 0.12
+ CH CH2
OH
OHCCH3
OO-
H
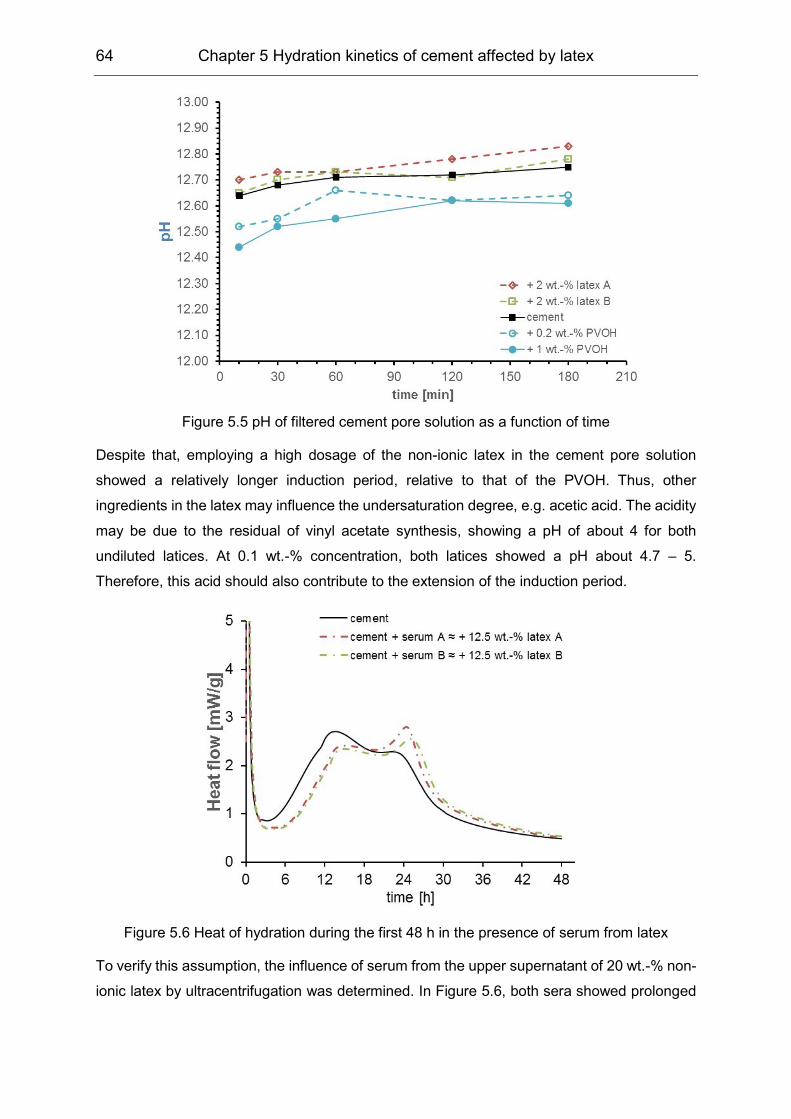
64 Chapter 5 Hydration kinetics of cement affected by latex
Figure 5.5 pH of filtered cement pore solution as a function of time
Despite that, employing a high dosage of the non-ionic latex in the cement pore solution
showed a relatively longer induction period, relative to that of the PVOH. Thus, other
ingredients in the latex may influence the undersaturation degree, e.g. acetic acid. The acidity
may be due to the residual of vinyl acetate synthesis, showing a pH of about 4 for both
undiluted latices. At 0.1 wt.-% concentration, both latices showed a pH about 4.7 – 5.
Therefore, this acid should also contribute to the extension of the induction period.
Figure 5.6 Heat of hydration during the first 48 h in the presence of serum from latex
To verify this assumption, the influence of serum from the upper supernatant of 20 wt.-% non-
ionic latex by ultracentrifugation was determined. In Figure 5.6, both sera showed prolonged
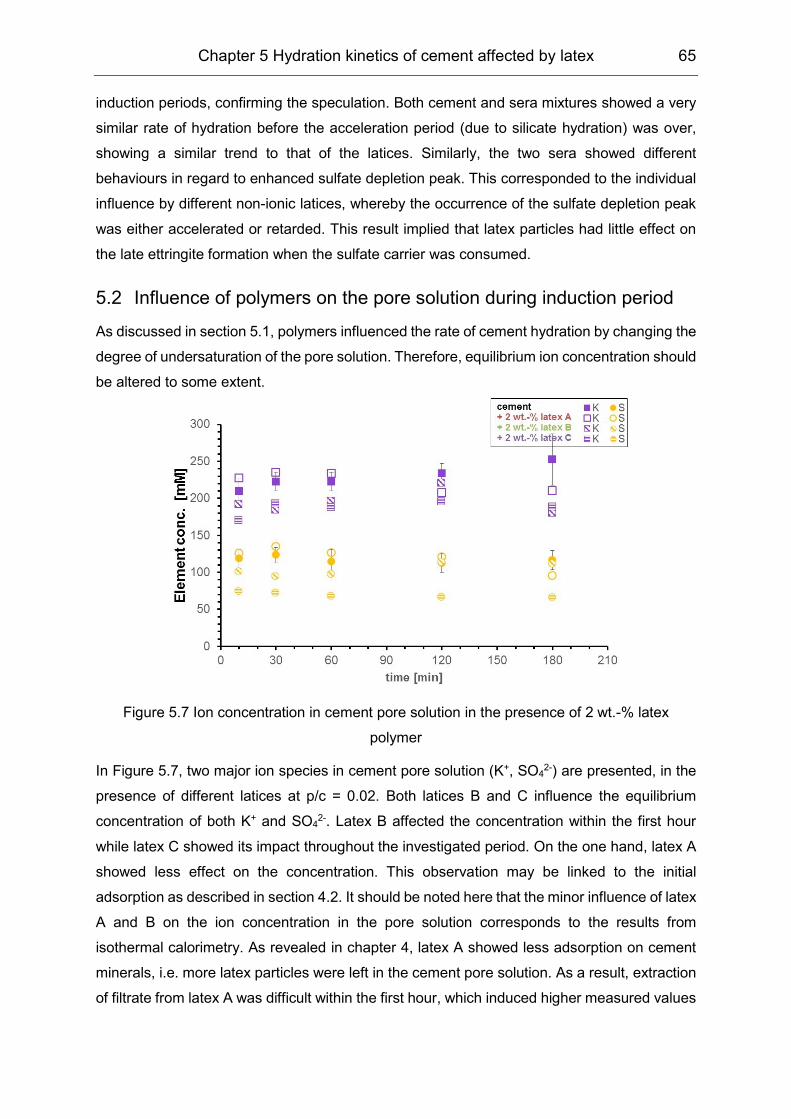
Chapter 5 Hydration kinetics of cement affected by latex 65
induction periods, confirming the speculation. Both cement and sera mixtures showed a very
similar rate of hydration before the acceleration period (due to silicate hydration) was over,
showing a similar trend to that of the latices. Similarly, the two sera showed different
behaviours in regard to enhanced sulfate depletion peak. This corresponded to the individual
influence by different non-ionic latices, whereby the occurrence of the sulfate depletion peak
was either accelerated or retarded. This result implied that latex particles had little effect on
the late ettringite formation when the sulfate carrier was consumed.
5.2 Influence of polymers on the pore solution during induction period
As discussed in section 5.1, polymers influenced the rate of cement hydration by changing the
degree of undersaturation of the pore solution. Therefore, equilibrium ion concentration should
be altered to some extent.
Figure 5.7 Ion concentration in cement pore solution in the presence of 2 wt.-% latex
polymer
In Figure 5.7, two major ion species in cement pore solution (K+, SO42-) are presented, in the
presence of different latices at p/c = 0.02. Both latices B and C influence the equilibrium
concentration of both K+ and SO42-. Latex B affected the concentration within the first hour
while latex C showed its impact throughout the investigated period. On the one hand, latex A
showed less effect on the concentration. This observation may be linked to the initial
adsorption as described in section 4.2. It should be noted here that the minor influence of latex
A and B on the ion concentration in the pore solution corresponds to the results from
isothermal calorimetry. As revealed in chapter 4, latex A showed less adsorption on cement
minerals, i.e. more latex particles were left in the cement pore solution. As a result, extraction
of filtrate from latex A was difficult within the first hour, which induced higher measured values
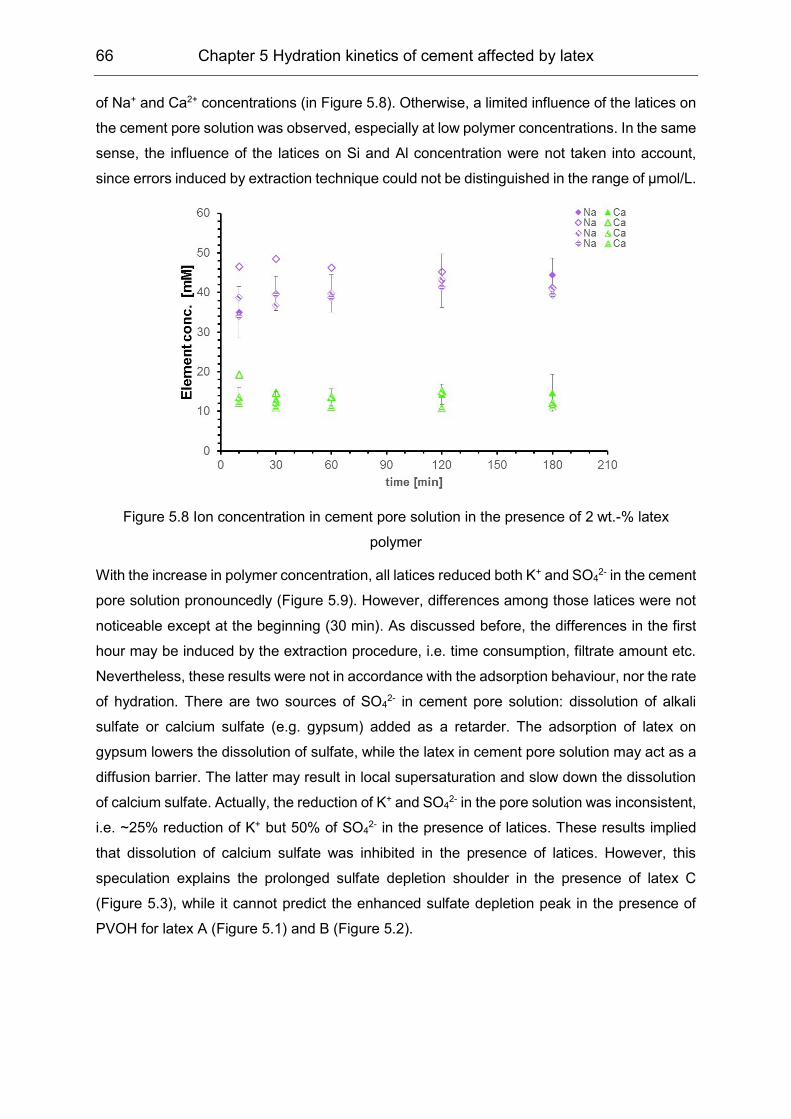
66 Chapter 5 Hydration kinetics of cement affected by latex
of Na+ and Ca2+ concentrations (in Figure 5.8). Otherwise, a limited influence of the latices on
the cement pore solution was observed, especially at low polymer concentrations. In the same
sense, the influence of the latices on Si and Al concentration were not taken into account,
since errors induced by extraction technique could not be distinguished in the range of µmol/L.
Figure 5.8 Ion concentration in cement pore solution in the presence of 2 wt.-% latex
polymer
With the increase in polymer concentration, all latices reduced both K+ and SO42- in the cement
pore solution pronouncedly (Figure 5.9). However, differences among those latices were not
noticeable except at the beginning (30 min). As discussed before, the differences in the first
hour may be induced by the extraction procedure, i.e. time consumption, filtrate amount etc.
Nevertheless, these results were not in accordance with the adsorption behaviour, nor the rate
of hydration. There are two sources of SO42- in cement pore solution: dissolution of alkali
sulfate or calcium sulfate (e.g. gypsum) added as a retarder. The adsorption of latex on
gypsum lowers the dissolution of sulfate, while the latex in cement pore solution may act as a
diffusion barrier. The latter may result in local supersaturation and slow down the dissolution
of calcium sulfate. Actually, the reduction of K+ and SO42- in the pore solution was inconsistent,
i.e. ~25% reduction of K+ but 50% of SO42- in the presence of latices. These results implied
that dissolution of calcium sulfate was inhibited in the presence of latices. However, this
speculation explains the prolonged sulfate depletion shoulder in the presence of latex C
(Figure 5.3), while it cannot predict the enhanced sulfate depletion peak in the presence of
PVOH for latex A (Figure 5.1) and B (Figure 5.2).
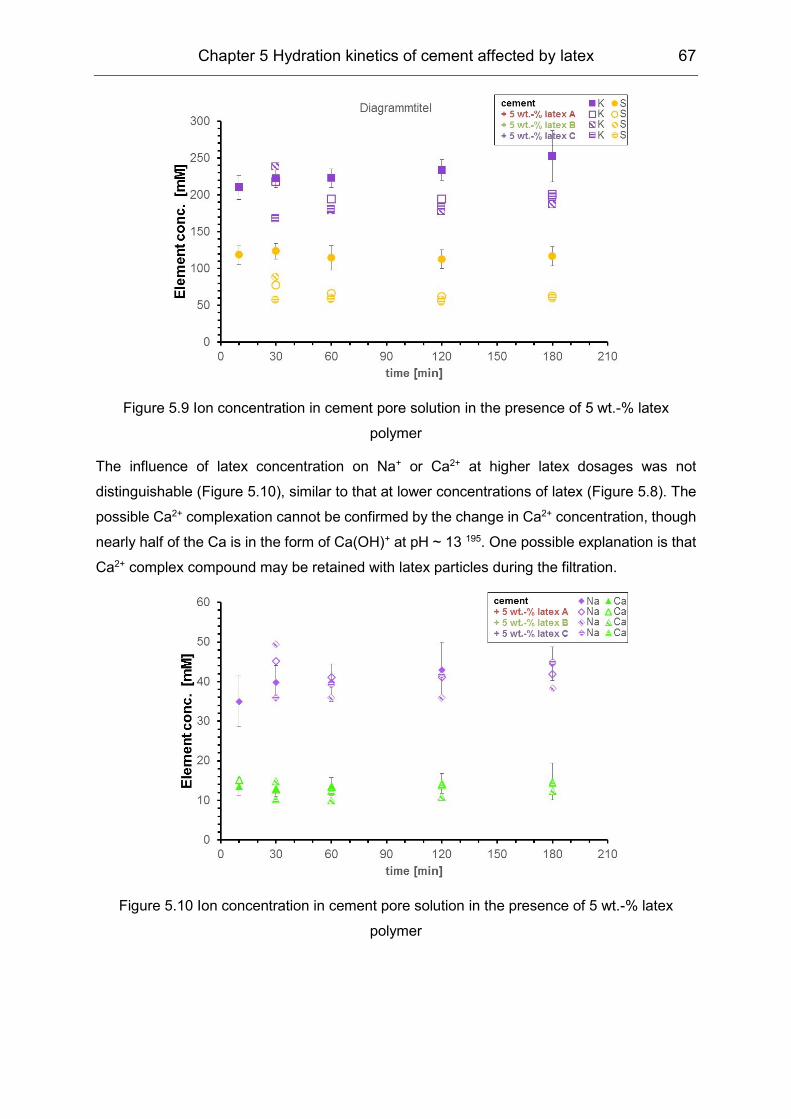
Chapter 5 Hydration kinetics of cement affected by latex 67
Figure 5.9 Ion concentration in cement pore solution in the presence of 5 wt.-% latex
polymer
The influence of latex concentration on Na+ or Ca2+ at higher latex dosages was not
distinguishable (Figure 5.10), similar to that at lower concentrations of latex (Figure 5.8). The
possible Ca2+ complexation cannot be confirmed by the change in Ca2+ concentration, though
nearly half of the Ca is in the form of Ca(OH)+ at pH ~ 13 195. One possible explanation is that
Ca2+ complex compound may be retained with latex particles during the filtration.
Figure 5.10 Ion concentration in cement pore solution in the presence of 5 wt.-% latex
polymer
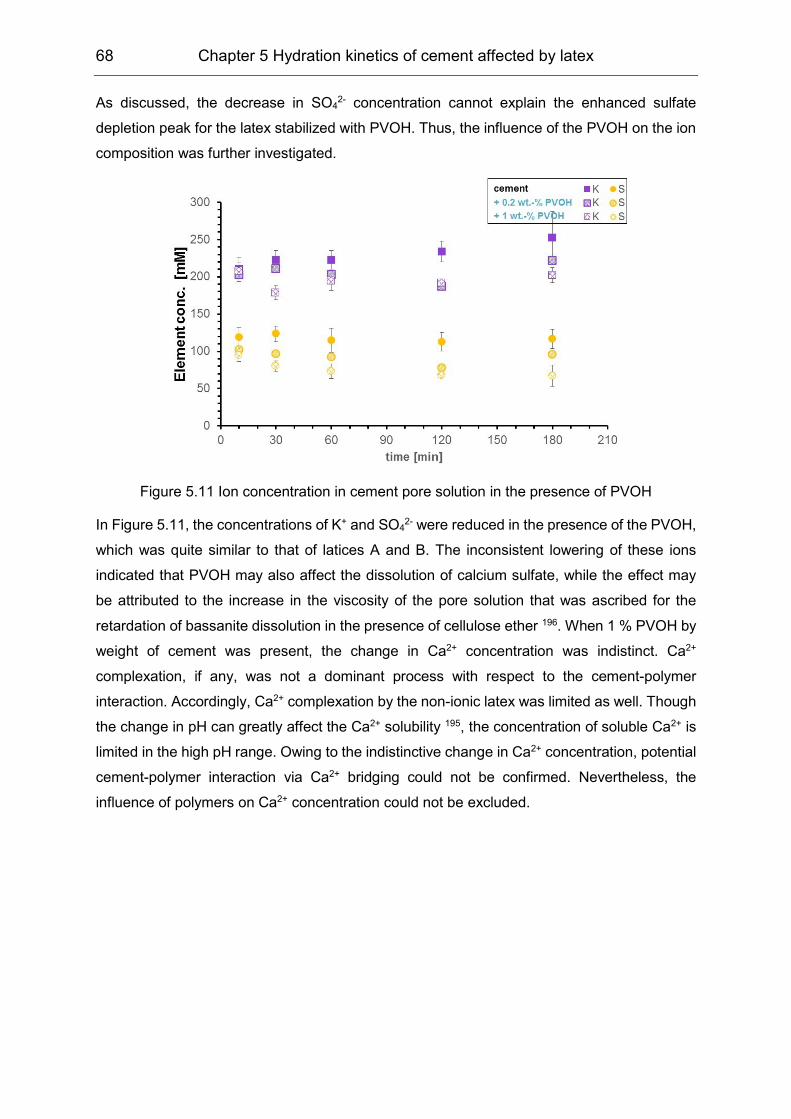
68 Chapter 5 Hydration kinetics of cement affected by latex
As discussed, the decrease in SO42- concentration cannot explain the enhanced sulfate
depletion peak for the latex stabilized with PVOH. Thus, the influence of the PVOH on the ion
composition was further investigated.
Figure 5.11 Ion concentration in cement pore solution in the presence of PVOH
In Figure 5.11, the concentrations of K+ and SO42- were reduced in the presence of the PVOH,
which was quite similar to that of latices A and B. The inconsistent lowering of these ions
indicated that PVOH may also affect the dissolution of calcium sulfate, while the effect may
be attributed to the increase in the viscosity of the pore solution that was ascribed for the
retardation of bassanite dissolution in the presence of cellulose ether 196. When 1 % PVOH by
weight of cement was present, the change in Ca2+ concentration was indistinct. Ca2+
complexation, if any, was not a dominant process with respect to the cement-polymer
interaction. Accordingly, Ca2+ complexation by the non-ionic latex was limited as well. Though
the change in pH can greatly affect the Ca2+ solubility 195, the concentration of soluble Ca2+ is
limited in the high pH range. Owing to the indistinctive change in Ca2+ concentration, potential
cement-polymer interaction via Ca2+ bridging could not be confirmed. Nevertheless, the
influence of polymers on Ca2+ concentration could not be excluded.
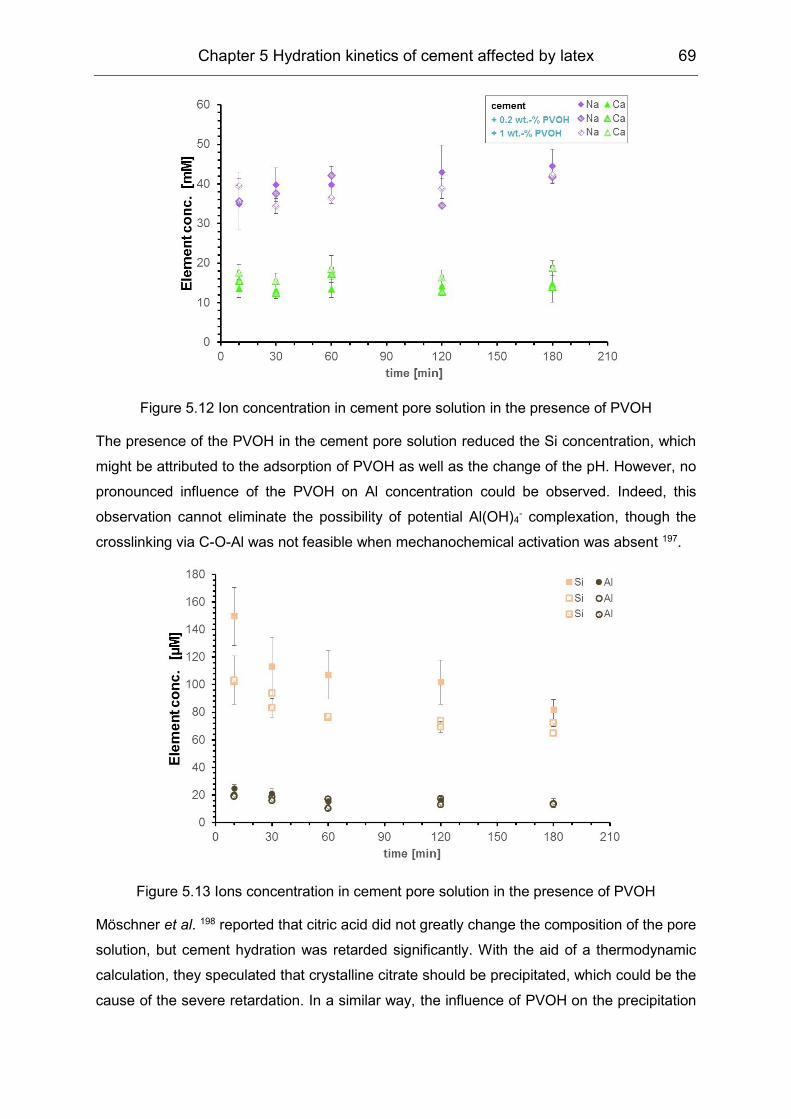
Chapter 5 Hydration kinetics of cement affected by latex 69
Figure 5.12 Ion concentration in cement pore solution in the presence of PVOH
The presence of the PVOH in the cement pore solution reduced the Si concentration, which
might be attributed to the adsorption of PVOH as well as the change of the pH. However, no
pronounced influence of the PVOH on Al concentration could be observed. Indeed, this
observation cannot eliminate the possibility of potential Al(OH)4- complexation, though the
crosslinking via C-O-Al was not feasible when mechanochemical activation was absent 197.
Figure 5.13 Ions concentration in cement pore solution in the presence of PVOH
Möschner et al. 198 reported that citric acid did not greatly change the composition of the pore
solution, but cement hydration was retarded significantly. With the aid of a thermodynamic
calculation, they speculated that crystalline citrate should be precipitated, which could be the
cause of the severe retardation. In a similar way, the influence of PVOH on the precipitation
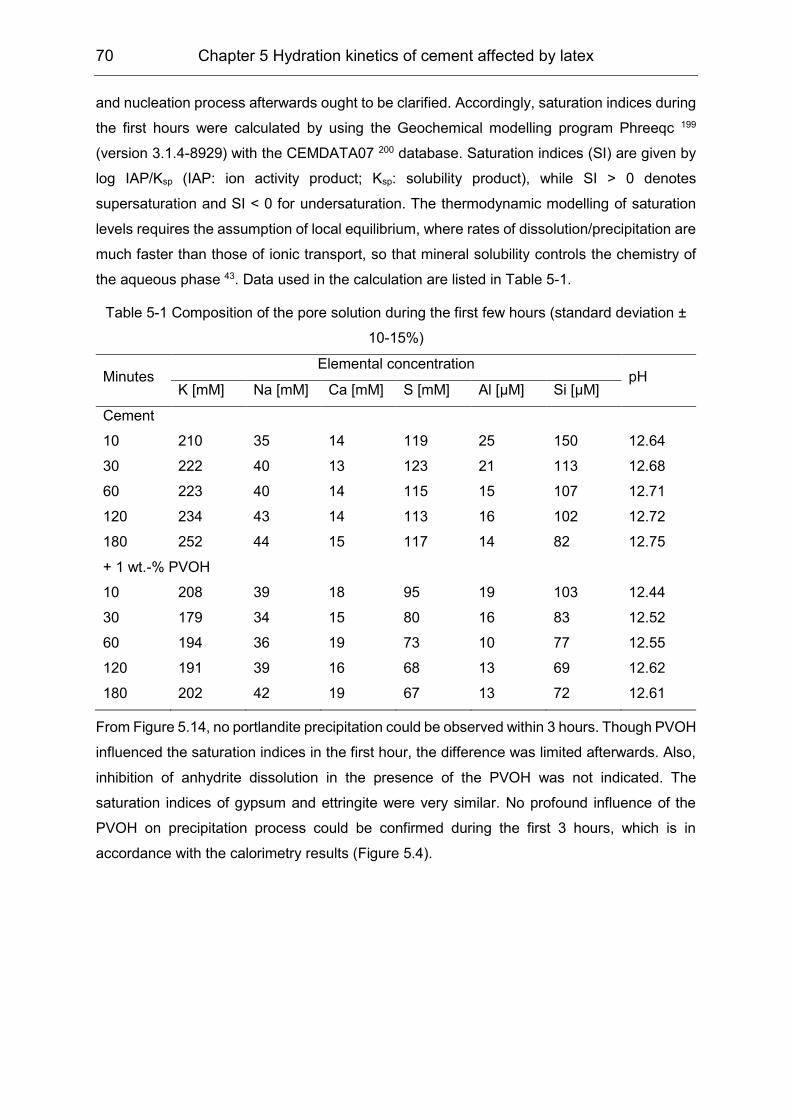
70 Chapter 5 Hydration kinetics of cement affected by latex
and nucleation process afterwards ought to be clarified. Accordingly, saturation indices during
the first hours were calculated by using the Geochemical modelling program Phreeqc 199
(version 3.1.4-8929) with the CEMDATA07 200 database. Saturation indices (SI) are given by
log IAP/Ksp (IAP: ion activity product; Ksp: solubility product), while SI > 0 denotes
supersaturation and SI < 0 for undersaturation. The thermodynamic modelling of saturation
levels requires the assumption of local equilibrium, where rates of dissolution/precipitation are
much faster than those of ionic transport, so that mineral solubility controls the chemistry of
the aqueous phase 43. Data used in the calculation are listed in Table 5-1.
Table 5-1 Composition of the pore solution during the first few hours (standard deviation ±
10-15%)
Minutes Elemental concentration
pH K [mM] Na [mM] Ca [mM] S [mM] Al [µM] Si [µM]
Cement
10 210 35 14 119 25 150 12.64
30 222 40 13 123 21 113 12.68
60 223 40 14 115 15 107 12.71
120 234 43 14 113 16 102 12.72
180 252 44 15 117 14 82 12.75
+ 1 wt.-% PVOH
10 208 39 18 95 19 103 12.44
30 179 34 15 80 16 83 12.52
60 194 36 19 73 10 77 12.55
120 191 39 16 68 13 69 12.62
180 202 42 19 67 13 72 12.61
From Figure 5.14, no portlandite precipitation could be observed within 3 hours. Though PVOH
influenced the saturation indices in the first hour, the difference was limited afterwards. Also,
inhibition of anhydrite dissolution in the presence of the PVOH was not indicated. The
saturation indices of gypsum and ettringite were very similar. No profound influence of the
PVOH on precipitation process could be confirmed during the first 3 hours, which is in
accordance with the calorimetry results (Figure 5.4).
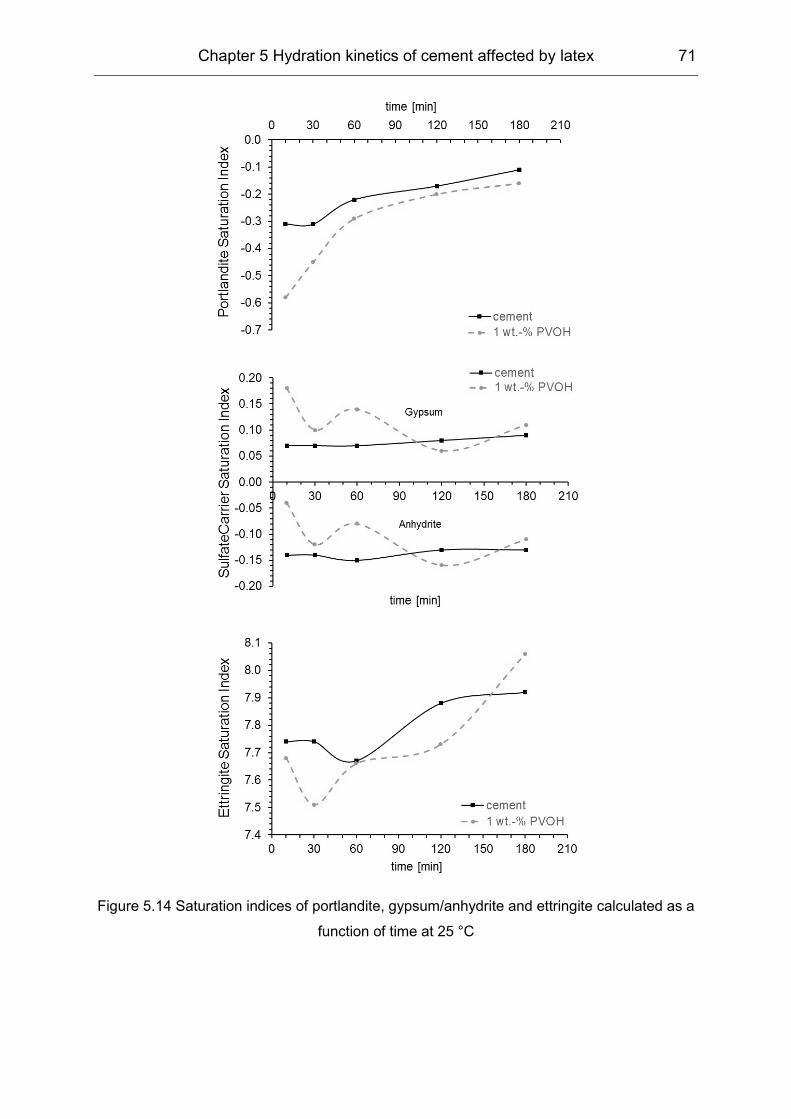
Chapter 5 Hydration kinetics of cement affected by latex 71
Figure 5.14 Saturation indices of portlandite, gypsum/anhydrite and ettringite calculated as a
function of time at 25 °C
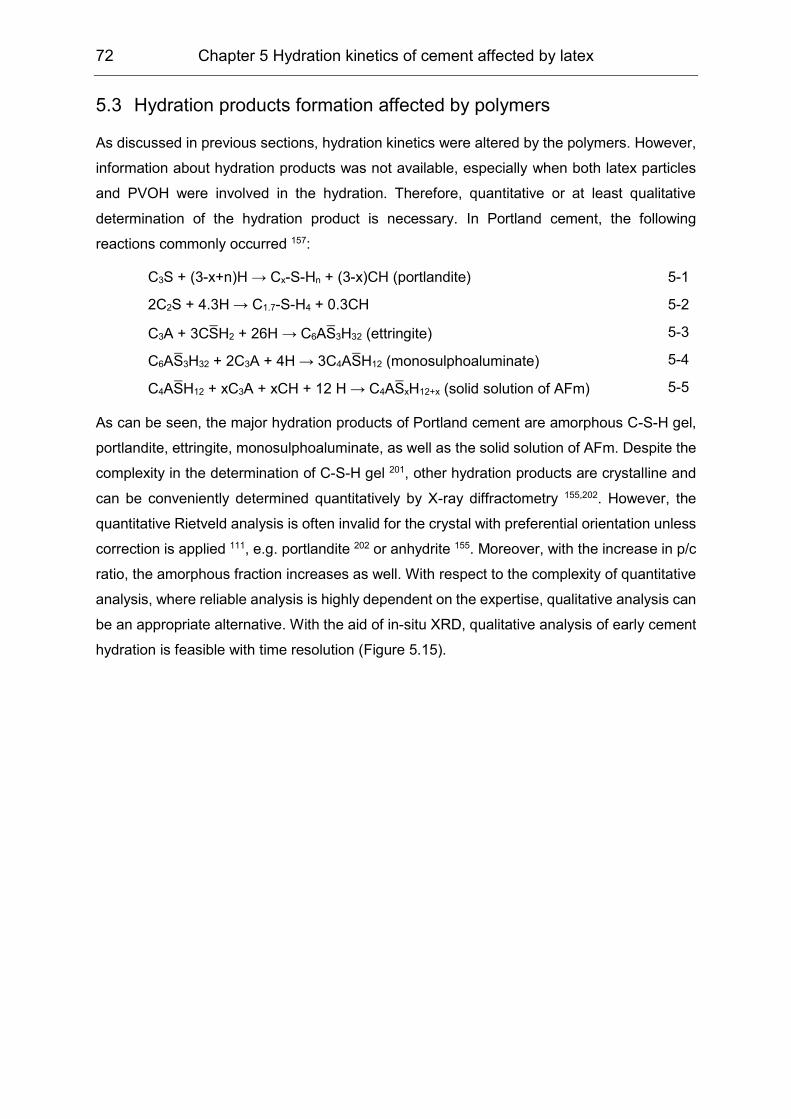
72 Chapter 5 Hydration kinetics of cement affected by latex
5.3 Hydration products formation affected by polymers
As discussed in previous sections, hydration kinetics were altered by the polymers. However,
information about hydration products was not available, especially when both latex particles
and PVOH were involved in the hydration. Therefore, quantitative or at least qualitative
determination of the hydration product is necessary. In Portland cement, the following
reactions commonly occurred 157:
C3S + (3-x+n)H → Cx-S-Hn + (3-x)CH (portlandite) 5-1
2C2S + 4.3H → C1.7-S-H4 + 0.3CH 5-2
C3A + 3CS̅H2 + 26H → C6AS̅3H32 (ettringite) 5-3
C6AS̅3H32 + 2C3A + 4H → 3C4AS̅H12 (monosulphoaluminate) 5-4
C4AS̅H12 + xC3A + xCH + 12 H → C4AS̅xH12+x (solid solution of AFm) 5-5
As can be seen, the major hydration products of Portland cement are amorphous C-S-H gel,
portlandite, ettringite, monosulphoaluminate, as well as the solid solution of AFm. Despite the
complexity in the determination of C-S-H gel 201, other hydration products are crystalline and
can be conveniently determined quantitatively by X-ray diffractometry 155,202. However, the
quantitative Rietveld analysis is often invalid for the crystal with preferential orientation unless
correction is applied 111, e.g. portlandite 202 or anhydrite 155. Moreover, with the increase in p/c
ratio, the amorphous fraction increases as well. With respect to the complexity of quantitative
analysis, where reliable analysis is highly dependent on the expertise, qualitative analysis can
be an appropriate alternative. With the aid of in-situ XRD, qualitative analysis of early cement
hydration is feasible with time resolution (Figure 5.15).
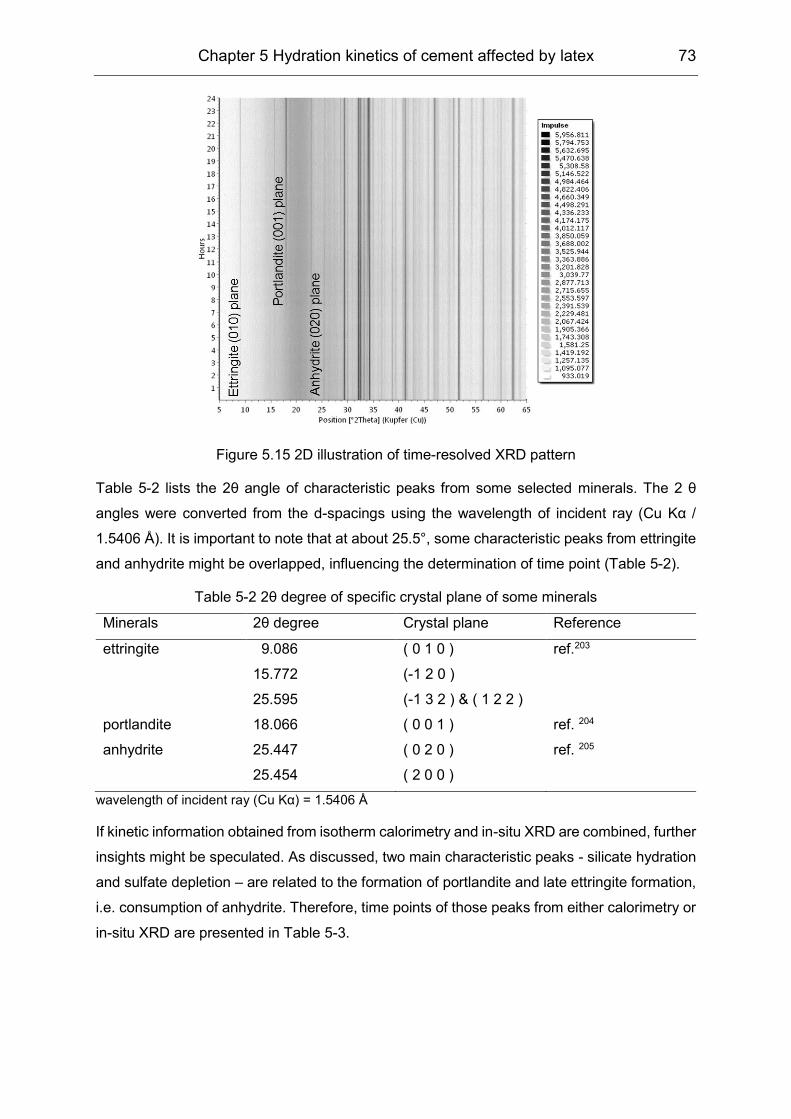
Chapter 5 Hydration kinetics of cement affected by latex 73
Figure 5.15 2D illustration of time-resolved XRD pattern
Table 5-2 lists the 2θ angle of characteristic peaks from some selected minerals. The 2 θ
angles were converted from the d-spacings using the wavelength of incident ray (Cu Kα /
1.5406 Å). It is important to note that at about 25.5°, some characteristic peaks from ettringite
and anhydrite might be overlapped, influencing the determination of time point (Table 5-2).
Table 5-2 2θ degree of specific crystal plane of some minerals
Minerals 2θ degree Crystal plane Reference
ettringite 9.086 ( 0 1 0 ) ref.203
15.772 (-1 2 0 )
25.595 (-1 3 2 ) & ( 1 2 2 )
portlandite 18.066 ( 0 0 1 ) ref. 204
anhydrite 25.447 ( 0 2 0 ) ref. 205
25.454 ( 2 0 0 )
wavelength of incident ray (Cu Kα) = 1.5406 Å
If kinetic information obtained from isotherm calorimetry and in-situ XRD are combined, further
insights might be speculated. As discussed, two main characteristic peaks - silicate hydration
and sulfate depletion – are related to the formation of portlandite and late ettringite formation,
i.e. consumption of anhydrite. Therefore, time points of those peaks from either calorimetry or
in-situ XRD are presented in Table 5-3.
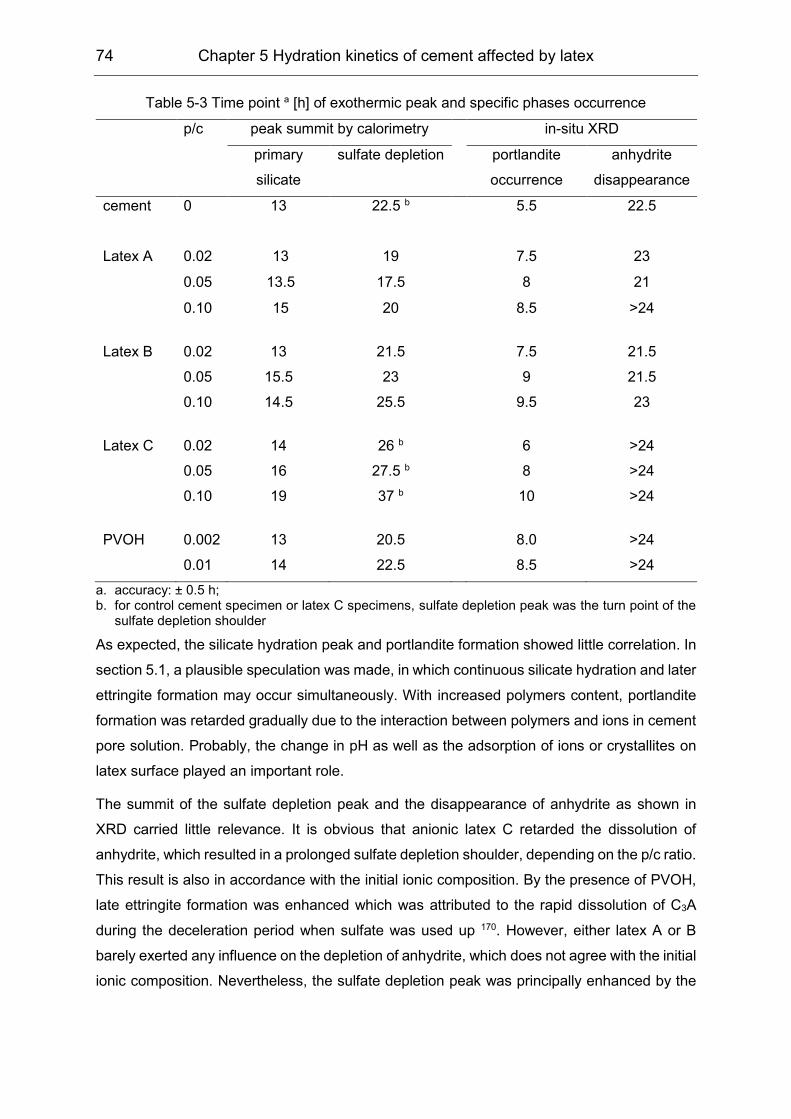
74 Chapter 5 Hydration kinetics of cement affected by latex
Table 5-3 Time point a [h] of exothermic peak and specific phases occurrence
p/c peak summit by calorimetry in-situ XRD
primary
silicate
sulfate depletion portlandite
occurrence
anhydrite
disappearance
cement 0 13 22.5 b 5.5 22.5
Latex A 0.02 13 19 7.5 23
0.05 13.5 17.5 8 21
0.10 15 20 8.5 >24
Latex B 0.02 13 21.5 7.5 21.5
0.05 15.5 23 9 21.5
0.10 14.5 25.5 9.5 23
Latex C 0.02 14 26 b 6 >24
0.05 16 27.5 b 8 >24
0.10 19 37 b 10 >24
PVOH 0.002 13 20.5 8.0 >24
0.01 14 22.5 8.5 >24
a. accuracy: ± 0.5 h; b. for control cement specimen or latex C specimens, sulfate depletion peak was the turn point of the
sulfate depletion shoulder
As expected, the silicate hydration peak and portlandite formation showed little correlation. In
section 5.1, a plausible speculation was made, in which continuous silicate hydration and later
ettringite formation may occur simultaneously. With increased polymers content, portlandite
formation was retarded gradually due to the interaction between polymers and ions in cement
pore solution. Probably, the change in pH as well as the adsorption of ions or crystallites on
latex surface played an important role.
The summit of the sulfate depletion peak and the disappearance of anhydrite as shown in
XRD carried little relevance. It is obvious that anionic latex C retarded the dissolution of
anhydrite, which resulted in a prolonged sulfate depletion shoulder, depending on the p/c ratio.
This result is also in accordance with the initial ionic composition. By the presence of PVOH,
late ettringite formation was enhanced which was attributed to the rapid dissolution of C3A
during the deceleration period when sulfate was used up 170. However, either latex A or B
barely exerted any influence on the depletion of anhydrite, which does not agree with the initial
ionic composition. Nevertheless, the sulfate depletion peak was principally enhanced by the
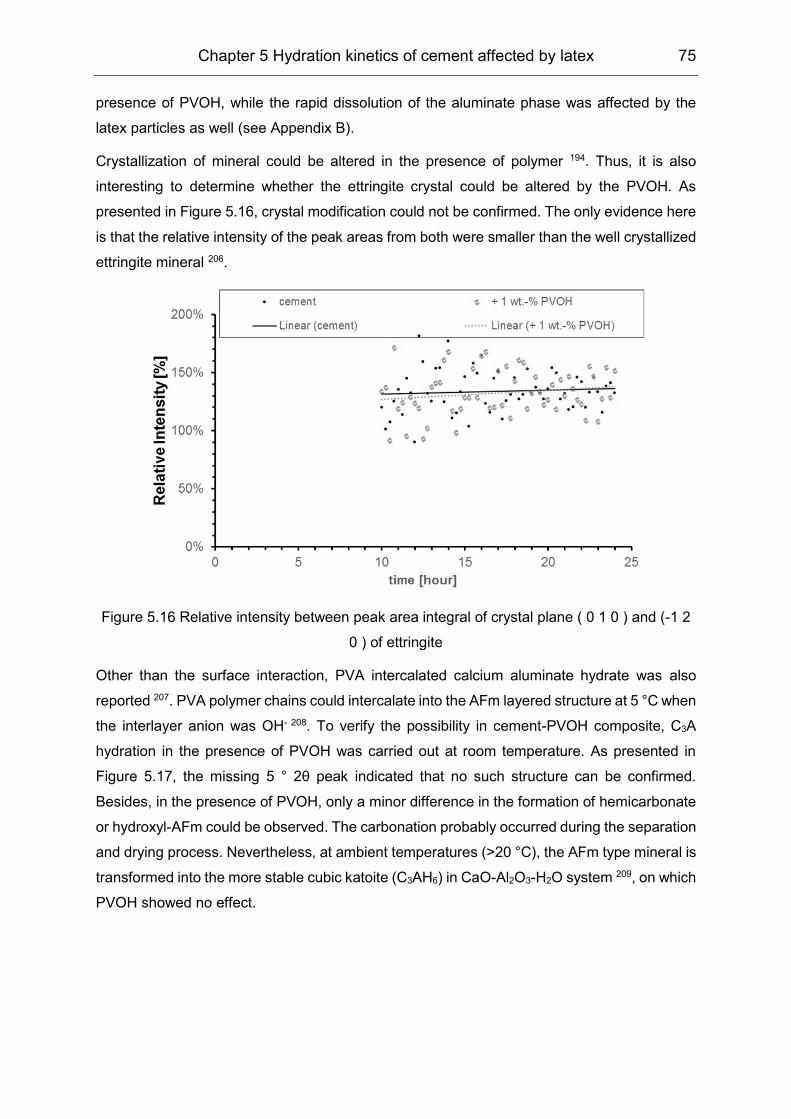
Chapter 5 Hydration kinetics of cement affected by latex 75
presence of PVOH, while the rapid dissolution of the aluminate phase was affected by the
latex particles as well (see Appendix B).
Crystallization of mineral could be altered in the presence of polymer 194. Thus, it is also
interesting to determine whether the ettringite crystal could be altered by the PVOH. As
presented in Figure 5.16, crystal modification could not be confirmed. The only evidence here
is that the relative intensity of the peak areas from both were smaller than the well crystallized
ettringite mineral 206.
Figure 5.16 Relative intensity between peak area integral of crystal plane ( 0 1 0 ) and (-1 2
0 ) of ettringite
Other than the surface interaction, PVA intercalated calcium aluminate hydrate was also
reported 207. PVA polymer chains could intercalate into the AFm layered structure at 5 °C when
the interlayer anion was OH- 208. To verify the possibility in cement-PVOH composite, C3A
hydration in the presence of PVOH was carried out at room temperature. As presented in
Figure 5.17, the missing 5 ° 2θ peak indicated that no such structure can be confirmed.
Besides, in the presence of PVOH, only a minor difference in the formation of hemicarbonate
or hydroxyl-AFm could be observed. The carbonation probably occurred during the separation
and drying process. Nevertheless, at ambient temperatures (>20 °C), the AFm type mineral is
transformed into the more stable cubic katoite (C3AH6) in CaO-Al2O3-H2O system 209, on which
PVOH showed no effect.
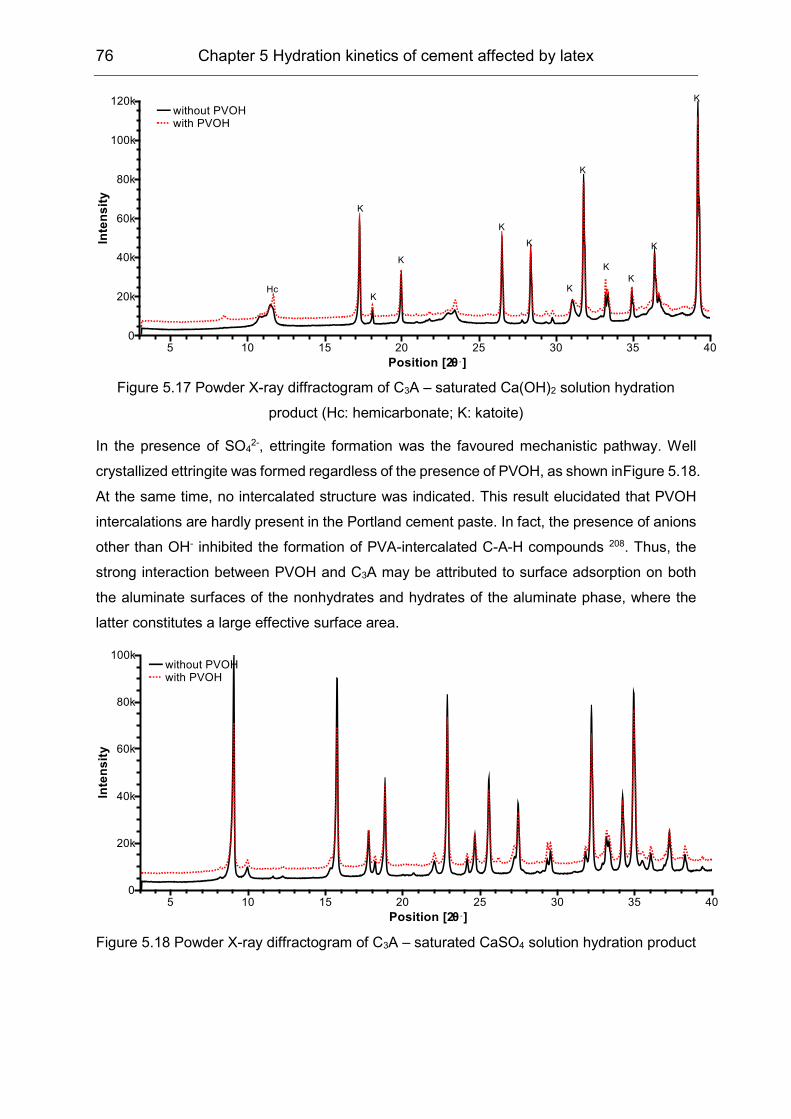
76 Chapter 5 Hydration kinetics of cement affected by latex
Figure 5.17 Powder X-ray diffractogram of C3A – saturated Ca(OH)2 solution hydration
product (Hc: hemicarbonate; K: katoite)
In the presence of SO42-, ettringite formation was the favoured mechanistic pathway. Well
crystallized ettringite was formed regardless of the presence of PVOH, as shown inFigure 5.18.
At the same time, no intercalated structure was indicated. This result elucidated that PVOH
intercalations are hardly present in the Portland cement paste. In fact, the presence of anions
other than OH- inhibited the formation of PVA-intercalated C-A-H compounds 208. Thus, the
strong interaction between PVOH and C3A may be attributed to surface adsorption on both
the aluminate surfaces of the nonhydrates and hydrates of the aluminate phase, where the
latter constitutes a large effective surface area.
Figure 5.18 Powder X-ray diffractogram of C3A – saturated CaSO4 solution hydration product
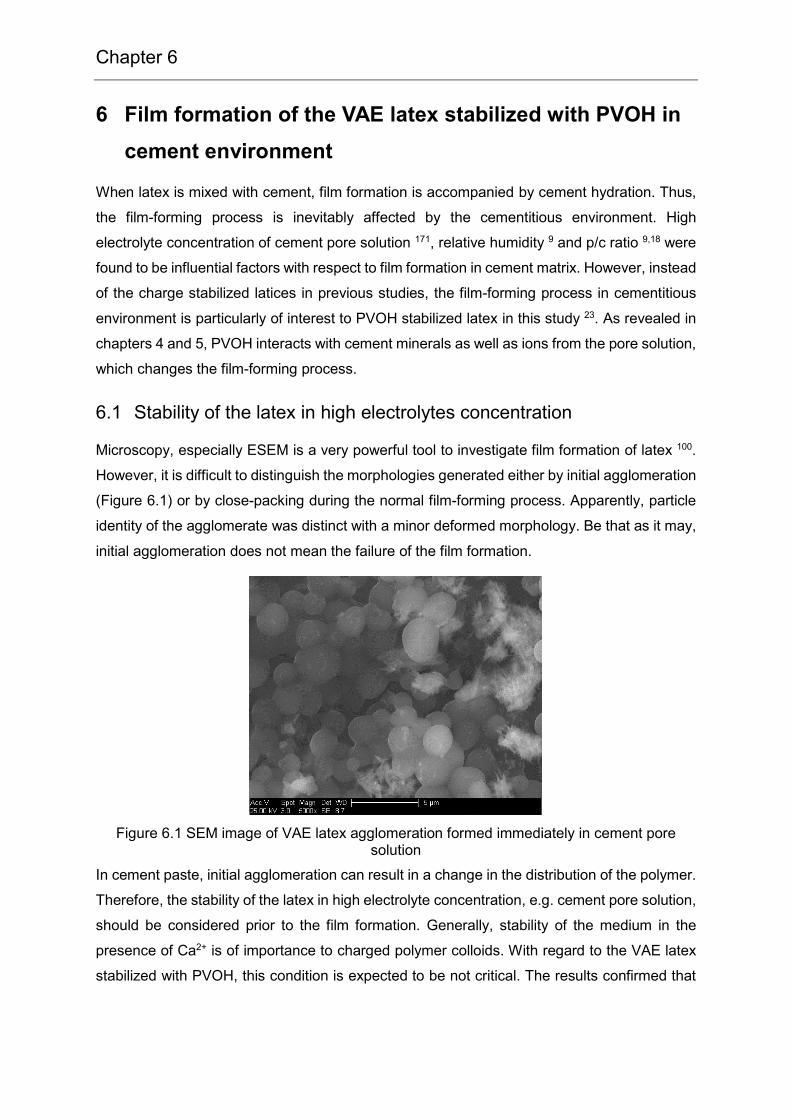
Chapter 6
6 Film formation of the VAE latex stabilized with PVOH in
cement environment
When latex is mixed with cement, film formation is accompanied by cement hydration. Thus,
the film-forming process is inevitably affected by the cementitious environment. High
electrolyte concentration of cement pore solution 171, relative humidity 9 and p/c ratio 9,18 were
found to be influential factors with respect to film formation in cement matrix. However, instead
of the charge stabilized latices in previous studies, the film-forming process in cementitious
environment is particularly of interest to PVOH stabilized latex in this study 23. As revealed in
chapters 4 and 5, PVOH interacts with cement minerals as well as ions from the pore solution,
which changes the film-forming process.
6.1 Stability of the latex in high electrolytes concentration
Microscopy, especially ESEM is a very powerful tool to investigate film formation of latex 100.
However, it is difficult to distinguish the morphologies generated either by initial agglomeration
(Figure 6.1) or by close-packing during the normal film-forming process. Apparently, particle
identity of the agglomerate was distinct with a minor deformed morphology. Be that as it may,
initial agglomeration does not mean the failure of the film formation.
Figure 6.1 SEM image of VAE latex agglomeration formed immediately in cement pore solution
In cement paste, initial agglomeration can result in a change in the distribution of the polymer.
Therefore, the stability of the latex in high electrolyte concentration, e.g. cement pore solution,
should be considered prior to the film formation. Generally, stability of the medium in the
presence of Ca2+ is of importance to charged polymer colloids. With regard to the VAE latex
stabilized with PVOH, this condition is expected to be not critical. The results confirmed that
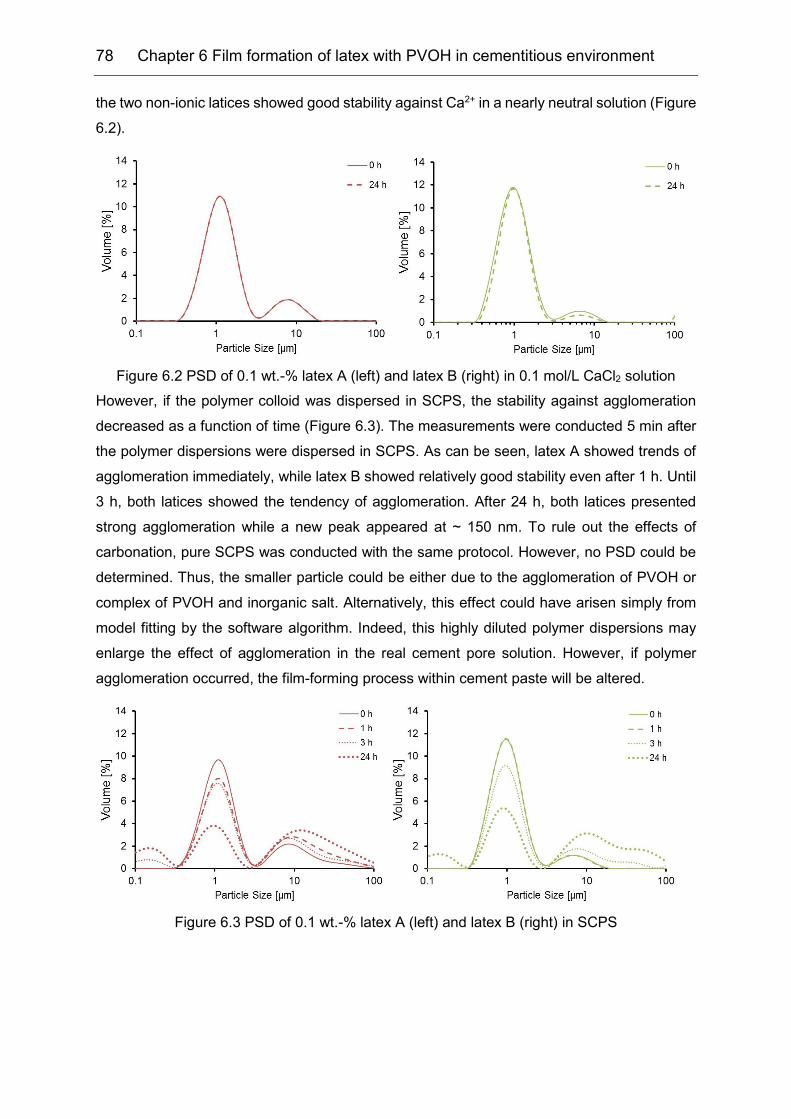
78 Chapter 6 Film formation of latex with PVOH in cementitious environment
the two non-ionic latices showed good stability against Ca2+ in a nearly neutral solution (Figure
6.2).
Figure 6.2 PSD of 0.1 wt.-% latex A (left) and latex B (right) in 0.1 mol/L CaCl2 solution
However, if the polymer colloid was dispersed in SCPS, the stability against agglomeration
decreased as a function of time (Figure 6.3). The measurements were conducted 5 min after
the polymer dispersions were dispersed in SCPS. As can be seen, latex A showed trends of
agglomeration immediately, while latex B showed relatively good stability even after 1 h. Until
3 h, both latices showed the tendency of agglomeration. After 24 h, both latices presented
strong agglomeration while a new peak appeared at ~ 150 nm. To rule out the effects of
carbonation, pure SCPS was conducted with the same protocol. However, no PSD could be
determined. Thus, the smaller particle could be either due to the agglomeration of PVOH or
complex of PVOH and inorganic salt. Alternatively, this effect could have arisen simply from
model fitting by the software algorithm. Indeed, this highly diluted polymer dispersions may
enlarge the effect of agglomeration in the real cement pore solution. However, if polymer
agglomeration occurred, the film-forming process within cement paste will be altered.
Figure 6.3 PSD of 0.1 wt.-% latex A (left) and latex B (right) in SCPS
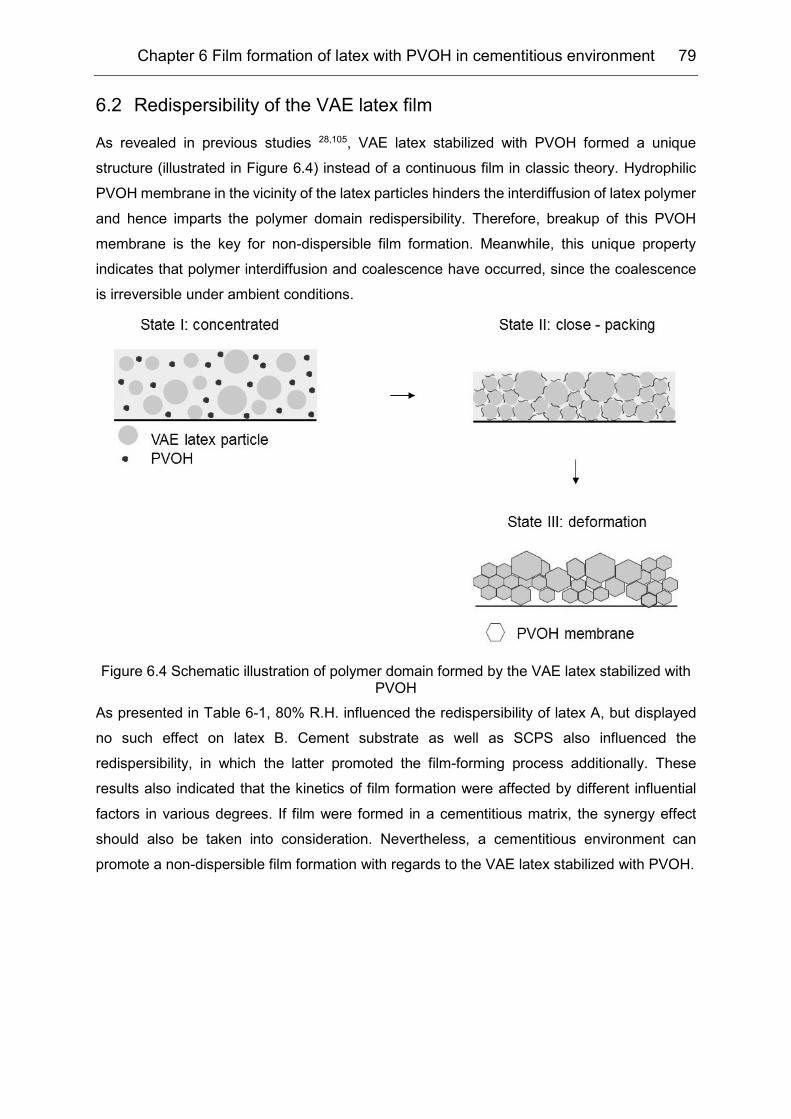
Chapter 6 Film formation of latex with PVOH in cementitious environment 79
6.2 Redispersibility of the VAE latex film
As revealed in previous studies 28,105, VAE latex stabilized with PVOH formed a unique
structure (illustrated in Figure 6.4) instead of a continuous film in classic theory. Hydrophilic
PVOH membrane in the vicinity of the latex particles hinders the interdiffusion of latex polymer
and hence imparts the polymer domain redispersibility. Therefore, breakup of this PVOH
membrane is the key for non-dispersible film formation. Meanwhile, this unique property
indicates that polymer interdiffusion and coalescence have occurred, since the coalescence
is irreversible under ambient conditions.
Figure 6.4 Schematic illustration of polymer domain formed by the VAE latex stabilized with PVOH
As presented in Table 6-1, 80% R.H. influenced the redispersibility of latex A, but displayed
no such effect on latex B. Cement substrate as well as SCPS also influenced the
redispersibility, in which the latter promoted the film-forming process additionally. These
results also indicated that the kinetics of film formation were affected by different influential
factors in various degrees. If film were formed in a cementitious matrix, the synergy effect
should also be taken into consideration. Nevertheless, a cementitious environment can
promote a non-dispersible film formation with regards to the VAE latex stabilized with PVOH.
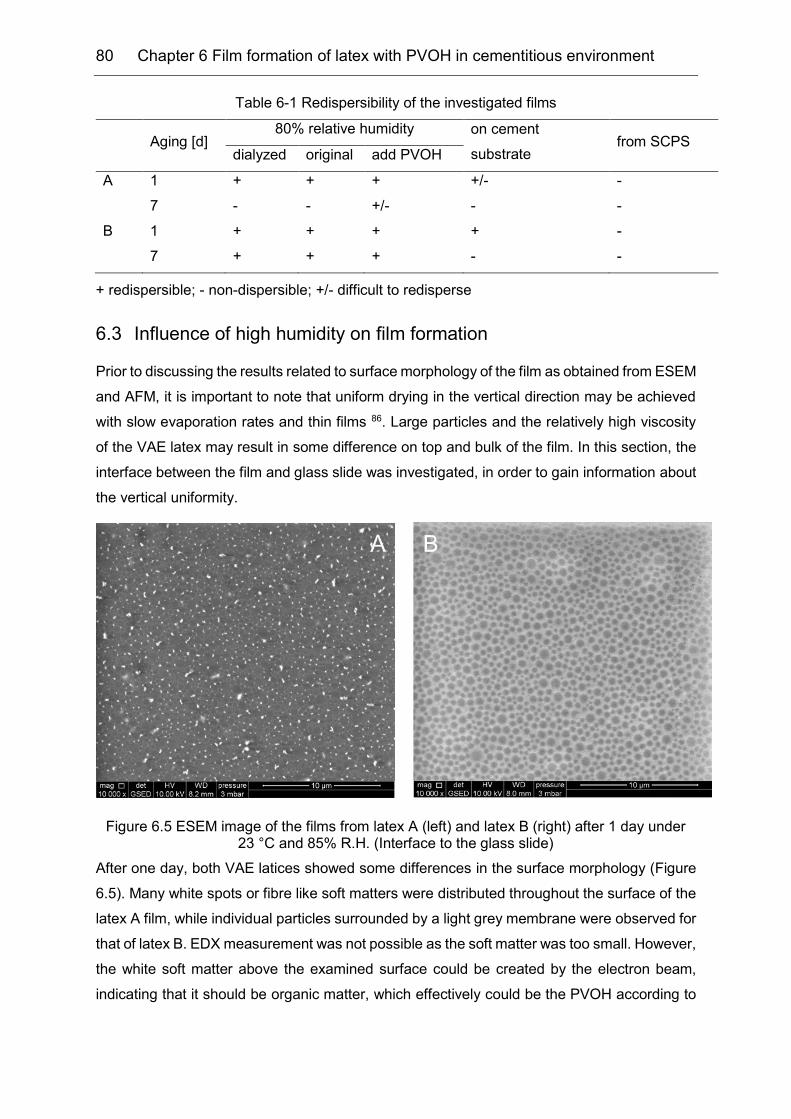
80 Chapter 6 Film formation of latex with PVOH in cementitious environment
Table 6-1 Redispersibility of the investigated films
Aging [d]
80% relative humidity on cement
substrate from SCPS
dialyzed original add PVOH
A 1 + + + +/- -
7 - - +/- - -
B 1 + + + + -
7 + + + - -
+ redispersible; - non-dispersible; +/- difficult to redisperse
6.3 Influence of high humidity on film formation
Prior to discussing the results related to surface morphology of the film as obtained from ESEM
and AFM, it is important to note that uniform drying in the vertical direction may be achieved
with slow evaporation rates and thin films 86. Large particles and the relatively high viscosity
of the VAE latex may result in some difference on top and bulk of the film. In this section, the
interface between the film and glass slide was investigated, in order to gain information about
the vertical uniformity.
Figure 6.5 ESEM image of the films from latex A (left) and latex B (right) after 1 day under 23 °C and 85% R.H. (Interface to the glass slide)
After one day, both VAE latices showed some differences in the surface morphology (Figure
6.5). Many white spots or fibre like soft matters were distributed throughout the surface of the
latex A film, while individual particles surrounded by a light grey membrane were observed for
that of latex B. EDX measurement was not possible as the soft matter was too small. However,
the white soft matter above the examined surface could be created by the electron beam,
indicating that it should be organic matter, which effectively could be the PVOH according to
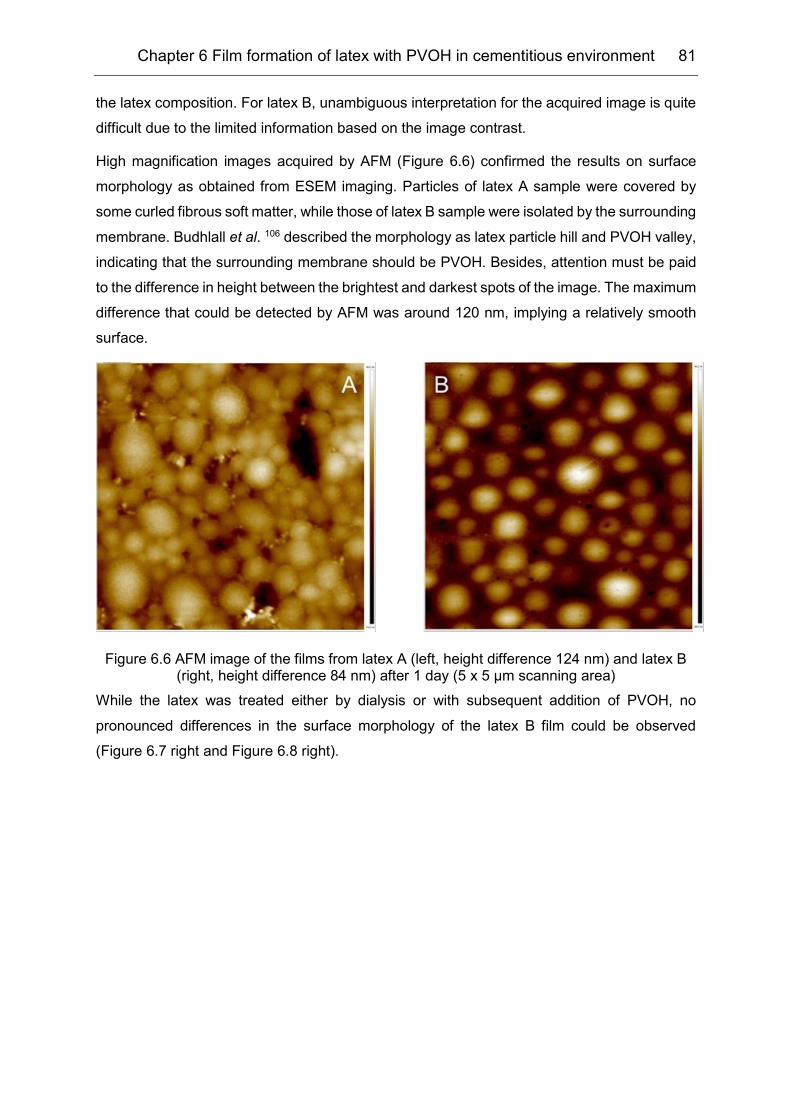
Chapter 6 Film formation of latex with PVOH in cementitious environment 81
the latex composition. For latex B, unambiguous interpretation for the acquired image is quite
difficult due to the limited information based on the image contrast.
High magnification images acquired by AFM (Figure 6.6) confirmed the results on surface
morphology as obtained from ESEM imaging. Particles of latex A sample were covered by
some curled fibrous soft matter, while those of latex B sample were isolated by the surrounding
membrane. Budhlall et al. 106 described the morphology as latex particle hill and PVOH valley,
indicating that the surrounding membrane should be PVOH. Besides, attention must be paid
to the difference in height between the brightest and darkest spots of the image. The maximum
difference that could be detected by AFM was around 120 nm, implying a relatively smooth
surface.
Figure 6.6 AFM image of the films from latex A (left, height difference 124 nm) and latex B (right, height difference 84 nm) after 1 day (5 x 5 µm scanning area)
While the latex was treated either by dialysis or with subsequent addition of PVOH, no
pronounced differences in the surface morphology of the latex B film could be observed
(Figure 6.7 right and Figure 6.8 right).
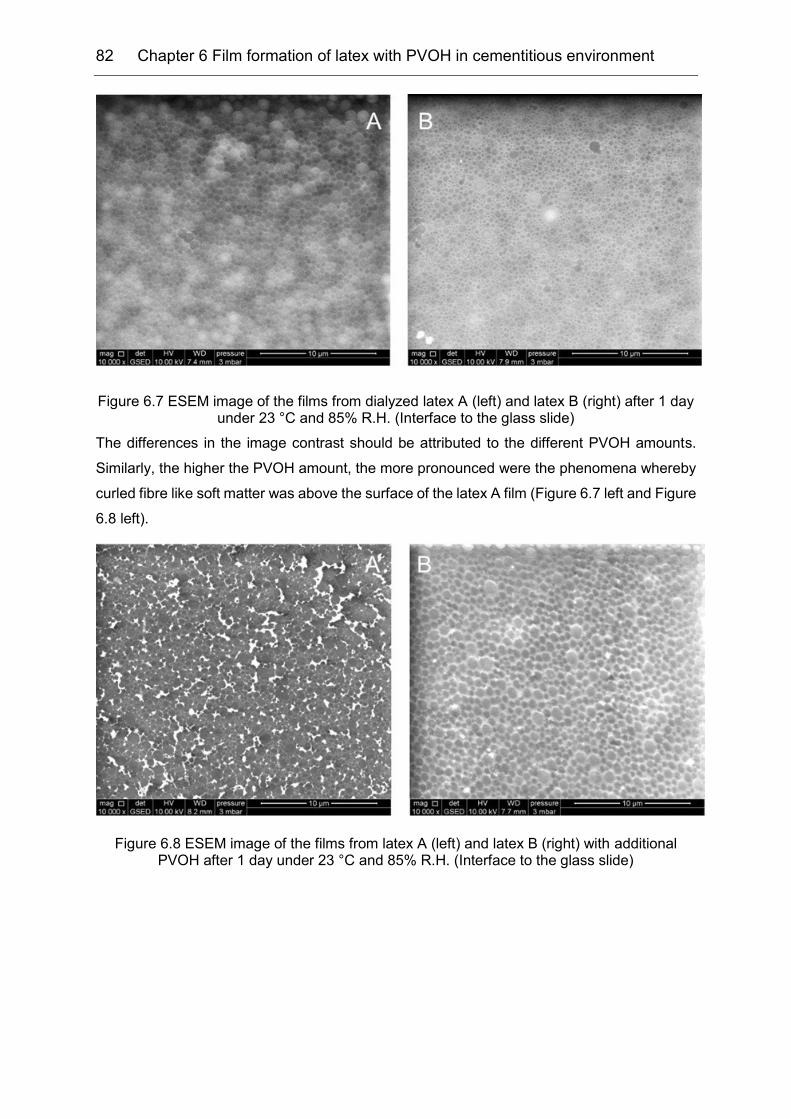
82 Chapter 6 Film formation of latex with PVOH in cementitious environment
Figure 6.7 ESEM image of the films from dialyzed latex A (left) and latex B (right) after 1 day under 23 °C and 85% R.H. (Interface to the glass slide)
The differences in the image contrast should be attributed to the different PVOH amounts.
Similarly, the higher the PVOH amount, the more pronounced were the phenomena whereby
curled fibre like soft matter was above the surface of the latex A film (Figure 6.7 left and Figure
6.8 left).
Figure 6.8 ESEM image of the films from latex A (left) and latex B (right) with additional PVOH after 1 day under 23 °C and 85% R.H. (Interface to the glass slide)
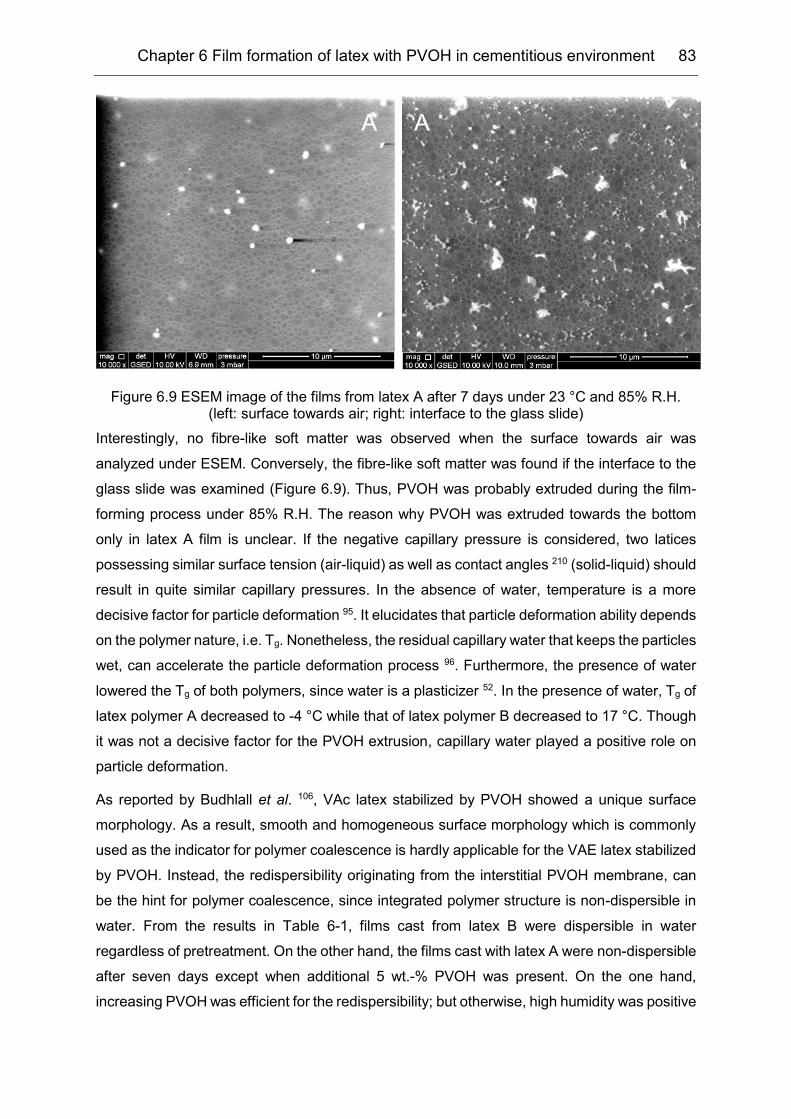
Chapter 6 Film formation of latex with PVOH in cementitious environment 83
Figure 6.9 ESEM image of the films from latex A after 7 days under 23 °C and 85% R.H. (left: surface towards air; right: interface to the glass slide)
Interestingly, no fibre-like soft matter was observed when the surface towards air was
analyzed under ESEM. Conversely, the fibre-like soft matter was found if the interface to the
glass slide was examined (Figure 6.9). Thus, PVOH was probably extruded during the film-
forming process under 85% R.H. The reason why PVOH was extruded towards the bottom
only in latex A film is unclear. If the negative capillary pressure is considered, two latices
possessing similar surface tension (air-liquid) as well as contact angles 210 (solid-liquid) should
result in quite similar capillary pressures. In the absence of water, temperature is a more
decisive factor for particle deformation 95. It elucidates that particle deformation ability depends
on the polymer nature, i.e. Tg. Nonetheless, the residual capillary water that keeps the particles
wet, can accelerate the particle deformation process 96. Furthermore, the presence of water
lowered the Tg of both polymers, since water is a plasticizer 52. In the presence of water, Tg of
latex polymer A decreased to -4 °C while that of latex polymer B decreased to 17 °C. Though
it was not a decisive factor for the PVOH extrusion, capillary water played a positive role on
particle deformation.
As reported by Budhlall et al. 106, VAc latex stabilized by PVOH showed a unique surface
morphology. As a result, smooth and homogeneous surface morphology which is commonly
used as the indicator for polymer coalescence is hardly applicable for the VAE latex stabilized
by PVOH. Instead, the redispersibility originating from the interstitial PVOH membrane, can
be the hint for polymer coalescence, since integrated polymer structure is non-dispersible in
water. From the results in Table 6-1, films cast from latex B were dispersible in water
regardless of pretreatment. On the other hand, the films cast with latex A were non-dispersible
after seven days except when additional 5 wt.-% PVOH was present. On the one hand,
increasing PVOH was efficient for the redispersibility; but otherwise, high humidity was positive
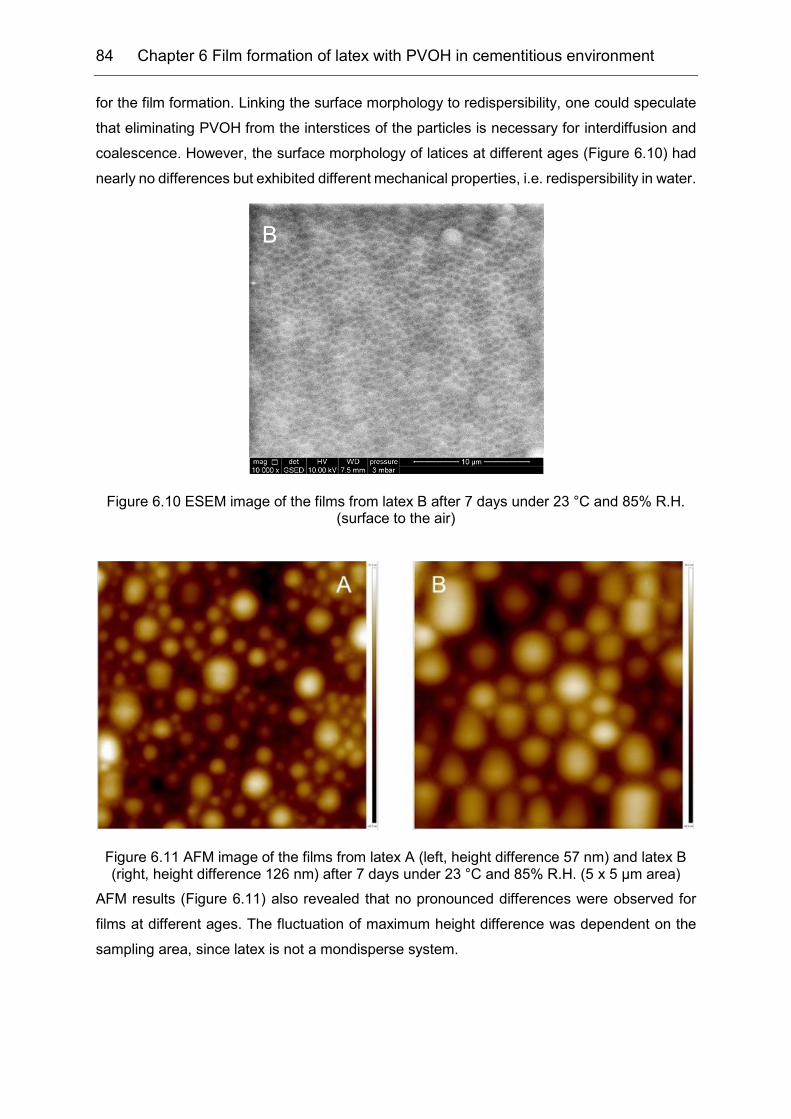
84 Chapter 6 Film formation of latex with PVOH in cementitious environment
for the film formation. Linking the surface morphology to redispersibility, one could speculate
that eliminating PVOH from the interstices of the particles is necessary for interdiffusion and
coalescence. However, the surface morphology of latices at different ages (Figure 6.10) had
nearly no differences but exhibited different mechanical properties, i.e. redispersibility in water.
Figure 6.10 ESEM image of the films from latex B after 7 days under 23 °C and 85% R.H. (surface to the air)
Figure 6.11 AFM image of the films from latex A (left, height difference 57 nm) and latex B (right, height difference 126 nm) after 7 days under 23 °C and 85% R.H. (5 x 5 µm area)
AFM results (Figure 6.11) also revealed that no pronounced differences were observed for
films at different ages. The fluctuation of maximum height difference was dependent on the
sampling area, since latex is not a mondisperse system.
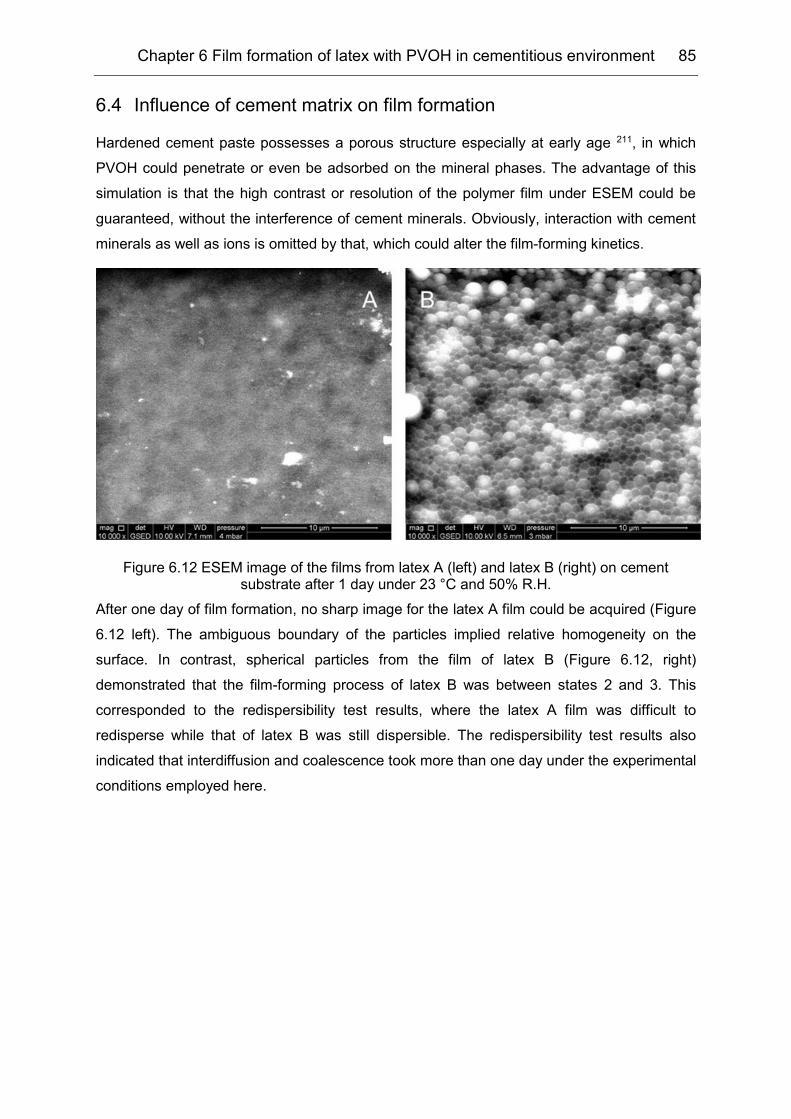
Chapter 6 Film formation of latex with PVOH in cementitious environment 85
6.4 Influence of cement matrix on film formation
Hardened cement paste possesses a porous structure especially at early age 211, in which
PVOH could penetrate or even be adsorbed on the mineral phases. The advantage of this
simulation is that the high contrast or resolution of the polymer film under ESEM could be
guaranteed, without the interference of cement minerals. Obviously, interaction with cement
minerals as well as ions is omitted by that, which could alter the film-forming kinetics.
Figure 6.12 ESEM image of the films from latex A (left) and latex B (right) on cement substrate after 1 day under 23 °C and 50% R.H.
After one day of film formation, no sharp image for the latex A film could be acquired (Figure
6.12 left). The ambiguous boundary of the particles implied relative homogeneity on the
surface. In contrast, spherical particles from the film of latex B (Figure 6.12, right)
demonstrated that the film-forming process of latex B was between states 2 and 3. This
corresponded to the redispersibility test results, where the latex A film was difficult to
redisperse while that of latex B was still dispersible. The redispersibility test results also
indicated that interdiffusion and coalescence took more than one day under the experimental
conditions employed here.
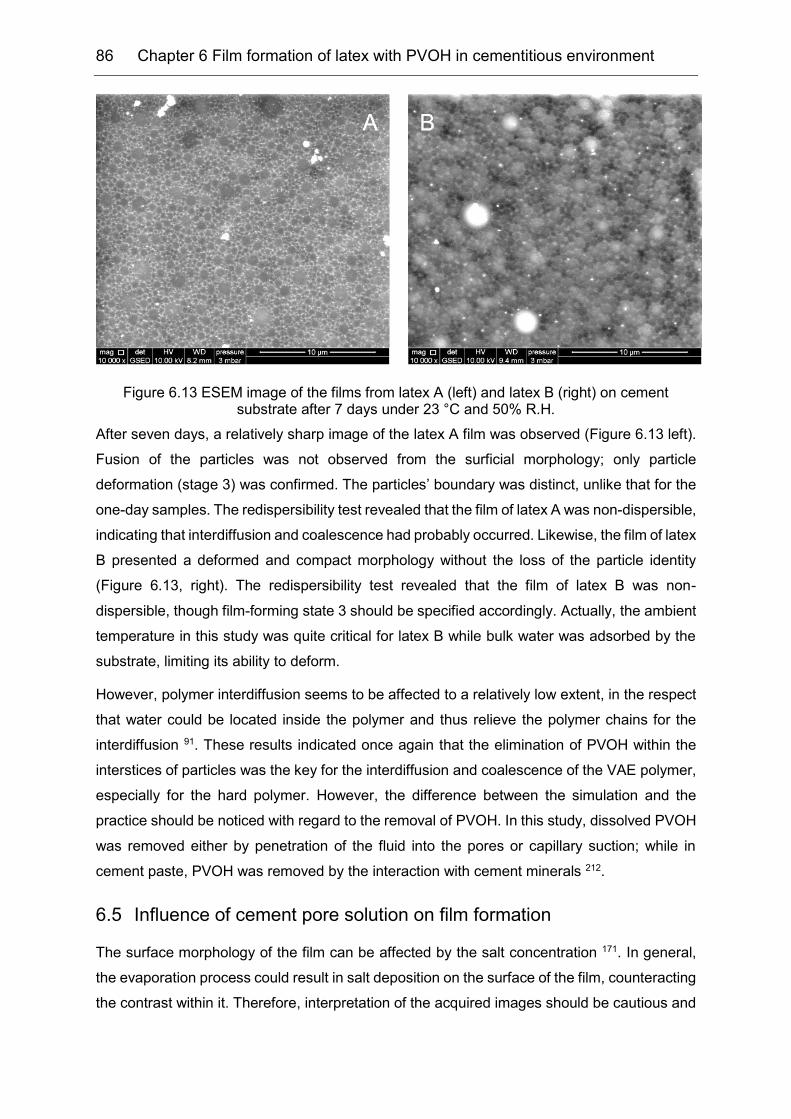
86 Chapter 6 Film formation of latex with PVOH in cementitious environment
Figure 6.13 ESEM image of the films from latex A (left) and latex B (right) on cement substrate after 7 days under 23 °C and 50% R.H.
After seven days, a relatively sharp image of the latex A film was observed (Figure 6.13 left).
Fusion of the particles was not observed from the surficial morphology; only particle
deformation (stage 3) was confirmed. The particles’ boundary was distinct, unlike that for the
one-day samples. The redispersibility test revealed that the film of latex A was non-dispersible,
indicating that interdiffusion and coalescence had probably occurred. Likewise, the film of latex
B presented a deformed and compact morphology without the loss of the particle identity
(Figure 6.13, right). The redispersibility test revealed that the film of latex B was non-
dispersible, though film-forming state 3 should be specified accordingly. Actually, the ambient
temperature in this study was quite critical for latex B while bulk water was adsorbed by the
substrate, limiting its ability to deform.
However, polymer interdiffusion seems to be affected to a relatively low extent, in the respect
that water could be located inside the polymer and thus relieve the polymer chains for the
interdiffusion 91. These results indicated once again that the elimination of PVOH within the
interstices of particles was the key for the interdiffusion and coalescence of the VAE polymer,
especially for the hard polymer. However, the difference between the simulation and the
practice should be noticed with regard to the removal of PVOH. In this study, dissolved PVOH
was removed either by penetration of the fluid into the pores or capillary suction; while in
cement paste, PVOH was removed by the interaction with cement minerals 212.
6.5 Influence of cement pore solution on film formation
The surface morphology of the film can be affected by the salt concentration 171. In general,
the evaporation process could result in salt deposition on the surface of the film, counteracting
the contrast within it. Therefore, interpretation of the acquired images should be cautious and
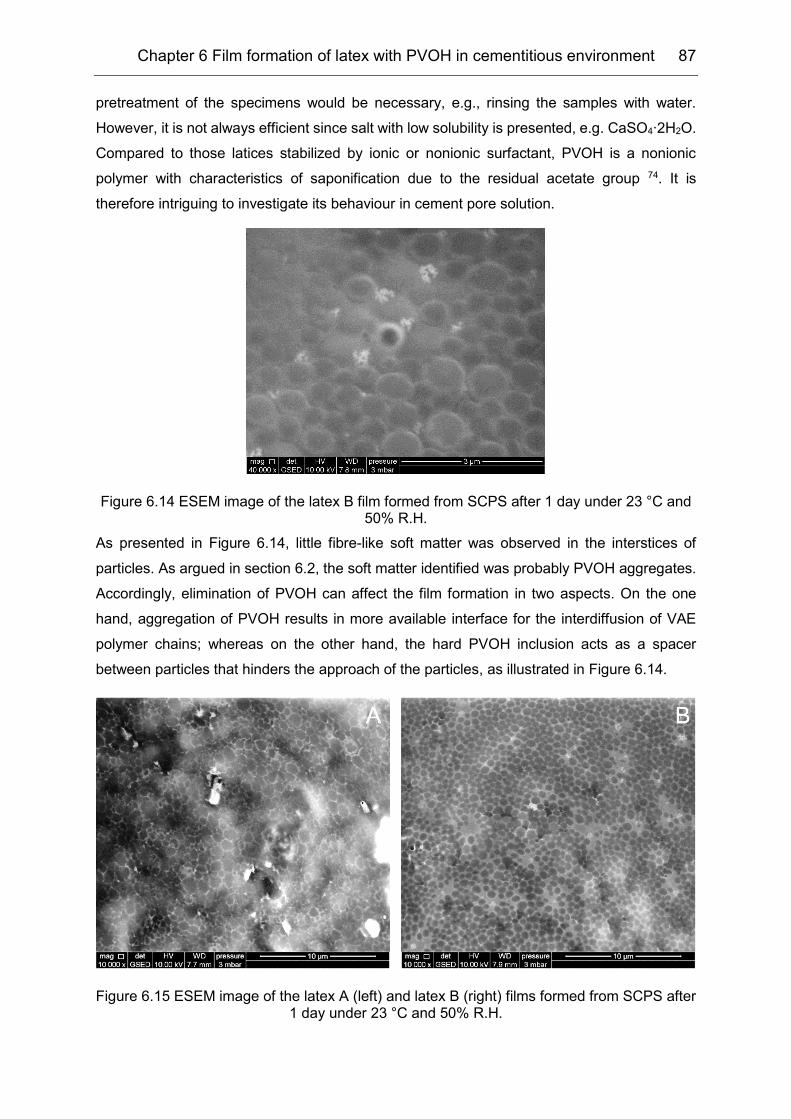
Chapter 6 Film formation of latex with PVOH in cementitious environment 87
pretreatment of the specimens would be necessary, e.g., rinsing the samples with water.
However, it is not always efficient since salt with low solubility is presented, e.g. CaSO4∙2H2O.
Compared to those latices stabilized by ionic or nonionic surfactant, PVOH is a nonionic
polymer with characteristics of saponification due to the residual acetate group 74. It is
therefore intriguing to investigate its behaviour in cement pore solution.
Figure 6.14 ESEM image of the latex B film formed from SCPS after 1 day under 23 °C and 50% R.H.
As presented in Figure 6.14, little fibre-like soft matter was observed in the interstices of
particles. As argued in section 6.2, the soft matter identified was probably PVOH aggregates.
Accordingly, elimination of PVOH can affect the film formation in two aspects. On the one
hand, aggregation of PVOH results in more available interface for the interdiffusion of VAE
polymer chains; whereas on the other hand, the hard PVOH inclusion acts as a spacer
between particles that hinders the approach of the particles, as illustrated in Figure 6.14.
Figure 6.15 ESEM image of the latex A (left) and latex B (right) films formed from SCPS after 1 day under 23 °C and 50% R.H.
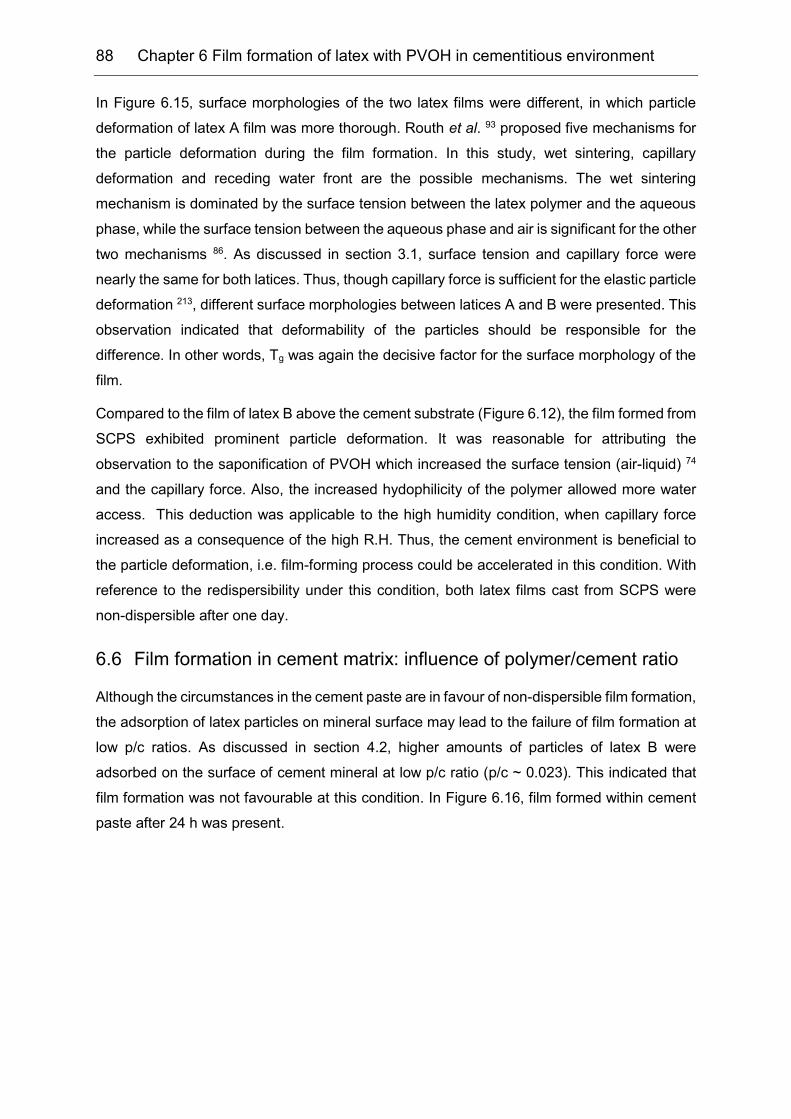
88 Chapter 6 Film formation of latex with PVOH in cementitious environment
In Figure 6.15, surface morphologies of the two latex films were different, in which particle
deformation of latex A film was more thorough. Routh et al. 93 proposed five mechanisms for
the particle deformation during the film formation. In this study, wet sintering, capillary
deformation and receding water front are the possible mechanisms. The wet sintering
mechanism is dominated by the surface tension between the latex polymer and the aqueous
phase, while the surface tension between the aqueous phase and air is significant for the other
two mechanisms 86. As discussed in section 3.1, surface tension and capillary force were
nearly the same for both latices. Thus, though capillary force is sufficient for the elastic particle
deformation 213, different surface morphologies between latices A and B were presented. This
observation indicated that deformability of the particles should be responsible for the
difference. In other words, Tg was again the decisive factor for the surface morphology of the
film.
Compared to the film of latex B above the cement substrate (Figure 6.12), the film formed from
SCPS exhibited prominent particle deformation. It was reasonable for attributing the
observation to the saponification of PVOH which increased the surface tension (air-liquid) 74
and the capillary force. Also, the increased hydophilicity of the polymer allowed more water
access. This deduction was applicable to the high humidity condition, when capillary force
increased as a consequence of the high R.H. Thus, the cement environment is beneficial to
the particle deformation, i.e. film-forming process could be accelerated in this condition. With
reference to the redispersibility under this condition, both latex films cast from SCPS were
non-dispersible after one day.
6.6 Film formation in cement matrix: influence of polymer/cement ratio
Although the circumstances in the cement paste are in favour of non-dispersible film formation,
the adsorption of latex particles on mineral surface may lead to the failure of film formation at
low p/c ratios. As discussed in section 4.2, higher amounts of particles of latex B were
adsorbed on the surface of cement mineral at low p/c ratio (p/c ~ 0.023). This indicated that
film formation was not favourable at this condition. In Figure 6.16, film formed within cement
paste after 24 h was present.
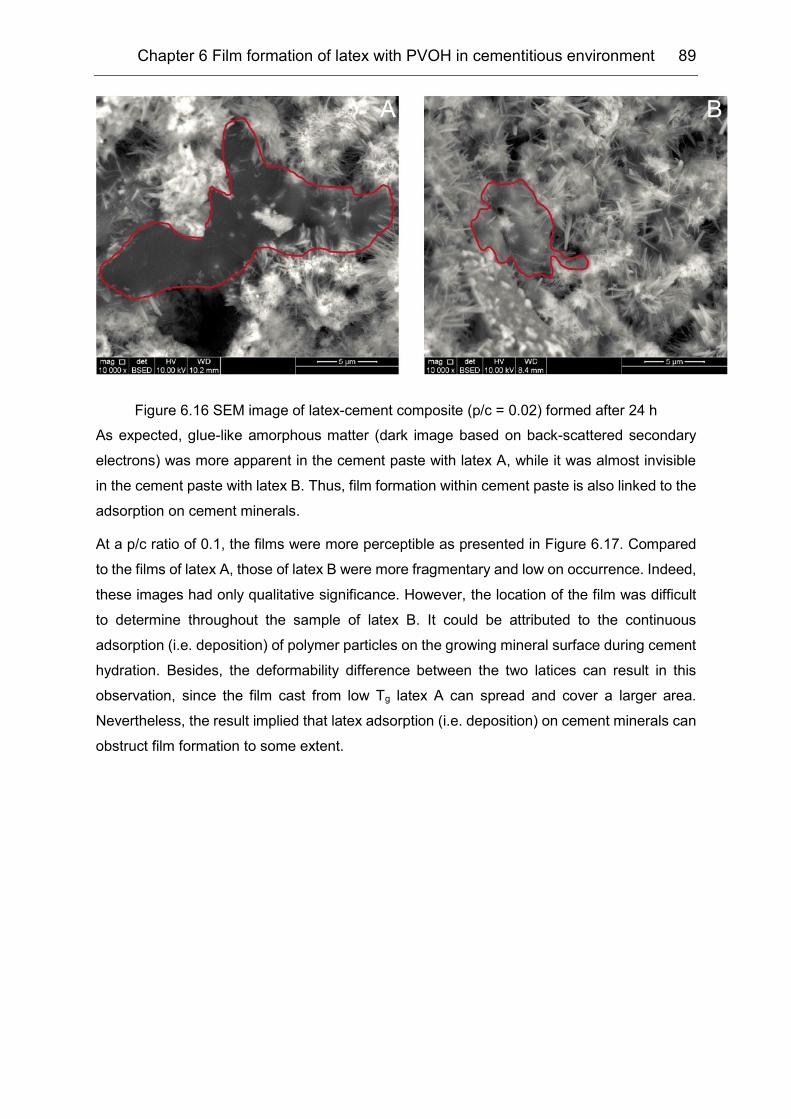
Chapter 6 Film formation of latex with PVOH in cementitious environment 89
Figure 6.16 SEM image of latex-cement composite (p/c = 0.02) formed after 24 h
As expected, glue-like amorphous matter (dark image based on back-scattered secondary
electrons) was more apparent in the cement paste with latex A, while it was almost invisible
in the cement paste with latex B. Thus, film formation within cement paste is also linked to the
adsorption on cement minerals.
At a p/c ratio of 0.1, the films were more perceptible as presented in Figure 6.17. Compared
to the films of latex A, those of latex B were more fragmentary and low on occurrence. Indeed,
these images had only qualitative significance. However, the location of the film was difficult
to determine throughout the sample of latex B. It could be attributed to the continuous
adsorption (i.e. deposition) of polymer particles on the growing mineral surface during cement
hydration. Besides, the deformability difference between the two latices can result in this
observation, since the film cast from low Tg latex A can spread and cover a larger area.
Nevertheless, the result implied that latex adsorption (i.e. deposition) on cement minerals can
obstruct film formation to some extent.
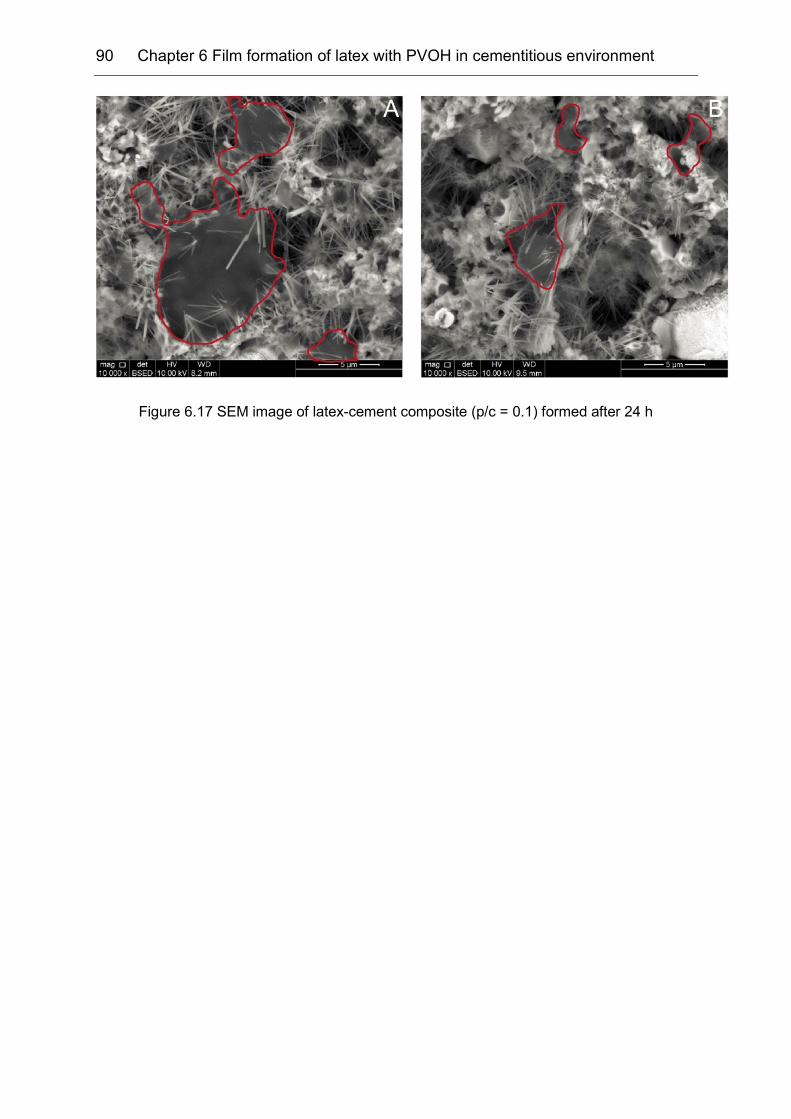
90 Chapter 6 Film formation of latex with PVOH in cementitious environment
Figure 6.17 SEM image of latex-cement composite (p/c = 0.1) formed after 24 h
Chapter 7
7 Conclusion and Outlook
Interaction between VAE latex stabilized with PVOH and Portland cement was studied in this
work. To understand the role of ionic charge as well as PVOH, one surfactant stabilized
anionic latex and a PVOH with an average molecular weight were employed. Here, the PVOH
was also used as protective colloid during the emulsion polymerization of the VAE latex.
The first step involved identification of chemicals in the VAE latex. Two components of the
VAE latex stabilized with PVOH were recognized: (1) the VAE copolymer colloid and (2)
dissolved PVOH in the solution. By physical separation, part of the PVOH was isolated, while
the rest remained adsorbed or grafted onto the surface of the latex particle. Dialysis of the
latex indicated an adsorption - desorption equilibrium within the system. Although the colloid
was sterically stabilized, the nominal non-ionic VAE latex possessed little anionic charge.
Compared to the anionic latex C, the non-ionic VAE latices A and B possessed lower charge
density. Charge titration by cations further confirmed that the non-ionic VAE latex had nearly
no affinity to Ca2+, both under neutral and alkaline conditions. In other words, the Ca2+ bridging
effect was limited.
Normally, the adsorbed amount of adsorbate on the adsorbent at solid-liquid interface was
assumed to be equal to the depleted amount in the liquid phase. However, from our results,
the depletion ratio of the latex showed a plateau as a function of its concentration. Though
polymer adsorption was not Langmuir type, the adsorption isotherm was analogous to the
profile of a monolayer type of adsorption. Thus, the result contradicted the profile of a
monolayer type. Due to the large particle size (> 800 nm), the short-range force does not work
beyond this range. Based on this, a new assumption was proposed: depletion of latex from
the solution was the combination of the adsorption and sedimentation (or trapped in the
sediment). The amount of sedimentation was subtracted by regression from the total depletion
amount. The calculated adsorption amount of the latex was very different when the two VAE
latices were employed, whereby the adsorbed amount was higher for the VAE latex with a
lower charge density.
This finding contradicted the conventional idea of polyelectrolytes adsorption on cement,
whereby electrostatic force is principally responsible for the potential polymer-cement
interaction. Indeed, the anionic latex showed the highest adsorption amount as well as the
surface coverage on the mineral surface. However, in the presence of dissolved PVOH,
adsorption (or more precisely as deposition) changed. The experiment proved that the
depletion ratio decreased with an increased amount of PVOH. These findings confirmed that
the adsorption of the VAE latex onto cement was dependent on both the PVOH corona on the
surface of the latex particle and the dissolved PVOH, instead of the surface charge density of
92 Chapter 7 Conclusion and Outlook
latex particle. Simultaneously, PVOH interacted with cement and showed preferential
interaction with C3A.
Since the polymers interact with the cement, kinetics of cement hydration were altered. At low
p/c ratios, both VAE latices showed little influence on the silicate hydration. Instead, an
enhanced sulfate depletion peak was presented. Cement hydration with either the PVOH or
the anionic latex proved that the phenomenen was attributed to the PVOH. In the presence
of either latex or PVOH, K+ and SO42- concentrations in the cement pore solution decreased
during the first few hours. This result indicated that latex particles acted as diffusion barriers
for ion transportation in cement pore solution while the particles adsorbed cations from the
pore solution. By means of in-situ XRD analysis, the complete dissolution of sulfate carrier
was observed to be less affected by the non-ionic latex, but retarded by both PVOH and the
anionic latex. Although the sulfate depletion peak was enhanced by the presence of PVOH
with the non-ionic latex, the rapid dissolution of the aluminate phase was affected by the non-
ionic latex polymer. At high p/c ratios, the induction period was extended. This was verified
by the rate of cement hydration with the PVOH or serum of the latex. The duration of the
induction period was related more to the solution chemistry (e.g. alkaline hydrolysis). Silicate
hydration was affected more by the incorporation of latex particles.
As water is consumed by cement hydration, the concentration of polymer particles increased
and film formation started consequently. In ambient conditions, VAE latex stabilized with
PVOH formed a polymer domain with surrounding PVOH membrane. However, the unique
structure resulted in the redispersibility of polymer film in water since the hydrophilic
membrane destroyed the integral polymer structure by hindering the entanglement of polymer
chains. The interaction between PVOH and cement eliminated the PVOH from the vicinity of
VAE particles, thus promoting polymer interdiffusion and coalescence. The effect was
simulated in this work and was found to be sufficient for the formation of integral film. High
humidity as well as electrolyte solution within cement paste accelerated particle deformation
during the film-forming process. In other words, fresh cement paste was an ideal environment
for the non-dispersible film formation with regard to the VAE latex stabilized with PVOH.
Moreover, this work also revealed that particle identity based on its surficial morphology was
distinguishable even after the polymer coalesced. Therefore, interpretation of the state of film-
forming according to electron microscopy images should be undertaken with cautiou.
The initial retention of the polymer particles on the mineral surface by adsorption (or deposition)
influences their distribution throughout the matrix of PMC. This topic is significant since the
film is desired to be located at the interface for certain applications, e.g. ceramic tile adhesives.
Although this work revealed that the adsorption of latex particles onto the cement surface was
the coaction of both surface and dissolved PVOH, it did not elaborate the mechanism behind
Chapter 7 Conclusion and Outlook 93
it. In the future, AFM may be employed with custom-built tip, which is covered by PVOH
molecules to simulate the latex particle. Meanwhile, stable mineral substrate in different
electrolytes solutions combined with different PVOH (amount, type etc.) shall be also applied.
In this way, the initial interaction mechanism between the surface and dissolved PVOH may
be revealed.
Furthermore, the adsorption was investigated at the initial time in the diluted state. The
conditions here differed from the real state. As water is consumed or agglomeration of latex
particles occurs, the particles or agglomerates can gradually deposit on cement surface. Thus,
their influence on the dissolution of cement minerals will be altered. In fact, initial adsorption
elaborated the changes in the ion composition of cement pore solution during the first few
hours, but it was impossible to interpret the alteration of cement hydration later on. To
overcome this shortcoming, the application of fluorescence-labelled polymer with confocal
laser scanning microscopy may be an option in the future. With the aid of the confocal
microscopy, surface coverage with time evolution will be available. Accompanying the
‘squeeze out’ apparatus, alteration of cement pore solution within a hardened cement paste
can be analyzed. Hence, a more comprehensive understanding about the latex-cement
interaction can be expected.
Finally, since ESEM and AFM pictures leave plenty of room for speculation, the results cannot
be over-interpreted. Considering the importance of film formation in cement pore solution, it is
quite necessary to investigate its film-forming kinetics further under such circumstances,
especially for those latices stabilized with PVOH only. Other techniques based on molecular
level rather than microscopy, such as small angle neutron scattering (SANS) or fluorescence
resonance energy transfer (FRET) should be employed in future studies.
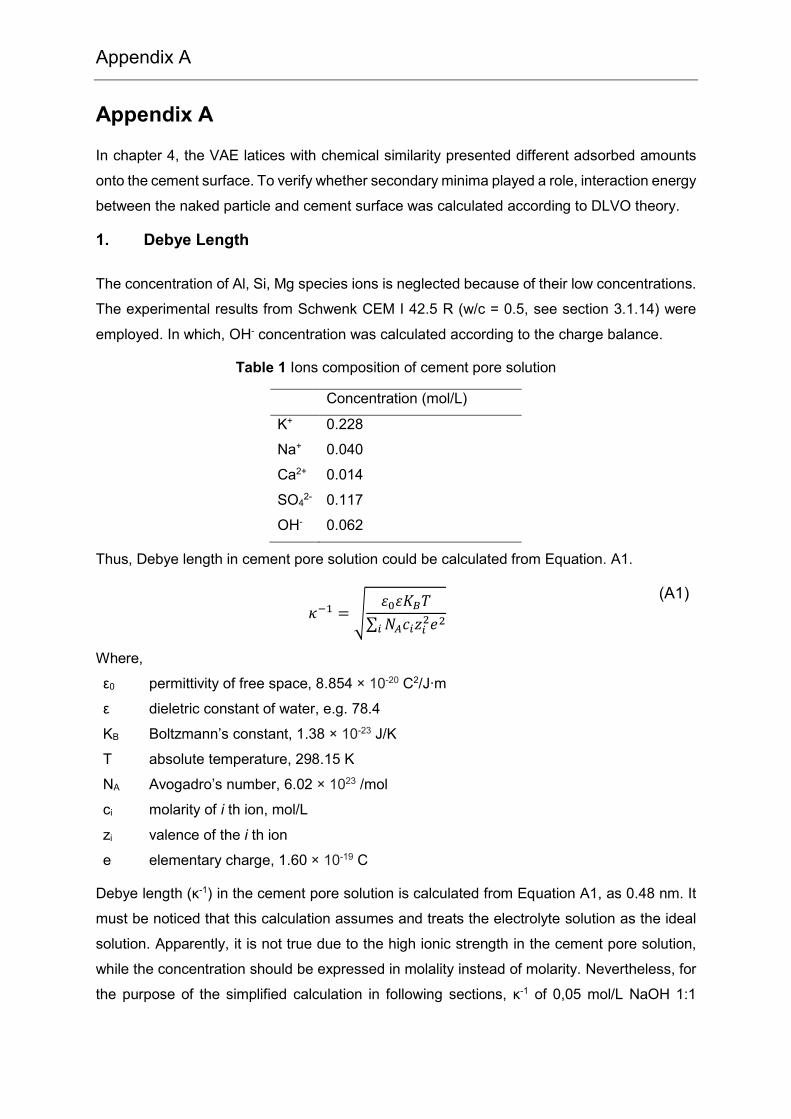
Appendix A
Appendix A
In chapter 4, the VAE latices with chemical similarity presented different adsorbed amounts
onto the cement surface. To verify whether secondary minima played a role, interaction energy
between the naked particle and cement surface was calculated according to DLVO theory.
1. Debye Length
The concentration of Al, Si, Mg species ions is neglected because of their low concentrations.
The experimental results from Schwenk CEM I 42.5 R (w/c = 0.5, see section 3.1.14) were
employed. In which, OH- concentration was calculated according to the charge balance.
Table 1 Ions composition of cement pore solution
Concentration (mol/L)
K+ 0.228
Na+ 0.040
Ca2+ 0.014
SO42- 0.117
OH- 0.062
Thus, Debye length in cement pore solution could be calculated from Equation. A1.
𝜅−1 = √𝜀0𝜀𝐾𝐵𝑇
∑ 𝑁𝐴𝑐𝑖𝑧𝑖2𝑒2
𝑖
(A1)
Where,
ε0 permittivity of free space, 8.854 × 10⁻²⁰ C2/J∙m
ε dieletric constant of water, e.g. 78.4
KB Boltzmann’s constant, 1.38 × 10⁻²³ J/K
T absolute temperature, 298.15 K
NA Avogadro’s number, 6.02 × 10²³ /mol
ci molarity of i th ion, mol/L
zi valence of the i th ion
e elementary charge, 1.60 × 10⁻¹⁹ C
Debye length (κ-1) in the cement pore solution is calculated from Equation A1, as 0.48 nm. It
must be noticed that this calculation assumes and treats the electrolyte solution as the ideal
solution. Apparently, it is not true due to the high ionic strength in the cement pore solution,
while the concentration should be expressed in molality instead of molarity. Nevertheless, for
the purpose of the simplified calculation in following sections, κ-1 of 0,05 mol/L NaOH 1:1
Appendix A: Theoretical calculation of the interaction energy 95
symmetric electrolyte will be used, which is 1.36 nm. Besides, Flatt et al. reported 183 a more
accurate Debye length with 0.67 nm in the pore solution (w/c = 0.45), applicable to the non-
ideal electrolyte solution. Since the adsorption of latex particles onto cement was carried out
in a diluted system at w/c of 9 (pH from 12.4-12.7), it is reasonable to estimate the Debye
length κ-1 of the solution as ~1 nm.
2. Surface potential and charge density (Grahame Equation)
Surface potential and charge density can be linked by the Grahame equation 42, though the
equation below is suitable only for z:z electrolyte solution.
𝜎 = √8𝑅𝑇𝜀𝜀0𝑐∞ 𝑠𝑖𝑛ℎ (
𝑧𝑒𝜓0
2𝑘𝐵𝑇)
(A2)
Where,
σ Surface charge density, C/m2
R gas constant, 8.314 J/k∙mol
Ψ0 surface potential
T absolute temperature, 298.15 K
c∞ molarity of solute in bulk solution, mol/m3
Surface charge density of both latices was determined by charge titration in pH=12.5 (see
section 4.1). Therefore, surface potential is -138.74 mV for latex A (σ = 0.1936 C/m2, negative)
and -118.66 mV for latex B (σ = 0.1304 C/m2, negative) in 0.05 mol/L NaOH solution.
Since Ca2+ might influence the surface potential greatly, a mixture of NaOH and Ca(OH)2
solution is composed for the calculation, taking [Na+] = 0.03 mol/L, [Ca2+] = 0.01 mol/L and
[OH-] = 0.05 mol/L. Then, the equation could be written as follows 42:
𝜎 = √8𝜀𝜀0𝐾𝐵𝑇 𝑠𝑖𝑛ℎ (
𝑒𝜓0
2𝑘𝐵𝑇) {[𝑁𝑎+]∞ + [𝐶𝑎2+]∞(2 + 𝑒
(−𝑒𝜓0
𝐾𝐵𝑇⁄ )}
12⁄
=
0.117 sinh (𝜓0
51.4⁄ ) {[𝑁𝑎+]∞ + [𝐶𝑎2+]∞(2 + 𝑒(−𝜓0
25.7⁄ )}
12⁄
𝐶 𝑚−2
(A3)
Then, a numerical calculation obtained a value of -88.89 mV for latex A and -78.28 mV for
latex B. As a result, the divalent ion has a little influence on the surface potential of the latices.
It is quite difficult to estimate the surface potential of cement particle, either due to the
heterogeneity of the irregular shape, or the dynamics during cement hydration as well as
asymmetric non-ideal solution in its vicinity. Furthermore, the validity of the Poisson-
Boltzmann approximation is still controversial 183,214, with respect to highly coupled systems in
cement pore solution. Since DLVO theory is applied, co-ion and counter ion correlation is
neglected in this calculation. Besides, only silicate surface of cement is considered for a simple
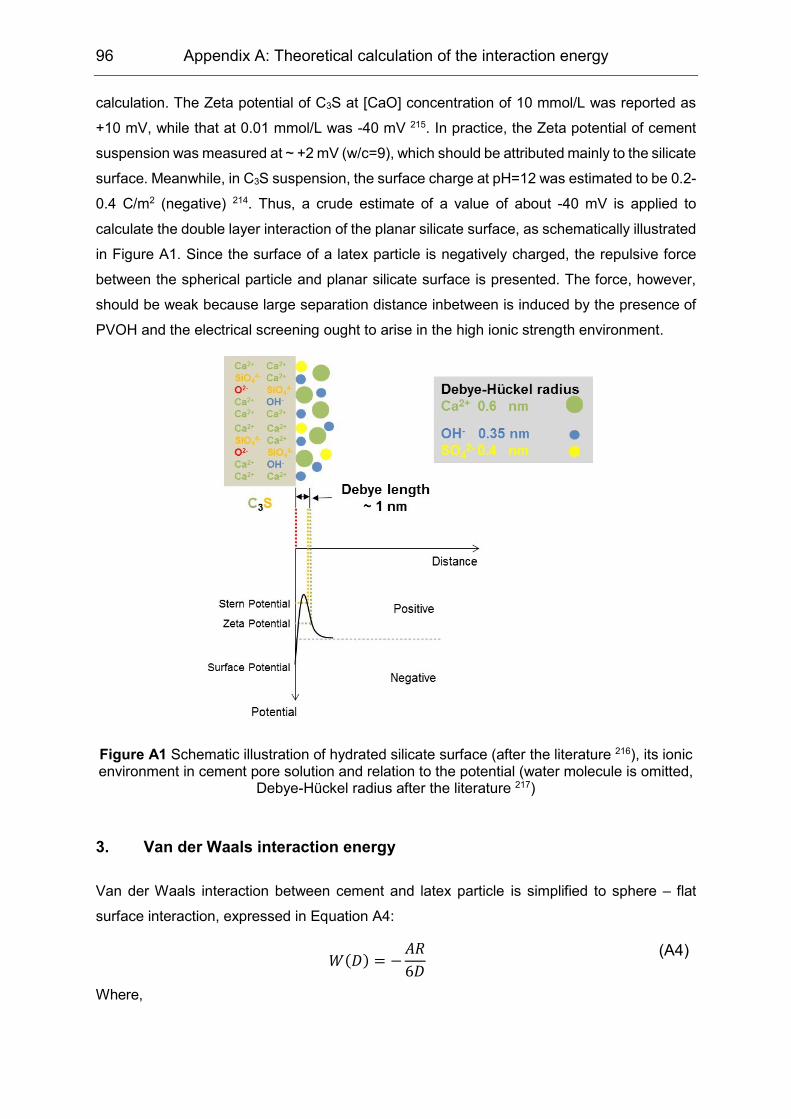
96 Appendix A: Theoretical calculation of the interaction energy
calculation. The Zeta potential of C3S at [CaO] concentration of 10 mmol/L was reported as
+10 mV, while that at 0.01 mmol/L was -40 mV 215. In practice, the Zeta potential of cement
suspension was measured at ~ +2 mV (w/c=9), which should be attributed mainly to the silicate
surface. Meanwhile, in C3S suspension, the surface charge at pH=12 was estimated to be 0.2-
0.4 C/m2 (negative) 214. Thus, a crude estimate of a value of about -40 mV is applied to
calculate the double layer interaction of the planar silicate surface, as schematically illustrated
in Figure A1. Since the surface of a latex particle is negatively charged, the repulsive force
between the spherical particle and planar silicate surface is presented. The force, however,
should be weak because large separation distance inbetween is induced by the presence of
PVOH and the electrical screening ought to arise in the high ionic strength environment.
Figure A1 Schematic illustration of hydrated silicate surface (after the literature 216), its ionic environment in cement pore solution and relation to the potential (water molecule is omitted,
Debye-Hückel radius after the literature 217)
3. Van der Waals interaction energy
Van der Waals interaction between cement and latex particle is simplified to sphere – flat
surface interaction, expressed in Equation A4:
𝑊(𝐷) = −
𝐴𝑅
6𝐷
(A4)
Where,
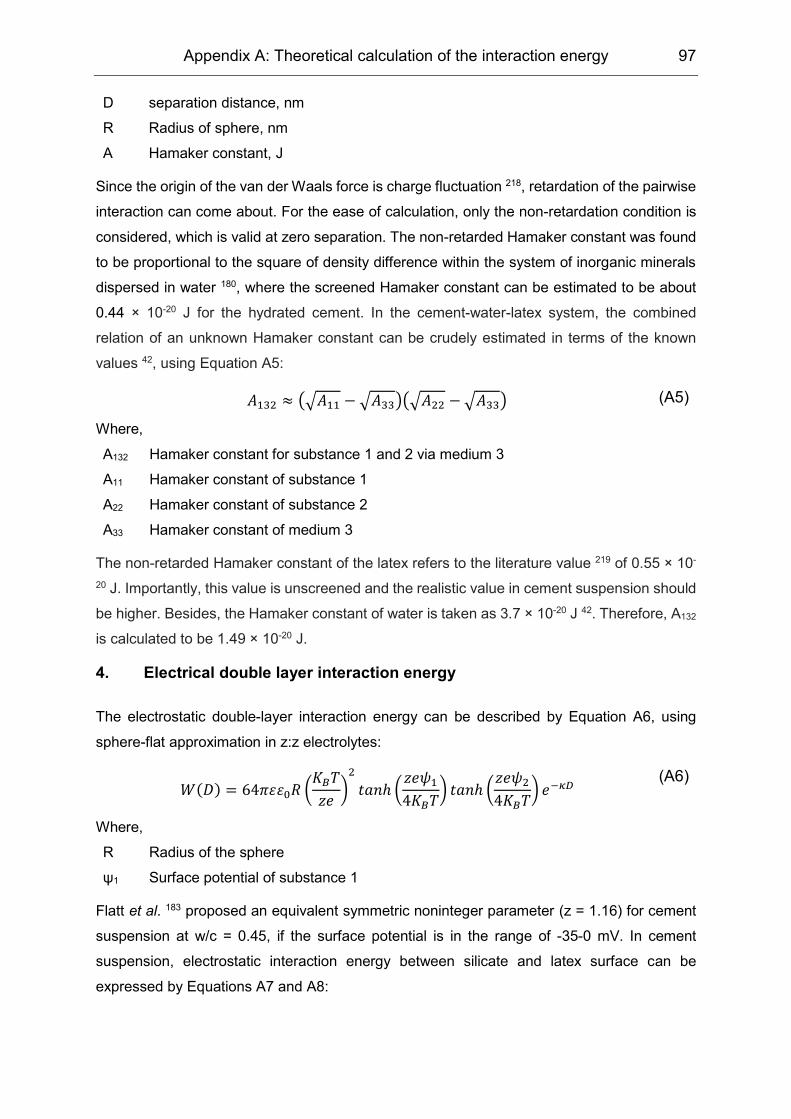
Appendix A: Theoretical calculation of the interaction energy 97
D separation distance, nm
R Radius of sphere, nm
A Hamaker constant, J
Since the origin of the van der Waals force is charge fluctuation 218, retardation of the pairwise
interaction can come about. For the ease of calculation, only the non-retardation condition is
considered, which is valid at zero separation. The non-retarded Hamaker constant was found
to be proportional to the square of density difference within the system of inorganic minerals
dispersed in water 180, where the screened Hamaker constant can be estimated to be about
0.44 × 10⁻²⁰ J for the hydrated cement. In the cement-water-latex system, the combined
relation of an unknown Hamaker constant can be crudely estimated in terms of the known
values 42, using Equation A5:
𝐴132 ≈ (√𝐴11 − √𝐴33)(√𝐴22 − √𝐴33) (A5)
Where,
A132 Hamaker constant for substance 1 and 2 via medium 3
A11 Hamaker constant of substance 1
A22 Hamaker constant of substance 2
A33 Hamaker constant of medium 3
The non-retarded Hamaker constant of the latex refers to the literature value 219 of 0.55 × 10-
20 J. Importantly, this value is unscreened and the realistic value in cement suspension should
be higher. Besides, the Hamaker constant of water is taken as 3.7 × 10⁻²⁰ J 42. Therefore, A132
is calculated to be 1.49 × 10⁻²⁰ J.
4. Electrical double layer interaction energy
The electrostatic double-layer interaction energy can be described by Equation A6, using
sphere-flat approximation in z:z electrolytes:
𝑊(𝐷) = 64𝜋𝜀𝜀0𝑅 (
𝐾𝐵𝑇
𝑧𝑒)
2
𝑡𝑎𝑛ℎ (𝑧𝑒𝜓1
4𝐾𝐵𝑇) 𝑡𝑎𝑛ℎ (
𝑧𝑒𝜓2
4𝐾𝐵𝑇) 𝑒−𝜅𝐷
(A6)
Where,
R Radius of the sphere
ψ1 Surface potential of substance 1
Flatt et al. 183 proposed an equivalent symmetric noninteger parameter (z = 1.16) for cement
suspension at w/c = 0.45, if the surface potential is in the range of -35-0 mV. In cement
suspension, electrostatic interaction energy between silicate and latex surface can be
expressed by Equations A7 and A8:
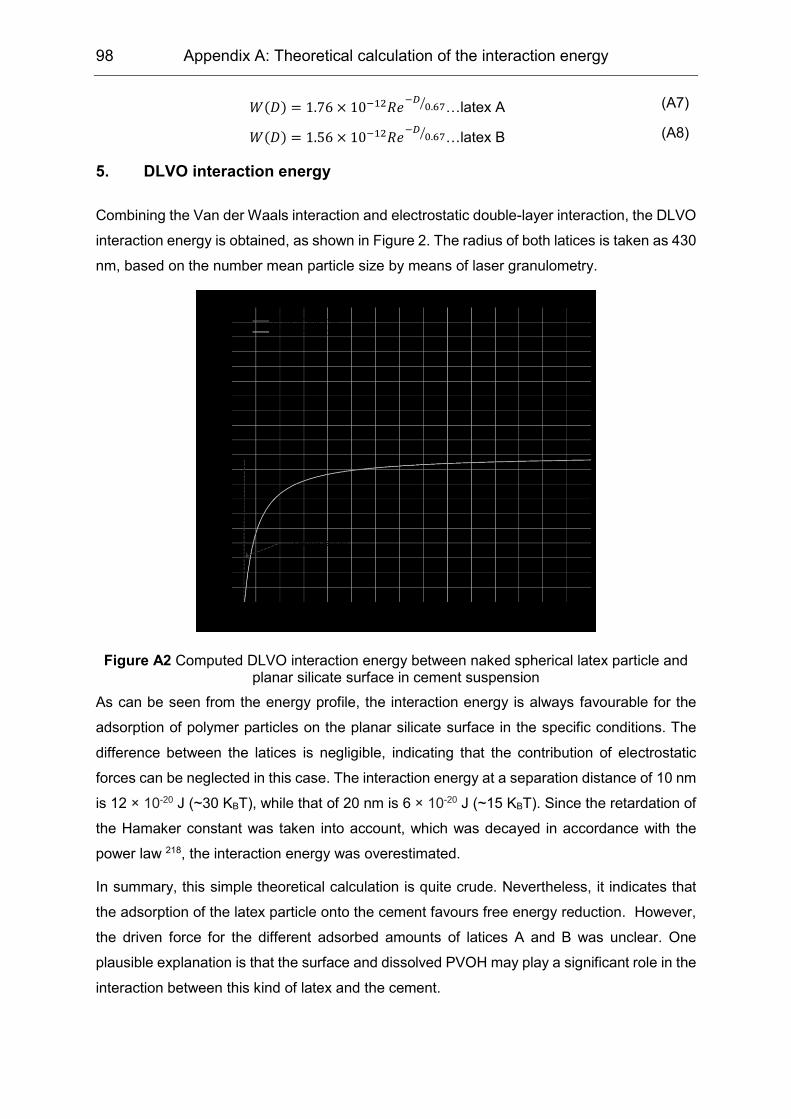
98 Appendix A: Theoretical calculation of the interaction energy
𝑊(𝐷) = 1.76 × 10⁻¹²𝑅𝑒−𝐷
0.67⁄ …latex A (A7)
𝑊(𝐷) = 1.56 × 10⁻¹²𝑅𝑒−𝐷
0.67⁄ …latex B (A8)
5. DLVO interaction energy
Combining the Van der Waals interaction and electrostatic double-layer interaction, the DLVO
interaction energy is obtained, as shown in Figure 2. The radius of both latices is taken as 430
nm, based on the number mean particle size by means of laser granulometry.
Figure A2 Computed DLVO interaction energy between naked spherical latex particle and planar silicate surface in cement suspension
As can be seen from the energy profile, the interaction energy is always favourable for the
adsorption of polymer particles on the planar silicate surface in the specific conditions. The
difference between the latices is negligible, indicating that the contribution of electrostatic
forces can be neglected in this case. The interaction energy at a separation distance of 10 nm
is 12 × 10-20 J (~30 KBT), while that of 20 nm is 6 × 10-20 J (~15 KBT). Since the retardation of
the Hamaker constant was taken into account, which was decayed in accordance with the
power law 218, the interaction energy was overestimated.
In summary, this simple theoretical calculation is quite crude. Nevertheless, it indicates that
the adsorption of the latex particle onto the cement favours free energy reduction. However,
the driven force for the different adsorbed amounts of latices A and B was unclear. One
plausible explanation is that the surface and dissolved PVOH may play a significant role in the
interaction between this kind of latex and the cement.
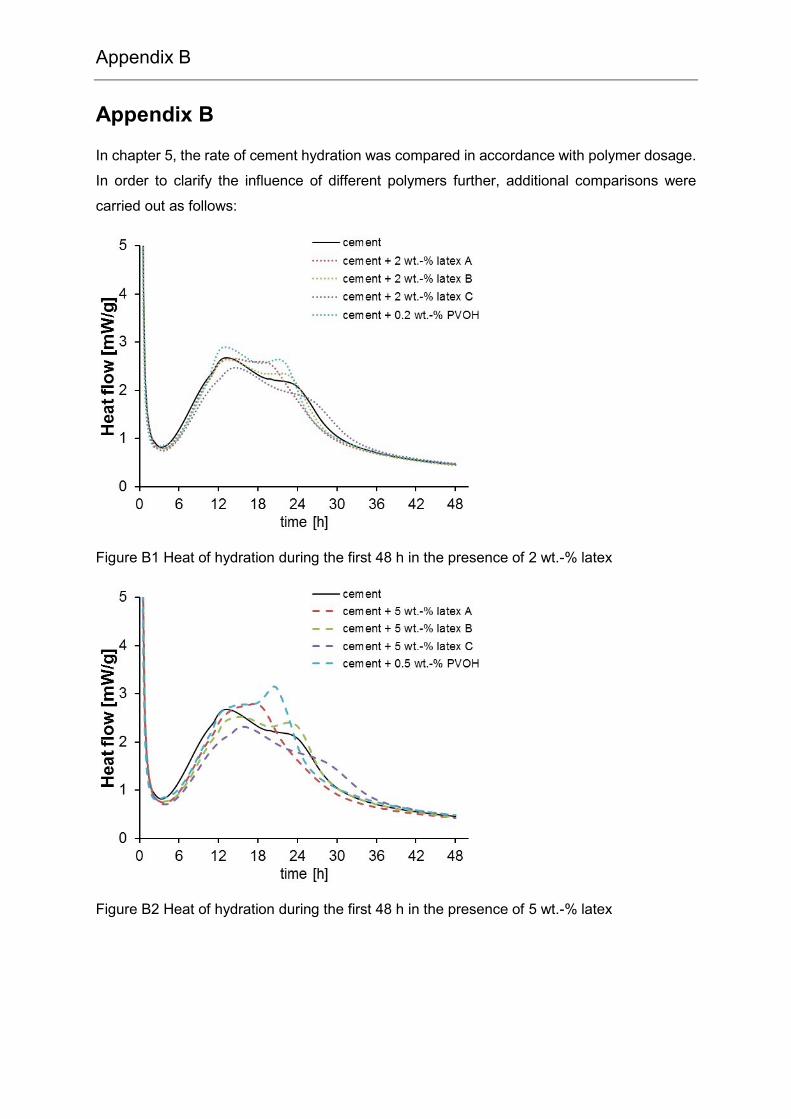
Appendix B
Appendix B
In chapter 5, the rate of cement hydration was compared in accordance with polymer dosage.
In order to clarify the influence of different polymers further, additional comparisons were
carried out as follows:
Figure B1 Heat of hydration during the first 48 h in the presence of 2 wt.-% latex
Figure B2 Heat of hydration during the first 48 h in the presence of 5 wt.-% latex
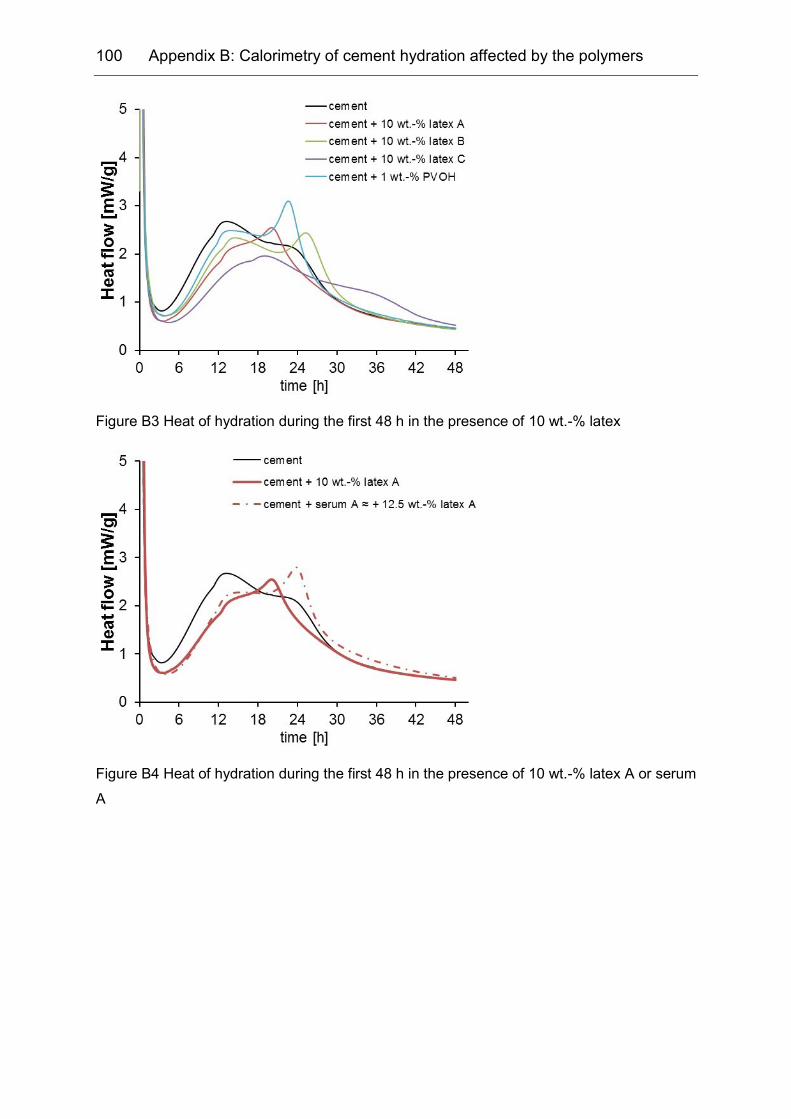
100 Appendix B: Calorimetry of cement hydration affected by the polymers
Figure B3 Heat of hydration during the first 48 h in the presence of 10 wt.-% latex
Figure B4 Heat of hydration during the first 48 h in the presence of 10 wt.-% latex A or serum
A
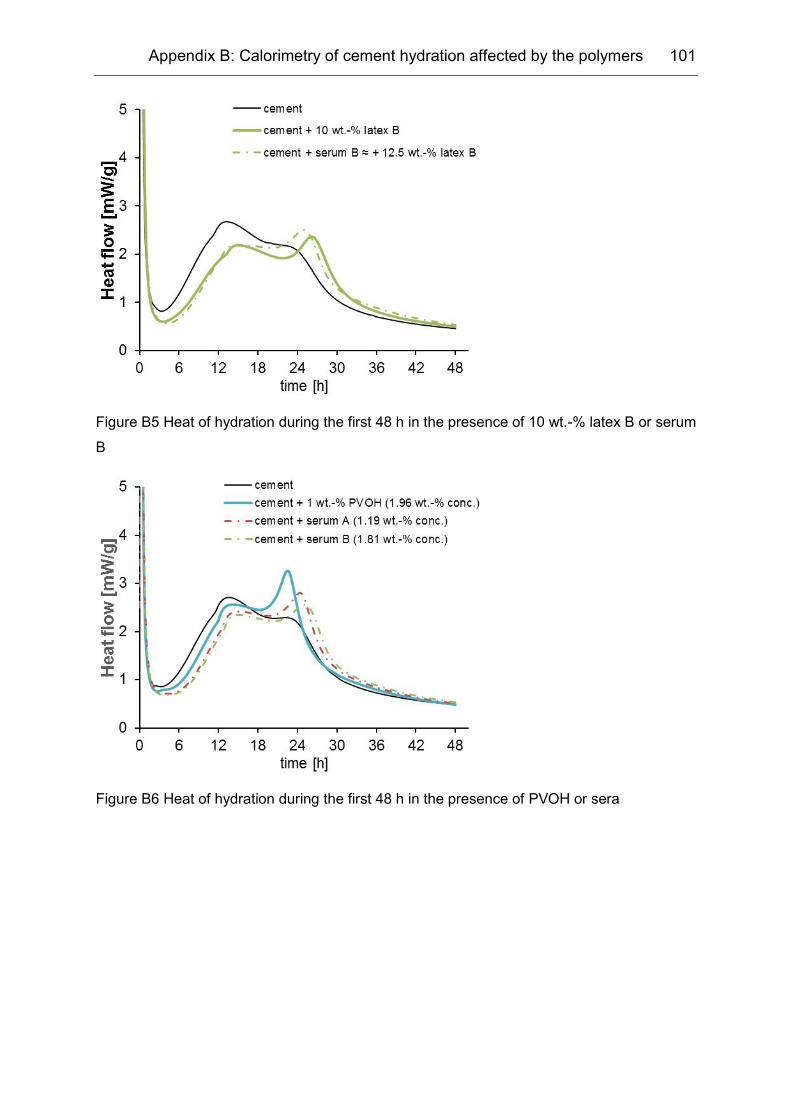
Appendix B: Calorimetry of cement hydration affected by the polymers 101
Figure B5 Heat of hydration during the first 48 h in the presence of 10 wt.-% latex B or serum
B
Figure B6 Heat of hydration during the first 48 h in the presence of PVOH or sera
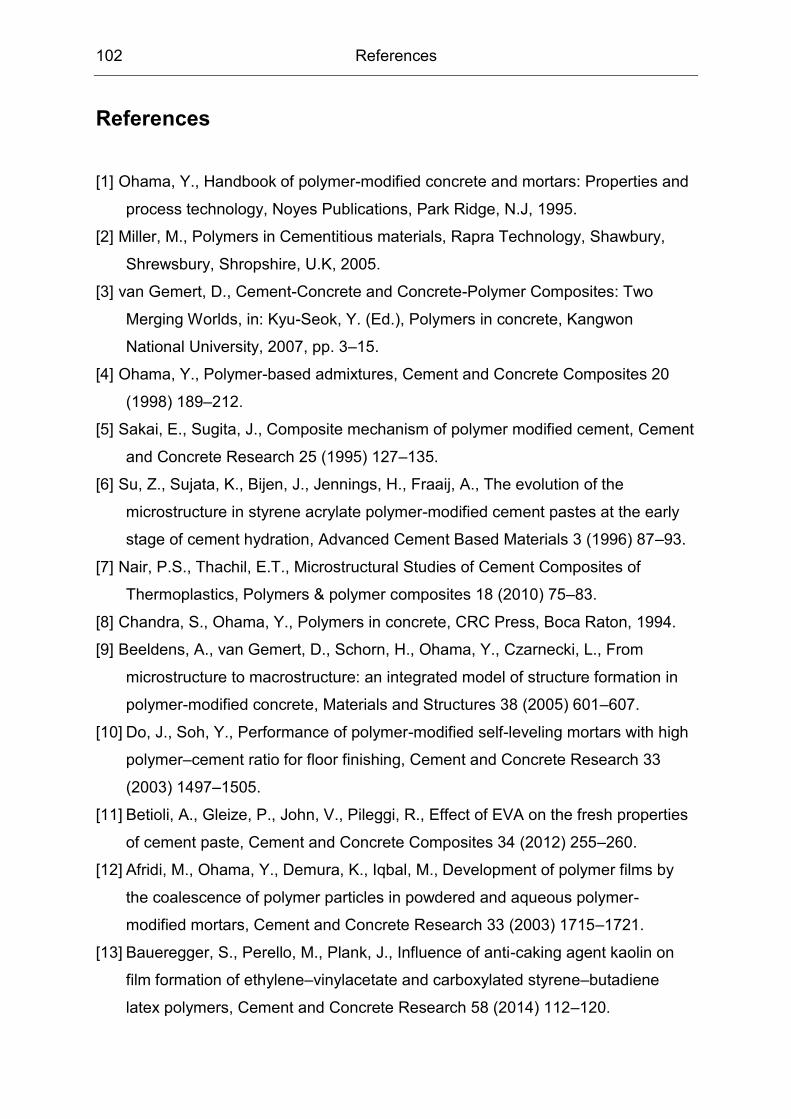
102 References
References
[1] Ohama, Y., Handbook of polymer-modified concrete and mortars: Properties and
process technology, Noyes Publications, Park Ridge, N.J, 1995.
[2] Miller, M., Polymers in Cementitious materials, Rapra Technology, Shawbury,
Shrewsbury, Shropshire, U.K, 2005.
[3] van Gemert, D., Cement-Concrete and Concrete-Polymer Composites: Two
Merging Worlds, in: Kyu-Seok, Y. (Ed.), Polymers in concrete, Kangwon
National University, 2007, pp. 3–15.
[4] Ohama, Y., Polymer-based admixtures, Cement and Concrete Composites 20
(1998) 189–212.
[5] Sakai, E., Sugita, J., Composite mechanism of polymer modified cement, Cement
and Concrete Research 25 (1995) 127–135.
[6] Su, Z., Sujata, K., Bijen, J., Jennings, H., Fraaij, A., The evolution of the
microstructure in styrene acrylate polymer-modified cement pastes at the early
stage of cement hydration, Advanced Cement Based Materials 3 (1996) 87–93.
[7] Nair, P.S., Thachil, E.T., Microstructural Studies of Cement Composites of
Thermoplastics, Polymers & polymer composites 18 (2010) 75–83.
[8] Chandra, S., Ohama, Y., Polymers in concrete, CRC Press, Boca Raton, 1994.
[9] Beeldens, A., van Gemert, D., Schorn, H., Ohama, Y., Czarnecki, L., From
microstructure to macrostructure: an integrated model of structure formation in
polymer-modified concrete, Materials and Structures 38 (2005) 601–607.
[10] Do, J., Soh, Y., Performance of polymer-modified self-leveling mortars with high
polymer–cement ratio for floor finishing, Cement and Concrete Research 33
(2003) 1497–1505.
[11] Betioli, A., Gleize, P., John, V., Pileggi, R., Effect of EVA on the fresh properties
of cement paste, Cement and Concrete Composites 34 (2012) 255–260.
[12] Afridi, M., Ohama, Y., Demura, K., Iqbal, M., Development of polymer films by
the coalescence of polymer particles in powdered and aqueous polymer-
modified mortars, Cement and Concrete Research 33 (2003) 1715–1721.
[13] Baueregger, S., Perello, M., Plank, J., Influence of anti-caking agent kaolin on
film formation of ethylene–vinylacetate and carboxylated styrene–butadiene
latex polymers, Cement and Concrete Research 58 (2014) 112–120.
References 103
[14] Wang, R., Wang, P.-M., Formation of hydrates of calcium aluminates in cement
pastes with different dosages of SBR powder, Construction and Building
Materials 25 (2011) 736–741.
[15] Silva, D.A., Monteiro, P.J., The influence of polymers on the hydration of
portland cement phases analyzed by soft X-ray transmission microscopy,
Cement and Concrete Research 36 (2006) 1501–1507.
[16] Kaufmann, J., Winnefeld, F., Zurbriggen, R., Polymer dispersions and their
interaction with mortar constituents and ceramic tile surfaces studied by zeta-
potential measurements and atomic force microscopy, Cement and Concrete
Composites 34 (2012) 604–611.
[17] Plank, J., Gretz, M., Study on the interaction between anionic and cationic latex
particles and Portland cement, Colloids and Surfaces A: Physicochemical and
Engineering Aspects 330 (2008) 227–233.
[18] Boutti, S., Urvoy, M., Dubois-Brugger, I., Graillat, C., Bourgeat-Lami, E., Spitz,
R., Influence of Low Fractions of Styrene/Butyl Acrylate Polymer Latexes on
Some Properties of Ordinary Portland Cement Mortars, Macromolecular
Materials and Engineering 292 (2007) 33–45.
[19] Merlin, F., Guitouni, H., Mouhoubi, H., Mariot, S., Vallée, F., van Damme, H.,
Adsorption and heterocoagulation of nonionic surfactants and latex particles on
cement hydrates, Journal of Colloid and Interface Science 281 (2005) 1–10.
[20] Betioli, A., Hoppe Filho, J., Cincotto, M., Gleize, P., Pileggi, R., Chemical
interaction between EVA and Portland cement hydration at early-age,
Construction and Building Materials 23 (2009) 3332–3336.
[21] Silva, D., Monteiro, P., Analysis of C3A hydration using soft X-rays transmission
microscopy: Effect of EVA copolymer, Cement and Concrete Research 35
(2005) 2026–2032.
[22] Silva, D., Monteiro, P., Hydration evolution of C3S–EVA composites analyzed by
soft X-ray microscopy, Cement and Concrete Research 35 (2005) 351–357.
[23] Lutz, H., Hahner, C., Applications of Redispersible Powders, in: Urban, D.,
Takamura, K. (Eds.), Polymer dispersions and their industrial applications,
Wiley-VCH, Weinheim, 2002, pp. 329–354.
[24] Carrà, S., Sliepcevich, A., Canevarolo, A., Carrà, S., Grafting and adsorption of
poly(vinyl) alcohol in vinyl acetate emulsion polymerization, Polymer 46 (2005)
1379–1384.
104 References
[25] Gilmore, C.M., Poehlein, G.W., Schork, F., Modeling poly(vinyl alcohol)-
stabilized vinyl acetate emulsion polymerization. I. Theory, Journal of Applied
Polymer Science 48 (1993) 1449–1460.
[26] Egret, H., Dimonie, V.L., Sudol, E.D., Klein, A., El-Aasser, M.S.,
Characterization of grafting in the emulsion polymerization of vinyl acetate using
poly(vinyl alcohol) as stabilizer, Journal of Applied Polymer Science 82 (2001)
1739–1747.
[27] Yuki, K., Nakamae, M., Sato, T., Maruyama, H., Okaya, T., Physical properties
of acrylic copolymer emulsions using poly(vinyl alcohol) as a protective colloid in
comparison with those using surfactants, Polymer International 49 (2000) 1629–
1635.
[28] Du Chesne, A., Bojkova, A., Gapinski, J., Seip, D., Fischer, P., Film Formation
and Redispersion of Waterborne Latex Coatings, Journal of Colloid and
Interface Science 224 (2000) 91–98.
[29] Urban, D., Distler, D., Introduction, in: Urban, D., Takamura, K. (Eds.), Polymer
dispersions and their industrial applications, Wiley-VCH, Weinheim, 2002, pp. 1–
14.
[30] Slomkowski, S., Alemán, J.V., Gilbert, R.G., Hess, M., Horie, K., Jones, R.G.,
Kubisa, P., Meisel, I., Mormann, W., Penczek, S., Stepto, R.F.T., Terminology of
polymers and polymerization processes in dispersed systems (IUPAC
Recommendations 2011), Pure and Applied Chemistry 83 (2011).
[31] Hiemenz, P.C., Rajagopalan, R., Principles of colloid and surface chemistry, 3rd
ed., Marcel Dekker, New York, 1997.
[32] Ma, Y., Davis, H., Scriven, L., Microstructure development in drying latex
coatings, Progress in Organic Coatings 52 (2005) 46–62.
[33] Warson, H., Finch, C.A., Fundamental chemistry of latices and applications in
adhesives, Wiley, Chichester [u.a.], 2001.
[34] Sundberg, D.C., Durant, Y.G., Latex Particle Morphology, Fundamental Aspects:
A Review, Polymer Reaction Engineering 11 (2003) 379–432.
[35] Elaissari, A. (Ed.), Colloidal polymers: Synthesis and characterization, M.
Dekker, New York, 2003.
[36] Blackley, D.C., Polymer latices: Science and technology, 2nd ed., Chapman &
Hall, London, New York, 1997.
References 105
[37] Collins, E.A., Measurement of Particle Size and Particle Size Distribution.
Chapter 12, in: Lovell, P.A., El-Aasser, M.S. (Eds.), Emulsion polymerization and
emulsion polymers, J. Wiley, New York, 1997, pp. 385–436.
[38] Hughes, R., An Introduction to Colloids, in: Cosgrove, T. (Ed.), Colloid science:
Principles, methods and applications, 2nd ed., Wiley, Chichester, U.K, 2010, pp.
1–22.
[39] Gretz, M., Synthese und kolloidchemische Eigenschaften hydrider core shell
Partikel und ihre mögliche Anwendung in der Bauchemie. Ph. D dissertation,
Garching, Germany, 2010.
[40] Derjaguin, B., Landau, L., Theory of the stability of strongly charged lyophobic
sols and of the adhesion of strongly charged particles in solutions of electrolytes,
Progress in Surface Science 43 (1993) 30–59.
[41] Verwey, E. J. W., Overbeek, J. Th. G., Theory of the stability of lyophobic
colloids: The interaction of sol particles having an electric double layer, Elsevier,
Amsterdam, 1948.
[42] Israelachvili, J.N., Intermolecular and surface forces, 3rd ed., Academic Press,
Burlington, MA, 2011.
[43] Rothstein, D., Thomas, J.J., Christensen, B.J., Jennings, H.M., Solubility
behavior of Ca-, S-, Al-, and Si-bearing solid phases in Portland cement pore
solutions as a function of hydration time, Cement and Concrete Research 32
(2002) 1663–1671.
[44] Kelzenberg, A.l., Tracy, S.L., Christiansen, B.J., Thomas, J.J., Clarage, M.E.,
Hodson, S., Jennings, H.M., Chemistry of the Aqueous Phase of Ordinary
Portland, Journal of the American Ceramic Society 81 (1998) 2349–2359.
[45] Goto, T., Influence des paramètres moléculaires du latex sur l’hydratation, la
rhéologie et les propriétés mécaniques des composites ciment/latex. Ph. D
dissertation, Paris, France, 2006.
[46] Evans, R., Napper, D.H., Steric stabilization I: Comparison of theories with
experiment, Kolloid-Zeitschrift und Zeitschrift für Polymere 251 (1973) 409–414.
[47] Hunter, R.J., Foundations of colloid science, Clarendon Press, New York, 1987.
[48] Teraoka, I., Polymer solutions: An introduction to physical properties, Wiley,
New York, 2002.
[49] Klein, J., Interaction between surfaces with adsorbed polymers: poor solvents,
Macromolecules 15 (1982) 1129–1135.
106 References
[50] Klein, J., Interactions between surfaces with adsorbed polymers: poor solvent: 2.
Calculations and comparison with experiment 19 (1986) 1374–1381.
[51] Stenkamp, V.S., Steric and Electrosteric Stabilization of Colloids in Aqueous Salt
Solutions. Ph. D dissertation, Washington, DC, 1999.
[52] Carraher, C.E., Seymour, R.B., Seymour/Carraher's polymer chemistry, 6th ed.,
M. Dekker, New York, 2003.
[53] German, A.L., van Herk, Alex M., Schoonbrood, Harold A. S., Aerdts, A.M.,
Latex Polymer Characterization. Chapter 11, in: Lovell, P.A., El-Aasser, M.S.
(Eds.), Emulsion polymerization and emulsion polymers, J. Wiley, New York,
1997, pp. 343–384.
[54] Jones, R.G. (Ed.), Compendium of polymer terminology and nomenclature:
IUPAC recommendations, 2008, Royal Society of Chemistry, Cambridge, 2009.
[55] Moad, G., Solomon, D.H., The chemistry of radical polymerization, 2nd ed.,
Elsevier, Amsterdam, Boston, 2006.
[56] Hiemenz, P.C., Lodge, T., Polymer chemistry, 2nd ed., CRC Press, Boca Raton,
2007.
[57] Odian, G.G., Principles of polymerization, 4th ed., Wiley, Hoboken, N.J, 2004.
[58] Vandezande, G.A., Smith, O.W., Bassett, D.R., Vinyl acetate Polymerization.
Chapter 16, in: Lovell, P.A., El-Aasser, M.S. (Eds.), Emulsion polymerization and
emulsion polymers, J. Wiley, New York, 1997, pp. 563–588.
[59] Erbil, H.Y., Vinyl acetate emulsion polymerization and copolymerization with
acrylic monomers, CRC Press, Boca Raton, 2000.
[60] El-Aasser, M.S., Sudol, E.D., Features of Emulsion Polymerization. Chapter 2,
in: Lovell, P.A., El-Aasser, M.S. (Eds.), Emulsion polymerization and emulsion
polymers, J. Wiley, New York, 1997, pp. 36–58.
[61] Reynolds, G., Vinyl acetate-ethylene copolymer dispersions, British Polymer
Journal 1 (1969) 233–238.
[62] Poljanšek, I., Fabjan, E., Burja, K., Kukanja, D., Emulsion copolymerization of
vinyl acetate-ethylene in high pressure reactor-characterization by inline FTIR
spectroscopy, Progress in Organic Coatings 76 (2013) 1798–1804.
[63] Chen, H., Lewis, M., Quantitative Determination of Vinyl Acetate Content of
Ethylene-Vinyl Acetate Copolymers by High-Resolution Nuclear Magnetic
Resonance, Analytical Chemistry 36 (1964) 1394–1396.
References 107
[64] Sung, H., Noggle, J., Carbon-13 NMR of poly(vinyl acetate) and ethylene-vinyl
acetate copolymer, Journal of Polymer Science: Polymer Physics Edition 19
(1981) 1593–1602.
[65] Koopmans, R., Van der Linden, R., Vansant, E., Quantitative determination of
the vinylacetate content in ethylene vinyl-acetate copolymers-a critical review,
Polymer Engineering and Science 22 (1982) 878–882.
[66] Bugada, D.C., Rudin, A., Molecular structure and melting behaviour of ethylene-
vinyl acetate copolymers, European Polymer Journal 28 (1992) 219–227.
[67] Scott, P., Penlidis, A., Rempel, G., Ethylene-vinyl acetate semi-batch emulsion
copolymerization: Experimental design and preliminary screening experiments,
Journal of Polymer Science Part A: Polymer Chemistry 31 (1993) 403–426.
[68] Scott, P., Penlidis, A., Rempel, G., Ethylene-vinyl acetate semi-batch emulsion
copolymerization: Use of factorial experiments for improved process
understanding, Journal of Polymer Science Part A: Polymer Chemistry 31 (1993)
2205–2230.
[69] Scott, P.J., Penlidis, A., Rempel, G.L., Lawrence, A.D., Ethylene-vinyl acetate
semi-batch emulsion copolymerization: Use of factorial experiments for process
optimization, Journal of Polymer Science Part A: Polymer Chemistry 32 (1994)
539–555.
[70] Gruber, B.A., Vratsanos, M.S., Smith, C.D., Effects of colloidal stabilizer on vinyl
acetate-ethylene copolymer emulsions and films, Macromolecular Symposia 155
(2000) 163–170.
[71] Petrocelli, F.P., Cordeiro, C.F., Continuous process for the production of vinyl
acetate-ethylene emulsion copolymers, Macromolecular Symposia 155 (2000)
39–52.
[72] Kim, N., Sudol, E.D., Dimonie, V.L., El-Aasser, M.S., Poly(vinyl alcohol)
Stabilization of Acrylic Emulsion Polymers Using the Miniemulsion Approach,
Macromolecules 36 (2003) 5573–5579.
[73] Noro, K., Emulsion polymerisation of vinyl acetate in relation to the chemical
structure of polyvinyl alcohol, British Polymer Journal 2 (1970) 128–134.
[74] Marten, F.L., Vinyl Alcohol Polymers, in: Encyclopedia of Polymer Science and
Technology, John Wiley & Sons, Inc, Hoboken, NJ, USA, 2002, pp. 399–437.
108 References
[75] Okaya, T., General Properties of Polyvinyl Alcohol in Relation to Its Applications.
Chapter 1, in: Finch, C.A. (Ed.), Polyvinyl alcohol: Developments, Wiley,
Chichester, New York, 1992, pp. 1–29.
[76] Clariant GmbH, Mowiol Polyvinyl Alcohol, 1999,
http://www2.cbm.uam.es/confocal/Manuales/mowiol.pdf.
[77] He, J., Chen, J., Hellwich, K.-H., Hess, M., Horie, K., Jones, R.G., Kahovec, J.,
Kitayama, T., Kratochvíl, P., Meille, S.V., Mita, I., dos Santos, C., Vert, M.,
Vohlídal, J., Abbreviations of polymer names and guidelines for abbreviating
polymer names (IUPAC Recommendations 2014), Pure and Applied Chemistry
86 (2014).
[78] Amiya, S., Tsuchiya, S., Qian, R., Nakajima, A., The Study of Microsturctures of
Poly(vinyl alcohol) by NMR, Pure and Applied Chemistry 62 (1990) 2139–2146.
[79] Moritani, T., Kurama, I., Shibatani, K., Fujiwara, Y., Tacticity of Poly (vinyl
alcohol) Studied by Nuclear Magnetic Resonance of Hydroxyl Protons,
Macromolecules 5 (1972) 577–580.
[80] Budhlall, B.M., Landfester, K., Nagy, D., Sudol, E.D., Dimonie, V.L., Sagl, D.,
Klein, A., El-Aasser, M.S., Characterization of partially hydrolyzed poly(vinyl
alcohol). I.: Sequence distribution via ¹H and 13C-NMR and a reversed-phased
gradient elution HPLC technique, Macromolecular Symposia 155 (2000) 63–84.
[81] Budhlall, B.M., Landfester, K., Sudol, E.D., Dimonie, V.L., Klein, A., El-Aasser,
M.S., Characterization of Partially Hydrolyzed Poly(vinyl alcohol). Effect of
Poly(vinyl alcohol) Molecular Architecture on Aqueous Phase Conformation,
Macromolecules 36 (2003) 9477–9484.
[82] Toppet, S., Lemstra, P., Van der Velden, Geert, Nuclear magnetic resonance
studies on sequence distributions in vinyl alcohol-vinyl acetate copolymers,
Polymer 24 (1983) 507–512.
[83] Gilmore, C.M., Poehlein, G.W., Schork, F., Modeling poly(vinyl alcohol)-
stabilized vinyl acetate emulsion polymerization. II. Comparison with experiment,
Journal of Applied Polymer Science 48 (1993) 1461–1473.
[84] González, G. S. Magallanes, Dimonie, V.L., Sudol, E.D., Yue, H.J., Klein, A., El-
Aasser, M.S., Characterization of poly(vinyl alcohol) during the emulsion
polymerization of vinyl acetate using poly(vinyl alcohol) as emulsifier, Journal of
Polymer Science Part A: Polymer Chemistry 34 (1996) 849–862.
References 109
[85] Budhlall, B.M., Sudol, E.D., Dimonie, V.L., Klein, A., El-Aasser, M.S., Role of
grafting in the emulsion polymerization of vinyl acetate with poly(vinyl alcohol) as
an emulsifier. I. Effect of the degree of blockiness on the kinetics and
mechanism of grafting, Journal of Polymer Science Part A: Polymer Chemistry
39 (2001) 3633–3654.
[86] Keddie, J.L., Routh, A.F., Fundamentals of latex film formation: Processes and
properties, Springer, Guildford, Berlin, 2010.
[87] Steward, P., Hearn, J., Wilkinson, M., An overview of polymer latex film
formation and properties, Advances in Colloid and Interface Science 86 (2000)
195–267.
[88] Chen, X., Fischer, S., Men, Y., Temperature and Relative Humidity Dependency
of Film Formation of Polymeric Latex Dispersions, Langmuir 27 (2011) 12807–
12814.
[89] Baueregger, S., Perello, M., Plank, J., On the role of colloidal crystal-like
domains in the film forming process of a carboxylated styrene-butadiene latex
copolymer, Progress in Organic Coatings 77 (2014) 685–690.
[90] Ludwig, I., Schabel, W., Kind, M., Castaing, J.-C., Ferlin, P., Drying and film
formation of industrial waterborne latices, AIChE Journal 53 (2007) 549–560.
[91] Rottstegge, J., Landfester, K., Wilhelm, M., Spiess, H., Heldmann, C., Different
types of water in the film formation process of latex dispersions as detected by
solid-state nuclear magnetic resonance spectroscopy, Colloid and Polymer
Science 278 (2000) 236–244.
[92] Rottstegge, J., Traub, B., Wilhelm, M., Landfester, K., Heldmann, C., Spiess, H.,
Investigations on the Film-Formation Process of Latex Dispersions by Solid-
State NMR Spectroscopy, Macromolecular Chemistry and Physics 204 (2003)
787–802.
[93] Routh, A.F., Russel, W.B., Deformation Mechanisms during Latex Film
Formation: Experimental Evidence, Industrial & Engineering Chemistry
Research 40 (2001) 4302–4308.
[94] Keddie, J.L., Film formation of latex, Materials Science and Engineering: R:
Reports 21 (1997) 101–170.
[95] Sperry, P.R., Snyder, B.S., O'Dowd, M.L., Lesko, P.M., Role of Water in Particle
Deformation and Compaction in Latex Film Formation, Langmiur 10 (1994)
2619–2628.
110 References
[96] Lin, F., Meier, D.J., A Study of Latex Film Formation by Atomic Force
Microscopy. 1. A Comparison of Wet and Dry Conditions, Langmuir 11 (1995)
2726–2733.
[97] Jensen, O., Morgan, L., Particle size as it relates to the minimum film formation
temperature of latices, Journal of Applied Polymer Science 42 (1991) 2845–
2849.
[98] Keddie, J.L., Meredith, P., Jones, R. A. L., Donald, A.M., Rate-Limiting Steps in
Film Formation of Acrylic Latices as Elucidated with Ellipsometry and
Environmental Scanning Electron Microscopy, in: Provder, T., Winnik, M.A.,
Urban, M.W. (Eds.), Film formation in waterborne coatings, American Chemical
Society, Washington, DC, 1996, pp. 332–348.
[99] Donald, A.M., He, C., Royall, C., Sferrazza, M., Stelmashenko, N.A., Thiel, B.L.,
Applications of environmental scanning electron microscopy to colloidal
aggregation and film formation, Colloids and Surfaces A: Physicochemical and
Engineering Aspects 174 (2000) 37–53.
[100] Keddie, J.L., Meredith, P., Jones, R. A. L., Donald, A.M., Kinetics of Film
Formation in Acrylic Latices Studied with Multiple-Angle-of-Incidence
Ellipsometry and Environmental SEM, Macromolecules 28 (1995) 2673–2682.
[101] Dragnevski, K., Donald, A., Taylor, P., Murray, M., Davies, S., Bone, E., Latex
Film Formation in the Environmental Scanning Electron Microscope,
Macromolecular Symposia 281 (2009) 119–125.
[102] Donald, A.M., The use of environmental scanning electron microscopy for
imaging wet and insulating materials, Nature Materials 2 (2003) 511–516.
[103] Wang, Y., Winnik, M.A., Polymer diffusion across interfaces in latex films,
Journal of Physical Chemistry B 97 (1993) 2507–2515.
[104] Urban, D., Takamura, K. (Eds.), Polymer dispersions and their industrial
applications, Wiley-VCH, Weinheim, 2002.
[105] Kast, H., Aspects of film formation with emulsion copolymers, Die
Makromolekulare Chemie 10 (1985) 447–461.
[106] Budhlall, B.M., Shaffer, O.L., Sudol, E.D., Dimonie, V.L., El-Aasser, M.S.,
Atomic Force Microscopy Studies of the Film Surface Characteristics of
Poly(vinyl acetate) Latexes Prepared with Poly(vinyl alcohol), Langmuir 19
(2003) 9968–9972.
[107] Taylor, H. F. W, Cement chemistry, 2nd ed., T. Telford, London, 1997.
References 111
[108] Bishop, M., Bott, S.G., Barron, A.R., A New Mechanism for Cement Hydration
Inhibition: Solid-State Chemistry of Calcium Nitrilotris(methylene)triphosphonate,
Chemistry of Materials 15 (2003) 3074–3088.
[109] Holzer, L., Flatt, R.J., Erdoğan, S.T., Bullard, J.W., Garboczi, E.J., Shape
Comparison between 0.4-2.0 and 20-60 μm Cement Particles, Journal of the
American Ceramic Society (2010).
[110] Erdoğan, S., Nie, X., Stutzman, P., Garboczi, E., Micrometer-scale 3-D shape
characterization of eight cements: Particle shape and cement chemistry, and the
effect of particle shape on laser diffraction particle size measurement, Cement
and Concrete Research 40 (2010) 731–739.
[111] Taylor, J., Aldridge, L., Matulis, C., Hinczak, I., Chapter 18 X-ray powder
diffraction analysis of cements, in: Bensted, J., Barnes, P. (Eds.), Structure and
performance of cements, 2nd ed., E & Fn Spon, London, 2002.
[112] Taylor, J., Hinczak, I., Matulis, C., Rietveld full-profile quantification of
Portland cement clinker The importance of including a full crystallography of the
major phase polymorphs, Powder Diffraction 15 (2000) 7–18.
[113] Snellings, R., Bazzoni, A., Scrivener, K., The existence of amorphous phase
in Portland cements: Physical factors affecting Rietveld quantitative phase
analysis, Cement and Concrete Research 59 (2014) 139–146.
[114] León-Reina, L., De la Torre,A. G., Porras-Vázquez, J.M., Cruz, M., Ordonez,
L.M., Alcobé, X., Gispert-Guirado, F., Larrañaga-Varga, A., Paul, M., Fuellmann,
T., Schmidt, R., Aranda, M.A.G., Round robin on Rietveld quantitative phase
analysis of Portland cements, Journal of Applied Crystallography 42 (2009) 906–
916.
[115] Whitfield, P., Mitchell, L., Quantitative Rietveld analysis of the amorphous
content in cements and clinkers, Journal of Materials Science 38 (2003) 4415–
4421.
[116] Stutzman, P., Scanning electron microscopy imaging of hydraulic cement
microstructure, Cement and Concrete Composites 26 (2004) 957–966.
[117] Scrivener, K.L., The microstructure of anhydrous cement and its effect on
hydration, MRS Proceedings 85 (1986) 39–46.
[118] Jeffery, J., The crystal structure of tricalcium silicate, Acta Crystallographica 5
(1952) 26–35.
112 References
[119] Nishi, F., Takéuchi, Y., Maki, I., Tricalcium silicate Ca3O[SiO4]: The monoclinic
superstructure, Zeitschrift für Kristallographie Supplements 172 (1985) 297–314.
[120] Mumme, W.G., Crystal structure of tricalcium silicate from a Portland Cement
clinker and its application to quantitative XRD analysis, Neues Jahrbuch für
Mineralogie Monatsheft (1995) 145–160.
[121] Noirfontaine, M.-N. de, Dunstetter, F., Courtial, M., Gasecki, G., Signes-
Frehel, M., Polymorphism of tricalcium silicate, the major compound of Portland
cement clinker: 2. Modelling alite for Rietveld analysis, an industrial challenge,
Cement and Concrete Research 36 (2006) 54–64.
[122] Dunstetter, F., Noirfontaine, M.-N. de, Courtial, M., Polymorphism of tricalcium
silicate, the major compound of Portland cement clinker: 1. Structural data.
review and unified analysis, Cement and Concrete Research 36 (2006) 39–53.
[123] De la Torre, Ángeles G., Vera, R.N. de, Cuberos, A.J., Aranda, M.A., Crystal
structure of low magnesium-content alite: Application to Rietveld quantitative
phase analysis, Cement and Concrete Research 38 (2008) 1261–1269.
[124] Ghosh, S.N., Rao, P. Bhaskara, Paul, A.K., Raina, K., The chemistry of
dicalcium silicate mineral. Review, Journal of Materials Science 14 (1979) 1554–
1566.
[125] Mondal, P., Jeffery, J., The Crystal Structure of Tricalcium Aluminate,
Ca3Al2O6, Structural Crystallography and Crystal Chemistry 31 (1975) 689–
698.
[126] Pöllmann, H., Chapter 2 Composition of cement phases, in: Bensted, J.,
Barnes, P. (Eds.), Structure and performance of cements, 2nd ed., E & Fn Spon,
London, 2002, pp. 25–56.
[127] Bensted, J., Gypsum in cements. Chapter 8, in: Bensted, J., Barnes, P.
(Eds.), Structure and performance of cements, 2nd ed., E & Fn Spon, London,
2002, pp. 253–264.
[128] Wade, L.G., Organic chemistry, 8th ed., Pearson Education; Pearson, Boston,
2013.
[129] Atkins, K.M., Edmonds, R.N., Majumdar, A.J., The hydration of Portland and
aluminous cements with added polymer dispersions, Journal of Materials
Science 26 (1991) 2372–2378.
References 113
[130] Larbi, J., Bijen, J., Interaction of polymers with portland cement during
hydration: A study of the chemistry of the pore solution of polymer-modified
cement systems, Cement and Concrete Research 20 (1990) 139–147.
[131] Pöllmann, H., Sieksmeier, J., Dispersionspulver in zementären Systemen,
ZKG International (2012) 56–61.
[132] Ma, H., Tian, Y., Li, Z., Interaction between Organic and Inorganic Phases in
PA- and PU/PA-Modified-Cement-Based Materials, Journal of Materials in Civil
Engineering 23 (2011) 1412–1421.
[133] Wang, R., Li, X.-G., Wang, P.-M., Influence of polymer on cement hydration in
SBR-modified cement pastes, Cement and Concrete Research 36 (2006) 1744–
1751.
[134] International Union of Pure and Applied Chemistry, Compendium of Chemical
Terminology: Gold Book, 2014.
[135] Myers, D., Surfaces, interfaces, and colloids: Principles and applications, 2nd
ed., Wiley-VCH, New York, 1999.
[136] Giles, C.H., Smith, D., Huitson, A., A general treatment and classification of
the solute adsorption isotherm: I. Theoretical, Journal of Colloid and Interface
Science 47 (1974) 755–765.
[137] Limousin, G., Gaudet, J.-P., Charlet, L., Szenknect, S., Barthès, V., Krimissa,
M., Sorption isotherms: A review on physical bases, modeling and
measurement, Applied Geochemistry 22 (2007) 249–275.
[138] Hinz, C., Description of sorption data with isotherm equations, Geoderma 99
(2001) 225–243.
[139] Adamczyk, Z., Adsorption of Particles: Theory, in: Encyclopedia of Surface
and Colloid Science, Second Edition, Taylor & Francis, 2007, pp. 575-591.
[140] Pattanayek, S.K., Juvekar, V.A., Prediction of Adsorption of Nonionic
Polymers from Aqueous Solutions to Solid Surfaces, Macromolecules 35 (2002)
9574–9585.
[141] Chibowski, Paszkiewicz, M., Studies of the Influence of Acetate Groups from
Polyvinyl Alcohol on Adsorption and Electrochemical Properties of the TiO2 –
Polymer Solution Interface, Journal of Dispersion Science and Technology 22
(2001) 281–289.
[142] Backfolk, K., Rosenholm, J.B., Husband, J., Eklund, D., The influence of
surface chemical properties of kaolin surfaces on the adsorption of poly(vinyl
114 References
alcohol), Colloids and Surfaces A: Physicochemical and Engineering Aspects
275 (2006) 133–141.
[143] Santhiya, D., Subramanian, S., Natarajan, K.A., Malghan, S.G., Surface
Chemical Studies on the Competitive Adsorption of Poly(acrylic acid) and
Poly(vinyl alcohol) onto Alumina, Journal of Colloid and Interface Science 216
(1999) 143–153.
[144] Labidi, N.S., Djebaili, A., Studies of The Mechanism of Polyvinyl Alcohol
Adsorption on The Calcite/Water Interface in The Presence of Sodium Oleate,
Journal of Minerals & materials Characterization & Engineering 7 (2008) 147–
161.
[145] Feder, J., Random sequential adsorption, Journal of Theoretical Biology 87
(1980) 237–254.
[146] Johnson, C.A., Lenhoff, A.M., Adsorption of Charged Latex Particles on Mica
Studied by Atomic Force Microscopy, Journal of Colloid and Interface Science
179 (1996) 587–599.
[147] Filby, A., Plaschke, M., Geckeis, H., AFM force spectroscopy study of
carboxylated latex colloids interacting with mineral surfaces, Colloids and
Surfaces A: Physicochemical and Engineering Aspects 414 (2012) 400–414.
[148] Adamczyk, Z., Particle adsorption and deposition: role of electrostatic
interactions, Advances in Colloid and Interface Science 100-102 (2003) 267–
347.
[149] Adamczyk, Z., Siwek, B., Musiał, E., Latex particle adsorption at
heterogeneous surfaces, Colloids and Surfaces A: Physicochemical and
Engineering Aspects 214 (2003) 219–229.
[150] Shen, C., Lazouskaya, V., Zhang, H., Li, B., Jin, Y., Huang, Y., Influence of
surface chemical heterogeneity on attachment and detachment of
microparticles, Colloids and Surfaces A: Physicochemical and Engineering
Aspects 433 (2013) 14–29.
[151] Ramachandran, V.S. (Ed.), Handbook of thermal analysis of construction
materials, Noyes Publications/William Andrew Pub., Norwich, N.Y, 2003.
[152] Bullard, J.W., Jennings, H.M., Livingston, R.A., Nonat, A., Scherer, G.W.,
Schweitzer, J.S., Scrivener, K.L., Thomas, J.J., Mechanisms of cement
hydration, Cement and Concrete Research 41 (2011) 1208–1223.
References 115
[153] Scrivener, K.L., Nonat, A., Hydration of cementitious materials, present and
future, Cement and Concrete Research 41 (2011) 651–665.
[154] Hesse, C., Goetz-Neunhoeffer, F., Neubauer, J., A new approach in
quantitative in-situ XRD of cement pastes: Correlation of heat flow curves with
early hydration reactions, Cement and Concrete Research 41 (2011) 123–128.
[155] Hesse, C., Goetz-Neunhoeffer, F., Neubauer, J., Braeu, M., Gaeberlein, P.,
Quantitative in situ X-ray diffraction analysis of early hydration of Portland
cement at defined temperatures, Powder Diffraction 24 (2009) 112–115.
[156] Jansen, D., Goetz-Neunhoeffer, F., Lothenbach, B., Neubauer, J., The early
hydration of Ordinary Portland Cement (OPC): An approach comparing
measured heat flow with calculated heat flow from QXRD, Cement and Concrete
Research 42 (2012) 134–138.
[157] Gartner, E.M., Young, J.F., Damidot, D., Jawed, I., Chapter 3 Hydration of
Portland cement, in: Bensted, J., Barnes, P. (Eds.), Structure and performance
of cements, 2nd ed., E & Fn Spon, London, 2002, pp. 57–113.
[158] Taylor, H.F.W., Barret, P., Brown, P.W., Double, D.D., Frohnsdorff, G.,
Johansen, V., Ménétrier-Sorrentino, D., Odler, I., Parrott, L.J., Pommersheim,
J.M., Regourd, M., Young, J.F., The hydration of tricalcium silicate, Matériaux et
Constructions 17 (1984) 457–468.
[159] Schlegel, M.-C., Sarfraz, A., Müller, U., Panne, U., Emmerling, F., First
Seconds in a Building’s Life-In Situ Synchrotron X-Ray Diffraction Study of
Cement Hydration on the Millisecond Timescale, Angewandte Chemie
International Edition 51 (2012) 4993–4996.
[160] Zingg, A., Holzer, L., Kaech, A., Winnefeld, F., Pakusch, J., Becker, S.,
Gauckler, L., The microstructure of dispersed and non-dispersed fresh cement
pastes — New insight by cryo-microscopy, Cement and Concrete Research 38
(2008) 522–529.
[161] Matschei, T., Lothenbach, B., Glasser, F.P., Thermodynamic properties of
Portland cement hydrates in the system CaO–Al2O3–SiO2–CaSO4–CaCO3–H2O,
Cement and Concrete Research 37 (2007) 1379–1410.
[162] Bullard, J.W., Flatt, R.J., New Insights Into the Effect of Calcium Hydroxide
Precipitation on the Kinetics of Tricalcium Silicate Hydration, Journal of the
American Ceramic Society (2010).
116 References
[163] Juilland, P., Gallucci, E., Flatt, R., Scrivener, K., Dissolution theory applied to
the induction period in alite hydration, Cement and Concrete Research 40
(2010) 831–844.
[164] Gartner, E., Discussion of the paper “Dissolution theory applied to the
induction period in alite hydration” by P. Juilland et al., Cem. Concr. Res. 40
(2010) 831–844, Cement and Concrete Research 41 (2011) 560–562.
[165] Nicoleau, L., Schreiner, E., Nonat, A., Ion-specific effects influencing the
dissolution of tricalcium silicate, Cement and Concrete Research 59 (2014) 118–
138.
[166] Minard, H., Garrault, S., Regnaud, L., Nonat, A., Mechanisms and parameters
controlling the tricalcium aluminate reactivity in the presence of gypsum, Cement
and Concrete Research 37 (2007) 1418–1426.
[167] Pourchet, S., Regnaud, L., Perez, J., Nonat, A., Early C3A hydration in the
presence of different kinds of calcium sulfate, Cement and Concrete Research
39 (2009) 989–996.
[168] Quennoz, A., Scrivener, K.L., Hydration of C3A–gypsum systems, Cement
and Concrete Research 42 (2012) 1032–1041.
[169] Quennoz, A., Scrivener, K.L., Interactions between alite and C3A-gypsum
hydrations in model cements, Cement and Concrete Research 44 (2013) 46–54.
[170] Jansen, D., Götz-Neunhoeffer, F., Neubauer, J., Hergeth, W., Influence of
polyvinyl alcohol on phase development during the hydration of Portland
cement, ZKG International (2010) 100–107.
[171] Gretz, M., Plank, J., An ESEM investigation of latex film formation in cement
pore solution, Cement and Concrete Research 41 (2011) 184–190.
[172] Dukhin, A.S., Goetz, P.J., Ultrasound for characterizing colloids: Particle
sizing, zeta potential, rheology, Elsevier, Amstedam [u.a.], 2002.
[173] Kämmer, S.B., Introduction to Bruker's ScanAsyst and PeakForce Tapping
Atomic Force Microscopy Technology, http://www.bruker.com/products/surface-
analysis/atomic-force-microscopy/modes/modes-techniques/primary-
modes/peakforce-tapping.html.
[174] Silverstein, R.M., Webster, F.X., Kiemle, D.J., Spectrometric identification of
organic compounds, 7th ed., John Wiley & Sons, Hoboken, NJ, 2005.
[175] ASTM D2354-10, Test Method for Minimum Film Formation Temperature
(MFFT) of Emulsion Vehicles, ASTM International, West Conshohocken, PA.
References 117
[176] Chui, J., Application of Thermogravimetry to the Study of High Polymers,
Applied Polymer Symposia 2 (1966) 25–43.
[177] Böckenhoff, K., Fischer, W.R., Determination of electrokinetic charge with a
particle-charge detector, and its relationship to the total charge, Fresenius'
Journal of Analytical Chemistry 371 (2001) 670–674.
[178] Medala, M., Labbez, C., Pochard, I., Nonat, A., Ettringite surface chemistry:
Interplay of electrostatic and ion specificity, Journal of Colloid and Interface
Science 354 (2011) 765–770.
[179] Turesson, M., Labbez, C., Nonat, A., Calcium Mediated Polyelectrolyte
Adsorption on Like-Charged Surfaces, Langmuir 27 (2011) 13572–13581.
[180] Flatt, R.J., Dispersion forces in cement suspensions, Cement and Concrete
Research 34 (2004) 399–408.
[181] Walker, C.A., Kirby, J.T., Dentel, S.K., The Streaming Current Detector: A
Quantitative Model, Journal of Colloid and Interface Science 182 (1996) 71–81.
[182] Chen, J., Heitmann, J.A., Hubbe, M.A., Dependency of polyelectrolyte
complex stoichiometry on the order of addition. 1. Effect of salt concentration
during streaming current titrations with strong poly-acid and poly-base, Colloids
and Surfaces A: Physicochemical and Engineering Aspects 223 (2003) 215–
230.
[183] Flatt, R.J., Bowen, P., Electrostatic repulsion between particles in cement
suspensions: Domain of validity of linearized Poisson–Boltzmann equation for
nonideal electrolytes, Cement and Concrete Research 33 (2003) 781–791.
[184] Koopal, L., Lyklema, J., Characterization of adsorbed polymers from double
layer experiments, Journal of Electroanalytical Chemistry and Interfacial
Electrochemistry 100 (1979) 895–912.
[185] Holmberg, K., Surfactants and polymers in aqueous solution, 2nd ed., John
Wiley & Sons, Chichester [etc.], op. 2003.
[186] Yamada, K., Basics of analytical methods used for the investigation of
interaction mechanism between cements and superplasticizers, Cement and
Concrete Research 41 (2011) 793–798.
[187] Allen, T., Particle size measurement, 5th ed., Chapman & Hall, London, New
York, 1997.
118 References
[188] Edmonds, R.N., Majumdar, A.J., The hydration of an aluminous cement with
added polyvinyl alcohol-acetate, Journal of Materials Science 24 (1989) 3813–
3818.
[189] Kotwica, Ł., Małolepszy, J., Chemical aspects of EVA redispersible powders
influence on the hydration of tricalcium aluminate, in: Siasa Congresos S.A.,
Palomo, A., Zaragoza, A., López Agüí, Juan Carlos (Eds.), Cementing a
sustainable future: XIII ICCC International Congress on the Chemistry of
Cement, Madrid, 3-8 July, 2011 Abstracts and Proceedings, Instituto de
Ciencias de la Construcción, Madrid, 2011.
[190] Mansur, A.A., Nascimento, O.L.d., Mansur, H.S., Physico-chemical
characterization of EVA-modified mortar and porcelain tiles interfaces, Cement
and Concrete Research 39 (2009) 1199–1208.
[191] Wadsö, L., Applications of an eight-channel isothermal conduction calorimeter
for cement hydration studies, Cement International (2005) 94–101.
[192] Keller, H., Plank, J., Mineralisation of CaCO3 in the presence of
polycarboxylate comb polymers, Cement and Concrete Research 54 (2013) 1–
11.
[193] Hosoda, N., Sugawara, A., Kato, T., Template Effect of Crystalline Poly(vinyl
alcohol) for Selective Formation of Aragonite and Vaterite CaCO3 Thin Films,
Macromolecules 36 (2003) 6449–6452.
[194] Marentette, J.M., Norwig, J., Stöckelmann, E., Meyer, W.H., Wegner, G.,
Crystallization of CaCO3 in the presence of PEO-block-PMAA copolymers,
Advanced Materials 9 (1997) 647–651.
[195] Yuan, T., Wang, J., Li, Z., Measurement and modelling of solubility for calcium
sulfate dihydrate and calcium hydroxide in NaOH/KOH solutions, Fluid Phase
Equilibria 297 (2010) 129–137.
[196] Brandt, F., Bosbach, D., Bassanite (CaSO4·0.5H2O) dissolution and gypsum
(CaSO4·2H2O) precipitation in the presence of cellulose ethers, Journal of
Crystal Growth 233 (2001) 837–845.
[197] Kalina, L., Másilko, J., Koplík, J., Šoukal, F., XPS characterization of polymer–
monocalcium aluminate interface, Cement and Concrete Research 66 (2014)
110–114.
References 119
[198] Möschner, G., Lothenbach, B., Figi, R., Kretzschmar, R., Influence of citric
acid on the hydration of Portland cement, Cement and Concrete Research 39
(2009) 275–282.
[199] Parkhurst, D.L., Appelo, C., User’s guide to PHREEQC—a computer program
for speciation, reaction-path, advective transport, and inverse geochemical
calculations: Water-Resources Investigations Report 99-4259, 1999.
[200] Jacques, D., Benchmarking of the cement model and detrimental chemical
reactions including temperature dependent parameters, 2009,
http://science.sckcen.be/en/Disposal_radioactive_waste/Safety_assessment_ne
ar_surface_disposal/concrete_durability_assessment.
[201] Richardson, I., The calcium silicate hydrates, Cement and Concrete Research
38 (2008) 137–158.
[202] Mitchell, L.D., Margeson, J.C., Whitfield, P.S., Quantitative Rietveld analysis
of hydrated cementitious systems, Powder Diffraction 21 (2006) 111–113.
[203] Goetz-Neunhoeffer, F., Neubauer, J., Schwesig, P., Mineralogical
characteristics of Ettringites synthesized from solutions and suspensions,
Cement and Concrete Research 36 (2006) 65–70.
[204] Chaix-Pluchery, O., Pannetier, J., Bouillot, J., Niepce, J., Structural
prereactional transformations in Ca(OH)2, Journal of Solid State Chemistry 67
(1987) 225–234.
[205] Hawthorne, F., Ferguson, R., Anhydrous Sulphates II Refinement of the
Crystal Structure of Anhydrite, Canadian Mineralogist 13 (1975) 289–292.
[206] Goetz-Neunhoeffer, F., Neubauer, J., Refined ettringite
(Ca6Al2(SO4)3(OH)12∙26H2O) structure for quantitative X-ray diffraction analysis,
Powder Diffraction 21 (2006) 4–11.
[207] Messersmith, P.B., Stupp, S.I., Synthesis and Properties of Poly(Vinyl
Alcohol)/Calcium Aluminate Nanocomposites, MRS Proceedings 245 (1991).
[208] Messersmith, P.B., Synthesis and characterization of novel polymer ceramic
nanocomposites Organoceramics. Ph. D dissertation, Urbana-Champaign,
United States of America, 1993.
[209] Lothenbach, B., Pelletier-Chaignat, L., Winnefeld, F., Stability in the system
CaO–Al2O3–H2O, Cement and Concrete Research 42 (2012) 1621–1634.
120 References
[210] Ucar, I., Doganci, M., Cansoy, C., Erbil, H., Avramova, I., Suzer, S.,
Combined XPS and contact angle studies of ethylene vinyl acetate and polyvinyl
acetate blends, Applied Surface Science 257 (2011) 9587–9594.
[211] Beaudoin, J.J., Marchand, J., Pore Sturcture, in: Ramachandran, V.S.,
Beaudoin, J.J. (Eds.), Handbook of analytical techniques in concrete science
and technology: Principles, techniques, and applications, Noyes Publications;
William Andrew Pub., Park Ridge, N.J, Norwich, N.Y, 2001, pp. 528–628.
[212] Rottstegge, J., Arnold, M., Herschke, L., Glasser, G., Wilhelm, M., Spiess, H.,
Hergeth, W., Solid state NMR and LVSEM studies on the hardening of latex
modified tile mortar systems, Cement and Concrete Research 35 (2005) 2233–
2243.
[213] Visschers, M., Laven, J., van der Linde, R., Forces operative during film
formation from latex dispersions, Progress in Organic Coatings 31 (1997) 311–
323.
[214] Jönsson, B., Nonat, A., Labbez, C., Cabane, B., Wennerström, H., Controlling
the Cohesion of Cement Paste, Langmuir 21 (2005) 9211–9221.
[215] Nachbaur, L., Nkinamubanz, P.-C., Nonat, A., Mutin, J.-C., Electrokinetic
Properties which Control the Coagulation of Silicate Cement Suspensions during
Early Age Hydration, Journal of Colloid and Interface Science 202 (1998) 261–
268.
[216] Mishra, R.K., Flatt, R.J., Heinz, H., Force Field for Tricalcium Silicate and
Insight into Nanoscale Properties: Cleavage, Initial Hydration, and Adsorption of
Organic Molecules, The Journal of Physical Chemistry C 117 (2013) 10417–
10432.
[217] Dean, J.A., Lange, N.A., Lange's handbook of chemistry, 15th ed., McGraw-
Hill, New York, NY [u.a.], 1999.
[218] Parsegian, V.A., Van der Waals forces: A handbook for biologists, chemists,
engineers, and physicists, Cambridge University Press, New York, 2006.
[219] Melis, S., Kemmere, M., Meuldijk, J., Storti, G., Morbidelli, M., A model for the
coagulation of polyvinyl acetate particles in emulsion, Chemical Engineering
Science 55 (2000) 3101–3111.
Recommended