RESEARCH ARTICLE
Indicators to measure the climate change adaptationoutcomes of ecosystem-based adaptation
Camila I. Donatti1 & Celia A. Harvey1,2 & David Hole1 & Steven N. Panfil3 &
Hanna Schurman4
Received: 18 July 2018 /Accepted: 26 September 2019 /Published online: 27 November 2019# Springer Nature B.V. 2019
AbstractEcosystem-based adaptation (EbA) is the use of biodiversity and ecosystem services as part of astrategy to help people adapt to climate change. Despite the potential of EbA to provide adaptationbenefits, there is a lack of consensus on how to measure the success of this approach. This paperreviews the intended adaptation outcomes and indicators used by ongoing and completed EbAprojects and addresses the following questions: (a) where have EbA projects been implemented? (b)what activities have been conducted by EbA projects? (c) what adaptation outcomes are EbAprojects seeking to achieve? (d) how have the impacts of EbA projects been measured andevaluated? and (e) what is the set of indicators that can capture the diversity of adaptation outcomesachieved by EbA? To identify the adaptation outcomes provided by EbA and the indicators thatcould be used to measure such outcomes, we reviewed 58 EbA projects implemented globally, andobtained recommendations from experts on what indicators should be measured. We identified 13adaptation outcomes that could be achieved through EbA, such as reducing the loss of assetsof coastal communities due to extreme events.We identified seven indicators tomonitor the successof EbA in achieving adaptation outcomes. Our review suggests that there is a strong need to betterarticulate the adaptation outcomes that EbA projects seek to achieve, to use a common set ofspecific indicators to track these outcomes, and to fund the monitoring of long-term EbA projects.
Keywords Climate change adaptation outcomes . Ecosystem-based adaptation . EbAeffectiveness .Monitoring and evaluation
1 Introduction
Climate change is impacting social and ecological systems, as well as the interactions betweenthem. The goal of the 2015 UNFCCC (United Nations Framework Convention on Climate
Climatic Change (2020) 158:413–433https://doi.org/10.1007/s10584-019-02565-9
Electronic supplementary material The online version of this article (https://doi.org/10.1007/s10584-019-02565-9) contains supplementary material, which is available to authorized users.
* Camila I. [email protected]
Extended author information available on the last page of the article
Change) Paris Agreement is to strengthen responses to keep the global temperature rise up to 2 0Cabove pre-industrial levels and to pursue efforts to limit the temperature increase to 1.5 0C (UnitedNations 2015). However, even if either of those targets is achieved, climate change adaptation willstill be needed, as many places have already experienced drastic impacts due to warmertemperatures, sea level rise, and stronger and more frequent extreme events (Mimura et al., 2014).
One promising approach for climate change adaptation is ecosystem-based adaptation(UNEP 2012; World Bank 2009). Ecosystem-based adaptation (hereafter “EbA”) refers to“the use of biodiversity and ecosystem services as part of an overall adaptation strategy to helppeople adapt to the adverse effects of climate change” (CBD 2009). It includes the conservation,restoration, and sustainable management of ecosystems, ecosystem processes, and biodiversityto address the impacts of climate change on people’s lives and livelihoods. Examples of EbAinclude the conservation of mangroves to protect people against storms, the reforestation ofhillsides to prevent landslides under extreme rainfall events, and the use of shade trees in coffeeplantations to maintain production under rising temperatures, among others (Andrade et al.2010; Jones et al. 2012; Vignola et al. 2015). In addition to delivering adaptation outcomes,EbA can provide economic, social, and environmental co-benefits (Moberg and Rönnbäck2003; World Bank 2009) and contribute to climate change mitigation (Jones et al. 2012; Moriet al. 2013). It is also considered to be a cost-effective (Mohamed 2007; Emerton et al. 2009;Munroe et al. 2012) and a low-regret option for climate adaptation (Jones et al. 2012).
Even though the protection, restoration, and management of ecosystems have been used bypeople to cope with climatic variability and change for many years, the use of the term EbA andthe attention this concept has received from policy makers, environmental and developmentorganizations, practitioners and donors is relatively new (see CBD 2009; Munang et al. 2013;UNEP 2015). EbA has been promoted within the UNFCCC policy discussions and in nationaland international fora since 2009 and is explicitly mentioned in the nationally determinedcontributions (NDCs) of 103 countries as part of the Paris Agreement (IIED 2018).
Despite the potential of EbA to provide adaptation outcomes and the growing interest bygovernments in this approach, there is still a limited evidence base on whether many types ofEbA interventions can be considered effective in helping people adapt to climate change. Thislack of clear evidence is considered a barrier to the broadscale use of EbA (Reid 2011;Naumann et al. 2013; Doswald et al. 2014; Milman and Jagannathan 2017). In contrast toclimate mitigation, climate change adaptation can be applied in a wide range of contexts, andhence lead to a very broad range of outcomes (e.g., reducing disaster risk, reducing foodinsecurity, reducing water scarcity driven by climate change) (Jones et al. 2012; Ford et al.2015), encompassing both social and biophysical impacts (McKinnon and Hole 2015). Thebroad range of adaptation activities and outcomes precludes the use of a single commonreference metric or indicator to measure adaptation outcomes in the same way that mitigationis measured (i.e., in terms of avoided greenhouse gases emissions) (Ford et al. 2013; Nobleet al. 2014; Ford et al. 2015; Leiter et al. 2019).
The identification of a set of candidate evaluation indicators for adaptation can be complicated.This is because what constitutes success following an adaptation intervention changes over spaceand time, as climate change impacts differ across sites, temporal and spatial scales, and affects aseries of sectors (Spearman and MacGray 2011; Leiter and Pringle 2018; Leiter et al. 2019).Furthermore, if proposed indicators are too narrow, they may not capture all adaptation outcomes.If the indicators are too broad, theymay not be useful in tracking adaptation success. Those are not,however, problems specific to EbA, but apply to the measurement of adaptation in general (Olivieret al. 2013).
414 Climatic Change (2020) 158:413–433
Nevertheless, focusing on a specific approach, such as EbA, and on indicators that can beused at the project level, may facilitate the identification of a set of indicators for trackingadaptation outcomes. The definition of adaptation outcomes that can be achieved throughEbA, and the indicators that can be used to monitor them, are critical for providing informationon whether this approach is delivering the expected adaptation outcomes (Spearman andMacGray 2011; McKinnon and Hole 2015; Raymond et al. 2017), as well as for understandingwhich EbA interventions are performing well, hence enabling a more targeted focus of futureEbA activities. Furthermore, the identification of adaptation outcomes could help practitionersto better plan and monitor their EbA projects and help practitioners to design EbA interven-tions that lead to specific adaptation outcomes. The identification of indicators could assistfunders in assessing the adaptation impacts of their EbA investments (SNIFFER 2012) andhelp policy makers evaluate progress towards countries’ adaptation goals.
This paper is an attempt to help identify and monitor the multiple adaptationoutcomes that can be achieved by EbA by compiling information on the intendedadaptation outcomes and indicators used by EbA projects. The paper aimed to answerthe following questions: (a) where have EbA projects been implemented? (b) whatactivities have been conducted by EbA projects? (c) what adaptation outcomes areEbA projects seeking to achieve? (d) how have the impacts of EbA projects beenmeasured and evaluated to date? and (e) what is the set of indicators that can capturethe broad diversity of adaptation outcomes achieved by EbA?
2 Methods
2.1 Review of EbA projects
To identify the intended adaptation outcomes of EbA projects and the indicators of adaptation“success” that the projects used to evaluate their overall goals, we reviewed completed andongoing EbA projects found in three major donor databases (UNFCCC 2015, UNEP:http://ebaflagship.unep.org/, and GEF: https://www.thegef.org/projects?search_api_views_fulltext=ecosystem-based+adaptation). We focused on these databases as they are the largestexisting databases for adaptation projects. Projects were included in the review if they were (a)self-identified as EbA projects (i.e., the term EbA had to be explicitly listed in the project titleor in the project description), (b) included as examples of EbA projects in a compilation ofinformation created by the UNFCCC (UNFCCC 2015), or (c) identified as EbA projects bydonors. Projects included in the review also had to have an implementation component (i.e.,the project had to implement restoration, protection or management of ecosystems, ecosystemprocesses and biodiversity to help people adapt to climate change, and/or implement softmeasures to support those).
We opted to focus on EbA projects only (and not extend the review to projects that areusing other terms such as green infrastructure and ecological infrastructure) and use the criteriaabove to avoid the need for authors to interpret whether or not the project was implemented toaddress the adaptation of people. Once EbA projects were identified, we then searched forproject documents in the same databases or in other online platforms and collected thefollowing information: (i) location (globally) of project implementation, (ii) EbA activitiesimplemented, (iii) climate hazard addressed, iv) beneficiaries of activities, v) expected climatechange adaptation outcomes, and (vi) indicators monitored.
Climatic Change (2020) 158:413–433 415
2.2 EbA activities implemented
Through our review, we identified the types of EbA activities planned or implemented by eachproject. We then summarized information about the types and locations of these activities.
2.3 Adaptation outcomes that can be achieved through EbA
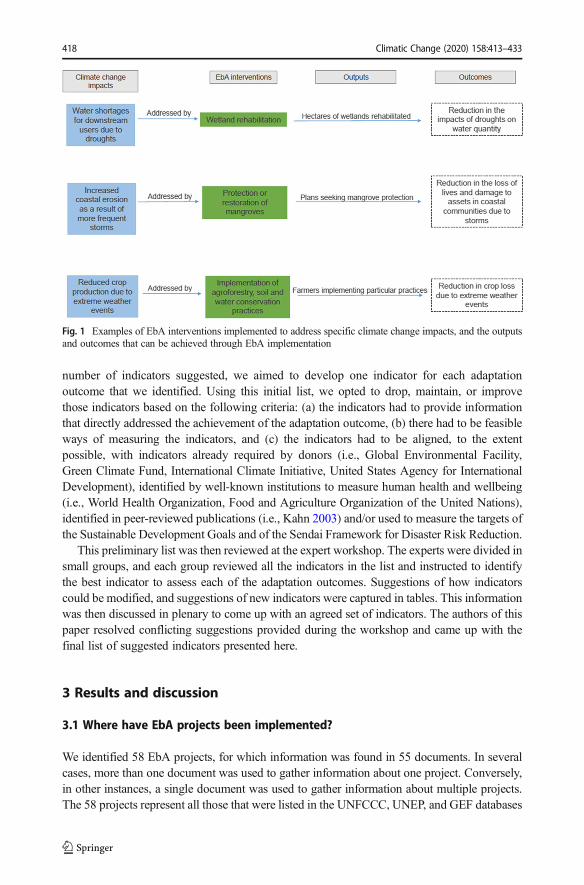
We defined an adaptation outcome as the reduction in harm, the reduction in the risk of harm,or the realization of benefits to address climate variability and change (UKCIP 2004). In otherwords, the outcome is the climate change adaptation goal that is to be achieved through theimplementation of the EbA intervention. Examples of adaptation outcomes that could beachieved through EbA include a “reduction in the impacts of elevated drought severity onwater quantity delivered to humans through the conservation or restoration of cloud forests” ora “reduction in the damage to coastal communities due to an increased intensity of tropicalstorms through the restoration of coastal mangrove” (see Table 1 for more examples) (Emanuel2005; Jones et al. 2012). These project outcomes are different than project outputs, whichsimply measure the short-term success of project activities, such as the increased number offarmers implementing certain agricultural practices, or the number of hectares of mangroverestored (see mangrove example in McKinnon and Hole 2015) (Fig. 1).
For each project, we identified the adaptation outcome(s) that the EbA intervention(s)aimed to achieve. We presented a preliminary set of adaptation outcomes identified through thereview in a workshop held on October 2016 in Arlington, VA, USA, with experts in the fieldof climate change adaptation. The purpose of the workshop was to (a) present the adaptationoutcomes found through the review of EbA projects, (b) review and identify the indicators thatcould be used to measure those outcomes, and (c) discuss ways of promoting the adoption of acommon set of adaptation indicators by donors, policy makers, and practitioners for EbAprojects. Experts from the following institutions participated in the workshop: ConservationInternational (CI), World Resources Institute (WRI), Arizona State University (ASU), UnitedStates Agency for International Developement (USAID), French Agricultural Research Centrefor International Development (CIRAD), United Nations Environment Programme (UNEP),Deutsche Gesellschaft für Internationale Zusammenarbeit (GIZ), Tierra Resources, The NatureConservancy (TNC), Adaptation Fund, Programme Office of the International Climate Initia-tive (IKI), and the International Union for Conservation of Nature (IUCN).
2.4 Indicators used to track EbA activities implemented by EbA projects
To understand how projects are monitoring or planning to monitor the results of their EbAactivities, we compiled a list of the indicators that each project used to track progress towardsoverall project goals. We further divided those indicators into output indicators and outcomeindicators to assess the proportion of projects that are using each type of indicators. Outputindicators are those that simply measure the short-term quantitative success of project activities(such as hectares of rangeland restored or number of farmers trained in certain agriculturalpractices), whereas outcome indicators are those that measure the effects on ecological orsocial systems resulting from project activities (such as reduced loss of assets, or reducedimpacts of climate change on livestock and crop production, see suppl. material).
Outcome indicators collected through our review were used to prepare an initial list ofindicators that could be used to measure the adaptation outcomes of EbA. To minimize the
416 Climatic Change (2020) 158:413–433
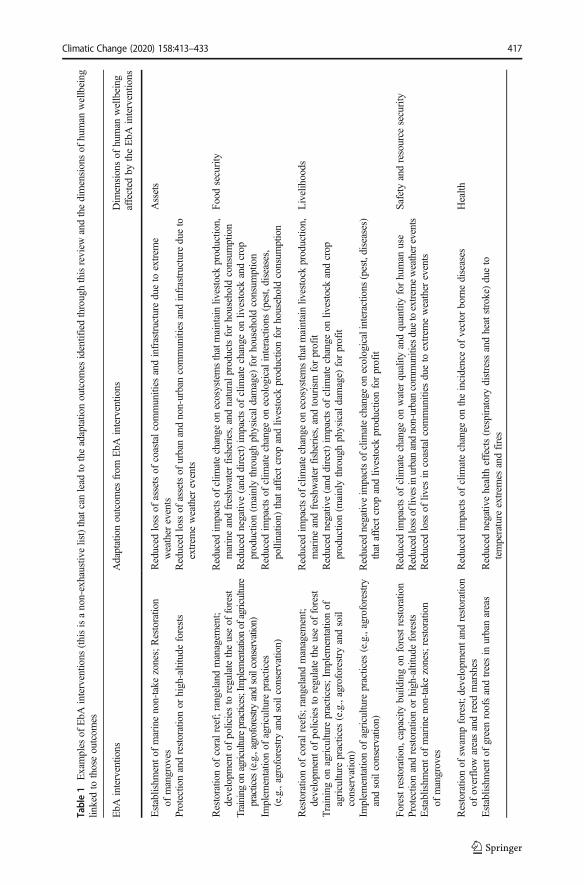
Table1
Examples
ofEbA
interventions
(thisisanon-exhaustiv
elist)thatcanlead
totheadaptationoutcom
esidentifiedthroughthisreview
andthedimensionsof
human
wellbeing
linkedto
thoseoutcom
es
EbA
interventions
Adaptationoutcom
esfrom
EbA
interventio
nsDim
ensionsof
human
wellbeing
affected
bytheEbA
interventio
ns
Establishm
entof
marinenon-take
zones;Restoration
ofmangroves
Reduced
loss
ofassetsof
coastalcommunities
andinfrastructure
dueto
extrem
eweather
events
Assets
Protectionandrestorationor
high-altitude
forests
Reduced
loss
ofassetsof
urbanandnon-urbancommunities
andinfrastructure
dueto
extrem
eweather
events
Restoratio
nof
coralreef;rangelandmanagem
ent;
developm
entof
policiesto
regulatetheuseof
forest
Reduced
impactsof
clim
atechange
onecosystemsthatmaintainlivestock
productio
n,marineandfreshw
ater
fisheries,andnaturalproductsforhouseholdconsum
ption
Food
security
Training
onagriculturepractices;Implem
entationofagriculture
practices
(e.g.,agroforestry
andsoilconservation)
Reduced
negativ
e(and
direct)im
pactsof
clim
atechange
onliv
estock
andcrop
production(m
ainlythroughphysicaldamage)
forhouseholdconsum
ption
Implem
entationof
agriculture
practices
(e.g.,agroforestry
andsoilconservatio
n)Reduced
impactsof
clim
atechange
onecologicalinteractions
(pest,diseases,
pollination)
thataffectcrop
andlivestock
productionforhouseholdconsum
ption
Restoratio
nof
coralreefs;rangelandmanagem
ent;
developm
entof
policiesto
regulatetheuseof
forest
Reduced
impactsof
clim
atechange
onecosystemsthatmaintainlivestock
productio
n,marineandfreshw
ater
fisheries,andtourism
forprofit
Livelihoods
Trainingon
agricultu
repractices;Im
plem
entatio
nof
agriculture
practices
(e.g.,agroforestry
andsoil
conservatio
n)
Reduced
negativ
e(and
direct)im
pactsof
clim
atechange
onliv
estock
andcrop
productio
n(m
ainlythroughphysicaldamage)
forprofit
Implem
entatio
nof
agricultu
repractices
(e.g.,agroforestry
andsoilconservatio
n)Reduced
negativeim
pactsof
clim
atechange
onecologicalinteractions
(pest,diseases)
thataffectcrop
andlivestock
productionforprofit
Forestrestoration,
capacity
buildingon
forestrestoration
Reduced
impactsof
clim
atechange
onwater
quality
andquantityforhuman
use
Safety
andresource
security
Protectio
nandrestorationor
high-altitude
forests
Reduced
lossoflivesinurbanandnon-urbancommunitiesduetoextrem
eweatherevents
Establishm
entof
marinenon-take
zones;restoration
ofmangroves
Reduced
loss
ofliv
esin
coastalcommunities
dueto
extrem
eweather
events
Restoratio
nof
swam
pforest;d
evelopmentandrestoration
ofoverflow
areasandreed
marshes
Reduced
impactsof
clim
atechange
ontheincidenceof
vector
bornediseases
Health
Establishm
entof
greenroofsandtreesin
urbanareas
Reduced
negativehealth
effects(respiratory
distress
andheatstroke)dueto
temperature
extrem
esandfires
Climatic Change (2020) 158:413–433 417
number of indicators suggested, we aimed to develop one indicator for each adaptationoutcome that we identified. Using this initial list, we opted to drop, maintain, or improvethose indicators based on the following criteria: (a) the indicators had to provide informationthat directly addressed the achievement of the adaptation outcome, (b) there had to be feasibleways of measuring the indicators, and (c) the indicators had to be aligned, to the extentpossible, with indicators already required by donors (i.e., Global Environmental Facility,Green Climate Fund, International Climate Initiative, United States Agency for InternationalDevelopment), identified by well-known institutions to measure human health and wellbeing(i.e., World Health Organization, Food and Agriculture Organization of the United Nations),identified in peer-reviewed publications (i.e., Kahn 2003) and/or used to measure the targets ofthe Sustainable Development Goals and of the Sendai Framework for Disaster Risk Reduction.
This preliminary list was then reviewed at the expert workshop. The experts were divided insmall groups, and each group reviewed all the indicators in the list and instructed to identifythe best indicator to assess each of the adaptation outcomes. Suggestions of how indicatorscould be modified, and suggestions of new indicators were captured in tables. This informationwas then discussed in plenary to come up with an agreed set of indicators. The authors of thispaper resolved conflicting suggestions provided during the workshop and came up with thefinal list of suggested indicators presented here.
3 Results and discussion
3.1 Where have EbA projects been implemented?
We identified 58 EbA projects, for which information was found in 55 documents. In severalcases, more than one document was used to gather information about one project. Conversely,in other instances, a single document was used to gather information about multiple projects.The 58 projects represent all those that were listed in the UNFCCC, UNEP, and GEF databases
Fig. 1 Examples of EbA interventions implemented to address specific climate change impacts, and the outputsand outcomes that can be achieved through EbA implementation
418 Climatic Change (2020) 158:413–433
from January 2005 up to August 2016, for which documents were available online and EbAinterventions had been implemented. Twenty-nine projects were self-identified as EbA pro-jects, 25 were listed as EbA in the project compilation provided by UNFCCC, and four wereidentified as EbA projects by donors.
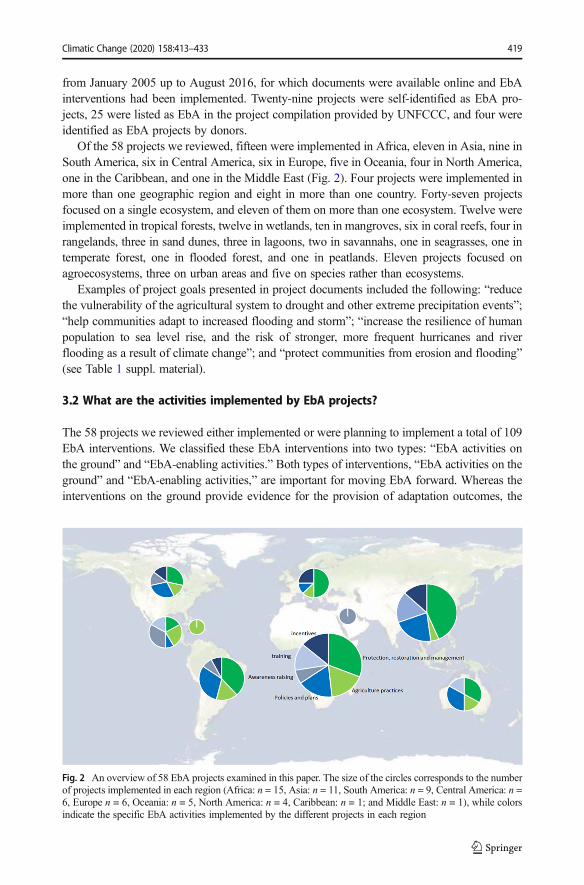
Of the 58 projects we reviewed, fifteen were implemented in Africa, eleven in Asia, nine inSouth America, six in Central America, six in Europe, five in Oceania, four in North America,one in the Caribbean, and one in the Middle East (Fig. 2). Four projects were implemented inmore than one geographic region and eight in more than one country. Forty-seven projectsfocused on a single ecosystem, and eleven of them on more than one ecosystem. Twelve wereimplemented in tropical forests, twelve in wetlands, ten in mangroves, six in coral reefs, four inrangelands, three in sand dunes, three in lagoons, two in savannahs, one in seagrasses, one intemperate forest, one in flooded forest, and one in peatlands. Eleven projects focused onagroecosystems, three on urban areas and five on species rather than ecosystems.
Examples of project goals presented in project documents included the following: “reducethe vulnerability of the agricultural system to drought and other extreme precipitation events”;“help communities adapt to increased flooding and storm”; “increase the resilience of humanpopulation to sea level rise, and the risk of stronger, more frequent hurricanes and riverflooding as a result of climate change”; and “protect communities from erosion and flooding”(see Table 1 suppl. material).
3.2 What are the activities implemented by EbA projects?
The 58 projects we reviewed either implemented or were planning to implement a total of 109EbA interventions. We classified these EbA interventions into two types: “EbA activities onthe ground” and “EbA-enabling activities.” Both types of interventions, “EbA activities on theground” and “EbA-enabling activities,” are important for moving EbA forward. Whereas theinterventions on the ground provide evidence for the provision of adaptation outcomes, the
Fig. 2 An overview of 58 EbA projects examined in this paper. The size of the circles corresponds to the numberof projects implemented in each region (Africa: n = 15, Asia: n = 11, South America: n = 9, Central America: n =6, Europe n = 6, Oceania: n = 5, North America: n = 4, Caribbean: n = 1; and Middle East: n = 1), while colorsindicate the specific EbA activities implemented by the different projects in each region
Climatic Change (2020) 158:413–433 419
EbA-enabling activities can help inform the regulations and build the social and institutionalcapacities which are keys for supporting EbA interventions.
“EbA activities on the ground” included (a) the protection, restoration, and management ofecosystems, ecosystem processes and biodiversity to help people adapt to climate change and(b) the implementation of specific agricultural practices (e.g., mulching, use of terraces, use oftrees in plantation) (Harvey et al. 2017) or use of new crop varieties to help people adapt toclimate change (see Vignola et al. 2015). “EbA-enabling activities” included (a) policies orplans for the protection, restoration and management of ecosystems, ecosystem process andbiodiversity or for the implementation of specific agricultural practices or new crop varieties tohelp people adapt to climate change; (b) awareness-raising activities regarding the protection,restoration, and management of ecosystems, ecosystem processes and biodiversity or for theimplementation of specific agricultural practices or new crop varieties to help people adapt toclimate change; (c) training on the protection, restoration and management of ecosystems,biodiversity, ecosystem services, and species or on the implementation of specific agriculturalpractices or new crop varieties to help people adapt to climate change; and (d) the provision ofincentives for the protection, restoration, and management of ecosystems, ecosystem processesand biodiversity or for the implementation of specific agricultural practices or new cropvarieties to help people adapt to climate change.
The 58 projects had a similar percentage of “EbA activities on the ground” (49%) and“EbA-enabling activities” (51%) planned. The most common activities were the protection,restoration, and management of ecosystems, and the development of policies and planstargeting ecosystem management. Examples of “EbA activities on the ground” included thereforestation of degraded areas to prevent floods under extreme rainfall events (n = 29projects), the implementation of soil conservation practices to increase the resilience of farmersto droughts (n = 10), and the conservation of mangroves to protect coastal communities againststorms (n = 4). In all continents, except Europe and South America, most of project activitieswere “EbA-enabling activities,” such as training of managers of protected areas on the benefitsof an ecosystem approach to climate change adaptation (n = 6), the development of policyguidelines for ecological restoration (n = 3), and the provision of incentives to landowners tomanage forests to enhance their adaptation benefits (n = 3).
3.3 What adaptation outcomes are EbA projects seek to achieve?
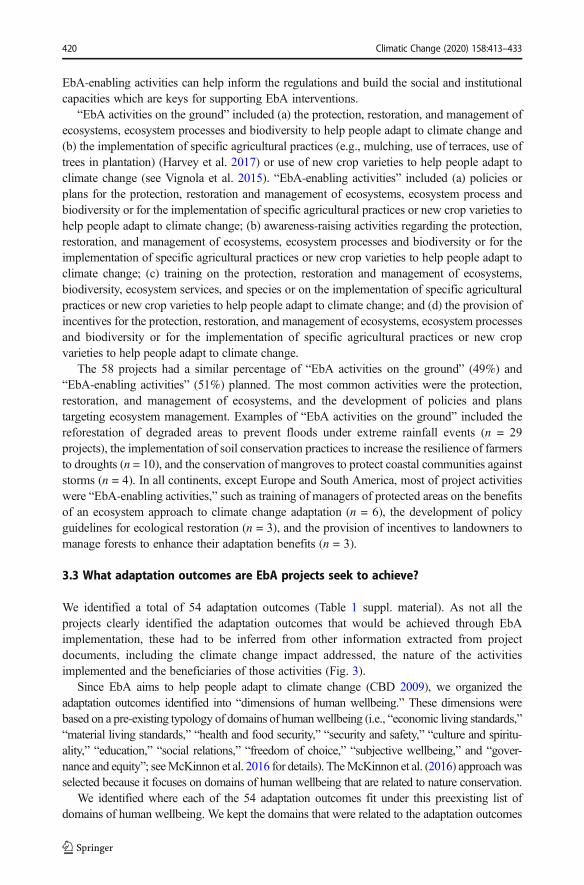
We identified a total of 54 adaptation outcomes (Table 1 suppl. material). As not all theprojects clearly identified the adaptation outcomes that would be achieved through EbAimplementation, these had to be inferred from other information extracted from projectdocuments, including the climate change impact addressed, the nature of the activitiesimplemented and the beneficiaries of those activities (Fig. 3).
Since EbA aims to help people adapt to climate change (CBD 2009), we organized theadaptation outcomes identified into “dimensions of human wellbeing.” These dimensions werebased on a pre-existing typology of domains of humanwellbeing (i.e., “economic living standards,”“material living standards,” “health and food security,” “security and safety,” “culture and spiritu-ality,” “education,” “social relations,” “freedom of choice,” “subjective wellbeing,” and “gover-nance and equity”; seeMcKinnon et al. 2016 for details). TheMcKinnon et al. (2016) approachwasselected because it focuses on domains of human wellbeing that are related to nature conservation.
We identified where each of the 54 adaptation outcomes fit under this preexisting list ofdomains of human wellbeing. We kept the domains that were related to the adaptation outcomes
420 Climatic Change (2020) 158:413–433
we identified (i.e., “economic living standards,” “material living standards,” “health and foodsecurity,” “security and safety”), and re-named or split some to make them more clearlyassociated with the adaptation outcomes that we have identified through our review. For example,we renamed “material living standards” as “assets” and split “health and food security” into“health” and “food security.” We also changed the name of the typology from “domains” to“dimensions” of human wellbeing to make a distinction between the typology presented herefrom the typology presented in McKinnon et al. (2016). These 54 adaptation outcomes fell intosix dimensions of human wellbeing: “assets” with 33% of the outcomes identified, “foodsecurity” (29%), “livelihoods” (14%), “safety and resource security” (14%), and “health” (10%).
As several of the outcomes were relatively like one another, we further organized them in13 unique adaptation outcomes (Table 1). For example, “help communities adapt to increasedflooding and storms, along with the effects on their livelihoods,” “reduce the vulnerability ofcoastal communities to coastal erosion” and “reduce climate and anthropogenic driven coast-line erosion” all fit into the adaptation outcome of “reducing the loss of assets of coastalcommunities and infrastructure due to extreme weather events.” Our final list of adaptationoutcomes includes 3 that refer to “food security,” 3 to “livelihoods,” 3 to “safety and resourcesecurity,” 2 to “assets,” and 2 to “health” (Table 1).
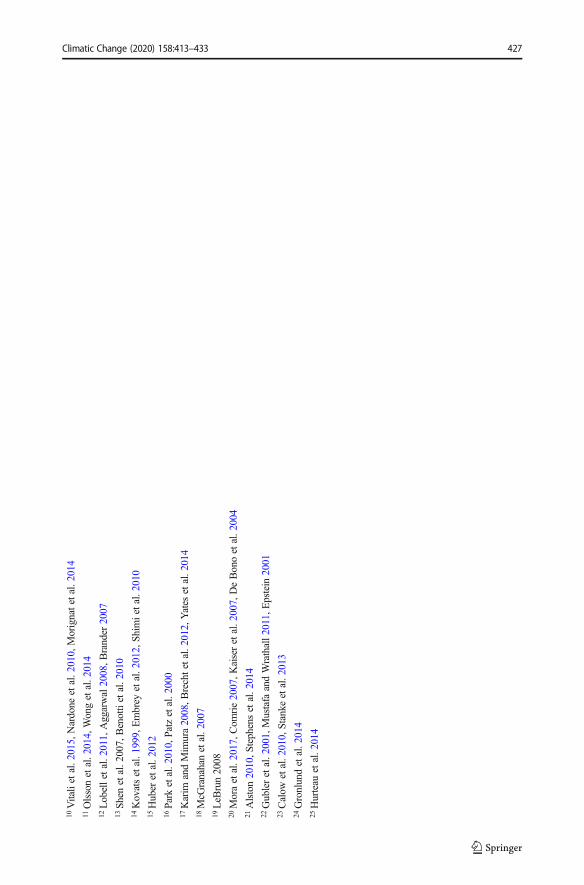
All five dimensions of human wellbeing that we used to organize the adaptation outcomes ofEbA are affected by climate change and have a clear connection with people’s adaptation to climatechange. For example, a reduction in livestock and crop production and fisheries affect food securityand livelihoods and are associated with flooding (Eckard et al. 2013), droughts (Matthews andMatthews 2003; Rockstrom 2003; Baro and Deubel 2006; Easterling et al. 2007; Albert et al. 2013;Wetz and Yoskowitz 2013; Maystadt and Ecker 2014; Golmohammadi 2016), storms (Mainville atal. 2003), fires (Minnegal and Dwyer 2000; Rossati 2017), heatwaves (Nardone et al. 2010;Morignat et al. 2014; Vitali et al. 2015), and sea level rise (Olsson et al. 2014; Wong et al. 2014).The production may also be impacted by the long-term changes in terrestrial and oceanic temper-ature (Aggarwal 2008; Brander 2007; Lobell et al. 2011).
Fig. 3 Information collected from project documents (in green), and how this information was used to define theadaptation outcomes of EbA and the list of indicators to measure such outcomes (the complete list of outcomesand indicators from project documents are in Table 1 of the supplementary material)
Climatic Change (2020) 158:413–433 421
A reduction in water quality and quantity that affects water security is associated withflooding (Kovats et al. 1999; Shimi et al. 2010; Embrey et al. 2012), heatwaves (Huber et al.2012), and droughts (Shen et al. 2007; Benotti et al. 2010) as well as long-term changes inprecipitation (Park et al. 2010; Patz et al. 2000). Deaths in coastal and non-coastal areas arerelated to hurricanes, typhoons, storms (Karim and Mimura 2008; Brecht et al. 2012; Yateset al. 2014), and associated flooding (McGranahan et al. 2007), landslides (LeBrun 2008),extreme heat (De Bono et al. 2004; Comrie 2007; Kaiser et al. 2007; Mora et al. 2017), andfires (Alston 2010; Stephens et al. 2014).
The coastal or hillside erosion leads to loss of assets and are associated to hurricanes,typhoons and storms (Scott et al. 2012; Mora et al. 2018), flooding (Haile et al. 2013; Moraet al. 2017), landslides (Tsai et al. 2011), heatwaves (Dobney et al. 2010), and fires (Teagueet al. 2010; Oloruntoba 2013). Human health issues, such as the incidence of pathogen andvector borne diseases (such as malaria, dengue, leptospirosis, rift valley fever) are associatedwith flooding (Epstein 2001; Gubler et al. 2001; Mustafa and Wrathall 2011) and droughts (aspeople start to rely on unprotected sources of water and as dry conditions favors the inhalationof fungus; Calow et al. 2010; Stanke et al. 2013). Respiratory distress and heat strokes areassociated with extreme heat, heat island effects (Gronlund et al. 2014), and fires (Hurteau et al.2014).
3.4 How EbA interventions have been measured and evaluated to date?
Of the 58 projects we reviewed, 60% included at least one indicator to track the impact(s) oftheir EbA interventions. More than half (55%) of all projects only included indicators to trackproject outputs (such as number of hectares restored). Thirty-six percent of all projectspresented indicators to track outcomes and 29% of all projects presented indicators to trackboth outputs and outcomes. Table 1 in the supplementary material provides details on thespecific indicators used by each project to measure their outputs and/or outcomes. Indicatorsused to measure adaptation outcomes varied widely across projects. The most commonlychosen indicators to measure outcomes included “change in income” (used by 27% of projectsthat measured outcomes) and “change in agriculture productivity” (9%). The most commonindicators used to measure outputs included “number of hectares restored” (used by 28% ofprojects that measured outputs), “number of hectares protected” (11%), and “number of peopletrained” (31%).
In our review, the majority of the EbA projects had not identified or reported on outcomeindicators. This could be due to several factors. First, the adaptation outcome to be achieved byproject activities is not clear, and so is not the outcome indicator to be measured. Second, as theoutcomes of many EbA projects that focus on ecosystem restoration will only be apparent afterseveral years, potentially even decades after project implementation (Holl et al. 2001; Birch et al.2010), many projects may not have resources to do the long-termmonitoring needed to documentpotential adaptation outcomes. Third, many donors do not require outcome indicators to bereported from EbA projects, so there is little motivation for projects to undertake such monitoringon outcomes. Finally, the lack of a set of common indicators that can be used by adaptationprojects to report on their progress makes monitoring outcomes more difficult than in otherprojects (such as mitigation projects, where a single metric—avoided greenhouse gasemissions—can be used) (Ford et al. 2013; Ford et al. 2015; Leiter et al. 2019). Therefore, twoof those limiting factors could be addressed by clearly stating the outcomes to be achieved, and byhaving a clearly understanding of what should be measured.
422 Climatic Change (2020) 158:413–433
3.5 What is the set of indicators that can capture the broad diversity of outcomesachieved by EbA?
Based on the 13 outcomes identified and indicators used by donors, institutions, and internationalframeworks, we suggest a set of seven indicators that can be used to measure the adaptationoutcomes of EbA (Table 2).We identified one indicator to address adaptation outcomes related to“assets,” one related to “food security,” one related to “livelihoods,” two related to “safety andresource security,” and two related to “health.” These indicators do not specifically addressimprovements in governance, knowledge, and adaptive capacity as those are output indicatorsthat do not provide information on the achievement of adaptation outcomes. The same way thatthe suggested indicators do not focus on on-the-ground EbA implementation or on the ecologicalcomponents of the interventions, such as hectares of mangrove restored or number of treesplanted. The indicators proposed here are ultimate, “gold standard” indicators that one shouldmeasure to address whether an adaptation outcome has been achieved.
These suggested indicators are worth using, not only because they directly address theadaptation outcomes that can be achieved through EbA, but because they can be assessed throughdata that has already been collected by national or regional censuses, data that is often used tomeasure development or other goals. This is the case of indicator no. 3 proposed here (seeTable 2) as people’s income from specific activities may already be collected through time bynational or regional censuses. Furthermore, indicator no. 1 is listed within those to track the globaltargets of the Sendai Framework for Disaster Risk Reduction, and indicators nos.2, 3, 4, and 5 arewithin those listed to track the achievement of the Sustainable Development Goals, making theindicators suggested here aligned with those that countries must report on. Likewise, some of theindicators proposed here are the same as those recommended by well-known organizations (i.e.,World Health Organization) to measure human wellbeing (nos. 6 and 7), while others (nos. 1 and4) by well-known institutions (i.e., GIZ) to measure adaptation goals (Hammill et al. 2014).
We acknowledge, however, that there are a few challenges in applying the indicatorsproposed by this study. These include the issues of causality (Ford et al. 2013; Ford et al.2015) (i.e., whether EbA is the factor leading to the identified outcomes), the limited dataavailable to assess the indicators in certain locations and the fact that adaptation outcomes taketime to become identifiable and can be subject to evolving objectives and conditions (Nobleet al. 2014).We are aware that our indicators may bemore aligned to the concept of contributionthan attribution or causality. Nevertheless, when applied systematically and regularly, thesuggested indicators could offer the opportunity to build the much-needed evidence on thesuccessful of the intervention in achieving adaptation outcomes (as highlighted by Ford et al.201). In addition, if projects can be sustained after the initial funding ends, and if appropriateindicators are used to monitor long-term outcomes, those issues can be overcome to someextent. Another way to overcome some of those issues is to clearly link the EbA activitiesimplemented to the adaptation outcome to be achieved and articulate the assumptions taken.Unless EbA projects do a better job of articulating clear adaptation outcomes and implementingindicators to measure these outcomes, it will be difficult to rigorously evaluate how effectiveEbA projects are in delivering adaptation benefits to human communities.
Identifying short-term indicators that can be collected through time, and indicate how theresults acquired can lead to the outcome, could also help advance the monitoring of EbA. Tofacilitate that, we have also provided a list of mid-term, process-based indicators that can betracked when the “gold standard” indicators cannot, due to lack of data and/or time and resourceconstraints (Table 2).
Climatic Change (2020) 158:413–433 423
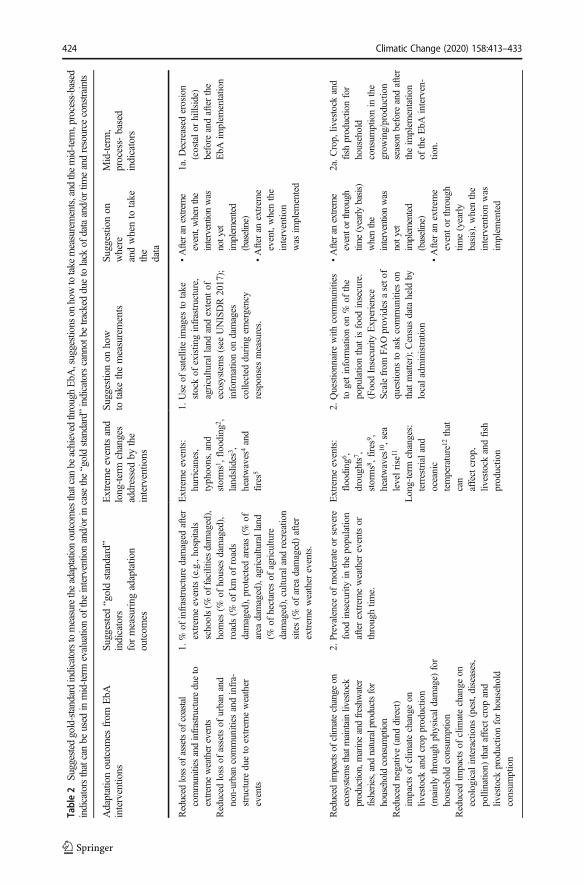
Table2
Suggestedgold-standardindicatorstomeasuretheadaptationoutcom
esthatcanbe
achieved
throughEbA
,suggestions
onhowtotake
measurements,and
themid-term
,process-based
indicatorsthatcanbe
used
inmid-term
evaluationof
theinterventionand/or
incase
the“goldstandard”indicatorscannotbe
tracked
duetolack
ofdataand/or
timeandresource
constraints
Adaptationoutcom
esfrom
EbA
interventions
Suggested“goldstandard”
indicators
formeasuring
adaptatio
noutcom
es
Extremeeventsand
long-term
changes
addressedby
the
interventio
ns
Suggestionon
how
totake
themeasurements
Suggestionon
where
andwhento
take
the
data
Mid-term,
process-based
indicators
Reduced
lossof
assetsof
coastal
communities
andinfrastructuredueto
extremeweatherevents
1.%
ofinfrastructure
damaged
after
extrem
eevents(e.g.,hospitals
schools(%
offacilitiesdamaged),
homes
(%of
houses
damaged),
roads(%
ofkm
ofroads
damaged),protectedareas(%
ofarea
damaged),agricultu
ralland
(%of
hectares
ofagricultu
redamaged),cultu
raland
recreatio
nsites(%
ofarea
damaged)after
extrem
eweather
events.
Extremeevents:
hurricanes,
typhoons,and
storms1,flooding2,
landslides
3 ,heatwaves
4and
fires5
1.Use
ofsatelliteim
ages
totake
stockof
existin
ginfrastructure,
agricultu
ralland
andextent
ofecosystems(see
UNISDR2017);
inform
ationon
damages
collected
during
emergency
responsesmeasures.
•Afteran
extreme
event,whenthe
interventionwas
notyet
implem
ented
(baseline)
•After
anextrem
eevent,whenthe
interventio
nwas
implem
ented
1a.D
ecreased
erosion
(costalor
hillside)
before
andafterthe
EbA
implem
entatio
nReduced
loss
ofassetsof
urbanand
non-urbancommunities
andinfra-
structuredueto
extrem
eweather
events
Reduced
impactsof
climatechange
onecosystemsthatmaintainlivestock
production,marineandfreshw
ater
fisheries,andnaturalproductsfor
householdconsum
ption
2.Prevalence
ofmoderateor
severe
food
insecurity
inthepopulatio
nafterextrem
eweather
eventsor
throughtim
e.
Extremeevents:
flooding
6 ,droughts7 ,
storms8,fires
9 ,heatwaves
10,sea
levelrise
11
Long-term
changes:
terrestrialand
oceanic
temperature
12that
can
affectcrop,
livestock
andfish
productio
n
2.Questionnaire
with
communities
togetinform
ationon
%of
the
populatio
nthatisfood
insecure.
(FoodInsecurity
Experience
Scalefrom
FAOprovides
aseto
fquestio
nsto
askcommunities
onthatmatter);Censusdataheld
bylocaladministration
•Afteran
extreme
eventorthrough
time(yearly
basis)
whenthe
interventionwas
notyet
implem
ented
(baseline)
•After
anextrem
eeventor
through
time(yearly
basis),w
henthe
interventio
nwas
implem
ented
2a.C
rop,
livestock
and
fish
productionfor
household
consum
ptionin
the
grow
ing/productio
nseason
before
andafter
theim
plem
entatio
nof
theEbA
interven-
tion.
Reduced
negativ
e(and
direct)
impactsof
clim
atechange
onliv
estock
andcrop
productio
n(m
ainlythroughphysicaldamage)
for
householdconsum
ption
Reduced
impactsof
clim
atechange
onecologicalinteractions
(pest,diseases,
pollinatio
n)thataffectcrop
and
livestock
productio
nforhousehold
consum
ption
424 Climatic Change (2020) 158:413–433
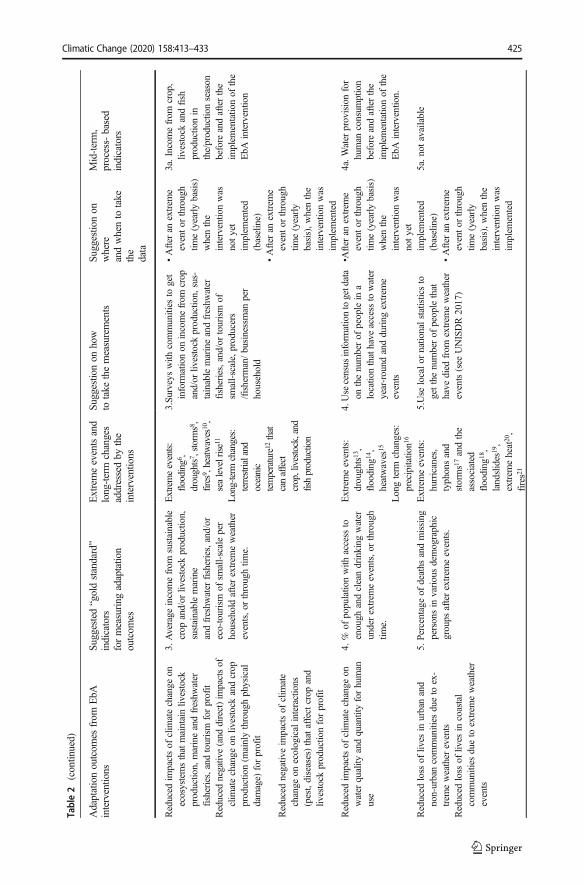
Table2
(contin
ued)
Adaptationoutcom
esfrom
EbA
interventions
Suggested“goldstandard”
indicators
formeasuring
adaptatio
noutcom
es
Extremeeventsand
long-term
changes
addressedby
the
interventio
ns
Suggestionon
how
totake
themeasurements
Suggestionon
where
andwhento
take
the
data
Mid-term,
process-based
indicators
Reduced
impactsof
clim
atechange
onecosystemsthatmaintainliv
estock
productio
n,marineandfreshw
ater
fisheries,andtourism
forprofit
3.Average
incomefrom
sustainable
crop
and/or
livestock
productio
n,sustainablemarine
andfreshw
ater
fisheries,and/or
eco-tourism
ofsm
all-scaleper
householdafterextrem
eweather
events,o
rthroughtim
e.
Extremeevents:
flooding6,
droughts7 ,storms8,
fires
9 ,heatwaves
10,
sealevelrise1
1
Long-term
changes:
terrestrialand
oceanic
temperature12that
canaffect
crop,livestock,and
fishproduction
3.Su
rveyswith
communities
toget
inform
ationon
incomefrom
crop
and/or
livestock
production,
sus-
tainablemarineandfreshw
ater
fisheries,and/or
tourism
ofsm
all-scale,producers
/fisherm
an/businessman
per
household
•After
anextrem
eeventor
through
time(yearlybasis)
whenthe
interventio
nwas
notyet
implem
ented
(baseline)
•After
anextrem
eeventor
through
time(yearly
basis),w
henthe
interventio
nwas
implem
ented
3a.Incom
efrom
crop,
livestock
andfish
productio
nin
the/productio
nseason
before
andafterthe
implem
entatio
nof
the
EbA
intervention
Reduced
negativ
e(and
direct)im
pactsof
clim
atechange
onliv
estock
andcrop
productio
n(m
ainlythroughphysical
damage)
forprofit
Reduced
negativ
eim
pactsof
clim
ate
change
onecologicalinteractions
(pest,diseases)thataffectcrop
and
livestock
productio
nforprofit
Reduced
impactsof
clim
atechange
onwater
quality
andquantityforhuman
use
4.%
ofpopulatio
nwith
access
toenough
andcleandrinking
water
underextrem
eevents,o
rthrough
time.
Extremeevents:
droughts13,
flooding
14,
heatwaves
15
Longterm
changes:
precipitatio
n16
4.Use
census
inform
ationtogetdata
onthenumberof
peoplein
alocatio
nthathave
access
towater
year-round
andduring
extrem
eevents
•After
anextrem
eeventor
through
time(yearlybasis)
whenthe
interventio
nwas
notyet
implem
ented
(baseline)
•After
anextrem
eeventor
through
time(yearly
basis),w
henthe
interventio
nwas
implem
ented
4a.W
ater
provisionfor
human
consum
ption
before
andafterthe
implem
entatio
nof
the
EbA
intervention.
Reduced
loss
ofliv
esin
urbanand
non-urbancommunities
dueto
ex-
trem
eweather
events
5.Percentage
ofdeaths
andmissing
personsin
variousdemographic
groups
afterextrem
eevents.
Extremeevents:
hurricanes,
typhonsand
storms1
7andthe
associated
flooding
18,
landslides
19,
extrem
eheat20,
fires2
1
5.Use
localor
natio
nalstatisticsto
getthenumberof
peoplethat
have
died
from
extrem
eweather
events(see
UNISDR2017)
5a.n
otavailable
Reduced
loss
ofliv
esin
coastal
communities
dueto
extrem
eweather
events
Climatic Change (2020) 158:413–433 425
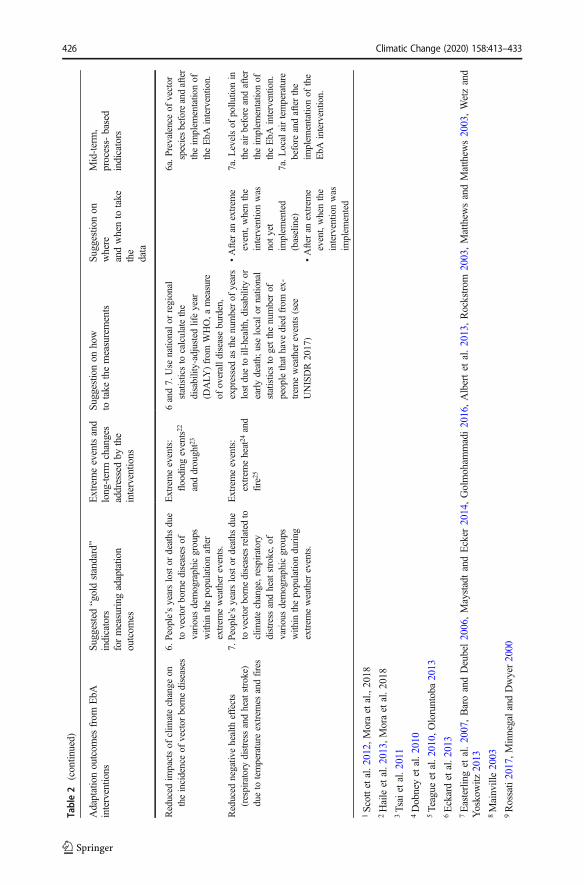
Table2
(contin
ued)
Adaptationoutcom
esfrom
EbA
interventions
Suggested“goldstandard”
indicators
formeasuring
adaptatio
noutcom
es
Extremeeventsand
long-term
changes
addressedby
the
interventio
ns
Suggestionon
how
totake
themeasurements
Suggestionon
where
andwhento
take
the
data
Mid-term,
process-based
indicators
Reduced
impactsof
clim
atechange
ontheincidenceof
vector
bornediseases
6.People’syearslostor
deaths
due
tovector
bornediseases
ofvariousdemographicgroups
with
inthepopulatio
nafter
extrem
eweather
events.
Extremeevents:
flooding
events22
anddrought23
6and7.
Use
nationalor
regional
statisticsto
calculatethe
disability-adjusted
lifeyear
(DALY
)from
WHO,a
measure
ofoveralldiseaseburden,
expressedas
thenumberof
years
lostdueto
ill-health
,disability
orearlydeath;
uselocalor
natio
nal
statisticsto
getthenumberof
peoplethathave
died
from
ex-
trem
eweather
events(see
UNISDR2017)
6a.P
revalenceof
vector
speciesbeforeandafter
theim
plem
entatio
nof
theEbA
interventio
n.
Reduced
negativ
ehealth
effects
(respiratory
distress
andheatstroke)
dueto
temperature
extrem
esandfires
7.People’syearslostor
deaths
due
tovector
bornediseases
relatedto
clim
atechange,respiratory
distress
andheatstroke,o
fvariousdemographicgroups
with
inthepopulatio
nduring
extrem
eweather
events.
Extremeevents:
extrem
eheat24and
fire
25
•After
anextrem
eevent,whenthe
interventio
nwas
notyet
implem
ented
(baseline)
•After
anextrem
eevent,whenthe
interventio
nwas
implem
ented
7a.L
evelsof
pollutio
nin
theairbefore
andafter
theim
plem
entatio
nof
theEbA
interventio
n.7a.L
ocalairtemperature
before
andafterthe
implem
entatio
nof
the
EbA
intervention.
1Scottetal.2
012,
Moraetal.,2018
2Haileetal.2
013,
Moraetal.2
018
3Tsaietal.2
011
4Dobneyetal.2010
5Teague
etal.2
010,
Oloruntoba2013
6Eckardetal.2
013
7Easterlinget
al.2007,BaroandDeubel2006,MaystadtandEcker
2014,Golmoham
madi2016,Albertet
al.2013,Rockstrom
2003,Matthew
sandMatthew
s2003,Wetzand
Yoskowitz
2013
8Mainville2003
9Rossati2017,M
innegalandDwyer2000
426 Climatic Change (2020) 158:413–433
10Vitalietal.2
015,
Nardone
etal.2
010,
Morignatetal.2
014
11Olssonetal.2014,W
ongetal.2
014
12Lobelletal.2
011,
Aggarwal2008,B
rander
2007
13Shenetal.2
007,
Benottietal.2
010
14Kovatsetal.1
999,
Embrey
etal.2
012,
Shim
ietal.2
010
15Huber
etal.2
012
16Park
etal.2
010,
Patzetal.2
000
17Karim
andMim
ura2008,B
rechtetal.2
012,
Yates
etal.2
014
18McG
ranahanetal.2
007
19LeB
run2008
20Moraetal.2
017,
Com
rie2007,K
aiseretal.2
007,
DeBonoetal.2
004
21Alston2010,S
tephensetal.2
014
22Gubleretal.2
001,
Mustafa
andWrathall2011,E
pstein
2001
23Calow
etal.2
010,
Stanke
etal.2
013
24Gronlundetal.2
014
25Hurteau
etal.2
014
Climatic Change (2020) 158:413–433 427
3.5.1 How suggested indicators could be applied?
We suggest that all indicators proposed here are measured both (a) prior to the implementation ofthe EbA intervention (i.e., baseline), and (b) either through time (on a yearly basis) or after anextreme weather event. Measurements of the same indicator pre- and post-intervention arenecessary to determine whether the adaptation outcomes of the EbA intervention were achieved(Ford et al. 2015). However, we believe that is up to the practitioner in charge of implementingthe EbA intervention to decide what type of adaptation action is needed, how the adaptationactions should be implemented, and what success means in a specific context. The spatial scale ofimplementation also needs to be decided by those designing and implementing the intervention.Likewise, the specific threshold used to determine whether the adaptation outcome has beenachieved has also to be decided by the practitioner as the magnitude and type of interventionsdepends on the socio-economic conditions of the target site and on the changes driven by climatethat the intervention is trying to address. Table 2 presents specific suggestions on how, where, andwhen the information related to each suggested indicator should be collected.
3.5.2 How the use of the indicators be promoted?
The seven EbA indicators suggested here can be used by governments, donors, projectmanagers, and policy makers to track the impacts of EbA activities in achieving adaptationoutcomes. In addition to using this common set of indicators, we suggest that projectimplementers clearly state the adaptation outcomes to be achieved by EbA interventions andprepare a theory of change (see McKinnon and Hole 2015), which can be used to explicitlylink interventions to intended outcomes. Using a theory of change can improve project design,implementation, and monitoring (see Conservation International 2012; Bours et al. 2014;McKinnon and Hole 2015) as assumptions, short-term indicators, and outcome indicatorscan be listed, allowing an adaptive project management with the adaptation outcome in mind.
For projects to make progress in measuring the adaptation outcomes achieved through EbA,governments and donors will need to agree on and adopt a common set of indicators (such asthe set proposed here), and access and provide funds for long-term monitoring. Some donors,such as the Green Climate Fund (e.g., GCF 2016) have recently included indicators that trackoutcomes of adaptation projects (e.g., “changes in… loss of lives and economic assets due to theimpacts of climate-related disasters in the area of intervention”), indicators that are similar tothose proposed in this study. However, most donors only require output indicators to bemonitored. In addition, donors interested in supporting and implementing EbA projects needto acknowledge that monitoring systems will need to remain in place over long-time frames andprovide funds to maintaining monitoring efforts support, so the adaptation outcomes of thoseprojects can be robustly measured. We suggest that key donors of EbA initiatives (such as IKIand GEF) also start to require that project implementers report on the adaptation outcomeindicators instead of just output indicators, and that governments do the same to track theiradaptation progress as part of the Paris Agreement. There is also a need to include a common setof adaptation indicators in national and subnational adaptation monitoring and evaluationsystems, as many currently lack indicators to monitor adaptation outcomes (Leiter 2015). Thesesteps would facilitate systematic and consistent reporting on the achievements of EbA projects.
The implementation of appropriate EbA interventions, the identification of how they can helpachieve adaptation outcomes, and the monitoring of these outcomes could ensure that funding isguided towards EbA interventions that are the most successful in delivering certain adaptation
428 Climatic Change (2020) 158:413–433
outcomes (Spearman and MacGray 2011; McKinnon and Hole 2015; Raymond et al. 2017).Identifying and focusing on successful EbA interventions could help increase funding to nature-based solutions to climate change, which receive less than 2% of global climate finance (ClimatePolicy Initiative 2017) and are largely ignored by the private sector (Goldstein et al. 2018).
4 Conclusions
Ecosystem-based adaptation projects are increasingly being implemented as part of adaptationefforts around the world, yet there is a lack of understanding on what should be measured to trackthe success of these projects. Our study summarized the activities, outcomes and indicators of 58EbA projects, including both on-the-ground efforts to manage and restore ecosystems, orbiodiversity, or the implementation of sustainable agricultural practices, and EbA-enablingactivities, such as the development of policies and plans to increase the protection and restorationof ecosystems and biodiversity. These EbA projects aim to address a variety of adaptationoutcomes to ultimately contribute to improving five dimensions of human wellbeing that areimpacted by climate change: assets, livelihoods, food security, safety and resource security andhealth. However, many did not clearly state the intended adaptation outcomes to be achieved anddid not include any indicators to monitor progress towards these outcomes.
This work, which combined an extensive review of EbA projects, recommendations frompractitioners and experts from non-governmental organizations, academia and funder agenciesand guided by theoretical literature, provides the much-needed information on a common setof indicators to monitor and evaluate EbA activities and projects. Indicators proposed throughthis study are relevant as many are used to measure development or other goals, such as theSendai Framework for Disaster Risk Reduction and the Sustainable Development Goals. ForEbA to be considered an important approach for climate change adaptation, there is a need totest the feasibility of the indicators proposed here and promote their use so a robust under-standing of the role of EbA in providing adaptation benefits is developed. The list ofadaptation indicators proposed here is a key step towards making that happen.
Acknowledgements We would like to thank Angela Andrade, Lauretta Burke, Netra Chhetri, Jonathan Cook,Giacomo Fedele, Carla Friedrich, Allie Goldstein, Anna Kontorov, Timo Leiter, Sarah Mack, Susi Menazza,Daouda Ndiaye, Felix Ries, and Ali Raza Rizvi for feedback on the adaptation outcomes and indicators during aworkshop organized by Conservation International in October 2016.
Funding information This work was funded by a grant provided by Betty and Gordon Moore
References
Aggarwal P (2008) Global climate change and Indian agriculture: impacts, adaptation and mitigation. Indian JAgric Sci 78(11):911–919
Albert IJM, Beck HE, Crosbie RS, de Jeu RAM, Liu YY, Podger GM, Timbal B, Viney NR (2013) TheMillennium Drought in southeast Australia (2001-2009): Natural and human causes and implications forwater resources, ecosystems, economy, and society. Water Resour Res 49(2):1040–1057
Alston M (2010) Gender and climate change in Australia. J Sociol 47(1):53–70Andrade A, Fernandez B, Gatti, R C (2010) Building resilience to climate change. IUCN. p. 164Baro M, Deubel TF (2006) Persistent hunger: perspectives on vulnerability, famine, and food security in sub-
Saharan Africa. Annu Rev Anthropol 35:521–538Benotti MJ, Stanford BD, Snyder SA (2010) Impact of drought on wastewater contaminants in an urban water
supply. J Environ Qual 39:1196–2000
Climatic Change (2020) 158:413–433 429
Birch JC, Newton AC, Aquino CA, Cantarello E, Echeverria C, Kitzberger T, Schiappacasse I, Gavarito NT(2010) Cost-effectiveness of dryland forest restoration evaluated by spatial analysis of ecosystem services.Proc Natl Acad Sci U S A 107(50):21925–21930
Bours D, McGinn C, Pringle P (2014) Guidance note 2: selecting indicators for climate change adaptationprogramming. https://ukcip.ouce.ox.ac.uk/wp-content/PDFs/MandE-Guidance-Note2.pdf. Accessed 6 Nov2019
Brander KM (2007) Global fish production and climate change. Proc Natl Acad Sci U S A 104(50):19709–19714Brecht H, Dasgupta S, Laplante B, Murray S, Wheeler D (2012) Sea-level rise and storm surges: high stakes for a
small number of developing countries. J Environ Dev 21(1):120–138Calow RC, MacDonald AM, Nicol AL, Robins NS (2010) Ground water security and drought in Africa: linking
availability, access, and demand. Ground Water 48(2):246–256CBD (2009) Connecting biodiversity and climate change mitigation and adaptation. Report of the second ad Hoc
Technical Expert Group and Climate Change. CBD Technical series No. 41. Secretariat of the convention onBiological Diversity.
Climate policy Initiative (2017) Global landscape of climate finance. p. 18Comrie A (2007) Climate Change and Human Health (2207). Geography Compass 1/3: 325–339. https://doi.
org/10.1111/j.1749-8198.2007.00037.xConservation International (2012) Constructing theories of change for ecosystem-based adaptation projects.
https://www.conservation.org/docs/default-source/publication-pdfs/constructing-theories-of-change-for-ecosystem-based-adaptation.pdf?Status=Master&sfvrsn=1fd83348_3. Accessed 6 Nov 2019
De Bono A, Peduzzi P, Luser S, Guiliani G (2004) Impacts of Summer 2003 heat wave in Europe. EnvironmentAlert Bulletin. United Nations Environment Programme.
Dobney K, Baker C, Chapman L, Quinn A (2010) The future cost to the United Kingdom’s railway network ofheat-related delays and buckles caused by the predicted increase in high summer temperatures owing toclimate change. Proc Inst Mech Eng Part 224:25–34
Doswald N, Munroe R, Roe D, Giuliani A, Castelli I, Stephens J, Moller I, Spencer T, Vira B, Reid H (2014)Effectiveness of ecosystem-based approaches for adaptation: review of the evidence-base. Clim Dev 6(2):185–201
Easterling WE, Aggarwal PK, Batima P, Brander KM, et al. (2007) Food, fibre and forest products. ClimateChange 2007: Impacts, Adaptation and Vulnerability. Contribution of Working Group II to the FourthAssessment Report of the Intergovernmental Panel on Climate Change, M.L. Parry, O.F. Canziani, J.P.Palutikof, P.J. van der Linden and C.E. Hanson, Eds., Cambridge University Press, Cambridge, UK 273-313.
Eckard R.B, Christie K, Rawnsley R (2013) Living in a warmer world Salinger J. (ed) 144–157 (CSIRO,Auckland, 2013).
Emanuel K (2005) Increasing destructiveness of tropical cyclones over the past 30 years. Nature 436:686–688Embrey S, Remais JV, Hess J (2012) Climate change and ecosystem disruption: the health impacts of the North
American rocky mountain pine beetle infestation. Am. J. Public Health 102:818–827Emerton L, Baig S, SaleemM (2009) Valuing biodiversity: the economic case for biodiversity conservation in the
Maldives. IUCN publication. https://portals.iucn.org/library/sites/library/files/documents/2009-115.pdf.Accessed 6 Nov 2019
Epstein PR (2001) Climate change and emerging infectious diseases. Microbes Infect 3:747–754Ford JD, Berrang Ford L, Lesnikowski A, Barrera M, Heymann SJ (2013) How to track climate change
adaptation: A typology of approaches for national-level application. Ecol Soc 18(3):40. https://doi.org/10.5751/ES-05732-180340
Ford JD, Berrang-Ford L, Biesbroek R, Araos M, Austin SE, Lesnikowski A (2015) Adaptation tracking for apost-2015 climate agreement. Nat Clim Chang 5:967–969
GCF (2016) Further development of indicators in the performance measurement frameworks. https://www.greenclimate.fund/documents/20182/184476/GCF_B.12_13_-_Further_development_of_indicators_in_the_performance_measurement_frameworks.pdf/30f1f9a5-98a5-483b-8553-e306b3c394e2. Accessed 6Nov 2019
Goldstein A, Turner WR, Gladstone J, Hole DG (2018) The private sector’s climate change risk and adaptationblind spots. Nat Clim Chang 9:18–25
Golmohammadi F (2016) Drought and it’s environmental and socio-economic impacts in the viewpoint offarmers in south Khorasan province-East of Iran. Indian Res J Ext Educ 1:238–244
Gronlund CJ, Zanobetti A, Schwartz JD, Wellenius GA, O’Neill MS (2014) Heat, heat waves, and hospitaladmissions among the elderly in the United States, 1992–2006. Environ Health Perspect 122:1187–1188
Gubler DJ, Reiter P, Ebi KL, YapW, Nasci R, Patz JA (2001) Climate variability and change in the United States:potential impacts on vector-and rodent-borne diseases. Environ Health Perspect 109:223–233
Haile AT, Kusters K, Wageshon N (2013) Loss and damage from flooding in the Gambela region, Ethiopia. Int JGlobal Warming 4(4):483–497
430 Climatic Change (2020) 158:413–433
Hammill A, Dekens J, Leiter T, Olivier J, Klockemann L, Stock E, Glaser A (2014) Repository of adaptationindicators. Real case examples from national monitoring and evaluation systems. GIZ. p. 74. file:///D:/Documents%20and%20Settings/cdonatti/Documents/back%20up%20july13th2017/OneDrive%20Old/Old%20OneDrive/Moore%20center%20funding_eba%20hotspots/relevant%20publications-indicators/giz2014-en-climate-adaptation-indicator-repository.pdf
Harvey CA, Martinez-Rodriguez MR, Cardeas JM et al (2017) The use of ecosystem-based adaptation practicesby smallholder farmers in Central America. Agric Ecosyst Environ 246:279–290
Holl KD, Loik ME, Lin EH, Samuels IA (2001) Tropical montane forest restoration in Costa Rica: overcomingbarriers to dispersal and establishment. Restor Ecol 8(4):339–349
Huber V, Wagner C, Gerten D, Adrian R (2012) To bloom or not to bloom: contrasting responses ofcyanobacteria to recent heat waves explained by critical thresholds of abiotic drivers. Oecologia 169(1):245–256
Hurteau MD, Westerlin AL, Wiedinmyer C, Bryant BP (2014) Projected effects of climate and development onCalifornia wildfire emissions through 2100. Environ Sci Technol 48:2298–2304
IIED (2018) Nature-based solutions delivering national-level adaptation and mitigation goals. IIED briefingpapers. http://pubs.iied.org/pdfs/17484IIED.pdf. Accessed 6 Nov 2019
Jones HP, Hole DG, Zavaleta ES (2012) Harnessing nature to help people adapt to climate change. Nat ClimChang 2(7):504–509
KahnME (2003) Two measures of progress in adapting to climate change. Global Environ Change—Hum PolicyDimen 13:307–312. https://doi.org/10.1016/S0959-3780(03)00052-9
Kaiser R, Le Tertre A, Schwartz J, Gotway CA, Daley WR, Rubin CH (2007) The effect of the 1995 heat wave inChicago on all-cause and cause-specific mortality. Am J Public Health 97:158–S162
Karim MF, Mimura N (2008) Impacts of climate change and sea-level rise on cyclonic storm surge floods inBangladesh. Glob Environ Chang 18(3):490–500
Kovats RS, Haines A, Stanwell-Smith R et al (1999) Climate change and human health in Europe. Br Med J 318:1682–1685
Leiter T (2015) Linking monitoring and evaluation of adaptation to climate change across scales: avenues of andpractical approaches. N Dir Eval 147:117–127
Leiter T, Pringle P (2018) Pitfalls and potential of measuring climate change adaptation through adaptationmetrics. In: Christiansen L, Martinez G, Naswa P (eds) Adaptation metrics: perspectives on measuring,aggregating and comparing adaptation results. UNEP DTU Partnership, Copenhagen
Leiter T, Olhoff A, Al Azar R, Barmby V, Bours D, Clement VWC, Dale TW, Davies C, Jacobs H (2019)Adaptation metrics: current landscape and evolving practices. Rotterdam and Washington, DC. Availableonline at www.gca.org
Lobell DB, Schlenker W, Costa-Roberts J (2011) Climate trends and global crop production since 1980. Science333(6042):616–620
Mainville DY (2003) Disasters and development in agricultural input markets: bean seed markets in Hondurasafter hurricane Mitch. Disasters 27:154–171
Matthews WJ, Matthews EW (2003) Effects of drought on fish across axes of space, time and ecologicalcomplexity. Freshw Biol 48(6):1232–1253
Maystadt J-F, Ecker O (2014) Extreme weather and civil war in Somalia: does drought fuel conflict throughlivestock price shocks? Am J Agric Econ 96(4):1157–1182
McGranahan G, Balk D, Anderson B (2007) The rising tide: assessing the risks of climate change and humansettlements in low elevation coastal zones. Environ Urban 19(1):17–37
McKinnon MC, Hole DG (2015) Exploring program theory to enhance monitoring and evaluation in Ecosystem-based adaptation projects. N Dir Eval 147:49–60
McKinnon MC, Cheng SH, Dupre S, Edmond J, Garside R, Glew L, Holland MB, Levine E, Masuda YJ, MillerD, Oliveira I, Revenaz J, Roe D, Shamer S, Wilkie D, Wongbusarakum S, Woddhouse E (2016) What arethe effects of nature conservation on human well-being? A systematic map of empirical evidence fromdeveloping countries. Environ Evid 5(8):1–25
Milman A, Jagannathan K (2017) Conceptualization and implementation of ecosystem-based adaptation. ClimChang 142:113–127. https://doi.org/10.1007/s10584-017-1933-0
Mimura NR, Pulwarty S, Duc D M, et al. (2014) Adaptation planning and implementation. In: Climate Change2014: Impacts, Adaptation, and Vulnerability. Part A: Global and Sectoral Aspects. Contribution of WorkingGroup II to the Fifth Assessment Report of the Intergovernmental Panel on Climate Change [Field, C.B.,V.R. Barros, D.J. Dokken, K.J. Mach, M.D. Mastrandrea, T.E. Bilir, M. Chatterjee, K.L. Ebi, Y.O. Estrada,R.C. Genova, B. Girma, E.S. Kissel, A.N. Levy, S. MacCracken, P.R.
Minnegal M, Dwyer PD (2000) Responses to a drought in the interior lowlands of Papua New Guinea: acomparison of bedamuni and Kubo Konai. Hum Ecol 28(4):493–526
Climatic Change (2020) 158:413–433 431
Moberg F, Rönnbäck P (2003) Ecosystem services of the tropical seascape: Interactions, substitutions andrestoration. Ocean Coast Manag 46:27–46
Mohamed M (2007) Economic valuation of coral reefs: a case study of the costs and benefits of improvedmanagement of Dhigali Haa, a marine protected in Baa atoll, Maldives. University of Canterbury, Master thesis
Mora C, Dousset B, Caldwell IR et al (2017) Global risk of deadly heat. Nat Clim Chang 7:501–506Mora C et al. (2018) Broad threat to humanity from cumulative climate hazards intensified by greenhouse gas
emissions. Nature Climate Change 8:1062–1071Mori AS, Spies TA, Sudmeier-Rieux K, Andrade A (2013) Reframing ecosystem management in the era of
climate change: issues and knowledge from forests. Biol Conserv 165:115–212Morignat E, Perrin JB, Gay E, Vinard JL, Calavas D, Hénaux V (2014) Assessment of the impact of the 2003 and
2006 heat waves on cattle mortality in France. PLoS One. https://doi.org/10.1371/journal.pone.0093176Munang R, Thiaw I, Alverson K, Mumba M, Liu J, Rivington M (2013) Climate change and Ecosystem-based
Adaptation: a new pragmatic approach to buffering climate change impacts. Curr Opin Environ Sustain 5:1–5Munroe R, Roe D, Doswald N, Spencer T, Moller I, Vira B, Hannah R, Andreas K, Alessandra G, Ivan C,
Stephens J (2012) Review of the evidence base for ecosystem-based approaches for adaptation to climatechange. Environ Evid 1:13
Mustafa D,Wrathall D (2011) Basin floods of 2010: souring of a Faustian bargain?Water Alternatives 4(1):72–85Nardone A, Ronchi B, Lacetera N, Ranieri MS, Bernabucci U (2010) Effects of climate changes on animal
production and sustainability of livestock systems. Livest Sci 130(1-3):57–69Naumann S, Davis M, Munang R et al (2013) The social dimension of ecosystem-based adaptation. UNEP
Policy Series: Ecosystem Management. Policy Brief 12.Noble, IR, Huq S, Anokhin YA, Carmin J, Goudou D, Lansigan FP, Osman-Elasha B, Villamizar A (2014)
Adaptation needs and options. In: Climate Change 2014: Impacts, Adaptation, and Vulnerability. Part A:Global and Sectoral Aspects. Contribution of Working Group II to the Fifth Assessment Report of theIntergovernmental Panel on Climate Change [Field, C.B., V.R. Barros, D.J. Dokken, K.J. Mach, M.D.Mastrandrea, T.E. Bilir, M. Chatterjee, K.L. Ebi, Y.O. Estrada, R.C. Genova, B. Girma, E.S. Kissel, A.N.Levy, S. MacCracken, P.R. Mastrandrea, and L.L.White (eds.)]. Cambridge University Press, Cambridge,United Kingdom and New York, NY, USA, pp. 833-868.
Olivier J, Leiter T, Linke J (2013) Adaptationmade tomeasure: a guidebook to the design and results-basedmonitoringof climate change adaptation projects. Deutsche Gesellschaft fur Internationale Zusammenarbeit (GIZ).
Oloruntoba R (2013) Plans never go according to plan: an empirical analysis of challenges to plans during the2009 Victoria bushfires. Technol Forecast Soc Change 80:1674–1702
Olsson L, Opondo M, Tshakert A et al (2014) In: Climate change 2014: impacts, adaptation, and vulnerability.Part A: global and sectoral aspects. Contribution of Working Group II to the Fifth Assessment Report of theIntergovernmental Panel on Climate Change [Field, C.B., V.R. Barros, D.J. Dokken, K.J. Mach, M.D.Mastrandrea, T.E. Bilir, M. Chatterjee, K.L. Ebi, Y.O. Estrada, R.C. Genova, B. Girma, E.S. Kissel, A.N.Levy, S. MacCracken, P.R. Mastrandrea, and L.L.White (eds.)]. Cambridge University Press, Cambridge,United Kingdom and New York, NY, USA.
Park HJ, Duan L, Kim B, Mitchell MJ, Shibata H (2010) Potential effects of climate change and variability onwatershed biogeochemical processes and water quality in Northeast Asia. Environ Int 36(2):212–225
Patz PA, McGeehin MA, Bernard SM, Ebi KL, Epstein PR, Grambsch A, Gubler DJ, Reither P, Romieu I, RoseJB, Samet JM, Trtanj J (2000) The potential health impacts of climate variability and change for the UnitedStates: executive summary of the report of the health sector of the U.S. National Assessment.
Raymond CM, Frantzeskaki N, Kabisch N, Berry P, Breil M, Nita MR, Geneletti D, Calfapietra C (2017) Aframework for assessing and implementing the co-benefits of nature-based solutions in urban areas. Environ.Sci Policy 77:15–24
Reid H (2011) Improving the evidence for ecosystem-based adaptation. Sustainable Development Opinion Paper.http://pubs.iied.org/pdfs/17109IIED.pdf. Accessed 6 Nov 2019
Rockstrom J (2003) Water for food and nature in drought–prone tropics: vapour shift in rain–fed agriculture.Philos Trans R Soc Lond Ser B Biol Sci 358(1440):1997–2009
Rossati A (2017) Global warming and its health impact. Int J Occup Environ Med 8:7–20Scott D, Simpson MC, Sim R (2012) The vulnerability of Caribbean coastal tourism to scenarios of climate
change related sea level rise. J Sustain Tour 20:883–898Shen C, Wang W-C, Hao Z, Gong W (2007) Exceptional drought events over eastern China during the last five
centuries. Clim Chang 85:453–471Shimi AC, Parvin GA, Biswas C, Shaw R (2010) Impact and adaptation to flood: a focus on water supply,
sanitation and health problems of rural community in Bangladesh. Disaster Prev Manage: An InternationalJournal 19(3):298–313
SNIFFER (2012) Climate change adaptation-related indicators. ER23 Final Report, Edinburgh, p 25
432 Climatic Change (2020) 158:413–433
Spearman M, MacGray H (2011) Making adaptation count: concepts and options for monitoring and evaluationof climate change adaptation. http://pdf.wri.org/making_adaptation_count. Accessed 6 Nov 2019
Stanke C, KeracM, Prudhomme C,Medlock J,Murray V (2013) Health effects of drought: a systematic review ofthe evidence. Plos Curr 5. DOI: https://doi.org/10.1371/currents.dis.7a2cee9e980f91ad7697b570bcc4b004.
Stephens SL, Burrows N, Buyantuyev A, Gray RW, Keane RE, Kubian R, Liu S, Seijo F, Shu L, Tolhurst KG,van Wagtendonk JW (2014) Temperate and boreal forest mega-fires: characteristics and challenges. FrontEcol Environ 12:115–122
Teague B, McLeod R, Pascoe S (2010) 2009 Victorian Bushfires Royal Commission final report: summary.Available at http://www.royalcommission.vic.gov.au/finaldocuments/summary/HR/VBRC_Summary_HR.pdf. Accessed 6 Nov 2019
Tsai H-T, Tseng C-J, Tzeng S-Y, Wu J, Day J-D (2011) The impacts of natural hazards on Taiwan’s tourismindustry. Nat Hazards 62:83–91
UKCIP (2004) Costing the impacts of climate change in the UK. Implementation report Oxford UK.https://www.ukcip.org.uk/wp-content/PDFs/Costings_overview.pdf. Accessed 6 Nov 2019
UNEP (2012) Making the case for ecosystems-based adaptation: building resilience to climate change. UNEP,Nairobi, Kenya
UNEP (2015) Implementation of resolutions adopted by the United Nations Environment Assembly at its firstsession. Addendum Resolution 1/8: ecosystem-based adaptation. Report of the Executive Director.
UNFCCC (2015) Database on ecosystem-based approaches to adaptation. https://unfccc.int/topics/resilience/resources/adaptation-databases.
United Nations (2015) The Paris Agreement. https://unfccc.int/sites/default/files/english_paris_agreement.pdfVignola R, Harvey CA, Bautista-Solis P, Avelino J, Rapidel B, Donatti CI, Martinez MR (2015) Ecosystem-
based adaptation for smallholder farmers: definitions, opportunities and constraints. Agric Ecosyst Environ211:126–132
Vitali A, Felici A, Esposito S, Bernabucci U (2015) Effects of heat waves on mortality of dairy cows. ProcMACSUR Int Livestock Model Res Colloq 6(1):15–16
Wetz MS, Yoskowitz DW (2013) An ‘extreme’ future for estuaries? Effects of extreme climatic events onestuarine water quality and ecology. Mar Pollut Bull 69(1-2):7–18
Wong PP, Losada IJ, Gattuso J-P et al (2014). Costal systems and low-lying areas. In: Climate change 2014:impacts, adaptation, and vulnerability. Part A: Global and Sectoral Aspects. Contribution of Working GroupII to the Fifth Assessment Report of the Intergovernmental Panel on Climate Change [Field, C.B., V.R.Barros, D.J. Dokken, K.J. Mach, M.D. Mastrandrea, T.E. Bilir, M. Chatterjee, K.L. Ebi, Y.O. Estrada, R.C.Genova, B. Girma, E.S. Kissel, A.N. Levy, S. MacCracken, P.R. Mastrandrea, and L.L.White (eds.)].Cambridge University Press, Cambridge, United Kingdom and New York, NY, USA, pp. 361-409.
World Bank (2009) Convenient solutions to an inconvenient truth: ecosystem-based approaches to climatechange. https://siteresources.worldbank.org/ENVIRONMENT/Resources/ESW_EcosystemBasedApp.pdf.Accessed 6 Nov 2019
Yates D, Luna BQ, Rasmussen R, Bratcher D et al (2014) Assessing climate change hazards to electric powerinfrastructure: a sandy case study. IEEE Power Energy Mag 12(5):66–75
Publisher’s note Springer Nature remains neutral with regard to jurisdictional claims in published maps andinstitutional affiliations.
Affiliations
Camila I. Donatti1 & Celia A. Harvey1,2 & David Hole1 & Steven N. Panfil3 & HannaSchurman4
1 The Betty and Gordon Moore Center for Science, Conservation International, 2011 Crystal Dr, Arlington,VA 22202, USA
2 Monteverde Institute, Monteverde, Puntarenas, Costa Rica3 Green Climate Fund Agency, Conservation International, 2011 Crystal Dr, Arlington, VA 22202, USA4 McCourt School of Public Policy, Georgetown University, 37th and O Streets NW, Washington, DC 20057,
USA
Climatic Change (2020) 158:413–433 433
Recommended