8/2/2019 IMF Ecperiences in Managing Capital Inflows
http://slidepdf.com/reader/full/imf-ecperiences-in-managing-capital-inflows 1/97
INTERNATIONAL MONETARY FUND
Recent Experiences in Managing Capital Inflows — Cross-Cutting Themes and Possible
Policy Framework
Prepared by the Strategy, Policy, and Review Department
In consultation with Legal, Monetary and Capital Markets, Research, and other Departments
Approved by Reza Moghadam
February 14, 2011
Contents Page
I. Overview and Introduction .....................................................................................................3 II. Stylized Facts About Capital Flows ......................................................................................8
A. Capital Flows Then and Now ..................................................................................11 B. Push and Pull Factors ..............................................................................................16
III. Selected Country Experiences with Capital Inflows .........................................................18 A. Nature of Capital Inflows ........................................................................................18 B. Drivers of Inflows ...................................................................................................21
C. Domestic Macroeconomic Implications…………………………………………..21 D. Recent Policy Responses ........................................................................................25
IV. A Possible Policy Framework for Managing Capital Inflows ...........................................39 A. Macroeconomic Policies .........................................................................................43 B. Capital Flow Management Policies.........................................................................44 C. Applying the Framework ........................................................................................48
V. Issues for Discussion ...........................................................................................................51 Tables
1. Inflow Episodes: Summary Statistics ..........................................................................15 2. Examples of Factors Affecting Capital Inflows to EMs ..............................................16 3. Determinants of Capital Inflows: Panel Regression Results .......................................18 4. Capital Flow Management (CFM) and Other Measures by Country ..........................37
8/2/2019 IMF Ecperiences in Managing Capital Inflows
http://slidepdf.com/reader/full/imf-ecperiences-in-managing-capital-inflows 2/97
2
Figures1. Capital Flows and Policy Responses in Selected EMs ..................................................42. Gross and Net Capital Inflows .......................................................................................9 3. Net Inflows and Nominal Effective Exchange Rates in Selected EMs .......................10 4.
Gross Capital Inflows, by Types of Flows for Each Wave..........................................14
5. Inflation and Target Policy Interest Rates: A Historical Perspective ..........................286. Exchange Rates and Use of CFMs in Selected EMs ...................................................32 7. Recent Use of CFMs and Other Measures ...................................................................41 8. Coping with Capital Inflows: Policy Considerations ..................................................44 9. Policies to Cope with Inflows: Judgment-based Illustrative Exercise .........................49 10. Policies to Cope with Inflows: Threshold-based Illustrative Exercise ........................51 Boxes1. Key Elements of a Possible Policy Framework for Managing Capital Inflows ............7 2. The Impact of Brazil’s IOF..........................................................................................35 3.
The Impact of Thailand’s Withholding Tax ................................................................36
AnnexesI. High Frequency Proxies for Capital Flows Data .........................................................52 II. Identifying Episodes of Large Capital Inflows ............................................................55 III. Brazil ............................................................................................................................58 IV. Indonesia ......................................................................................................................65 V. Korea ............................................................................................................................71 VI. Peru ..............................................................................................................................74 VII. South Africa .................................................................................................................79 VIII. Thailand .......................................................................................................................85 IX.
Turkey ..........................................................................................................................90
References ................................................................................................................................96
8/2/2019 IMF Ecperiences in Managing Capital Inflows
http://slidepdf.com/reader/full/imf-ecperiences-in-managing-capital-inflows 3/97
3
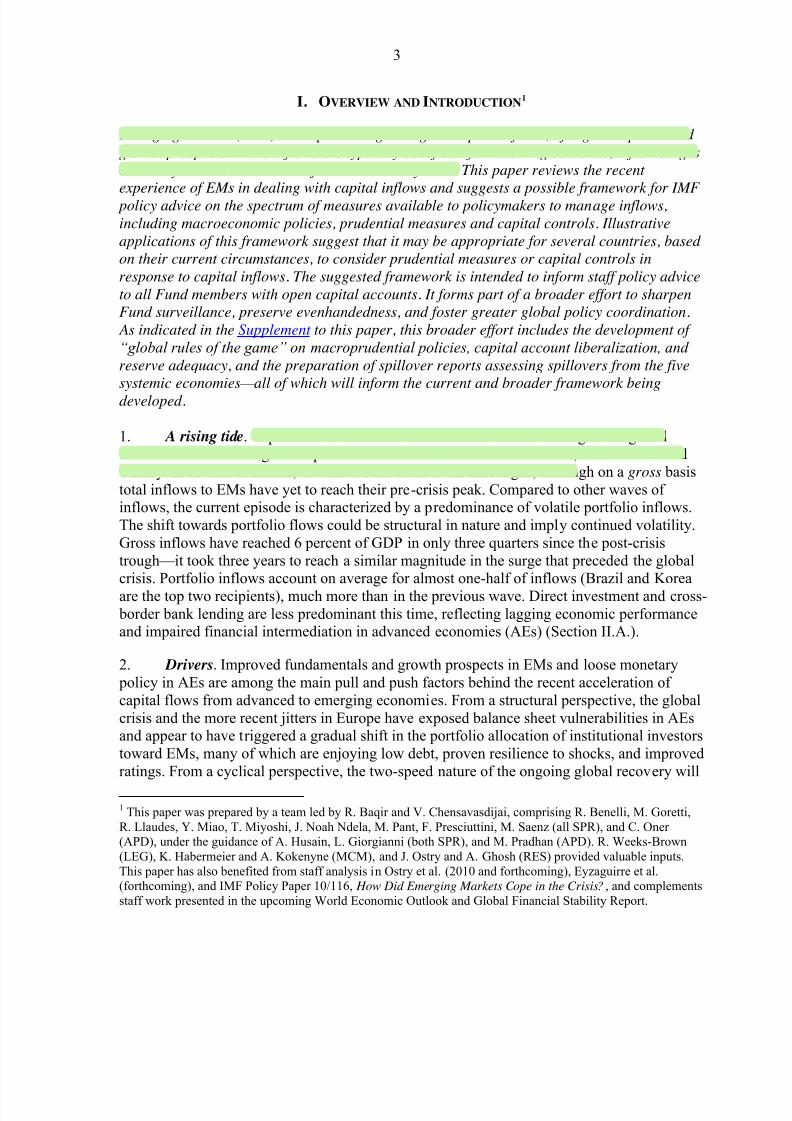
I. OVERVIEW AND INTRODUCTION1
Emerging markets (EMs) are experiencing a surge in capital inflows, lifting asset prices and
growth prospects. While inflows are typically beneficial for receiving countries, inflow surges
can carry macroeconomic and financial stability risks. This paper reviews the recent
experience of EMs in dealing with capital inflows and suggests a possible framework for IMF
policy advice on the spectrum of measures available to policymakers to manage inflows,
including macroeconomic policies, prudential measures and capital controls. Illustrative
applications of this framework suggest that it may be appropriate for several countries, based
on their current circumstances, to consider prudential measures or capital controls in
response to capital inflows. The suggested framework is intended to inform staff policy advice
to all Fund members with open capital accounts. It forms part of a broader effort to sharpen
Fund surveillance, preserve evenhandedness, and foster greater global policy coordination.
As indicated in the Supplement to this paper, this broader effort includes the development of
“global rules of the game” on macroprudential policies, capital account liberalization, and
reserve adequacy, and the preparation of spillover reports assessing spillovers from the five
systemic economies — all of which will inform the current and broader framework being
developed.
1. A rising tide. Capital flows to EMs have rebounded with the ebbing of the globalfinancial crisis. The largest recipients are Asian and Latin American EMs, South Africa andTurkey. In several countries, net inflows are close to all-time highs, although on a gross basistotal inflows to EMs have yet to reach their pre-crisis peak. Compared to other waves of inflows, the current episode is characterized by a predominance of volatile portfolio inflows.The shift towards portfolio flows could be structural in nature and imply continued volatility.Gross inflows have reached 6 percent of GDP in only three quarters since the post-crisistrough — it took three years to reach a similar magnitude in the surge that preceded the globalcrisis. Portfolio inflows account on average for almost one-half of inflows (Brazil and Koreaare the top two recipients), much more than in the previous wave. Direct investment and cross- border bank lending are less predominant this time, reflecting lagging economic performanceand impaired financial intermediation in advanced economies (AEs) (Section II.A.).
2. Drivers. Improved fundamentals and growth prospects in EMs and loose monetary policy in AEs are among the main pull and push factors behind the recent acceleration of capital flows from advanced to emerging economies. From a structural perspective, the globalcrisis and the more recent jitters in Europe have exposed balance sheet vulnerabilities in AEsand appear to have triggered a gradual shift in the portfolio allocation of institutional investorstoward EMs, many of which are enjoying low debt, proven resilience to shocks, and improvedratings. From a cyclical perspective, the two-speed nature of the ongoing global recovery will
1 This paper was prepared by a team led by R. Baqir and V. Chensavasdijai, comprising R. Benelli, M. Goretti,R. Llaudes, Y. Miao, T. Miyoshi, J. Noah Ndela, M. Pant, F. Presciuttini, M. Saenz (all SPR), and C. Oner (APD), under the guidance of A. Husain, L. Giorgianni (both SPR), and M. Pradhan (APD). R. Weeks-Brown(LEG), K. Habermeier and A. Kokenyne (MCM), and J. Ostry and A. Ghosh (RES) provided valuable inputs.This paper has also benefited from staff analysis in Ostry et al. (2010 and forthcoming), Eyzaguirre et al.(forthcoming), and IMF Policy Paper 10/116, How Did Emerging Markets Cope in the Crisis?, and complementsstaff work presented in the upcoming World Economic Outlook and Global Financial Stability Report.
8/2/2019 IMF Ecperiences in Managing Capital Inflows
http://slidepdf.com/reader/full/imf-ecperiences-in-managing-capital-inflows 4/97
4
likely keep interest rate differentials between EMs and AEs wide for a prolonged period of time. Surging commodity prices are an additional cyclical force pushing capital towardcommodity exporters such as Brazil and Peru. In relative terms, more liquid EMs areattracting larger inflows. All things considered, the stage seems set for the ongoing wave of inflows to be both large and persistent, bringing important investment and growth benefits to
EMs. However, inflows have tended to reverse suddenly and in a synchronized manner, in the past, causing sharp currency depreciation and severe balance sheet dislocations. Whilevariations in capital flows are a normal cyclical phenomenon, they have been exacerbated by policy imbalances in both AEs and EMs, and by herding behavior in financial markets. EMstherefore face the challenge of absorbing the benefits of capital inflows while limiting theattendant macroeconomic and financial stability risks (Section II.B.).
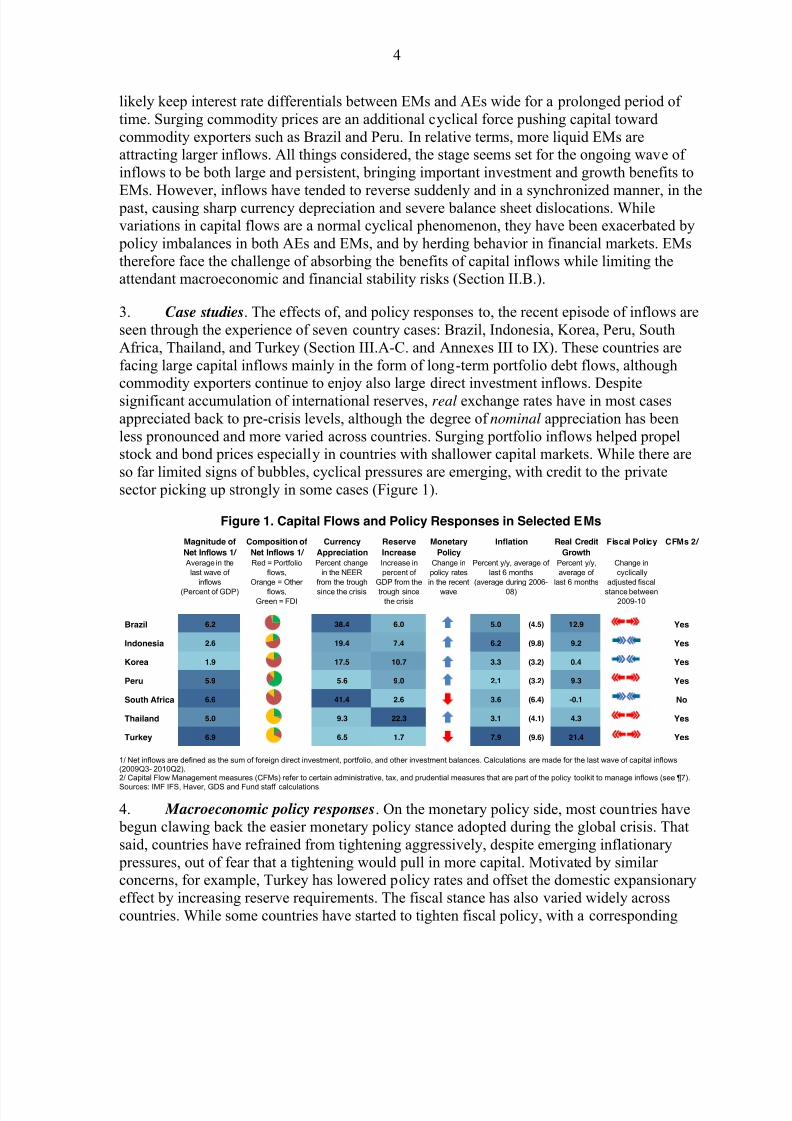
3. Case studies. The effects of, and policy responses to, the recent episode of inflows areseen through the experience of seven country cases: Brazil, Indonesia, Korea, Peru, SouthAfrica, Thailand, and Turkey (Section III.A-C. and Annexes III to IX). These countries arefacing large capital inflows mainly in the form of long-term portfolio debt flows, althoughcommodity exporters continue to enjoy also large direct investment inflows. Despitesignificant accumulation of international reserves, real exchange rates have in most casesappreciated back to pre-crisis levels, although the degree of nominal appreciation has beenless pronounced and more varied across countries. Surging portfolio inflows helped propelstock and bond prices especially in countries with shallower capital markets. While there areso far limited signs of bubbles, cyclical pressures are emerging, with credit to the privatesector picking up strongly in some cases (Figure 1).
Figure 1. Capital Flows and Policy Responses in Selected EMs
1/ Net inflows are defined as the sum of foreign direct investment, portfolio, and other investment balances. Calculations are made for the last wave of capital inflows(2009Q3- 2010Q2).2/ Capital Flow Management measures (CFMs) refer to certain administrative, tax, and prudential measures that are part of the policy toolkit to manage inflows (see ¶7).
Sources: IMF IFS, Haver, GDS and Fund staff calculations.
4. Macroeconomic policy responses. On the monetary policy side, most countries have begun clawing back the easier monetary policy stance adopted during the global crisis. Thatsaid, countries have refrained from tightening aggressively, despite emerging inflationary pressures, out of fear that a tightening would pull in more capital. Motivated by similar concerns, for example, Turkey has lowered policy rates and offset the domestic expansionaryeffect by increasing reserve requirements. The fiscal stance has also varied widely acrosscountries. While some countries have started to tighten fiscal policy, with a corresponding
Magnitude of
Net Inflows 1/
Composition of
Net Inflows 1/
Currency
Appreciation
Reserve
Increase
Real Credit
Growth
Fiscal Policy CFMs 2/
Average in the
last wave of
inflows
(Percent of GDP)
Red = Portfolio
flows,
Orange = Other
flows,Green = FDI
Percent change
in the NEER
from the trough
since the crisis
Increase in
percent of
GDP from the
trough sincethe crisis
Percent y/y,
average of
last 6 months
Change in
cyclically
adjusted fiscal
stance between2009-10
Brazil 6.2 38.4 6.0 5.0 (4.5) 12.9 Yes
Indonesia 2.6 19.4 7.4 6.2 (9.8) 9.2 Yes
Korea 1.9 17.5 10.7 3.3 (3.2) 0.4 Yes
Peru 5.9 5.6 9.0 2.1 (3.2) 9.3 Yes
South Africa 6.6 41.4 2.6 3.6 (6.4) -0.1 No
Thailand 5.0 9.3 22.3 3.1 (4.1) 4.3 Yes
Turkey 6.9 6.5 1.7 7.9 (9.6) 21.4 Yes
Monetary
PolicyChange in
policy rates
in the recent
wave
Percent y/y, average of
last 6 months
(average during 2006-
08)
Inflation
8/2/2019 IMF Ecperiences in Managing Capital Inflows
http://slidepdf.com/reader/full/imf-ecperiences-in-managing-capital-inflows 5/97
5
strengthening in the cyclically-adjusted primary balance, most countries have yet to fullyunwind the structural loosening adopted during the crisis. Thus, in some countries fiscal policy remains accommodative even though the output gap has closed, implying a procyclicalstance (Section III.D.).
5. Controls and prudential measures. The countries under review have generallycomplemented macroeconomic policy with other measures to manage capital inflows, such astaxes on certain inflows, minimum holding periods, and currency-specific reserverequirements. Recourse to such measures by the countries in question has been motivated byconcerns about export competitiveness, financial stability, sterilization costs, and politicalconstraints on fiscal policy. Many of the measures introduced were designed to addressspecific risks associated with certain types of flows, such as their impact on certain assetmarkets or their short-term nature, and to guard against the risk of flow reversal. Evidence onthe effectiveness of these measures in reducing targeted inflows is so far mixed, though inmost cases currency appreciation has slowed or halted around the time of the introduction of the measures. Market participants have expressed concerns about policy and regulatoryuncertainty and distortions from measures that go beyond macroeconomic policies. Even so,they consider the measures so far implemented to be “at the margin” and are likely to continueinvesting in countries where the positive structural story dominates.
6. Framework for policy advice on managing inflows. For countries experiencing a surge
in inflows, choosing appropriate responses can be challenging given the uncertainties associated
with the causes and effects of the inflows and with possible policy reactions. The variety of
policy responses adopted — and their potential multilateral implications — suggests the
importance of developing a broadly accepted framework for considering policies to deal with
capital inflows. A possible framework, informed by the cross-country experience of EMs
reviewed in this paper and complementary analysis by Fund staff, is presented in Box 1 and
Section IV. It is intended to be applied to (a) all countries with open capital accounts, and (b)with respect to all countries with partially open capital accounts, to those portions that are open.
This framework would signify a first-round articulation of Fund views on appropriate policy
responses to manage capital inflows and would inform staff policy advice to relevant members
(¶6-7 of the Supplement to this paper clarify that this framework aims at consistency and
evenhandedness in Fund policy advice to countries and does not create new obligations under
Fund surveillance). Over time, this framework could be adjusted based on experience and
deeper analysis of the multilateral context in which capital flows arise, and the multilateral
consequences of any policy response. The framework could also be supplemented by additional
analysis and frameworks addressing capital flows in other contexts (¶3 of the Supplement to this
paper provides additional information on the broader agenda) as contemplated in lastDecember’s Boar d discussion on The Fund’s Role Regarding Cross-Border Capital Flows (PIN
11/1, 1/5/11; The Fund’s Role Regarding Cross-Border Capital Flows, 11/15/10). For instance,
capital flows from and between AEs account for the bulk of global flows, and the implications
for global and individual country financial stability are being tackled under the broad rubric of
the Fund’s work on macroprudential policies. For EMs and low-income members, further work
focuses on dealing with outflows, progressing towards capital account liberalization, and
8/2/2019 IMF Ecperiences in Managing Capital Inflows
http://slidepdf.com/reader/full/imf-ecperiences-in-managing-capital-inflows 6/97
6
assessing reserve adequacy. At a later stage and as clarified further in ¶6-7 of the Supplement to
this paper, the Executive Board may wish to consider whether — or not — to incorporate this
framework into Fund surveillance.
7. Nomenclature. Aside from macroeconomic policies, the toolkit encompasses a broad
spectrum of instruments, including administrative, tax, and prudential measures. On one sideof the spectrum, measures that affect inflows merit greater scrutiny because they can
potentially be used to substitute for appropriate macroeconomic policies and they can have
externalities for other countries. It is therefore useful to distinguish within this spectrum those
measures that are designed to influence capital inflows, here referred to as capital flow
management measures (CFMs). These measures comprise (i) residency-based CFMs, often
referred to as capital controls, which encompass a variety of measures affecting cross-border
financial activity that discriminate on the basis of residency; and (ii) other CFMs that do not
discriminate on the basis of residency but are nonetheless designed to influence inflows. The
latter category would typically include (a) measures, including a subset of prudential
measures, that differentiate transactions on the basis of currency (e.g., broad limits on foreigncurrency borrowings and currency-specific reserve requirements) and (b) other measures (e.g.,
minimum holding periods and taxes on certain investments) that are typically applied in the
nonfinancial sector. Based on this nomenclature, if a measure is not designed to influence
capital inflows it would not fall under the CFM umbrella. These non-CFM measures do not
discriminate by residency and typically, but not always, do not differentiate by currency.
Relevant examples are prudential measures designed to ensure the resilience and soundness of
financial institutions, such as capital adequacy requirements, loan-to-value ratios, limits on net
open foreign exchange positions, and limits on foreign currency mortgages. Non-CFM
measures tend to be of a permanent nature, instead of being deployed temporarily in reaction
to an inflow surge, like CFMs. As such, non-CFMs would not tend to have the samemacroeconomic and multilateral effects as CFMs, namely to slow currency appreciation
and/or divert capital flows to other countries. As is evident, the classification of a particular
measure along the spectrum of measures as CFM or non-CFM requires the exercise of
judgment as to whether, in fact, the measure was designed to influence capital flows. This
assessment in turn would be based on the totality of circumstances, including whether the
measure was introduced or intensified during an inflow surge.
8/2/2019 IMF Ecperiences in Managing Capital Inflows
http://slidepdf.com/reader/full/imf-ecperiences-in-managing-capital-inflows 7/97
7
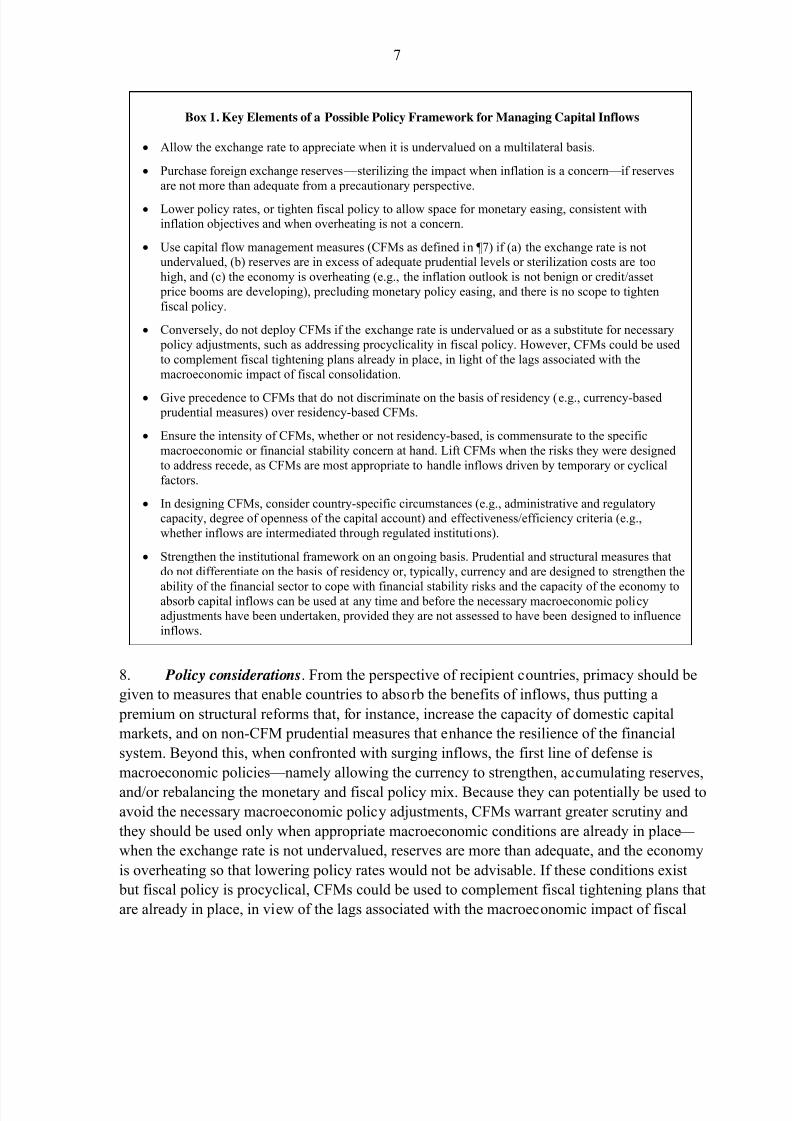
Box 1. Key Elements of a Possible Policy Framework for Managing Capital Inflows
Allow the exchange rate to appreciate when it is undervalued on a multilateral basis.
Purchase foreign exchange reserves — sterilizing the impact when inflation is a concern — if reservesare not more than adequate from a precautionary perspective.
Lower policy rates, or tighten fiscal policy to allow space for monetary easing, consistent withinflation objectives and when overheating is not a concern.
Use capital flow management measures (CFMs as defined in ¶7) if (a) the exchange rate is notundervalued, (b) reserves are in excess of adequate prudential levels or sterilization costs are toohigh, and (c) the economy is overheating (e.g., the inflation outlook is not benign or credit/asset price booms are developing), precluding monetary policy easing, and there is no scope to tightenfiscal policy.
Conversely, do not deploy CFMs if the exchange rate is undervalued or as a substitute for necessary policy adjustments, such as addressing procyclicality in fiscal policy. However, CFMs could be usedto complement fiscal tightening plans already in place, in light of the lags associated with themacroeconomic impact of fiscal consolidation.
Give precedence to CFMs that do not discriminate on the basis of residency (e.g., currency-based prudential measures) over residency-based CFMs.
Ensure the intensity of CFMs, whether or not residency-based, is commensurate to the specificmacroeconomic or financial stability concern at hand. Lift CFMs when the risks they were designedto address recede, as CFMs are most appropriate to handle inflows driven by temporary or cyclicalfactors.
In designing CFMs, consider country-specific circumstances (e.g., administrative and regulatorycapacity, degree of openness of the capital account) and effectiveness/efficiency criteria (e.g.,whether inflows are intermediated through regulated institutions).
Strengthen the institutional framework on an ongoing basis. Prudential and structural measures thatdo not differentiate on the basis of residency or, typically, currency and are designed to strengthen the
ability of the financial sector to cope with financial stability risks and the capacity of the economy toabsorb capital inflows can be used at any time and before the necessary macroeconomic policyadjustments have been undertaken, provided they are not assessed to have been designed to influenceinflows.
8. Policy considerations. From the perspective of recipient countries, primacy should be
given to measures that enable countries to absorb the benefits of inflows, thus putting a
premium on structural reforms that, for instance, increase the capacity of domestic capital
markets, and on non-CFM prudential measures that enhance the resilience of the financial
system. Beyond this, when confronted with surging inflows, the first line of defense is
macroeconomic policies — namely allowing the currency to strengthen, accumulating reserves,
and/or rebalancing the monetary and fiscal policy mix. Because they can potentially be used to
avoid the necessary macroeconomic policy adjustments, CFMs warrant greater scrutiny and
they should be used only when appropriate macroeconomic conditions are already in place —
when the exchange rate is not undervalued, reserves are more than adequate, and the economy
is overheating so that lowering policy rates would not be advisable. If these conditions exist
but fiscal policy is procyclical, CFMs could be used to complement fiscal tightening plans that
are already in place, in view of the lags associated with the macroeconomic impact of fiscal
8/2/2019 IMF Ecperiences in Managing Capital Inflows
http://slidepdf.com/reader/full/imf-ecperiences-in-managing-capital-inflows 8/97
8
consolidation. If CFMs are adopted, residency-based measures should be given lower priority,
consistent with the general standard of fairness that Fund members expect from their
participation in a multilateral framework (see ¶s 46 and 53). An illustrative application of this
framework (Section IV.C.) shows that several countries could qualify for using CFMs based on
their current circumstances.
9. CFM design. CFMs should be proportional to the specific macroeconomic or financialstability concern at hand: a blunt CFM that generally bans flows is inappropriate to deal witha sectoral prudential concern, but would be appropriate when currency overvaluation is therelevant concern. CFMs should be designed to maximize their effectiveness and efficiency: arelevant consideration in this regard is whether flows are intermediated through the regulatedfinancial sector (e.g., residency-based CFMs may be more effective than prudential measuresin dealing with inflows not intermediated by regulated financial institutions). Also, CFMs aremost effective as temporary responses, though the administrative apparatus to cope withfuture surges might be permanent.
II. STYLIZED FACTS ABOUT CAPITAL FLOWS
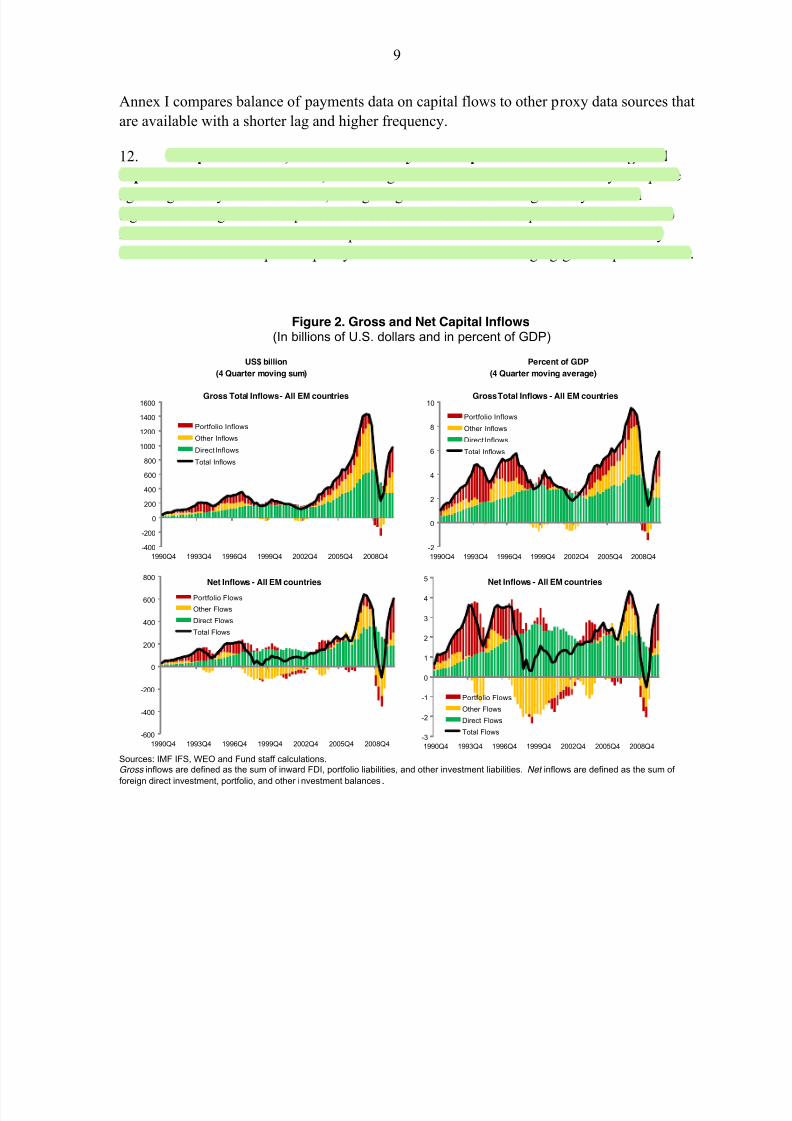
10. Capital flows to EMs are recovering at a fast pace — in net terms already close to
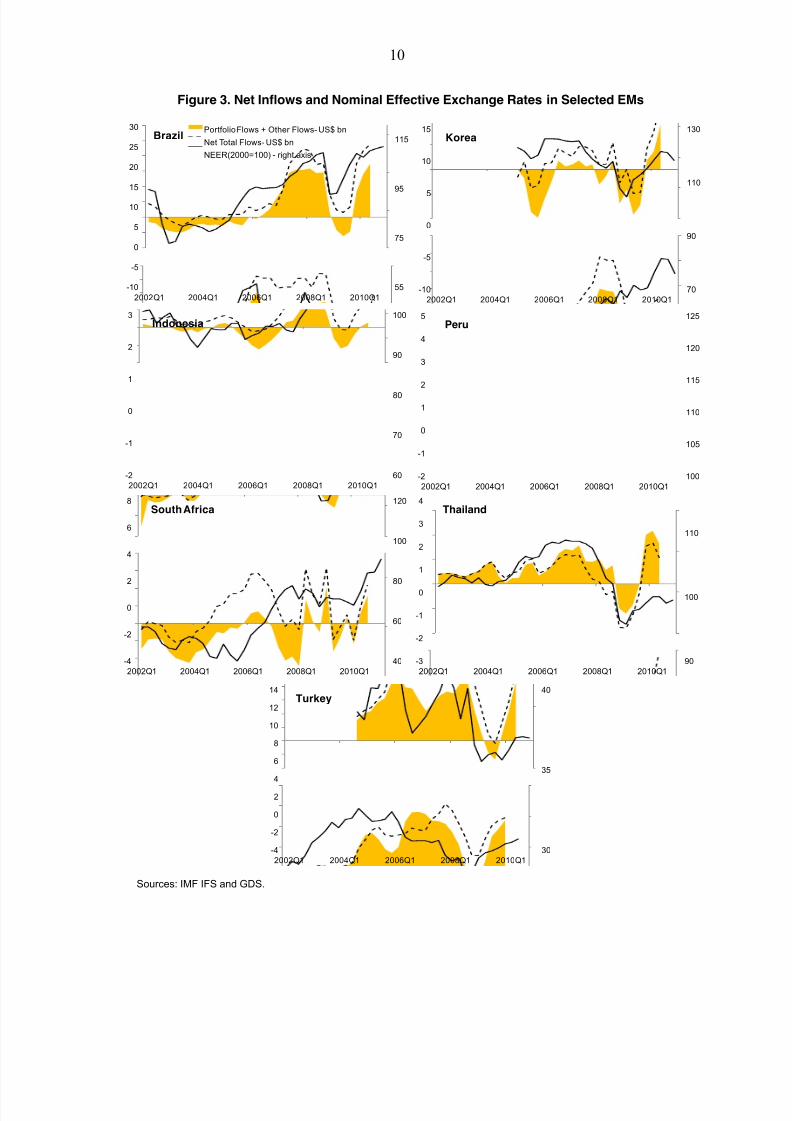
all-time highs (Figure 2). Strong growth prospects and healthy sovereign and private balancesheets are likely to continue drawing inflows in the future. This will bring important benefits toEMs, promoting investment and growth, and expanding the pool of financing opportunities. Atthe same time, large inflows may result in sharp, sustained currency appreciation, which canmake export sectors uncompetitive (Figure 3). Moreover, with historically volatile portfolioinflows comprising a bigger proportion of total flows this time around, higher inflow volumemay be accompanied by increased volatility if past trends continue. 2 Capital flows, especiallywhen investors are leveraged, can suddenly and sharply reverse. Where such reversals come on
the back of domestic credit booms, the resulting damage can be protracted. Thus, the currentwave of inflows can also bring risks and pose challenges for macroeconomic management.
11. This section focuses on two key questions: (a) how does the current experience with
capital inflows compare to past experiences; and (b) what push and pull factors explain capital
flows to EMs. To carry out this analysis, the section begins by defining how past experiences
with capital flows are identified. The analysis here is based on gross inflows — that is, changes
in portfolio and other liabilities of residents to nonresidents and inward direct investment — so
as to try to capture the key characteristics in the behavior of foreign capital. The next section
that reviews the recent experience of selected countries focuses on net inflows — that is, the
sum of foreign direct investment, portfolio, and other investment balances — since its primary
emphasis is on policy responses in which exchange rate appreciation is an important
consideration and exchange rate movements are affected more by net than gross flows.
2 Anecdotal evidence suggests the share of institutional investors, who are not typically associated with hotmoney, may have risen in flows to EMs. If sustained, this may imply lower volatility of portfolio flows goingforward.
8/2/2019 IMF Ecperiences in Managing Capital Inflows
http://slidepdf.com/reader/full/imf-ecperiences-in-managing-capital-inflows 9/97
9
Annex I compares balance of payments data on capital flows to other proxy data sources that
are available with a shorter lag and higher frequency.
12. Compared to AEs, EMs are relatively more exposed to fluctuations in global
capital flows. In contrast to AEs, where large inflows and outflows traditionally take place
against generally stable net flows, swings in gross inflows to EMs generally result insignificant changes in net capital flows. The modest size of EM capital markets relative to
AEs’ also means that a small shift in portfolio allocations from AEs to EMs could easily
overwhelm EMs’ absorptive capacity. This raises the bar for managing gross capital inflows.
Figure 2. Gross and Net Capital Inflows(In billions of U.S. dollars and in percent of GDP)
Sources: IMF IFS, WEO and Fund staff calculations.Gross inflows are defined as the sum of inward FDI, portfolio liabilities, and other investment liabilities. Net inflows are defined as the sum of
foreign direct investment, portfolio, and other i nvestment balances.
US$ billion Percent of GDP
(4 Quarter moving sum) (4 Quarter moving average)
-400
-200
0
200
400
600
800
1000
1200
1400
1600
1990Q4 1993Q4 1996Q4 1999Q4 2002Q4 2005Q4 2008Q4
Portfolio Inflows
Other Inflows
Direct Inflows
Total Inflows
Gross Total Inflows - All EM countries
-2
0
2
4
6
8
10
1990Q4 1993Q4 1996Q4 1999Q4 2002Q4 2005Q4 2008Q4
Portfolio Inflows
Other Inflows
Direct Inflows
Total Inflows
Gross Total Inflows - All EM countries
-600
-400
-200
0
200
400
600
800
1990Q4 1993Q4 1996Q4 1999Q4 2002Q4 2005Q4 2008Q4
Portfolio Flows
Other Flows
Direct Flows
Total Flows
Net Inflows - All EM countries
-3
-2
-1
0
1
2
3
4
5
1990Q4 1993Q4 1996Q4 1999Q4 2002Q4 2005Q4 2008Q4
Portfolio Flows
Other Flows
Direct Flows
Total Flows
Net Inflows - All EM countries
8/2/2019 IMF Ecperiences in Managing Capital Inflows
http://slidepdf.com/reader/full/imf-ecperiences-in-managing-capital-inflows 10/97
10
Figure 3. Net Inflows and Nominal Effective Exchange Rates in Selected EMs
Sources: IMF IFS and GDS.
55
75
95
115
-10
-5
0
5
10
15
20
25
30
2002Q1 2004Q1 2006Q1 2008Q1 2010Q1
Portfolio Flows + Other Flows- US$ bn
Net Total Flows- US$ bn
NEER(2000=100) - right axis
Brazil
70
90
110
130
-10
-5
0
5
10
15
2002Q1 2004Q1 2006Q1 2008Q1 2010Q1
Korea
100
105
110
115
120
125
-2
-1
0
1
2
3
4
5
2002Q1 2004Q1 2006Q1 2008Q1 2010Q1
Peru
40
60
80
100
120
-4
-2
0
2
4
6
8
2002Q1 2004Q1 2006Q1 2008Q1 2010Q1
South Africa
90
100
110
-3
-2
-1
0
1
2
3
4
2002Q1 2004Q1 2006Q1 2008Q1 2010Q1
Thailand
60
70
80
90
100
-2
-1
0
1
2
3
2002Q1 2004Q1 2006Q1 2008Q1 2010Q1
Indonesia
30
35
40
-4
-2
0
2
4
6
8
10
12
14
2002Q1 2004Q1 2006Q1 2008Q1 2010Q1
Turkey
8/2/2019 IMF Ecperiences in Managing Capital Inflows
http://slidepdf.com/reader/full/imf-ecperiences-in-managing-capital-inflows 11/97
11
0
10
20
30
40
1990 1995 2000 2005 2010
Number of countries
Distribution of Capital Inflows Episodes
Source: Fund staff calculations
A. Capital Flows Then and Now
13. To facilitate the analysis, the following terminology is used to define inflow
surges, episodes, and waves:
Surge. A surge refers to a quarter or year during which gross inflows significantly exceedtheir long-run trend and are also large in absolute magnitude. Based on the criteriadescribed in Annex 2, EMs experienced surges in capital inflows 20 percent of the time between 1990Q1 and 2010Q2. Such identified surges cluster in two seven-quarter periodsof 1996Q4−1998Q2 and 2006Q4−2008Q2 and in the post crisis period.
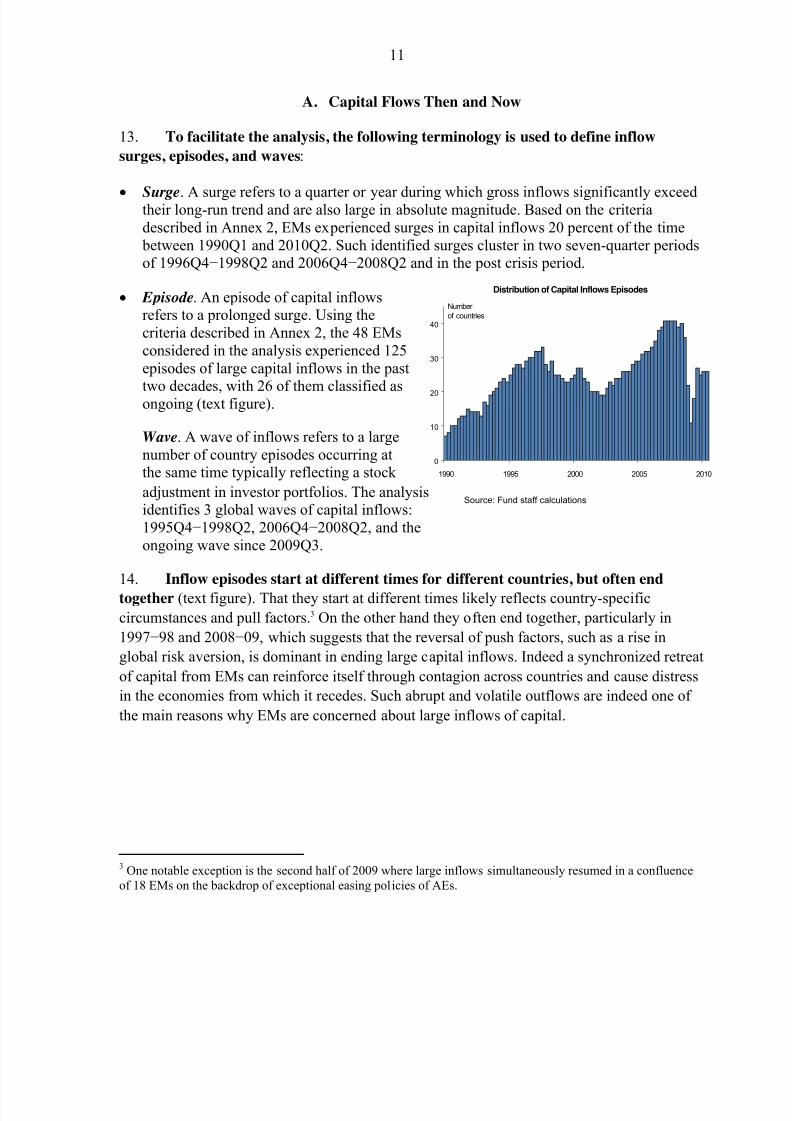
Episode. An episode of capital inflowsrefers to a prolonged surge. Using thecriteria described in Annex 2, the 48 EMsconsidered in the analysis experienced 125episodes of large capital inflows in the past
two decades, with 26 of them classified asongoing (text figure).
Wave. A wave of inflows refers to a largenumber of country episodes occurring atthe same time typically reflecting a stock
adjustment in investor portfolios. The analysisidentifies 3 global waves of capital inflows:1995Q4−1998Q2, 2006Q4−2008Q2, and theongoing wave since 2009Q3.
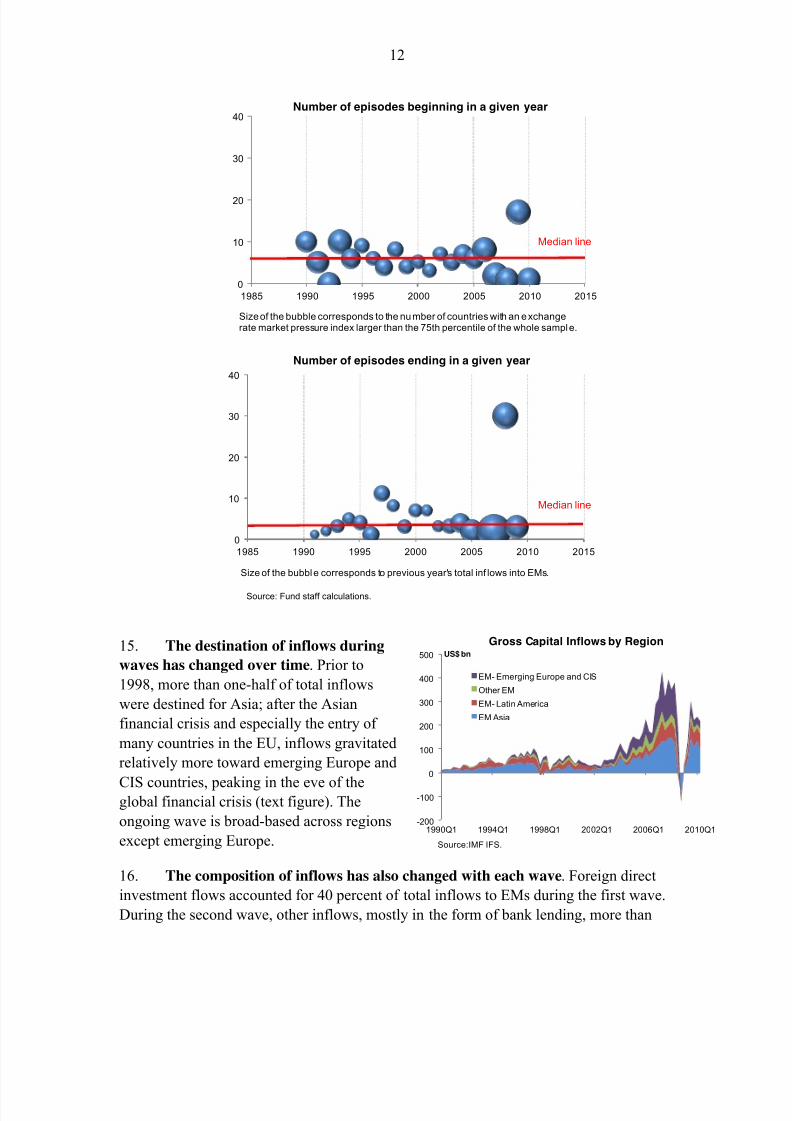
14. Inflow episodes start at different times for different countries, but often end
together (text figure). That they start at different times likely reflects country-specific
circumstances and pull factors.3 On the other hand they often end together, particularly in
1997−98 and 2008−09, which suggests that the reversal of push factors, such as a rise in
global risk aversion, is dominant in ending large capital inflows. Indeed a synchronized retreat
of capital from EMs can reinforce itself through contagion across countries and cause distress
in the economies from which it recedes. Such abrupt and volatile outflows are indeed one of
the main reasons why EMs are concerned about large inflows of capital.
3 One notable exception is the second half of 2009 where large inflows simultaneously resumed in a confluenceof 18 EMs on the backdrop of exceptional easing policies of AEs.
8/2/2019 IMF Ecperiences in Managing Capital Inflows
http://slidepdf.com/reader/full/imf-ecperiences-in-managing-capital-inflows 12/97
12
Source: Fund staff calculations.
15. The destination of inflows during
waves has changed over time. Prior to
1998, more than one-half of total inflows
were destined for Asia; after the Asian
financial crisis and especially the entry of
many countries in the EU, inflows gravitated
relatively more toward emerging Europe and
CIS countries, peaking in the eve of theglobal financial crisis (text figure). The
ongoing wave is broad-based across regions
except emerging Europe.
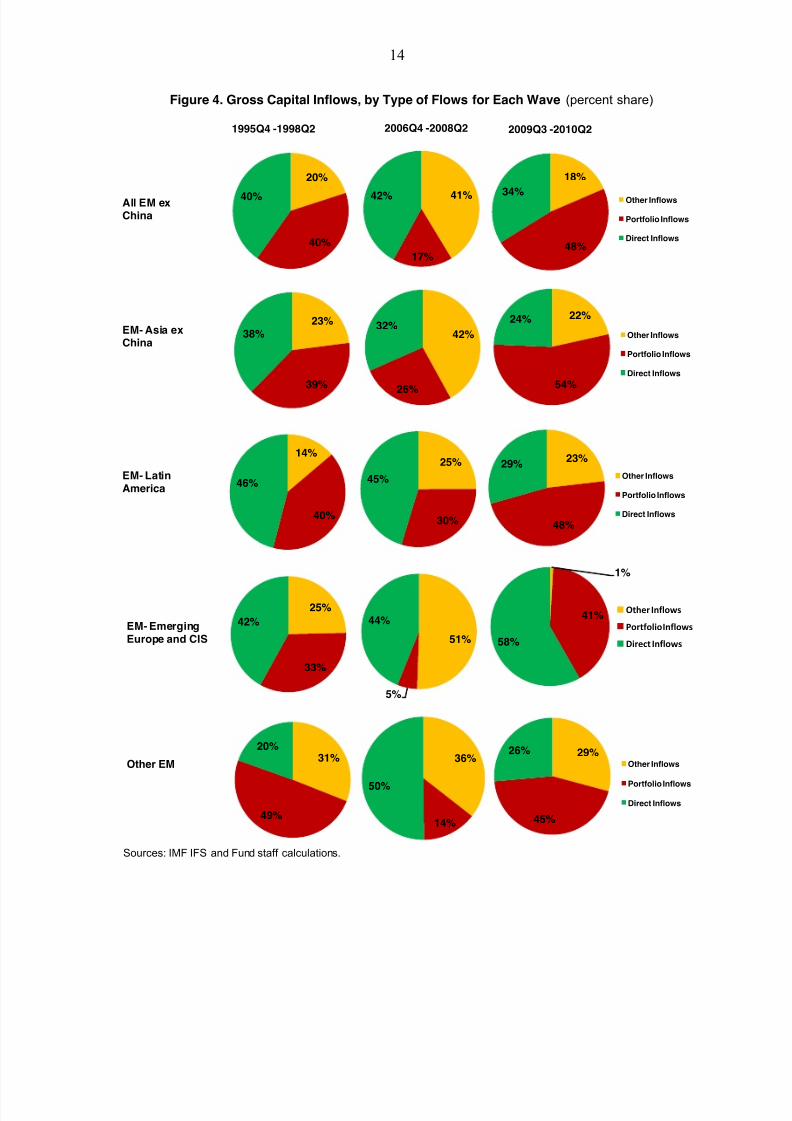
16. The composition of inflows has also changed with each wave. Foreign direct
investment flows accounted for 40 percent of total inflows to EMs during the first wave.
During the second wave, other inflows, mostly in the form of bank lending, more than
0
10
20
30
40
1985 1990 1995 2000 2005 2010 2015
Number of episodes ending in a given year
Size of the bubble corresponds to previous year's total inf lows into EMs.
Median line
0
10
20
30
40
1985 1990 1995 2000 2005 2010 2015
Number of episodes beginning in a given year
Sizeof the bubble corresponds to the number of countries with an exchangerate market pressure index larger than the 75th percentile of the whole sample.
Median line
-200
-100
0
100
200
300
400
500
1990Q1 1994Q1 1998Q1 2002Q1 2006Q1 2010Q1
EM- Emerging Europe and CIS
Other EM
EM- Latin America
EM Asia
Gross Capital Inflows by RegionUS$ bn
Source:IMF IFS.
8/2/2019 IMF Ecperiences in Managing Capital Inflows
http://slidepdf.com/reader/full/imf-ecperiences-in-managing-capital-inflows 13/97
13
doubled their share from about 20 percent in the previous wave to around 40 percent. For
emerging European countries in particular, around one-half of total inflows were in the form
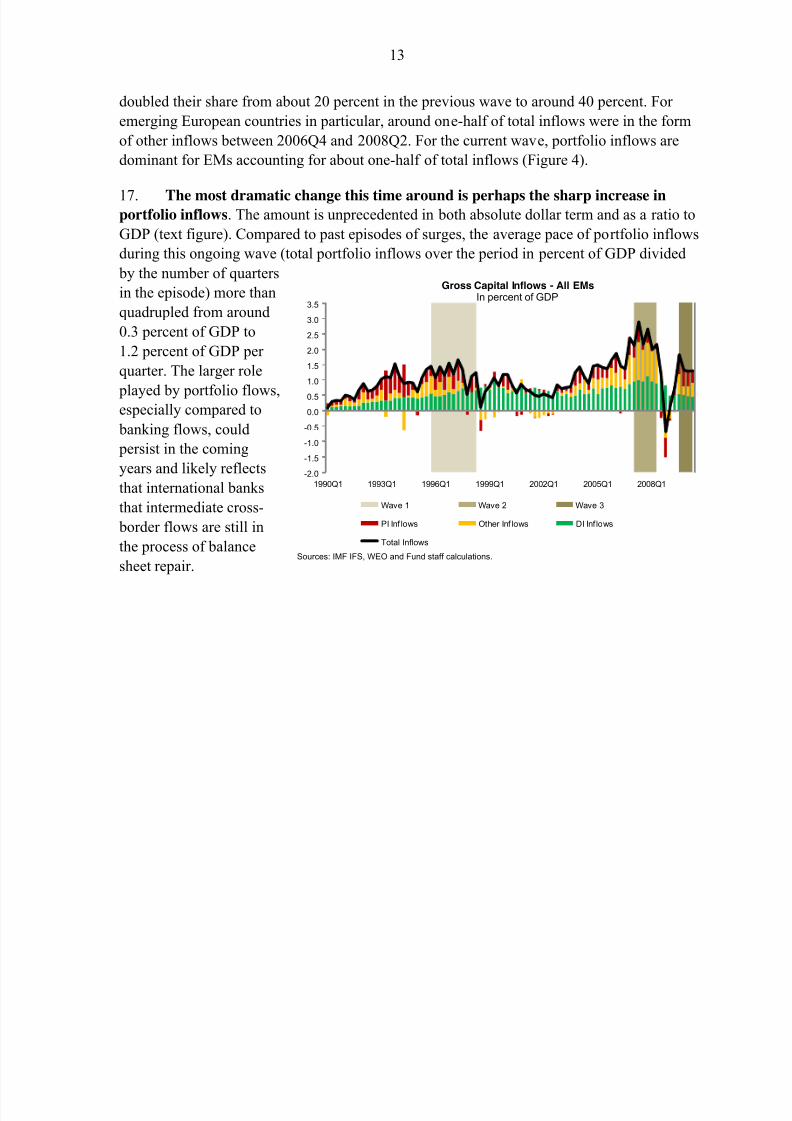
of other inflows between 2006Q4 and 2008Q2. For the current wave, portfolio inflows are
dominant for EMs accounting for about one-half of total inflows (Figure 4).
17. The most dramatic change this time around is perhaps the sharp increase inportfolio inflows. The amount is unprecedented in both absolute dollar term and as a ratio to
GDP (text figure). Compared to past episodes of surges, the average pace of portfolio inflows
during this ongoing wave (total portfolio inflows over the period in percent of GDP divided
by the number of quarters
in the episode) more than
quadrupled from around
0.3 percent of GDP to
1.2 percent of GDP per
quarter. The larger role
played by portfolio flows,especially compared to
banking flows, could
persist in the coming
years and likely reflects
that international banks
that intermediate cross-
border flows are still in
the process of balance
sheet repair.
2 2 2 2 2 2
Sources: IMF IFS, WEO and Fund staff calculations.
-2.0
-1.5
-1.0
-0.5
0.0
0.5
1.0
1.5
2.0
2.5
3.0
3.5
1990Q1 1993Q1 1996Q1 1999Q1 2002Q1 2005Q1 2008Q1
Gross Capital Inflows - All EMsIn percent of GDP
-5.00.05.0
Wave 1 Wave 2 Wave 3
PI Inf lows Other Inf lows DI Inf lows
Total Inflows
8/2/2019 IMF Ecperiences in Managing Capital Inflows
http://slidepdf.com/reader/full/imf-ecperiences-in-managing-capital-inflows 14/97
14
Figure 4. Gross Capital Inflows, by Type of Flows for Each Wave (percent share)
Sources: IMF IFS and Fund staff calculations.
All EM exChina
EM- Asia exChina
EM- LatinAmerica
EM- EmergingEurope and CIS
Other EM
20%
40%
40% 41%
17%
42%
1995Q4 -1998Q2
18%
48%
34% Other Inflows
Portfolio Inflows
Direct Inflows
2006Q4 -2008Q2 2009Q3 -2010Q2
23%
39%
38% 42%
26%
32%22%
54%
24%
Other Inflows
Portfolio Inflows
Direct Inflows
14%
40%
46%
25%
30%
45%
23%
48%
29%Other Inflows
Portfolio Inflows
Direct Inflows
25%
33%
42%
51%
5%
44%Other Inflows
Portfolio Inflows
Direct Inflows
31%
49%
20%29%
45%
26%Other Inflows
Portfolio Inflows
Direct Inflows
1%
41%
58%
36%
14%
50%
8/2/2019 IMF Ecperiences in Managing Capital Inflows
http://slidepdf.com/reader/full/imf-ecperiences-in-managing-capital-inflows 15/97
15
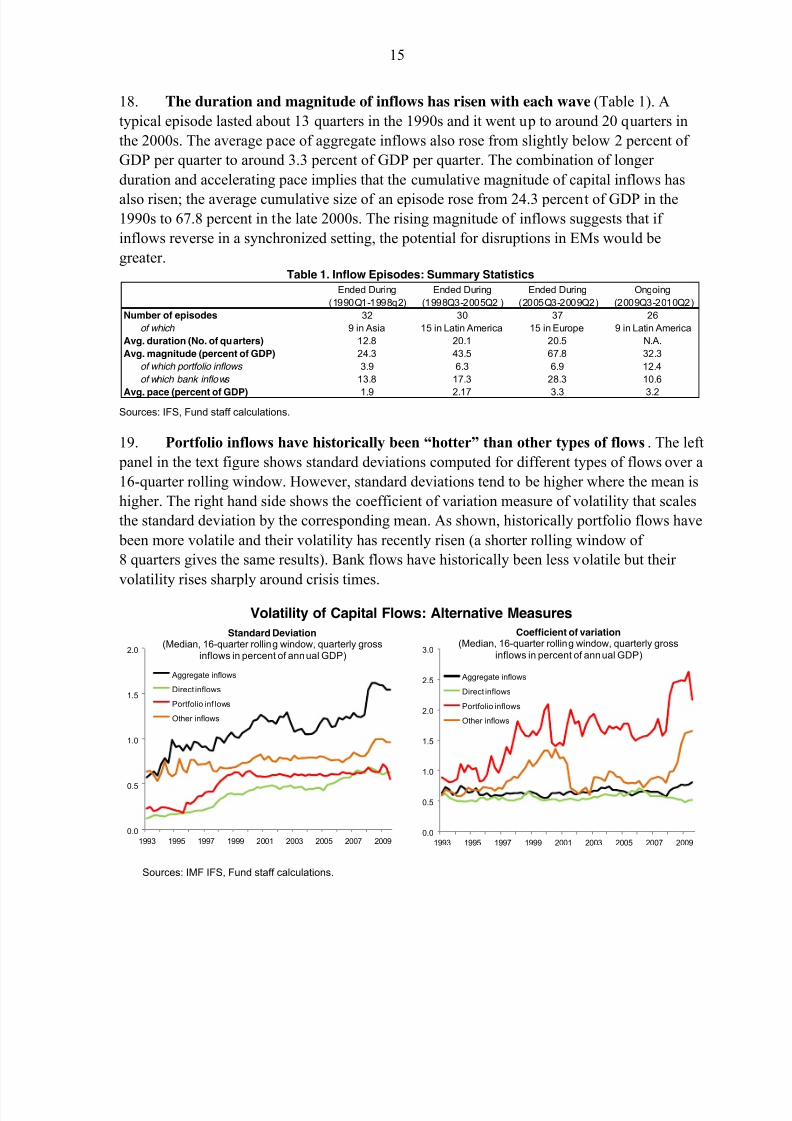
18. The duration and magnitude of inflows has risen with each wave (Table 1). A
typical episode lasted about 13 quarters in the 1990s and it went up to around 20 quarters in
the 2000s. The average pace of aggregate inflows also rose from slightly below 2 percent of
GDP per quarter to around 3.3 percent of GDP per quarter. The combination of longer
duration and accelerating pace implies that the cumulative magnitude of capital inflows has
also risen; the average cumulative size of an episode rose from 24.3 percent of GDP in the1990s to 67.8 percent in the late 2000s. The rising magnitude of inflows suggests that if
inflows reverse in a synchronized setting, the potential for disruptions in EMs would be
greater. Table 1. Inflow Episodes: Summary Statistics
Sources: IFS, Fund staff calculations.
19. Portfolio inflows have historically been “hotter” than other types of flows. The left
panel in the text figure shows standard deviations computed for different types of flows over a
16-quarter rolling window. However, standard deviations tend to be higher where the mean is
higher. The right hand side shows the coefficient of variation measure of volatility that scales
the standard deviation by the corresponding mean. As shown, historically portfolio flows have
been more volatile and their volatility has recently risen (a shorter rolling window of
8 quarters gives the same results). Bank flows have historically been less volatile but their
volatility rises sharply around crisis times.
Volatility of Capital Flows: Alternative Measures
Sources: IMF IFS, Fund staff calculations.
Ended During Ended During Ended During Ongoing
(1990Q1-1998q2) (1998Q3-2005Q2 ) (2005Q3-2009Q2) (2009Q3-2010Q2)
Number of episodes 32 30 37 26
of which 9 in Asia 15 in Latin America 15 in Europe 9 in Latin America
Avg. duration (No. of quarters) 12.8 20.1 20.5 N.A.
Avg. magnitude (percent of GDP) 24.3 43.5 67.8 32.3
of which portfolio inflows 3.9 6.3 6.9 12.4
of which bank inflows 13.8 17.3 28.3 10.6
Avg. pace (percent of GDP) 1.9 2.17 3.3 3.2
0.0
0.5
1.0
1.5
2.0
2.5
3.0
1993 1995 1997 1999 2001 2003 2005 2007 2009
Coefficient of variation(Median, 16-quarter rolling window, quarterly gross
inflows in percent of annual GDP)
Aggregate inflows
Direct inflows
Portfolio inflows
Other inflows
0.0
0.5
1.0
1.5
2.0
1993 1995 1997 1999 2001 2003 2005 2007 2009
Standard Deviation(Median, 16-quarter rolling window, quarterly gross
inflows in percent of annual GDP)
Aggregate inflows
Direct inflows
Portfolio inf lows
Other inflows
8/2/2019 IMF Ecperiences in Managing Capital Inflows
http://slidepdf.com/reader/full/imf-ecperiences-in-managing-capital-inflows 16/97
16
B. Push and Pull Factors
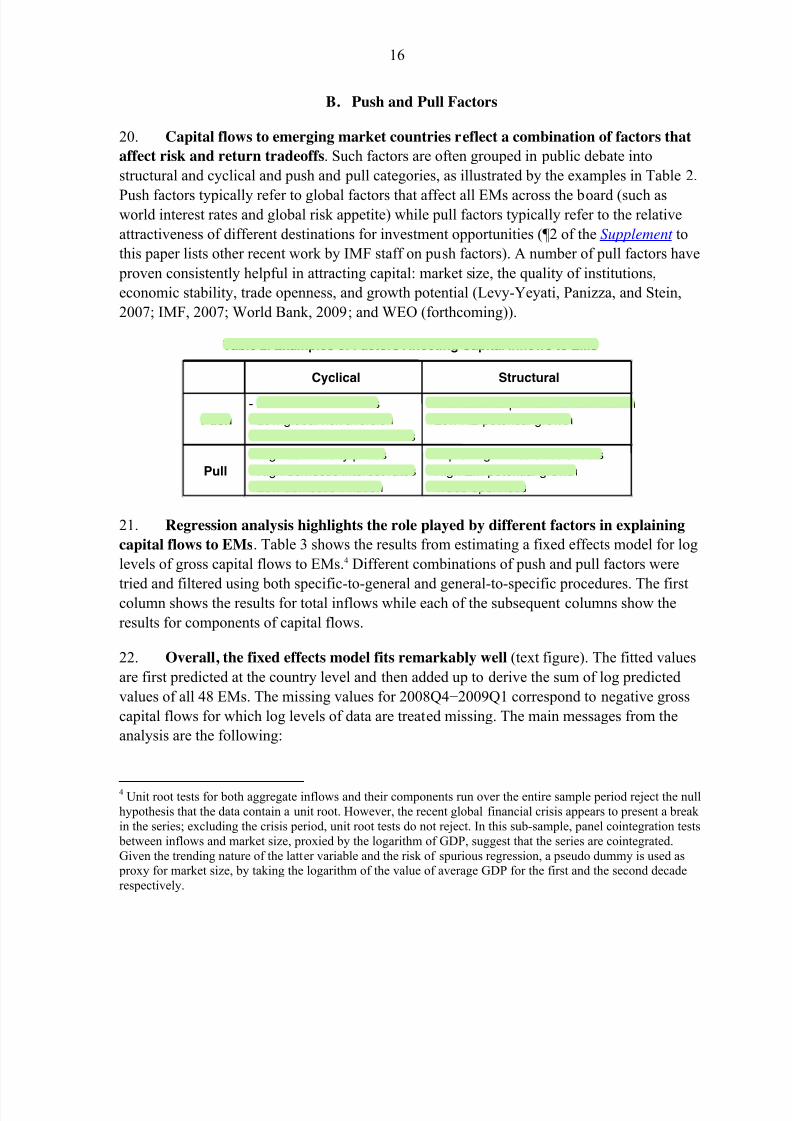
20. Capital flows to emerging market countries reflect a combination of factors that
affect risk and return tradeoffs. Such factors are often grouped in public debate into
structural and cyclical and push and pull categories, as illustrated by the examples in Table 2.
Push factors typically refer to global factors that affect all EMs across the board (such asworld interest rates and global risk appetite) while pull factors typically refer to the relative
attractiveness of different destinations for investment opportunities (¶2 of the Supplement to
this paper lists other recent work by IMF staff on push factors). A number of pull factors have
proven consistently helpful in attracting capital: market size, the quality of institutions,
economic stability, trade openness, and growth potential (Levy-Yeyati, Panizza, and Stein,
2007; IMF, 2007; World Bank, 2009; and WEO (forthcoming)).
Table 2. Examples of Factors Affecting Capital Inflows to EMs
21. Regression analysis highlights the role played by different factors in explaining
capital flows to EMs. Table 3 shows the results from estimating a fixed effects model for log
levels of gross capital flows to EMs.4 Different combinations of push and pull factors were
tried and filtered using both specific-to-general and general-to-specific procedures. The firstcolumn shows the results for total inflows while each of the subsequent columns show the
results for components of capital flows.
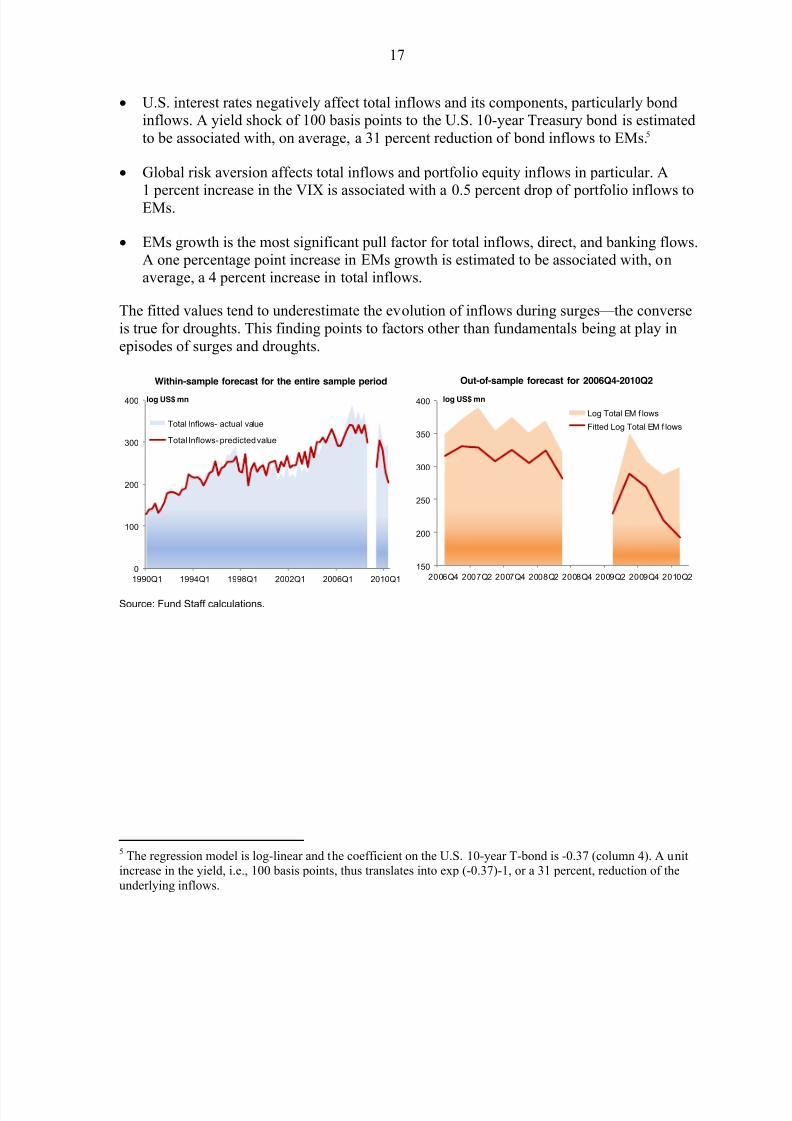
22. Overall, the fixed effects model fits remarkably well (text figure). The fitted values
are first predicted at the country level and then added up to derive the sum of log predicted
values of all 48 EMs. The missing values for 2008Q4−2009Q1 correspond to negative gross
capital flows for which log levels of data are treated missing. The main messages from the
analysis are the following:
4 Unit root tests for both aggregate inflows and their components run over the entire sample period reject the nullhypothesis that the data contain a unit root. However, the recent global financial crisis appears to present a break in the series; excluding the crisis period, unit root tests do not reject. In this sub-sample, panel cointegration tests between inflows and market size, proxied by the logarithm of GDP, suggest that the series are cointegrated.Given the trending nature of the latter variable and the risk of spurious regression, a pseudo dummy is used as proxy for market size, by taking the logarithm of the value of average GDP for the first and the second decaderespectively.
Cyclical Structural
Push - Low US interest rates
- Low global risk aversion - Strained AE balance sheets
- International portfolio diversification - Low AE potential growth
Pull - High commodity prices - High domestic interest rates - Low domestic inflation
- Improving EM balance sheets - High EM potential growth - Trade openness
8/2/2019 IMF Ecperiences in Managing Capital Inflows
http://slidepdf.com/reader/full/imf-ecperiences-in-managing-capital-inflows 17/97
8/2/2019 IMF Ecperiences in Managing Capital Inflows
http://slidepdf.com/reader/full/imf-ecperiences-in-managing-capital-inflows 18/97
18
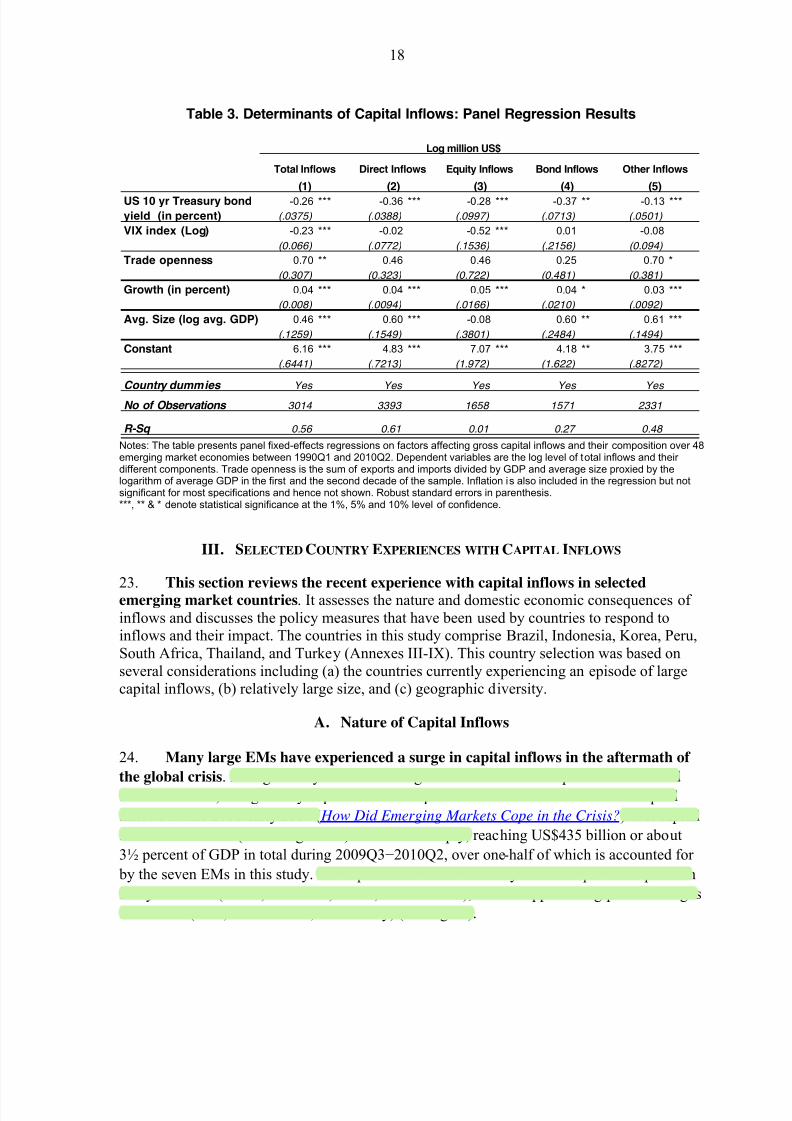
Table 3. Determinants of Capital Inflows: Panel Regression Results
Notes: The table presents panel fixed-effects regressions on factors affecting gross capital inflows and their composition over 48emerging market economies between 1990Q1 and 2010Q2. Dependent variables are the log level of total inflows and their different components. Trade openness is the sum of exports and imports divided by GDP and average size proxied by thelogarithm of average GDP in the first and the second decade of the sample. Inflation is also included in the regression but notsignificant for most specifications and hence not shown. Robust standard errors in parenthesis.***, ** & * denote statistical significance at the 1%, 5% and 10% level of confidence.
III. SELECTED COUNTRY EXPERIENCES WITH CAPITAL INFLOWS
23. This section reviews the recent experience with capital inflows in selectedemerging market countries. It assesses the nature and domestic economic consequences of inflows and discusses the policy measures that have been used by countries to respond toinflows and their impact. The countries in this study comprise Brazil, Indonesia, Korea, Peru,South Africa, Thailand, and Turkey (Annexes III-IX). This country selection was based onseveral considerations including (a) the countries currently experiencing an episode of largecapital inflows, (b) relatively large size, and (c) geographic diversity.
A. Nature of Capital Inflows
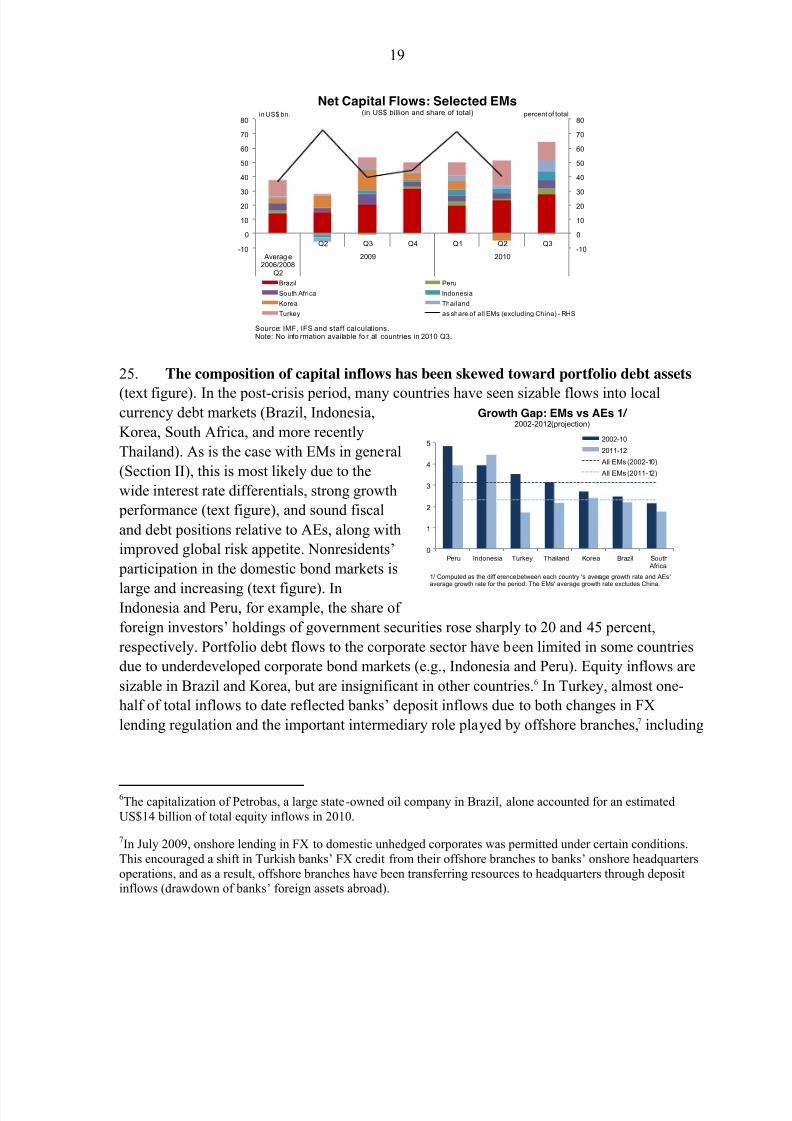
24. Many large EMs have experienced a surge in capital inflows in the aftermath of
the global crisis. EMs generally weathered the global crisis better than previous crises and
better than AEs, though many experienced a sharp slowdown — even a reversal — in capital
inflows in late 2008/early 2009 ( How Did Emerging Markets Cope in the Crisis?). Net capital
inflows to all EMs (excluding China) have risen sharply, reaching US$435 billion or about
3½ percent of GDP in total during 2009Q3−2010Q2, over one-half of which is accounted for
by the seven EMs in this study. Net capital inflows have already exceeded pre-crisis peaks in
many countries (Brazil, Indonesia, Korea, and Thailand), and are approaching pre-crisis highs
for the rest (Peru, South Africa, and Turkey) (text figure).
-0.26 *** -0.36 *** -0.28 *** -0.37 ** -0.13 ***
(.0375) (.0388) (.0997) (.0713) (.0501)
VIX index (Log) -0.23 *** -0.02 -0.52 *** 0.01 -0.08
(0.066) (.0772) (.1536) (.2156) (0.094)
Trade openness 0.70 ** 0.46 0.46 0.25 0.70 *
(0.307) (0.323) (0.722) (0.481) (0.381)
Growth (in percent) 0.04 *** 0.04 *** 0.05 *** 0.04 * 0.03 ***
(0.008) (.0094) (.0166) (.0210) (.0092)
Avg. Size (log avg. GDP) 0.46 *** 0.60 *** -0.08 0.60 ** 0.61 ***
(.1259) (.1549) (.3801) (.2484) (.1494)
Constant 6.16 *** 4.83 *** 7.07 *** 4.18 ** 3.75 ***
(.6441) (.7213) (1.972) (1.622) (.8272)
Country dummies Yes Yes Yes Yes Yes
No of Observations 3014 3393 1658 1571 2331
R-Sq 0.56 0.61 0.01 0.27 0.48
Total Inflows
Log million US$
US 10 yr Treasury bond
yield (in percent)
(1) (2) (3) (4) (5)
Other InflowsBond InflowsEquity InflowsDirect Inflows
8/2/2019 IMF Ecperiences in Managing Capital Inflows
http://slidepdf.com/reader/full/imf-ecperiences-in-managing-capital-inflows 19/97
19
0
1
2
3
4
5
Peru Indonesia Turkey Thailand Korea Brazil South Africa
Growth Gap: EMs vs AEs 1/ 2002-2012 (projection)
2002-10
2011-12
All EMs (2002-10)
All EMs (2011-12)
1/ Computed as the diff erence between each country 's average growth rate and AEs 'average growth rate for the period. The EMs' average growth rate excludes China.
25. The composition of capital inflows has been skewed toward portfolio debt assets
(text figure). In the post-crisis period, many countries have seen sizable flows into localcurrency debt markets (Brazil, Indonesia,
Korea, South Africa, and more recently
Thailand). As is the case with EMs in general
(Section II), this is most likely due to the
wide interest rate differentials, strong growth
performance (text figure), and sound fiscal
and debt positions relative to AEs, along with
improved global risk appetite. Nonresidents’
participation in the domestic bond markets is
large and increasing (text figure). InIndonesia and Peru, for example, the share of
foreign investors’ holdings of government securities rose sharply to 20 and 45 percent,
respectively. Portfolio debt flows to the corporate sector have been limited in some countries
due to underdeveloped corporate bond markets (e.g., Indonesia and Peru). Equity inflows are
sizable in Brazil and Korea, but are insignificant in other countries.6 In Turkey, almost one-
half of total inflows to date reflected banks’ deposit inflows due to both changes in FX
lending regulation and the important intermediary role played by offshore branches,7 including
6The capitalization of Petrobas, a large state-owned oil company in Brazil, alone accounted for an estimatedUS$14 billion of total equity inflows in 2010.
7In July 2009, onshore lending in FX to domestic unhedged corporates was permitted under certain conditions.This encouraged a shift in Turkish banks’ FX credit from their offshore branches to banks’ onshore headquartersoperations, and as a result, offshore branches have been transferring resources to headquarters through depositinflows (drawdown of banks’ foreign assets abroad).
-10
0
10
20
30
40
50
60
70
80
-10
0
10
20
30
40
50
60
70
80
Q2 Q3 Q4 Q1 Q2 Q3
Averag e2006/2008
Q2
2009 2010
Net Capital Flows: Selected EMs(in US$ billion and share of total)
Brazil Peru
South Africa Indonesia
Korea Thailand
Turkey as share of all EMs (excluding China) - RHS
percent of totalin US$ bn.
Source: IMF, IFS and staff calculations.Note: No info rmation available fo r all countries in 2010 Q3.
8/2/2019 IMF Ecperiences in Managing Capital Inflows
http://slidepdf.com/reader/full/imf-ecperiences-in-managing-capital-inflows 20/97
20
0
5
10
15
20
25
30
35
40
45
0
5
10
15
20
25
30
Jun -08 Sep -08 Dec-08 Mar-09 Jun -09 Sep -09 Dec-09 Mar-10 J un -10 Sep -10
Foreign Holdings of Local CurrencyPublic Debt 1/
(as share of total)
Brazil Indonesia Korea
Thailand Turkey Peru (RHS)
Source: IMF staff calculations.1/ Shaded area represents most recent wave of capital inflo ws.
in currency swap transactions,8 but flows into government securities have also been notable.
FDI has remained subdued and well below pre-crisis peaks in most countries, except in Brazil
and Peru where it continued to account for a sizable share of total inflows. Both these
countries are large commodity exporters and the stronger outlook for commodity prices may
have been a factor in attracting FDI.
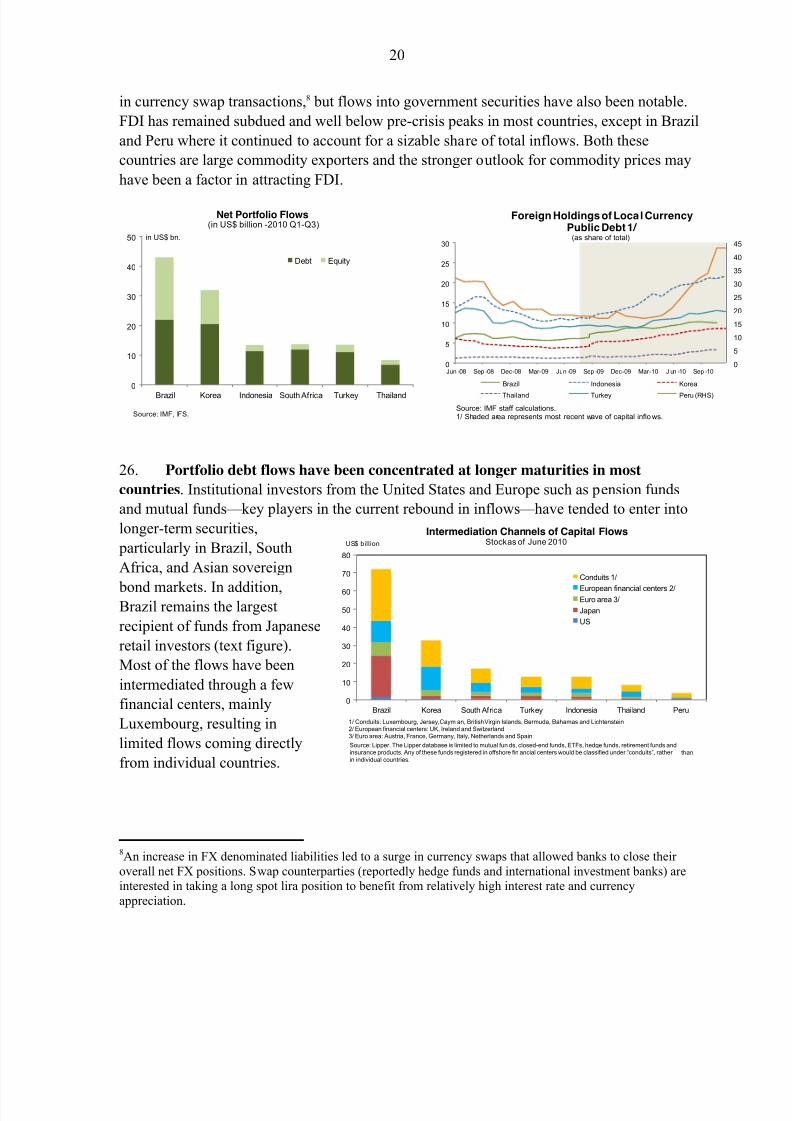
26. Portfolio debt flows have been concentrated at longer maturities in most
countries. Institutional investors from the United States and Europe such as pension funds
and mutual funds — key players in the current rebound in inflows — have tended to enter into
longer-term securities,
particularly in Brazil, South
Africa, and Asian sovereign
bond markets. In addition,Brazil remains the largest
recipient of funds from Japanese
retail investors (text figure).
Most of the flows have been
intermediated through a few
financial centers, mainly
Luxembourg, resulting in
limited flows coming directly
from individual countries.
8An increase in FX denominated liabilities led to a surge in currency swaps that allowed banks to close their overall net FX positions. Swap counterparties (reportedly hedge funds and international investment banks) areinterested in taking a long spot lira position to benefit from relatively high interest rate and currencyappreciation.
0
10
20
30
40
50
Brazil Korea Indonesia South Africa Turkey Thailand
Net Portfolio Flows(in US$ billion -2010 Q1-Q3)
Debt Equity
in US$ bn.
Source: IMF, IFS.
0
10
20
30
40
50
60
70
80
Brazil Korea South Africa Turkey Indonesia Thailand Peru
Intermediation Channels of Capital FlowsStock as of June 2010
Conduits 1/
European financial centers 2/Euro area 3/
Japan
US
1/ Conduits: Luxembourg, Jersey,Caym an, British Virgin Islands, Bermuda, Bahamas and Lichtenstein2/ European financial centers: UK, Ireland and Switzerland3/ Euro area: Austria, France, Germany, Italy, Netherlands and Spain
US$ billion
Source: Lipper. The Lipper database is limited to mutual fun ds, closed-end funds, ETFs, hedge funds, retirement funds andinsurance products. Any of these funds registered in offshore fin ancial centers would be classified under “conduits”, rather thanin individual countries.
8/2/2019 IMF Ecperiences in Managing Capital Inflows
http://slidepdf.com/reader/full/imf-ecperiences-in-managing-capital-inflows 21/97
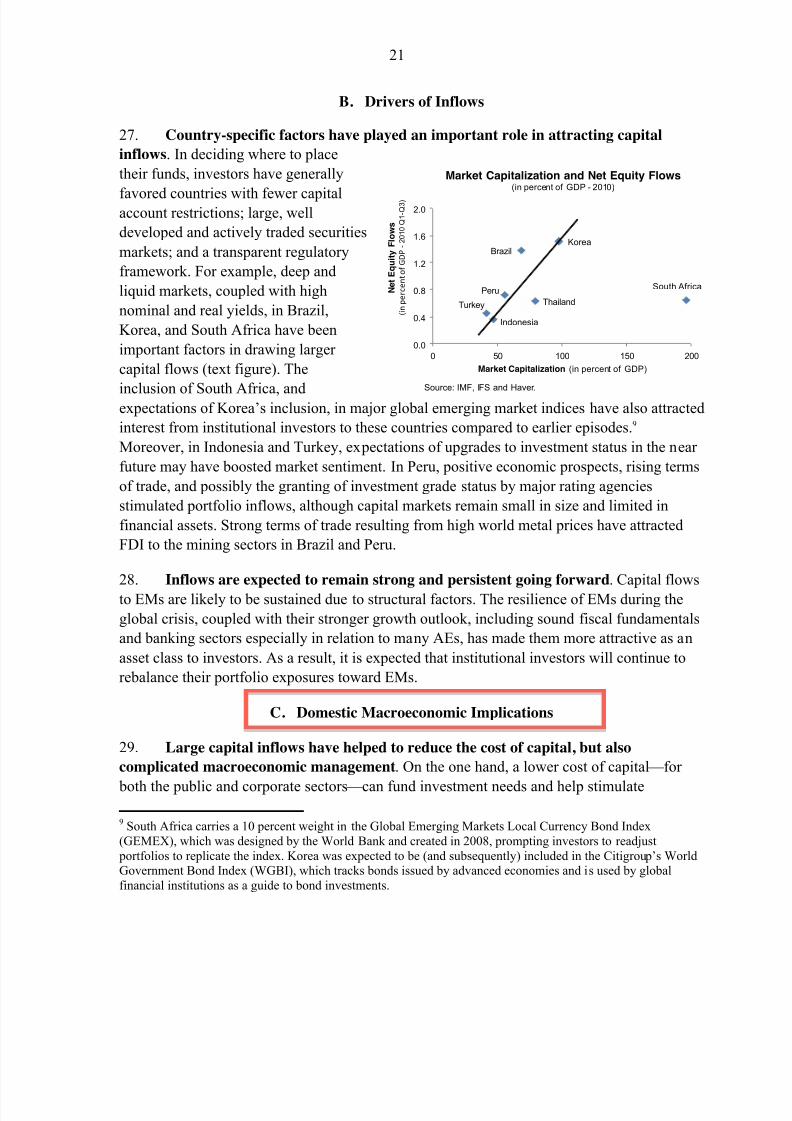
8/2/2019 IMF Ecperiences in Managing Capital Inflows
http://slidepdf.com/reader/full/imf-ecperiences-in-managing-capital-inflows 22/97
22
consumption and investment. Capital flows can also promote financial market development
by introducing new investment instruments and increasing absorption capacity. However, they
may also potentially bring costs. For example, inflows may put upward pressure on exchange
rates leading to a loss of competitiveness. They can also possibly complicate monetary
management by pushing down long-term bond yields below levels that would prevail given
domestic conditions, potentially making interest rate policy less effective, especially when themonetary transmission mechanism is already weak.10 Lower government borrowing costs can
also possibly lead to looser fiscal discipline, although in some countries this may be justified
by better debt dynamics.
In Brazil, large inflows into government bonds have been associated with a
compression in longer-term yields against a backdrop of strong economic activity,
procyclical fiscal policy, and high real interest rates.
In Indonesia, with limited bond market liquidity and depth, continued strong portfolio
flows into the long end of the yield curve may have reduced the level of term risk
premia of government bonds.
In Thailand, inflows into the bond market, coupled with easy monetary conditions,
may have been associated with a flattening of the yield curve.
30. Inflows can also have an impact on macro-financial stability. Inflows that are
volatile, typically concentrated in short-term maturity instruments, can trigger sharp asset
price movements and destabilizing sudden stops or reversals of flows, particularly when risk
sentiment shifts. This was the case at the onset of the global crisis in 2008 for Indonesia when
SBI holdings by nonresidents fell sharply, and for Korea where massive global deleveraging
led to a rapid reversal of banks’ short-term debt inflows.
10 IMF Regional Economic Outlook: Asia and Pacific (forthcoming) provides some empirical evidence on therelationship between capital inflows and bond yields.
8/2/2019 IMF Ecperiences in Managing Capital Inflows
http://slidepdf.com/reader/full/imf-ecperiences-in-managing-capital-inflows 23/97
23
50
100
150
200
250
300
350
Jan-09 Apr-09 Jul-09 Oct-09 Jan-10 Apr-10 Jul-10 Oct-10
Stock Market Indices(January 2009=100, daily)
Brazil
Peru
South Africa
Source: Bloomberg.1/Shaded area represents most recent wave of capital inflows.
50
100
150
200
250
300
350
Jan-09 Apr-09 Jul-09 Oct-09 Jan-10 Apr-10 Jul-10 Oct-10
Stock Market Indices(January 2009=100, daily)
Indonesia
Korea
Thailand
Turkey
-3
-2
-1
0
1
2
3
4
5
-3
-2
-1
0
1
2
3
4
5
Jul-08 Oct-08 Jan-09 Ap r-09 Jul-09 Oct-09 Jan -10 Apr-10 Jul-10 Oct-10
Yield Spreads 1/ (10Y - 1Y Bond Yields, in percent)
Brazil Indonesia Korea
South Africa Thailand Turkey
Source: Bloomberg.1/ Shaded area represents most recent wave of capital inflows.
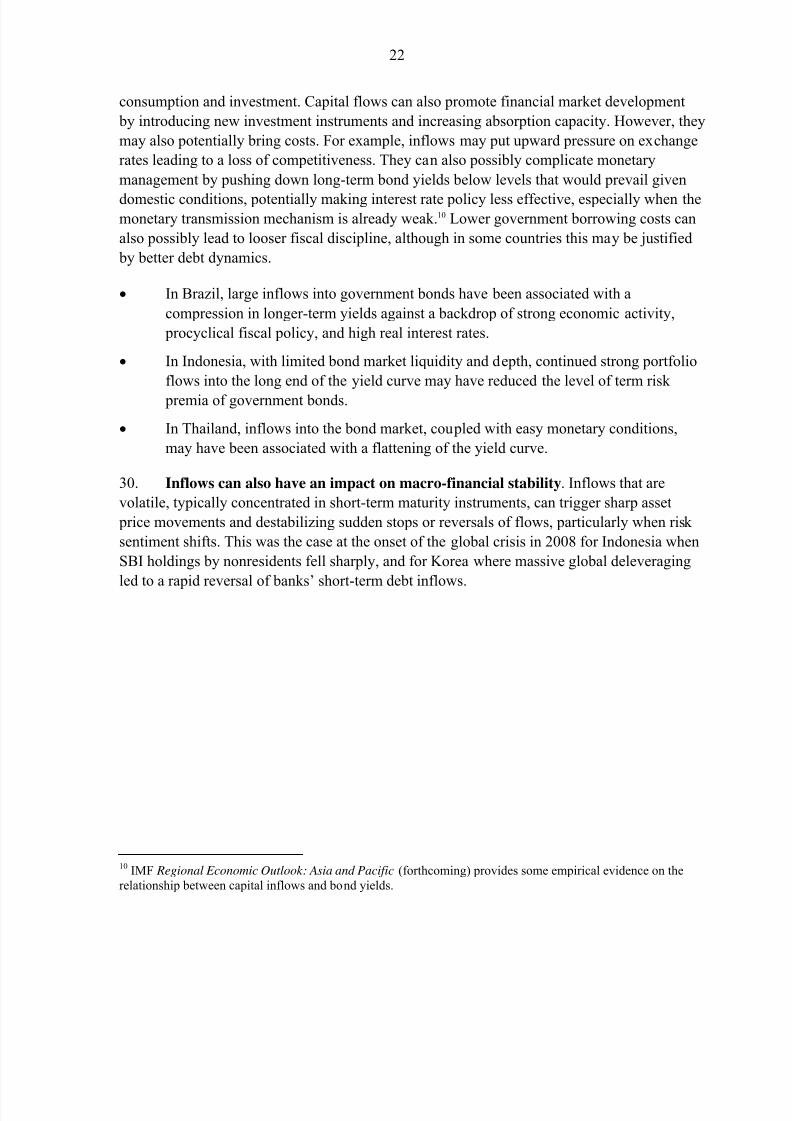
31. The recent surge in inflows has helped
propel stock and bond prices in some
countries. It is difficult to separate the impact
of capital inflows versus, for example, rapidly
recovering domestic or external demand onasset prices and domestic cyclical conditions.
Stock market indices in Indonesia and Thailand
have now reached their highest levels since the
Asian crisis, having risen in 2010 by about
40 percent (text figure). Peru’s stock market
performance was one of the strongest in 2010,
with equity prices up 60 percent, but this was dominated by strong performance of
commodity- producing companies. Despite large equity inflows, Brazil’s stock prices have
been fairly flat, reflecting larger absorptive capacity for inflows owing to a string of large
corporate IPOs that allowed for increased capitalization without stretching valuation. In fixed
income markets, portfolio flows into government securities have lowered public borrowing
costs by pushing down longer term bond yields (for example in Brazil, Indonesia, Peru,
Thailand, and South Africa; text figure). In Turkey, both prices of equities and government
securities reached historical highs during 2010.
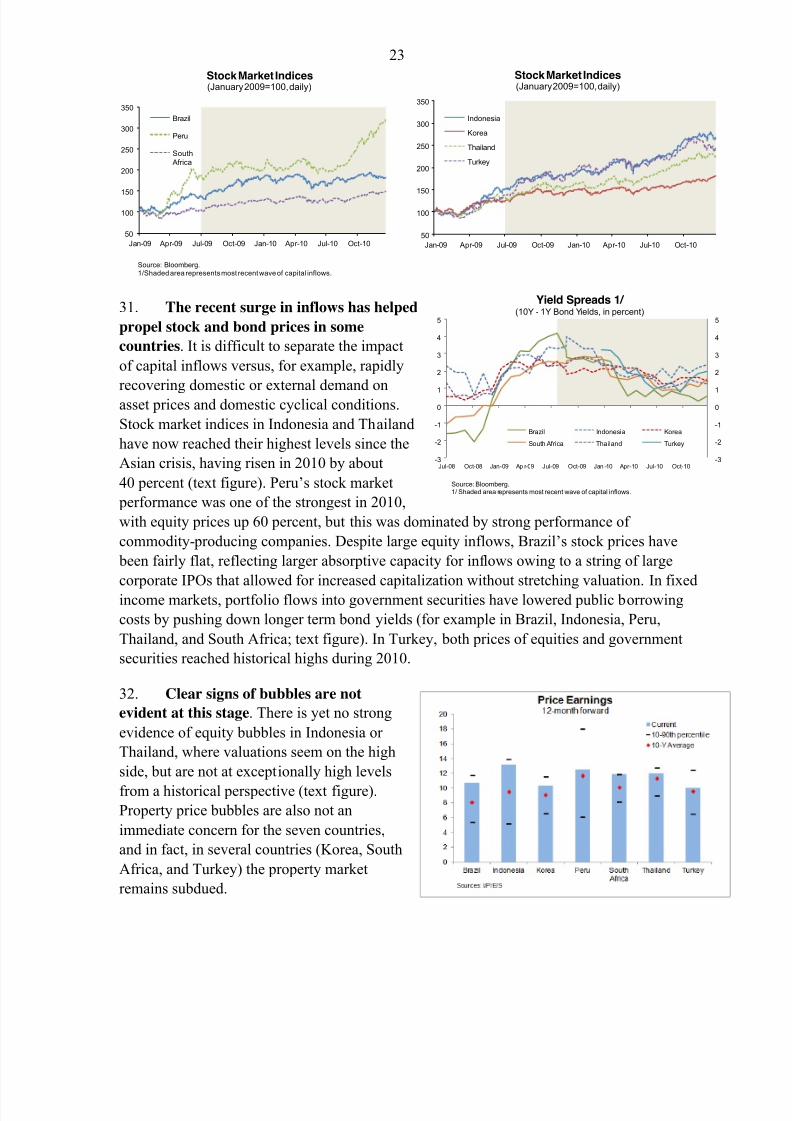
32. Clear signs of bubbles are not
evident at this stage. There is yet no strong
evidence of equity bubbles in Indonesia or
Thailand, where valuations seem on the high
side, but are not at exceptionally high levels
from a historical perspective (text figure).
Property price bubbles are also not an
immediate concern for the seven countries,
and in fact, in several countries (Korea, South
Africa, and Turkey) the property market
remains subdued.
8/2/2019 IMF Ecperiences in Managing Capital Inflows
http://slidepdf.com/reader/full/imf-ecperiences-in-managing-capital-inflows 24/97
24
-5
0
5
10
15
20
25
30
35
2009Q1 2009Q2 2009Q3 2009Q4 2010Q1 2010Q2 2010Q3
Credit to Private Sector(y/y -In p ercent)
Brazil Peru South Af rica
Sources: IMF IFS, CEIC and country authorities.1/ Shaded area represents most recent wave of capital inflows.
-5
0
5
10
15
20
25
30
35
2009Q1 2009Q2 2009Q3 2009Q4 2010Q1 2010Q2 2010Q3
Credit to Private Sector(y/y -In p ercent)
Indonesia Korea Thailand Turkey
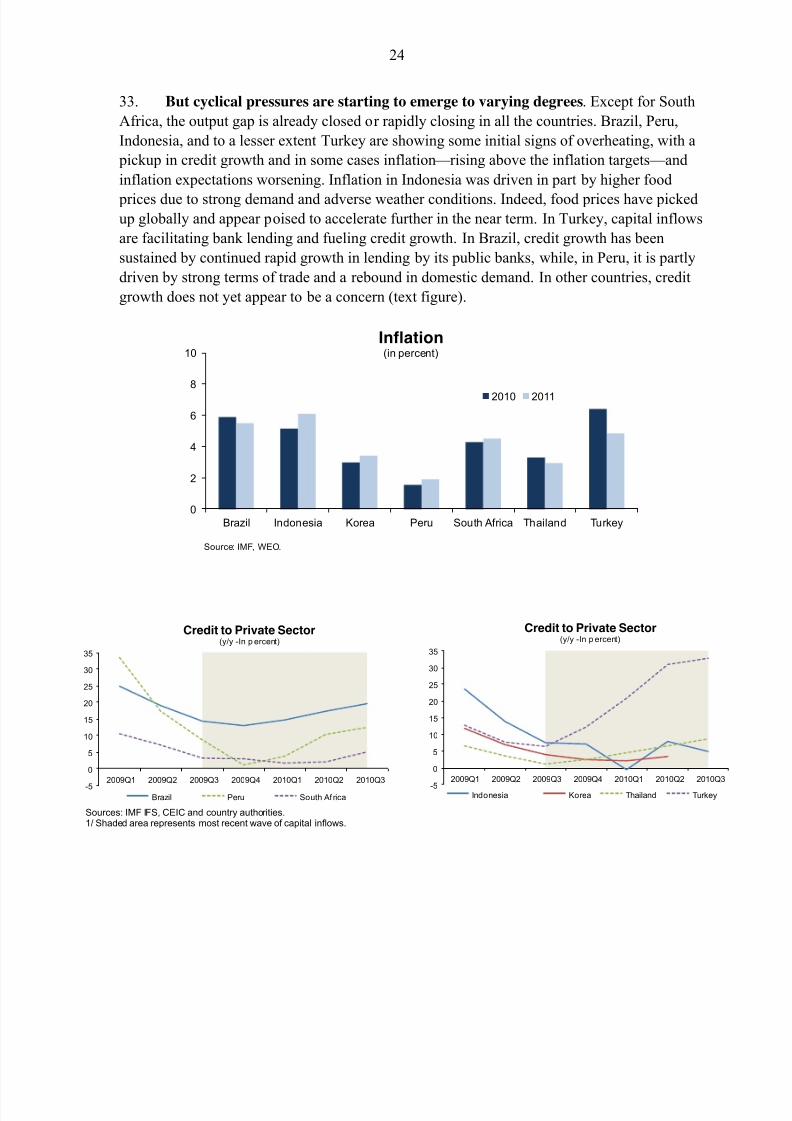
33. But cyclical pressures are starting to emerge to varying degrees. Except for South
Africa, the output gap is already closed or rapidly closing in all the countries. Brazil, Peru,
Indonesia, and to a lesser extent Turkey are showing some initial signs of overheating, with a
pickup in credit growth and in some cases inflation — rising above the inflation targets — and
inflation expectations worsening. Inflation in Indonesia was driven in part by higher food
prices due to strong demand and adverse weather conditions. Indeed, food prices have pickedup globally and appear poised to accelerate further in the near term. In Turkey, capital inflows
are facilitating bank lending and fueling credit growth. In Brazil, credit growth has been
sustained by continued rapid growth in lending by its public banks, while, in Peru, it is partly
driven by strong terms of trade and a rebound in domestic demand. In other countries, credit
growth does not yet appear to be a concern (text figure).
0
2
4
6
8
10
Brazil Indonesia Korea Peru South Africa Thailand Turkey
Inflation(in percent)
2010 2011
Source: IMF, WEO.
8/2/2019 IMF Ecperiences in Managing Capital Inflows
http://slidepdf.com/reader/full/imf-ecperiences-in-managing-capital-inflows 25/97
25
Brazil
Peru
South AfricaIndonesia
Korea
Thailand
Turkey
0
5
10
15
20
0 2 4 6 8 10 12 14 16
C h a n g e i n
R E E R ( p e r c e n t )
Change in International Reserves (percent of GDP)
International Reserves and REER(June 2009 - December 2010)
Sources: IMF IFS and INS database.
D. Recent Policy Responses
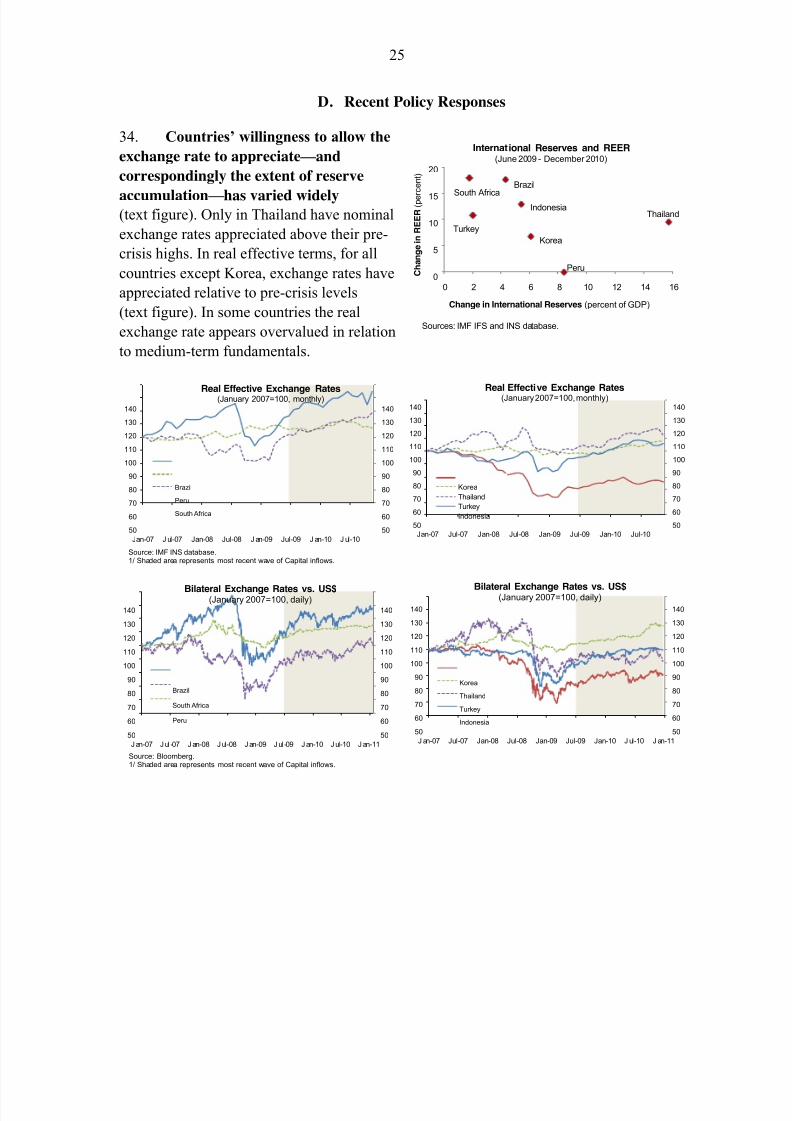
34. Countries’ willingness to allow the
exchange rate to appreciate — and
correspondingly the extent of reserve
accumulation — has varied widely(text figure). Only in Thailand have nominal
exchange rates appreciated above their pre-
crisis highs. In real effective terms, for all
countries except Korea, exchange rates have
appreciated relative to pre-crisis levels
(text figure). In some countries the real
exchange rate appears overvalued in relation
to medium-term fundamentals.
50
60
70
80
90
100
110
120
130
140
50
60
70
80
90
100
110
120
130
140
Jan-07 J ul-07 Jan-08 Jul-08 J an-09 Jul-09 J an-10 J ul-10
Real Effective Exchange Rates(January 2007=100, monthly)
Brazil
Peru
South Africa
Source: IMF INS database.1/ Shaded area represents most recent wave of Capital inflows.
50
60
70
80
90
100
110
120
130
140
50
60
70
80
90
100
110
120
130
140
Jan-07 Jul-07 Jan-08 Jul-08 Jan-09 Jul-09 Jan-10 Jul-10
Real Effective Exchange Rates(January 2007=100, monthly)
Korea
Thailand
Turkey
Indonesia
50
60
70
80
90
100
110
120
130
140
50
60
70
80
90
100
110
120
130
140
Jan-07 Jul -07 Jan-08 Jul-08 Jan-09 Jul -09 Jan-10 Jul-10 Jan-11
Bilateral Exchange Rates vs. US$(January 2007=100, daily)
Brazil
South Africa
Peru
Source: Bloomberg.1/ Shaded area represents most recent wave of Capital inflows.
50
60
70
80
90
100
110
120
130
140
50
60
70
80
90
100
110
120
130
140
J an-07 Jul-07 Jan-08 Jul-08 Jan-09 Jul-09 Jan-10 J ul-10 J an-11
Bilateral Exchange Rates vs. US$(January 2007=100, daily)
Korea
Thailand
Turkey
Indonesia
8/2/2019 IMF Ecperiences in Managing Capital Inflows
http://slidepdf.com/reader/full/imf-ecperiences-in-managing-capital-inflows 26/97
26
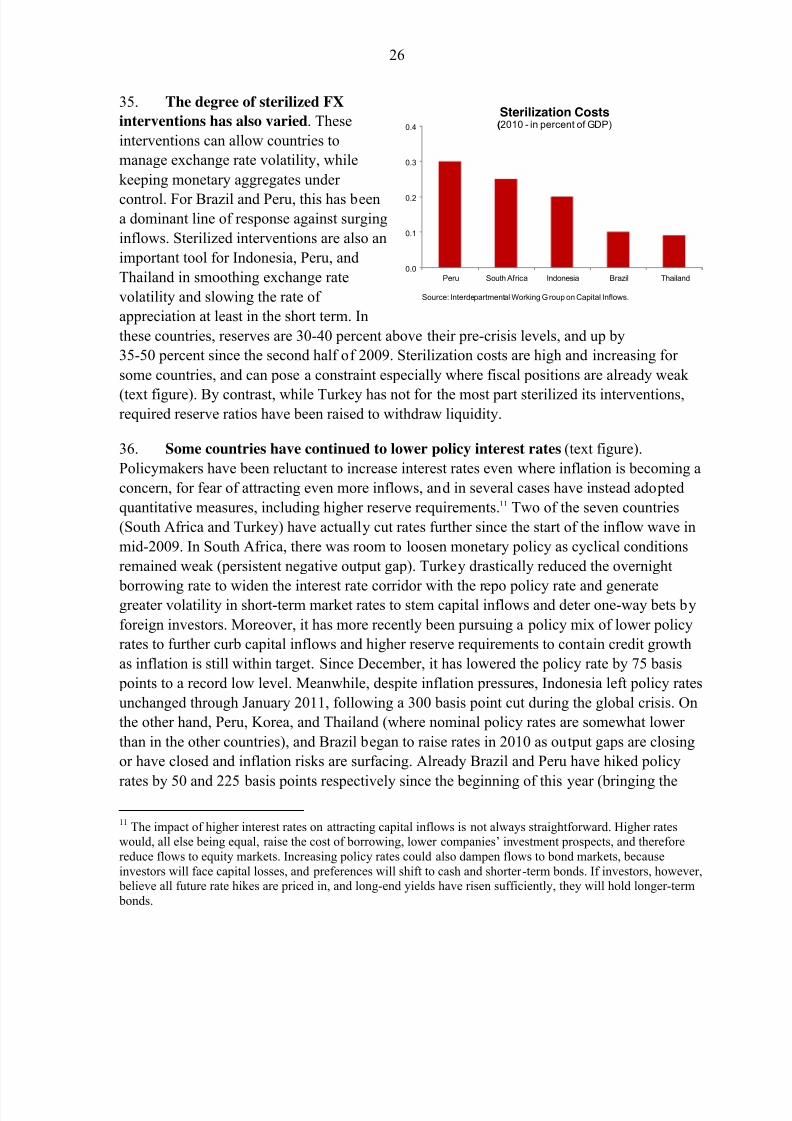
35. The degree of sterilized FX
interventions has also varied. These
interventions can allow countries to
manage exchange rate volatility, while
keeping monetary aggregates under
control. For Brazil and Peru, this has beena dominant line of response against surging
inflows. Sterilized interventions are also an
important tool for Indonesia, Peru, and
Thailand in smoothing exchange rate
volatility and slowing the rate of
appreciation at least in the short term. In
these countries, reserves are 30-40 percent above their pre-crisis levels, and up by
35-50 percent since the second half of 2009. Sterilization costs are high and increasing for
some countries, and can pose a constraint especially where fiscal positions are already weak
(text figure). By contrast, while Turkey has not for the most part sterilized its interventions,required reserve ratios have been raised to withdraw liquidity.
36. Some countries have continued to lower policy interest rates (text figure).
Policymakers have been reluctant to increase interest rates even where inflation is becoming a
concern, for fear of attracting even more inflows, and in several cases have instead adopted
quantitative measures, including higher reserve requirements.11 Two of the seven countries
(South Africa and Turkey) have actually cut rates further since the start of the inflow wave in
mid-2009. In South Africa, there was room to loosen monetary policy as cyclical conditions
remained weak (persistent negative output gap). Turkey drastically reduced the overnight
borrowing rate to widen the interest rate corridor with the repo policy rate and generategreater volatility in short-term market rates to stem capital inflows and deter one-way bets by
foreign investors. Moreover, it has more recently been pursuing a policy mix of lower policy
rates to further curb capital inflows and higher reserve requirements to contain credit growth
as inflation is still within target. Since December, it has lowered the policy rate by 75 basis
points to a record low level. Meanwhile, despite inflation pressures, Indonesia left policy rates
unchanged through January 2011, following a 300 basis point cut during the global crisis. On
the other hand, Peru, Korea, and Thailand (where nominal policy rates are somewhat lower
than in the other countries), and Brazil began to raise rates in 2010 as output gaps are closing
or have closed and inflation risks are surfacing. Already Brazil and Peru have hiked policy
rates by 50 and 225 basis points respectively since the beginning of this year (bringing the
11 The impact of higher interest rates on attracting capital inflows is not always straightforward. Higher rateswould, all else being equal, raise the cost of borrowing, lower companies’ investment prospects, and thereforereduce flows to equity markets. Increasing policy rates could also dampen flows to bond markets, becauseinvestors will face capital losses, and preferences will shift to cash and shorter-term bonds. If investors, however, believe all future rate hikes are priced in, and long-end yields have risen sufficiently, they will hold longer-term bonds.
0.0
0.1
0.2
0.3
0.4
Peru South Africa Indonesia Brazil Thailand
Sterilization Costs(2010 - in percent of GDP)
Source: Interdepartmental Working Group on Capital Inflows.
8/2/2019 IMF Ecperiences in Managing Capital Inflows
http://slidepdf.com/reader/full/imf-ecperiences-in-managing-capital-inflows 27/97
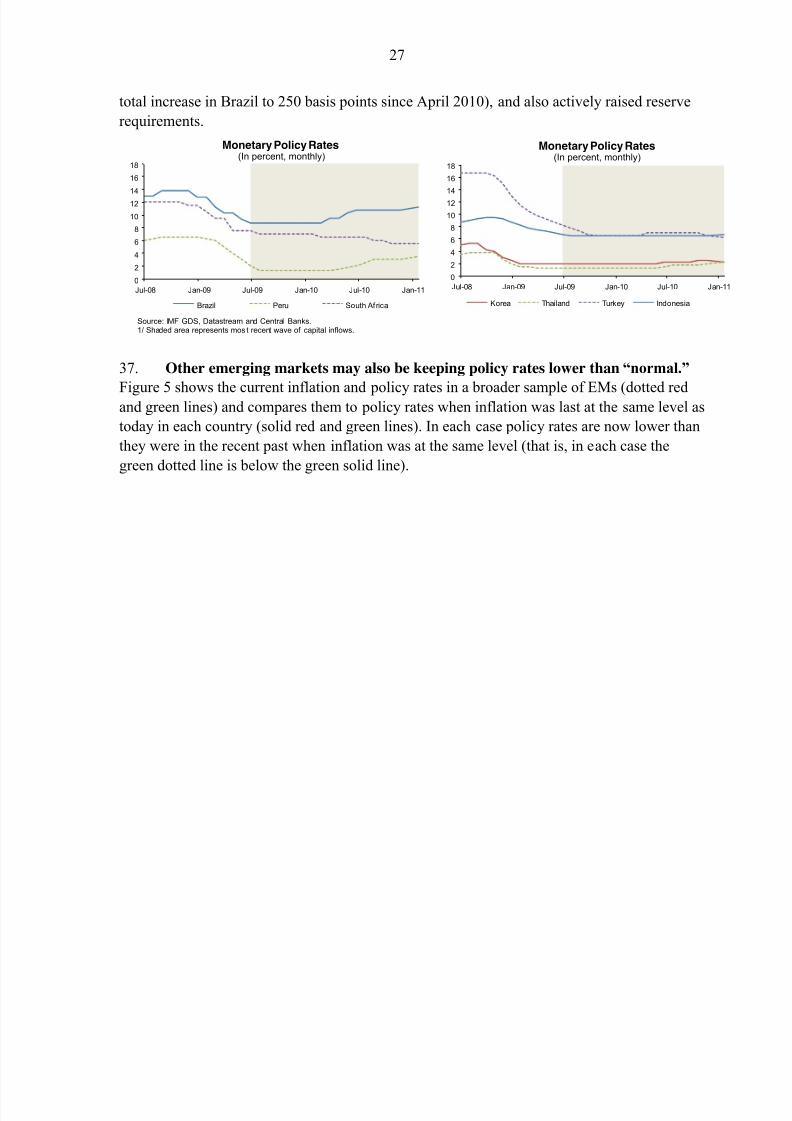
27
total increase in Brazil to 250 basis points since April 2010), and also actively raised reserve
requirements.
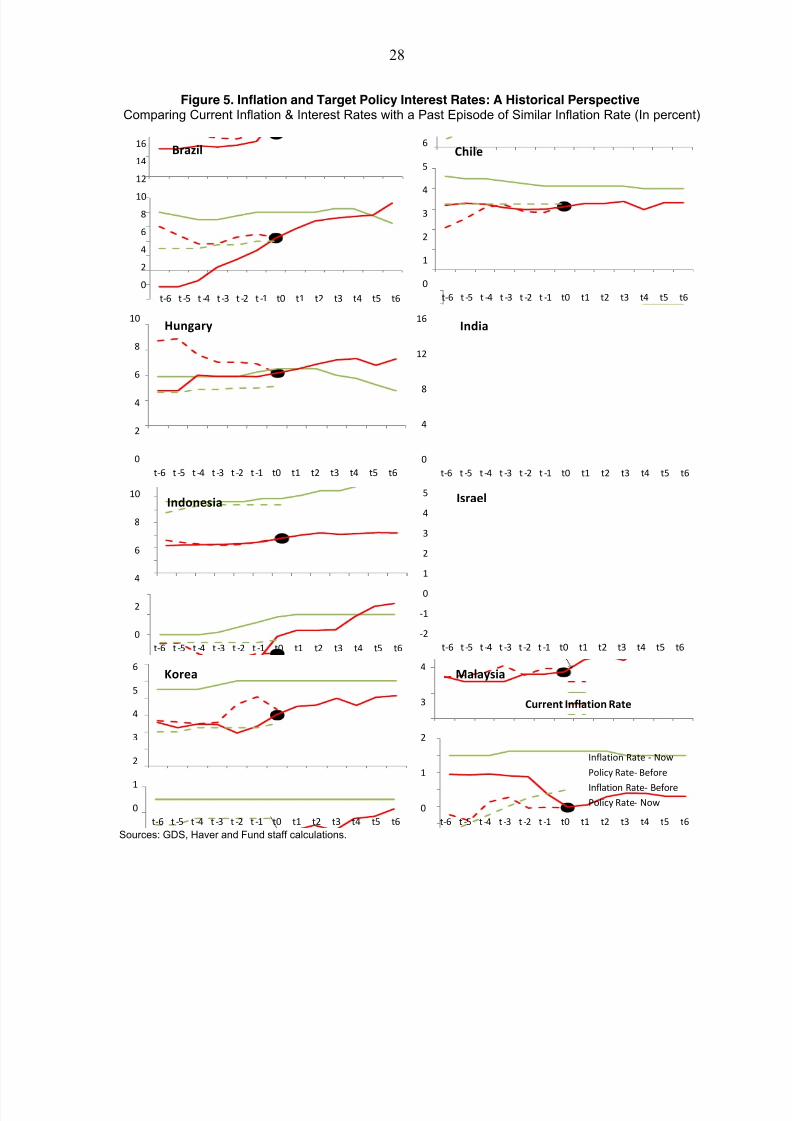
37. Other emerging markets may also be keeping policy rates lower than “normal.”
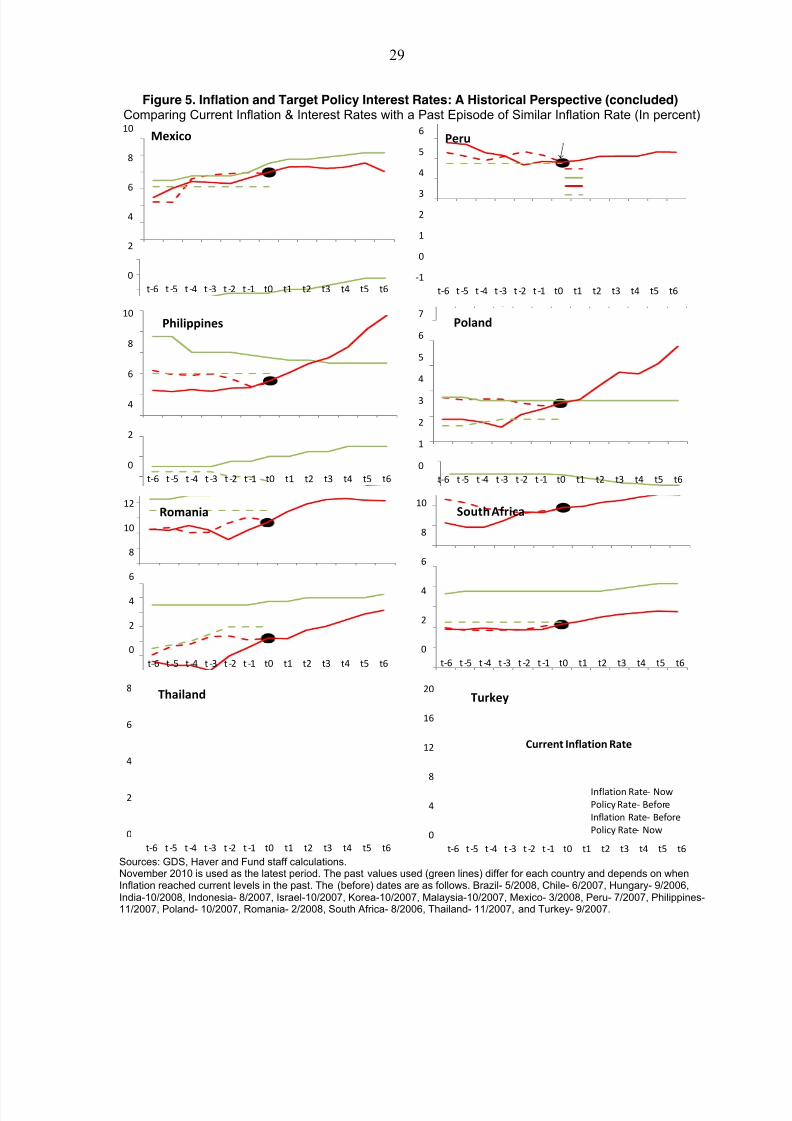
Figure 5 shows the current inflation and policy rates in a broader sample of EMs (dotted redand green lines) and compares them to policy rates when inflation was last at the same level as
today in each country (solid red and green lines). In each case policy rates are now lower than
they were in the recent past when inflation was at the same level (that is, in each case the
green dotted line is below the green solid line).
0
2
4
6
8
10
12
14
16
18
Jul-08 Jan-09 Jul-09 Jan-10 Jul-10 Jan-11
Monetary Policy Rates(In percent, monthly)
Brazil Peru South Africa
Source: IMF GDS, Datastream and Central Banks.1/ Shaded area represents mos t recent wave of capital inflows.
0
2
4
6
8
10
12
14
16
18
Jul-08 Jan-09 Jul-09 Jan-10 Jul-10 Jan-11
Monetary Policy Rates(In percent, monthly)
Korea Thailand Turkey Indonesia
8/2/2019 IMF Ecperiences in Managing Capital Inflows
http://slidepdf.com/reader/full/imf-ecperiences-in-managing-capital-inflows 28/97
28
Figure 5. Inflation and Target Policy Interest Rates: A Historical PerspectiveComparing Current Inflation & Interest Rates with a Past Episode of Similar Inflation Rate (In percent)
Sources: GDS, Haver and Fund staff calculations.
0
2
4
6
8
10
12
14
16
t-6 t -5 t -4 t -3 t -2 t -1 t0 t1 t2 t3 t4 t5 t6
Brazil
0
1
2
3
4
5
6
t-6 t -5 t -4 t -3 t -2 t -1 t0 t1 t2 t3 t4 t5 t6
Chile
0
2
4
6
8
10
t-6 t -5 t -4 t -3 t -2 t -1 t0 t1 t2 t3 t4 t5 t6
Hungary
0
2
4
6
8
10
t-6 t -5 t -4 t -3 t -2 t -1 t0 t1 t2 t3 t4 t5 t6
Indonesia
-2
-1
0
1
2
3
4
5
t-6 t -5 t -4 t -3 t -2 t -1 t0 t1 t2 t3 t4 t5 t6
Israel
0
4
8
12
16
t-6 t -5 t -4 t -3 t -2 t -1 t0 t1 t2 t3 t4 t5 t6
India
0
1
2
3
4
5
6
t-6 t -5 t -4 t -3 t -2 t -1 t0 t1 t2 t3 t4 t5 t6
Korea
0
1
2
3
4
t-6 t -5 t -4 t -3 t -2 t -1 t0 t1 t2 t3 t4 t5 t6
Inflation Rate - Now
Policy Rate- Before
Inflation Rate- Before
Policy Rate- Now
Malaysia
Current Inflation Rate
8/2/2019 IMF Ecperiences in Managing Capital Inflows
http://slidepdf.com/reader/full/imf-ecperiences-in-managing-capital-inflows 29/97
29
Figure 5. Inflation and Target Policy Interest Rates: A Historical Perspective (concluded)Comparing Current Inflation & Interest Rates with a Past Episode of Similar Inflation Rate (In percent)
Sources: GDS, Haver and Fund staff calculations.November 2010 is used as the latest period. The past values used (green lines) differ for each country and depends on whenInflation reached current levels in the past. The (before) dates are as follows. Brazil- 5/2008, Chile- 6/2007, Hungary- 9/2006,India-10/2008, Indonesia- 8/2007, Israel-10/2007, Korea-10/2007, Malaysia-10/2007, Mexico- 3/2008, Peru- 7/2007, Philippines-11/2007, Poland- 10/2007, Romania- 2/2008, South Africa- 8/2006, Thailand- 11/2007, and Turkey- 9/2007.
0
2
4
6
8
10
t-6 t -5 t -4 t -3 t -2 t -1 t0 t1 t2 t3 t4 t5 t6
Mexico
-1
0
1
2
3
4
5
6
t-6 t -5 t -4 t -3 t -2 t -1 t0 t1 t2 t3 t4 t5 t6
Peru
0
2
4
6
8
10
t-6 t -5 t -4 t -3 t -2 t -1 t0 t1 t2 t3 t4 t5 t6
Philippines
0
1
2
3
4
5
6
7
t-6 t -5 t -4 t -3 t -2 t -1 t0 t1 t2 t3 t4 t5 t6
Poland
0
2
4
6
8
t-6 t -5 t -4 t -3 t -2 t -1 t0 t1 t2 t3 t4 t5 t6
Thailand
0
2
4
6
8
10
12
t-6 t -5 t -4 t -3 t -2 t -1 t0 t1 t2 t3 t4 t5 t6
Romania
0
2
4
6
8
10
t-6 t -5 t -4 t -3 t -2 t -1 t0 t1 t2 t3 t4 t5 t6
South Africa
0
4
8
12
16
20
t-6 t -5 t -4 t -3 t -2 t -1 t0 t1 t2 t3 t4 t5 t6
Inflation Rate- Now
Policy Rate- Before
Inflation Rate- Before
Policy Rate- Now
Turkey
Current Inflation Rate
8/2/2019 IMF Ecperiences in Managing Capital Inflows
http://slidepdf.com/reader/full/imf-ecperiences-in-managing-capital-inflows 30/97
30
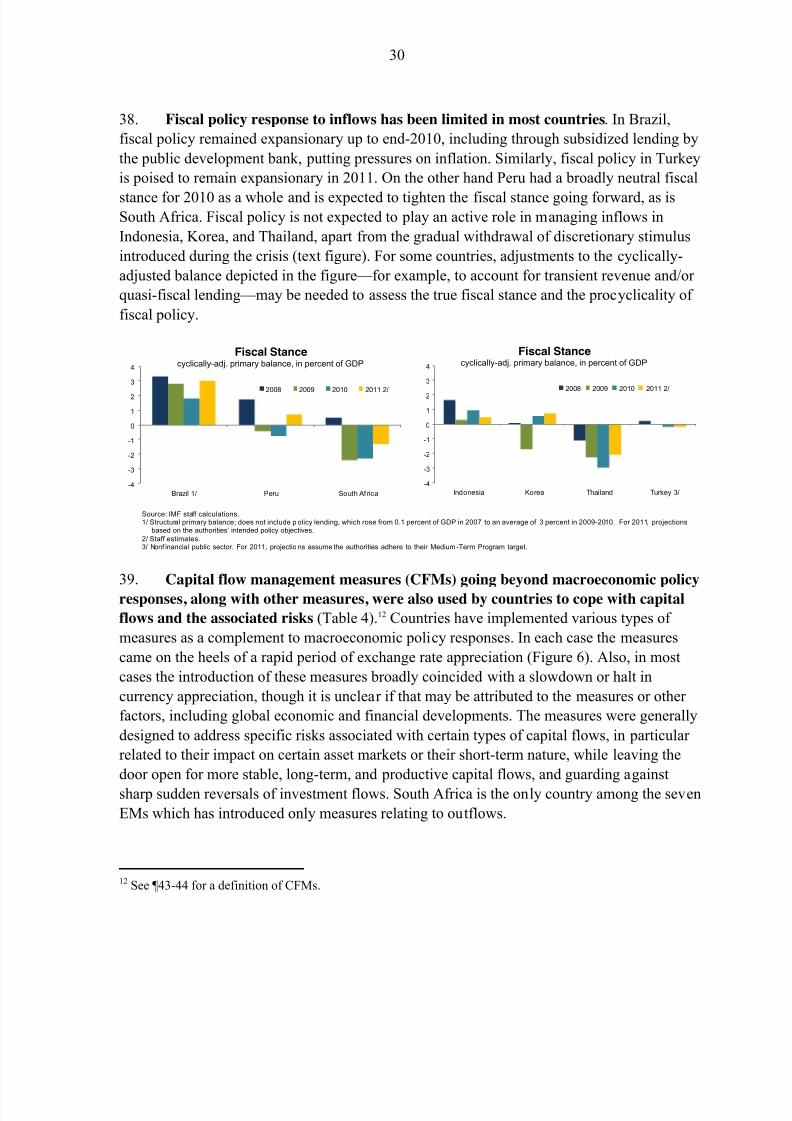
38. Fiscal policy response to inflows has been limited in most countries. In Brazil,
fiscal policy remained expansionary up to end-2010, including through subsidized lending by
the public development bank, putting pressures on inflation. Similarly, fiscal policy in Turkey
is poised to remain expansionary in 2011. On the other hand Peru had a broadly neutral fiscal
stance for 2010 as a whole and is expected to tighten the fiscal stance going forward, as isSouth Africa. Fiscal policy is not expected to play an active role in managing inflows in
Indonesia, Korea, and Thailand, apart from the gradual withdrawal of discretionary stimulus
introduced during the crisis (text figure). For some countries, adjustments to the cyclically-
adjusted balance depicted in the figure — for example, to account for transient revenue and/or
quasi-fiscal lending — may be needed to assess the true fiscal stance and the procyclicality of
fiscal policy.
39. Capital flow management measures (CFMs) going beyond macroeconomic policy
responses, along with other measures, were also used by countries to cope with capital
flows and the associated risks (Table 4).12 Countries have implemented various types of
measures as a complement to macroeconomic policy responses. In each case the measures
came on the heels of a rapid period of exchange rate appreciation (Figure 6). Also, in most
cases the introduction of these measures broadly coincided with a slowdown or halt in
currency appreciation, though it is unclear if that may be attributed to the measures or other
factors, including global economic and financial developments. The measures were generally
designed to address specific risks associated with certain types of capital flows, in particular
related to their impact on certain asset markets or their short-term nature, while leaving the
door open for more stable, long-term, and productive capital flows, and guarding against
sharp sudden reversals of investment flows. South Africa is the only country among the seven
EMs which has introduced only measures relating to outflows.
12 See ¶43-44 for a definition of CFMs.
-4
-3
-2
-1
0
1
2
3
4
Brazil 1/ Peru South Af rica
Fiscal Stancecyclically-adj. primary balance, in percent of GDP
2008 2009 2010 2011 2/
-4
-3
-2
-1
0
1
2
3
4
Indonesia Korea Thailand Turkey 3/
Fiscal Stancecyclically-adj. primary balance, in percent of GDP
2008 2009 2010 2011 2/
Source: IMF staff calculations.1/ Structural primary balance; does not include p olicy lending, which rose from 0.1 percent of GDP in 2007 to an average of 3 percent in 2009-2010. For 2011, projections
based on the authorities’ intended policy objectives.
2/ Staff estimates.3/ Nonf inancial public sector. For 2011, projectio ns assume the authorities adhere to their Medium -Term Program target.
8/2/2019 IMF Ecperiences in Managing Capital Inflows
http://slidepdf.com/reader/full/imf-ecperiences-in-managing-capital-inflows 31/97
31
In the face of rapid exchange rate appreciation, Brazil reinstated the tax on portfolio
inflows (IOFs) in October 2009 to discourage carry trade and increased it twice on
debt inflows in October 2010, when it also extended it to cover margin requirements in
derivatives transactions. In January 2011, it imposed reserve requirements on banks’
short FX positions in the cash market.13 While Brazil’s IOF reduced after -tax returns,
its effectiveness in alleviating appreciation pressures has been limited, at least relativeto the level of the exchange rate at the time of its introduction (Box 2). This was in
part due to the fact that the original design of the IOF provided for a lower tax
incidence on currency positions taken by nonresidents via the domestic futures
markets. Thus, in response to the tax, nonresidents’ positions in these markets
increased, matched by an increase in short FX positions in the spot market by resident
banks. The recent introduction of a reserve requirement on banks’ FX short positions
is expected to constrain this channel while reducing potential vulnerabilities in the
banking sector, and may intensify the effect of the IOF by effectively raising the
incidence of the tax on derivatives transactions.
Also faced with rapid capital inflows, upward pressure on the exchange rate, and
prudential considerations, Peru introduced a wide range of measures. In July 2010, it
implemented additional capital requirements for FX credit risk exposure. In August,
the fee on nonresident purchase of central bank paper (CDs) was increased to 4 percent
which virtually closed this investment option to nonresidents and shifted interest to
longer-term government bonds. In September, reserve requirements on deposits were
raised, including a 120 percent reserve requirement for nonresidents’ deposits in local
currency. The highly restrictive reserve requirements and active intervention have
helped maintain low exchange rate volatility and restrain credit growth. However, the
limits on banks’ net FX position are not expected to have much impact, as banks arecurrently within the limits.
13 Banks with short spot dollar positions above US$3 billion or Tier I capital will be required to deposit60 percent of the excess position in reserves at zero remuneration at the central bank.
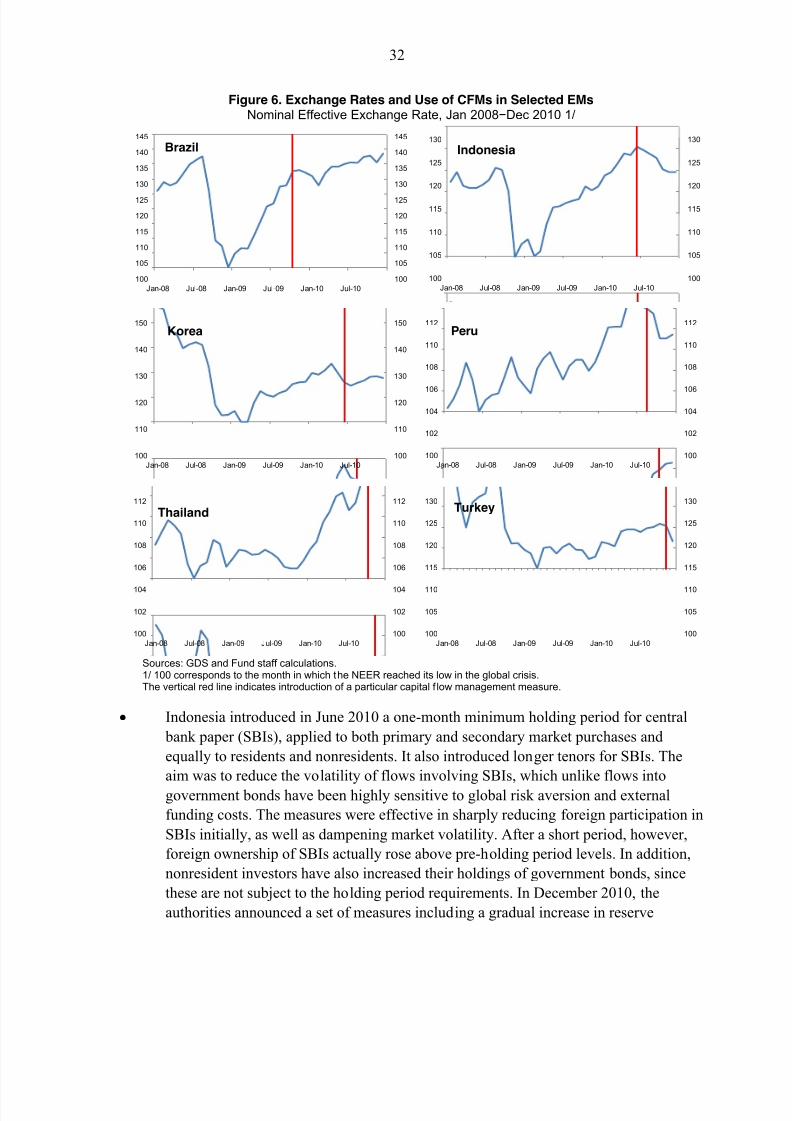
8/2/2019 IMF Ecperiences in Managing Capital Inflows
http://slidepdf.com/reader/full/imf-ecperiences-in-managing-capital-inflows 32/97
32
Figure 6. Exchange Rates and Use of CFMs in Selected EMsNominal Effective Exchange Rate, Jan 2008−Dec 2010 1/
Sources: GDS and Fund staff calculations.1/ 100 corresponds to the month in which the NEER reached its low in the global crisis.The vertical red line indicates introduction of a particular capital f low management measure.
Indonesia introduced in June 2010 a one-month minimum holding period for central
bank paper (SBIs), applied to both primary and secondary market purchases and
equally to residents and nonresidents. It also introduced longer tenors for SBIs. The
aim was to reduce the volatility of flows involving SBIs, which unlike flows into
government bonds have been highly sensitive to global risk aversion and external
funding costs. The measures were effective in sharply reducing foreign participation in
SBIs initially, as well as dampening market volatility. After a short period, however,
foreign ownership of SBIs actually rose above pre-holding period levels. In addition,
nonresident investors have also increased their holdings of government bonds, since
these are not subject to the holding period requirements. In December 2010, the
authorities announced a set of measures including a gradual increase in reserve
100
105
110
115
120
125
130
135
140
145
100
105
110
115
120
125
130
135
140
145
Jan-08 Jul-08 Jan-09 Jul-09 Jan-10 Jul-10
Brazil
100
105
110
115
120
125
130
100
105
110
115
120
125
130
Jan-08 Jul-08 Jan-09 Jul-09 Jan-10 Jul-10
Indonesia
100
110
120
130
140
150
100
110
120
130
140
150
Jan-08 Jul-08 Jan-09 Jul-09 Jan-10 Jul-10
Korea
100
102
104
106
108
110
112
100
102
104
106
108
110
112
Jan-08 Jul-08 Jan-09 Jul-09 Jan-10 Jul-10
Peru
100
102
104
106
108
110
112
100
102
104
106
108
110
112
Jan-08 Jul-08 Jan-09 Jul-09 Jan-10 Jul-10
Thailand
100
105
110
115
120
125
130
100
105
110
115
120
125
130
Jan-08 Jul-08 Jan-09 Jul-09 Jan-10 Jul-10
Turkey
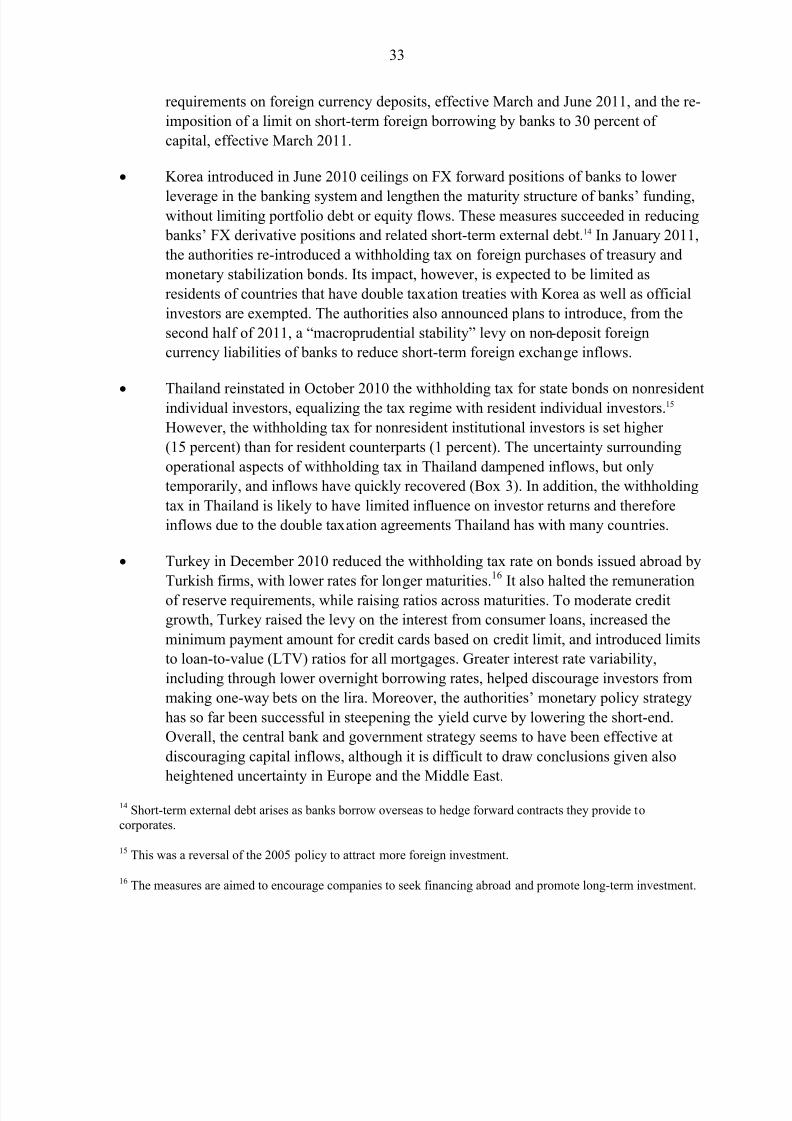
8/2/2019 IMF Ecperiences in Managing Capital Inflows
http://slidepdf.com/reader/full/imf-ecperiences-in-managing-capital-inflows 33/97
33
requirements on foreign currency deposits, effective March and June 2011, and the re-
imposition of a limit on short-term foreign borrowing by banks to 30 percent of
capital, effective March 2011.
Korea introduced in June 2010 ceilings on FX forward positions of banks to lower
leverage in the banking system and lengthen the maturity structure of banks’ funding,without limiting portfolio debt or equity flows. These measures succeeded in reducing
banks’ FX derivative positions and related short-term external debt.14 In January 2011,
the authorities re-introduced a withholding tax on foreign purchases of treasury and
monetary stabilization bonds. Its impact, however, is expected to be limited as
residents of countries that have double taxation treaties with Korea as well as official
investors are exempted. The authorities also announced plans to introduce, from the
second half of 2011, a “macroprudential stability” levy on non-deposit foreign
currency liabilities of banks to reduce short-term foreign exchange inflows.
Thailand reinstated in October 2010 the withholding tax for state bonds on nonresidentindividual investors, equalizing the tax regime with resident individual investors.15
However, the withholding tax for nonresident institutional investors is set higher
(15 percent) than for resident counterparts (1 percent). The uncertainty surrounding
operational aspects of withholding tax in Thailand dampened inflows, but only
temporarily, and inflows have quickly recovered (Box 3). In addition, the withholding
tax in Thailand is likely to have limited influence on investor returns and therefore
inflows due to the double taxation agreements Thailand has with many countries.
Turkey in December 2010 reduced the withholding tax rate on bonds issued abroad by
Turkish firms, with lower rates for longer maturities.16 It also halted the remuneration
of reserve requirements, while raising ratios across maturities. To moderate credit
growth, Turkey raised the levy on the interest from consumer loans, increased the
minimum payment amount for credit cards based on credit limit, and introduced limits
to loan-to-value (LTV) ratios for all mortgages. Greater interest rate variability,
including through lower overnight borrowing rates, helped discourage investors from
making one-way bets on the lira. Moreover, the authorities’ monetary policy strategy
has so far been successful in steepening the yield curve by lowering the short-end.
Overall, the central bank and government strategy seems to have been effective at
discouraging capital inflows, although it is difficult to draw conclusions given also
heightened uncertainty in Europe and the Middle East.
14 Short-term external debt arises as banks borrow overseas to hedge forward contracts they provide tocorporates.
15 This was a reversal of the 2005 policy to attract more foreign investment.
16 The measures are aimed to encourage companies to seek financing abroad and promote long-term investment.
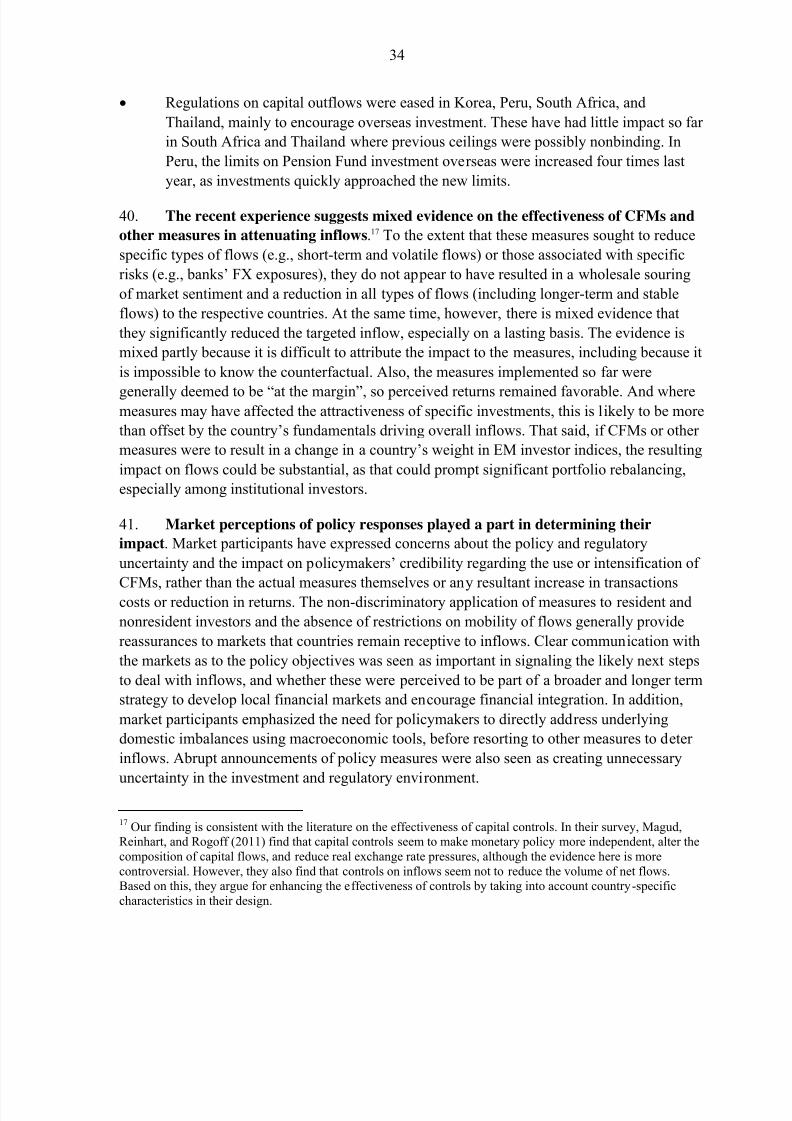
8/2/2019 IMF Ecperiences in Managing Capital Inflows
http://slidepdf.com/reader/full/imf-ecperiences-in-managing-capital-inflows 34/97
34
Regulations on capital outflows were eased in Korea, Peru, South Africa, and
Thailand, mainly to encourage overseas investment. These have had little impact so far
in South Africa and Thailand where previous ceilings were possibly nonbinding. In
Peru, the limits on Pension Fund investment overseas were increased four times last
year, as investments quickly approached the new limits.
40. The recent experience suggests mixed evidence on the effectiveness of CFMs and
other measures in attenuating inflows.17 To the extent that these measures sought to reduce
specific types of flows (e.g., short-term and volatile flows) or those associated with specific
risks (e.g., banks’ FX exposures), they do not appear to have resulted in a wholesale souring
of market sentiment and a reduction in all types of flows (including longer-term and stable
flows) to the respective countries. At the same time, however, there is mixed evidence that
they significantly reduced the targeted inflow, especially on a lasting basis. The evidence is
mixed partly because it is difficult to attribute the impact to the measures, including because it
is impossible to know the counterfactual. Also, the measures implemented so far were
generally deemed to be “at the margin”, so perceived returns remained favorable. And wheremeasures may have affected the attractiveness of specific investments, this is likely to be more
than offset by the country’s fundamentals driving overall inflows. That said, if CFMs or other
measures were to result in a change in a country’s weight in EM investor indices, the resulting
impact on flows could be substantial, as that could prompt significant portfolio rebalancing,
especially among institutional investors.
41. Market perceptions of policy responses played a part in determining their
impact. Market participants have expressed concerns about the policy and regulatory
uncertainty and the impact on policymakers’ credibility regarding the use or intensification of
CFMs, rather than the actual measures themselves or any resultant increase in transactionscosts or reduction in returns. The non-discriminatory application of measures to resident and
nonresident investors and the absence of restrictions on mobility of flows generally provide
reassurances to markets that countries remain receptive to inflows. Clear communication with
the markets as to the policy objectives was seen as important in signaling the likely next steps
to deal with inflows, and whether these were perceived to be part of a broader and longer term
strategy to develop local financial markets and encourage financial integration. In addition,
market participants emphasized the need for policymakers to directly address underlying
domestic imbalances using macroeconomic tools, before resorting to other measures to deter
inflows. Abrupt announcements of policy measures were also seen as creating unnecessary
uncertainty in the investment and regulatory environment.
17 Our finding is consistent with the literature on the effectiveness of capital controls. In their survey, Magud,Reinhart, and Rogoff (2011) find that capital controls seem to make monetary policy more independent, alter thecomposition of capital flows, and reduce real exchange rate pressures, although the evidence here is morecontroversial. However, they also find that controls on inflows seem not to reduce the volume of net flows.Based on this, they argue for enhancing the effectiveness of controls by taking into account country-specificcharacteristics in their design.
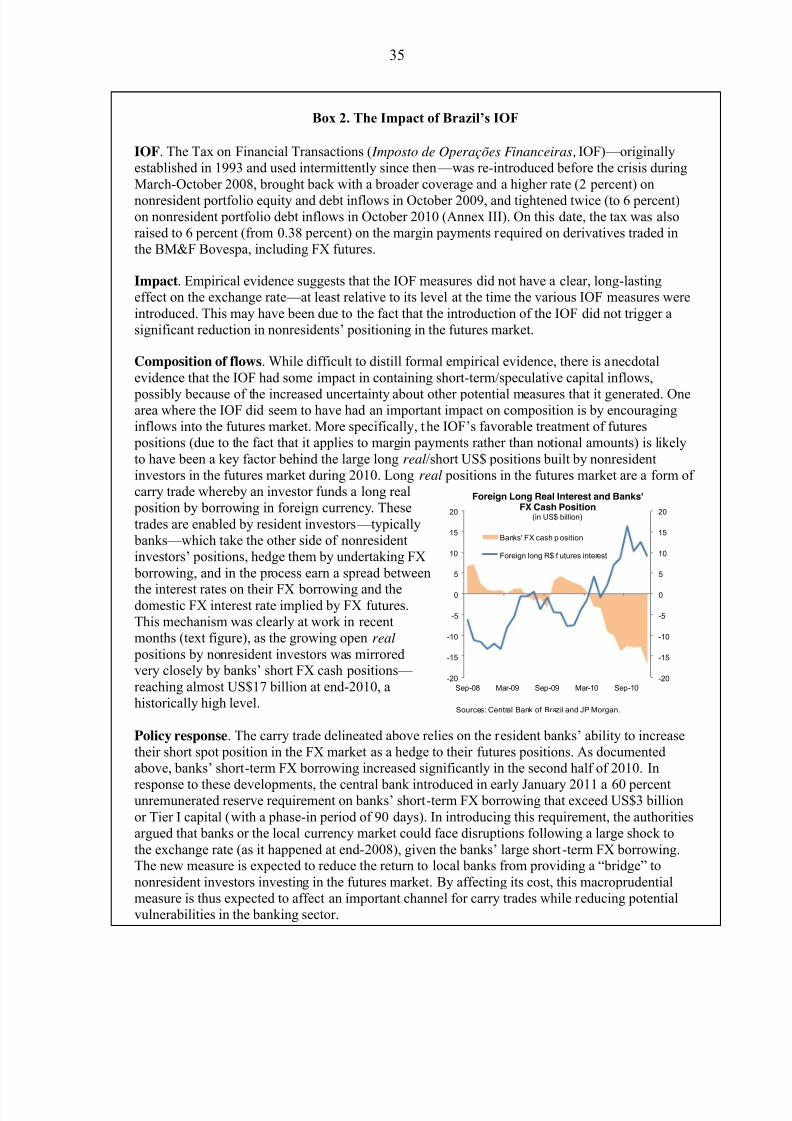
8/2/2019 IMF Ecperiences in Managing Capital Inflows
http://slidepdf.com/reader/full/imf-ecperiences-in-managing-capital-inflows 35/97
35
Box 2. The Impact of Brazil’s IOF
IOF. The Tax on Financial Transactions ( Imposto de Operações Financeiras, IOF) — originallyestablished in 1993 and used intermittently since then — was re-introduced before the crisis duringMarch-October 2008, brought back with a broader coverage and a higher rate (2 percent) on
nonresident portfolio equity and debt inflows in October 2009, and tightened twice (to 6 percent)on nonresident portfolio debt inflows in October 2010 (Annex III). On this date, the tax was alsoraised to 6 percent (from 0.38 percent) on the margin payments required on derivatives traded inthe BM&F Bovespa, including FX futures.
Impact. Empirical evidence suggests that the IOF measures did not have a clear, long-lastingeffect on the exchange rate — at least relative to its level at the time the various IOF measures wereintroduced. This may have been due to the fact that the introduction of the IOF did not trigger asignificant reduction in nonresidents’ positioning in the futures market.
Composition of flows. While difficult to distill formal empirical evidence, there is anecdotalevidence that the IOF had some impact in containing short-term/speculative capital inflows,
possibly because of the increased uncertainty about other potential measures that it generated. Onearea where the IOF did seem to have had an important impact on composition is by encouraginginflows into the futures market. More specifically, the IOF’s favorable treatment of futures positions (due to the fact that it applies to margin payments rather than notional amounts) is likelyto have been a key factor behind the large long real/short US$ positions built by nonresidentinvestors in the futures market during 2010. Long real positions in the futures market are a form of carry trade whereby an investor funds a long real position by borrowing in foreign currency. Thesetrades are enabled by resident investors — typically banks — which take the other side of nonresidentinvestors’ positions, hedge them by undertaking FX borrowing, and in the process earn a spread between
the interest rates on their FX borrowing and thedomestic FX interest rate implied by FX futures.This mechanism was clearly at work in recentmonths (text figure), as the growing open real positions by nonresident investors was mirroredvery closely by banks’ short FX cash positions— reaching almost US$17 billion at end-2010, ahistorically high level.
Policy response. The carry trade delineated above relies on the resident banks’ ability to increasetheir short spot position in the FX market as a hedge to their futures positions. As documentedabove, banks’ short-term FX borrowing increased significantly in the second half of 2010. In
response to these developments, the central bank introduced in early January 2011 a 60 percentunremunerated reserve requirement on banks’ short-term FX borrowing that exceed US$3 billionor Tier I capital (with a phase-in period of 90 days). In introducing this requirement, the authoritiesargued that banks or the local currency market could face disruptions following a large shock tothe exchange rate (as it happened at end-2008), given the banks’ large short-term FX borrowing.The new measure is expected to reduce the return to local banks from providing a “bridge” tononresident investors investing in the futures market. By affecting its cost, this macroprudentialmeasure is thus expected to affect an important channel for carry trades while reducing potentialvulnerabilities in the banking sector.
-20
-15
-10
-5
0
5
10
15
20
-20
-15
-10
-5
0
5
10
15
20
Sep-08 Mar-09 Sep-09 Mar-10 Sep-10
Foreign Long Real Interest and Banks'FX Cash Position
(in US$ billion)
Banks' FX cash p osition
Foreign long R$ f utures interest
Sources: Central Bank of Brazil and JP Morgan.
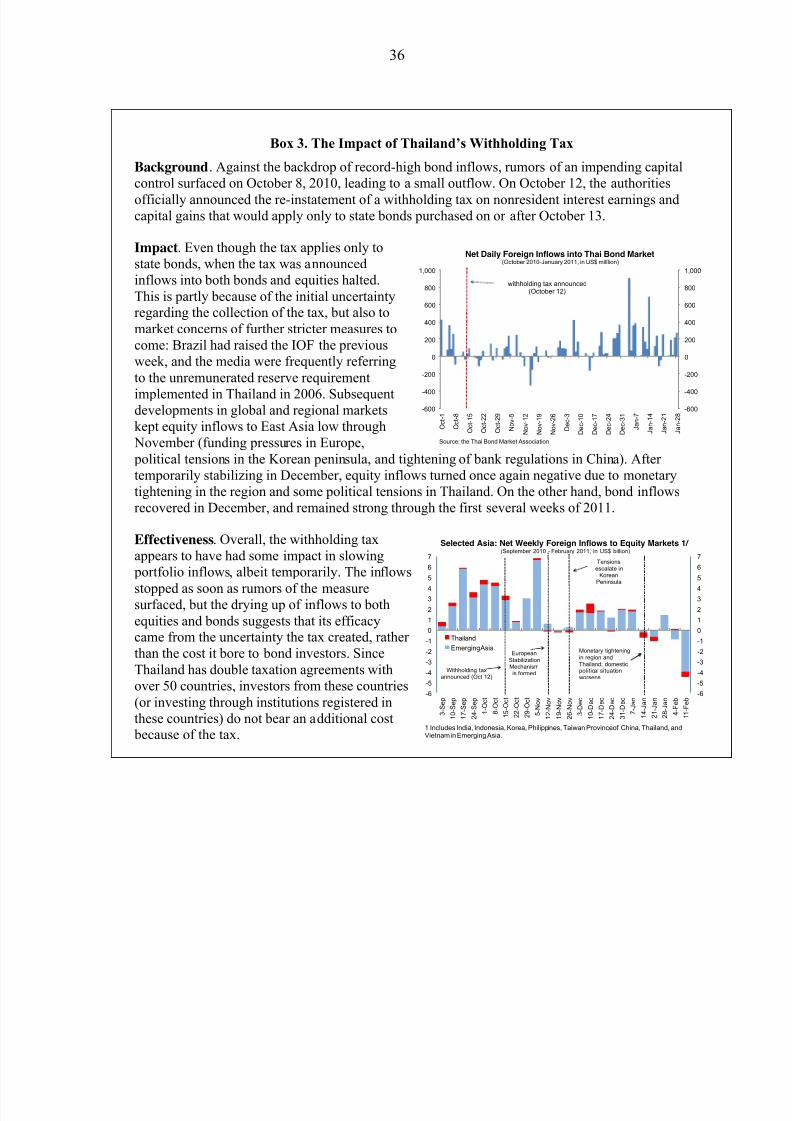
8/2/2019 IMF Ecperiences in Managing Capital Inflows
http://slidepdf.com/reader/full/imf-ecperiences-in-managing-capital-inflows 36/97
36
-600
-400
-200
0
200
400
600
800
1,000
-600
-400
-200
0
200
400
600
800
1,000
O c t - 1
O c t - 8
O c t - 1 5
O c t - 2 2
O c t - 2 9
N o v - 5
N o v - 1 2
N o v - 1 9
N o v - 2 6
D e c - 3
D e c - 1 0
D e c - 1 7
D e c - 2 4
D e c - 3 1
J a n - 7
J a n - 1 4
J a n - 2 1
J a n - 2 8
Net Daily Foreign Inflows into Thai Bond Market(October 2010-January 2011, in US$ milllion)
withholding tax announced(October 12)
Source: the Thai Bond Market Association
-6
-5
-4
-3
-2
-1
0
1
2
34
5
6
7
-6
-5
-4
-3
-2
-1
0
1
2
34
5
6
7
3 - S e p
1 0 - S e p
1 7 - S e p
2 4 - S e p
1 - O c t
8 - O c t
1 5 - O c t
2 2 - O c t
2 9 - O c t
5 - N o v
1 2 - N o v
1 9 - N o v
2 6 - N o v
3 - D e c
1 0 - D e c
1 7 - D e c
2 4 - D e c
3 1 - D e c
7 - J a n
1 4 - J a n
2 1 - J a n
2 8 - J a n
4 - F e b
1 1 - F e b
Thailand
Emerging Asia
1 Includes India, Indonesia, Korea, Philippines, Taiwan Provinceof China, Thailand, andVietnam in Emerging Asia.
Withholding taxannounced (Oct 12)
EuropeanStabilizationMechanismis formed
Tensionsescalate in
KoreanPeninsula
Monetary tighteningin region andThailand; domesticpolitical situationworsens
Selected Asia: Net Weekly Foreign Inflows to Equity Markets 1/ (September 2010 - February 2011, in US$ billion)
Box 3. The Impact of Thailand’s Withholding Tax
Background. Against the backdrop of record-high bond inflows, rumors of an impending capitalcontrol surfaced on October 8, 2010, leading to a small outflow. On October 12, the authorities
officially announced the re-instatement of a withholding tax on nonresident interest earnings andcapital gains that would apply only to state bonds purchased on or after October 13.
Impact. Even though the tax applies only tostate bonds, when the tax was announcedinflows into both bonds and equities halted.This is partly because of the initial uncertaintyregarding the collection of the tax, but also tomarket concerns of further stricter measures tocome: Brazil had raised the IOF the previousweek, and the media were frequently referringto the unremunerated reserve requirement
implemented in Thailand in 2006. Subsequentdevelopments in global and regional marketskept equity inflows to East Asia low through November (funding pressures in Europe, political tensions in the Korean peninsula, and tightening of bank regulations in China). After temporarily stabilizing in December, equity inflows turned once again negative due to monetarytightening in the region and some political tensions in Thailand. On the other hand, bond inflowsrecovered in December, and remained strong through the first several weeks of 2011.
Effectiveness. Overall, the withholding taxappears to have had some impact in slowing portfolio inflows, albeit temporarily. The inflows
stopped as soon as rumors of the measuresurfaced, but the drying up of inflows to bothequities and bonds suggests that its efficacycame from the uncertainty the tax created, rather than the cost it bore to bond investors. SinceThailand has double taxation agreements withover 50 countries, investors from these countries(or investing through institutions registered inthese countries) do not bear an additional cost because of the tax.
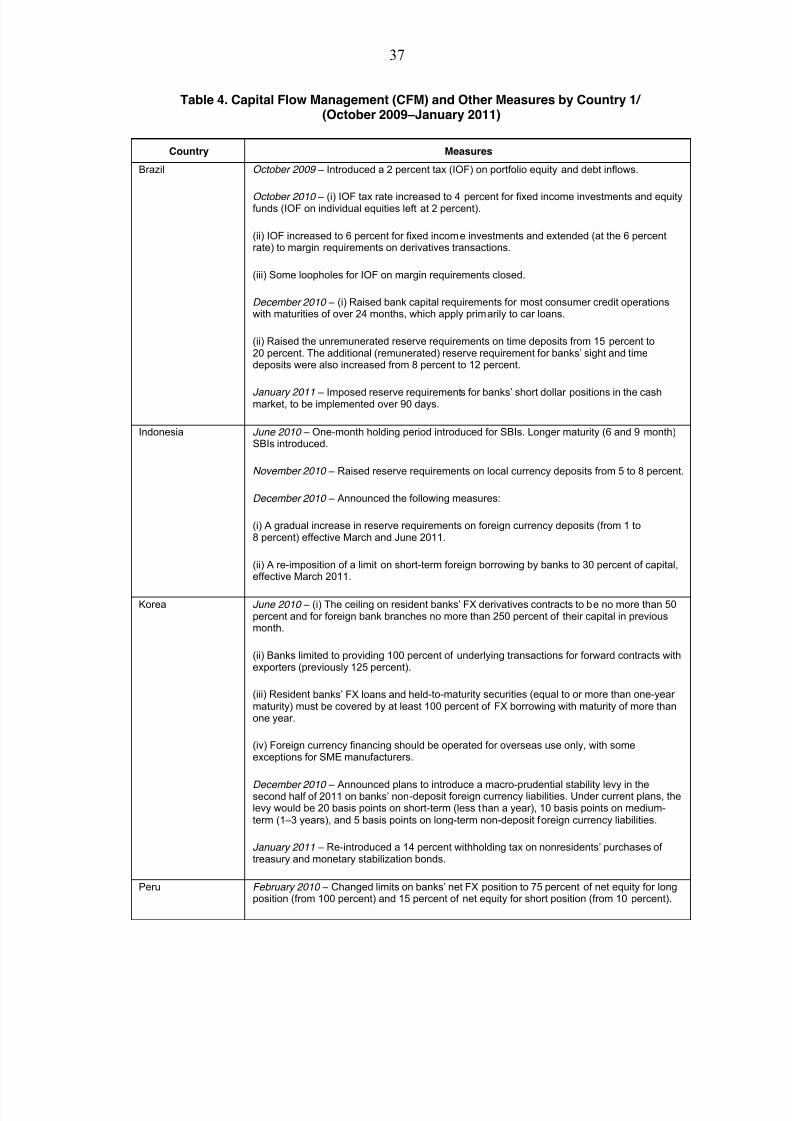
8/2/2019 IMF Ecperiences in Managing Capital Inflows
http://slidepdf.com/reader/full/imf-ecperiences-in-managing-capital-inflows 37/97
37
Table 4. Capital Flow Management (CFM) and Other Measures by Country 1/ (October 2009 –January 2011)
Country Measures
Brazil October 2009 – Introduced a 2 percent tax (IOF) on portfolio equity and debt inflows.
October 2010 – (i) IOF tax rate increased to 4 percent for fixed income investments and equityfunds (IOF on individual equities left at 2 percent).
(ii) IOF increased to 6 percent for fixed income investments and extended (at the 6 percentrate) to margin requirements on derivatives transactions.
(iii) Some loopholes for IOF on margin requirements closed.
December 2010 – (i) Raised bank capital requirements for most consumer credit operationswith maturities of over 24 months, which apply primarily to car loans.
(ii) Raised the unremunerated reserve requirements on time deposits from 15 percent to20 percent. The additional (remunerated) reserve requirement for banks’ sight and timedeposits were also increased from 8 percent to 12 percent.
January 2011 – Imposed reserve requirements for banks’ short dollar positions in the cashmarket, to be implemented over 90 days.
Indonesia June 2010 – One-month holding period introduced for SBIs. Longer maturity (6 and 9 month)SBIs introduced.
November 2010 – Raised reserve requirements on local currency deposits from 5 to 8 percent.
December 2010 – Announced the following measures:
(i) A gradual increase in reserve requirements on foreign currency deposits (from 1 to8 percent) effective March and June 2011.
(ii) A re-imposition of a limit on short-term foreign borrowing by banks to 30 percent of capital,effective March 2011.
Korea June 2010 – (i) The ceiling on resident banks’ FX derivatives contracts to be no more than 50percent and for foreign bank branches no more than 250 percent of their capital in previousmonth.
(ii) Banks limited to providing 100 percent of underlying transactions for forward contracts withexporters (previously 125 percent).
(iii) Resident banks’ FX loans and held-to-maturity securities (equal to or more than one-year maturity) must be covered by at least 100 percent of FX borrowing with maturity of more thanone year.
(iv) Foreign currency financing should be operated for overseas use only, with someexceptions for SME manufacturers.
December 2010 – Announced plans to introduce a macro-prudential stability levy in thesecond half of 2011 on banks’ non-deposit foreign currency liabilities. Under current plans, thelevy would be 20 basis points on short-term (less than a year), 10 basis points on medium-term (1 –3 years), and 5 basis points on long-term non-deposit foreign currency liabilities.
January 2011 – Re-introduced a 14 percent withholding tax on nonresidents’ purchases of treasury and monetary stabilization bonds.
Peru February 2010 – Changed limits on banks’ net FX position to 75 percent of net equity for longposition (from 100 percent) and 15 percent of net equity for short position (from 10 percent).
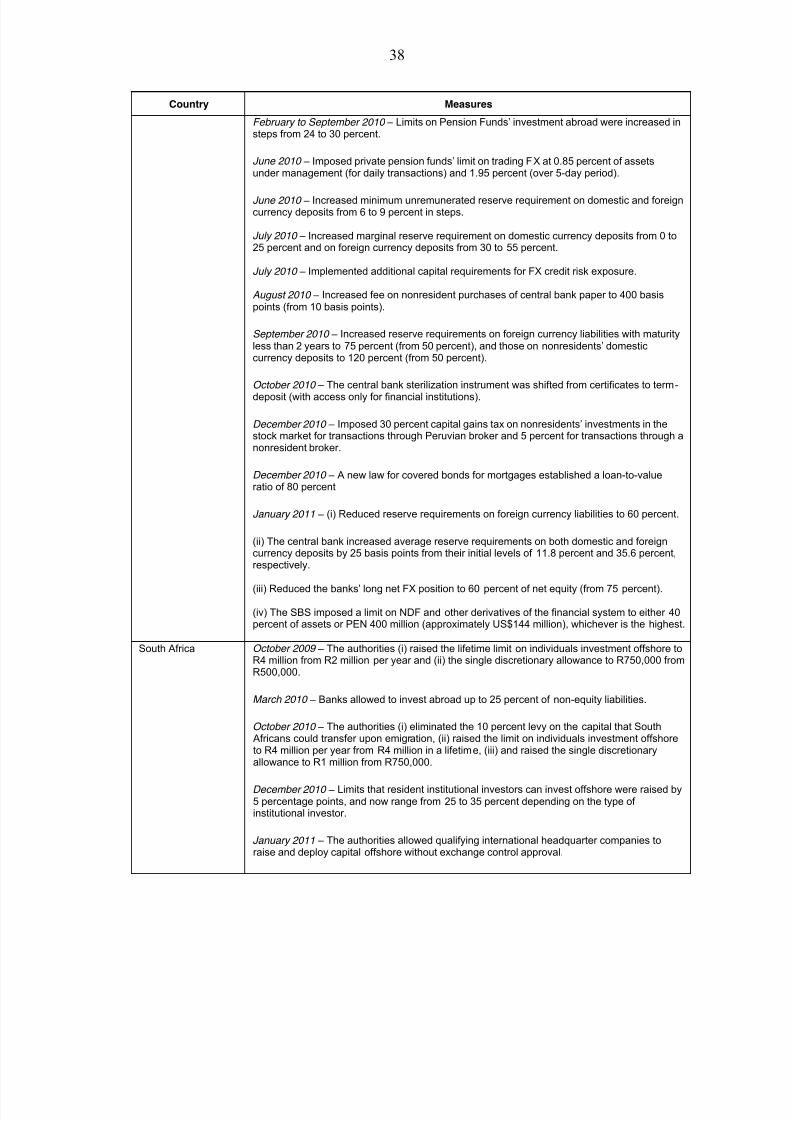
8/2/2019 IMF Ecperiences in Managing Capital Inflows
http://slidepdf.com/reader/full/imf-ecperiences-in-managing-capital-inflows 38/97
38
Country Measures
February to September 2010 – Limits on Pension Funds’ investment abroad were increased insteps from 24 to 30 percent.
June 2010 – Imposed private pension funds’ limit on trading FX at 0.85 percent of assetsunder management (for daily transactions) and 1.95 percent (over 5-day period).
June 2010 – Increased minimum unremunerated reserve requirement on domestic and foreigncurrency deposits from 6 to 9 percent in steps.
July 2010 – Increased marginal reserve requirement on domestic currency deposits from 0 to25 percent and on foreign currency deposits from 30 to 55 percent.
July 2010 – Implemented additional capital requirements for FX credit risk exposure.
August 2010 – Increased fee on nonresident purchases of central bank paper to 400 basispoints (from 10 basis points).
September 2010 – Increased reserve requirements on foreign currency liabilities with maturityless than 2 years to 75 percent (from 50 percent), and those on nonresidents’ domesticcurrency deposits to 120 percent (from 50 percent).
October 2010 – The central bank sterilization instrument was shifted from certificates to term-deposit (with access only for financial institutions).
December 2010 – Imposed 30 percent capital gains tax on nonresidents’ investments in thestock market for transactions through Peruvian broker and 5 percent for transactions through anonresident broker.
December 2010 – A new law for covered bonds for mortgages established a loan-to-valueratio of 80 percent
January 2011 – (i) Reduced reserve requirements on foreign currency liabilities to 60 percent.
(ii) The central bank increased average reserve requirements on both domestic and foreigncurrency deposits by 25 basis points from their initial levels of 11.8 percent and 35.6 percent,respectively.
(iii) Reduced the banks’ long net FX position to 60 percent of net equity (from 75 percent).
(iv) The SBS imposed a limit on NDF and other derivatives of the financial system to either 40percent of assets or PEN 400 million (approximately US$144 million), whichever is the highest.
South Africa October 2009 – The authorities (i) raised the lifetime limit on individuals investment offshore toR4 million from R2 million per year and (ii) the single discretionary allowance to R750,000 fromR500,000.
March 2010 – Banks allowed to invest abroad up to 25 percent of non-equity liabilities.
October 2010 – The authorities (i) eliminated the 10 percent levy on the capital that South Africans could transfer upon emigration, (ii) raised the limit on individuals investment offshoreto R4 million per year from R4 million in a lifetime, (iii) and raised the single discretionaryallowance to R1 million from R750,000.
December 2010 – Limits that resident institutional investors can invest offshore were raised by5 percentage points, and now range from 25 to 35 percent depending on the type of institutional investor.
January 2011 – The authorities allowed qualifying international headquarter companies toraise and deploy capital offshore without exchange control approval.
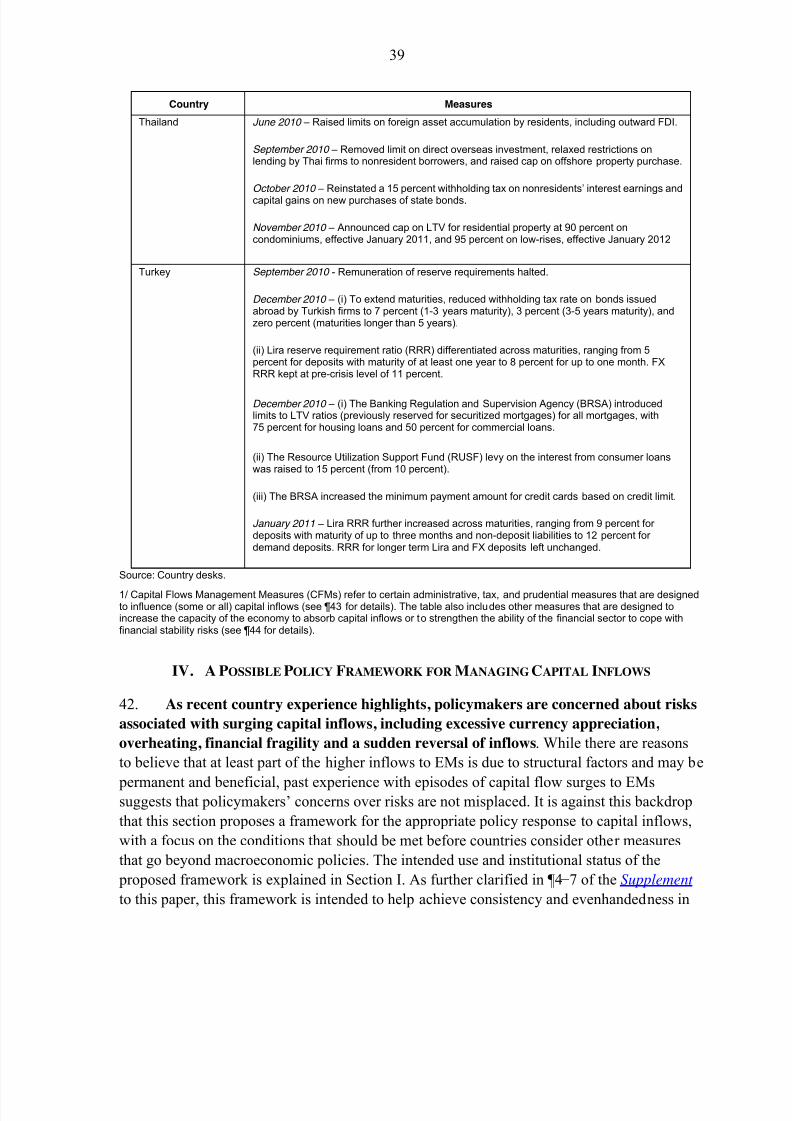
8/2/2019 IMF Ecperiences in Managing Capital Inflows
http://slidepdf.com/reader/full/imf-ecperiences-in-managing-capital-inflows 39/97
39
Country Measures
Thailand June 2010 – Raised limits on foreign asset accumulation by residents, including outward FDI.
September 2010 – Removed limit on direct overseas investment, relaxed restrictions onlending by Thai firms to nonresident borrowers, and raised cap on offshore property purchase.
October 2010 – Reinstated a 15 percent withholding tax on nonresidents’ interest earnings and
capital gains on new purchases of state bonds.
November 2010 – Announced cap on LTV for residential property at 90 percent oncondominiums, effective January 2011, and 95 percent on low-rises, effective January 2012
Turkey September 2010 - Remuneration of reserve requirements halted.
December 2010 – (i) To extend maturities, reduced withholding tax rate on bonds issuedabroad by Turkish firms to 7 percent (1-3 years maturity), 3 percent (3-5 years maturity), andzero percent (maturities longer than 5 years).
(ii) Lira reserve requirement ratio (RRR) differentiated across maturities, ranging from 5percent for deposits with maturity of at least one year to 8 percent for up to one month. FXRRR kept at pre-crisis level of 11 percent.
December 2010 – (i) The Banking Regulation and Supervision Agency (BRSA) introducedlimits to LTV ratios (previously reserved for securitized mortgages) for all mortgages, with75 percent for housing loans and 50 percent for commercial loans.
(ii) The Resource Utilization Support Fund (RUSF) levy on the interest from consumer loanswas raised to 15 percent (from 10 percent).
(iii) The BRSA increased the minimum payment amount for credit cards based on credit limit.
January 2011 – Lira RRR further increased across maturities, ranging from 9 percent for deposits with maturity of up to three months and non-deposit liabilities to 12 percent for demand deposits. RRR for longer term Lira and FX deposits left unchanged.
Source: Country desks.
1/ Capital Flows Management Measures (CFMs) refer to certain administrative, tax, and prudential measures that are designedto influence (some or all) capital inflows (see ¶43 for details). The table also includes other measures that are designed toincrease the capacity of the economy to absorb capital inflows or to strengthen the ability of the financial sector to cope withfinancial stability risks (see ¶44 for details).
IV. A POSSIBLE POLICY FRAMEWORK FOR MANAGING CAPITAL INFLOWS
42. As recent country experience highlights, policymakers are concerned about risks
associated with surging capital inflows, including excessive currency appreciation,
overheating, financial fragility and a sudden reversal of inflows. While there are reasons
to believe that at least part of the higher inflows to EMs is due to structural factors and may be
permanent and beneficial, past experience with episodes of capital flow surges to EMssuggests that policymakers’ concerns over risks are not misplaced. It is against this backdrop
that this section proposes a framework for the appropriate policy response to capital inflows,
with a focus on the conditions that should be met before countries consider other measures
that go beyond macroeconomic policies. The intended use and institutional status of the
proposed framework is explained in Section I. As further clarified in ¶4−7 of the Supplement
to this paper, this framework is intended to help achieve consistency and evenhandedness in
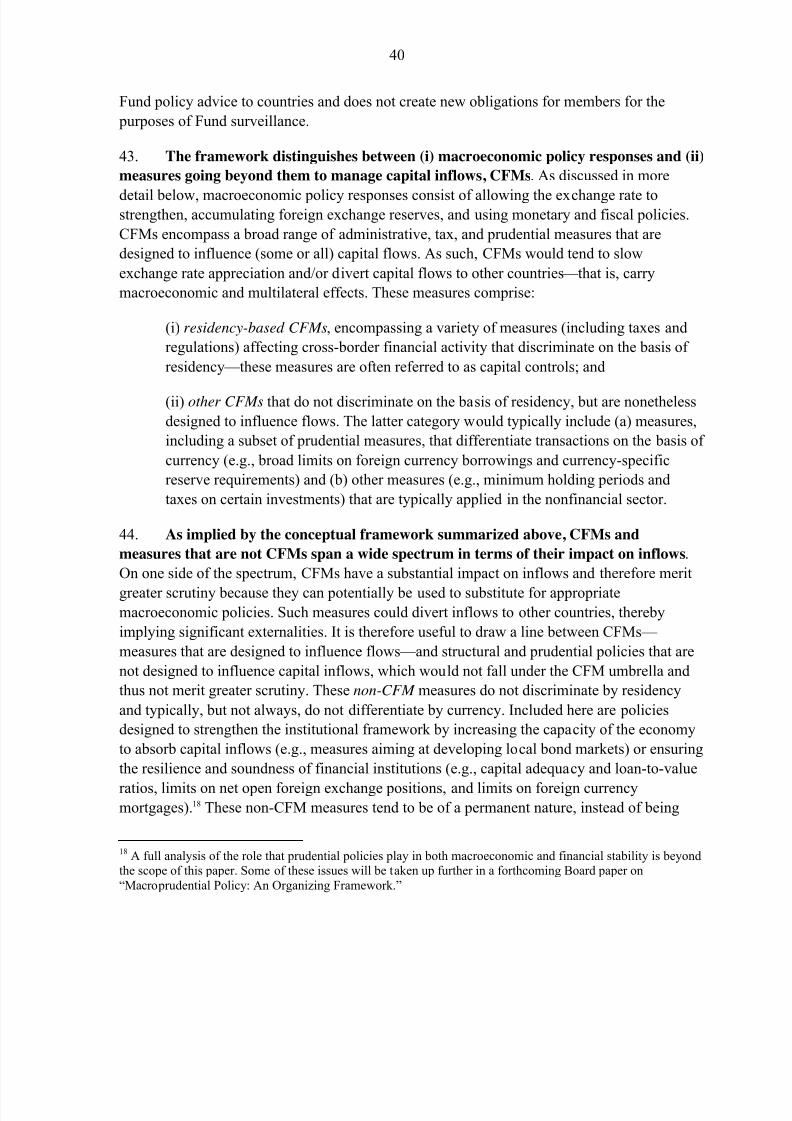
8/2/2019 IMF Ecperiences in Managing Capital Inflows
http://slidepdf.com/reader/full/imf-ecperiences-in-managing-capital-inflows 40/97
40
Fund policy advice to countries and does not create new obligations for members for the
purposes of Fund surveillance.
43. The framework distinguishes between (i) macroeconomic policy responses and (ii)
measures going beyond them to manage capital inflows, CFMs. As discussed in more
detail below, macroeconomic policy responses consist of allowing the exchange rate tostrengthen, accumulating foreign exchange reserves, and using monetary and fiscal policies.
CFMs encompass a broad range of administrative, tax, and prudential measures that are
designed to influence (some or all) capital flows. As such, CFMs would tend to slow
exchange rate appreciation and/or divert capital flows to other countries — that is, carry
macroeconomic and multilateral effects. These measures comprise:
(i) residency-based CFMs, encompassing a variety of measures (including taxes and
regulations) affecting cross-border financial activity that discriminate on the basis of
residency — these measures are often referred to as capital controls; and
(ii) other CFMs that do not discriminate on the basis of residency, but are nonetheless
designed to influence flows. The latter category would typically include (a) measures,
including a subset of prudential measures, that differentiate transactions on the basis of
currency (e.g., broad limits on foreign currency borrowings and currency-specific
reserve requirements) and (b) other measures (e.g., minimum holding periods and
taxes on certain investments) that are typically applied in the nonfinancial sector.
44. As implied by the conceptual framework summarized above, CFMs and
measures that are not CFMs span a wide spectrum in terms of their impact on inflows.
On one side of the spectrum, CFMs have a substantial impact on inflows and therefore merit
greater scrutiny because they can potentially be used to substitute for appropriatemacroeconomic policies. Such measures could divert inflows to other countries, thereby
implying significant externalities. It is therefore useful to draw a line between CFMs —
measures that are designed to influence flows — and structural and prudential policies that are
not designed to influence capital inflows, which would not fall under the CFM umbrella and
thus not merit greater scrutiny. These non-CFM measures do not discriminate by residency
and typically, but not always, do not differentiate by currency. Included here are policies
designed to strengthen the institutional framework by increasing the capacity of the economy
to absorb capital inflows (e.g., measures aiming at developing local bond markets) or ensuring
the resilience and soundness of financial institutions (e.g., capital adequacy and loan-to-value
ratios, limits on net open foreign exchange positions, and limits on foreign currencymortgages).18 These non-CFM measures tend to be of a permanent nature, instead of being
18 A full analysis of the role that prudential policies play in both macroeconomic and financial stability is beyondthe scope of this paper. Some of these issues will be taken up further in a forthcoming Board paper on“Macro prudential Policy: An Organizing Framework.”
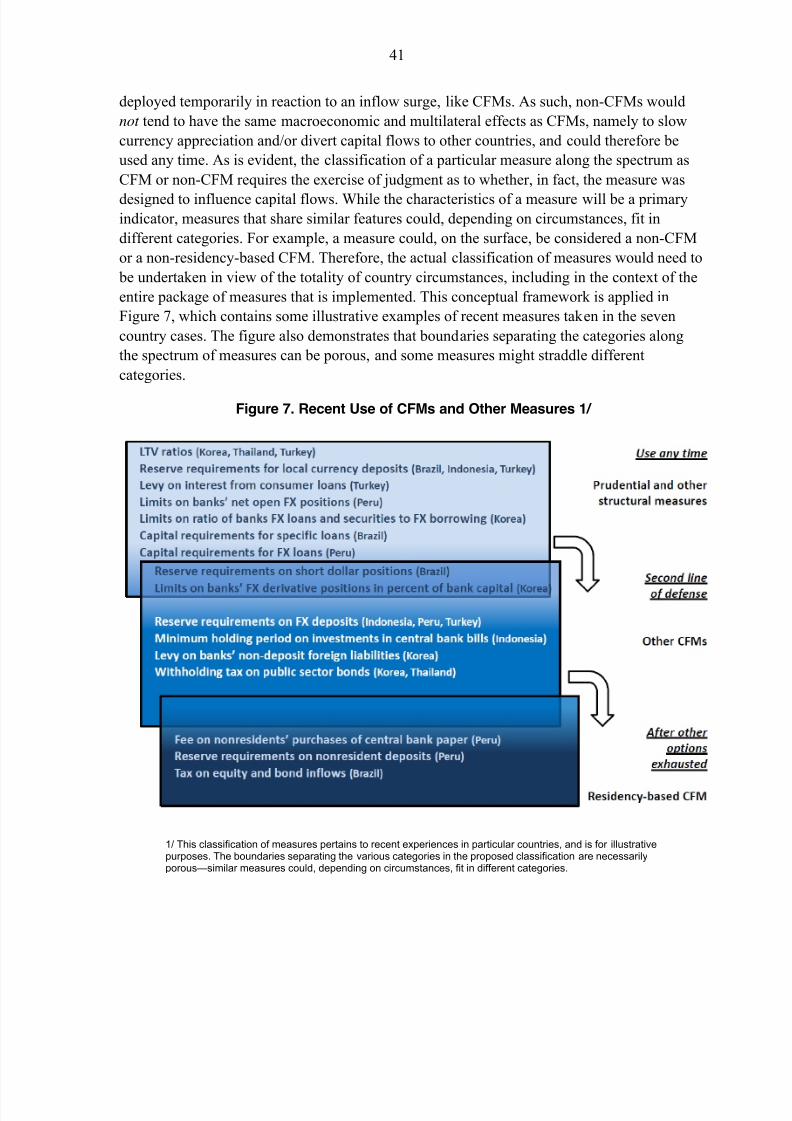
8/2/2019 IMF Ecperiences in Managing Capital Inflows
http://slidepdf.com/reader/full/imf-ecperiences-in-managing-capital-inflows 41/97
41
deployed temporarily in reaction to an inflow surge, like CFMs. As such, non-CFMs would
not tend to have the same macroeconomic and multilateral effects as CFMs, namely to slow
currency appreciation and/or divert capital flows to other countries, and could therefore be
used any time. As is evident, the classification of a particular measure along the spectrum as
CFM or non-CFM requires the exercise of judgment as to whether, in fact, the measure was
designed to influence capital flows. While the characteristics of a measure will be a primaryindicator, measures that share similar features could, depending on circumstances, fit in
different categories. For example, a measure could, on the surface, be considered a non-CFM
or a non-residency-based CFM. Therefore, the actual classification of measures would need to
be undertaken in view of the totality of country circumstances, including in the context of the
entire package of measures that is implemented. This conceptual framework is applied in
Figure 7, which contains some illustrative examples of recent measures taken in the seven
country cases. The figure also demonstrates that boundaries separating the categories along
the spectrum of measures can be porous, and some measures might straddle different
categories.
Figure 7. Recent Use of CFMs and Other Measures 1/
1/ This classification of measures pertains to recent experiences in particular countries, and is for illustrativepurposes. The boundaries separating the various categories in the proposed classification are necessarilyporous—similar measures could, depending on circumstances, fit in different categories.
8/2/2019 IMF Ecperiences in Managing Capital Inflows
http://slidepdf.com/reader/full/imf-ecperiences-in-managing-capital-inflows 42/97
42
45. This is a broad framework that is intended to be relevant for (a) all countries
with open capital accounts and (b) with respect to all countries with partially open
capital accounts, to those portions that are open.19 Because it is general, the proposed
framework may not fit well all individual country cases — country-specific circumstances will
need to be weighed in assessing the appropriateness of the response to inflows. This is
particularly important as assessments of currency overvaluation, reserve adequacy, andoverheating — which are germane to the choice of the policy response to inflows — are
notoriously difficult to make. (See Section IV.C for applications of the proposed
framework.)20
46. Giving primacy to macroeconomic policies in responding to inflows accords
prominence to external stability considerations, thereby ensuring that countries act in a
multilaterally-consistent manner. Because CFMs could be used to avoid appreciation of
undervalued currencies — which would be at odds with the multilateral consistency of stable
external positions and, where countries are large enough, may perpetuate global imbalances —
the framework emphasizes that CFMs should only be used when appropriate macroeconomic policies are already in place. Similarly, greater scrutiny of CFMs is envisaged under the
framework also because their use by one set of countries can divert inflows to other countries
that may be less able to absorb them, thus undercutting the external stability of other countries
and by extension the medium-run benefits for global growth and welfare from financial
integration. Moreover, it is important to be cognizant of the multilateral risks if CFMs were to
be broadly and indiscriminately adopted, for example through a process of imitation or
diffusion. Thus, this approach is in line with the Fund’s mandate to promote systemic stability
and the effective operation of the International Monetary System (IMS) by paying attention to
policies that are directed at the balance of payments of members. For similar reasons related to
the Fund’s mandate, even though there is no unambiguous welfare ranking of policyinstruments, the framework discourages the use of CFMs that discriminate based on residency
over those that do not discriminate on that basis (see ¶53).
47. The framework’s focus on macroeconomic policies of recipient countries does not
mean that the onus of policy adjustment from inflow surges rests solely on these
countries. It is well understood that policy actions in AEs carry important spillovers that can
complicate policy management for EMs. For example, AEs’ monetary policies can affect the
size and composition of flows to EMs. Cooperative policy solutions should therefore take
precedence as they can achieve better outcomes for the global economy and reduce the need
19 Countries with open capital accounts for this paper are defined as countries where the main channels of capitalinflows are mostly free of controls, i.e., no overall quantitative limits are applied to these inflows and the scopeof investors is not limited to specific types of investors.
20 Recent staff work on assessing reserve adequacy will be presented in a forthcoming Board paper. See Lee et al.(2008) on methodologies for assessing the consistency of exchange rates with medium-run fundamentals andBecker et al. (2007) on assessing reserve adequacy and country insurance issues.
8/2/2019 IMF Ecperiences in Managing Capital Inflows
http://slidepdf.com/reader/full/imf-ecperiences-in-managing-capital-inflows 43/97
43
for second best policies. As noted in Section I, other staff work in the pipeline is meant to
complement the proposed framework on managing inflows and ensure that staff policy advice
addresses all relevant aspects of these issues and applies across the membership. One such
example of ongoing work is the preparation of spillover reports, which offer the opportunity
to scrutinize those policies of systemic countries that are contributing to the surge of inflows
to EMs.
A. Macroeconomic Policies
48. The exchange rate should be allowed to appreciate when it is undervalued on a
multilateral basis. This is especially important at the current global economic juncture since
part of the factors driving inflows to emerging markets are structural in nature, reflecting
improved private and public sector balance sheets in emerging markets relative to advanced
economies. If sustained, such trends would suggest that equilibrium medium-term real
exchange rates for EMs are possibly stronger than currently estimated. More generally, a
demonstrated commitment to exchange rate flexibility can diminish the role for potentiallydestabilizing one-way bets by investors.21 It can also help preserve the credibility of the policy
framework in inflation-targeting countries. Nevertheless, a sharp, sustained rise in the
currency can create its own problems especially when there is strong evidence that the
exchange rate is already overvalued.
49. Countries with foreign exchange reserves that are not more than adequate from a
precautionary perspective can respond to inflows by building reserves. Intervention can
be sterilized where domestic liquidity growth may lead to overheating or be inconsistent with
inflation objectives, but sterilization can become counterproductive if inflows are being driven
by yield differentials. Countries need to be cautious, however, about intervention: excessive
reserve holdings are associated with diminishing marginal benefits and rising costs.
50. Lowering policy rates or tightening fiscal policy to allow space for monetary
easing could offer a more sustained response to deal with inflows. Any monetary policy
easing would need to be consistent with inflation objectives. Moreover, lowering policy rates
may not be an option if the economy is already overheating with high or rising inflation or a
developing credit or asset price boom. In such cases, rebalancing the monetary-fiscal policy
mix could still be a viable option, though it is often difficult in practice for fiscal and
monetary authorities to coordinate especially when central banks are independent. If fiscal
policy is judged to be procyclical, outright fiscal tightening could also be an option, though
this may require a lengthy legislative process and have long lags in implementation — thatsaid, its announcement could have an immediate impact on exchange rate expectations and
thus inflows.
21 While the use of exchange rate policy is limited in countries with fixed exchange rate regimes, the framework does not differentiate the policy hierarchy based on the nature of the exchange rate arrangement.
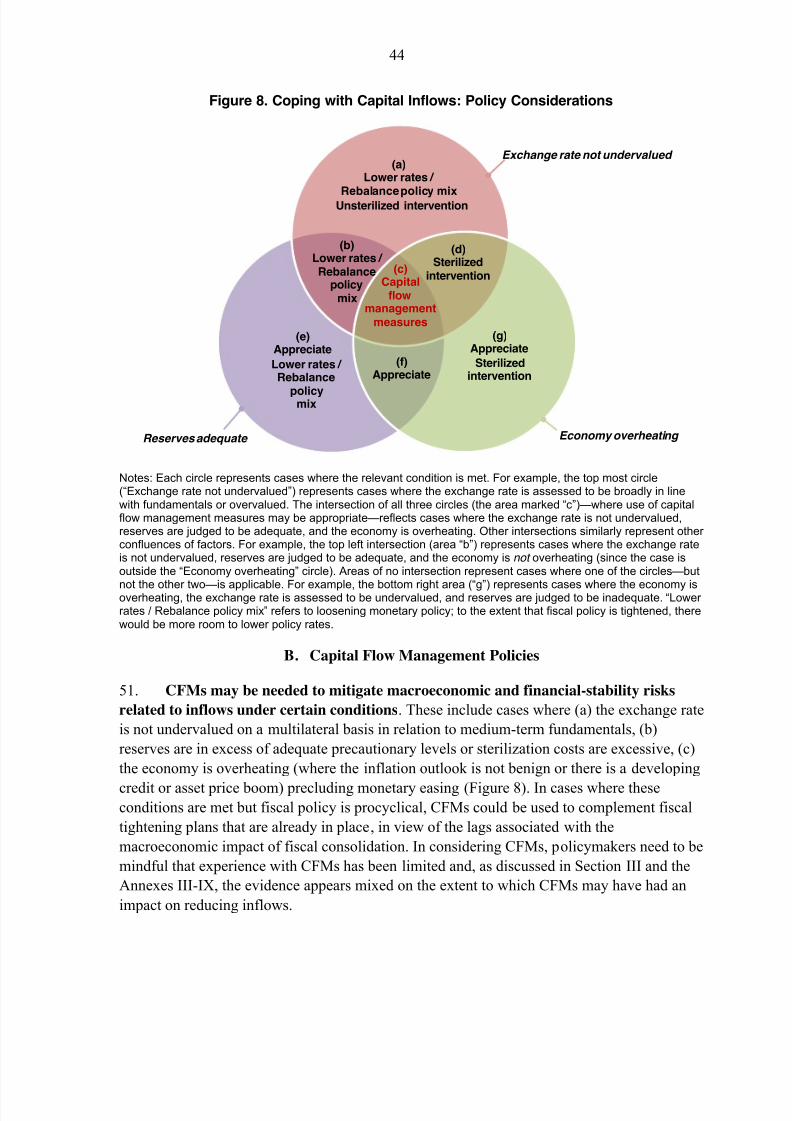
8/2/2019 IMF Ecperiences in Managing Capital Inflows
http://slidepdf.com/reader/full/imf-ecperiences-in-managing-capital-inflows 44/97
44
Figure 8. Coping with Capital Inflows: Policy Considerations
Notes: Each circle represents cases where the relevant condition is met. For example, the top most circle(“Exchange rate not undervalued”) represents cases where the exchange rate is assessed to be broadly in linewith fundamentals or overvalued. The intersection of all three circles (the area marked “c”)—where use of capitalflow management measures may be appropriate—reflects cases where the exchange rate is not undervalued,reserves are judged to be adequate, and the economy is overheating. Other intersections similarly represent other confluences of factors. For example, the top left intersection (area “b”) represents cases where the exchange rateis not undervalued, reserves are judged to be adequate, and the economy is not overheating (since the case isoutside the “Economy overheating” circle). Areas of no intersection represent cases where one of the circles—but
not the other two—is applicable. For example, the bottom right area (“g”) represents cases where the economy isoverheating, the exchange rate is assessed to be undervalued, and reserves are judged to be inadequate. “Lower rates / Rebalance policy mix” refers to loosening monetary policy; to the extent that fiscal policy is tightened, therewould be more room to lower policy rates.
B. Capital Flow Management Policies
51. CFMs may be needed to mitigate macroeconomic and financial-stability risks
related to inflows under certain conditions. These include cases where (a) the exchange rate
is not undervalued on a multilateral basis in relation to medium-term fundamentals, (b)
reserves are in excess of adequate precautionary levels or sterilization costs are excessive, (c)
the economy is overheating (where the inflation outlook is not benign or there is a developing
credit or asset price boom) precluding monetary easing (Figure 8). In cases where theseconditions are met but fiscal policy is procyclical, CFMs could be used to complement fiscal
tightening plans that are already in place, in view of the lags associated with the
macroeconomic impact of fiscal consolidation. In considering CFMs, policymakers need to be
mindful that experience with CFMs has been limited and, as discussed in Section III and the
Annexes III-IX, the evidence appears mixed on the extent to which CFMs may have had an
impact on reducing inflows.
Exchange rate not undervalued
Economy overheating Reserves adequate
(b)Lower rates / Rebalance
policymix
(d)Sterilized
intervention(c)
Capitalflow
managementmeasures
(f)Appreciate
(a)Lower rates /
Rebalance policy mixUnsterilized intervention
(e)Appreciate
Lower rates / Rebalance
policymix
(g)Appreciate
Sterilizedintervention
8/2/2019 IMF Ecperiences in Managing Capital Inflows
http://slidepdf.com/reader/full/imf-ecperiences-in-managing-capital-inflows 45/97
45
52. Targeted CFMs that do not discriminate based on residency can be a second line
of defense to address macroeconomic and financial stability risks. Such measures have the
benefit of targeting directly the risk at hand and avoid the burdens associated with measures
targeting nonresident investors (discussed below). For example, if the key concern is the
creation of vulnerabilities due to inflow of foreign currency denominated capital that amongst
other things leads to a sharp currency appreciation, all such flows should be targeted(irrespective of the residency of the investor). For banks, these could take the form of
currency-specific reserve and liquidity requirements, differentiated risk weights for domestic
versus foreign currency loans, and the like. For non-banks (e.g., corporates, leasing
companies, etc.), the authorities could impose a differentiated tax treatment of domestic
versus foreign currency borrowing. Since such measures do not discriminate by residency,
they can also be more effective than residency-based measures as they remove incentives for
circumvention from residents acting as nonresidents. But by the same token, currency-based
restrictions can be circumvented through the use of derivative transactions.
53. CFMs that discriminate based on residency could be considered when otheroptions have already been deployed or are infeasible.22 For example, residency-based
CFMs may be necessary if the existing regulatory perimeter, or the existing capacity of the
country’s regulatory institutions, does not permit direct targeting of the risk at hand through
anything other than a residency-based measure. This prioritization of measures takes into
account institutional and political economy concerns flowing from the general standard of
fairness that a member expects that its nationals will enjoy as a result of its participation in a
multilateral framework. Moreover, ensuring that this protection is extended on the basis of
residency rather than, for example, citizenship, is particularly appropriate given the Fund’s
mandate to promote the effective operation of the IMS, which comprises those official
arrangements that control members’ balance of payments (which, in turn, is comprised of transactions between residents and nonresidents).23 Given the Fund’s multilateral framework,
it would also be important to avoid measures that discriminate among Fund members. This
22 Discrimination for these purposes would be present where (i) a measure explicitly differentiates on the basis of residency (of either the parties or assets involved), (ii) this differentiation treats nonresident transactions lessfavorably, and (iii) the less favorable treatment is not justified by relevant inherent differences in the nonresidenttransactions. The criterion in (iii) is a narrow concept that provides flexibility to differentiate between residentand nonresident transactions only where this is necessary to put the two sets of transactions on an equal footing(e.g., special financial requirements for the establishment of branches of foreign banks where needed to putforeign and domestic branches on equal footing given the requirements applicable to domestic banks).
23
As discussed in the recent paper on the Fund’s role in capital flows, comprehensive capital flows guidelinescould ultimately be incorporated into Fund surveillance. Such incorporation, which would require a decision bythe Executive Board, would be based on the Fund’s mandate to undertake bilateral and multilateral surveillance.As recognized in Article IV, the objective of such surveillance is to promote the stability of the system of exchange rates and the effective operation of the IMS. For a more detailed discussion of the IMS, see The Fund’s
Mandate — The Legal Framework , ¶5, 21-22). As noted above and clarified in ¶6 of the Supplement to this paper,the proposed framework in this paper is not intended to guide members on the scope of their obligations withrespect to Fund surveillance. Its intent is to facilitate consistent and evenhanded policy advice to members.
8/2/2019 IMF Ecperiences in Managing Capital Inflows
http://slidepdf.com/reader/full/imf-ecperiences-in-managing-capital-inflows 46/97
46
approach is also consistent with that followed by the Fund with respect to its existing
jurisdiction regarding payments and transfers for “current international transactions,” which
has been defined as transactions between residents and nonresidents, and where Fund
approval is not given for restrictions that discriminate among members. Separately, measures
that discriminate by residency may also give rise to additional distortions and inefficiencies
due to evasion.
54. The above-notwithstanding, the lower priority accorded to residency-based
CFMs does not mean that they are always an inappropriate part of the toolkit. Indeed,
there could be circumstances when CFMs that target a characteristic, such as prudential risk,
may be less effective than those targeting residency, for instance, when dealing with inflows
not intermediated by regulated financial institutions. Moreover, the intensity of alternative
measures may have a bearing on their priority: a limited residency-based CFM may be less
distortive than an expansive prudential measure targeting all foreign exchange transactions,
which often closely correlate with transactions between residents and nonresidents.
55. A relevant consideration in designing CFMs is whether flows are primarily being
intermediated through regulated financial institutions (RFIs). When flows are
intermediated through RFIs, prudential measures may be preferred, including because they
help address risks in the financial sector. When flows bypass RFIs (either direct flows from
abroad, or intermediated through non RFIs), residency-based CFMs are more likely to be
indicated because prudential measures would have no traction, although nonprudential CFMs
that do not discriminate on a residency basis, if available, may be preferable.
56. Whether or not discriminatory, the intensity of CFMs should be commensurate
with the relevant macroeconomic or financial stability concern. For example, a blunt
measure that discriminates against whole classes of nonresident flows would be inappropriate
to deal with a prudential concern in a specific asset class. On the other hand, a broad CFM
measure could be more appropriate when exchange rate overvaluation is the key concern.
57. The design and implementation of CFMs should depend on country-specific
circumstances and considerations of effectiveness and efficiency:24
CFMs should not be considered a permanent solution and should be scaled back when
capital inflow pressures ease. This argues, among other things, for not treating taxes
on certain inflows as a permanent source of fiscal revenues. If inflows are eventually
perceived to be permanent, the exchange rate assessment needs to be revisited andgreater reliance placed on macroeconomic policy responses, especially exchange rate
appreciation.
24 Ostry et al. (2011) provides further details on these considerations.
8/2/2019 IMF Ecperiences in Managing Capital Inflows
http://slidepdf.com/reader/full/imf-ecperiences-in-managing-capital-inflows 47/97
47
Price-based measures (e.g. taxes on inflows and URRs) are typically more transparent
than administrative measures (measures that are not price-based and that implement
ceilings, outright bans, or outright bans for certain capital transactions). The former do
not prohibit transactions, but only discourage them by increasing their cost. Which
type of measure is preferable will depend on country circumstances.
The effectiveness of a CFM can be affected by the efficiency and the regulatory
framework of the different domestic institutions that are tasked to administer the
measures. These considerations, for instance, can weigh in deciding whether a
particular CFM is better administered by the tax collection agency (usually the widest
coverage), the bank regulator, the securities markets regulator, or other agencies.
CFMs need to be designed bearing in mind potential further adjustments as the country
gains experience with the measure and in response to circumvention. As CFMs tend to
raise the cost of capital, relatively small measures may be taken first. Further changes
may be introduced after initial experience with the measures. In fact, the effectivenessof the measure may increase if market participants perceive that the initial step signals
more to come. This benefit should be, however, weighed against the risk that such an
approach may create an adverse market reaction. The ease with which the measure can
be subsequently adjusted should therefore be taken into account in designing CFMs.
58. Finally, the costs of using CFMs should be kept in mind. While CFMs can be
useful, particularly when appropriate macroeconomic policies are in place, they entail costs
and distortions even if they are not residency-based.
Such measures can adversely affect the pace of capital market development in EMs.
Markets become more sophisticated as volume grows weakening the effect of broad-
based measures that seek to control the volume of inflows. Markets for hedging would,
for example, develop only if participants are exposed to volatility.
Because all CFMs are prone to circumvention, ensuring compliance may require
increasing investments in enforcement or administration. The cost of administration is
likely to increase over time as the loopholes for circumvention are being closed.
Active suppression of exchange rate volatility through CFMs can backfire. Investors
often discount the profitability of an investment by the historical volatility of the target
country’s exchange rate (BIS, 2007). Seeking to reduce such volatility raises risk-adjusted returns for investors, making the country even more attractive, at least in the
short run.
There is also the potential for a severe adverse market reaction to the use of CFMs.
Their use, or even expectations of their use, could trigger capital outflows and
associated market turmoil. CFMs can also affect investor memories and future
8/2/2019 IMF Ecperiences in Managing Capital Inflows
http://slidepdf.com/reader/full/imf-ecperiences-in-managing-capital-inflows 48/97
48
willingness to invest. Such severe reactions can often not be anticipated and eventual
policy reversals can affect perceptions of policy credibility. This suggests the
importance of a well-crafted communications strategy when deploying CFMs.
C. Applying the Framework
59. This section shows the results from illustrative applications of the framework.
The analysis consists of two parts. In the first, an assessment is made on the three criteria
discussed above (exchange rate valuation, reserve adequacy, and economic overheating) using
recent desk judgment. In the second part, a similar exercise is performed using consistent
numerical thresholds across countries to assess the three criteria instead of desk judgment.
This was done because judgment-based assessment was available for only 22 countries that
have recently experienced large capital inflows, while the numerical thresholds could be
applied to a larger sample of 39 EMs. The latter exercise also permits sensitivity analysis to
changes in definitions of the relevant macroeconomic criteria.
60. The main message from the illustrative analysis is that about one-quarter to one-
third of the countries are currently likely to meet the criteria to potentially validate the
use of CFMs. In other words, about one-third of each sample of countries constitutes cases
where the exchange rate is not undervalued, reserves are in excess of adequate levels, and
there are signs of overheating. This conclusion broadly holds in both the judgment- and
threshold-based exercises presented below.
61. The judgment-based analysis indicates that it would be appropriate to consider
CFMs in seven of the 22 countries in the sample, and broadly corresponds to the cases
where CFMs have been implemented in recent months (Figure 9). The assessments for
each macroeconomic policy criterion are based on country teams’ judgment obtained in November 2010 from a survey conducted by the Interdepartmental Working Group on Capital
Inflows. Where desks assessed the exchange rate to be overvalued or broadly in line with
fundamentals, the exchange rate criterion was considered to have been met. By this measure,
19 countries’ exchange rates were judged “not undervalued”. The overheating criterion was
judged to have been met where desks assessed the output gap to be closed or closing rapidly;
10 cases met this criterion. It may be noted, however, that this does not necessarily mean that
the monetary/fiscal policy mix was appropriate in all 10 cases. Indeed, fiscal policy may have
been procyclical in some cases. Lastly, country teams assessed the reserve adequacy criterion
based on their own judgment on the relevant metrics for their countries, and concluded that
18 countries had adequate reserves. To the extent that desk judgment may have changed since November, or that judgment based on the totality of the macroeconomic policy considerations
differs from judgment based on each consideration individually (the survey assessed the
latter), the number of countries meeting the second-line of defense criteria for deploying
CFMs may well differ from these estimates.
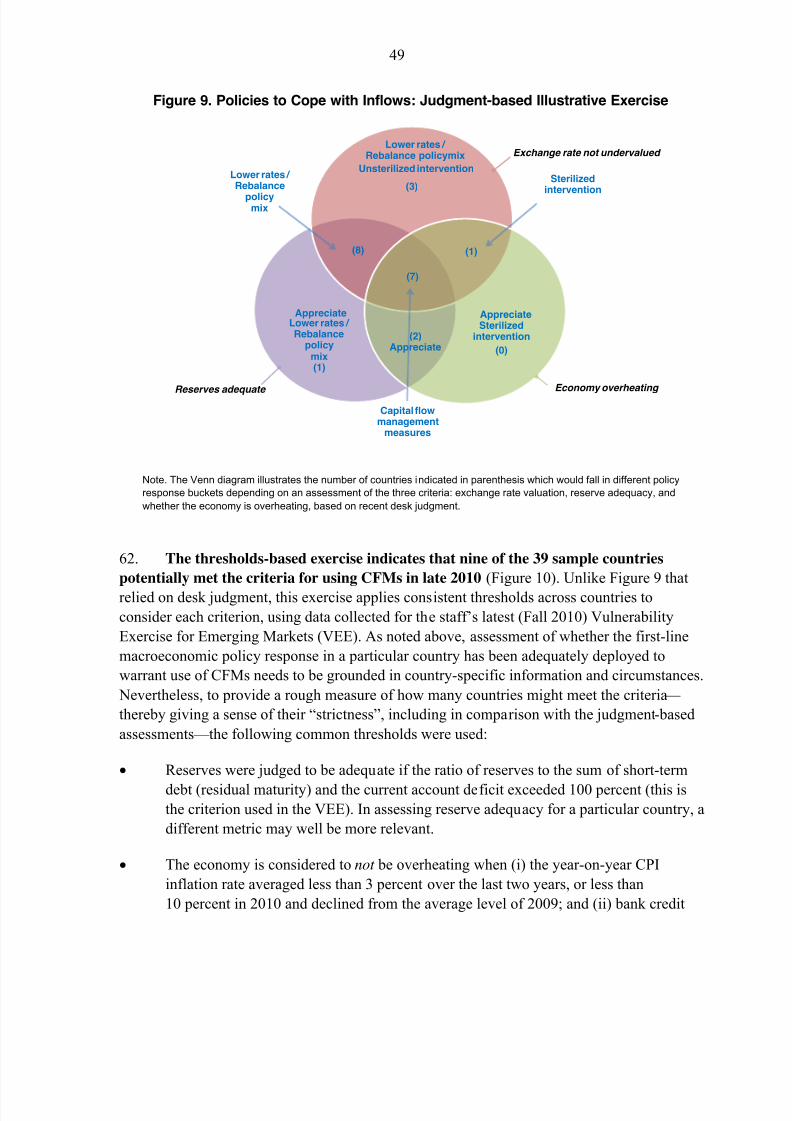
8/2/2019 IMF Ecperiences in Managing Capital Inflows
http://slidepdf.com/reader/full/imf-ecperiences-in-managing-capital-inflows 49/97
49
Figure 9. Policies to Cope with Inflows: Judgment-based Illustrative Exercise
Note. The Venn diagram illustrates the number of countries indicated in parenthesis which would fall in different policy
response buckets depending on an assessment of the three criteria: exchange rate valuation, reserve adequacy, and
whether the economy is overheating, based on recent desk judgment.
62. The thresholds-based exercise indicates that nine of the 39 sample countries
potentially met the criteria for using CFMs in late 2010 (Figure 10). Unlike Figure 9 that
relied on desk judgment, this exercise applies consistent thresholds across countries to
consider each criterion, using data collected for the staff’s latest (Fall 2010) Vulnerability
Exercise for Emerging Markets (VEE). As noted above, assessment of whether the first-line
macroeconomic policy response in a particular country has been adequately deployed to
warrant use of CFMs needs to be grounded in country-specific information and circumstances.
Nevertheless, to provide a rough measure of how many countries might meet the criteria —
thereby giving a sense of their “strictness”, including in comparison with the judgment-based
assessments — the following common thresholds were used:
Reserves were judged to be adequate if the ratio of reserves to the sum of short-term
debt (residual maturity) and the current account deficit exceeded 100 percent (this isthe criterion used in the VEE). In assessing reserve adequacy for a particular country, a
different metric may well be more relevant.
The economy is considered to not be overheating when (i) the year-on-year CPI
inflation rate averaged less than 3 percent over the last two years, or less than
10 percent in 2010 and declined from the average level of 2009; and (ii) bank credit
Exchange rate not undervalued
Economy overheating Reserves adequate
Lower rates / Rebalance policymix
Lower rates / Rebalance
policymix
Sterilizedintervention
Capital flowmanagement
measures
(2)Appreciate
AppreciateLower rates / Rebalance
policymix(1)
AppreciateSterilized
intervention
Unsterilized intervention
(3)
(8)
(7)
(1)
(0)
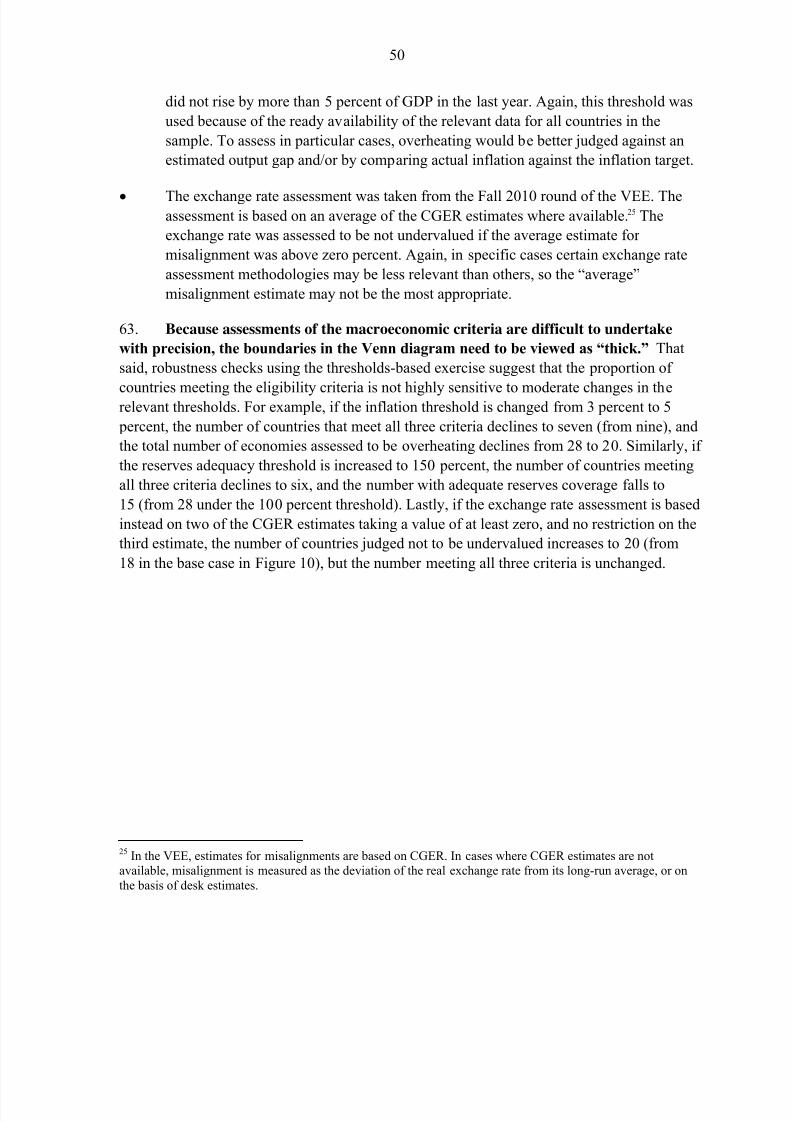
8/2/2019 IMF Ecperiences in Managing Capital Inflows
http://slidepdf.com/reader/full/imf-ecperiences-in-managing-capital-inflows 50/97
50
did not rise by more than 5 percent of GDP in the last year. Again, this threshold was
used because of the ready availability of the relevant data for all countries in the
sample. To assess in particular cases, overheating would be better judged against an
estimated output gap and/or by comparing actual inflation against the inflation target.
The exchange rate assessment was taken from the Fall 2010 round of the VEE. Theassessment is based on an average of the CGER estimates where available.25 The
exchange rate was assessed to be not undervalued if the average estimate for
misalignment was above zero percent. Again, in specific cases certain exchange rate
assessment methodologies may be less relevant than others, so the “average”
misalignment estimate may not be the most appropriate.
63. Because assessments of the macroeconomic criteria are difficult to undertake
with precision, the boundaries in the Venn diagram need to be viewed as “thick.” That
said, robustness checks using the thresholds-based exercise suggest that the proportion of
countries meeting the eligibility criteria is not highly sensitive to moderate changes in therelevant thresholds. For example, if the inflation threshold is changed from 3 percent to 5
percent, the number of countries that meet all three criteria declines to seven (from nine), and
the total number of economies assessed to be overheating declines from 28 to 20. Similarly, if
the reserves adequacy threshold is increased to 150 percent, the number of countries meeting
all three criteria declines to six, and the number with adequate reserves coverage falls to
15 (from 28 under the 100 percent threshold). Lastly, if the exchange rate assessment is based
instead on two of the CGER estimates taking a value of at least zero, and no restriction on the
third estimate, the number of countries judged not to be undervalued increases to 20 (from
18 in the base case in Figure 10), but the number meeting all three criteria is unchanged.
25 In the VEE, estimates for misalignments are based on CGER. In cases where CGER estimates are notavailable, misalignment is measured as the deviation of the real exchange rate from its long-run average, or onthe basis of desk estimates.
8/2/2019 IMF Ecperiences in Managing Capital Inflows
http://slidepdf.com/reader/full/imf-ecperiences-in-managing-capital-inflows 51/97
51
Figure 10. Policies to Cope with Inflows: Threshold-based Illustrative Exercise
Note. The Venn diagram illustrates the number of countries indicated in parenthesis which would fall indifferent policy response buckets depending on an assessment of the three criteria: exchange ratevaluation, reserve adequacy, and whether the economy is overheating, based on numerical thresholds.
V. ISSUES FOR DISCUSSION
Do Executive Directors support the framework for managing large-scale capital inflows?
Do Directors support the proposed elements that should be taken into consideration in thedesign of CFMs?
What other operational aspects do Directors consider important to facilitate the applicationof the framework?
Exchange rate is not undervalued
Economy overheating Reserves adequate
Lower rates / Rebalance policymix
Lower rates / Rebalance
policymix
Sterilizedintervention
Capital flowmanagement
measures
(11)Appreciate
AppreciateLower rates / Rebalance
policymix(6)
AppreciateSterilized
intervention
Unsterilized intervention
(3)
(2)
(9)
(4)
(4)
8/2/2019 IMF Ecperiences in Managing Capital Inflows
http://slidepdf.com/reader/full/imf-ecperiences-in-managing-capital-inflows 52/97
52
ANNEX I. HIGH FREQUENCY PROXIES FOR CAPITAL FLOWS DATA26
1. Lack of up-to-date data is an important constraint to analysis on capital flows.
One of the most widely used sources of cross-country data on capital flows is Balance of
Payment Statistics collected by the Fund’s Statistics Department. However, such data
typically become available with a 3-6 month lag, are many times not available at a monthlyfrequency and sometimes not even quarterly. This constrains the ability of policy makers to
assess the effects of capital flows and calibrate the appropriate policy responses.
2. For more up-to-date analysis, analysts often use proxies for capital inflows that
are available on a more timely basis. Two such proxies often used include (a) weekly EM
mutual fund flows data published by Emerging Portfolio Fund Research (EPFR) and (b) a
proxy for net capital flows computed from the difference between monthly change in
international reserves and the trade balance (referred to as “capital flows tracker”).
EPFR provides daily, weekly, and monthly information on equity and bond fund
flows to EMs and covers funds registered for sale in several major market
jurisdictions and offshore domiciles including Australia, Austria, Canada, Channel
Islands, France, Germany, Hong Kong SAR, Luxembourg, Switzerland, United
Kingdom, United States, and others. However, this information is a subset of all
portfolio flows to EMs; it covers only one class, albeit important, of institutional
investors and does not cover all EM destinations of flows.
The capital flows tracker provides a more up to date proxy for net capital flows since
reserves and trade balance data are typically available at a higher frequency and with
a smaller lag than BOP data. However, it is likely to show differences from capital
flows measures from BOP data where services, transfers, and income balances may be a significant part of the total BOP. This measure also does not control for valuation
and other changes that affect the reported stock of reserves.
3. A comparison of these proxies with BOP data shows that they work well for
aggregate EM flows, but may not capture developments in particular regions and
countries.
Figure 1 shows a comparison between EPFR and BOP data. As expected, the
magnitudes for EPFR reported flows are much smaller than the capital flows recorded
in the BOP. For EMs as a whole, EPFR reported flows cover around a third of BOPreported portfolio equity inflows and around a fifth of BOP reported portfolio bond
inflows. Importantly though, the trend in EPFR data is a leading indicator of BOP
recorded capital flows for most time periods, although there can be important
26 Prepared by Malika Pant (SPR).
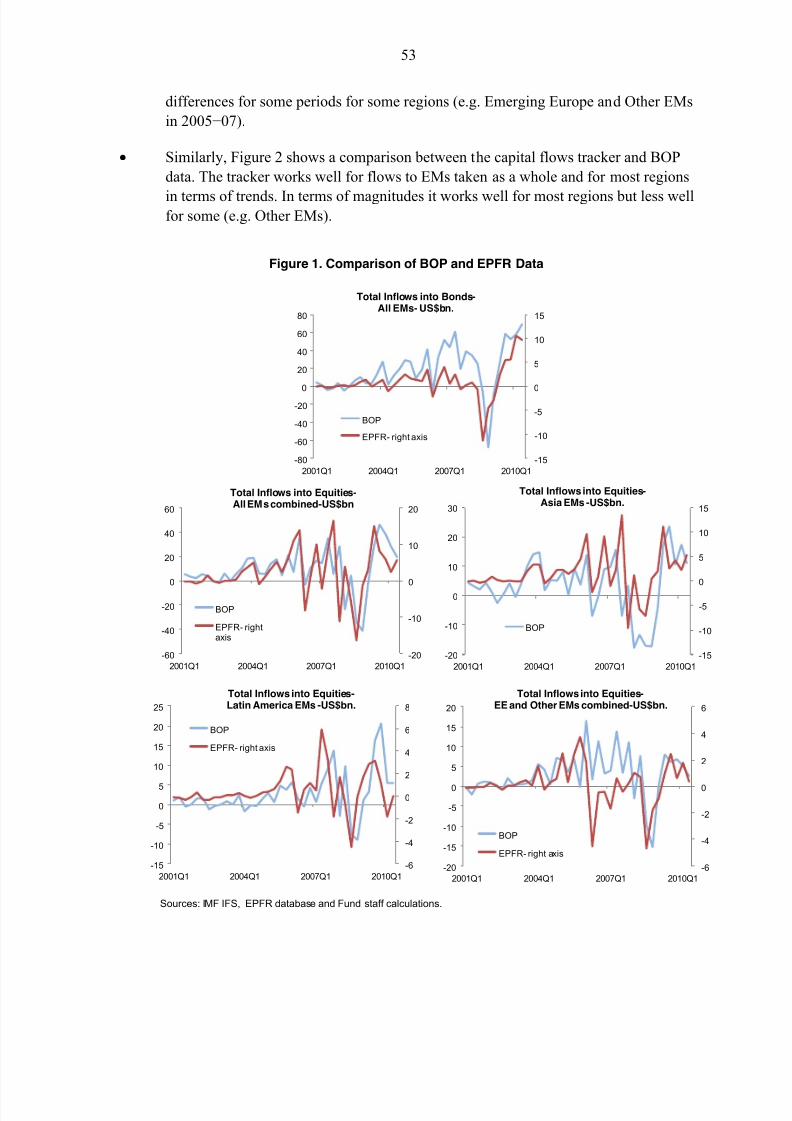
8/2/2019 IMF Ecperiences in Managing Capital Inflows
http://slidepdf.com/reader/full/imf-ecperiences-in-managing-capital-inflows 53/97
53
differences for some periods for some regions (e.g. Emerging Europe and Other EMs
in 2005−07).
Similarly, Figure 2 shows a comparison between the capital flows tracker and BOP
data. The tracker works well for flows to EMs taken as a whole and for most regions
in terms of trends. In terms of magnitudes it works well for most regions but less wellfor some (e.g. Other EMs).
Figure 1. Comparison of BOP and EPFR Data
-15
-10
-5
0
5
10
15
-80
-60
-40
-200
20
40
60
80
2001Q1 2004Q1 2007Q1 2010Q1
BOP
EPFR- right axis
Total Inflows into Bonds-All EMs- US$bn.
-6
-4
-2
0
2
4
6
8
-15
-10
-5
0
5
10
15
20
25
2001Q1 2004Q1 2007Q1 2010Q1
BOP
EPFR- right axis
Total Inflowsinto Equities-Latin America EMs -US$bn.
-20
-10
0
10
20
-60
-40
-20
0
20
40
60
2001Q1 2004Q1 2007Q1 2010Q1
BOP
EPFR- rightaxis
Total Inflows into Equities-All EMs combined-US$bn
-6
-4
-2
0
2
4
6
-20
-15
-10
-5
0
5
10
15
20
2001Q1 2004Q1 2007Q1 2010Q1
BOP
EPFR- right axis
Total Inflowsinto Equities-EE and Other EMs combined-US$bn.
-15
-10
-5
0
5
10
15
-20
-10
0
10
20
30
2001Q1 2004Q1 2007Q1 2010Q1
BOP
Total Inflowsinto Equities-Asia EMs -US$bn.
Sources: IMF IFS, EPFR database and Fund staff calculations.
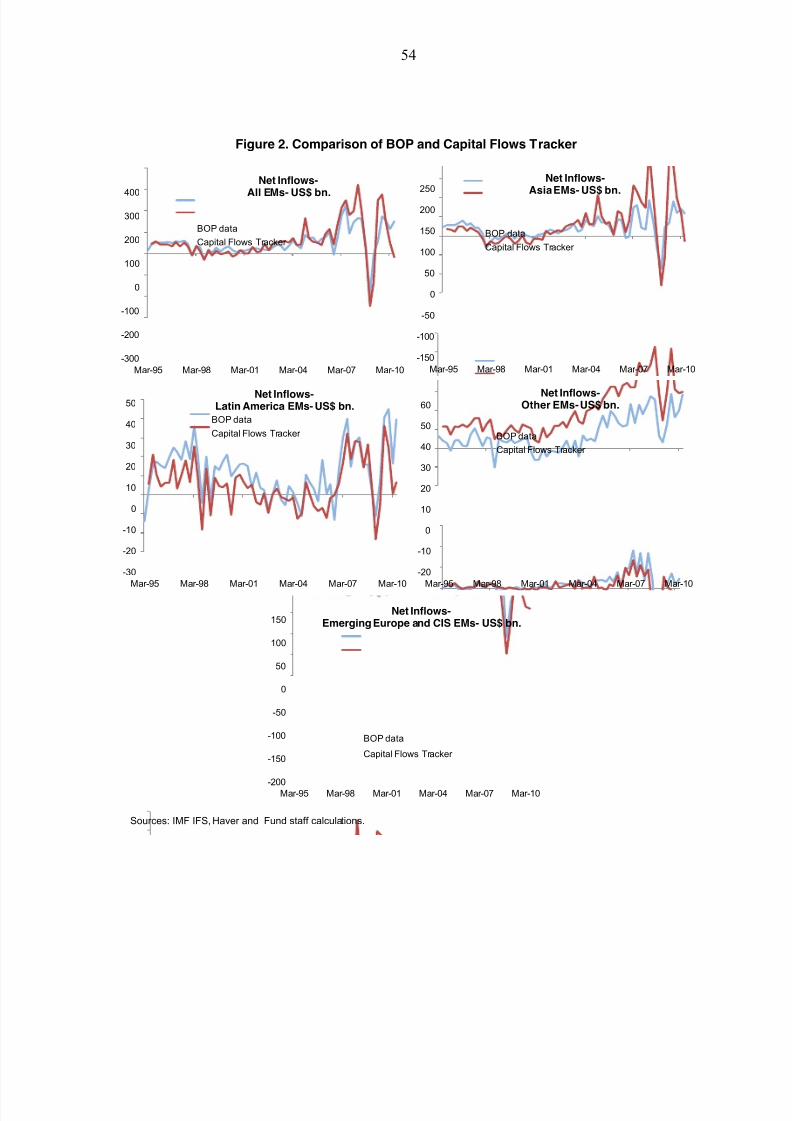
8/2/2019 IMF Ecperiences in Managing Capital Inflows
http://slidepdf.com/reader/full/imf-ecperiences-in-managing-capital-inflows 54/97
54
Figure 2. Comparison of BOP and Capital Flows Tracker
-300
-200
-100
0
100
200
300
400
Mar-95 Mar-98 Mar-01 Mar-04 Mar-07 Mar-10
BOP data
Capital Flows Tracker
Net Inflows-
All EMs- US$ bn.
-150
-100
-50
0
50
100
150
200
250
Mar-95 Mar-98 Mar-01 Mar-04 Mar-07 Mar-10
BOP data
Capital Flows Tracker
Net Inflows-Asia EMs- US$ bn.
-30
-20
-10
0
10
20
30
40
50
Mar-95 Mar-98 Mar-01 Mar-04 Mar-07 Mar-10
BOP data
Capital Flows Tracker
Net Inflows-Latin America EMs- US$ bn.
-20
-10
0
10
20
30
40
50
60
Mar-95 Mar-98 Mar-01 Mar-04 Mar-07 Mar-10
BOP data
Capital Flows Tracker
Net Inflows-Other EMs-US$ bn.
-200
-150
-100
-50
0
50
100
150
Mar-95 Mar-98 Mar-01 Mar-04 Mar-07 Mar-10
BOP data
Capital Flows Tracker
Net Inflows-Emerging Europe and CIS EMs- US$ bn.
Sources: IMF IFS, Haver and Fund staff calculations.
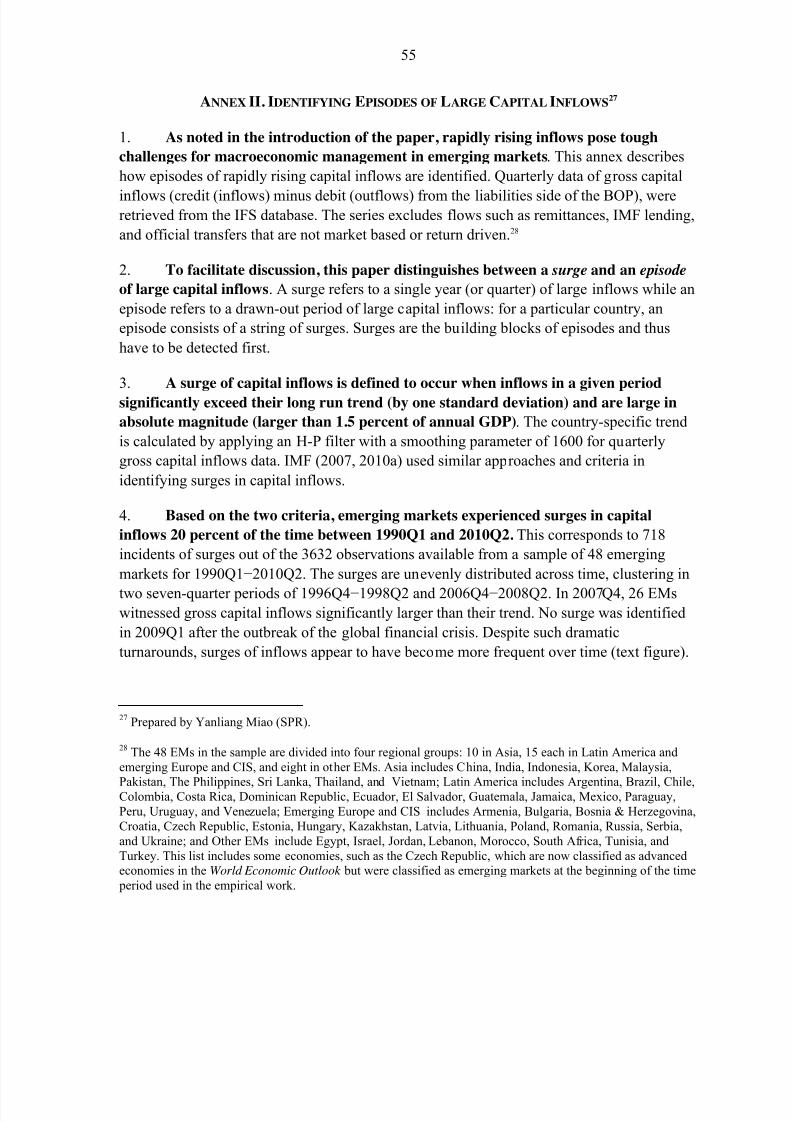
8/2/2019 IMF Ecperiences in Managing Capital Inflows
http://slidepdf.com/reader/full/imf-ecperiences-in-managing-capital-inflows 55/97
55
ANNEX II. IDENTIFYING EPISODES OF LARGE CAPITAL INFLOWS27
1. As noted in the introduction of the paper, rapidly rising inflows pose tough
challenges for macroeconomic management in emerging markets. This annex describes
how episodes of rapidly rising capital inflows are identified. Quarterly data of gross capital
inflows (credit (inflows) minus debit (outflows) from the liabilities side of the BOP), wereretrieved from the IFS database. The series excludes flows such as remittances, IMF lending,
and official transfers that are not market based or return driven.28
2. To facilitate discussion, this paper distinguishes between a surge and an episode
of large capital inflows. A surge refers to a single year (or quarter) of large inflows while an
episode refers to a drawn-out period of large capital inflows: for a particular country, an
episode consists of a string of surges. Surges are the building blocks of episodes and thus
have to be detected first.
3. A surge of capital inflows is defined to occur when inflows in a given period
significantly exceed their long run trend (by one standard deviation) and are large in
absolute magnitude (larger than 1.5 percent of annual GDP). The country-specific trend
is calculated by applying an H-P filter with a smoothing parameter of 1600 for quarterly
gross capital inflows data. IMF (2007, 2010a) used similar approaches and criteria in
identifying surges in capital inflows.
4. Based on the two criteria, emerging markets experienced surges in capital
inflows 20 percent of the time between 1990Q1 and 2010Q2. This corresponds to 718
incidents of surges out of the 3632 observations available from a sample of 48 emerging
markets for 1990Q1−2010Q2. The surges are unevenly distributed across time, clustering in
two seven-quarter periods of 1996Q4−1998Q2 and 2006Q4−2008Q2. In 2007Q4, 26 EMswitnessed gross capital inflows significantly larger than their trend. No surge was identified
in 2009Q1 after the outbreak of the global financial crisis. Despite such dramatic
turnarounds, surges of inflows appear to have become more frequent over time (text figure).
27 Prepared by Yanliang Miao (SPR).
28 The 48 EMs in the sample are divided into four regional groups: 10 in Asia, 15 each in Latin America andemerging Europe and CIS, and eight in other EMs. Asia includes China, India, Indonesia, Korea, Malaysia,
Pakistan, The Philippines, Sri Lanka, Thailand, and Vietnam; Latin America includes Argentina, Brazil, Chile,Colombia, Costa Rica, Dominican Republic, Ecuador, El Salvador, Guatemala, Jamaica, Mexico, Paraguay,Peru, Uruguay, and Venezuela; Emerging Europe and CIS includes Armenia, Bulgaria, Bosnia & Herzegovina,Croatia, Czech Republic, Estonia, Hungary, Kazakhstan, Latvia, Lithuania, Poland, Romania, Russia, Serbia,and Ukraine; and Other EMs include Egypt, Israel, Jordan, Lebanon, Morocco, South Africa, Tunisia, andTurkey. This list includes some economies, such as the Czech Republic, which are now classified as advancedeconomies in the World Economic Outlook but were classified as emerging markets at the beginning of the time period used in the empirical work.
8/2/2019 IMF Ecperiences in Managing Capital Inflows
http://slidepdf.com/reader/full/imf-ecperiences-in-managing-capital-inflows 56/97
56
5. An episode of capital inflows is a string of quarters containing capital inflow
surges. The most straightforward case is when identified surges are continuous; an episodethen simply connects the contiguous surges. Two adjacent episodes, if separated by four
quarters or less, are further combined to form one continuous episode as long as capital
inflows in all intermediate quarters remain positive. A minimum duration of four quarters is
required for a period to be identified as an episode of large inflows. Using these criteria, the
48 emerging markets in the sample experienced 158 episodes of capital inflows over the past
20 years.
6. Applying these rules too stringently, however, may lead to overidentification of
episodes. Certain continuous periods of large flows may be rendered fragmented simply
because two adjacent surges are not close enough to bridge the continuous and large inflows.
To overcome this undesirable overidentification of episodes, we complement the mechanical
rule with a set of ad hoc criteria. We define the end of an episode as the peak of cumulative
inflows, that is, the point at which gross inflows turn negative. The main difficulty, however,
lies in pinning down the exact starting quarter of an episode. We use the following criterion
in fine-tuning whether a period adjacent to only one surge should be included: the size of
inflows normally should not be below one percent of GDP unless there is a salient change of
pace of inflows such as from deep negative territories to positive inflows.
7. On the basis of these criteria combined, emerging markets experienced 125
episodes of large capital inflows, with 26 of them classified as ongoing (text table). The
episodes are rather unevenly distributed across regions and countries. EMs in Latin America
and emerging Europe often experienced three to four episodes of large inflows in the past 20
years, while Asian and other EMs had less frequent alternations of inflows and outflows.
0
5
10
15
20
25
30
1990 1995 2000 2005 2010
Number of countries
Clusterof surges
Distribution of Capital Inflows Surges
Source: Fund staff calculations.
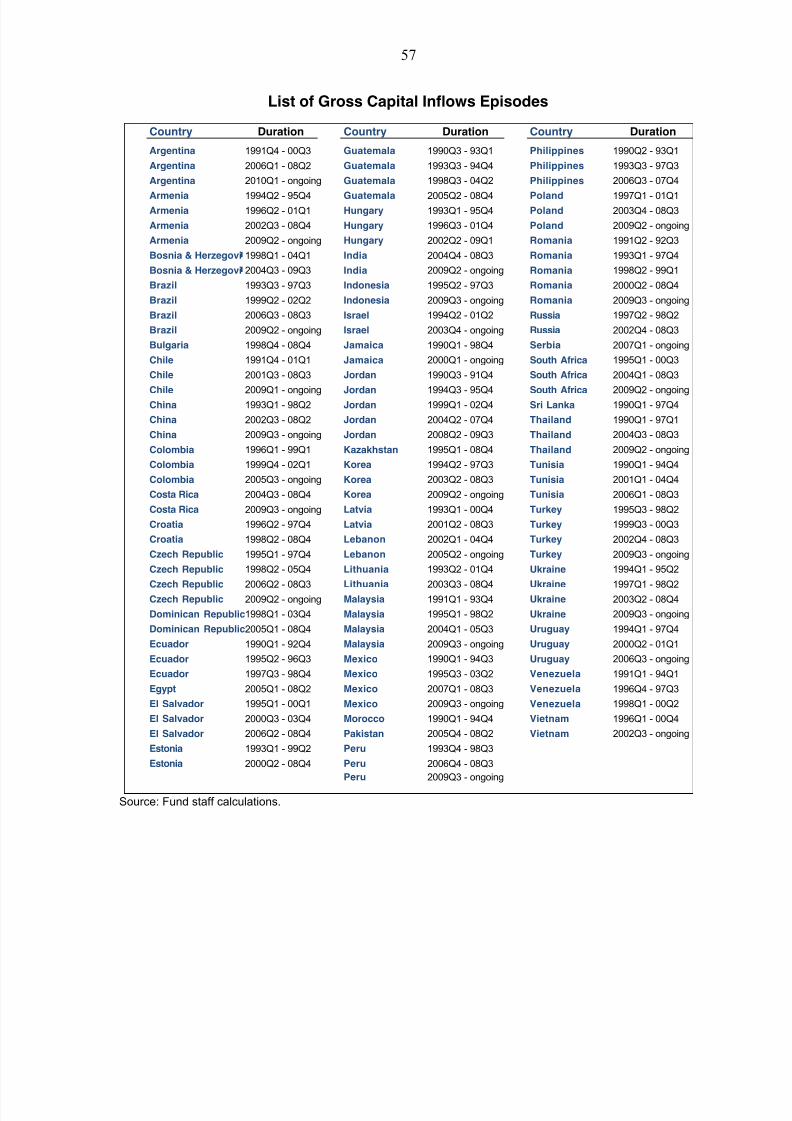
8/2/2019 IMF Ecperiences in Managing Capital Inflows
http://slidepdf.com/reader/full/imf-ecperiences-in-managing-capital-inflows 57/97
57
List of Gross Capital Inflows Episodes
Source: Fund staff calculations.
Country Duration Country Duration Country Duration
Argentina 1991Q4 - 00Q3 Guatemala 1990Q3 - 93Q1 Philippines 1990Q2 - 93Q1
Argentina 2006Q1 - 08Q2 Guatemala 1993Q3 - 94Q4 Philippines 1993Q3 - 97Q3
Argentina 2010Q1 - ongoing Guatemala 1998Q3 - 04Q2 Philippines 2006Q3 - 07Q4
Armenia 1994Q2 - 95Q4 Guatemala 2005Q2 - 08Q4 Poland 1997Q1 - 01Q1Armenia 1996Q2 - 01Q1 Hungary 1993Q1 - 95Q4 Poland 2003Q4 - 08Q3
Armenia 2002Q3 - 08Q4 Hungary 1996Q3 - 01Q4 Poland 2009Q2 - ongoing
Armenia 2009Q2 - ongoing Hungary 2002Q2 - 09Q1 Romania 1991Q2 - 92Q3
Bosnia & Herzegovi 1998Q1 - 04Q1 India 2004Q4 - 08Q3 Romania 1993Q1 - 97Q4
Bosnia & Herzegovi 2004Q3 - 09Q3 India 2009Q2 - ongoing Romania 1998Q2 - 99Q1
Brazil 1993Q3 - 97Q3 Indonesia 1995Q2 - 97Q3 Romania 2000Q2 - 08Q4
Brazil 1999Q2 - 02Q2 Indonesia 2009Q3 - ongoing Romania 2009Q3 - ongoing
Brazil 2006Q3 - 08Q3 Israel 1994Q2 - 01Q2 Russia 1997Q2 - 98Q2
Brazil 2009Q2 - ongoing Israel 2003Q4 - ongoing Russia 2002Q4 - 08Q3
Bulgaria 1998Q4 - 08Q4 Jamaica 1990Q1 - 98Q4 Serbia 2007Q1 - ongoing
Chile 1991Q4 - 01Q1 Jamaica 2000Q1 - ongoing South Africa 1995Q1 - 00Q3
Chile 2001Q3 - 08Q3 Jordan 1990Q3 - 91Q4 South Africa 2004Q1 - 08Q3
Chile 2009Q1 - ongoing Jordan 1994Q3 - 95Q4 South Africa 2009Q2 - ongoingChina 1993Q1 - 98Q2 Jordan 1999Q1 - 02Q4 Sri Lanka 1990Q1 - 97Q4
China 2002Q3 - 08Q2 Jordan 2004Q2 - 07Q4 Thailand 1990Q1 - 97Q1
China 2009Q3 - ongoing Jordan 2008Q2 - 09Q3 Thailand 2004Q3 - 08Q3
Colombia 1996Q1 - 99Q1 Kazakhstan 1995Q1 - 08Q4 Thailand 2009Q2 - ongoing
Colombia 1999Q4 - 02Q1 Korea 1994Q2 - 97Q3 Tunisia 1990Q1 - 94Q4
Colombia 2005Q3 - ongoing Korea 2003Q2 - 08Q3 Tunisia 2001Q1 - 04Q4
Costa Rica 2004Q3 - 08Q4 Korea 2009Q2 - ongoing Tunisia 2006Q1 - 08Q3
Costa Rica 2009Q3 - ongoing Latvia 1993Q1 - 00Q4 Turkey 1995Q3 - 98Q2
Croatia 1996Q2 - 97Q4 Latvia 2001Q2 - 08Q3 Turkey 1999Q3 - 00Q3
Croatia 1998Q2 - 08Q4 Lebanon 2002Q1 - 04Q4 Turkey 2002Q4 - 08Q3
Czech Republic 1995Q1 - 97Q4 Lebanon 2005Q2 - ongoing Turkey 2009Q3 - ongoing
Czech Republic 1998Q2 - 05Q4 Lithuania 1993Q2 - 01Q4 Ukraine 1994Q1 - 95Q2
Czech Republic 2006Q2 - 08Q3 Lithuania 2003Q3 - 08Q4 Ukraine 1997Q1 - 98Q2Czech Republic 2009Q2 - ongoing Malaysia 1991Q1 - 93Q4 Ukraine 2003Q2 - 08Q4
Dominican Republic1998Q1 - 03Q4 Malaysia 1995Q1 - 98Q2 Ukraine 2009Q3 - ongoing
Dominican Republic2005Q1 - 08Q4 Malaysia 2004Q1 - 05Q3 Uruguay 1994Q1 - 97Q4
Ecuador 1990Q1 - 92Q4 Malaysia 2009Q3 - ongoing Uruguay 2000Q2 - 01Q1
Ecuador 1995Q2 - 96Q3 Mexico 1990Q1 - 94Q3 Uruguay 2006Q3 - ongoing
Ecuador 1997Q3 - 98Q4 Mexico 1995Q3 - 03Q2 Venezuela 1991Q1 - 94Q1
Egypt 2005Q1 - 08Q2 Mexico 2007Q1 - 08Q3 Venezuela 1996Q4 - 97Q3
El Salvador 1995Q1 - 00Q1 Mexico 2009Q3 - ongoing Venezuela 1998Q1 - 00Q2
El Salvador 2000Q3 - 03Q4 Morocco 1990Q1 - 94Q4 Vietnam 1996Q1 - 00Q4
El Salvador 2006Q2 - 08Q4 Pakistan 2005Q4 - 08Q2 Vietnam 2002Q3 - ongoing
Estonia 1993Q1 - 99Q2 Peru 1993Q4 - 98Q3
Estonia 2000Q2 - 08Q4 Peru 2006Q4 - 08Q3
Peru 2009Q3 - ongoing
8/2/2019 IMF Ecperiences in Managing Capital Inflows
http://slidepdf.com/reader/full/imf-ecperiences-in-managing-capital-inflows 58/97
58
ANNEX III. BRAZIL29
A. Background and Drivers of Flows
1. Deep capital markets and high interest rates make Brazil one of investors’
preferred destinations for capital flows into EMs. Cyclical factors — namely, strongeconomic growth in the aftermath of the global crisis — have reinforced structural factors
(exemplified by very high interest rates by international standards), resulting in large capital
inflows and strong appreciation pressures. During the first eleven months of 2010, gross
capital inflows (defined as nonresidents’ net direct investment plus portfolio investment and
other flows) amounted to close to US$141 billion (6.8 percent of 2010 GDP), compared with
US$92 billion in 2009 as a whole. Brazil has dominated capital inflows to Latin America,
attracting a large share of global equity issuance in 2010, due in part to the record Petrobras
issue (worth a total US$70 billion of which about US$14 billion was subscribed by foreign
investors) in the third quarter. In addition to FDI and equity flows, fixed income inflows have
also been steady during 2010, reflecting to a large extent “real money” flows as well as retail
flows (especially from Japan), while external corporate bond issuance has risen to near
record highs.
2. The overall macroeconomic policy stance has reinforced pull factors in an
economy with traditionally high interest rates. Fiscal policy has remained expansionary,
and the structural primary balance deteriorated in 2010 by 1 percent of GDP over 2009
despite the strong recovery. With inflation rates drifting higher, procyclical fiscal policy has
raised the burden on monetary policy. The Central Bank of Brazil (BCB) has hiked rates by
250 basis points to 11.25 percent since April 2010, while intervening in large amounts.
Intervention in the FX spot market reached US$41 billion in 2010, pushing reserves to a
historic high of US$287 billion (17 months of imports; 600 percent of short-term debt) at
end-2010. Recently, the BCB has also resumed intervention in the forward FX market.
Despite this rapid pace of intervention, the currency has appreciated significantly in the post-
crisis period: since its bottom reached in December 2008, the exchange rate (measured as the
U.S. dollar price of one unit of domestic currency) has appreciated around 50 percent, with
most of the rebound taking place in the first stages of the recovery. Staff estimates suggest
that the real is significantly overvalued in real terms.
B. Impact of Inflows
3. Beyond their macroeconomic implications, especially on the exchange rate, largecapital inflows do not seem to have had a large impact on domestic asset markets. While
the equity market received large inflows in 2010, stock market valuations were mostly flat
during the year, reflecting an increase in the supply of shares to the public and a large rally in
29 Prepared by Roberto Benelli (SPR).
8/2/2019 IMF Ecperiences in Managing Capital Inflows
http://slidepdf.com/reader/full/imf-ecperiences-in-managing-capital-inflows 59/97
59
the earlier phase of the recovery. Bank credit grew rapidly during 2010, but this was in part a
reflection of policy decisions — 43 percent of credit expansion in 2010 came from public
banks — and banks generally did not rely on external funding for their credit expansion30.
Rapid credit growth has in turn sustained a rapid rise in property prices that continue in
certain urban areas but, based on anecdotal evidence, this phenomenon appears so far
circumscribed and not linked to capital inflows.
C. Policy Responses
4. Capital inflows have touched various aspects of the policy framework. As noted
above, the BCB has engaged in large-scale intervention operations to prevent even more
exchange rate appreciation. Beginning in December 2010, the BCB started tightening some
prudential and regulatory measures.31 In announcing them, the BCB explicitly pointed out
that, because of their expected impact on credit growth and economic activity, these
measures will lessen the burden on monetary policy to contain rising inflationary pressures
and thus help moderate pull factors.
5. A tax on inflows ( Imposto de Operações Financeiras, IOF) has played a central
part in the response to large capital inflows during the post-crisis recovery. The IOF,
originally established in 1993 and used intermittently since then, has been in recent years a
key tool for managing capital inflows. Before the crisis, it was applied to fixed income
inflows (with a 1.5 percent rate) during the period between March and October 2008 at the
peak of the pre-crisis capital inflow surge. With the resumption of inflows after the trough of
the crisis, the tax was re-introduced on October 19, 2009, with a higher rate (2 percent) and
broader coverage — the tax base was extended to include equity inflows in addition to
portfolio fixed income. The rate on fixed income inflows was subsequently raised to
4 percent on October 4, 2010, and to 6 percent on October 18, 2010. On this date, the tax was
also raised to 6 percent (from 0.38 percent) on the margin payments required on derivatives
30 More recently, however, small and medium size banks have been active issuing external debt to finance newlending.
31 These included: (i) an increase in capital requirements for most consumer credit operations with maturities of over 24 months (primarily car loans); (ii) an increase in unremunerated reserve requirements on time depositsfrom 15 percent to 20 percent; and (iii) an increase in the additional (remunerated) reserve requirement on sightand time deposits from 8 percent to 12 percent.
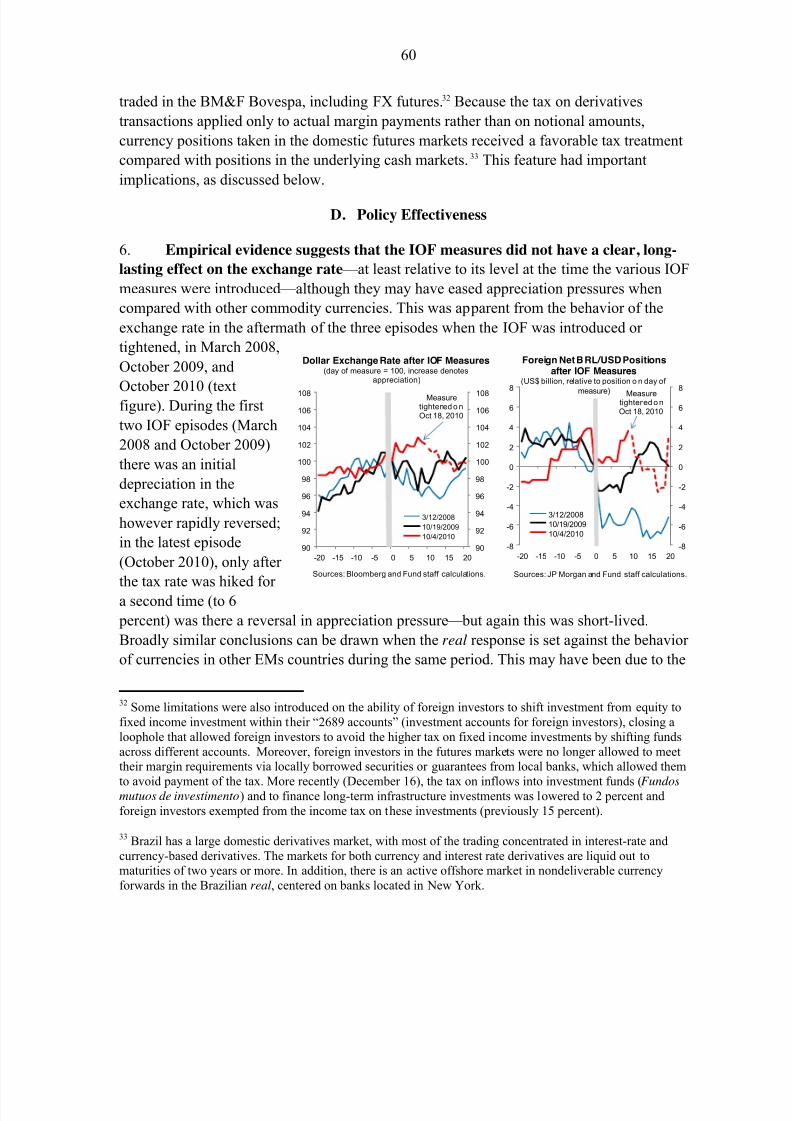
8/2/2019 IMF Ecperiences in Managing Capital Inflows
http://slidepdf.com/reader/full/imf-ecperiences-in-managing-capital-inflows 60/97
60
traded in the BM&F Bovespa, including FX futures.32 Because the tax on derivatives
transactions applied only to actual margin payments rather than on notional amounts,
currency positions taken in the domestic futures markets received a favorable tax treatment
compared with positions in the underlying cash markets. 33 This feature had important
implications, as discussed below.
D. Policy Effectiveness
6. Empirical evidence suggests that the IOF measures did not have a clear, long-
lasting effect on the exchange rate — at least relative to its level at the time the various IOF
measures were introduced — although they may have eased appreciation pressures when
compared with other commodity currencies. This was apparent from the behavior of the
exchange rate in the aftermath of the three episodes when the IOF was introduced or
tightened, in March 2008,
October 2009, and
October 2010 (textfigure). During the first
two IOF episodes (March
2008 and October 2009)
there was an initial
depreciation in the
exchange rate, which was
however rapidly reversed;
in the latest episode
(October 2010), only after
the tax rate was hiked for a second time (to 6
percent) was there a reversal in appreciation pressure — but again this was short-lived.
Broadly similar conclusions can be drawn when the real response is set against the behavior
of currencies in other EMs countries during the same period. This may have been due to the
32 Some limitations were also introduced on the ability of foreign investors to shift investment from equity tofixed income investment within their “2689 accounts” (investment accounts for foreign investors), closing aloophole that allowed foreign investors to avoid the higher tax on fixed income investments by shifting fundsacross different accounts. Moreover, foreign investors in the futures markets were no longer allowed to meettheir margin requirements via locally borrowed securities or guarantees from local banks, which allowed them
to avoid payment of the tax. More recently (December 16), the tax on inflows into investment funds (Fundosmutuos de investimento) and to finance long-term infrastructure investments was lowered to 2 percent andforeign investors exempted from the income tax on these investments (previously 15 percent).
33 Brazil has a large domestic derivatives market, with most of the trading concentrated in interest-rate andcurrency-based derivatives. The markets for both currency and interest rate derivatives are liquid out tomaturities of two years or more. In addition, there is an active offshore market in nondeliverable currencyforwards in the Brazilian real, centered on banks located in New York.
90
92
94
96
98
100
102
104
106
108
90
92
94
96
98
100
102
104
106
108
-20 -15 -10 -5 0 5 10 15 20
3/12/2008
10/19/2009
10/4/2010
Measuretightened o nOct 18, 2010
Sources: Bloomberg and Fund staff calculations.
Dollar Exchange Rate after IOF Measures(day of measure = 100, increase denotes
appreciation)
-8
-6
-4
-2
0
2
4
6
8
-8
-6
-4
-2
0
2
4
6
8
-20 -15 -10 -5 0 5 10 15 20
3/12/200810/19/200910/4/2010
Measuretightened o nOct 18, 2010
Foreign Net BRL/USD Positionsafter IOF Measures
(US$ billion, relative to position o n day of
measure)
Sources: JP Morgan and Fund staff calculations.
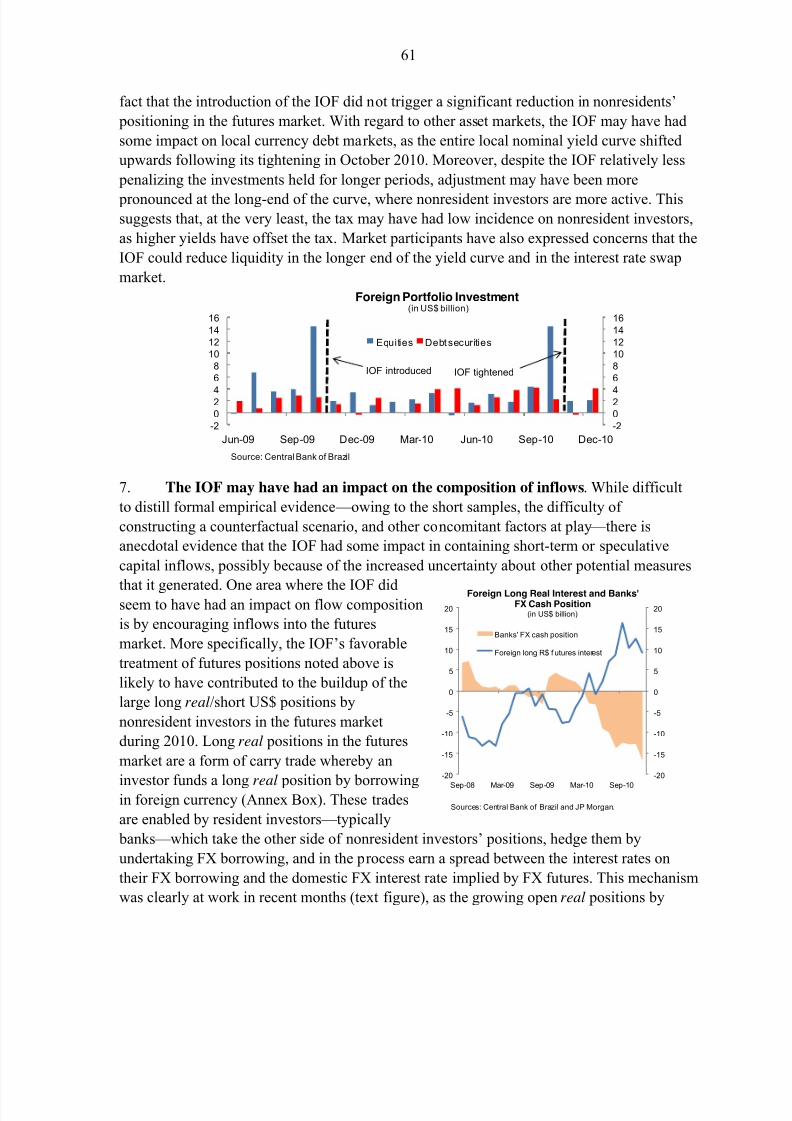
8/2/2019 IMF Ecperiences in Managing Capital Inflows
http://slidepdf.com/reader/full/imf-ecperiences-in-managing-capital-inflows 61/97
61
-2024
6810121416
-2024
68
10121416
Jun-09 Sep-09 Dec-09 Mar-10 Jun-10 Sep-10 Dec-10
Equities Debt securities
Foreign Portfolio Investment(in US$ billion)
IOF introduced IOF tightened
Source: CentralBank of Brazil
fact that the introduction of the IOF did not trigger a significant reduction in nonresidents’
positioning in the futures market. With regard to other asset markets, the IOF may have had
some impact on local currency debt markets, as the entire local nominal yield curve shifted
upwards following its tightening in October 2010. Moreover, despite the IOF relatively less
penalizing the investments held for longer periods, adjustment may have been more
pronounced at the long-end of the curve, where nonresident investors are more active. Thissuggests that, at the very least, the tax may have had low incidence on nonresident investors,
as higher yields have offset the tax. Market participants have also expressed concerns that the
IOF could reduce liquidity in the longer end of the yield curve and in the interest rate swap
market.
7. The IOF may have had an impact on the composition of inflows. While difficult
to distill formal empirical evidence — owing to the short samples, the difficulty of
constructing a counterfactual scenario, and other concomitant factors at play — there is
anecdotal evidence that the IOF had some impact in containing short-term or speculative
capital inflows, possibly because of the increased uncertainty about other potential measures
that it generated. One area where the IOF didseem to have had an impact on flow composition
is by encouraging inflows into the futures
market. More specifically, the IOF’s favorable
treatment of futures positions noted above is
likely to have contributed to the buildup of the
large long real/short US$ positions by
nonresident investors in the futures market
during 2010. Long real positions in the futures
market are a form of carry trade whereby an
investor funds a long real position by borrowingin foreign currency (Annex Box). These trades
are enabled by resident investors — typically
banks — which take the other side of nonresident investors’ positions, hedge them by
undertaking FX borrowing, and in the process earn a spread between the interest rates on
their FX borrowing and the domestic FX interest rate implied by FX futures. This mechanism
was clearly at work in recent months (text figure), as the growing open real positions by
-20
-15
-10
-5
0
5
10
15
20
-20
-15
-10
-5
0
5
10
15
20
Sep-08 Mar-09 Sep-09 Mar-10 Sep-10
Foreign Long Real Interest and Banks'FX Cash Position
(in US$ billion)
Banks' FX cash position
Foreign long R$ f utures interest
Sources: Central Bank of Brazil and JP Morgan.

8/2/2019 IMF Ecperiences in Managing Capital Inflows
http://slidepdf.com/reader/full/imf-ecperiences-in-managing-capital-inflows 62/97
62
nonresident investors was mirrored very closely by banks’ short FX cash positions— reaching
almost US$17 billion at end-2010, a historically high level.
8. The IOF has recently been complemented by macro-prudential measures. The
carry trade delineated above relies on the resident banks’ ability to increase their short spot
position in the FX market (that is, to borrow in FX) as a hedge to their positions in the futuresmark et. As documented above, banks’ short FX positions increased significantly in the
second half of 2010. In response to these developments, the BCB introduced in early January
2011 a 60 percent non-remunerated reserve requirement on banks’ short FX position in the
spot market that exceed US$3 billion or Tier I capital (with a phase-in period of 90 days). In
introducing this requirement, the authorities argued that they were concerned that banks or
the local currency market could face disruptions following a large shock to the exchange rate
(as it happened at end-2008), given the banks’ large short FX positions. The new measure is
expected to reduce the return to local banks from providing a “bridge” to nonresident
investors investing in the futures market. By affecting its cost, this measure is thus expected
to affect an important channel for carry trades that was left open in the original design of theIOF while reducing potential vulnerabilities in the banking sector. This measure has many
similarities, both in terms of design and goals, with the macro-prudential measure aimed at
limiting external indebtedness linked to carry trades introduced in Korea in June 2010.
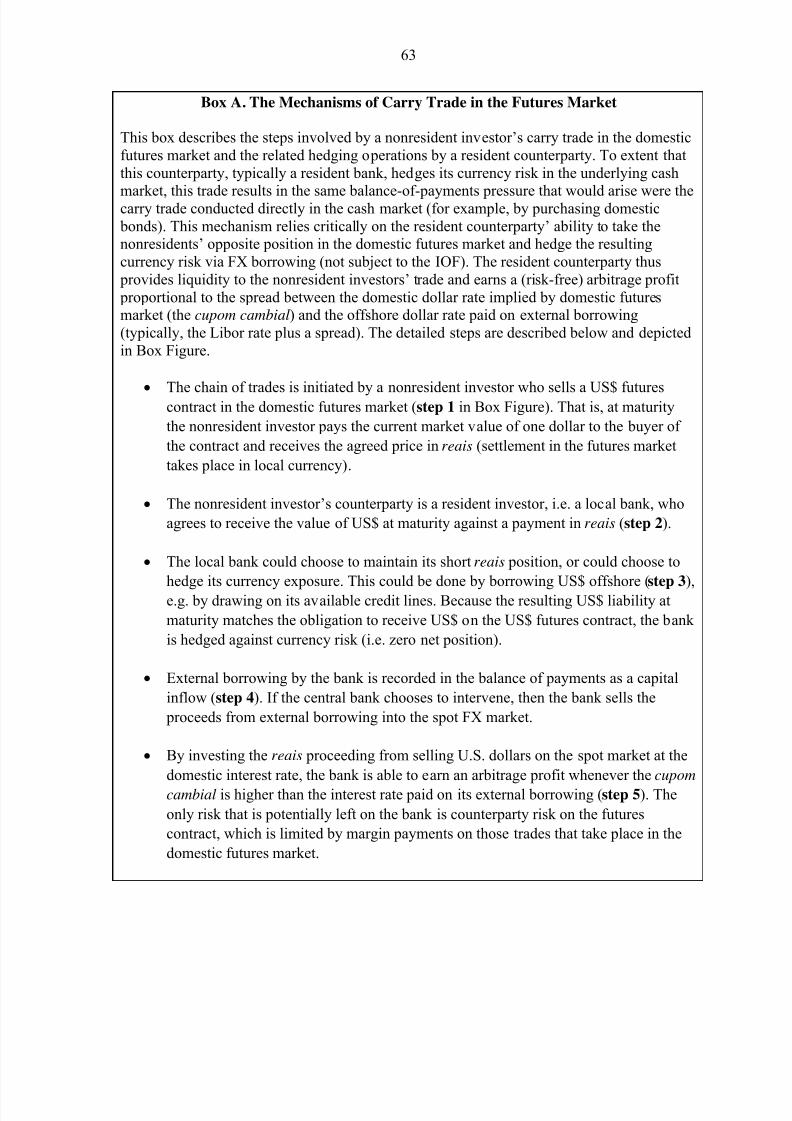
8/2/2019 IMF Ecperiences in Managing Capital Inflows
http://slidepdf.com/reader/full/imf-ecperiences-in-managing-capital-inflows 63/97
63
Box A. The Mechanisms of Carry Trade in the Futures Market
This box describes the steps involved by a nonresident investor’s carry trade in the domesticfutures market and the related hedging operations by a resident counterparty. To extent thatthis counterparty, typically a resident bank, hedges its currency risk in the underlying cash
market, this trade results in the same balance-of-payments pressure that would arise were thecarry trade conducted directly in the cash market (for example, by purchasing domestic bonds). This mechanism relies critically on the resident counterparty’ ability to take thenonresidents’ opposite position in the domestic futures market and hedge the resultingcurrency risk via FX borrowing (not subject to the IOF). The resident counterparty thus provides liquidity to the nonresident investors’ trade and earns a (risk-free) arbitrage profit proportional to the spread between the domestic dollar rate implied by domestic futuresmarket (the cupom cambial) and the offshore dollar rate paid on external borrowing(typically, the Libor rate plus a spread). The detailed steps are described below and depictedin Box Figure.
The chain of trades is initiated by a nonresident investor who sells a US$ futurescontract in the domestic futures market (step 1 in Box Figure). That is, at maturity
the nonresident investor pays the current market value of one dollar to the buyer of
the contract and receives the agreed price in reais (settlement in the futures market
takes place in local currency).
The nonresident investor’s counterparty is a resident investor, i.e. a local bank, who
agrees to receive the value of US$ at maturity against a payment in reais (step 2).
The local bank could choose to maintain its short reais position, or could choose to
hedge its currency exposure. This could be done by borrowing US$ offshore (step 3),
e.g. by drawing on its available credit lines. Because the resulting US$ liability at
maturity matches the obligation to receive US$ on the US$ futures contract, the bank
is hedged against currency risk (i.e. zero net position).
External borrowing by the bank is recorded in the balance of payments as a capital
inflow (step 4). If the central bank chooses to intervene, then the bank sells the
proceeds from external borrowing into the spot FX market.
By investing the reais proceeding from selling U.S. dollars on the spot market at the
domestic interest rate, the bank is able to earn an arbitrage profit whenever the cupom
cambial is higher than the interest rate paid on its external borrowing (step 5). The
only risk that is potentially left on the bank is counterparty risk on the futures
contract, which is limited by margin payments on those trades that take place in the
domestic futures market.
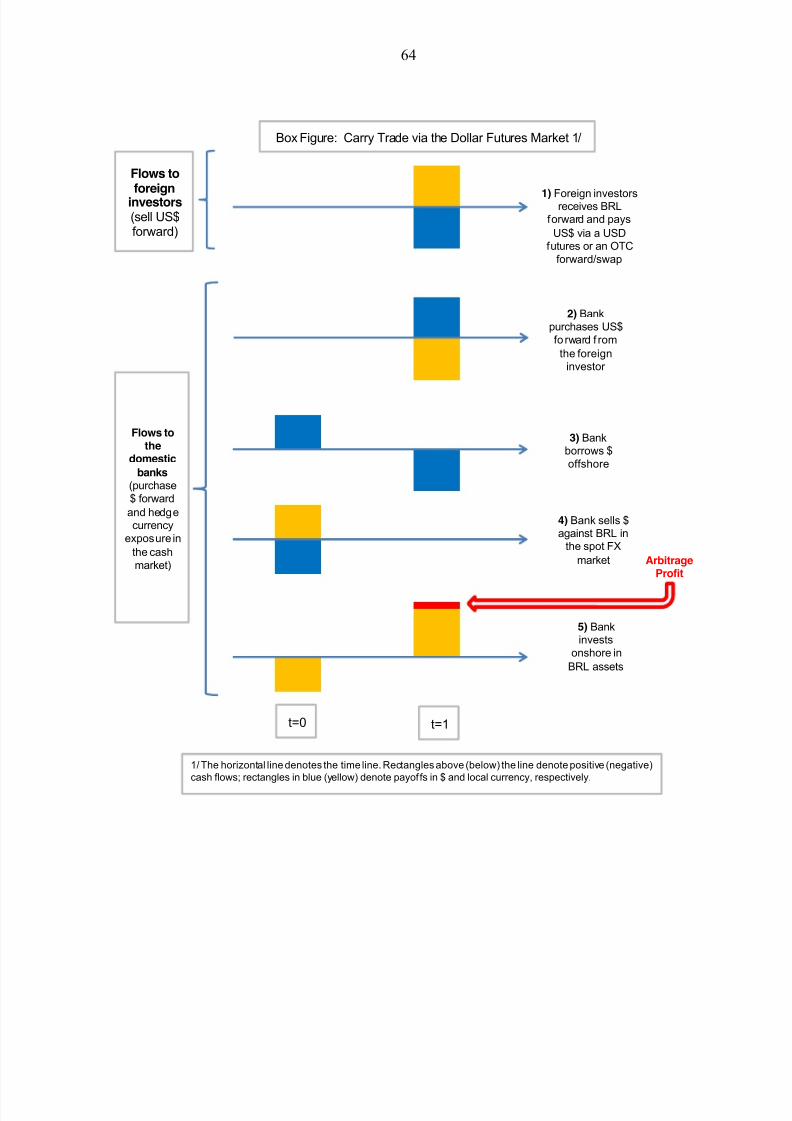
8/2/2019 IMF Ecperiences in Managing Capital Inflows
http://slidepdf.com/reader/full/imf-ecperiences-in-managing-capital-inflows 64/97
64
5) Bankinvests
onshore in
BRL assets
Box Figure: Carry Trade via the Dollar Futures Market 1/
t=0 t=1
1/ The horizontal line denotes the time line. Rectangles above (below) the line denote positive (negative)cash flows; rectangles in blue (yellow) denote payoffs in $ and local currency, respectively.
1) Foreign investorsreceives BRLforward and pays
US$ via a USDfutures or an OTC
forward/swap
2) Bankpurchases US$forward f rom
the foreigninvestor
3) Bankborrows $offshore
4) Bank sells $against BRL in
the spot FX
market
Flows toforeign
investors(sell US$forward)
Flows tothe
domestic
banks(purchase$ forward
and hedgecurrency
exposure in
the cashmarket) Arbitrage
Profit
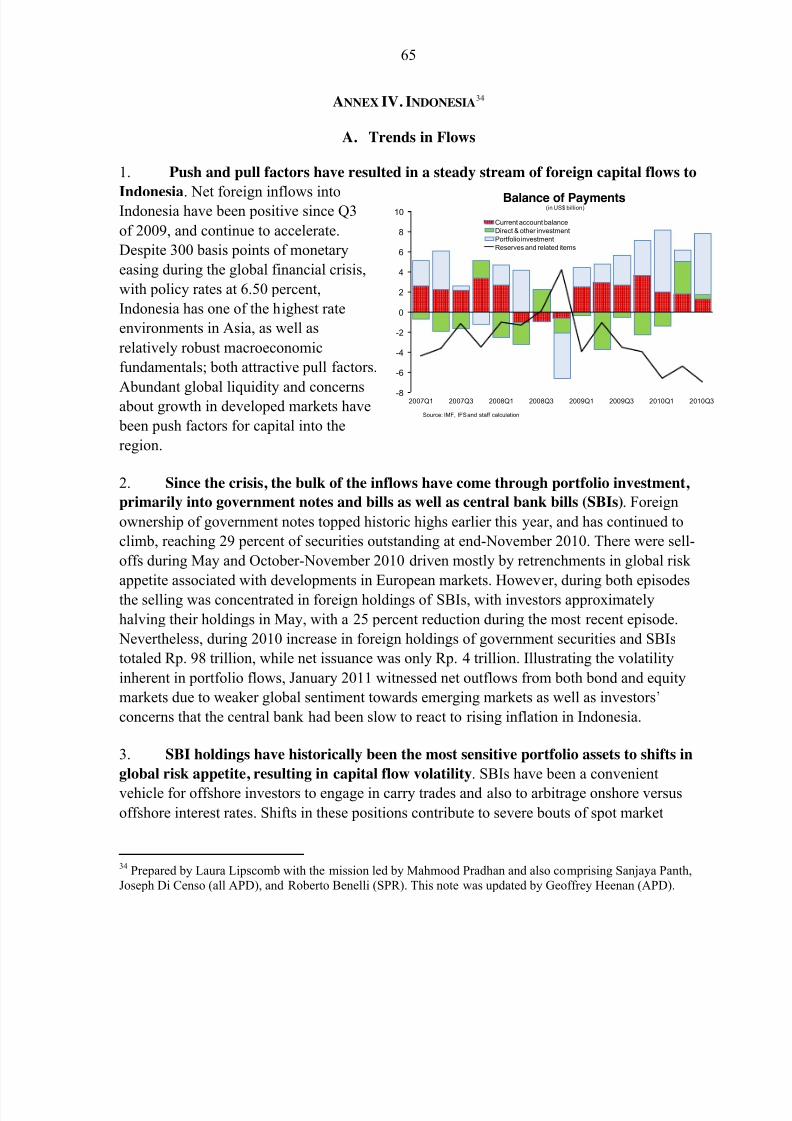
8/2/2019 IMF Ecperiences in Managing Capital Inflows
http://slidepdf.com/reader/full/imf-ecperiences-in-managing-capital-inflows 65/97
65
-8
-6
-4
-2
0
2
4
6
8
10
2007Q1 2007Q3 2008Q1 2008Q3 2009Q1 2009Q3 2010Q1 2010Q3
Balance of Payments(in US$ billion)
Current account balanceDirect & other investmentPortfolio investmentReserves and related items
Source: IMF, IFS and staff calculation
ANNEX IV. INDONESIA34
A. Trends in Flows
1. Push and pull factors have resulted in a steady stream of foreign capital flows to
Indonesia. Net foreign inflows intoIndonesia have been positive since Q3
of 2009, and continue to accelerate.
Despite 300 basis points of monetary
easing during the global financial crisis,
with policy rates at 6.50 percent,
Indonesia has one of the highest rate
environments in Asia, as well as
relatively robust macroeconomic
fundamentals; both attractive pull factors.
Abundant global liquidity and concernsabout growth in developed markets have
been push factors for capital into the
region.
2. Since the crisis, the bulk of the inflows have come through portfolio investment,
primarily into government notes and bills as well as central bank bills (SBIs). Foreign
ownership of government notes topped historic highs earlier this year, and has continued to
climb, reaching 29 percent of securities outstanding at end-November 2010. There were sell-
offs during May and October-November 2010 driven mostly by retrenchments in global risk
appetite associated with developments in European markets. However, during both episodes
the selling was concentrated in foreign holdings of SBIs, with investors approximately
halving their holdings in May, with a 25 percent reduction during the most recent episode.
Nevertheless, during 2010 increase in foreign holdings of government securities and SBIs
totaled Rp. 98 trillion, while net issuance was only Rp. 4 trillion. Illustrating the volatility
inherent in portfolio flows, January 2011 witnessed net outflows from both bond and equity
markets due to weaker global sentiment towards emerging markets as well as investors’
concerns that the central bank had been slow to react to rising inflation in Indonesia.
3. SBI holdings have historically been the most sensitive portfolio assets to shifts in
global risk appetite, resulting in capital flow volatility. SBIs have been a convenient
vehicle for offshore investors to engage in carry trades and also to arbitrage onshore versus
offshore interest rates. Shifts in these positions contribute to severe bouts of spot market
34 Prepared by Laura Lipscomb with the mission led by Mahmood Pradhan and also comprising Sanjaya Panth,Joseph Di Censo (all APD), and Roberto Benelli (SPR). This note was updated by Geoffrey Heenan (APD).
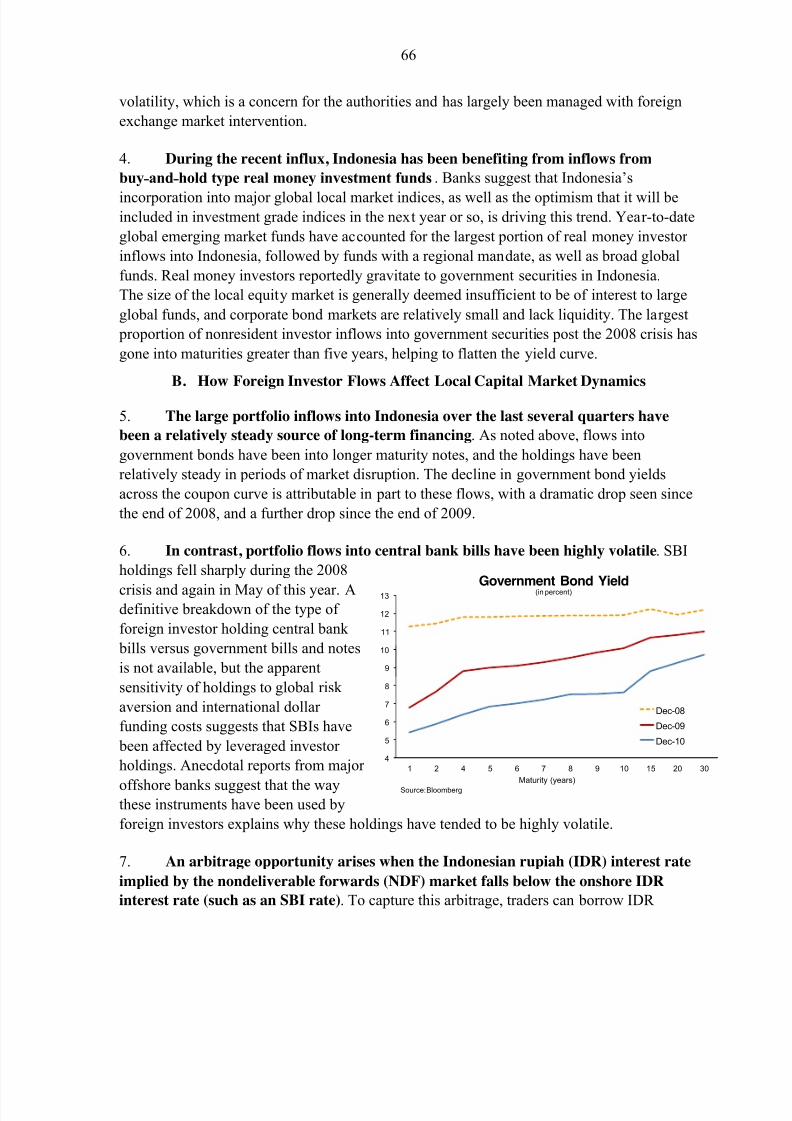
8/2/2019 IMF Ecperiences in Managing Capital Inflows
http://slidepdf.com/reader/full/imf-ecperiences-in-managing-capital-inflows 66/97
66
4
5
6
7
8
9
10
11
12
13
1 2 4 5 6 7 8 9 10 15 20 30
Maturity (years)
Dec-08
Dec-09
Dec-10
Government Bond Yield(in percent)
Source: Bloomberg
volatility, which is a concern for the authorities and has largely been managed with foreign
exchange market intervention.
4. During the recent influx, Indonesia has been benefiting from inflows from
buy˗and˗hold type real money investment funds. Banks suggest that Indonesia’s
incorporation into major global local market indices, as well as the optimism that it will beincluded in investment grade indices in the next year or so, is driving this trend. Year-to-date
global emerging market funds have accounted for the largest portion of real money investor
inflows into Indonesia, followed by funds with a regional mandate, as well as broad global
funds. Real money investors reportedly gravitate to government securities in Indonesia.
The size of the local equity market is generally deemed insufficient to be of interest to large
global funds, and corporate bond markets are relatively small and lack liquidity. The largest
proportion of nonresident investor inflows into government securities post the 2008 crisis has
gone into maturities greater than five years, helping to flatten the yield curve.
B. How Foreign Investor Flows Affect Local Capital Market Dynamics
5. The large portfolio inflows into Indonesia over the last several quarters have
been a relatively steady source of long-term financing. As noted above, flows into
government bonds have been into longer maturity notes, and the holdings have been
relatively steady in periods of market disruption. The decline in government bond yields
across the coupon curve is attributable in part to these flows, with a dramatic drop seen since
the end of 2008, and a further drop since the end of 2009.
6. In contrast, portfolio flows into central bank bills have been highly volatile. SBI
holdings fell sharply during the 2008
crisis and again in May of this year. Adefinitive breakdown of the type of
foreign investor holding central bank
bills versus government bills and notes
is not available, but the apparent
sensitivity of holdings to global risk
aversion and international dollar
funding costs suggests that SBIs have
been affected by leveraged investor
holdings. Anecdotal reports from major
offshore banks suggest that the waythese instruments have been used by
foreign investors explains why these holdings have tended to be highly volatile.
7. An arbitrage opportunity arises when the Indonesian rupiah (IDR) interest rate
implied by the nondeliverable forwards (NDF) market falls below the onshore IDR
interest rate (such as an SBI rate). To capture this arbitrage, traders can borrow IDR
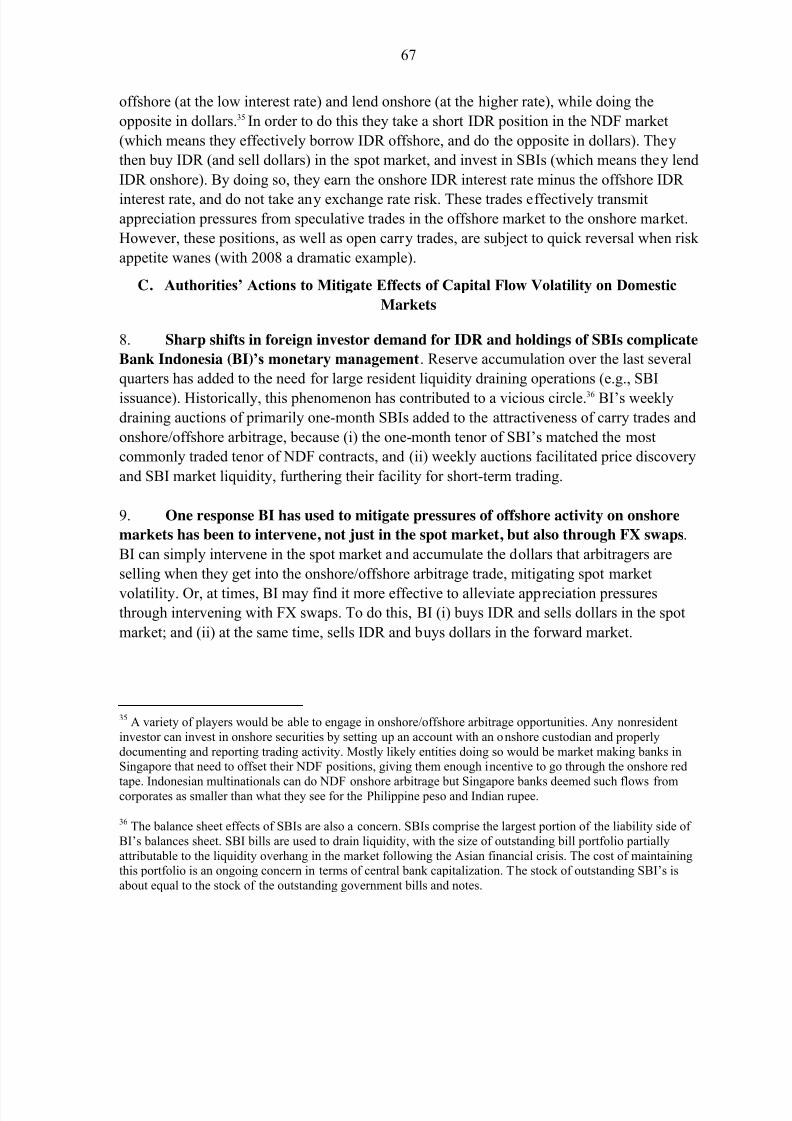
8/2/2019 IMF Ecperiences in Managing Capital Inflows
http://slidepdf.com/reader/full/imf-ecperiences-in-managing-capital-inflows 67/97
67
offshore (at the low interest rate) and lend onshore (at the higher rate), while doing the
opposite in dollars.35 In order to do this they take a short IDR position in the NDF market
(which means they effectively borrow IDR offshore, and do the opposite in dollars). They
then buy IDR (and sell dollars) in the spot market, and invest in SBIs (which means they lend
IDR onshore). By doing so, they earn the onshore IDR interest rate minus the offshore IDR
interest rate, and do not take any exchange rate risk. These trades effectively transmitappreciation pressures from speculative trades in the offshore market to the onshore market.
However, these positions, as well as open carry trades, are subject to quick reversal when risk
appetite wanes (with 2008 a dramatic example).
C. Authorities’ Actions to Mitigate Effects of Capital Flow Volatility on Domestic
Markets
8. Sharp shifts in foreign investor demand for IDR and holdings of SBIs complicate
Bank Indonesia (BI)’s monetary management. Reserve accumulation over the last several
quarters has added to the need for large resident liquidity draining operations (e.g., SBI
issuance). Historically, this phenomenon has contributed to a vicious circle.36 BI’s weekly
draining auctions of primarily one-month SBIs added to the attractiveness of carry trades and
onshore/offshore arbitrage, because (i) the one-month tenor of SBI’s matched the most
commonly traded tenor of NDF contracts, and (ii) weekly auctions facilitated price discovery
and SBI market liquidity, furthering their facility for short-term trading.
9. One response BI has used to mitigate pressures of offshore activity on onshore
markets has been to intervene, not just in the spot market, but also through FX swaps .
BI can simply intervene in the spot market and accumulate the dollars that arbitragers are
selling when they get into the onshore/offshore arbitrage trade, mitigating spot market
volatility. Or, at times, BI may find it more effective to alleviate appreciation pressuresthrough intervening with FX swaps. To do this, BI (i) buys IDR and sells dollars in the spot
market; and (ii) at the same time, sells IDR and buys dollars in the forward market.
35 A variety of players would be able to engage in onshore/offshore arbitrage opportunities. Any nonresidentinvestor can invest in onshore securities by setting up an account with an onshore custodian and properlydocumenting and reporting trading activity. Mostly likely entities doing so would be market making banks inSingapore that need to offset their NDF positions, giving them enough incentive to go through the onshore red
tape. Indonesian multinationals can do NDF onshore arbitrage but Singapore banks deemed such flows fromcorporates as smaller than what they see for the Philippine peso and Indian rupee.
36 The balance sheet effects of SBIs are also a concern. SBIs comprise the largest portion of the liability side of BI’s balances sheet. SBI bills are used to drain liquidity, with the size of outstanding bill portfolio partiallyattributable to the liquidity overhang in the market following the Asian financial crisis. The cost of maintainingthis portfolio is an ongoing concern in terms of central bank capitalization. The stock of outstanding SBI’s isabout equal to the stock of the outstanding government bills and notes.
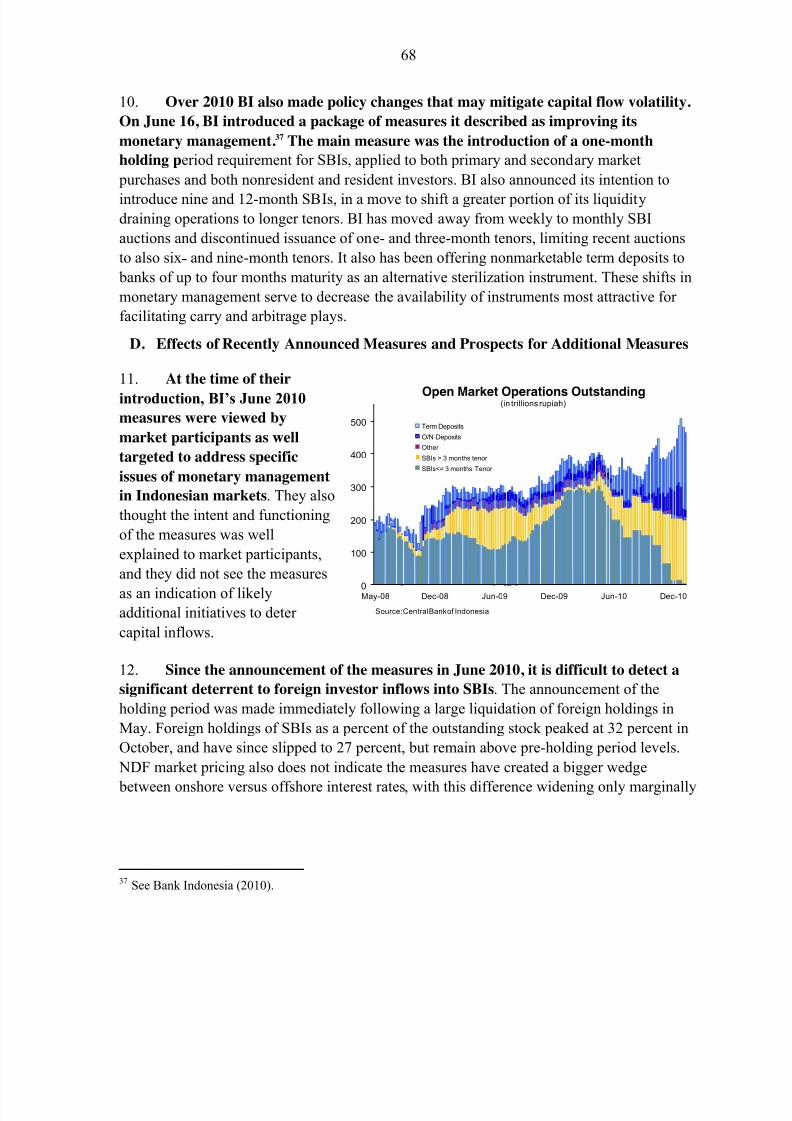
8/2/2019 IMF Ecperiences in Managing Capital Inflows
http://slidepdf.com/reader/full/imf-ecperiences-in-managing-capital-inflows 68/97
68
10. Over 2010 BI also made policy changes that may mitigate capital flow volatility.
On June 16, BI introduced a package of measures it described as improving its
monetary management.37 The main measure was the introduction of a one-month
holding period requirement for SBIs, applied to both primary and secondary market
purchases and both nonresident and resident investors. BI also announced its intention to
introduce nine and 12-month SBIs, in a move to shift a greater portion of its liquiditydraining operations to longer tenors. BI has moved away from weekly to monthly SBI
auctions and discontinued issuance of one- and three-month tenors, limiting recent auctions
to also six˗ and nine-month tenors. It also has been offering nonmarketable term deposits to
banks of up to four months maturity as an alternative sterilization instrument. These shifts in
monetary management serve to decrease the availability of instruments most attractive for
facilitating carry and arbitrage plays.
D. Effects of Recently Announced Measures and Prospects for Additional Measures
11. At the time of their
introduction, BI’s June 2010
measures were viewed by
market participants as well
targeted to address specific
issues of monetary management
in Indonesian markets. They also
thought the intent and functioning
of the measures was well
explained to market participants,
and they did not see the measures
as an indication of likelyadditional initiatives to deter
capital inflows.
12. Since the announcement of the measures in June 2010, it is difficult to detect a
significant deterrent to foreign investor inflows into SBIs. The announcement of the
holding period was made immediately following a large liquidation of foreign holdings in
May. Foreign holdings of SBIs as a percent of the outstanding stock peaked at 32 percent in
October, and have since slipped to 27 percent, but remain above pre-holding period levels.
NDF market pricing also does not indicate the measures have created a bigger wedge
between onshore versus offshore interest rates, with this difference widening only marginally
37 See Bank Indonesia (2010).
0
100
200
300
400
500
May-08 Dec-08 Jun-09 Dec-09 Jun-10 Dec-10
Term Deposits
O/N Deposits
Other
SBIs > 3 months tenor
SBIs<= 3 months Tenor
Open Market Operations Outstanding(in trillions rupiah)
Source: Central Bank of Indonesia
8/2/2019 IMF Ecperiences in Managing Capital Inflows
http://slidepdf.com/reader/full/imf-ecperiences-in-managing-capital-inflows 69/97
69
since the announcement and remains near the historical average for this differential prior to
the announcement of the measures.38
13. Banks noted that both foreign and domestic investors had increasingly
purchased Ministry of Finance bills (SPNs). These bills are not subject to the one-month
holding period, and as a result, interest rates on 12-month SPNs have fallen below yields onthree and six month SBIs, and have fallen even more than 150 basis points below the policy
rate. Outstanding issuance of SPNs is a small fraction of the issuance of SBIs, so these bills
could be benefiting from a scarcity premium as well as a liquidity premium.39 It is unlikely
that foreign investors will be able to use 12-month SPNs quite as effectively as they had used
one-month SBIs for short-term carry and arbitrage trades, because of the longer tenor, and
the lower amount outstanding.
14. Major onshore banks
suggested that the change in net
open position (NOP) regulationswould also likely dampen spot
market volatility and improve
onshore money markets. Prior to
July 1, 2010, banks’ NOP limits in
foreign exchange were 20 percent,
applied both on- and off-balance
sheet and in real time. The June 16
measures eliminated the on-
balance sheet NOP limit, but
imposed an overall NOP limitat 20 percent of capital, within 30 minute windows. The 30-minute window allows for
increased opportunity for trading to maintain positions within the limit. In addition, banks
will be able to engage in foreign exchange swaps to meet the overall position limits. For
example, a bank with an excess dollar position and a short IDR position (perhaps from
offering a customer FX hedge), would be able to sell dollars in the spot market for rupiah,
and buy back the dollars at the forward date in exchange for rupiah (effectively obtaining
rupiah funding by using dollar liquidity).
38 The continued foreign investor interest in SBIs is particularly interesting, given that they are now only
eligible to buy “aged” securities. Initially onshore bond custodians had thought that the holding period on SBIswould greatly diminish foreign investor participation in the SBI market. Dealers who bid at SBI auctions on behalf of foreign investors are now required to hold the securities for one-month before the securities can besold on to foreign investors. As a result, foreign investors can only buy “aged” SBIs, such as 6-month bills with5-months left to maturity. Large custodians had thought that banks would not find it profitable to holdinventories of SBIs on their balance sheets with the intent of selling them to foreign investors after one-month.
39 As of end-2010, outstanding issuance of SBIs was Rp 200 trillion, while that of SPNs was Rp 30 trillion.
4
5
6
7
8
Mar-10 Apr-10 May-10 Jun-10 Jul-10 Aug-10 Sep-10 Oct-10 Nov-10 Dec-10 Jan-11
Money Market Rates(in percent)
3-Month SBI
1-year government bond yield
Overnight interbank
Source: Bloomberg

8/2/2019 IMF Ecperiences in Managing Capital Inflows
http://slidepdf.com/reader/full/imf-ecperiences-in-managing-capital-inflows 70/97
70
15. In December 2010, BI announced additional measures it planned to impose to
address the risks posed by continuing inflows. These included raising the reserve
requirement on foreign currency deposits and re-imposing a limit on short-term foreign
borrowings of banks to 30 percent of capital. This limit had been removed in 2008 in
response to bank funding pressures during the global financial crisis. The government hasannounced it will direct state-owned banks and enterprises to purchase government securities
to support the bond market if outflows cause disorderly market conditions.
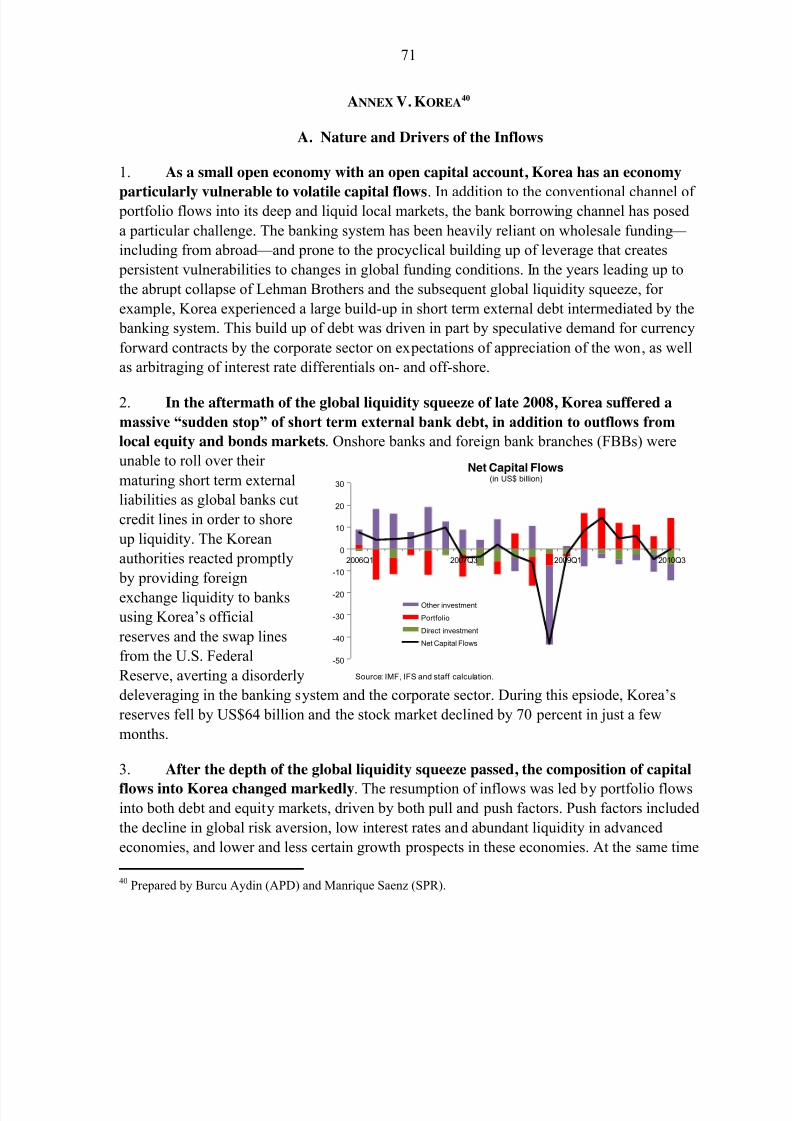
8/2/2019 IMF Ecperiences in Managing Capital Inflows
http://slidepdf.com/reader/full/imf-ecperiences-in-managing-capital-inflows 71/97
71
-50
-40
-30
-20
-10
0
10
20
30
2006Q1 2007Q3 2009Q1 2010Q3
Net Capital Flows(in US$ billion)
Other investment
Portfolio
Direct investment
Net Capital Flows
Source: IMF, IFS and staff calculation.
ANNEX V. KOREA40
A. Nature and Drivers of the Inflows
1. As a small open economy with an open capital account, Korea has an economy
particularly vulnerable to volatile capital flows. In addition to the conventional channel of portfolio flows into its deep and liquid local markets, the bank borrowing channel has posed
a particular challenge. The banking system has been heavily reliant on wholesale funding —
including from abroad — and prone to the procyclical building up of leverage that creates
persistent vulnerabilities to changes in global funding conditions. In the years leading up to
the abrupt collapse of Lehman Brothers and the subsequent global liquidity squeeze, for
example, Korea experienced a large build-up in short term external debt intermediated by the
banking system. This build up of debt was driven in part by speculative demand for currency
forward contracts by the corporate sector on expectations of appreciation of the won, as well
as arbitraging of interest rate differentials on- and off-shore.
2. In the aftermath of the global liquidity squeeze of late 2008, Korea suffered a
massive “sudden stop” of short term external bank debt, in addition to outflows from
local equity and bonds markets. Onshore banks and foreign bank branches (FBBs) were
unable to roll over their
maturing short term external
liabilities as global banks cut
credit lines in order to shore
up liquidity. The Korean
authorities reacted promptly
by providing foreign
exchange liquidity to banks
using Korea’s official
reserves and the swap lines
from the U.S. Federal
Reserve, averting a disorderly
deleveraging in the banking system and the corporate sector. During this epsiode, Korea’s
reserves fell by US$64 billion and the stock market declined by 70 percent in just a few
months.
3. After the depth of the global liquidity squeeze passed, the composition of capital
flows into Korea changed markedly. The resumption of inflows was led by portfolio flowsinto both debt and equity markets, driven by both pull and push factors. Push factors included
the decline in global risk aversion, low interest rates and abundant liquidity in advanced
economies, and lower and less certain growth prospects in these economies. At the same time
40 Prepared by Burcu Aydin (APD) and Manrique Saenz (SPR).
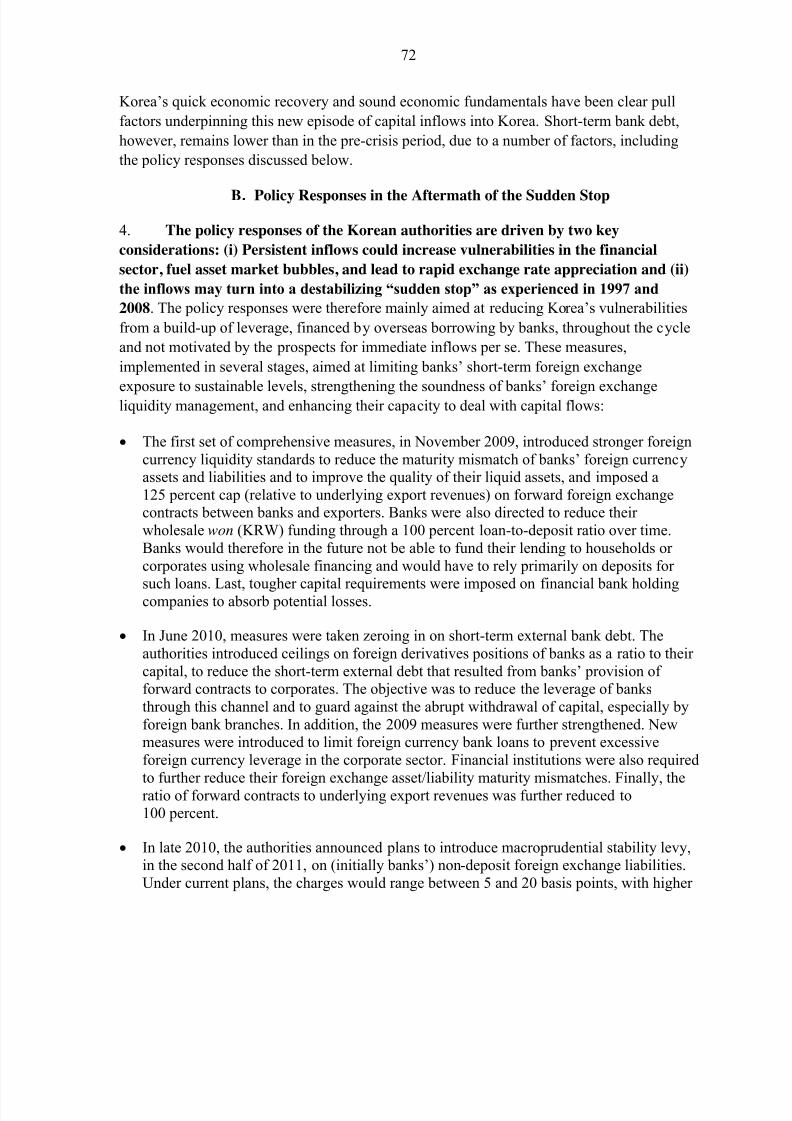
8/2/2019 IMF Ecperiences in Managing Capital Inflows
http://slidepdf.com/reader/full/imf-ecperiences-in-managing-capital-inflows 72/97
72
Korea’s quick economic recovery and sound economic fundamentals have been clear pull
factors underpinning this new episode of capital inflows into Korea. Short-term bank debt,
however, remains lower than in the pre-crisis period, due to a number of factors, including
the policy responses discussed below.
B. Policy Responses in the Aftermath of the Sudden Stop
4. The policy responses of the Korean authorities are driven by two key
considerations: (i) Persistent inflows could increase vulnerabilities in the financial
sector, fuel asset market bubbles, and lead to rapid exchange rate appreciation and (ii)
the inflows may turn into a destabilizing “sudden stop” as experienced in 1997 and
2008. The policy responses were therefore mainly aimed at reducing Korea’s vulnerabilities
from a build-up of leverage, financed by overseas borrowing by banks, throughout the cycle
and not motivated by the prospects for immediate inflows per se. These measures,
implemented in several stages, aimed at limiting banks’ short-term foreign exchange
exposure to sustainable levels, strengthening the soundness of banks’ foreign exchangeliquidity management, and enhancing their capacity to deal with capital flows:
The first set of comprehensive measures, in November 2009, introduced stronger foreigncurrency liquidity standards to reduce the maturity mismatch of banks’ foreign currencyassets and liabilities and to improve the quality of their liquid assets, and imposed a125 percent cap (relative to underlying export revenues) on forward foreign exchangecontracts between banks and exporters. Banks were also directed to reduce their wholesale won (KRW) funding through a 100 percent loan-to-deposit ratio over time.Banks would therefore in the future not be able to fund their lending to households or corporates using wholesale financing and would have to rely primarily on deposits for
such loans. Last, tougher capital requirements were imposed on financial bank holdingcompanies to absorb potential losses.
In June 2010, measures were taken zeroing in on short-term external bank debt. Theauthorities introduced ceilings on foreign derivatives positions of banks as a ratio to their capital, to reduce the short-term external debt that resulted from banks’ provision of forward contracts to corporates. The objective was to reduce the leverage of banksthrough this channel and to guard against the abrupt withdrawal of capital, especially byforeign bank branches. In addition, the 2009 measures were further strengthened. Newmeasures were introduced to limit foreign currency bank loans to prevent excessiveforeign currency leverage in the corporate sector. Financial institutions were also required
to further reduce their foreign exchange asset/liability maturity mismatches. Finally, theratio of forward contracts to underlying export revenues was further reduced to100 percent.
In late 2010, the authorities announced plans to introduce macroprudential stability levy,in the second half of 2011, on (initially banks’) non-deposit foreign exchange liabilities.Under current plans, the charges would range between 5 and 20 basis points, with higher
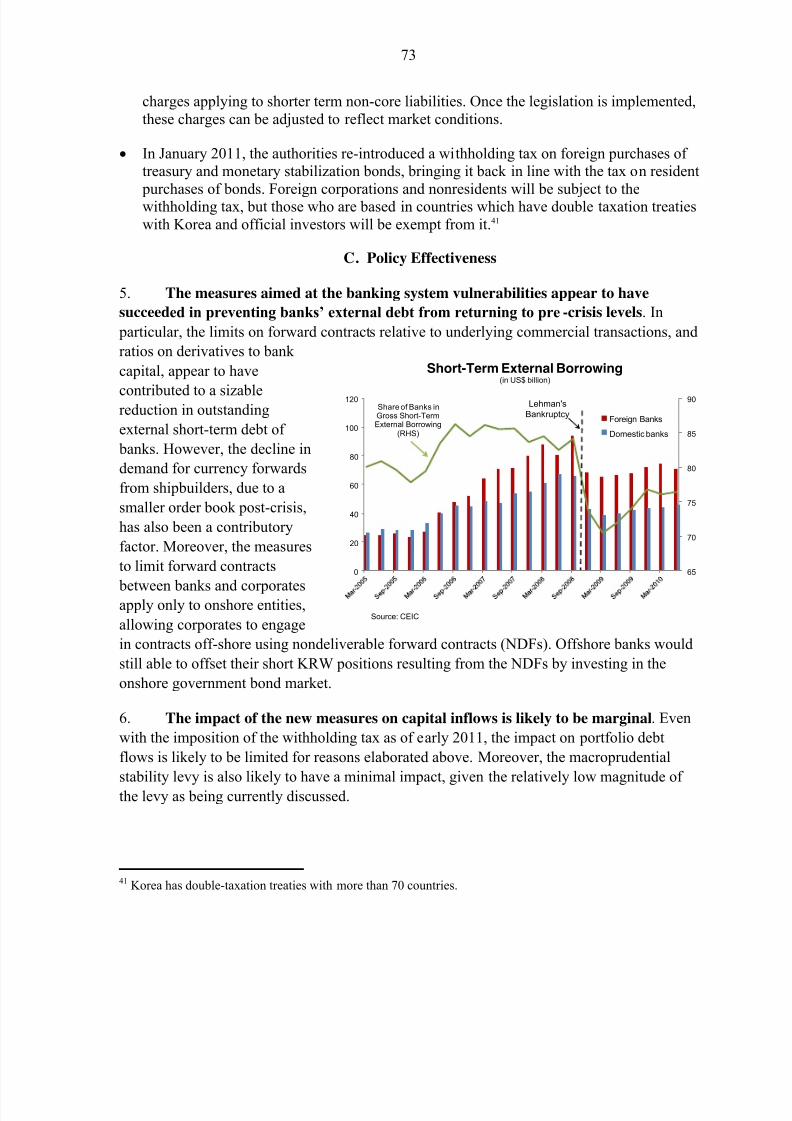
8/2/2019 IMF Ecperiences in Managing Capital Inflows
http://slidepdf.com/reader/full/imf-ecperiences-in-managing-capital-inflows 73/97
73
charges applying to shorter term non-core liabilities. Once the legislation is implemented,these charges can be adjusted to reflect market conditions.
In January 2011, the authorities re-introduced a withholding tax on foreign purchases of treasury and monetary stabilization bonds, bringing it back in line with the tax on resident
purchases of bonds. Foreign corporations and nonresidents will be subject to thewithholding tax, but those who are based in countries which have double taxation treatieswith Korea and official investors will be exempt from it.41
C. Policy Effectiveness
5. The measures aimed at the banking system vulnerabilities appear to have
succeeded in preventing banks’ external debt from returning to pre-crisis levels. In
particular, the limits on forward contracts relative to underlying commercial transactions, and
ratios on derivatives to bank
capital, appear to have
contributed to a sizablereduction in outstanding
external short-term debt of
banks. However, the decline in
demand for currency forwards
from shipbuilders, due to a
smaller order book post-crisis,
has also been a contributory
factor. Moreover, the measures
to limit forward contracts
between banks and corporatesapply only to onshore entities,
allowing corporates to engage
in contracts off-shore using nondeliverable forward contracts (NDFs). Offshore banks would
still able to offset their short KRW positions resulting from the NDFs by investing in the
onshore government bond market.
6. The impact of the new measures on capital inflows is likely to be marginal. Even
with the imposition of the withholding tax as of early 2011, the impact on portfolio debt
flows is likely to be limited for reasons elaborated above. Moreover, the macroprudential
stability levy is also likely to have a minimal impact, given the relatively low magnitude of
the levy as being currently discussed.
41 Korea has double-taxation treaties with more than 70 countries.
65
70
75
80
85
90
0
20
40
60
80
100
120
Short-Term External Borrowing(in US$ billion)
Foreign Banks
Domestic banks
Source: CEIC
Share of Banks inGross Short-TermExternal Borrowing
(RHS)
Lehman'sBankruptcy
8/2/2019 IMF Ecperiences in Managing Capital Inflows
http://slidepdf.com/reader/full/imf-ecperiences-in-managing-capital-inflows 74/97
74
-4
-3
-2
-1
0
1
2
3
4
5
6
2002Q1 2003Q1 2004Q1 2005Q1 2006Q1 2007Q1 2008Q1 2009Q1 2010Q1
Net Capital Flows(in percent of GDP)
FDI
Portfolio Inv.
Others
Net Capital F lows
Source: IMF IFS and staff calculation
ANNEX VI. PERU42
1. Peru has attracted strong capital inflows that represented approximately
7 percent of GDP in 2010. Although the bulk of these flows are dedicated to the real side of
the economy in the form of FDI, a recent spike in debt portfolio flows has caused concern
among the authorities that large capitalinflows could fuel domestic credit and
asset price booms, and create
vulnerabilities in the economy.
2. Peru’s high and sustained
economic growth has attracted
foreign investment. Underlying factors
include strong terms of trade and robust
domestic demand growth mainly driven
by private sector investment. Inaddition to the fact that Peru is an
important producer of gold and copper,
the extraordinary performance of the Peruvian economy is based on strong economic
fundamentals and a solid track record of prudent macroeconomic policy during the current
decade. The country grew at an average 6.3 percent since 2002 — 50 percent above its
peers — and it was among the few countries in the world with positive growth during 2009.
Partly reflecting these achievements, the country was granted investment grade by Fitch and
S&P, and Moody’s in 2008 and 2009 respectively.
3. In addition to these “pull factors”, easy external financing conditions have also
played a role. Ample international liquidity (a “push factor ”) has led investors to search for
opportunities in EMs with higher growth prospects and/or interest rate differential with
respect to AMs. Peru’s higher credit rating, good economic prospects and, to a lesser extent,
positive interest rate differentials led to strong performance in financial assets, which was
reflected in compression of spreads on external debt. Furthermore, foreign investors have
been increasing substantially their holdings of medium- and long-term government domestic
debt (about 45 percent of total outstanding)
4. Peru’s supply of financial assets is limited in comparison to regional peers . The
fixed income market, mostly public debt, is less developed than others in the region and
fairly illiquid as pension funds hold the bulk of these instruments and have followed a buy-
42 Prepared by Federico G. Presciuttini (SPR).
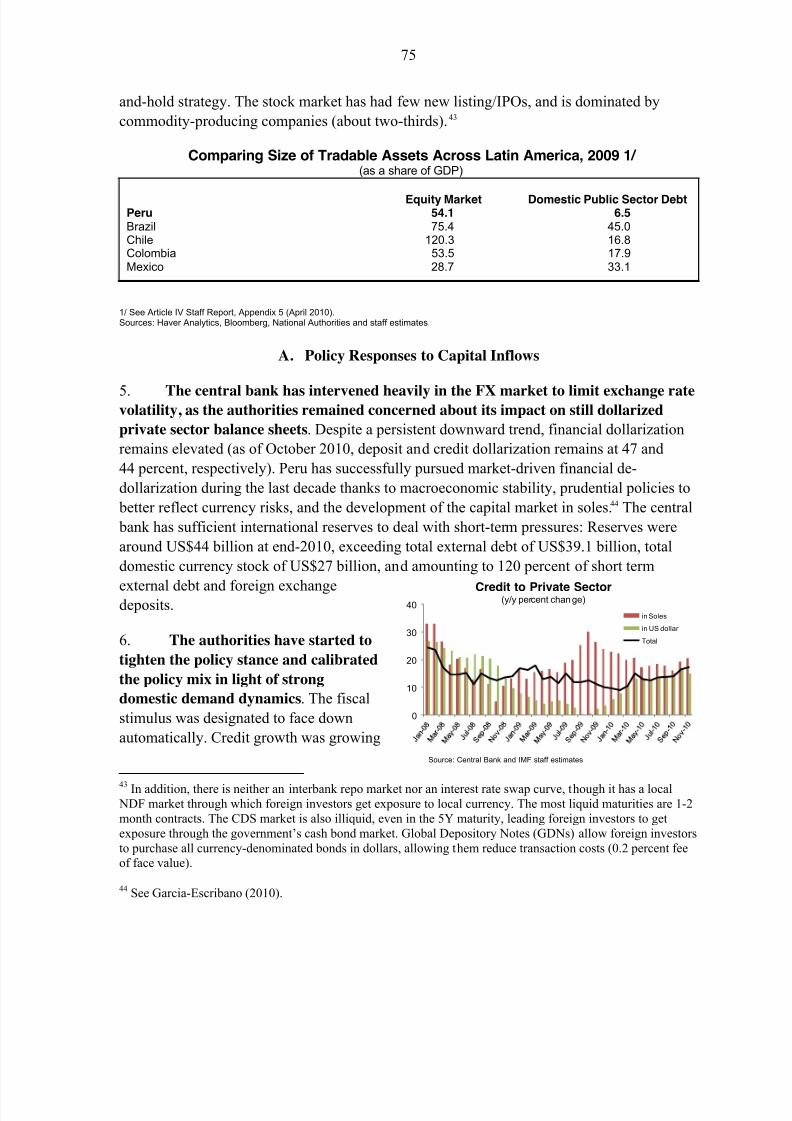
8/2/2019 IMF Ecperiences in Managing Capital Inflows
http://slidepdf.com/reader/full/imf-ecperiences-in-managing-capital-inflows 75/97
75
and-hold strategy. The stock market has had few new listing/IPOs, and is dominated by
commodity-producing companies (about two-thirds). 43
Comparing Size of Tradable Assets Across Latin America, 2009 1/ (as a share of GDP)
Equity Market Domestic Public Sector DebtPeru 54.1 6.5Brazil 75.4 45.0Chile 120.3 16.8Colombia 53.5 17.9Mexico 28.7 33.1
1/ See Article IV Staff Report, Appendix 5 (April 2010).Sources: Haver Analytics, Bloomberg, National Authorities and staff estimates.
A. Policy Responses to Capital Inflows
5. The central bank has intervened heavily in the FX market to limit exchange ratevolatility, as the authorities remained concerned about its impact on still dollarized
private sector balance sheets. Despite a persistent downward trend, financial dollarization
remains elevated (as of October 2010, deposit and credit dollarization remains at 47 and
44 percent, respectively). Peru has successfully pursued market-driven financial de-
dollarization during the last decade thanks to macroeconomic stability, prudential policies to
better reflect currency risks, and the development of the capital market in soles.44 The central
bank has sufficient international reserves to deal with short-term pressures: Reserves were
around US$44 billion at end-2010, exceeding total external debt of US$39.1 billion, total
domestic currency stock of US$27 billion, and amounting to 120 percent of short term
external debt and foreign exchangedeposits.
6. The authorities have started to
tighten the policy stance and calibrated
the policy mix in light of strong
domestic demand dynamics. The fiscal
stimulus was designated to face down
automatically. Credit growth was growing
43 In addition, there is neither an interbank repo market nor an interest rate swap curve, though it has a local NDF market through which foreign investors get exposure to local currency. The most liquid maturities are 1-2month contracts. The CDS market is also illiquid, even in the 5Y maturity, leading foreign investors to getexposure through the government’s cash bond market. Global Depository Notes (GDNs) allow foreign investorsto purchase all currency-denominated bonds in dollars, allowing them reduce transaction costs (0.2 percent feeof face value).
44 See Garcia-Escribano (2010).
0
10
20
30
40Credit to Private Sector(y/y percent change)
in Soles
in US dollar
Total
Source: Central Bank and IMF staff estimates
8/2/2019 IMF Ecperiences in Managing Capital Inflows
http://slidepdf.com/reader/full/imf-ecperiences-in-managing-capital-inflows 76/97
76
at 20 percent (y/y) in recent months, albeit at a much slower pace than in a boom before the
crisis (close to 40 percent). Since early 2010, the policy rate has been increased by 225 basis
points up to 3.25 percent and the cyclically-adjusted primary balance is expected to improve
from -0.8 percent of GDP in 2010 to 0.7 percent of GDP in 2011.
7. The authorities have also actively used reserve requirements and other measuresto manage liquidity and extend maturity of FX liabilities with the aim to strengthen
financial stability.
Deposit reserve requirements: a) minimum unremunerated reserve requirements in
domestic and foreign currencies have increased from 6 percent to 9 percent (step-
increases) since June 2010, b) marginal reserve requirements in domestic currency have
increased from 0 to 25 percent (step increases) since July 2010 and in foreign currency
from 30 to 55 percent since June 2010, and c) average reserve requirements on both
domestic and foreign currency deposits were increased by 25 basis points from 11.8
percent and 35.6 percent, respectively, in January 2011.
Reserve requirements on foreign currency liabilities with maturity less than two years:
the rate went from 60 percent in January 2010 to 35 percent in June 2010. Then it was
increased in steps to 75 percent in September 2010. In January 2011, the reserve
requirements on foreign currency liabilities were reduced to 60 percent.
B. Prudential and Other Measures
8. In addition to these policy responses, the central bank adopted additional
measures to achieve a combination of goals. The objectives for the measures listed below
have varied by the measure and have included reducing FX volatility, enhancing financialstability, developing capital markets, managing inflows amongst other objects.
In February 2010, limits on banks’ net FX position were changed: a) long net FX
positions reduced to 75 percent of net equity from 100 percent, b) short net FX positions
raised to 15 percent of net equity from 10 percent. In January 2011, the long net FX
position was reduced to 60 percent of net equity.
Limits on pension funds’ investment abroad were increased in steps since February from
24 percent to 30 percent (in September 2010).45
In June 2010, private pension funds’ limit on trading FX imposed at 0.85 percent of assets under management (for daily transactions) and 1.95 percent of assets under management (over 5-day period).
45 The main purpose of these measures is to reduce the tension between growing demand of assets by pensionfunds and lack of new equity and debt issuance in the domestic market, which put pressure on asset prices.
8/2/2019 IMF Ecperiences in Managing Capital Inflows
http://slidepdf.com/reader/full/imf-ecperiences-in-managing-capital-inflows 77/97
77
In July 2010, additional capital requirements for FX credit risk exposure wereimplemented.
In December 2010, a new law for covered bonds for mortgages established a loan-to-value ratio of 80 percent.
In January 2011, the Superintendency of Banks and Insurance imposed a limit on NDFand other derivatives of the financial system to either 40 percent of assets or PEN 400million (US$144 million), whichever is the highest.
9. Furthermore, the central bank has limited the array of instruments to channel
short-term flows from nonresidents. The main measure was the increase (in August 2010)
of the fee on nonresidents’ purchases of central bank certificates of deposits (CDs) from 10
to 400 basis points, as well as the increase (in September 2010) of reserve requirements for
domestic currency deposits in financial institutions to 120 percent (increasing from 35
percent in June 2010). In October 2010, the central bank sterilization instrument was shifted
from a tradable instrument (CDs) to a non-tradable instrument (term deposits) which limitsaccess only to financial institutions.
C. Effectiveness of the Measures
10. The main aim of central bank’s intervention was to limit FX volatility . This
would help reduce the possibility of a negative impact on balance sheets from destabilizing
outflows (and consequent exchange rate overshooting), which in turn could also have an
impact on macroeconomic stability. The nominal exchange rate has been among the most
stable in the region. The authorities have intervened heavily in the market and sterilized the
intervention to maintain the overnight rate in line with the policy rate, limiting appreciation
spikes and volatility. 46 Measures implemented to limit carry trade operations have been
effective. Carry trade operations were done mainly by purchasing central bank short-term
paper and through short term deposits in local currency at local banks.
11. The application of reserve requirements, not only to deposits but also to FX
liabilities, helped stabilize credit growth. Credit growth declined from 40 percent before
the crisis to 20 percent during 2010. Besides, the measures also helped in extending the
maturity of FX liabilities in the financial system. However, the authorities are aware that
these measures have their own limitations as they can lead to financial circumvention.
12. Measures implemented with the purpose of limiting foreign investors’ exposureto local-currency-denominated assets were partially effective. Investors shifted from
46 The sterilization costs have been 0.3 percent of GDP. The Central Bank currently has operating profits to cover these
costs.

8/2/2019 IMF Ecperiences in Managing Capital Inflows
http://slidepdf.com/reader/full/imf-ecperiences-in-managing-capital-inflows 78/97
78
short- to longer-term government bonds following the increase of the fee on central bank
CDs, thus the measures did not discourage the flows to debt markets. Overall, the imposition
of reserve requirements for financial institutions on nonresident deposits as well as the shift
of sterilization instruments from CDs to time deposits closed a window for nonresidents to
gain exposure to short-term central bank paper.
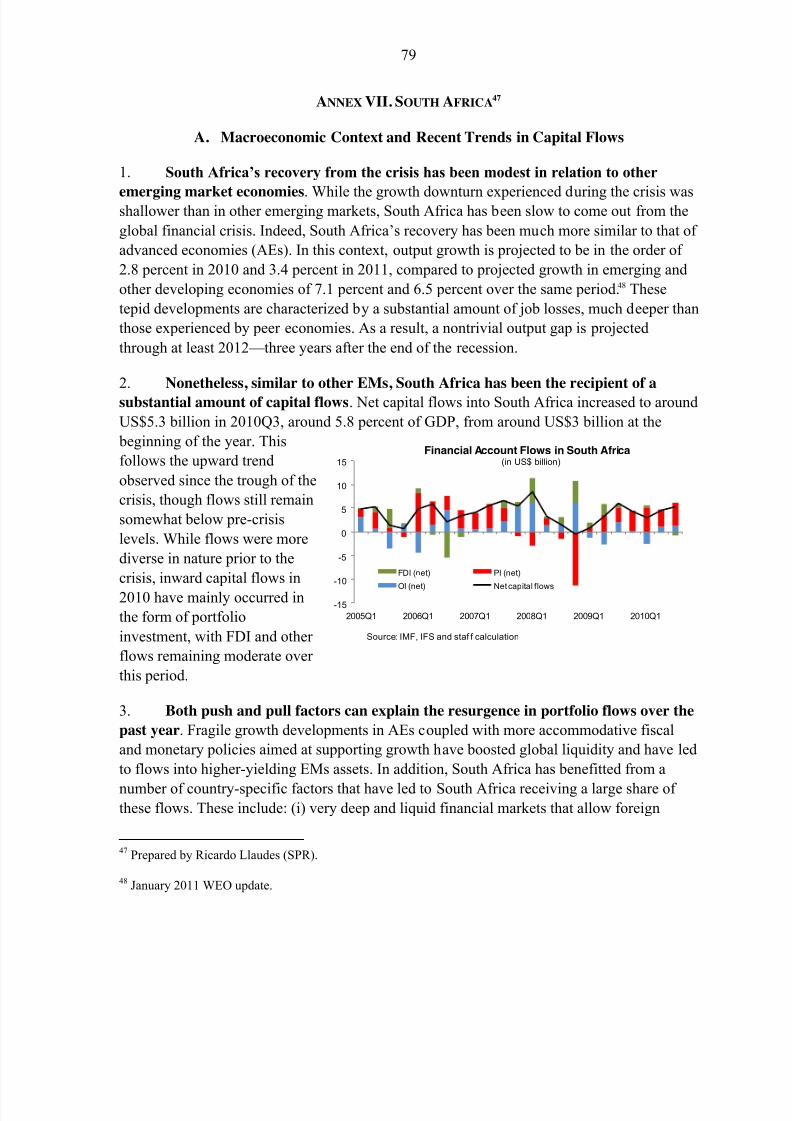
8/2/2019 IMF Ecperiences in Managing Capital Inflows
http://slidepdf.com/reader/full/imf-ecperiences-in-managing-capital-inflows 79/97
79
-15
-10
-5
0
5
10
15
2005Q1 2006Q1 2007Q1 2008Q1 2009Q1 2010Q1
FDI (net) PI (net)
OI (net) Net capital flows
Financial Account Flows in South Africa(in US$ billion)
Source: IMF, IFS and staf f calculation
ANNEX VII. SOUTH AFRICA47
A. Macroeconomic Context and Recent Trends in Capital Flows
1. South Africa’s recovery from the crisis has been modest in relation to other
emerging market economies. While the growth downturn experienced during the crisis wasshallower than in other emerging markets, South Africa has been slow to come out from the
global financial crisis. Indeed, South Africa’s recovery has been much more similar to that of
advanced economies (AEs). In this context, output growth is projected to be in the order of
2.8 percent in 2010 and 3.4 percent in 2011, compared to projected growth in emerging and
other developing economies of 7.1 percent and 6.5 percent over the same period.48 These
tepid developments are characterized by a substantial amount of job losses, much deeper than
those experienced by peer economies. As a result, a nontrivial output gap is projected
through at least 2012 — three years after the end of the recession.
2. Nonetheless, similar to other EMs, South Africa has been the recipient of a
substantial amount of capital flows. Net capital flows into South Africa increased to around
US$5.3 billion in 2010Q3, around 5.8 percent of GDP, from around US$3 billion at the
beginning of the year. This
follows the upward trend
observed since the trough of the
crisis, though flows still remain
somewhat below pre-crisis
levels. While flows were more
diverse in nature prior to the
crisis, inward capital flows in
2010 have mainly occurred in
the form of portfolio
investment, with FDI and other
flows remaining moderate over
this period.
3. Both push and pull factors can explain the resurgence in portfolio flows over the
past year. Fragile growth developments in AEs coupled with more accommodative fiscal
and monetary policies aimed at supporting growth have boosted global liquidity and have led
to flows into higher-yielding EMs assets. In addition, South Africa has benefitted from a
number of country-specific factors that have led to South Africa receiving a large share of these flows. These include: (i) very deep and liquid financial markets that allow foreign
47 Prepared by Ricardo Llaudes (SPR).
48 January 2011 WEO update.
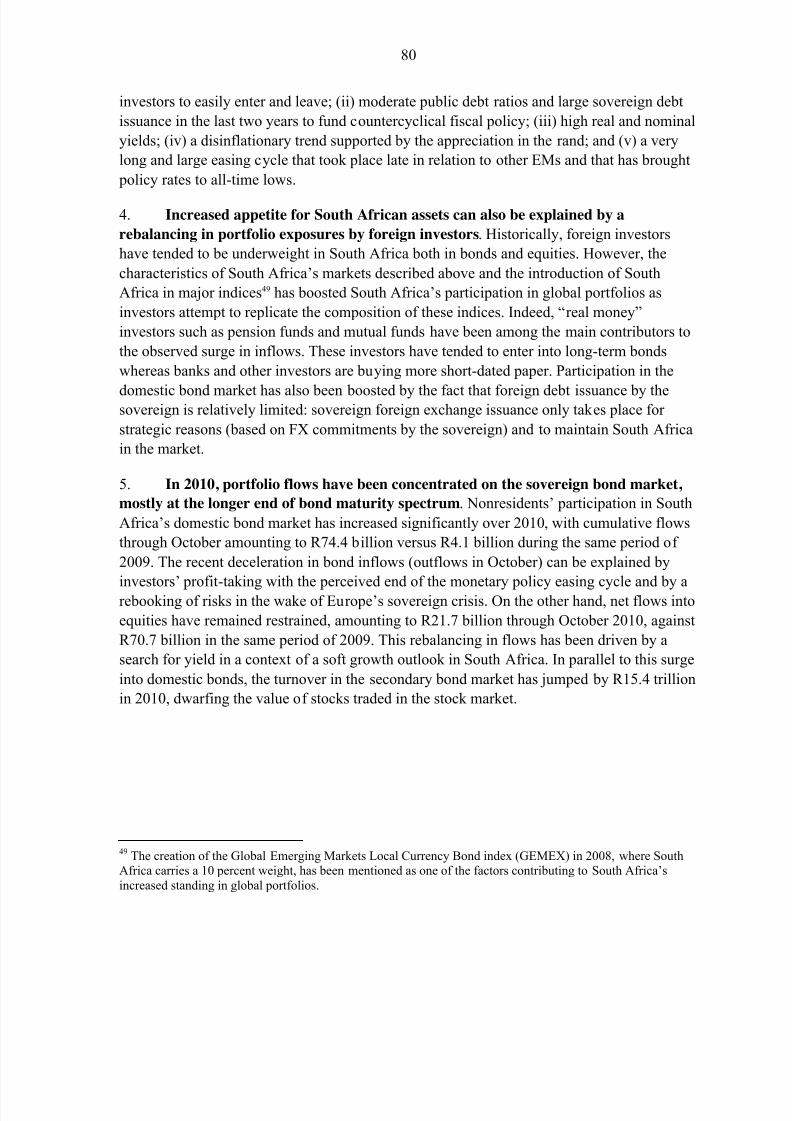
8/2/2019 IMF Ecperiences in Managing Capital Inflows
http://slidepdf.com/reader/full/imf-ecperiences-in-managing-capital-inflows 80/97
80
investors to easily enter and leave; (ii) moderate public debt ratios and large sovereign debt
issuance in the last two years to fund countercyclical fiscal policy; (iii) high real and nominal
yields; (iv) a disinflationary trend supported by the appreciation in the rand; and (v) a very
long and large easing cycle that took place late in relation to other EMs and that has brought
policy rates to all-time lows.
4. Increased appetite for South African assets can also be explained by a
rebalancing in portfolio exposures by foreign investors. Historically, foreign investors
have tended to be underweight in South Africa both in bonds and equities. However, the
characteristics of South Af rica’s markets described above and the introduction of South
Africa in major indices49 has boosted South Africa’s participation in global portfolios as
investors attempt to replicate the composition of these indices. Indeed, “real money”
investors such as pension funds and mutual funds have been among the main contributors to
the observed surge in inflows. These investors have tended to enter into long-term bonds
whereas banks and other investors are buying more short-dated paper. Participation in the
domestic bond market has also been boosted by the fact that foreign debt issuance by thesovereign is relatively limited: sovereign foreign exchange issuance only takes place for
strategic reasons (based on FX commitments by the sovereign) and to maintain South Africa
in the market.
5. In 2010, portfolio flows have been concentrated on the sovereign bond market,
mostly at the longer end of bond maturity spectrum. Nonresidents’ participation in South
Africa’s domestic bond market has increased significantly over 2010, with cumulative flows
through October amounting to R74.4 billion versus R4.1 billion during the same period of
2009. The recent deceleration in bond inflows (outflows in October) can be explained by
investors’ profit-taking with the perceived end of the monetary policy easing cycle and by arebooking of risks in the wake of Europe’s sovereign crisis. On the other hand, net flows into
equities have remained restrained, amounting to R21.7 billion through October 2010, against
R70.7 billion in the same period of 2009. This rebalancing in flows has been driven by a
search for yield in a context of a soft growth outlook in South Africa. In parallel to this surge
into domestic bonds, the turnover in the secondary bond market has jumped by R15.4 trillion
in 2010, dwarfing the value of stocks traded in the stock market.
49 The creation of the Global Emerging Markets Local Currency Bond index (GEMEX) in 2008, where SouthAfrica carries a 10 percent weight, has been mentioned as one of the factors contributing to South Africa’sincreased standing in global portfolios.
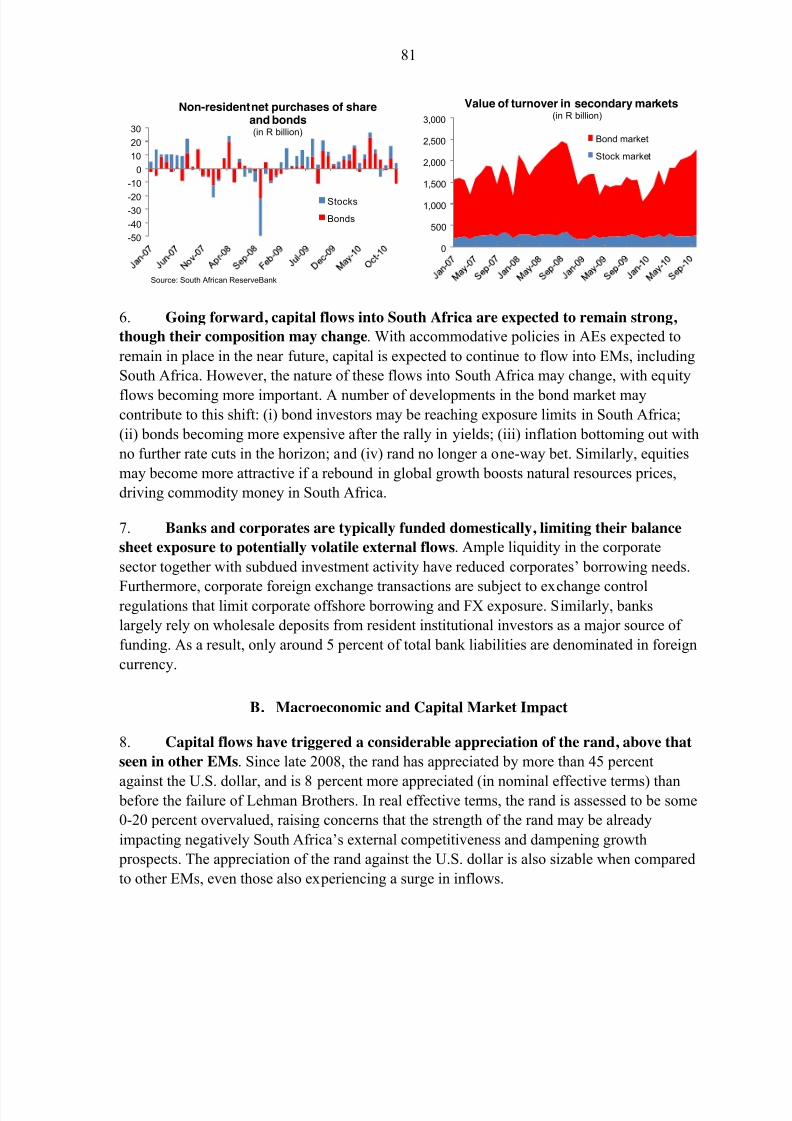
8/2/2019 IMF Ecperiences in Managing Capital Inflows
http://slidepdf.com/reader/full/imf-ecperiences-in-managing-capital-inflows 81/97
81
6. Going forward, capital flows into South Africa are expected to remain strong,
though their composition may change. With accommodative policies in AEs expected to
remain in place in the near future, capital is expected to continue to flow into EMs, including
South Africa. However, the nature of these flows into South Africa may change, with equity
flows becoming more important. A number of developments in the bond market maycontribute to this shift: (i) bond investors may be reaching exposure limits in South Africa;
(ii) bonds becoming more expensive after the rally in yields; (iii) inflation bottoming out with
no further rate cuts in the horizon; and (iv) rand no longer a one-way bet. Similarly, equities
may become more attractive if a rebound in global growth boosts natural resources prices,
driving commodity money in South Africa.
7. Banks and corporates are typically funded domestically, limiting their balance
sheet exposure to potentially volatile external flows. Ample liquidity in the corporate
sector together with subdued investment activity have reduced corporates’ borrowing needs.
Furthermore, corporate foreign exchange transactions are subject to exchange controlregulations that limit corporate offshore borrowing and FX exposure. Similarly, banks
largely rely on wholesale deposits from resident institutional investors as a major source of
funding. As a result, only around 5 percent of total bank liabilities are denominated in foreign
currency.
B. Macroeconomic and Capital Market Impact
8. Capital flows have triggered a considerable appreciation of the rand, above that
seen in other EMs. Since late 2008, the rand has appreciated by more than 45 percent
against the U.S. dollar, and is 8 percent more appreciated (in nominal effective terms) than before the failure of Lehman Brothers. In real effective terms, the rand is assessed to be some
0-20 percent overvalued, raising concerns that the strength of the rand may be already
impacting negatively South Africa’s external competitiveness and dampening growth
prospects. The appreciation of the rand against the U.S. dollar is also sizable when compared
to other EMs, even those also experiencing a surge in inflows.
-50
-40
-30-20
-10
0
10
20
30
Stocks
Bonds
Non-residentnet purchases of shareand bonds(in R billion)
Source: South African ReserveBank
0
500
1,000
1,500
2,000
2,500
3,000
Bond market
Stock market
Value of turnover in secondary markets(in R billion)
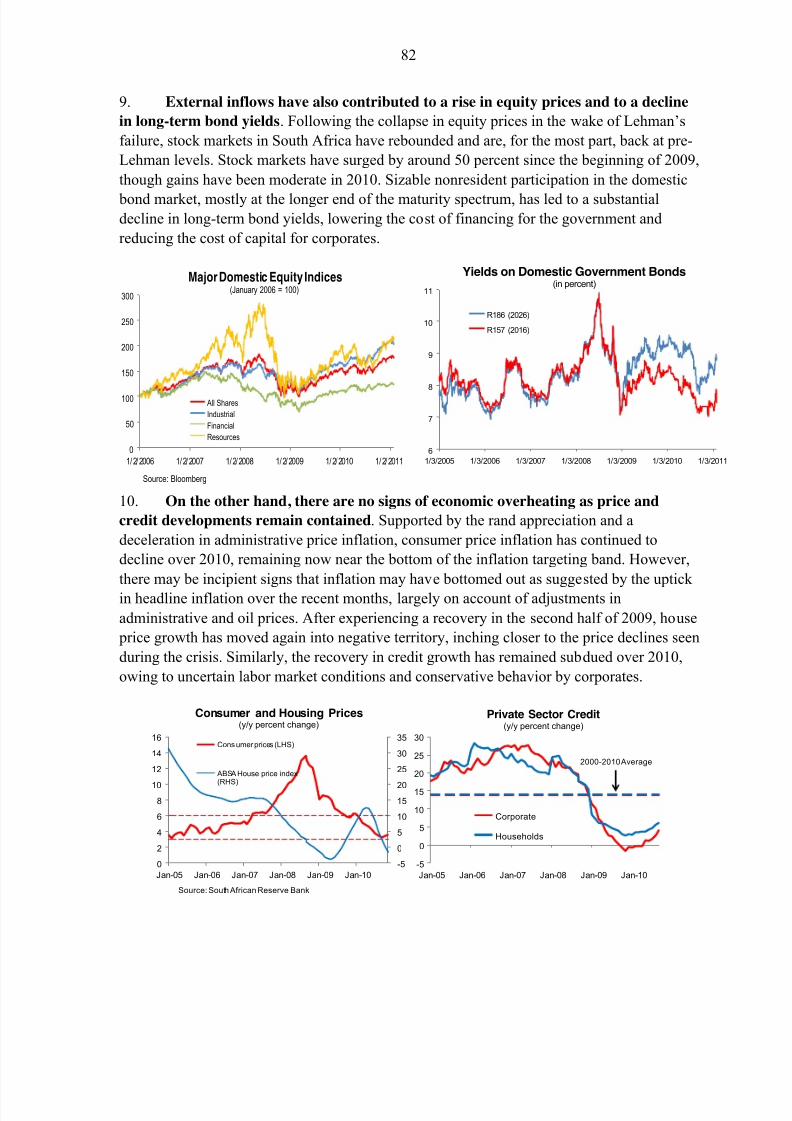
8/2/2019 IMF Ecperiences in Managing Capital Inflows
http://slidepdf.com/reader/full/imf-ecperiences-in-managing-capital-inflows 82/97
82
9. External inflows have also contributed to a rise in equity prices and to a decline
in long-term bond yields. Following the collapse in equity prices in the wake of Lehman’s
failure, stock markets in South Africa have rebounded and are, for the most part, back at pre-
Lehman levels. Stock markets have surged by around 50 percent since the beginning of 2009,
though gains have been moderate in 2010. Sizable nonresident participation in the domestic
bond market, mostly at the longer end of the maturity spectrum, has led to a substantialdecline in long-term bond yields, lowering the cost of financing for the government and
reducing the cost of capital for corporates.
10. On the other hand, there are no signs of economic overheating as price and
credit developments remain contained. Supported by the rand appreciation and a
deceleration in administrative price inflation, consumer price inflation has continued to
decline over 2010, remaining now near the bottom of the inflation targeting band. However,
there may be incipient signs that inflation may have bottomed out as suggested by the uptick
in headline inflation over the recent months, largely on account of adjustments in
administrative and oil prices. After experiencing a recovery in the second half of 2009, house
price growth has moved again into negative territory, inching closer to the price declines seen
during the crisis. Similarly, the recovery in credit growth has remained subdued over 2010,
owing to uncertain labor market conditions and conservative behavior by corporates.
-5
0
5
10
15
20
25
30
Jan-05 Jan-06 Jan-07 Jan-08 Jan-09 Jan-10
Corporate
Households
Private Sector Credit(y/y percent change)
2000-2010 Average
-5
0
5
10
15
20
25
30
35
0
2
4
6
8
10
12
14
16
Jan-05 Jan-06 Jan-07 Jan-08 Jan-09 Jan-10
Cons umer prices (LHS)
ABSA House price index
(RHS)
Consumer and Housing Prices(y/y percent change)
Source: South African Reserve Bank
0
50
100
150
200
250
300
1/2/2006 1/2/2007 1/2/2008 1/2/2009 1/2/2010 1/2/2011
All Shares
Industrial
Financial
Resources
Major Domestic Equity Indices(January 2006 = 100)
Source: Bloomberg
6
7
8
9
10
11
1/3/2005 1/3/2006 1/3/2007 1/3/2008 1/3/2009 1/3/2010 1/3/2011
R186 (2026)
R157 (2016)
Yields on Domestic Government Bonds(in percent)
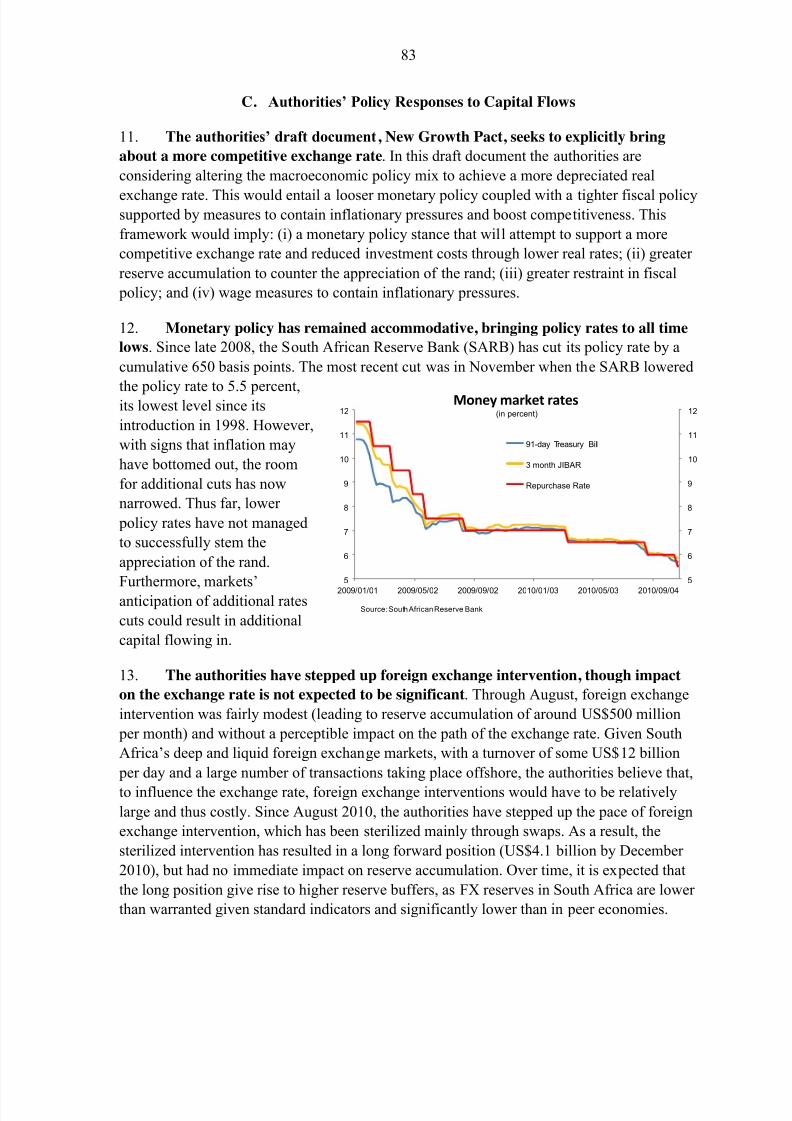
8/2/2019 IMF Ecperiences in Managing Capital Inflows
http://slidepdf.com/reader/full/imf-ecperiences-in-managing-capital-inflows 83/97
83
C. Authorities’ Policy Responses to Capital Flows
11. The authorities’ draft document, New Growth Pact, seeks to explicitly bring
about a more competitive exchange rate. In this draft document the authorities are
considering altering the macroeconomic policy mix to achieve a more depreciated real
exchange rate. This would entail a looser monetary policy coupled with a tighter fiscal policysupported by measures to contain inflationary pressures and boost competitiveness. This
framework would imply: (i) a monetary policy stance that will attempt to support a more
competitive exchange rate and reduced investment costs through lower real rates; (ii) greater
reserve accumulation to counter the appreciation of the rand; (iii) greater restraint in fiscal
policy; and (iv) wage measures to contain inflationary pressures.
12. Monetary policy has remained accommodative, bringing policy rates to all time
lows. Since late 2008, the South African Reserve Bank (SARB) has cut its policy rate by a
cumulative 650 basis points. The most recent cut was in November when the SARB lowered
the policy rate to 5.5 percent,its lowest level since its
introduction in 1998. However,
with signs that inflation may
have bottomed out, the room
for additional cuts has now
narrowed. Thus far, lower
policy rates have not managed
to successfully stem the
appreciation of the rand.
Furthermore, markets’anticipation of additional rates
cuts could result in additional
capital flowing in.
13. The authorities have stepped up foreign exchange intervention, though impact
on the exchange rate is not expected to be significant. Through August, foreign exchange
intervention was fairly modest (leading to reserve accumulation of around US$500 million
per month) and without a perceptible impact on the path of the exchange rate. Given South
Africa’s deep and liquid foreign exchange markets, with a turnover of some US$12 billion
per day and a large number of transactions taking place offshore, the authorities believe that,
to influence the exchange rate, foreign exchange interventions would have to be relatively
large and thus costly. Since August 2010, the authorities have stepped up the pace of foreign
exchange intervention, which has been sterilized mainly through swaps. As a result, the
sterilized intervention has resulted in a long forward position (US$4.1 billion by December
2010), but had no immediate impact on reserve accumulation. Over time, it is expected that
the long position give rise to higher reserve buffers, as FX reserves in South Africa are lower
than warranted given standard indicators and significantly lower than in peer economies.
5
6
7
8
9
10
11
12
5
6
7
8
9
10
11
12
2009/01/01 2009/05/02 2009/09/02 2010/01/03 2010/05/03 2010/09/04
Money market rates(in percent)
91-day Treasury Bill
3 month JIBAR
Repurchase Rate
Source: South African Reserve Bank
8/2/2019 IMF Ecperiences in Managing Capital Inflows
http://slidepdf.com/reader/full/imf-ecperiences-in-managing-capital-inflows 84/97
84
14. Controls on outflows are gradually being liberalized. South African resident
entities and individuals are subject to a range of capital controls. These have been eased
considerably over the years. However, the pace of relaxing the controls on residents’ foreign
exchange transactions is constrained by the heavy reliance of the banking system on
wholesale funding. In other words, increased offshore allowance for local institutional
investors may drive offshore liquidity that is essential to support banks’ funding and balancesheets. While it is not clear the extent to which the previous limits were binding, the new
measures may lead to greater outflows that could help offset portfolio inflows and would
support two-way demand for the rand.
15. The authorities are carefully monitoring the tax measures introduced by several
countries. In this context, “further steps to moderate the impact of capital flows on the South
African economy will be considered, drawing on both international experience and
assessment of the likely local impact” (South Africa Medium Term Budget Policy Statement,
p. 18). Nonetheless, both authorities and market participants are concerned that controls on
inflows may permanently drive away capital flows.
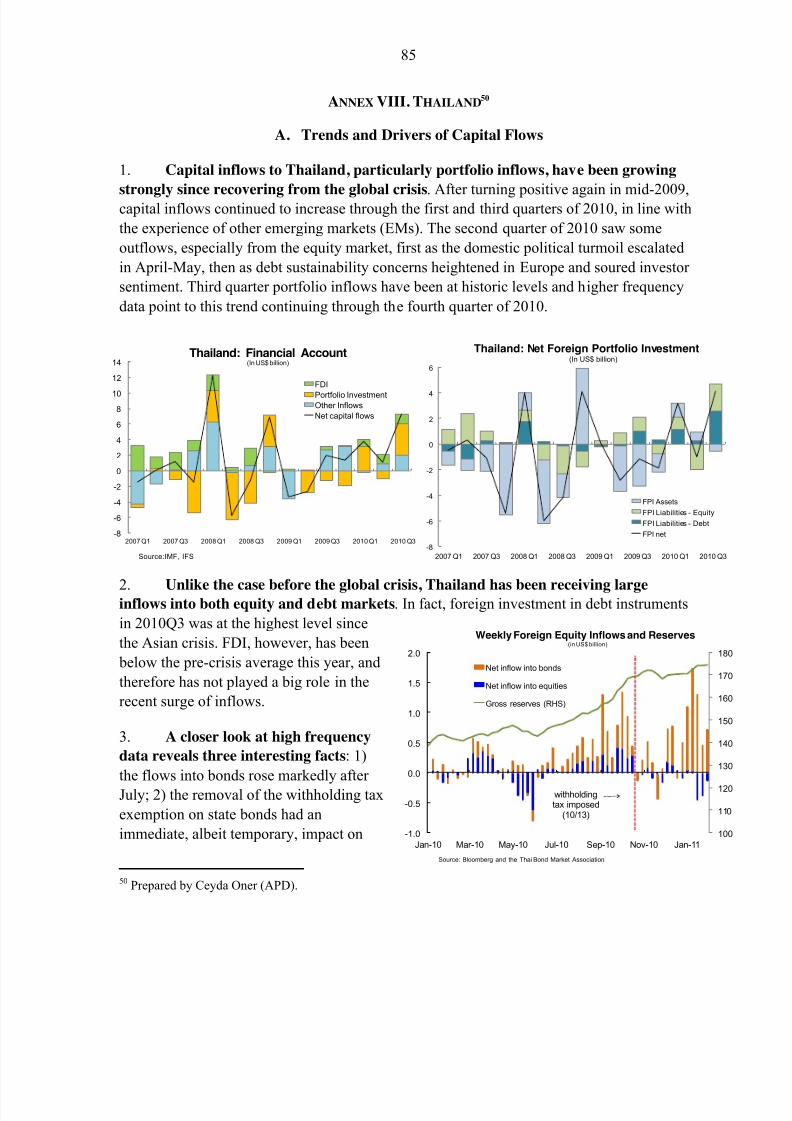
8/2/2019 IMF Ecperiences in Managing Capital Inflows
http://slidepdf.com/reader/full/imf-ecperiences-in-managing-capital-inflows 85/97
85
ANNEX VIII. THAILAND50
A. Trends and Drivers of Capital Flows
1. Capital inflows to Thailand, particularly portfolio inflows, have been growing
strongly since recovering from the global crisis. After turning positive again in mid-2009,capital inflows continued to increase through the first and third quarters of 2010, in line with
the experience of other emerging markets (EMs). The second quarter of 2010 saw some
outflows, especially from the equity market, first as the domestic political turmoil escalated
in April-May, then as debt sustainability concerns heightened in Europe and soured investor
sentiment. Third quarter portfolio inflows have been at historic levels and higher frequency
data point to this trend continuing through the fourth quarter of 2010.
2. Unlike the case before the global crisis, Thailand has been receiving largeinflows into both equity and debt markets. In fact, foreign investment in debt instruments
in 2010Q3 was at the highest level since
the Asian crisis. FDI, however, has been
below the pre-crisis average this year, and
therefore has not played a big role in the
recent surge of inflows.
3. A closer look at high frequency
data reveals three interesting facts: 1)
the flows into bonds rose markedly after
July; 2) the removal of the withholding tax
exemption on state bonds had an
immediate, albeit temporary, impact on
50 Prepared by Ceyda Oner (APD).
-8
-6
-4
-2
0
2
4
6
8
10
12
14
2007 Q1 2007 Q3 2008 Q1 2008 Q3 2009 Q1 2009 Q3 2010 Q1 2010 Q3
FDI
Portfolio InvestmentOther Inflows
Net capital flows
Thailand: Financial Account(In US$ billion)
Source:IMF, IFS
-8
-6
-4
-2
0
2
4
6
2007 Q1 2007 Q3 2008 Q1 2008 Q3 2009 Q1 2009 Q3 2010 Q1 2010 Q3
FPI Assets
FPI Liabilities - Equity
FPI Liabilities - Debt
FPI net
Thailand: Net Foreign Portfolio Investment(In US$ billion)
100
110
120
130
140
150
160
170
180
-1.0
-0.5
0.0
0.5
1.0
1.5
2.0
Jan-10 Mar-10 May-10 Jul-10 Sep-10 Nov-10 Jan-11
Net inflow into bonds
Net inflow into equities
Gross reserves (RHS)
Weekly Foreign Equity Inflows and Reserves(in US$ billion)
withholdingtax imposed
(10/13)
Source: Bloomberg and the Thai Bond Market Association.
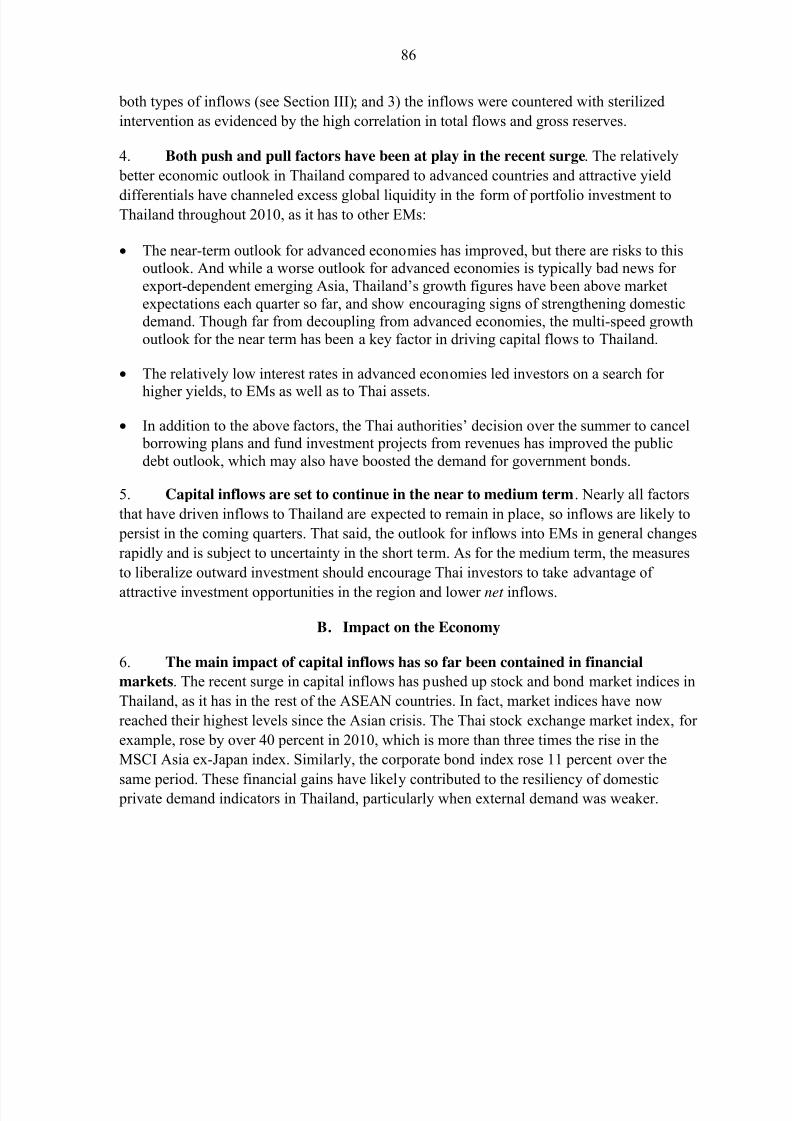
8/2/2019 IMF Ecperiences in Managing Capital Inflows
http://slidepdf.com/reader/full/imf-ecperiences-in-managing-capital-inflows 86/97
86
both types of inflows (see Section III); and 3) the inflows were countered with sterilized
intervention as evidenced by the high correlation in total flows and gross reserves.
4. Both push and pull factors have been at play in the recent surge. The relatively
better economic outlook in Thailand compared to advanced countries and attractive yield
differentials have channeled excess global liquidity in the form of portfolio investment toThailand throughout 2010, as it has to other EMs:
The near-term outlook for advanced economies has improved, but there are risks to thisoutlook. And while a worse outlook for advanced economies is typically bad news for export-dependent emerging Asia, Thailand’s growth figures have been above marketexpectations each quarter so far, and show encouraging signs of strengthening domesticdemand. Though far from decoupling from advanced economies, the multi-speed growthoutlook for the near term has been a key factor in driving capital flows to Thailand.
The relatively low interest rates in advanced economies led investors on a search for
higher yields, to EMs as well as to Thai assets.
In addition to the above factors, the Thai authorities’ decision over the summer to cancel borrowing plans and fund investment projects from revenues has improved the publicdebt outlook, which may also have boosted the demand for government bonds.
5. Capital inflows are set to continue in the near to medium term . Nearly all factors
that have driven inflows to Thailand are expected to remain in place, so inflows are likely to
persist in the coming quarters. That said, the outlook for inflows into EMs in general changes
rapidly and is subject to uncertainty in the short term. As for the medium term, the measures
to liberalize outward investment should encourage Thai investors to take advantage of
attractive investment opportunities in the region and lower net inflows.
B. Impact on the Economy
6. The main impact of capital inflows has so far been contained in financial
markets. The recent surge in capital inflows has pushed up stock and bond market indices in
Thailand, as it has in the rest of the ASEAN countries. In fact, market indices have now
reached their highest levels since the Asian crisis. The Thai stock exchange market index, for
example, rose by over 40 percent in 2010, which is more than three times the rise in the
MSCI Asia ex-Japan index. Similarly, the corporate bond index rose 11 percent over the
same period. These financial gains have likely contributed to the resiliency of domestic private demand indicators in Thailand, particularly when external demand was weaker.
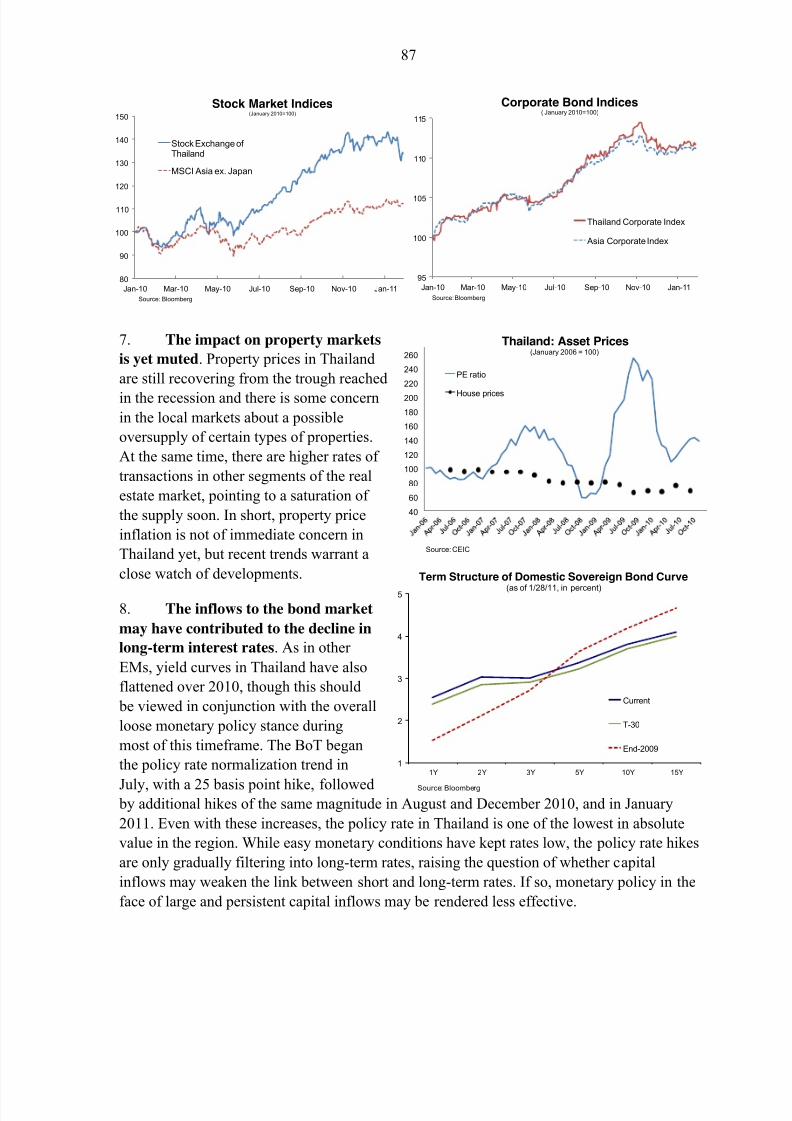
8/2/2019 IMF Ecperiences in Managing Capital Inflows
http://slidepdf.com/reader/full/imf-ecperiences-in-managing-capital-inflows 87/97
87
1
2
3
4
5
1Y 2Y 3Y 5Y 10Y 15Y
Current
T-30
End-2009
Term Structure of Domestic Sovereign Bond Curve
(as of 1/28/11, in percent)
Source: Bloomberg
7. The impact on property markets
is yet muted. Property prices in Thailand
are still recovering from the trough reached
in the recession and there is some concern
in the local markets about a possible
oversupply of certain types of properties.
At the same time, there are higher rates of
transactions in other segments of the real
estate market, pointing to a saturation of
the supply soon. In short, property price
inflation is not of immediate concern in
Thailand yet, but recent trends warrant a
close watch of developments.
8. The inflows to the bond market
may have contributed to the decline in
long-term interest rates. As in other
EMs, yield curves in Thailand have also
flattened over 2010, though this should
be viewed in conjunction with the overall
loose monetary policy stance during
most of this timeframe. The BoT began
the policy rate normalization trend in
July, with a 25 basis point hike, followed by additional hikes of the same magnitude in August and December 2010, and in January
2011. Even with these increases, the policy rate in Thailand is one of the lowest in absolute
value in the region. While easy monetary conditions have kept rates low, the policy rate hikes
are only gradually filtering into long-term rates, raising the question of whether capital
inflows may weaken the link between short and long-term rates. If so, monetary policy in the
face of large and persistent capital inflows may be rendered less effective.
40
60
80
100
120
140
160
180
200
220
240
260
Thailand: Asset Prices(January 2006 = 100)
PE ratio
House prices
Source: CEIC
95
100
105
110
115
Jan-10 Mar-10 May-10 Jul-10 Sep-10 Nov-10 Jan-11
Corporate Bond Indices( January 2010=100)
Thailand Corporate Index
Asia Corporate Index
Source: Bloomberg
80
90
100
110
120
130
140
150
Jan-10 Mar-10 May-10 Jul-10 Sep-10 Nov-10 Jan-11
Stock Market Indices(January 2010=100)
Stock Exchange of Thailand
MSCI Asia ex. Japan
Source: Bloomberg
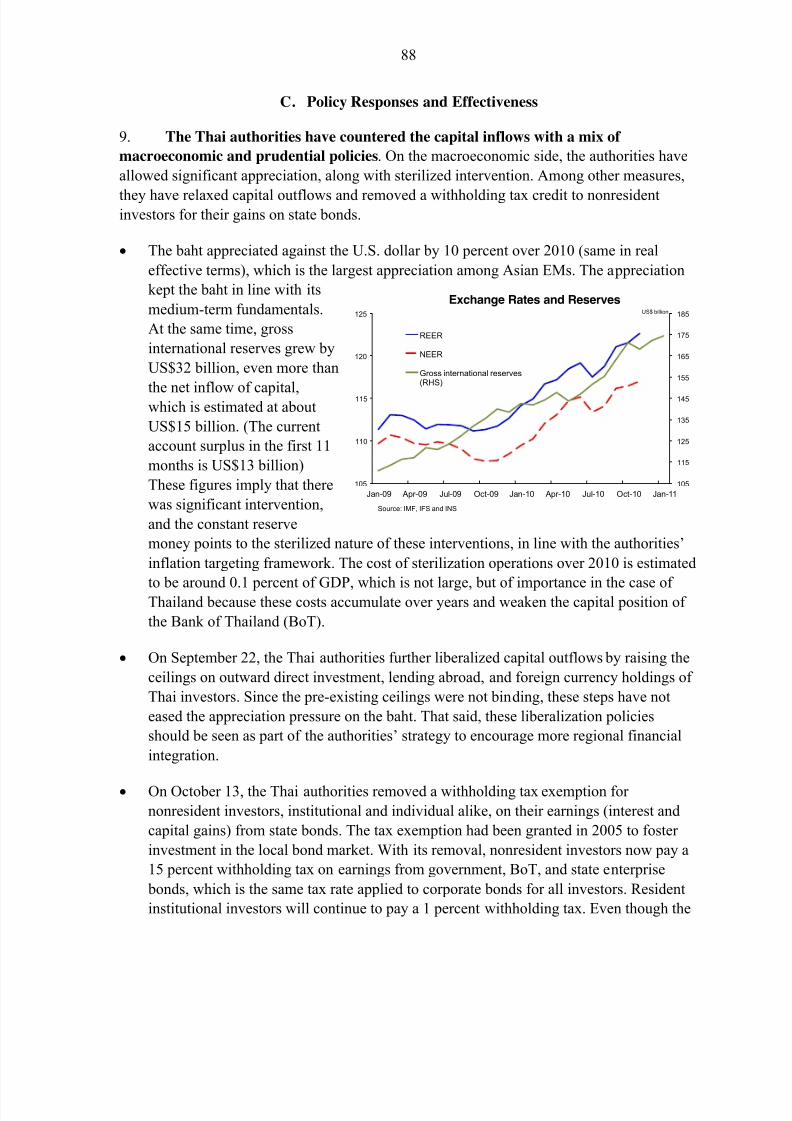
8/2/2019 IMF Ecperiences in Managing Capital Inflows
http://slidepdf.com/reader/full/imf-ecperiences-in-managing-capital-inflows 88/97
88
C. Policy Responses and Effectiveness
9. The Thai authorities have countered the capital inflows with a mix of
macroeconomic and prudential policies. On the macroeconomic side, the authorities have
allowed significant appreciation, along with sterilized intervention. Among other measures,
they have relaxed capital outflows and removed a withholding tax credit to nonresidentinvestors for their gains on state bonds.
The baht appreciated against the U.S. dollar by 10 percent over 2010 (same in real
effective terms), which is the largest appreciation among Asian EMs. The appreciation
kept the baht in line with its
medium-term fundamentals.
At the same time, gross
international reserves grew by
US$32 billion, even more than
the net inflow of capital,which is estimated at about
US$15 billion. (The current
account surplus in the first 11
months is US$13 billion)
These figures imply that there
was significant intervention,
and the constant reserve
money points to the sterilized nature of these interventions, in line with the authorities’
inflation targeting framework. The cost of sterilization operations over 2010 is estimated
to be around 0.1 percent of GDP, which is not large, but of importance in the case of Thailand because these costs accumulate over years and weaken the capital position of
the Bank of Thailand (BoT).
On September 22, the Thai authorities further liberalized capital outflows by raising the
ceilings on outward direct investment, lending abroad, and foreign currency holdings of
Thai investors. Since the pre-existing ceilings were not binding, these steps have not
eased the appreciation pressure on the baht. That said, these liberalization policies
should be seen as part of the authorities’ strategy to encourage more regional financial
integration.
On October 13, the Thai authorities removed a withholding tax exemption for
nonresident investors, institutional and individual alike, on their earnings (interest and
capital gains) from state bonds. The tax exemption had been granted in 2005 to foster
investment in the local bond market. With its removal, nonresident investors now pay a
15 percent withholding tax on earnings from government, BoT, and state enterprise
bonds, which is the same tax rate applied to corporate bonds for all investors. Resident
institutional investors will continue to pay a 1 percent withholding tax. Even though the
105
115
125
135
145
155
165
175
185
105
110
115
120
125
Jan-09 Apr-09 Jul-09 Oct-09 Jan-10 Apr-10 Jul-10 Oct-10 Jan-11
Exchange Rates and Reserves
REER
NEER
Gross international reserves(RHS)
Source: IMF, IFS and INS
US$ billion
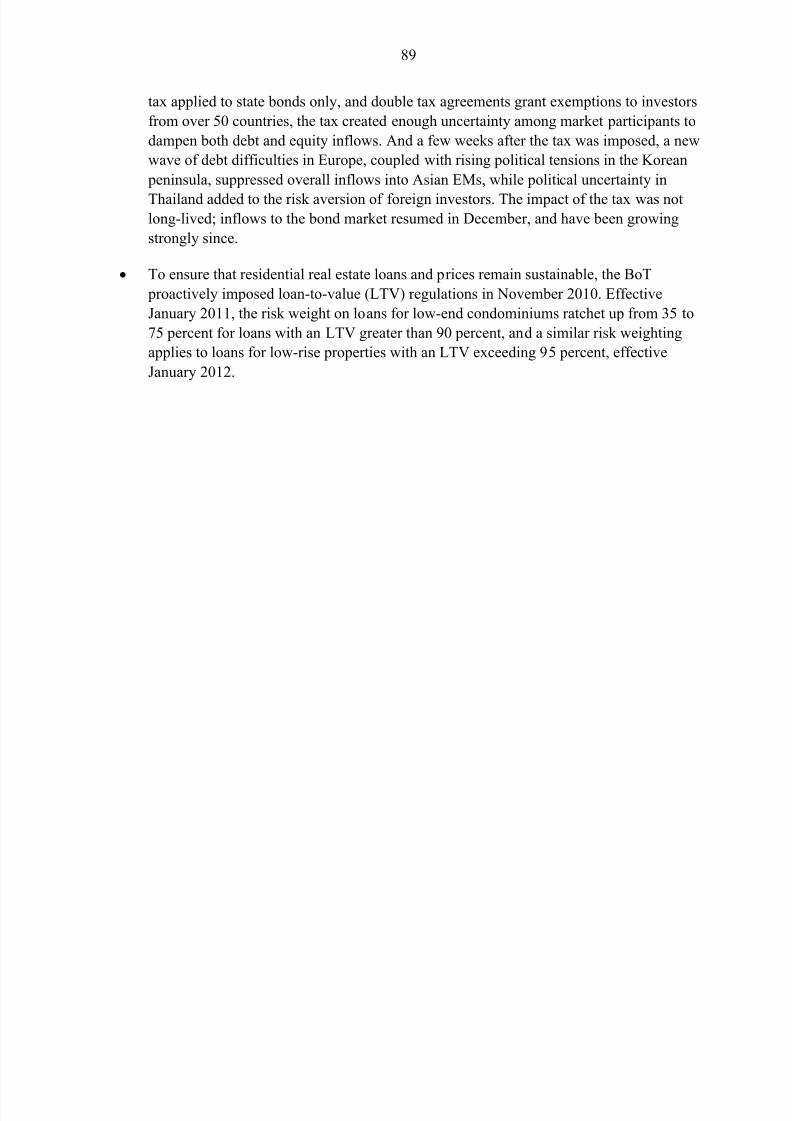
8/2/2019 IMF Ecperiences in Managing Capital Inflows
http://slidepdf.com/reader/full/imf-ecperiences-in-managing-capital-inflows 89/97
89
tax applied to state bonds only, and double tax agreements grant exemptions to investors
from over 50 countries, the tax created enough uncertainty among market participants to
dampen both debt and equity inflows. And a few weeks after the tax was imposed, a new
wave of debt difficulties in Europe, coupled with rising political tensions in the Korean
peninsula, suppressed overall inflows into Asian EMs, while political uncertainty in
Thailand added to the risk aversion of foreign investors. The impact of the tax was notlong-lived; inflows to the bond market resumed in December, and have been growing
strongly since.
To ensure that residential real estate loans and prices remain sustainable, the BoT
proactively imposed loan-to-value (LTV) regulations in November 2010. Effective
January 2011, the risk weight on loans for low-end condominiums ratchet up from 35 to
75 percent for loans with an LTV greater than 90 percent, and a similar risk weighting
applies to loans for low-rise properties with an LTV exceeding 95 percent, effective
January 2012.
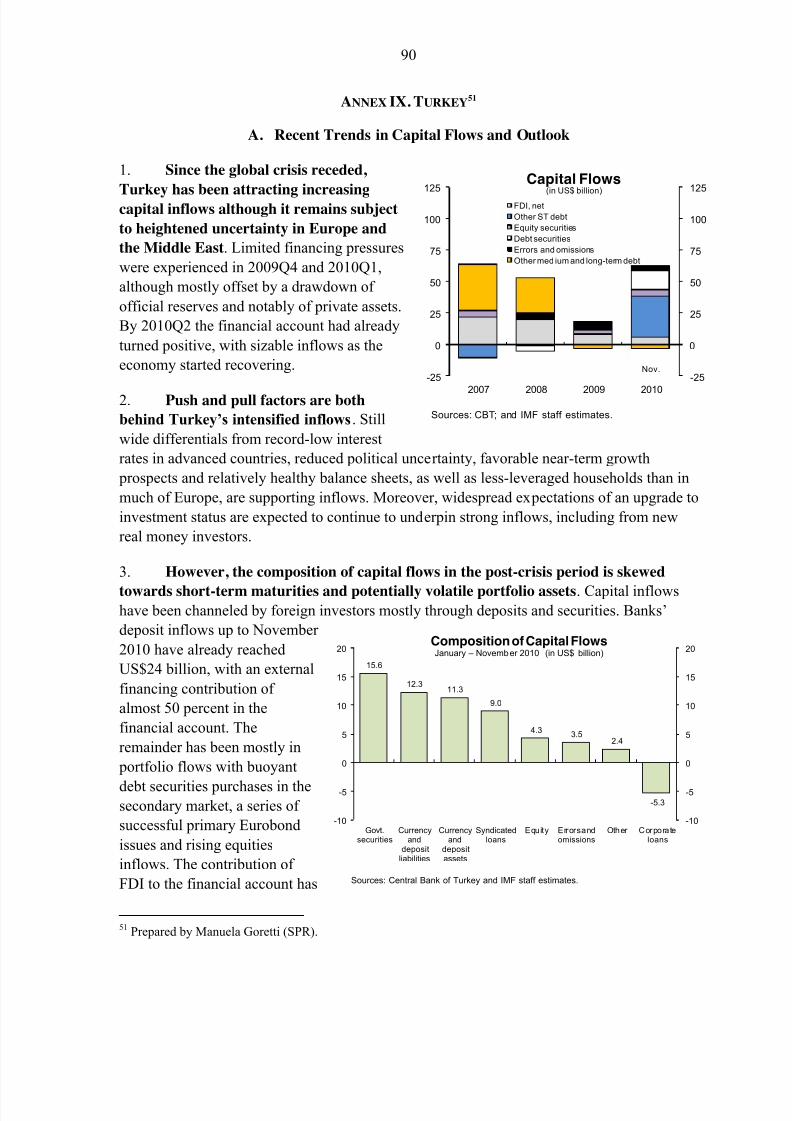
8/2/2019 IMF Ecperiences in Managing Capital Inflows
http://slidepdf.com/reader/full/imf-ecperiences-in-managing-capital-inflows 90/97
90
Sources: CBT; and IMF staff estimates.
-25
0
25
50
75
100
125
-25
0
25
50
75
100
125
2007 2008 2009 2010
Capital Flows(in US$ billion)
FDI, net
Other ST debt
Equity securities
Debt securities
Errors and omissions
Other med ium and long-term debt
Nov.
ANNEX IX. TURKEY51
A. Recent Trends in Capital Flows and Outlook
1. Since the global crisis receded,
Turkey has been attracting increasingcapital inflows although it remains subject
to heightened uncertainty in Europe and
the Middle East. Limited financing pressures
were experienced in 2009Q4 and 2010Q1,
although mostly offset by a drawdown of
official reserves and notably of private assets.
By 2010Q2 the financial account had already
turned positive, with sizable inflows as the
economy started recovering.
2. Push and pull factors are both
behind Turkey’s intensified inflows. Still
wide differentials from record-low interest
rates in advanced countries, reduced political uncertainty, favorable near-term growth
prospects and relatively healthy balance sheets, as well as less-leveraged households than in
much of Europe, are supporting inflows. Moreover, widespread expectations of an upgrade to
investment status are expected to continue to underpin strong inflows, including from new
real money investors.
3. However, the composition of capital flows in the post-crisis period is skewed
towards short-term maturities and potentially volatile portfolio assets. Capital inflowshave been channeled by foreign investors mostly through deposits and securities. Banks’
deposit inflows up to November
2010 have already reached
US$24 billion, with an external
financing contribution of
almost 50 percent in the
financial account. The
remainder has been mostly in
portfolio flows with buoyant
debt securities purchases in thesecondary market, a series of
successful primary Eurobond
issues and rising equities
inflows. The contribution of
FDI to the financial account has
51 Prepared by Manuela Goretti (SPR).
Sources: Central Bank of Turkey and IMF staff estimates.
15.6
12.311.3
9.0
4.33.5
2.4
-5.3
-10
-5
0
5
10
15
20
-10
-5
0
5
10
15
20
Govt.securities
Currencyand
depositliabilities
Currencyand
depositassets
Syndicatedloans
Equity Errors andomissions
Other Corporateloans
Composition of Capital FlowsJanuary – November 2010 (in US$ billion)
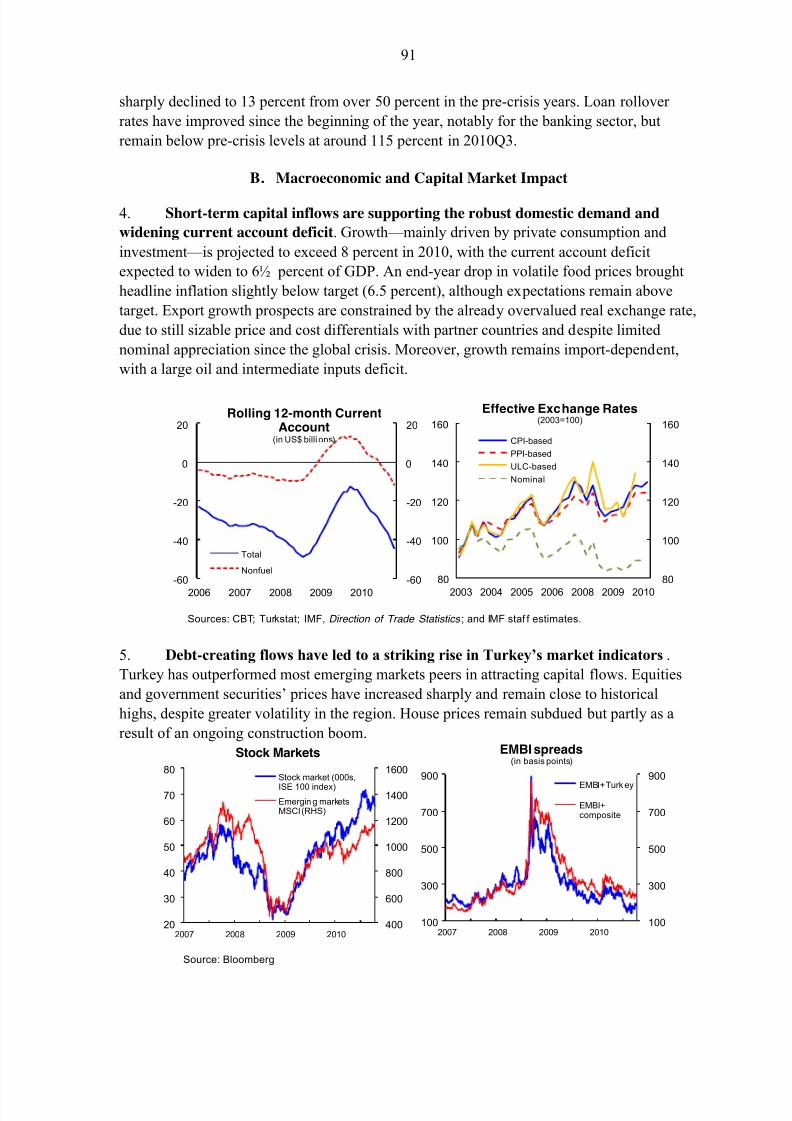
8/2/2019 IMF Ecperiences in Managing Capital Inflows
http://slidepdf.com/reader/full/imf-ecperiences-in-managing-capital-inflows 91/97
91
Source: Bloomberg
400
600
800
1000
1200
1400
1600
20
30
40
50
60
70
80
2007 2008 2009 2010
Stock Markets
Stock market (000s,
ISE 100 index)
Emerging marketsMSCI (RHS)
100
300
500
700
900
100
300
500
700
900
2007 2008 2009 2010
EMBI spreads(in basis points)
EMBI+ Turkey
EMBI+composite
sharply declined to 13 percent from over 50 percent in the pre-crisis years. Loan rollover
rates have improved since the beginning of the year, notably for the banking sector, but
remain below pre-crisis levels at around 115 percent in 2010Q3.
B. Macroeconomic and Capital Market Impact
4. Short-term capital inflows are supporting the robust domestic demand and
widening current account deficit. Growth — mainly driven by private consumption and
investment — is projected to exceed 8 percent in 2010, with the current account deficit
expected to widen to 6½ percent of GDP. An end-year drop in volatile food prices brought
headline inflation slightly below target (6.5 percent), although expectations remain above
target. Export growth prospects are constrained by the already overvalued real exchange rate,
due to still sizable price and cost differentials with partner countries and despite limited
nominal appreciation since the global crisis. Moreover, growth remains import-dependent,
with a large oil and intermediate inputs deficit.
5. Debt-creating flows have led to a striking rise in Turkey’s market indicators .
Turkey has outperformed most emerging markets peers in attracting capital flows. Equities
and government securities’ prices have increased sharply and remain close to historical
highs, despite greater volatility in the region. House prices remain subdued but partly as a
result of an ongoing construction boom.
-60
-40
-20
0
20
-60
-40
-20
0
20
2006 2007 2008 2009 2010
Rolling 12-month CurrentAccount
(in US$ billi ons)
Total
Nonfuel80
100
120
140
160
80
100
120
140
160
2003 2004 2005 2006 2008 2009 2010
Effective Exchange Rates(2003=100)
CPI-based
PPI-based
ULC-based
Nominal
Sources: CBT; Turkstat; IMF, Direction of Trade Statistics ; and IMF staf f estimates.
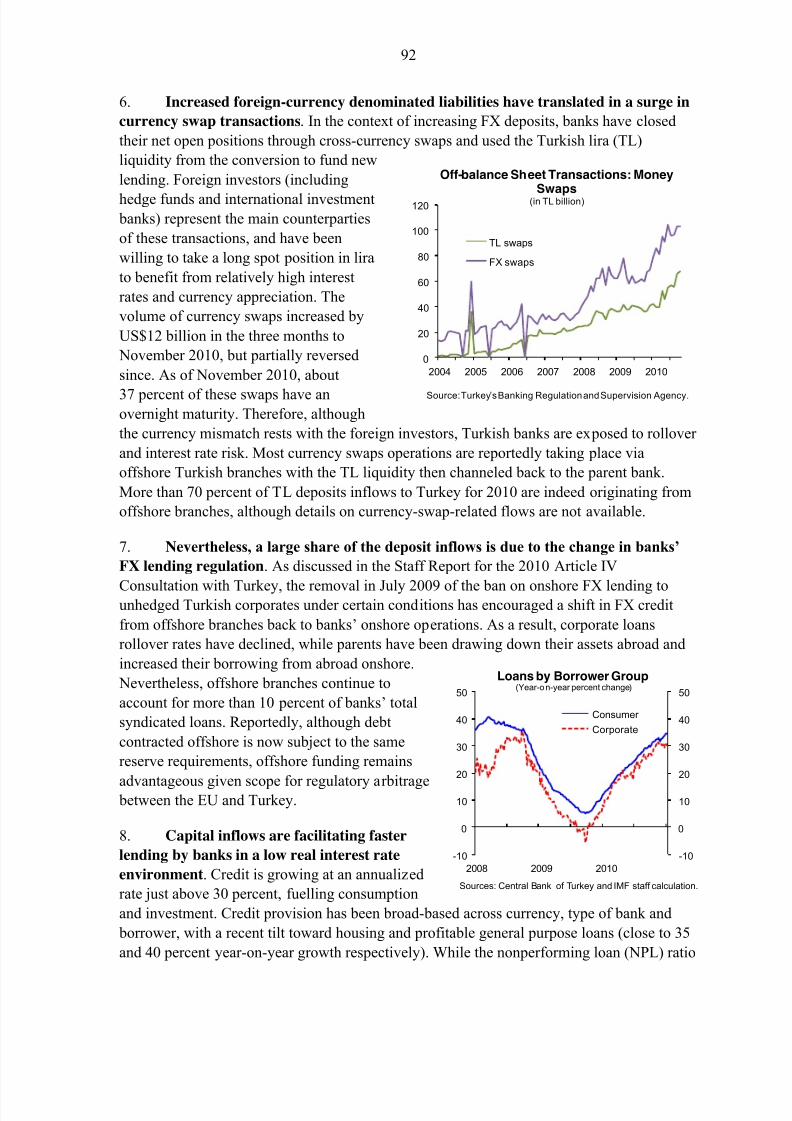
8/2/2019 IMF Ecperiences in Managing Capital Inflows
http://slidepdf.com/reader/full/imf-ecperiences-in-managing-capital-inflows 92/97
92
6. Increased foreign-currency denominated liabilities have translated in a surge in
currency swap transactions. In the context of increasing FX deposits, banks have closed
their net open positions through cross-currency swaps and used the Turkish lira (TL)
liquidity from the conversion to fund new
lending. Foreign investors (including
hedge funds and international investment banks) represent the main counterparties
of these transactions, and have been
willing to take a long spot position in lira
to benefit from relatively high interest
rates and currency appreciation. The
volume of currency swaps increased by
US$12 billion in the three months to
November 2010, but partially reversed
since. As of November 2010, about
37 percent of these swaps have anovernight maturity. Therefore, although
the currency mismatch rests with the foreign investors, Turkish banks are exposed to rollover
and interest rate risk. Most currency swaps operations are reportedly taking place via
offshore Turkish branches with the TL liquidity then channeled back to the parent bank.
More than 70 percent of TL deposits inflows to Turkey for 2010 are indeed originating from
offshore branches, although details on currency-swap-related flows are not available.
7. Nevertheless, a large share of the deposit inflows is due to the change in banks’
FX lending regulation. As discussed in the Staff Report for the 2010 Article IV
Consultation with Turkey, the removal in July 2009 of the ban on onshore FX lending tounhedged Turkish corporates under certain conditions has encouraged a shift in FX credit
from offshore branches back to banks’ onshore operations. As a result, corporate loans
rollover rates have declined, while parents have been drawing down their assets abroad and
increased their borrowing from abroad onshore.
Nevertheless, offshore branches continue to
account for more than 10 percent of banks’ total
syndicated loans. Reportedly, although debt
contracted offshore is now subject to the same
reserve requirements, offshore funding remains
advantageous given scope for regulatory arbitrage between the EU and Turkey.
8. Capital inflows are facilitating faster
lending by banks in a low real interest rate
environment. Credit is growing at an annualized
rate just above 30 percent, fuelling consumption
and investment. Credit provision has been broad-based across currency, type of bank and
borrower, with a recent tilt toward housing and profitable general purpose loans (close to 35
and 40 percent year-on-year growth respectively). While the nonperforming loan (NPL) ratio
-10
0
10
20
30
40
50
-10
0
10
20
30
40
50
2008 2009 2010
Loans by Borrower Group(Year-on-year percent change)
Consumer
Corporate
Sources: Central Bank of Turkey and IMF staff calculation.
0
20
40
60
80
100
120
2004 2005 2006 2007 2008 2009 2010
Off-balance Sheet Transactions: MoneySwaps
(in TL billion)
TL swaps
FX swaps
Source:Turkey’s Banking Regulation and Supervision Agency.
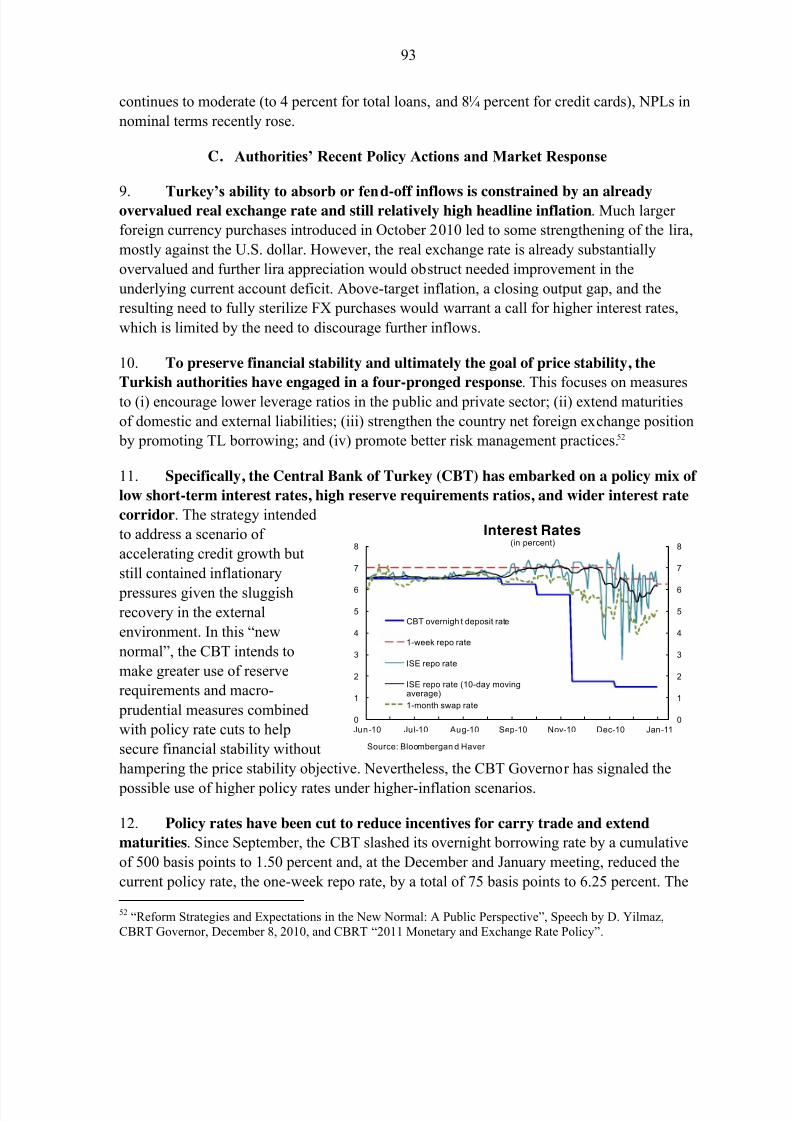
8/2/2019 IMF Ecperiences in Managing Capital Inflows
http://slidepdf.com/reader/full/imf-ecperiences-in-managing-capital-inflows 93/97
93
continues to moderate (to 4 percent for total loans, and 8¼ percent for credit cards), NPLs in
nominal terms recently rose.
C. Authorities’ Recent Policy Actions and Market Response
9. Turkey’s ability to absorb or fend-off inflows is constrained by an alreadyovervalued real exchange rate and still relatively high headline inflation. Much larger
foreign currency purchases introduced in October 2010 led to some strengthening of the lira,
mostly against the U.S. dollar. However, the real exchange rate is already substantially
overvalued and further lira appreciation would obstruct needed improvement in the
underlying current account deficit. Above-target inflation, a closing output gap, and the
resulting need to fully sterilize FX purchases would warrant a call for higher interest rates,
which is limited by the need to discourage further inflows.
10. To preserve financial stability and ultimately the goal of price stability, the
Turkish authorities have engaged in a four-pronged response . This focuses on measures
to (i) encourage lower leverage ratios in the public and private sector; (ii) extend maturities
of domestic and external liabilities; (iii) strengthen the country net foreign exchange position
by promoting TL borrowing; and (iv) promote better risk management practices.52
11. Specifically, the Central Bank of Turkey (CBT) has embarked on a policy mix of
low short-term interest rates, high reserve requirements ratios, and wider interest rate
corridor. The strategy intended
to address a scenario of
accelerating credit growth but
still contained inflationary
pressures given the sluggishrecovery in the external
environment. In this “new
normal”, the CBT intends to
make greater use of reserve
requirements and macro-
prudential measures combined
with policy rate cuts to help
secure financial stability without
hampering the price stability objective. Nevertheless, the CBT Governor has signaled the
possible use of higher policy rates under higher-inflation scenarios.
12. Policy rates have been cut to reduce incentives for carry trade and extend
maturities. Since September, the CBT slashed its overnight borrowing rate by a cumulative
of 500 basis points to 1.50 percent and, at the December and January meeting, reduced the
current policy rate, the one-week repo rate, by a total of 75 basis points to 6.25 percent. The
52 “Reform Strategies and Expectations in the New Normal: A Public Perspective”, Speech by D. Yilmaz,CBRT Governor, December 8, 2010, and CBRT “2011 Monetary and Exchange Rate Policy”.
0
1
2
3
4
5
6
7
8
0
1
2
3
4
5
6
7
8
Jun-10 Jul-10 Aug-10 Sep-10 Nov-10 Dec-10 Jan-11
Interest Rates(in percent)
CBT overnigh t deposit rate
1-week repo rate
ISE repo rate
ISE repo rate (10-day movingaverage)
1-month swap rate
Source: Bloombergan d Haver

8/2/2019 IMF Ecperiences in Managing Capital Inflows
http://slidepdf.com/reader/full/imf-ecperiences-in-managing-capital-inflows 94/97
94
cut in the overnight rate was designed to introduce some volatility and discourage short-term
lira conversion through currency swaps. As a result of the cut, higher volatility has been
recorded with the ISE overnight repo rate hovering above and below the policy rate and the
one-month swap rate declining sharply although only with a lag after the overnight rate cut.
13. To offset the recent policy rate cuts, unremunerated reserve requirements wereraised and coverage broadened, while other measures to improve maturity profiles may
be considered. The CBT’s unusual shift in monetary policy includes an increase across
maturities of the TL reserves requirement ratio (RRR), now ranging from 5 percent for
deposits with maturity of at least one year to 12 percent for demand deposits. This step
follows previous increases which had raised RRRs for TL and FX liabilities to pre-crisis
levels of 6 and 11 percent, respectively. Remuneration of reserves requirements was also
halted to reduce profits from intermediation and withdraw liquidity as well as to increase the
effectiveness of RRR as a policy tool via the cost channel.
14. Moreover, the sharp step-up in FX purchases has been moderated, also in viewof greater market volatility in the region. The CBT gradually cut the total amount in daily
FX purchase auctions from US$140 million to US$50 million for 2011, thereby reducing the
need for sterilization instruments to absorb additional liquidity and limiting the risk of further
interest rate pressures. Nevertheless, a flexible approach to currency auctions will continue to
be pursued to counter "hot money" inflows.
15. Macro-prudential and other market-based measures are supporting the
monetary policy response. To moderate credit growth, the government raised the Resource
Utilization Support Fund levy on the interest from consumer loans to 15 percent, while the
Bank Regulation and Supervision Agency (BRSA) extended the limits to loan-to-value ratios
previously reserved for securitized mortgages to all mortgages. To encourage longer
maturities, the BRSA is now granting permissions for the issuance of TL-denominated bonds
by banks. Accordingly, the government has recently abolished or reduced the withholding tax
on interest earnings from Eurobond issues by Turkish corporates for longer maturities. These
measures support existing ones, such as the ban for households to use FX-denominated or
FX-indexed loans and the FX net general position limits for the banking sector.
16. The role of fiscal policy in dealing with “hot money” flows should not be
underestimated. Sustained fiscal discipline in the public sector is seen as a key ingredient to
limit the risks from the widening current account deficit. However, in staff’s view, the
authorities’ fiscal anchor— the Medium Term Program (MTP) — does not adjust flexibly tocurrent macroeconomic conditions. Consequently, a faster withdrawal of the fiscal stimulus,
once all cyclical conditions are accounted for, should be pursued beyond the scope of the
MTP.
17. As regards capital controls, the authorities believe that these should not be used.
The free floating exchange rate and open trade and capital account have served Turkey well
in the last decade and the authorities continue to subscribe to this strategy, although they are
aware of the need to implement policies to reinforce financial stability and enhance financial
depth. Moreover, restrictions to capital inflows are regarded as inconsistent with the free
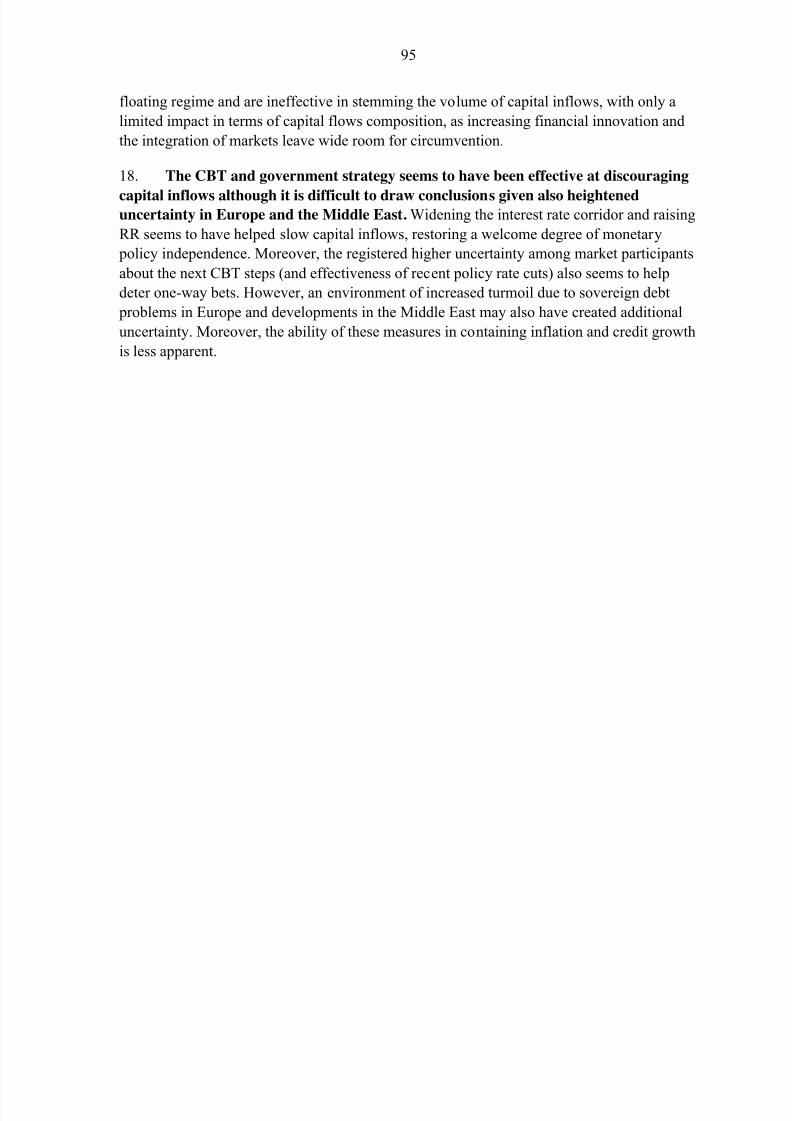
8/2/2019 IMF Ecperiences in Managing Capital Inflows
http://slidepdf.com/reader/full/imf-ecperiences-in-managing-capital-inflows 95/97
8/2/2019 IMF Ecperiences in Managing Capital Inflows
http://slidepdf.com/reader/full/imf-ecperiences-in-managing-capital-inflows 96/97
96
References
Bank of Indonesia, 2010, “Bank Indonesia Policy Package of June 16, 2010: Question andAnswer,” June 25.
BIS, 2007, “Evidence of carry trade activity,” BIS Quarterly Review, September 2007, p. 27-41.
Becker, Torbjorn, Olivier Jeanne, Paolo Mauro, Jonathan D. Ostry, and Romain Rancière,2007, “Country Insurance: the Role of Domestic Policies,” Occasional Paper No. 254(Washington: International Monetary Fund).
Eyzaguirre, Nicolás, Martin Kaufman, Steven Phillips, and Rodrigo Valdés, forthcoming,“Capital Inflows and Terms of Trade Bonanza in Latin America: ManagingAbundance to Break the Cycle of Crises,” IMF Staff Discussion Note.
Garcia-Escribano, Mercedes, 2010, “Peru: Drivers of De-dollarization”, IMF Working Paper No. 10/169 (Washington: International Monetary Fund).
International Monetary Fund, 2007, World Economic Outlook, October 2007 “Chapter 3.Managing Large Capital Inflows” (Washington: International Monetary Fund).
_______, 2010a, Regional Economic Outlook: Asia and Pacific, April 2010 (Washington: International Monetary Fund).
_______, 2010b, Peru — Staff Report for the 2010 Article IV Consultation, IMF CountryReport No. 10/98 (Washington: International Monetary Fund).
_______, 2010c, Indonesia — Financial System Stability Assessment , IMF Country Report No. 10/288 (Washington: International Monetary Fund).
_______, 2011, Regional Economic Outlook: Asia and Pacific, April 2011, forthcoming(Washington: International Monetary Fund).
_______, 2011, World Economic Outlook, forthcoming (Washington: InternationalMonetary Fund).
Lee, Jaewoo, Gian Maria Milesi-Ferretti, Jonathan D. Ostry, Alessandro Prati, and LucaAntonio Ricci, 2008, “Exchange Rate Assessments: CGER Methodologies,”
Occasional Paper No. 261 (Washington: International Monetary Fund).
Levy-Yeyati, Eduardo, Ugo Panizza, and Ernesto Stein, 2007, “The Cyclical Nature of North-South FDI Flows,” Journal of International Money and Finance, Vol. 26, No.1, pp. 104 – 130.
Magud, Nicolas E., Carmen M. Reinhart, and Kenneth S. Rogoff , 2011, “Capital Controls:Myth and Reality – A Portfolio Balance Approach,” NBER Working Paper No.16805 (Cambridge: National Bureau of Economic Research)

8/2/2019 IMF Ecperiences in Managing Capital Inflows
http://slidepdf.com/reader/full/imf-ecperiences-in-managing-capital-inflows 97/97
97
Ostry, Jonathan D., Atish R. Ghosh, Karl Habermeier, Marcos Chamon, Mahvash S. Qureshi,and Dennis B.S. Reinhardt, 2010, “Capital Inflows: The Role of Controls,” IMF Staff Position Note SPN/10/04, February 2010.
Ostry, Jonathan D., Atish R. Ghosh, Karl Habermeier, Luc Laeven, Marcos Chamon,
Mahvash S. Qureshi, and Annamaria Kokenyne, forthcoming, “Managing CapitalInflows: What Tools to Use?” IMF Staff Discussion Note.
World Bank, 2009, “Global Development Finance: Charting a Global Recovery”(Washington: World Bank).
Recommended