BioMed CentralBMC Bioinformatics
ss
Open AcceResearch articleHow accurate and statistically robust are catalytic site predictions based on closeness centrality?Eric Chea1 and Dennis R Livesay*2Address: 1Department of Biological Sciences, California State Polytechnic University, Pomona, CA 91768, USA and 2Department of Computer Science and Bioinformatics Research Center, University of North Carolina at Charlotte, Charlotte, NC 28223, USA
Email: Eric Chea - [email protected]; Dennis R Livesay* - [email protected]
* Corresponding author
AbstractBackground: We examine the accuracy of enzyme catalytic residue predictions from a networkrepresentation of protein structure. In this model, amino acid α-carbons specify vertices within agraph and edges connect vertices that are proximal in structure. Closeness centrality, which hasshown promise in previous investigations, is used to identify important positions within thenetwork. Closeness centrality, a global measure of network centrality, is calculated as thereciprocal of the average distance between vertex i and all other vertices.
Results: We benchmark the approach against 283 structurally unique proteins within the CatalyticSite Atlas. Our results, which are inline with previous investigations of smaller datasets, indicatecloseness centrality predictions are statistically significant. However, unlike previous approaches,we specifically focus on residues with the very best scores. Over the top five closeness centralityscores, we observe an average true to false positive rate ratio of 6.8 to 1. As demonstratedpreviously, adding a solvent accessibility filter significantly improves predictive power; the averageratio is increased to 15.3 to 1. We also demonstrate (for the first time) that filtering the predictionsby residue identity improves the results even more than accessibility filtering. Here, we simplyeliminate residues with physiochemical properties unlikely to be compatible with catalyticrequirements from consideration. Residue identity filtering improves the average true to falsepositive rate ratio to 26.3 to 1. Combining the two filters together has little affect on the results.Calculated p-values for the three prediction schemes range from 2.7E-9 to less than 8.8E-134.Finally, the sensitivity of the predictions to structure choice and slight perturbations is examined.
Conclusion: Our results resolutely confirm that closeness centrality is a viable prediction schemewhose predictions are statistically significant. Simple filtering schemes substantially improve themethod's predicted power. Moreover, no clear effect on performance is observed when comparingligated and unligated structures. Similarly, the CC prediction results are robust to slight structuralperturbations from molecular dynamics simulation.
Published: 11 May 2007
BMC Bioinformatics 2007, 8:153 doi:10.1186/1471-2105-8-153
Received: 11 December 2006Accepted: 11 May 2007
This article is available from: http://www.biomedcentral.com/1471-2105/8/153
© 2007 Chea and Livesay; licensee BioMed Central Ltd. This is an Open Access article distributed under the terms of the Creative Commons Attribution License (http://creativecommons.org/licenses/by/2.0), which permits unrestricted use, distribution, and reproduction in any medium, provided the original work is properly cited.
Page 1 of 14(page number not for citation purposes)
BMC Bioinformatics 2007, 8:153 http://www.biomedcentral.com/1471-2105/8/153
BackgroundThe accurate and robust prediction of protein functionalsites from sequence and/or structure remains an openproblem in bioinformatics [1]. Despite the limitations ofcurrent methodologies, several sequence and structure-based approaches have recently become popular [2]. Mostof these approaches rely on an underlying multiplesequence alignment and attempt to uncover some type offeature conservation therein [3] (i.e. residues that are con-served across the alignment [4-6]). Arguably, evolutionarytracing has become the most widely used method forcomputational prediction of protein functional sites [7].The Evolutionary trace (ET) approach begins with analignment and corresponding phylogeny. The methodsearches for all alignment positions that recapitulate theoverall phylogeny. While ET is fundamentally a sequence-based scheme, the standard application of the approachuses structural clusters of trace residues to identify func-tional regions [8-10]. Several other related methods thatrely on an underlying alignment plus representative struc-ture have proven useful as well [11-14]. Conversely, wehave introduced a phylogenetic motif-based method thatis similar in spirit to ET, although it is specifically designedto rely solely on sequence information [15-17].
The literature also contains a host of functional site pre-diction strategies that are explicitly designed to not rely ona phylogeny [18]. These approaches are useful when toofew sequences are available to generate a representativedescription of familial diversity. While their theoreticalfoundations vary considerably, most rely solely on struc-ture or a structure + alignment combination. For example,Gutteridge et al. recently developed a neural networkapproach to predict catalytic sites [19]. Catalytic sites aredefined by residues directly involved in the enzyme-medi-ated reaction mechanism, which generally constitute asubset of all functional residues. The neural network inputof Gutteridge et al. includes both structural and alignmentdescriptors, and is able to correctly predict the active sitein >69% of the cases examined. The ability to rigorouslybenchmark the approach is based on comprehensive data-basing and exhaustive manual curation of catalytic resi-dues from the literature [20] by the same group. This tourde force has led to the Catalytic Site Atlas (CSA) [21],which contains approximately 600 different proteins withexperimentally validated catalytic residues.
Other common catalytic site prediction methods arebased on Poisson-Boltzmann continuum electrostatictheory [22]. Elcock has observed that functional residuestend to have increased electrostatic strain energy [23],meaning that stabilization occurs on mutation. While theapproach utilizes sophisticated Poisson-Boltzmann con-tinuum theory, the underlying rationale is based onstraightforward evolutionary arguments. The naïve
description of protein evolution is that nature solely opti-mizes structural stability at each residue. However, cata-lytic and other important residues have functionalconstraints imposed upon them, meaning that whilemutation might be stabilizing, it can occur at the expenseof functional proficiency. The detangling of stability andfunctional evolutionary pressures is examined more thor-oughly by Cheng et al. using all-atom protein design [24].Analogous to the electrostatic strain energy approach, theTHEMATICS approach uses Poisson-Boltzmann-basedpKa calculations to look for residue titration curves thatdo not follow Henderson-Hasselbalch [25]. The methodlooks for titration curves of partially charged residues thatare flat over a wide pH range. Similarly, we have demon-strated that a large pKa shift from the null model (aque-ous) value can be indicative of catalytic residues [26,27].However, the prediction accuracy of this approach is less-ened because many structurally important residues (i.e.residues involved in a salt bridge) also have significantpKa shifts.
Network models have also been used with success in pre-dicting protein functional and/or catalytic residues.Instead of representing protein structures as a Cartesiancollection of atoms, network models recast protein struc-tures as topological graphs [28-31]. The most common ofthese methods are based on protein structure contactmaps, where each vertex of the graph represents an α-car-bon and edges connect vertices within some distance cut-off (generally 6–9 Å). Once the graph is complete, avariety of topological metrics can be used to predict func-tional residues from it, including: centrality [32,33],valency [32] and sub-graph conservation [34]. Despitegrowing consensus concerning the utility of these meth-ods, a robust assessment of their prediction accuracyremains to be completed. Amitai et al. [32], Thibert et al.[33] and del Sol et al. [35] examine the ability of residuecentrality to predict catalytic and/or functional siteswithin datasets of 178, 128 and 46 proteins, respectively.The results from these studies are encouraging. Moreover,they show that combining centrality within other metricsimproves predictive power. For example, Amitai et al.demonstrates that combining centrality with solventaccessibility substantially improves accuracy, whereasboth Amitai et al. and Thibert et al. demonstrate thatincluding residue conservation improves results.
In this report, we investigate the accuracy and statisticalsignificance of closeness centrality (CC) functional resi-due predictions, which has previously been shown to bethe best of several different network centrality scores (i.e.valency, betweenness, etc.) [32,33]. Primarily, our investi-gation is based on SCOP [36] superfamily-filtered proteinchains (which represents 283 unique SCOP super-families) from the CSA. Based on observed accuracies, CC
Page 2 of 14(page number not for citation purposes)
BMC Bioinformatics 2007, 8:153 http://www.biomedcentral.com/1471-2105/8/153
is demonstrated to be a viable prediction scheme. Ourresults are inline with previous investigations, but aremore significant due to dataset size and compositionsince we control for structural redundancy. A second dis-tinction of this work is that instead of focusing on theentire range of true to false positive rates, as done by pre-vious investigations, we concentrate on the very best CCscores. By focusing only on the top five scoring residues,we are able to evaluate the ability of the model to provideinsight that provides a reasonable number of experimen-tally testable predictions. In all cases, our predictions cor-respond to false positive rates below 1.6%. Theperformance of the method is improved substantially byconsidering only residues that are not completely inacces-sible to solvent. We further demonstrate that filtering thepredictions based solely on amino acid identity substan-tially improves predictive power even more than filteringby solvent accessibility.
Theoretical backgroundThroughout this report, the vertices within each graph cor-respond to α-carbons. Edges connect two α-carbonswithin 8.5 Å of each other. While slightly less complicatedthan methods based on all-atom pair distances, the sim-pler model results in a noticeable computational speedupthat significant when analyzing a dataset the size of ours.A cursory comparison of the two networks indicates thatthe resultant predictions are qualitatively similar (resultsnot shown). The common threshold of 8.5 Å is usedbecause it best approximates the average sidechain size.Closeness centrality (CC), a global centrality metric, isused to determine how critical each vertex (residue) is inmaintaining the small-world behavior of the graph. CC iscalculated by:
where Np is the total number of vertices in the graph andLij is the shortest path (geodesic distance) between verticesi and j. The shortest path is simply the minimum of allpossible paths between residues i and j. As normally donein protein structure networks, edges are not weighted,making the shortest path simply an integer count of thenumber of edges separating i and j. It should be noted thatNp (a constant within each protein) has no effect on ourobserved results since we are only using CC to rank theresidues, meaning the inverse of shortest path sum solelyestablishes which residues are ultimately predicted. Nev-ertheless, we employ CC here to be consistent with previ-ous investigations.
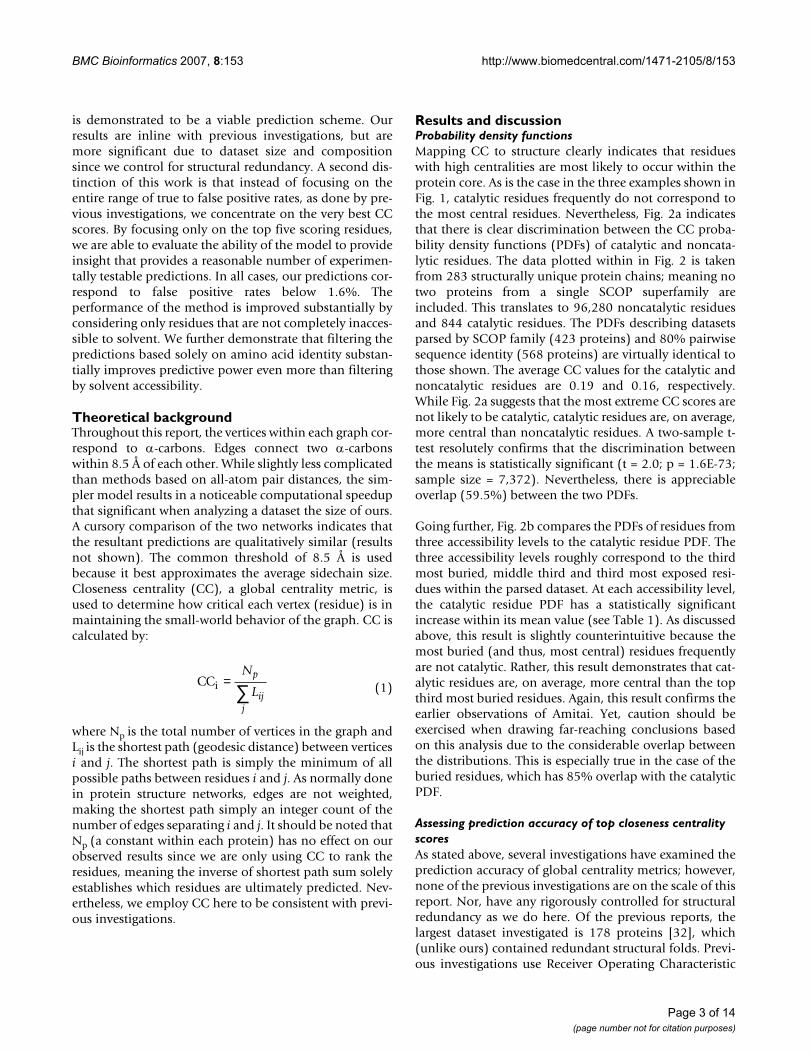
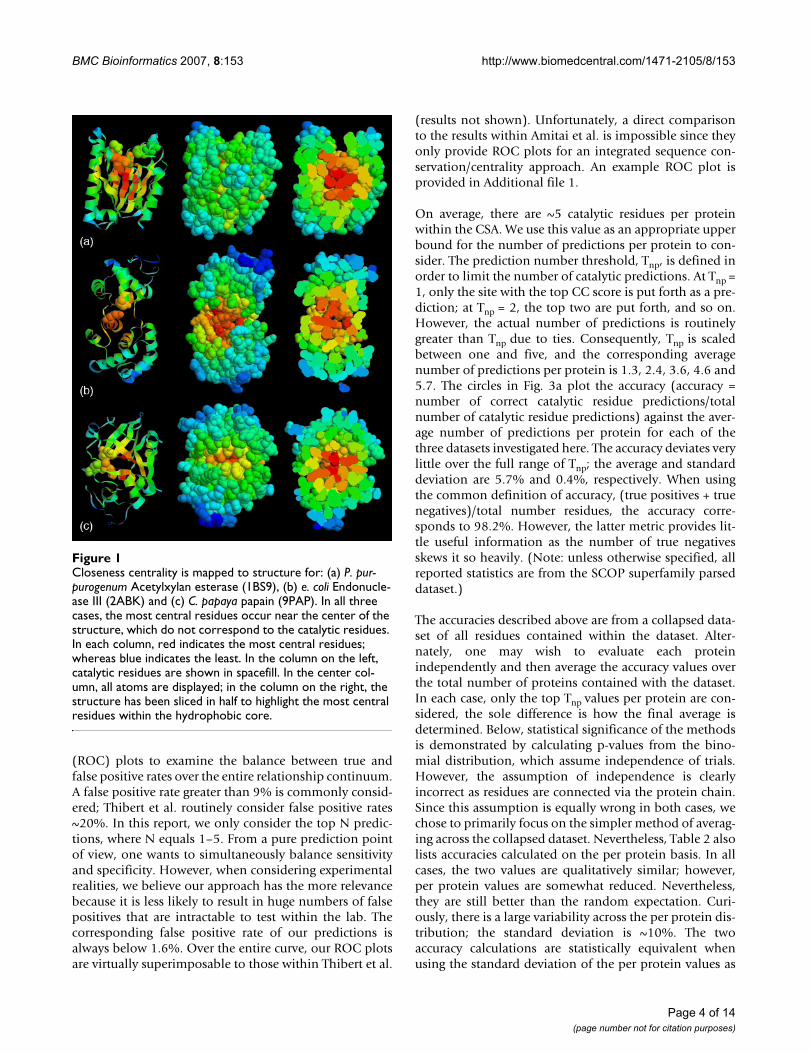
Results and discussionProbability density functionsMapping CC to structure clearly indicates that residueswith high centralities are most likely to occur within theprotein core. As is the case in the three examples shown inFig. 1, catalytic residues frequently do not correspond tothe most central residues. Nevertheless, Fig. 2a indicatesthat there is clear discrimination between the CC proba-bility density functions (PDFs) of catalytic and noncata-lytic residues. The data plotted within in Fig. 2 is takenfrom 283 structurally unique protein chains; meaning notwo proteins from a single SCOP superfamily areincluded. This translates to 96,280 noncatalytic residuesand 844 catalytic residues. The PDFs describing datasetsparsed by SCOP family (423 proteins) and 80% pairwisesequence identity (568 proteins) are virtually identical tothose shown. The average CC values for the catalytic andnoncatalytic residues are 0.19 and 0.16, respectively.While Fig. 2a suggests that the most extreme CC scores arenot likely to be catalytic, catalytic residues are, on average,more central than noncatalytic residues. A two-sample t-test resolutely confirms that the discrimination betweenthe means is statistically significant (t = 2.0; p = 1.6E-73;sample size = 7,372). Nevertheless, there is appreciableoverlap (59.5%) between the two PDFs.
Going further, Fig. 2b compares the PDFs of residues fromthree accessibility levels to the catalytic residue PDF. Thethree accessibility levels roughly correspond to the thirdmost buried, middle third and third most exposed resi-dues within the parsed dataset. At each accessibility level,the catalytic residue PDF has a statistically significantincrease within its mean value (see Table 1). As discussedabove, this result is slightly counterintuitive because themost buried (and thus, most central) residues frequentlyare not catalytic. Rather, this result demonstrates that cat-alytic residues are, on average, more central than the topthird most buried residues. Again, this result confirms theearlier observations of Amitai. Yet, caution should beexercised when drawing far-reaching conclusions basedon this analysis due to the considerable overlap betweenthe distributions. This is especially true in the case of theburied residues, which has 85% overlap with the catalyticPDF.
Assessing prediction accuracy of top closeness centrality scoresAs stated above, several investigations have examined theprediction accuracy of global centrality metrics; however,none of the previous investigations are on the scale of thisreport. Nor, have any rigorously controlled for structuralredundancy as we do here. Of the previous reports, thelargest dataset investigated is 178 proteins [32], which(unlike ours) contained redundant structural folds. Previ-ous investigations use Receiver Operating Characteristic
CCi =∑N
Lp
ijj
(1)
Page 3 of 14(page number not for citation purposes)
BMC Bioinformatics 2007, 8:153 http://www.biomedcentral.com/1471-2105/8/153
(ROC) plots to examine the balance between true andfalse positive rates over the entire relationship continuum.A false positive rate greater than 9% is commonly consid-ered; Thibert et al. routinely consider false positive rates~20%. In this report, we only consider the top N predic-tions, where N equals 1–5. From a pure prediction pointof view, one wants to simultaneously balance sensitivityand specificity. However, when considering experimentalrealities, we believe our approach has the more relevancebecause it is less likely to result in huge numbers of falsepositives that are intractable to test within the lab. Thecorresponding false positive rate of our predictions isalways below 1.6%. Over the entire curve, our ROC plotsare virtually superimposable to those within Thibert et al.
(results not shown). Unfortunately, a direct comparisonto the results within Amitai et al. is impossible since theyonly provide ROC plots for an integrated sequence con-servation/centrality approach. An example ROC plot isprovided in Additional file 1.
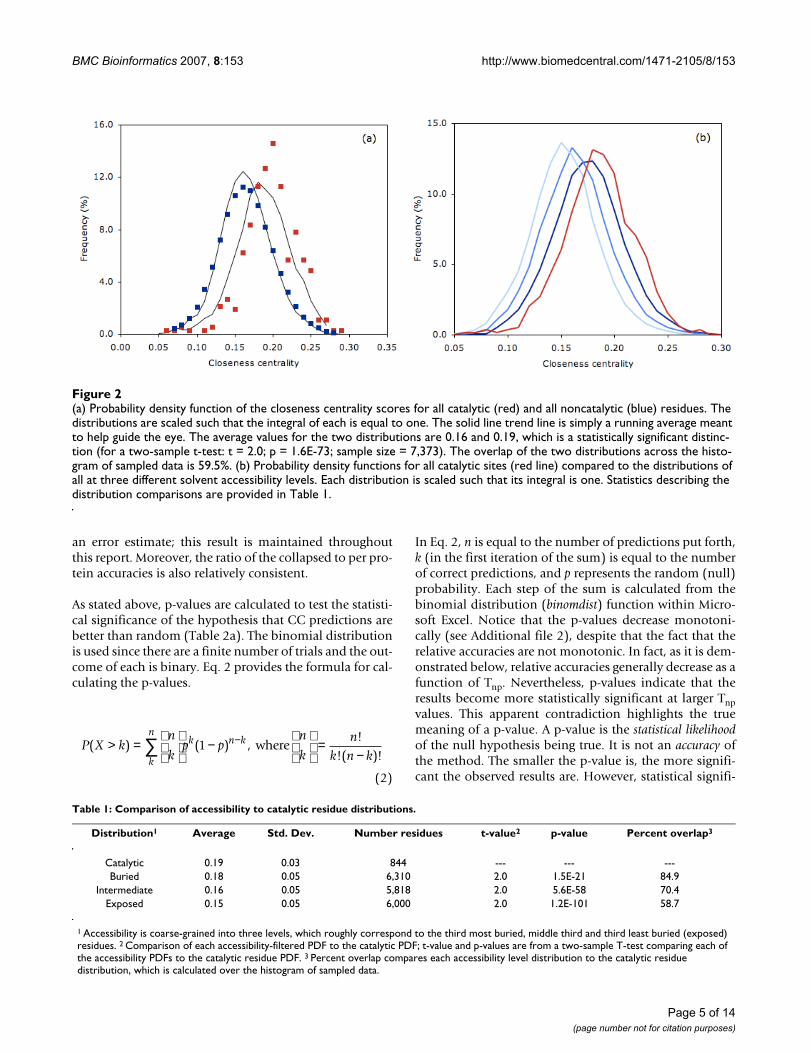
On average, there are ~5 catalytic residues per proteinwithin the CSA. We use this value as an appropriate upperbound for the number of predictions per protein to con-sider. The prediction number threshold, Tnp, is defined inorder to limit the number of catalytic predictions. At Tnp =1, only the site with the top CC score is put forth as a pre-diction; at Tnp = 2, the top two are put forth, and so on.However, the actual number of predictions is routinelygreater than Tnp due to ties. Consequently, Tnp is scaledbetween one and five, and the corresponding averagenumber of predictions per protein is 1.3, 2.4, 3.6, 4.6 and5.7. The circles in Fig. 3a plot the accuracy (accuracy =number of correct catalytic residue predictions/totalnumber of catalytic residue predictions) against the aver-age number of predictions per protein for each of thethree datasets investigated here. The accuracy deviates verylittle over the full range of Tnp; the average and standarddeviation are 5.7% and 0.4%, respectively. When usingthe common definition of accuracy, (true positives + truenegatives)/total number residues, the accuracy corre-sponds to 98.2%. However, the latter metric provides lit-tle useful information as the number of true negativesskews it so heavily. (Note: unless otherwise specified, allreported statistics are from the SCOP superfamily parseddataset.)
The accuracies described above are from a collapsed data-set of all residues contained within the dataset. Alter-nately, one may wish to evaluate each proteinindependently and then average the accuracy values overthe total number of proteins contained with the dataset.In each case, only the top Tnp values per protein are con-sidered, the sole difference is how the final average isdetermined. Below, statistical significance of the methodsis demonstrated by calculating p-values from the bino-mial distribution, which assume independence of trials.However, the assumption of independence is clearlyincorrect as residues are connected via the protein chain.Since this assumption is equally wrong in both cases, wechose to primarily focus on the simpler method of averag-ing across the collapsed dataset. Nevertheless, Table 2 alsolists accuracies calculated on the per protein basis. In allcases, the two values are qualitatively similar; however,per protein values are somewhat reduced. Nevertheless,they are still better than the random expectation. Curi-ously, there is a large variability across the per protein dis-tribution; the standard deviation is ~10%. The twoaccuracy calculations are statistically equivalent whenusing the standard deviation of the per protein values as
Closeness centrality is mapped to structure for: (a) P. pur-purogenum Acetylxylan esterase (1BS9), (b) e. coli Endonucle-ase III (2ABK) and (c) C. papaya papain (9PAP)Figure 1Closeness centrality is mapped to structure for: (a) P. pur-purogenum Acetylxylan esterase (1BS9), (b) e. coli Endonucle-ase III (2ABK) and (c) C. papaya papain (9PAP). In all three cases, the most central residues occur near the center of the structure, which do not correspond to the catalytic residues. In each column, red indicates the most central residues; whereas blue indicates the least. In the column on the left, catalytic residues are shown in spacefill. In the center col-umn, all atoms are displayed; in the column on the right, the structure has been sliced in half to highlight the most central residues within the hydrophobic core.
Page 4 of 14(page number not for citation purposes)
BMC Bioinformatics 2007, 8:153 http://www.biomedcentral.com/1471-2105/8/153
an error estimate; this result is maintained throughoutthis report. Moreover, the ratio of the collapsed to per pro-tein accuracies is also relatively consistent.
As stated above, p-values are calculated to test the statisti-cal significance of the hypothesis that CC predictions arebetter than random (Table 2a). The binomial distributionis used since there are a finite number of trials and the out-come of each is binary. Eq. 2 provides the formula for cal-culating the p-values.
In Eq. 2, n is equal to the number of predictions put forth,k (in the first iteration of the sum) is equal to the numberof correct predictions, and p represents the random (null)probability. Each step of the sum is calculated from thebinomial distribution (binomdist) function within Micro-soft Excel. Notice that the p-values decrease monotoni-cally (see Additional file 2), despite that the fact that therelative accuracies are not monotonic. In fact, as it is dem-onstrated below, relative accuracies generally decrease as afunction of Tnp. Nevertheless, p-values indicate that theresults become more statistically significant at larger Tnpvalues. This apparent contradiction highlights the truemeaning of a p-value. A p-value is the statistical likelihoodof the null hypothesis being true. It is not an accuracy ofthe method. The smaller the p-value is, the more signifi-cant the observed results are. However, statistical signifi-
P X kn
kp p
n
kn
k n kk
nk n k( ) ( ) ,
!!( )!
> =
−
=
−∑ −1 where
(2)
(a) Probability density function of the closeness centrality scores for all catalytic (red) and all noncatalytic (blue) residuesFigure 2(a) Probability density function of the closeness centrality scores for all catalytic (red) and all noncatalytic (blue) residues. The distributions are scaled such that the integral of each is equal to one. The solid line trend line is simply a running average meant to help guide the eye. The average values for the two distributions are 0.16 and 0.19, which is a statistically significant distinc-tion (for a two-sample t-test: t = 2.0; p = 1.6E-73; sample size = 7,373). The overlap of the two distributions across the histo-gram of sampled data is 59.5%. (b) Probability density functions for all catalytic sites (red line) compared to the distributions of all at three different solvent accessibility levels. Each distribution is scaled such that its integral is one. Statistics describing the distribution comparisons are provided in Table 1.
Table 1: Comparison of accessibility to catalytic residue distributions.
Distribution1 Average Std. Dev. Number residues t-value2 p-value Percent overlap3
Catalytic 0.19 0.03 844 --- --- ---Buried 0.18 0.05 6,310 2.0 1.5E-21 84.9
Intermediate 0.16 0.05 5,818 2.0 5.6E-58 70.4Exposed 0.15 0.05 6,000 2.0 1.2E-101 58.7
1 Accessibility is coarse-grained into three levels, which roughly correspond to the third most buried, middle third and third least buried (exposed) residues. 2 Comparison of each accessibility-filtered PDF to the catalytic PDF; t-value and p-values are from a two-sample T-test comparing each of the accessibility PDFs to the catalytic residue PDF. 3 Percent overlap compares each accessibility level distribution to the catalytic residue distribution, which is calculated over the histogram of sampled data.
Page 5 of 14(page number not for citation purposes)
BMC Bioinformatics 2007, 8:153 http://www.biomedcentral.com/1471-2105/8/153
cance is intimately related to the number of observations.The more observations of a given difference between anobserved and null probability, the more significant it is.The number of predictions put forth put forth at each levelincreases substantially, whereas the accuracy is onlyslightly diminished, which is why p-values monotonicallydecrease as a function Tnp.
The improvement is plotted in Fig. 3b in order to normal-ize the observed percentages by the random expectation.Improvement is defined as the ratio of observed accuracyto random expectation. The random expectation is simplycalculated as the percentage of catalytic to all sites withinthe dataset, meaning each site has an equal chance ofbeing catalytic. While not overwhelming, the observedaccuracies (~6%) are substantially greater than the nullmodel (0.9%). The average improvement over Tnp = 1–5 is6.4% (standard deviation = 0.4%). The false positiverange in Fig. 3a–b is 0.4–1.6%. The false positive rate iscalculated as the number of incorrect predictions dividedby the total number of noncatalytic residues. True positiverates (number correct divided by the total number of cat-alytic residues) range from 2.1–11.0%.
While the circles in Fig 3a correspond to overall accura-cies, the squares describe the number of proteins with atleast one correct prediction per protein. The near linearincrease is trivially expected since the number of proteinswith at least one correct should increase with the totalnumber of predictions. However, after normalizing forthe random expectation in Fig. 3b, the improvement indi-cates that the rate of new proteins with at least one correct
prediction generally decreases as a function of Tnp. Here,the random expectation describes the percentage of pro-teins with at least one correct again assuming that all sitesare equally probable to be catalytic.
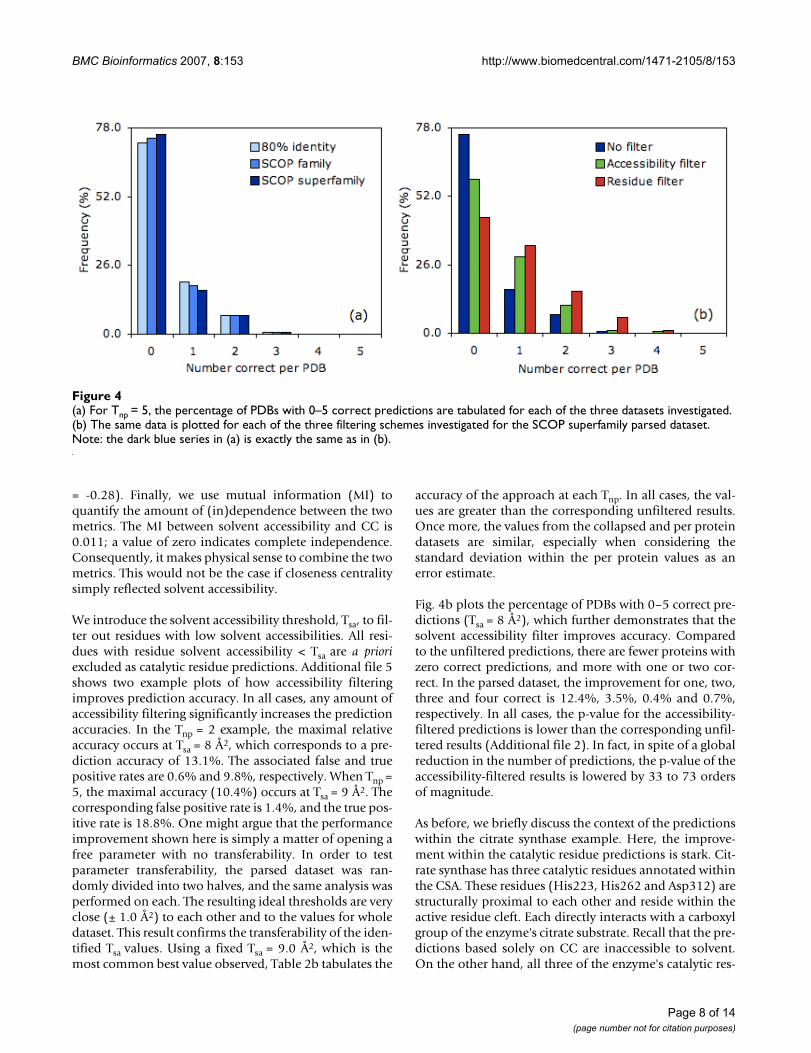
Fig. 4a tabulates the number of proteins observed with aspecific number of correct catalytic residue predictions atTnp = 5. By far, the most common incidence is zero correct(76%), which corresponds to every prediction within agiven protein being incorrect. Approximately 17% of thepredictions from the SCOP superfamily parsed datasethave one correct and 7% have two correct. Less than 1%has three correct, and none have four or five correct.Again, there is good agreement between the three datasets,yet (as before) there is a slight accuracy reduction withinthe smaller datasets.
Throughout this report, we use citrate synthase as anexample to discuss the context of the CC results. Citratesynthase is chosen because it nicely demonstrates how thetwo filters discussed below improve prediction accuracy.Moreover, citrate synthase is an important enzyme in aer-obic metabolism; it regulates the pace of the Krebs cycle.The enzyme catalyzes the condensation between the twoacetyl carbons from acetyl-CoA and oxaloacetate to formcitrate [38]. The reaction is energetically driven by hydrol-ysis of the thioester bond, which is strongly exothermic,within acetyl-CoA. None of the predictions at Tnp = 5 cor-respond to catalytic residues. While we are only narrowlyusing catalytic residues to benchmark the approach, thislack of sensitivity should not be interpreted as a completefailure to provide useful information. Similar to the exam-
(a) The accuracy for all predictions (circles) and the percentage of PDBs with one correct prediction (squares) is plotted for the three datasets investigatedFigure 3(a) The accuracy for all predictions (circles) and the percentage of PDBs with one correct prediction (squares) is plotted for the three datasets investigated. (b) Improvement normalizes the observed accuracies in (a) by the random expectation.
Page 6 of 14(page number not for citation purposes)
BMC Bioinformatics 2007, 8:153 http://www.biomedcentral.com/1471-2105/8/153
ples shown in Fig. 1, the five most central residues(Tyr185, Ala186, Phe333, Met335 and Gly336, using1AJ8 numbering) are all buried deep with the core of theprotein; in fact, four are completely inaccessible to sol-vent. Despite their location within the core, Tyr185 andPhe333 are both clearly important as they structurallycontact the catalytic Asp312. Moreover, Phe333 is alsocontacting the citrate substrate. While all non-protein(HETERO) groups have been stripped from our inputs tomake this large-scale analysis tractable, it is evocative thatthe model is picking residues directly interacting with thesubstrate, even if they are not catalytic per se. Below it isdemonstrated that filtering CC predictions by residueaccessibility and/or residue identity substantiallyimproves citrate synthase catalytic residue predictionaccuracy.
Improving prediction accuracy by excluding the most buried residuesStraightforward physical intuition suggests that the mostburied residues within the protein are likely to have thehighest CC values. Fig. 1 clearly demonstrates this expec-tation to be correct. However, conventional wisdom also
states that most catalytic residues are (at least partially)exposed to solvent [20]. For example, it is very commonto find catalytic residues at the bottom of an active residuecleft where they are partially obscured from solvent. This isbecause some exposure to solvent is important for recog-nition by the incoming substrate. Moreover, water mole-cules are frequently utilized along the reaction coordinate.As such, it makes sense to filter residue completely inac-cessible from solvent from further consideration.
As a first step toward improving CC catalytic residue pre-dictions using solvent accessibility, we begin by asking thequestion, "Are the solvent accessibility distributions of cata-lytic and noncatalytic residues significantly different?" Addi-tional file 3 clearly shows that the two distributions arevery similar. This result justifies the approach because itdemonstrates that CC does not simply recapitulate sol-vent accessibility. Put in other words, CC provides infor-mation orthogonal to accessibility. This point is furtherdemonstrated in Additional file 4 that plots accessibilityvs. CC for catalytic and noncatalytic residues. Similar tothe value reported within Amitai et al. [32], the overallcorrelation between solvent accessibility and CC is low (R
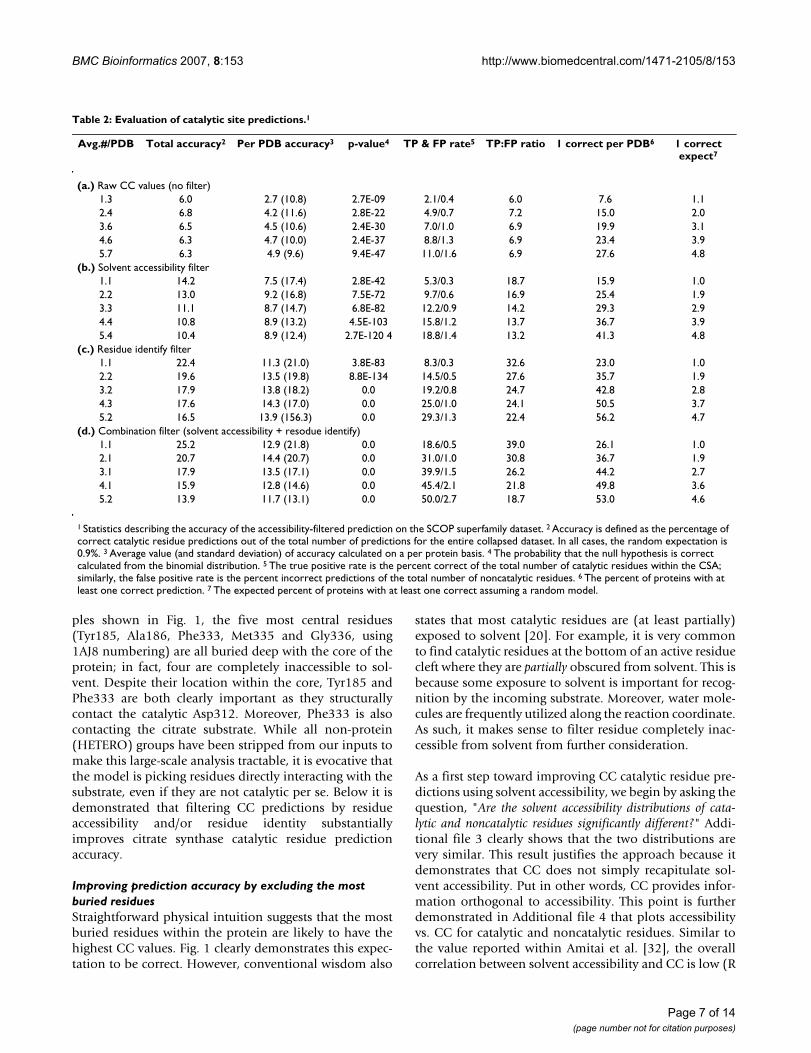
Table 2: Evaluation of catalytic site predictions.1
Avg.#/PDB Total accuracy2 Per PDB accuracy3 p-value4 TP & FP rate5 TP:FP ratio 1 correct per PDB6 1 correct expect7
(a.) Raw CC values (no filter)1.3 6.0 2.7 (10.8) 2.7E-09 2.1/0.4 6.0 7.6 1.12.4 6.8 4.2 (11.6) 2.8E-22 4.9/0.7 7.2 15.0 2.03.6 6.5 4.5 (10.6) 2.4E-30 7.0/1.0 6.9 19.9 3.14.6 6.3 4.7 (10.0) 2.4E-37 8.8/1.3 6.9 23.4 3.95.7 6.3 4.9 (9.6) 9.4E-47 11.0/1.6 6.9 27.6 4.8
(b.) Solvent accessibility filter1.1 14.2 7.5 (17.4) 2.8E-42 5.3/0.3 18.7 15.9 1.02.2 13.0 9.2 (16.8) 7.5E-72 9.7/0.6 16.9 25.4 1.93.3 11.1 8.7 (14.7) 6.8E-82 12.2/0.9 14.2 29.3 2.94.4 10.8 8.9 (13.2) 4.5E-103 15.8/1.2 13.7 36.7 3.95.4 10.4 8.9 (12.4) 2.7E-120 4 18.8/1.4 13.2 41.3 4.8
(c.) Residue identify filter1.1 22.4 11.3 (21.0) 3.8E-83 8.3/0.3 32.6 23.0 1.02.2 19.6 13.5 (19.8) 8.8E-134 14.5/0.5 27.6 35.7 1.93.2 17.9 13.8 (18.2) 0.0 19.2/0.8 24.7 42.8 2.84.3 17.6 14.3 (17.0) 0.0 25.0/1.0 24.1 50.5 3.75.2 16.5 13.9 (156.3) 0.0 29.3/1.3 22.4 56.2 4.7
(d.) Combination filter (solvent accessibility + resodue identify)1.1 25.2 12.9 (21.8) 0.0 18.6/0.5 39.0 26.1 1.02.1 20.7 14.4 (20.7) 0.0 31.0/1.0 30.8 36.7 1.93.1 17.9 13.5 (17.1) 0.0 39.9/1.5 26.2 44.2 2.74.1 15.9 12.8 (14.6) 0.0 45.4/2.1 21.8 49.8 3.65.2 13.9 11.7 (13.1) 0.0 50.0/2.7 18.7 53.0 4.6
1 Statistics describing the accuracy of the accessibility-filtered prediction on the SCOP superfamily dataset. 2 Accuracy is defined as the percentage of correct catalytic residue predictions out of the total number of predictions for the entire collapsed dataset. In all cases, the random expectation is 0.9%. 3 Average value (and standard deviation) of accuracy calculated on a per protein basis. 4 The probability that the null hypothesis is correct calculated from the binomial distribution. 5 The true positive rate is the percent correct of the total number of catalytic residues within the CSA; similarly, the false positive rate is the percent incorrect predictions of the total number of noncatalytic residues. 6 The percent of proteins with at least one correct prediction. 7 The expected percent of proteins with at least one correct assuming a random model.
Page 7 of 14(page number not for citation purposes)
BMC Bioinformatics 2007, 8:153 http://www.biomedcentral.com/1471-2105/8/153
= -0.28). Finally, we use mutual information (MI) toquantify the amount of (in)dependence between the twometrics. The MI between solvent accessibility and CC is0.011; a value of zero indicates complete independence.Consequently, it makes physical sense to combine the twometrics. This would not be the case if closeness centralitysimply reflected solvent accessibility.
We introduce the solvent accessibility threshold, Tsa, to fil-ter out residues with low solvent accessibilities. All resi-dues with residue solvent accessibility < Tsa are a prioriexcluded as catalytic residue predictions. Additional file 5shows two example plots of how accessibility filteringimproves prediction accuracy. In all cases, any amount ofaccessibility filtering significantly increases the predictionaccuracies. In the Tnp = 2 example, the maximal relativeaccuracy occurs at Tsa = 8 Å2, which corresponds to a pre-diction accuracy of 13.1%. The associated false and truepositive rates are 0.6% and 9.8%, respectively. When Tnp =5, the maximal accuracy (10.4%) occurs at Tsa = 9 Å2. Thecorresponding false positive rate is 1.4%, and the true pos-itive rate is 18.8%. One might argue that the performanceimprovement shown here is simply a matter of opening afree parameter with no transferability. In order to testparameter transferability, the parsed dataset was ran-domly divided into two halves, and the same analysis wasperformed on each. The resulting ideal thresholds are veryclose (± 1.0 Å2) to each other and to the values for wholedataset. This result confirms the transferability of the iden-tified Tsa values. Using a fixed Tsa = 9.0 Å2, which is themost common best value observed, Table 2b tabulates the
accuracy of the approach at each Tnp. In all cases, the val-ues are greater than the corresponding unfiltered results.Once more, the values from the collapsed and per proteindatasets are similar, especially when considering thestandard deviation within the per protein values as anerror estimate.
Fig. 4b plots the percentage of PDBs with 0–5 correct pre-dictions (Tsa = 8 Å2), which further demonstrates that thesolvent accessibility filter improves accuracy. Comparedto the unfiltered predictions, there are fewer proteins withzero correct predictions, and more with one or two cor-rect. In the parsed dataset, the improvement for one, two,three and four correct is 12.4%, 3.5%, 0.4% and 0.7%,respectively. In all cases, the p-value for the accessibility-filtered predictions is lower than the corresponding unfil-tered results (Additional file 2). In fact, in spite of a globalreduction in the number of predictions, the p-value of theaccessibility-filtered results is lowered by 33 to 73 ordersof magnitude.
As before, we briefly discuss the context of the predictionswithin the citrate synthase example. Here, the improve-ment within the catalytic residue predictions is stark. Cit-rate synthase has three catalytic residues annotated withinthe CSA. These residues (His223, His262 and Asp312) arestructurally proximal to each other and reside within theactive residue cleft. Each directly interacts with a carboxylgroup of the enzyme's citrate substrate. Recall that the pre-dictions based solely on CC are inaccessible to solvent.On the other hand, all three of the enzyme's catalytic res-
(a) For Tnp = 5, the percentage of PDBs with 0–5 correct predictions are tabulated for each of the three datasets investigatedFigure 4(a) For Tnp = 5, the percentage of PDBs with 0–5 correct predictions are tabulated for each of the three datasets investigated. (b) The same data is plotted for each of the three filtering schemes investigated for the SCOP superfamily parsed dataset. Note: the dark blue series in (a) is exactly the same as in (b).
Page 8 of 14(page number not for citation purposes)
BMC Bioinformatics 2007, 8:153 http://www.biomedcentral.com/1471-2105/8/153
idues are partially exposed to solvent in both the func-tional dimer and the constituent monomers that are ourpredictions are based. The monomer exposure of His223,His262 and Asp312 is 34, 52 and 10 Å2, respectively. Theaccessibilities of His223 and His262 within the dimer areslightly reduced, whereas the Asp312 value is unaffected.Based solely on CC (i.e. no filtering), the network modelfails to predict either of the catalytic residues; in fact, theyonly rank order 27th, 43rd and 172nd (of 371 residues).Nevertheless, after filtering all residues solvent accessibil-ities less than 9 Å2, His223 and Asp312 are correctly pre-dicted to be catalytic.
As suggested above, sites other than the catalytic residuescan also be critical to function [38-40]. Additionally, it ispossible that sites not annotated within the CSA mightalso be catalytic, or at the very least, directly related tofunctional efficiency. In fact, Russell et al. define ten addi-tional active site residues as being critical to function [37].In spite of this more liberal definition, none of theremaining three accessibility-filtered predictions (Glu189,Lys219 and Glu228) correspond to sites within theexpanded benchmark. Nevertheless, these residues areclearly important, as they are structurally proximal to bothcatalytic sites. This result is trivially expected due to theirsequence proximity to His218; however, the fact that CC,which treats considers each vertex without regard to pri-mary structure, is promising.
Filtering based on residue identityWhile we explicitly avoid alignment and phylogeny datahere, it might be possible to improve prediction accuracyby simply filtering out residues that are unlikely to be cat-alytic based on their innate physiochemical properties.For example, in the neural networkbased predictionapproach of Gutteridge et al. [19], it is demonstrated thatthe single most import element of the input is whether ornot the residue being considered is histidine. The secondmost important element is residue conservation, which isfollowed closely by whether or not the residue in questionis lysine, cysteine, aspartate, glutamate and arginine (inthat order). These sequencebased input elements are allmore important than a variety of commonsense structuralcharacteristics (i.e. depth, solvent accessibility, cleft infor-mation and secondary structure). Consequently, weimplement a simple filter based on residue identity here.Any residue that is not histidine, lysine, cysteine, aspar-tate, glutamate or arginine is excluded from further con-sideration. We have tried other combinations of residueexclusion, but this provides the best overall results. Acomparison of per residue CC values for catalytic andnoncatalytic residues is provided in Additional file 6.
The accuracy of the residue identity filtered predictionsranges from 16.5 to 22.4%, which is a substantial
improvement over the random expectation of 0.9%(Table 2c). Predicting catalytic residues by residue identityalone provides a second baseline to compare to. In thisapproach, a prediction is put forth each time one of the sixresidue types listed above occurs. Using only residue iden-tity results in an accuracy of 2.1%, which is only slightlybetter than random expectation of 0.9%. Moreover, it issubstantially less than the residue identity filtered results,meaning CC substantially improves predictive power overresidue identity alone. Like before, the per protein accu-racy range is significantly less (11.3 to 14.3%) than thecollapsed results. Nevertheless, the main result that themethod significantly improves upon the solvent accessi-bility filtered predictions is clearly conserved.
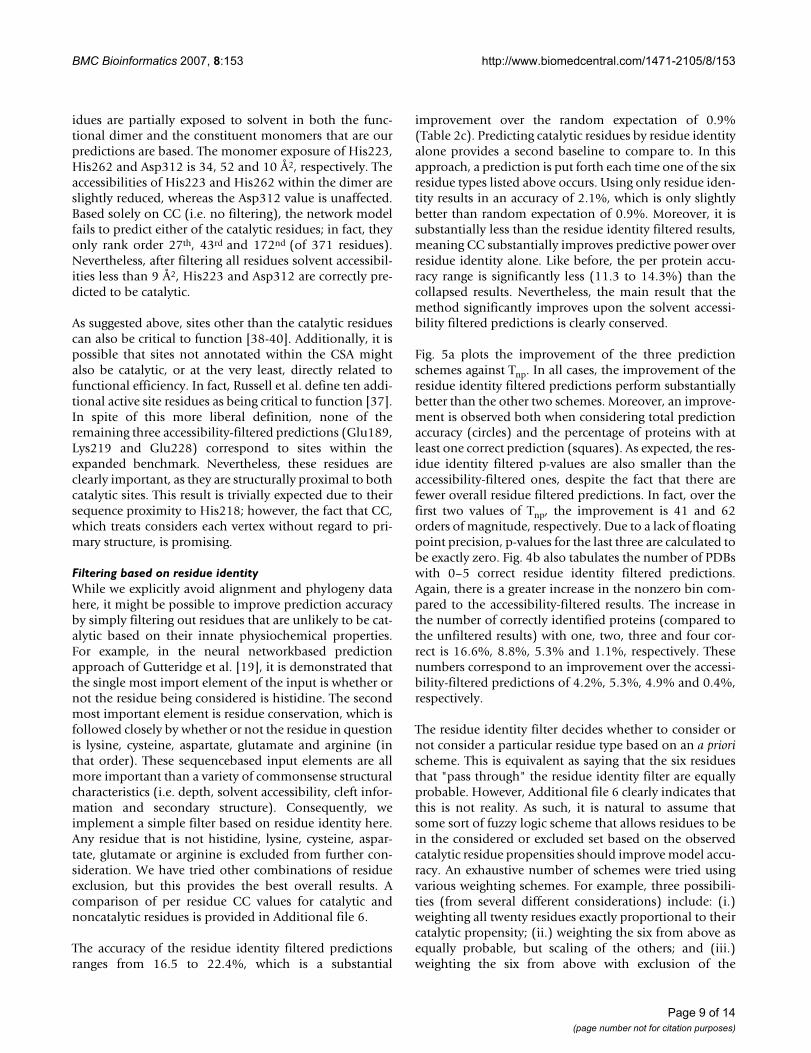
Fig. 5a plots the improvement of the three predictionschemes against Tnp. In all cases, the improvement of theresidue identity filtered predictions perform substantiallybetter than the other two schemes. Moreover, an improve-ment is observed both when considering total predictionaccuracy (circles) and the percentage of proteins with atleast one correct prediction (squares). As expected, the res-idue identity filtered p-values are also smaller than theaccessibility-filtered ones, despite the fact that there arefewer overall residue filtered predictions. In fact, over thefirst two values of Tnp, the improvement is 41 and 62orders of magnitude, respectively. Due to a lack of floatingpoint precision, p-values for the last three are calculated tobe exactly zero. Fig. 4b also tabulates the number of PDBswith 0–5 correct residue identity filtered predictions.Again, there is a greater increase in the nonzero bin com-pared to the accessibility-filtered results. The increase inthe number of correctly identified proteins (compared tothe unfiltered results) with one, two, three and four cor-rect is 16.6%, 8.8%, 5.3% and 1.1%, respectively. Thesenumbers correspond to an improvement over the accessi-bility-filtered predictions of 4.2%, 5.3%, 4.9% and 0.4%,respectively.
The residue identity filter decides whether to consider ornot consider a particular residue type based on an a priorischeme. This is equivalent as saying that the six residuesthat "pass through" the residue identity filter are equallyprobable. However, Additional file 6 clearly indicates thatthis is not reality. As such, it is natural to assume thatsome sort of fuzzy logic scheme that allows residues to bein the considered or excluded set based on the observedcatalytic residue propensities should improve model accu-racy. An exhaustive number of schemes were tried usingvarious weighting schemes. For example, three possibili-ties (from several different considerations) include: (i.)weighting all twenty residues exactly proportional to theircatalytic propensity; (ii.) weighting the six from above asequally probable, but scaling of the others; and (iii.)weighting the six from above with exclusion of the
Page 9 of 14(page number not for citation purposes)
BMC Bioinformatics 2007, 8:153 http://www.biomedcentral.com/1471-2105/8/153
remainder. However, no statistically significant improve-ment over what is reported in Table 2c is found. In the firsttwo examples, the fuzzy model actually does worse sincecatalytic residues make up such a tiny fraction of the totalnumber of residues. Meaning, any relaxed filtering criteriaallows many more noncatalytic (vs. catalytic) residues tobe considered; consequently, specificity is lost. Con-versely, the best of the trials within the third scheme is sta-tistically indistinguishable from Table 2c.
Filtering based on residue identity results in the followingset of predictions (Glu187, His188, Lys219, Asp312 andArg337) within citrate synthase at Tnp = 5. Asp312 andLys219 are discussed above, whereas Glu187, His188 andArg337 are noncatalytic residues within the active siteregion. As with Phe333, both His188 and Arg337 aredirectly interacting with the citrate substrate (see Fig. 6).These residues are also interacting with several of the resi-dues identified without filtering. This result, along withthose from above, highlights the fact that the three differ-ent prediction schemes are identifying citrate synthase res-idues structurally proximal to the catalytic residues. A
similar overall trend is observed when investigating otherproteins.
Combining solvent accessibility and residue identityCombining both filters together results in slight improve-ment over the residue identity filter at Tnp = 1–2 (Fig. 5b).At Tnp = 4 and 5, the combination slightly underperformsthe residue identity filter, yet the values are still signifi-cantly better than the accessibility-filtered results. (At Tnp= 3 the results are virtually identical to the residue identityfiltered predictions.) The likely explanation for this resultis due to the fact that the filters eliminate similar informa-tion. For example, it is trivially expected, due to their pro-pensity to be within the core, that residues eliminated bythe accessibility filter will be nonpolar amino acids. Like-wise, the residue identity filter always eliminates nonpolarresidues from further consideration. As done above withthe residue identity filtered results, a baseline without CCis considered. In this instance, any time one of the six con-sidered residue types occurs with a solvent accessibilitybelow 9 Å2, a prediction is put forth. This scheme resultsin an accuracy of 2.5%, slightly better than the 2.1% of
(a) Improvement for all predictions and percent of proteins with at least one correct is plotted for: no filtering (blue), solvent accessibility filtering (green) and residue identity filtering (red)Figure 5(a) Improvement for all predictions and percent of proteins with at least one correct is plotted for: no filtering (blue), solvent accessibility filtering (green) and residue identity filtering (red). The data presented is from the SCOP superfamily parsed data-set. Symbols are the same as in Fig. 3. In (b), the combination (accessibility + residue identity) filter (magenta) is shown to per-form very similar to the residue identity filter alone.
Page 10 of 14(page number not for citation purposes)

BMC Bioinformatics 2007, 8:153 http://www.biomedcentral.com/1471-2105/8/153
residue identity alone, yet nowhere near the accuracies ofthe combination-filtered CC scores.
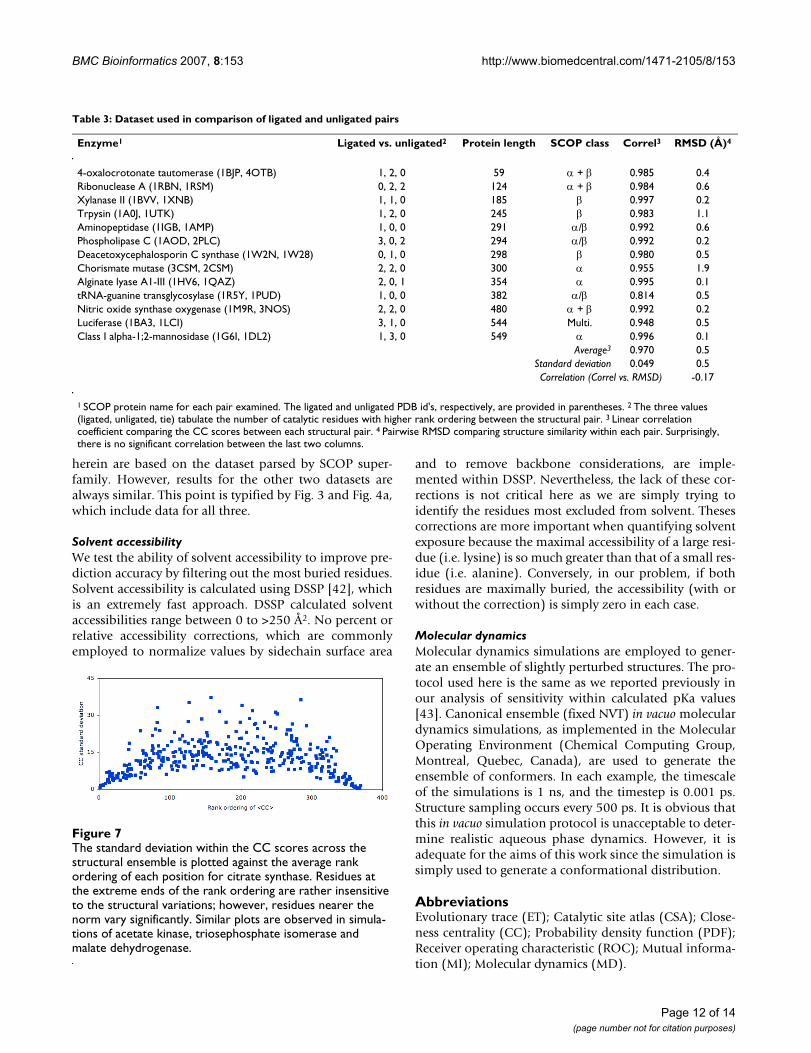
Sensitivity to structural inputIt is also important to assess the sensitivity of the CCmethod to structural input variations. Specifically, liga-tion state could have a pronounced affect on the observedresults. To explore the effects of bound substrate, thirteenrandomly chosen structure pairs (with and without lig-and) are compared (Table 3). The chosen structures repre-sent a diverse spectrum of protein sizes and SCOP classes.Encouragingly, the average correlation coefficientbetween CC values for each pair is very high (<R> = 0.970;standard deviation = 0.049), meaning that CC is ratherrobust to the structural differences. Surprisingly, there isno correlation between CC correlation and pairwise struc-tural RMSD calculated via combinatorial extension [40](see Table 3). It is also important to consider what is hap-pening between specific catalytic pairs. Comparing the rel-ative rank ordering within each catalytic residue pairreveals that the rank within ligated structures increases46.2% of the time. Conversely, the rank increases 41.0%of the time within unligated structures; there is no changein the rank 12.8% of the time. Accordingly, there is no sys-tematic performance increase when choosing structuresbased on the presence or absence of bound substrate.
Similarly, we also examined the sensitivity of the CCmethod to slight structural perturbations. Here, we usemolecular dynamics simulations (MD) to "shake up" thestructure a small amount (we specifically focus on slightstructural perturbations) and compare the resultant CCvalues. Additional file 7 plots the average CC value +standard deviation for the citrate synthase conformers.The plot clearly demonstrates that CC is fairly robust tothese slight structural rearrangements. More importantly,the results concerning catalytic sites predicted after filter-ing results are overall unchanged. Fig. 7 plots the CCstandard deviation vs. the CC rank for each residue withincitrate synthase. Residues at the extremes of the CC distri-bution vary little across the simulation; whereas, residueswith CC values near the norm fluctuate much more. Sim-ilar results are observed in three other MD simulations.Since catalytic residue CC values are not exclusively at thetop end of the distribution, the potential for slight fluctu-ations to affect prediction accuracy is present (eventhough it is not observed here). Future work will explorethis result more thoroughly.
ConclusionThis report investigates the ability of CC to predictenzyme catalytic residues from topological descriptions ofprotein structure. While the most central residues gener-ally correspond to positions within the core, the predic-tions are substantially better than the randomexpectation. This result is maintained whether one aver-ages over the collapsed or per protein datasets. Filteringthe predictions by solvent accessibility and/or residueidentity improves the results considerably. Overall, theseresults are comparable to those from previous reports[32,33], but have better statistics due to database size andcomposition. Additionally, we carefully examine theeffect of input structure on our predictions. Pairwise com-parisons between ligated and unligated structures revealsno clear trend regarding which input is a better choice.Similarly, slight structural perturbations of four proteinexamples via MD simulation have no observed effect onthe overall conclusions.
MethodsDatasetThree different datasets extracted from the manuallyannotated CSA entries are examined here. The first, whichcontains 568 PDB files, represents a dataset randomlyculled such that no two sequences have greater than 80%sequence identity. The second and third datasets use struc-tural information to randomly distil to nonredundantSCOP [36] families (423 proteins) and superfamilies (283proteins). In each dataset, a single chain per protein struc-ture is included; however, our analysis of all chains dem-onstrates that the overall accuracies are generally robust tochain differences (results not shown). All figures shown
All predictions within citrate synthase, as discussed in the text, are shown in spacefillFigure 6All predictions within citrate synthase, as discussed in the text, are shown in spacefill. Note that they all cluster within the active site region. Coenzyme-A and the citrate substrate are shown in purple and magenta, respectively. The two cor-rectly predicted catalytic residues are shown in red; the unpredicted catalytic residue (His262) is shown in orange. The image on the left, which is rotated 180 degrees from the one on the right, is centered on Asp312 whereas the image on the right is centered on His223. Unfiltered predictions are colored cyan. Except for Lys219, the remaining accessibility and residue identity filtered predictions are colored yellow and blue, respectively. Lys219, which is predicted by both fil-tering schemes, is colored green (yellow + blue = green).
Page 11 of 14(page number not for citation purposes)
BMC Bioinformatics 2007, 8:153 http://www.biomedcentral.com/1471-2105/8/153
herein are based on the dataset parsed by SCOP super-family. However, results for the other two datasets arealways similar. This point is typified by Fig. 3 and Fig. 4a,which include data for all three.
Solvent accessibilityWe test the ability of solvent accessibility to improve pre-diction accuracy by filtering out the most buried residues.Solvent accessibility is calculated using DSSP [42], whichis an extremely fast approach. DSSP calculated solventaccessibilities range between 0 to >250 Å2. No percent orrelative accessibility corrections, which are commonlyemployed to normalize values by sidechain surface area
and to remove backbone considerations, are imple-mented within DSSP. Nevertheless, the lack of these cor-rections is not critical here as we are simply trying toidentify the residues most excluded from solvent. Thesescorrections are more important when quantifying solventexposure because the maximal accessibility of a large resi-due (i.e. lysine) is so much greater than that of a small res-idue (i.e. alanine). Conversely, in our problem, if bothresidues are maximally buried, the accessibility (with orwithout the correction) is simply zero in each case.
Molecular dynamicsMolecular dynamics simulations are employed to gener-ate an ensemble of slightly perturbed structures. The pro-tocol used here is the same as we reported previously inour analysis of sensitivity within calculated pKa values[43]. Canonical ensemble (fixed NVT) in vacuo moleculardynamics simulations, as implemented in the MolecularOperating Environment (Chemical Computing Group,Montreal, Quebec, Canada), are used to generate theensemble of conformers. In each example, the timescaleof the simulations is 1 ns, and the timestep is 0.001 ps.Structure sampling occurs every 500 ps. It is obvious thatthis in vacuo simulation protocol is unacceptable to deter-mine realistic aqueous phase dynamics. However, it isadequate for the aims of this work since the simulation issimply used to generate a conformational distribution.
AbbreviationsEvolutionary trace (ET); Catalytic site atlas (CSA); Close-ness centrality (CC); Probability density function (PDF);Receiver operating characteristic (ROC); Mutual informa-tion (MI); Molecular dynamics (MD).
The standard deviation within the CC scores across the structural ensemble is plotted against the average rank ordering of each position for citrate synthaseFigure 7The standard deviation within the CC scores across the structural ensemble is plotted against the average rank ordering of each position for citrate synthase. Residues at the extreme ends of the rank ordering are rather insensitive to the structural variations; however, residues nearer the norm vary significantly. Similar plots are observed in simula-tions of acetate kinase, triosephosphate isomerase and malate dehydrogenase.
Table 3: Dataset used in comparison of ligated and unligated pairs
Enzyme1 Ligated vs. unligated2 Protein length SCOP class Correl3 RMSD (Å)4
4-oxalocrotonate tautomerase (1BJP, 4OTB) 1, 2, 0 59 α + β 0.985 0.4Ribonuclease A (1RBN, 1RSM) 0, 2, 2 124 α + β 0.984 0.6Xylanase II (1BVV, 1XNB) 1, 1, 0 185 β 0.997 0.2Trpysin (1A0J, 1UTK) 1, 2, 0 245 β 0.983 1.1Aminopeptidase (1IGB, 1AMP) 1, 0, 0 291 α/β 0.992 0.6Phospholipase C (1AOD, 2PLC) 3, 0, 2 294 α/β 0.992 0.2Deacetoxycephalosporin C synthase (1W2N, 1W28) 0, 1, 0 298 β 0.980 0.5Chorismate mutase (3CSM, 2CSM) 2, 2, 0 300 α 0.955 1.9Alginate lyase A1-III (1HV6, 1QAZ) 2, 0, 1 354 α 0.995 0.1tRNA-guanine transglycosylase (1R5Y, 1PUD) 1, 0, 0 382 α/β 0.814 0.5Nitric oxide synthase oxygenase (1M9R, 3NOS) 2, 2, 0 480 α + β 0.992 0.2Luciferase (1BA3, 1LCI) 3, 1, 0 544 Multi. 0.948 0.5Class I alpha-1;2-mannosidase (1G6I, 1DL2) 1, 3, 0 549 α 0.996 0.1
Average3 0.970 0.5Standard deviation 0.049 0.5Correlation (Correl vs. RMSD) -0.17
1 SCOP protein name for each pair examined. The ligated and unligated PDB id's, respectively, are provided in parentheses. 2 The three values (ligated, unligated, tie) tabulate the number of catalytic residues with higher rank ordering between the structural pair. 3 Linear correlation coefficient comparing the CC scores between each structural pair. 4 Pairwise RMSD comparing structure similarity within each pair. Surprisingly, there is no significant correlation between the last two columns.
Page 12 of 14(page number not for citation purposes)
BMC Bioinformatics 2007, 8:153 http://www.biomedcentral.com/1471-2105/8/153
Authors' contributionsEC and DRL contributed equally to the performance ofthe work described herein. DRL oversaw the research andwrote the manuscript. Both authors have read andapproved the final version of the manuscript.
Additional material
AcknowledgementsAndrei Istomin is thanked for proof reading the manuscript. Anthony Fodor is thanked for reading an early draft of this paper and providing several val-uable suggestions. The reviewers are also thanked for a number of helpful suggestions. Swati Pande is thanked for constructing the ROC plots. James Torrance, from Janet Thornton's research group, is thanked for assistance with the Catalytic Site Atlas. This work is supported by a Joint Ventures Grant to DRL from the California State Program for Education and Research in Biotechnology. DRL is supported, in part, by NIH R01 GM073082. EC is supported by Howard Hughes Medical Institute under-graduate fellowship.
References1. Watson JD, Laskowski RA, Thornton JM: Predicting protein func-
tion from sequence and structural data. Curr Opin Struct Biol2005, 15(3):275-284.
2. Pazos F, Bang JW: Computational Prediction of FunctionallyImportant Regions in Proteins. Curr Bioinformatics 2006, 1:15-23.
3. Jones S, Thornton JM: Searching for functional sites in proteinstructures. Curr Opin Chem Biol 2004, 8(1):3-7.
4. Innis CA, Anand AP, Sowdhamini R: Prediction of functional sitesin proteins using conserved functional group analysis. J MolBiol 2004, 337(4):1053-1068.
5. Panchenko AR, Kondrashov F, Bryant S: Prediction of functionalsites by analysis of sequence and structure conservation. Pro-tein Sci 2004, 13(4):884-892.
6. Soyer OS, Goldstein RA: Predicting functional sites in proteins:site-specific evolutionary models and their application toneurotransmitter transporters. J Mol Biol 2004, 339(1):227-242.
7. Lichtarge O, Bourne HR, Cohen FE: An evolutionary tracemethod defines binding surfaces common to protein fami-lies. J Mol Biol 1996, 257(2):342-358.
8. Aloy P, Querol E, Aviles FX, Sternberg MJ: Automated structure-based prediction of functional sites in proteins: applicationsto assessing the validity of inheriting protein function fromhomology in genome annotation and to protein docking. JMol Biol 2001, 311(2):395-408.
9. Madabushi S, Yao H, Marsh M, Kristensen DM, Philippi A, Sowa ME,Lichtarge O: Structural clusters of evolutionary trace residuesare statistically significant and common in proteins. J Mol Biol2002, 316(1):139-154.
10. Yao H, Kristensen DM, Mihalek I, Sowa ME, Shaw C, Kimmel M, Kav-raki L, Lichtarge O: An accurate, sensitive, and scalable methodto identify functional sites in protein structures. J Mol Biol2003, 326(1):255-261.
11. Armon A, Graur D, Ben Tal N: ConSurf: an algorithmic tool forthe identification of functional regions in proteins by surfacemapping of phylogenetic information. J Mol Biol 2001,307(1):447-463.
12. Bickel PJ, Kechris KJ, Spector PC, Wedemayer GJ, Glazer AN: Find-ing important sites in protein sequences. Proc Natl Acad Sci USA2002, 99(23):14764-14771.
13. del Sol MA, Pazos F, Valencia A: Automatic methods for predict-ing functionally important residues. J Mol Biol 2003,326(4):1289-1302.
14. Landgraf R, Xenarios I, Eisenberg D: Three-dimensional clusteranalysis identifies interfaces and functional residue clustersin proteins. J Mol Biol 2001, 307(5):1487-1502.
15. La D, Livesay DR: MINER: Software for phylogenetic motifidentification. Nucleic Acids Res 2005:W267-W270.
16. La D, Livesay DR: Predicting functional sites with an auto-mated algorithm suitable for heterogeneous datasets. BMCBioinformatics 2005, 6(1):116.
17. La D, Sutch B, Livesay DR: Predicting protein functional siteswith phylogenetic motifs. Proteins 2005, 58(2):309-320.
18. Pazos F, Rausell A, Valencia A: Phylogeny-independent detectionof functional residues. Bioinformatics 2006, 22(12):1440-1448.
19. Gutteridge A, Bartlett GJ, Thornton JM: Using a neural networkand spatial clustering to predict the location of active sites inenzymes. J Mol Biol 2003, 330(4):719-734.
20. Bartlett GJ, Porter CT, Borkakoti N, Thornton JM: Analysis of cat-alytic residues in enzyme active sites. J Mol Biol 2002,324(1):105-121.
Additional file 1Supplementary figure 1. This file contains an example ROC curve.Click here for file[http://www.biomedcentral.com/content/supplementary/1471-2105-8-153-S1.pdf]
Additional file 2Supplementary figure 2. The probability of the null hypothesis being cor-rect at each Tnp value.Click here for file[http://www.biomedcentral.com/content/supplementary/1471-2105-8-153-S2.pdf]
Additional file 3Supplementary figure 3. Probability density functions of the solvent acces-sibility scores for all catalytic and all noncatalytic sites.Click here for file[http://www.biomedcentral.com/content/supplementary/1471-2105-8-153-S3.pdf]
Additional file 4Supplementary figure 4. Scatter plot of residue solvent accessibility vs. closeness centrality.Click here for file[http://www.biomedcentral.com/content/supplementary/1471-2105-8-153-S4.pdf]
Additional file 5Supplementary figure 5. The relative accuracy vs. solvent accessibility thresholds is plotted.Click here for file[http://www.biomedcentral.com/content/supplementary/1471-2105-8-153-S5.pdf]
Additional file 6Supplementary figure 6. Histogram comparing the catalytic vs. noncata-lytic average closeness centrality values for each residue type.Click here for file[http://www.biomedcentral.com/content/supplementary/1471-2105-8-153-S6.pdf]
Additional file 7Supplementary figure 7. Average CC value vs. sequence position for citrate synthase.Click here for file[http://www.biomedcentral.com/content/supplementary/1471-2105-8-153-S7.pdf]
Page 13 of 14(page number not for citation purposes)
BMC Bioinformatics 2007, 8:153 http://www.biomedcentral.com/1471-2105/8/153
Publish with BioMed Central and every scientist can read your work free of charge
"BioMed Central will be the most significant development for disseminating the results of biomedical research in our lifetime."
Sir Paul Nurse, Cancer Research UK
Your research papers will be:
available free of charge to the entire biomedical community
peer reviewed and published immediately upon acceptance
cited in PubMed and archived on PubMed Central
yours — you keep the copyright
Submit your manuscript here:http://www.biomedcentral.com/info/publishing_adv.asp
BioMedcentral
21. Porter CT, Bartlett GJ, Thornton JM: The Catalytic Site Atlas: aresource of catalytic sites and residues identified in enzymesusing structural data. Nucleic Acids Res 2004:D129-D133.
22. Neves-Petersen MT, Petersen SB: Protein electrostatics: areview of the equations and methods used to model electro-static equations in biomolecules – applications in biotechnol-ogy. Biotechnol Annu Rev 2003, 9:315-395.
23. Elcock AH: Prediction of functionally important residuesbased solely on the computed energetics of protein struc-ture. J Mol Biol 2001, 312(4):885-896.
24. Cheng G, Qian B, Samudrala R, Baker D: Improvement in proteinfunctional site prediction by distinguishing structural andfunctional constraints on protein family evolution using com-putational design. Nucleic Acids Res 2005, 33(18):5861-5867.
25. Ondrechen MJ, Clifton JG, Ringe D: THEMATICS: a simple com-putational predictor of enzyme function from structure. ProcNatl Acad Sci USA 2001, 98(22):12473-12478.
26. Livesay DR, Jambeck P, Rojnuckarin A, Subramaniam S: Conserva-tion of electrostatic properties within enzyme families andsuperfamilies. Biochemistry 2003, 42(12):3464-3473.
27. Livesay DR, La D: The evolutionary origins and catalytic impor-tance of conserved electrostatic networks within TIM-barrelproteins. Protein Sci 2005, 14(5):1158-1170.
28. Brinda KV, Vishveshwara S: A network representation of pro-tein structures: implications for protein stability. Biophys J2005, 89(6):4159-4170.
29. Dokholyan NV, Li L, Ding F, Shakhnovich EI: Topological determi-nants of protein folding. Proc Natl Acad Sci USA 2002,99(13):8637-8641.
30. Greene LH, Higman VA: Uncovering network systems withinprotein structures. J Mol Biol 2003, 334(4):781-791.
31. Vendruscolo M, Dokholyan NV, Paci E, Karplus M: Small-worldview of the amino acids that play a key role in protein folding.Phys Rev E Stat Nonlin Soft Matter Phys 2002, 65(6 Pt 1):061910.
32. Amitai G, Shemesh A, Sitbon E, Shklar M, Netanely D, Venger I, Pie-trokovski S: Network analysis of protein structures identifiesfunctional residues. J Mol Biol 2004, 344(4):. 1135-identity filtered
33. Thibert B, Bredesen DE, del Rio G: Improved prediction of criti-cal residues for protein function based on network and phyl-ogenetic analyses. BMC Bioinformatics 2005, 6:213.
34. Wangikar PP, Tendulkar AV, Ramya S, Mali DN, Sarawagi S: Func-tional sites in protein families uncovered via an objective andautomated graph theoretic approach. J Mol Biol 2003,326(3):955-978.
35. del Sol A, Fujihashi H, Amoros D, Nussinov R: Residue centrality,functionally important residues, and active site shape: analy-sis of enzyme and non-enzyme families. Protein Sci 2006,15(9):2120-2128.
36. Murzin AG, Brenner SE, Hubbard T, Chothia C: SCOP: a structuralclassification of proteins database for the investigation ofsequences and structures. J Mol Biol 1995, 247:536-540.
37. Kabsch W, Sander C: Dictionary of protein secondary struc-ture: pattern recognition of hydrogen-bonded and geometri-cal features. Biopolymers 1983, 22(12):2577-2637.
38. Russell RJ, Ferguson JM, Hough DW, Danson MJ, Taylor GL: Thecrystal structure of citrate synthase from the hyperther-mophilic archaeon pyrococcus furiosus at 1.9 A resolution.Biochemistry 1997, 36(33):9983-9994.
39. Usher KC, Remington SJ, Martin DP, Drueckhammer DG: A veryshort hydrogen bond provides only moderate stabilization ofan enzyme-inhibitor complex of citrate synthase. Biochemistry1994, 33(25):7753-7759.
40. Alter GM, Casazza JP, Zhi W, Nemeth P, Srere PA, Evans CT: Muta-tion of essential catalytic residues in pig citrate synthase. Bio-chemistry 1990, 29(33):7557-7563.
41. Kurz LC, Shah S, Frieden C, Nakra T, Stein RE, Drysdale GR, EvansCT, Srere PA: Catalytic strategy of citrate synthase: subunitinteractions revealed as a consequence of a single amino acidchange in the oxaloacetate binding site. Biochemistry 1995,34(41):13278-13288.
42. Livesay DR, Jacobs DJ, Kanjanapangka J, Chea E, Cortez H, Garcia J,Kidd P, Marquez MP, Pande S, Yang D: Probing the conforma-tional dependence of calculated pKa values. J Chem Theor &Comp 2006, 2(4):927-938.
Page 14 of 14(page number not for citation purposes)
Recommended


![Closeness Centrality Extended To Unconnected Graphs : The ...EN]ASNA09.pdf · Closeness Centrality Extended To Unconnected Graphs : The Harmonic Centrality Index Yannick Rochat1 Institute](https://img.dokumen.tips/doc/110x75/5e68c4d8d85073536033bf7b/closeness-centrality-extended-to-unconnected-graphs-the-enasna09pdf-closeness.jpg)