Graphing Behavior & Measuring Change
Graph ConstructionResearch Design
Graph InterpretationUsing Excel to Construct a Graph
Graph Construction
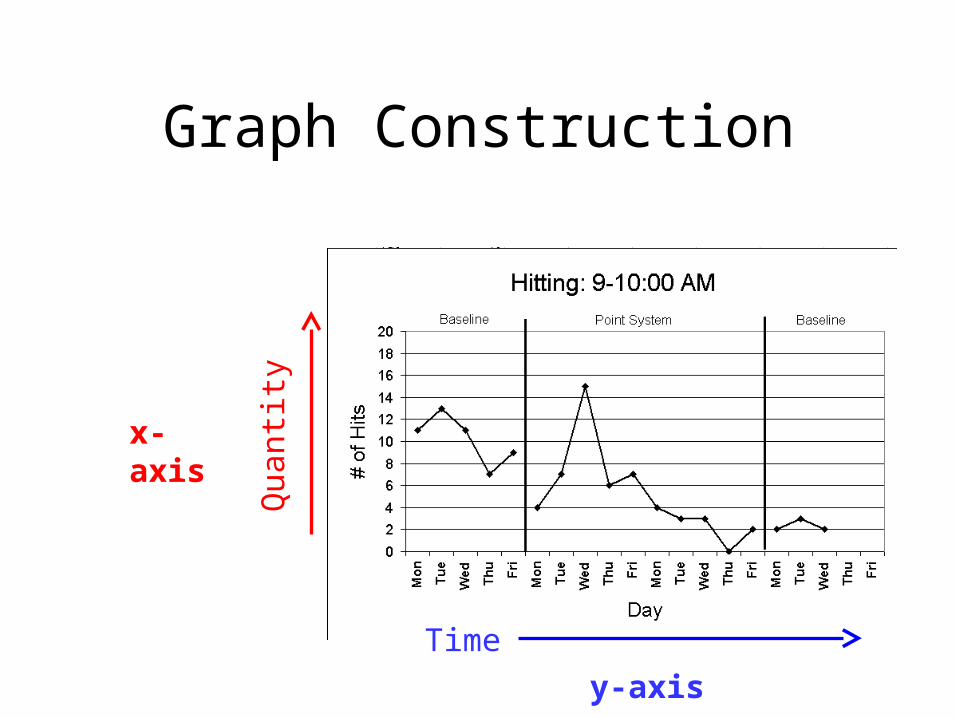
Graph Construction
x-axis
y-axis
Quan
tity
Time
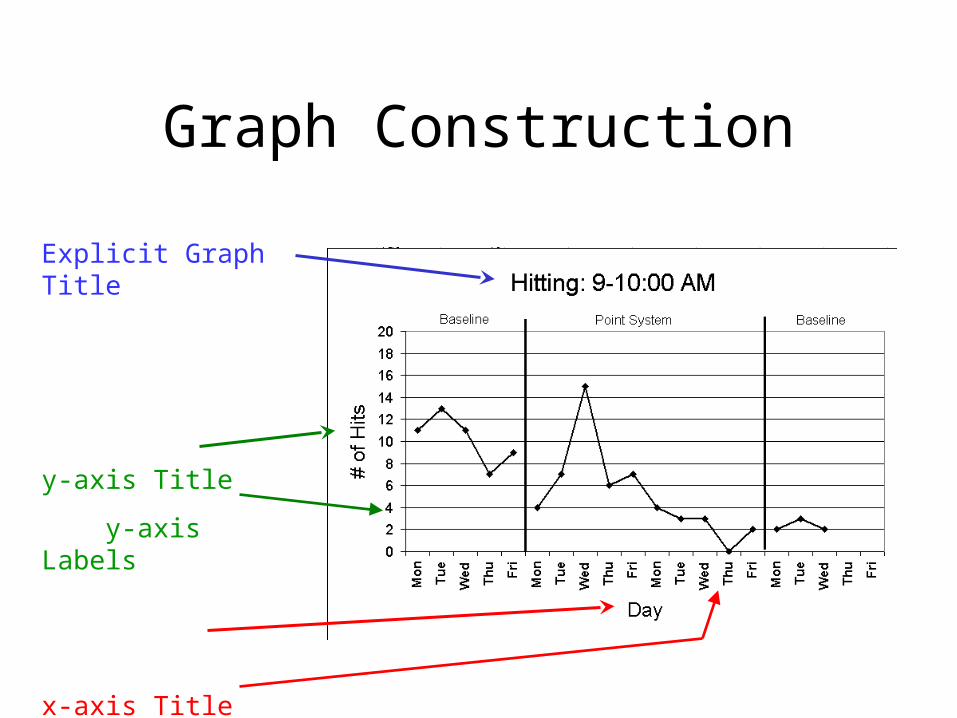
Graph Construction
Explicit Graph Title
y-axis Title
y-axis Labels
x-axis Title
x-axis Labels
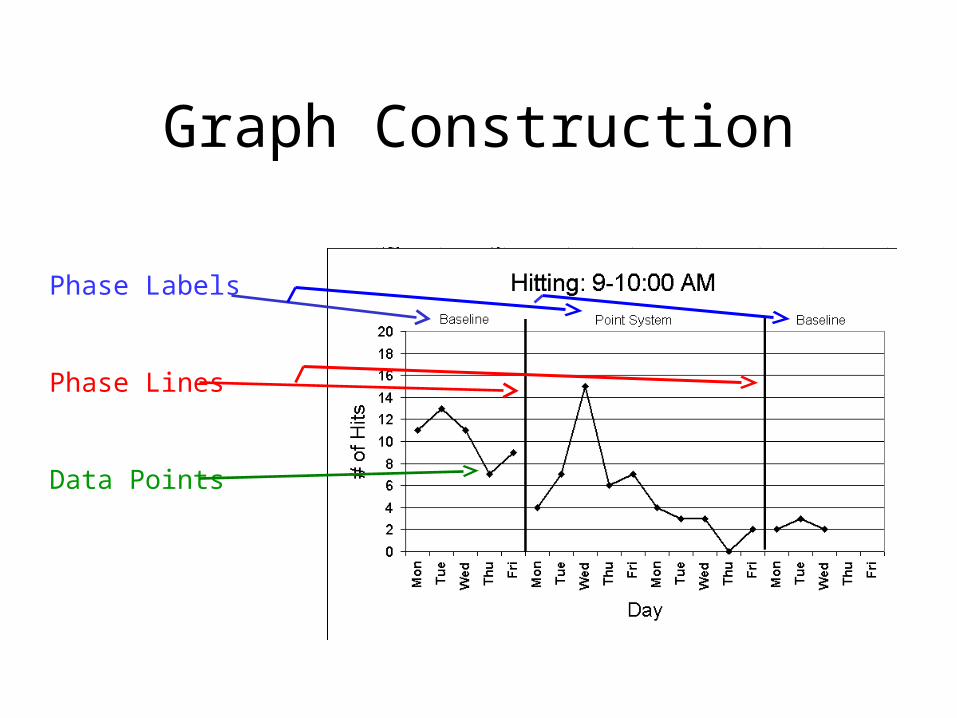
Graph Construction
Phase Labels
Phase Lines
Data Points
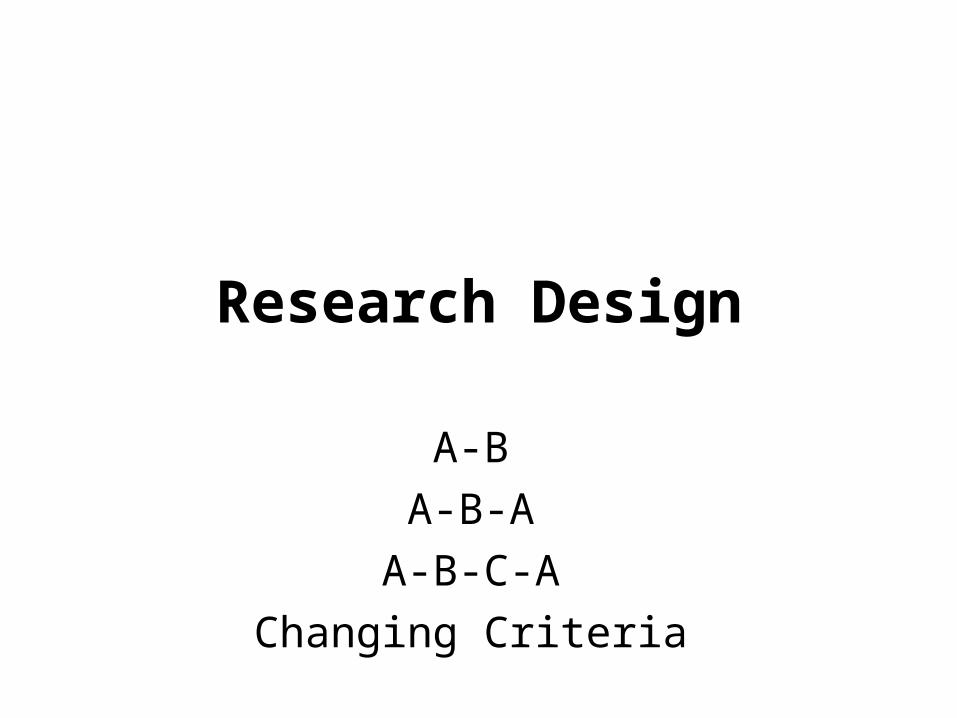
Research Design
A-BA-B-A
A-B-C-AChanging Criteria
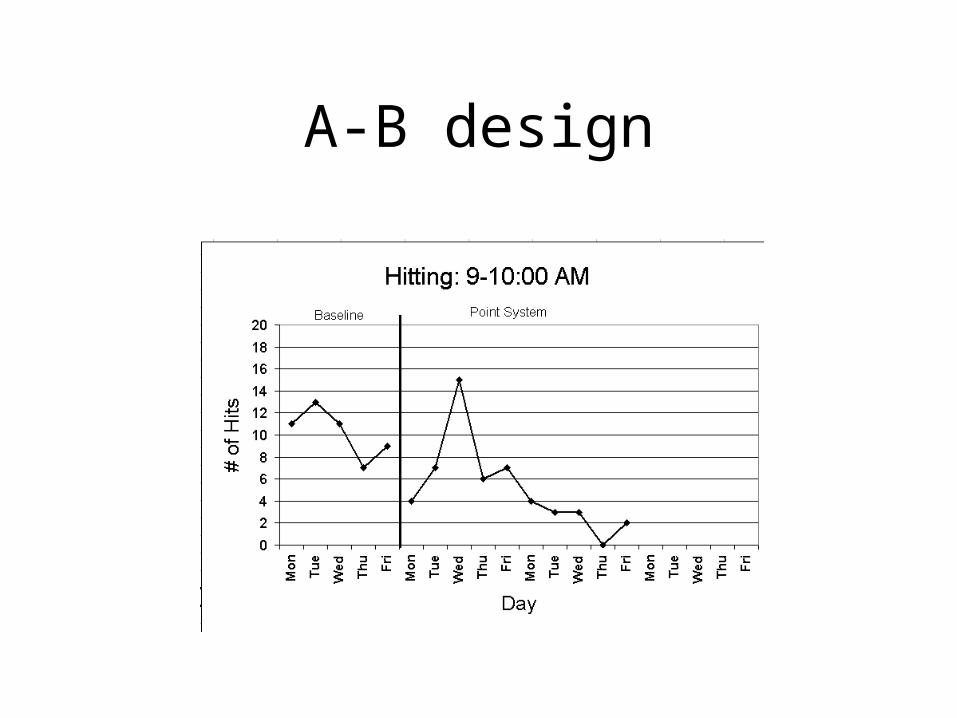
A-B design
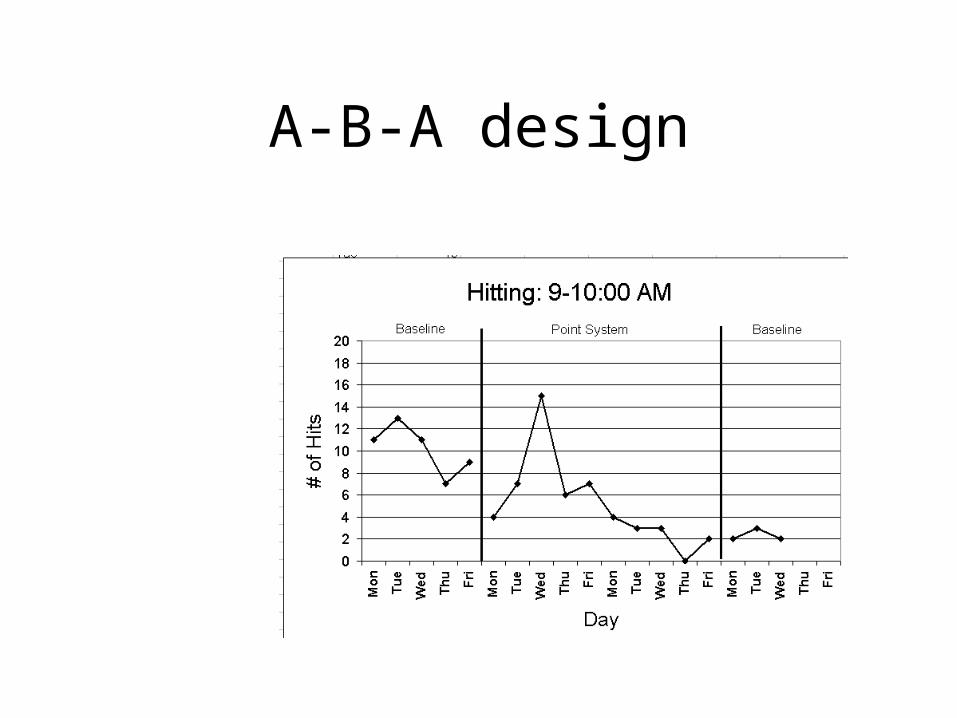
A-B-A design
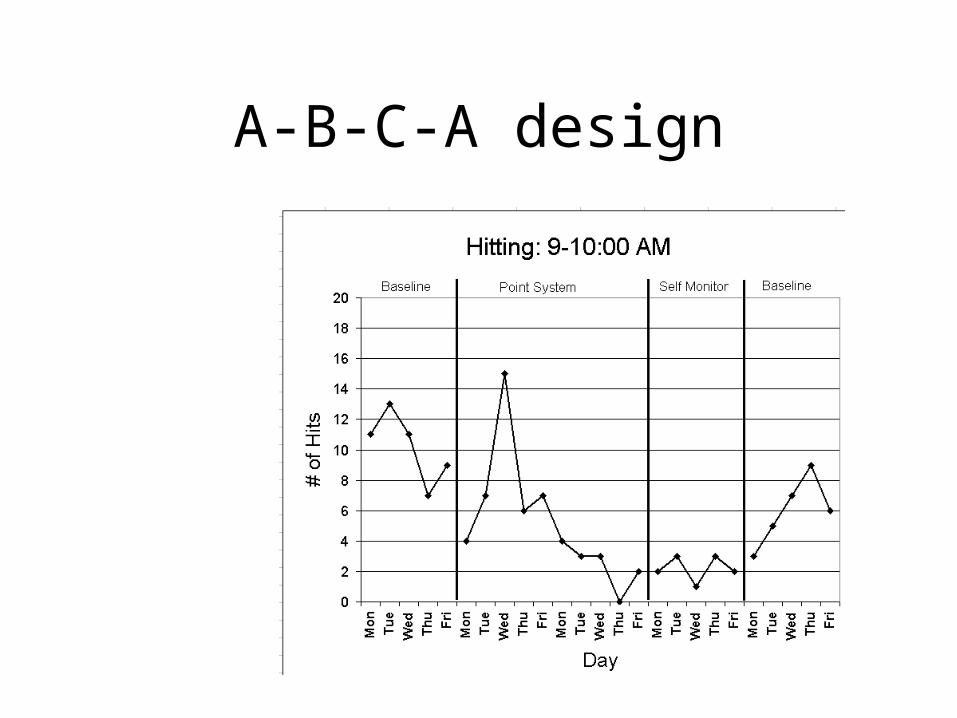
A-B-C-A design
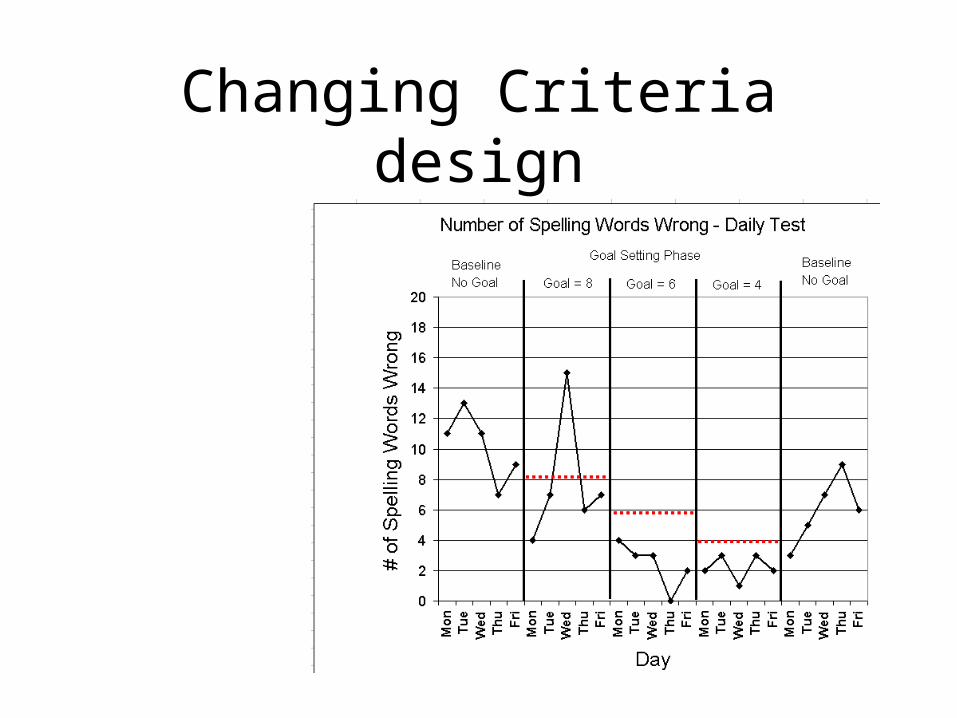
Changing Criteria design
Graph Interpretation
Common Data Patterns
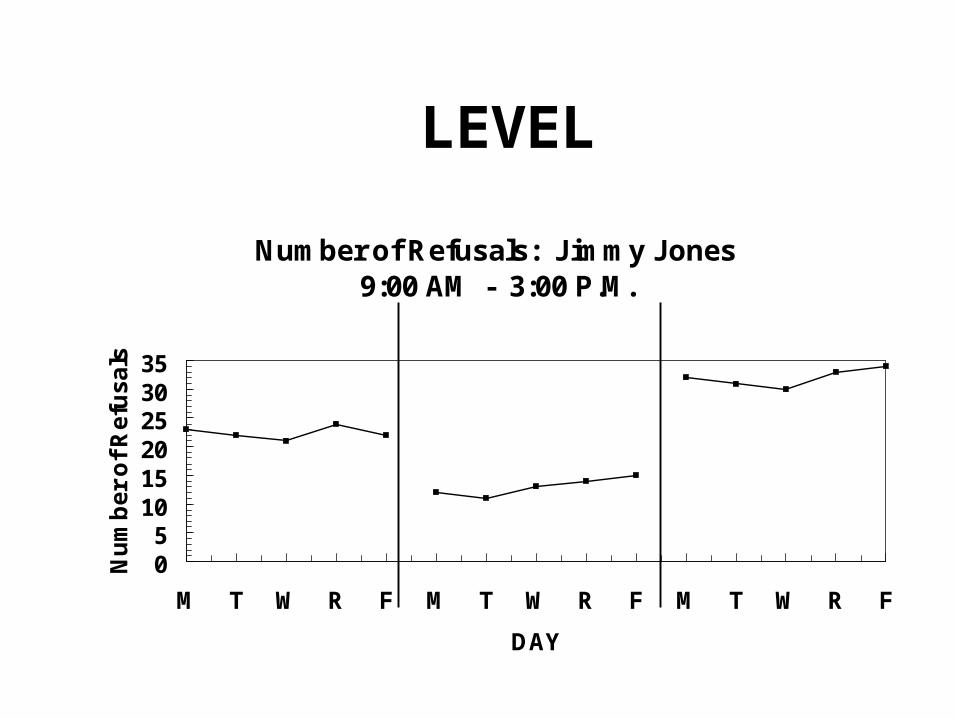
LEVEL
Number of Refusals: Jimmy Jones9:00 AM - 3:00 P.M.
05
101520253035
M T W R F M T W R F M T W R F
DAY
Nu
mb
er
of
Re
fus
als
SLOPE
Number of Refusals: Jimmy Jones9:00 AM - 3:00 P.M.
05
101520253035
M T W R F M T W R F M T W R F
DAY
Nu
mb
er
of
Re
fus
als
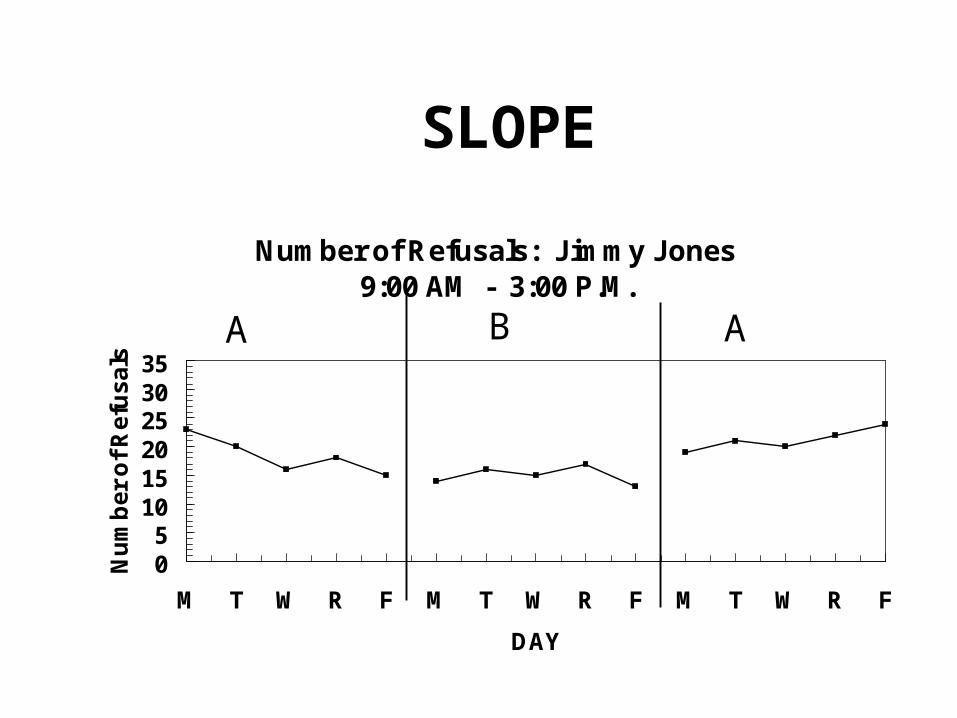
A B A
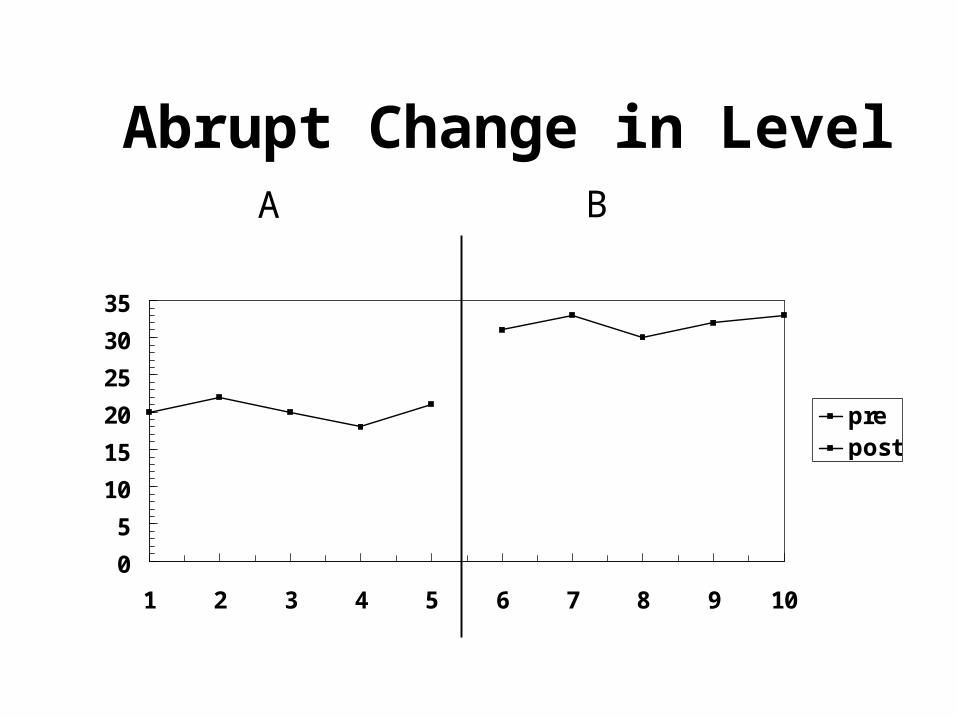
Abrupt Change in Level
0
5
10
15
20
25
30
35
1 2 3 4 5 6 7 8 9 10
prepost
A B
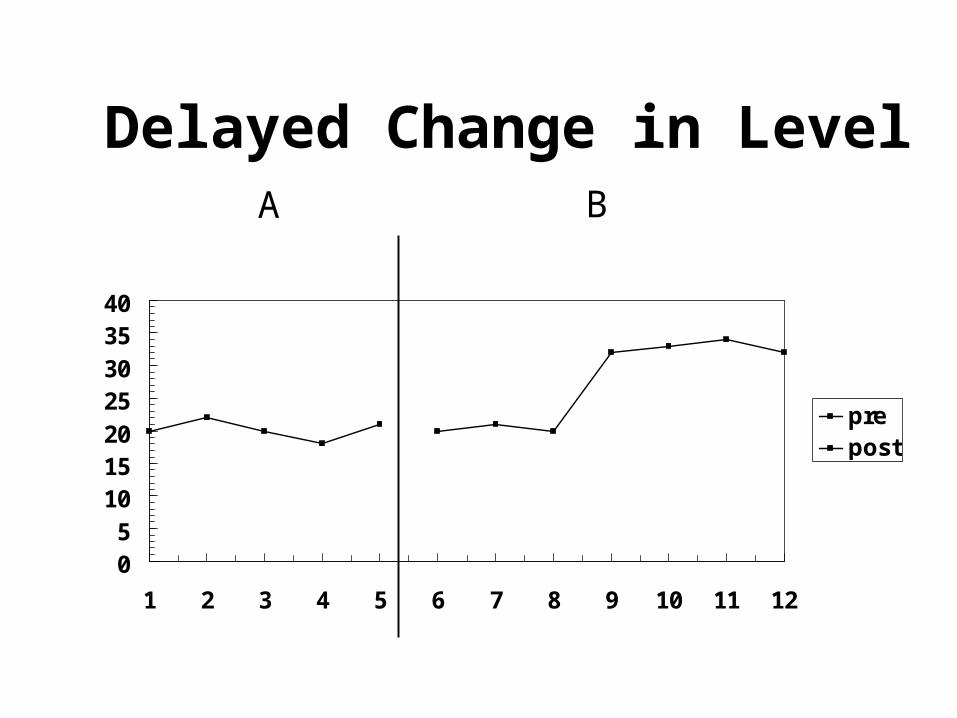
Delayed Change in Level
05
10152025303540
1 2 3 4 5 6 7 8 9 10 11 12
prepost
A B
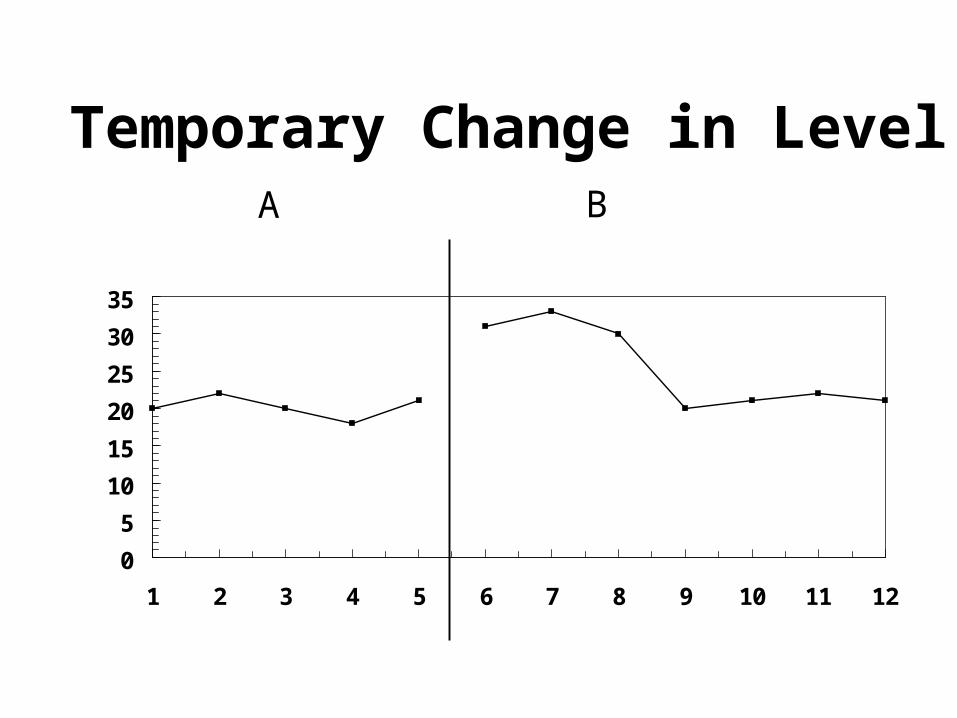
Temporary Change in Level
0
5
10
15
20
25
30
35
1 2 3 4 5 6 7 8 9 10 11 12
A B
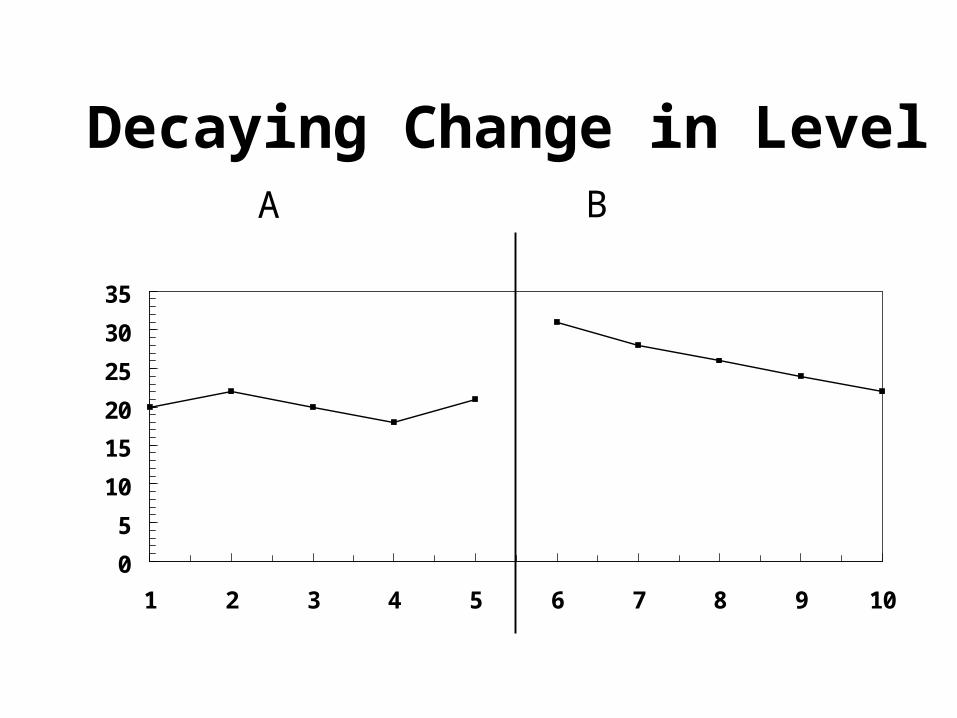
Decaying Change in Level
0
5
10
15
20
25
30
35
1 2 3 4 5 6 7 8 9 10
A B
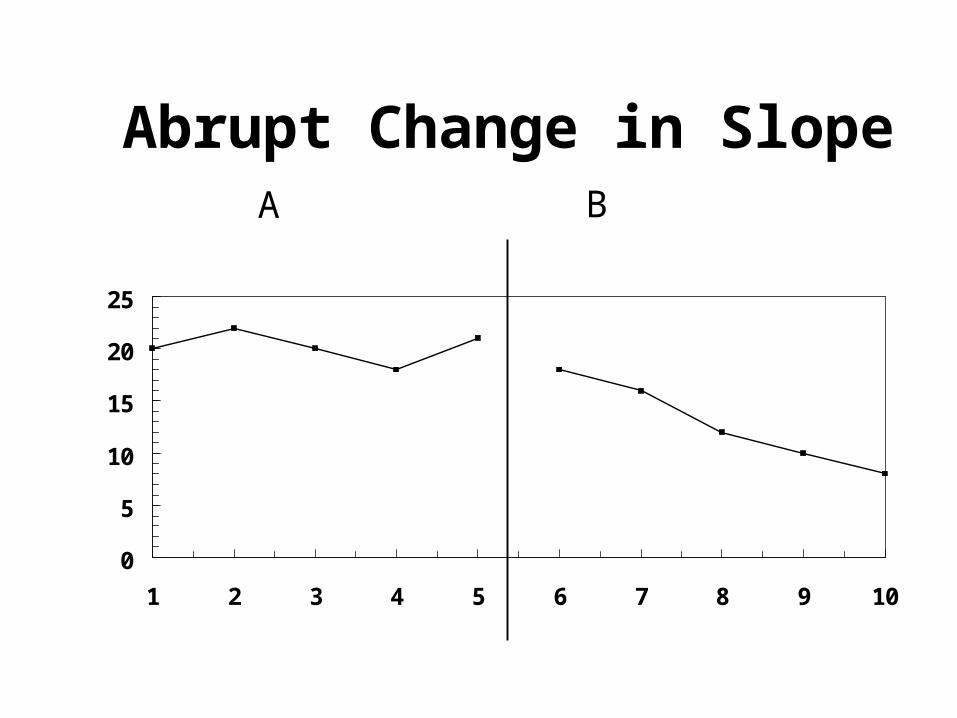
Abrupt Change in Slope
0
5
10
15
20
25
1 2 3 4 5 6 7 8 9 10
A B
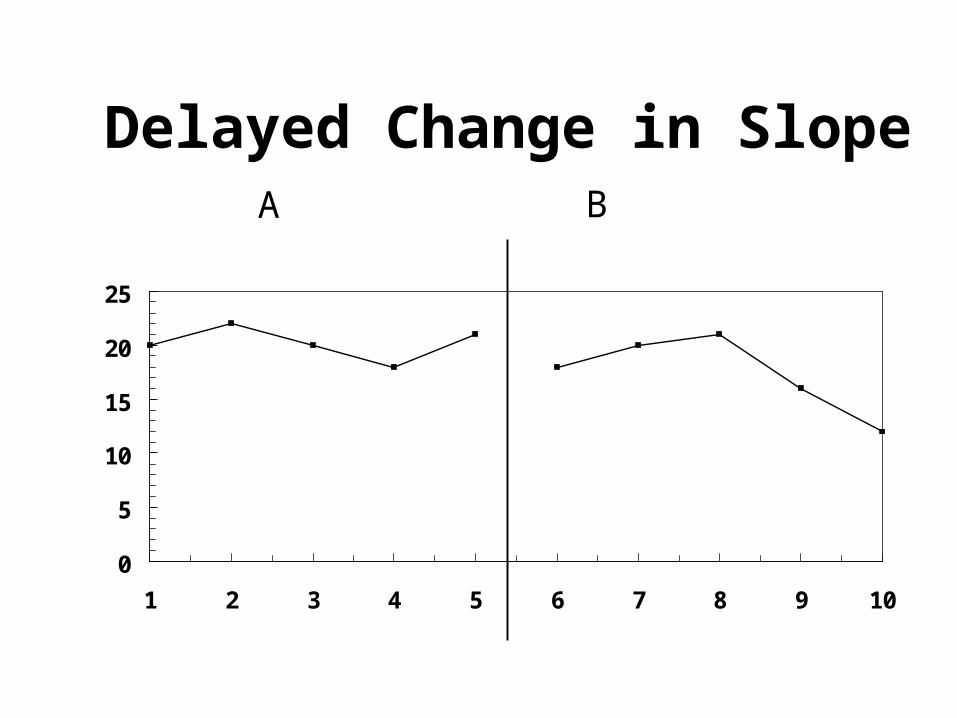
Delayed Change in Slope
0
5
10
15
20
25
1 2 3 4 5 6 7 8 9 10
A B
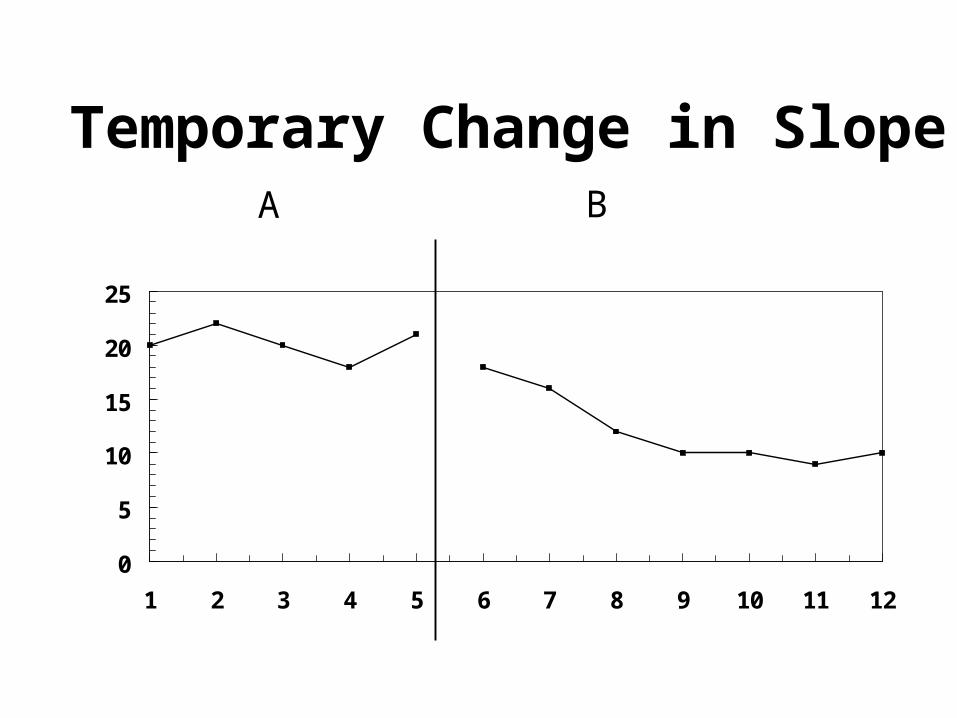
Temporary Change in Slope
0
5
10
15
20
25
1 2 3 4 5 6 7 8 9 10 11 12
A B
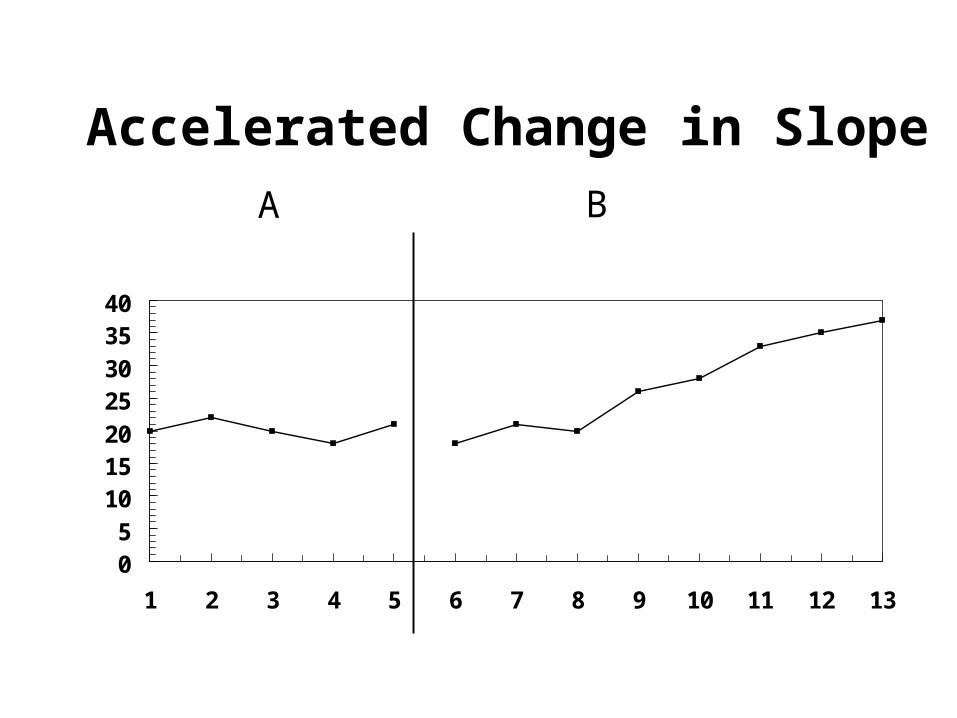
Accelerated Change in Slope
05
10152025303540
1 2 3 4 5 6 7 8 9 10 11 12 13
A B
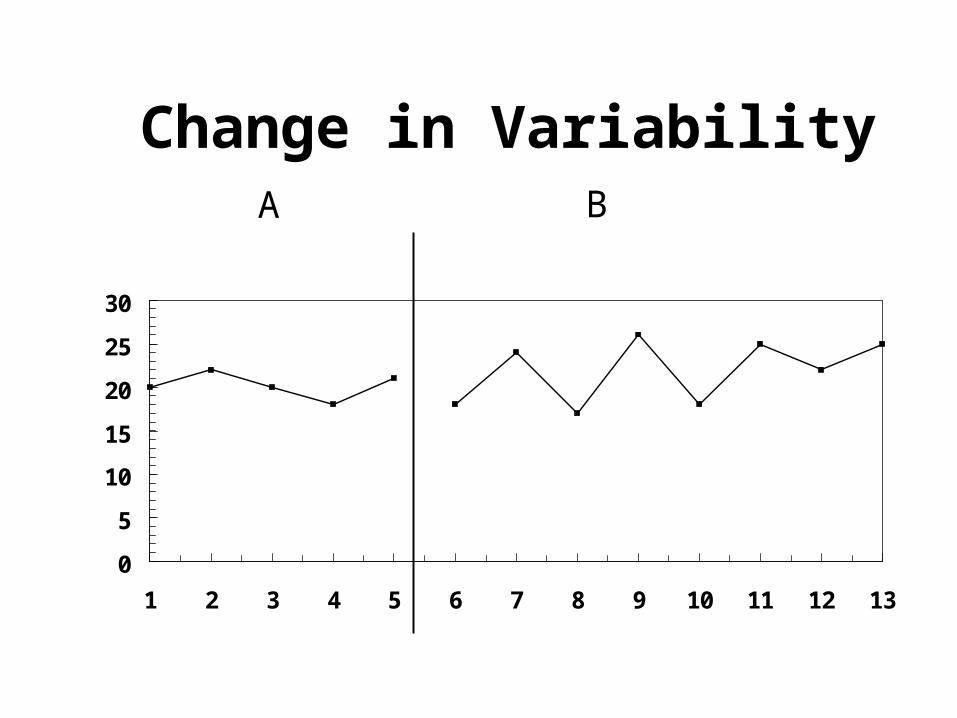
Change in Variability
0
5
10
15
20
25
30
1 2 3 4 5 6 7 8 9 10 11 12 13
A B
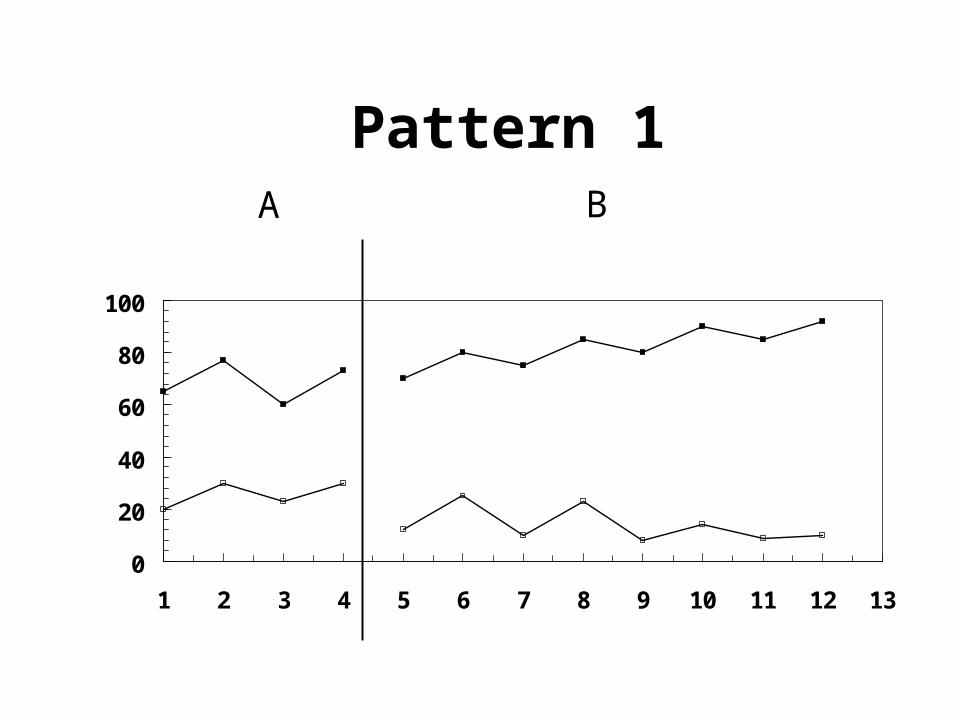
Pattern 1
0
20
40
60
80
100
1 2 3 4 5 6 7 8 9 10 11 12 13
A B
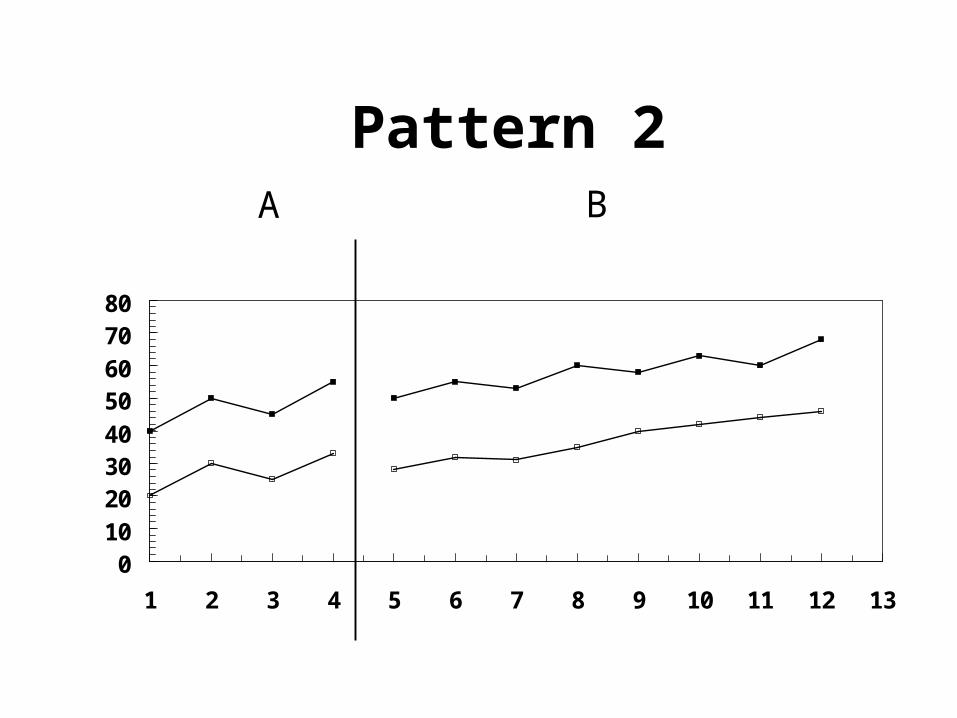
Pattern 2
01020304050607080
1 2 3 4 5 6 7 8 9 10 11 12 13
A B
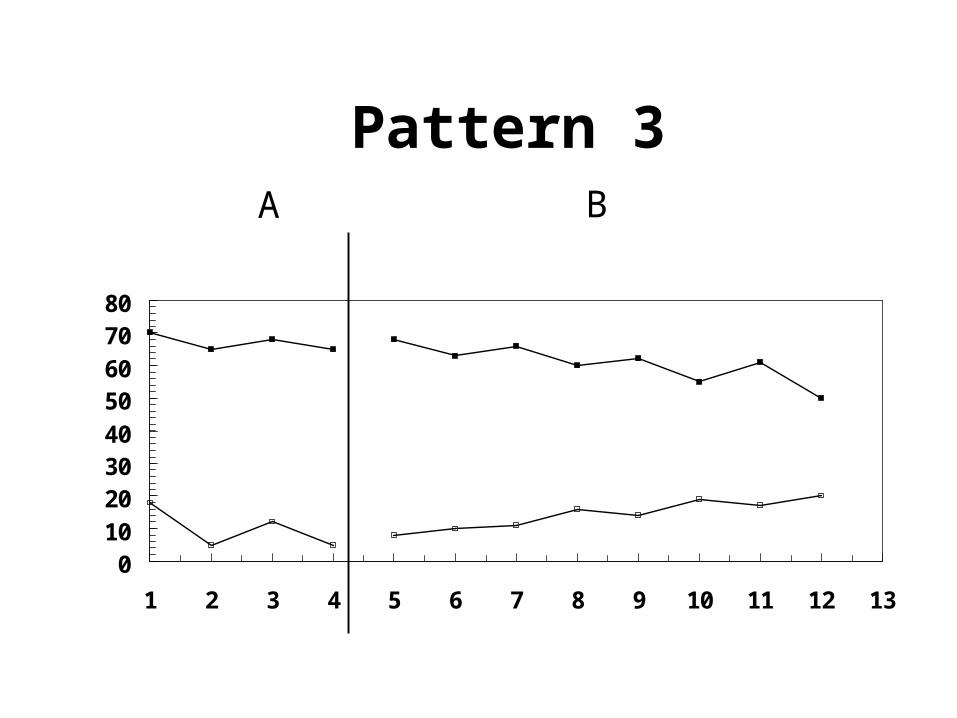
Pattern 3
01020304050607080
1 2 3 4 5 6 7 8 9 10 11 12 13
A B

Pattern 4
01020304050607080
1 2 3 4 5 6 7 8 9 10 11 12 13
A B
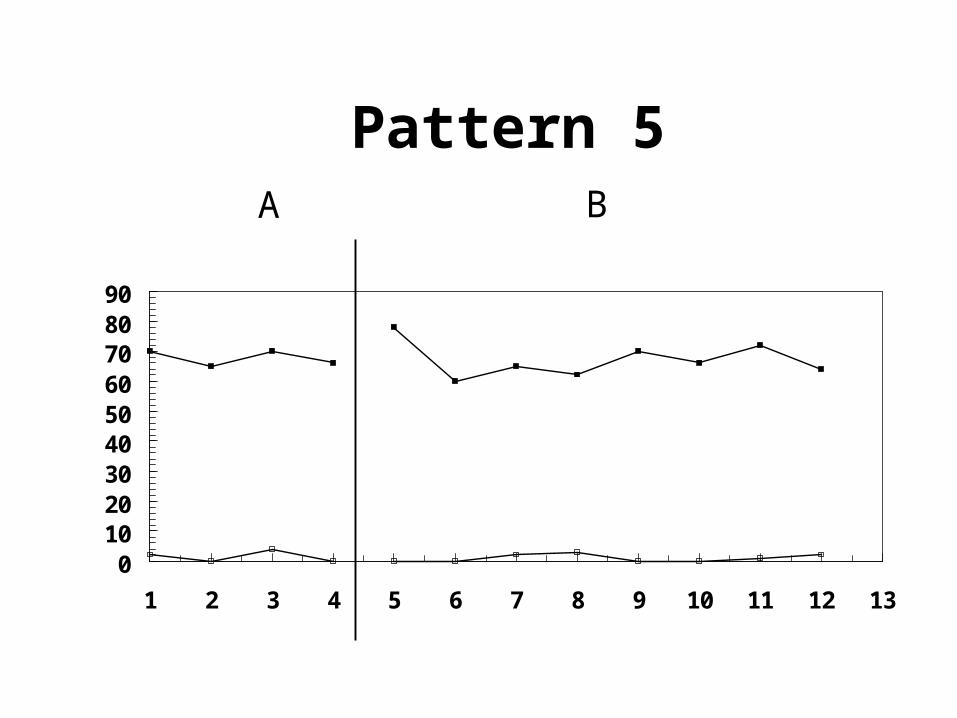
Pattern 5
0102030405060708090
1 2 3 4 5 6 7 8 9 10 11 12 13
A B
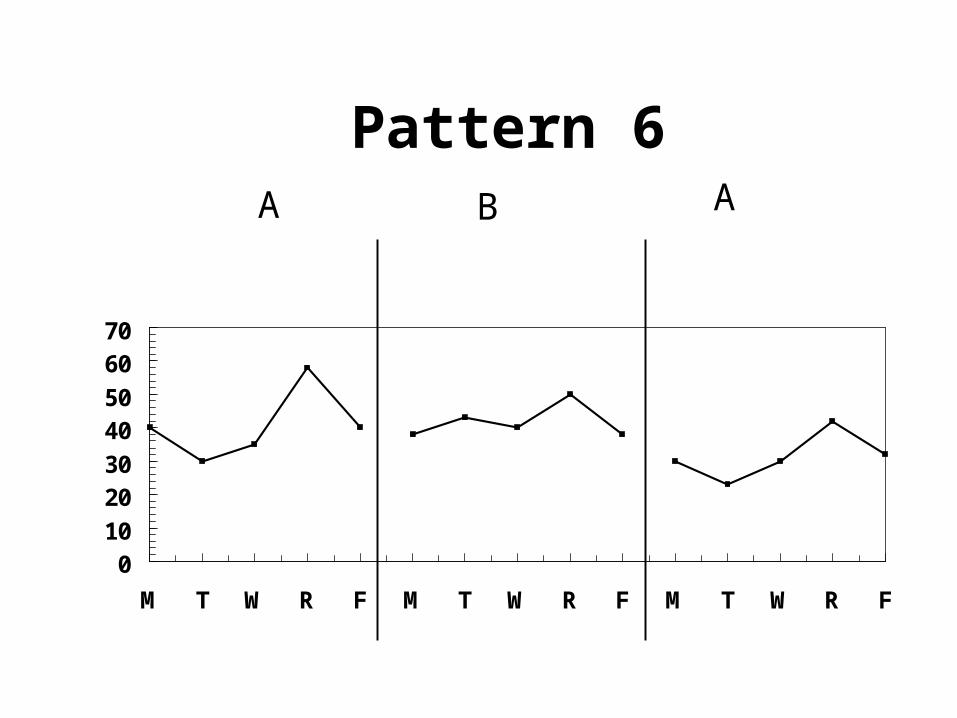
Pattern 6
010
2030
4050
6070
M T W R F M T W R F M T W R F
A B A
Using Excel to Construct a Graph
Using Excel to Draw Graphs
• (A) Baseline Graph
• (A-B) Two Phase Graph
• (A-B-A) Three Phase Graph
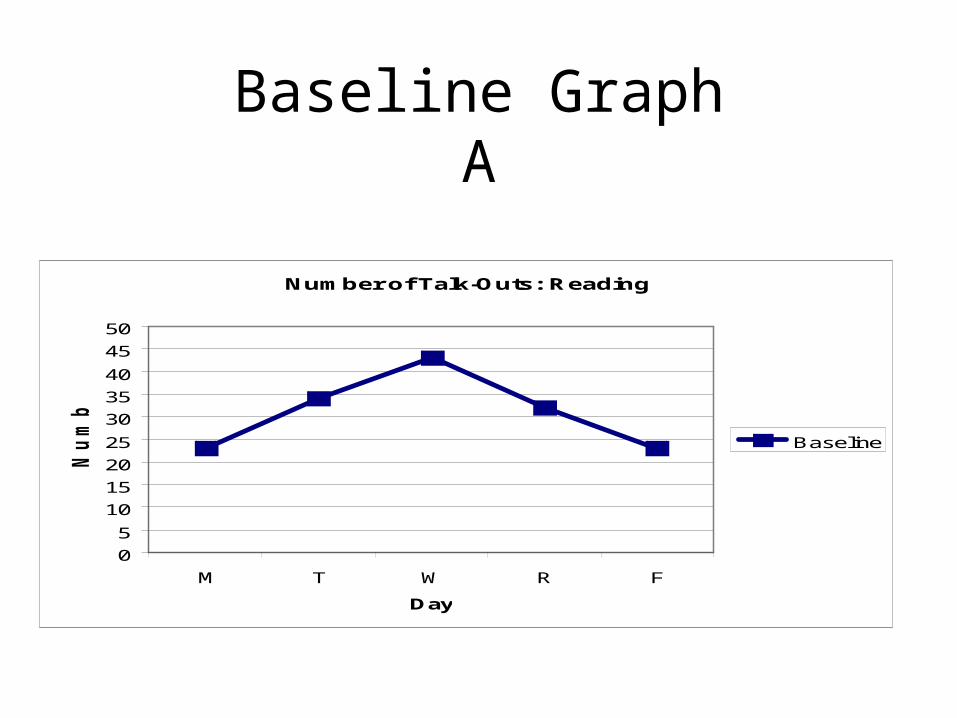
Baseline GraphA
Number of Talk-Outs: Reading
0
5
10
15
20
25
30
35
40
45
50
M T W R F
Day
Nu
mb
er
Baseline
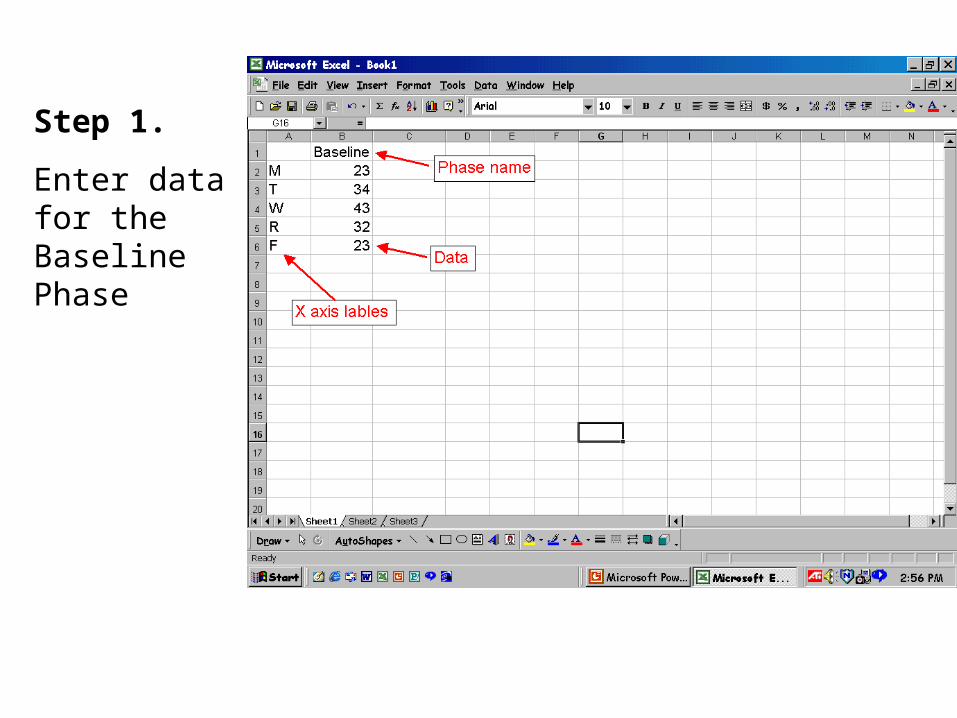
Step 1.
Enter data for the Baseline Phase
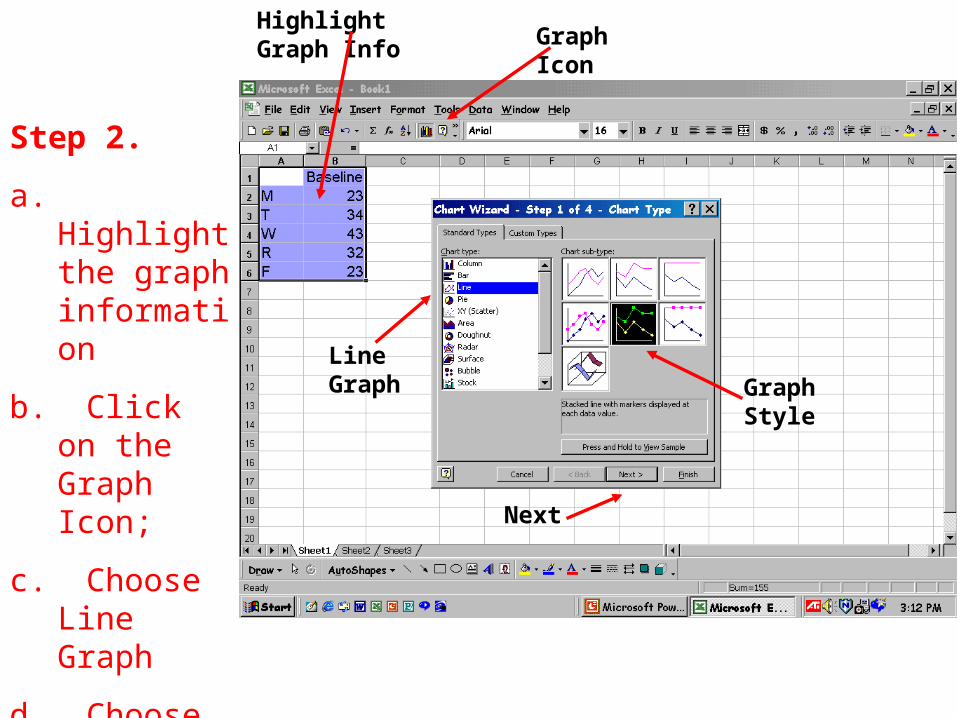
Step 2.
a. Highlight the graph information
b. Click on the Graph Icon;
c. Choose Line Graph
d. Choose Graph Style
e. Click on Next
Graph Icon
Line Graph Graph
Style
Next
Highlight Graph Info
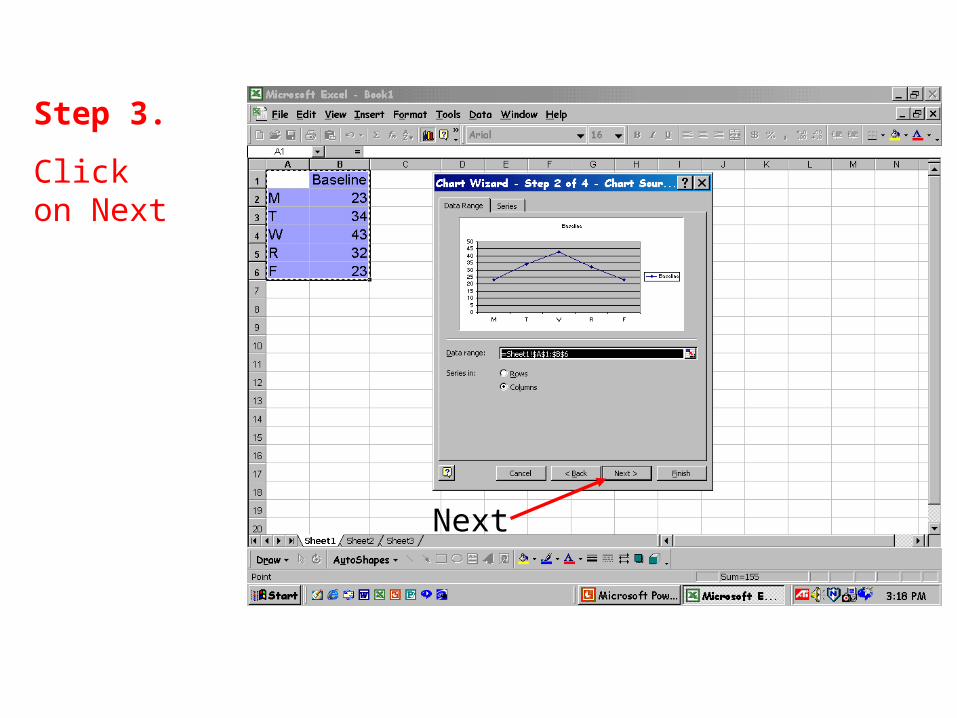
Step 3.
Click on Next
Next
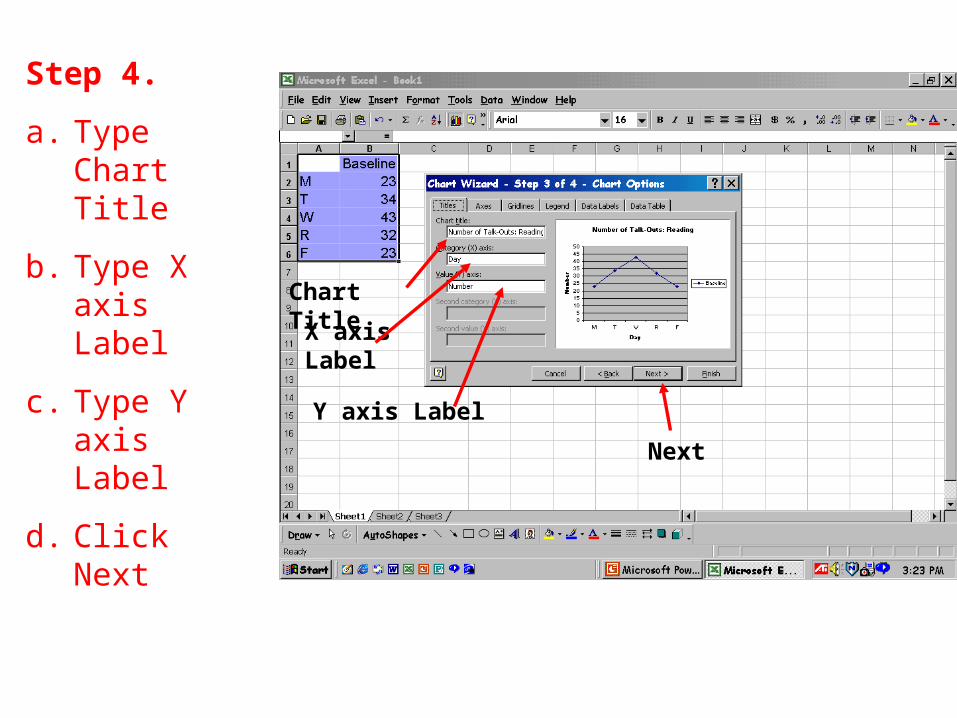
Step 4.
a. Type Chart Title
b. Type X axis Label
c. Type Y axis Label
d. Click Next
Chart Title
X axis Label
Y axis Label
Next
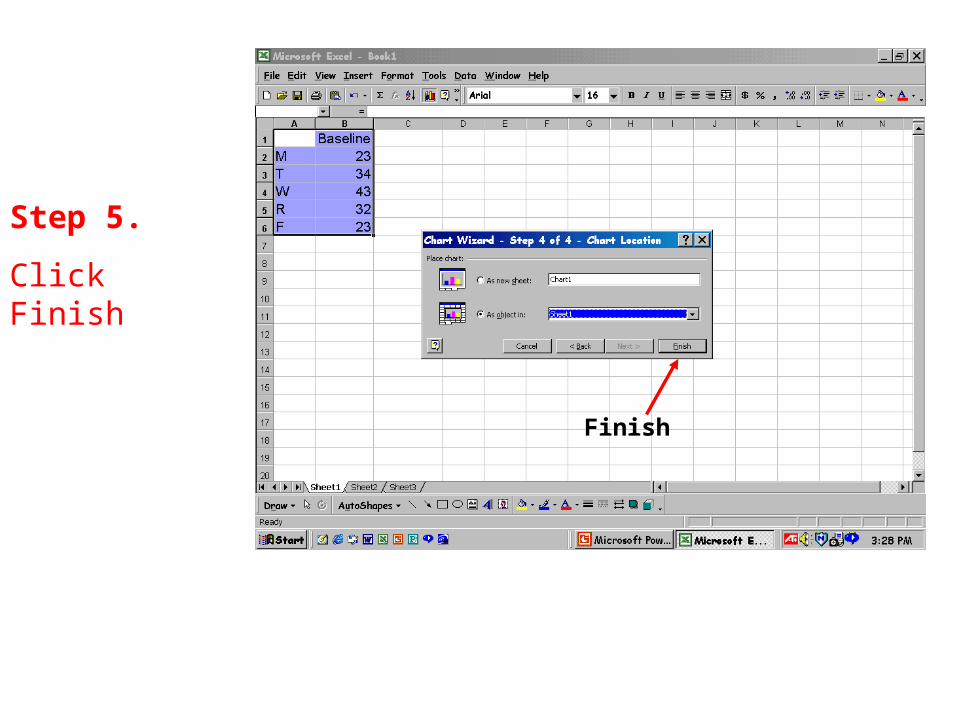
Step 5.
Click Finish
Finish
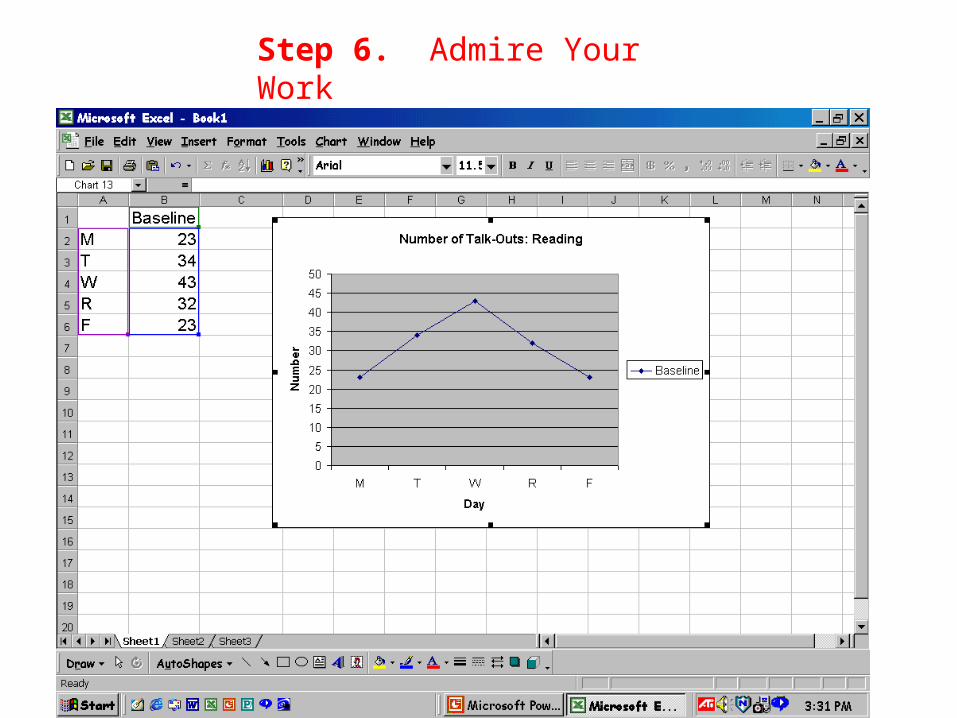
Step 6. Admire Your Work
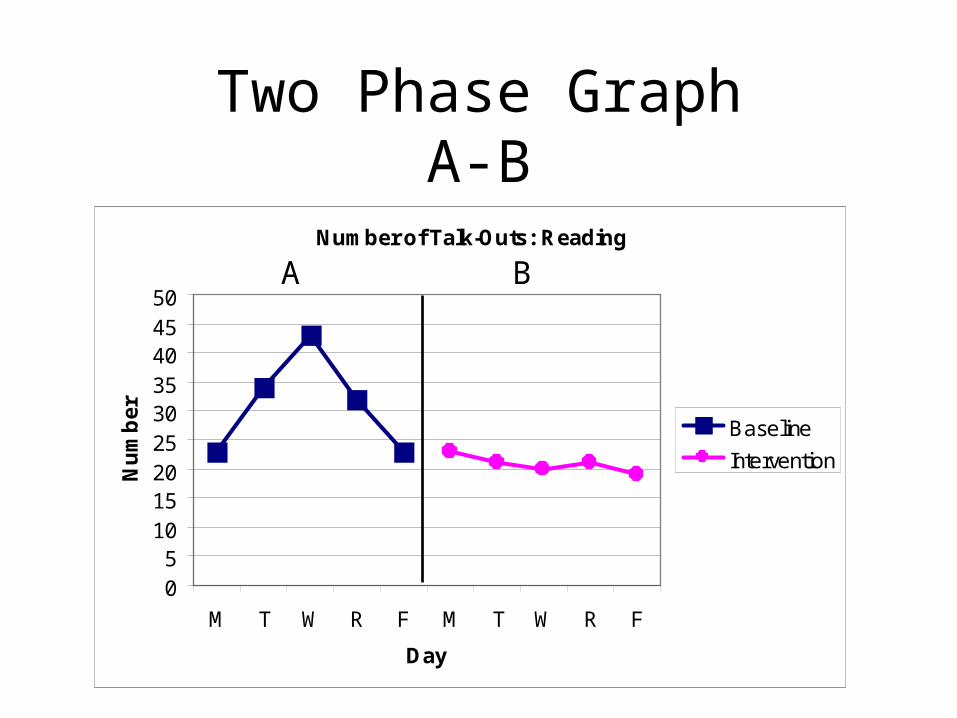
Two Phase GraphA-B
Number of Talk-Outs: Reading
05
101520253035404550
M T W R F M T W R F
Day
Nu
mb
er
Baseline
Intervention
A B
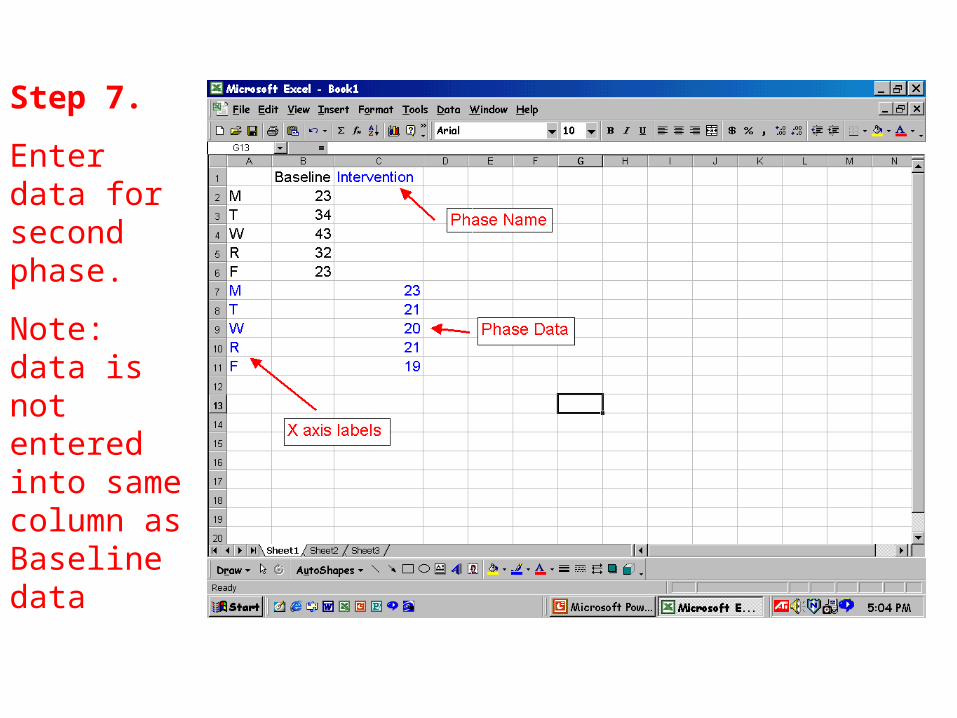
Step 7.
Enter data for second phase.
Note: data is not entered into same column as Baseline data
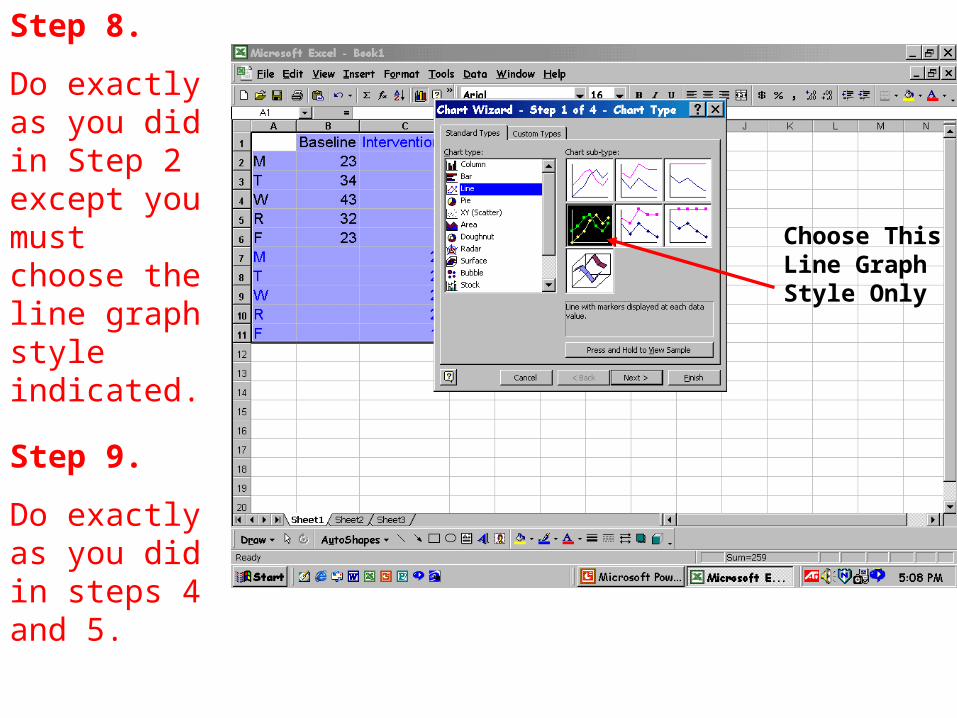
Step 8.
Do exactly as you did in Step 2 except you must choose the line graph style indicated.
Choose This Line Graph Style Only
Step 9.
Do exactly as you did in steps 4 and 5.
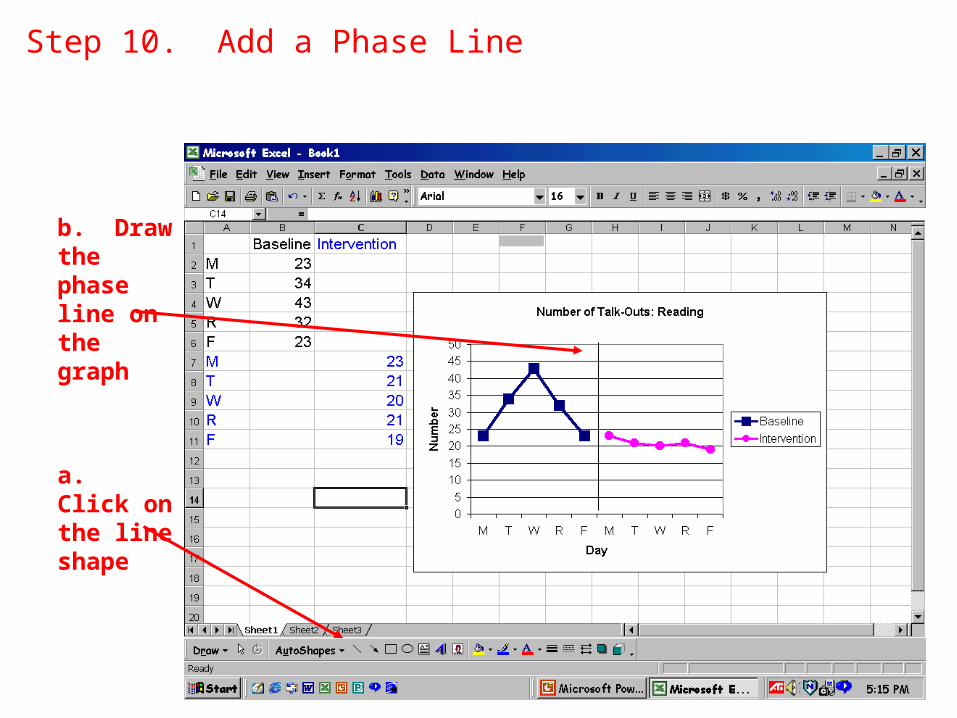
Step 10. Add a Phase Line
a. Click on the line shape
b. Draw the phase line on the graph
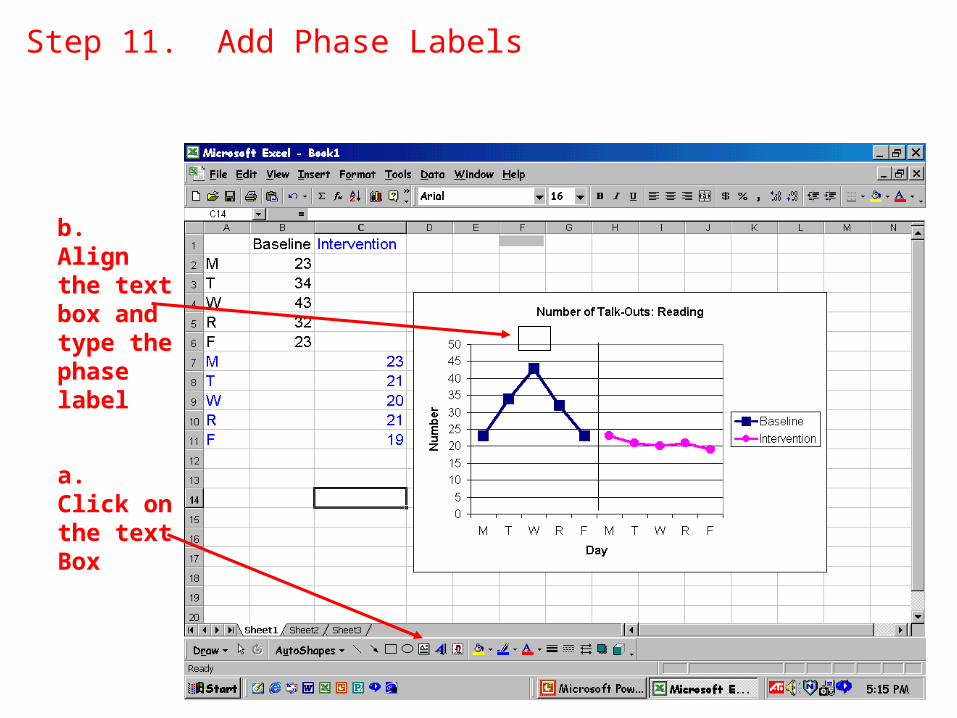
Step 11. Add Phase Labels
a. Click on the text Box
b. Align the text box and type the phase label
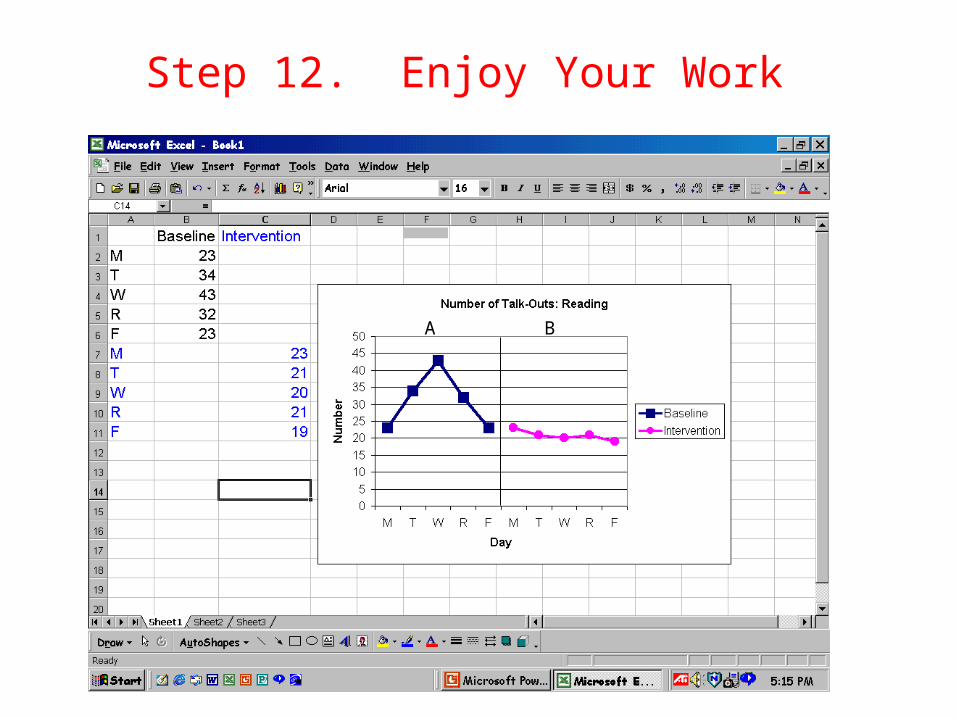
Step 12. Enjoy Your Work
A B
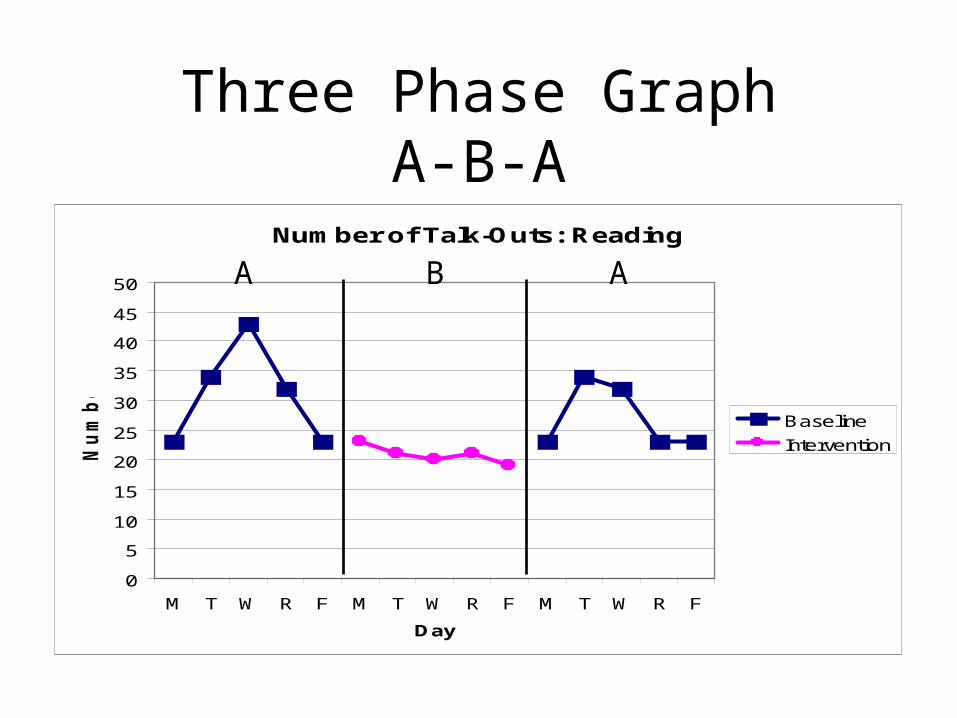
Three Phase GraphA-B-A
Number of Talk-Outs: Reading
0
5
10
15
20
25
30
35
40
45
50
M T W R F M T W R F M T W R F
Day
Nu
mb
er
Baseline
Intervention
A B A
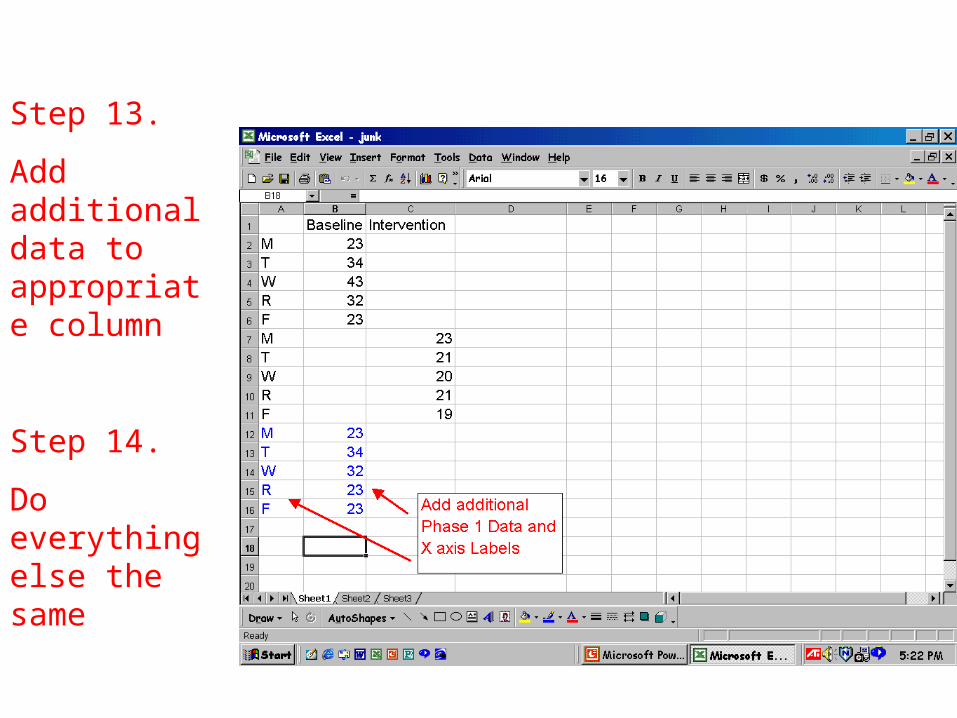
Step 13.
Add additional data to appropriate column
Step 14.
Do everything else the same
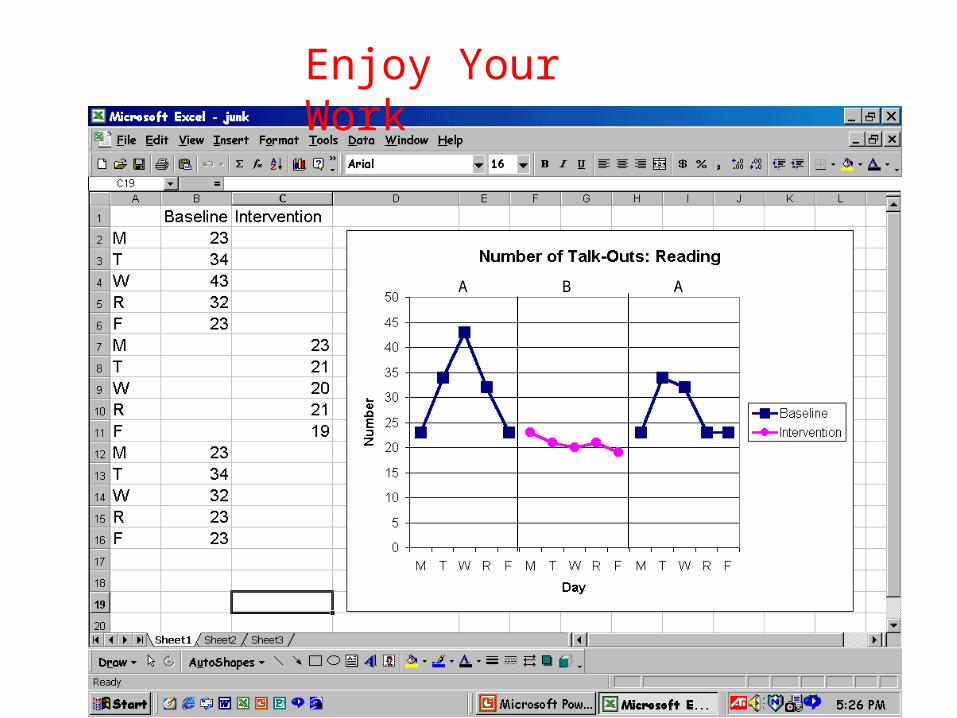
Enjoy Your Work
A B A
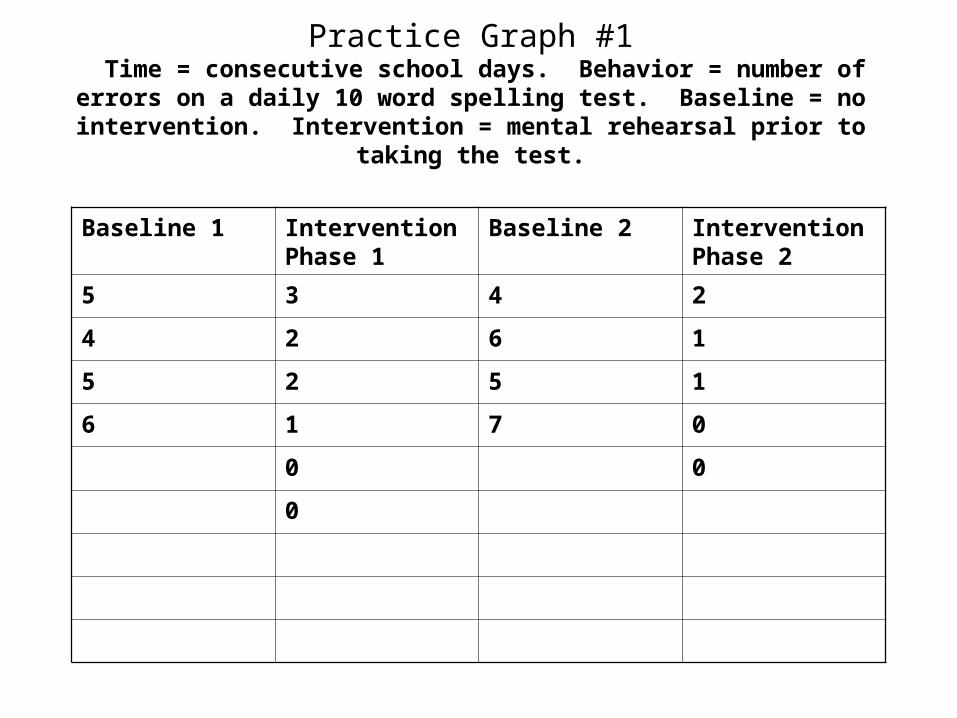
Practice Graph #1 Time = consecutive school days. Behavior = number of
errors on a daily 10 word spelling test. Baseline = no intervention. Intervention = mental rehearsal prior to
taking the test.
Baseline 1 Intervention Phase 1
Baseline 2 Intervention Phase 2
5 3 4 2
4 2 6 1
5 2 5 1
6 1 7 0
0 0
0
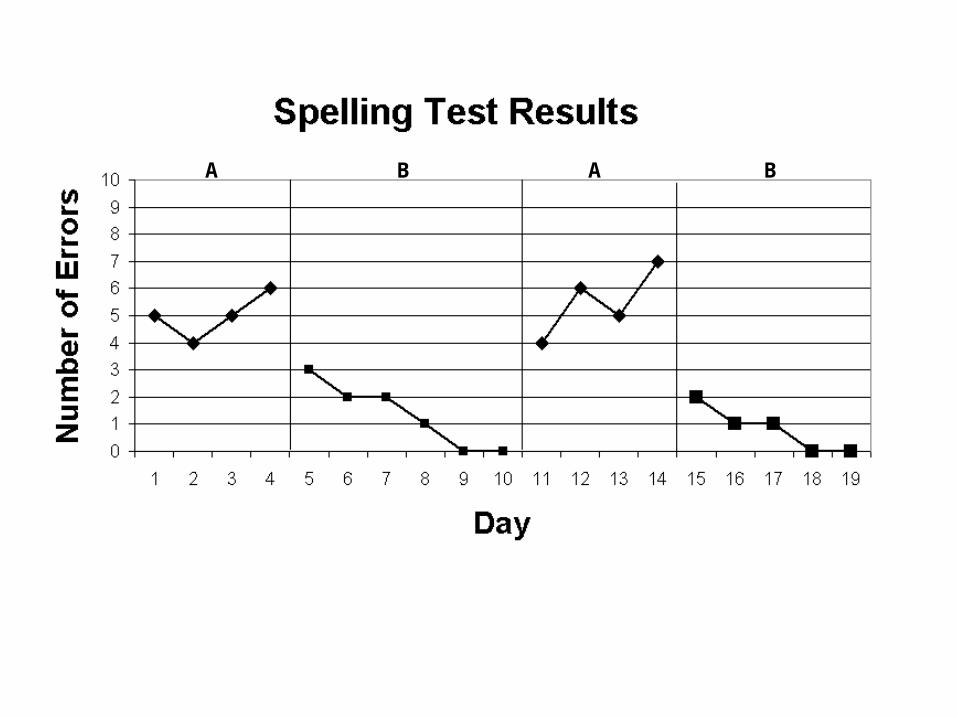
A B A B
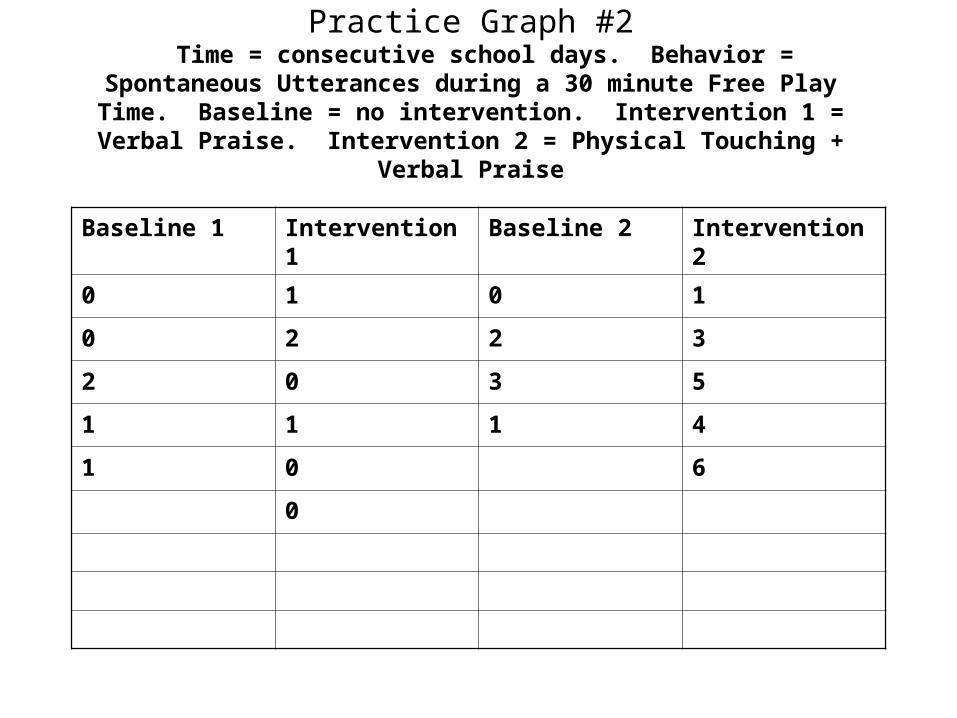
Practice Graph #2 Time = consecutive school days. Behavior =
Spontaneous Utterances during a 30 minute Free Play Time. Baseline = no intervention. Intervention 1 = Verbal
Praise. Intervention 2 = Physical Touching + Verbal Praise
Baseline 1 Intervention 1
Baseline 2 Intervention 2
0 1 0 1
0 2 2 3
2 0 3 5
1 1 1 4
1 0 6
0
Recommended