1
Ilham Hassan Fathelrahman H. Mansour
Dalia Mohammed Elzubier Diab
Hesham Eldaw Mohamed
Abuzar M. A. Eljelly
School of Management Studies, Marketing
University of Khartoum, Khartoum, Sudan
2
Objectives (1) Measuring the perceived quality of the offered services in
higher education programs at the School of Management Studies.
2) To determine important factors that affect higher education service quality evaluation by students
(3) Offering suggestions to develop service quality to improve the performance of the higher education programs.

Service Quality Dimensions:
Tangibility: The appearance of physical facilities, equipment, appearance of personnel, and communication materials.
Reliability: The ability to perform the promised service dependably and accurately.
Responsiveness: The willingness to help customers and provide prompt service.
Assurance: The knowledge and courtesy of employees and their ability to inspire trust and confidence.
Empathy: The caring, and individualized attention the firm provides to its customers.
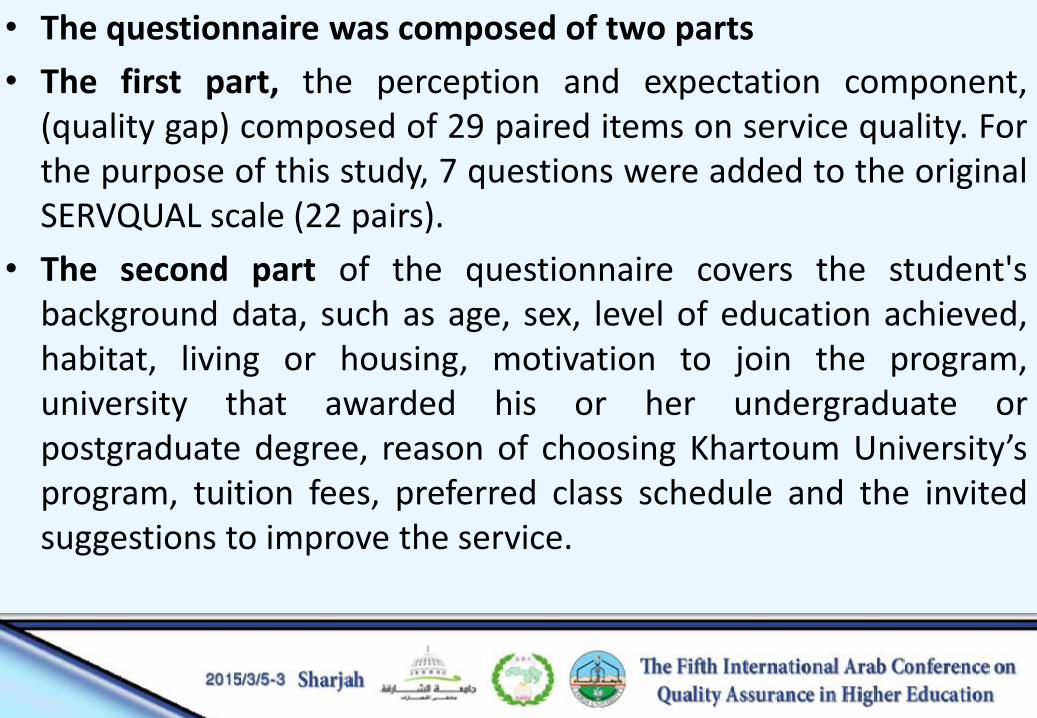
• The questionnaire was composed of two parts
• The first part, the perception and expectation component, (quality gap) composed of 29 paired items on service quality. For the purpose of this study, 7 questions were added to the original SERVQUAL scale (22 pairs).
• The second part of the questionnaire covers the student's background data, such as age, sex, level of education achieved, habitat, living or housing, motivation to join the program, university that awarded his or her undergraduate or postgraduate degree, reason of choosing Khartoum University’s program, tuition fees, preferred class schedule and the invited suggestions to improve the service.
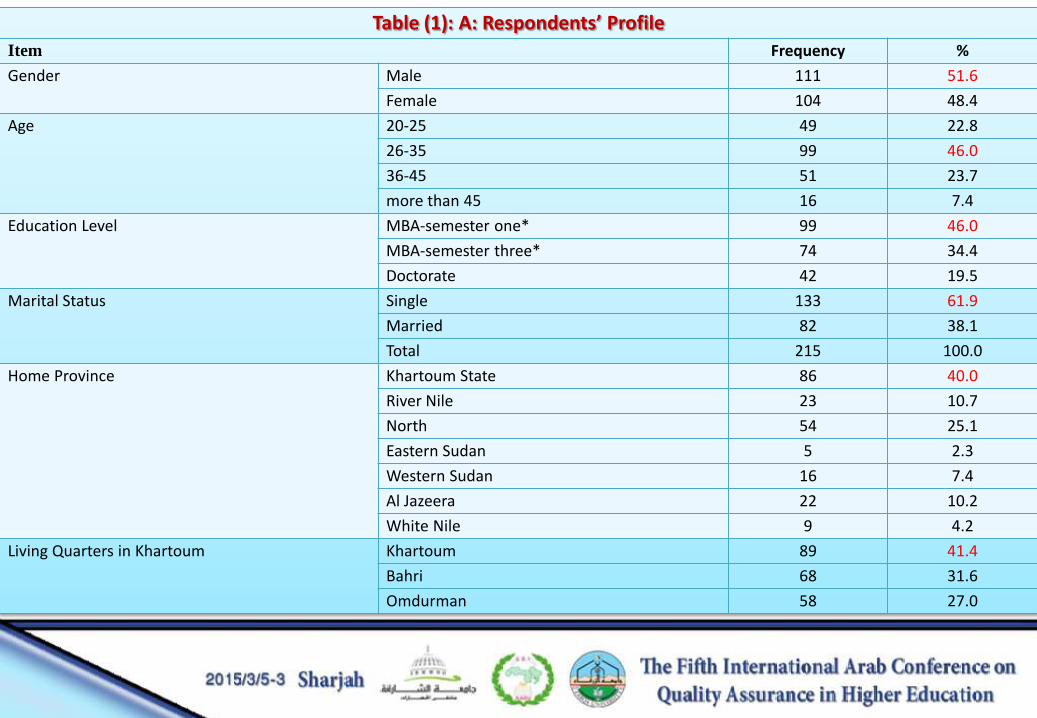
Table (1): A: Respondents’ Profile
Item Frequency %
Gender Male 111 51.6
Female 104 48.4
Age 20-25 49 22.8
26-35 99 46.0
36-45 51 23.7
more than 45 16 7.4
Education Level MBA-semester one* 99 46.0
MBA-semester three* 74 34.4
Doctorate 42 19.5
Marital Status Single 133 61.9
Married 82 38.1
Total 215 100.0
Home Province Khartoum State 86 40.0
River Nile 23 10.7
North 54 25.1
Eastern Sudan 5 2.3
Western Sudan 16 7.4
Al Jazeera 22 10.2
White Nile 9 4.2
Living Quarters in Khartoum Khartoum 89 41.4
Bahri 68 31.6
Omdurman 58 27.0
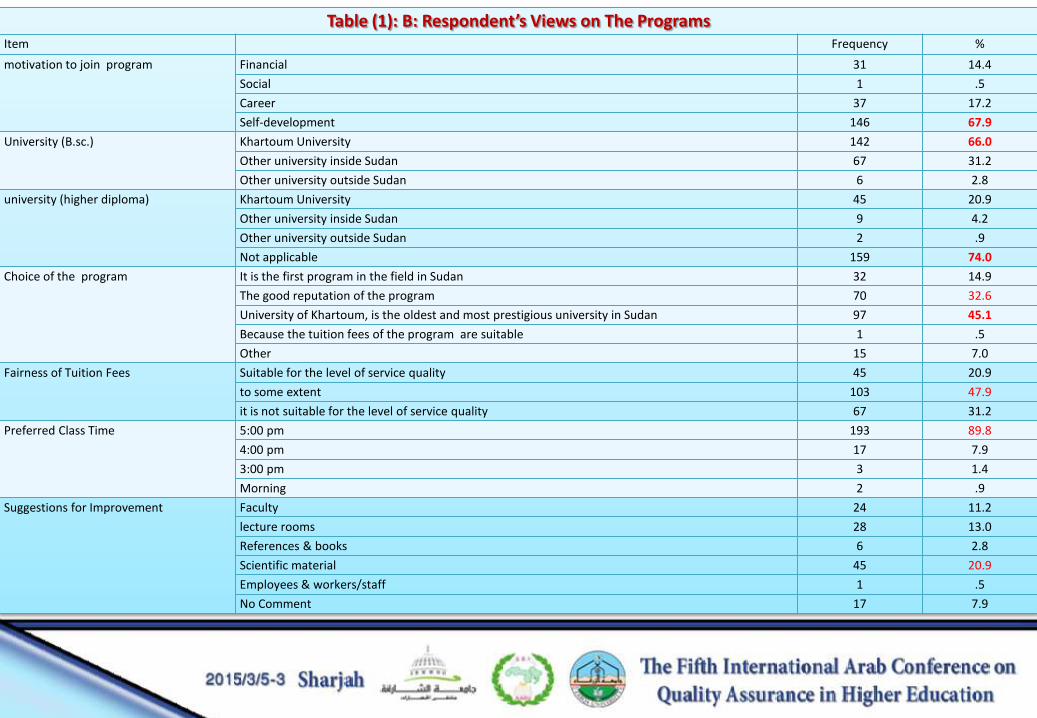
Table (1): B: Respondent’s Views on The Programs Item Frequency %
motivation to join program Financial 31 14.4
Social 1 .5
Career 37 17.2
Self-development 146 67.9
University (B.sc.) Khartoum University 142 66.0
Other university inside Sudan 67 31.2
Other university outside Sudan 6 2.8
university (higher diploma) Khartoum University 45 20.9
Other university inside Sudan 9 4.2
Other university outside Sudan 2 .9
Not applicable 159 74.0
Choice of the program It is the first program in the field in Sudan 32 14.9
The good reputation of the program 70 32.6
University of Khartoum, is the oldest and most prestigious university in Sudan 97 45.1
Because the tuition fees of the program are suitable 1 .5
Other 15 7.0
Fairness of Tuition Fees Suitable for the level of service quality 45 20.9
to some extent 103 47.9
it is not suitable for the level of service quality 67 31.2
Preferred Class Time 5:00 pm 193 89.8
4:00 pm 17 7.9
3:00 pm 3 1.4
Morning 2 .9
Suggestions for Improvement Faculty 24 11.2
lecture rooms 28 13.0
References & books 6 2.8
Scientific material 45 20.9
Employees & workers/staff 1 .5
No Comment 17 7.9
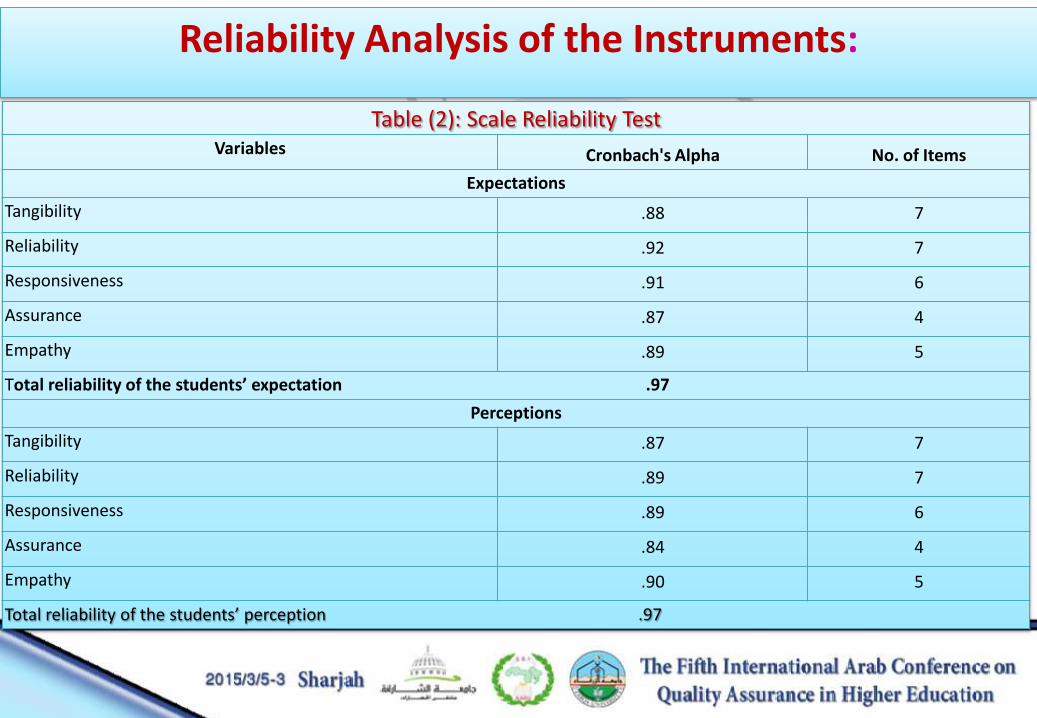
Table (2): Scale Reliability Test Variables Cronbach's Alpha No. of Items
Expectations
Tangibility .88 7
Reliability .92 7
Responsiveness .91 6
Assurance .87 4
Empathy .89 5
Total reliability of the students’ expectation .97
Perceptions
Tangibility .87 7
Reliability .89 7
Responsiveness .89 6
Assurance .84 4
Empathy .90 5
Total reliability of the students’ perception .97
Reliability Analysis of the Instruments:
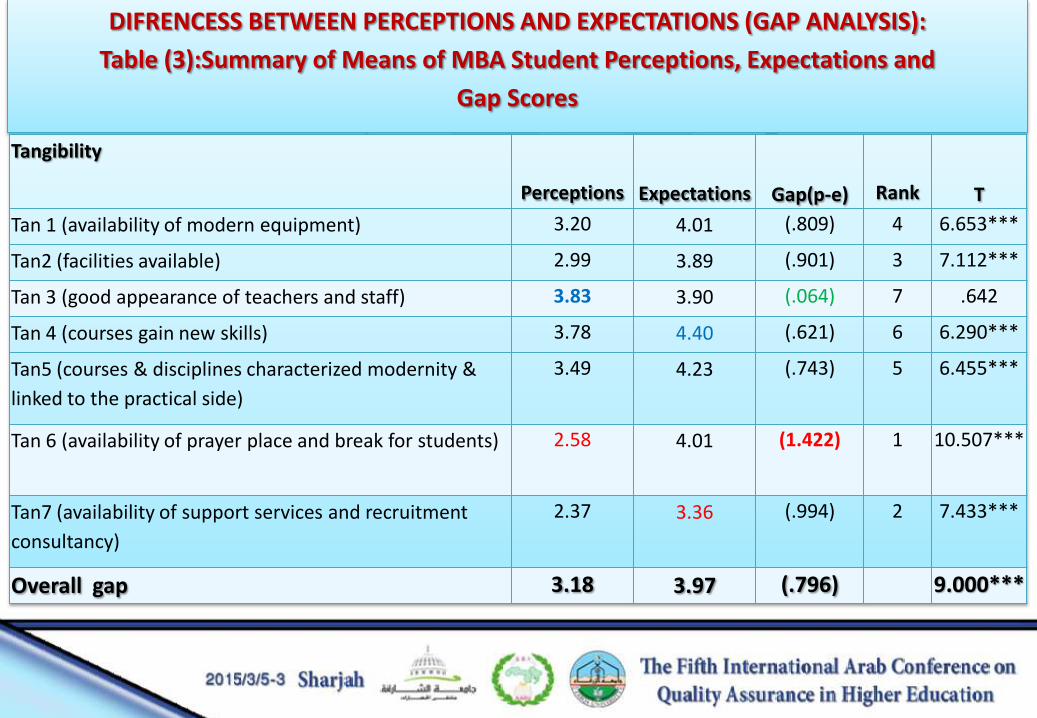
DIFRENCESS BETWEEN PERCEPTIONS AND EXPECTATIONS (GAP ANALYSIS):
Table (3):Summary of Means of MBA Student Perceptions, Expectations and
Gap Scores
Tangibility
Perceptions Expectations Gap(p-e)
Rank T
Tan 1 (availability of modern equipment) 3.20 4.01 (.809) 4 6.653***
Tan2 (facilities available) 2.99 3.89 (.901) 3 7.112***
Tan 3 (good appearance of teachers and staff) 3.83 3.90 (.064) 7 .642
Tan 4 (courses gain new skills) 3.78 4.40 (.621) 6 6.290***
Tan5 (courses & disciplines characterized modernity &
linked to the practical side)
3.49 4.23 (.743) 5 6.455***
Tan 6 (availability of prayer place and break for students) 2.58 4.01 (1.422) 1 10.507***
Tan7 (availability of support services and recruitment
consultancy)
2.37 3.36 (.994) 2 7.433***
Overall gap 3.18 3.97 (.796) 9.000***
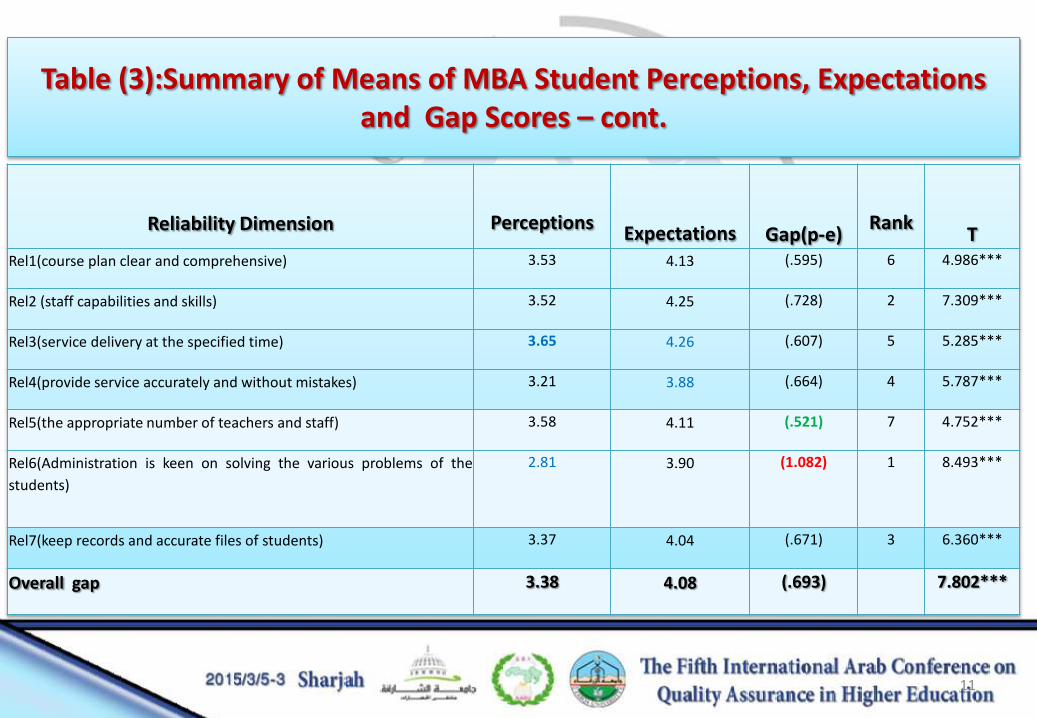
Table (3):Summary of Means of MBA Student Perceptions, Expectations and Gap Scores – cont.
11
Reliability Dimension
Perceptions Expectations Gap(p-e)
Rank T
Rel1(course plan clear and comprehensive) 3.53 4.13 (.595) 6 4.986***
Rel2 (staff capabilities and skills) 3.52 4.25 (.728) 2 7.309***
Rel3(service delivery at the specified time) 3.65 4.26 (.607) 5 5.285***
Rel4(provide service accurately and without mistakes) 3.21 3.88 (.664) 4 5.787***
Rel5(the appropriate number of teachers and staff) 3.58 4.11 (.521) 7 4.752***
Rel6(Administration is keen on solving the various problems of the
students)
2.81 3.90 (1.082) 1 8.493***
Rel7(keep records and accurate files of students) 3.37 4.04 (.671) 3 6.360***
Overall gap 3.38 4.08 (.693) 7.802***
12
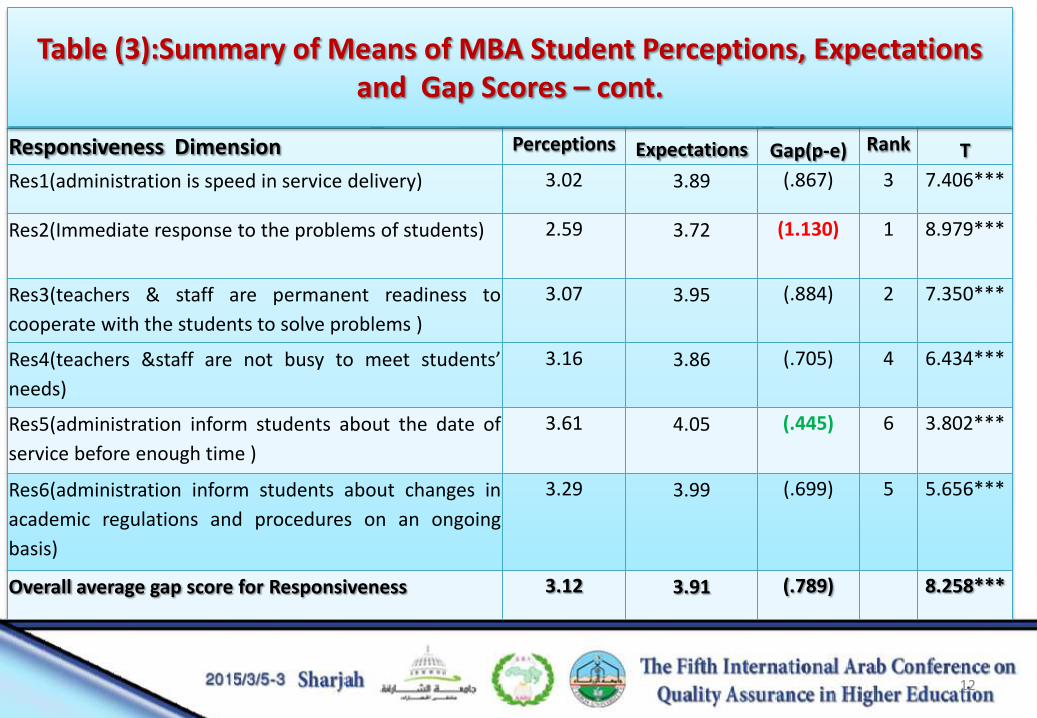
Responsiveness Dimension Perceptions Expectations Gap(p-e) Rank T
Res1(administration is speed in service delivery) 3.02 3.89 (.867) 3 7.406***
Res2(Immediate response to the problems of students) 2.59 3.72 (1.130) 1 8.979***
Res3(teachers & staff are permanent readiness to
cooperate with the students to solve problems )
3.07 3.95 (.884) 2 7.350***
Res4(teachers &staff are not busy to meet students’
needs)
3.16 3.86 (.705) 4 6.434***
Res5(administration inform students about the date of
service before enough time )
3.61 4.05 (.445) 6 3.802***
Res6(administration inform students about changes in
academic regulations and procedures on an ongoing
basis)
3.29 3.99 (.699) 5 5.656***
Overall average gap score for Responsiveness 3.12 3.91 (.789) 8.258***
Table (3):Summary of Means of MBA Student Perceptions, Expectations and Gap Scores – cont.
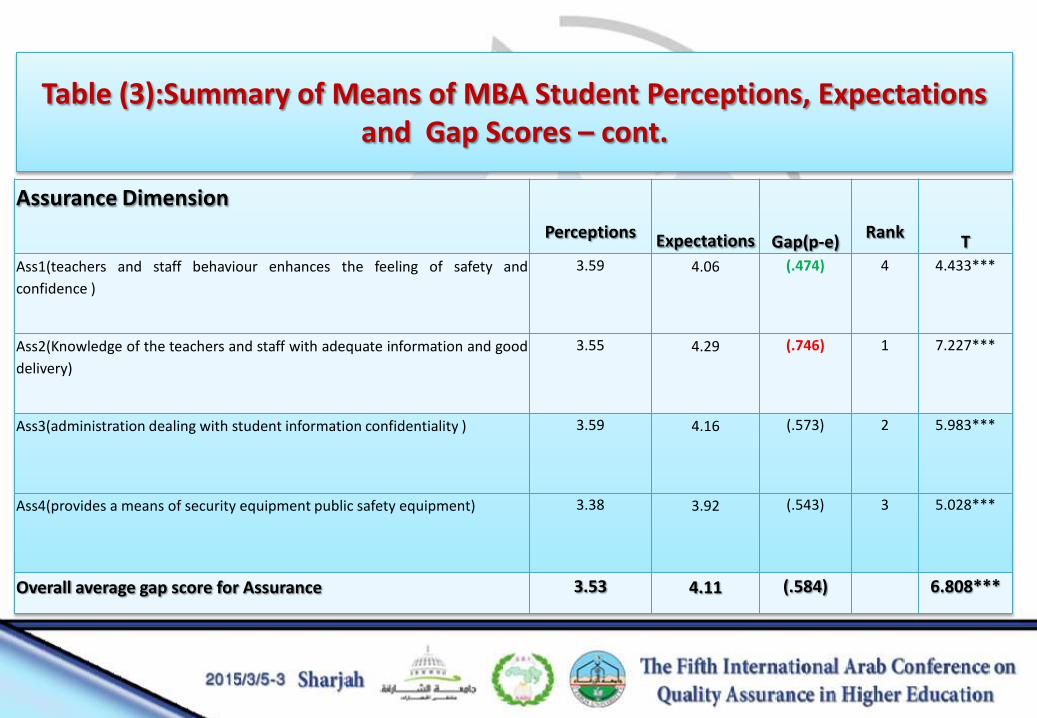
Assurance Dimension
Perceptions Expectations Gap(p-e)
Rank T
Ass1(teachers and staff behaviour enhances the feeling of safety and
confidence )
3.59 4.06 (.474) 4 4.433***
Ass2(Knowledge of the teachers and staff with adequate information and good
delivery)
3.55 4.29 (.746) 1 7.227***
Ass3(administration dealing with student information confidentiality ) 3.59 4.16 (.573) 2 5.983***
Ass4(provides a means of security equipment public safety equipment) 3.38 3.92 (.543) 3 5.028***
Overall average gap score for Assurance 3.53 4.11 (.584) 6.808***
Table (3):Summary of Means of MBA Student Perceptions, Expectations and Gap Scores – cont.

14
Empathy Dimension
Perceptions Expectations
Gap(p-e)
Difference
Rank T
Emp1(tact& ethics) 3.57 4.01 (.434) 5 3.761***
Emp2(Put the student interest at the forefront of the management agenda) 3.03 3.92 (.884) 1 7.301***
Emp3(friendship) 3.43 3.94 (.508) 4 4.522***
Emp4(respect for guests) 3.17 3.77 (.601) 3 5.342***
Emp5(celebrations and trips) 2.82 3.46 (.636) 2 5.157***
Overall average gap score for Empathy 3.21 3.82 (.610) 6.221***
Grand gap 3.27 3.98 (.708) 8.681***
Table (3):Summary of Means of MBA Student Perceptions, Expectations and Gap Scores – cont.
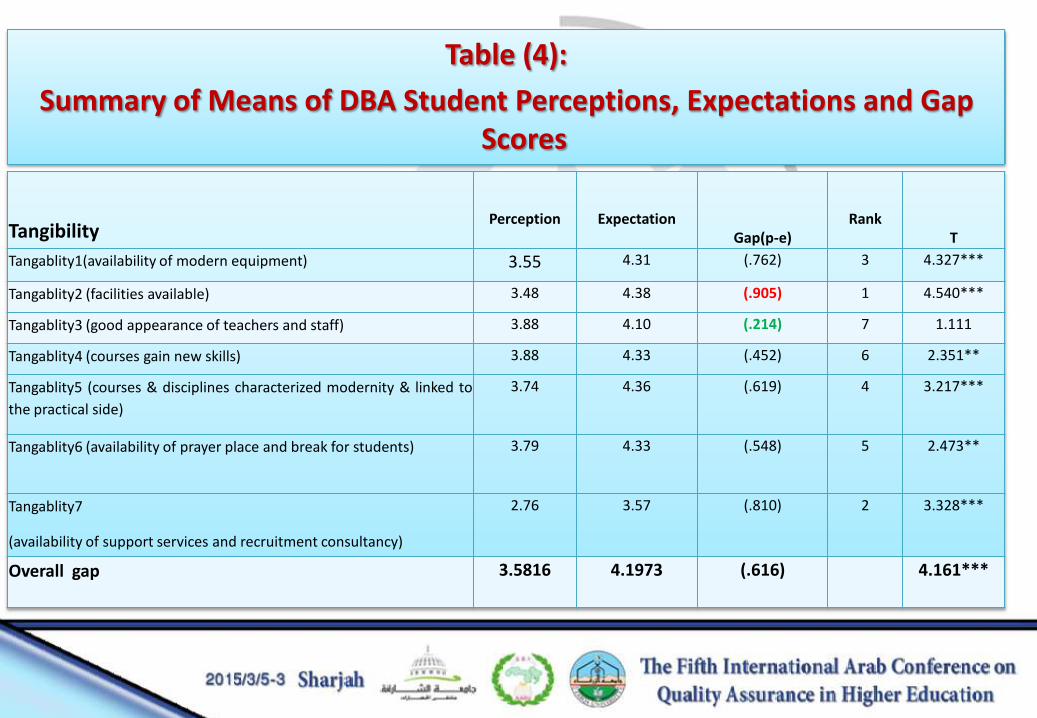
Table (4):
Summary of Means of DBA Student Perceptions, Expectations and Gap Scores
Tangibility
Perception
Expectation Gap(p-e)
Rank T
Tangablity1(availability of modern equipment) 3.55 4.31 (.762) 3 4.327***
Tangablity2 (facilities available) 3.48 4.38 (.905) 1 4.540***
Tangablity3 (good appearance of teachers and staff) 3.88 4.10 (.214) 7 1.111
Tangablity4 (courses gain new skills) 3.88 4.33 (.452) 6 2.351**
Tangablity5 (courses & disciplines characterized modernity & linked to
the practical side)
3.74 4.36 (.619) 4 3.217***
Tangablity6 (availability of prayer place and break for students) 3.79 4.33 (.548) 5 2.473**
Tangablity7
(availability of support services and recruitment consultancy)
2.76 3.57 (.810) 2 3.328***
Overall gap 3.5816 4.1973 (.616) 4.161***
16
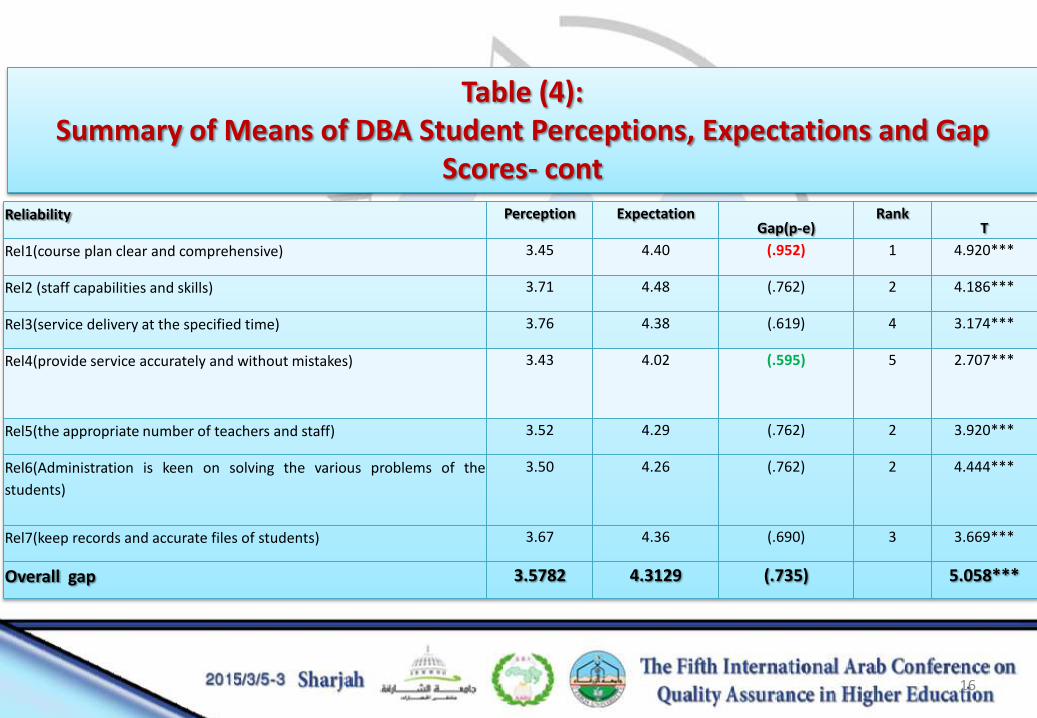
Reliability Perception Expectation Gap(p-e)
Rank T
Rel1(course plan clear and comprehensive) 3.45 4.40 (.952) 1 4.920***
Rel2 (staff capabilities and skills) 3.71 4.48 (.762) 2 4.186***
Rel3(service delivery at the specified time) 3.76 4.38 (.619) 4 3.174***
Rel4(provide service accurately and without mistakes) 3.43 4.02 (.595) 5 2.707***
Rel5(the appropriate number of teachers and staff) 3.52 4.29 (.762) 2 3.920***
Rel6(Administration is keen on solving the various problems of the
students)
3.50 4.26 (.762) 2 4.444***
Rel7(keep records and accurate files of students) 3.67 4.36 (.690) 3 3.669***
Overall gap 3.5782 4.3129 (.735) 5.058***
Table (4): Summary of Means of DBA Student Perceptions, Expectations and Gap
Scores- cont
17
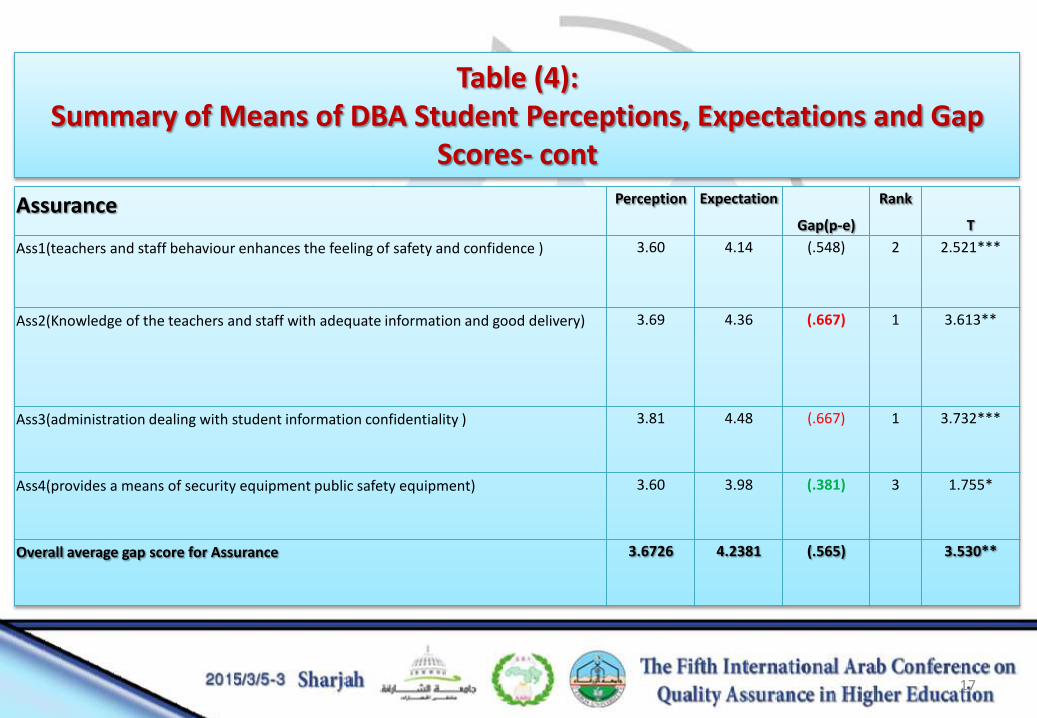
Assurance Perception Expectation
Gap(p-e)
Rank
T
Ass1(teachers and staff behaviour enhances the feeling of safety and confidence ) 3.60 4.14 (.548) 2 2.521***
Ass2(Knowledge of the teachers and staff with adequate information and good delivery) 3.69 4.36 (.667) 1 3.613**
Ass3(administration dealing with student information confidentiality ) 3.81 4.48 (.667) 1 3.732***
Ass4(provides a means of security equipment public safety equipment) 3.60 3.98 (.381) 3 1.755*
Overall average gap score for Assurance 3.6726 4.2381 (.565) 3.530**
Table (4): Summary of Means of DBA Student Perceptions, Expectations and Gap
Scores- cont
18
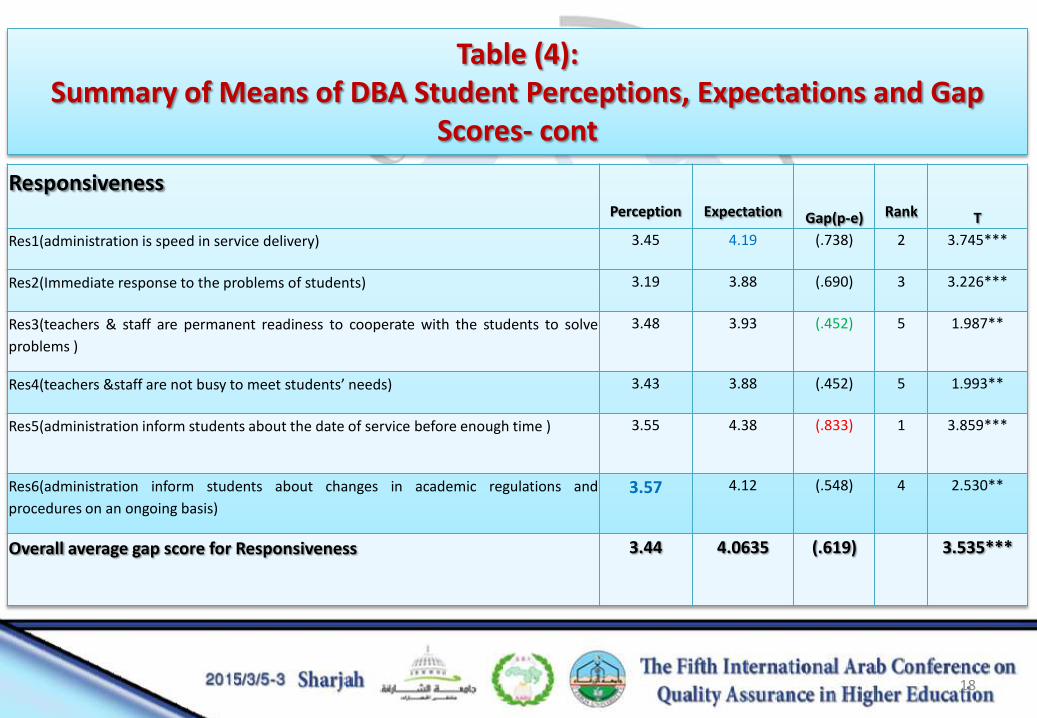
Responsiveness
Perception
Expectation Gap(p-e)
Rank T
Res1(administration is speed in service delivery) 3.45 4.19 (.738) 2 3.745***
Res2(Immediate response to the problems of students) 3.19 3.88 (.690) 3 3.226***
Res3(teachers & staff are permanent readiness to cooperate with the students to solve
problems )
3.48 3.93 (.452) 5 1.987**
Res4(teachers &staff are not busy to meet students’ needs) 3.43 3.88 (.452) 5 1.993**
Res5(administration inform students about the date of service before enough time ) 3.55 4.38 (.833) 1 3.859***
Res6(administration inform students about changes in academic regulations and
procedures on an ongoing basis)
3.57 4.12 (.548) 4 2.530**
Overall average gap score for Responsiveness 3.44
4.0635 (.619) 3.535***
Table (4): Summary of Means of DBA Student Perceptions, Expectations and Gap
Scores- cont
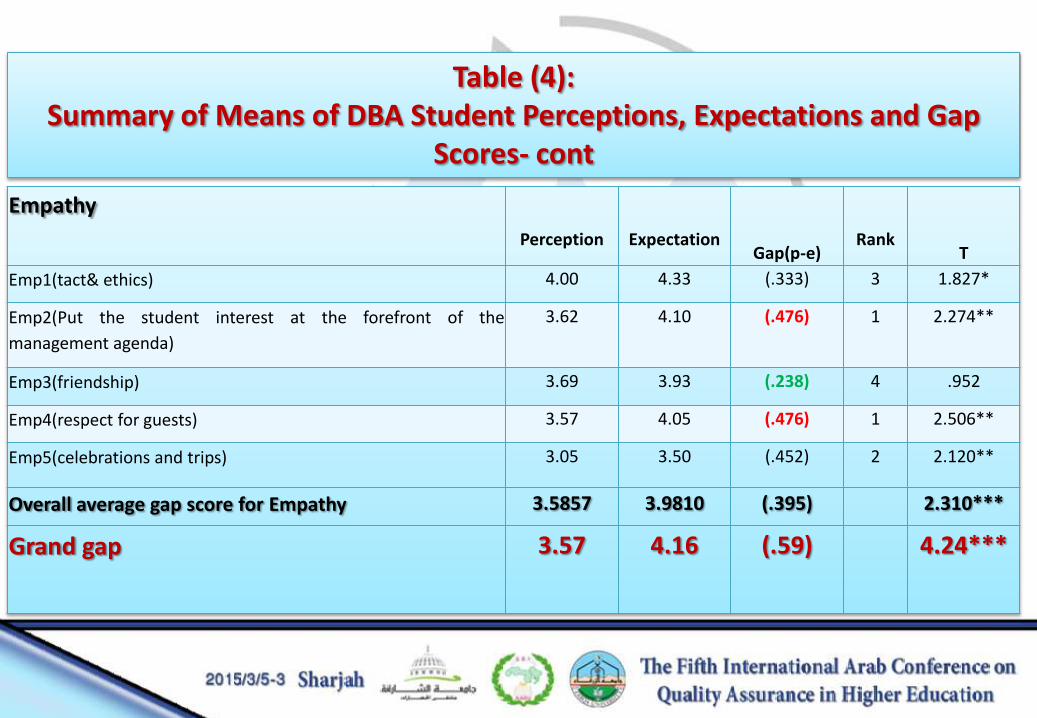
Empathy
Perception
Expectation Gap(p-e)
Rank T
Emp1(tact& ethics) 4.00 4.33 (.333) 3 1.827*
Emp2(Put the student interest at the forefront of the
management agenda)
3.62 4.10 (.476) 1 2.274**
Emp3(friendship) 3.69 3.93 (.238) 4 .952
Emp4(respect for guests) 3.57 4.05 (.476) 1 2.506**
Emp5(celebrations and trips) 3.05 3.50 (.452) 2 2.120**
Overall average gap score for Empathy 3.5857 3.9810 (.395) 2.310***
Grand gap 3.57 4.16 (.59) 4.24***
Table (4): Summary of Means of DBA Student Perceptions, Expectations and Gap
Scores- cont
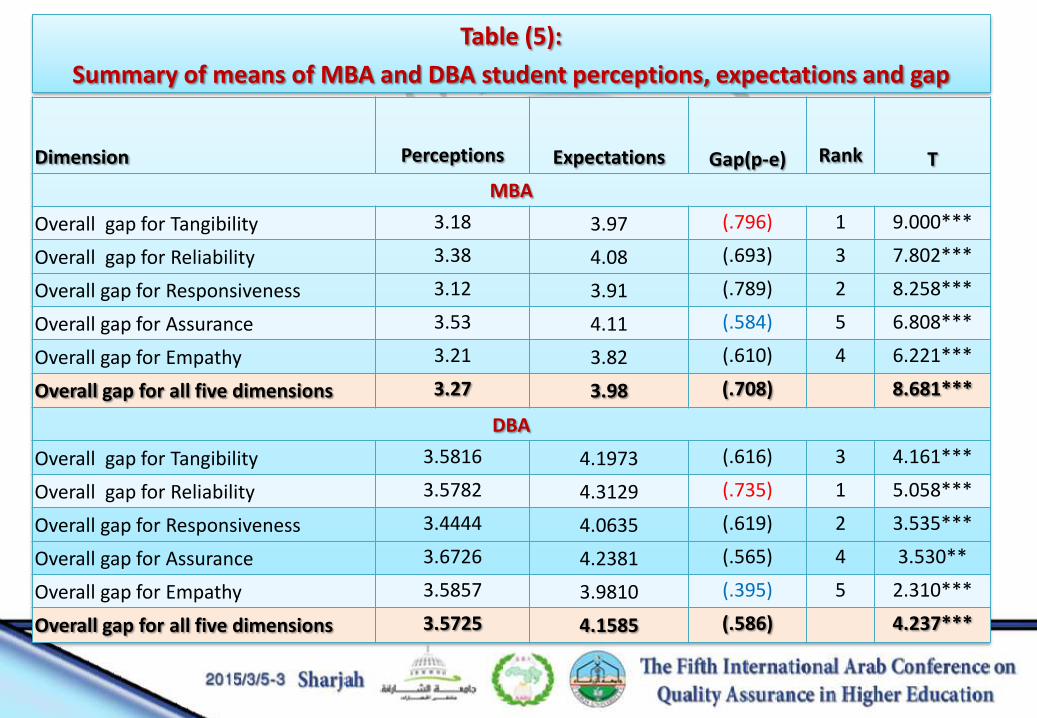
Table (5):
Summary of means of MBA and DBA student perceptions, expectations and gap scores
Dimension
Perceptions Expectations Gap(p-e)
Rank T
MBA
Overall gap for Tangibility 3.18 3.97 (.796) 1 9.000***
Overall gap for Reliability 3.38 4.08 (.693) 3 7.802***
Overall gap for Responsiveness 3.12 3.91 (.789) 2 8.258***
Overall gap for Assurance 3.53 4.11 (.584) 5 6.808***
Overall gap for Empathy 3.21 3.82 (.610) 4 6.221***
Overall gap for all five dimensions 3.27 3.98 (.708) 8.681***
DBA
Overall gap for Tangibility 3.5816 4.1973 (.616) 3 4.161***
Overall gap for Reliability 3.5782 4.3129 (.735) 1 5.058***
Overall gap for Responsiveness 3.4444 4.0635 (.619) 2 3.535***
Overall gap for Assurance 3.6726 4.2381 (.565) 4 3.530**
Overall gap for Empathy 3.5857 3.9810 (.395) 5 2.310***
Overall gap for all five dimensions 3.5725 4.1585 (.586) 4.237***
• Results showed a negative service quality gap in all of the five SERVQUAL dimensions for both the MBA and the DBA programs. This means students' expectations are greater than their perception and, therefore, they are not satisfied with the quality of services provided to them.
• The MBA students were found to be less satisfied (with a significant negative overall gap of .708) than the DBAs (with a significant negative overall gap of = .586).
• Improvements are needed in related dimensions as the greater the negative gap, the lower the level of satisfaction as students expectations were not met.
Conclusion

Implication
• The study findings provides the school management with important insights by knowing which of their service quality dimension should receive the most attention in order to gain competitive advantage.
• Increasing competition on higher education market, makes quality a key factor for every institution in achieving a competitive position. An improvement of service quality will help them to survive in the competitive marketplace
22
23 23
Recommended