Government Data Quality Findings &
Recommendations:
A Compendium
Final Draft
28 November 2014
Nils Riemenschneider & Jesse McConnell
Oxford Policy Management
Commissioned by the Millennium Challenge Account Namibia
with funding from the Millennium Challenge Corporation

Bi‐Annual Ex‐Post Data Quality Review
Table of Contents
List of tables .................................................................................................................. 3
List of figures ................................................................................................................. 4
List of acronyms ............................................................................................................. 5
Preface .......................................................................................................................... 6
1. Introduction ........................................................................................................... 7
1.1. Structure of the Report ......................................................................................... 7
1.2. Data Sources Reviewed ......................................................................................... 8
1.3. Data Quality Review Methods ............................................................................... 8
2. Goal Indicators ..................................................................................................... 10
2.1. Namibia Household Income and Expenditure Survey (Namibia Statistics Agency)
............................................................................................................................ 10
2.2. Namibia Labour Force Survey (Namibia Statistics Agency) ................................. 12
3. Education Indicators ............................................................................................. 15
3.1. Education Management Information System (Ministry of Education) ............... 15
3.2. Directorate of National Examination and Assessment (Ministry of Education) .. 17
3.3. Education Administrative Data (Ministry of Education) ...................................... 19
3.4. Vocational Education Administrative Data & VETMIS (Namibia Training
Authority) ............................................................................................................ 20
4. Tourism Indicators ................................................................................................ 23
4.1. Foreign Arrival Records (Ministry of Environment and Tourism) ........................ 23
4.2. Etosha National Park Administrative Data (Ministry of Environment and
Tourism) .............................................................................................................. 24
4.3. Tourism Jobs Model (Namibia Tourism Board) ................................................... 28
4.4. Google Analytics (Namibia Tourism Board) ......................................................... 29
4.5. Bed Levy Statistics administrative data (Namibia Tourism Board) ..................... 31
5. Agriculture Indicators ........................................................................................... 33
5.1. System for Livestock Health Statistics (Ministry of Agriculture, Water and
Forestry) .............................................................................................................. 33
5.2. Formal Cattle Slaughter Data (Meat Corporation of Namibia) ........................... 35
5.3. Namibia Communal Land Administration System (Ministry of Lands and
Resettlement) ..................................................................................................... 36
Annex 1: Data sources and corresponding reviews ....................................................... 37
Annex 2: List of documents consulted .......................................................................... 38
Annex 3: International Data Quality Standards ............................................................ 39
3.1 IMF Data Quality Assessment Framework .......................................................... 39
3.2 UN Fundamental Principles of Official Statistics ................................................. 40
Annex 4: Supporting documentation ........................................................................... 41
Compendium of Government Data Quality Findings & Recommendations
3
List of tables
Table 1: Data sources reviewed 8
Table 2: MCA‐N related indicators: goal (NHIES) 11
Table 3: MCA‐N related indicators: goal (NLFS) 12
Table 4: MCA‐N related indicators: education (EMIS) 15
Table 5: MCA‐N related indicators: education (DNEA) 18
Table 6: MCA‐N related indicators: education (MoE) 19
Table 7: MCA‐N related indicators: education (NTA) 21
Table 8: MCA‐N related indicators: tourism (Arrivals Statistics – MET) 23
Table 9: MCA‐N related indicators: tourism (ENP administrative data – MET) 25
Table 10: MCA‐N related indicators: tourism (jobs model – NTB) 29
Table 11: MCA‐N related indicators: tourism (Google Analytics – NTB) 30
Table 12: MCA‐N related indicators: tourism (bed levy statistics – NTB) 31
Table 13: MCA‐N related indicators: agriculture (DVS – MAWF) 33
Table 14: MCA‐N related indicators: agriculture (Meatco) 35
Table 15: MCA‐N related indicators: agriculture (NCLAS – MLR) 36
Table 16: Data source and corresponding reviews 37
Compendium of Government Data Quality Findings & Recommendations
4
List of figures
Figure 1: Galton Gate – Yellow Book & white forms 27
Figure 2: Visitor data record sheet (Yellow Book) – Galton Gate 42
Figure 3: Visitor data record sheet (white form) – Anderson Gate 43
Figure 4: Covering Advice, 23 May 2014 44
Figure 5: Tourism Levy Return & Statistics Form 45
Figure 6: Google Analytics – visits to NTB website (sample taken from Oct‐Dec 2013) 46
Figure 7: Poster by MLR to communicate the process around land registration 47

Compendium of Government Data Quality Findings & Recommendations
5
List of acronyms
AEC Annual Education Census
BAR Bi‐Annual Review
DVS Directorate of Veterinary Services in the Ministry of Agriculture, Water and
Forestry
DNEA Directorate of National Examination and Assessment in the Ministry of Education
DoT Directorate of Tourism and Gaming
DQAF Data Quality Assessment Framework
DQR Data Quality Review
EMIS Education Management Information System
GDQR Government Data Quality Review
GRN Government of the Republic of Namibia
IMF International Monetary Fund
JSC Junior Secondary Certificate
MAWF Ministry of Agriculture, Water and Forestry
MCA‐N Millennium Challenge Account Namibia
M&E Monitoring and Evaluation
MoE Ministry of Education
MLR Ministry of Lands and Resettlement
NCLAS Namibia Communal Land Administration System
NHIES Namibia Household Income and Expenditure Survey
NLFS Namibia Labour Force Survey
NPC National Planning Commission
NSA Namibia Statistics Agency
NSSCHL Namibia Senior Secondary Certificate Higher Level
NSSCOL Namibia Senior Secondary Certificate Ordinary Level
OPM Oxford Policy Management
SSC Senior Secondary Certificate

Compendium of Government Data Quality Findings & Recommendations
6
Preface
The Millennium Challenge Account Namibia (MCA‐N) has contracted Oxford Policy
Management (OPM) to provide consultancy services for the Data Quality Review (DQR) of
different MCA‐N monitoring and evaluation (M&E) indicators. The DQRs occurred over the
period 2010 to 2014. As the culmination of this process, this Compendium Report provides a
summation of all findings and recommendations related to government data sources
included in all preceding data quality reviews conducted by OPM for MCA‐N. The report
draws on those previous reviews, and is targeted towards highlighting key considerations in
the future use of the data sources, e.g., in national M&E frameworks like the National
Planning Commission’s monitoring of achievement towards Vision 2030 and National
Development Plan objectives.
Compendium of Government Data Quality Findings & Recommendations
7
1. Introduction
This report aims to synthesize the findings from various data quality reviews (DQRs) of
Namibian government data sources. These DQRs were conducted from 2010 to 2014 and
have been documented in various reports. The synthesis targets government data sources
that formed part of MCA‐N’s monitoring and evaluation (M&E) framework during its
implementation of the Compact between the Government of the Republic of Namibia (GRN)
and the Government of the United States (represented by the Millennium Challenge
Corporation (MCC)). The report provides an overview of previous reviews of the data
sources, a snapshot of the current or most recent status on the reported data sources, and
considerations for future use and/or improvement of those data sources.
A related workshop that took place on 18‐19 November 2014 disseminated these
consolidated findings and recommendations to key government stakeholders – particularly
the National Planning Commission’s (NPC’s) M&E unit and the Namibia Statistics Agency
(NSA) – to ensure that GRN is well aware of the issues; the workshop also had a training
component to give the relevant institutions solid grounding for conducting or managing their
own follow‐up or new DQRs.
The DQR period for which OPM was contracted by MCA‐N extended from 2010 to 2014, and
the findings related to government sources have been documented in the following reports,
which also serve as the key source documents to this report:
i. Government Data Quality Review (2011)
ii. Bi‐Annual Review I (2012)
iii. Bi‐Annual Review II (2012)
iv. Bi‐Annual Review III (2014)
v. Data Quality Review Follow‐Up: Education Management Information System (EMIS)
(2014)
vi. Data Quality Review Follow‐Up: Vocational Education and Training Management
Information System (VETMIS) (2014)
vii. Support for High Quality Data Reporting: Quarter 19 (Q19) (2014)
Each of these reports are referenced within the text of this report. They are sources of
further details underlying the processes of data collection that pertain to the relevant
indicators, should the reader wish to delve into those details. This report itself seeks only to
highlight key issues for follow‐up based on the findings and recommendations from the
previous reviews.
1.1. Structure of the Report
The general structure of the report is based around the MCA‐N Compact, beginning with the
overall Goal indicators, followed by indicators falling under its three Projects: Education,
Tourism and Agriculture. Under each Project, the data source(s) included in previous reviews
are discussed, beginning with a brief overview of the data source itself. This is followed by

Compendium of Government Data Quality Findings & Recommendations
8
relating it to the specific MCA‐N indicators that the data sources were used to monitor,
followed then with a review history, including key findings and recommendations. It
concludes with considerations for further monitoring of the data source.
Each sub‐section tabulates the MCA‐N indicators related to the data sources. The narrative
in the sub‐section provides a chronological overview of the data source, including the
processes that it underwent in its review history, in which the evolution of the indicator and
data source(s) are briefly described.
1.2. Data Sources Reviewed
The specific data sources that were reviewed and included in this report relate to
government‐specific data sources. They are listed below, according to the MCA‐N Project
that they pertain to, with their institutional affiliation provided in parentheses1:
Table 1: Data sources reviewed Goal Indicators
1. Namibia Household Income and Expenditure Survey (NSA)
2. Namibia Labour Force Survey (NSA)
Education Indicators
3. Education Management Information System (MoE)
4. Examination results from the Directorate of National Examinations and
Assessment (MoE)
5. Administrative data from the NTA
6. Administrative data from MoE
Tourism Indicators
7. Foreign Arrival Records (MET)
8. Etosha National Park administrative data (MET)
9. Tourism Jobs Model (NTB)
10. Google Analytics (NTB)
11. Bed Levy Statistics (NTB)
Agriculture Indicators
12. System for Livestock Health Statistics (MAWF)
13. Formal Cattle Slaughter Data (MEATCO)
14. Namibia Communal Land Administration System (MLR)
1.3. Data Quality Review Methods
The data quality reviews conducted by OPM were, at their premise, aimed at understanding
in detail the processes that underpin data collection for the reviewed data sources. In the
process of understanding how data are collected and reported on, the DQR Team sought to
identify where weaknesses in the process might exist that would challenge the quality and
1 Please see Annex 1 for a tabulation of the data sources together with their related data quality reviews

Compendium of Government Data Quality Findings & Recommendations
9
integrity of the data being collected or, in cases where the process was considered
sufficiently robust to result in solid data, to deem the data source ‘fit for purpose’.
The methods used for undertaking the data quality reviews varied according to the data
sources, necessarily adapting to the processes that the data sources themselves entailed.
This was an important feature of the data quality reviews, given the diversity of the data
sources that were reviewed, as well as the broad period of time over which the DQRs were
conducted. In general, the reviews sought to comply with the internationally accepted
standards on statistical and data quality, such as the ‘prerequisites of quality’ outlined in the
International Monetary Fund (IMF) Data Quality Assessment Framework (DQAF)2 and the 10
Fundamental Principles of Official Statistics outlined by the UN.3
The reviews generally included some form of document review at the outset, followed by a
formulation of key questions resulting from the document review, which could then be
taken into field and raised during consultations with the data collectors for each source.
These stakeholder consultations were generally conducted in‐field at the data collectors’
area of work, and included not only discussions about the data collection processes, but –
when possible – observations of the data collection processes themselves.
Often follow‐up consultations were also held by way of clarifying previous findings in order
to ensure accurate understanding of the processes and reasonable premises for further
recommendations. The findings from the review were then written in the data quality
review reports (listed above) which were then submitted to the MCA‐N M&E unit, which
circulated them among the relevant data producers, NPC M&E staff and/or sector teams
responsible for the implementation and management of its projects. The input provided
formed part of an iterative process in the finalisation of the recommendations. The objective
was to identify recommendations that were pragmatic and viable for implementation
which were also aligned with the overall objectives of the MCA‐N Compact.
2 International Monetary Fund, Data Quality Assessment Framework (2012)
3 United Nations, Fundamental Principles of Official Statistics (1994)

Compendium of Government Data Quality Findings & Recommendations
10
2. Goal Indicators
The Goal indicators in MCA‐N’s M&E Plan are drawn from Namibia’s Vision 2030 and the
National Development Plan 3, with the view that the MCA‐N program would contribute to
achieving national objectives.4 However, MCA‐N’s intervention is noted as not being of
sufficient scale to independently achieve these goals at the national level. The data sources
that informed the Goal indicators included in this compendium report include the Namibia
Household Income and Expenditure Survey (NHIES) and the Namibia Labour Force Survey
(NLFS), both conducted by the Namibia Statistics Agency (NSA) (which was formerly the
Central Bureau of Statistics in the National Planning Commission).
2.1. Namibia Household Income and Expenditure Survey (Namibia Statistics Agency)
Overview of the data source
The Namibia Household Income and Expenditure Survey (NHIES) was conducted most
recently in 2009/2010. Previous versions of the survey having been conducted in 1993/1994
and 2003/2004.5 As the 2009/2010 NHIES report states, the NHIES is ‘a survey collecting data
on income, consumption and expenditure patterns of households, in accordance with
methodological principles of statistical enquiries, which are linked to demographic and
socio‐economic characteristics of households.’6 The survey is managed and implemented by
the Namibia Statistics Agency (NSA) every 5 years. An initial interval period of 10 years was
seen to be too long. Given these methodological and statistical mandates, the NHIES was
deemed as an appropriate data source for several goal‐level indicators for MCA‐N.
MCA‐N related indicators
For MCA‐N’s critical Goal indicators – those that monitor overall impact of the Compact –
the three indicators were informed by the NHIES. These indicators bear the following high‐
impact goals: reduce the poverty rate, reduce the unemployment rate, and increase the
median household income. These indicators are listed below, together with their definitions,
data sources, and responsible parties:7
4 Oxford Policy Management, Government Data Quality Review (2011), p25 5 Namibia Statistics Agency, Namibia Household Income and Expenditure Survey 2009/2010, piv 6 NSA, NHIES 2009/2010, piv
7 Data sources listed in parentheses indicate original data sources that changed to those currently listed as the main data source in the same column.

Compendium of Government Data Quality Findings & Recommendations
11
Table 2: MCA‐N related indicators: goal (NHIES)8
Indicator Definition Data Source
Responsible Party
Poverty Rate
The cost of a food basket enabling households to meet a minimum nutritional requirement plus an allowance for the consumption of basic non‐food items. Households with consumption expenditure in excess of this threshold are considered non‐poor and households with expenditure less than the threshold are considered poor
NHIES NSA
Unemployment Rate The percentage of the economically active population that is currently unemployed
NHIES(NLFS)
NSA
Median Household Income
The sum of total consumption and non‐consumption expenditures. Savings are not included
NHIES NSA
Review history: key findings & recommendations
The first review for these indicators and related data sources was in the Government Data
Quality Review (GDQR). At that point the 2009/2010 version of the NHIES was not yet
available. Thus the 2003/2004 version formed the basis for the review. The NHIES originally
provided data for two MCA‐N indicators – poverty rate and median household income – as
noted in the table above. However, it was later recommended to also serve as the data
source for the unemployment rate indicator, due to problems found with the original source
(see section 2.2 of this report).
The overall findings of the NHIES review were that the survey and report were ‘generally of
high quality and its results...reliable’.9 Minor recommendations were provided for areas
where the survey could be improved. These included points such as reduced number of
households per enumeration area; improving the sample size per region so that the sample
can be disaggregated at a regional level; calculating sampling errors for key variables;
making minor improvements to the questionnaire; using price deflators to standardise costs
in estimating value of total consumption for households; calculating poverty based on the
cost of basic needs (not by food shares); using double data‐entry for certain complex
sections of a question in order to reduce data capture errors where double‐entry is not
possible for the full questionnaire.
Considerations going forward
Future considerations that should be taken into account related to the NHIES should firstly
ensure that the survey maintains comparability over time. While certain recommendations
have been provided in the reviews, these are somewhat minor issues that should not detract
from the replicability of the survey. Being able to replicate the survey is vital to make
8 Millennium Challenge Account Namibia, Monitoring and Evaluation Plan (2014), Annex 1, p1 (Please note that all references to the MCA‐N M&E Plan relate to the prevailing Plan at the time of the referenced data quality review unless currently referenced, in which case the most recent and formally referenced version (2014) applies.) 9 OPM, GDQR, p42

Compendium of Government Data Quality Findings & Recommendations
12
comparisons over time. This will help to accurately measure change and monitor Namibia’s
critical socio‐economic development indicators.
Other matters for further improvement include that data should be made more timeously
accessible to users. The 2003/2004 report only became available more than two years after
fieldwork ended, and the poverty report four years after fieldwork ended. More timely
access to the data is vital for user confidence in the data and for informing decision‐making
processes more substantially.10
2.2. Namibia Labour Force Survey (Namibia Statistics Agency)
Overview of the data source
The 2004 Namibia Labour Force Survey (NLFS) was the third of its kind conducted since
independence, and is a nationally representative household‐based sample survey, with the
objectives ‘to measure the extent of available and unused labour time and human resources’
and ‘to measure the relationship between employment and other socio‐economic
characteristics’.11
The NLFS is specifically targeted towards informing critical policy decisions and programmes
that aim at building the economic base for development in Namibia. In 2004 this was stated
as the survey aiming to provide ‘all the necessary information on employment,
unemployment and underemployment to meet the demands of policy‐makers, analysts and
other institutions for period policy and comprehensive reviews of the employment situation
in the country’.12 In its latest version, the NLFS targets its data towards ‘assessment of labour
market conditions in Namibia.’13 The survey is now conducted annually by the NSA.14
MCA‐N‐related indicators
The NLFS was originally identified as the data source for the goal indicator on
unemployment (though, given the findings of the GDQR, this was recommended to be
changed to the NHIES), tabulated in further detail below:
Table 3: MCA‐N related indicators: goal (NLFS)15
Indicator Definition Data Source
Responsible Party
Unemployment Rate The percentage of the economically active population that is currently unemployed
NHIES(NLFS)
NSA
10 OPM, GDQR, p42‐45
11Namibia Statistics Agency, Namibia Labour Force Survey 2004, p17 12 NSA, NLFS 2004, pi 13 NSA, NLFS 2014, p8
14 NSA, NLFS 2014, p19
15 MCA‐N, M&E Plan, Annex 1, p1

Compendium of Government Data Quality Findings & Recommendations
13
Review history: key findings & recommendations
The NLFS was first reviewed in the GDQR – along with the NHIES – but without the same
positive outcome.16 The GDQR review (conducted in 2010‐2011) was based on the published
results of the 2004 NLFS – which was compared to the data from the 2003/2004 NHIES
database – as this was the most recent data available at the time of the review.
One of the findings of the review pertaining to this indicator was that significant
discrepancies existed between the two major national surveys – the NLFS and the NHIES –
particularly in the areas of the unemployment rate.17 The review found that there were
‘varying interpretations of the standard concepts and definitions surrounding economic
activity’, particularly those used by the NLFS.18 More specifically, the review noted ‘the
exclusion of subsistence farmers from the economically active population’, reflecting an
over‐inflated level of unemployment (37%) to that of reported in the NHIES (23%).19
Around the time of the GDQR (but not necessarily as the exclusive reason for it), the
Namibian government officials requested the World Bank to further investigate the quality
of the 2008 NLFS data and its estimates of the unemployment rate.
The World Bank document was reviewed by the DQR Team in the Bi‐Annual Review (BAR),
round II report, which formed the second review of the data source (after it was first
reviewed in the GDQR).20 The main question for this review was whether the conclusions of
the World Bank study (looking at the 2008 NLFS) and the GDQR report (looking at the 2004
NLFS) on the reasons for the high estimates of the unemployment rate were consistent. In
addition, the objective was to identify any new findings in the World Bank review that could
lead to additional recommendations.
Although the descriptions of the estimation methodology for the 2004 and 2008 NLFS are
different in the World Bank review and the GDQR, they nevertheless reach similar
conclusions that the over‐estimation of the unemployment rate is partly due to the
treatment of subsistence farming in the survey data. The BAR II submitted a list of
recommendations for the improvement of the NLFS.
MCA‐N recognized these findings by noting in its final M&E Plan (of July 2014) the following
additional information for the unemployment rate indicator: ‘Given the weakness of the
NLFS‐sourced unemployment rate as identified by the Data Quality Review (DQR) consultant
in the Government Data Quality Review and in Round 2 of the bi‐annual ex‐post reviews, the
unemployment rate from the NHIES (which was found to be a reliable source of data) should
be used as a parallel indicator.’21
16 See OPM, GDQR, p46‐59
17 This is of course of particular significant to MCA‐N, given that the NLFS was identified as the data source for the
unemployment indicator. 18 OPM, GDQR, p58 19 OPM, GDQR, p58
20 See Oxford Policy Management, Bi‐Annual Ex‐Post Data Quality Review, Round 2 (2012), p8‐16
21 MCA‐N, M&E Plan, Annex 1, p1

Compendium of Government Data Quality Findings & Recommendations
14
The NLFS has since been significantly overhauled, which was recognized by MCA‐N in its
note in the Indicator Tracking Table (in which the organisation reports actual achievement
against indicator targets) that the latest report unemployment rate should be cautiously
interpreted in relation to previous figures given changes in methodology.22
Considerations going forward
The first concern raised by the reviews is the timely and adequate access to data for users. It
is critical that users be able to have quick access to the data in order to inform relevant
decision‐making processes.
The fact of the previous versions of the NLFS being untimely in their release to the public
appears to have found traction at the highest levels of the NSA, as the latest NLFS report
(2014) indicates: ‘the 2013 Labour Force Survey was conducted with the objective of
generating “timely collection and release of key socio‐economic indicators for assessment of
labour market conditions in Namibia”’.23
Some of the definitional challenges found in the NLFS (i.e. unemployment parameters) also
appear to have been addressed – largely with the revised legal framework under which the
NSA was created and given the mandate of statistics autonomy and national data
production. MCA‐N also reported that the recommendations by the BAR II report had been
implemented.
However, it is still vital that the definitions of key statistics be constantly updated to keep
pace with international standards while also ensuring that the various national surveys
follow similar methodologies in order to ensure comparability and integrity across the
various national data.
22 MCA‐N, Indicator Tracking Tables of July 2014 and September 2014
23 Namibia Statistics Agency, Namibia Labour Force Survey 2013 Report (2014), p8
Compendium of Government Data Quality Findings & Recommendations
15
3. Education Indicators
MCA‐N’s Education Project was aimed at contributing to ‘improving the quality of education
and training in Namibia as well as expanding access of underserved groups to education and
vocational training.’24 The data sources included in this compendium report include the
Education Management Information System (EMIS), the Directorate of National Examination
and Assessment (DNEA) and administrative data from the Ministry of Education (MoE), as
well as the Vocational Education Training Management Information System (VETMIS) and
various administrative data from the Namibia Training Authority (NTA).
3.1. Education Management Information System (Ministry of Education)
Overview of the data source
The Education Management Information System (EMIS), managed by the Ministry of
Education (MoE), was selected as a data source for MCA‐N for the following two main
reasons: i) ‘to capture change in the flow of learners in the school system (by observing
promotion rates and the proportion of new entrants to targets grades); and ii) to measure
change in learners’ access to textbooks (by observing learner to textbook ratios)’.25
MCA‐N related indicators
Within MCA‐N’s Education Project, the Education Management Information System (EMIS)
was identified as the data source for the M&E Plan indicators listed below, together with
their definitions, data sources, and responsible parties:
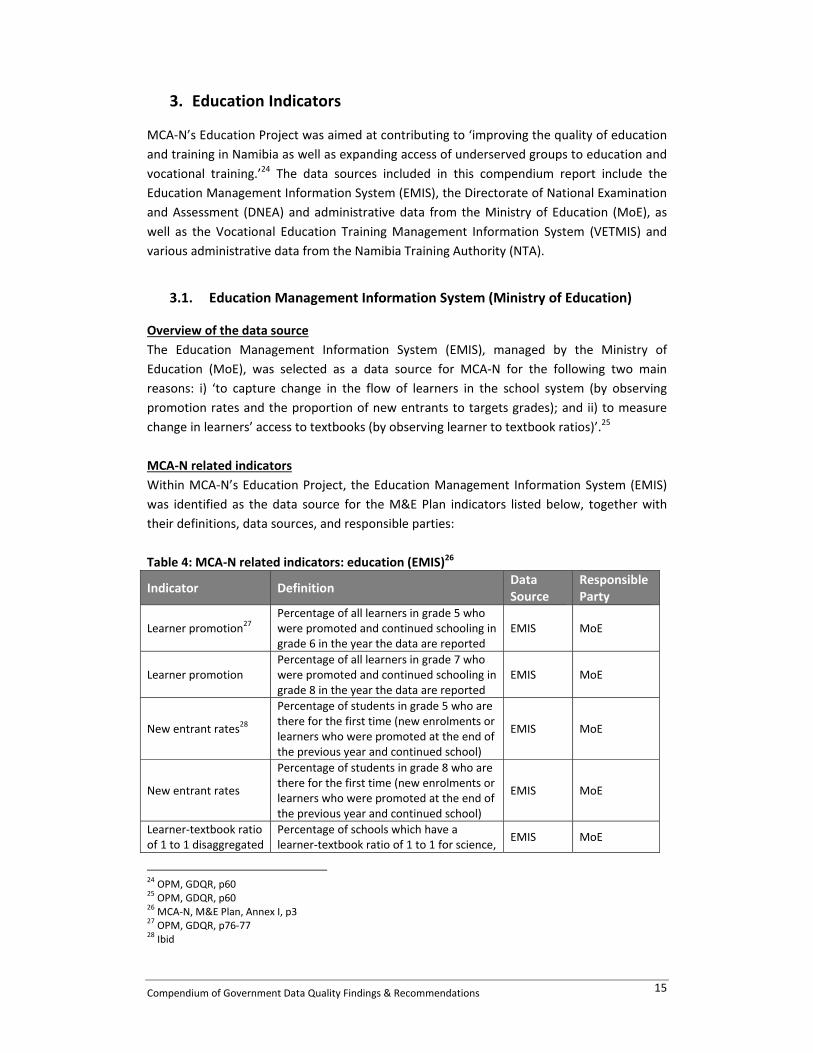
Table 4: MCA‐N related indicators: education (EMIS)26
Indicator Definition Data Source
Responsible Party
Learner promotion27 Percentage of all learners in grade 5 who were promoted and continued schooling in grade 6 in the year the data are reported
EMIS MoE
Learner promotion Percentage of all learners in grade 7 who were promoted and continued schooling in grade 8 in the year the data are reported
EMIS MoE
New entrant rates28
Percentage of students in grade 5 who are there for the first time (new enrolments or learners who were promoted at the end of the previous year and continued school)
EMIS MoE
New entrant rates
Percentage of students in grade 8 who are there for the first time (new enrolments or learners who were promoted at the end of the previous year and continued school)
EMIS MoE
Learner‐textbook ratio of 1 to 1 disaggregated
Percentage of schools which have a learner‐textbook ratio of 1 to 1 for science,
EMIS MoE
24 OPM, GDQR, p60 25 OPM, GDQR, p60 26 MCA‐N, M&E Plan, Annex I, p3
27 OPM, GDQR, p76‐77
28 Ibid

Compendium of Government Data Quality Findings & Recommendations
16
Indicator Definition Data Source
Responsible Party
by science, maths and English29
mathematics and English books for all grades
Learner‐textbook ratio of 1 to 2 disaggregated by science, maths and English
Percentage of schools which have a learner‐textbook ratio of 1 to 2 for science, mathematics and English books for all grades
EMIS MoE
Learners (any level) participating in the 47 schools sub‐activity
The number of learners enrolled or participating in educational programmes in the 47 schools plus any new schools that split from the original schools and are co‐located.
EMIS MoE
Teacher qualification – 47 schools
% of teachers (in the 47 schools plus any new schools that split from the original schools and are co‐located) who have a teacher qualification of Code 4, 5, or 6 for Professional Qualifications in the Annual Education Census.
EMIS MoE
Review history: key findings & recommendations
The EMIS was first reviewed in the GDQR (2011), then the BAR I (2012) and again in the DQR
follow‐up report on EMIS (2014). The first review (GDQR) identified the three indicators that
were currently monitored by EMIS. The indicators aimed to i) ‘capture change in the flow of
learners in the school system (by observing promotion rates and the proportion of new
entrants to targeted grades); ii) change in learners’ access to textbooks (by observing leaner
to textbook ratios); and iii) change in the quality of the school system (by observing the
proportion of learners passing the Junior Secondary Certificate (JSC) and Senior Secondary
Certificate (SSC) exams at a targeted pass rate level)’.30
For the GDQR report, the review included not only a review of the EMIS itself, but also the
data sources that feed into EMIS for the other indicators, including a review of the Annual
Education Census (AEC) and Fifteenth School Day Statistics survey forms (used to collect data
for EMIS), the Education Statistics publications, a report of a survey of textbooks, and the
Manual for Schools for Registers of Orphans and Vulnerable Children.
The EMIS data are based on the AEC, which is conducted in September each year. The EMIS
unit also supports the implementation of the Fifteenth School Day Statistics survey, in which
schools report on enrolment, teachers and other basic information at the beginning of each
academic year.31
As a result of the review, indicators pertaining to learner promotion were noted as facing
challenges to adequately indicate change based on the MCA‐N intervention. This is due to
the fact that AEC forms do not distinguish children that are transferred (without passing) to
the next grade. Moreover, the standards required for children to pass a class can also vary
29 Oxford Policy Management, Bi‐Annual Ex‐Post Data Quality Review, Round 1 (2012), p11
30 OPM, GDQR, p60
31 OPM, GDQR, p60‐61

Compendium of Government Data Quality Findings & Recommendations
17
by school. Hence the indicator was not recommended as a measure for the MCA‐N
intervention.32
The BAR I report reviewed the indicators pertaining to learner‐textbook ratios. It suggested
that the indicators be dropped from the MCA‐N logframe, as the data were unreliable.33 The
review found that the data collected by EMIS did not distinguish between old and new
textbooks, and thus risked including old and outdated textbooks, skewing the ratio.
Similar findings emerged in the DQR Follow‐Up: EMIS report as that of the GDQR. In it, the
capacity constraints noted previously within EMIS were still prevalent. Key roles in statistics
and database management were still vacant, while the data collection forms were also
noted as similarly burdensome and un‐modified in their data requirements.
The GDQR noted significant human resource constraints within EMIS, especially in the area
of statistics and database management. The GDQR recommended that these skills gaps will
be addressed through training and sourcing adequate capacity. The capacity constraints
were further highlighted by the fact that there were plans to decentralise EMIS data entry to
the regional levels, which are even further characterised by inadequate human resources. A
number of the data collection forms for EMIS were also noted as being burdensome to the
regional and local levels where the data are collected. Recommendations were made that
these be streamlined as much as possible, and any superfluous or repeated data
requirements be omitted. Similar findings emerged from the follow‐up DQR exercise.
Considerations going forward
In spite of the significant capacity constraints that both reviews noted for EMIS, it was
further discovered was that the EMIS management has a well‐developed vision for
developing and implementing a learner tracking system. That system would significantly
streamline the entire data collection process for the Ministry of Education throughout the
country. It would feed more robust, accurate and timely data into EMIS. In order for this
system to proceed towards development, sufficient political will and resources need to be
oriented towards its consideration and development. The potential benefits that such a
system presents make its strong consideration a high recommendation by the DQR Team.
3.2. Directorate of National Examination and Assessment (Ministry of Education)
Overview of the data source
As a directorate within the Ministry of Education, the main functions of the Directorate of
National Examination and Assessment (DNEA) are ‘to provide a national assessment and
certification service for the school system, to assist in enhancing the quality of education,
and with the monitoring of educational standards’. 34 More specially, the DNEA administers
32 See OPM, GDQR, p76‐77
33 See OPM, BAR I, p11‐16
34 National Examination and Assessment, http://www.dnea.gov.na/en (accessed 15 October 2014)

Compendium of Government Data Quality Findings & Recommendations
18
and monitors the standards of the Junior Secondary Certificate (JSC) and the Namibia Senior
Secondary Certificate Ordinary Level (NSSCOL) and the Namibia Senior Secondary Certificate
Higher Level (NSSCHL).
For MCA‐N the DNEA was selected as a data source in order to measure ‘change in the
quality of the school system (by observing the proportion of learners passing the JSC and SSC
exams at a targeted pass rate level)’.35
MCA‐N‐related indicators
The DNEA holds data on the national examinations and assessment statistics, which has
been used to report on eight MCA‐N indicators on learner achievement. These are listed
below:
Table 5: MCA‐N related indicators: education (DNEA)36
Indicator Definition Data Source
Responsible Party
Percentage of learners attaining ‘Basic Achievement’ or higher on the Grade 5 NSAT – English – 47 schools
The percentage of learners attaining ‘Basic Achievement’ or higher on the Grade 5 NSAT – English – 47 schools
DNEA MoE
Percentage of learners attaining ‘Basic Achievement’ or higher on the Grade 5 NSAT – Mathematics – 47 schools
The percentage of learners attaining ‘Basic Achievement’ or higher on the Grade 5 NSAT – Mathematics – 47 schools
DNEA MoE
Pass Rate of JSC learners (grade 10) – Math – 47 schools
The percentage of learners achieving D or better in core mathematics (at 45 of the 47 schools that include 10th grade)
DNEA MoE
Pass Rate of JSC learners (grade 10) – Science – 47 schools
The percentage of learners achieving D or better in Physical and Life Science (at 45 of the 47 schools that include 10th grade)
DNEA MoE
Pass Rate of JSC learners (grade 10) – English – 47 schools
The percentage of learners achieving D or better in English as a second language (at 45 of the 47 schools that include 10th grade)
DNEA MoE
Pass Rate of NSSC learners (grade 12) – Math – 47 schools
The percentage of learners achieving D or better in ordinary level mathematics (at 9 of the 47 schools that include 12th grade)
DNEA MoE
Pass Rate of NSSC learners (grade 12) – Science – 47 schools
The percentage of learners achieving D or better in ordinary level Physical Science (at 9 of the 47 schools that include 12th grade)
DNEA MoE
Pass Rate of NSSC learners (grade 12) – English – 47 schools
The percentage of learners achieving D or better in ordinary level English as a second language (at 9 of the 47 schools that include 12th grade)
DNEA MoE
35 OPM, GDQR, p60
36 MCA‐N, M&E Plan, Annex I, p3‐4
Compendium of Government Data Quality Findings & Recommendations
19
Review history: key findings & recommendations
The DNEA as a data source was reviewed in the GDQR (2011) and in the BAR II (2012). The
findings from the GDQR state simply that the DNEA data were of good quality with no
major concerns.37
In this second review of the DNEA, the key question of the review was whether the DNEA
has ensured that the exams used at grades 10 and 12 were comparable over time to ensure
consistency in the data. The outcome of the review showed that there was indeed an
equating process to ensure comparability of the grades. Thus, similar to the GDQR, no
significant issues were noted with the DNEA as a data source.38
Considerations going forward
There are no critical issues to follow‐up on with DNEA.
3.3. Education Administrative Data (Ministry of Education)
Overview of the data source
Administrative data from the Ministry of Education was used for several MCA‐N indicators.
The administrative data are generally routinely collected by processes already in place at the
MoE. The reviews conducted on these data were generally oriented towards understanding
the processes of data collection, rather than being motivated by a specific concern with the
data quality.
MCA‐N‐related indicators
Administrative data from the Ministry of Education (MoE) served as a data source on three
MCA‐N indicators that were included in data quality reviews. These indicators are listed
below:
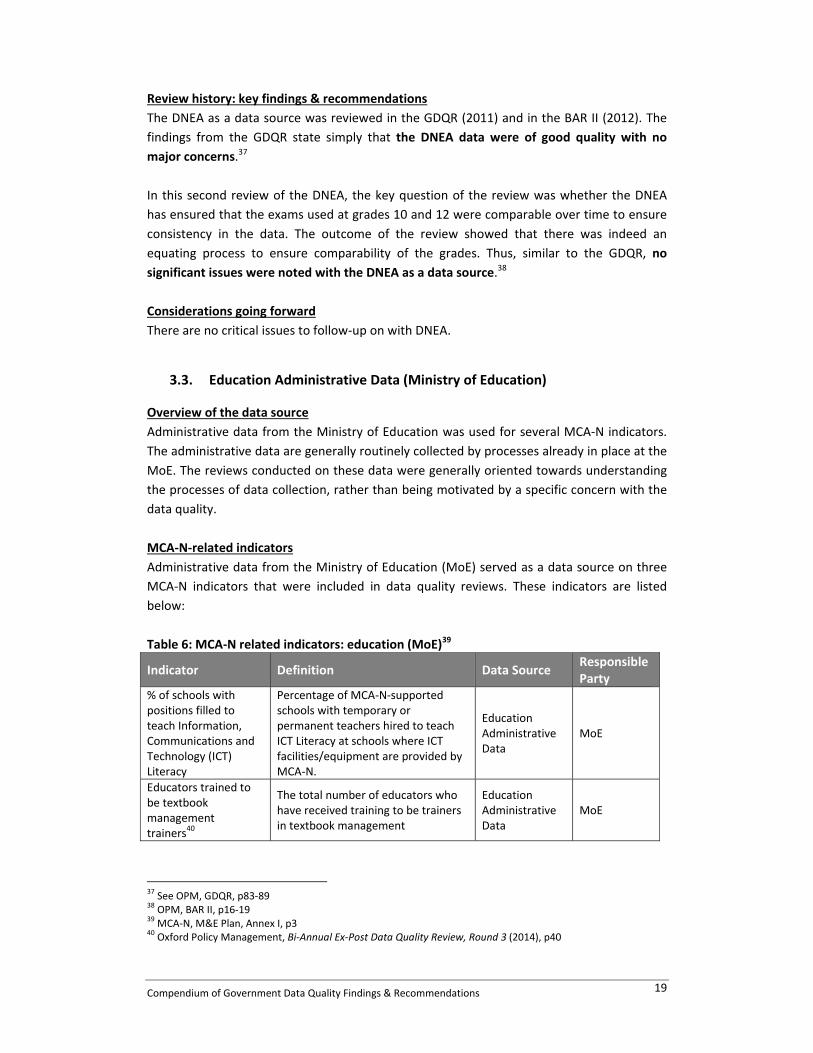
Table 6: MCA‐N related indicators: education (MoE)39
Indicator Definition Data Source Responsible Party
% of schools with positions filled to teach Information, Communications and Technology (ICT) Literacy
Percentage of MCA‐N‐supported schools with temporary or permanent teachers hired to teach ICT Literacy at schools where ICT facilities/equipment are provided by MCA‐N.
Education Administrative Data
MoE
Educators trained to be textbook management trainers40
The total number of educators who have received training to be trainers in textbook management
Education Administrative Data
MoE
37 See OPM, GDQR, p83‐89
38 OPM, BAR II, p16‐19 39 MCA‐N, M&E Plan, Annex I, p3 40 Oxford Policy Management, Bi‐Annual Ex‐Post Data Quality Review, Round 3 (2014), p40

Compendium of Government Data Quality Findings & Recommendations
20
Indicator Definition Data Source Responsible Party
Educators trained to be textbook utilisation trainers41
The total number of educators who have received training to be trainers in textbook utilisation
Education Administrative Data
MoE
Review history: key findings & recommendations
The first review of MoE as a data source dealt with it primarily in regards to EMIS. It
identified key capacity gaps as their largest constraint, as described above. The second
review – in BAR III – looked at all the indicators above – ICT positions and educators
trained.42
The BAR III report found that the data collected on the ICT positions indicator were poor,
due largely to the fact that it was seen as a once‐off indicator and thus no systematic data
collection processes were established or implemented.43
Findings from the BAR III report in regards to the educators trained indicators did not reveal
any significant challenges to the data quality itself, as these had been resolved
(discrepancies were identified between the organiser and trainer reports); minor issue was
taken with the indicator itself, which was seen to omit issues of quality relevance, and
usefulness of training.44
Considerations going forward
The data needed for any potential future monitoring of ICT positions filled to teach ICT
literacy should ensure that a more systematic processes be put in place than what had been
previously used. No specific issues require further monitoring for the educators trained in
textbook management or utilisation data.
3.4. Vocational Education Administrative Data & VETMIS (Namibia Training Authority)
Overview of the data source
The Namibia Training Authority (NTA) is mandated to manage the vocational training sector
in Namibia, endeavouring ‘to ensure a sustainable skills delivery system under which quality
vocational and technical skills are imparted to young Namibians through Vocational
Education and Training programmes which meet the current and emerging needs of
industries’.45 Given its mandate for managing the vocational skills training sector, the NTA
was able to provide routinely collected administrative data towards monitoring various
MCA‐N indicators.
41 OPM, BAR 3, p15 42 Oxford Policy Management, Bi‐Annual Ex‐Post Data Quality Review, Round 3 (2014), p15‐17, 40‐44 43 OPM, BAR III, p17
44 OPM, BAR III, p40‐44
45 http://www.nta.com.na/?page_id=246 (accessed 16 October 2014)

Compendium of Government Data Quality Findings & Recommendations
21
MCA‐N‐related indicators
The Namibia Training Authority (NTA) provided data for three MCA‐N indicators included in
the DQR process. They form a part of MCA‐N’s Competitive Grants for High Priority
Vocational Skills Training sub‐activity. These indicators are listed below:
Table 7: MCA‐N related indicators: education (NTA)46
Indicator Definition Data Source
Responsible Party
Vocational trainees assisted through the MCA‐N grant facility
47
The number of vocational trainees assisted through the MCA‐N grant facility
MCA‐N (NTA)
MCA‐N
Graduates from MCC‐supported education activities
The number of students graduating from the highest grade (year) for that educational level in MCC‐supported education schooling programs
NTA NTA
NQA‐accredited and/or NTA‐registered vocational training providers
The number of NQA‐accredited and/or NTA‐registered vocational training providers
NTA & NQA
NTA & NQA
Review history: key findings & recommendations
The Namibia Training Authority (NTA) was first included in a data quality review at the third
round (2014) of the bi‐annual reviews, which looked at two of the three indicators above,
excluding the vocational trainees. All three indicators were reviewed in the DQR Follow‐Up:
Quarter 19 report. The DQR Follow‐Up: VETMIS report looked only at VETMIS, which will
take over monitoring data from the various aspects of NTA as it is fully rolled out.
The largest single recommendation that came from the BAR III relating to MCC‐supported
graduates (other than internal reporting improvements) was that the training providers
working with MCA‐N be registered with NTA and accredited by NQA. Otherwise, data were
found to be sound and fit for purpose. Furthermore, the data relating to vocational training
providers (VTPs) and their registration with NTA or accreditation with NQA were also found
to be sound and fit for purpose. It was suggested to separate the indicator into each
registration and accreditation and to monitor both separately rather than in aggregate. This
was not deemed to be necessarily beneficial by MCA‐N and was thus not taken into
implementation.48
The DQR Follow‐Up: Quarter 19 report provided the first reporting on the ‘vocational
trainees assisted’ indicator. The indicator presented certain challenges around how ‘assisted’
was considered and whether trainees should be considered assisted only at the selection
point and before drop‐out, or only after the ‘drop‐out’ period. It was determined that
46 MCA‐N, M&E Plan, Annex I, p6 47 For this indicator, MCA‐N is listed is the primary data source and responsible party. However, NTA was consulted as a key stakeholder on this indicator as they provide the bulk of the data that goes into monitoring this data to MCA‐N, which is then compiled with additional data external to NTA for a cumulative indicator. 48 OPM, BAR III, p24‐40

Compendium of Government Data Quality Findings & Recommendations
22
assistance might still be considered even if a trainee drops out at a later point. Graduates
from MCC‐supported activities were also considered as well as NTA‐registered and NQA‐
accredited TPs, with no significant data challenges to these.49
The VETMIS review provided an insight into the development and functionalities of VETMIS
as a means of consolidating and monitoring the multitude of data that NTA is trying to
manage. However, due to critical capacity constraints, the full roll‐out of the system has
been slowed. NTA struggles to find adequate capacity to train TPs in the usage of the system
as well as to manage the system within NTA, and to ensure the completion of its full
development (several modules of the system still remain incomplete).50
The largest single challenge to the various indicators and their monitoring was that the NTA
often struggled to get accurate and timely data from the TPs at the reporting periods. This
was seen as primarily a capacity constraint at the TP level in effectively being able to gather
and compile data in a systematic and timely fashion, while similarly relating to capacity
constraints acknowledged at NTA, inhibiting the institution’s ability to build capacity at the
TP levels in order to bolster their overall data quality and reporting structures.
These capacity constraints also translate directly into the completion and roll‐out status of
VETMIS. NTA lacks critical capacity within NTA to manage the system, as well as at the TP
level to effectively implement the system (collect and enter data) at the local levels (with
serious follow‐on implications in terms of the NTA’s performance management capability).
Considerations going forward
The single most important component for further action is the completion of VETMIS,
through the building of the necessary capacity and prioritisation of related functions and
systems such as M&E. This relates to the full development of the system and its component
modules and its roll‐out to the local TP levels where the data will be collected and entered
on an on‐going basis. In addition, it will be important within NTA to manage the system on
an on‐going basis, such as ensuring timely data uploads, and the sound use of the data
itself for analysis and reporting.
49 Oxford Policy Management, Support for High Quality Data Report: selected indicators in ITT on completed Quarter 19 – DRAFT (2014), p11‐13 50 Oxford Policy Management, Follow‐Up Data Quality Review of Data Collection Systems: Vocational Education
and Training Management Information System (2014), p4, 11‐14

Compendium of Government Data Quality Findings & Recommendations
23
4. Tourism Indicators
MCA‐N’s Tourism Project has as its goal to ‘grow the Namibian tourism industry by
improving tourism management and increasing awareness of Namibia as a tourist
destination’.51 This compendium report provides an overview of the following data sources
reviewed for MCA‐N: the system for Arrivals Statistics (MET), Etosha National Park
administrative data (MET), Tourism Jobs Model (NTB), Google Analytics (NTB), and the Bed
Levy Statistics administrative data (NTB).
4.1. Foreign Arrival Records (Ministry of Environment and Tourism)
Overview of the data source
Tourism is a critical part of the Namibian economy, and the Ministry of Environment and
Tourism (MET) is tasked with promoting ‘biodiversity conservation in Namibia through the
sustainable utilisation of natural resources and tourism development’.52 Given the economic
importance of tourism to the Namibian economy, it is important to have ‘up‐to‐date, reliable
and comprehensive information on foreign visitors to Namibia’.53 In the development of the
MET’s tourism arrival statistics, MET collaborated with the Ministry of Home Affairs and
Immigration (MHAI) to support the data project, while MCA‐N provided additional technical
support.
MCA‐N‐related indicators
The Foreign Arrival Records at the Ministry of Environment and Tourism (MET) provided
data for four of the MCA‐N related indicators that have been included in previous reviews,
which are listed below:
Table 8: MCA‐N related indicators: tourism (Arrivals Statistics – MET)54
Indicator Definition Data Source Responsible Party
Leisure tourist arrivals The total number of leisure tourist arrivals recorded per calendar year
Foreign Arrival Records
MET
Tourist arrivals The total number of tourist arrivals recorded per calendar year
Foreign Arrival Records
MET
Leisure tourist arrivals from the North American market
The number of leisure tourist arrivals from the targeted North American market (United States and Canada) per year
Foreign Arrival Records
MET
Tourist arrivals from the North American market
The number of tourist arrivals from the targeted North American market (United States and Canada) per year
Foreign Arrival Records
MET
51 MCA‐N M&E Plan, Annex 4, p7 52 Ministry of Environment and Tourism, Statistical Report on Tourist Arrivals (2011), p5
53 MET, Statistical Report on Tourist Arrivals, 2011, p5
54 MCA‐N, M&E Plan, Annex I, p11‐14

Compendium of Government Data Quality Findings & Recommendations
24
Review history: key findings & recommendations
The indicators on tourist arrivals were reviewed in the GDQR.55 The review found that the
partners that collect data for these indicators – the MHAI and the Directorate of Tourism
and Gaming (within the MET) – had human capacity constraints, noted particularly for the
DoT. There were also much needed information systems upgrades in order to make the data
collection and entry not only more accurate and efficient, but also more reliable. Also, not all
border posts were covered by the computerised system used to capture information on
tourist entries and exits. Recommendations were therefore provided that these challenges
be addressed.56
Considerations going forward
Given the critical gaps in human capacity noted by the GDQR, particularly in the areas of
statistical training and data management, it is important for both the DoT and the MHAI to
develop and implement a capacity building plan tailored to the needs of each institution,
with an implicit assumption that they have the capacity to do so.
The review also noted a lack of adequate technological capacity to the arrivals statistics.
This took the form of insufficiently robust data back‐up. Hence, there remained a
considerable risk to data loss and corruption. It should be addressed through the
establishment of a reliable data management system, such as ACCESS or SPSS Data Builder.57
Finally, the computerised system used to capture tourist entries and exits should ultimately
be expanded to all border posts. This would allow for virtually 100% capture of tourist
movements.58 As a result, a much more accurate reflection on tourist arrivals in Namibia
would be ensured.
4.2. Etosha National Park Administrative Data (Ministry of Environment and Tourism)
Overview of the data source
While the data source discussed above (tourist arrivals) pertained to the significant share
that the tourism industry has in the Namibian economy, the Etosha National Park (ENP) has
possibly the largest share for single tourism destinations within the tourism industry. As
such, assistance to ENP formed a significant component of MCA‐N’s Tourism Project. Its
administrative data provided input to several indicators. It was also the most reviewed data
source under MCA‐N’s data quality reviews.
55 See OPM, GDQR, p90‐104 56 OPM, GDQR, p103‐104 57 OPM, GDQR, p103‐104
58 At the time of the GDQR, it was noted that approximately 90% of border posts in Namibia possessed a
computerised data system.
Compendium of Government Data Quality Findings & Recommendations
25
MCA‐N‐related indicators
The Etosha National Park’s administrative data system provided data for five MCA‐N
indicators included in data quality reviews, as tabulated below:
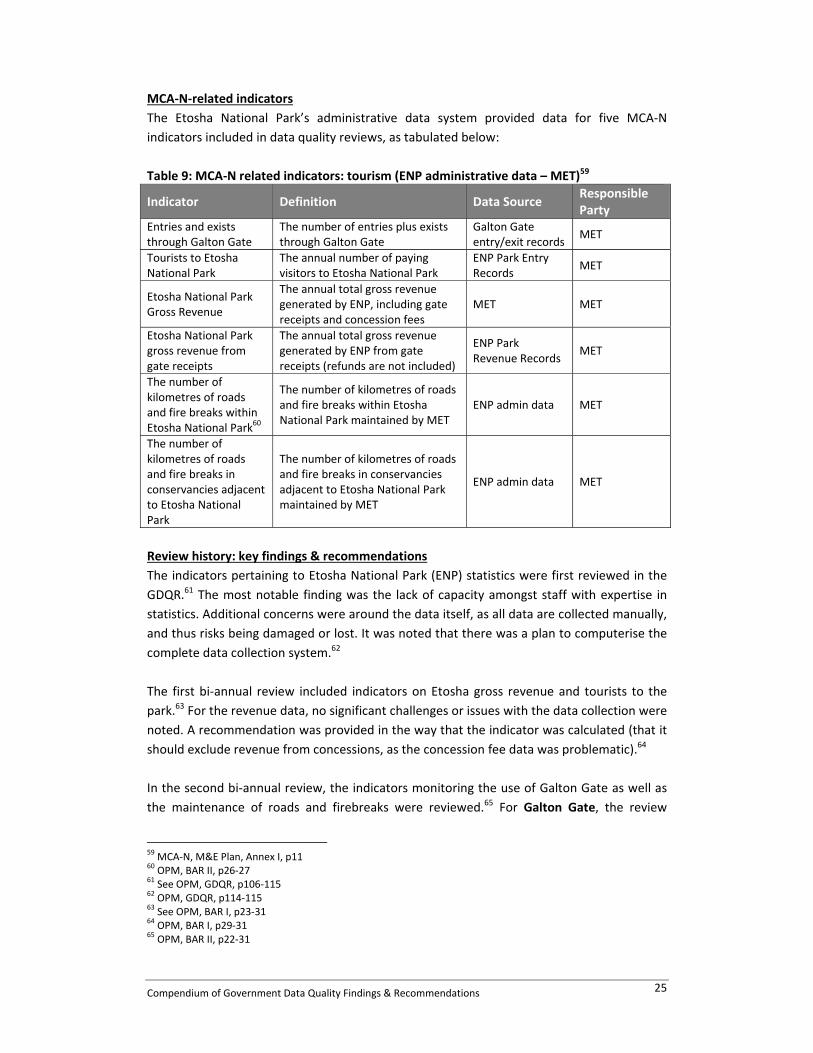
Table 9: MCA‐N related indicators: tourism (ENP administrative data – MET)59
Indicator Definition Data Source Responsible Party
Entries and exists through Galton Gate
The number of entries plus exists through Galton Gate
Galton Gate entry/exit records
MET
Tourists to Etosha National Park
The annual number of paying visitors to Etosha National Park
ENP Park Entry Records
MET
Etosha National Park Gross Revenue
The annual total gross revenue generated by ENP, including gate receipts and concession fees
MET MET
Etosha National Park gross revenue from gate receipts
The annual total gross revenue generated by ENP from gate receipts (refunds are not included)
ENP Park Revenue Records
MET
The number of kilometres of roads and fire breaks within Etosha National Park
60
The number of kilometres of roads and fire breaks within Etosha National Park maintained by MET
ENP admin data MET
The number of kilometres of roads and fire breaks in conservancies adjacent to Etosha National Park
The number of kilometres of roads and fire breaks in conservancies adjacent to Etosha National Park maintained by MET
ENP admin data MET
Review history: key findings & recommendations
The indicators pertaining to Etosha National Park (ENP) statistics were first reviewed in the
GDQR.61 The most notable finding was the lack of capacity amongst staff with expertise in
statistics. Additional concerns were around the data itself, as all data are collected manually,
and thus risks being damaged or lost. It was noted that there was a plan to computerise the
complete data collection system.62
The first bi‐annual review included indicators on Etosha gross revenue and tourists to the
park.63 For the revenue data, no significant challenges or issues with the data collection were
noted. A recommendation was provided in the way that the indicator was calculated (that it
should exclude revenue from concessions, as the concession fee data was problematic).64
In the second bi‐annual review, the indicators monitoring the use of Galton Gate as well as
the maintenance of roads and firebreaks were reviewed.65 For Galton Gate, the review
59 MCA‐N, M&E Plan, Annex I, p11
60 OPM, BAR II, p26‐27
61 See OPM, GDQR, p106‐115 62 OPM, GDQR, p114‐115 63 See OPM, BAR I, p23‐31
64 OPM, BAR I, p29‐31
65 OPM, BAR II, p22‐31
Compendium of Government Data Quality Findings & Recommendations
26
noted frequent opportunity for errors in the collection and transmission of data, as this is
done manually and telephonically. It was also noted that there were certain inconsistencies
in the forms used at Galton with those at other gates, presenting an inconsistent method of
gathering data.66 For the roads and firebreaks indicators, the data were found to be ‘dubious
in quality and the indicator values have a variable meaning as the need for maintenance
fluctuates with seasonality and usage’.67 A considerably more systematic and scientific
system for measuring data for this indicator was noted as being needed, and it was
recommended that the indicator not be used for MCA‐N’s monitoring purposes. It was
subsequently dropped from the M&E Plan.
The indicator on Galton Gate entries was reviewed again in BAR III, which found that the
same system and forms as discussed in the previous review were still in use.68 In particular,
the Yellow Book (shown in Figure 1 below and in Annex 3, Figure 2) is not suited to a gate
that would see several hundred tourists pass through it each day.
The indicator on tourists to Etosha was also included in the BAR III. It found the data to be
prone to errors as all the data are entered at least twice (from entry at the gate to
registering at the reception), and that these data are not easily reconciled with exiting
tourists, due to the manual nature of the process.69
The BAR III also reviewed the indicator on ENP gross revenue from gate receipts.70 The
review found an elaborate process in place to count money on a daily basis, rendering the
data reliable and of a high quality. The only exception is that Galton Gate follows a different
and less systematic method, which needs to be adapted to the same method used
elsewhere in the park.
The DQR Follow‐up: Quarter 19 report provided a final look at ENP as a data source.71 For
Galton Gate, the same system as what is reported on in BAR I and III was found to still be
used for monitoring visitors through the gate. This presented challenges for consistency
when moving between the white forms and the Yellow Book.72 However, in addition to the
problematic forms themselves, the reporting mechanism was found to be feeble: weekly
reporting does not precisely align with monthly reports. It also does not align with monthly
reports provided by the Warden of the Western Park to the Chief Warden. As a result of this
assessment, the DQR Team conducted a review of the numbers reported for Q17‐Q19
(October 2013‐June 2014) in order to get more accurate figures.
66 See Annex 3, Figure 2 and 3 for examples of the data collection forms
67 OPM, BAR II, p30
68 OPM, BAR III, p44‐48 69 OPM, BAR III, p49‐51 70 OPM, BAR III, p52‐56
71 See OPM, Q19, p14‐17, 39‐52
72 OPM, Q19, p39‐44

Compendium of Government Data Quality Findings & Recommendations
27
Figure 1: Galton Gate – Yellow Book & white forms
Source: Q19
In monitoring the number of tourists to ENP, these figures were found to be based on
revenue figures (number of permits) rather than actual tourist numbers.73 This does not
provide solid data for tourist numbers, as this method can present a false reality (i.e. tourists
that travel through a tour company who paid in Windhoek would not be counted; a tourist
that stays for 5 days is counted 5 times, rather than as a single tourist).
Revenue figures from gate receipts were similarly diverse. The Otjovasandu office (Galton
Gate) used several forms to record revenue: a book with blue pages with every transaction
recorded, the Monthly Report, and a Covering Advice Book.74 All the gates use a manual
calculation system, which is highly vulnerable to errors and inconsistencies in the time
periods that are reported on.
A key recommendation for Galton Gate is that it moves to the same system as that used by
the other gates in Etosha to count tourists. This will help to ensure consistency in data
collection and comparability across all data. In addition to the form discrepancies at Galton
Gate, the reporting mechanism was not found to be systematic and therefore prone to
errors. This needs to be standardised across all the gates with a systematic format. Tourist
figures are currently based on revenue figures, which do not provide solid data for tourist
figures.
73 OPM, Q19, p45‐46
74 OPM, Q19, p46‐52
Compendium of Government Data Quality Findings & Recommendations
28
Revenue figures for the park are monitored and calculated manually. This is highly prone to
errors, as the DQR Team discovered while assessing records in field. The reporting periods
are also at times inconsistent, where a month’s ending point is not precisely followed and
certain days overlap between two months, presenting over‐ or under‐counting. Galton Gate
also needs to come into the same system as that used throughout the rest of the park for
revenue monitoring.
Finally, a computerised system to monitor tourist entries and exits, as well as revenue, is
recommended throughout the park. Such a system would offer the most systematic,
accurate and reliable data possible for all the types of data that are reported on for
monitoring the use of and revenue generated by ENP.
Considerations going forward
Most of the issues and challenges encountered in the earlier data quality reviews with data
collection in ENP remained consistent throughout the DQR period (2010‐2014). This relates
especially to revenue from gate receipts, tourists entering the park, and Galton Gate specific
tourist monitoring.
As such, an improved system is still needed for monitoring the number of tourists to ENP.
Such a system could also be used to track revenue. A computerised system implemented
across the park would standardise the current data collection systems. This would ensure
much higher quality and accuracy of data collection and reporting, while also offering
opportunity for instant analysis and reporting, quality checks and transparency. But the
implementation of such a system would need to be accompanied by adequate capacity
building to ensure its proper usage.
4.3. Tourism Jobs Model (Namibia Tourism Board)
Overview of the Data Source
The Namibia Tourism Board is the Namibia Government agency responsible for ‘bring
together both the private and public sector in implementing the national policy on
tourism’.75 As such, the NTB’s mission is the following: ‘to market and develop tourism to
and within Namibia that exceeds our visitors’ experience expectations, delivers value to
stakeholders, improves the living standards and sustains the cultural values and way of life
of our people, and enables broad based participation of Namibians in the tourism
industry.’76 The NTB provided data through its tourism jobs model and Google Analytics to
MCA‐N‐related indicators.
For data on jobs created in the tourism sector, the NTB uses data from several sources,
including the Namibia Statistics Agency, the Central Bank, and the Ministry of Finance. As
75 http://www.namibiatourism.com.na/pages/About+NTB (accessed 19 October 2014)
76 http://www.namibiatourism.com.na/pages/About+NTB (accessed 19 October 2014)

Compendium of Government Data Quality Findings & Recommendations
29
such, one key data source for the jobs model is the Namibian Labour Force Survey, which
would prove problematic for the related MCA‐N indicator (see section 2.2).
MCA‐N‐related indicators
The Tourism Jobs Model from the NTB provided data for the following MCA‐N indicator:
Table 10: MCA‐N related indicators: tourism (jobs model – NTB)77
Indicator Definition Data Source
Responsible Party
Jobs created through tourism
The number of direct jobs existing in the last 12 months within the tourism industry by companies involved in travel and tourism activities, such as hospitality, lodging, food service, equipment rental, guiding, sport hunting, airlines, etc., as defined by NTB
Tourism Jobs Model
NTB
Review history: key findings & recommendations
The BAR I report reviewed the ‘jobs created through tourism’ indicator under NTB.78 The review found that the data for this draws heavily from the NLFS; and as noted earlier in this
report, the NLFS has had considerable scrutiny around methodological approaches that it
undertook and the exclusion of subsistence farmers in its employment considerations. In
addition to these specific challenges, the indicator itself would be similarly flawed even if the
methodological issues with the NLFS were resolved due to the lack of comparability over
time. Thus the indicator was seen as sufficiently sound, except for its basis in the NLFS. It
was recommended to be dropped as a MCA‐N indicator. 79 Considerations going forward
For the ‘jobs created’ indicator, the extent to which the data remains based largely on the
NLFS should be considered; and to that degree, the quality and comparability of the NLFS to
that of previous years should be considered for any comparability of the data. The current
editions of the NLFS (2012 and later) are considered methodologically sound, whereas
previous rounds, (namely 2004, 2008) are not. Hence, the indicator could be based on the
latest rounds of NLFS.
4.4. Google Analytics (Namibia Tourism Board)
Overview of the data source
The NTB website is a key portal both to tourists seeking information about Namibia, as well
as commercial operators in Namibia seeking to promote their products to the international
tourism market. Behind the NTB website, Google Analytics provides data on how the
website is used and accessed, with detailed data on numbers of users, unique users, the
location of users, time spent on the website, and other forms of detailed site usage data.
77 OPM, BAR I, p16‐17
78 See OPM, BAR I, p16‐20
79 OPM, BAR I, p20

Compendium of Government Data Quality Findings & Recommendations
30
MCA‐N‐related indicators
The NTB website, using Google Analytics, provided data to support a total of 4 MCA‐N‐
related and reviewed indicators, which are tabulated below.
Table 11: MCA‐N related indicators: tourism (Google Analytics – NTB)80
Indicator Definition Data Source
Responsible Party
Unique visits on NTB website
The number of unique visits on NTB website Google Analytics
NTB
Unique visits on NTB website from the North American market
The number of unique visits on NTB website from the North American market (United States and Canada)
Google Analytics
NTB
Average time spent on the NTB website
The average length of time spent on the NTB website per visit
Google Analytics
NTB
Registered users of the NTB website
The number of visitors to the NTB website who enter the website and then register as a user (to receive updates)
Google Analytics
NTB
Review history: key findings & recommendations
Google Analytics for the NTB website was reviewed in the BAR I and Q19 reports.81 For the
BAR I report, the data were generally found to be reliable and fit for purpose. The data are
drawn primarily from Google Analytics, which is robust and reliable. The only challenges in
the process of the review was more definitional, relating to how website visits are identified
(cookies on a computer mitigate over‐counting while multiple browser usage would be
registered under unique visits).82
In Q19, the NTB website indicators were again reviewed. The data were once again found to
be robust, given its basis in Google Analytics, which empirically measures the site’s usage.83
The only divergence in the findings related to registered users of the website. The original
intention of the indicator was to measure tourists who sign up to receive updates on tourism
in Namibia. Instead, it more recently began to monitor commercial users that sign up to
have their commercial products (i.e. tours, travel packages, etc) listed and advertised on the
NTB website.84 As a result, no data were available for consistent monitoring purposes on the
indicator after May 2013.
Considerations going forward
Consistency is needed in the use of the ‘registered users’ indicator. The meaning of the
indicator needs to remains constant, its data source reliable and data providers confident in
their understanding of the indicator. As it stands, the data cannot be of use for monitoring
80 MCA‐N, M&E Plan, Annex I, p14 81 See OPM BAR I, p32‐35 and Q19, p17‐21 82 OPM, BAR I, p32‐35
83 See Annex 3, Figure 6, for an overview of Google Analytics’ features available for the website’s monitoring.
84 OPM, Q19, p20‐21

Compendium of Government Data Quality Findings & Recommendations
31
that indicator. In moving forward, if tourist users of the NTB website are still of interest to
the NTB and the broader tourism industry, the website needs to be rebuilt to incorporate
the capacity to allow tourists to register as users, rather than being oriented towards
commercial usage of the site.
4.5. Bed Levy Statistics administrative data (Namibia Tourism Board)
Overview of the data source
As mentioned above, the NTB’s mandate is to regulate the tourism industry in Namibia and
promote the country as a tourism destination. Given this mandate, the NTB collects monthly
levies and other related statistics through a Tourism Levy Return and Statistics Form.85
Establishments registered with the NTB are required to complete this form along with a
proof of payment of their respective levy by the end of each quarter.86 This data collection
process, therefore, forms the basis for data on the Bed Levy statistics.
Table 12: MCA‐N related indicators: tourism (bed levy statistics – NTB)87
Indicator Definition Data Source Responsible Party
Bed levy income Total bed levies collected Administrative data (NTB)
NTB
Review history: key findings & recommendations
The GDQR provided the first review of the bed levy statistics.88 The production of statistics
for this indicator relied on NTB administrative data, and the NTB noted considerably limited
human resources in this area, particularly with statistics. A further complicating element
noted in the review was the fact that the bed levy statics relates largely to financial matters
for the industry. The data for this are collected and kept separately from the statistics and
research unit. The disconnect between the two units prevents the research unit from
helping oversee quality standards for the data. A further issue was a noted discrepancy
between the forms used to collect data from registered establishments and the actual levy
fees that were received.
As a result, recommendations from the review were oriented towards increasing the
agency’s capacity, particularly in the area of statistics and data management. In addition, the
relationship between the research unit and the financial unit that gathers data on the bed
levy should be strengthened. It was also noted that the NTB should more regularly update its
list of registered establishments to identify those that have closed. This would ensure a
higher validity in response rates for their data. It would also show greater alignment in data
on establishments that are registered and those paying the levy.89
85 Please see Annex 3, Figure 5, for a sample of the form. 86 OPM, GDQR, p116 87 OPM, BAR I, p20
88 See OPM, GDQR, p116‐126
89 OPM, GDQR, p126
Compendium of Government Data Quality Findings & Recommendations
32
The second review – in BAR I – summarised the issue that NTB was legislatively restricted
from being able to penalise tourism establishments that do not comply with the necessary
levy fees as a part of their registration. At the time of the review, legislation was awaiting
approval that would allow the NTB to send inspectors to check establishments and
determine compliance and impose fines as punishment for non‐compliance.90 Ultimately,
due to the high levels of suspected underreporting, as well as the quality issues noted in the
GDQR, it was recommended that the indicator be dropped from MCA‐N’s monitoring plan.
Considerations going forward
Per the recommendation noted above the bed levy indicator was dropped for MCA‐N. If it is
to be used by NPC M&E or other entities as part of a monitoring framework, several points
should be taken into account. Firstly, it needs to be determined, whether the legislative
possibilities noted during the BAR I are in place now. They would allow the NTB greater
power to enforce compliance amongst registered establishments. A second point is to
determine what kind of support is needed to increase the overall capacity of the NTB to
manage statistics and data in a way that ensures minimal quality standards for monitoring
and reporting purposes. Moreover, there needs to be data management capacity to ensure
that the various data collected by the NTB are kept secure and managed across the
institution’s departments.
90 OPM, BAR I, p21‐22

Compendium of Government Data Quality Findings & Recommendations
33
5. Agriculture Indicators
The data sources used for MCA‐N’s Agriculture Project included in the DQRs related to
measuring change supplemented by MCA‐N’s efforts to contribute to the agricultural sector
in Namibia. These data sources include the Directorate of Veterinary Services (DVS) in the
Ministry of Agriculture, Water and Forestry (MAWF), the Meat Corporation of Namibia
(Meatco), and the Namibia Communal Land Administration System (NCLAS) in the Ministry
of Lands and Resettlement (MLR). The data sources were used i) to ‘capture change in the
average value of slaughtered cattle (by observing the value of sales of slaughtered cattle and
the number of cattle slaughtered in the NCAs)’; ii) to measure ‘change in overall animal
health (by observing the supply of animal health services and diseases/infections
diagnosed)’;91 and iii) to measure changes in parcel registration, perceptions about land
tenure, benefits to households or community groups.’92
5.1. System for Livestock Health Statistics (Ministry of Agriculture, Water and Forestry)
Overview of the data source
The Directorate of Veterinary Services (DVS) falls under the purview of the Ministry of
Agriculture, Water and Forestry (MAWF), with a mission ‘to maintain and promote animal
health, production and reproduction, and to assure safe and orderly marketing of animals
and animal products through animal disease control’.93 The DVS compiles and manages data
on cattle diseases, which is used for the system for Livestock Health Statistics.
MCA‐N‐related indicators
The system for Livestock Health Statistics at the DVS served as a data source for the
following MCA‐N indicators:
Table 13: MCA‐N related indicators: agriculture (DVS – MAWF) 94
Indicator Definition Data Source
Responsible Party
Cattle inspections
Number of cattle inspections (on unique cattle) in the NCAs by a DVS health technician during the last 12 month reporting period
DVS MAWF
Cattle diseases
Number of cattle infections diagnosed which include foot and mouth disease, lung sickness (contagious bovine pleural pneumonia), lymph and skin disease, black quarter, botulism and rabies during the last 12 month reporting period
DVS MAWF
91 OPM, GDQR, p128 92 MCA‐N, M&E Plan, p21
93 http://www.mawf.gov.na/Directorates/VeterinaryServices/veterinary.html (accessed 20 October 2014)
94 OPM, BAR II, p42

Compendium of Government Data Quality Findings & Recommendations
34
Review history: key findings & recommendations
The GDQR provided the first review of the DVS as a data source, looking at both indicators
listed above.95 The review found that the DVS is considerably constrained by inadequate
human capacity. At the time of the review, data capture, processing and analysis relied on a
single person. The GDQR therefore strongly recommended that the data skills needed at DVS
be decentralised amongst more staff than just the single person.96
Furthermore, on the indicator for cattle inspections the indicator should be changed. The
cattle are not all systematically inspected as this would be impossible. The indicator should
change from monitoring unique cattle inspections to using cattle vaccinated as a proxy to
the inspection indicator. This format is more reliable as data on specific vaccinations can be
monitored. This should in fact be used as a ratio (cattle vaccinated against those not
vaccinated) rather than simply a number of vaccinations.97
The first bi‐annual review also assessed the indicators on cattle inspections and cattle
diseases. Echoing the findings from the GDQR on the cattle inspection indicator, the review
showed that the data are unreliable as it stood with further vagaries around how a cattle
‘inspection’ is defined in the communal areas. Thus vaccinations should be used in the
stead of inspections.
For cattle diseases, the indicator was found to pose problems around interpretation: an
increase in cattle disease could mean that the DVS staff is increasing and able to diagnose
more cattle, or that there is in fact a higher prevalence of disease. As a result, it was
recommended that the indicator should not be used to monitor MCA‐N specific success on
this project. Instead the indicator should be retained for internal purposes of monitoring
progress. The data were seen to still offer useful evidence on outbreaks of diseases, etc.
Thus the indictor was dropped from the MCA‐N logframe, but still provides valuable
information for DVS.98
Considerations going forward
Future attention to this data source should revolve around the DVS’ capacity to manage and
process data. The constraints noted in the DQR’s point to the much‐needed improvements
in this area. Contingency plans should be in place to manage these challenges, as well as
training plans to mitigate them.
95 See OPM, GDQR, p126‐137 96 OPM, GDQR, p137
97 OPM, GDQR, p137
98 OPM, BAR I, p42‐48

Compendium of Government Data Quality Findings & Recommendations
35
5.2. Formal Cattle Slaughter Data (Meat Corporation of Namibia)
Overview of the data source
The Meat Corporation of Namibia (Meatco) is ‘a meat processing and marketing
organisation, serving markets locally and internationally on behalf of Namibian farmers’.99 It
is considered a state‐owned enterprise and, as it is the largest single entity managing large‐
scale commercial processing of meat in Namibia, its data on cattle slaughter was included to
support MCA‐N’s Agriculture Project and its activities aimed at enhancing the productivity of
the livestock sector in Namibia.
MCA‐N‐related indicators
The data provided by the formal cattle slaughter database from Meatco underpinned the
monitoring of the following indicators:
Table 14: MCA‐N related indicators: agriculture (Meatco)100
Indicator Definition Data Source Responsible Party
Cattle slaughtered in the formal market
Number of cattle slaughtered in the formal market
Meatco Meatco
Sales of slaughtered cattle paid to farmers
Value of sales of slaughtered cattle paid to farmers by Meatco
Meatco Meatco
Review history: key findings & recommendations
The GDQR found that the overall quality of Meatco’s data on cattle slaughter is
‘satisfactory’.101 However, in considering the data for MCA‐N’s monitoring purpose and the
indicator specifically, Meatco’s data reflects Meatco’s formal slaughters only. This does not
capture other formal slaughter occurring in Namibia, such as at other more local abattoirs
not owned by Meatco, nor the expansive informal sector.102 The indicator was subsequently
dropped from MCA‐N’s monitoring plan.
Considerations going forward
There are no further action considerations going forward, except for institutions like NPC
M&E to note the above findings when considering Meatco‐sourced indicators for possible
inclusion in results frameworks in the future.
99 http://www.meatco.com.na/ (accessed on 20 October 2014) 100
OPM, GDQR, p142 101
See OPM, GDQR, p138‐144 102
OPM, GDQR, p143‐144

Compendium of Government Data Quality Findings & Recommendations
36
5.3. Namibia Communal Land Administration System (Ministry of Lands and Resettlement)
Overview of the data source
The Namibia Communal Land Administration System (NCLAS) sits within the Ministry of
Lands and Resettlement (MLR). The NCLAS can be used in the process of managing land
rights, including generating village maps, applicant lists that can be displayed during the
notice period, vital information used for approval of applicants, and printing certificates.103
MCA‐N‐related indicators
The NCLAS and the MLR provides data for two key indicators for MCA‐N’s efforts to support
reducing the amount of time required to register land, as listed below:
Table 15: MCA‐N related indicators: agriculture (NCLAS – MLR)104
Indicator Definition Data Source
Responsible Party
Average number of days to register a land right
The average length of time (in days) it takes to register a customary land right from when an application is submitted to the TA until the certificate is issued by the CLB
NCLAS MLR
Percentage of rights registered
The number of customary rights that are registered in a given quarter expressed as a percentage of the number of pending applications at that point
NCLAS MLR
Review history: key findings & recommendations
The NCLAS was reviewed in the BAR II, within the broader framework of the indicators and
their pertinence to MCA‐N’s intervention.105 With regards to the NCALS specifically, though,
it was noted as capturing various data points along the land rights application process, such
as the Traditional Authority (TA) approval dates. However, it was also lacking some
important information, such as when land parcels are mapped and entered into NCLAS, and
when certificates are delivered to the TAs for owners to pick up.106 At the time of the review,
the NCLAS was undergoing a revision, which is expected to integrate the tracking of
applications.107
Considerations going forward
Ultimately, the most important point on this data source is the further development and
implementation of the NCLAS. At the time of the latest data quality review, the system’s
revised development had not yet been completed. The gaps noted above in the land rights
application should be addressed in the NCLAS for accurate monitoring of the process, such
that each point in the process is monitored.
103 OPM, BAR II, p34 104 OPM, BAR II, p31 105
See OPM, BAR II, p31‐38 106
See Annex 3, Figure 7, for a poster by MLR that communicates the process around land registration 107
OPM, BAR II, p37

Bi‐Annual Ex‐Post Data Quality Review 37
Annex 1: Data sources and corresponding reviews
Table 16: Data source and corresponding reviews
Data sources
Data quality reviews
GDQR (2011)
BAR I (2012)
BAR II (2012)
BAR III (2014)
EMIS (2014)
VETMIS (2014)
Q19 (2014)
Goal Namibia Household Income and Expenditure Survey (Namibia Statistics Agency [NSA]) √
Namibia Labour Force Survey (Namibia Statistics Agency [NSA]) √ √
Education Education Management Information System (Ministry of Education [MoE]) √ √ √
Directorate of National Examinations and Assessment (Ministry of Education [MoE]) √ √
Admin data (Ministry of Education [MoE]) √
Admin data (Namibia Training Authority [NTA]) √ √ √
Tourism Foreign Arrivals Records (Ministry of Environment and Tourism [MET]) √
Etosha National Park admin data (Ministry of Environment and Tourism [MET]) √ √ √ √ √
Tourism Jobs Model (Namibia Tourism Board [NTB]) √
Google Analytics (Namibia Tourism Board [NTB]) √ √
Bed Levy Statistics (Namibia Tourism Board [NTB]) √ √
Agriculture System for Livestock Health Statistics (Ministry of Agriculture, Water and Forestry [MAWF]) √ √
Formal Cattle Slaughter Data (MEATCO) √
Namibia Communal Land Administration System (NCLAS) (Ministry of Lands and Resettlement [MLR]) √

Bi‐Annual Ex‐Post Data Quality Review
Annex 2: List of documents consulted
International Monetary Fund, Data Quality Assessment Framework (2012) Meat Corporation of Namibia: http://www.meatco.com.na/ (accessed on 20 October 2014) Ministry of Agriculture, Water and Forestry: http://www.mawf.gov.na/Directorates/VeterinaryServices/veterinary.html (accessed 20 October 2014) Ministry of Environment and Tourism, 2011, Statistical Report on Tourist Arrivals Millennium Challenge Account Namibia, 2014, Indicator Tracking Tables of July and September 2014 Millennium Challenge Account Namibia, 2014, Monitoring and Evaluation Plan National Examination and Assessment: http://www.dnea.gov.na/en (accessed 15 October 2014) Namibia Statistics Agency, 2012, Namibia Household Income and Expenditure Survey 2009/2010 Namibia Statistics Agency, Namibia Labour Force Survey 2004 Namibia Statistics Agency, 2014, Namibia Labour Force Survey 2013 Report Namibia Training Authority: http://www.nta.com.na/?page_id=246 (accessed 16 October 2014) Namibia Tourism Board: http://www.namibiatourism.com.na/pages/About+NTB (accessed 19 October 2014) Oxford Policy Management, 2011, Government Data Quality Review Report Oxford Policy Management, 2012, Bi‐Annual Ex‐Post Data Quality Review, Round 1 Oxford Policy Management, 2012, Bi‐Annual Ex‐Post Data Quality Review, Round 2 Oxford Policy Management, 2014, Bi‐Annual Ex‐Post Data Quality Review, Round 3 Oxford Policy Management, 2014, Follow‐Up Data Quality Review of Data Collection Systems: Vocational Education and Training Management Information System (VETMIS) Oxford Policy Management, 2014, Support for High Quality Data Reporting: selected indicators in ITT on completed Quarter 19 – DRAFT United Nations, Fundamental Principles of Official Statistics (1994)
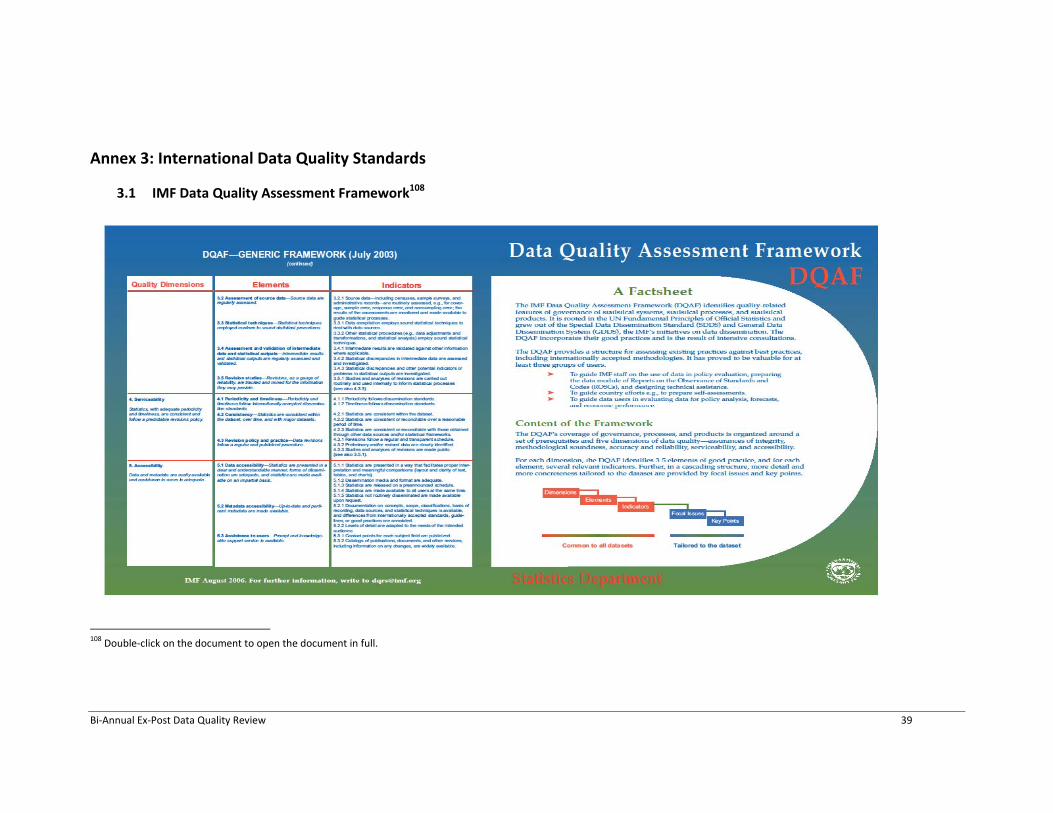
Bi‐Annual Ex‐Post Data Quality Review 39
Annex 3: International Data Quality Standards
3.1 IMF Data Quality Assessment Framework108
108
Double‐click on the document to open the document in full.

Bi‐Annual Ex‐Post Data Quality Review
3.2 UN Fundamental Principles of Official Statistics

Compendium of Government Data Quality Findings & Recommendations
41
Annex 4: Supporting documentation

Bi‐Annual Ex‐Post Data Quality Review 42
Figure 2: Visitor data record sheet (Yellow Book) – Galton Gate
Source: OPM, BAR II

Bi‐Annual Ex‐Post Data Quality Review 43
Figure 3: Visitor data record sheet (white form) – Anderson Gate
Source: OPM, BAR II

Bi‐Annual Ex‐Post Data Quality Review
Figure 4: Covering Advice, 23 May 2014
Source: OPM, Q19
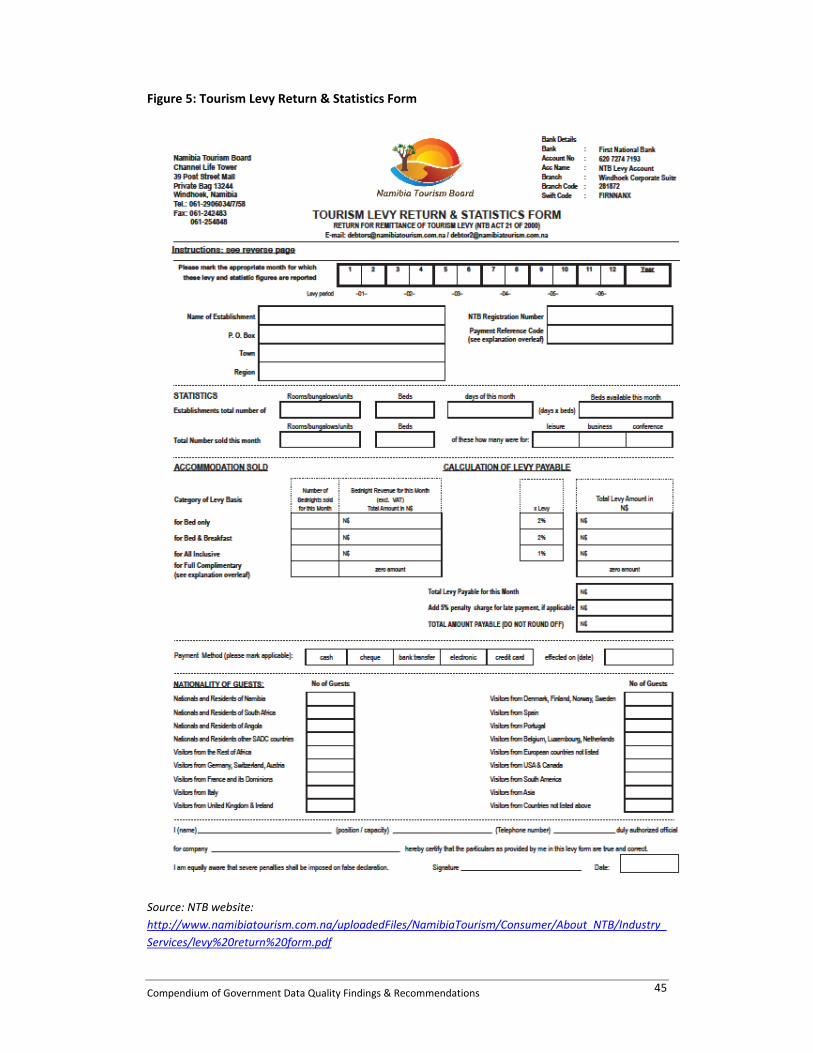
Compendium of Government Data Quality Findings & Recommendations
45
Figure 5: Tourism Levy Return & Statistics Form
Source: NTB website:
http://www.namibiatourism.com.na/uploadedFiles/NamibiaTourism/Consumer/About_NTB/Industry_
Services/levy%20return%20form.pdf

Compendium of Government Data Quality Findings & Recommendations
46
Figure 6: Google Analytics – visits to NTB website (sample taken from Oct‐Dec 2013)
Source: OPM, Q19

Compendium of Government Data Quality Findings & Recommendations
47
Figure 7: Poster by MLR to communicate the process around land registration
Source: OPM, BAR II
Recommended


![[GUTS-RS] World Quality Report 2014-15 Key Findings](https://img.dokumen.tips/doc/110x75/55a638de1a28ab761e8b47a9/guts-rs-world-quality-report-2014-15-key-findings.jpg)