Gibson County
GIBSON COUNTY, INDIANA AND INCORPORATED AREAS
COMMUNITY COMMUNITY NAME NUMBER *FORT BRANCH, TOWN OF 180452 FRANCISCO, TOWN OF 180336 GIBSON COUNTY
(Unincorporated Areas) 180434 *HAUBSTADT, TOWN OF 185252 HAZLETON, TOWN OF 180327 *MACKEY, TOWN OF 185251 *OAKLAND, CITY OF 180072 *OWENSVILLE, TOWN OF 185253 PATOKA, TOWN OF 180340 PRINCETON, CITY OF 180073 *SOMERVILLE, TOWN OF 185250 *No Special Flood Hazard Area
PRELIMINARY:
Federal Emergency Management Agency
FLOOD INSURANCE STUDY NUMBER
18051CV000A
NOTICE TO FLOOD INSURANCE STUDY USERS
Communities participating in the National Flood Insurance Program have established repositories of
flood hazard data for floodplain management and flood insurance purposes. This Flood Insurance
Study (FIS) report may not contain all data available within the Community Map Repository. Please
contact the Community Map Repository for any additional data.
The Federal Emergency Management Agency (FEMA) may revise and republish part or all of this
FIS report at any time. In addition, FEMA may revise part of this FIS report by the Letter of Map
Revision process, which does not involve republication or redistribution of the FIS report. Therefore,
users should consult with community officials and check the Community Map Repository to obtain
the most current FIS report components.
Selected Flood Insurance Rate Map panels for this community contain information that was
previously shown separately on the corresponding Flood Boundary and Floodway Map panels (e.g.,
floodways, cross sections). In addition, former flood hazard zone designations have been changed as
follows:
Old Zone: New Zone:
A1 through A30 AE
B X
C X
Initial Countywide FIS Effective Date: To be Determined
i
TABLE OF CONTENTS
Page
1.0 INTRODUCTION 1
1.1 Purpose of Study 1
1.2 Authority and Acknowledgments 2
1.3 Coordination 2
2.0 AREA STUDIED 3
2.1 Scope of Study 3
2.2 Community Description 4
2.3 Principal Flood Problems 5
2.4 Flood Protection Measures 6
3.0 ENGINEERING METHODS 7
3.1 Hydrologic Analyses 7
3.2 Hydraulic Analyses 8
3.3 Vertical Datum 10
4.0 FLOODPLAIN MANAGEMENT APPLICATIONS 10
4.1 Floodplain Boundaries 11
4.2 Floodways 11
5.0 INSURANCE APPLICATION 15
6.0 FLOOD INSURANCE RATE MAP 16
7.0 OTHER STUDIES 18
8.0 LOCATION OF DATA 18
9.0 BIBLIOGRAPHY AND REFERENCES 18
FIGURES
Figure 1 - Floodway Schematic 13
ii
TABLES
Table 1 – Scope of Study 4
Table 2 – Population of Incorporated Cities and Towns in Gibson County 5
Table 3 - Flood Crest Elevations (Pigeon Creek near Fort Branch) 5
Table 4 – Flood Crest Elevations (White River at Hazleton) 6
Table 5 – Flood Crest Elevations (Patoka River near Princeton) 6
Table 6 – Summary of Discharges 7
Table 7 – Channel and Overbank Roughness Factors 9
Table 8 – Floodway Data Table 14
Table 9 – Community Map History 17
EXHIBITS
Exhibit 1 - Flood Profiles Panel #s
Brown Ditch Panels 01P-02P
McCarty Ditch Panels 03P-04P
Richland Creek Panels 05P-06P
Exhibit 2 - Flood Insurance Rate Map Index
Flood Insurance Rate Map
1
FLOOD INSURANCE STUDY
GIBSON COUNTY, INDIANA AND INCORPORATED AREAS
1.0 INTRODUCTION
1.1 Purpose of Study
This Flood Insurance Study (FIS) revises and supersedes the FIS reports and Flood
Insurance Rate Maps (FIRMs) in the geographic area of Gibson County, Indiana,
including the Cities of Princeton and Oakland, the Towns of Fort Branch, Francisco,
Haubstadt, Hazleton, Mackey, Owensville, Patoka, and Somerville, and the
unincorporated areas of Gibson County (hereinafter referred to collectively as Gibson
County), and aids in the administration of the National Flood Insurance Act of 1968
and the Flood Disaster Protection Act of 1973. This study has developed flood risk
data for various areas of the community that will be used to establish actuarial flood
insurance rates and to assist the community in its efforts to promote sound floodplain
management. This information will also be used by Gibson County to update existing
floodplain regulations as part of the Regular Phase of the National Flood Insurance
Program (NFIP), and by local and regional planners to further promote sound land
use and floodplain development. Minimum floodplain management requirements for
participation in the National Flood Insurance Program (NFIP) are set forth in the
Code of Federal Regulations at 44 CFR, 60.3.
In some states or communities, floodplain management criteria or regulations may
exist that are more restrictive or comprehensive than the minimum Federal
requirements. In such cases, the more restrictive criteria take precedence and the
State (or other jurisdictional agency) will be able to explain them.
Furthermore, the Towns of Fort Branch, Haubstadt, Mackey, Owensville, and
Somerville as well as the City of Oakland do not have special flood hazard areas
within their incorporated limits. However, for the purpose of complete county-wide
mapping of Gibson County, these communities are still included in this FIS and
FIRMs.
The Digital Flood Insurance Rate Map (DFIRM) and FIS report for this countywide
study have been produced in digital format. Flood hazard information was converted
to meet the Federal Emergency Management Agency (FEMA) DFIRM database
specifications and Geographic Information System (GIS) format requirements. The
flood hazard information was created and is provided in a digital format so that it can
be incorporated into local GIS and be accessed more easily by the community.
2
1.2 Authority and Acknowledgments
The sources of authority for this Flood Insurance Study are the National Flood
Insurance Act of 1968 and the Flood Disaster Protection Act of 1973.
Information of the authority and acknowledgements for each of the new studies and
previously printed FIS reports and Flood Insurance Rate Maps (FIRMs) for
communities within Gibson County was compiled and is shown below:
Gibson County
(Unincorporated Areas) No previous FIS.
New Studies: The hydrologic and hydraulic analyses for approximate
stream reaches of Gibson County were performed by
Morley and Associates, Inc., on behalf of the Indiana
Department of Natural Resources, under Indiana Public
Works Project Number E060008. The Indiana
Department of Natural Resources managed the
production of this study as part of their Cooperating
Technical Partner agreement with the Federal
Emergency Management Agency dated April 29, 2004,
which was defined by the Indiana DNR Mapping
Activity Statement 07-10 dated July 3, 2007 and funded
under agreement number EMC-2007-CA-7021.
Hydrologic and hydraulic analyses for the detailed
study stream reaches were performed the U.S. Army
Corps of Engineers.
Redelineation of the previously effective flood hazard information for this FIS report,
correction to the North American Vertical Datum of 1988, and conversion of the
unincorporated and incorporated areas of Gibson County into the Countywide format
was performed by Morley and Associates, Inc., on behalf of the Indiana Department
of Natural Resources, under Indiana Public Works Project Number E060008. The
Indiana Department of Natural Resources managed the production of this study as
part of their Cooperating Technical Partner agreement with the Federal Emergency
Management Agency dated April 29, 2004, which was defined by the Indiana DNR
Mapping Activity Statement 07-10 dated July 3, 2007 and funded under agreement
number EMC-2007-CA-7021.
1.3 Coordination
The purpose of an initial Consultation Coordinated Officer’s (CCOs) meeting is to
discuss the scope of the FIS. A final CCO meeting is held to review the results of the
study. No previous dates exist for the initial and final CCO meetings because there
3
are no previously effective FIS reports covering the geographic area of Gibson
County, Indiana.
The coordinate system used for the production of the digital FIRMs is the Transverse
Mercator projection, Indiana State Plane coordinate system, East Zone, referenced to
the North American Datum of 1983 and the GRS 1980 spheroid.
For this countywide FIS, an initial CCO meeting was held on October 4, 2006, and
was attended by IDNR, the Princeton Health Department, the Town of Owensville,
the Gibson Highway Department, the Gibson County Safety Department, the City of
Princeton, the U.S. Army Corps of Engineers the Gibson County Emergency
Management Agency, and the Gibson County Surveyor.
The results of the countywide study were reviewed at the final CCO meeting held on
--, and attended by representatives of FEMA, IDNR and_______. All problems
raised at that meeting have been addressed.
2.0 AREA STUDIED
2.1 Scope of Study
This FIS covers the geographic area of Gibson County, Indiana, including the
incorporated communities listed in Section 1.1.
All FIRM panels for Gibson County have been revised, updated, and republished in
countywide format as a part of this FIS. The FIRM panel index, provided as Exhibit
2, illustrates the revised FIRM panel layout.
Approximate methods of analysis were used to study those areas having a low
development potential or minimal flood hazards as identified during the initial CCO
meeting. For this study, six new stream reaches were studied using approximate
methods. The scope and methods of new approximate studies were proposed and
agreed upon by FEMA, the IDNR, and Gibson County.
This FIS update also incorporates the determination of letters issued by FEMA
resulting in map changes (Letters of Map Change, or LOMCs). No Letters of Map
Revision (LOMRs) have been issued at this time.
4
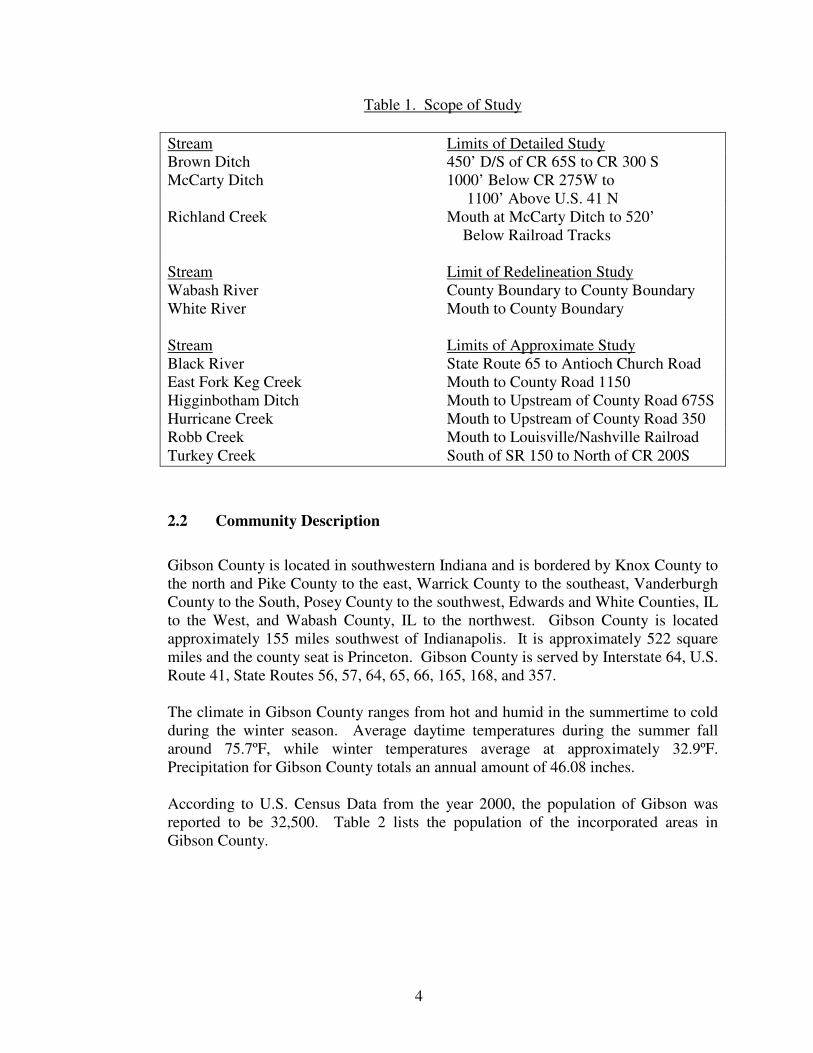
Table 1. Scope of Study
Stream Limits of Detailed Study
Brown Ditch 450’ D/S of CR 65S to CR 300 S
McCarty Ditch 1000’ Below CR 275W to
1100’ Above U.S. 41 N
Richland Creek Mouth at McCarty Ditch to 520’
Below Railroad Tracks
Stream Limit of Redelineation Study
Wabash River County Boundary to County Boundary
White River Mouth to County Boundary
Stream Limits of Approximate Study
Black River State Route 65 to Antioch Church Road
East Fork Keg Creek Mouth to County Road 1150
Higginbotham Ditch Mouth to Upstream of County Road 675S
Hurricane Creek Mouth to Upstream of County Road 350
Robb Creek Mouth to Louisville/Nashville Railroad
Turkey Creek South of SR 150 to North of CR 200S
2.2 Community Description
Gibson County is located in southwestern Indiana and is bordered by Knox County to
the north and Pike County to the east, Warrick County to the southeast, Vanderburgh
County to the South, Posey County to the southwest, Edwards and White Counties, IL
to the West, and Wabash County, IL to the northwest. Gibson County is located
approximately 155 miles southwest of Indianapolis. It is approximately 522 square
miles and the county seat is Princeton. Gibson County is served by Interstate 64, U.S.
Route 41, State Routes 56, 57, 64, 65, 66, 165, 168, and 357.
The climate in Gibson County ranges from hot and humid in the summertime to cold
during the winter season. Average daytime temperatures during the summer fall
around 75.7ºF, while winter temperatures average at approximately 32.9ºF.
Precipitation for Gibson County totals an annual amount of 46.08 inches.
According to U.S. Census Data from the year 2000, the population of Gibson was
reported to be 32,500. Table 2 lists the population of the incorporated areas in
Gibson County.
5
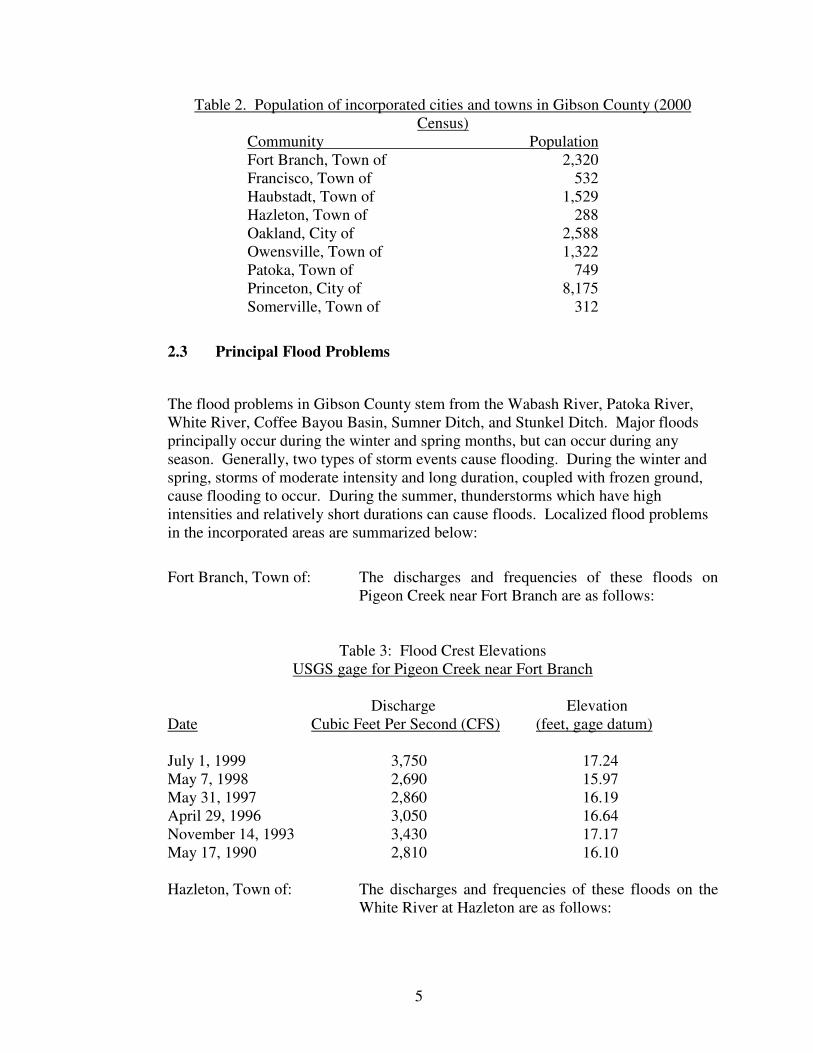
Table 2. Population of incorporated cities and towns in Gibson County (2000
Census)
Community Population
Fort Branch, Town of 2,320
Francisco, Town of 532
Haubstadt, Town of 1,529
Hazleton, Town of 288
Oakland, City of 2,588
Owensville, Town of 1,322
Patoka, Town of 749
Princeton, City of 8,175
Somerville, Town of 312
2.3 Principal Flood Problems
The flood problems in Gibson County stem from the Wabash River, Patoka River,
White River, Coffee Bayou Basin, Sumner Ditch, and Stunkel Ditch. Major floods
principally occur during the winter and spring months, but can occur during any
season. Generally, two types of storm events cause flooding. During the winter and
spring, storms of moderate intensity and long duration, coupled with frozen ground,
cause flooding to occur. During the summer, thunderstorms which have high
intensities and relatively short durations can cause floods. Localized flood problems
in the incorporated areas are summarized below:
Fort Branch, Town of: The discharges and frequencies of these floods on
Pigeon Creek near Fort Branch are as follows:
Table 3: Flood Crest Elevations
USGS gage for Pigeon Creek near Fort Branch
Discharge Elevation
Date Cubic Feet Per Second (CFS) (feet, gage datum)
July 1, 1999 3,750 17.24
May 7, 1998 2,690 15.97
May 31, 1997 2,860 16.19
April 29, 1996 3,050 16.64
November 14, 1993 3,430 17.17
May 17, 1990 2,810 16.10
Hazleton, Town of: The discharges and frequencies of these floods on the
White River at Hazleton are as follows:
6
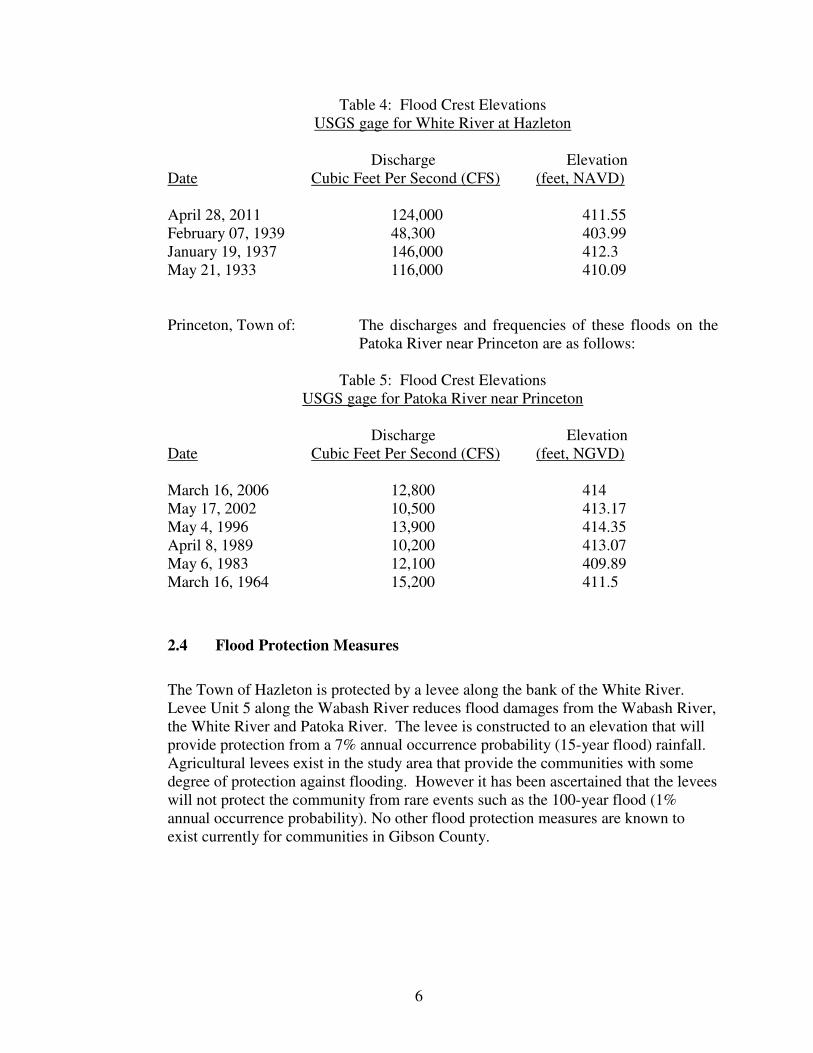
Table 4: Flood Crest Elevations
USGS gage for White River at Hazleton
Discharge Elevation
Date Cubic Feet Per Second (CFS) (feet, NAVD)
April 28, 2011 124,000 411.55
February 07, 1939 48,300 403.99
January 19, 1937 146,000 412.3
May 21, 1933 116,000 410.09
Princeton, Town of: The discharges and frequencies of these floods on the
Patoka River near Princeton are as follows:
Table 5: Flood Crest Elevations
USGS gage for Patoka River near Princeton
Discharge Elevation
Date Cubic Feet Per Second (CFS) (feet, NGVD)
March 16, 2006 12,800 414
May 17, 2002 10,500 413.17
May 4, 1996 13,900 414.35
April 8, 1989 10,200 413.07
May 6, 1983 12,100 409.89
March 16, 1964 15,200 411.5
2.4 Flood Protection Measures
The Town of Hazleton is protected by a levee along the bank of the White River.
Levee Unit 5 along the Wabash River reduces flood damages from the Wabash River,
the White River and Patoka River. The levee is constructed to an elevation that will
provide protection from a 7% annual occurrence probability (15-year flood) rainfall.
Agricultural levees exist in the study area that provide the communities with some
degree of protection against flooding. However it has been ascertained that the levees
will not protect the community from rare events such as the 100-year flood (1%
annual occurrence probability). No other flood protection measures are known to
exist currently for communities in Gibson County.
7
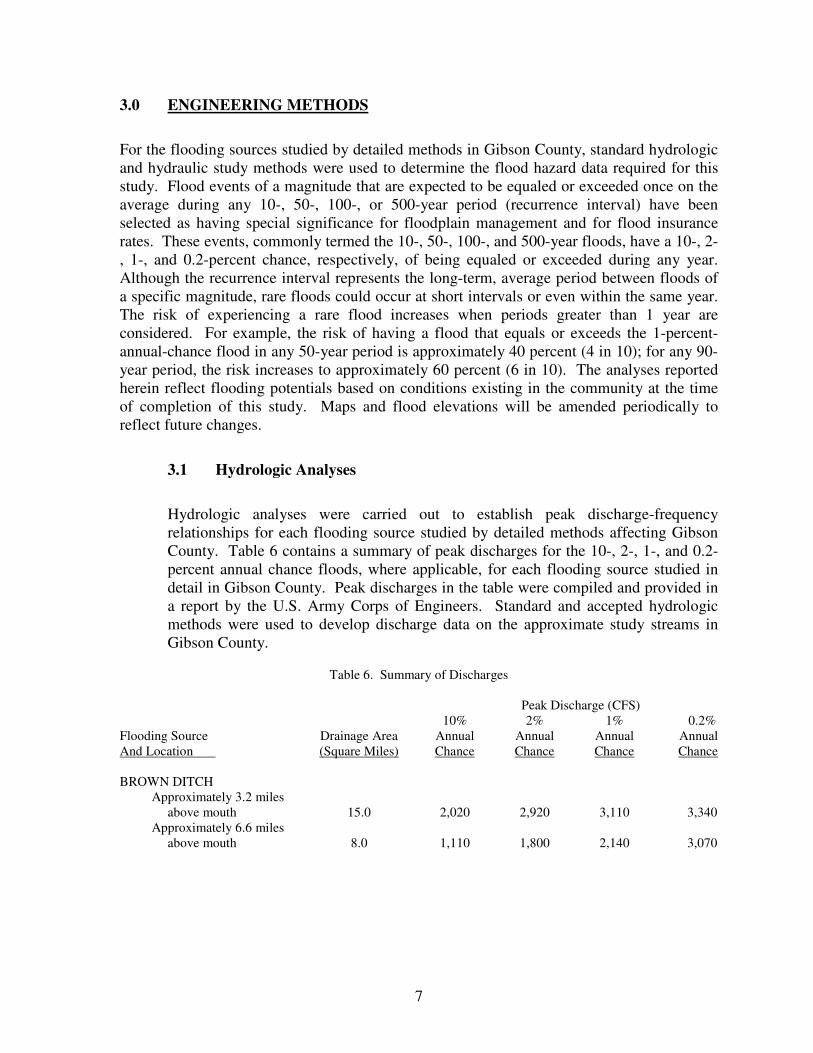
3.0 ENGINEERING METHODS
For the flooding sources studied by detailed methods in Gibson County, standard hydrologic
and hydraulic study methods were used to determine the flood hazard data required for this
study. Flood events of a magnitude that are expected to be equaled or exceeded once on the
average during any 10-, 50-, 100-, or 500-year period (recurrence interval) have been
selected as having special significance for floodplain management and for flood insurance
rates. These events, commonly termed the 10-, 50-, 100-, and 500-year floods, have a 10-, 2-
, 1-, and 0.2-percent chance, respectively, of being equaled or exceeded during any year.
Although the recurrence interval represents the long-term, average period between floods of
a specific magnitude, rare floods could occur at short intervals or even within the same year.
The risk of experiencing a rare flood increases when periods greater than 1 year are
considered. For example, the risk of having a flood that equals or exceeds the 1-percent-
annual-chance flood in any 50-year period is approximately 40 percent (4 in 10); for any 90-
year period, the risk increases to approximately 60 percent (6 in 10). The analyses reported
herein reflect flooding potentials based on conditions existing in the community at the time
of completion of this study. Maps and flood elevations will be amended periodically to
reflect future changes.
3.1 Hydrologic Analyses
Hydrologic analyses were carried out to establish peak discharge-frequency
relationships for each flooding source studied by detailed methods affecting Gibson
County. Table 6 contains a summary of peak discharges for the 10-, 2-, 1-, and 0.2-
percent annual chance floods, where applicable, for each flooding source studied in
detail in Gibson County. Peak discharges in the table were compiled and provided in
a report by the U.S. Army Corps of Engineers. Standard and accepted hydrologic
methods were used to develop discharge data on the approximate study streams in
Gibson County.
Table 6. Summary of Discharges
Peak Discharge (CFS)
10% 2% 1% 0.2%
Flooding Source Drainage Area Annual Annual Annual Annual
And Location (Square Miles) Chance Chance Chance Chance
BROWN DITCH
Approximately 3.2 miles
above mouth 15.0 2,020 2,920 3,110 3,340
Approximately 6.6 miles
above mouth 8.0 1,110 1,800 2,140 3,070
8
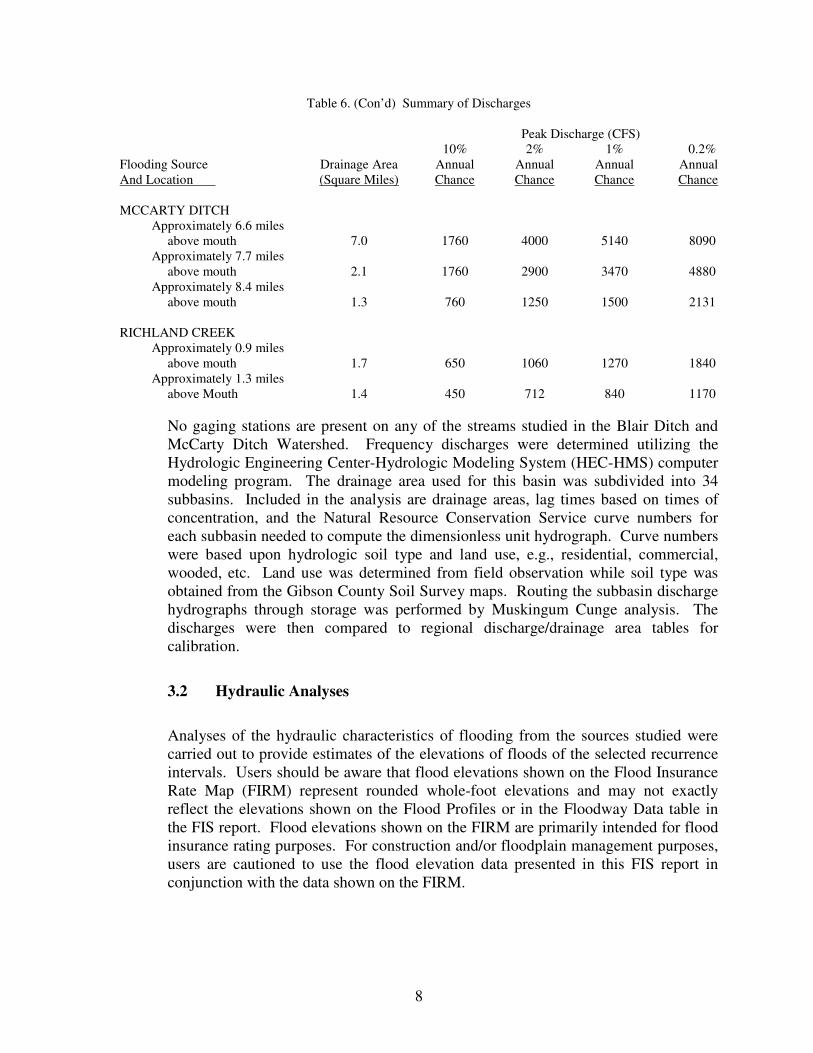
Table 6. (Con’d) Summary of Discharges
Peak Discharge (CFS)
10% 2% 1% 0.2%
Flooding Source Drainage Area Annual Annual Annual Annual
And Location (Square Miles) Chance Chance Chance Chance
MCCARTY DITCH
Approximately 6.6 miles
above mouth 7.0 1760 4000 5140 8090
Approximately 7.7 miles
above mouth 2.1 1760 2900 3470 4880
Approximately 8.4 miles
above mouth 1.3 760 1250 1500 2131
RICHLAND CREEK
Approximately 0.9 miles
above mouth 1.7 650 1060 1270 1840
Approximately 1.3 miles
above Mouth 1.4 450 712 840 1170
No gaging stations are present on any of the streams studied in the Blair Ditch and
McCarty Ditch Watershed. Frequency discharges were determined utilizing the
Hydrologic Engineering Center-Hydrologic Modeling System (HEC-HMS) computer
modeling program. The drainage area used for this basin was subdivided into 34
subbasins. Included in the analysis are drainage areas, lag times based on times of
concentration, and the Natural Resource Conservation Service curve numbers for
each subbasin needed to compute the dimensionless unit hydrograph. Curve numbers
were based upon hydrologic soil type and land use, e.g., residential, commercial,
wooded, etc. Land use was determined from field observation while soil type was
obtained from the Gibson County Soil Survey maps. Routing the subbasin discharge
hydrographs through storage was performed by Muskingum Cunge analysis. The
discharges were then compared to regional discharge/drainage area tables for
calibration.
3.2 Hydraulic Analyses
Analyses of the hydraulic characteristics of flooding from the sources studied were
carried out to provide estimates of the elevations of floods of the selected recurrence
intervals. Users should be aware that flood elevations shown on the Flood Insurance
Rate Map (FIRM) represent rounded whole-foot elevations and may not exactly
reflect the elevations shown on the Flood Profiles or in the Floodway Data table in
the FIS report. Flood elevations shown on the FIRM are primarily intended for flood
insurance rating purposes. For construction and/or floodplain management purposes,
users are cautioned to use the flood elevation data presented in this FIS report in
conjunction with the data shown on the FIRM.
9
Water-surface elevations for floods of the selected recurrence intervals for the
detailed study stream reaches were computed through use of the USACE HEC-RAS
program. Also for the new approximate study reaches, the USACE HEC-RAS
program was used. HEC-RAS is an updated version of the HEC-2 program used to
perform step-backwater analyses.
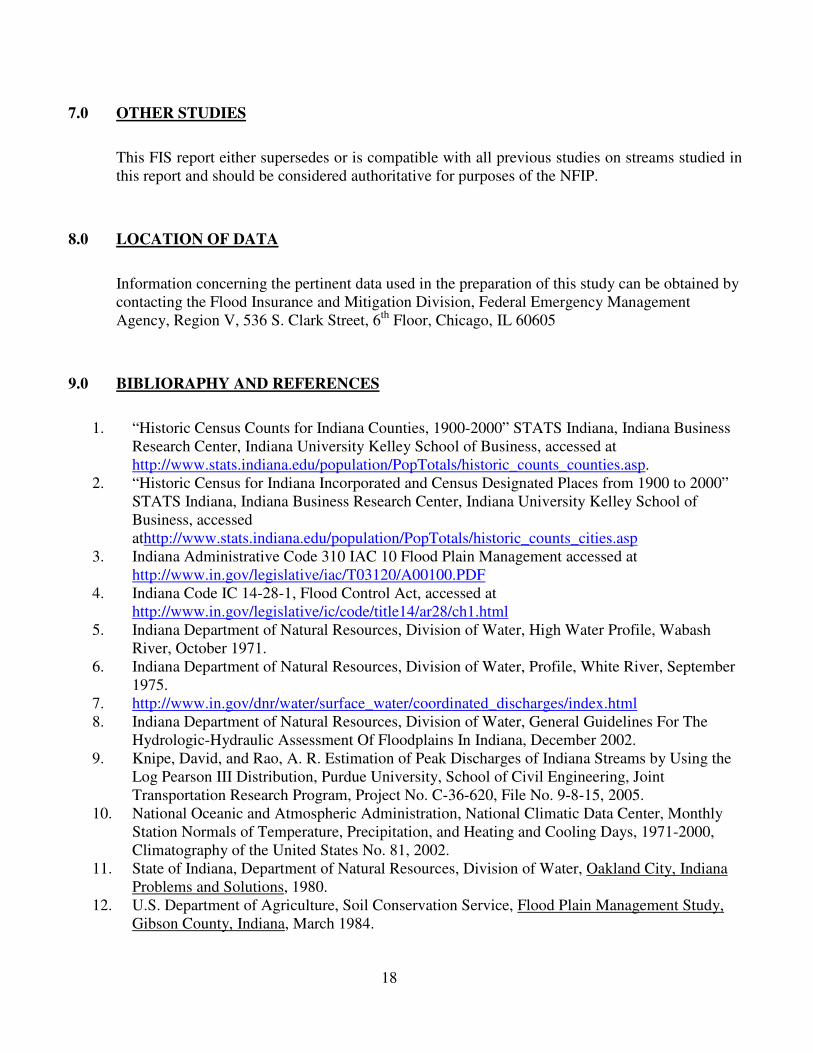
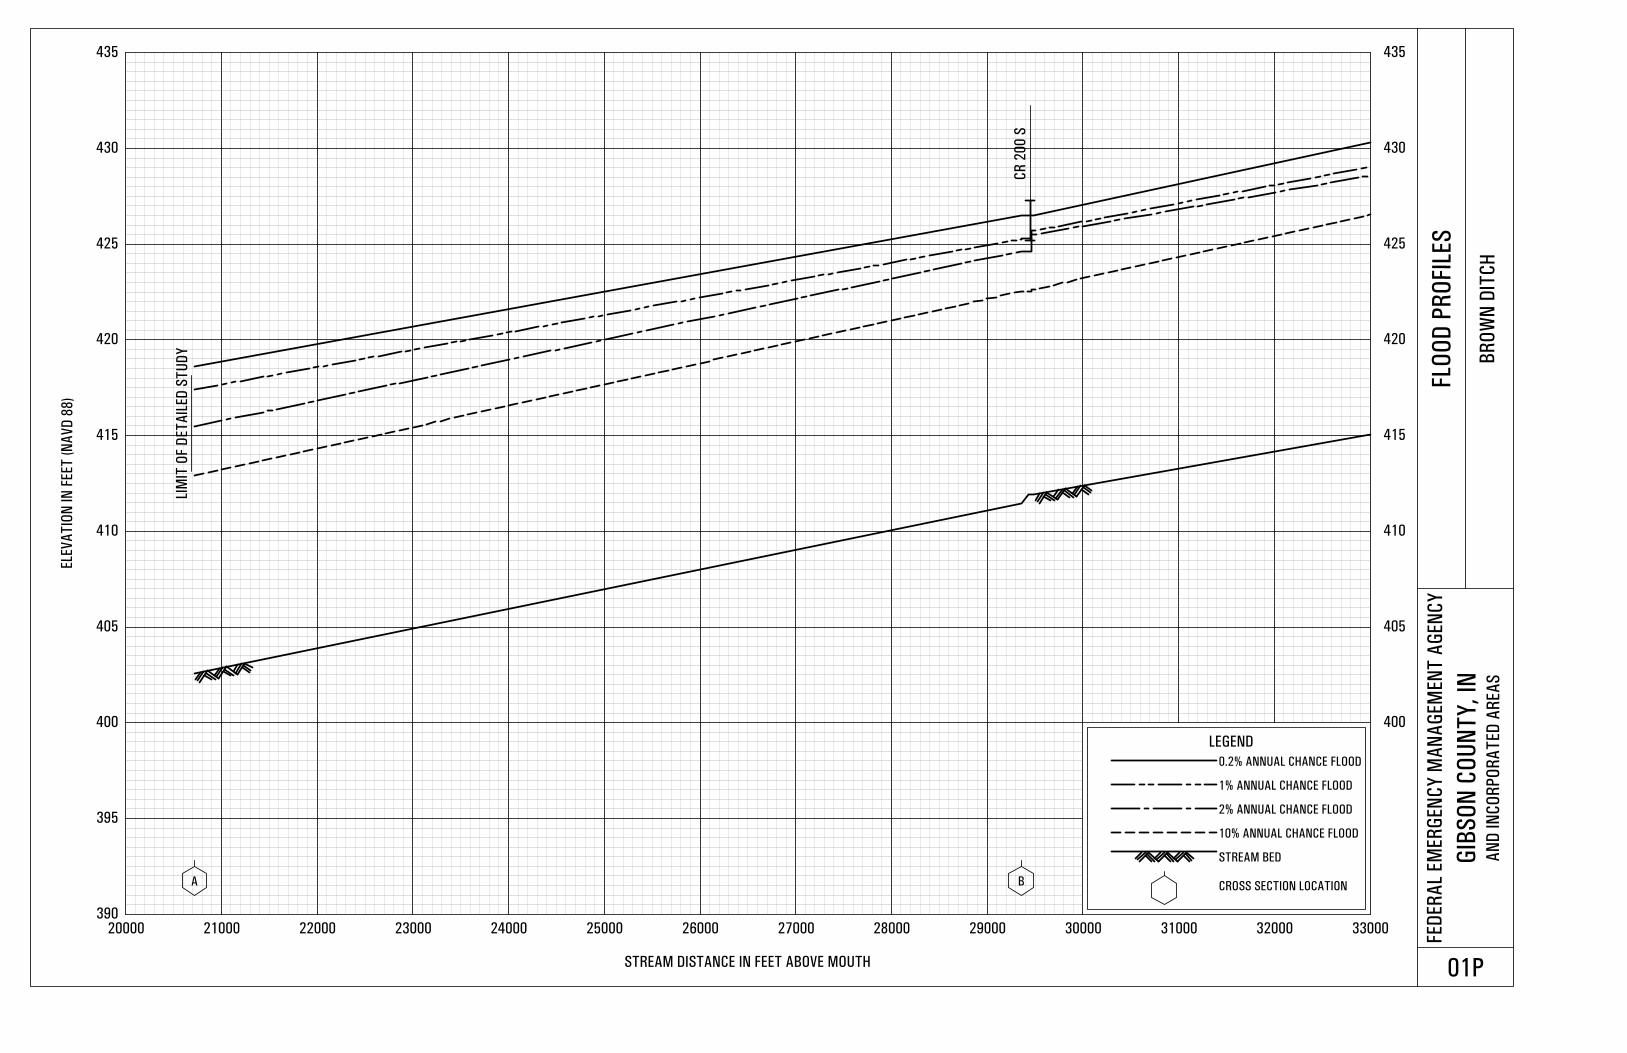
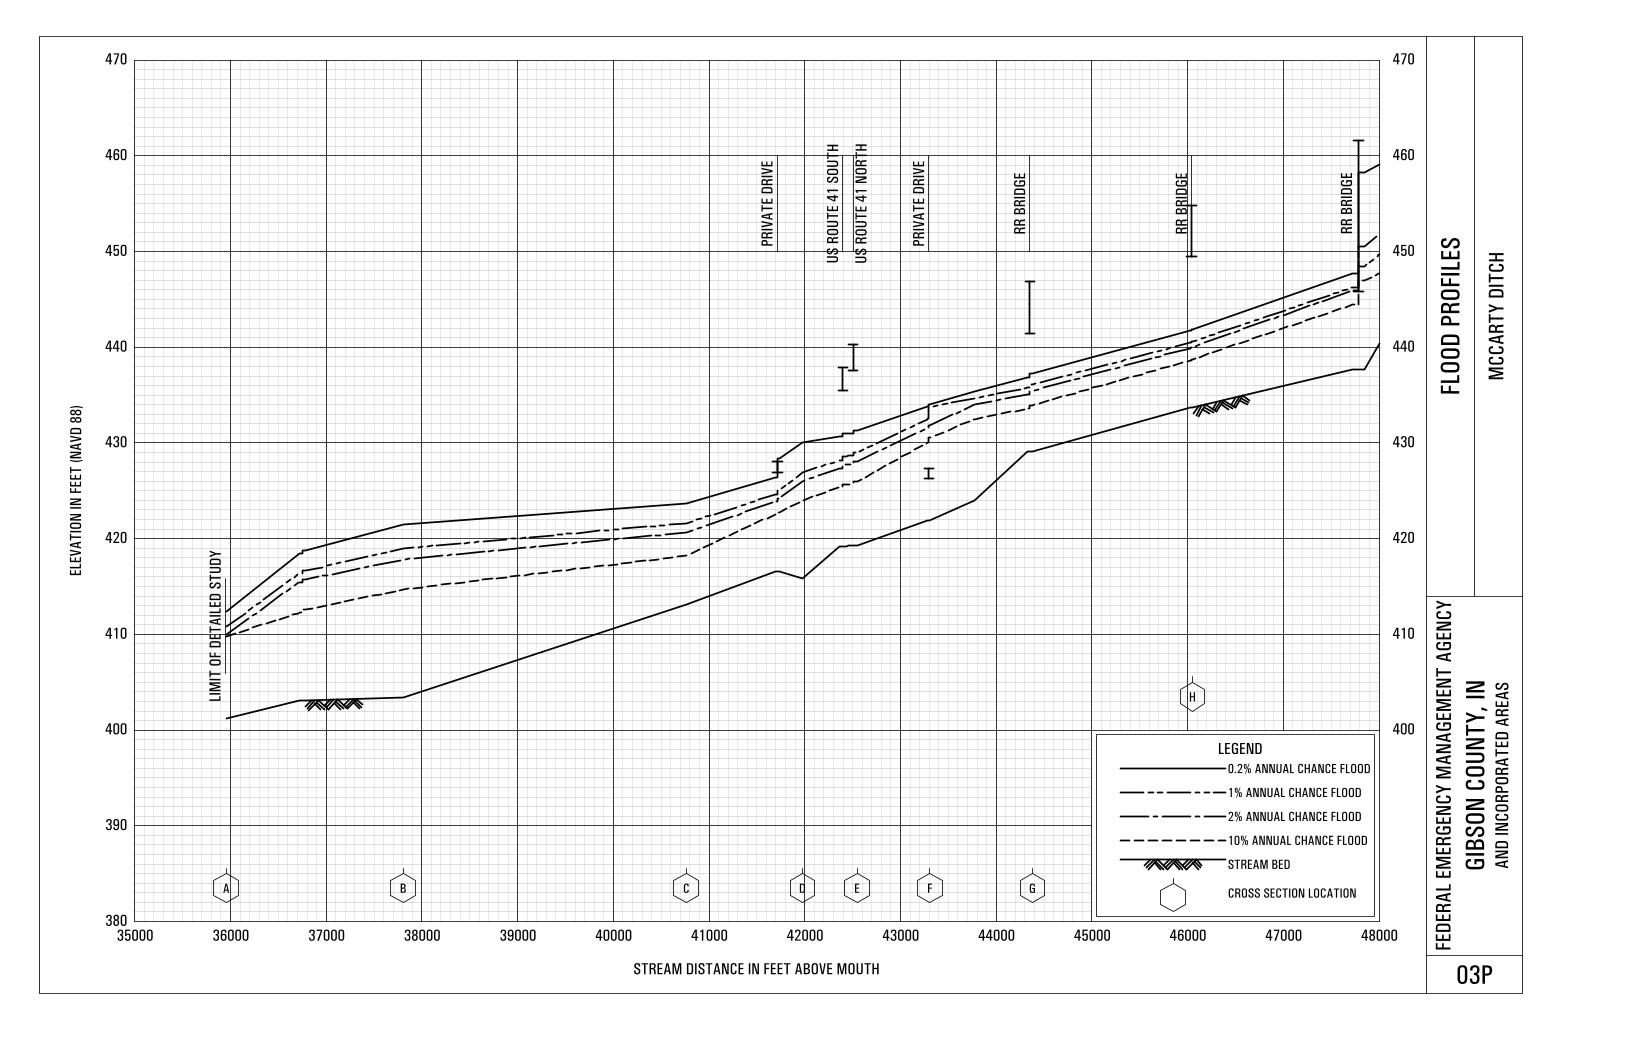
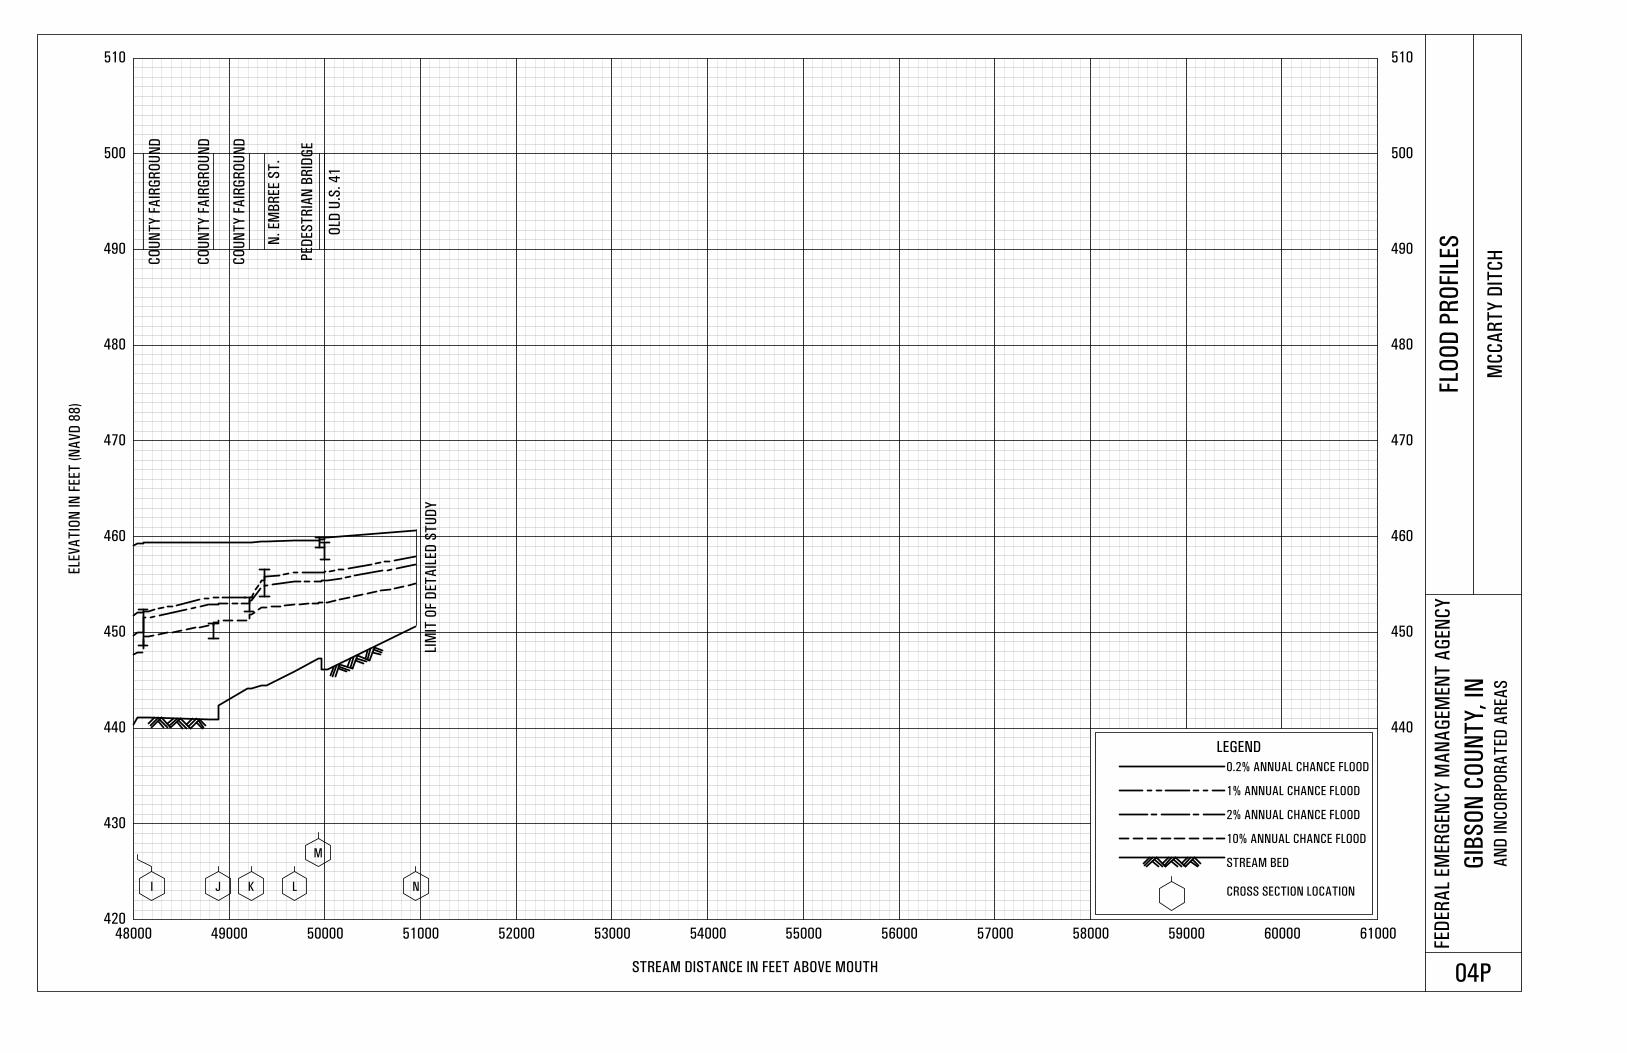
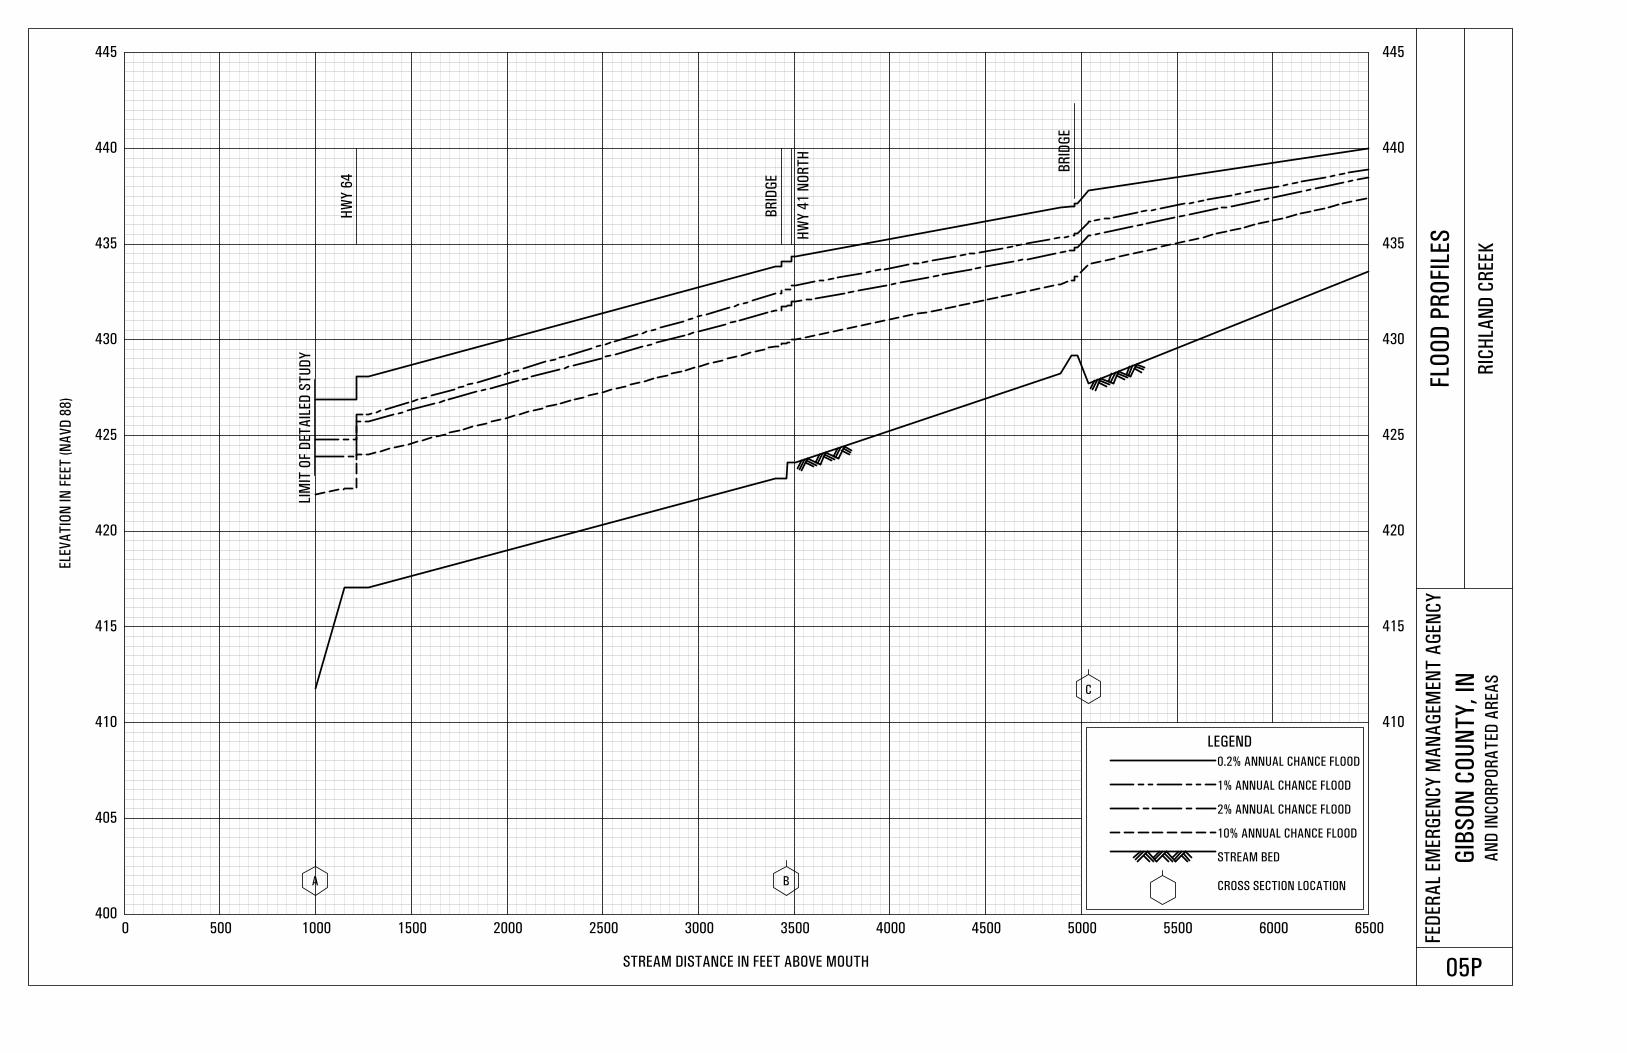
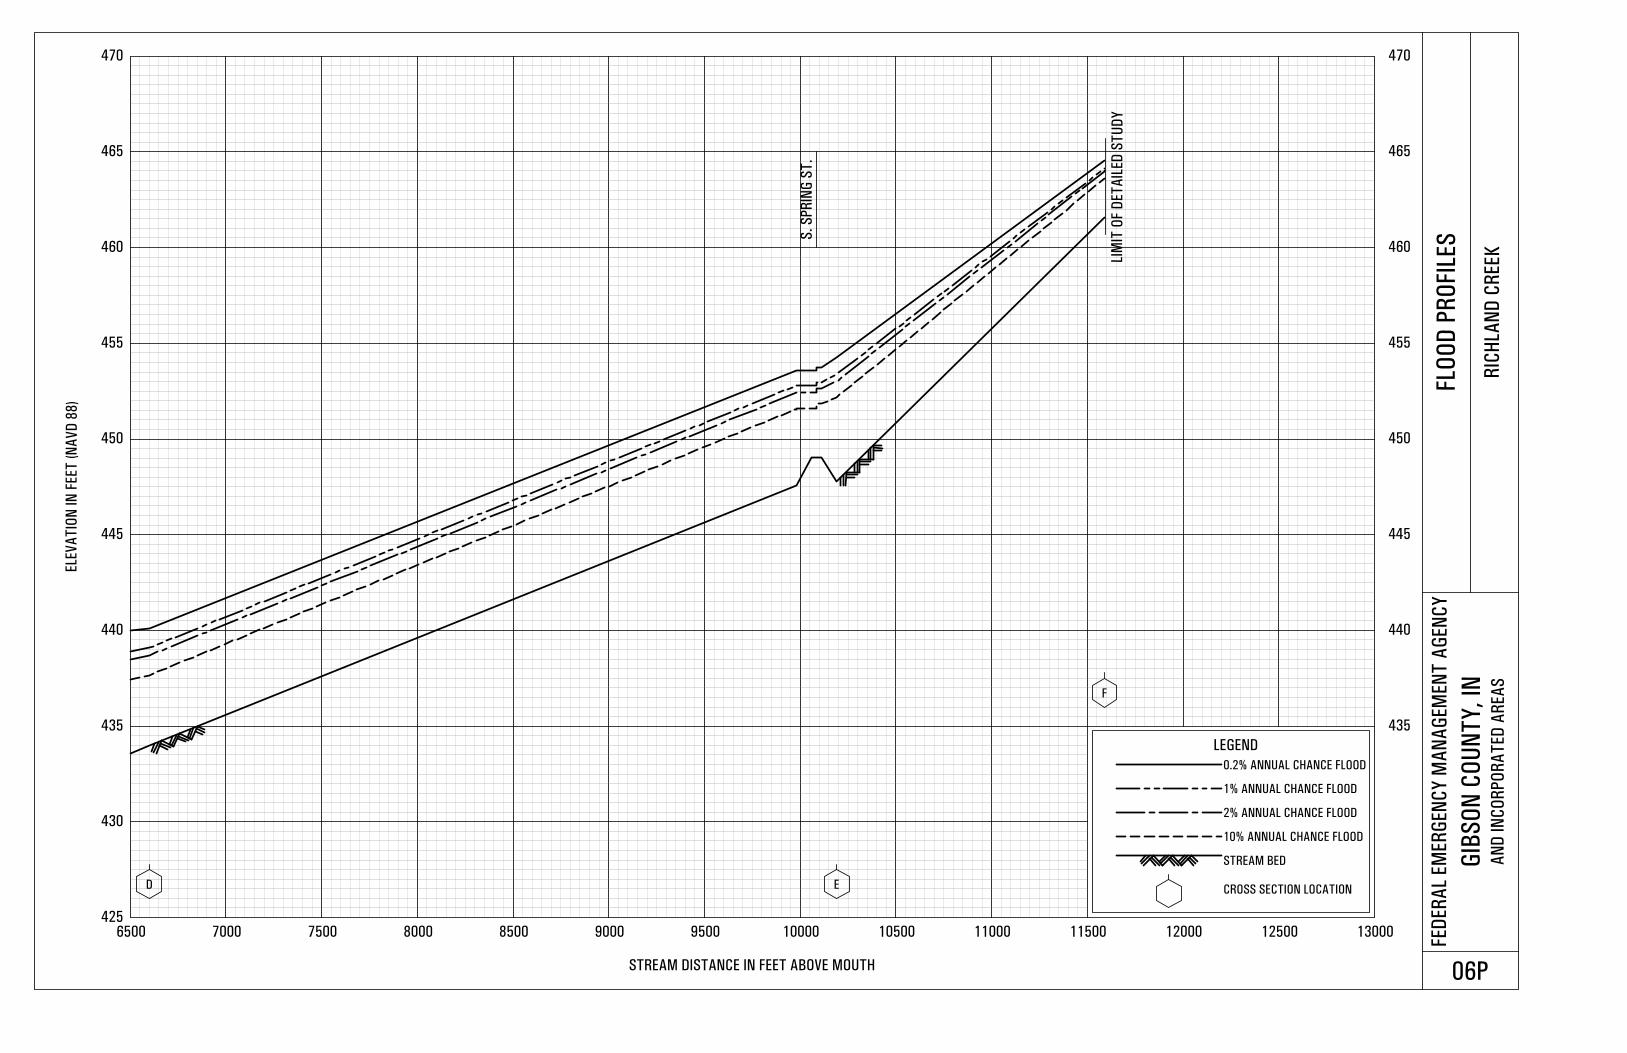
Flood profiles were prepared for all streams studied by detailed methods and show
computed water-surface elevations to an accuracy of 0.5 feet for floods of the selected
recurrence intervals. For this countywide FIS, flood profiles and approved LOMRs
have been consolidated into continuous stream reaches and adjusted to reflect the
current vertical datum as described in Section 3.3. New profiles have been prepared
for the new detailed studies and for the purposes of incorporating the LOMRs
described in Section 2.1 above.
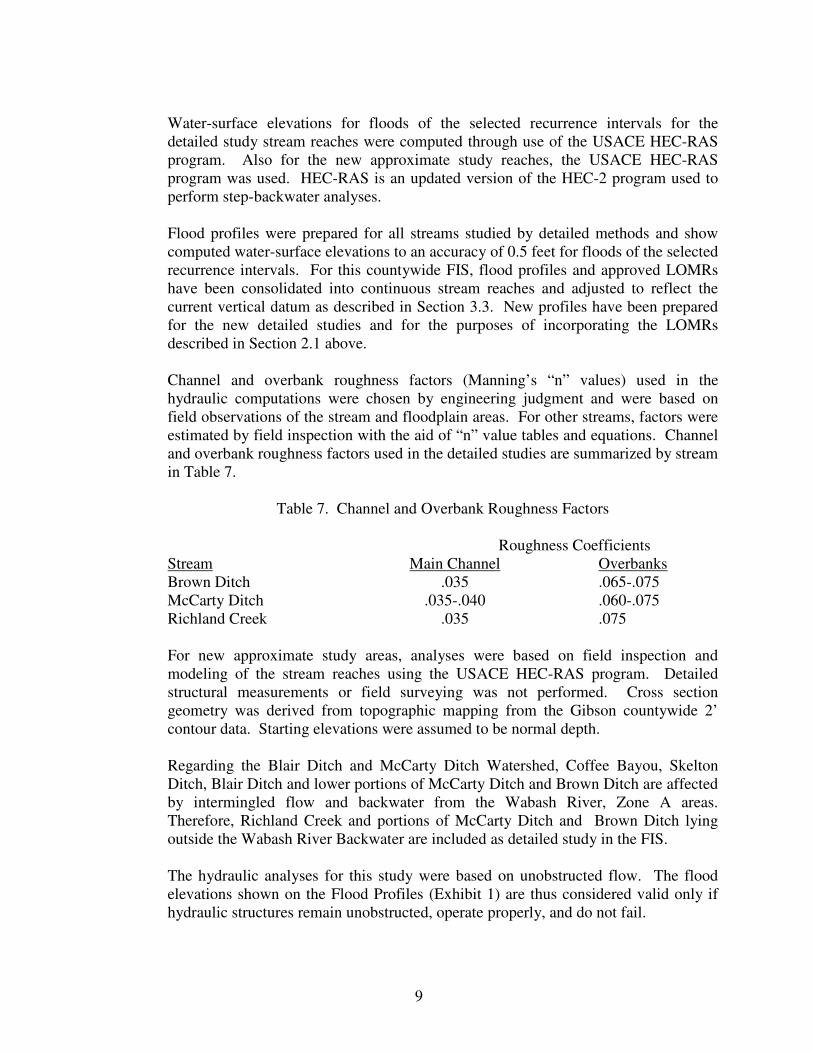
Channel and overbank roughness factors (Manning’s “n” values) used in the
hydraulic computations were chosen by engineering judgment and were based on
field observations of the stream and floodplain areas. For other streams, factors were
estimated by field inspection with the aid of “n” value tables and equations. Channel
and overbank roughness factors used in the detailed studies are summarized by stream
in Table 7.
Table 7. Channel and Overbank Roughness Factors
Roughness Coefficients
Stream Main Channel Overbanks
Brown Ditch .035 .065-.075
McCarty Ditch .035-.040 .060-.075
Richland Creek .035 .075
For new approximate study areas, analyses were based on field inspection and
modeling of the stream reaches using the USACE HEC-RAS program. Detailed
structural measurements or field surveying was not performed. Cross section
geometry was derived from topographic mapping from the Gibson countywide 2’
contour data. Starting elevations were assumed to be normal depth.
Regarding the Blair Ditch and McCarty Ditch Watershed, Coffee Bayou, Skelton
Ditch, Blair Ditch and lower portions of McCarty Ditch and Brown Ditch are affected
by intermingled flow and backwater from the Wabash River, Zone A areas.
Therefore, Richland Creek and portions of McCarty Ditch and Brown Ditch lying
outside the Wabash River Backwater are included as detailed study in the FIS.
The hydraulic analyses for this study were based on unobstructed flow. The flood
elevations shown on the Flood Profiles (Exhibit 1) are thus considered valid only if
hydraulic structures remain unobstructed, operate properly, and do not fail.
10
3.3 Vertical Datum
All FIS reports and FIRMs are referenced to a specific vertical datum. The vertical
datum provides a starting point against which flood, ground, and structure elevations
can be referenced and compared. Until recently, the standard vertical datum in use
for newly created or revised FIS reports and FIRMs was the National Geodetic
Vertical Datum of 1929 (NGVD29). With the finalization of the North American
Vertical Datum of 1988 (NAVD88), many FIS reports and FIRMs are being prepared
using NAVD88 as the referenced vertical datum.
All flood elevations shown in this FIS report and on the FIRM are referenced to
NAVD88. Structure and ground elevations in the community must, therefore, be
referenced to NAVD88. It is important to note that adjacent communities may be
referenced to NGVD29. This may result in differences in Base Flood Elevations
(BFEs) across the corporate limits between the communities.
In this revision, a vertical datum conversion of -0.43 feet was calculated at the
centroid of the county and used to convert all elevations in Gibson county from
NGVD29 to NAVD88 using the National Geologic Survey’s VERTCON online
utility (VERTCON, 2005).
(NGVD29 – 0.43 = NAVD88)
For more information on NAVD88, see the FEMA publication entitled Converting
the National Flood Insurance Program to the North American Vertical Datum of 1988
(FEMA, June 1992), or contact the Vertical Network Branch, National Geodetic
Survey, Coast and Geodetic Survey, National Oceanic and Atmospheric
Administration, Rockville, Maryland 20910 (Internet address
http://www.ngs.noaa.gov).
Temporary vertical monuments are often established during the preparation of a flood
hazard analysis for the purpose of establishing local vertical control. Although these
monuments are not shown on the FIRM, they may be found in the Technical Support
Data Notebook associated with the FIS report and FIRM for this community.
Interested individuals may contact FEMA to access these data.
4.0 FLOODPLAIN MANAGEMENT APPLICATIONS
The NFIP encourages State and local governments to adopt sound floodplain
management programs. Therefore, each FIS provides 1-percent-annual-chance flood
elevations and delineations of the 1- and 0.2-percent-annual-chance floodplain
boundaries and 1-percent-annual-chance floodway to assist communities in
developing floodplain management measures. This information is presented on the
FIRM and in many components of the FIS report, including Flood Profiles, and the
Floodway Data table. Users should reference the data presented in the FIS report as
11
well as additional information that may be available at the local map repository
before making flood elevation and/or floodplain boundary determinations.
4.1 Floodplain Boundaries
To provide a national standard without regional discrimination, the 1-percent-annual-
chance flood has been adopted by FEMA as the base flood for floodplain
management purposes. The 0.2-percent-annual-chance flood is employed to indicate
additional areas of flood risk in the community. For each stream studied by detailed
methods, the 1- and 0.2-percent-annual-chance floodplain boundaries have been
delineated using the flood elevations determined at each cross section. Between cross
sections, the boundaries were interpolated using topographic mapping from the
Gibson countywide 2’ contour data.
The 1- and 0.2-percent-annual-chance floodplain boundaries are shown on the FIRM
(Exhibit 2). On this map, the 1-percent-annual-chance floodplain boundary
corresponds to the boundary of the areas of special flood hazards (Zones A, AE, V,
and VE); and the 0.2-percent-annual-chance floodplain boundary corresponds to the
boundary of areas of moderate flood hazards. In cases where the 1- and 0.2-percent-
annual-chance floodplain boundaries are close together, only the 1-percent-annual-
chance floodplain boundary has been shown. Small areas within the floodplain
boundaries may lie above the flood elevations but cannot be shown due to limitations
of the map scale and/or lack of detailed topographic data.
For streams studied by redelineation method, the existing flood frequeny profiles
developed by the Indiana Department of Natural Resources were used to refine the
Zone A flood areas shown on FIRM (Exhibit 2); the flood elevations will not be
published. For the streams studied by approximate methods, only the 1-percent-
annual chance floodplain boundary is shown on the FIRM (Exhibit 2).
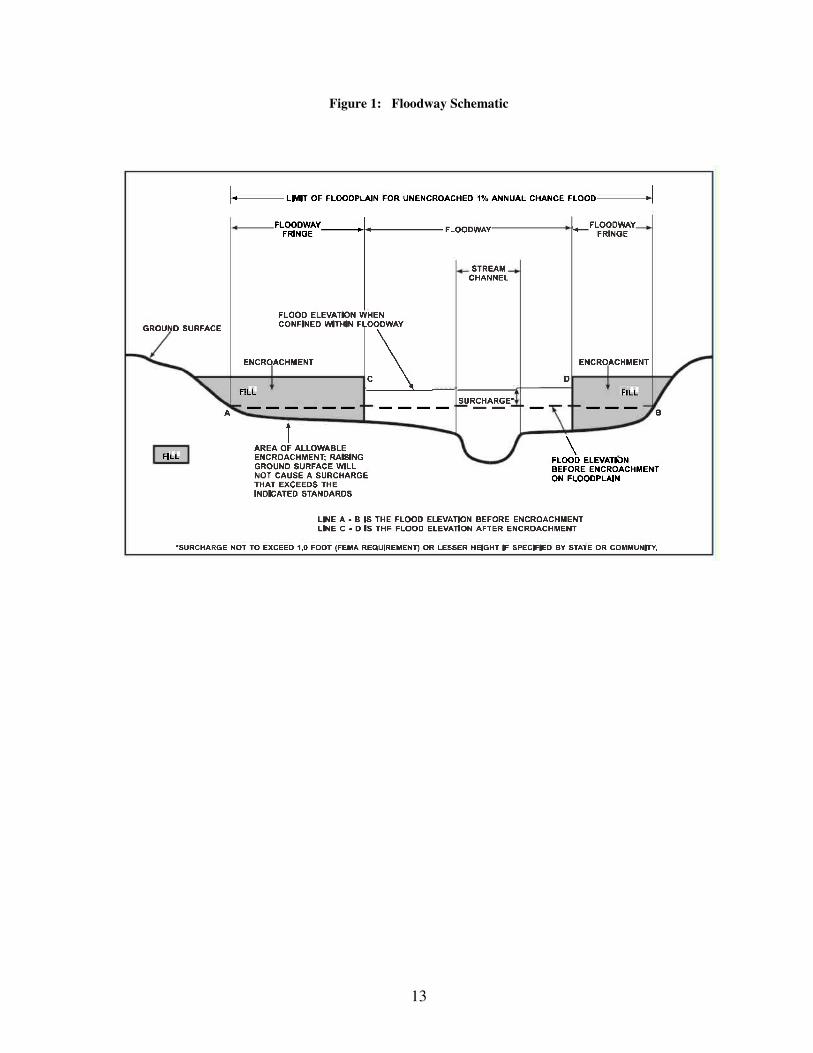
4.2 Floodways
Encroachment on floodplains, such as structures and fill, reduces flood-carrying
capacity, increases flood heights and velocities, and increases flood hazards in areas
beyond the encroachment itself. One aspect of floodplain management involves
balancing the economic gain from floodplain development against the resulting
increase in flood hazard. For purposes of the NFIP, a floodway is used as a tool to
assist local communities in this aspect of floodplain management. Under this
concept, the area of the 1-percent-annual-chance floodplain is divided into a floodway
and a floodway fringe. The floodway is the channel of a stream, plus any adjacent
floodplain areas, that must be kept free of encroachment so that the 1-percent-annual-
chance flood can be carried without substantial increases in flood heights. Minimum
Federal standards limit such increases to 1.0 foot, provided that hazardous velocities
are not produced. The floodways in this study are presented to local agencies as
12
minimum standards that can be adopted directly or that can be used as a basis for
additional floodway studies.
The State of Indiana, however, per Indiana Code IC 14-28-1 and Indiana
Administrative Code 312 IAC 10, has designated that encroachment in the floodplain
is limited to that which will cause no significant increase in flood height. As a result,
floodways for this study are delineated based on a flood surcharge of less than 0.15
feet. The floodways in this study were approved by the IDNR, and are presented to
local agencies as minimum standards that can be adopted directly or that can be used
as a basis for additional floodway studies.
The floodway presented in this FIS report and on the FIRM was computed on the
basis of equal conveyance reduction from each side of the floodplain. Floodway
widths were computed at cross sections. Between cross sections, the floodway
boundaries were interpolated. The results of the floodway computations have been
tabulated for selected cross sections (Table 8). In cases where the floodway and 1-
percent-annual-chance floodplain boundaries are either close together or collinear,
only the floodway boundary has been shown.
The area between the floodway and 1-percent-annual-chance floodplain boundaries is
termed the floodway fringe. The floodway fringe encompasses the portion of the
floodplain that could be completely obstructed without increasing the water-surface
elevation of the 1-percent-annual-chance flood more than 1.0 foot at any point.
Typical relationships between the floodway and the floodway fringe and their
significance to floodplain development are shown in Figure 1.
13
Figure 1: Floodway Schematic
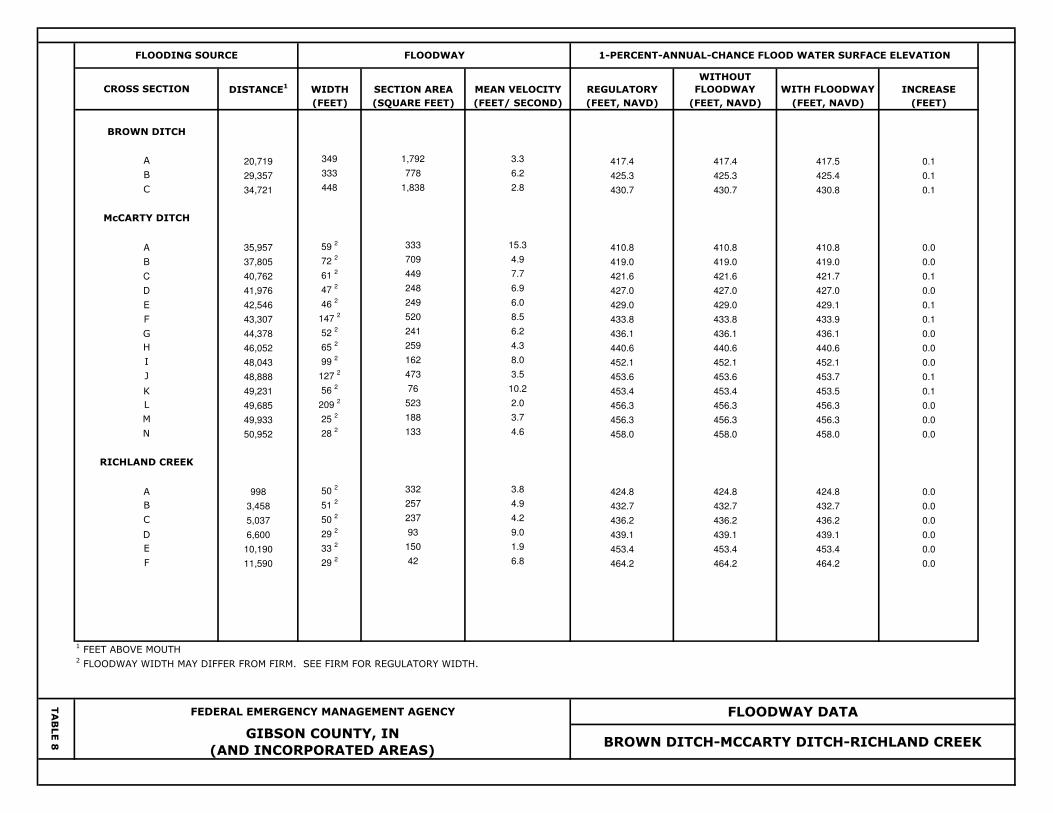
WIDTH SECTION AREA MEAN VELOCITY REGULATORY
WITHOUT
FLOODWAY WITH FLOODWAY INCREASE
(FEET) (SQUARE FEET) (FEET/ SECOND) (FEET, NAVD) (FEET, NAVD) (FEET, NAVD) (FEET)
BROWN DITCH
A 20,719 349 1,792 3.3 417.4 417.4 417.5 0.1
B 29,357 333 778 6.2 425.3 425.3 425.4 0.1
C 34,721 448 1,838 2.8 430.7 430.7 430.8 0.1
McCARTY DITCH
A 35,957 59 2 333 15.3 410.8 410.8 410.8 0.0
B 37,805 72 2 709 4.9 419.0 419.0 419.0 0.0
C 40,762 61 2 449 7.7 421.6 421.6 421.7 0.1
D 41,976 47 2 248 6.9 427.0 427.0 427.0 0.0
E 42,546 46 2 249 6.0 429.0 429.0 429.1 0.1
F 43,307 147 2 520 8.5 433.8 433.8 433.9 0.1
G 44,378 52 2 241 6.2 436.1 436.1 436.1 0.0
H 46,052 65 2 259 4.3 440.6 440.6 440.6 0.0
I 48,043 99 2 162 8.0 452.1 452.1 452.1 0.0
J 48,888 127 2 473 3.5 453.6 453.6 453.7 0.1
K 49,231 56 2 76 10.2 453.4 453.4 453.5 0.1
L 49,685 209 2 523 2.0 456.3 456.3 456.3 0.0
M 49,933 25 2 188 3.7 456.3 456.3 456.3 0.0
N 50,952 28 2 133 4.6 458.0 458.0 458.0 0.0
RICHLAND CREEK
A 998 50 2 332 3.8 424.8 424.8 424.8 0.0
B 3,458 51 2 257 4.9 432.7 432.7 432.7 0.0
C 5,037 50 2 237 4.2 436.2 436.2 436.2 0.0
D 6,600 29 2 93 9.0 439.1 439.1 439.1 0.0
E 10,190 33 2 150 1.9 453.4 453.4 453.4 0.0
F 11,590 29 2 42 6.8 464.2 464.2 464.2 0.0
1 FEET ABOVE MOUTH
2 FLOODWAY WIDTH MAY DIFFER FROM FIRM. SEE FIRM FOR REGULATORY WIDTH.
1-PERCENT-ANNUAL-CHANCE FLOOD WATER SURFACE ELEVATION
CROSS SECTION DISTANCE1
FLOODWAY DATA
BROWN DITCH-MCCARTY DITCH-RICHLAND CREEK
TABLE 8
GIBSON COUNTY, IN
(AND INCORPORATED AREAS)
FEDERAL EMERGENCY MANAGEMENT AGENCY
FLOODING SOURCE FLOODWAY
15
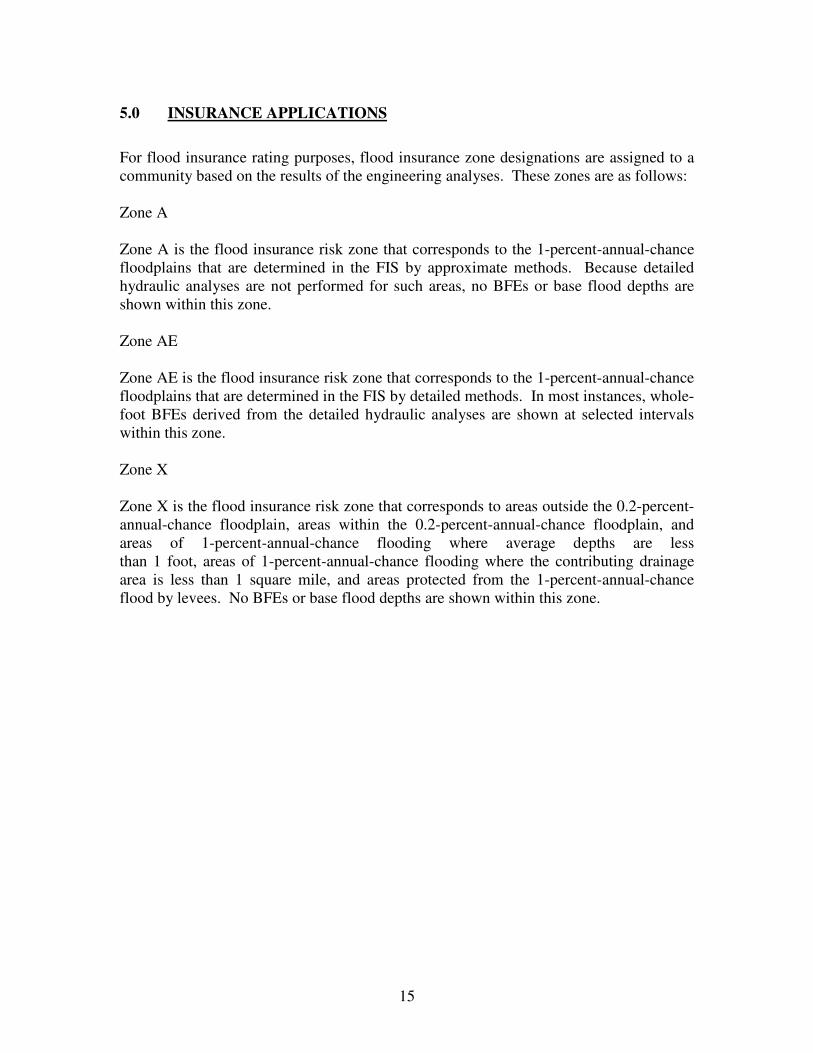
5.0 INSURANCE APPLICATIONS
For flood insurance rating purposes, flood insurance zone designations are assigned to a
community based on the results of the engineering analyses. These zones are as follows:
Zone A
Zone A is the flood insurance risk zone that corresponds to the 1-percent-annual-chance
floodplains that are determined in the FIS by approximate methods. Because detailed
hydraulic analyses are not performed for such areas, no BFEs or base flood depths are
shown within this zone.
Zone AE
Zone AE is the flood insurance risk zone that corresponds to the 1-percent-annual-chance
floodplains that are determined in the FIS by detailed methods. In most instances, whole-
foot BFEs derived from the detailed hydraulic analyses are shown at selected intervals
within this zone.
Zone X
Zone X is the flood insurance risk zone that corresponds to areas outside the 0.2-percent-
annual-chance floodplain, areas within the 0.2-percent-annual-chance floodplain, and
areas of 1-percent-annual-chance flooding where average depths are less
than 1 foot, areas of 1-percent-annual-chance flooding where the contributing drainage
area is less than 1 square mile, and areas protected from the 1-percent-annual-chance
flood by levees. No BFEs or base flood depths are shown within this zone.
16
6.0 FLOOD INSURANCE RATE MAP
The FIRM is designed for flood insurance and floodplain management applications.
For flood insurance applications, the map designates flood insurance risk zones as described in
Section 5.0 and, in the 1-percent-annual-chance floodplains that were studied by detailed
methods, shows selected whole-foot BFEs or average depths. Insurance agents use the zones and
BFEs in conjunction with information on structures and their contents to assign premium rates for
flood insurance policies.
For floodplain management applications, the map shows by tints, screens, and symbols, the 1-
and 0.2-percent-annual-chance floodplains, floodways, and the locations of selected cross
sections used in the hydraulic analyses and floodway computations.
The current FIRM presents flooding information for the entire geographic area of Gibson County.
Previously, separate FIRMs were prepared for each identified flood prone incorporated
community and for the unincorporated areas of the county. Historical data relating to the maps
prepared for each community are presented in Table 9.
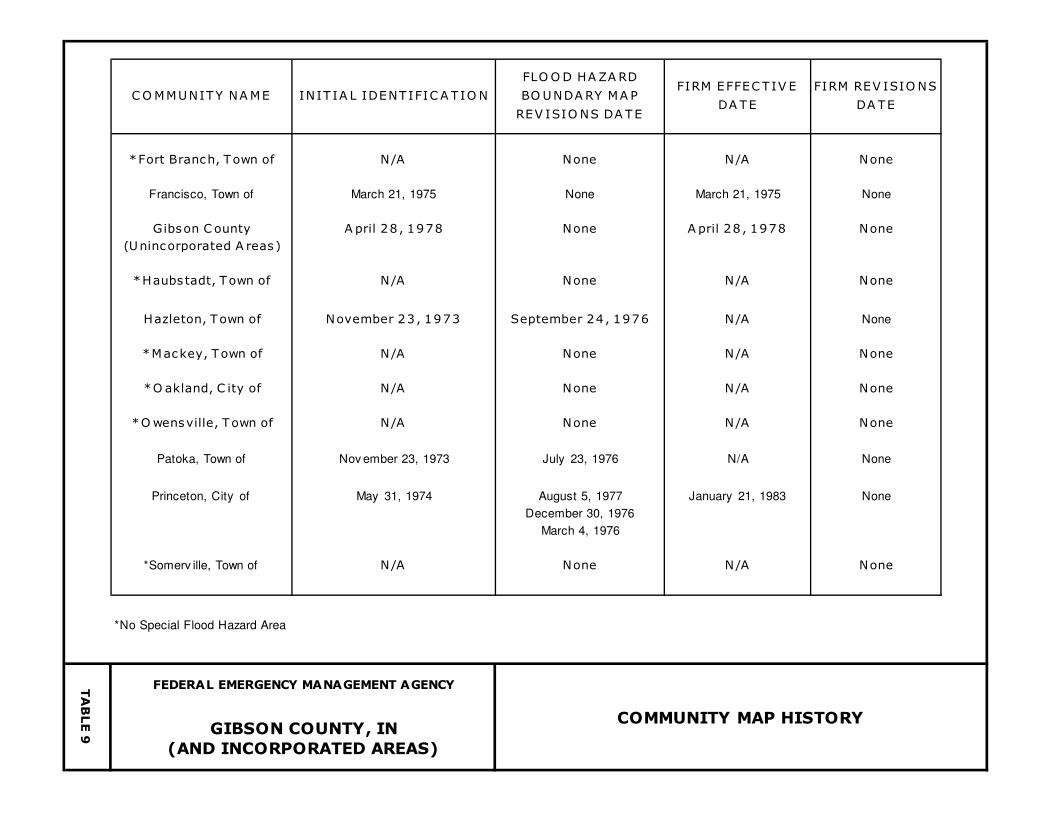
*Fort Branch, Town of N/A None N/A None
Francisco, Town of March 21, 1975 None March 21, 1975 None
Gibson C ounty A pril 28 , 1978 None A pril 28 , 1978 None
(Unincorporated A reas)
*Haubstadt, Town of N/A None N/A None
Hazleton, Town of November 23, 1973 September 24, 1976 N/A None
*Mackey, Town of N/A None N/A None
*O akland, C ity of N/A None N/A None
*Owensville, Town of N/A None N/A None
Patoka, Town of Nov ember 23, 1973 July 23, 1976 N/A None
Princeton, City of May 31, 1974 August 5, 1977 January 21, 1983 None
December 30, 1976
March 4, 1976
*Somerv ille, Town of N/A None N/A None
*No Special Flood Hazard Area
FIRM REV ISIO NS
DA TE
COMMUNITY MAP HISTORY
FEDERAL EMERGENCY MANAGEMENT AGENCY
GIBSON COUNTY, IN
(AND INCORPORATED AREAS)
TABLE 9
COMMUNITY NAME INIT IA L IDENTIFICA T IO N
FLOOD HA ZARD
BOUNDARY MA P
REV ISIO NS DA TE
FIRM EFFECT IV E
DA TE
18
7.0 OTHER STUDIES
This FIS report either supersedes or is compatible with all previous studies on streams studied in
this report and should be considered authoritative for purposes of the NFIP.
8.0 LOCATION OF DATA
Information concerning the pertinent data used in the preparation of this study can be obtained by
contacting the Flood Insurance and Mitigation Division, Federal Emergency Management
Agency, Region V, 536 S. Clark Street, 6th
Floor, Chicago, IL 60605
9.0 BIBLIORAPHY AND REFERENCES
1. “Historic Census Counts for Indiana Counties, 1900-2000” STATS Indiana, Indiana Business
Research Center, Indiana University Kelley School of Business, accessed at
http://www.stats.indiana.edu/population/PopTotals/historic_counts_counties.asp.
2. “Historic Census for Indiana Incorporated and Census Designated Places from 1900 to 2000”
STATS Indiana, Indiana Business Research Center, Indiana University Kelley School of
Business, accessed
athttp://www.stats.indiana.edu/population/PopTotals/historic_counts_cities.asp
3. Indiana Administrative Code 310 IAC 10 Flood Plain Management accessed at
http://www.in.gov/legislative/iac/T03120/A00100.PDF
4. Indiana Code IC 14-28-1, Flood Control Act, accessed at
http://www.in.gov/legislative/ic/code/title14/ar28/ch1.html
5. Indiana Department of Natural Resources, Division of Water, High Water Profile, Wabash
River, October 1971.
6. Indiana Department of Natural Resources, Division of Water, Profile, White River, September
1975.
7. http://www.in.gov/dnr/water/surface_water/coordinated_discharges/index.html
8. Indiana Department of Natural Resources, Division of Water, General Guidelines For The
Hydrologic-Hydraulic Assessment Of Floodplains In Indiana, December 2002.
9. Knipe, David, and Rao, A. R. Estimation of Peak Discharges of Indiana Streams by Using the
Log Pearson III Distribution, Purdue University, School of Civil Engineering, Joint
Transportation Research Program, Project No. C-36-620, File No. 9-8-15, 2005.
10. National Oceanic and Atmospheric Administration, National Climatic Data Center, Monthly
Station Normals of Temperature, Precipitation, and Heating and Cooling Days, 1971-2000,
Climatography of the United States No. 81, 2002.
11. State of Indiana, Department of Natural Resources, Division of Water, Oakland City, Indiana
Problems and Solutions, 1980.
12. U.S. Department of Agriculture, Soil Conservation Service, Flood Plain Management Study,
Gibson County, Indiana, March 1984.

19
13. U.S. Army Corps of Engineers, HEC-2 Water-Surface Profiles Computer Program 723-X6,
L202A, Davis, California, November 1976.
14. U.S. Army Corps of Engineers, Louisville District, Planning Assistance to States, Blair Ditch
and McCarty Ditch Watersheds Gibson County, Indiana, FINAL REPORT September 2006.
15. U.S. Department of the Interior, Geological Survey, Water Resources Investigation 35-75,
Statistical Summaries of Indiana Streamflow Data, February 1976.
16. U.S. Geological Survey, Surface-Water Data for Indiana, Peak-Flow Data for Gibson County.
http://nwis.waterdata.usgs.gov/in/nwis/peak.
390
395
400 400
405 405
410 410
415 415
420 420
425 425
430 430
435 435
20000 21000 22000 23000 24000 25000 26000 27000 28000 29000 30000 31000 32000 33000
ELE
VA
TIO
N IN
FEET
(N
AV
D 8
8)
STREAM DISTANCE IN FEET ABOVE MOUTH
FED
ER
AL
EM
ER
GEN
CY
MA
NA
GEM
EN
T A
GEN
CY
GIB
SO
N C
OU
NT
Y,
INA
ND
IN
CO
RP
OR
AT
ED
AR
EA
S
FLO
OD
PR
OFI
LES
BR
OW
N D
ITC
H
01P
A B
CR
20
0 S
LEGEND
0.2% ANNUAL CHANCE FLOOD
1% ANNUAL CHANCE FLOOD
2% ANNUAL CHANCE FLOOD
10% ANNUAL CHANCE FLOOD
STREAM BED
CROSS SECTION LOCATION
LIM
IT O
F D
ET
AIL
ED
ST
UD
Y
405
410
415 415
420 420
425 425
430 430
435 435
440 440
445 445
450 450
33000 34000 35000 36000 37000 38000 39000 40000 41000 42000 43000 44000 45000 46000
ELE
VA
TIO
N IN
FEET
(N
AV
D 8
8)
STREAM DISTANCE IN FEET ABOVE MOUTH
FED
ER
AL
EM
ER
GEN
CY
MA
NA
GEM
EN
T A
GEN
CY
GIB
SO
N C
OU
NT
Y,
INA
ND
IN
CO
RP
OR
AT
ED
AR
EA
S
FLO
OD
PR
OFI
LES
BR
OW
N D
ITC
H
02P
C
LEGEND
0.2% ANNUAL CHANCE FLOOD
1% ANNUAL CHANCE FLOOD
2% ANNUAL CHANCE FLOOD
10% ANNUAL CHANCE FLOOD
STREAM BED
CROSS SECTION LOCATION
LIM
IT O
F D
ET
AIL
ED
ST
UD
Y
380
390
400 400
410 410
420 420
430 430
440 440
450 450
460 460
470 470
35000 36000 37000 38000 39000 40000 41000 42000 43000 44000 45000 46000 47000 48000
ELE
VA
TIO
N IN
FEET
(N
AV
D 8
8)
STREAM DISTANCE IN FEET ABOVE MOUTH
FED
ER
AL
EM
ER
GEN
CY
MA
NA
GEM
EN
T A
GEN
CY
GIB
SO
N C
OU
NT
Y,
INA
ND
IN
CO
RP
OR
AT
ED
AR
EA
S
FLO
OD
PR
OFI
LES
MC
CA
RT
Y D
ITC
H
03P
A B C D E F G
H
PR
IVA
TE D
RIV
E
US
RO
UT
E 4
1 S
OU
TH
US
RO
UT
E 4
1 N
OR
TH
PR
IVA
TE D
RIV
E
RR
BR
IDG
E
RR
BR
IDG
E
RR
BR
IDG
E
LEGEND
0.2% ANNUAL CHANCE FLOOD
1% ANNUAL CHANCE FLOOD
2% ANNUAL CHANCE FLOOD
10% ANNUAL CHANCE FLOOD
STREAM BED
CROSS SECTION LOCATION
LIM
IT O
F D
ET
AIL
ED
ST
UD
Y
420
430
440 440
450 450
460 460
470 470
480 480
490 490
500 500
510 510
48000 49000 50000 51000 52000 53000 54000 55000 56000 57000 58000 59000 60000 61000
ELE
VA
TIO
N IN
FEET
(N
AV
D 8
8)
STREAM DISTANCE IN FEET ABOVE MOUTH
FED
ER
AL
EM
ER
GEN
CY
MA
NA
GEM
EN
T A
GEN
CY
GIB
SO
N C
OU
NT
Y,
INA
ND
IN
CO
RP
OR
AT
ED
AR
EA
S
FLO
OD
PR
OFI
LES
MC
CA
RT
Y D
ITC
H
04P
I J K L
M
N
CO
UN
TY
FA
IRG
RO
UN
D
CO
UN
TY
FA
IRG
RO
UN
D
CO
UN
TY
FA
IRG
RO
UN
D
N.
EM
BR
EE S
T.
PED
ES
TR
IAN
BR
IDG
E
OLD
U.S
. 4
1
LEGEND
0.2% ANNUAL CHANCE FLOOD
1% ANNUAL CHANCE FLOOD
2% ANNUAL CHANCE FLOOD
10% ANNUAL CHANCE FLOOD
STREAM BED
CROSS SECTION LOCATION
LIM
IT O
F D
ET
AIL
ED
ST
UD
Y
400
405
410 410
415 415
420 420
425 425
430 430
435 435
440 440
445 445
0 500 1000 1500 2000 2500 3000 3500 4000 4500 5000 5500 6000 6500
ELE
VA
TIO
N IN
FEET
(N
AV
D 8
8)
STREAM DISTANCE IN FEET ABOVE MOUTH
FED
ER
AL
EM
ER
GEN
CY
MA
NA
GEM
EN
T A
GEN
CY
GIB
SO
N C
OU
NT
Y,
INA
ND
IN
CO
RP
OR
AT
ED
AR
EA
S
FLO
OD
PR
OFI
LES
RI C
HLA
ND
CR
EEK
05P
A B
C
HW
Y 6
4
BR
IDG
E
HW
Y 4
1 N
OR
TH
BR
IDG
E
LEGEND
0.2% ANNUAL CHANCE FLOOD
1% ANNUAL CHANCE FLOOD
2% ANNUAL CHANCE FLOOD
10% ANNUAL CHANCE FLOOD
STREAM BED
CROSS SECTION LOCATION
LIM
IT O
F D
ET
AIL
ED
ST
UD
Y
425
430
435 435
440 440
445 445
450 450
455 455
460 460
465 465
470 470
6500 7000 7500 8000 8500 9000 9500 10000 10500 11000 11500 12000 12500 13000
ELE
VA
TIO
N IN
FEET
(N
AV
D 8
8)
STREAM DISTANCE IN FEET ABOVE MOUTH
FED
ER
AL
EM
ER
GEN
CY
MA
NA
GEM
EN
T A
GEN
CY
GIB
SO
N C
OU
NT
Y,
INA
ND
IN
CO
RP
OR
AT
ED
AR
EA
S
FLO
OD
PR
OFI
LES
RI C
HLA
ND
CR
EEK
06P
D E
F
S. S
PR
ING
ST
.
LEGEND
0.2% ANNUAL CHANCE FLOOD
1% ANNUAL CHANCE FLOOD
2% ANNUAL CHANCE FLOOD
10% ANNUAL CHANCE FLOOD
STREAM BED
CROSS SECTION LOCATION
LIM
IT O
F D
ET
AIL
ED
ST
UD
Y
Recommended