1
Getting started with Virtual Platforms:A Software Developer Prespective
Virtual Platform WorkshopDAC 09, San Francisco
Achim Nohl, CoWare IncBooth Number 3665 located in the North Hall

2
ObjectiveObjective
Objective: Provide illustrative examples on how
Virtual Platforms are used for debugging.
Non-Objective: Provide a complete feature- and
benefit-list of Virtual Platforms.

3
OutlineOutline
SW Developers‘s Views
Debugging on the boundary of HW and SW
Virtual Platform based Debugging
Platform Level Software Analysis
Virtual Platfrom Scripting
– Tracing
– Software Assertions
Summary

4
Embedded Software Design TasksEmbedded Software Design Tasks
Pre-/Post-Silicon
Validation
Optimization
Porting/Bring-Up/
Development
Embed.SoftwareDesignTasks
Debugging
Presentation focus

5
PerspectivesPerspectives
User
OS
Kern
el
Applic
atr
ion
MIiddle
ware
Drivers
Mem
ory
Map
Software
CPU(s)CPU(s)
SystemMemorySpace
Data
Peripherals
SystemMemorySpace
Data
Peripherals
CPUs
LCD/TSCLCD/TSC
DMADMA
TimerTimer
Inte
rrupt C
ontr
rolll
er
Inte
rrupt C
ontr
rolll
er
Key IFKey IF
UARTUART
USBUSB
Modem SSModem SS
Video SSVideo SS
Audio SSAudio SS
Peripherals
Gap

6
User‘s ViewUser‘s View
[DEMO: Android Phone UI with Android AMP skin]

7
Example:Device Key PressExample:Device Key Press
Lin
ux O
S K
ern
el
Andro
id P
hone D
eskto
p
Andro
id S
W P
latform
Drivers
Mem
ory
Map
CPU(s)CPU(s)
SystemMemorySpace
Data
Peripherals
SystemMemorySpace
Data
Peripherals
LCD/TSCLCD/TSC
DMADMA
TimerTimer
Inte
rrupt C
ontr
rolll
er
Inte
rrupt C
ontr
rolll
er
Key IFKey IF
UARTUART
USBUSB
Modem SSModem SS
Video SSVideo SS
Audio SSAudio SS
Key IFKey IF
Lin
ux O
S K
ern
el
Keyboard
Driver
Input H
andle
r
Handle
Pre
ss B
ack

8
SW Debug
Example:Device Key PressExample:Device Key Press
Lin
ux O
S K
ern
el
Andro
id P
hone D
eskto
p
Andro
id S
W P
latform
Drivers
Mem
ory
Map
CPU(s)CPU(s)
SystemMemorySpace
Data
Peripherals
SystemMemorySpace
Data
Peripherals
LCD/TSCLCD/TSC
DMADMA
TimerTimer
Inte
rrupt C
ontr
rolll
er
Inte
rrupt C
ontr
rolll
er
Key IFKey IF
UARTUART
USBUSB
Modem SSModem SS
Video SSVideo SS
Audio SSAudio SS
Key IFKey IF
What if something goes wrong ?
?

9
Debugging ProcessDebugging Process
Analyze symptomWhat worked ?
What did not work?
Analyze cause
Why did it not work?
Potential
causeidentified ?
Run & validatesoftware
Adapt codeModify & build software
ExpectedBehavior ?
Preparedebug iteration
(e.g. earlier breakpoints)
DoneStart
Yes
No
No
Yes

10
Virtual Platform PerspectiveVirtual Platform Perspective
OS
Kern
el
Applic
atr
ion
MIiddle
ware
Drivers
Mem
ory
Map
CPU(s)CPU(s)
SystemMemorySpace
Data
Peripherals
SystemMemorySpace
Data
Peripherals
LCD/TSCLCD/TSC
DMADMA
TimerTimer
Inte
rrupt C
ontr
rolll
er
Inte
rrupt C
ontr
rolll
er
Key IFKey IF
UARTUART
USBUSB
Modem SSModem SS
Video SSVideo SS
Audio SSAudio SS
Virtual Platform Based Debug Perspective
Synchronous system controlFull and consistent system visibility

11
Time and Space During DebugTime and Space During Debug
Software initiatet system activity:
Example: Timer dies
What code should I look at and debug?
Hardware initiated system activity:
Example: Device key press
What time should I stop to debug?
Software initiatet system activity:
Example: Timer dies
What code should I look at and debug?
Hardware initiated system activity:
Example: Device key press
What time should I stop to debug?

12
Watchpoints: Fast Track to the ProblemWatchpoints: Fast Track to the Problem
Getting to the code:
– Need to determine the code that configures/ corrupts the peripheral
– A: Software access watchpoint
Getting to a point in time
– Need to closely investigate the SW reaction on an event generated by the HW
– B: Hardware access watchpoint
– C: Signal watchpoint
Key IFKey IFMappedRegisters
InternalRegisters
Device
Keys
Interrupt
Controller
A
B C

13
WatchpointsWatchpoints

14
Platform Level Software DebuggingPlatform Level Software Debugging
Core #2simulator
Core #2simulator
Control & Inspection LayerControl & Inspection Layer
GPIO 2GPIO 2
TimerTimer
VIC 2VIC 2
Core #1simulator
Core #1simulator
GPIO 1GPIO 1
VIC 1VIC 1
VICVICMappedRegisters
InternalRegisters
BusPort
Signal
CoreCore
CoreRegisters
BusPort
TimerTimer
TCL Scripting InterfaceTCL Scripting Interface
Virtual Platform AnalyzerVirtual Platform Analyzer
E.g.:
ARM926EJS_0 step_core
VIC_1/EnableMask get_value
Break-/Watch-point
Visible Register
Visible Signal
Visible Code
SW Debugger

15
Platform Level Software AnalysisPlatform Level Software Analysis
OS/Bootloader
Drivers
Middleware
Applications
Drivers
Middleware
Applications
FirmwareOS/Bootloader
(Multi-Core) Hardware Platform
Domain BDomain A Domain C
Debugging: Analyze a snaphot of the system state
Challenge: Understand/analyze system history
– Interaction between HW and SW entities over time
Requierement: System level tracing of HW/SW

16
Platform Level Software AnalysisPlatform Level Software Analysis
Control & Inspection InterfaceControl & Inspection Interface
Core #1simulator
Core #1simulator
TIMER 1TIMER 1
MEM 1MEM 1
Platform Level AnalysisPlatform Level Analysis
VIC 1VIC 1
Core #2simulator
Core #2simulator
TIMER 2TIMER 2
MEM 2MEM 2
VIC 2VIC 2
Shared MemoryShared Memory
boot
kthread
irq_timer
decompress
time
OS Context Tracing Core A
irq_enter
vic_mask_irq
handle_level_irq
asm_do_IRQ
time
Context’s Function Tracing
c002b62c: MOV R0, R4
c002b630: MOV R1, R5
c002b634: MOV R2, R6
c002b638: MOV R14, R15
c002b6ec: LDR R15,[R5,#0]
Instruction Tracing
t
i
me
VIC 1
Shared MEM
MEM 1
TIMER 1
time
Platform Memory Access Tracing
idle
h264_decode
soft_irq
boot
time
OS Context Tracing Core B

17
Platform Level Software AnalysisPlatform Level Software Analysis

18
Platform Level Software AnalysisPlatform Level Software Analysis

19
Virtual Platform ScriptingVirtual Platform Scripting
Core #2simulator
Core #2simulator
Control & Inspection LayerControl & Inspection Layer
GPIO 2GPIO 2
TimerTimer
VIC 2VIC 2
Core #1simulator
Core #1simulator
GPIO 1GPIO 1
VIC 1VIC 1
TimerTimer
TCL Scripting InterfaceTCL Scripting Interface
Virtual Platform AnalyzerVirtual Platform Analyzer
E.g.:
ARM926EJS_0 step_core
VIC_1/EnableMask get_value
Scripting Use Cases:
Determinstic repetition
of scenarios
Regressionizing
Analyzing
Debugging
20
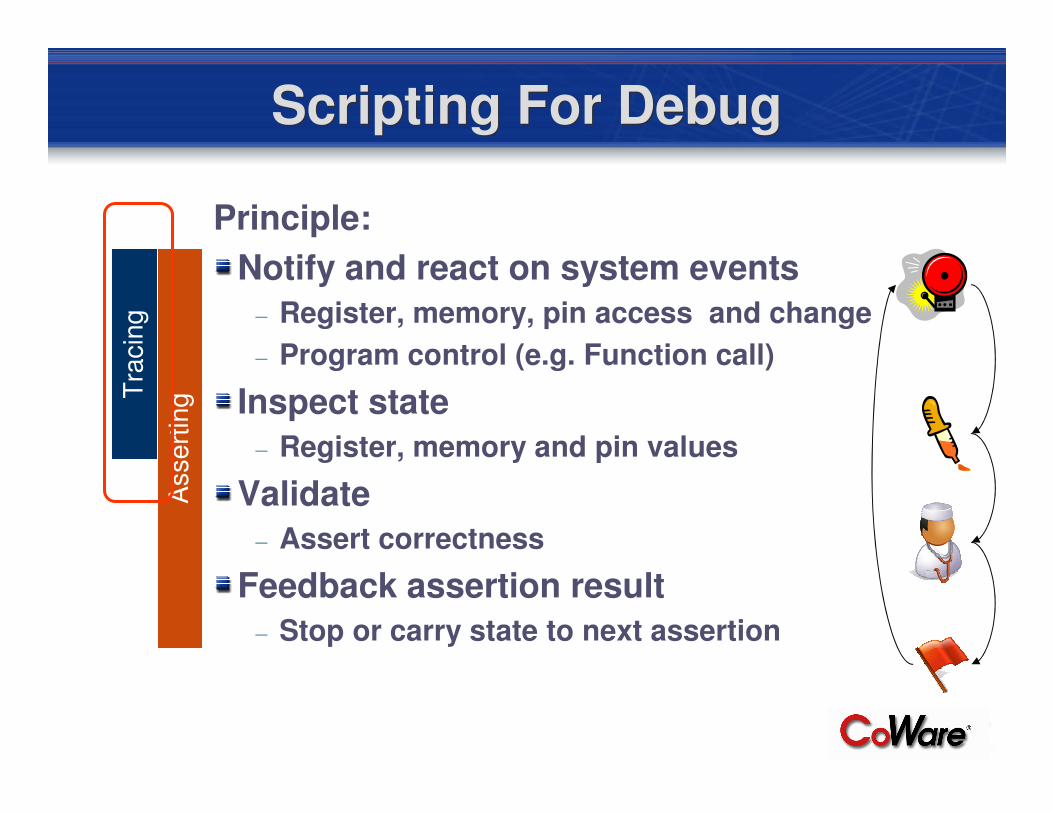
Scripting For DebugScripting For Debug
Principle:
Notify and react on system events
– Register, memory, pin access and change
– Program control (e.g. Function call)
Inspect state
– Register, memory and pin values
Validate
– Assert correctness
Feedback assertion result
– Stop or carry state to next assertion
Tra
cin
g
Assert
ing
21
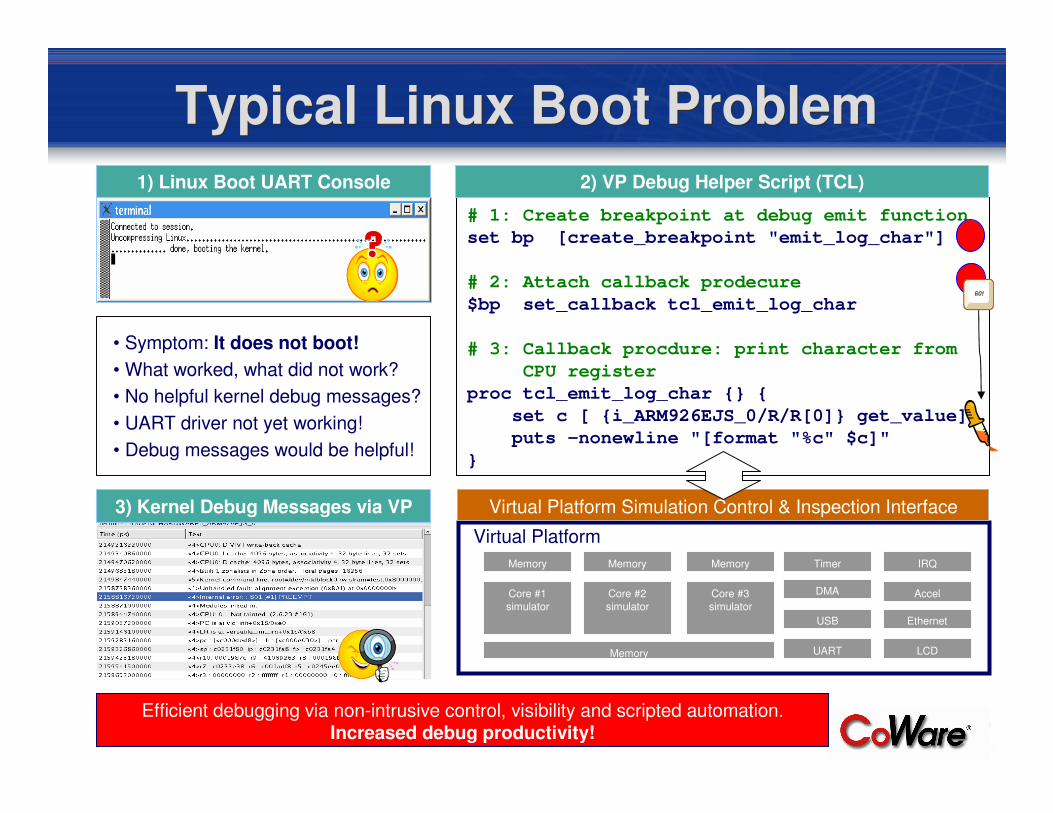
Typical Linux Boot ProblemTypical Linux Boot Problem
# 1: Create breakpoint at debug emit function
set bp [create_breakpoint "emit_log_char"]
# 2: Attach callback prodecure
$bp set_callback tcl_emit_log_char
# 3: Callback procdure: print character from
CPU register
proc tcl_emit_log_char {} {
set c [ {i_ARM926EJS_0/R/R[0]} get_value]
puts -nonewline "[format "%c" $c]"
}
2) VP Debug Helper Script (TCL)
Core #1
simulator
Core #2
simulator
LCDUART
Ethernet
Timer
DMACore #3
simulator
Memory
Virtual Platform
IRQ
Accel
Memory Memory Memory
USB
Virtual Platform Simulation Control & Inspection Interface
1) Linux Boot UART Console
• Symptom: It does not boot!
• What worked, what did not work?
• No helpful kernel debug messages?
• UART driver not yet working!
• Debug messages would be helpful!
3) Kernel Debug Messages via VP
Efficient debugging via non-intrusive control, visibility and scripted automation.Increased debug productivity!

22
Scripting For DebugScripting For Debug
Principle:
Notify and react on system events
– Register, memory, pin access and change
– Program control (e.g. Function call)
Inspect state
– Register, memory and pin values
Validate
– Assert correctness
Feedback assertion result
– Stop or carry state to next assertion
Tra
cin
g
Assert
ing

23
Kernel Memory CorruptionKernel Memory Corruption
“My kernel shows sporadic kernel panic problems.
How can I assert a memory corruption in the
kernel?”
“My kernel shows sporadic kernel panic problems.
How can I assert a memory corruption in the
kernel?”
Read un-initialized memory Buffer overrunFaulty heap memory mgmt.
Kernel Memory Corruption Categories
Memory leaksKernel heap corruption
Delayed crash of kernel activities (scheduler, threads...)
Most times immediate unpredictable kernel behavior
Kernel Memory Corruption Symptoms
Memory corruption defects severely increase the system vulnerability
char * tmp = (char*) malloc(strlen(str));strcpy(tmp, str);
Typical code prone to a buffer overrun
irq
khelper
kthread
time
History of a buffer overrun defect

24
Memory Address SpaceMemory Address Space
allo
cate
d h
eap a
rea
slob_page_alloc(int size,int align,int addr)
- Probe parameters: address, size- Set watchpoint at address + size
Virtual Platform Callback (Pseudo Code)
set watchpoint
Linux kernel function:
Kernel Memory CorruptionKernel Memory Corruption

25
Kernel Memory CorruptionKernel Memory Corruption
Demo: Linux SLOB (Simple List Of Blocks) Allocator – Virtual Platform Assertion

26
Multi-core Driver ExampleMulti-core Driver Example
OS AOS A
H.264 Decoder Firmware
H.264 Decoder Firmware
CPU 2CPU 2CPU 0CPU 0
IRQ/TimerIRQ/Timer
MemoryMemory
IRQ/TimerIRQ/Timer
MemoryMemory
Shared Address Space (used by driver and firmware)Shared Address Space (used by driver and firmware)
Shared Address SpaceShared Address Space
write
read
h.264data
empty
start offset
size
write pos
read pos
H.264 Stream DriverH.264 Stream Driver
cat video.264 > /dev/h264cat video.264 > /dev/h264H.264 Stream Device Example
Linux H.264 stream device� Driver on CPU 0, provides data to
� H.264 decoder firmware on CPU 2
Control/Synchronization
� Interrupts
� Mutex/Semaphores
Data streaming� Circular buffer in shared memory

27
Multi-core Driver ExampleMulti-core Driver Example
Shared Address Space – Circular BufferShared Address Space – Circular Buffer
start offset
size
write pos
read pos
empty(to be written)
data(to be read)
data(to be read)
CPU 0
CPU 0
Implementation issues
• Buffer overrun
• Race condition/data corruption
• Starvation
Debugging challenges
• Become aware of a defect
• Sporadic decoding errors
(e.g. frames dropped)
System level software assertion
• Protected address regions,
• through VP region watch-points
• Dynamically adjusted,
• on every circular buffer update
CPU 2

28
Multi-core Driver ExampleMulti-core Driver Example
Shared Address SpaceShared Address Space
start offset
size
write pos
read pos
empty(to be written)
data(to be read)
data(to be read)
update_watch_region_cpu_0
update_watch_region_cpu_1
Virtual Platform Callback Pseudo Code
CPU_0 set_range_watchpoint read
$start_offset $write_pos-1
CPU_1 set_range_watchpoint write
$write_pos $read_pos-1
System level software assertion
• Watch-points on circular buffer pointers
• trigger updates of the watch-regions.
• Platform execution is suspended,
• as soon as memory is accessed illegally.

29
Multi-core Driver ExampleMulti-core Driver Example

30
Multi-core Driver ExampleMulti-core Driver Example
31
SummarySummary
We have used Virtual Platforms...
– to identify, analyze and assert software defects.
– by means of real-world hardware and software
examples.
We have seen Virtual Platforms...
– provide non-intrusive and deterministic
• Control & Visibility
– enable novel debug solutions,
– with less guessing and more analysis,
– resulting in increased productivity,
– for embedded software development.

32
Thank You!Thank You!
Recommended