
Electronic Design and
Manufacturing International
Genius Energy Meter User Manual
R e v i s i o n D
R e l e a s e D a t e : 1 1 t h M a y 2 0 0 4 1 6 8 0 - E - 0 0
EDMI Pty Ltd 162 South Pine Rd Brendale, Qld, 4500 Australia
E.D.M.I. (Asia) Pte Ltd
Level 3 No.47 Yishun Industrial Park A
Singapore 768724

© Copyright 1999-2004, Electronic Design and Manufacturing International Pty Ltd.
All rights reserved.
Genius is a registered tradename of E.D.M.I. Pty. Ltd.
Other product names are trademarks or registered trademarks of their respective owners.

TABLE OF CONTENTS
Chapter 1 Introduction................................................................................ 1-1 What’s in this manual? ....................................................................................................................... 1-1 Conventions used in this manual........................................................................................................ 1-2 For more information.......................................................................................................................... 1-2
Part I Fundamentals
Chapter 2 The Meter ................................................................................... 2-1 Dimensions and Mounting ................................................................................................................. 2-1 External Features................................................................................................................................. 2-3 Under the Terminal Cover.................................................................................................................. 2-4 Under the Meter Lid............................................................................................................................ 2-6
The Config Jumper ...................................................................................................................... 2-7 CT to VT Links............................................................................................................................ 2-8
Connections in Detail.......................................................................................................................... 2-9 Current and Voltage..................................................................................................................... 2-9 Auxiliary Supply........................................................................................................................ 2-10 RS-232........................................................................................................................................ 2-11 RS-485........................................................................................................................................ 2-12 FLAG Port.................................................................................................................................. 2-12 ANSI Port................................................................................................................................... 2-12 EziPort ........................................................................................................................................ 2-12 Inputs .......................................................................................................................................... 2-12 Outputs ....................................................................................................................................... 2-13 Battery ........................................................................................................................................ 2-13
LCD/Select Button............................................................................................................................ 2-13 Default Display .......................................................................................................................... 2-14
Billing Reset Button.......................................................................................................................... 2-15 Measurement Conventions............................................................................................................... 2-16 Servicing............................................................................................................................................ 2-16
Chapter 3 EziView Basics ........................................................................... 3-1 Installation ........................................................................................................................................... 3-1
System Requirements .................................................................................................................. 3-1 To install EziView ....................................................................................................................... 3-1
EziView Tutorial................................................................................................................................. 3-2 CD Keys....................................................................................................................................... 3-2 Running EziView......................................................................................................................... 3-4 Sites............................................................................................................................................... 3-5 Site Properties .............................................................................................................................. 3-8 Mapping a Site ........................................................................................................................... 3-11 Meters in EziView ..................................................................................................................... 3-12 Connecting to a meter................................................................................................................ 3-13 Online Functionality .................................................................................................................. 3-15 Disconnecting............................................................................................................................. 3-16
Bits and Pieces .................................................................................................................................. 3-17 Different Languages .................................................................................................................. 3-17 MTR File Locations................................................................................................................... 3-18
Contents i
Notes ........................................................................................................................................... 3-18
Chapter 4 Viewing Data .............................................................................. 4-1 Data Storage ........................................................................................................................................ 4-1 Link Active Icon.................................................................................................................................. 4-2 Basic Status.......................................................................................................................................... 4-2
Analogue and Alarm Status......................................................................................................... 4-2 Waveform..................................................................................................................................... 4-4 Harmonics..................................................................................................................................... 4-7 Time Of Use ............................................................................................................................... 4-10 Gated Energy.............................................................................................................................. 4-10
Online Variables................................................................................................................................ 4-11 Special Commands............................................................................................................................ 4-12
Chapter 5 Registers ...................................................................................... 5-1 What’s in a Register? .......................................................................................................................... 5-1
Register Numbers......................................................................................................................... 5-2 Register Types.............................................................................................................................. 5-2 Register Units ............................................................................................................................... 5-4 Security Groups............................................................................................................................ 5-4
Accessing Registers with EziView..................................................................................................... 5-4 General Read ................................................................................................................................ 5-5 General Write ............................................................................................................................... 5-6
Part II Configuration
Chapter 6 Configuration Basics ................................................................. 6-1 Changing Configuration...................................................................................................................... 6-1 Transferring Configuration ................................................................................................................. 6-2
Read Setup from Meter................................................................................................................ 6-2 Write Setup to Meter.................................................................................................................... 6-3 Synchronise Setup........................................................................................................................ 6-4 Compare Setup with Meter.......................................................................................................... 6-5 Automatic Transferral.................................................................................................................. 6-6
Copying Setup ..................................................................................................................................... 6-6
Chapter 7 Miscellaneous ............................................................................. 7-1 Feature Codes ...................................................................................................................................... 7-1 Extended Feature Code....................................................................................................................... 7-2 System Parameters .............................................................................................................................. 7-4
Chapter 8 External Transformers ............................................................. 8-1 Transformer Ratios.............................................................................................................................. 8-2
Chapter 9 LCD Display ............................................................................... 9-1 LCD Formatting .................................................................................................................................. 9-2
Floating Point Numbers............................................................................................................... 9-2 Units.............................................................................................................................................. 9-3
LCD Setup........................................................................................................................................... 9-4 Other display parameters ............................................................................................................. 9-6
Direct LCD control.............................................................................................................................. 9-7 Q & A................................................................................................................................................. 9-10
ii EDMI Genius User Manual

Chapter 10 Pulsing Outputs ..................................................................... 10-1 Output Hardware............................................................................................................................... 10-1 Programming Outputs....................................................................................................................... 10-2
Not Fitted.................................................................................................................................... 10-2 Off............................................................................................................................................... 10-3 Pulsing ........................................................................................................................................ 10-3 Pulsed ......................................................................................................................................... 10-4 Fixed Output and Fixed Output Persistent................................................................................ 10-4 Time Pulse.................................................................................................................................. 10-5
Output Status Information ................................................................................................................ 10-6
Chapter 11 Pulsing Inputs ........................................................................ 11-1 Physical Input Types......................................................................................................................... 11-1 Configuration .................................................................................................................................... 11-2
Pulsing Inputs from other Meters.............................................................................................. 11-4 Time Synchronisation Inputs..................................................................................................... 11-5 Input Status Reading.................................................................................................................. 11-5 Inputs for Testing Gate Control................................................................................................. 11-6 Using Inputs with EziScript Extensions ................................................................................... 11-6
Chapter 12 Date and Time........................................................................ 12-1 Consequences of Changing the Time .............................................................................................. 12-1 Changing the Time............................................................................................................................ 12-1 Year 2000 Issues ............................................................................................................................... 12-2 Timing Source................................................................................................................................... 12-2
Synchronisation from an External Source ................................................................................ 12-3 Generating an External Synchronising Pulse ........................................................................... 12-4 Loss of Power............................................................................................................................. 12-4
Daylight Saving................................................................................................................................. 12-4 How DLS affects meter operation ............................................................................................ 12-5
Time Statistics ................................................................................................................................... 12-7
Chapter 13 Time of Use............................................................................. 13-1 Overview ........................................................................................................................................... 13-2
TOU Channels ........................................................................................................................... 13-3 Rates ........................................................................................................................................... 13-3 Rate Groups................................................................................................................................ 13-4 Billing Resets ............................................................................................................................. 13-5 Overflows................................................................................................................................... 13-6 Maximum Demands .................................................................................................................. 13-6 Seasons ....................................................................................................................................... 13-7 The Scheduler/Calender ............................................................................................................ 13-7
Setup via EziView............................................................................................................................. 13-9 Channel setup............................................................................................................................. 13-9 Rates ......................................................................................................................................... 13-15 Maximum Demand.................................................................................................................. 13-20 Billing Resets ........................................................................................................................... 13-24 Seasons ..................................................................................................................................... 13-29
Clearing the TOU system ............................................................................................................... 13-31
Chapter 14 Communications.................................................................... 14-1 Optical Communications Port .......................................................................................................... 14-1 Time Windows.................................................................................................................................. 14-2 EziPort ............................................................................................................................................... 14-3 RS-485 Port ....................................................................................................................................... 14-4
Contents iii
Modems ............................................................................................................................................. 14-5
Chapter 15 Alarms/EFA............................................................................ 15-1 Alarm States ...................................................................................................................................... 15-2 Alarm Setup....................................................................................................................................... 15-3 Alarm Types ...................................................................................................................................... 15-4
Calibration Data Lost. ................................................................................................................ 15-4 Asymmetric Power..................................................................................................................... 15-4 Voltage Tolerance Error. ........................................................................................................... 15-5 VT Failure................................................................................................................................... 15-5 Reverse Power............................................................................................................................ 15-5 Incorrect Phase Rotation. ........................................................................................................... 15-5 Clock Failure. ............................................................................................................................. 15-5 User Defined............................................................................................................................... 15-6 Modem Failure. .......................................................................................................................... 15-6 RAM or LCD Failure................................................................................................................. 15-6 Program Flash Failure................................................................................................................ 15-6 Data Flash Failure. ..................................................................................................................... 15-6 Pulsing Output Overflow........................................................................................................... 15-7 Battery Failure. ........................................................................................................................... 15-7
Chapter 16 Security.................................................................................... 16-1 User’s Perspective ............................................................................................................................. 16-1 Meter Security Overview.................................................................................................................. 16-3 EziView Security............................................................................................................................... 16-5
User Groups................................................................................................................................ 16-6 Users ........................................................................................................................................... 16-7 Permissions................................................................................................................................. 16-9 Alternate Permissions Control.................................................................................................16-11 Permission Schemes.................................................................................................................16-13 Additional Security ..................................................................................................................16-13
Lost Passwords ................................................................................................................................16-14
Part III EziScript Extensions
Chapter 17 Using EziScript Extensions .................................................. 17-1 Where are EziScript extensions stored? ........................................................................................... 17-1 EziScripts using setup and Toolbox ................................................................................................. 17-2
Working with Tools ................................................................................................................... 17-3 File Locations ............................................................................................................................. 17-5 Where to next?............................................................................................................................ 17-5
Online EziScript Control................................................................................................................... 17-5 Showing what EziScript extensions are loaded........................................................................ 17-6 Loading a new EziScript extension into the meter ................................................................... 17-8 Deleting an EziScript Extension................................................................................................ 17-8 Defragmenting the EziScript Memory...................................................................................... 17-9 Disabling an EziScript Extension............................................................................................17-10
Detailed Survey Information ..........................................................................................................17-11 The Effect of Time Changes....................................................................................................17-13 Reading Survey Status .............................................................................................................17-14 Reading a Survey .....................................................................................................................17-15 Reading Survey Value Registers.............................................................................................17-16
Where from here?............................................................................................................................17-16
iv EDMI Genius User Manual

Chapter 18 Toolbox.................................................................................... 18-1 Tool Selection ................................................................................................................................... 18-1 Tool Setup ......................................................................................................................................... 18-2 Tool Properties .................................................................................................................................. 18-3
Settings ....................................................................................................................................... 18-3 Description ................................................................................................................................. 18-5 About .......................................................................................................................................... 18-6
Tools .................................................................................................................................................. 18-6
Chapter 19 Survey Tools........................................................................... 19-1 Load Survey ...................................................................................................................................... 19-2
Channels ..................................................................................................................................... 19-3 Available Channels.................................................................................................................... 19-3
Billing History Tool.......................................................................................................................... 19-5 Notes........................................................................................................................................... 19-6
Event Log Tool ................................................................................................................................. 19-7 Sag / Surge Tool.............................................................................................................................. 19-10
Chapter 20 Control Tools.......................................................................... 20-1 Chapter 21 Modem Control...................................................................... 21-1 Required setup components.............................................................................................................. 21-1 Compatible Modems......................................................................................................................... 21-1 Connection Requirements ................................................................................................................ 21-2 EziView Configuration..................................................................................................................... 21-3
Communication Parameters ...................................................................................................... 21-3 Modem Setup............................................................................................................................. 21-4
Modem EziScript .............................................................................................................................. 21-5 Trying it out....................................................................................................................................... 21-5 Enhanced Modem Script .................................................................................................................. 21-7
Output Setup............................................................................................................................... 21-8 Time Window ............................................................................................................................ 21-9
Part IV Advanced Topics
Chapter 22 Testing..................................................................................... 22-1 Using the Pulsing Outputs ................................................................................................................ 22-1 Using Gated Energy.......................................................................................................................... 22-1 Optical Gate Interface ....................................................................................................................... 22-4
Chapter 23 EziView Reading Files .......................................................... 23-5 Using Reading Files.......................................................................................................................... 23-5
Viewing Reading Result Files................................................................................................... 23-3 Example...................................................................................................................................... 23-4
Reading File Structure ...................................................................................................................... 23-4 Register values – Format ........................................................................................................... 23-6 Register Values – OutputFormat............................................................................................... 23-7 Survey Data.............................................................................................................................. 23-11
Examples ......................................................................................................................................... 23-12
Chapter 24 EziView Script Files .............................................................. 24-1 Structure............................................................................................................................................. 24-1 Program Outline................................................................................................................................ 24-3
Predefined Global Variables ..................................................................................................... 24-4
Contents v
Main Parameters......................................................................................................................... 24-4 Program Flow.................................................................................................................................... 24-4 Types.................................................................................................................................................. 24-5 Instructions......................................................................................................................................... 24-6
Basic Instructions ....................................................................................................................... 24-6 String Instructions ...................................................................................................................... 24-8 File Instructions.......................................................................................................................... 24-8 Communications Instructions..................................................................................................24-11 Variables...................................................................................................................................24-12
Debugger..........................................................................................................................................24-12 Example 1: Datagate .......................................................................................................................24-12 Example 2: Special Modem............................................................................................................24-14 Summary..........................................................................................................................................24-16
Chapter 25 Summation.............................................................................. 25-1 Using Summation.............................................................................................................................. 25-1 Quick Data Display ........................................................................................................................... 25-4 Notes .................................................................................................................................................. 25-5
Appendixes Appendix A Use with MV-90..................................................................... A-1 Setting up the meter............................................................................................................................ A-1 Notes ................................................................................................................................................... A-1 Appendix B System Specifications.............................................................B-1 Measured Quantities and Methods.................................................................................................... B-1
Notes ............................................................................................................................................ B-1
vi EDMI Genius User Manual
LIST OF TABLES
• TABLE 2-1 TERMINAL BLOCK CONNECTIONS............................................................................................... 2-5 • TABLE 2-2 RS-232 CONNECTIONS.............................................................................................................. 2-11 • TABLE 2-3 RS-485 CONNECTIONS.............................................................................................................. 2-12 • TABLE 2-4 SPECIAL DISPLAY CONTENTS ................................................................................................... 2-14 • TABLE 3-1 SITE PROPERTIES, ADVANCED PAGE SETTINGS. ...................................................................... 3-10 • TABLE 4-1 SUMMARY DEFINITIONS.............................................................................................................. 4-6 • TABLE 4-2 HARMONIC QUANTITY OPTIONS. ................................................................................................ 4-8 • TABLE 4-3 HARMONIC GRAPH OPTIONS. ...................................................................................................... 4-8 • TABLE 5-1 EXAMPLE REGISTERS ................................................................................................................. 5-1 • TABLE 5-2 TYPES OF REGISTER.................................................................................................................... 5-3 • TABLE 5-3 TYPES OF REGISTER.................................................................................................................... 5-4 • TABLE 7-1 FEATURE CODE FEATURES.......................................................................................................... 7-2 • TABLE 7-2 SYSTEM PARAMETER STRING USES. ........................................................................................... 7-4 • TABLE 9-1 LCD DATA TYPE FORMATTING................................................................................................... 9-2 • TABLE 9-2 LCD FLOATING-POINT FORMATTING EXAMPLES....................................................................... 9-2 • TABLE 9-3 LCD UNIT MULTIPLIERS. ............................................................................................................ 9-3 • TABLE 9-4 LCD UNIT EXAMPLES. ................................................................................................................ 9-4 • TABLE 9-5 LCD UNIT EXAMPLES. .............................................................................................................. 9-10 • TABLE 10-1 PULSING OUTPUT OPTIONS..................................................................................................... 10-3 • TABLE 10-2 PULSED OUTPUT OPTIONS. ..................................................................................................... 10-4 • TABLE 10-3 FIXED OUTPUT/PERSISTENT OPTIONS. ................................................................................... 10-4 • TABLE 10-4 TIME PULSE OPTIONS.............................................................................................................. 10-5 • TABLE 10-5 TIME PULSE OPTIONS.............................................................................................................. 10-5 • TABLE 11-1 PULSING INPUT MODES. .......................................................................................................... 11-2 • TABLE 11-2 PULSING INPUT FIELD DESCRIPTIONS. .................................................................................... 11-3 • TABLE 12-1 DLS EXAMPLE 1. .................................................................................................................... 12-5 • TABLE 12-2 DLS EXAMPLE 2. .................................................................................................................... 12-6 • TABLE 13-1 TIME SPECIFICATION OPTIONS. ............................................................................................... 13-8 • TABLE 13-2 SCALING FACTORS. ............................................................................................................... 13-12 • TABLE 13-3 EZIVIEW RATE SETUP COLUMNS. ......................................................................................... 13-15 • TABLE 13-4 EXAMPLE TARIFF TIMES........................................................................................................ 13-16 • TABLE 13-5 EXAMPLE TARIFF RATE ALLOCATIONS................................................................................. 13-16 • TABLE 13-6 EXAMPLE SCHEDULER COMMANDS...................................................................................... 13-16 • TABLE 13-7 EXAMPLE ALTERNATIVE SCHEDULER COMMANDS.............................................................. 13-16 • TABLE 15-1 ALARM NAMES AND FLAG LETTERS....................................................................................... 15-2 • TABLE 16-1 EXTENSION SECURITY GROUPS ........................................................................................... 16-11 • TABLE 17-1 TOOL ICONS IN EZIVIEW......................................................................................................... 17-3 • TABLE 17-2 EZISCRIPT EXTENSION ICONS IN EZIVIEW. ............................................................................ 17-6 • TABLE 17-3 EXTENSION TOTAL MEMORY STATISTICS............................................................................... 17-7 • TABLE 17-4 ALARM NAMES AND FLAG LETTERS..................................................................................... 17-12 • TABLE 17-5 EZIVIEW SURVEY EXTENSION CHANNEL STATISTICS. ......................................................... 17-15 • TABLE 17-6 EZIVIEW SURVEY EXTENSION STATISTICS. .......................................................................... 17-15 • TABLE 19-1 EVENT LOG EVENTS AND GROUPINGS.................................................................................... 19-8 • TABLE 19-2 EVENT LOG SETUP CHANGE EVENTS...................................................................................... 19-9 • TABLE 21-1 RS-232 CONNECTIONS............................................................................................................ 21-2 • TABLE 22-1 GATING MODES ...................................................................................................................... 22-2 • TABLE 23-1 READ FILE CONTROL SEQUENCES........................................................................................... 23-5 • TABLE 23-2 FORMAT CHARACTERS. .......................................................................................................... 23-6 • TABLE 23-3 OUTPUTFORMAT SPECIFIERS.................................................................................................. 23-8 • TABLE 23-4 DATE AND TIME OUTPUTFORMATS..................................................................................... 23-11 • TABLE 23-5 READING FILE EXAMPLE 1. .................................................................................................. 23-12
Contents vii

• TABLE 23-6 READING FILE EXAMPLE 2................................................................................................... 23-12 • TABLE 23-7 READING FILE EXAMPLE 3................................................................................................... 23-12 • TABLE 23-8 READING FILE EXAMPLE 4................................................................................................... 23-13 • TABLE 24-1 AVAILABLE TYPES.................................................................................................................. 24-5 • TABLE 24-2 BASIC INSTRUCTIONS. ............................................................................................................ 24-8 • TABLE 24-3 STRING INSTRUCTIONS. .......................................................................................................... 24-8 • TABLE 24-4 FILE INSTRUCTIONS. ............................................................................................................. 24-11 • TABLE 24-5 COMMUNICATIONS INSTRUCTIONS. ..................................................................................... 24-11 • TABLE 25-1 MEASUREMENTS. .....................................................................................................................B-1
viii EDMI Genius User Manual

LIST OF FIGURES
• FIGURE 2-1 OVERALL DIMENSIONS OF THE METER...................................................................................... 2-1 • FIGURE 2-2 MOUNTING POINTS. ................................................................................................................... 2-2 • FIGURE 2-3 THE METER WITH TERMINAL COVER FITTED............................................................................. 2-3 • FIGURE 2-4 UNDER THE TERMINAL COVER OF THE METER.......................................................................... 2-4 • FIGURE 2-5 TERMINAL BLOCK DIAGRAM..................................................................................................... 2-5 • FIGURE 2-6 TB1 TERMINAL SPACINGS. ........................................................................................................ 2-6 • FIGURE 2-7 LOCATION OF THE CONFIG JUMPER. ......................................................................................... 2-7 • FIGURE 2-8 LOCATION OF THE CT TO VT LINKS. ........................................................................................ 2-8 • FIGURE 2-9 METER WITH THE CT TO VT LINKS DISCONNECTED BY REMOVING SCREWS.......................... 2-8 • FIGURE 2-10 TB1 CT AND VT CONNECTIONS FOR 3 ELEMENT (TOP) AND 2 ELEMENT (BOTTOM). ........... 2-9 • FIGURE 2-11 CONNECTIONS FOR 3 ELEMENT WHOLE CURRENT, TB1....................................................... 2-10 • FIGURE 2-12 DEFAULT LCD DISPLAY........................................................................................................ 2-14 • FIGURE 2-13 ENERGY DIRECTIONS. ........................................................................................................... 2-16 • FIGURE 3-1 EZIVIEW WELCOME SCREEN. .................................................................................................... 3-2 • FIGURE 3-2 EZIVIEW CD KEY ENTRY DIALOG. ........................................................................................... 3-2 • FIGURE 3-3 EZIVIEW CD KEY INFORMATION.............................................................................................. 3-3 • FIGURE 3-4 EZIVIEW SYSTEM CODE CONFIRMATION. ................................................................................ 3-4 • FIGURE 3-5 EZIVIEW LOGIN.......................................................................................................................... 3-4 • FIGURE 3-6 EZIVIEW MAIN SCREEN. ............................................................................................................ 3-5 • FIGURE 3-7 EZIVIEW MAIN SCREEN WITH COMPLEX SITE SETUP................................................................. 3-6 • FIGURE 3-8 EZIVIEW NEW SITE MENU OPTION............................................................................................. 3-6 • FIGURE 3-9 EZIVIEW FILE MENU NEW SITE MENU OPTION. ......................................................................... 3-7 • FIGURE 3-10 RENAMING A SITE. ................................................................................................................... 3-7 • FIGURE 3-11 EZIVIEW SITE PROPERTIES, NAME PAGE................................................................................ 3-8 • FIGURE 3-12 EZIVIEW SITE PROPERTIES, CONNECTION PAGE. ................................................................... 3-8 • FIGURE 3-13 EZIVIEW SITE PROPERTIES, ADVANCED PAGE....................................................................... 3-9 • FIGURE 3-14 EZIVIEW SITE PROPERTIES, SCRIPT PAGE............................................................................. 3-10 • FIGURE 3-15 EZIVIEW MAPPING A SITE. .................................................................................................... 3-11 • FIGURE 3-16 EZIVIEW MAPPING A NON-RESPONDING SITE....................................................................... 3-11 • FIGURE 3-17 EZIVIEW MAPPING OF A SITE COMPLETED. .......................................................................... 3-12 • FIGURE 3-18 A NEWLY MAPPED METER IN EZIVIEW. ................................................................................ 3-12 • FIGURE 3-19 EZIVIEW CONNECTING TO A METER...................................................................................... 3-13 • FIGURE 3-20 EZIVIEW CONNECTION STATUS PAGE................................................................................... 3-14 • FIGURE 3-21 EZIVIEW CONNECTION SCREEN OPTIONS............................................................................. 3-14 • FIGURE 3-22 INTERACTIVE CONNECTION. ................................................................................................. 3-15 • FIGURE 3-23 EZIVIEW ONLINE OPTIONS..................................................................................................... 3-15 • FIGURE 3-24 EZIVIEW STATUS SCREEN EXAMPLE..................................................................................... 3-16 • FIGURE 3-25 EZIVIEW OPTIONS LANGUAGE PAGE.................................................................................... 3-17 • FIGURE 3-26 EZIVIEW DIRECTORY SEARCH LIST. ...................................................................................... 3-18 • FIGURE 4-1 EZIVIEW OPTIONS FILE LOCATIONS PAGE. .............................................................................. 4-1 • FIGURE 4-2 EZIVIEW STATUS SCREEN. ........................................................................................................ 4-2 • FIGURE 4-3 EZIVIEW PHASOR SCREEN......................................................................................................... 4-3 • FIGURE 4-4 EZIVIEW WAVEFORM SCREEN.................................................................................................. 4-4 • FIGURE 4-5 EZIVIEW WAVEFORM SCREEN, OPTIONS PAGE. ....................................................................... 4-5 • FIGURE 4-6 EZIVIEW WAVEFORM SCREEN, SUMMARY PAGE..................................................................... 4-6 • FIGURE 4-7 EZIVIEW WAVEFORM SCREEN, HARMONICS GRAPH PAGE. .................................................... 4-7 • FIGURE 4-8 EZIVIEW WAVEFORM SCREEN, OPTIONS PAGE. ....................................................................... 4-7 • FIGURE 4-9 EZIVIEW WAVEFORM SCREEN, HARMONICS TABLE PAGE...................................................... 4-9 • FIGURE 4-10 SINGLE HARMONIC GRAPH..................................................................................................... 4-9 • FIGURE 4-11 EZIVIEW TIME OF USE SCREEN. ........................................................................................... 4-10 • FIGURE 4-12 EZIVIEW GATED ENERGY SCREEN. ...................................................................................... 4-10
Contents ix

• FIGURE 4-13 ONLINE VARIABLES SCREEN, DATE/TIME PAGE. ................................................................. 4-11 • FIGURE 4-14 ONLINE VARIABLES SCREEN, OPTIONS PAGE....................................................................... 4-11 • FIGURE 4-15 ONLINE VARIABLES SCREEN, SYSTEM PAGE........................................................................ 4-12 • FIGURE 5-1 GENERAL READ SCREEN............................................................................................................5-5 • FIGURE 5-2 GENERAL WRITE SCREEN. .........................................................................................................5-6 • FIGURE 6-1 METER CONFIGURATION SETUP SCREEN. .................................................................................6-1 • FIGURE 6-2 READ ALL SETUP VALUES DIALOG. ............................................................................................6-2 • FIGURE 6-3 SET TIME DIALOG........................................................................................................................6-3 • FIGURE 6-4 READ SETUP IN PROGRESS..........................................................................................................6-3 • FIGURE 6-5 SYNCHRONISE SETUP. ................................................................................................................6-4 • FIGURE 6-6 COMPARE SETUP. .......................................................................................................................6-5 • FIGURE 6-7 AUTO TRANSFER OPTIONS.........................................................................................................6-6 • FIGURE 6-8 PASTE SETUP. .............................................................................................................................6-7 • FIGURE 7-1 ONLINE VARIABLES FEATURE CODE PAGE.................................................................................7-1 • FIGURE 7-2 EXTENDED FEATURE CODE SETUP PAGE....................................................................................7-3 • FIGURE 7-3 SYSTEM PARAMETERS SETUP PAGE. ..........................................................................................7-4 • FIGURE 8-1 TRANSFORMER RATIOS PAGE IN EZIVIEW.................................................................................8-2 • FIGURE 9-1 EZIVIEW LCD SETUP. ................................................................................................................9-4 • FIGURE 9-2 EZIVIEW REGISTER SELECTION DIALOG WITH “PHASE A INSTANTANEOUS VOLTAGE”
SELECTED.....................................................................................................................................................9-5 • FIGURE 9-3 EZIVIEWONLINE VARIABLES LCD DIALOG..............................................................................9-7 • FIGURE 9-4 EZIVIEWONLINE VARIABLES LCD DIALOG, NUMBER TAB.....................................................9-8 • FIGURE 9-5 EZIVIEWONLINE VARIABLES LCD DIALOG, DISPLAY SET TAB..............................................9-8 • FIGURE 9-6 EZIVIEWONLINE VARIABLES LCD DIALOG, SCREEN TAB.......................................................9-9 • FIGURE 9-7 EZIVIEWONLINE VARIABLES LCD DIALOG, FREEZE TAB. ......................................................9-9 • FIGURE 10-1 TERMINAL BLOCK DIAGRAM................................................................................................. 10-1 • FIGURE 10-2 EZIVIEW PULSING OUTPUTS SETUP PAGE............................................................................ 10-2 • FIGURE 10-3 EZIVIEW ONLINE VARIABLES PULSING OUTPUTS PAGE. .................................................... 10-6 • FIGURE 11-1 TERMINAL BLOCK DIAGRAM................................................................................................. 11-1 • FIGURE 11-2 EZIVIEWPULSINGINPUTS SETUP PAGE.................................................................................. 11-2 • FIGURE 11-3 EZIVIEWONLINE VARIABLES PULSINGINPUTS STATUS PAGE. ............................................ 11-3 • FIGURE 11-4 EZIVIEW PULSINGINPUTS SETUP PAGE, PULSING INPUTS..................................................... 11-4 • FIGURE 11-5 EZIVIEWPULSINGINPUTS SETUP PAGE, TIME SYNCHRONISATION. ...................................... 11-5 • FIGURE 12-1 EZIVIEW DATE AND TIME PAGE. .......................................................................................... 12-1 • FIGURE 12-2 EZIVIEW DATE AND TIME SETUP PAGE................................................................................ 12-3 • FIGURE 12-3 EZIVIEW DATE AND TIME SETUP PAGE – DAYLIGHT SAVINGS........................................... 12-4 • FIGURE 13-1 TOU OVERVIEW, CELL. ......................................................................................................... 13-2 • FIGURE 13-2 TOU OVERVIEW, CHANNELS................................................................................................. 13-3 • FIGURE 13-3 TOU OVERVIEW, RATES........................................................................................................ 13-3 • FIGURE 13-4 TOU OVERVIEW, EZIVIEW OPTIONS DIALOG. ..................................................................... 13-4 • FIGURE 13-5 TOU OVERVIEW, RATE GROUPS EXAMPLE. .......................................................................... 13-4 • FIGURE 13-6 TOU OVERVIEW, BILLING RESETS. ....................................................................................... 13-5 • FIGURE 13-7 DEMAND EXAMPLE. .............................................................................................................. 13-7 • FIGURE 13-8 EZIVIEW TOUSETUP PAGE................................................................................................... 13-9 • FIGURE 13-9 REGISTER SELECTION, TOTAL EXPORT WH. ...................................................................... 13-10 • FIGURE 13-10 REGISTER SELECTION, TOTAL QUADRANT 1 WH. ............................................................ 13-10 • FIGURE 13-11 REGISTER SELECTION, PULSING INPUT 1.......................................................................... 13-11 • FIGURE 13-12 CHANNEL EXAMPLE.......................................................................................................... 13-13 • FIGURE 13-13 CHANNEL EXAMPLE, TOU STATUS.................................................................................. 13-14 • FIGURE 13-14 EZIVIEW TARIFF RATES PAGE. ......................................................................................... 13-15 • FIGURE 13-15 EZIVIEW MINUTE CALCULATOR...................................................................................... 13-17 • FIGURE 13-16 EZIVIEW RATES EXAMPLE COMPLETED. ......................................................................... 13-18 • FIGURE 13-17 EZIVIEW TOU STATUS, WITH RATES. .............................................................................. 13-19 • FIGURE 13-18 EZIVIEW ONLINE VARIABLES TARIFF PAGE. ................................................................... 13-20 • FIGURE 13-19 EZIVIEW TARIFF DEMAND SETUP PAGE........................................................................... 13-20 • FIGURE 13-20 DEMAND PERIODS EXAMPLE............................................................................................. 13-21
x EDMI Genius User Manual

• FIGURE 13-21 DEMAND PERIODS EXAMPLE EZIVIEW CONFIGURATION................................................. 13-22 • FIGURE 13-22 DEMAND PERIODS VAR EXAMPLE EZIVIEW CONFIGURATION. ........................................ 13-23 • FIGURE 13-23 DEMAND PERIODS EZIVIEW TIME OF USE STATUS.......................................................... 13-24 • FIGURE 13-24 BILLING RESETS LCD SCREEN.......................................................................................... 13-25 • FIGURE 13-25 BILLING RESETS VIA EZIVIEW.......................................................................................... 13-25 • FIGURE 13-26 ENABLING THE BILLING RESET BUTTON. ......................................................................... 13-26 • FIGURE 13-27 AUTOMATIC BILLING RESETS........................................................................................... 13-26 • FIGURE 13-28 EZIVIEW TOU STATUS SCREEN, PERIODS......................................................................... 13-28 • FIGURE 13-29 EZIVIEW SEASON CONFIGURATION. ................................................................................. 13-29 • FIGURE 13-30 EZIVIEW ONLINE VARIABLES TARIFF PAGE, CURRENT SEASON. .................................... 13-30 • FIGURE 13-31 EZIVIEW RESET TOU CONTROL....................................................................................... 13-31 • FIGURE 14-1 COMMUNICATIONS PORTS SETUP.......................................................................................... 14-1 • FIGURE 14-2 TIMEWINDOW SETUP. ............................................................................................................ 14-2 • FIGURE 14-3 EZIPORT PORT SETUP. ............................................................................................................ 14-3 • FIGURE 14-4 EZIPORT REGISTERS FOR TRANSMISSION SETUP. .................................................................. 14-4 • FIGURE 14-5 RS-485 COMMUNICATIONS SETUP. ....................................................................................... 14-5 • FIGURE 15-1 EZIVIEW STATUS SCREEN. .................................................................................................... 15-1 • FIGURE 15-2 EZIVIEW ALARMS SETUP PAGE............................................................................................. 15-3 • FIGURE 15-3 EZIVIEW USER DEFINED FLAG SETTING............................................................................... 15-6 • FIGURE 16-1 EZIVIEW LOGIN DIALOG. ...................................................................................................... 16-1 • FIGURE 16-2 SAVE MAIN PASSWORD SETTING.......................................................................................... 16-2 • FIGURE 16-3 SECURITY ONLINE VARIABLES DISPLAY.............................................................................. 16-3 • FIGURE 16-4 EZIVIEW SECURITY SETUP PAGE........................................................................................... 16-5 • FIGURE 16-5 SECURITY CHANGE CONFIRMATION...................................................................................... 16-5 • FIGURE 16-6 USERS NOT IN THE METER SETTINGS..................................................................................... 16-6 • FIGURE 16-7 EZIVIEW USER SETUP............................................................................................................ 16-7 • FIGURE 16-8 PERMISSIONS EDIT SCREEN. .................................................................................................. 16-9 • FIGURE 16-9 MODIFIED PULSINGOUTPUTS PAGE. ................................................................................... 16-10 • FIGURE 16-10 EXTRA PERMISSIONS......................................................................................................... 16-10 • FIGURE 16-11 ALTERNATE PERMISSIONS SETUP METHOD. ..................................................................... 16-12 • FIGURE 16-12 PERMISSION SCHEME OPTIONS......................................................................................... 16-13 • FIGURE 17-1 EZIVIEW EXTENSIONS SETUP PAGE...................................................................................... 17-2 • FIGURE 17-2 EZIVIEW EXTENSIONS SETUP PAGE, DETAILED VIEW. ......................................................... 17-4 • FIGURE 17-3 EZIVIEW EXTENSIONS PATH SETUP....................................................................................... 17-5 • FIGURE 17-4 EZIVIEW ONLINE VARIABLES MEMORY MAP DIALOG, LIST TAB....................................... 17-6 • FIGURE 17-5 EZIVIEW ONLINE VARIABLES MEMORY MAP DIALOG, PIE CHART TAB. ........................... 17-7 • FIGURE 17-6 EZIVIEW EXTENSION EXISTS WARNING DIALOG.................................................................. 17-8 • FIGURE 17-7 EZIVIEW EXTENSION DELETE CONFIRMATION DIALOG........................................................ 17-8 • FIGURE 17-8 EZIVIEW SHOWING MEMORY FRAGMENTATION................................................................... 17-9 • FIGURE 17-9 EZIVIEW SHOWING MEMORY AFTER DEFRAGMENTATION................................................. 17-10 • FIGURE 17-10 SURVEY STORAGE STRUCTURE. ........................................................................................ 17-11 • FIGURE 17-11 EZIVIEW SURVEY EXTENSION INFORMATION DIALOG. .................................................... 17-14 • FIGURE 17-12 DOWNLOAD SURVEY SAVE DIALOG.................................................................................. 17-16 • FIGURE 18-1 TOOLBOX TOOL SELECTION DIALOG. ................................................................................... 18-1 • FIGURE 18-2 EVENT LOG DIALOG. ............................................................................................................. 18-2 • FIGURE 18-3 TOOLBOX PROPERTIES, SETTINGS PAGE............................................................................... 18-3 • FIGURE 18-4 TOOLBOX PROPERTIES, DESCRIPTION PAGE......................................................................... 18-5 • FIGURE 18-5 TOOLBOX PROPERTIES, DESCRIPTION PAGE WITH GENERATE............................................. 18-5 • FIGURE 18-6 TOOLBOX PROPERTIES, ABOUT PAGE................................................................................... 18-6 • FIGURE 19-1 LOAD SURVEY TOOL. ............................................................................................................ 19-2 • FIGURE 19-2 LOAD SURVEY TOOL, INSTANTANEOUS PAGE. ....................................................................... 19-3 • FIGURE 19-3 LOAD SURVEY TOOL, PULSING INPUTS PAGE........................................................................ 19-4 • FIGURE 19-4 BILLING HISTORY TOOL. ....................................................................................................... 19-5 • FIGURE 19-5 BILLING PERIOD DIAGRAM. .................................................................................................. 19-6 • FIGURE 19-6 EVENT LOG TOOL. ................................................................................................................. 19-7 • FIGURE 19-7 SAG / SURGE TOOL............................................................................................................... 19-10
Contents xi

• FIGURE 21-1 EZIVIEW MODEM SETUP....................................................................................................... 21-3 • FIGURE 21-2 MODEM TOOL. ....................................................................................................................... 21-5 • FIGURE 21-3 EZIVIEW SITE PROPERTIES SETUP........................................................................................ 21-6 • FIGURE 21-4 DIALING LOCATION PROPERTIES.......................................................................................... 21-6 • FIGURE 21-5 EXTENDED MODEM CONTROL TOOL. .................................................................................. 21-7 • FIGURE 21-6 EZIVIEW PULSING OUTPUT PROPERTIES SETUP. ................................................................. 21-8 • FIGURE 21-7 EZIVIEW TIME WINDOW PROPERTIES SETUP. ..................................................................... 21-9 • FIGURE 22-1 EZIVIEW GATE CONFIGURATION........................................................................................... 22-2 • FIGURE 22-2 EZIVIEW ONLINE VARIABLES GATE STATUS. ...................................................................... 22-3 • FIGURE 22-3 EZIVIEW GATED ENERGY STATUS. ...................................................................................... 22-4 • FIGURE 23-1 EZIVIEW READING FILE SETUP. ........................................................................................... 23-5 • FIGURE 23-2 READING FILES ON THE METER MENU................................................................................... 23-2 • FIGURE 23-3 READING FILE VIEWING SETUP............................................................................................. 23-3 • FIGURE 23-4 SELECTING A VIEWER. .......................................................................................................... 23-4 • FIGURE 23-5 SURVEY OUTPUT FORMAT................................................................................................... 23-11 • FIGURE 23-6 RICH TEXT SOURCE EXAMPLE. ............................................................................................ 23-13 • FIGURE 23-7 RICH TEXT PROCESSED EXAMPLE. ...................................................................................... 23-14 • FIGURE 24-1 SIMPLE EXAMPLE................................................................................................................... 24-1 • FIGURE 24-2 COMPOUND ADD EXAMPLE. .................................................................................................. 24-1 • FIGURE 24-3 FUNCTION EXAMPLE. ............................................................................................................ 24-2 • FIGURE 24-4 VARIABLES EXAMPLE............................................................................................................ 24-3 • FIGURE 24-5 POINTER EXAMPLE. ............................................................................................................. 24-12 • FIGURE 25-1 SUMMATION MAIN SCREEN................................................................................................... 25-1 • FIGURE 25-2 SUMMATION WITH A NEW SET. ............................................................................................. 25-2 • FIGURE 25-3 SUMMATION WITH A NEW SUM. ............................................................................................ 25-3 • FIGURE 25-4 SUMMATION WITH FILES ADDED TO THE SUM. ..................................................................... 25-3 • FIGURE 25-5 DISPLAY EXAMPLE. ............................................................................................................... 25-4
xii EDMI Genius User Manual

Chapter 1 IntThis manual is for the EDMI Genius Energy Meter. It covers all aspecmeter, from basic operations such as installation, through to advanced usage. Examples are provided where possible to demonstrate applicatifeatures.
The meter is fundamentally an energy meter, measuring the basic quanVArh and VAh. Consumption data may be recorded in a load survey, use data. The meter can also measure a wide variety of instantaneous qconfiguration is extremely flexible.
If you want to get started straight away, Chapter 2 covers the installatioand Chapter 3 covers the basic use of EziView and a tutorial. These chread as a minimum.
What’s in this manual? There are four parts to this manual, as follows:
• Part I, “Fundamentals”, describes the basics of getting the meter upThis includes installing the EziView PC software and the basic usefor communicating with the meter. This part should be read compl
• Part II, “Configuration”, describes how to use the EziView softwarmeter to your application. This covers all of the basic uses of the mchapter of this part should be read, then the other chapters may be r
• Part III, “EziScript Extensions”, describes the use of EziScripts. Tthe meter enable functionality such as modems, load surveys, evenof use history.
• Part IV, “Advanced Topics”, describes the more advanced uses of includes reporting functions, and methods of testing the accuracy o
C h a p t e r
1
roduction ts of using the configuration and on of the metertities of Wh, and as time of uantities. The
n of the meter, apters should be
and running. of this software etely.
e to configure the eter. The first ead as required.
hese add-ons to t logs, and time
the meter. This f the meter.
Introduction 1-1

Conventions used in this manual All dates are in DD/MM/YY format.
References to settings or controls are printed in Italics.
The path to a specific menu option is written as:
Menu Level 1 → Menu Level 2 → Menu Level 3
. Information with special note (such as safety information) is marked with a
. Additional noteworthy information is marked with a
“Clicking” on a button or field means using the left mouse button.
n in this manual may vary slightly from the appearance of the software on your system.
Note that due to variations between computers and improvements in software, the screenshots show
For more information The best source of information should generally be this manual. The table of contenhas been organised to make finding information as easy as possible. If yhaving problems though, EDMI support may be contacted via email at
ts ou are still
[email protected]. The EDMI web site is located at www.edmi.com.au.
When contacting EDMI for support you may be asked for the meter serial number, firmware version and EziView version. The serial number is printed on the label, the serial number used in EziView to identify the meter. The firmware version is displayed on the LCD at start up, or by holding Select down for 10 seconds (See LCD/Select Button, page 2-13). It can also be displayed using EziView (See OnliVariables, p
and is
ne age 4-11). The EziView version is available under Help → About in
EziView.
All this information will help us help you.
1-2 EDMI Genius User Manual

Part I Fundam
his section of the manual covers the information and procedures rethe initial installation and setup of the meter. It also covers some bconcepts of the meter, and its basic use.
T • Chapter 2: “The Meter”
• Chapter 3: “EziView Basics”
• Chapter 4: “Viewing Data”
• Chapter 5: “Registers”
P a r t
I
entalsquired for asic
Fundamentals

Intentionally Blank
II EDMI Genius User Manual

This chapter covers the basic installation and physical features of the m
Dimensions and Mounting Figure 2-1 shows the overall dimensions of the meter. The height excland the ANSI fitting if present.
• Figure 2-1 Overall dimensions of the meter.
C h a p t e r
2
Chapter 2 The Meter eter.udes the buttons
The Meter 2-1

The mounting screw positions are shown in Figure 2-2. This is a view from the back of the meter.
79.25mm79.25mmFor mounting use 3 screws with a threaded sectionnot larger than 5mmØ with a screwhead not smallerthan 8mmØ.
• Figure 2-2 Mounting points.
The neral:
e head and the wall for the plastic around the keyhole.
2. n the screw using the keyhole in the back of the meter.
3. Insert the remaining two screws (meter base, under the terminal cover) to hold the meter securely.
meter is mounted using three screws. In ge
1. Screw the first (top) screw into the wall. Leave enough space between th
Hang the meter o
2-2 EDMI Genius User Manual
External Features
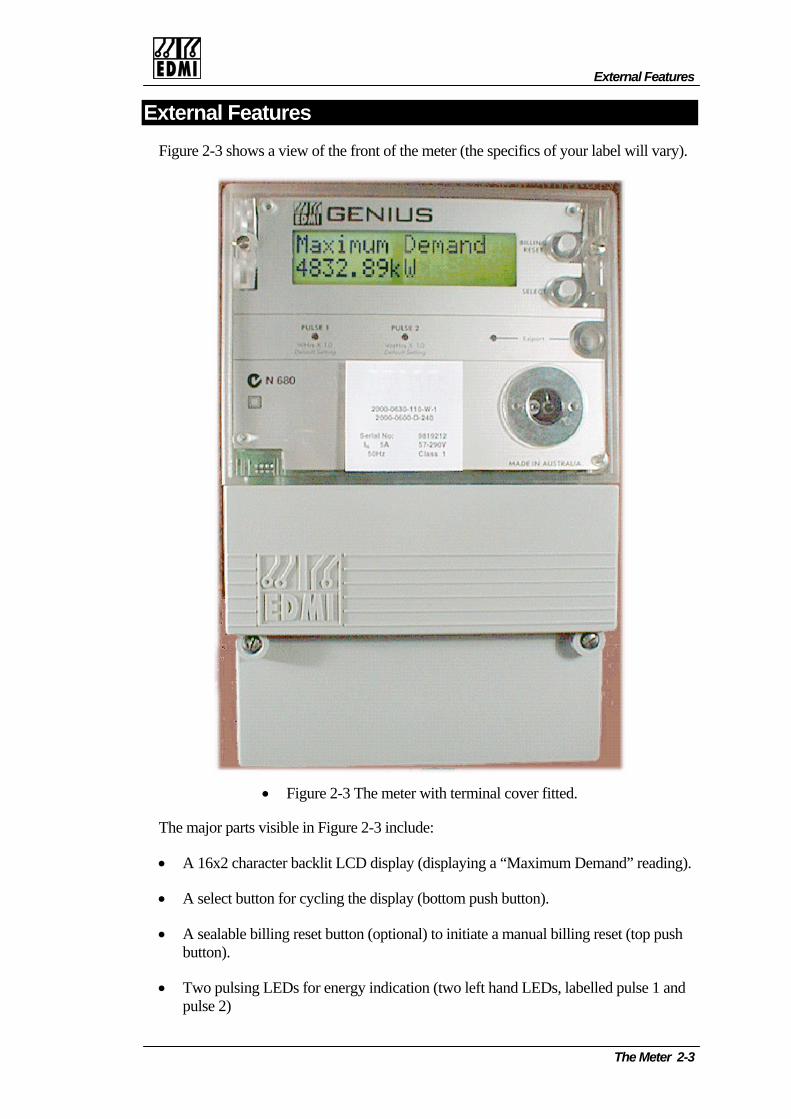
External Features Figure 2-3 shows a view of the front of the meter (the specifics of your label will vary).
• Figure 2-3 The meter with terminal cover fitted.
The major parts visible in Figure 2-3 include:
• A 16x2 character backlit LCD display (displaying a “Maximum Demand” reading).
• A select button for cycling the display (bottom push button).
• A sealable billing reset button (optional) to initiate a manual billing reset (top push button).
• Two pulsing LEDs for energy indication (two left hand LEDs, labelled pulse 1 and pulse 2)
The Meter 2-3
• A FLAG or ANSI port for local connection.
the terminal cover) is the terminal block for voltage and current measurement, as well as connectors for the pulsing inputs and outputs (optional), and for the optional RS-232 or RS-485 interface.
The sealable screws have 2.7mm diameter holes to accommodate standard sealing wire.
• EziPort socket with activity indicator LED (optional).
Beneath the terminal cover (accessible by removing the two sealable screws on
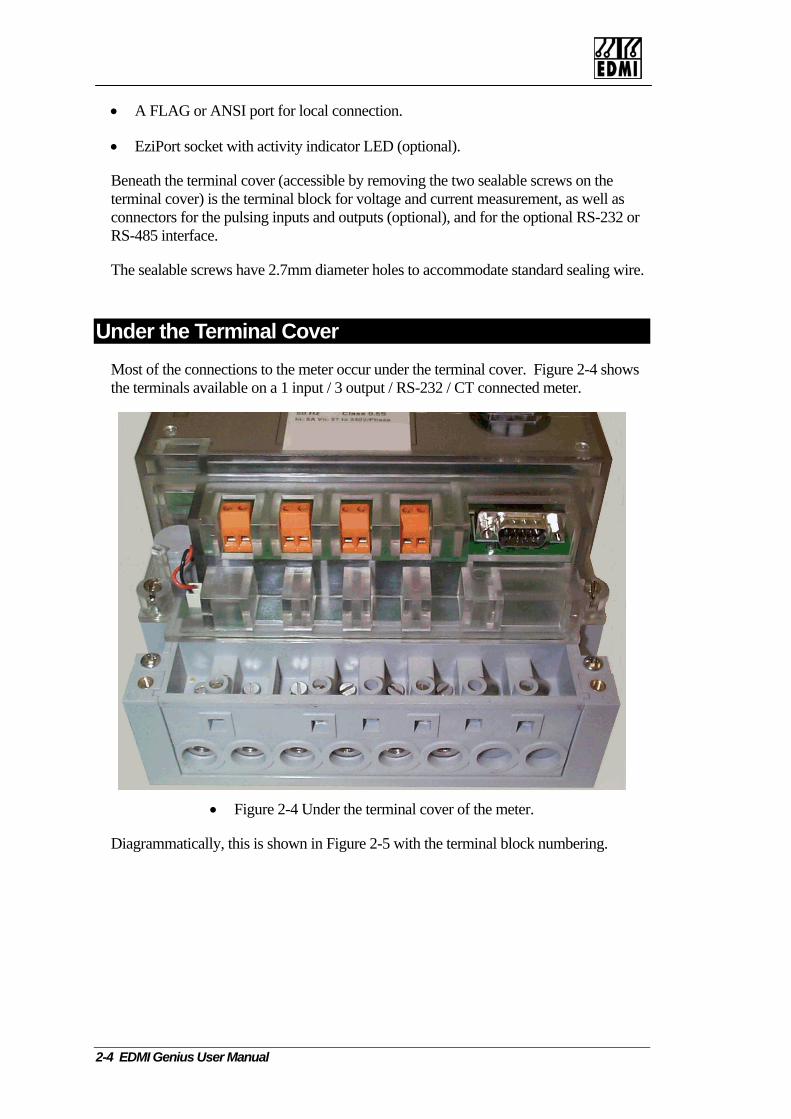
Under the Terminal Cover Most of the connections to the meter occur under the terminal cover. Figure 2-4 shows the terminals available on a 1 input / 3 output / RS-232 / CT connected meter.
• Figure 2-4 Under the terminal cover of the meter.
Diagrammatically, this is shown in Figure 2-5 with the terminal block numbering.
2-4 EDMI Genius User Manual
Under the Terminal Cover
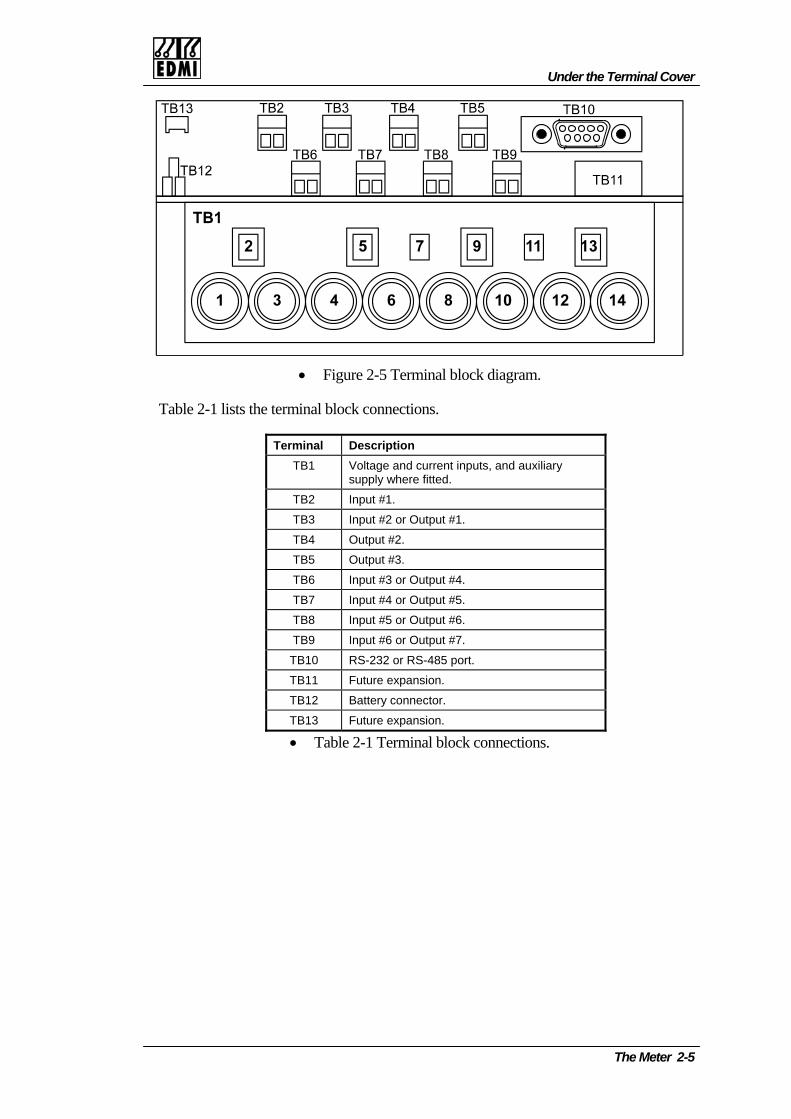
• Figu lock diagram.
Table 2-1 lists the ter
re 2-5 Terminal b
minal block connections.
Terminal Description TB1 Voltage and current inputs, and auxiliary
supply where fitted.
TB2 Input #1.
TB3 Input #2 or Output #1.
TB4 Output #2.
TB5 Output #3.
TB6 Input #3 or Output #4.
TB7 Input #4 or Output #5.
TB8 Input #5 or Output #6.
TB9 Input #6 or Output #7.
TB10 RS-232 or RS-485 port.
TB11 Future expansion.
TB12 Battery connector.
TB13 Future expansion.
• Table 2-1 Terminal block connections.
The Meter 2-5

Figure 2-6 gives the terminal spacings of TB1.
• Figure 2-6 TB1 terminal spacings.
The two screws into the grey plastic of the base are not to be removed as they hold the terminal block in place. The other two screws visible are two of the four sealable screws that secure the meter lid. The other two screws are located on either side of the LCD. All sealing screws have 2.7mm diameter holes, for accepting standard sealing wire or plastic seals.
Under the Meter Lid Removing the four sealable screws allows the meter lid to be removed. Generally connections to the I/O connectors need to be detached to allow the cover to be removed. Removal of the meter lid is required to access the Config Jumper, and to add or remove the CT to VT links on whole current meters.
Care must be taken as dangerous voltages are present in the circuity under the meter lid while the meter is active. Most of the circuity is at neutral potential. Even when the meter is not powered, care should be taken to prevent electrostatic damage to the circuity of the meter.
2-6 EDMI Genius User Manual

Under the Meter Lid
The Config Jumper
The Config Jumper is part of the data access security. See Chapter 16 for more information. Figure 2-7 shows the location of the jumper.
• Figure 2-7 Location of the Config Jumper.
The jumper is located just under the EziPort indicator LED. It has two positions, Config and Secure. To change the setting, remove the plastic jumper and move it to the other set of pins. Shorting the top and centre pins is the Config position, while shorting the bottom and centre pins is the Secure position.
The Meter 2-7

CT to VT Links
Whole current meters have Cand 9, 12 and 13. There is a
T to VT links between TB1 terminals 1 and 2, 4 and 5, 8 lso a fixed link between 12 and 14. These links may need
to be removed to allow testing on some types of test bench. Figure 2-8 shows the location of the links, just above the terminal block.
• Figure 2-8 Location of the CT to VT links.
To remove the link connections, remove the four screws and washers from the deeper set of holes. This disconnects the links. Figure 2-9 shows the meter with the screws removed.
• Figure 2-9 Meter with the CT to VT links disconnected by removing screws.
It is important to leave the other screws in place, as they are part of the connection of the voltage terminals to the meter.
2-8 EDMI Genius User Manual
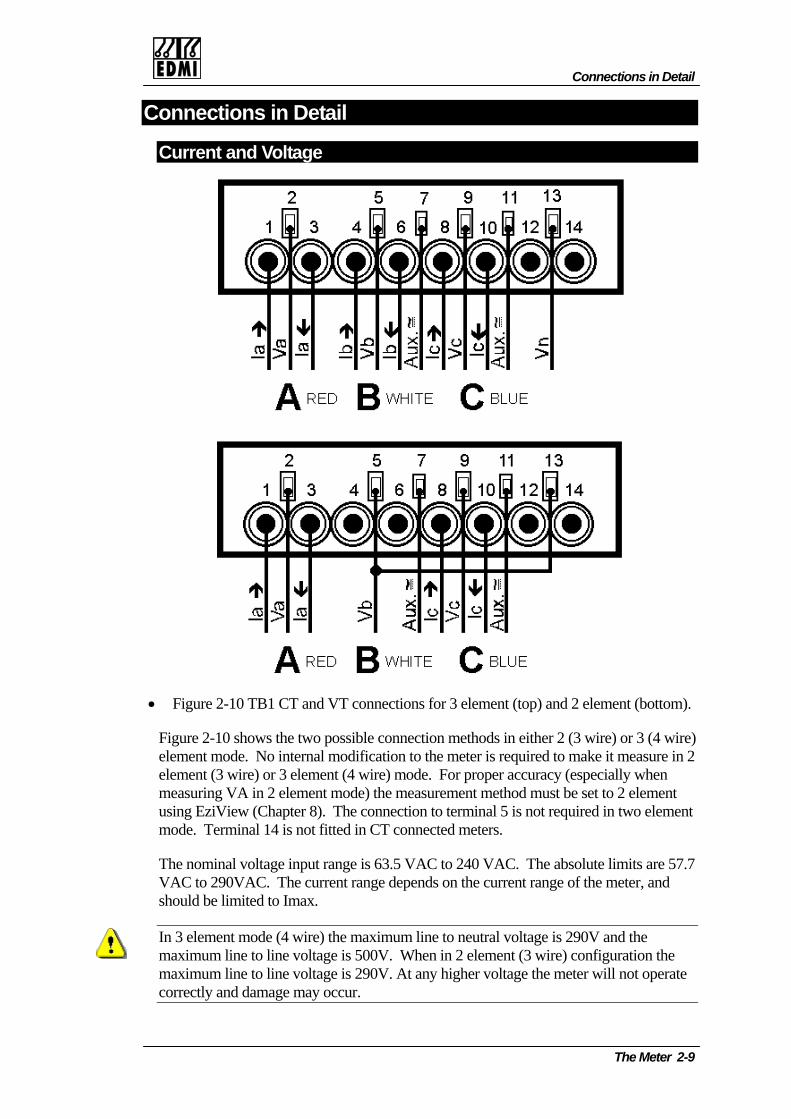
Connections in Detail
Connections in Detail
Current and Voltage
Figure 2-10 TB1 CT and VT conn• ections for 3 element (top) and 2 element (bottom).
thods in either 2 (3 wire) or 3 (4 wire)
ment mode) the measurement method must be set to 2 element using EziView (Chapter 8). The connection to terminal 5 is not required in two element
meters.
7.7
ax.
Figure 2-10 shows the two possible connection meelement mode. No internal modification to the meter is required to make it measure in 2 element (3 wire) or 3 element (4 wire) mode. For proper accuracy (especially when measuring VA in 2 ele
mode. Terminal 14 is not fitted in CT connected
The nominal voltage input range is 63.5 VAC to 240 VAC. The absolute limits are 5VAC to 290VAC. The current range depends on the current range of the meter, and should be limited to Im
In 3 element mode (4 wire) the maximum line to neutral voltage is 290V and the maximum line to line voltage is 500V. When in 2 element (3 wire) configuration the maximum line to line voltage is 290V. At any higher voltage the meter will not operate correctly and damage may occur.
The Meter 2-9

• Figur on tions for 3 e current, TB1.
Figure 2-11 shows t ct or a who ter. The neutral connection must be made, even ot c ected to b Whole current meters have links connecting TB1 term 13 to 14. The links are fitted under the main meter cover, discussed earlier in this chapter. The same maximum
e 2-11 C nec element whol
he conne ions f le current me if it is n onn oth 12 and 14.
inals 1 to 2, 4 to 5, 8 to 9, and 12 to
voltage restrictions apply as for CT meters.
Auxiliary Supply
e present.
stems, and as the neutral in AC systems.
ry voltage input is rated at 110 VAC/VDC ± 20%.
Ty
metering applications, particularly low voltage sites. Once all VTs fail the meter will power down.
Type 1 – Aux 24V LCD and lo su
Used for applications where ead may need to be performed in the absence of power. A 24V battery supp e a d to allow the meter to be read.
Type 3 - Auxiliary only
Used for switchyard appl ti at all times and there is
Ty ity – High Voltage 200-240V Aux
ally draw power from the VT circuits. Once all the VTs have
als.
The meter has optional support for an auxiliary supply for powering the meter. There are four different options, depending on the required operation when different power sources ar
The auxiliary supply inputs are TB1-7 and TB1-11. TB1-11 should be used as the negative input in DC sy
The auxilia
pe 0 – VT supply
Used for most typical
cal port pply
meter r ingsly may b pplie
ica ons where the meter must be on spare capacity in the auxiliary supply system. If the auxiliary system fails for any reason the meter will power down.
pe 4 – VT prior
The meter will normfailed, the changeover board will operate the internal relay and draw power from the auxiliary termin
2-10 EDMI Genius User Manual
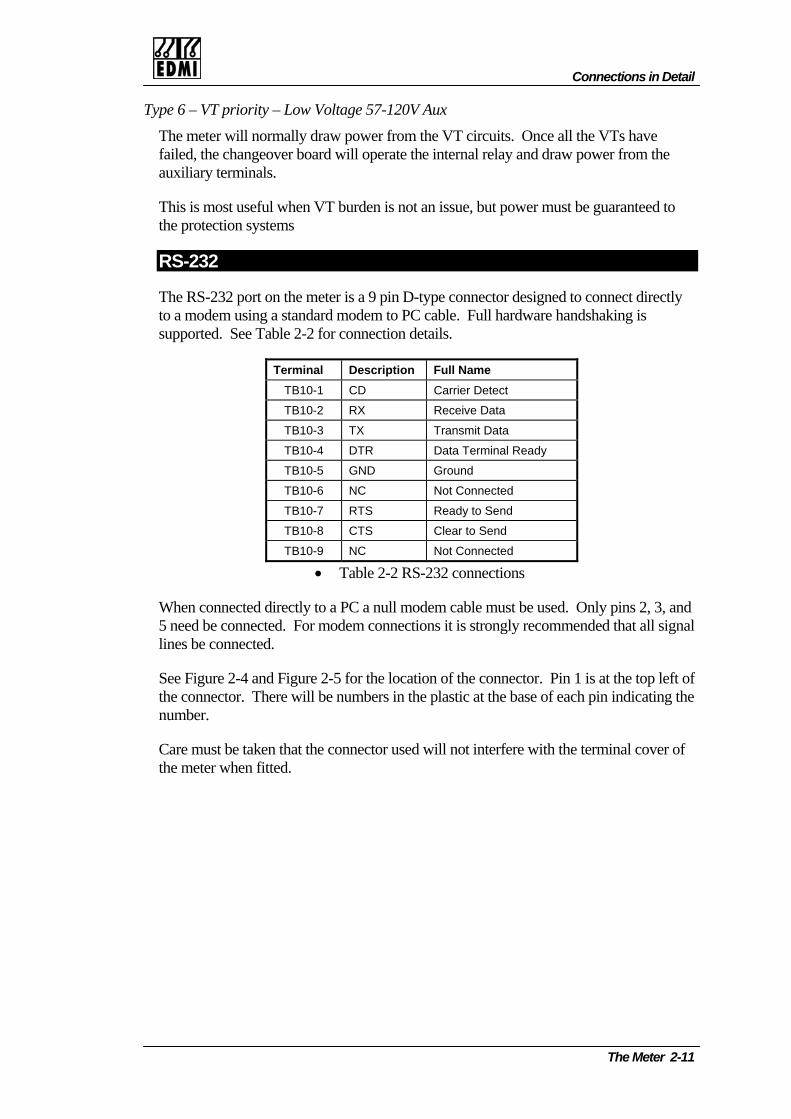
Connections in Detail
Ty
. Once all the VTs have geover board will operate the internal relay and draw power from the
e guaranteed to on systems
pe 6 – VT priority – Low Voltage 57-120V Aux
The meter will normally draw power from the VT circuitsfailed, the chanauxiliary terminals.
This is most useful when VT burden is not an issue, but power must bthe protecti
RS-232
The RS-232 port on the meter is a 9 pin D-type connector designed to connect directly is to a modem using a standard modem to PC cable. Full hardware handshaking
supported. See Table 2-2 for connection details.
Terminal Description Full Name TB10-1 CD Carrier Detect
TB10-2 RX Receive Data
TB10-3 TX Transmit Data
TB10-4 DTR Data Terminal Ready
TB10-5 GND Ground
TB10-6 NC Not Connected
TB10-7 RTS Ready to Send
TB10-8 CTS Clear to Send
TB10-9 NC Not Connected
• Table 2-2 RS-232 connections
and nal
ation of the connector. Pin 1 is at the top left of the connector. There will be numbers in the plastic at the base of each pin indicating the
When connected directly to a PC a null modem cable must be used. Only pins 2, 3,5 need be connected. For modem connections it is strongly recommended that all siglines be connected.
See Figure 2-4 and Figure 2-5 for the loc
number.
Care must be taken that the connector used will not interfere with the terminal cover of the meter when fitted.
The Meter 2-11
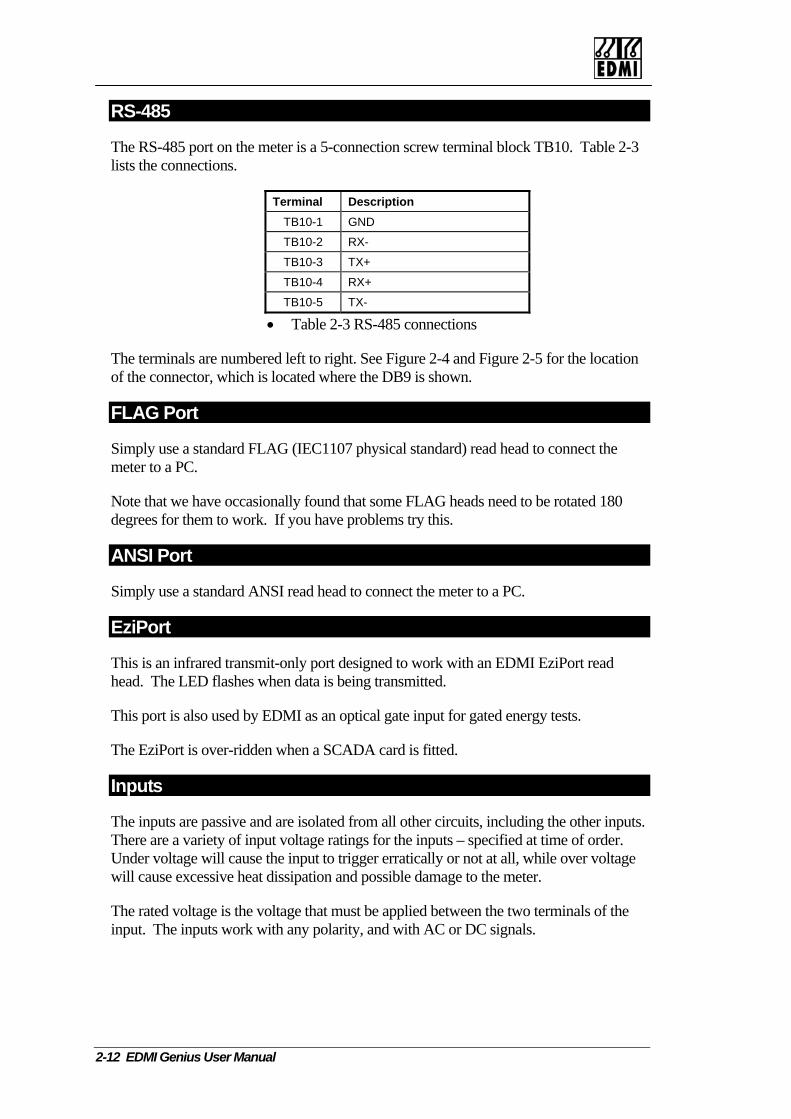
RS-485
The RS-485 port on the meter is a 5-connection screw terminal block TB10. Table 2-3lists the connections.
Terminal Description TB10-1 GND
TB10-2 RX-
TB10-3 TX+
TB10-4 RX+
TB10-5 TX-
• Table 2-3 RS-485 connections
The terminals are numbered left to right. See Figure 2-4 and Figure 2-5 for the locationof the connector, which is located where the DB9 is shown.
FLAG Port
t some FLAG heads need to be rotated 180 degrees for them to work. If you have problems try this.
Simply use a standard FLAG (IEC1107 physical standard) read head to connect the meter to a PC.
Note that we have occasionally found tha
ANSI Port
imply use a standard ANSI read head to connect thS e meter to a PC.
EziPort
This is an infrared transmit-only port designed to work with an EDMI EziPort read head. The LED flashes when data is being transmitted.
This port is also used by EDMI as an optical gate input for gated energy tests.
The EziPort is over-ridden when a SCADA card is fitted.
Inputs
The inputs are passive and are isolated from all other circuits, including the other inputs. There are a variety of input voltage ratings for the inputs – specified at time of order. Under voltage will cause the input to trigger erratically or not at all, while over voltage will cause excessive heat dissipation and possible damage to the meter.
The rated voltage is the voltage that must be applied between the two terminals of the input. The inputs work with any polarity, and with AC or DC signals.
2-12 EDMI Genius User Manual

LCD/Select Button
Outputs
The outputs are passive and are isolated from all other circuits, including the other outputs. There are two types of output – BOSFET and Mercury Wetted Reed Relay (MW Relay). The BOSFET type is rated up to 240V, 100mA. The MW relay type is rated up to 240V, but is not preferred due to the mercury content. They may switch either AC or DC voltages, any polarity.
Battery
The battery is used to run oss of power. It also preserves the memory of the meter, most notably ot backed up to permanent FLASH memory.
The battery is a 3.6V, 750m to the compartment above and to the left of the main plugs into TB12 (polarised). Replacement batteries may be ordered from EDMI as 2000-0600-BATTERY. A low battery indicator is display eter powers up if the battery is not present or is depleted. e The Meter Off time display (Time Statistics, page 12-7) may be used to help estimate the battery usage.
To eliminate the possibility of data loss it is best to change the battery while the meter is e taken as the battery is at the potential of the neutral terminal. etain data for several seconds with the power off and no battery.
tery is at the potential of the neutral terminal. If conditions (such as wiring
the clock during l the EziScript memory n
Ah Lithium battery. It clips interminal block, and
ed on the LCD when the mTh battery usage life is at least 2 years.
running. Care must bThe meter will only r
The batconfiguration) make this a dangerous operation then steps should be taken to ensure that it is safe to do so. While the risk of coming into contact with the conductors during a battery change is minimal, care must be exercised. If the meter does have to be turned off while a battery change is made the data (especially load surveys) should be backed up from the me r. The battery should be changed as quickly as possi
teble under these circumstances.
LThe LCD is primarily for displaying information from the meter’s registers for meter
6-character display. The backlight may be set to only
hat is nt, and then a series of pages that follow it (up to 64). Each page displays a
CD/Select Button
readers. It is also useful during installation, configuration, and diagnosing problems. The LCD is a backlit two line by 1activate while the LCD is in use.
The data is displayed on the LCD as a series of pages. There is one default page talways presesingle quantity from the meter. The top line shows a description (16 characters), and the bottom line shows the value, with an optional unit. The LCD is fully alphanumeric, so any text or numbers may be displayed.
The Meter 2-13

If the bottom line of the display is too long to fit into 16 characters, the display will scroll a character every second to show the entire line (up to 59 characters). A right facing arrow “→” shows the start of the line.
To progress to the next page, press the Select button. Each time the button is pressedthe display moves to the next page. The display may also be set up to automatically cycle the display through the pages, pausing if the Select button is pressed.
LCD, each page belongs to a display set. Only pages from the current display set are shown. There are four display sets, called A, B, C and D. To change display sets press
a second. The LCD will give a message like “Changed to set B” to indicate the new display set. The LCD will then change to display the new
ial display mode to assist in cases where information is needed from the meter that has not been configured on displays. This is generally where information is
To enter this mode hold the select button down for 10 seconds. The display will change to a cycling display that shows the following information (Table 2-4). Pressing the button
In order to make it easier to find a certain page and to allow for different users of the
and hold the Select button for
display set, starting at the default page that is present in all sets. The first three display sets can be reached in this way. The fourth can be reached using EziView.
There is a spec
needed in order to establish a link with the meter (e.g. unknown baud rate settings).
again will revert to the normal display.
LCD Screens Model ID No
Serial No
Firmware Version
Modem port Configuration
Optical port Configuration
EziPort/SCADA port Configuration
Processor Idle time
Flash Used
HW type code
• Table 2-4 Special Display contents
Processor idle time and Flash Used are for EDMI internal use.
Default Display
e The default display (Figure 2-12) shows a summary of many of the systems within thmeter.
• Figure 2-12 Default LCD display.
The organisation of the display from the top left is as follows:
2-14 EDMI Genius User Manual

Billing Reset Button
The first two characters of the top row display the direction of Watts and VArs respectively. A plus sign indicates positive/export/delivered energy, while a minus sign indicates negative/import/received energy. A blank indicates zero energy.
The third character shows a little pulsing heart symbol as an indication that the meter is running and updating the display.
The fourth, fifth and sixth characters indicate the active rate for W, VAr and VA rate roups respectively as a number from 1 to 8. These values are fully explained in
Chapter 13.
The seventh character shows a battery symbol if the battery w
The first three characters of the bottom row display the alarm status. See Chapter 15 for more information.
and six on the bottom row show the login status. An ‘L’ indicates a on the modem port.
s the current date (with daylight savings if active).
g
as depleted or missing at power up. See the Battery section earlier in this chapter.
The eighth character shows a ‘D’ if daylight saving is currently active.
The right hand side of the display shows the current time (with daylight savings if active).
Characters five login on the optical port (local), and an ‘M’ indicates a login
Finally, the right hand side show
Billing Reset Button The billing reset button is the top of the two push buttons beside the display. The button is an option, and where not fitted the hole will be filled by a plastic plug. The push button has a 2.7mm diameter hole through it, allowing it to be sealed using standard s
e “Manually using the Billing Reset Button”, page 13-25.
ealing wire.
For more information, se
The Meter 2-15
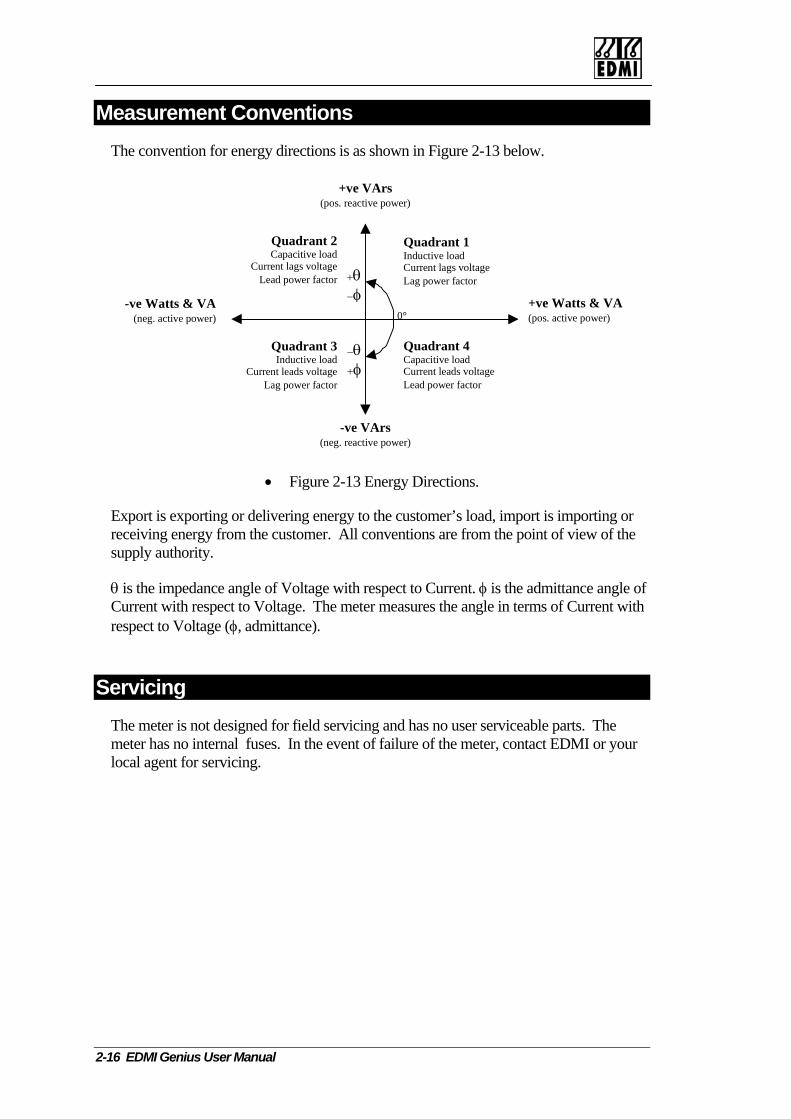
Measurement Conventions The convention for energy directions is as shown in Figure 2-13 below.
0°
Quadrant 2Capacitive load
Current lags voltageLead power factor
Quadrant 3Inductive load
Current leads voltageLag power factor
Quadrant 4Capacitive loadCurrent leads voltageLead power factor
Quadrant 1Inductive loadCurrent lags voltageLag power factor+θ
−φ
−θ+φ
+ve VArs(pos. reactive power)
+ve Watts & VA(pos. active power)
-ve Watts & VA(neg. active power)
-ve VArs(neg. reactive power)
• Figure 2-13 Energy Directions.
Export is exporting or delivering energy to the customer’s load, import is importing or receiving energy from the customer. All conventions are from the point of view of the supply authority.
θ is the impedance angle of Voltage with respect to Current. φ is the admittance angle of Current with respect to Voltage. The meter measures the angle in terms of Current with respect to Voltage (φ, admittance).
Servicing The meter is not de able parts. The signed for field servicing and has no user servicemeter has no internal fuses. In the event of failure of the meter, contact EDMI or your local agent for servicing.
2-16 EDMI Genius User Manual

Chapter 3 EziViEziView is a 32 bit Windows application written by EDMI. EziView iconfigure and retrieve data in a user-friendly manner from EDMI energkeep track of multiple meters spread across multiple sites.
This chapter covers the installation of EziView and configuring EziVieyour meters.
Installation EziView version 2.0 or later is required to access the meter.
System Requirements
• 486, Pentium, or a v
•
•
• At least 15 MB of HDD space, plus space for retrieved meter data.
bo e based personal computer
Microsoft Windows™ 95/98 or Windows™ NT4. (Win3.1 is not sup
16 MB of RAM
To install Ezi e
1.
2.
3. Run the setup.exe program from the install package.
4. The EziView Installer dialogue box appears. Follow the instructions oprogress through the installation.
Vi w
Close all active applications.
Insert the EziView software CD in the CD ROM drive, or download EDMI web site.
E
C h a p t e r
3
ew Basics s used to y meters. It canw to connect to
ported).
n the screen to
EziView from the
ziView Basics 3-1
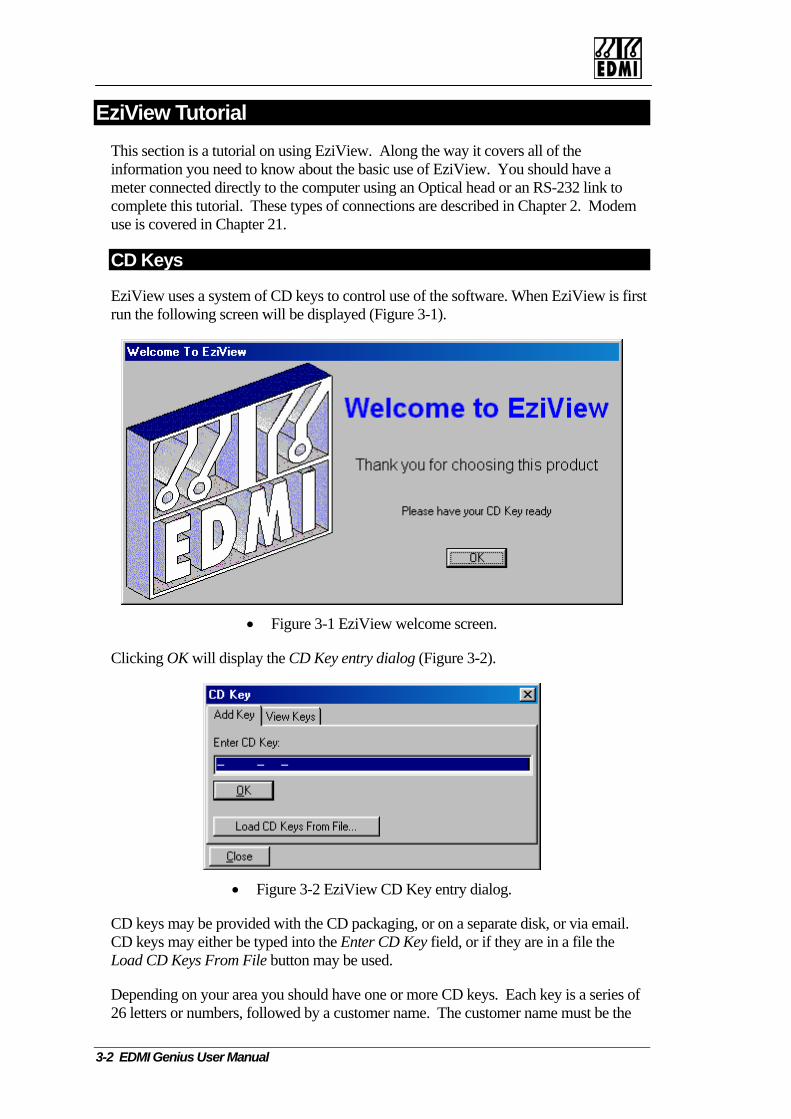
E
. Modem use is covered in Chapter 21.
ziView Tutorial This section is a tutorial on using EziView. Along the way it covers all of the information you need to know about the basic use of EziView. You should have a meter connected directly to the computer using an Optical head or an RS-232 link to complete this tutorial. These types of connections are described in Chapter 2
CD Keys
EziView uses a system of CD keys to control use of the software. When EziView is first run the following screen will be displayed (Figure 3-1).
• Figure 3-1 EziView welcome screen.
Clicking will display the (Figure 3-2). OK CD Key entry dialog
• Figure 3-2 EziView CD Key entry dialog.
CD keys may be provided with the CD packaging, or on a separate disk, or via email. CD keys may either be typed into the Enter CD Key field, or if they are in a file the Load CD Keys From File button may be used.
Depending on your area you should have one or more CD keys. Each key is a series of 26 letters or numbers, followed by a customer name. The customer name must be the
3-2 EDMI Genius User Manual

EziView Tutorial
same for all keys in use. New keys may be added after the first run of EziView by using the Tools → CD Key option.
To see what CD keys are in use change to the View Keys tab (Figure 3-3). The keys thave been entered will be listed in the Keys section. The Status indicator shows whethethe currently selected key is valid and active or not. The Save CD Keys to File buttomay be used to save all the installed CD keys to a file.
hat r
n
• Figure 3-3 EziView CD Key information.
The Meters pane displays any restrictions on what meters the CD keys may be used on. The Features pane p wn in Bold) by the CD keys.
dis lays what EziView features are enabled (sho
EziView Basics 3-3
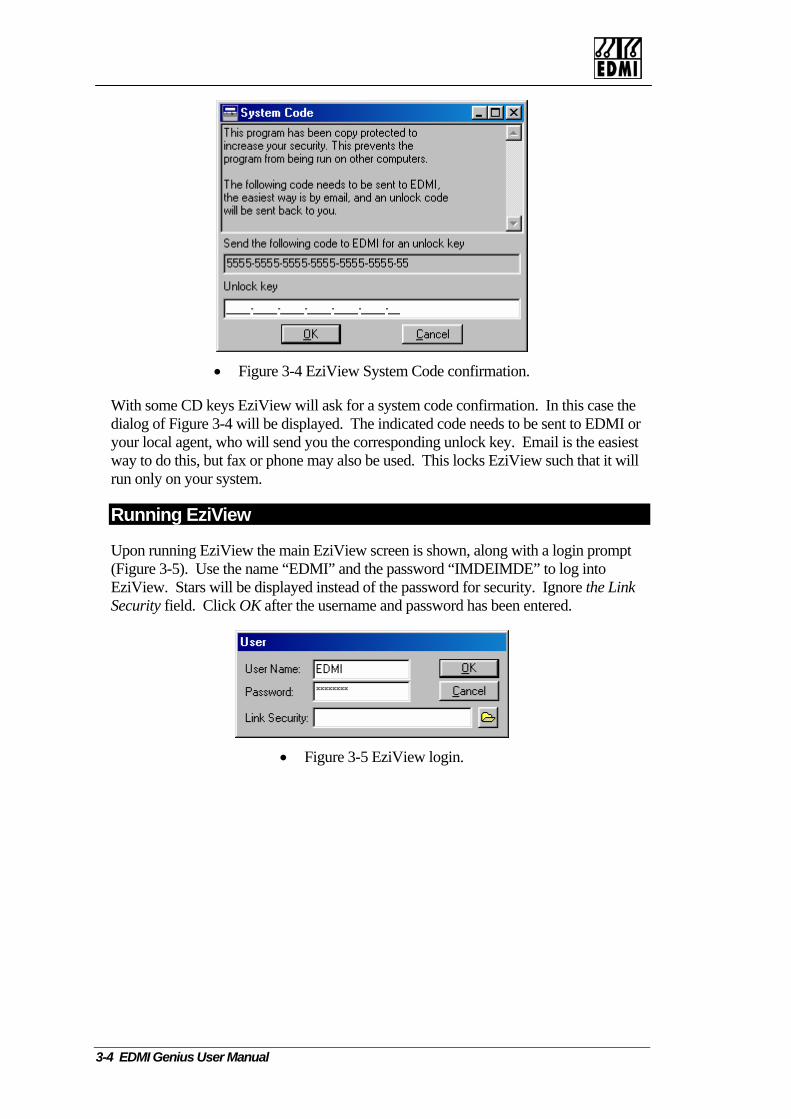
• Figure 3-4 EziView System Code confirmation.
With some CD keys EziView will ask for a system code confirmation. In this case the dialog of Figu 3 nt to EDMI or re -4 will be displayed. The indicated code needs to be seyour local agent, who will send you the corresponding unlock key. Email is the easiest way to do this, but fax or phone may also be used. This locks EziView such that it will run only on your system.
Running EziView
Upon running EziView the main EziView screen is shown, along with a login prompt (Figure 3-5). Use the name “EDMI” and the password “IMDEIMDE” to log into EziView. Stars will be dis y security. Ignore the Link Security field. Click OK after the username and password has been entered.
pla ed instead of the password for
• Figure 3-5 EziView login.
3-4 EDMI Genius User Manual

EziView Tutorial
This brings you to EziView’s main screen (Figure 3-6).
• Figure 3-6 EziView main screen.
The screen consists of eter sites, the right hand a
several parts. The left hand pane shows a diagram of m p ne shows the meters at the selected site (discussed later). Above each
pane is a toolbar of actions for the pane.
Sites
A meter site represents a connection point to a meter (or meters). It defines such things as the phone number and baud rates.
Each site contains meters. The meters in the selected site are listed in the right hand pane. Most connections will have only one meter, but an RS-485 multidropped site mahave many more, all on the same connection defined by the site.
Clicking on MySite selects it, showing in the Meters pane that it has a single meter (as
y
shown in Figure 3-6). This is a default site installed with EziView as an example, with a serial number of 10000000 to indicate that it is not a real meter. The meter’s name defaults to its serial number, which is shown in the second column. The Address column is not used with the Genius meter.
EziView Basics 3-5
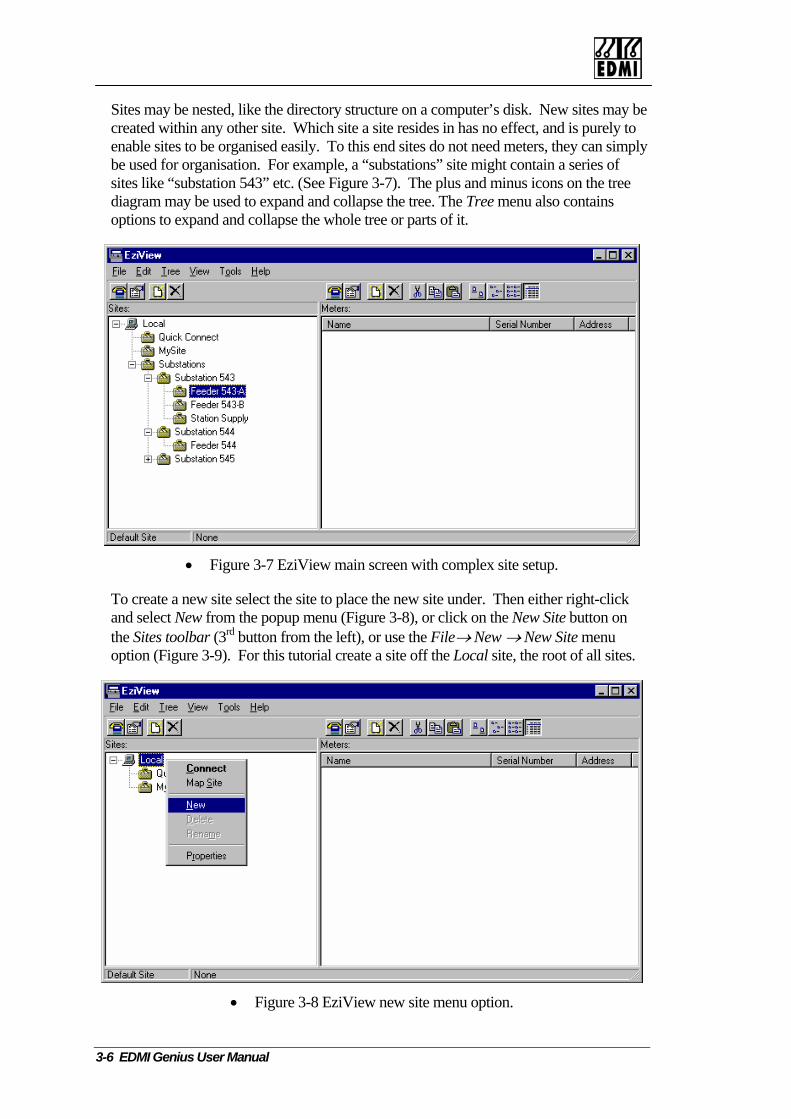
Sites may be nested, like the directory structure on a computer’s disk. New sites may be created within any other site. Which site a site resides in has no effect, and is purely to enable sites to be organised easily. To this end sites do not need meters, they can simply be used for organisation. For example, a “substations” site might contain a series of sites like “substation 543” etc. (See Figure 3-7). The plus and minus icons on the tree diagram may be used to expand and collapse the tree. The Tree menu also contains options to expand and collapse the whole tree or parts of it.
• Figur
To create a new site s e to place the new site under. Then either right-click a w from tthe Sites toolbar (3rd boption (Figure 3-9). For this
e 3-7 EziView main screen with complex site setup.
elect the sitnd select Ne he popup menu (Figure 3-8), or click on the New Site button on
utton from the left), or use the File→ New → New Site menu tutorial create a site off the Local site, the root of all sites.
• Figure 3-8 EziView new site menu option.
3-6 EDMI Genius User Manual
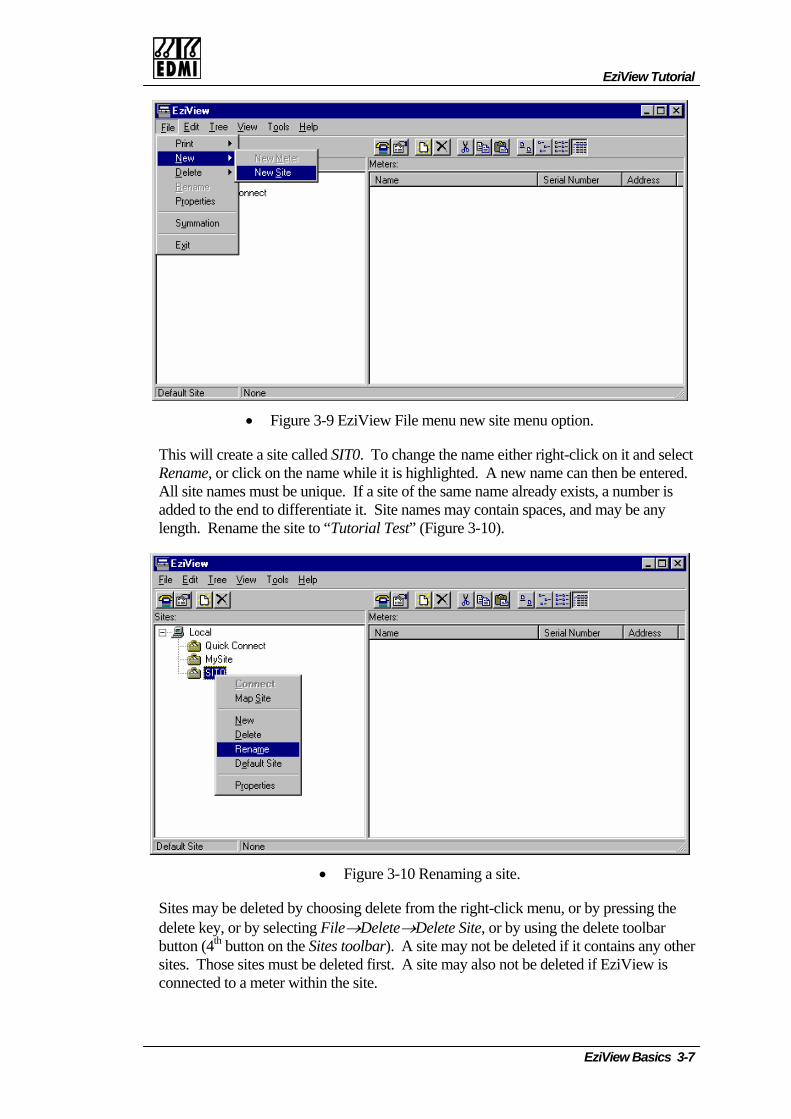
EziView Tutorial
• Figure 3-9 EziView File menu new site menu option.
This will create a site called SIT0. To change the name either right-click on it and select Rename, or click on the name while it is highlighted. A new name can then be entered. All site names must be unique. If a site of the same name already exists, a number is added to the end to differentiate it. Site names may contain spaces, and may be any length. Rename the site to “Tutorial Test” (Figure 3-10).
• Figure 3-10 Renaming a site.
Sites may be deleted by choosing delete from the right-click menu, or by pressing the delete key, or by selecting File→Delete→Delete Site, or by using the delete toolbar button (4th button on the Sites toolbar). A site may not be deleted if it contains any other sites. Those sites must be deleted first. A site may also not be deleted if EziView is connected to a meter within the site.
EziView Basics 3-7
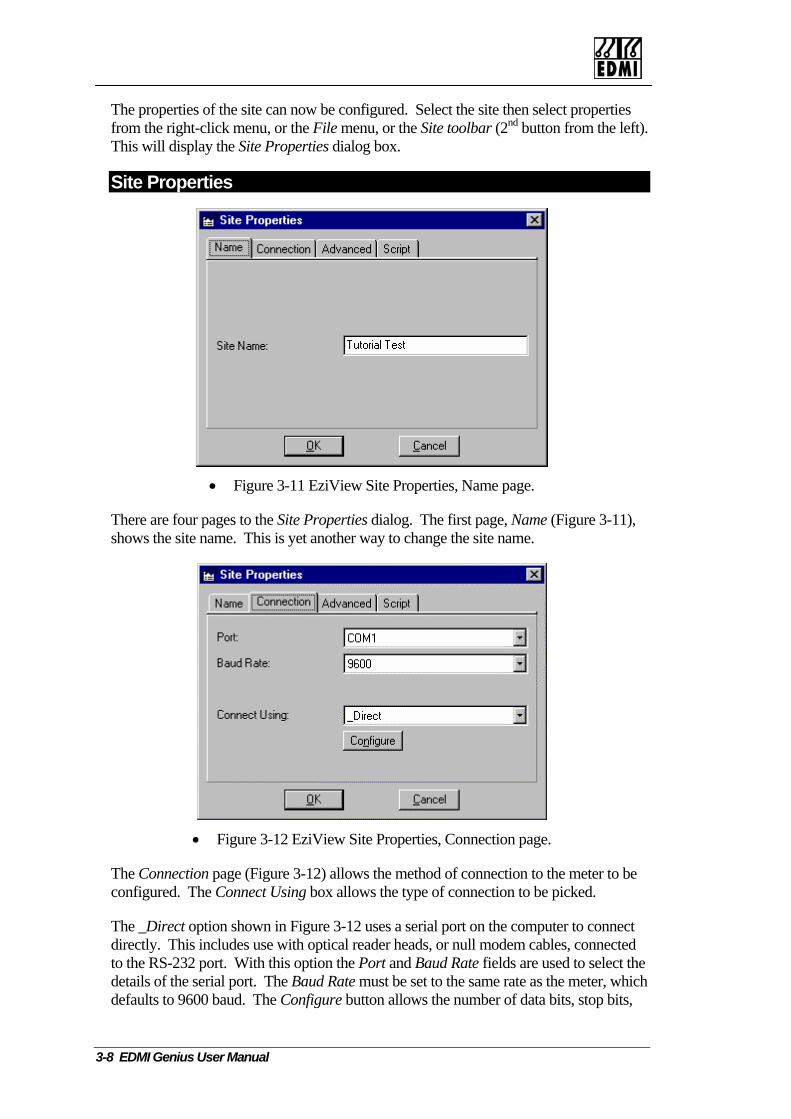
The properties of the site can now be configured. Select the site then select properties from the right-click menu, or the File menu, or the Site toolbar (2nd button from the left). This will display the Site Properties dialog box.
Site Properties
• Figure 3-11 EziView Site Properties, Name page.
There are four pages to the Site Properties dialog. The first page, Name (Figure 3-11), shows the site name. This is yet another way to change the site name.
•
ect ncludes use with optical reader heads, or null modem cables, connected
to the RS-232 port. With this option the Port and Baud Rate fields are used to select the ust be set to the same rate as the meter, which
defaults to 9600 baud. The Configure button allows the number of data bits, stop bits,
Figure 3-12 EziView Site Properties, Connection page.
The Connection page (Figure 3-12) allows the method of connection to the meter to be configured. The Connect Using box allows the type of connection to be picked.
The _Direct option shown in Figure 3-12 uses a serial port on the computer to conndirectly. This i
details of the serial port. The Baud Rate m
3-8 EDMI Genius User Manual

EziView Tutorial
parity and flow control to be set. Unlemay generally be left as their default values of 8 data bi
ss the meter settings have been changed, these ts, 1 stop bit, no parity, and no
dems are installed in Windows these will appear as options in the Connect Using field. Selecting a modem to use allows properties such as phone number to be set. These settings are covered in Chapter 20.
The _Socket protocol option is for connection to a port redirector using a network. Use of this option is not covered here.
flow control. 8 data bits must be used for correct operation with the meter at all times.
If any mo
• Figure 3-13 EziView Site Properties, Advanced page.
The Advanced page (Figure 13-3) allows a number of specialised settings to be changed that may be used to tw tions. eak a connection. Table 3-1 below lists the op
EziView Basics 3-9
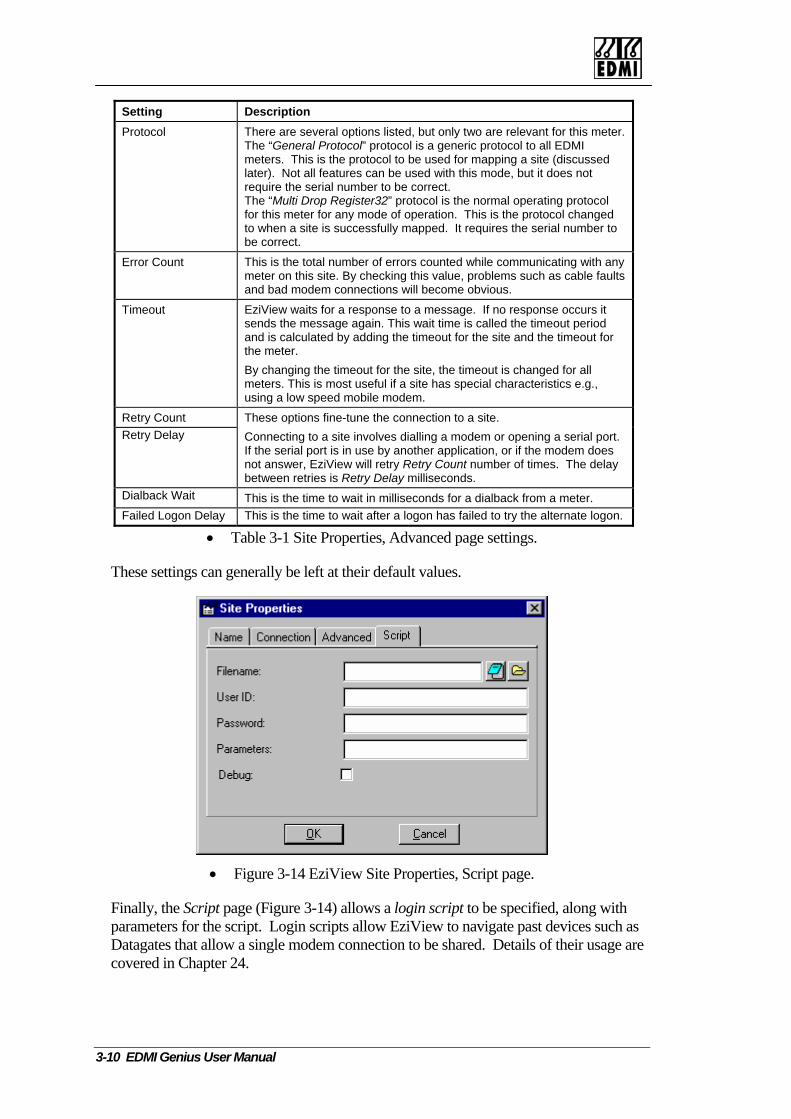
Setting Description Protocol There are several options listed, but only two are relevant for this meter.
The “General Protocol” protocol is a generic protocol to all EDMI meters. This is the protocol to be used for mapping a site (discussed later). Not all features can be used with this mode, but it does not require the serial number to be correct. The “Multi Drop Register32” protocol is the normal operating protocol for this meter for any mode of operation. This is the protocol changed to when a site is successfully mapped. It requires the serial number to be correct.
Error Count This is the total number of errors counted while communicating with any meter on this site. By checking this value, problems such as cable faults and bad modem connections will become obvious.
Timeout EziView waits for a response to a message. If no response occurs it sends the message again. This wait time is called the timeout period and is calculated by adding the timeout for the site and the timeout for the meter. By changing the timeout for the site, the timeout is changed for all meters. This is most useful if a site has special characteristics e.g., using a low speed mobile modem.
Retry Count Retry Delay g a serial port.
These options fine-tune the connection to a site. Connecting to a site involves dialling a modem or openinIf the serial port is in use by another application, or if the modem does not answer, EziView will retry Retry Count number of times. The delay between retries is Retry Delay milliseconds.
Dialback Wait This is the time to wait in milliseconds for a dialback from a meter. Failed Logon Delay This is the time to wait after a logon has failed to try the alternate logon.
• Table 3-1 Site Properties, Advanced page settings.
These settings can generally be left at their default values.
• Figure 3-14 EziView Site Properties, Script page.
Finally, the Script page (Figure 3-14) allows a login script to be specified, along with parameters for the script. Login scripts allow EziView to navigate past devices such as Datagates that allow a single modem connection to be shared. Details of their usage are covered in Chapter 24.
3-10 EDMI Genius User Manual
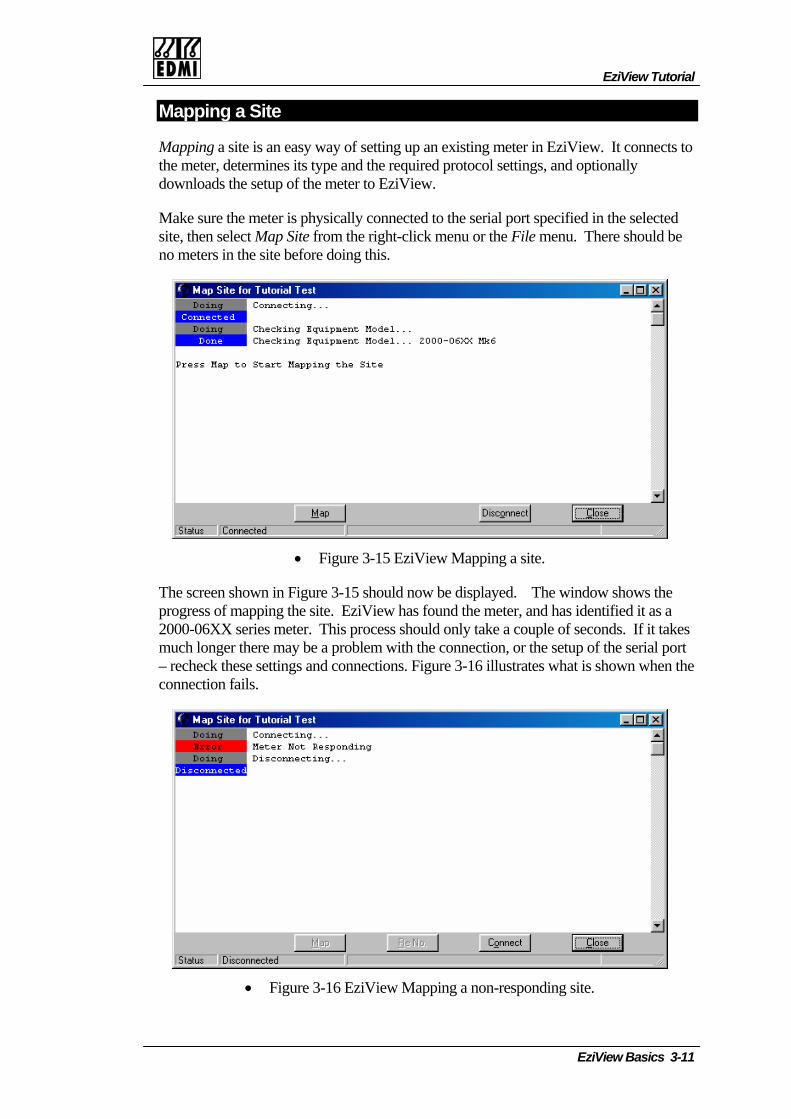
EziView Tutorial
Mapping a Site
Mapping a site is an easy way of setting up an existing meter in EziView. It connects tothe meter, determines its type and the required protocol settings, and optionally downloads the setup of the meter to EziVie
w.
Make sure the meter is physically connected to the serial port specified in the selected site, then select Map Site from the right-click menu or the File menu. There should be no meters in the site before doing this.
• Figure 3-15 EziView Mapping a site.
The screen shown in Figure 3-15 should now be displayed. The window shows the progress of mapping the site. EziView has found the meter, and has identified it as a
s what is shown when the
2000-06XX series meter. This process should only take a couple of seconds. If it takes much longer there may be a problem with the connection, or the setup of the serial port– recheck these settings and connections. Figure 3-16 illustrateconnection fails.
• Figure 3-16 EziView Mapping a non-responding site.
EziView Basics 3-11

At this point EziView has created a blank mmatch the physical meter. Clicking the
eter in the site, but has not configured it to Map button causes the meter’s serial number to
rotocol set. be read, and the appropriate p
• Figure 3-17 EziView Mapping of a site completed.
Figure 3-17 illustrates successful completion. The serial number displayed will be the serial number of the unit being mapped (9300000 here). Click on the Close button to return to the EziView main screen.
Meters in EziView
• Figure 3-18 A newly mapped meter in EziView.
A site’s meters appear in the Meters pane when the site is selected. The meter may be r
Each meter in the Meters pane represents what is called an MTR file. This is kept by EziView, and primarily consists of the configuration for the meter. EziView allows the
renamed or deleted in a similar way to sites. The right hand four icons on the tool bacontrol how the pane is displayed, with the Details view being the preferred method.
3-12 EDMI Genius User Manual
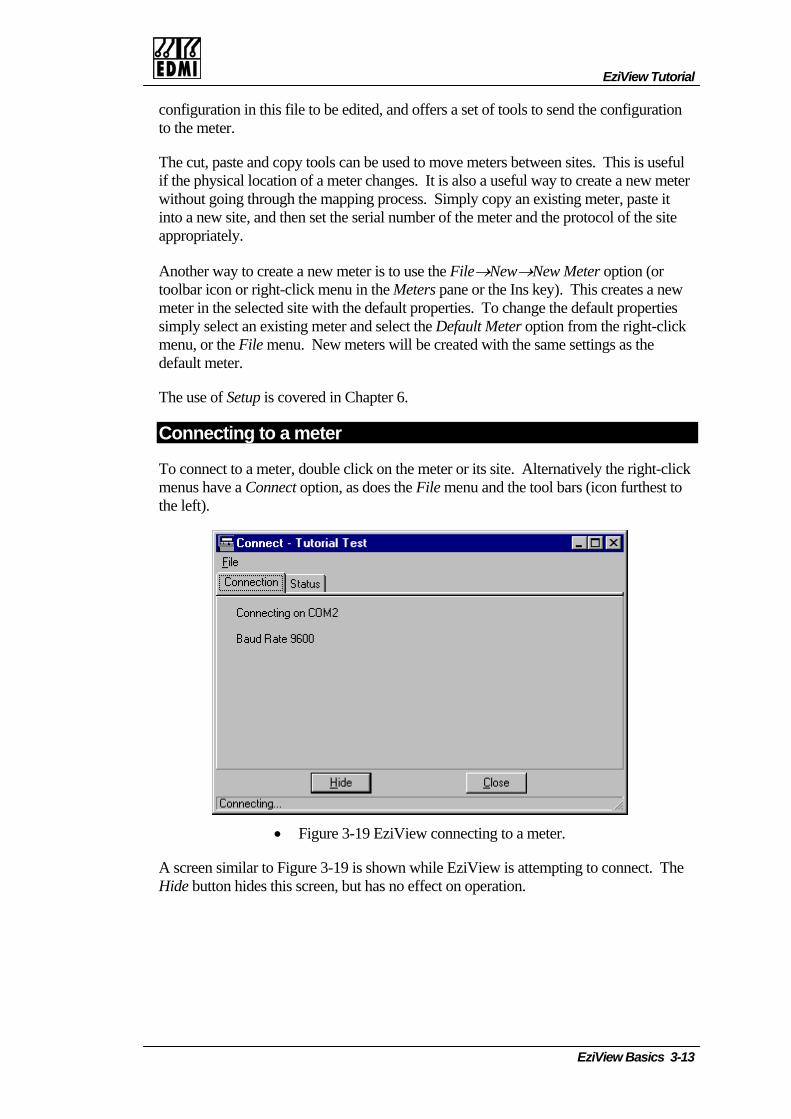
EziView Tutorial
configurato the me
tion in this file to be edited, and offers a set of tools to send the configuration ter.
en sites. This is useful if the physical location of a meter changes. It is also a useful way to create a new meter
, paste it into a new site, and then set the serial number of the meter and the protocol of the site
Another way to create a new meter is to use the File→New→New Meter option (or w
fault properties. To change the default properties simply select an existing meter and select the Default Meter option from the right-click
The use of Setup is covered in Chapter 6.
The cut, paste and copy tools can be used to move meters betwe
without going through the mapping process. Simply copy an existing meter
appropriately.
toolbar icon or right-click menu in the Meters pane or the Ins key). This creates a nemeter in the selected site with the de
menu, or the File menu. New meters will be created with the same settings as the default meter.
Connecting to a meter
To connect to a meter, double click on the meter or its site. Alternatively the right-click menus have a Connect option, as does the File menu and the tool bars (icon furthest to the left).
• Figure 3-19 EziView connecting to a meter.
A screen similar to Figure 3-19 is shown while EziView is attempting to connect. The Hide button hides this screen, but has no effect on operation.
EziView Basics 3-13
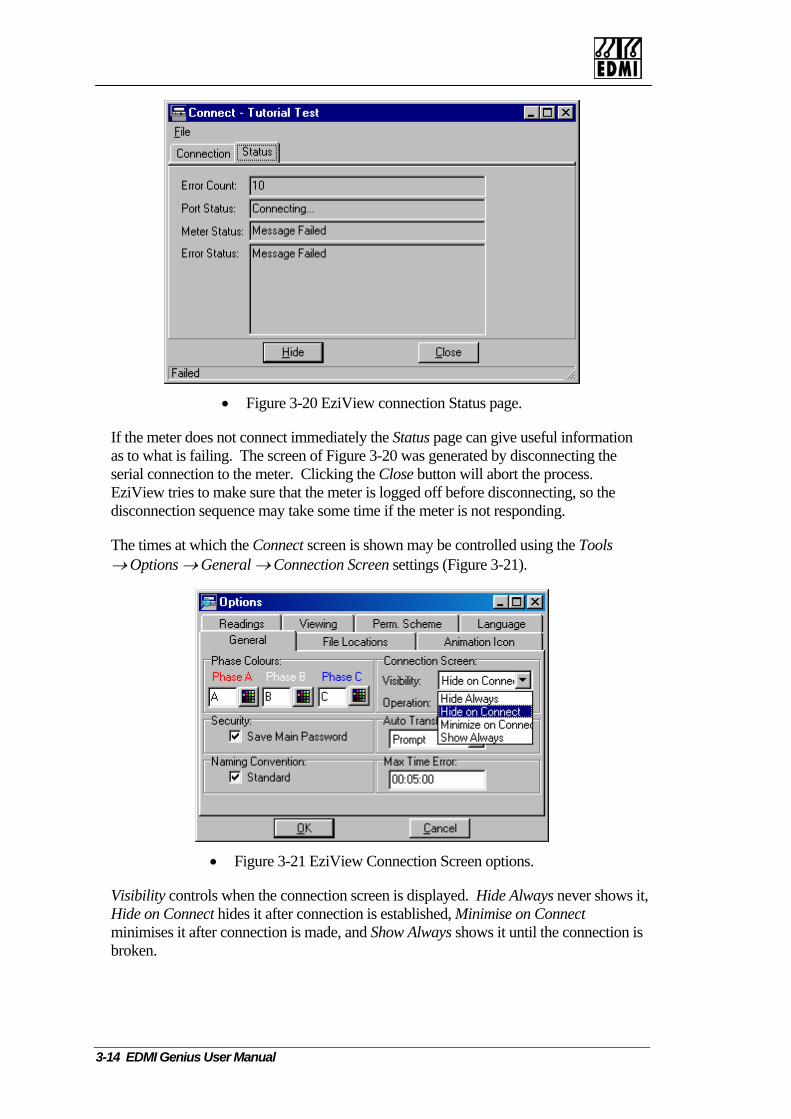
• Figure 3-20 EziView connection Status page.
If the meter does not connect immediately the Status page can give useful information as to what is failing. The screen of Figure 3-20 was generated by disconnecting the serial connection to the meter. Clicking the Close button will abort the process. EziView tries to make sure that the meter is logged off before disconnecting, so the disconnection sequence may take some time if the meter is not responding.
The times at which the Connect screen is shown may be controlled using the Tools → Options → General → Connection Screen settings (Figure 3-21).
• Figure 3-21 EziView Connection Screen options.
Visibility controls when the connection screen is displayed. Hide Always never shows it, Hide on Connect hides it after connection is established, Minimise on Connect minimises it after connection is made, and Show Always shows it until the connection is broken.
3-14 EDMI Genius User Manual
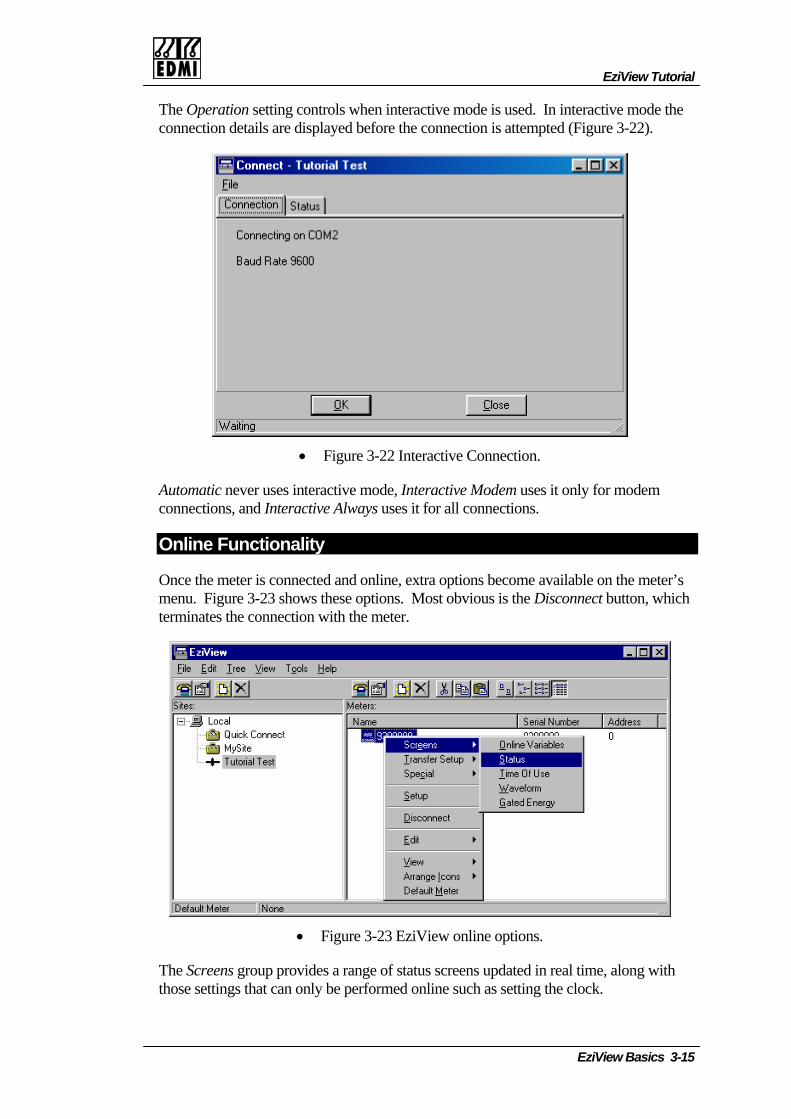
EziView Tutorial
The Operation setting controls when interactive mode is used. In interactive mode the connection details are displayed before the connection is attempted (Figure 3-22).
• Figure 3-22 Interactive Connection.
Automatic never uses interactive mode, Interactive Modem uses it only for modem connections, and Interactive Always uses it for all connections.
Online Functionality
Once the meter is connected and online, extra options become available on the meter’s menu. Figure 3-23 shows these options. Most obvious is the Disconnect button, which terminates the connection with the meter.
• Figure 3-23 EziView online options.
The Screens group provides a range of status screens updated in real time, along with those settings that can only be performed online such as setting the clock.
EziView Basics 3-15
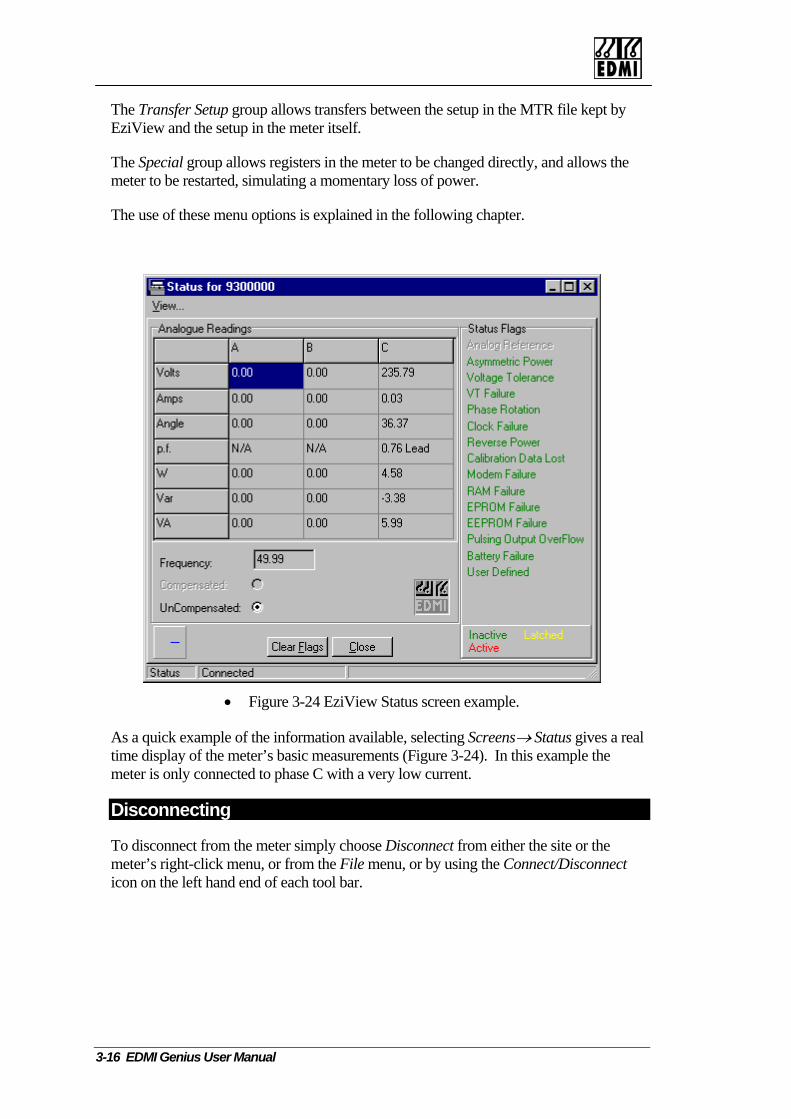
The Transfer Setup group allows transfers between the setup in the MTR file kept by EziView and the setup in the meter itself.
s registers in the meter to be changed directly, and allows the ting a momentary loss of power.
The Special group allowmeter to be restarted, simula
The use of these menu options is explained in the following chapter.
• Figure 3-24 EziView Status screen example.
As a quick example of the information available, selecting Screens→ Status gives a real time display of the meter’s basic measurements (Figure 3-24). In this example the meter is only connected to phase C with a very low current.
Disconnecting
To disconnect from the meter simply choose Disconnect from either the site or the meter’s right-click menu, or from the File menu, or by using the Connect/Disconnect icon on the left hand end of each tool bar.
3-16 EDMI Genius User Manual
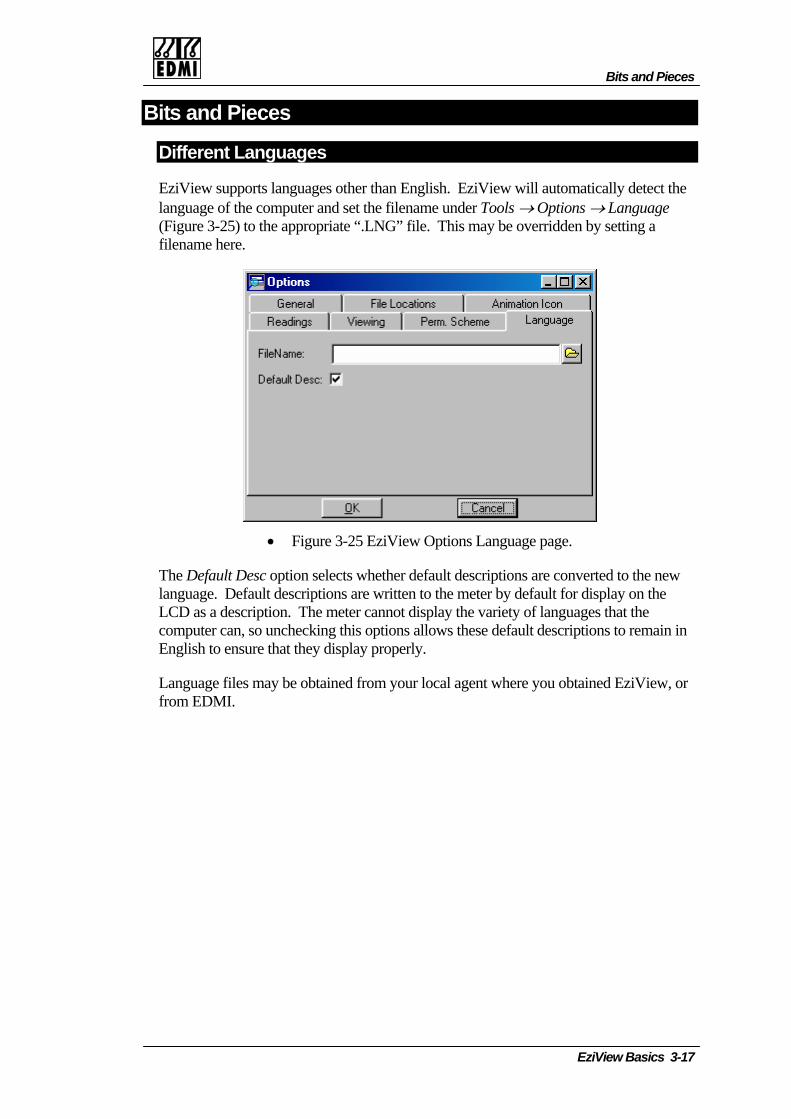
Bits and Pieces
Bits and Pieces
Different Languages
EziView supports languages other than English. EziView will automatically detect the language of the computer and set the filename under Tools → Options → Language (Figure 3-25) to the appropriate “.LNG” file. This may be overridden by setting a filename here.
• Figure 3-25 EziView Options Language page.
The Default Desc option selects whether default descriptions are converted to the new language. Default descriptions are written to the meter by default for display on the LCD as a description. e nguages that the computer can, so unchecking this escriptions to remain in
re that they display properly.
Th meter cannot display the variety of la options allows these default d
English to ensu
Language files may be obtained from your local agent where you obtained EziView, or from EDMI.
EziView Basics 3-17
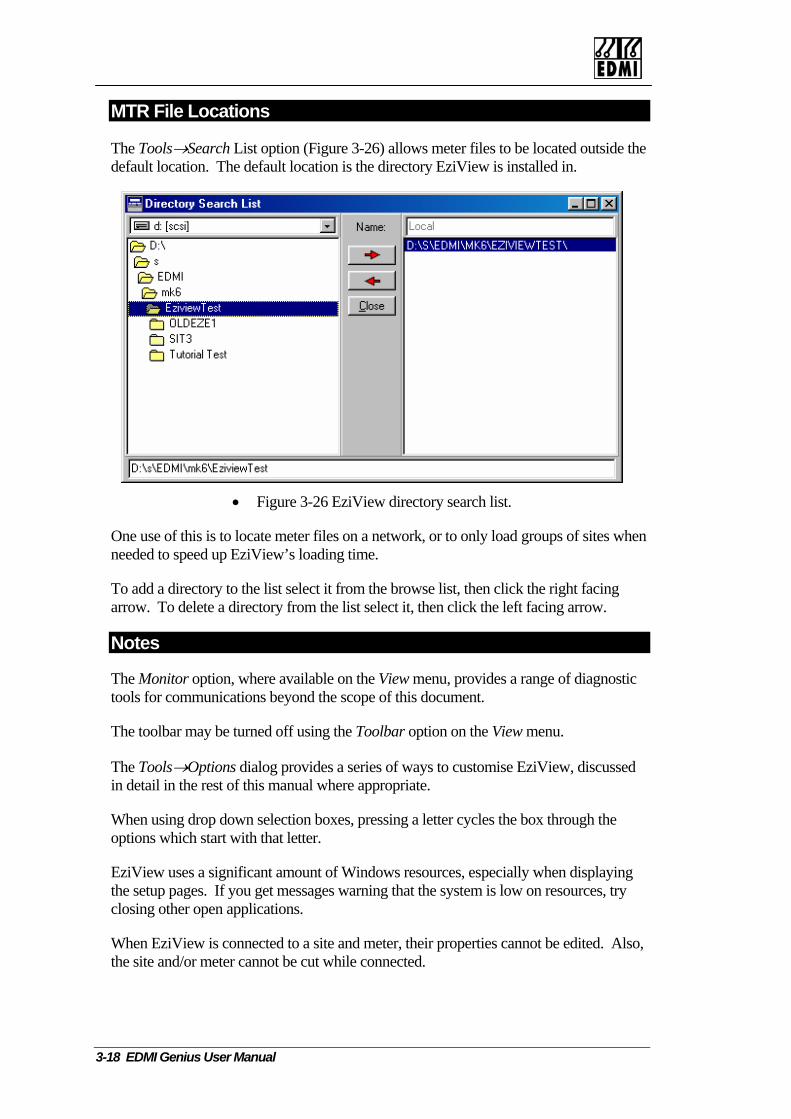
MTR File Locations
The Tools→Search List option (Figure 3-26) allows meter files to be located outside the default location. The default location is the directory EziView is installed in.
• Figure 3-26 EziView directory search list.
One use of this is to locate meter files on a network, or to only load groups of sites when
the browse list, then click the right facing arrow. To delete a directory from the list select it, then click the left facing arrow.
needed to speed up EziView’s loading time.
To add a directory to the list select it from
Notes
The Monitor option, where available on the iew menu, provides a range of diagnostic tools for com n
w, discussed in detail in the rest of this manual where appropriate.
When using drop down selection boxes, pressing a letter cycles the box through the options which start with that letter.
EziView uses a significant amount of Windows resources, especially when displaying the setup pages. If you get messages warning that the system is low on resources, try closing other open applications.
When EziView is connected to a site and meter, their properties cannot be edited. Also, the site and/or meter cannot be cut while connected.
Vmu ications beyond the scope of this document.
The toolbar may be turned off using the Toolbar option on the View menu.
The Tools→Options dialog provides a series of ways to customise EziVie
3-18 EDMI Genius User Manual
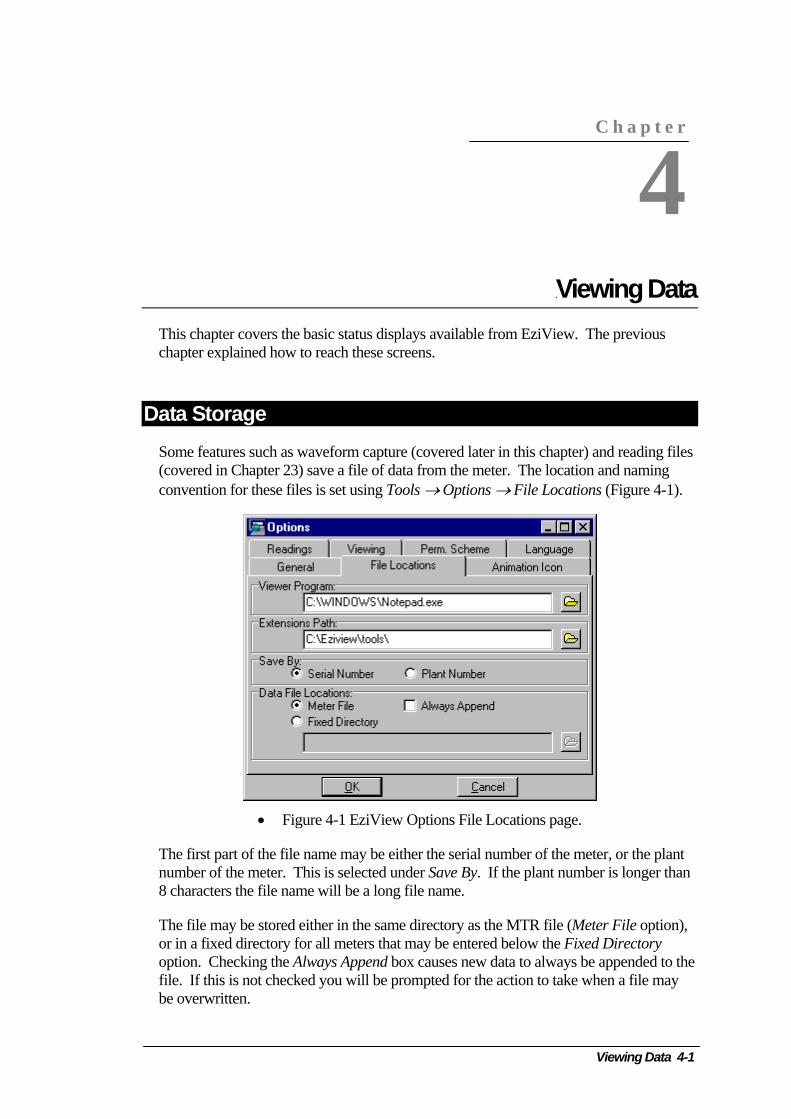
Chapter 4 VieThis chapter cover ys available from EziView. cha xplained ens.
s the basic status displapter e how to reach these scre
Data Storage Some features such as w f chapter)(covered in Chapter 23) e locatio
ese files is set using Tools → Options → File Locatio
ave orm capture (covered later in thissave a file of data from the meter. Th
convention for th
• Figure 4-1 EziView Options File Locations page.
The first part of the file name may be either the serial number of the mnumber of the meter. This is selected under Save By. If the plant numb8 characters the file name will be a long file name.
The file mor in a fixed directory for all meters that may be entered below the Fixeoption. Checking the Always Append box causes new data to always bfile. If this is not checked you will be prompted for the action to take wbe overwritten.
ay be stored either in the same directory as the MTR file (Me
C h a p t e r
4
g Data winThe previous
and reading files n and naming ns (Figure 4-1).
eter, or the plant er is longer than
option), d Directory e appended to the hen a file may
ter File
Viewing Data 4-1
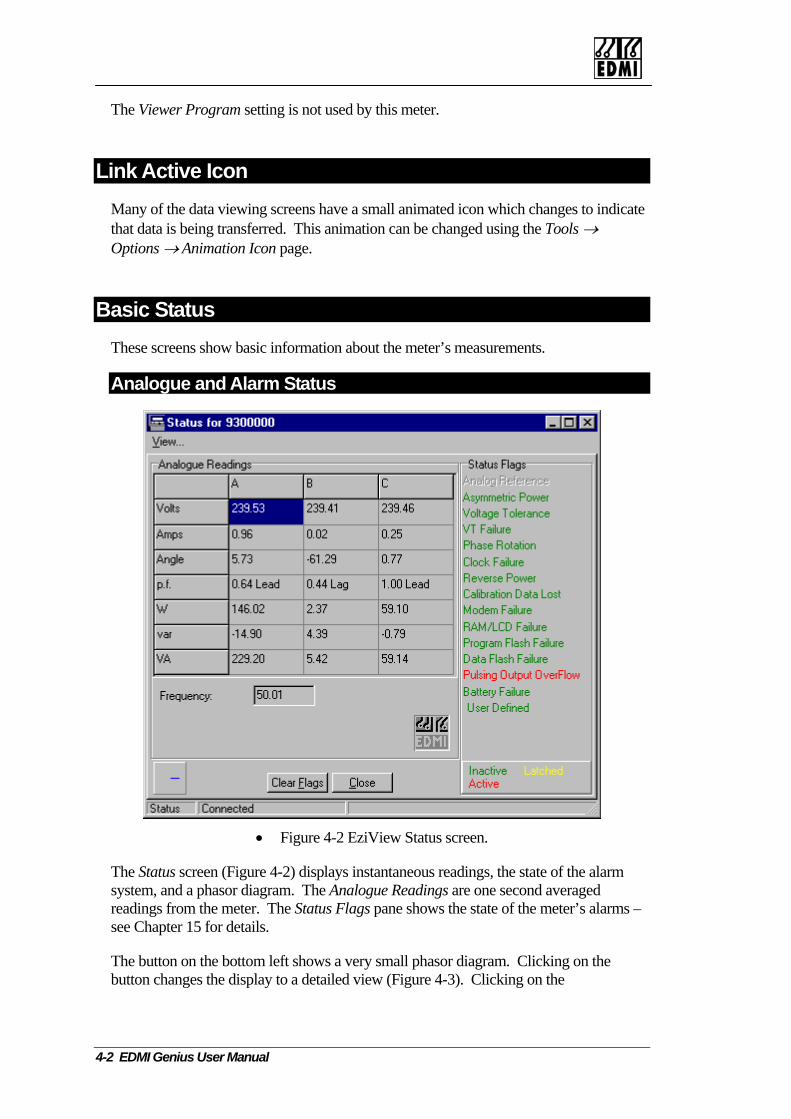
The Viewer Program setting is not used by this meter.
Link Active Icon Many of the data viewing screens have a small animated icon which changes to indicate
using the Tools → that data is being transferred. This animation can be changedOptions → Animation Icon page.
Bas us These screens show
ic Stat basic information about the meter’s measurements.
An dalogue an Alarm Status
• Figure 4-2 EziView Status screen.
The Status screen (Figure 4-2) displays instantaneous readings, the state of the alarm system, and a phasor diagram. The Analogue Readings are one second averaged readings from the meter. The Status Flags pane shows the state of the meter’s alarms – see Chapter 15 for details.
The button on the bottom left shows a very small phasor diagram. Clicking on the button changes the display to a detailed view (Figure 4-3). Clicking on the
4-2 EDMI Genius User Manual
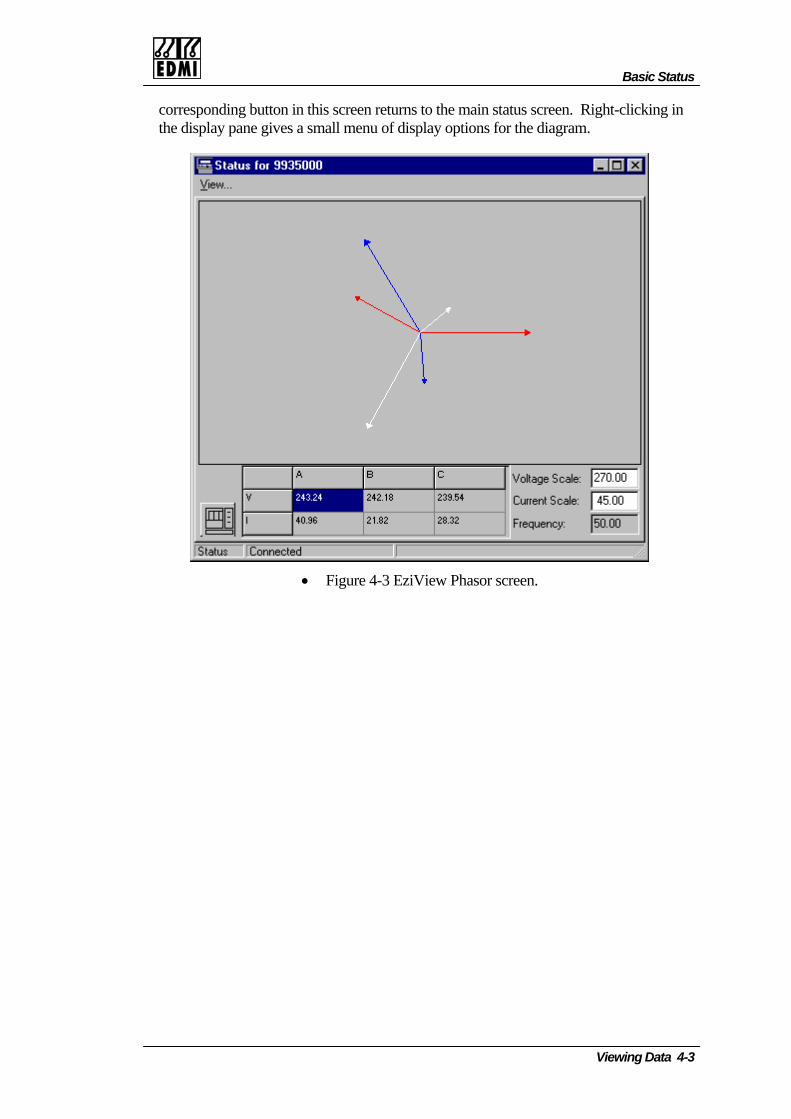
Basic Status
corresponding button in this screen returns to the main status screen. Right-clicking in the display pane gives a small menu of display options for the diagram.
• Figure 4-3 EziView Phasor screen.
Viewing Data 4-3
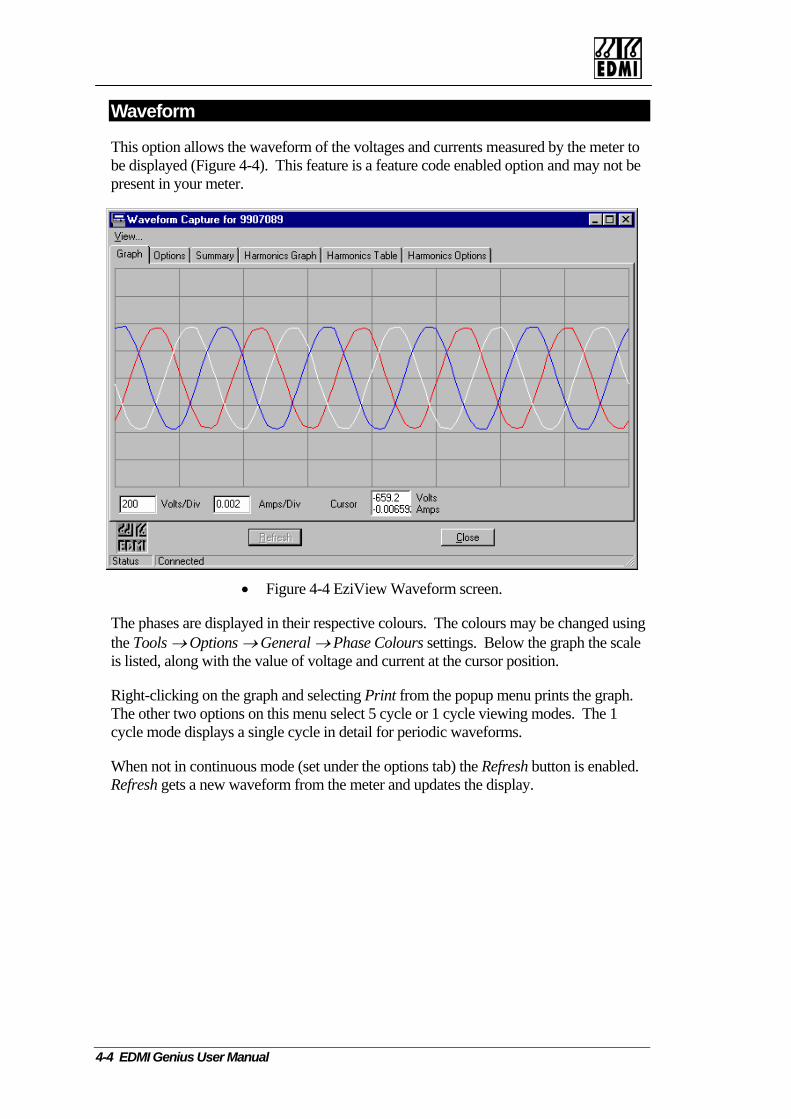
Waveform
This option allows the waveform of the voltages and currents measured by the meter tbe displayed (Figure 4-4). This feature is a feature code enabled option and may nopresent in your meter.
o t be
• Figure 4-4 EziView Waveform screen.
ng
ith the value of voltage and current at the cursor position.
Right-clicking on the graph and selecting Print from the popup menu prints the graph. The other two optio o modes. The 1 cycle mode displays a single cycle in detail for periodic waveforms.
When not in continuous mode (set under the options tab) the Refresh button is enabled. Refresh gets a new waveform from the meter and updates the display.
The phases are displayed in their respective colours. The colours may be changed usithe Tools → Options → General → Phase Colours settings. Below the graph the scale is listed, along w
ns n this menu select 5 cycle or 1 cycle viewing
4-4 EDMI Genius User Manual
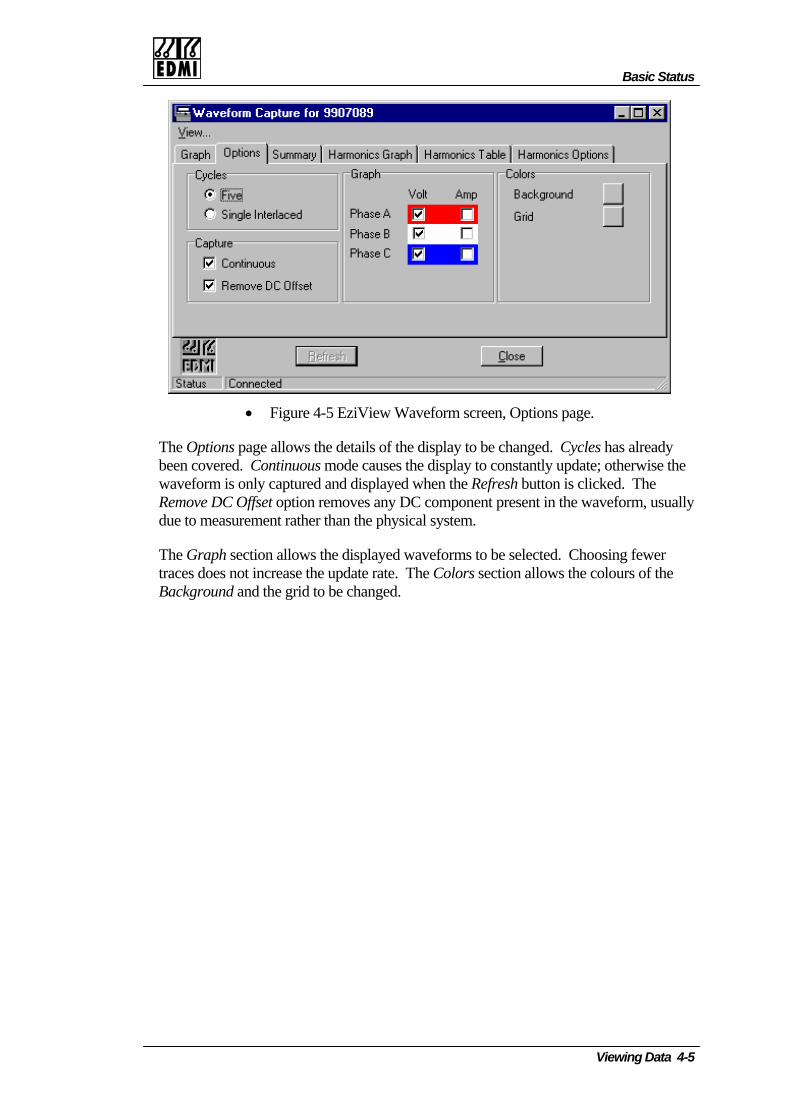
Basic Status
• Figure 4-5 EziView Waveform screen, Options page.
The Options page allows the details of the display to be changed. Cycles has already been covered. Continuous mode causes the display to constantly update; otherwise the waveform is only captured and displayed when the Refresh button is clicked. The Remove DC Offset option removes any DC component present in the waveform, usually due to measurement rather than the physical system.
The Graph section allows the displayed waveforms to be selected. Choosing fewer traces does not increase the update rate. The Colors section allows the colours of the Background and the grid to be changed.
Viewing Data 4-5
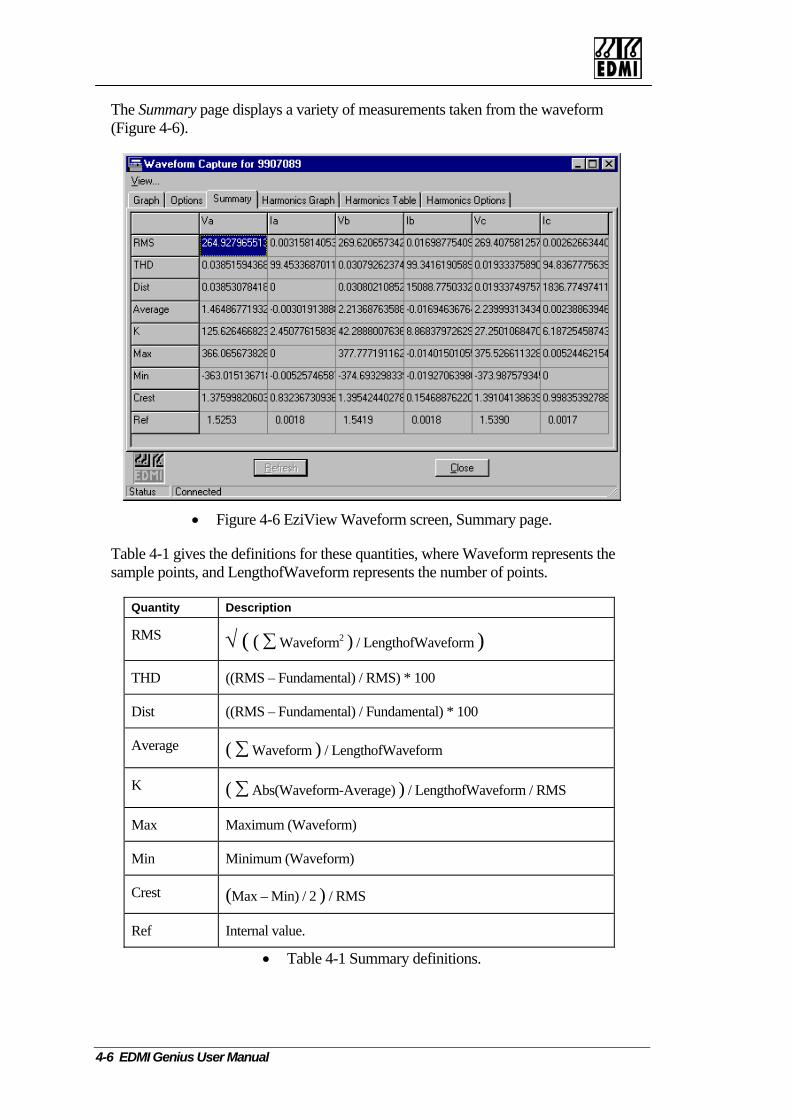
The Summary page displays a variety of measurements taken from the waveform (Figure 4-6).
• Figure 4-6 EziView Waveform screen, Summary page.
Table 4-1 gives the definitions for these quantities, where Waveform represents the sample points, and LengthofWaveform represents the number of points.
Quantity Description
RMS √ ( ( ∑ Waveform2 ) / LengthofWaveform )
THD ((RMS – Fundamental) / RMS) * 100
Dist ((RMS – Fundamental) / Fundamental) * 100
Average ( ∑ Waveform ) / LengthofWaveform
K ( ∑ Abs(Waveform-Average) ) / LengthofWaveform / RMS
Max Maximum (Waveform)
Min Minimum (Waveform)
Crest (Max – Min) / 2 ) / RMS
Ref Internal value.
• Table 4-1 Summary definitions.
4-6 EDMI Genius User Manual
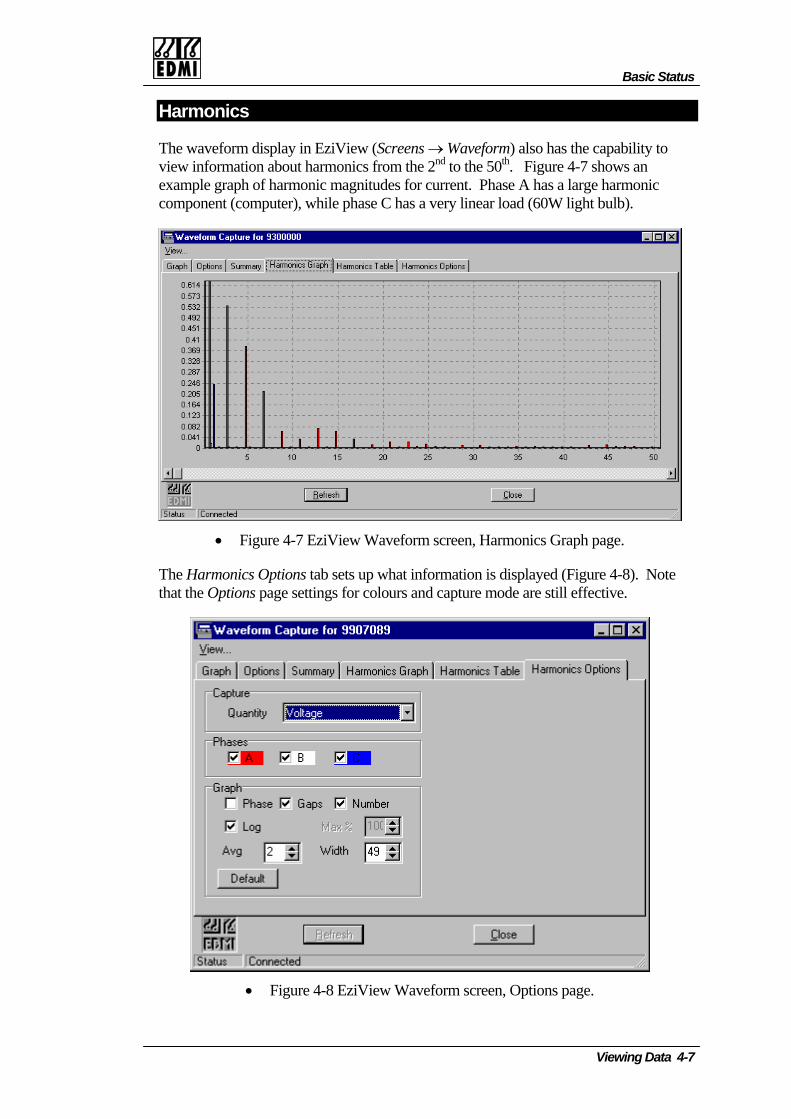
Basic Status
Harmonics
The waveform display in EziView (Screens → Waveform) also has the capability to view information about harmonics from the 2nd to the 50th. Figure 4-7 shows an example graph of harmonic magnitudes for current. Phase A has a large harmonic component (computer), while phase C has a very linear load (60W light bulb).
• Figure 4-7 EziView Waveform screen, Harmonics Graph page.
The Harmonics Options tab sets up what information is displayed (Figure 4-8). Note that the Options page settings for colours and capture mode are still effective.
• Figure 4-8 EziView Waveform screen, Options page.
Viewing Data 4-7

The Phases setting allows selection of the phases to display.
ible The Quantity setting selects what quantity is displayed. Table 4-2 shows the possoptions.
Quantity Description Voltage Displays the voltage harmonics as a percent of the fundamental. Current Displays the current harmonics as a percent of the fundamental. Voltage Mag Displays the voltage harmonic magnitudes in volts. Current Mag Displays the current harmonic magnitudes in amps. Watts Displays the power of each harmonic in watts, with sign.
• Table 4-2 Harmonic quantity options.
The first two options have a wide range of formatting options for the display. These are listed in Table 4-3.
Graph Option Description Phase Displays the phase (A, B and C) under the bars if there is room. Gaps Puts gaps between each harmonic. Number Numbers the harmonics. Log If checked, the scale is a log scale. If unchecked the scale is linear. Max % The maximum % value to display on the graph for linear scales. Avg EziView will perform a running average over this many readings
from the meter. This can settle down the display when harmonics are changing.
Width This is the number of harmonics to display. • Table 4-3 Harmonic graph options.
The other three options have a single formatting option of Show Fundamental. Unchecking this box prevents the fundamental from being displayed, bypassing scaling problems when the harmonic levels are relatively low compared to the fundamental.
The Default button returns the graph settings to their default values.
4-8 EDMI Genius User Manual
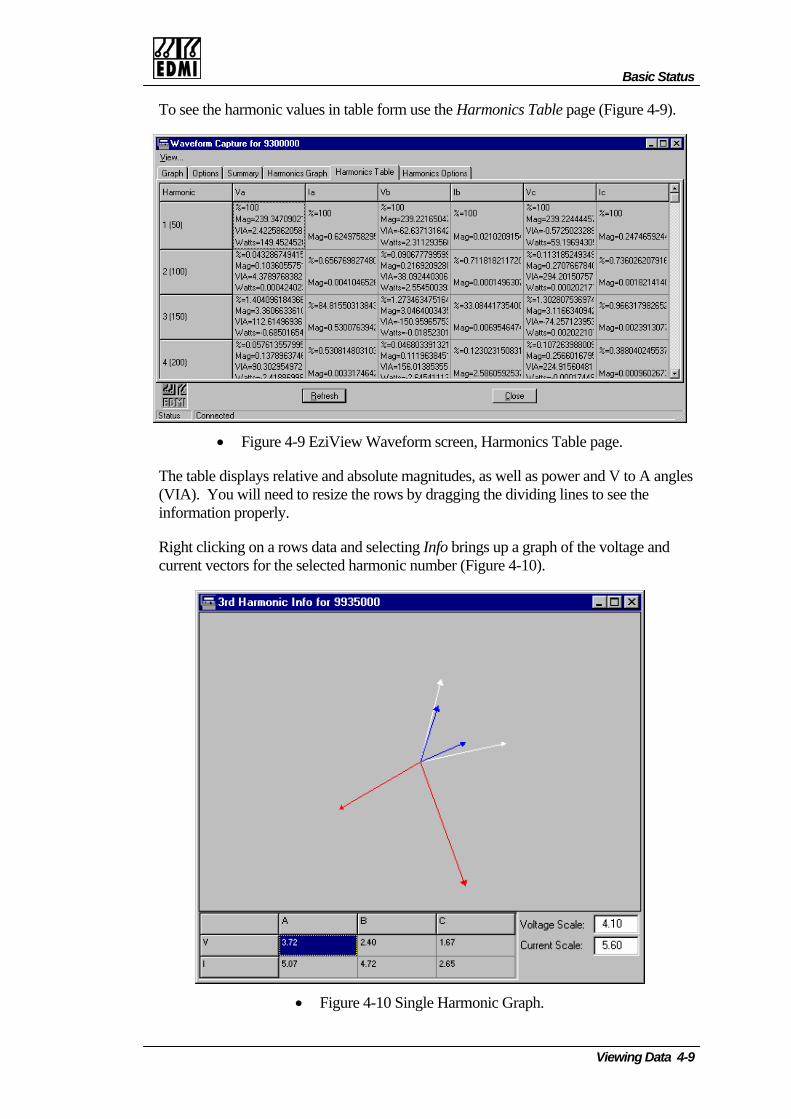
Basic Status
To see the harm alues in se the Harmonics Table page (Figuronic v table form u e 4-9).
• Figure 4-9 EziV .
The table displays relative an nd V to A angles (VIA). You will need to resiz the dividing lines to see thinformation properly.
Right clicking on a rows data e voltage and current vectors selecte
iew Waveform screen, Harmonics Table page
d absolute magnitudes, as well as power ae the rows by dragging e
and selecting Info brings up a graph of thfor the d harmonic number (Figure 4-10).
• Figure 4-10 Single Harmonic Graph.
Viewing Data 4-9
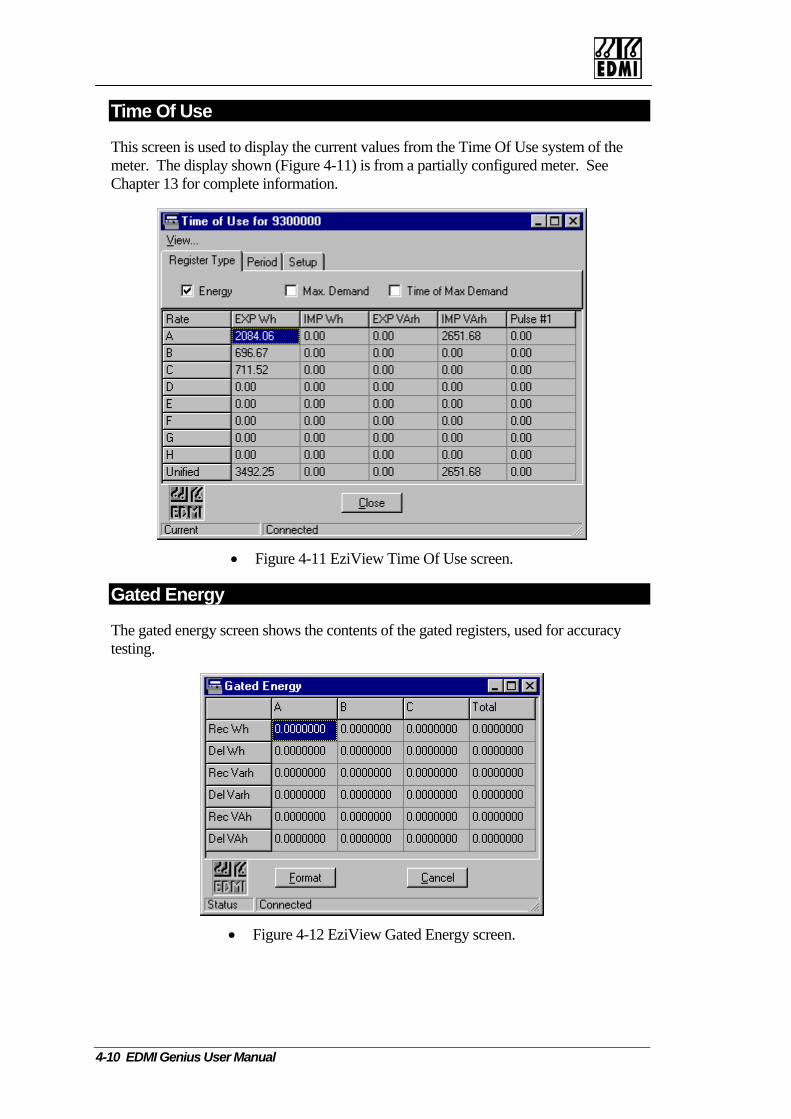
Time Of Use
This screen is used to display the current values from the Time Of Use system of meter. The display shown (Figure 4-11) is from a partially configured meter. See Chapter 13 for complete information.
the
• Figure 4-11 EziView Time Of Use screen.
Gated Energy
shows the contents of the gated registers, used for accuracy The gated energy screentesting.
• F een. igure 4-12 EziView Gated Energy scr
4-10 EDMI Genius User Manual
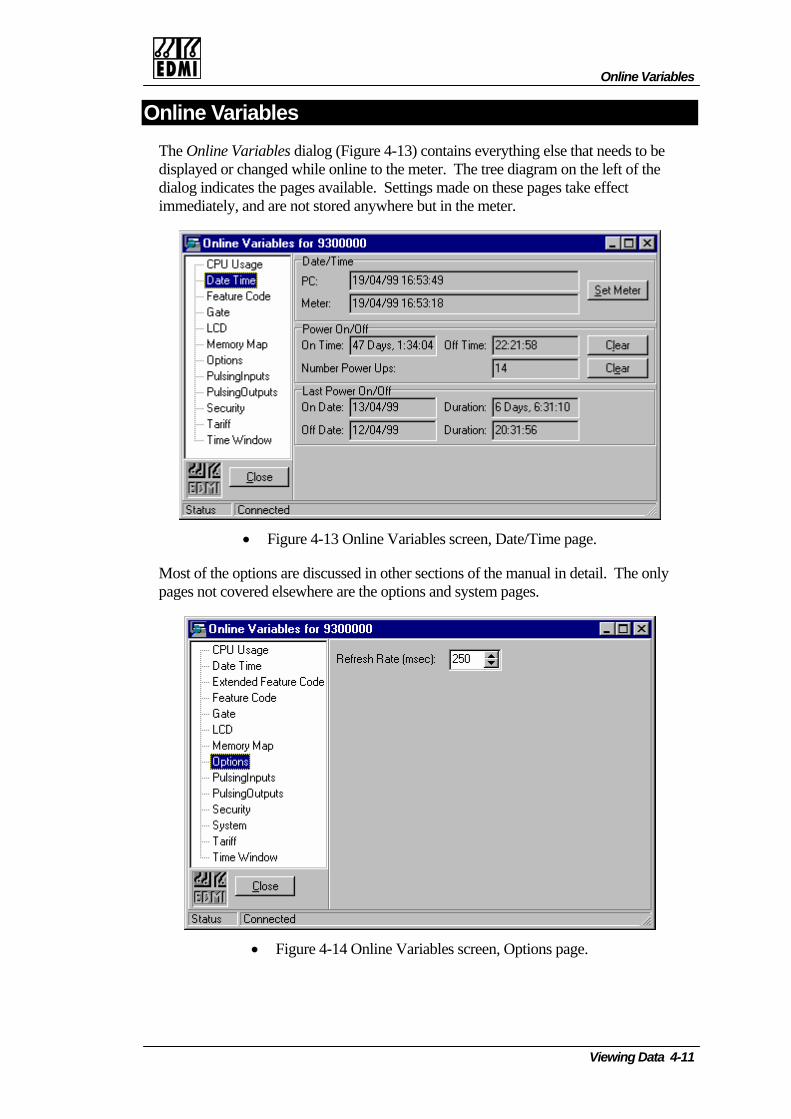
Online Variables
O needs to be
nline Variables The Online Variables dialog (Figure 4-13) contains everything else thatdisplayed or changed while online to the meter. The tree diagram on the left of the dialog indicates the pages available. Settings made on these pages take effect immediately, and are not stored anywhere but in the meter.
• Figure 1 me page.
ly
4- 3 Online Variables screen, Date/Ti
Most of the options are discussed in other sections of the manual in detail. The onpages not covered elsewhere are the options and system pages.
• Figure 4-14 Online Variables screen, Options page.
Viewing Data 4-11
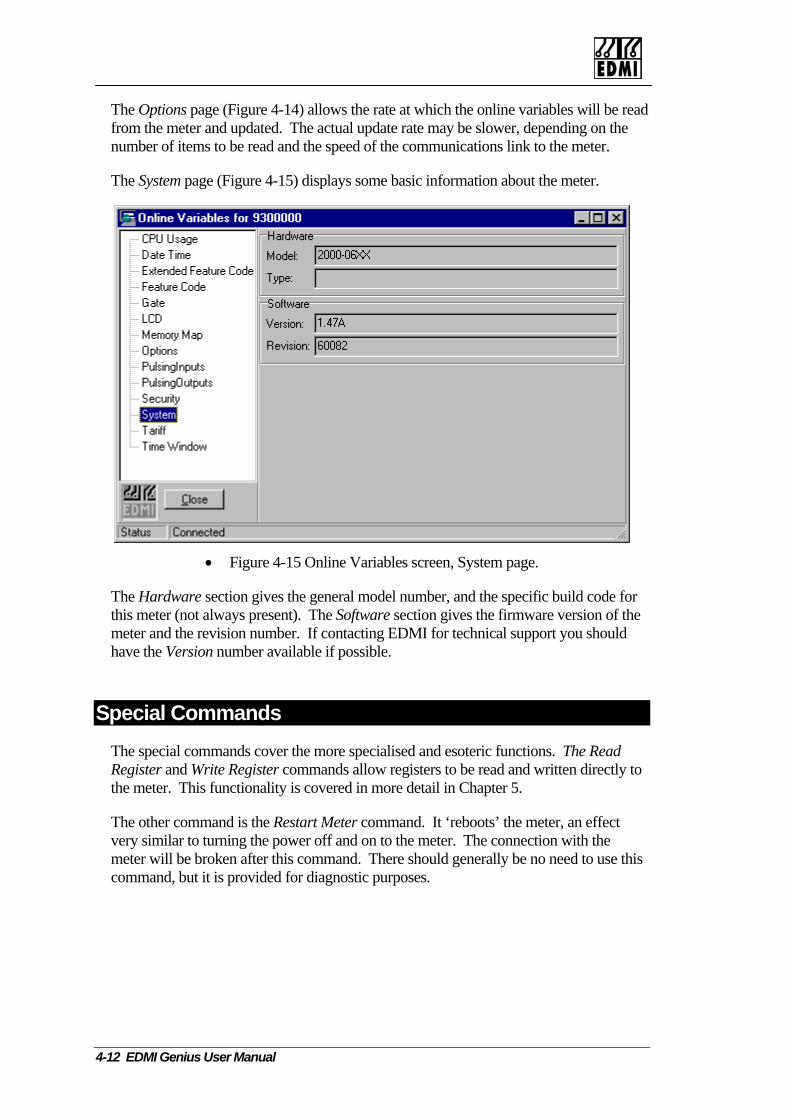
The Options page (Figure 4-14) allows the rate at which the online variables will be read from the meter and updated. The actual update rate may be slower, depending on the number of items to be read and the speed of the communications link to the meter.
The System page (Figure 4-15) displays some basic information about the meter.
• Figure 4-15 Online Variables screen, System page.
The Hardware section gives the general model number, and the specific build code for this meter (not always present). The Software section gives the firmware version of the meter and the revision number. If contacting EDMI for technical support you should have the Version number available if possible.
Special Commands The special commands cover the more specialised and esoteric functions. The Read Register and Write Register commands allow registers to be read and written directly to the meter. This functionality is covered in more detail in Chapter 5.
The other command is the Restart Meter command. It ‘reboots’ the meter, an effect very similar to turning the power off and on to the meter. The connection with the meter will be broken after this command. There should generally be no need to use this command, but it is provided for diagnostic purposes.
4-12 EDMI Genius User Manual

The Genius is able to store a vast amount of information. In order to fiformation there needs to be a way to refer to it. This is done
owever, it is not necessary to fully understand registers to use the meost of the usage of registers, so don’t be alarmed if the followin
s io
piece of innumbers. Each piece of information in the meter is stored in a register,has a number.
Register numbers provide a universal way of referencing information wA basic understanding of registers is important as much of the meter’s based on registers. These registers can be used both as a reference to ina device (as used by the meter’s LCD displays), and as a means of progreading the device remotely.
Hhides mect ns seem a little complex.
What’s in a Register? Each register has a num ies besides the value stoin u lue, and which security group it belocan be read to retr laying voltage on thw te ng the time). Some examples of s
Data Type Example Value Un
ber of different propertcl de the type and unit of the va
ieve their current value (e.g. disprit n to store a new value (e.g. setti
hown in Table 5-1.
Register Register Number
Phase A Volta Float 237.345 Vge E000 P ant Number F00D l String Fred Electric NNum g 453 Nber of Billing Resets
F032 Lon
Last Billi Time/Date 14:30:24 28/8/98 Nng Reset FC00 F equency E060 r Float 50.056 HChannel le 12332543.12234 W 1 Unified Energy
0009 Doub
• Table 5-1 Example Registers
C h a p t e r
5
Chapter 5 Registersusing register er
peration is in
ter. EziView g more detailed
nd a particular
and each regist
ithin the meter. oformation withramming and
red in it. These ngs to. Registers e LCD), or registers are
it Security Group
olts 35 one 21 one 92
one 93 z 200 h 42
Registers 5-1

Register Numbers
he register number is represented as a hexadecimal number. Whereas decimal bers (base 10) count from 0 to 9, hexadecimal numbers (base 16) count from 0 to 9
en A to F. Thus the 4 digit hexadecimal numbers used for the registers listed in Table -1 above give 164 possible registers, that is 65536.
ormally register numbers can just be used as is, so there is no need to worry about exadecimal arithmetic.
ull register numbers are 8 digits (32 bit). Wherever a 4 digit number is listed (as in able 5-1 above) the first four digits are assumed to be zero. For example, E000 is ctually 0000E000. The 4 digit numbers are used for convenience, as most of the ommonly used registers fall into this category. EziScript extensions use registers with
first four positions.
Tnumth5
Nh
FTacnon-zero digits in the
Register Types
There are a few more parts to registers than are immediately obvious. Each register has a defined type that gives information about what kind of data it can store. The type is given a capital letter to identify it ’ is an 8-bit integer that can
ore values from 0 to 255.
e types though have both an internal format, and an external format. For example, pe ‘E’ is used to store alarm strings. Its normal External form is a string of 16 letters
or dots depending on whether a particular alarm is active. This is easily read on an LCD or other display. Internally to the meter though, it is stored as a 16-bit number. When a bit is on, the corresponding alarm letter is displayed instead of a dot. Each bit of the number represents one of the 16 letters in the string.
The Internal form of the type is much smaller to store than the external type, and some operations can be easier to perform. In order to make this form available, the meter has both external and internal types for some data types. The base data type of an alarm register like F01A is ‘E’. Reading register 0000F01A gives the external value, with a data type of ‘A’ – a null terminated string of characters. Reading register 0001F01A requests the internal form (note the 1), which is data type ‘H’ – a hexadecimal 16-bit number.
Not all registers have internal types, and not all registers permit the internal version to be read. Except in special circumstances the Internal types may be ignored. Table 5-2 gives a list of all available base data types and what they translate to. In most cases EziView and the meter handle any type conversions transparently, but advanced users will find this information useful.
A note for command line users - all number formats more than 8-bits have big-endian byte ordering – that is the Most Significant Byte occurs first.
. For example, type ‘Cst
Somty
5-2 EDMI Genius User Manual
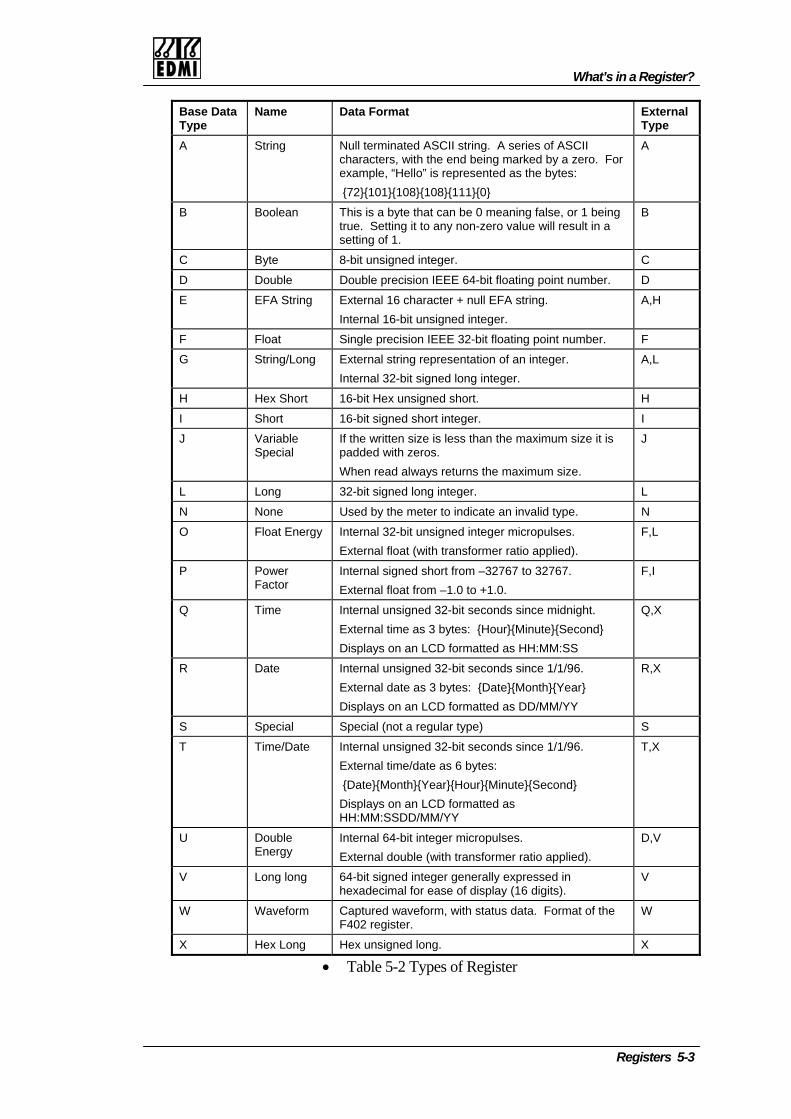
What’s in a Register?
Base Data Type
Name Data Format External Type
A String Null terminated ASCII string. A series of ASCII characters, with the end being marked by a zero. For example, “Hello” is represented as the bytes: {72}{101}{108}{108}{111}{0}
A
B Boolean This is a byte that can be 0 meaning false, or 1 being true. Setting it to any non-zero value will result in a setting of 1.
B
C Byte 8-bit unsigned integer. C
D Double Double precision IEEE 64-bit floating point number. D
E EFA String External 16 character + Internal 16-bit unsigned integer.
null EFA string. A,H
F Float Single precision IEEE 32-bit floating point number. F
G String/Long External string representation of an integer. Internal 32-bit signed long integer.
A,L
H Hex Short 16-bit Hex unsigned short. H
I Short 16-bit signed short integer. I
J Variable Special
If the wrpadded
itten size is less than the maximum size it is with zeros.
When read always returns the maximum size.
J
L Long 32-bit signed long integer. L
N None Used by the meter to indicate an invalid type. N
O Float Energy Internal 32-bit unsigned integer micropulses. External float (w er ratio applied).
F,L ith transform
P Power Factor
Internal signed short from –32767 to 32767. F,I External float from –1.0 to +1.0.
Q Time Internal unsigned 32-bit seconds since midnight. External time as 3 bytes: {Hour}{Minute}{Second} Displays on an LCD formatted as HH:MM:SS
Q,X
R Date Internal unsigned 32-bit seconds since 1/1/96. External date as 3 bytes: {Date}{Month}{Year} Displays on an LCD formatted as DD/MM/YY
R,X
S Special Special (not a regular type) S
T Time/Date Internal unsigned 32-bit seconds since 1/1/96. External time/date as 6 bytes: {Date}{Month}{Year}{Hour}{M
T,X
inute}{Second} Displays on an LCD formatted as HH:MM:SSDD/MM/YY
U Double Internal 64-bit integer micropulses. Energy External double (with transformer ratio applied).
D,V
V Long long 64-bit signed integer generally expressed in hexadecimal for ease of display (16 digits).
V
W Waveform Captured waveform, with status data. Format of the F402 register.
W
X Hex Long Hex unsigned long. X
• Table 5-2 Types of Register
Registers 5-3

Register Units
Each register has a unit, althoughdisplayed on the LCD when sele
many simply have ‘None’ as a unit. These are cted, and are available to command line users using the
ble
nit Code Measurement Unit
information command. A single capital letter is used to refer to the unit. The possiunits are listed in Table 5-3.
UA Amps
D Angle in degrees
H Hz
M Minutes
N No unit
P Percent
Q Power Factor
R VArs
S VA
T Seconds
U Unknown
V Volts
W Watts
X Wh
Y VArh
Z VAh
• Table 5-3 Types of Register
Security Groups
Every register belongs to on is granted only if the user has access to tha Security is
e of 256 security groups. Access to a registert group to perform the requested operation.
discussed fully in Chapter 16.
Accessing Registers with EziView EziView communicates with the meter using registers, although this process is generally hidden from the user. The Special→Read Register and Special→Write Register commands in EziView while online to a meter allow registers to be accessed directly.
5-4 EDMI Genius User Manual
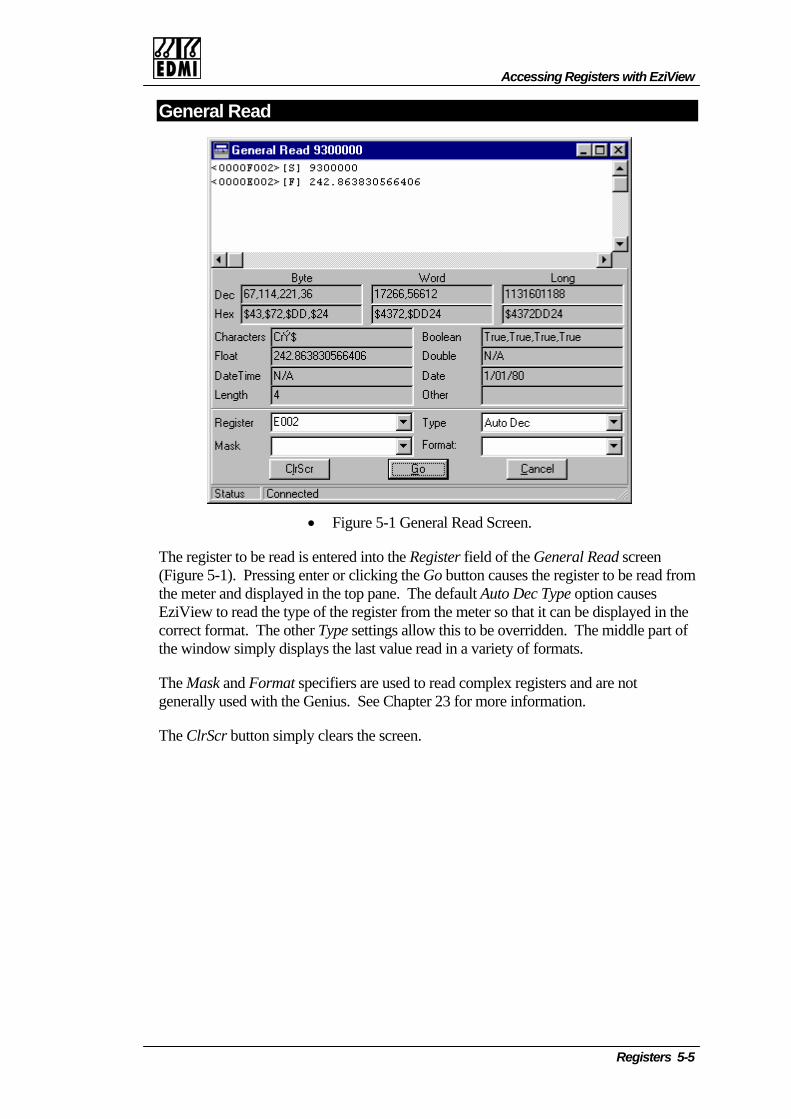
Accessing Registers with EziView
General Read
• Figure 5-1 General Read Screen.
The register to be read is entered into the Register field of the General Read screen (Figure 5-1). Pressing enter or clicking the Go button causes the register to be read fromthe meter and displayed in the top pane. The default Auto Dec Type option cau
ses
sk and Format specifiers are used to read complex registers and are not generally used with the Genius. See Chapter 23 for more information.
The ClrScr button simply clears the screen.
EziView to read the type of the register from the meter so that it can be displayed in the correct format. The other Type settings allow this to be overridden. The middle part of the window simply displays the last value read in a variety of formats.
The Ma
Registers 5-5
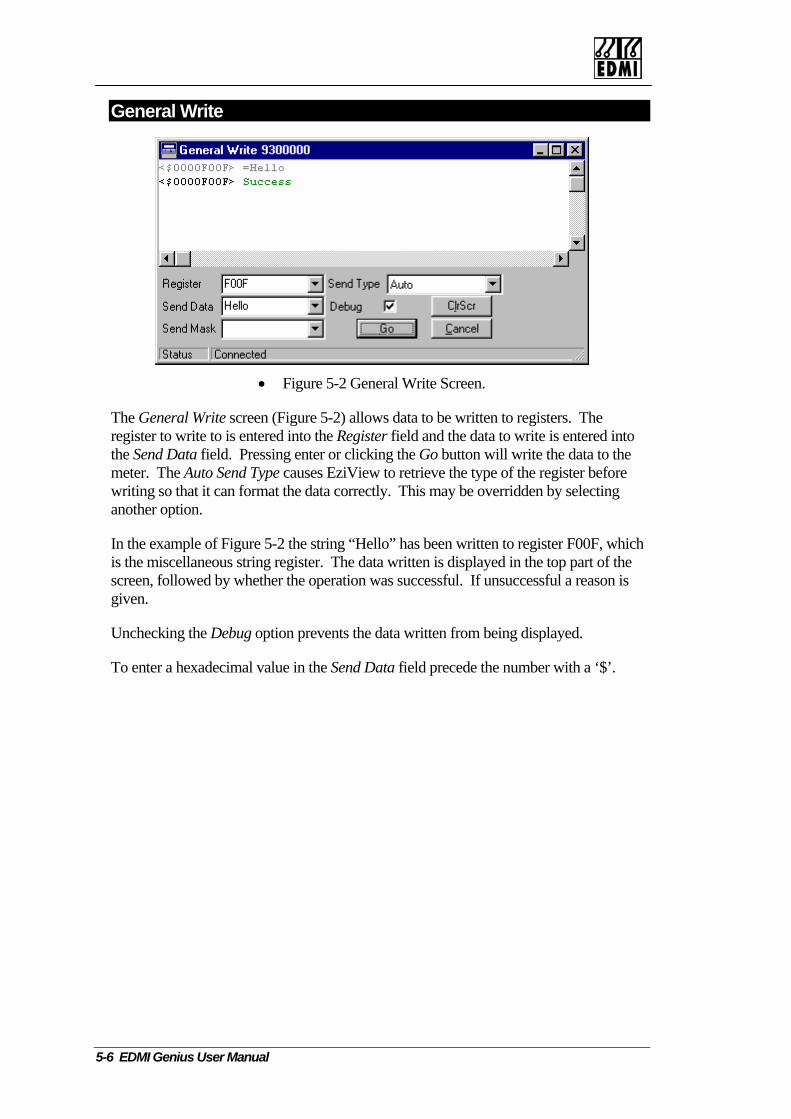
General Write
• Figure 5-2 General Write Screen.
The General Write screen (Figure 5-2) allows data to be written to registers. The register to write to is entered into the Register field and the data to write is entered into the Send Data field. Pressing enter or clicking the Go button will write the data to the meter. The Auto Send Type causes EziView to retrieve the type of the register before writing so that it can format the data correctly. This may be overridden by selecting another option.
h
ug option prevents the data written from being displayed.
In the example of Figure 5-2 the string “Hello” has been written to register F00F, whicis the miscellaneous string register. The data written is displayed in the top part of the screen, followed by whether the operation was successful. If unsuccessful a reason is given.
Unchecking the Deb
To enter a hexadecimal value in the Send Data field precede the number with a ‘$’.
5-6 EDMI Genius User Manual

Part II Config
his section of the manual covers the information and procedures rethe initial installation and setup of the meter. The first chapter in tshoT
I
uld be read first as it covers how to transfer setup information tThe remaining chapters may be read in any order as required.
e number of meters, you should decide how you wition. This is particul
• Chapter 7: “Miscellaneous”
• Chapter 8: “External Transformers”
• Chapter 9: “LCD Display”
• Chapter 10: “Pulsing Outputs”
• Chapter 11: “Pulsing Inputs”
• Chapter 12: “Date and Time”
• Chapter 13: “Time of Use”
• Chapter 14: “Communications”
• Chapter 15: “Alarms/EFA”
• Chapter 16: “Security”
Note that EziPort configuration is covered in Chapter 14.
Before you setup a largfeatures of the meter consistently within your organisaimportant in deciding security groupings, and basic setting such as TOU ch
• Chapter 6: “Configuration Basics”
P a r t
I
urationquirhis se
ed for ction
o the meter.
ll use the arly annels.
Configuration

Intentionally Blank
II EDMI Genius User Manual
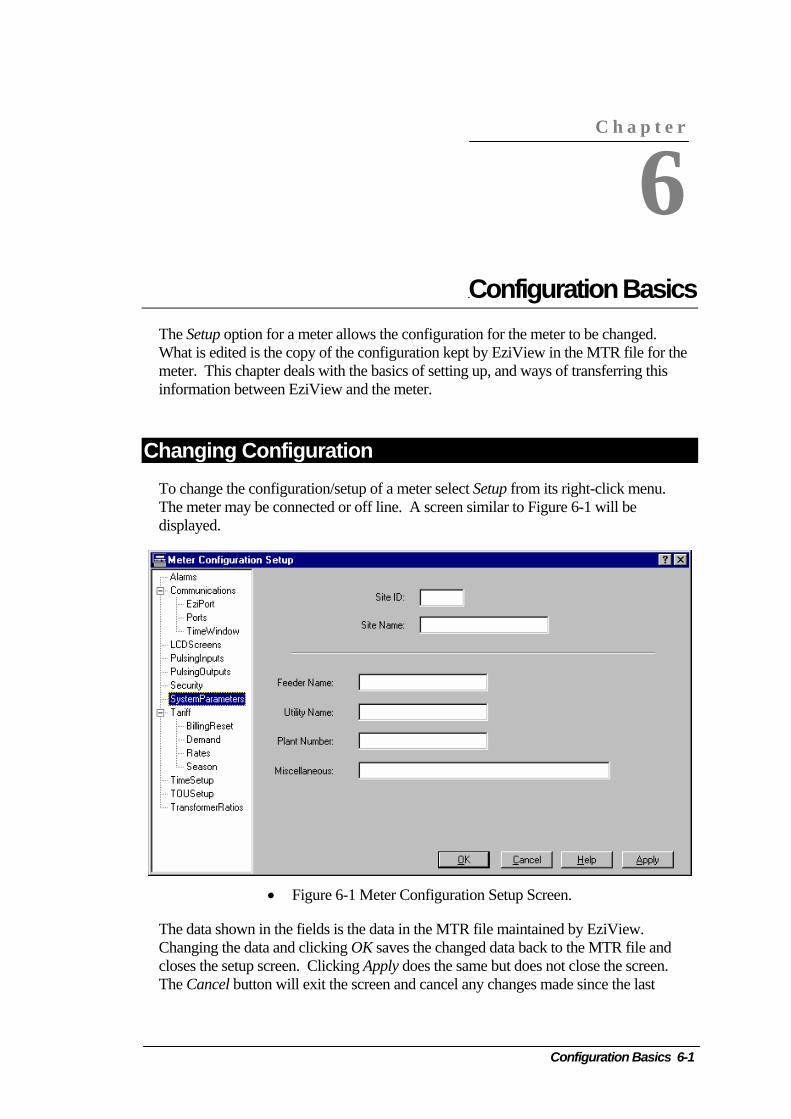
Chapter 6 ConfiguratiThe Setup option for a meter allows the configuration for the meter to b
hat is edited is the copy of the configuration kept by EziView in the eter. This chapter deals with the basics of setting up, and ways of traformation between EziView and the meter.
Wmin
Changing Configuration o change the configuration/setup of a meter select Setup from its righ
The meter may be connected or off line. A screen similar to Figure 6-1displayed.
T
• Figure 6-1 Meter Configuration Setup Screen.
The data shown in the fields is the data in the MTR file maintained by Changing the data and clicking OK saves the changed data back to the closes the setup screen. Clicking Apply does the same but does not cloThe Cancel button will exit the screen and cancel any changes made si
Config
C h a p t e r
6
on Basics e changed.MTR file for the nsferring this
t-click menu. will be
EziView. MTR file and se the screen. nce the last
uration Basics 6-1

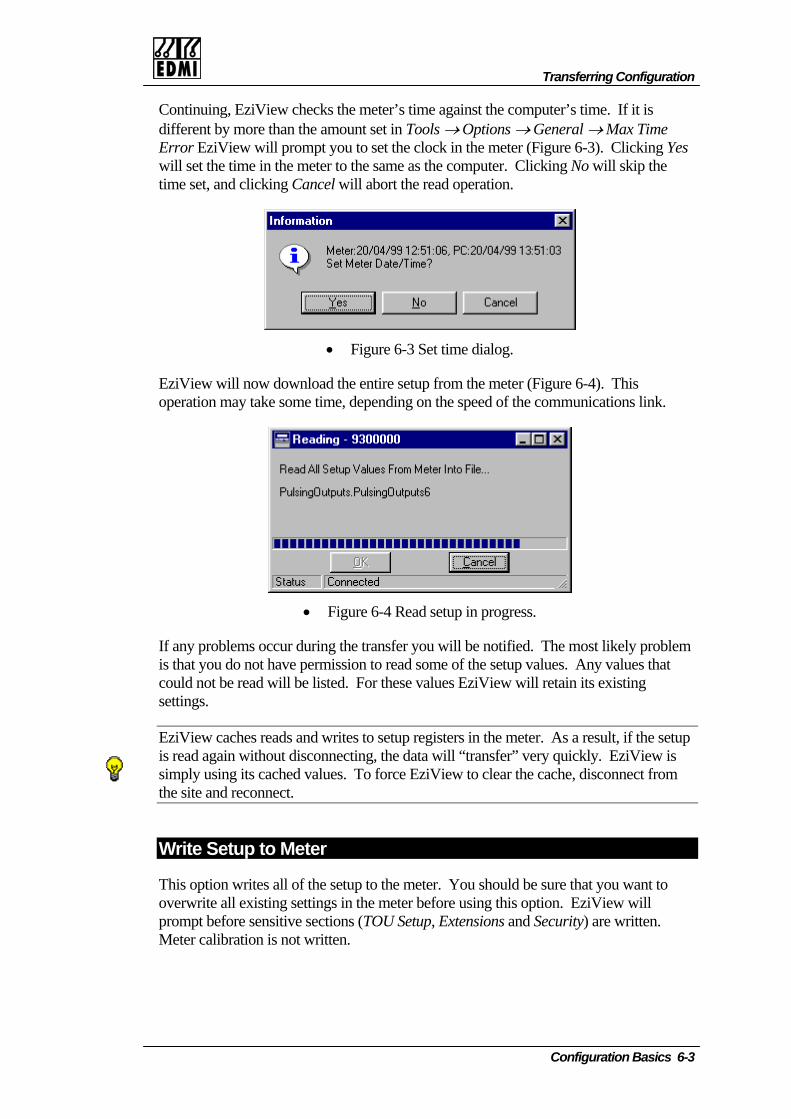
Transferring Configuration
Continuing, EziView checks the meter’s time against the computer’s time. If it is different by more than the amount set in Tools → Options → General → Max Time Error EziView will prompt you to set the clock in the meter (Figure 6-3). Clicking Yes will set the time in the meter to the same as the computer. Clicking No will skip the time set, and clicking Cancel will abort the read operation.
• Figure 6-3 Set time dialog.
EziView will now download the entire setup from the meter (Figure 6-4). This operation may take some time, depending on the speed of the communications link.
• Figure 6-4 Read setup in progress.
you will be notified. The most likely problem some of the setup values. Any values that
g
E V tup
If any problems occur during the transfer is that you do not have permission to readcould not be read will be listed. For these values EziView will retain its existinsettings.
zi iew caches reads and writes to setup registers in the meter. As a result, if the seis read again without ill “transfer” very quickly. EziView is
es. To force EziView to clear the cache, disconnect from the site and reconnect.
disconnecting, the data wsimply using its cached valu
Wri
r. You should be sure that you want to overwrite all existing settings in the meter before using this option. EziView will prompt before sensitive sections (TOU Setup, Extensions and Security) are written. Meter calibration is not written.
te Setup to Meter
This option writes all of the setup to the mete
Configuration Basics 6-3
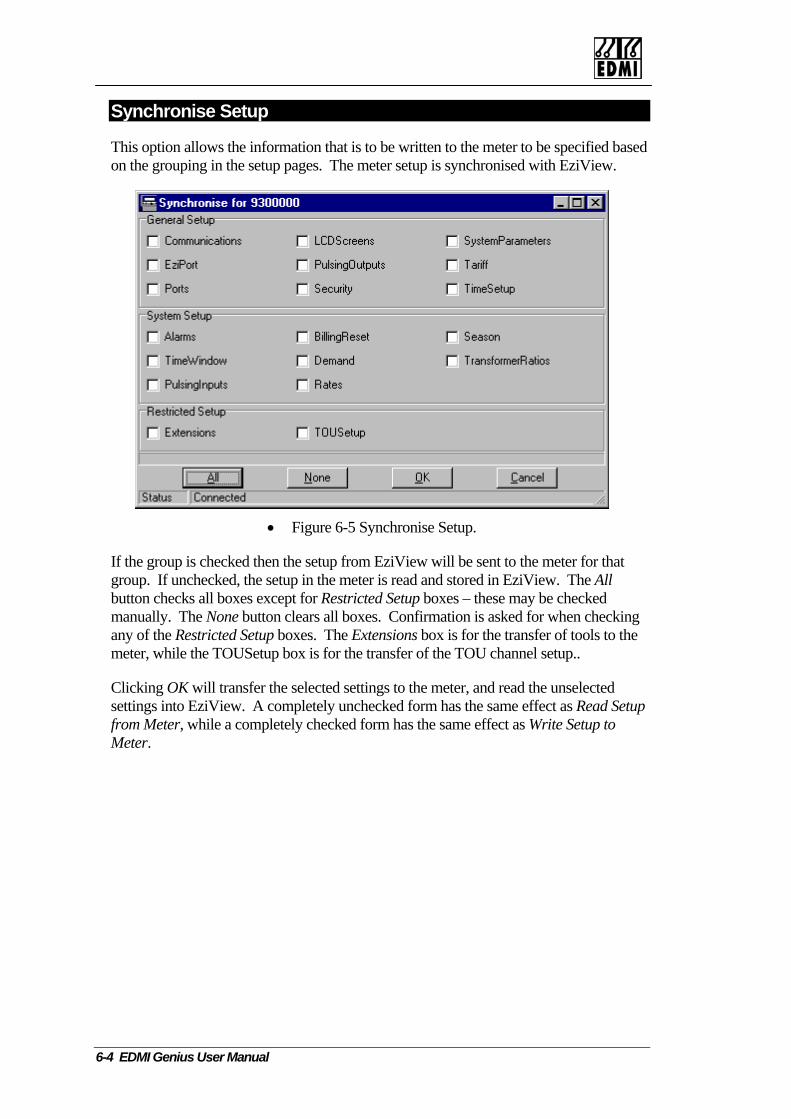
Sy nise Setup
Th s the informa to the meter to be specified based on the grouping in the setup pa synchronised with EziView.
nchro
is option allow tion that is to be writtenges. The meter setup is
• Figure 6-5 Synchronise Setup.
If the group is checked then the setup from EziView will be sent to the meter for that
g r of tools to the
meter, while the TOUSetup box is for the transfer of the TOU channel setup..
Clicking OK will transfer the selected settings to the meter, and read the unselected settings into EziView. A completely unchecked form has the same effect as Read Setup from Meter, while a completely checked form has the same effect as Write Setup to Meter.
group. If unchecked, the setup in the meter is read and stored in EziView. The All button checks all boxes except for Restricted Setup boxes – these may be checked manually. The None button clears all boxes. Confirmation is asked for when checkinany of the Restricted Setup boxes. The Extensions box is for the transfe
6-4 EDMI Genius User Manual
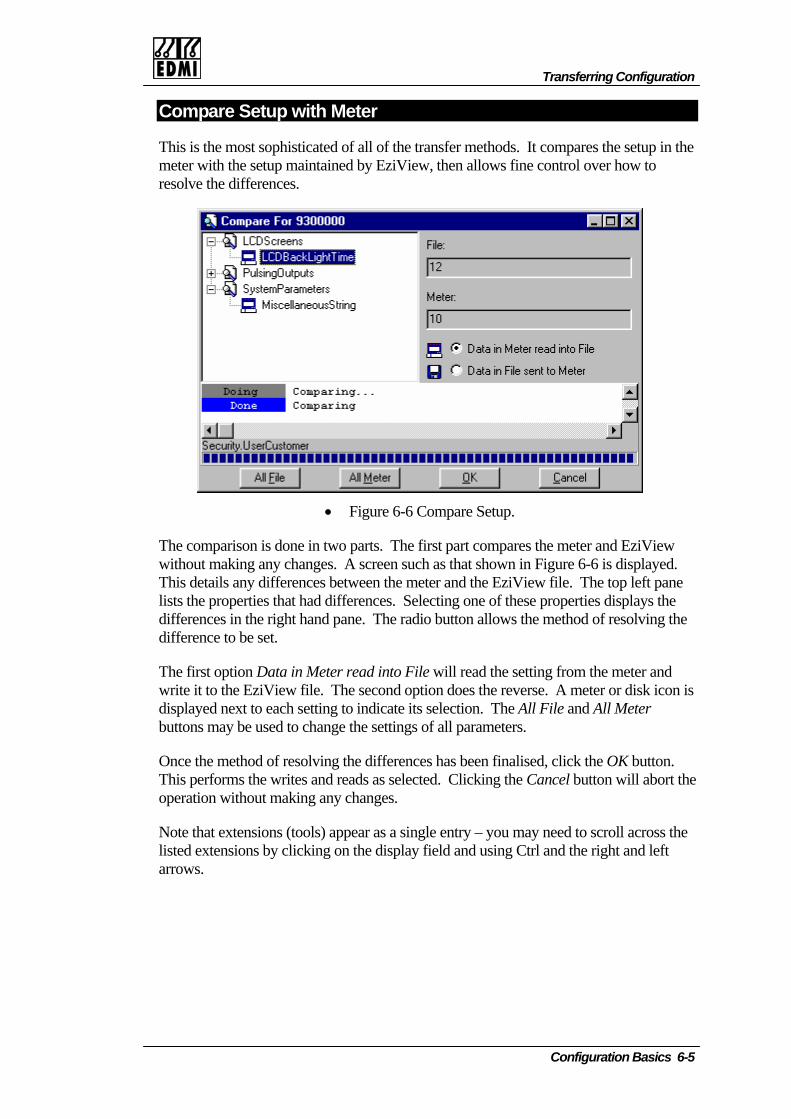
Transferring Configuration
Compare Setup with Meter
This is the most sophisticated of all of the transfer methods. It compares the setup in the meter with the setup maintained by EziView, then allows fine control over how to resolve the differences.
• Figure 6-6 Compare Setup.
The comparison is done in two parts. The first part compares the meter and EziView without making any changes. A screen such as that shown in Figure 6-6 is displayedThis details any differences between the meter and the EziView file. The top left pane lists the properties that had differences. Selecting on
.
e of these properties displays the differences in the right hand pane. The radio button allows the method of resolving the
and write it to the EziView file. The second option does the reverse. A meter or disk icon is displayed next to each setting to indicate its selection. The All File and All Meter
e the settings of all parameters.
e ges.
Note that extensions (tools) appear as a single entry – you may need to scroll across the listed extensions by c the right and left arrows.
difference to be set.
The first option Data in Meter read into File will read the setting from the meter
buttons may be used to chang
Once the method of resolving the differences has been finalised, click the OK button. This performs the writes and reads as selected. Clicking the Cancel button will abort thoperation without making any chan
cli king on the display field and using Ctrl and
Configuration Basics 6-5
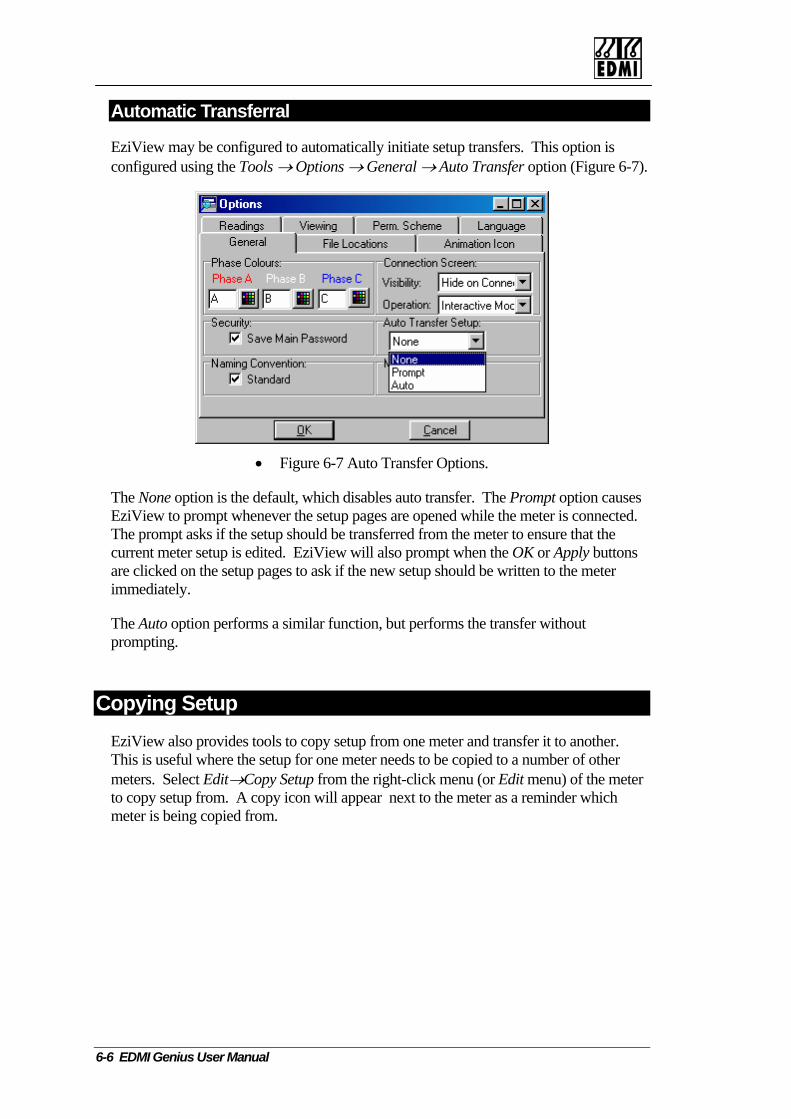
Automatic Transferral
EziView may be configured to automatically initiate setup transfers. This option is configured using the Tools → Options neral → Auto Transfer option (Figure 6-7). → Ge
• Figure 6-7 Auto Transfer Options.
The None option is the default, which disables auto transfer. The Prompt option causes EziView to prompt whenever the setup pages are opened while the meter is connected. The prompt asks if the setup should be transferred from the meter to ensure that the current meter setup is edited. EziView will also prompt when the OK or Apply buttons are clicked on the setup pages to ask if the new setup should be written to the meter immediately.
The Auto option performs a similar function, but performs the transfer without prompting.
Copying Setup EziView also provides tools to copy setup from one meter and transfer it to another. This is useful where the setup for one meter needs to be copied to a number of other meters. Select Edit→Copy Setup from the right-click menu (or Edit menu) of the meter to copy setup from. A copy icon will appear next to the meter as a reminder which meter is being copied from.
6-6 EDMI Genius User Manual
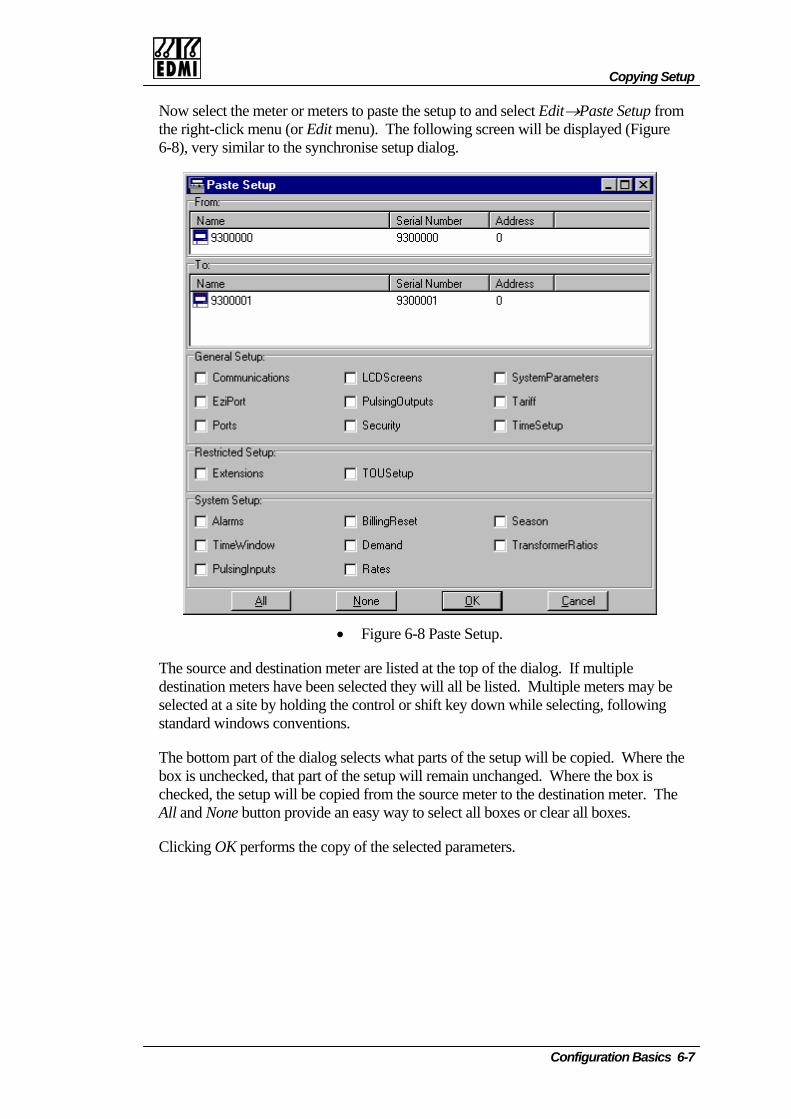
Copying Setup
Now select the meter or meters to paste the setup to and select Edit→Paste Setup from the right-click menu (or Edit menu). The following screen will be displayed (Figure 6-8), very similar to the synchronise setup dialog.
• Figure 6-8 Paste Setup.
the control or shift key down while selecting, following
e hanged. Where the box is
hecked, the setup will be copied from the source meter to the destination meter. The ll and None button provide an easy way to select all boxes or clear all boxes.
Clicking OK performs the copy of the selected parameters.
The source and destination meter are listed at the top of the dialog. If multiple destination meters have been selected they will all be listed. Multiple meters may be selected at a site by holding standard windows conventions.
The bottom part of the dialog selects what parts of the setup will be copied. Where thbox is unchecked, that part of the setup will remain unccA
Configuration Basics 6-7

Intentionally Blank
6-8 EDMI Genius User Manual
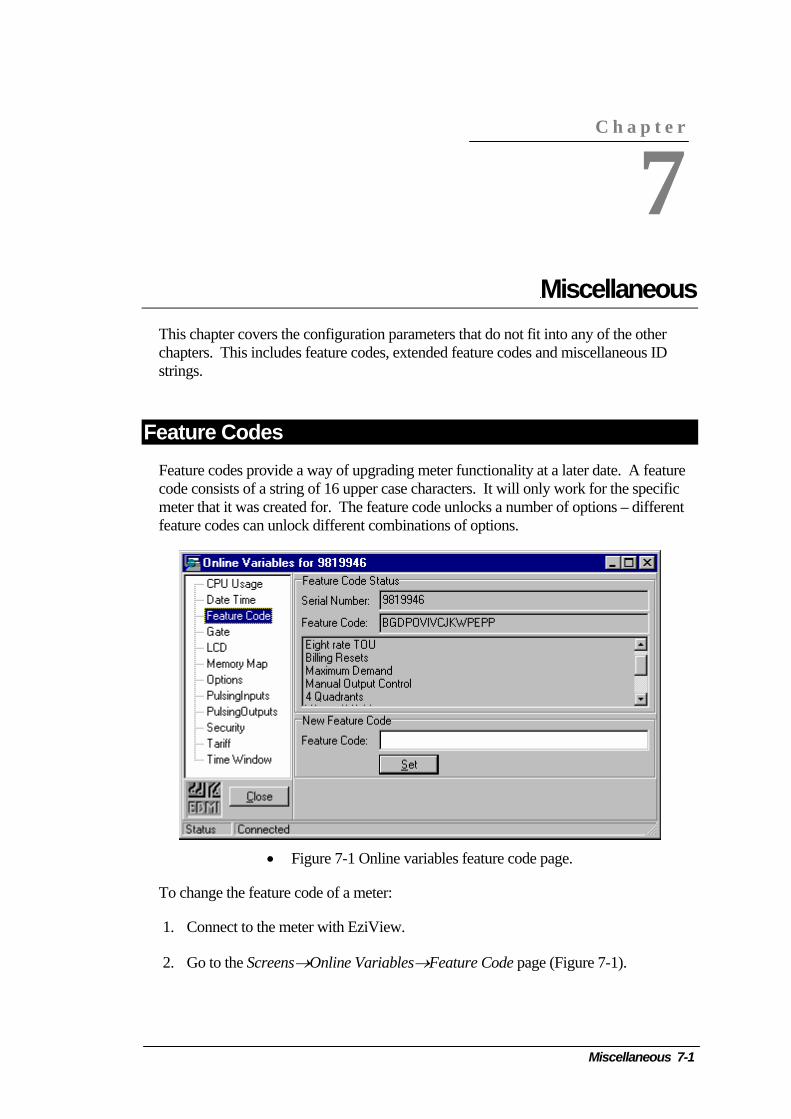
Chapter 7 MiscThis chapter covers the configuration parameters that do not fit into anchapters. This includes feature codes, extended feature codes and miscstrings.
Fe codes provide a way of upgrading meter functionality at a later
code consists of a string of 16 upper case characters. It will only workmeter that it was created for. The feature code unlocks a number of opfeature codes can unlock different combinations of options.
eature Codes Featur
• Figure 7-1 Online variables feature code page.
To change the feature code of a meter:
1. Connect to the meter with EziView.
2. Go to the Screens→Online Variables→Feature Code page (Figur
C h a p t e r
7
ellaneousy of the other ellaneous ID
date. A feature for the specific tions – different
e 7-1).
Miscellaneous 7-1

3. Enter the new featucorrect code for thi
re code into the feature code field. Make sure that it is the s meter.
atures res are enab the spelling of the feature code for errors
s the co de for the meter.
The av le features are listed
ature
4. Click the Set button.
5. The Feature Code Status section will update to show the new code and the feenabled. If nand check
o featuthat it i
led, check rrect feature co
ailab in Table 7-1:
Fe Meaning Single rate TOU Allows a single rate of TOU.
Two rate TOU Allows two rates of TOU.
Four rate TOU Allows four rates of TOU.
Eight rate TOU Allows eight rates of TOU.
Billing Resets Allows billing resets to occur.
Maximum Demand Enables maximum demand calculations.
Manual Outpu Allows outputs to be set manually (not just pulsing/time t Controlsync).
4 Quadrants ents. Enables full 4 quadrant measurem
VAr and VA M ements easurements. easur Enables VAr, VArh, VA and VAh m
Waveform Capture Allows waveforms to be captured and downloaded.
Extension Upl to the meter. oad Allows new EziScript extensions to be written
Enhanced Modem Allows the enhanced modem script to operate, which supports turning off of modems.
EziPort Enables the EziPort.
•
To connect to the meter and go to the Screens→Online Va
Table 7-1 Feature code features.
see the list of available features, riables→Feature Code page.
EIn addition to the feature code system, the meter has an extended feature code system. This is used to control access cripts ls. Unlike the normal feature code scheme, extende ture code lative. Each extended feature code enables one or more opt , in additi options.
xtended Feature Code
to EziS and Toolbox tood fea s are cumuions on to the existing
7-2 EDMI Genius User Manual
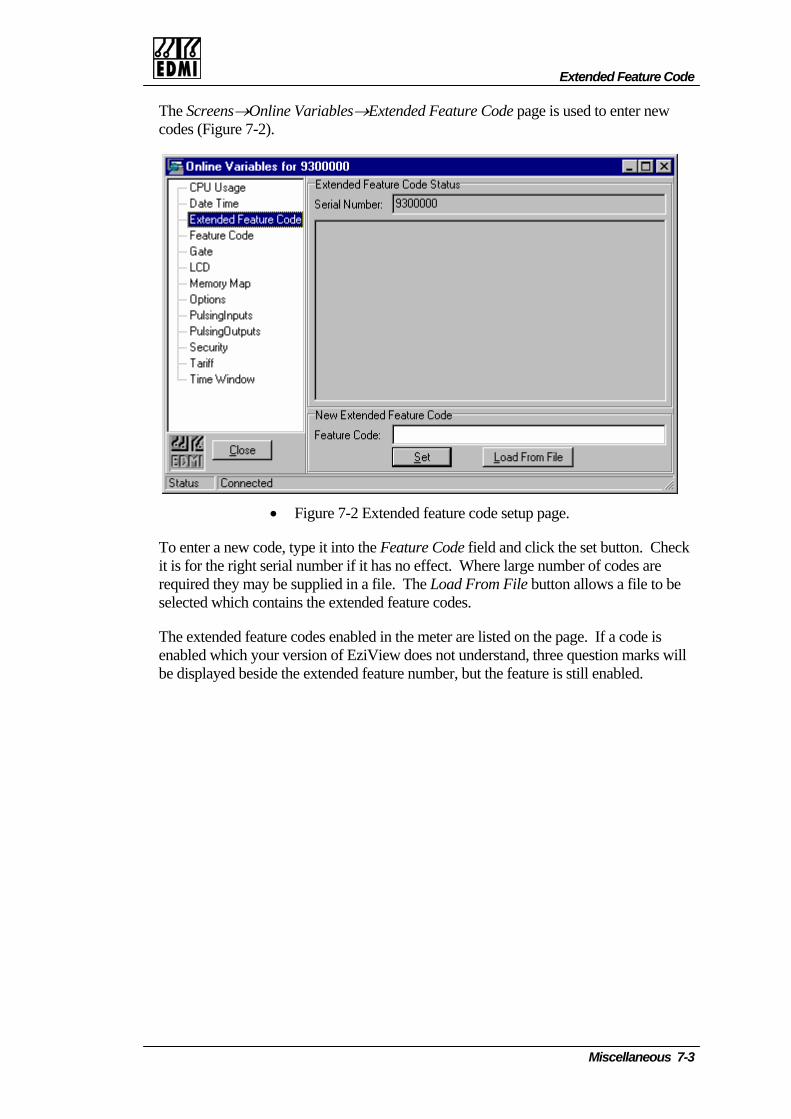
Extended Feature Code
The Screens→Online Variables→Extended Feature Code page is used to enter newcodes (Figure 7-2).
• Figure 7-2 Extended feature code setup page.
. The Load From File button allows a file to be
rsion of EziView does not understand, three question marks will be displayed beside the extended feature number, but the feature is still enabled.
To enter a new code, type it into the Feature Code field and click the set button. Check it is for the right serial number if it has no effect. Where large number of codes are required they may be supplied in a fileselected which contains the extended feature codes.
The extended feature codes enabled in the meter are listed on the page. If a code is enabled which your ve
Miscellaneous 7-3
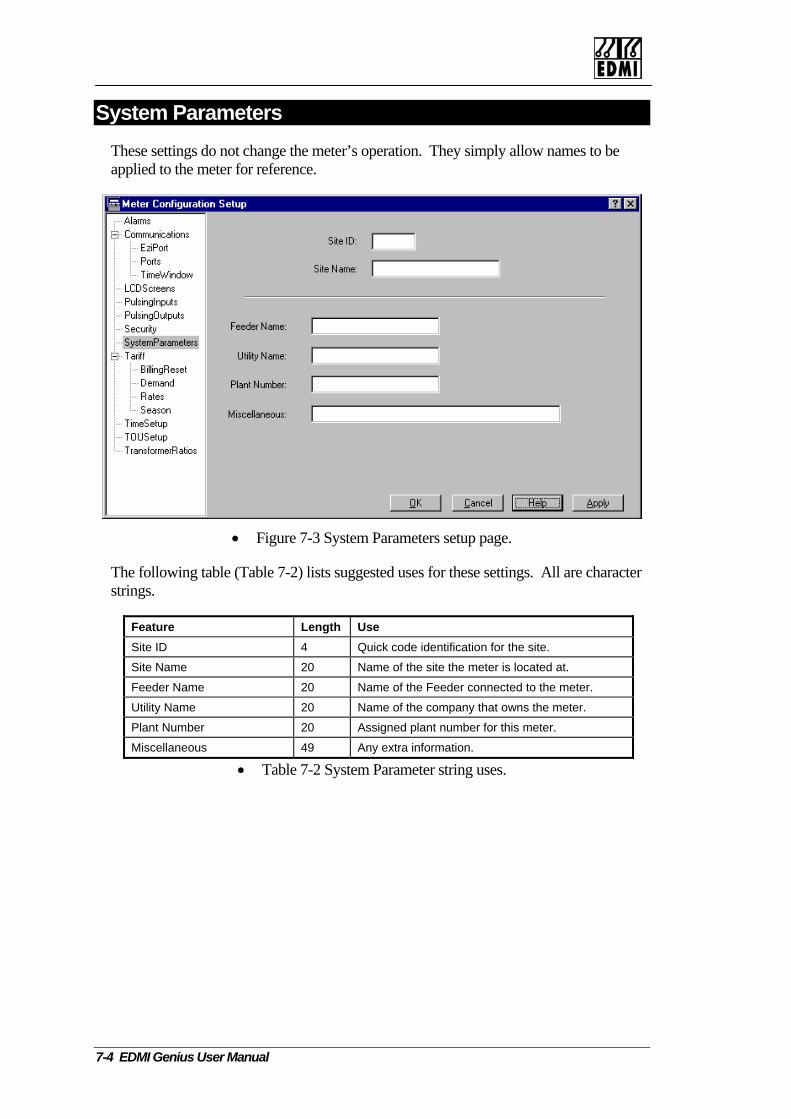
SThese settings do not change the meter’s operation. They simply allow names to be app e me r refe
ystem Parameters
lied to th ter fo rence.
• Figure 7-3 System Parameters setup page.
The following table (Table 7-2) lists suggested uses for these settings. All are character strings.
Feature Length Use Site ID 4 Quick code identification for the site.
Site Name 20 Name of the site the meter is located at.
Feeder Name 20 Name of the Feeder connected to the meter.
Utility Name 20 Name of the company that owns the meter.
Plant Number 20 Assigned plant number for this meter.
Miscellaneous 49 Any extra information.
• Table 7-2 System Parameter string uses.
7-4 EDMI Genius User Manual
Chapter 8 External TranThis section is dedicated to configuring the meter for its voltage and cuconnections.
In many applications external measurement transformers are used betwand the system to be measured. The values at the input to the meter aresecondary quantities and the values on the high voltage/current side of ra
and CTs external to the meter to be accounted for. t nsformers are defined as primary quantities. The meter allows the ra
Changing the transformer ratios in a meter with existing data may haveon tin s ratios affect how th
Bec eadin
he data already stored. Much of the information recorded by the mecondary quantities. Changing the transformer
are read out as primary values. This mainly affects the Time of Use syon load surveys will depend on the survey (See Chapter 19 for more in
ause of this it is strongly recommended that the Time of Use rthe transformer ratios are changed.
The meter also needs to know the nominal voltage and current at the mi.e. the secondary values. The meter uses these for the generation of al
or more information).
15 f
mak ble.
Finally the meter needs to know if it is connected in two element or thr(See Chapter 2 for connection details). This is not automatically detect
e the detection of alarm conditions more relia
Externa
C h a p t e r
8
sformersrrent
een the meter defined as the measurement tios of these VTs
variable effects tively
ese stored values
gs be cleared if
eter is effec
stem. The effect formation).
eter terminals, arms (see Chapter
de ee element moed in order to
l Transformers 8-1
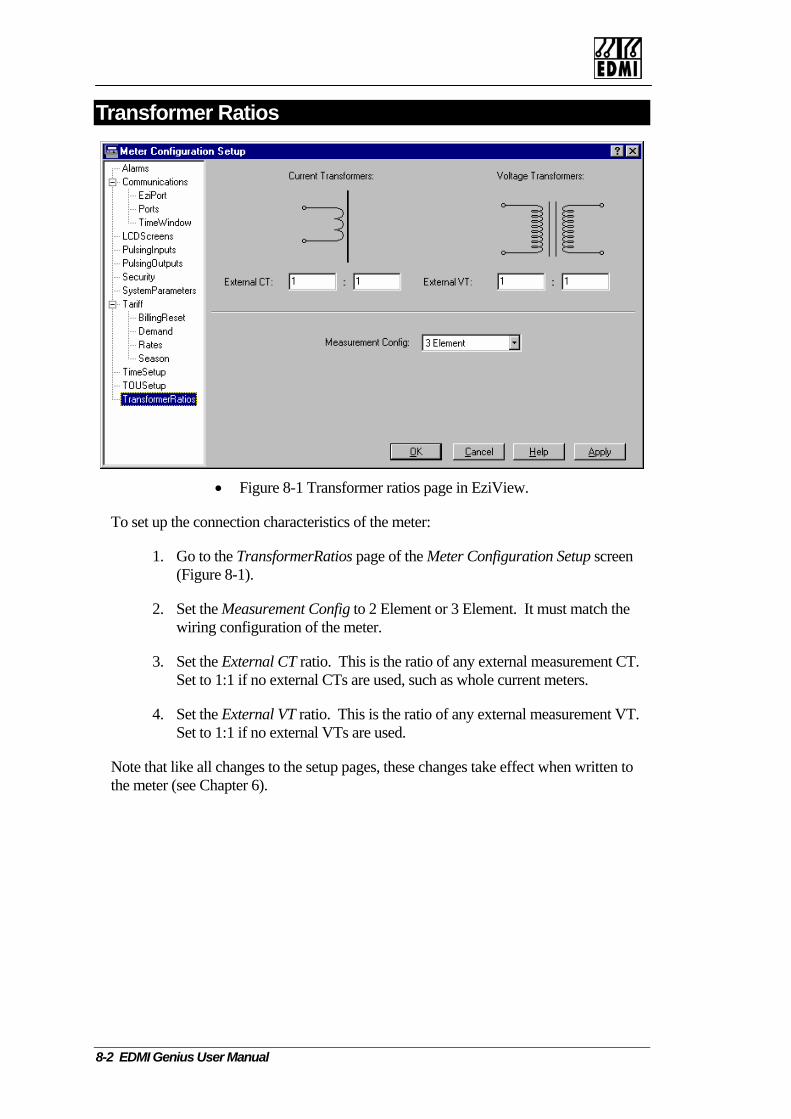
Transformer Ratios
• Figure 8-1 Transformer ratios page in EziView.
en
CT.
any external measurement VT.
to
To set up the connection characteristics of the meter:
1. Go to the TransformerRatios page of the Meter Configuration Setup scre(Figure 8-1).
2. Set the Measurement Config to 2 Element or 3 Element. It must match the wiring configuration of the meter.
3. Set the External CT ratio. This is the ratio of any external measurement Set to 1:1 if no external CTs are used, such as whole current meters.
4. Set the External VT ratio. This is the ratio of Set to 1:1 if no external VTs are used.
Note that like all changes to the setup pages, these changes take effect when writtenthe meter (see Chapter 6).
8-2 EDMI Genius User Manual

Chapter 9 LCThe LCD of the meter is for displaying information from the meter’s reLCD is a two line by 16 character display which can display any letter,variety of symbols. See the section “LCD/Select Button” on page 2-13on how to use the display.
The meter allows for up to 64 pages of display. Each page can displayregister’s contents. How the register is displayed is controlled by a forpage.
C h a p t e r
9
D Display gisters. The number and a for informationa single mat for each
LCD Display 9-1

LThere is a wide range of formatting options available that affect how a register’s contents are displayed. Most options only affect floating point numbers, which have data types of ‘F’ or ‘D’. All displays are left justified unless otherwise indicated.
Base Data Type
Name Display Format
CD Formatting
A String Displayed as is. If longer than 59 characters it is not displayed at all – “Unreadable 5” is shown instead.
B Boolean If true, the word “TRUE”. If false, the word “FALSE”.
C Byte Displayed as a number from 0 to 255.
D Double See the Floating Point Numbers section below.
F Float See the Floating Point Numbers section below.
H Hex Short Displayed as 4 hexadecimal digits. Leading zeros are shown.
I Short Displayed as a number from 0 to 65535. Units may be enabled for display following the number, with a space separating.
J Variable Special
Cannot be displayed. “Undefined” is shown instead.
L Long Displayed as a number from 0 to 4294967295.
Q Time Displayed in the form “HH:MM:SS”
R Date Displayed in the form “DD/MM/YY”
S Special Cannot be displayed. “Undefined” is shown instead.
T Time/Date Displayed in the form “DD/MM/YYHH:MM:SS”
V Long long Displayed as 16 exadecimal digits. Leading zeros are shown. h
W Waveform Cannot be displa d. “Undefined” is shown instead. ye
X shown. Hex Long Displayed as 8 hexadecimal digits. Leading zeros are
• Table 9-1 LCD data type formatting.
Floating Point Numbers
The formatting capabilities for floating point numbers are far more extensive than foother types of data. In the following examples (Table 9-2) the number
r
345.67890234567 is being displayed. For clarity, hashes (#) are used to illustrate
Places 0 Fill Displayed as…
12spaces.
Digits15 3 No 12345.678
1 3 No #####12345.678 0
4 3 No 2345.678
0 3 No .678
1 3 Yes 5 12345.678
10 3 Yes 0000012345.678
4 3 Yes 2345.678
0 3 Yes .678
15 0 No 12345
15 8 No 12345.67890234
• Table 9-2 LCD floating-point formatting examples.
9-2 EDMI Genius User Manual

LCD Formatting
Th rameter (for values 0 to 14) sets the length of the number, including a mi the d al point). If the set by spaces from the left. If the eter is set then the number is padded with zeros instead of spaces. This option should not be used with n ill option is useful for duplicating the look of
A Digits setting of 15 causes all before the decimal place to be displayed.
Th ts the nu t. The num ded to this precisi the decimal point is not shown. Floating-poi of decimal places, but nificant.
Th ant digits mber is not infinite – it is limited
e Digits panus sign if present, up to number is shorter than 0 Fill param
ecimal point (but not including the decim the parameter it is padded with
umbers that may be negative. The zero f mechanical counters.
digits of the number
e Places parameter seber is roun
mber of digits to be shown after the decimal poinon. It may be set from 0 to 15. If set to 0nt numbers have an infinite number
not all digits are sig
e number of signific in a floating-point nuby yregisters have 15 significant eaning. Also, take account of the basi adisplayed.
the floating-point format. T pe ‘F’ registers have 7 significant digits, while type ‘D’ digits. All digits beyond thc
ese limits have no mccuracy and resolution of the quantity that is being
Units
The formatting also allows units to be specified. This is controlled by the Multiplier and Units settings. Turning Units on enables the display of a unit after the number. The
e
M lists the
ltipliers.
met r knows the units of all registers.
The ultiplier parameter allows the number to be scaled. It only has an effect on floating-point formats. A prefix is also added to the unit if displayed. Table 9-3available mu
Multiplier Meaning Displayed value G Giga Reading divided by 1 000 000 000
M Mega Reading divided by 1 000 000
K Kilo Reading divided by 1 000
-None- Reading as normal
M Milli Reading multiplied by 1 000
U Micro Reading multiplied by 1 000 000
• Table 9-3 LCD unit multipliers.
LCD Display 9-3


LCD Setup
• Figure 9-2 EziView Register Selection Dialog with “Phase A Instantaneous Voltage”
selected.
selected the options within that entry
ries of registers to the list of screens click on the Add button. To add a
4. To display leading zeros check the 0 Fill box. This only has an effect for floating point registers. Digits must be less than 15 as well.
5. To limit the number of digits to the left of the decimal point set a number other than 15 in the Digits field. Set the Digits field to 15 to allow any number of digits. This only has an effect for floating point registers.
6. Set the Place field to the number of digits required after the decimal point. This only has an effect for floating point registers.
7. Set the Multiplier field to the desired unit multiplier. See Table 9-3 for a list of the available options.
8. Check the Units field to display a unit after the value. If a multiplier has been selected it is prefixed to the unit. The meter knows the units of all registers, although not all regi
ult description is entered when a register is selected from the Register Selection dialog. Descriptions may be up to 16 characters long. If the description is blank,
2. Select the register to display. As each entry isare displayed in the next column to the right. When the register is completely defined the Add and OK buttons will activate.
3. To add a sesingle register and return to the table click on the OK button.
sters have units.
9. Select the display set the register belongs to from the list in the Set field. Note that set D cannot be reached from the Select button.
10. Enter a description of the register to be displayed on the top line of the LCD. A defa
LCD Display 9-5

the description “Reg: XXXXXXXX” is used, where the Xs represent the register number in hexadecimal.
If the same register is displayed several times, the description from its first occurrence in the list is used for all entries.
2. Delete the register number using delete or backspace so the field is blank.
3. Press <Enter> or click in another field.
To move an LC s
creen will be inserted when the mouse button is released.
To delete an LCD screen:
1. Select the register number to remove.
D creen:
1. Click on the numbered tab to the left of the screen to move.
2. Drag the screen to the new location. A highlighted line will show where the s
Other display parameters
Set the Cycling Rate to a non zero number of seconds to enable display cycling. The display will automatically step to the next screen after the Cycling Rate period has passed. The range is 1 to 255 seconds. A setting of zero disables display cycling.
Set the Hold TimeSelect button is
to the time in seconds to pause automatic display cycling when the pushed. The range is 0 to 255 seconds.
r of minutes the display will revert to the default screen of display set A. The range is 1 to
inutes. A setting of zero disables display revert.
econds (1 to 254) that the backlight should remain on after the Select button is pressed. A setting of 0 disables the backlight. A setting of 255 keeps the backlight on permanently.
Change the Contrast setting to adjust the contrast of the LCD. Adjustments of this setting are not normally required, as this is set at the factory. Adjusting the contrast may help visibility in some lighting environments.
Set the User Level to the user level that the meter will use to access the registers to display on the LCD. A level of none prevents all access.
If a register is displayed as “Access Denied”, this is caused by the security level’s access
Set the Display Revert field to a non zero number to ensure the display returns to a known state after use. If the Select button has not been pressed for the set numbe
255 m
The backlight of the display is usually configured to light only when the meter is being read. Set the Backlight On Time to the time in s
being insufficient to read the register. See Chapter 16 for more information.
9-6 EDMI Genius User Manual
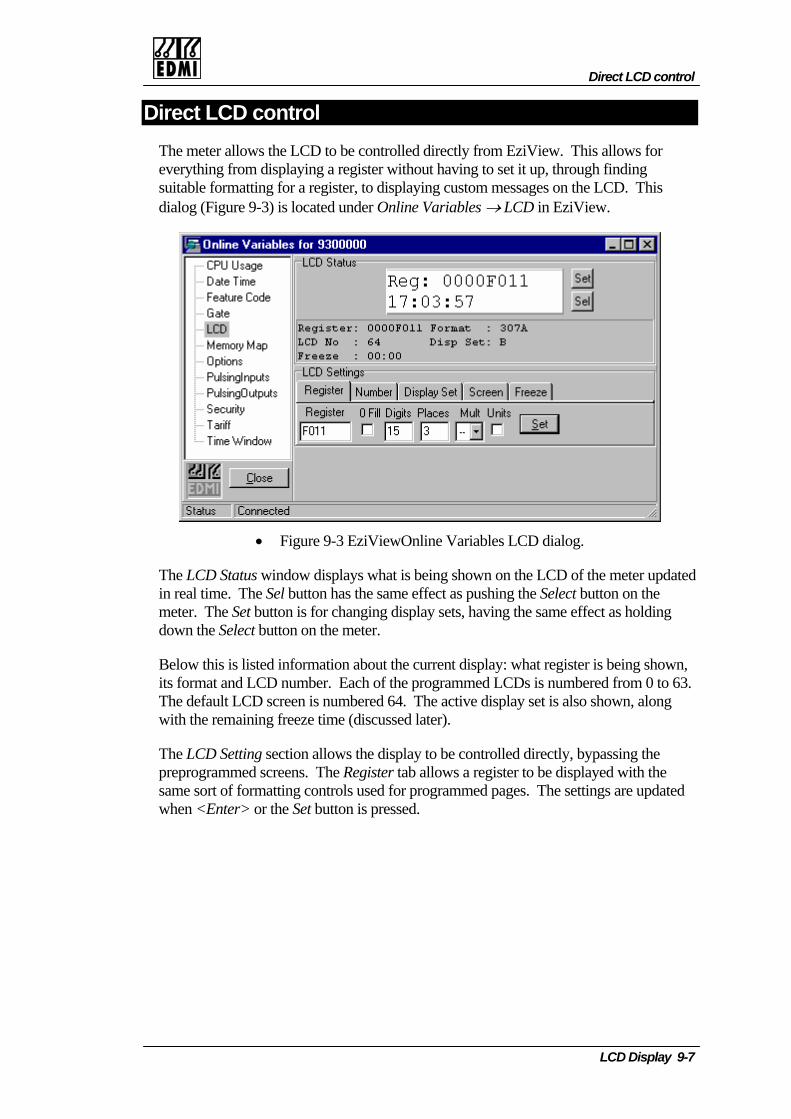
Direct LCD control
Direct LCD control s for
is
The meter allows the LCD to be controlled directly from EziView. This alloweverything from displaying a register without having to set it up, through finding suitable formatting for a register, to displaying custom messages on the LCD. Thdialog (Figure 9-3) is located under Online Variables → LCD in EziView.
• F
Th Status wind the meter updated in r e. The Sel meter. The Set button down the Select butto
Below this is listed in shown, its format and LCD n 63. The default LCD scre ng with the remaining fre ater).
LCD Setting section allows the display to be controlled directly, bypassing the rogrammed screens. The Register tab allows a register to be displayed with the
igure 9-3 EziViewOnline Variables LCD dialog.
e LCD ow displays what is being shown on the LCD of eal tim button has the same effect as pushing the Select button on the
is for changing display sets, having the same effect as holdingn on the meter.
formation about the current display: what register is beingumber. Each of the programmed LCDs is numbered from 0 toen is numbered 64. The active display set is also shown, aloeze time (discussed l
The prepsame sort of formatting controls used for programmed pages. The settings are updated when <Enter> or the Set button is pressed.
LCD Display 9-7
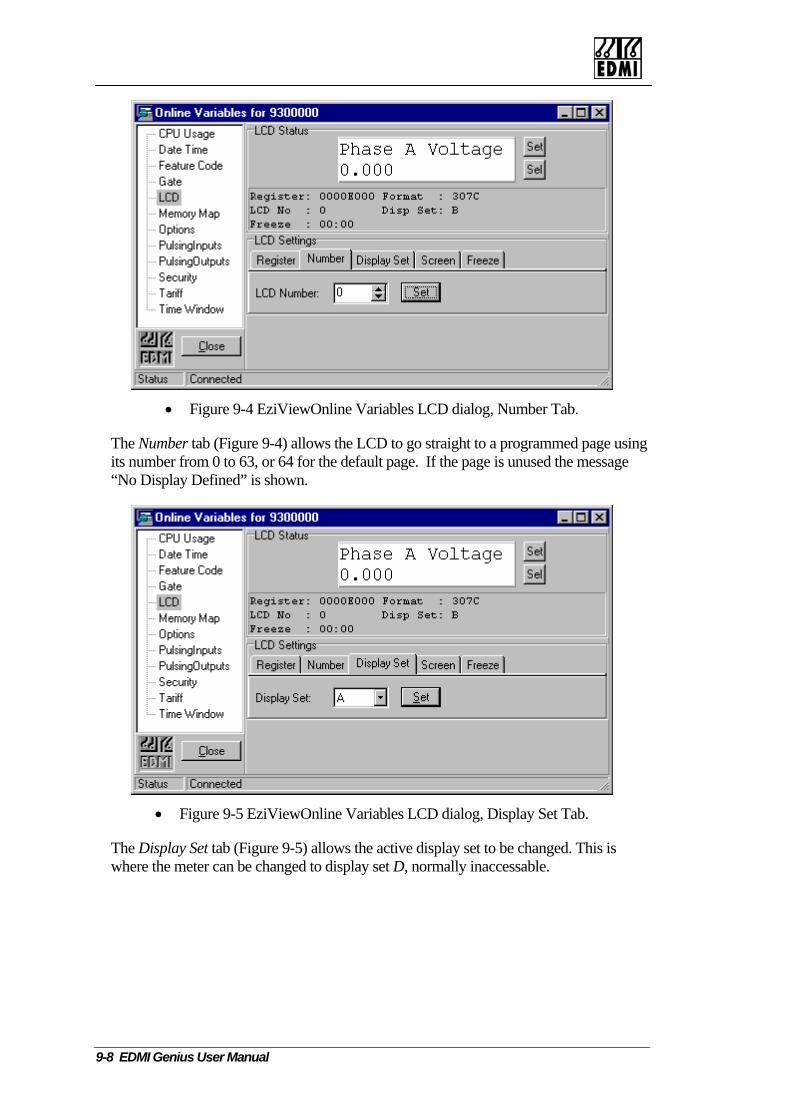
• Figure 9-4 EziViewOnline Variables LCD dialog, Number Tab.
Th r tab (Figu s the LCD to go straight to a programmed page using its ber from 0 to 63, or 64 for the default page. If the page is unused the message “N efined
e Numbe re 9-4) allownumo Display D ” is shown.
• Figure 9-5 EziViewOnline Variables LCD dialog, Display Set Tab.
Th y Set tab (F llows the active display set to be changed. This is where th isplay set D, normally inaccessable.
e Displae meter can b
igure 9-5) ae changed to d
9-8 EDMI Genius User Manual

Direct LCD control
• Figure 9-6 EziViewOnline Variables LCD dialog, Screen Tab.
The Screen tab is used to override what is shown on the LCD with a custom messagThe text to be displayed is entered into the edit field, then th
e. e Set button is pressed to
send the change. The text will be displaye e Freeze time, set on the final tab. d for th
• Figure 9-7 EziViewOnline Variables LCD dialog, Freeze Tab.
The Freeze tab allows the LCD freeze time to be set. When the freeze time is set (in seconds, 0 to 255) the Freeze counter will count back down to zero. During this time updates to the display are frozen, stopping the display from changing. The freeze time is set when the Set button is pressed, or the Set button on the Screen tab is pressed. When the freeze counter reaches zero, normal updates of the LCD will resume.
LCD Display 9-9
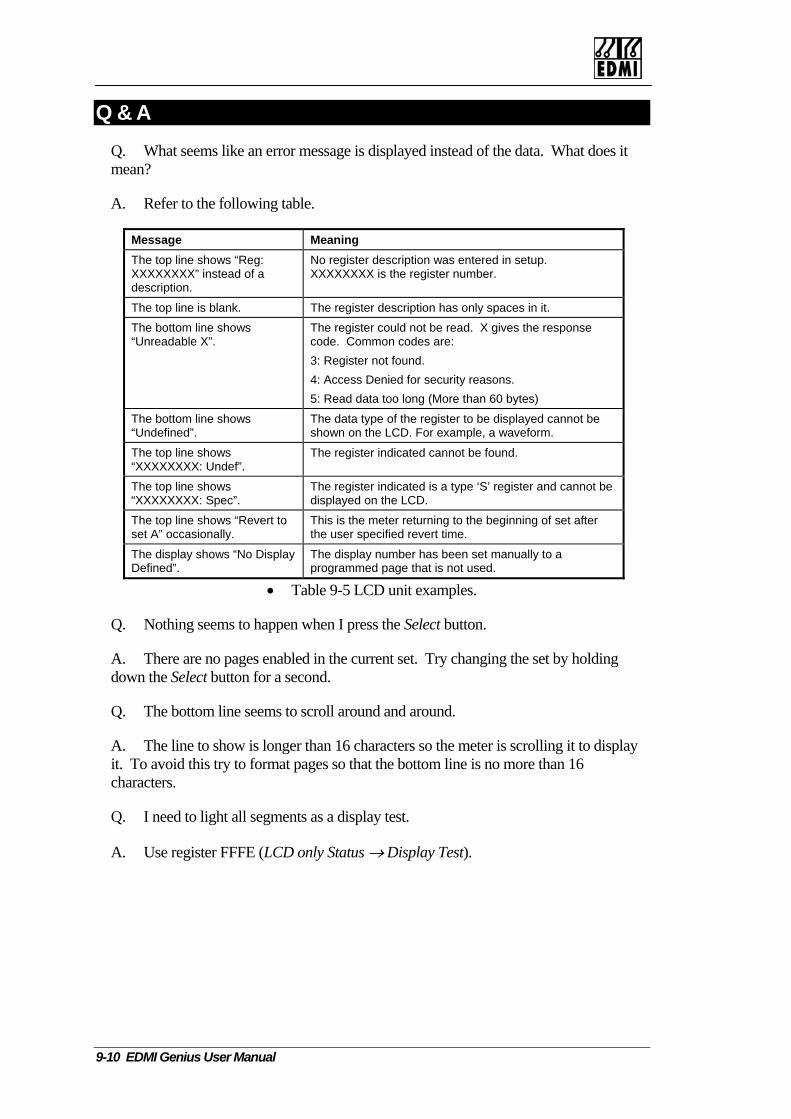
Q & A Q. What seems like an error message is displayed instead of the data. What does imean?
t
A. Refer to the following table.
Message Meaning The top line shows “Reg: XXXXXXXX” instead of a description.
No register description was entered in setup. XXXXXXXX is the register number.
The top line is blank. The register description has only spaces in it.
The bottom line shows “Unreadable X”.
The register could not be read. X gives the response code. Common codes are: 3: Register not found. 4: Access Denied for security reasons. 5: Read data too long (More than 60 bytes)
The bottom line shows “Undefined”.
The data type of the register to be displayed cannot be shown on the LCD. For example, a waveform.
The top line shows “XXXXXXXX: Undef”.
The register indicated cannot be found.
The top line shows “XXXXXXXX
The register indicated is a type ‘S’ register and cannot be : Spec”. displayed on the LCD.
The top line shows “Revert to This is the meter returning to the beginning of set after set A” occasionally. the user specified revert time.
The display shows “No Display Defined”.
The display number has been set manually to a programmed page that is not used.
• Table 9-5 LCD unit examples.
Q. Nothing seems to happen when I press the Select button.
A. There are no pages enabled in the current set. Try changing the set by holding down the Select button for a second.
Q. The bottom line seems to scroll around and around.
A. The line to show is longer than 16 characters so the meter is scrolling it to display it. To avoid this try to format pages so that the bottom line is no more than 16 characters.
Q. I need to light all segments as a display test.
A. Use register FFFE (LCD only Status → Display Test).
9-10 EDMI Genius User Manual

Chapter 10 PulsinThe pulsing outputs of the meter provide more functionality than simppower usage. Among other things they also allow for a synchronising generated or for various fixed output uses where the state of the outputthan its pulse rate.
Output Hardware f various types.
1 and Pulse 2.
Up to 7 ouputs are available
The meter has up to 9 outputs o
There are two red LEDs on the meter face located just below the LCD.generally be used to generate pulses for meter accuracy testing. They a
on the terminals under the terminal cover
• Figure 10-1 Terminal block diagram.
TB3 to TB9 may be outputs, depending on the exact meter type. Thesoutputs 1 to 7. TB3 is shared with input 2, so depending on the meter’the terminal may be an input or an output. Refer to the terminal cover odetails.
Pu
C h a p t e r
10
g Outputsly an indication oftime pulse to be is used rather
se
igure 10-1).
These would re labelled Pul
(F
e correspond to s configuration r order code for
lsing Outputs 10-1
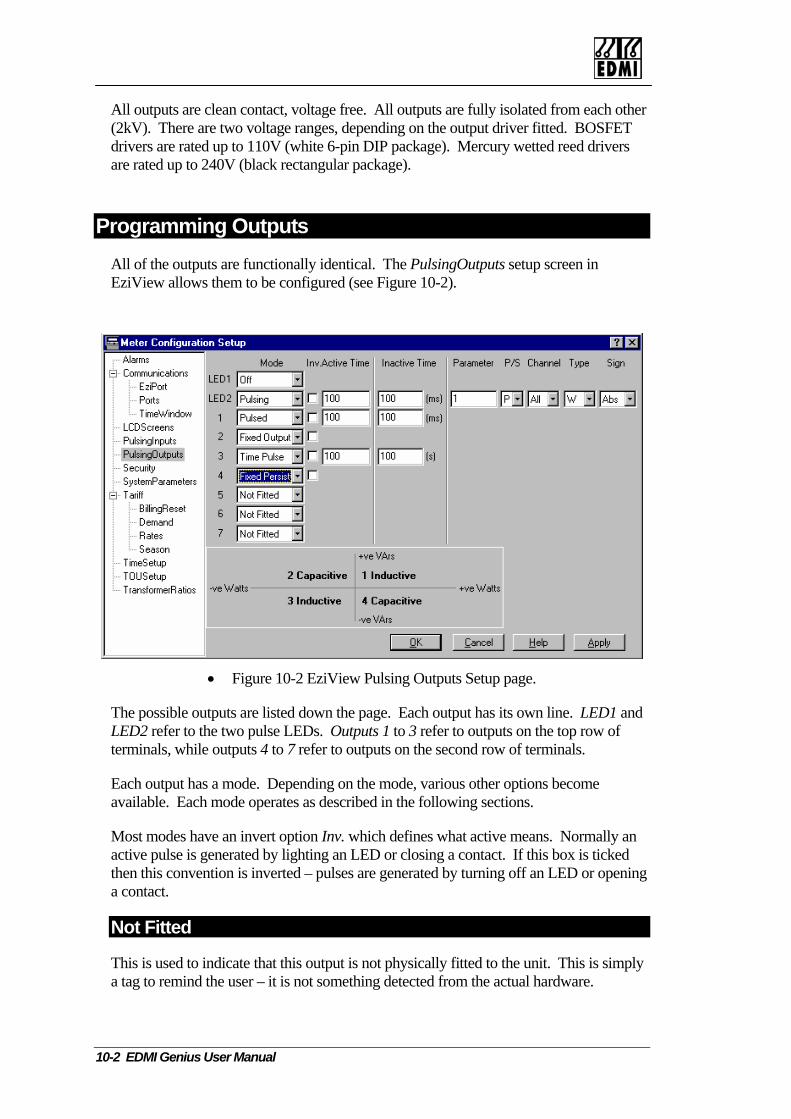
All outputs are clean(2kV). There are tw
contact, voltage free. All outputs are fully isolated from each other o voltage ranges, depending on the output driver fitted. BOSFET
drivers are rated up to 110V (white 6-pin DIP package). Mercury wetted reed drivers are rated up to 240V (black rectangular package).
Programming Outputs All of the outputs are functionally identical. The PulsingOutputs setup screen in EziView allows them to be configured (see Figure 10-2).
• Figu ts Setup page.
The possible outputs are d LED2 refer to the two puterminals, while outputs
Each output has a mode.available. Each mode op n the following sections.
Most modes have an invert option which defines what active means. Normally an
g
re 10-2 EziView Pulsing Outpu
listed down the page. Each output has its own line. LED1 anlse LEDs. Outputs 1 to 3 refer to outputs on the top row of 4 to 7 refer to outputs on the second row of terminals.
Depending on the mode, various other options become erates as described i
Inv.active pulse is generated by lighting an LED or closing a contact. If this box is tickedthen this convention is inverted – pulses are generated by turning off an LED or openina contact.
Not Fitted
This is used to indicate that this output is not physically fitted to the unit. This is simply a tag to remind the user – it is not something detected from the actual hardware.
10-2 EDMI Genius User Manual
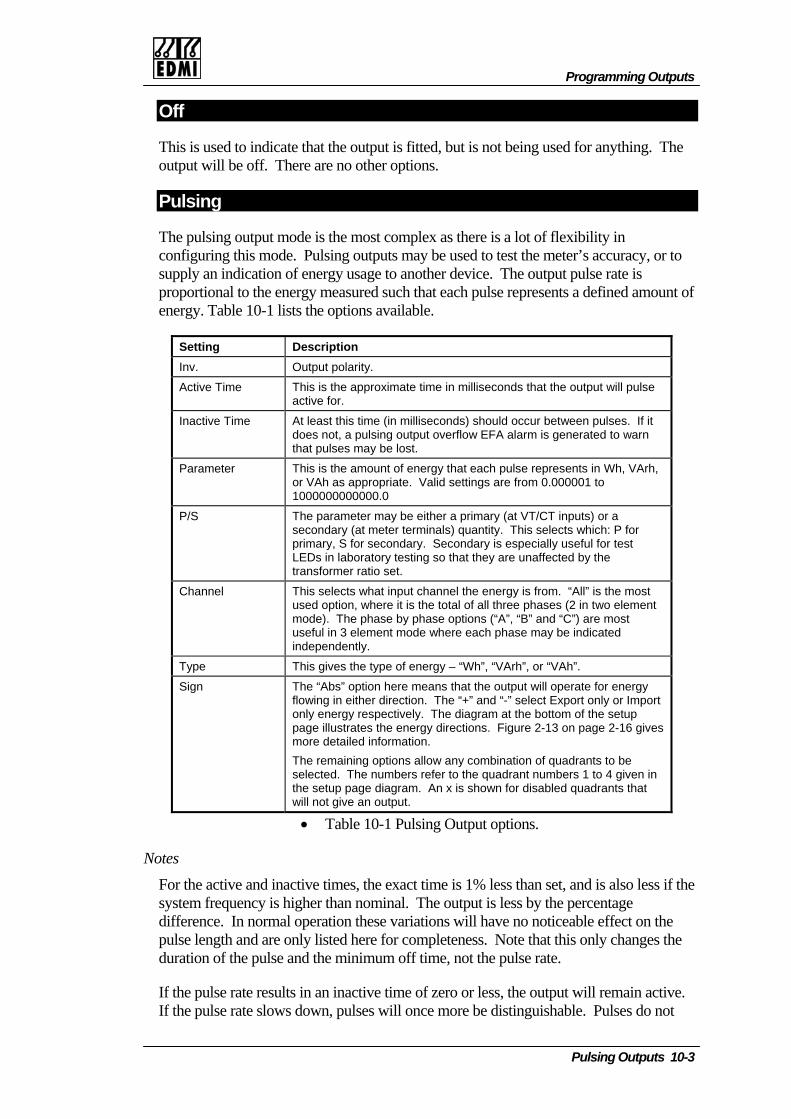
Programming Outputs
Off
This is used to indicate that the output is fitted, but is not being used for anything. The output will be off. There are no other options.
Pulsing
The pulsing output mode a lot of flexibility in configuring this mode. P supply an indication of eproport energ mount of energy lists t
is the most complex as there isulsing outputs may be used to test the meter’s accuracy, or tonergy usage to another device. The output pulse rate is y measured such that each pulse represents a definional to the
. Table 10-1ed a
he options available.
Setting Description Inv. Output polarity.
Active Time This is the approximate time in milliseconds that the output will pulse active for.
Inactive Time At least this time (in milliseconds) should occur between pulses. If it rn does not, a pulsing output overflow EFA alarm is generated to wa
that pulses may be lost.
Parameter This is the amount of energy that each pulse represents in Wh, VArh, or VAh as appropriate. Valid settings are from 0.000001 to 1000000000000.0
P/S The parameter may be either a primary (at VT/CT inputs) or a secondary (at meter terminals) quantity. This selects which: P for primary, S for secondary. Secondary is especially useful for test LEDs in laboratory testing so that they are unaffected by the transformer ratio set.
Channel This selects what input channel thused option, where it is the total o
e energy is from. “All” is the most f all three phases (2 in two element
mode). The phase by phase options (“A”, “B” and “C”) are most useful in 3 element mode where each phase may be indicated independently.
Type This gives the type of energy – “Wh”, “VArh”, or “VAh”.
Sign The “Abs” option here means that the output will operate for energy flowing in either direction. The “+” and “-” select Export only or Import only energy respectively. The diagram at the bottom of the setup page illustrates the energy directions. Figure 2-13 on page 2-16 gives more detailed information. The remaining options allow any combination of quadrants to be selected. The numbers refer to the quadrant numbers 1 to 4 given in the setup page diagram. An x is shown for disabled quadrants that will not give an output.
• Table 10-1 Pulsing Output options.
Notes
For the active and inactive times, the exact time is 1% less than set, and is also less if the system frequency is higher than nominal. The output is less by the percentage difference. In normal operation these variations will have no noticeable effect on the pulse length and are only listed here for completeness. Note that this only changes the duration of the pulse and the minimum off time, not the pulse rate.
If the pulse rate results in an inactive time of zero or less, the output will remain active. If the pulse rate slows down, pulses will once more be distinguishable. Pulses do not
Pulsing Outputs 10-3

‘back up’ if the rate becomes too fast – they siis important to select an appropriate paramete
mply merge into each other. Therefore it r to prevent pulses from being lost under
Ex
h accuracy. A pulse rate of 0.01 Wh per pulse is needed at the meter terminals. The sense head needs a 90ms light pulse with at least a 50ms gap between pulses to sense properly.
The required setup is no inversion, 90ms active time, 50ms inactive time, a parameter of 0.01, Secondary, All channels, W, Export (+).
high load conditions.
ample
An LED output is needed for testing the delivered W
Pulsed
The pulsed output mode is mostly designed for use with EziScript for pulse transmission. In this mode a number of pulses are written to a register (F96X series), which is added to a total of pulses to be sent. Pulses are sent with the indicated Active and Inactive times. Each time a pulse is sent the pulses to be transmitted is decremented by one, until there are no pulses left to send. If the meter is turned off then any pulses that were queued for transmission will be lost. Table 10-2 lists the options available. Normally instructions for this setup will be given with the EziScript documentation.
Setting Description Inv. Output polarity.
Active Time This is the time in milliseconds that the output will pulse active for. it will This has a resolution of 5ms – if the time is not divisible by 5ms,
be rounded down.
Inactive Time This ithe A
s the time between pulses. This has a resolution of 5ms, as for ctive Time.
• Table 10-2 Pulsed Output options.
Fixed Output and Fixed Output Persistent
Ezithe generate outputs such as demand exceeded or active tariff indication. This feature is controlled by a feature code.
The only difference between Fixed Output and Fixed Output Persistent is when power t Persistent
output will return to the state it was last set to before power off. A Fixed Output mode
The only option is the invert option, listed in Table 10-3.
Setting Description
This allows the state of an output to be controlled directly. This may be done from View or other such communications program, or via an EziScript extension within meter to
to the meter is lost. When power to the meter is restored, a Fixed Outpu
output will return to the inactive state under the same circumstances.
Inv. Output polarity.
• Table 10-3 Fixed Output/Persistent options.
10-4 EDMI Genius User Manual

Programming Outputs
Time Pulse
This output mode is designed to give a synchronising time pulse to other equipment or meters. The pulse is generated at a programmed interval to the second. Table 10-4 liststhe options.
Setting Description Inv. Output polarity.
Active Time This is the time in milliseconds that the output will pulse active for. Has a resolution of 5ms – if the time is not divisible by 5ms, it will be rounded down.
Inactive Time This is thpulse sta
e time between the start of each time pulse in seconds. The rts at the indicated time.
• Table 10-4 Time Pulse options.
geof 1996). Thus a setting of 61 seconds would give a time pulse every 61 seconds starting at midnight on the 1st of January 1996. Of course such a setting is not very
t indicates some common settings.
The offset of the time pulse from the hour or such can be calculated. A time pulse is nerated every Inactive Time seconds from the beginning of the meter’s time (the start
useful - the following lis
Interval Setting Every minute 60
Every 15 minutes 60 * 15 = 900
Every half hour 60 * 30 = 1800
Every hour 60 * 60 = 3600
• Table 10-5 Time Pulse options.
Ex
A 500ms time pulse contact closure is required every 15 minutes at 0, 15, 30, and 45
s.
ample
minutes past the hour.
The active time should be set to 500, and the inactive time to 15 * 60 = 900 second
Pulsing Outputs 10-5
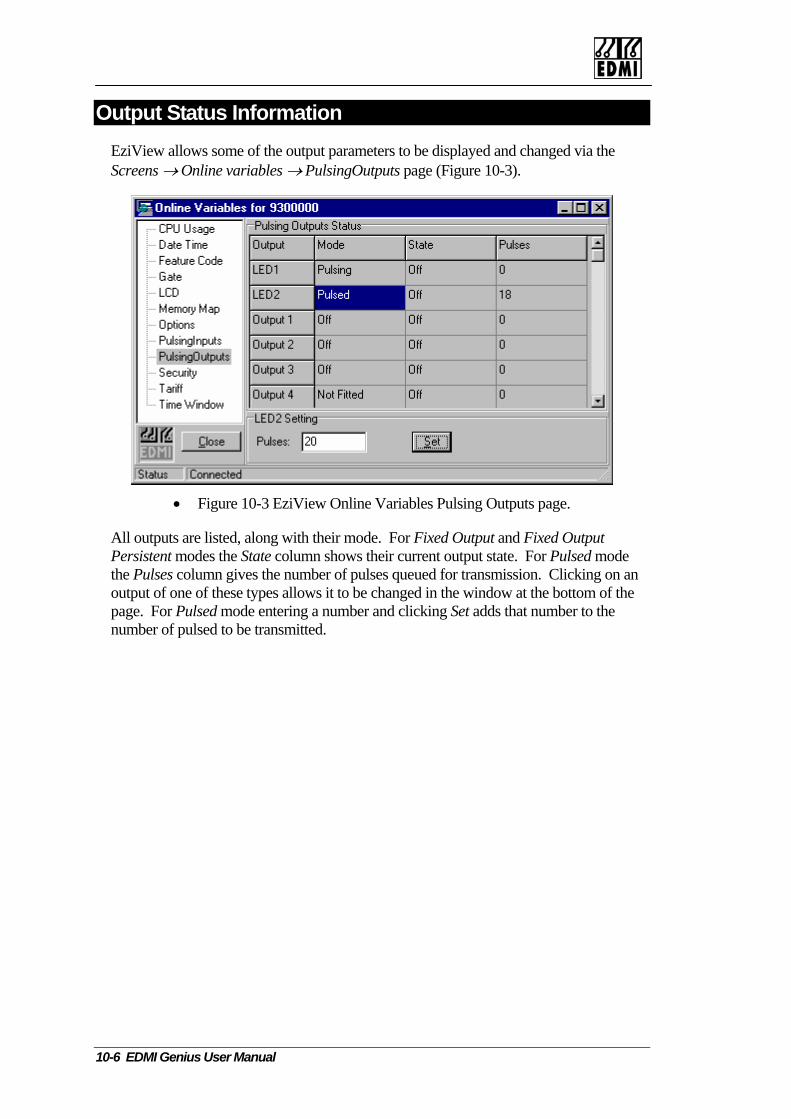
Output Status Information EziView allows some of the output parameters to be displayed and changed via the Screens → Online variables → PulsingOutputs page (Figure 10-3).
• Figure 10-3 EziView Online Variables Pulsing Outputs page.
All outputs are listed, along with their mode. For Fixed Output and Fixed Output Persistent modes the State column shows their current output state. For Pulsed mode the Pulses column gives the number of pulses queued for transmission. Clicking on an output of one of these types allows it to be changed in the window at the bottom of the page. For Pulsed mode entering a number and clicking Set adds that number to the number of pulsed to be transmitted.
10-6 EDMI Genius User Manual
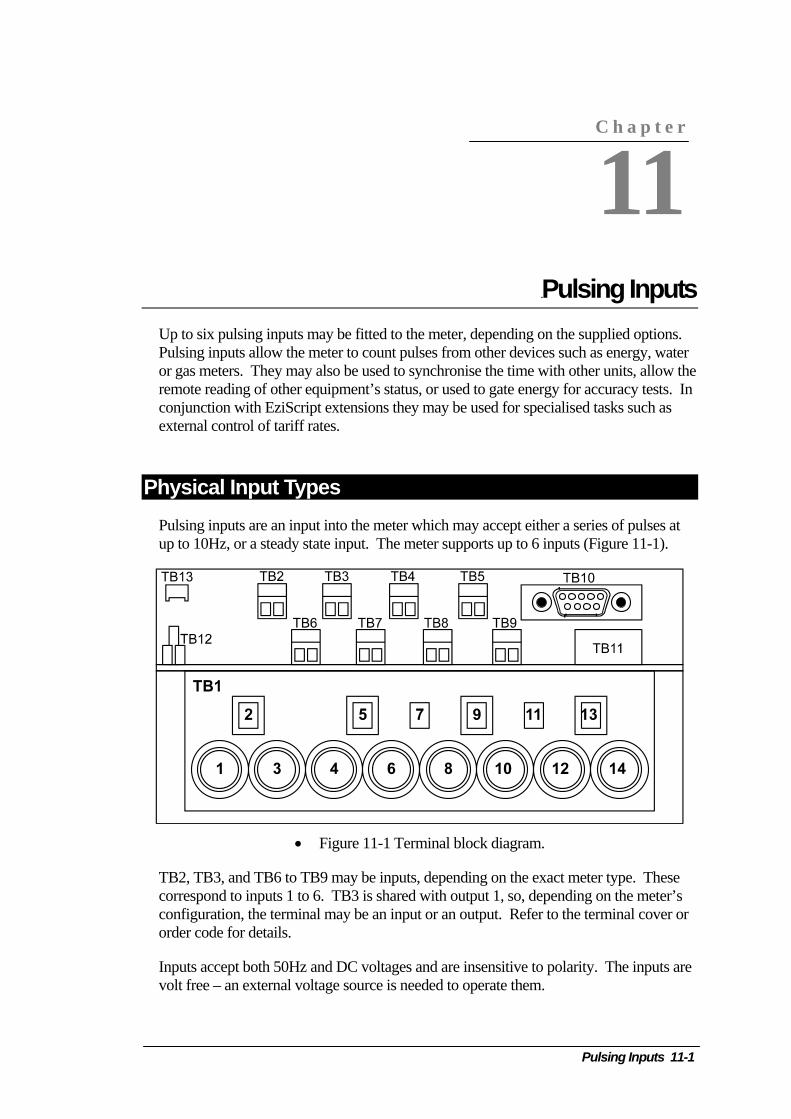
Chapter 11 PulsUp to six pulsing inputs may be fitted to the meter, depending on the suPulsing inputs allow the meter to count pulses from other devices suchor gas meters. They may also be used to synchronise the time with othremote reading of other equipment’s status, or used to gate energy for aconjunction with EziScript extensions they may be used for specialisedexternal control of tariff rates.
P
inputs (
hysical Input Types Pulsing inputs are an input into the meter which may accept either a seup to 10Hz, or a steady state input. The meter supports up to 6
• Figure 11-1 Terminal block diagram.
TB2, TB3, and TB6 to TB9 may be inputs, depending on the exact mecorrespond to inputs 1 to 6. TB3 is shared with output 1, so, dependingconfiguration, the terminal may be an input or an output. Refer to the torder code for details.
Inputs accept both 50Hz and DC voltages and are insensitive to polaritvolt free – an external voltage source is needed to operate them.
P
C h a p t e r
11
ing Inputs pplied optioas energy, water er units, allow t
ns.
he ccuracy tests. In tasks such as
Figure 11-1). ries of pulses at
ter type. These on the meter’s erminal cover or
y. The inputs are
ulsing Inputs 11-1
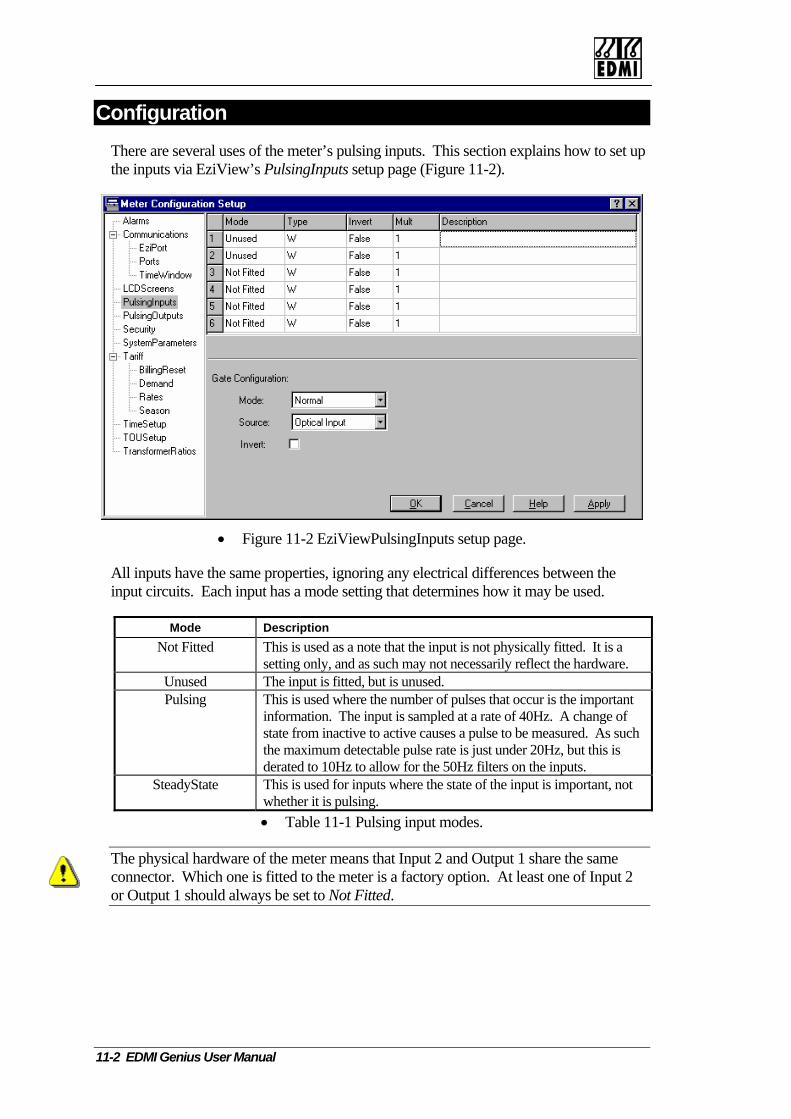
Ce several uses of the meter’s pulsing inputs. This section explains how to set up
onfiguration There arthe inputs via EziView’s PulsingInputs setup page (Figure 11-2).
• Figure 11-2 EziViewPulsingInputs setup page.
e properties, ignoring any electrical differences between the put has a mode setting that determines how it may be used.
All inputs have the saminput circuits. Each in
Mode Description Not Fitted This is used as a note that the input is not physically fitted. It is a
setting only, and as such may not necessarily reflect the hardware. Unused The input is fitted, but is unused. Pulsing This is used where the number of pulses that occur is the important
information. The input is sampled at a rate of 40Hz. A change of state from inactive to active causes a pulse to be measured. As such the maximum detectable pulse rate is just under 20Hz, but this is derated to 10Hz to allow for the 50Hz filters on the inputs.
SteadyState This is used for inputs where the state of the input is important, notwhether it is pulsing.
• Table 11-1 Pulsing input modes.
The physical hardware of the meter means that Input 2 and Output 1 share the same coonnector. Which one is fitted to the meter is a factory option. At least one of Input 2 r Output 1 should always be set to Not Fitted.
11-2 EDMI Genius User Manual
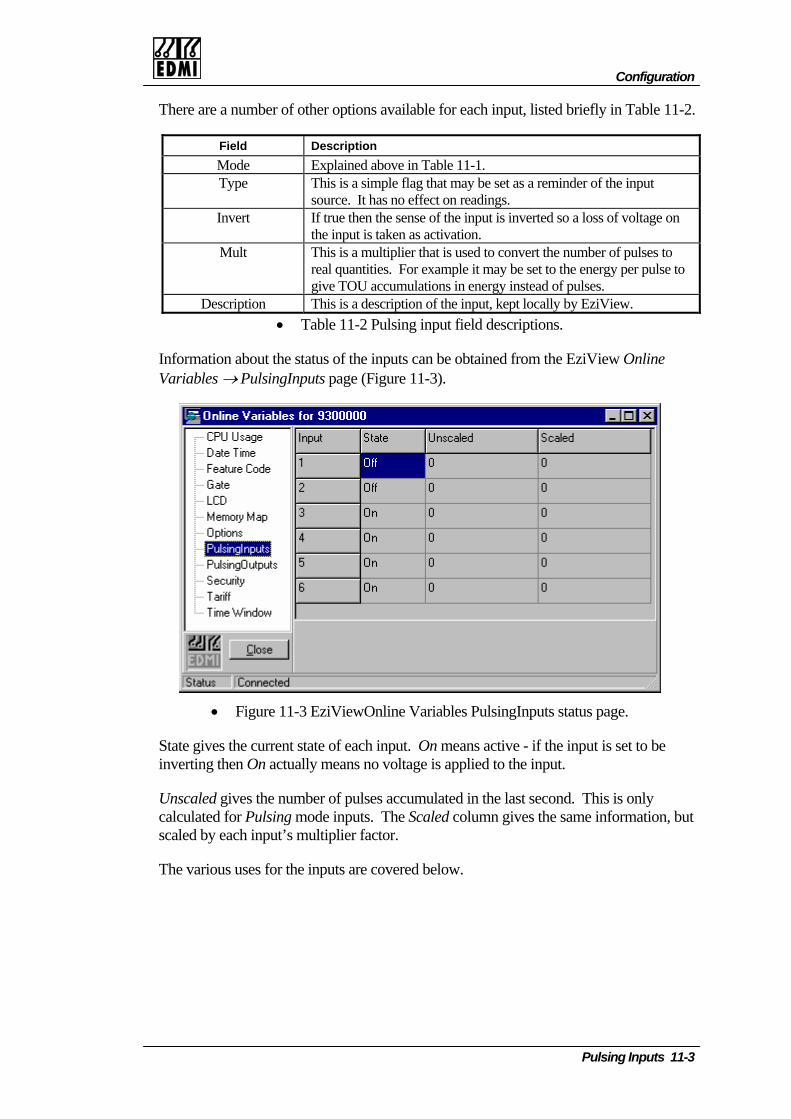
Configuration
There are a number of other options available for each input, listed briefly in Table 11-2.
Field Description Mode Explained above in Table 11-1. Type This is a simple flag that may be set as a reminder of the input
source. It has no effect on readings. Invert If true then the sense of the input is inverted so a loss of voltage on
the input is taken as activation. Mult This is a multiplier that is used to convert the number of pulses to
real quantities. For example it may be set to the energy per pulse to give TOU accumulations in energy instead of pulses.
Description This is a description of the input, kept locally by EziView. • Table 11-2 Pulsing input field descriptions.
Information about the status of the inputs can be obtained from the EziView Online -3). Variables → PulsingInputs page (Figure 11
• Figure 11-3 EziViewOnline Variables PulsingInputs status page.
ives the current state of each input. On means active - if the input is set to be nput.
t tiplier factor.
the inputs are covered below.
State ginverting then On actually means no voltage is applied to the i
Unscaled gives the number of pulses accumulated in the last second. This is only calculated for Pulsing mode inputs. The Scaled column gives the same information, buscaled by each input’s mul
The various uses for
Pulsing Inputs 11-3
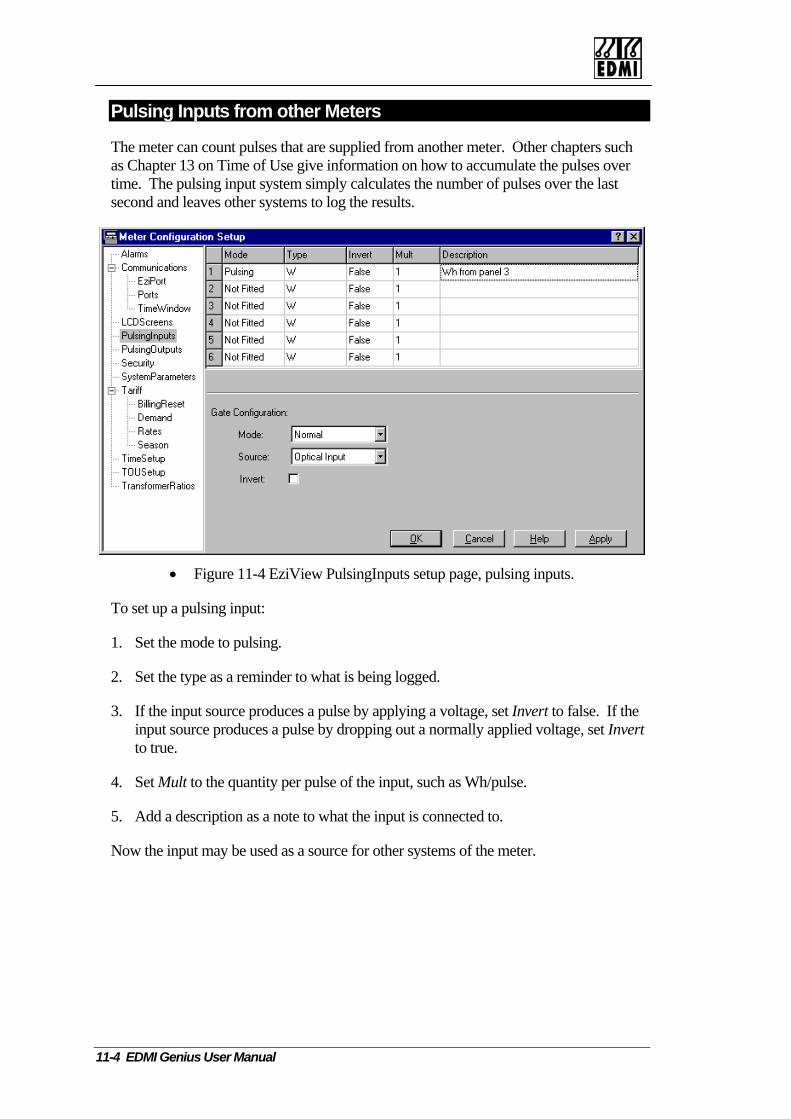
Pulsing Inputs from other Meters
ers such as Chapter 13 on Time of Use give information on how to accumulate the pulses over time. The pulsing input system simply calculates the number of pulses over the last second and leaves other systems to log the results.
The meter can count pulses that are supplied from another meter. Other chapt
• Figure 11-4 EziView PulsingInputs setup page, pulsing inputs.
To set up a pulsing input:
1. Set the mode to pulsing.
e vert
2. Set the type as a reminder to what is being logged.
3. If the input source produces a pulse by applying a voltage, set Invert to false. If thinput source produces a pulse by dropping out a normally applied voltage, set Into true.
4. Set Mult to the quantity per pulse of the input, such as Wh/pulse.
5. Add a description as a note to what the input is connected to.
Now the input may be used as a source for other systems of the meter.
11-4 EDMI Genius User Manual
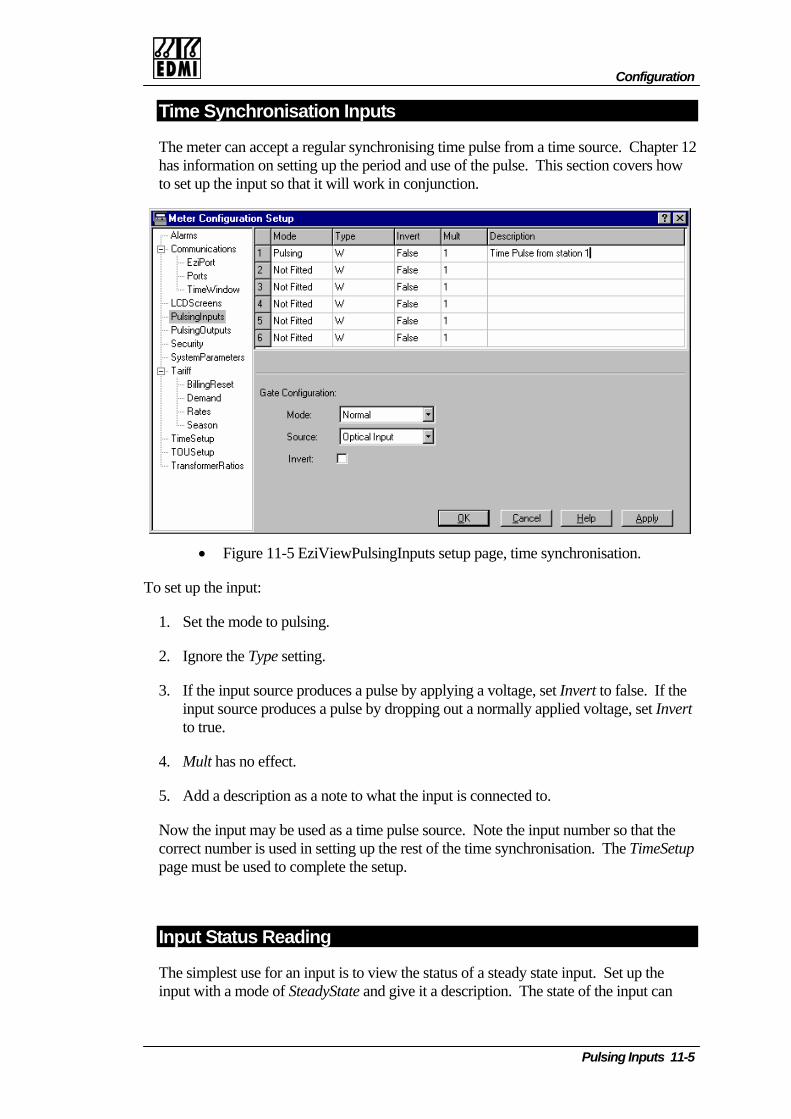
Configuration
Time Synchronisation Inputs
The meter can accept a regular synchronising time pulse from a time source. Chaphas information on setting up the period and use of the pulse. This section covers h
ter 12 ow
to set up the input so that it will work in conjunction.
• Figure 11-5 EziViewPul e synchronisation.
To
e ing out a normally applied voltage, set Invert
meSetup page must be used to complete the setup.
singInputs setup page, tim
set up the input:
1. Set the mode to pulsing.
2. Ignore the Type setting.
3. If the input source produces a pulse by applying a voltage, set Invert to false. If thinput source produces a pulse by droppto true.
4. Mult has no effect.
5. Add a description as a note to what the input is connected to.
Now the input may be used as a time pulse source. Note the input number so that the correct number is used in setting up the rest of the time synchronisation. The Ti
Input Status Reading
The simplest use for an input is to view the status of a steady state input. Set up the input with a mode of SteadyState and give it a description. The state of the input can
Pulsing Inputs 11-5

then be read from the Online Variables → PulsingInputs status page (Figure 11-3 above).
Inputs for Testing Gate Control
See Chapter 22 for information on te curacy using gated readings. sting the meter’s ac
Using Inputs with Ez cript tensions
Refer to the documentation on the Ez n how to he meter to work with the extensi
iS Ex
iScript extension o set up ton.
11-6 EDMI Genius User Manual
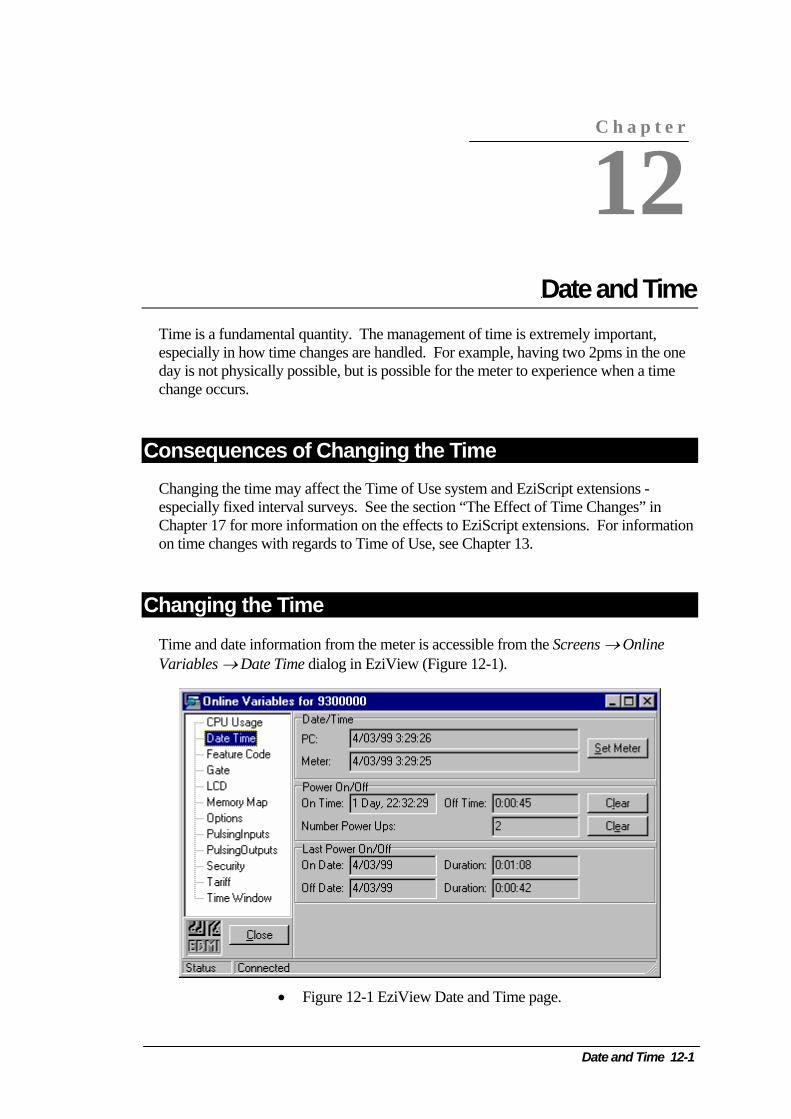
Chapter 12 DateTime is a fundamental quantity. The management of time is extremelyespecially in how time changes are handled. For example, having two day is not physically possible, but is possible for the meter to experiencchange occurs.
Consequences of Changing the Time Changing the time may affect the Time of Use system and EziScript exespecially fixed interval surveys. See the section “The Effect of Time Chapter 17 for more information on the effects to EziScript extensionson time changes with regards to Time of Use, see Chapter 13.
Changing the Time
Time and date information from the meter is accessible from the ScreeVariables → Date Time dialog in EziView (Figure 12-1).
• Figure 12-1 EziView Date and Time page.
D
C h a p t e r
12
and Time important, 2pms in the one e when a timetensions - Changes” in . For information
ns → Online
ate and Time 12-1
The top panel displays the time on your computer (PC) and the time read from the meter. To set the time on the meter to the same as the computer click the Set Meter button.
Changing the time may have an effect on stored data. Make sure you understand the possible consequences before changing the clock by large amounts.
The time displayed is daylight saving time. As such, the computer time should be set to daylight saving time – not standard time.
Note that EziView checks the time difference between the meter and the computer when transferring setup with the meter. If the time difference is too large, it will ask if it should synchronise the time. See Chapter 6 for more information.
Year 2000 Issues The meter is fully year 2000 compliant. It uses two-digit year, with a defined pivot date of 96. Years from 96 to 99 are treated as 1996 to 1999. Years from 00 to 95 are treated as 2000 to 2095. The year 2000 is treated as a leap year. The meter keeps time internally as the number of seconds since the start of 1996, using 32-bit numbers to ensure operation beyond 2050.
Timing Source The reference for timekeeping may come from one of two sources. The first is an internal crystal clock. This clock is also maintained during loss of power by the meter’s battery.
The second time source synchronises the time to the system frequency of the measured voltages and currents, any phase. Many generation authorities adjust the system frequency slightly over the course of the day to ensure that clocks based on the system frequency read correctly in the long term. There may be some short-term variations that will depend on the generation authority.
The meter may be set to operate only on the internal crystal clock (called Internal operation), or to operate in the system frequency (called Line operation). In Line mode the clock will revert to Internal operation if there is no signal to extract the system frequency from.
12-2 EDMI Genius User Manual
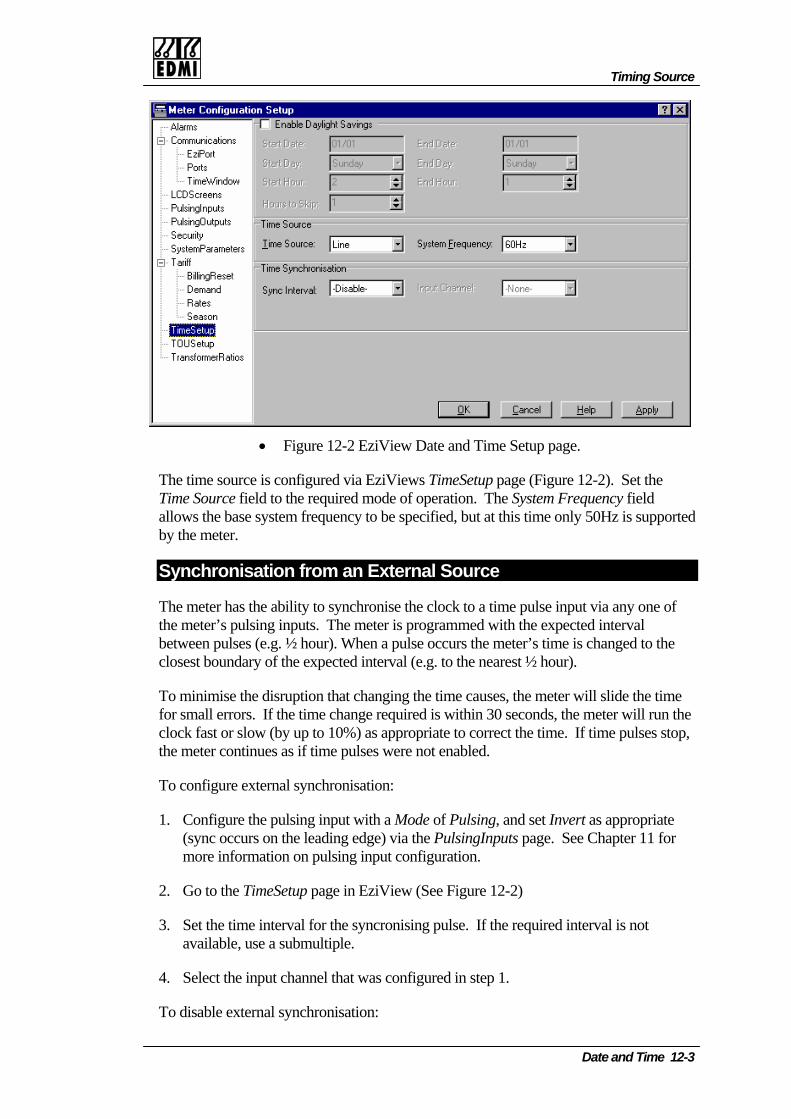
Timing Source
• Figure 12-2 EziView Date and Time Setup page.
The time source is configured via EziViews TimeSetup page (Figure 12-2). Set the mode of operation. The System Frequency field
allows the base system frequency to be specified, but at this time only 50Hz is supported Time Source field to the required
by the meter.
Sy
meter has the ability to synchronise the clock to a tim
nchronisation from an External Source
The e pulse input via any one of xpected interval
e is changed to the
To for uired is within 30 seconds, the meter will run the
oc
To
e (sync occurs on the leading edge) via the PulsingInputs page. See Chapter 11 for
2. Go to the TimeSetup page in EziView (See Figure 12-2)
3. e.
4. Select the input channel that was configured in step 1.
To disable external synchronisation:
the meter’s pulsing inputs. The meter is programmed with the ebetween pulses (e.g. ½ hour). When a pulse occurs the meter’s timclosest boundary of the expected interval (e.g. to the nearest ½ hour).
minimise the disruption that changing the time causes, the meter will slide the timesmall errors. If the time change req
cl k fast or slow (by up to 10%) as appropriate to correct the time. If time pulses stop, the meter continues as if time pulses were not enabled.
configure external synchronisation:
1. Configure the pulsing input with a Mode of Pulsing, and set Invert as appropriat
more information on pulsing input configuration.
Set the time interval for the syncronising pulse. If the required interval is not available, use a submultipl
Date and Time 12-3
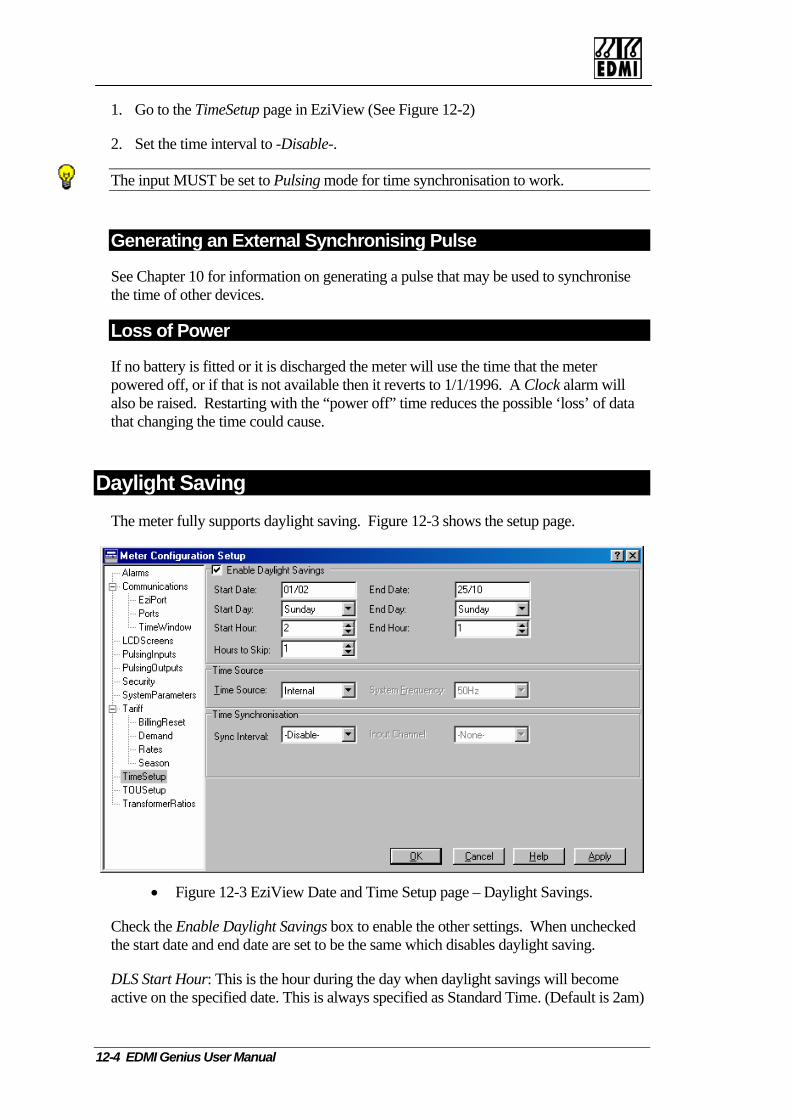
1. Go to the TimeSetup page in EziView (See Figure 12-2)
Set the time interval to -Disable-. 2.
The input MUST be set to Pulsing mode for time synchronisation to work.
Generating an External Synchronising Pulse
See Chapter 10 for information on generating a pulse that may be used to synchronise the time of other devices.
Loss of Power
If no battery is fitted or it is discharged the meter will use the time that the meter r if that is not available then it reverts to 1/1/1996. A Clock alarm will
ting with the “power off” time reduces the possible ‘loss’ of data powered off, oalso be raised. Restarthat changing the time could cause.
Daylight Saving The meter fully supports daylight saving. Figure 12-3 shows the setup page.
• Figure 12-3 EziView Date and Time Setup page – Daylight Savings.
ck the Enable Daylight Savings box to enable the otheChe r settings. When unchecked e start date and end date are set to be the same which disables daylight saving.
DLS Start Hour: This is the hour during the day when daylight savings will become active on the specified date. This is always specified as Standard Time. (Default is 2am)
th
12-4 EDMI Genius User Manual
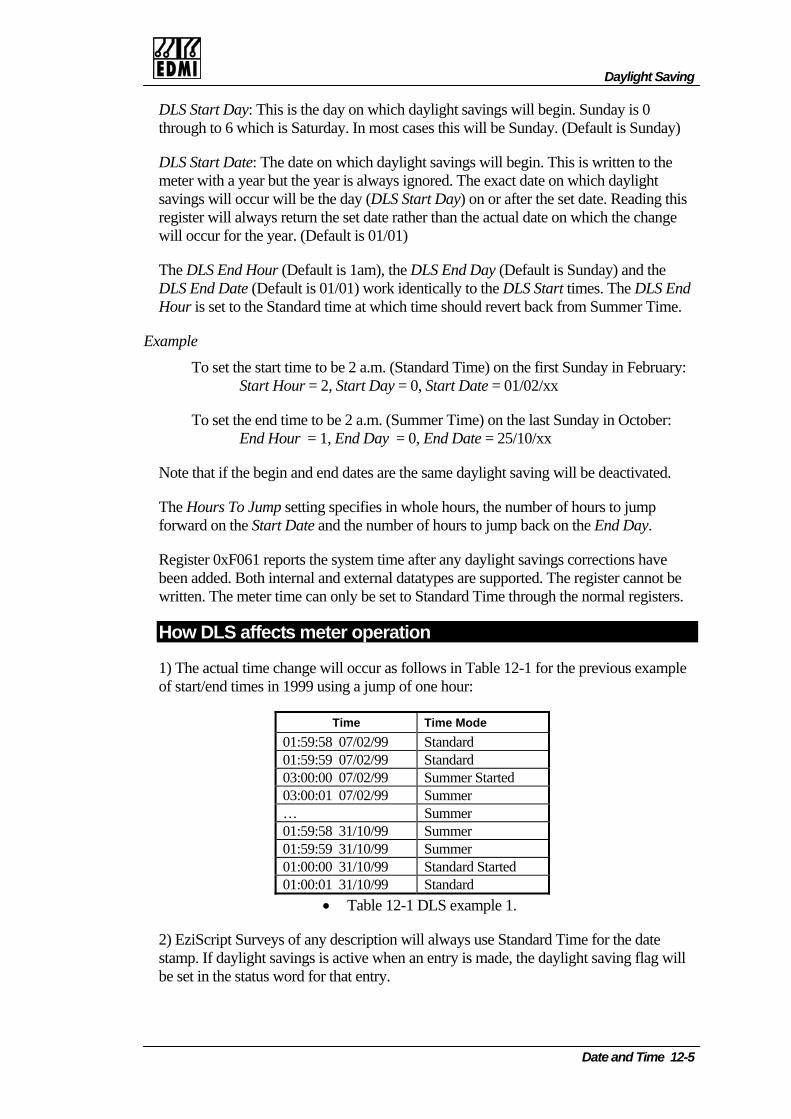
Daylight Saving
DLS Start Day: This through to 6 which is S
is the day on which daylight savings will begin. Sunday is 0 aturday. In most cases this will be Sunday. (Default is Sunday)
D S Star ate on which daylight savings will begi ritten to the m ter with a year but the year is always ignored. The exact date on which daylight sa be the tart D after s in thire ll the ther th al da n h ge w r fo fau t is 01/01)
T En lt 1am), the DLS End Day (Default is Sunday) and the DLS End Date (Default is 01/ 1) work identically to the DLS Start mes. The DLS End H et t the Standard tim at which time Summer T me.
Example
et the start time to be 2 a.m. (Standard Time) on the first Sunday in Febr y:Start Ho =
The Hours To Jump setting specifies in whole hours, the number of hours to jump forward on the Start Date and the number of hours to jump back on the End Day.
0xF061 reports the system time after any daylight savings corrections have been added. Both internal and external datatypes are supported. The register cannot be w tten. The m me can only be set to Standard Time thro h t rmal reg e
L t Date: The d n. This is we
day (DLS S set date ra
ay) on or an the actu
vings wiill occur will
always retuthe te o
et date. Read which the c
gan
s gister will occu
rnr the year. (De l
he DLS d Hour (Defau is0e
tiour is s o should revert back from i
To s
uar ur 2, Start Day = 0, Start Date = 01/02/xx
To set the end time to be 2 a.m. (Summer Time) on the last Sunday in October: End Hour = 1, End Day = 0, End Date = 25/10/xx
Note that if the begin and end dates are the same daylight saving will be deactivated.
Register
ri eter ti ug he no ist rs.
How DLS affects meter operation
1) The actua wil occur as follows in Table 12-1 for the previous examplof start/end t sing a jump of one hour:
Time Time Mode
l time change l e imes in 1999 u
01:59:58 7/02/99 Standard 001:59:59 7/02/99 Standard 003:00:00 7/02/99 Summer Started 003:00:01 7/02/99 Summer 0… Summer 01:5 59: 8 31/10/99 Summer 01:5 59: 9 31/10/99 Summer 01:00:00 31/10/99 Standard Started 01:00:01 31/10/99 Standard
• Table 12-1 DLS example 1.
2) EziScript Surveys of any description will always use Standard Time for the date stamp. If daylight savings is active when an entry is made, the daylight saving flag will be set in the status word for that entry.
Date and Time 12-5

3) Time dependent settings (Billing Resets, Rates and Seasons) will run as normal offStandard T
ime if the daylight saving box is not checked. If the daylight saving box is
checked in their settings, the setting will run off Summer Time if daylight saving is
t r in the period over which the time
jumps. In the example, a Billing Reset set to occur at 2:30:00 07/02/99 (Standard Time) will not occur since there is no actual 2:30 on that day. Similarly, a Billing Reset set to occur at 1:30: 3 e two instances where th ccur on Standard time it will only occur once - there is only one 1:30 (Standard Time).
t is suggested that any time based events should be set to occur during the periods when a time change does not occur due to daylight saving starting or ending.
5) erange begins during the period in which tim odd. In ca a Season or R te e nn ng t 3 00 1 0 9 Su m r im ) the following would result (Table 12-2).
v Time A v Rate
active and Standard Time if it is inactive.
4) Time based events (particularly Billing Resets and script based time events) will nobe activated on the start date if they are set to occu
00 1/10/99 (Summer Time) will occur twice, since there are time is 1:30. However, in the case that the event is set to o
For these reasons i
Tim range based settings (Rates and Seasoe is changed ba
ns) will work cock, the results m
rrectly. Howevay seem
er if a
the se of a a b gi i a 1: 0: 3 /1 /9 ( m e T e
DLS Acti e? cti e D 01:29: 0/9 Rate 1 59 31/1 9 D 01 0 0/ Rate 2 :3 :00 31/1 99 D 01 0 0/ Rate 2 :3 :01 31/1 99 D … Rate 2 D 01:59:59 31/10/99 Rate 2
Ending 01:00:00 31/10/99 Rate 1 01:00:01 31/10/99 Rate 1 … Rate 1 01:29:59 31/10/99 Rate 1 01:30:00 31/10/99 Rate 2 01:30:01 31/10/99 Rate 2
• Table 12-2 DLS example 2.
This is correct since there are two 1:30 time instances on 31/10/99.
e meter are done using standard time to avoid ambiguous times. EziView converts daylight saving time to standard time when
gs
6) The display of time on the default LCD display includes daylight saving. To display standard time on the LCD use register F03D. Register F061 gives daylight saving time, but cannot be written. All time settings to th
writing the time to the meter.
A ‘D’ is shown on the default LCD display just to the left of the time if daylight savinis active.
12-6 EDMI Genius User Manual

Time Statistics
T The meter ma a set of statistics about when it was opera ng. hese can be s f in fault an kin and in tamper det ion. The Screens Online Vari bles→ D dialog in EziView displays this formation (see ig e 12-1).
T er O ive accumulated power on and power off times since they were last cle the on and off times click the top Clear button. The number of power ups is also shown. To clear this click the bottom Clear button.
T Po er On/Off panel gives statistics about when and how ng ago that p werwas last applied. It also gives the time and duration of the last power outage.
ime Statisticsintains ti T u e ul
a d outage trac g, ect →ate Time in F ur
he Pow n/Off panel g sared. To clear
he Last w lo o
Date and Time 12-7

ntionally Blank
Inte
12-8 EDMI Genius User Manual

Time Statistics
Date and Time 12-9


Chapter 13 TiThe Time of Use system (TOU) is used when there is a need to measurwithout going to the detail of load survey type recordings. The aim of is to produce directly m that extracted from a load survey. This reduces
on site.
f the key features of the TOU system are:
can be from the meter’s own measurements, or pulseInpu
tervals.
e current set of channels is cleare
• Each channel belongs to one of 5 rate groups (W, VAR, VA, EX1,
• There are 5 active rates (one for each of the 5 rate groups), each beprogrammable using the scheduler.
• Scheduler time specifications may repeat hourly, daily, weekly, monever, or repeat at a user defined interval. Specifications with a lonhave priority over others.
fro the meter the type of tariff information the amount of information
transferred from the meter, and makes the information more easily acccustomer
Some o
• Up to 12 channels of TOU.
• Channel datasources. Example sources are Imported Wh, Export VArh or
• Each channel records the accumulated energy, as well as the maximenergy and the time of maximum demand of energy.
• Maximum demand may be rolling up to 15 sub in
• Each channel records this information in up to eight rates, each rateperiod over which the information was recorded. There is also a unbehaves as if it was always active.
• The occurrence of a billing reset causes the contents of all current ccopied into a set of previous channels. This data is also added to a registers. After this processing th
C h a p t e r
13
me of Use e usage patterns the TOU system is generallyust be
s from external t #1 pulses.
d to zero.
and EX2).
ing independently
nthly, yearly and ger repeat rate
that messible to the
um demand of
being a time ified rate that
hannels to beset of total
Time of Use 13-1
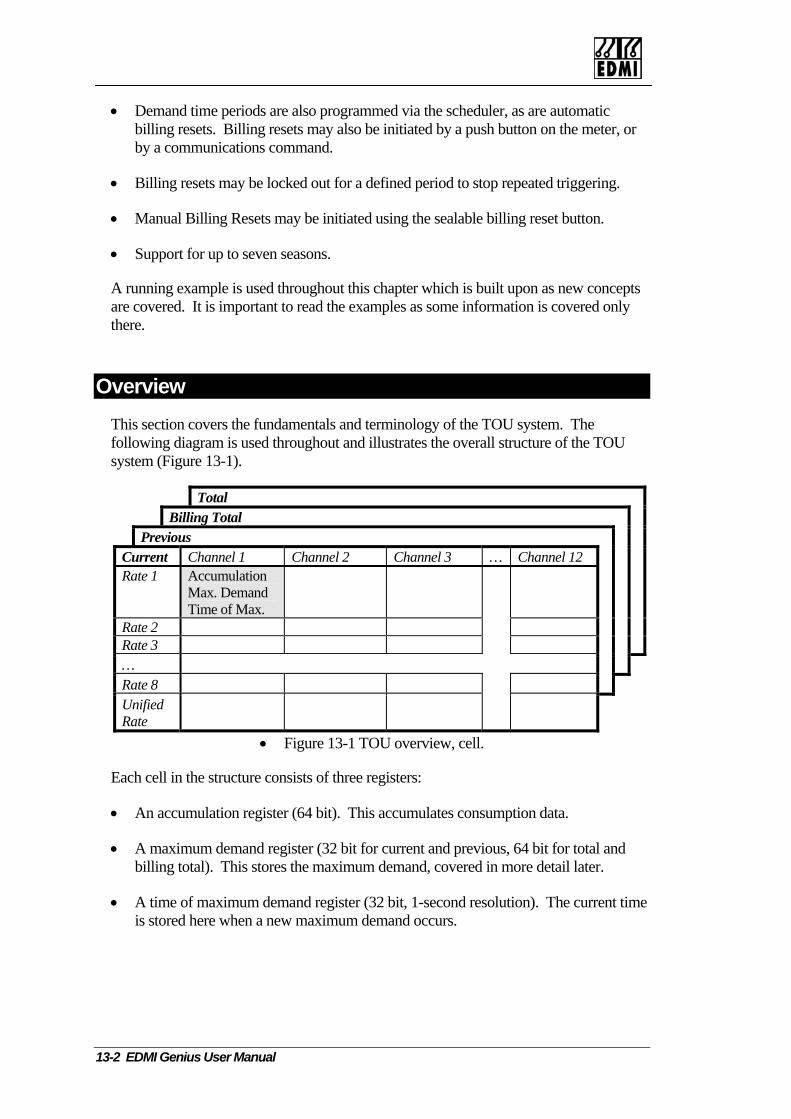
• Demand time periods are also programmed via the scheduler, as are automatic billing resets. Billing resets may also be initiated by a push button on the meter, or by a communications command.
• Billing resets may be locked out for a defined period to stop repeated triggering.
• Manual Billing Resets may be initiated using the sealable billing reset button.
• Support for up to seven seasons.
A running example is used throughout this chapter which is built upon as new concepts are covered. It is important to read the examples as some information is covered only there.
Overview This section covers the fundamentals and terminology of the TOU system. The following diagra is e of the TOU system (Figure 13-1).
m used throughout and illustrates the overall structur
Total Billing Total Previous Current Chan l 12 nel 1 Channel 2 Channel 3 … ChanneRate 1 Accumulation
Max. Demand Time of Max.
Rate 2 Rate 3 … Rate 8 Unified Rate
• Figure 13-1 TOU overview, cell.
Each cell in the structure consists of three registers:
• An accumulation register (64 bit). This accumulates consumption data.
• A maximum demand register (32 bit for current and previous, 64 bit for total and billing total). This stores the maximum demand, covered in more detail later.
• A time of maximum demand register (32 bit, 1-second resolution). The current time is stored here when a new maximum demand occurs.
13-2 EDMI Genius User Manual
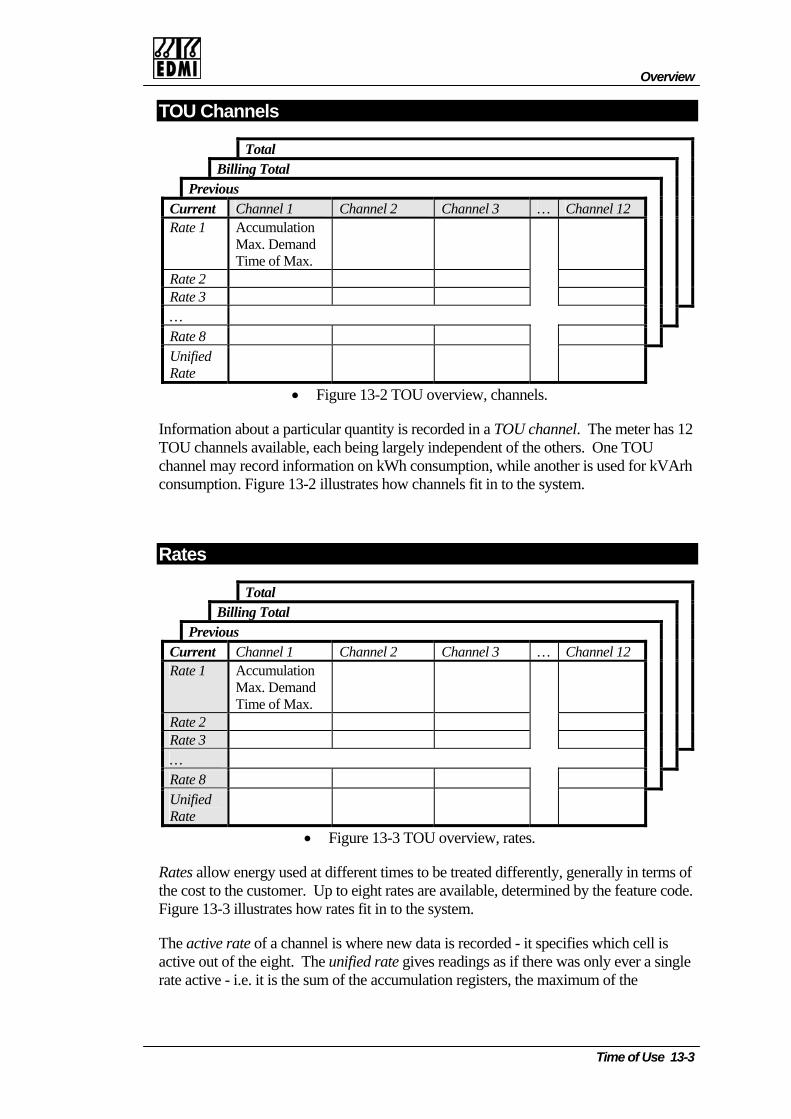
Overview
TOU Channels
Total Billing Total Previous Current Channel 1 Channel 2 Channel 3 … Channel 12 Rate 1 Accumulation
Max. Demand Time of Max.
Rate 2 Rate 3 … Rate 8 Unified Rate
• Figure 13-2 TOU overview, channels.
d information on kWh consumption, while another is used for kVArh illustrates how channels fit in to the system.
Information about a particular quantity is recorded in a TOU channel. The meter has 12TOU channels available, each being largely independent of the others. One TOU channel may recorconsumption. Figure 13-2
Rates
Total Billing Total Previous Current Channel 1 Channel 2 Channel 3 … Channel 12 Rate 1 Accumulation
MaTim
x. Demand e of Max.
Rate 2 Rate 3 … Rate 8 Unified Rate
• Figure 13-3 TOU overview, rates.
R w ene s of the cost to the c code. Figure 13-3 illu
The active rate of a channe w it specifies which cell is f the eight. The unified rate gives readings as if there was only ever a single
ates allo rgy used at different times to be treated differently, generally in termustomer. Up to eight rates are available, determined by the featurestrates how rates fit in to the system.
l is here new data is recorded - active out orate active - i.e. it is the sum of the accumulation registers, the maximum of the
Time of Use 13-3
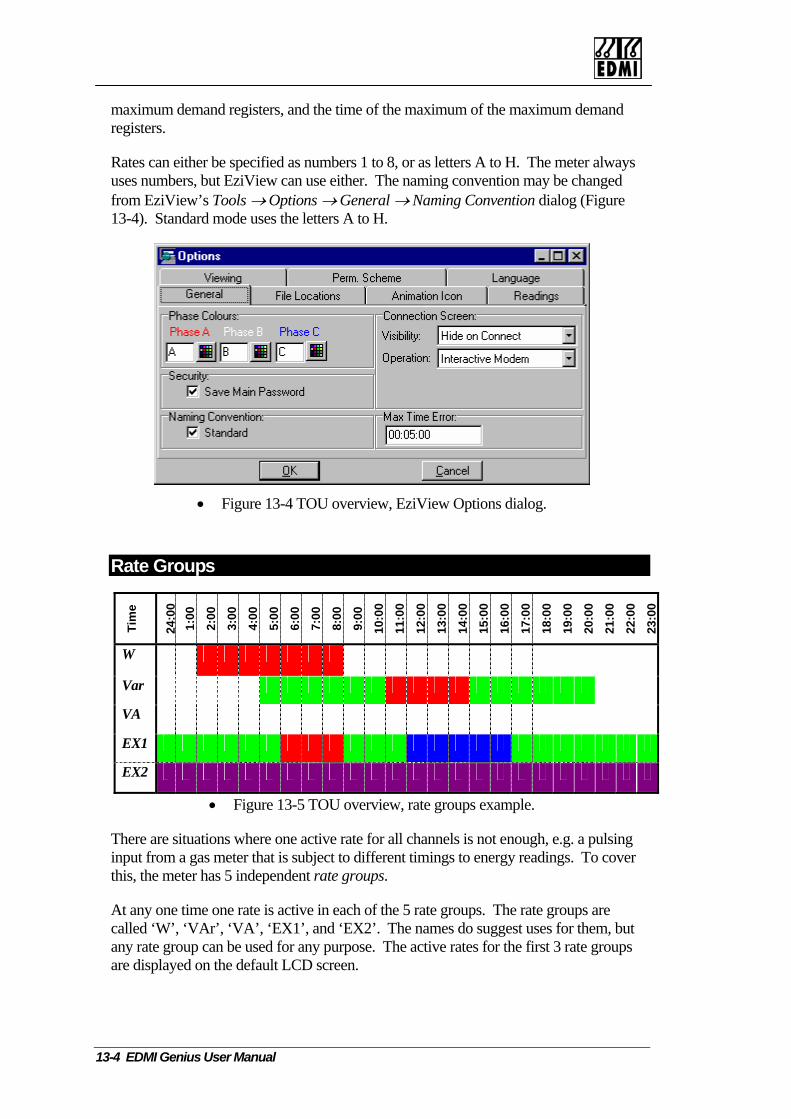
maximum demand registers, and the time of the maximum of the maximum demand
s ay be changed
iView’s Tools → Options → General → Naming Convention dialog (Figure tandard mode uses the letters A to H.
registers.
Rates can either be specified as numbers 1 to 8, or as letters A to H. The meter alwayuses numbers, but EziView can use either. The naming convention mfrom Ez13-4). S
• Figure 13-4 TOU overview, EziView Options dialog.
Rate Groups
Tim
e
24:0
0 1:
00
2:00
3:00
4:00
5:00
6:00
7:00
8:00
9:00
10:0
0
11:0
0
12:0
0 0 0 0 0 0 0 0 0 0 0
13:0
14:0
15:0
16:0
17:0
18:0
19:0
20:0
21:0
22:0
23:0
0 W
Var
VA
EX1
EX2
• Figure 13-5 TOU overview, rate groups example.
There are situations where one active rate for all channels is not enough, e.g. a pulsing input from a gas meter that is subject to different timings to energy readings. To cover this, the meter has 5 independent rate groups.
At any one time one rate is active in each of the 5 rate groups. The rate groups are called ‘W’, ‘VAr’, ‘VA’, ‘EX1’, and ‘EX2’. The names do suggest uses for them, but any rate group can be used for any purpose. The active rates for the first 3 rate groups are displayed on the default LCD screen.
13-4 EDMI Genius User Manual

Overview
The active rate that affects a channel is determined from the TOU channel’s rate groEach TOU channel belongs to a rate group for accumulated energy, and a
up. rate group for
maximum demand (they may be different).
In the example of Figure 13-5 the 5 rate groups are shown down the side, with times of long the top. Different colours in the grid represent different active rate
numbers. Rate group VA has the same active rate all day, while rate group EX1 has
The active rate in each group may be controlled by the scheduler, or from a manual override.
the day a
three different active rates during the day.
Billing Resets
Total Billing Total Previous Current Channel 1 Channel 2 Channel 3 … Channel 12 Rate 1 Accumula
Max. DemTime of M
tion and ax.
Rate 2 Rate 3 … Rate 8 Unified Rate
•
T rrent registers umulated. W billing reset o egisters (i al) and the cu set at once. As well as this, the accu l l accumulation
g total maximum nd registers as they
The total registers are a sum of the billing total regis nd the current registers following the sam
Billing resets ma :
• Pressing the billing reset button on the front of ter.
• Initiating a b ations
• Being automatically n
Figure 13-6 TOU overview, billing resets.
he cu are where TOU information is currently being acchen a ccurs, these registers are copied into the previous r
dentic rmu ation registers are added to the billing totarent registers are cleared. All TOU channels are re
registers, and the maximum demand registers are added to the billindemand registers. There are no billing total time of maximum demahave no meaning.
ters ae rules.
y be caused by
the me
illing reset from a communic session.
ge erated by the scheduler.
Time of Use 13-5

A billing reset lockout period may also be specified. Two billing resets may not occuwithin this time of each other. If an attempt is made, the second billing reset will be ignored.
r
The ability to per a billing reset is controlled b eter may not have this cod
To extend the nu revious readings stored, EziScript survey may be used. See Chapter 19, Bil g ation.
form y a feature code. Your me.
mber of p an lin History Tool on page 19-5 for more inform
Overflows
The reason for the large number of bits in the registers is to totally eliminate the high resolution
results. For energy quantities the data is stored as a number of micropulses. Micropulses are an internal pulse value used for measured energy, and should be scaled to a primary or secondary quantity. There is approximately 1 micropulse per 0.000001 kWh (for a 5A m This m even very l input conditions a significant numb lses ar ded. Fo ple, at 63.5V, 0.05A on a single phase, around 800 pulses are st d fo ut eriod, ensuring that the meter’s accuracy is not
Gated energy tes perform n even h r intern ensure maximum accura a rate o hundr sand tim
possibility of overflow within the lifetime of the meter, and to provide
eter). eans that under ower of pu e recor r exam
ill recorde r a 15 min e plost though an inadequate number of pulses.
At the other end of the scale, even at full load the registers will not overflow. The maximum demand registers (which never record energy for more than an hour) would take almost 6 days to overflow. The energy accumulation registers will take more than 70 million years to overflow at full load. Even a billing reset every minute would mean the cumulative maximum demand registers would not overflow for well over 1 million years.
ts are ed at a ighe al pulse rate toes faster. cy, at f over a ed thou
Maximum Demands
In support of m ers. These are
el has its own set of 15
o of 5 minutes results in resets at times of 0:05, 0:20, 0:35, and 0:50.
Whemaxi the maxitime.
The
the aximum demand registers are the rising demand registthe registers that accumulate energy over the demand period, generally from 1 minute to 60 minutes. The demand for the period is simply the accumulated energy divided by the fraction of an hour that the demand period is. Each TOU channrising demand registers. The reason there are fifteen is to allow for rolling demand schemes. For example, there might be three 15-minute demands, but they start with ffsets from the hour of 0, 5 and 10 minutes. An offset
n a demand period ends, the demand is compared with the channel’s active mum demand register. If it is larger, the new maximum demand is written tomum demand register and the time of maximum demand is updated to the current
maximum demand feature is optional and is enabled by a feature code.
13-6 EDMI Genius User Manual
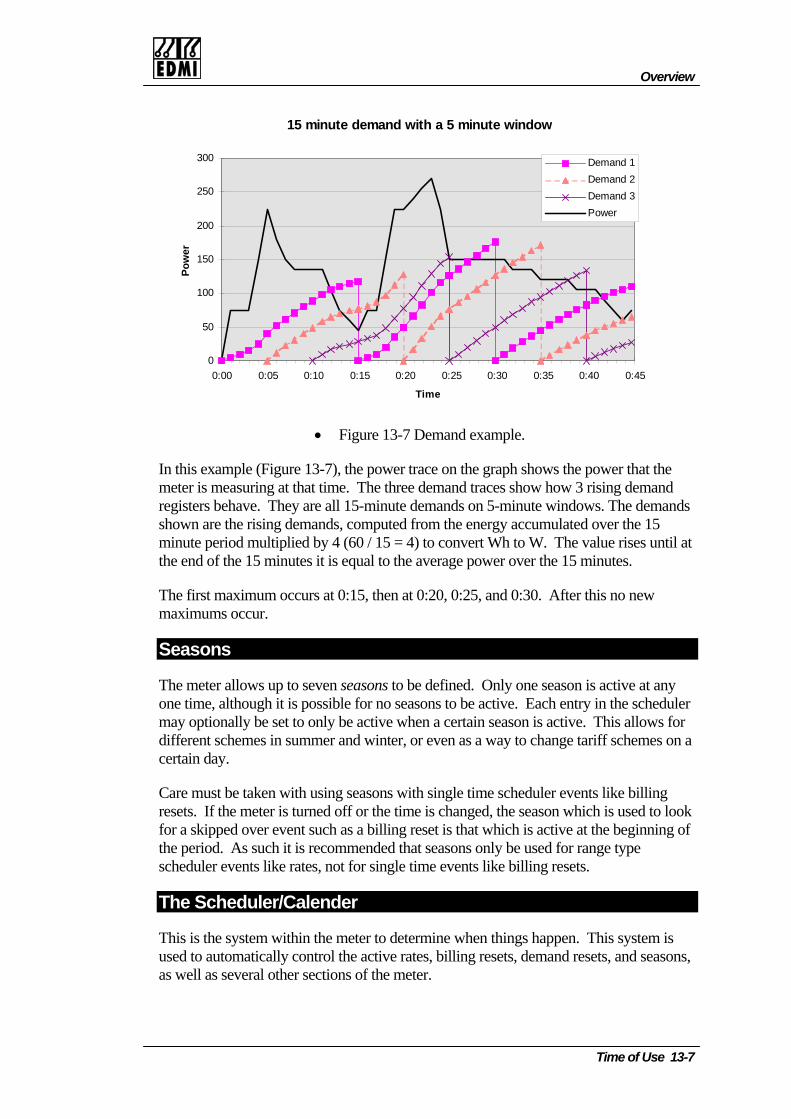
Overview
15 minute demand with a 5 minute window
0
50
100
150
200
250
300
0:00 0:05 0:10 0:15 0:20 0:25 0:30 0:35 0:40 0:45
Pow
er
Time
Demand 1Demand 2Demand 3Power
In thmete and traces show how 3 rising demand r ows. The demands s ted over the 15 m s until at the end of
• Figure 13-7 Demand example.
is example (Figure 13-7), the power trace on the graph shows the power that the r is measuring at that time. The three dem
egisters behave. They are all 15-minute demands on 5-minute windhown are the rising demands, computed from the energy accumulainute period multiplied by 4 (60 / 15 = 4) to convert Wh to W. The value rise
the 15 minutes it is equal to the average power over the 15 minutes.
The first maximum occurs at 0:15, then at 0:20, 0:25, and 0:30. After this no new maximums occur.
Seasons
er
billing ason which is used to look
s active at the beginning of e period. As such it is recommended that seasons only be used for range type
scheduler events like rates, not for single time events like billing resets.
The meter allows up to seven seasons to be defined. Only one season is active at any one time, although it is possible for no seasons to be active. Each entry in the schedulmay optionally be set to only be active when a certain season is active. This allows for different schemes in summer and winter, or even as a way to change tariff schemes on acertain day.
Care must be taken with using seasons with single time scheduler events likeresets. If the meter is turned off or the time is changed, the sefor a skipped over event such as a billing reset is that which ith
The Scheduler/Calender
This is the system within the meter to determine when things happen. This system is used to automatically control the active rates, billing resets, demand resets, and seasons, as well as several other sections of the meter.
Time of Use 13-7

The calender is made up of a number of entries. Each entry defines either a single time (billing resets and demand resets) or a time range (rates and seasons), and what happenif the entry occurs. Entries are also qualified by a season - entries from an inactive season are ignored. If no season is specified then the entry is not affected by seaso
s
n.
There are several ways to specify a time, based on how often it repeats. The times are specified in minutes past a reference point. The table below shows the options (Table 13-1). The size columns give the size of an entry of this type in bytes.
Time Type Description Event Size
Range Size
Hourly Minutes since the start of the hour. 6 8 Daily Minutes since the start of the day. 6 8 Weekly Minutes since the start of the week. 6 8 Monthly Minutes since the start of the month. 6 8 R. Monthly Minutes from the end of the month, back towards the
beginning of the month. (Reverse Monthly) 6 8
Yearly Minutes since the start of the year, assuming February has 28 days.
8 12
Special Day Days since the start of 1996. 1 day range assumed. Firmware v1.55 and later.
6 6
Special Minutes since the start of 1996. 8 12 Rate 1st argument: Minutes between operations.
2nd argument: Minutes offset. 12 20
• Table 13-1 Time specification options.
If two single time entries occur in the same minute to generate the same event (e.g. a billing reset), the event will still occur only once. If power is switched off or a time change occurs, the intervening timduring the period t ed by this method.
s
7:00 would result in a range that extends through midnight, but excludes the period 7:00 to 20:00 during the day.
When time range entriesprecedence. Time types lower down in Table 13-1 (i.e. those with longer repeat rates) override types higher up the table, e.g. Yearly overrides Daily. For time types with the same type, those higher up in the scheduler table will override those lower down.
The Memory Available bar at the bottom of the scheduler setup pages indicates how much memory is left in the meter for entries. Note that the BillingReset, Demand, Rates and Season pages all share the same block of memory. The meter has 1600 bytes of memory allocated for the scheduler. This gives up to 266 of the smallest entries, but in practice there will be a mix of types so this figure will be less.
e is searched for events that would have occurred . A most only one of the same event will be generat
Time range entries are specified in a similar manner, except that two times are given - the start time and the end time. If the start time is after the end time, the range extendover the boundaries. For example, starting at 20:00 on a daily time type and going to
for the same event overlap (e.g. active rate) there is a defined
13-8 EDMI Genius User Manual
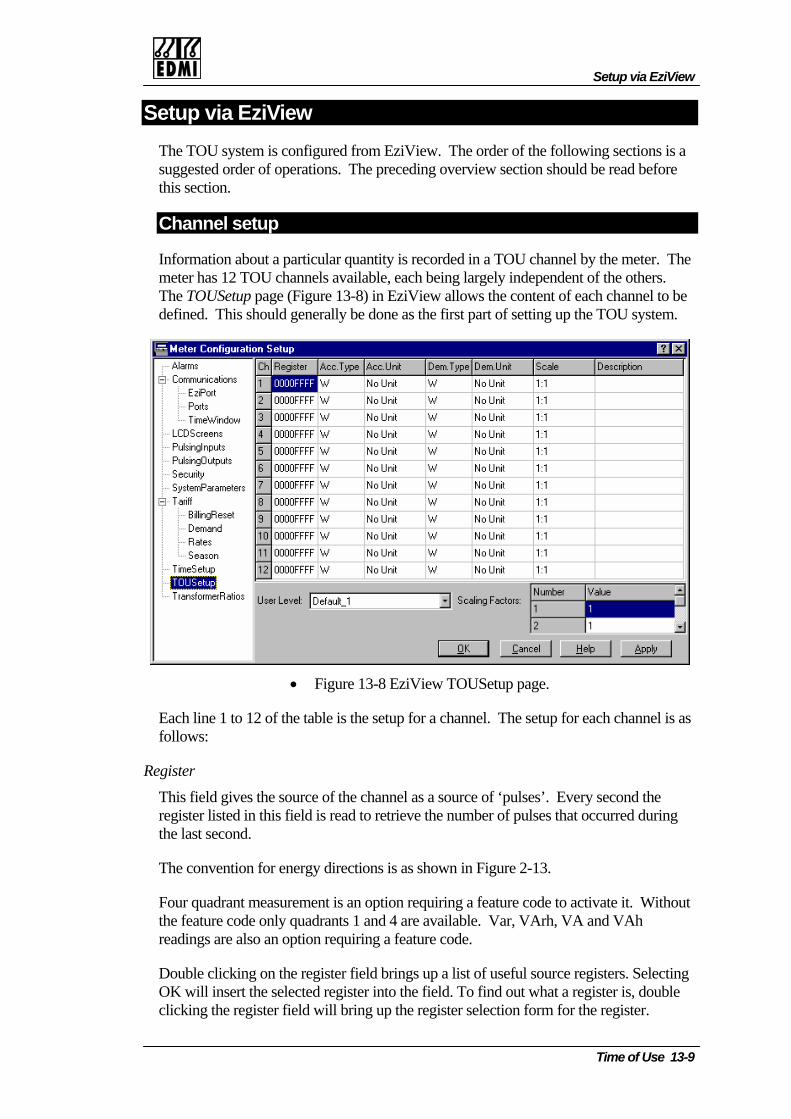
Setup via EziView
S
s. The preceding overview section should be read before this section.
etup via EziView The TOU system is configured from EziView. The order of the following sections is a suggested order of operation
Channel setup
Information about a particular quantity is recorded in a TOU channel by the meter. The meter has 12 TOU channels available, each being largely independent of the others. The TOUSetup page (Figure 13-8) in EziView allows the content of each channel to be defined. This should generally be done as the first part of setting up the TOU system.
• Figure 13-8 EziView TOUSetup page.
Each line 1 to 12 of the table is the setup for a channel. The setup for each channel isfollows:
as
Register
de to activate it. Without the feature code only quadrants 1 and 4 are available. Var, VArh, VA and VAh readings are also an option requiring a feature code.
Double clicking on the register field brings up a list of useful source registers. Selecting OK will insert the selected register into the field. To find out what a register is, double clicking the register field will bring up the register selection form for the register.
This field gives the source of the channel as a source of ‘pulses’. Every second the register listed in this field is read to retrieve the number of pulses that occurred during the last second.
The convention for energy directions is as shown in Figure 2-13.
Four quadrant measurement is an option requiring a feature co
Time of Use 13-9
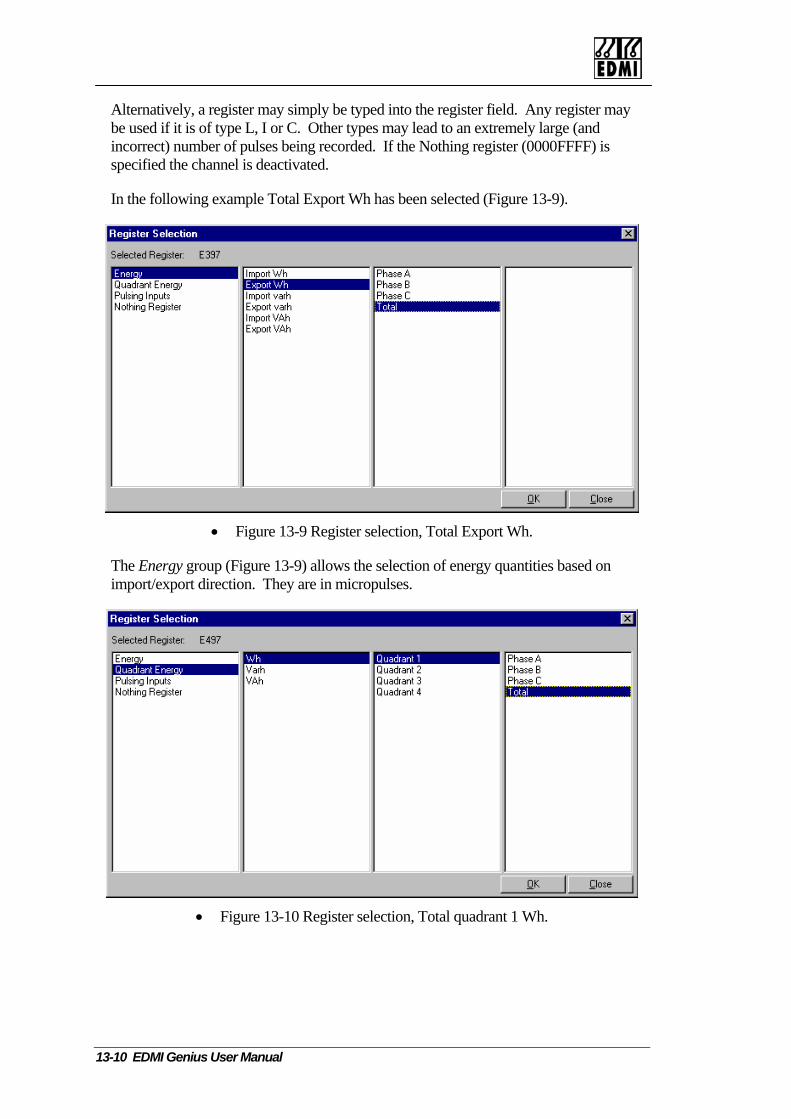
Alternatively, a register may simply be typed into the register field. Any register may be used if it is of type L, I or C. Other types may lead to an extremely large (and incorrect) number of pulses being recorded. If the Nothing register (0000FFFF) is specified the channel is deactivated.
In the following example Total Export Wh has been selected (Figure 13-9).
• Figure 13-9 Register selection, Total Export Wh.
The Energy group (Figure 13-9) allows the selection of energy quantities based on import/export direction. They are in micropulses.
• Figure 13-10 Register selection, Total quadrant 1 Wh.
13-10 EDMI Genius User Manual

Setup via EziView
The Quadrant group (Figure 13-10) allows energies to be selected on an individual quadrant basis. They are in micropulses. The quadrants are as labelled in Figure 2-13, on page 2-16.
13-11) allows pulsing inputs to be selected as a source. The values read are the number of pulses on the indicated input. The input must be set
Ac
annel into one of five groups for accumulated energy calculations. The ’, ‘VAr’, ‘VA’, ‘EX1’, and ‘EX2’. The usage of the groups doesn’t need
at is suggested by the names - all groups have the same functionality. The
Ac
D
This puts the channel into one of five groups for demand calculations. The groups are
D
easured, or No Unit where none is appropriate (Pulses from a gas meter for example).
• Figure 13-11 Register selection, Pulsing Input 1.
The pulsing inputs group (Figure
up appropriately as a pulsing input.
c. Type (Accumulated Type)
This puts the chgroups are ‘Wto follow whusage of groups will become clearer when rates and demand times are described later in this chapter.
c. Unit (Accumulated Unit)
This selects the unit that will be displayed after the value on LCD displays. It should generally be Wh, VArh, or VAh as appropriate to the quantity being measured, or No Unit where none is appropriate (Pulses from a gas meter for example).
em. Type (Demand Type)
as for Acc. Type.
em. Unit (Demand Unit)
This selects the unit that will be displayed after the value on LCD displays. It should generally be W, VAr, or VA as appropriate to the quantity being m
Time of Use 13-11
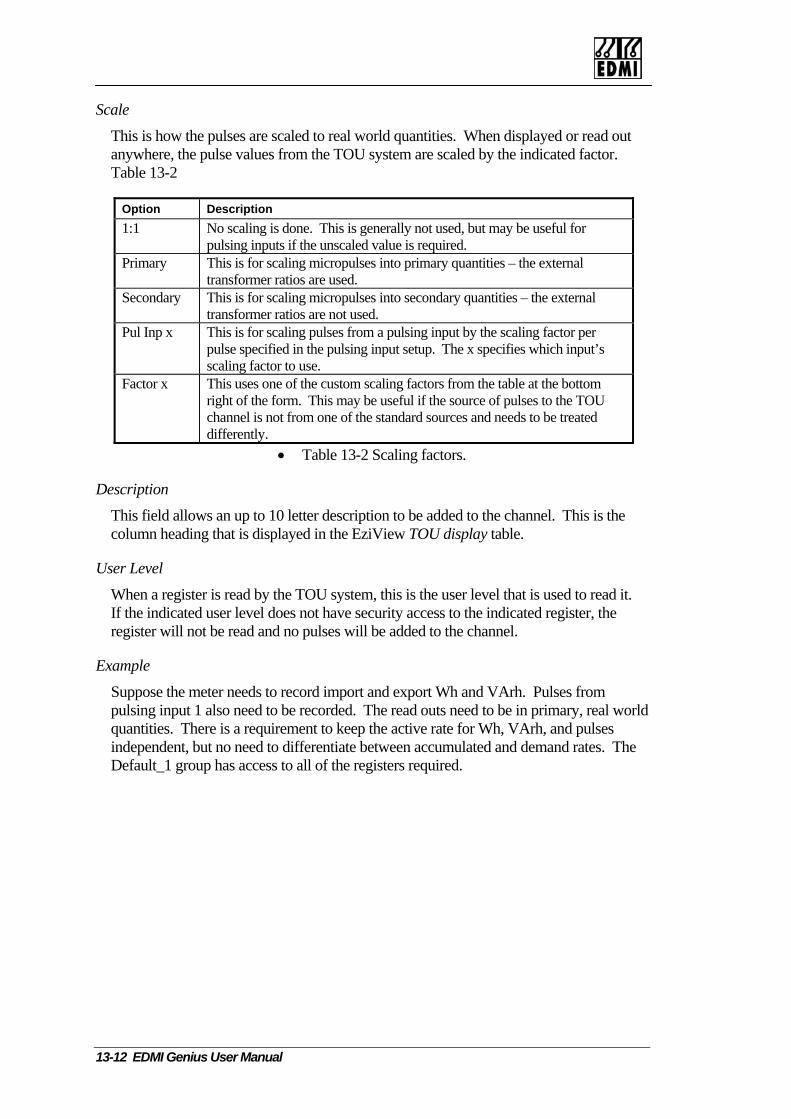
Sc
ription
ale
This is how the pulses are scaled to real world quantities. When displayed or read out anywhere, the pulse values from the TOU system are scaled by the indicated factor. Table 13-2
Option Desc1:1 No scaling is done. This is generally not used, but may be useful for
pulsing inputs if the unscaled value is required. Primary This is for scaling micropulses into primary quantities – the external
s are used. transformer ratioS condary This is for scaline g micropulses into secondary quantities – the external
transformer ratios are not used. P l Inp x This is for scaling pulses from a pulsing input by the scaling facu tor per
ng input setup. The x specifies which input’s pulse specified in the pulsiscaling factor to use.
Factor x This uses one of the custom scaling factors from the table at the bottom right of the form. This may be useful if the source of pulses to the TOU channel is not from one of the standard sources and needs to be treated differently.
• Table 13-2 Scaling factors.
Description
This field allows an t annel. This is the column heading that is displayed in the EziView TOU display table.
User Level
by the TOU system, this is the user level that is used to read it.
Example
rld
mulated and demand rates. The Default_1 group has access to all of the registers required.
up o 10 letter description to be added to the ch
When a register is read If the indicated user level does not have security access to the indicated register, theregister will not be read and no pulses will be added to the channel.
Suppose the meter needs to record import and export Wh and VArh. Pulses from pulsing input 1 also need to be recorded. The read outs need to be in primary, real woquantities. There is a requirement to keep the active rate for Wh, VArh, and pulses independent, but no need to differentiate between accu
13-12 EDMI Genius User Manual
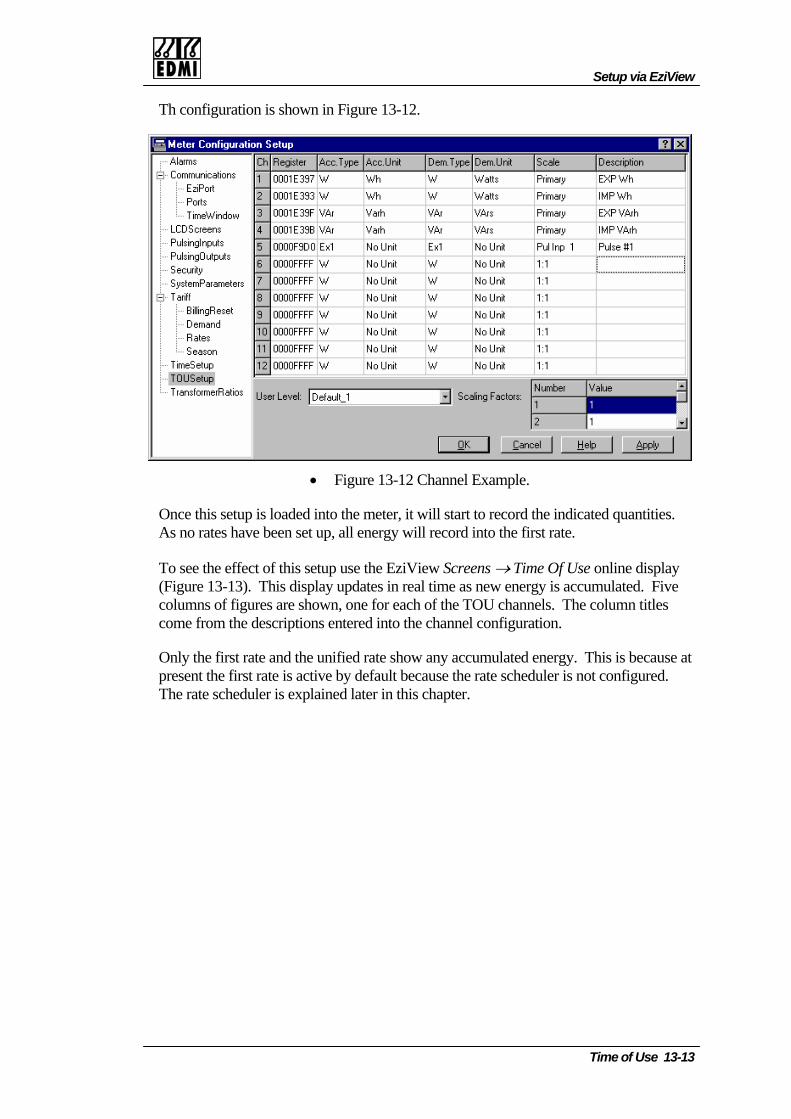
Setup via EziView
Th configuration is shown in Figure 13-12.
• Figure 13-12 Channel Example.
Once this setup is a ated quantities. As no rates have been set up, all energy will record into the first rate.
To see the effect of this setup use the EziView Screens → Time Of Use online display tes in real time as new energy is accumulated. Five
tles
Only the first rate and the unified rate show any accumulated energy. This is because at present the first rate is active by default because the rate scheduler is not configured. The rate scheduler is exp
lo ded into the meter, it will start to record the indic
(Figure 13-13). This display updacolumns of figures are shown, one for each of the TOU channels. The column ticome from the descriptions entered into the channel configuration.
lained later in this chapter.
Time of Use 13-13
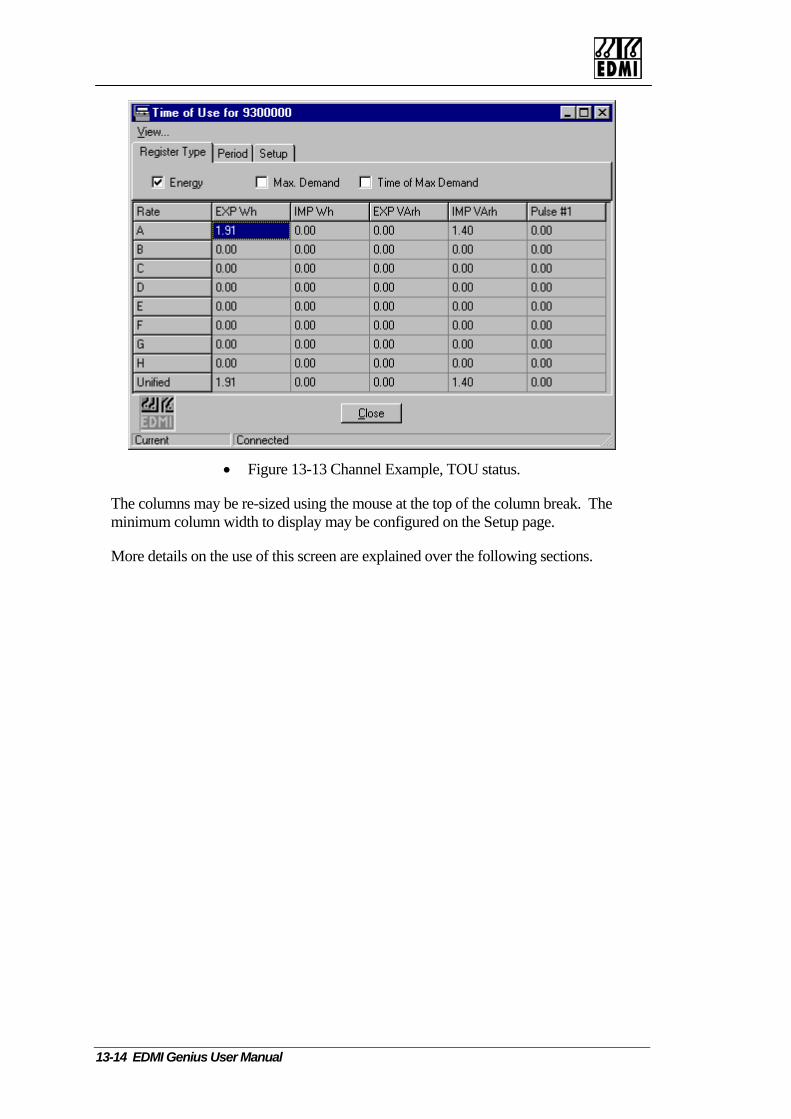
• Figure 13-13 Channel Example, TOU status.
The columns may be re-sized using the mouse at the top of the column break. The minimum column width to display may be configured on the Setup page.
More details on the use of this screen are explained over the following sections.
13-14 EDMI Genius User Manual
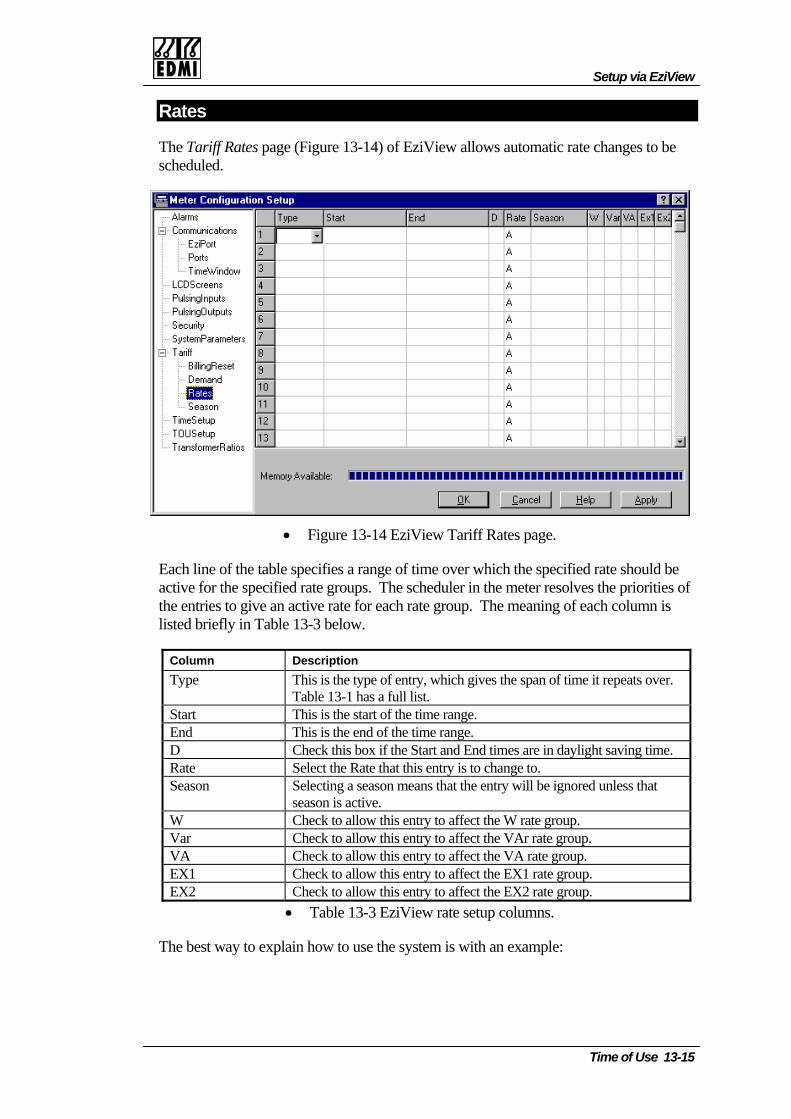
Setup via EziView
Rates
The Tariff Rates page (Figure 13-14) of EziView allows automatic rate changes to be scheduled.
• Figure 13-14 EziView Tariff Rates page.
Each line of the table specifies a range of time over which the specified rate should be active for the specified rate groups. The scheduler in the meter resolves the priorities of the entries to give an active rate for each rate group. The meaning of each column is listed briefly in Table 13-3 below.
Column Description Type This is the type of entry, which gives the span of time it repeats over.
Table 13-1 has a full list. Start This is the start of the time range. End This is the end of the time range. D Check this box if the Start and End times are in daylight saving time. Rate Select the Rate that this entry is to change to. Season Selecting a season means that the entry will be ignored unless that
season is active. W Check to allow this entry to affect the W rate group. Var Check to allow this entr to affect the VAr rate group. y VA Check to allow this entry to affect the VA rate group. EX1 up. Check to allow this entry to affect the EX1 rate groEX2 Check to allow this entry to affect the EX2 rate group.
• Table 13-3 EziView rate setup columns.
The best way to explain how to use the system is with an example:
Time of Use 13-15

Suppose the following tariff was in place (Table 13-4):
Time Rate 0:00 to 7:00 Off Peak 7:00 to 10:00 Peak 10:00 to 17:00 Daytime 17:00 to 21:00 Peak 21:00 to 24:00 Off Peak Weekends: 21:00 Friday to 7:00 Monday
Off Peak
• Table 13-4 Example tariff times.
There are 3 rates in this tariff structure, each being charged at a different amount per Wh. To separate this usage different rates in the meter are used for each tariff rate. this example the following assignment is used (Table 13-5):
For
Rate Rate Number Off Peak 1 Peak 2 Daytime 3
• Table 13-5 Example tariff rate allocations.
It is best to use rate 1 for the most common rate. Rate 1 is the default rate, and as such does not need any scheduler entries to define it.
The scheduler commands needed to implement this are (Table 13-6):
Type Start End Rate Number Daily 7:00 10:00 2 Daily 10:00 17:00 3 Daily 17:00 21:00 2 Weekly 21:00 Fri 7:00 Mon 1
• Table 13-6 Example scheduler commands.
The first three lines are self-explanatory. They define a daily schedule of changes. The last entry overrides the daily entries to enforce off peak on a weekend. This could be simplified even further by using the fact that entries higher up in the table override those lower down of the same type if they overlap. In the following table (Table 13-7) the top entry will override the second entry during the middle of the day. While this requires fewer entries, it is more cryptic than the earlier version (Table 13-6).
Type Start End Rate Number Daily 10:00 17:00 3 Daily 7:00 21:00 2 Weekly 21:00 Fri 7:00 Mon 1
• Table 13-7 Example alternative scheduler commands.
We will use rate group W for the channels to be controlled by this tariff. No seasons are used, and all times are standard time, not daylight saving time.
13-16 EDMI Genius User Manual
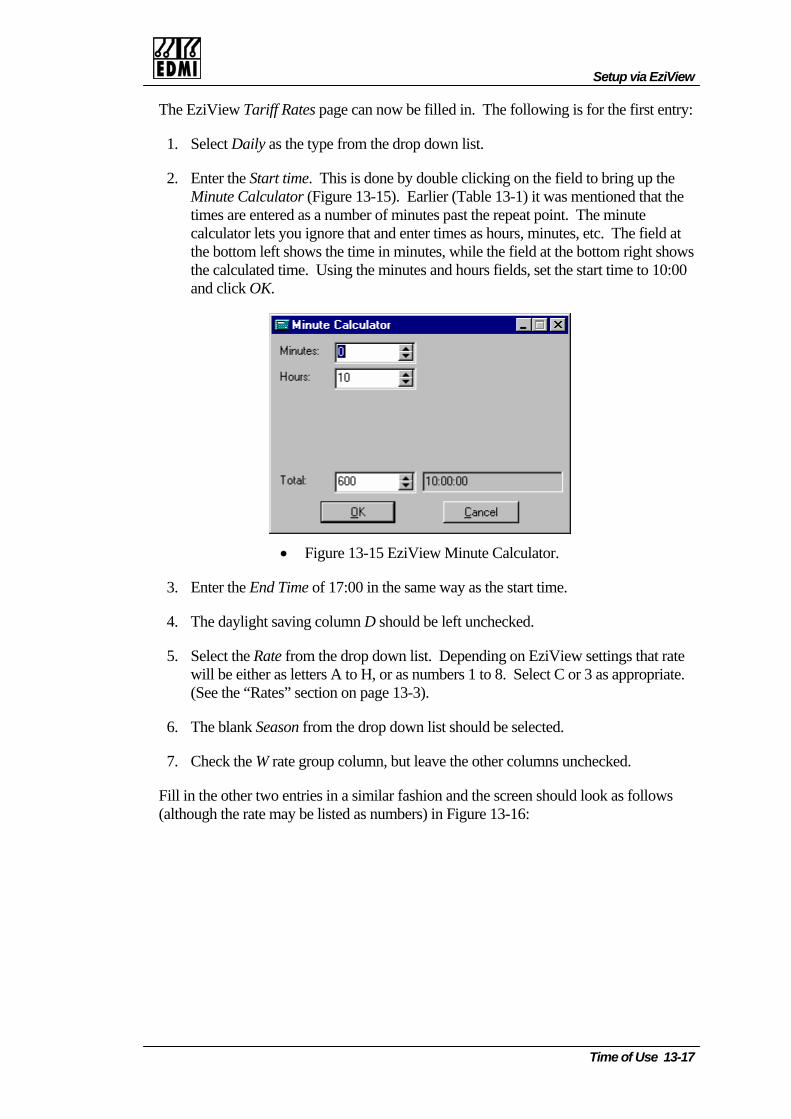
Setup via EziView
The EziView Tariff Rates page can now be filled in. The following is for the first entry:
ble clicking on the field to bring up the Minute Calculator (Figure 13-15). Earlier (Table 13-1) it was mentioned that the times are entered as a number of minutes past the repeat point. The minute calculator lets u s, etc. The field at
1. Select Daily as the type from the drop down list.
2. Enter the Start time. This is done by dou
yo ignore that and enter times as hours, minutethe bottom left shows the time in minutes, while the field at the bottom right shows the calculated time. Using the minutes and hours fields, set the start time to 10:00 and click OK.
• Figure 13-15 EziView Minute Calculator.
3. Enter the End Time of 17:00 in the same way as the start time.
4. The daylight saving column D should be left unchecked.
5. Select the Rate from the drop down list. Depending on EziView settings that rate will be either as letters A to H, or as numbers 1 to 8. Select C or 3 as appropriate. (See the “Rates” section on page 13-3).
6. The blank Season from the drop down list should be selected.
7. Check the W rate group column, but leave the other columns unchecked.
Fill in the other two entries in a similar fashion and the screen should look as follows (although the rate may be listed as numbers) in Figure 13-16:
Time of Use 13-17

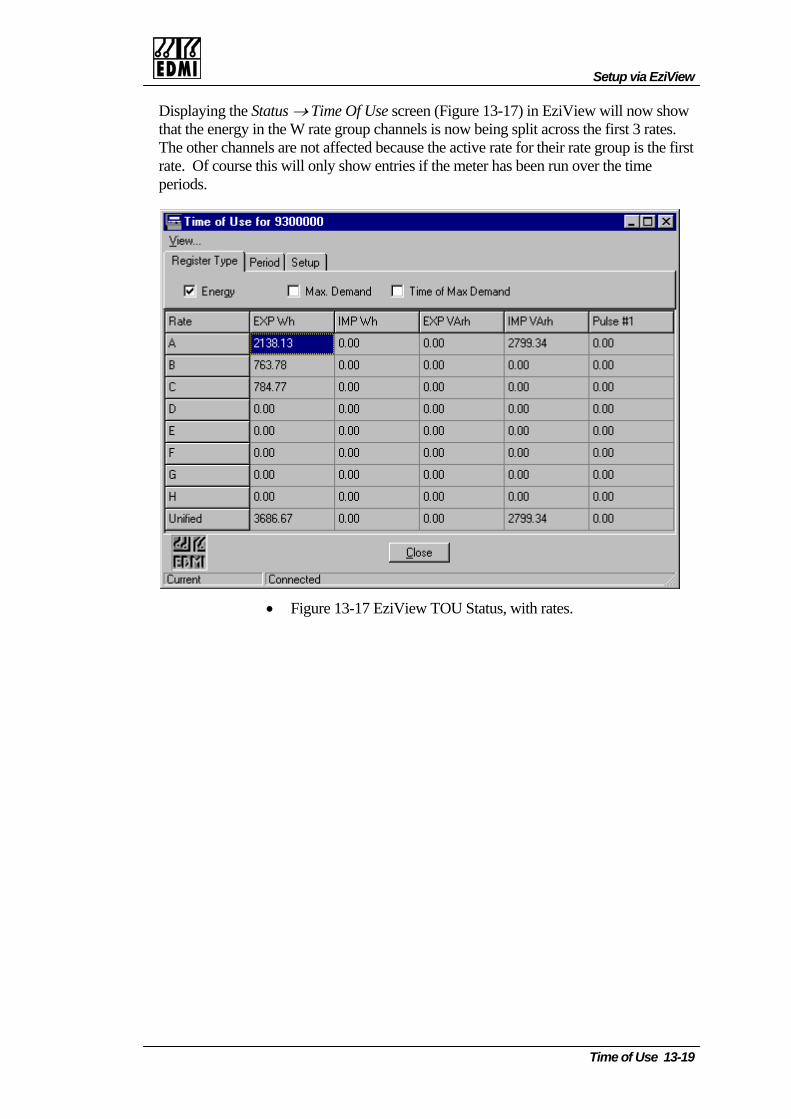
Setup via EziView
Displaying the Status → Time Of Use screen (Figure 13-17) in EziView will now show that the energy in the W rate group channels is now being split across the first 3 rates. The other channels are not affected because the active rate for their rate group is the first rate. Of course this will only show entries if the meter has been run over the time periods.
• Figure 13-17 EziView TOU Status, with rates.
Time of Use 13-19
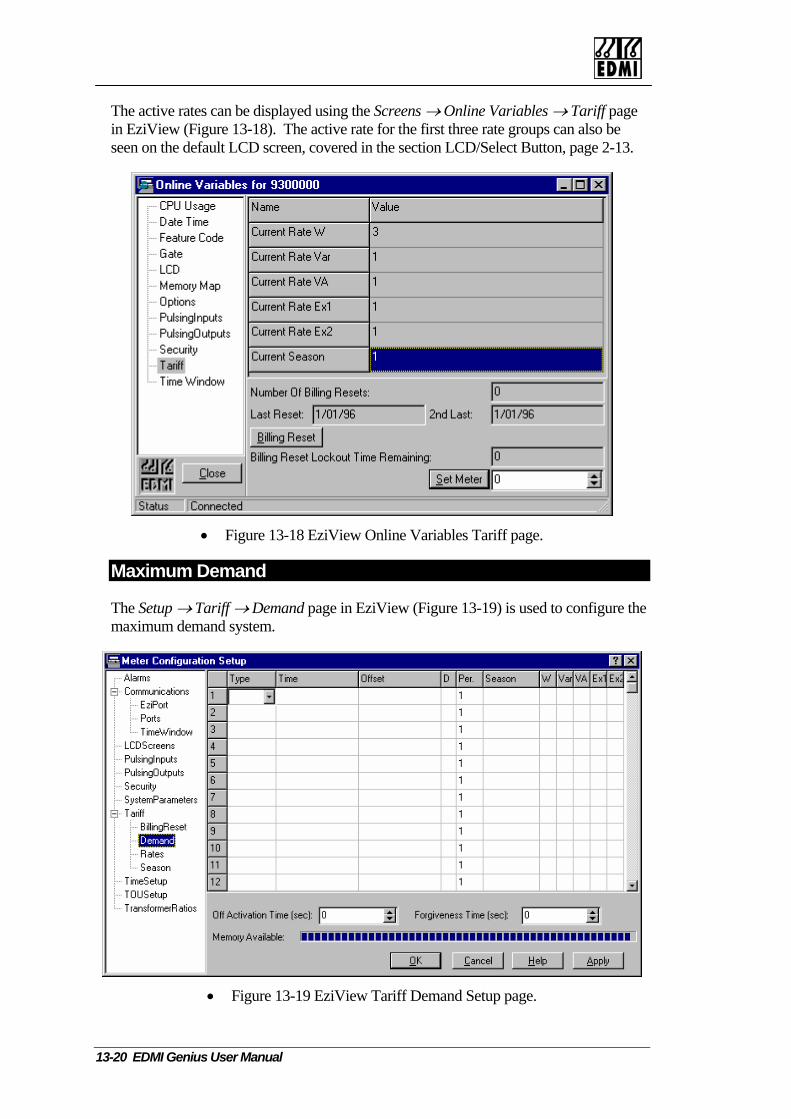
The active rates can be displayed using the Screens → Online Variables → Tariff page in EziView (Figure 13-18). The active rate for the first three rate groups can also be seen on the default LCD screen, covered in the section LCD/Select Button, page 2-13.
• Figure 13-18 EziView Online Variables Tariff page.
Maximum Demand
The Setup → Tariff → Demand page in EziView (Figure 13-19) is used to configure tmaximum demand system.
he
• Figure 13-19 EziView Tariff Demand Setup page.
13-20 EDMI Genius User Manual

Setup via EziView
The demand scheduler page allows the occurrence of demand resets to be controlled.Each channel has a set of 15 rising demand registers that accumulate energy continuously. When the demand schedule indicates that o
ne of these should be reset, the demand is calculated (using the rate of the scheduler event) and is compared against the channel’s maximum demand. If the new reading is greater, a new maximum and time of maximum is set for the channel. The demand register is then reset.
The demand scheduler set up is similar to rate scheduler configuration. The main difference is in the type of time event required. What is needed to mark the ends of demand intervals is a type that resets the rising demand registers when the end of an interval is reached. The type to use is Rate. No other types can be used for demand.
The Time field becomes the demand interval, the time between resetting the demand back to zero. It must always be divisible into an hour evenly (i.e. 60, 30, 20, 15, 12, 10, 6, 5, 4, 3, 2, or 1 minute). If it is not the demand calculated will be wrong.
The Offset field is an offset from start of the interval. For example, if the Time field is set to15 minutes, setting the Offset field to 5 results in resets at times of 0:05, 0:20, 0:35, and 0:50. This is used for rolling window demand schemes.
For example, in a rolling window scheme the demand interval may be 15 minutes, with 3 windows. This is effectively running three demand calculations at once on the same data. Figure 13-20 illustrates this, showing how the different windows overlap. To achieve this in the meter, egisters are used,
0:00
0:05
0:10
0:15
0:20
0:25
0:30
0:35
0:40
0:45
0:50
0:55
1:00
1:05
1:10
three of a channel’s rising demand rconfigured the same except for different offsets.
Ti
me
1
2
3
• Figure 13-20 Demand periods example.
Time of Use 13-21
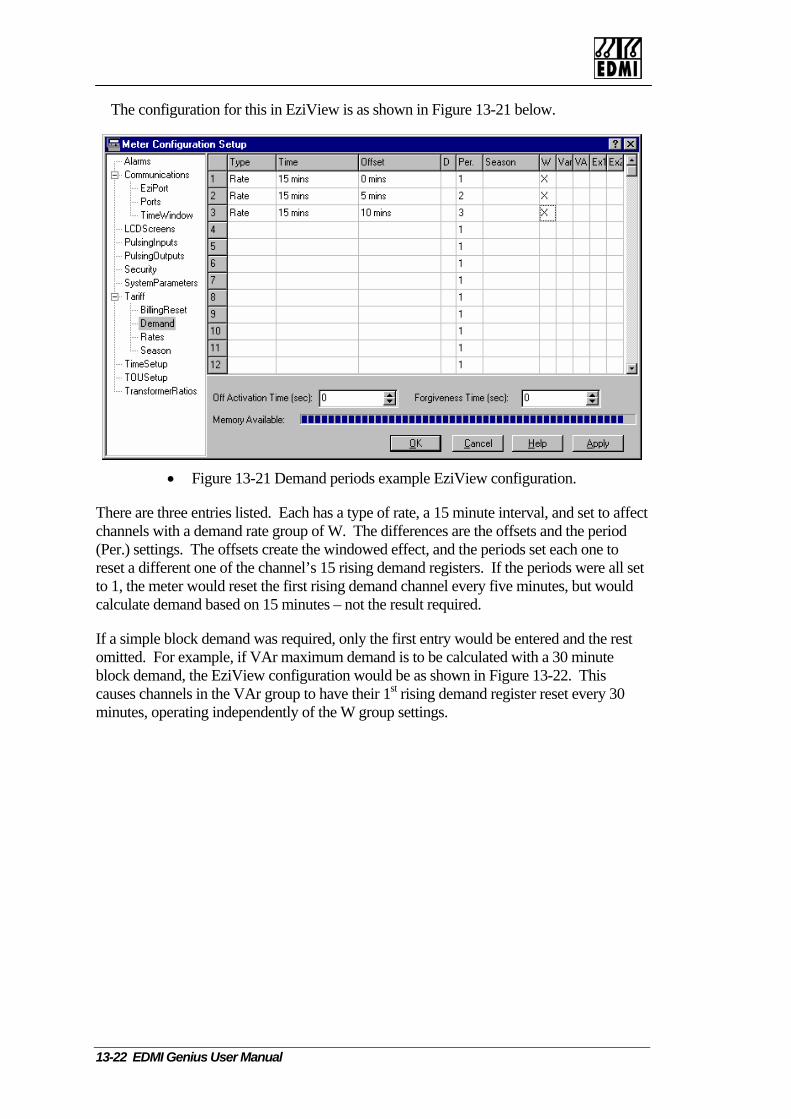
The configuration for this in EziView is as shown in Figure 13-21 below.
• Figure 13-21 Demand periods example EziView configuration.
There are three entries listed. Each has a type of rate, a 15 minute interval, and set to affect channels with a demand rate group of W. The differences are the offsets and the period (Per.) settings. The offsets create the windowed effect, and the periods set each one to reset a different one of the channel’s 15 rising demand registers. If the periods were all set to 1, the meter would reset the first rising demand channel every five minutes, but would calculate demand based on 15 minutes – not the result required.
If a simple block demand was required, only the first entry would be entered and the rest omitted. For example, if VAr maximum demand is to be calculated with a 30 minute block demand, the EziView configuration would be as shown in Figure 13-22. This causes channels in the VAr group to have their 1st rising demand register reset every 30 minutes, operating independently of the W group settings.
13-22 EDMI Genius User Manual
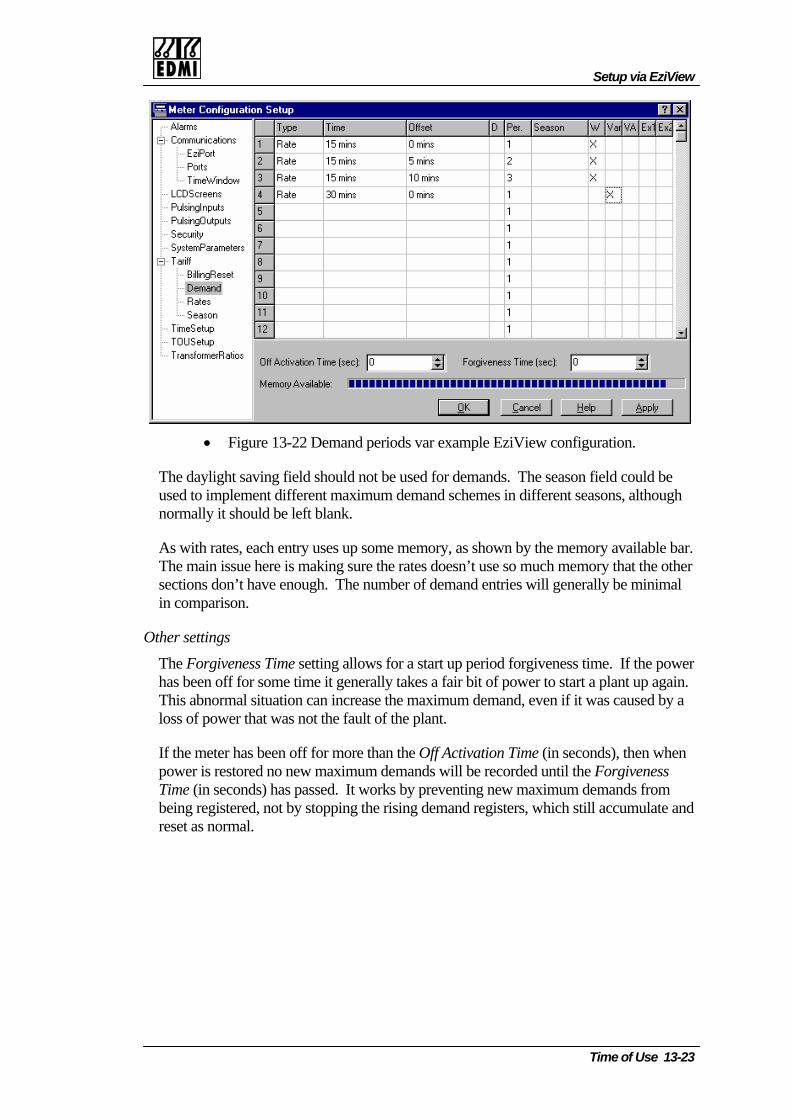
Setup via EziView
• Figure 13-22 Demand periods var example EziView configuration.
he daylight saving field should not be used for demands. The season field could be sed to implement different maximum demand schemes in different seasons, although
normally it should be left blank.
As with rates, each entry uses up some mem ry, as shown by the memory available bar. The main issue here is making sure the rates doesn’t use so much memory that the other sections don’t have enough. The number of demand entries will generally be minimal in comparison.
Other settings
The Forgiveness Time setting allows for a start up period forgiveness time. If the power has been off for some time it generally takes a fair bit of power to start a plant up again. This abnormal situation can increase the maximum demand, even if it was caused by a loss of power that was not the fault of the plant.
If the meter has been off for more than the Off Activation Time (in seconds), then when power is restored no new maximum demands will be recorded until the Forgiveness Time (in seconds) has passed. It works by preventing new maximum demands from being registered, not by stopping the rising dem which still accumulate and reset as normal.
Tu
o
and registers,
Time of Use 13-23
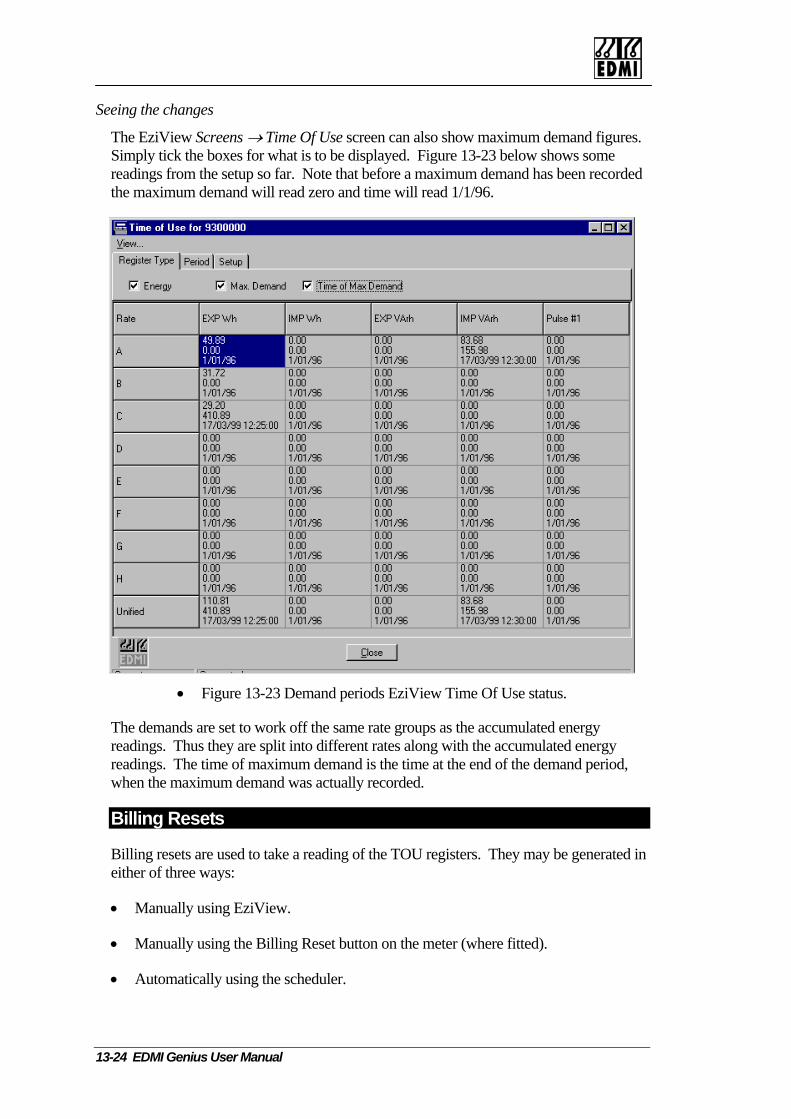
Seeing the changes
The EziView Screens → Time Of Use screen can also show maximum demand figures. Simply tick the boxes for what is to be displayed. Figure 13-23 below shows some readings from the setup so far. Note that before a maximum demand has been recorded the maximum demand will read zero and time will read 1/1/96.
• Figure 13-23 Demand periods EziView Time Of Use status.
The demands are set to work off the same rate groups as the accumulated energy readings. Thus they are split into different rates along with the accumulated energy readings. The time of maximum demand is the time at the end of the demand period, when the maximum demand was actually recorded.
Billing Resets
Billing resets are used to take a reading of the TOU registers. They may be generated in either of three ways:
• Manually using EziView.
• Manually using the Billing Reset button on the meter (where fitted).
• Automatically using the scheduler.
13-24 EDMI Genius User Manual
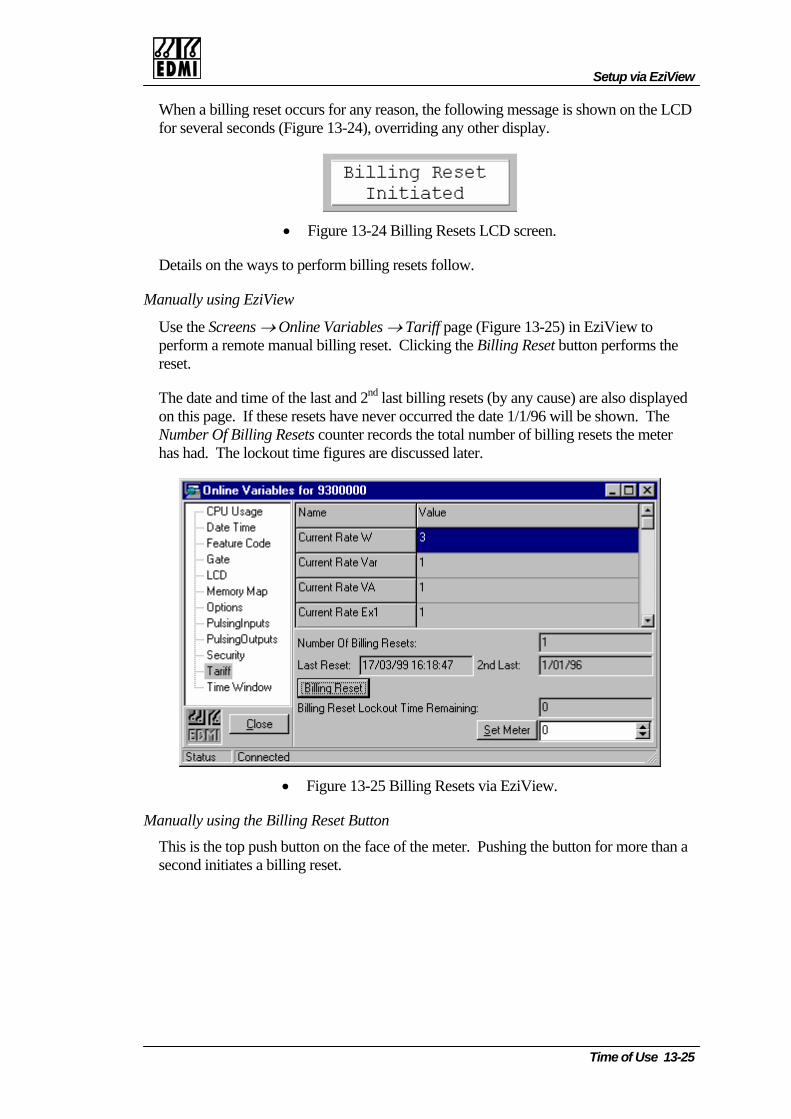
Setup via EziView
When a billing reset occurs for any reason, the following message is shown on the LCD for several seconds (Figure 13-24), overriding any other display.
• Figure 13-24 Billing Resets LCD screen.
Details on the ways to perform billing resets follow.
Manually using EziView
of the last and 2nd last billing resets (by any cause) are also displayed on this page. If these resets have never occurred the date 1/1/96 will be shown. The Number Of Billing Resets counter records th total number of billing resets the meter has had. The lockout t
Use the Screens → Online Variables → Tariff page (Figure 13-25) in EziView to perform a remote manual billing reset. Clicking the Billing Reset button performs the reset.
The date and time
eime figures are discussed later.
• Figure 13-25 Billing Resets via EziView.
Manually using the Bil Reset B
This is the top push on on th shing the button for more than a second initiates a billing reset.
ling utton
butt e face of the meter. Pu
Time of Use 13-25
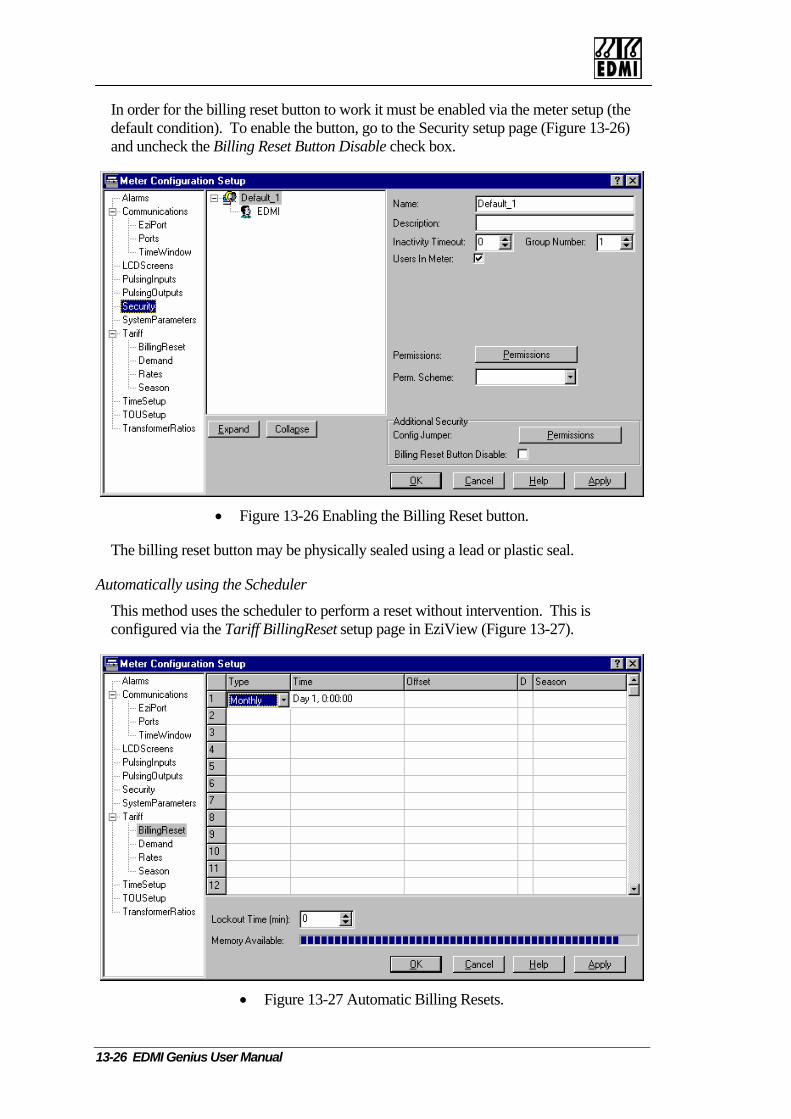
In order for the billing reset button to work it must be enabled via the meter setup (the default condition). To enable the button, go to the Security setup page (Figure 13-26) and uncheck the Billing Reset Button Disable check box.
• Figure 13-26 Enabling the Billing Reset button.
utton may be physically sealed using a lead or plastic seal.
Au
This method uses the scheduler to perform a reset without intervention. This is configured via the Tariff BillingReset setup page in EziView (Figure 13-27).
The billing reset b
tomatically using the Scheduler
• Figure 13-27 Automatic Billing Resets.
13-26 EDMI Genius User Manual

Setup via EziView
The most common type of entry used is the monthly. The configuration in Figure 13-2will perform a billing reset at the start of ev
7 ery month. The day and time of the billing
reset can be specified in the time field.
e billing reset must occur a certain number of days from the end of the month.
Offset field allows this start time (and thus all events afterward) to be shifted by a fixed amount.
of every month, and on the 1 of January”.
The daylight saving checkbox causes the event to be calculated on daylight saving time to
is period times occur
pecified season, allowing changing of billing reset times automatically during the year. As with other occurrences of this field, setting it to blank disables season control for the entry.
cause s of billing data. To reduce the risk of this the billing reset
lockout interval may be used. After a billing reset the meter will prevent any further
The lockout interval may be set on the Tariff BillingReset page in EziView (Figure minutes. A setting of zero disables this feature.
Reverse monthly events are useful in situations where th
The Offset field is used only for rate type events. This is used where a reset should occur every 60 days for example. The Time field gives the repeat rate, with the first event occurring 1/1/96. The
Any other event type may be used, but they are not usually. Multiple events may be specified, allowing scenarios such as “Perform a billing reset on the 15th day
st
instead of standard time. If this option is used, billing resets should not be scheduledoccur during the daylight saving change over period. During thtwice or not at all – affecting the occurrence of billing resets. If time is changed past the change-over period the meter will always trigger just one missed reset. Avoid these confusions by not programming resets during the daylight saving change-over periods (e.g. when 2am goes to 3am, or 3am goes to 2am).
The season field allows specific billing reset events to only occur in the s
Billing reset lockout
Accidentally performing more than one billing reset when reading the meter canproblems with the record
billing resets from occurring until the lockout interval has passed. Turning off or restarting the meter will abort the lockout interval.
13-27 above). The setting is in
The remaining lockout time may be seen on the Screens → Online Variables → Tariff page (Figure 13-25) in EziView.
Time of Use 13-27

Vi
ows different periods to be shown – see the page 13-5 for more information about how the periods
the screen allow the displayed period to be
ewing
The Screens → Time Of Use status screen (Figure 13-28) may be used to view the effects of a billing reset. The Period page allearlier section Billing Resets onroll over. The radio buttons at the top ofchanged.
• Figure 13-28 EziView TOU status screen, periods.
Periods before the most recent previous readings may be stored in a TOU history survey. See Chthis.
apter 19, Billing History Tool on page 19-5 for more information on
13-28 EDMI Genius User Manual
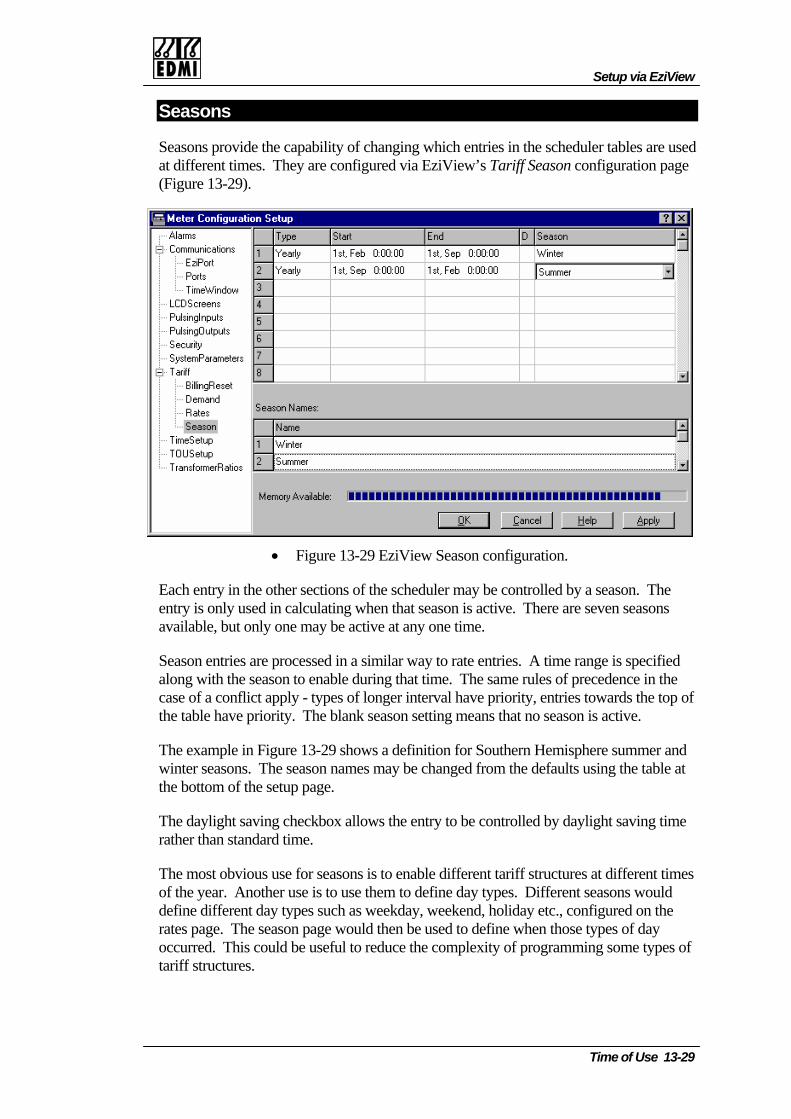
Setup via EziView
Seasons
Seasons provide the capability of changing which entries in the scheduler tables are used at different times. They are configured via EziView’s Tariff Season configuration page (Figure 13-29).
• Figure 13-29 EziView Season configuration.
Each entry in the other sections of the scheduler may be controlled by a season. The entry is only used in c lculatin season is active. There are seven seasona g when that s available, but only one may be active at any one time.
Season entries are pr nge is specified along with the season to enable during that time. The same rules of precedence in the
- types of longer interval have priority, entries towards the top of the table have priority. The blank season setting means that no season is active.
nd asons. The season names may be changed from the defaults using the table at
the bottom of the setup page.
ws the entry to be controlled by daylight saving time
different times of the year. Another use is to use them to define day types. Different seasons would
s weekday, weekend, holiday etc., configured on the used to define when those types of day
ocessed in a similar way to rate entries. A time ra
case of a conflict apply
The example in Figure 13-29 shows a definition for Southern Hemisphere summer awinter se
The daylight saving checkbox allorather than standard time.
The most obvious use for seasons is to enable different tariff structures at
define different day types such arates page. The season page would then beoccurred. This could be useful to reduce the complexity of programming some types of tariff structures.
Time of Use 13-29
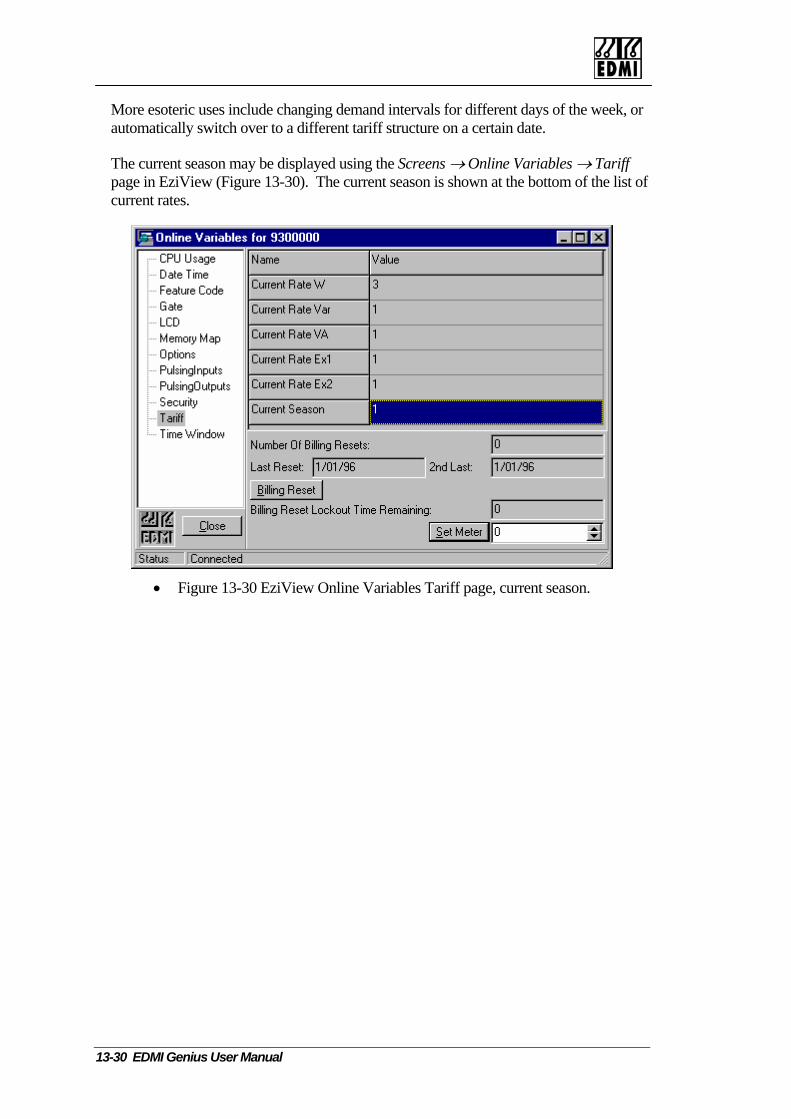
More esoteric uses includeautomatically switch over to a differen
changing demand intervals for different days of the week, or t tariff structure on a certain date.
The current season may be displayed using the Screens → Online Variables → Tariffpage in EziView (Figure 13-30). The current season is shown at the bottom of the list of current rates.
• Figure 13-30 EziView Online Variables Tariff page, current season.
13-30 EDMI Genius User Manual
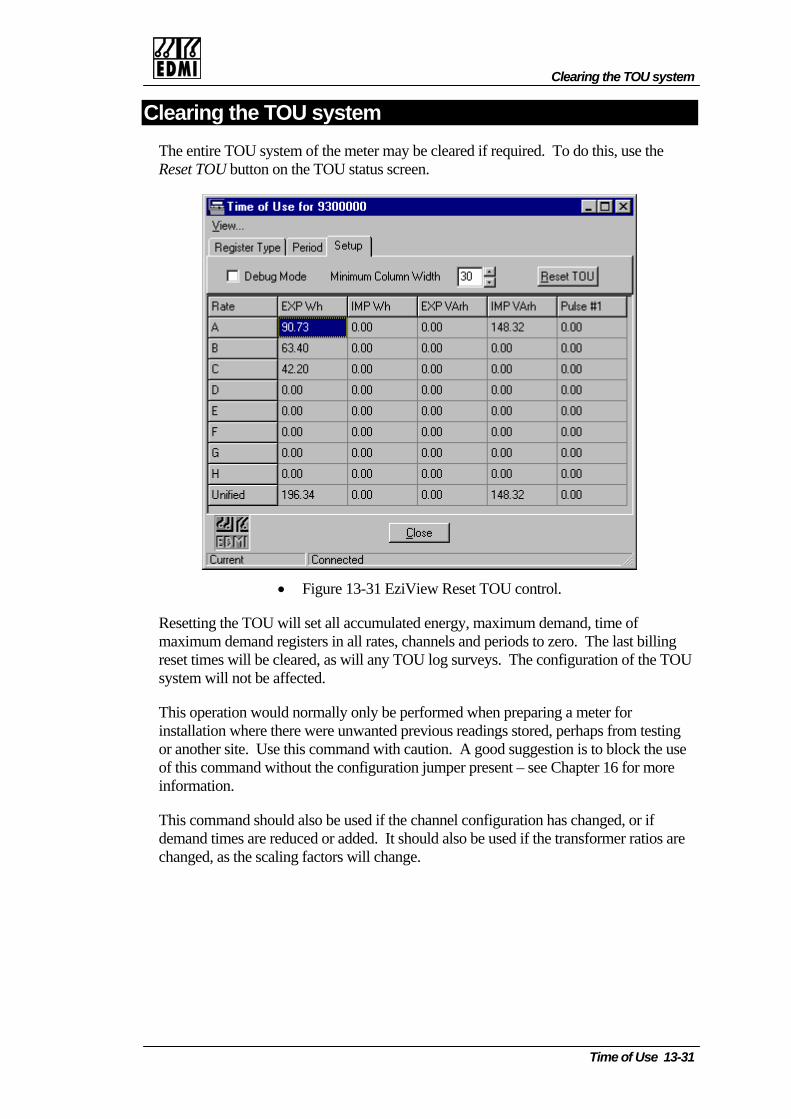
Clearing the TOU system
Clearing the TOU system he entire TOU system of the meter may be cleared if required. To do this, use the eset TOU button on the TOU status screen.
TR
• Figure 13-31 EziView Reset TOU control.
Resetting the TOU will set all accumulated energy, maximum demand, time of maximum demand registers in al riods to zero. The last billing
eared, as will any TOU log surveys. The configuration of the TOU stem will not be affected.
his operation would normally only be performed when preparing a meter for stallation where there were unwanted previous readings stored, perhaps from testing
r another site. Use this command with caution. A good suggestion is to block the use f this command without the configuration jumper present – see Chapter 16 for more
ormation.
his command should also be used if the channel configuration has changed, or if emand times are reduced or added. It should also be used if the transformer ratios are
ed, as the scaling factors will change.
l rates, channels and pereset times will be clsy
Tinooinf
Tdchang
Time of Use 13-31

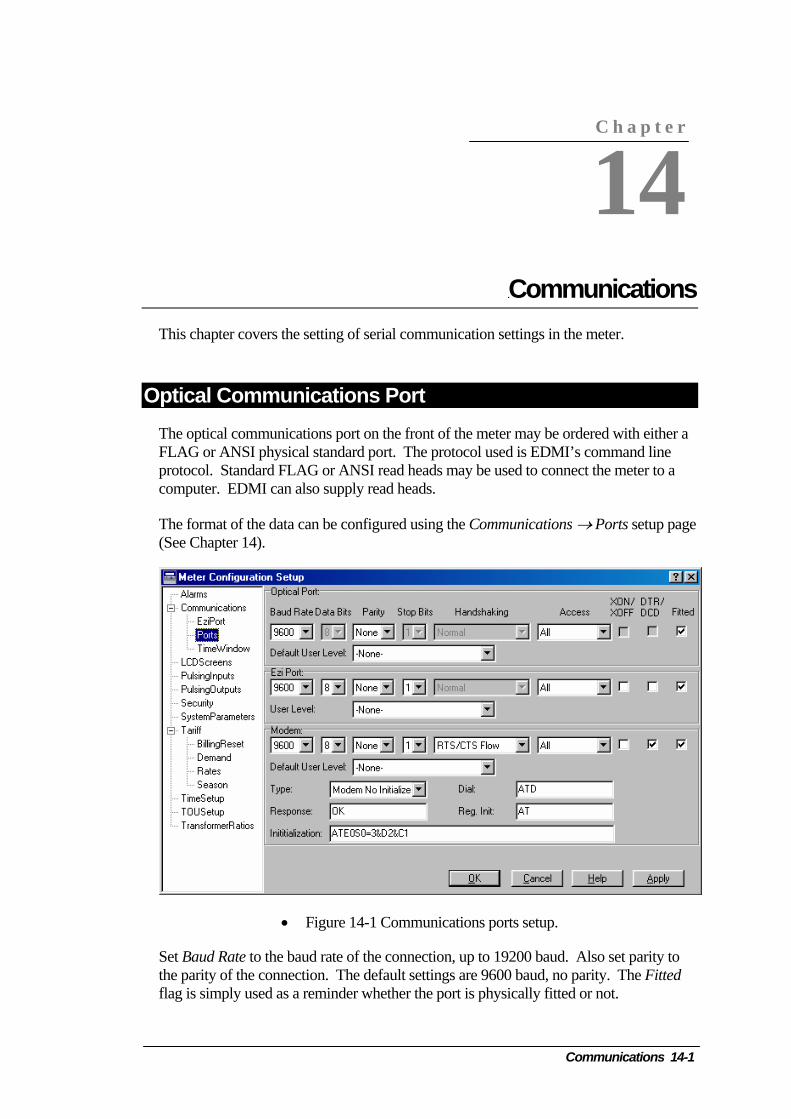
Chapter 14 CommuThis chapter covers the setting of serial communication settings in the
O
or ANSI physical standard port. The protocol used is EDMI’s cprotocol. Standard FLAG or ANSI read heads may be used to connect
The format of the data can be configured using the Communications →
ptical Communications Port The optical communications port on the front of the meter may be ordeFLAG
computer. EDMI can also supply read heads.
(See Chapter 14).
• Figure 14-1 Communications ports setup.
Set Baud Rate to the baud rate of the connection, up to 19200 baud. Athe parity of the connection. The default settings are 9600 baud, no paflag is simply used as a reminder whether the port is physically fitted o
Com
C h a p t e r
14
nicationsmeter.
ommand line the meter to a
Ports setup page
red with either a
lso set parity to rity. The Fitted r not.
munications 14-1
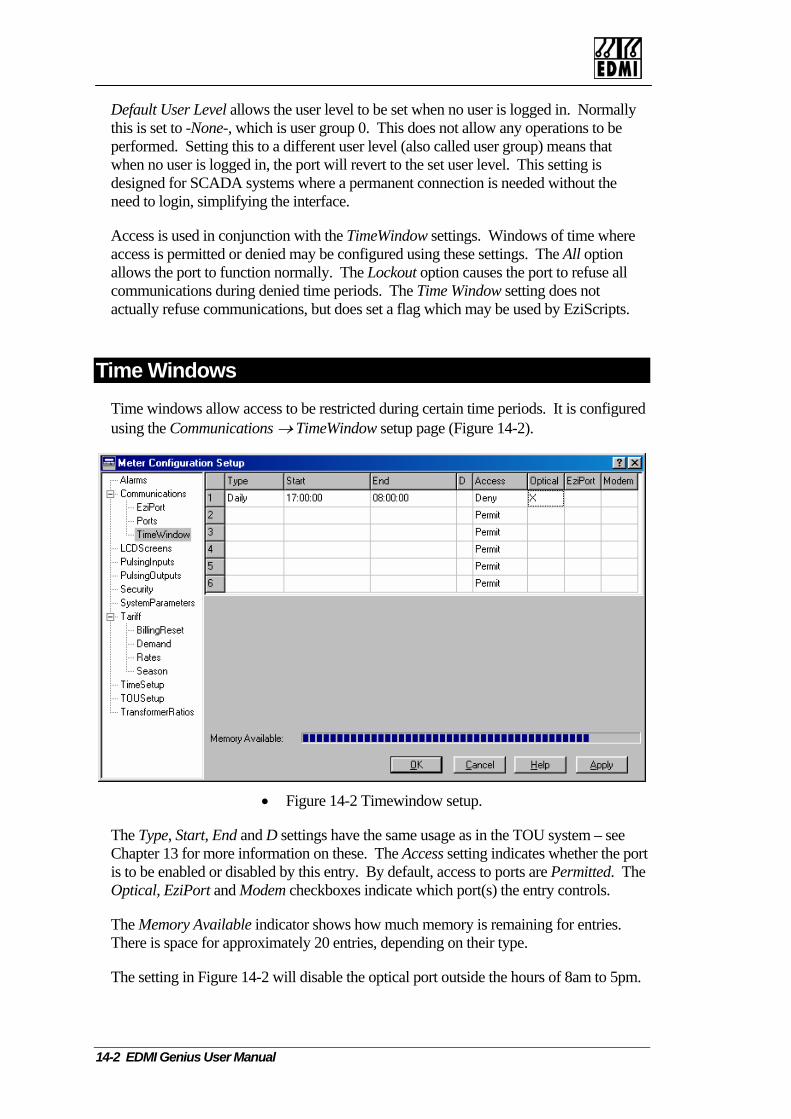
Default User Level allows the user level to be set when no user is logged in. Normally this is set to -None-, which is user group 0. This does not allow any operations to performed. Setting this to a different user level (also called user group) means that when no user is logged in, the port will revert to the set user level. This setting is designed for SCADA systems where a permanent connection is needed withoutneed to login, simplifyin
be
the g the interface.
ications during denied time periods. The Time Window setting does not actually refuse communications, but does set a flag which may be used by EziScripts.
Access is used in conjunction with the TimeWindow settings. Windows of time where access is permitted or denied may be configured using these settings. The All option allows the port to function normally. The Lockout option causes the port to refuse all commun
Time Windows Time windows allow access to be restricted during certain time periods. It is configured using the Communications → TimeWindow setup page (Figure 14-2).
• Figure 14-2 Timewindow setup.
e usage as in the TOU system – see port
ess to ports are Permitted. The Optical, EziPort and Modem checkboxes indicate which port(s) the entry controls.
of 8am to 5pm.
The Type, Start, End and D settings have the samChapter 13 for more information on these. The Access setting indicates whether theis to be enabled or disabled by this entry. By default, acc
The Memory Available indicator shows how much memory is remaining for entries. There is space for approximately 20 entries, depending on their type.
The setting in Figure 14-2 will disable the optical port outside the hours
14-2 EDMI Genius User Manual
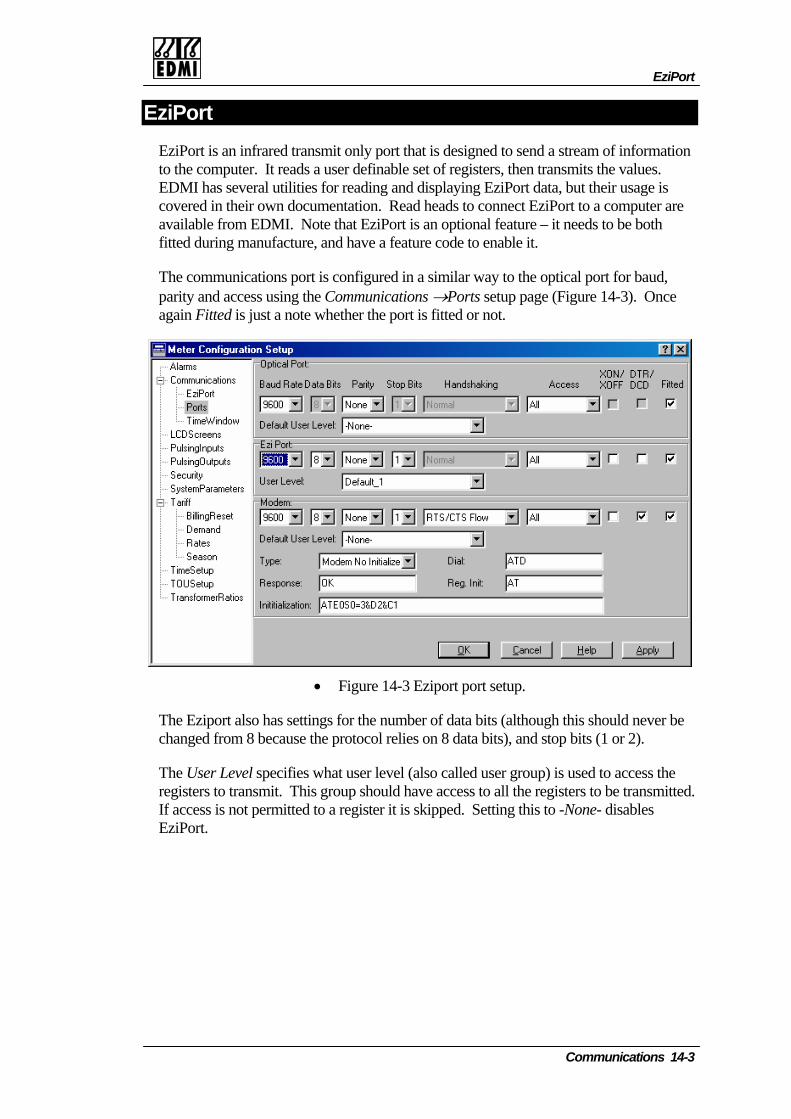
EziPort
Eation
re th
anufacture, and have a feature code to enable it.
ziPort EziPort is an infrared transmit only port that is designed to send a stream of informto the computer. It reads a user definable set of registers, then transmits the values. EDMI has several utilities for reading and displaying EziPort data, but their usage is covered in their own documentation. Read heads to connect EziPort to a computer aavailable from EDMI. Note that EziPort is an optional feature – it needs to be bofitted during m
The communications port is configured in a similar way to the optical port for baud, parity and access using the Communications →Ports setup page (Figure 14-3). Once again Fitted is just a note whether the port is fitted or not.
• Figure 14-3 Eziport port setup.
The Eziport also has settings for the number of data bits (although this should never be changed from 8 because the protocol relies on 8 data bits), and stop bits (1 or 2).
The User Level specifies what user level (also called user group) is used to access thregisters to transm
e it. This group should have access to all the registers to be transmitted.
If access is not permitted to a register it is skipped. Setting this to -None- disables EziPort.
Communications 14-3
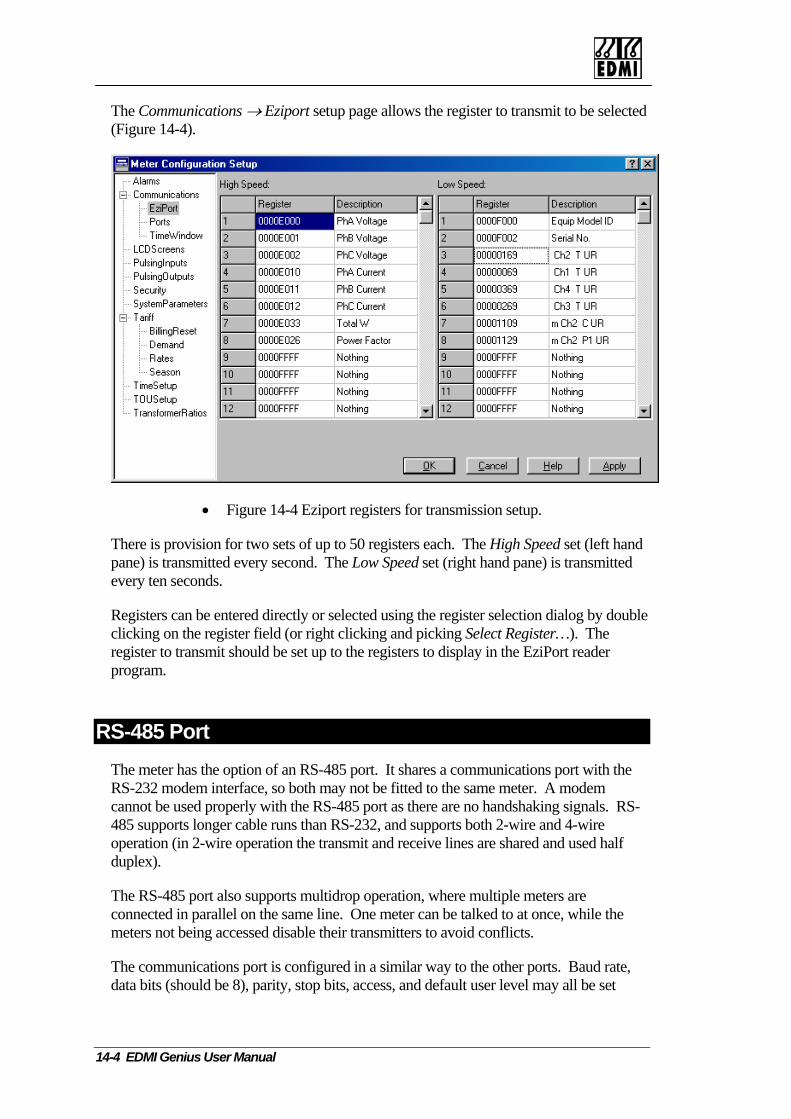
The Communications →(Figure 14-4).
Eziport setup page allows the register to transmit to be selected
• Figure 14-4 Eziport registers for transmission setup.
There is provision for two sets of up to 50 registers each. The High Speed set (left hand pane) is transmitted every second. The Low Speed set (right hand pane) is transmitted every ten seconds.
Registers can be entered directly or selected using the register selection dialog by double clicking on the regi gister…). The
set up to the registers to display in the EziPort reader ster field (or right clicking and picking Select Re
register to transmit should beprogram.
Re
are no handshaking signals. RS-
set
S-485 Port The meter has the option of an RS-485 port. It shares a communications port with thRS-232 modem interface, so both may not be fitted to the same meter. A modemcannot be used properly with the RS-485 port as there 485 supports longer cable runs than RS-232, and supports both 2-wire and 4-wire operation (in 2-wire operation the transmit and receive lines are shared and used halfduplex).
The RS-485 port also supports multidrop operation, where multiple meters are connected in parallel on the same line. One meter can be talked to at once, while the meters not being accessed disable their transmitters to avoid conflicts.
The communications port is configured in a similar way to the other ports. Baud rate, data bits (should be 8), parity, stop bits, access, and default user level may all be
14-4 EDMI Genius User Manual

Modems
using the modem section of the Communications → Ports setup page (Figure 14-5). Once again Fitted is just a note whether the port is fitted or not.
• Figure 14-5 RS-485 communications setup.
The bottom three rows of modem setup may be ignored, except that Type should be set
Active or Transmit Enable.
with EziView on a 2- the converter needs to detect a transmission from the computer and enable
itter.
to No Modem. DTR/DCD should be turned off as the lines are not available on the port. XON/XOFF flow control may be enabled if required.
The Handshaking setting should be set to either RTS AlwaysRTS Always Active will enable the transmitter all the time, so should not be used in multidrop situations. Transmit Enable will enable the transmitter only when transmitting a response to a request. This is the mode that should be used in most situations including multidrop.
The connections for the RS-485 port are covered in Chapter 2. A converter is needed when connecting RS-485 to an RS-232 port. For proper operationwire systemits transm
M maximum flexibility in modem
m with the meter.
odems Modem operation is controlled by an EziScript to allowsupport. See Chapter 21 for information on using a mode
Communications 14-5

Intentionally Blank
14-6 EDMI Genius User Manual
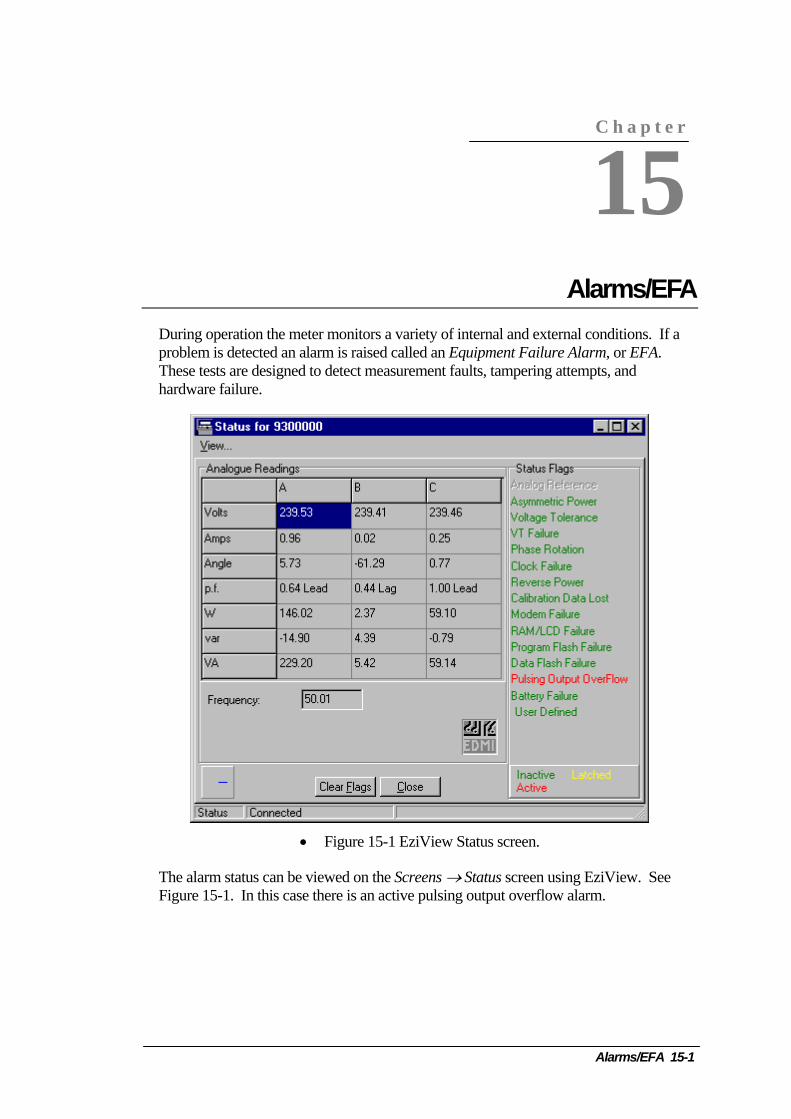
Chapter 15 AlDuring operation the meter monitors a variety of internal and external cproblem is detected an alarm is raised called an Equipment Failure AlaThese tests are designed to detect measurement faults, tampering attemhardware failure.
• Figure 15-1 EziView Status screen.
The alarm status can be v n using EFigure 15-1. In this case there is an active pulsing output overflow alar
iewed on the Screens → Status scree
C h a p t e r
15
arms/EFA onditions. If arm, or EFA. pts, andziView. See m.
Alarms/EFA 15-1

Aach alarm has
a corresponding flag letter that represents it, listed in Table 15-1.
Lett
larm States There are 14 different alarms, each representing a different type of fault. E
Flag er Alarm Name S Asymmetric Power. V Voltage Tolerance Error. F VT Failure. R Incorrect Phase Rotation. C Clock Failure. M Reverse Power. L Calibration Data Lost. H Modem Failure. X RAM Failure or LCD Failure. Y Program Flash Failure. Z Data Flash Failure. N Pulsing Output Overflow. D Battery Failure U User Defined. • Table 15-1 Alarm names and flag letters.
An alarm flag can have one of 3 states. The active state means that the alarm has been detected and is still occurring. The latched state means that the alarm was active but isn’t now. The inactive state means that the alarm is not active and has not been in the
m the meter. They may be
enerated if any alarms are active. The letters “EFA” are displayed on the the Chapter 2 section Default Display on lay). If there are latched alarms, but no
ags in space restricted places such as the LCD a string format is used. The alarm status is displayed as a string of 16 characters, with each alarm’s flag letter used to indicate an alarm. An inactive alarm resented by a full stop. A masked flag is represen b r case. All flags active looks like “.SVFR.CMLHXYZNDU”. The two full stops represent two unused
past.
Latched alarms stay latched even if power is removed frocleared using the Clear Flags button on the Screens → Status screen in EziView.
An EFA is gdefault LCD screen at the bottom left (Seepage 2-14 for more information on the dispactive alarms, the letters “efa” are displayed to indicate the fault is no longer active. Alarms may be set to a flashing mode, where if active they will flash the “EFA” sign. This could be used for serious alarms or indicating certain types of tamper.
Alarms that should not cause an EFA may be disabled. Each alarm has a mask that when set stops it from causing an EFA.
For displaying fl
is repted y lower case. An active flag is represented by uppe
alarm positions. The letters always appear in the same locations.
15-2 EDMI Genius User Manual
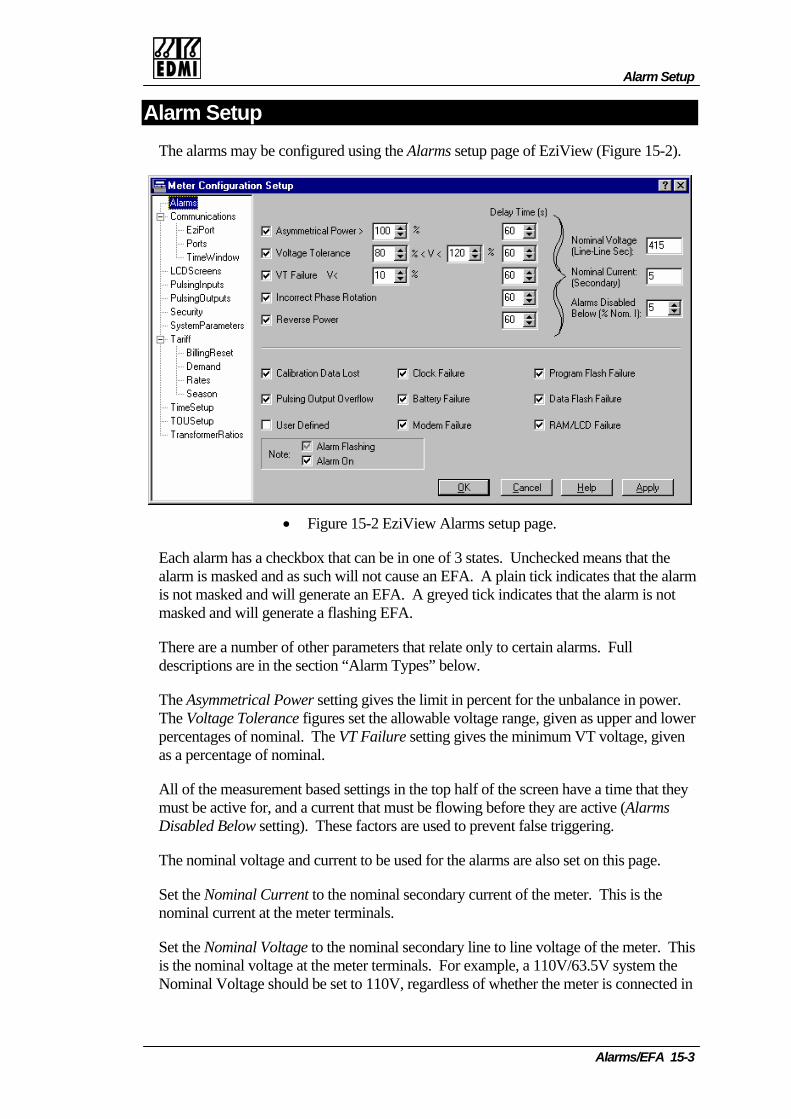
Alarm Setup
Alarm Setup The alarms may be configured using the Alarms setup page of EziView (Figure 15-2).
• Figure 15-2 EziView Alarms setup page.
Each alarm has a checkbox that can be in one of 3 states. Unchecked means that the alarm is masked and as such will not cause an EFA. A plain tick indicates that the alarmis not masked and will generate an EFA. A greyed tick indicates that the alarm is not masked and will generate a flashing EFA.
ed settings in the top half of the screen have a time that they
r. This is the nominal current at the meter terminals.
y line to line voltage of the meter. This is the nominal voltage at the meter terminals. For example, a 110V/63.5V system the Nominal Voltage should be set to 110V, regardless of whether the meter is connected in
There are a number of other parameters that relate only to certain alarms. Full descriptions are in the section “Alarm Types” below.
The Asymmetrical Power setting gives the limit in percent for the unbalance in power. The Voltage Tolerance figures set the allowable voltage range, given as upper and lowerpercentages of nominal. The VT Failure setting gives the minimum VT voltage, given as a percentage of nominal.
All of the measurement basmust be active for, and a current that must be flowing before they are active (Alarms Disabled Below setting). These factors are used to prevent false triggering.
The nominal voltage and current to be used for the alarms are also set on this page.
Set the Nominal Current to the nominal secondary current of the mete
Set the Nominal Voltage to the nominal secondar
Alarms/EFA 15-3

2 Element or in 3 Elemevoltage – the meter adju
nt mode. The voltage is always specified as a line to line sts it automatically based on the element mode.
Alarm Types list of all possible alarm conditions is provided below, followed by a detailed escription of each test.
ote that where a programmed delay time is specified, this means that the fault must exist continuously for the set time before an alarm will be raised. Meter reset/loss of power will restart the timers.
Ad
N
Calibration Data Lost.
This is a check for valid calibration data in the meter. If a reference value has its default value of 0, then the calibration data has been initialised and a ‘Calibration Data Lost’ alarm will be raised. This will occur if a unit has never been calibrated, or if a major fault causes both the non-volatile RAM and FLASH to be corrupted.
Asymmetric Power.
Power Symmetry (Pu) is defined as the amount of unbalance between the individual phase powers. The calculation of this figure depends on the measurement configuration (2 or 3-element) as detailed below. This test is not performed if all of the input currents are below the minimum current threshold, Imin.
If the value Pu is greater than or equal to the set limit, then a power symmetry error is considered to be present. Unbalance must exceed the bounds for a programmed time (default 1 minute) before an alarm is raised.
For 3 Element configuration :
The calculation of power unbalance (Pu) is based on the maximum and minimum power levels from the three phases (Pmax and Pmin):
Puabs P P
abs P=
−( max min)( max)
For 2 Element configuration :
The voltages must be in tolerance, and:
Puabs I I
I IA C
A C=
−+
( )
( )2
15-4 EDMI Genius User Manual
Alarm Types
Voltage Tolerance Error.
he voltage input levels on each phase are tested to ensure that they remain within the its set by Vmax and Vmin. Only those phases with at least Imin current are tested.
max and Vmin are specified as a percentage of the nominal voltage, Vn. For 3-lement measurements, Vn = line to line nominal / √3, for 2-element measurements, Vn line to line nominal. In 2-element mode, only inputs Va and Vc are tested. A rogrammed time delay (default 1 minute) is applied to this test.
TlimVe=p
VT Failure.
VT failure is indicated if the voltage measured by any input is less than Vfail and the corresponding current input is at least Imin. Phase B is not tested in 2-element mode. A rogrammed time delay (default 1 minute) is applied to this test.
A
p
Reverse Power.
reverse power alarm is indicated if power is negative on any phase (provided the phase is carrying current and the voltage is within tolerance). In 2-element mode this
st is applied to the total power. A programmed time delay (default 1 minute) is
A
teapplied to this test.
Incorrect Phase Rotation.
The phase rotation of the applied sure that the correct phase rotation is maintained. The method of determining the phase rotation is dependent upon the measurement configuration. For both methods, the test is applied only if all of the currents are greater than the minimum current level (Imin) and all of the voltages are between the limits of Vmin and Vmax. A programmed time delay (default 1 minute) is applied to this test. (An error condition must be present for more than the programmed time delay (default 1 minute) before the alarm is activated.)
2-Element - For 2-element measurements, the angle between the two applied voltages (Vab to Vcb) must be between +30 and +90 degrees, while the angle between the two applied currents (Ia-Ic) must be between +60 and +180 degrees.
3-Element - For 3-element measurements, the angles between each successive voltage input (Vab, Vbc, Vca) must be between -90 and -150 degrees, while the angle between each successive current input (Iab, Ibc, Ica) must be between -60 and -180 degrees.
signals is tested to en
Clock Failure.
The clock test consists of a simple check to determine that the real time clock (RTC) is running. It also checks that the RTC is operating at approximately the correct rate. If a clock is running significantly fast or slow, the event log will show a large number of “System Time Synchronised” events. It may also be caused if the time in the RTC was found to be invalid during start-up. In this case the time will be set to the turn-off time if available. The appearance of inactive clock failure alarms after power up may indicate that the reserve battery is almost exhausted. During operation the RTC time is compared against the system clock to check for a failed oscillator.
Alarms/EFA 15-5
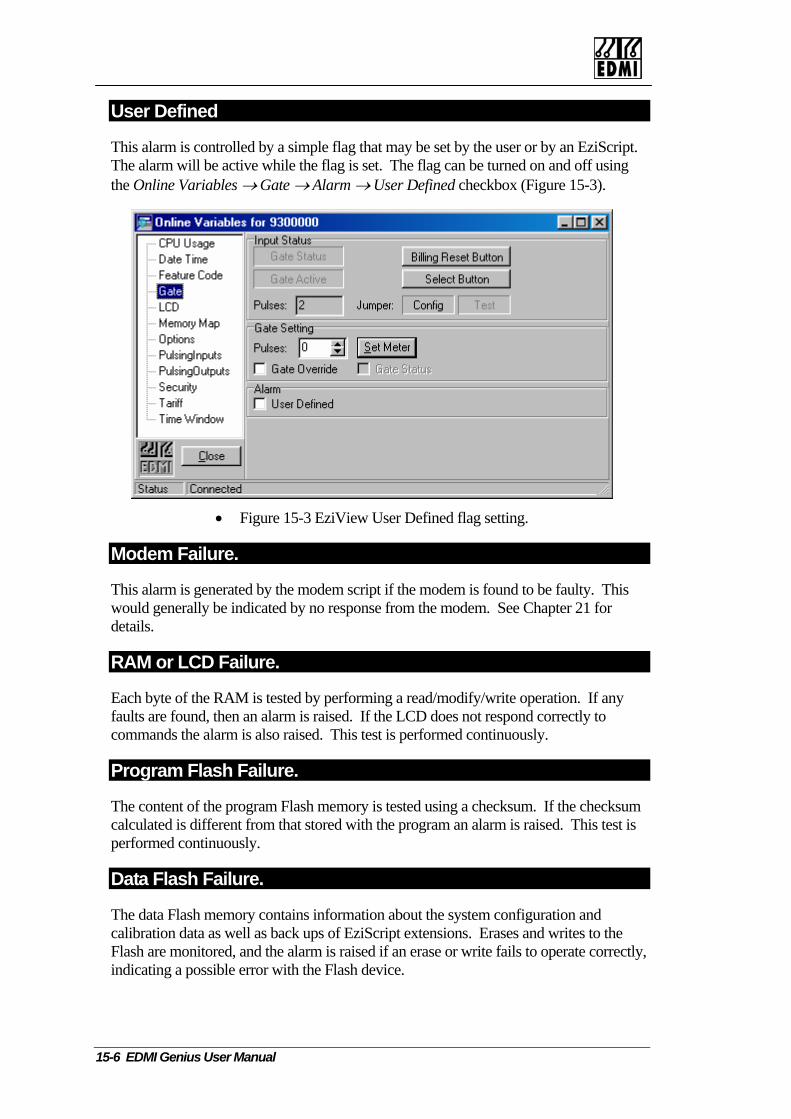
User Defined
This alarm is controlled by a simple flag that may be set by the user or by an EziScript. The alarm will be active while the flag is set. The flag can be turned on and off using the Online Variables → Gate → Alarm → User Defined checkbox (Figure 15-3).
• Figure 15-3 EziView User Defined flag setting.
Modem Failure.
This alarm is generated by the modem script if the modem is found to be faulty. This would generally be indicated by no response from the modem. See Chapter 21 for details.
RAM or LCD Failure.
Each byte of the RAM is tested by performing a read/modify/write operation. If any faults are found, then an alarm is raised. If the LCD does not respond correctly to commands the alarm is also raised. This test is performed continuously.
Program Flash Failure.
The content of the program Flash memory is tested using a checksum. If the checksum calculated is different from that stored with the program an alarm is raised. This test is performed continuously.
Data Flash Failure.
The data Flash memory contains information about the system configuration and calibration data as well as back ups of EziScript extensions. Erases and writes to the Flash are monitored, and the alarm is raised if an erase or write fails to operate correctly, indicating a possible error with the Flash device.
15-6 EDMI Genius User Manual

Alarm Types
Pulsing Output Overflow.
A pulsing output overflow alarm is generated if the rate of pulses to be output is such that the off time between pulses violates the specified minimum off time for the output. The pulses will still be output, but the off time will be less than the specified minimum, and in extreme overflows the off time will be zero, resulting in a permanently on output. This alarm provides a warning that the settings for the pulsing outputs may need to be changed.
Battery Failure.
Tested at power up, this flag is set if the backup battery is low/non existent. It is only sted when the meter is powered up, not when simply reset. When simply reset (e.g.
via the Restart Meter option) the meter will always indicate that the battery is ok.
te
Alarms/EFA 15-7

Intentionally Blank
15-8 EDMI Genius User Manual
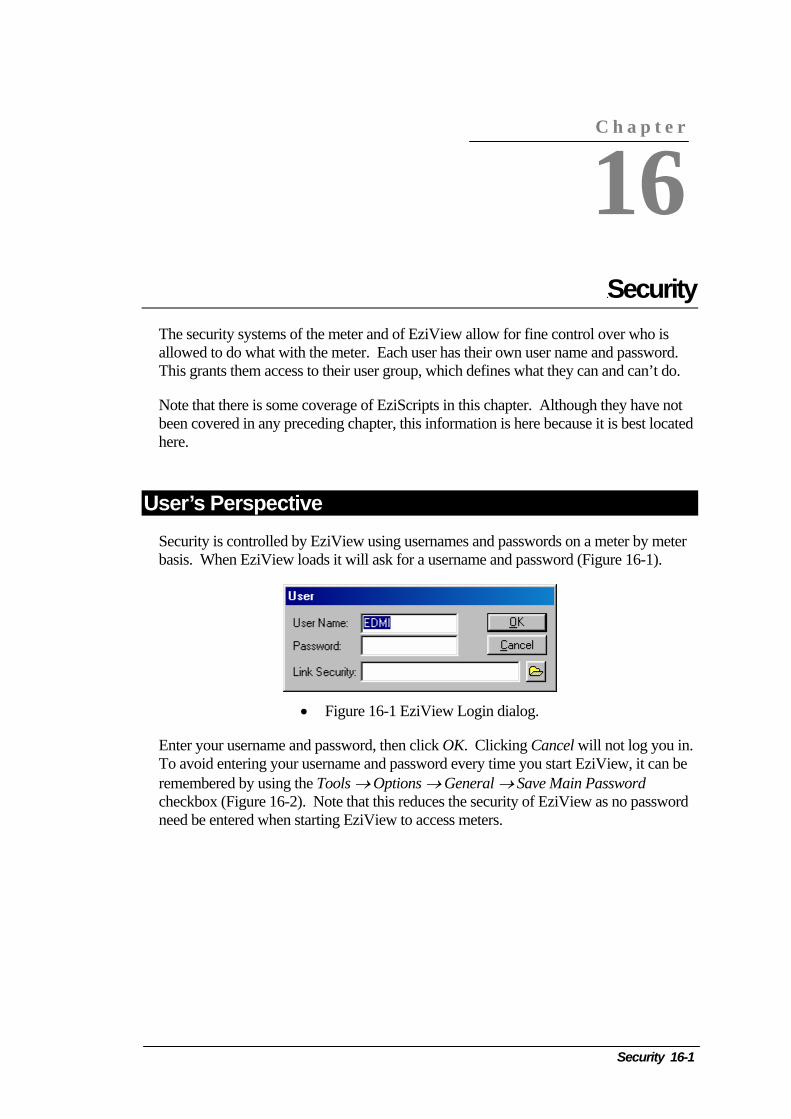
The security systems of the meter and of EziView allow for fine controallowed to do what with the meter. Each user has their own user nameThis grants them access to their user group, which defines what they ca
Note that there is some coverage of EziScripts in this chapter. Althoug
herebeen covered in any preceding chapter, this information is here because
.
Use ective r’s PerspSecurity is controlled by EziView using usernames and passwords on abasis. When EziView loads it will ask for a username and password (F
• Figure 16-1 EziView Login dialog.
Enter your username and password, then click OK. Clicking Cancel wTo avoid entering your username and password every time you start Ez
ecurity of EziViewneed be entered when starting EziView to access meters.
remembered by using the Tools → Options → General → Save Main checkbox (Figure 16-2). Note that this reduces the s
C h a p t e r
16
Chapter 16 Securityl over w and passn and can’t do.
ho is word.
h they have not it is best located
meter meter byigure 16-1).
ill not log you in. iView, it can be
as no password Password
Security 16-1
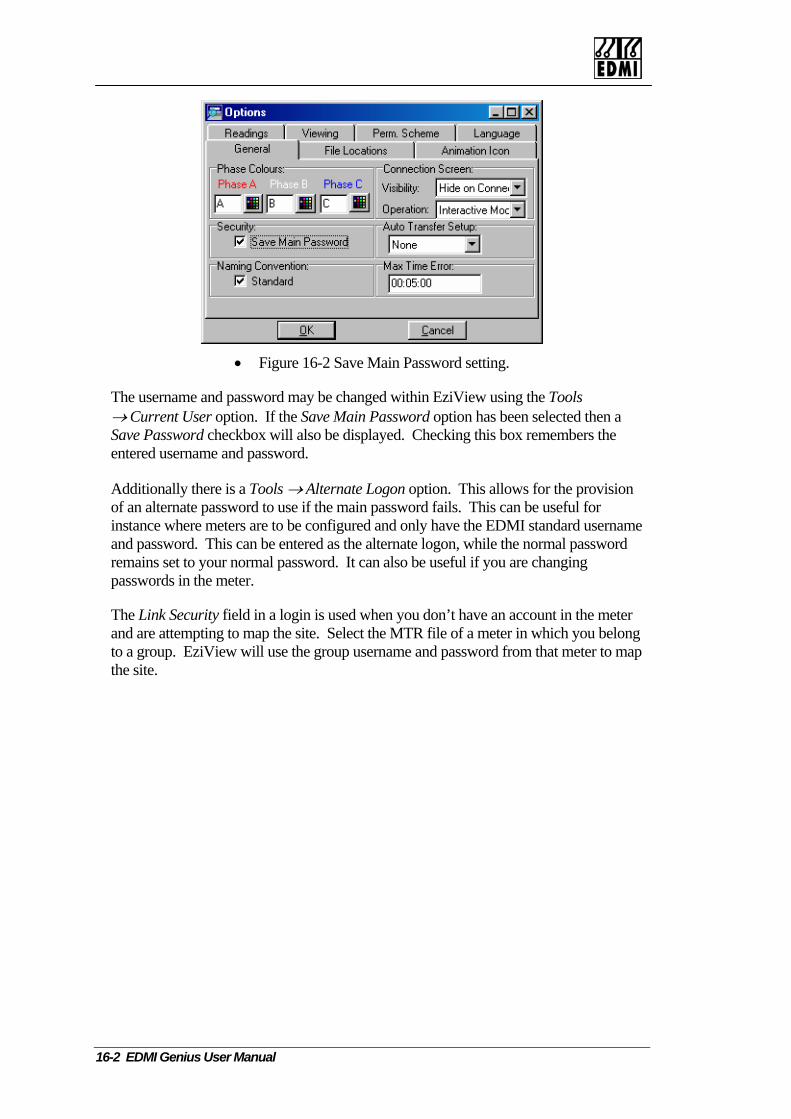
• Figure 16-2 Save Main Password setting.
The username and password may be changed within EziView using the Tools → Current User option. If the Save Main Password option has been selected then a Save Password checkbox will also be displayed. Checking this box remembers the entered username
igured and only have the EDMI standard username and password. This can be entered as the alternate logon, while the normal password
n the meter.
u belong p
and password.
Additionally there is a Tools → Alternate Logon option. This allows for the provision of an alternate password to use if the main password fails. This can be useful for instance where meters are to be conf
remains set to your normal password. It can also be useful if you are changing passwords i
The Link Security field in a login is used when you don’t have an account in the meter and are attempting to map the site. Select the MTR file of a meter in which yoto a group. EziView will use the group username and password from that meter to mathe site.
16-2 EDMI Genius User Manual
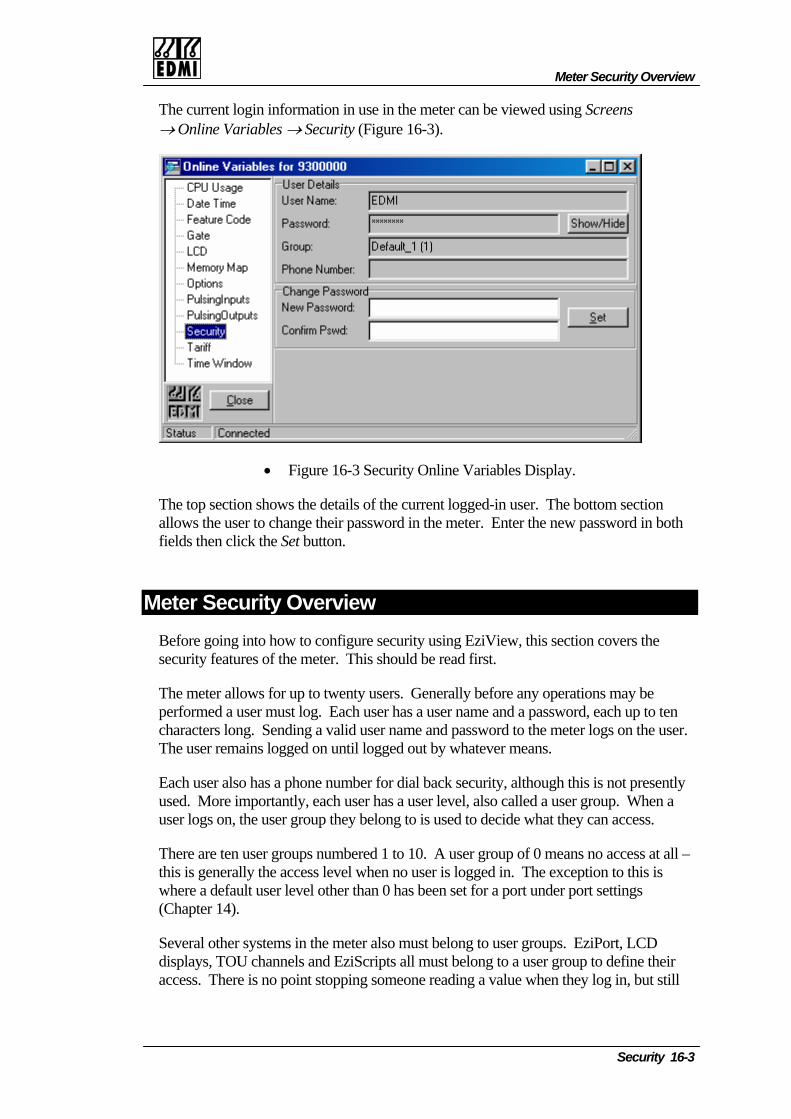
Meter Security Overview
The current login information in use in the meter can be viewed using Screens → Online Variables → Security (Figure 16-3).
• Figure 16-3 Security Online Variables Display.
The top section shows the details of the current logged-in user. The bottom section allows the user to change their password in the meter. Enter the new password in bothfields then click the Set button.
M
The meter allows for up to twenty users. Generally before any operations may be
until logged out by whatever means.
number for dial back security, although this is not presently used. More importantly, each user has a user level, also called a user group. When a
user groups numbered 1 to 10. A user group of 0 means no access at all – this is generally the access level when no user is logged in. The exception to this is
r systems in the meter also must belong to user groups. EziPort, LCD displays, TOU channels and EziScripts all must belong to a user group to define their access. There is no point stopping someone reading a value when they log in, but still
eter Security Overview Before going into how to configure security using EziView, this section covers the security features of the meter. This should be read first.
performed a user must log. Each user has a user name and a password, each up to ten characters long. Sending a valid user name and password to the meter logs on the user. The user remains logged on
Each user also has a phone
user logs on, the user group they belong to is used to decide what they can access.
There are ten
where a default user level other than 0 has been set for a port under port settings (Chapter 14).
Several othe
Security 16-3

allowing them to show the value on an LCD screen. Just like a logged-in user, thgroup controls what data they can access.
e
Each user group has an inactivity timeout setting. If a user makes no valid (checksum
More importantly, each user group has the permissions of the group. Every setting or
e
but does not have to be. However, setup settings used by EziView need read and write access to write a setting as it reads all settings to check if a change needs to be made.
In addition t onfiguration
ser set masks are applied to all operations. This allows hardware security to t be defeated without breaking two sets of seals on the meter. s for the config jumper requires the config jumper to be in the
a password o roup number 1, which is given full access. This user may and should be deleted after you have configured your own administrator user.
As described above, the internal security provisions of the meter are considerable. EziView uses these capabilities, and adds more of its own.
OK) communications in this period of time the user is logged out. It may be disabled bysetting to zero, useful for applications like SCADA.
value in the meter (every register) belongs to one of 256 security groups. For example, the settings for each pulsing output belong to separate security groups. The permission settings allow read and write access to be independently controlled to each of thessecurity groups.
This means that, for example, a user could be given access to read all pulsing output settings, but only to change some of them. Generally when write access is given, read access should also be given,
to his, there is an additional mask for writing controlled by the cjumper (also called the config jumper). This is located under the main meter cover, below the right hand end of the LCD (See The Config Jumper on page 2-7). When in the Config position the jumper has no effect on security. When in the Secure position additional ube applied that cannoChanging the settingconfig position.
By default, meters are usually shipped with a single user ‘EDMI’, which hasf ‘IMDEIMDE’. The user is in the user g
16-4 EDMI Genius User Manual
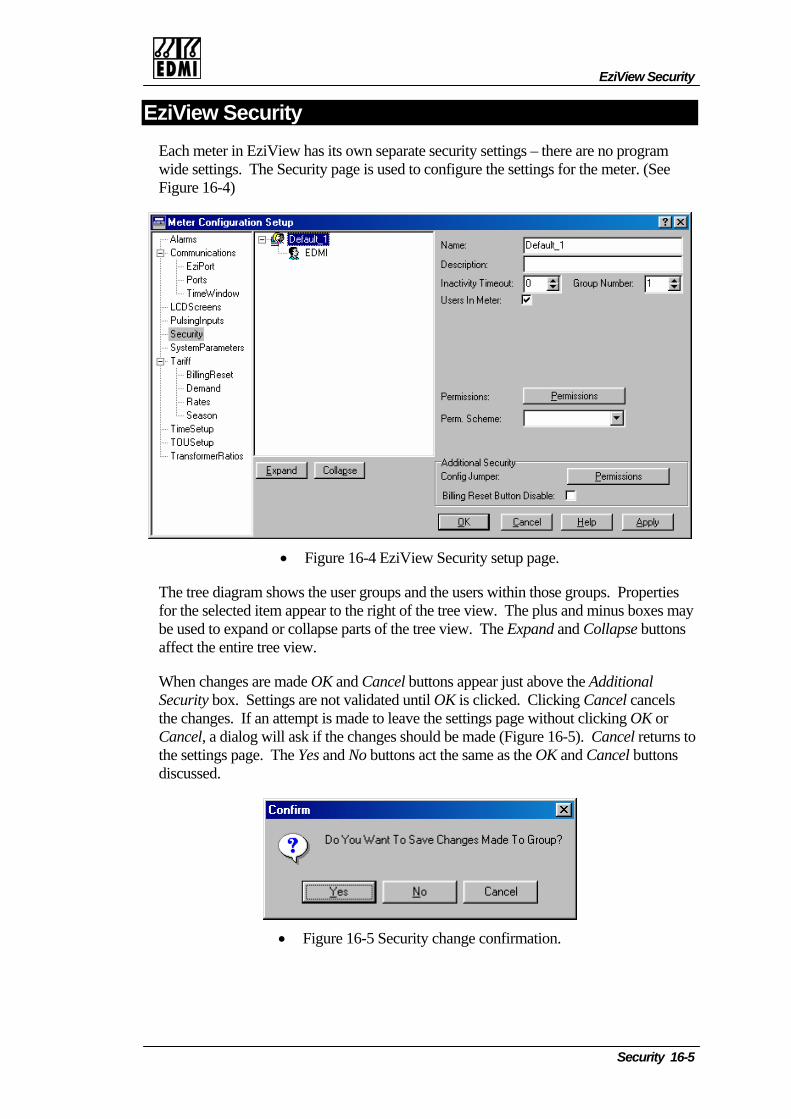
EziView Security
Etings – there are no program
ziView Security Each meter in EziView has its own separate security setwide settings. The Security page is used to configure the settings for the meter. (See Figure 16-4)
• Figure 16-4 EziView Security setup page.
The tree diagram shows the user groups and the users within those groups. Properties inus boxes may
be used to expand or collapse parts of the tree view. The Expand and Collapse buttons
When changes are made OK and Cancel buttons appear just above the Additional Security box. Settings are not validated until OK is clicked. Clicking Cancel cancels the ch or Cance turns to the settings page. The Yes and No buttons act the same as the OK and Cancel buttons discussed.
for the selected item appear to the right of the tree view. The plus and m
affect the entire tree view.
anges. If an attempt is made to leave the settings page without clicking OKl, a dialog will ask if the changes should be made (Figure 16-5). Cancel re
• Figure 16-5 Security change confirmation.
Security 16-5
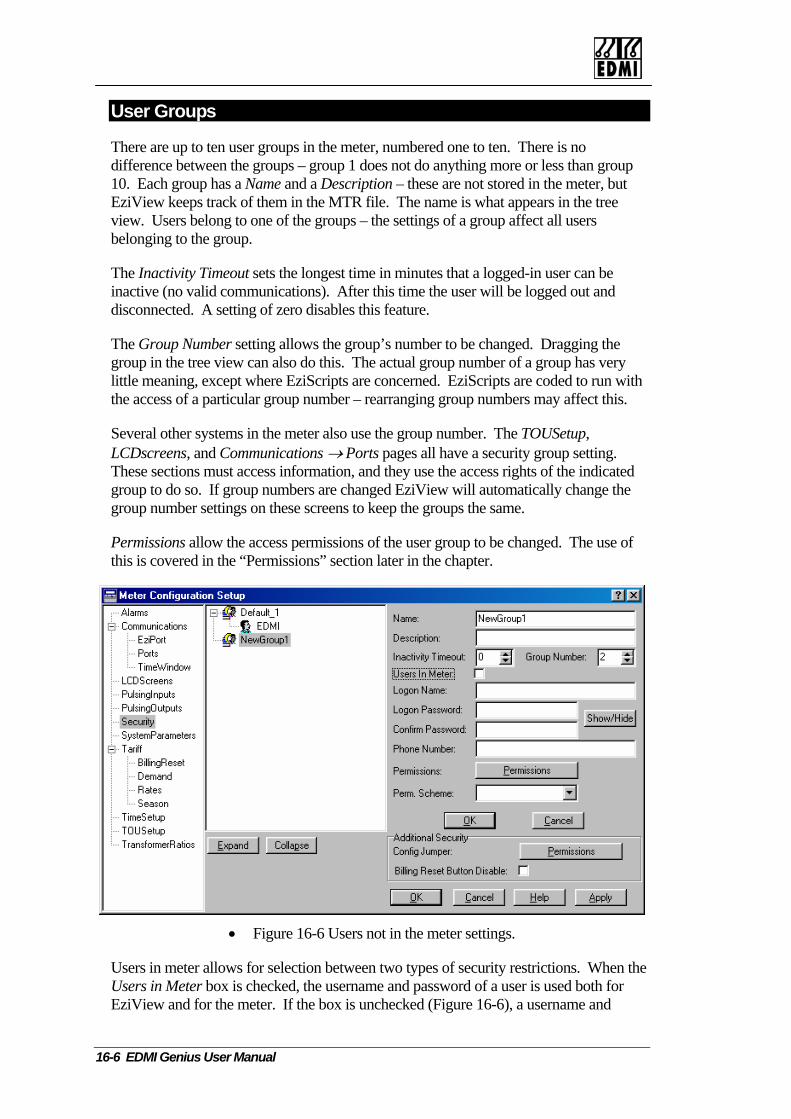
User Groups
There are up to ten user groups in the meter, numbered one to ten. There is no difference between the groups – group 1 does not do anything more or less than group 10. Each group hEziView keeps tr hem in the MTR file. The name is what appears in the tree view. Users belong to one of the groups – the settings of a group affect all users belonging to the
The Inactivity Tiinactive (no validdisconne ed. A
The Group Numbgroup in e tree ry little meaning, ex n with the access of a pa s.
Several other sys also use the group number. The TOUSetup, LCDscreens, an roup setting. These sections must access information, and they use the access rights of the indicated
issions” section later in the chapter.
as a Name and a Description – these are not stored in the meter, but ack of t
group.
meout sets the longest time in minutes that a logged-in user can be communications). After this time the user will be logged out and
setting of zero disables this feature. ct
er setting allows the group’s number to be changed. Dragging the view can also do this. The actual group number of a group has vethcept where EziScripts are concerned. EziScripts are coded to rurticular group number – rearranging group numbers may affect thi
tems in the meter d Communications → Ports pages all have a security g
group to do so. If group numbers are changed EziView will automatically change the group number settings on these screens to keep the groups the same.
Permissions allow the access permissions of the user group to be changed. The use of this is covered in the “Perm
• ttings.
U llow s. When the Users in Meter bo is used both for EziView and for th m username and
Figure 16-6 Users not in the meter se
sers in meter a s for selection between two types of securitys
restrictionx i checked, the username and password of a user e eter. If the box is unchecked (Figure 16-6), a
16-6 EDMI Genius User Manual
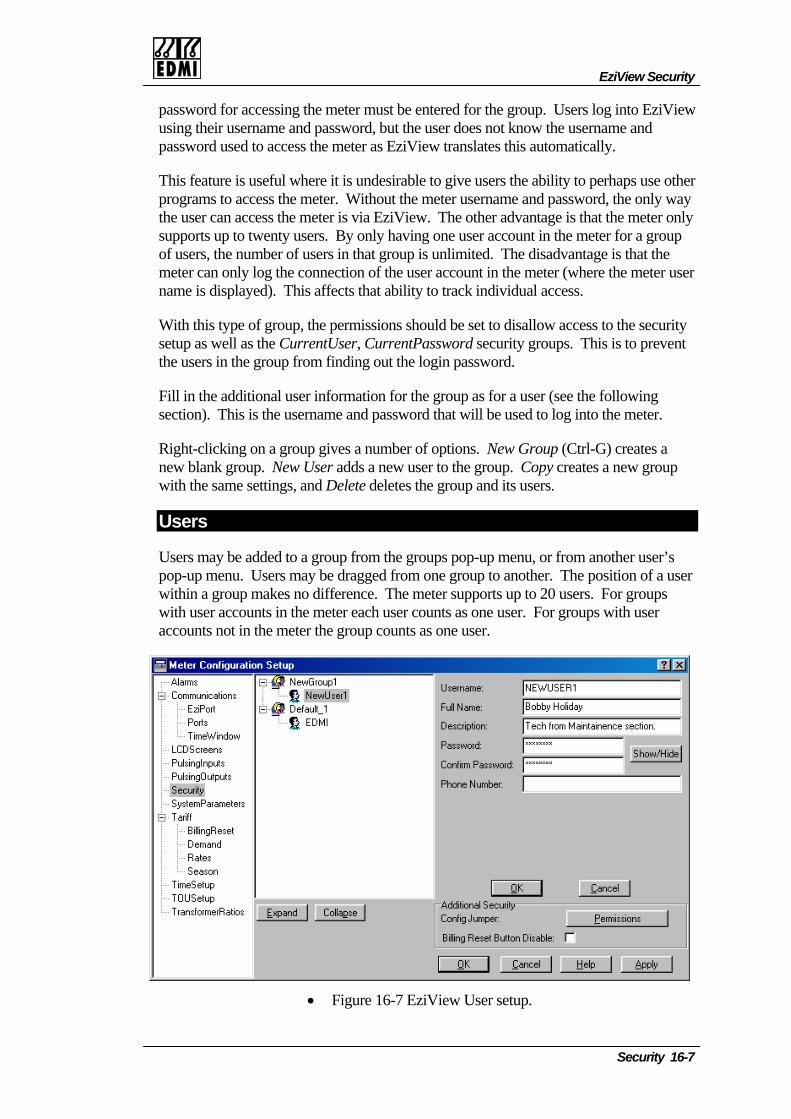
EziView Security
password for accessing the meter must be entered for the group. Users log into EziVusing th
iew eir username and password, but the user does not know the username and
password used to access the meter as EziView translates this automatically.
Th e ther pro way
s that the meter only meter for a group
ser s
Wit setuthe
Fillsect used to log into the meter.
new with
is f ature is useful where it is undesirable to give users the ability to perhaps use ograms to access the meter. Without the meter username and password, the only
the user can access the meter is via EziView. The other advantage isupports up to twenty users. By only having one user account in theof users, the number of users in that group is unlimited. The disadvantage is that the meter can only log the connection of the user account in the meter (where the meter uname is displayed). Thi affects that ability to track individual access.
h this type of group, the permissions should be set to disallow access to the securityp as well as the CurrentUser, CurrentPassword security groups. This is to prevent users in the group from finding out the login password.
in the additional user information for the group as for a user (see the following ion). This is the username and password that will be
Right-clicking on a group gives a number of options. New Group (Ctrl-G) creates a blank group. New User adds a new user to the group. Copy creates a new group the same settings, and Delete deletes the group and its users.
Users
Users may be added to a group from the groups pop-up menu, or from another user’s pop-up menu. Users may be dragged from one group to another. The position of a use
in a group makes no difference. The meter supports up to 20 users. For groups user accounts in the meter each user counts as one user. For groups with user
ounts not in the mete
r withwithacc r the group counts as one user.
• Figure 16-7 EziView User setup.
Security 16-7

Figure 16-7 shows the settings for a user. The Username may be up to 10 characters (A to Z and 0 to 9). The Full Name andlong Description fields are kept by EziView
(not the meter) and are for information only.
The intoEziView will not accept the new password. The password will usually be starred out.
h accounts in the meter only. It allows dial back curity when used with a modem EziScript capable of this. See the modems
chapter(Chapter 21).
e meter that has no
Password may be from 5 to 10 characters (A to Z and 0 to 9). Enter the password both the Password field and the Confirm Password field – they must match or
The Show/Hide button may be used to display the password text.
The Phone Number is used for users witse
EziView will try to protect you from writing a setup to thadministrator user. Care should be taken that there is always a user capable of chuser information.
anging
16-8 EDMI Genius User Manual
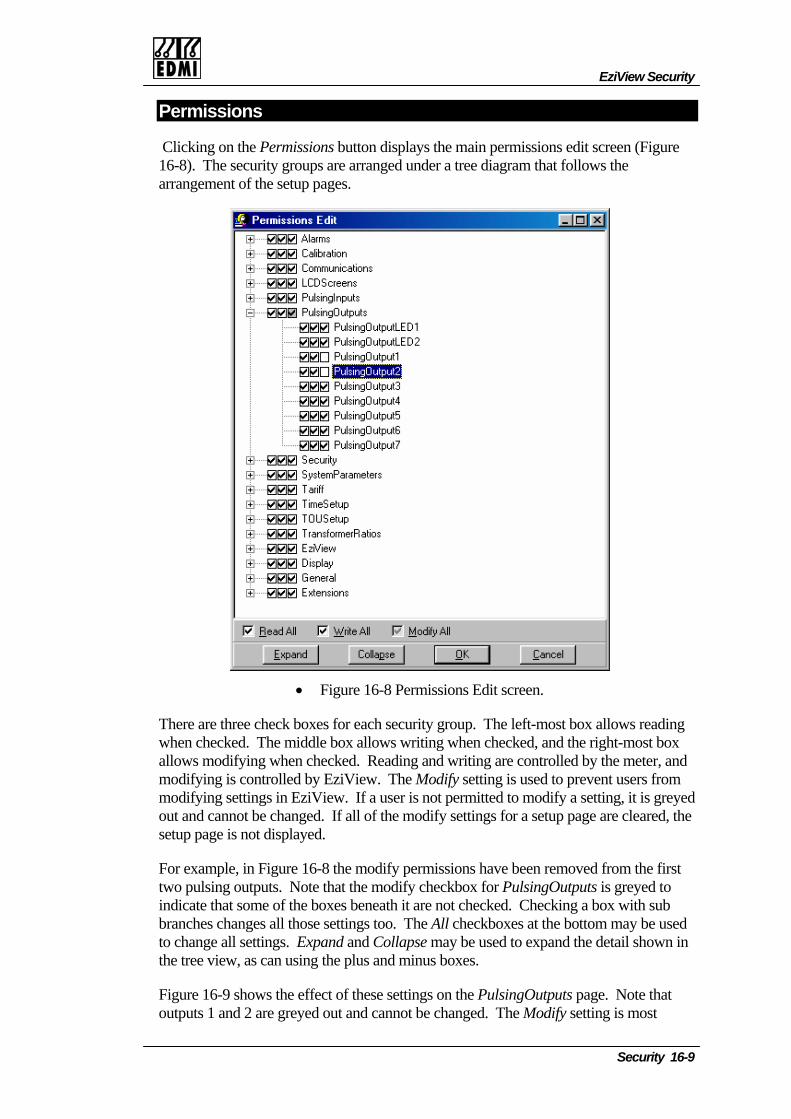
EziView Security
Permissions
Clicking on the Permissions button displays the main permissions edit screen (Figure 16-8). The security groups are arranged under a tree diagram that follows the arrangement of the setup pages.
• Figure 16-8 Permissions Edit screen.
There are three check boxes for each security group. The left-most box allows reading hen checked. The middle box allows writing when checkew
ad, and the right-most box
llows modifying when checked. Reading and writing are controlled by the meter, and modifying is controlled by EziView. The Modify setting is used to prevent users from
not permitted to modify a setting, it is greyed r a setup page are cleared, the
setup page is not displayed.
to
ose settings too. The All checkboxes at the bottom may be used to change all settings. Expand and Collapse may be used to expand the detail shown in the tree view, as can using the plus and minus boxes.
Figure 16-9 shows the effect of these settings on the PulsingOutputs page. Note that outputs 1 and 2 are greyed out and cannot be changed. The Modify setting is most
modifying settings in EziView. If a user isout and cannot be changed. If all of the modify settings fo
For example, in Figure 16-8 the modify permissions have been removed from the firsttwo pulsing outputs. Note that the modify checkbox for PulsingOutputs is greyedindicate that some of the boxes beneath it are not checked. Checking a box with sub branches changes all th
Security 16-9
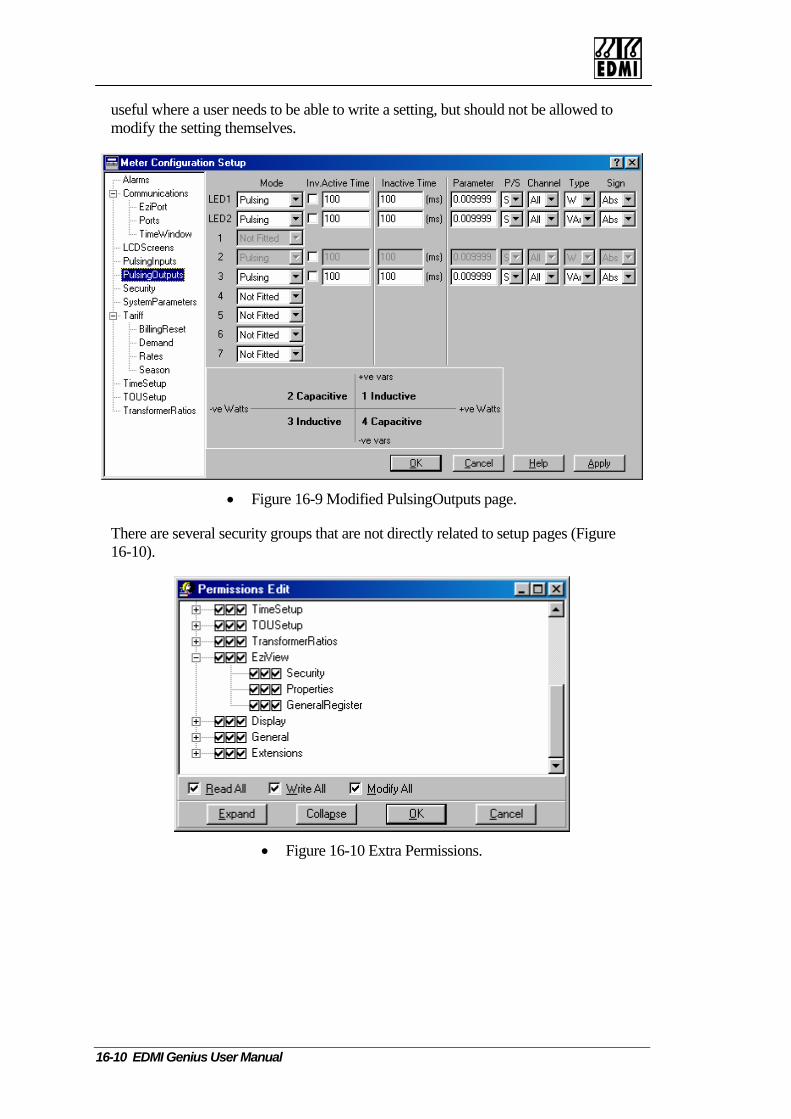
useful where a user needs to be able to write a setting, but should not be allowed to modify the setting themselves.
• Figure 16-9 Modified PulsingOutputs page.
There are several security groups that are not directly related to setup pages (Figure 16-10).
• Figure 16-10 Extra Permissions.
16-10 EDMI Genius User Manual

EziView Security
T y iss or values that can be displayed, such as voltage. General has the security groups which don’t fit anywhere else, along with any currently unused groups. Ext ions
S rity Group
he Displa perm ions are f
ens has the settings for EziScript extensions (Table 16-1).
ecu Effect ExtensionSetup1 Access to read the EziScript memory usage information.
Write access allows defragment command. Extension tup2 Se Access to read the summary information of EziScripts. ExtensionSetup3 Access to create extensions. ExtensionSetup4 Access to upload and download EziScripts (this is not survey
data). Access is also required to the EziScript’s security group. ExtensionXX
bers 230 to 245. These are security groups reserved for EziScripts to use. They correspond to group num
• Table 16-1 Extension Security Groups
The bleL elXS o control what level EziScripts may be lo have a user group level that they use to access the registers d an EziScript into the meter, the EnableLevelXScript sponds to the EziScript’s user group must be set. This al ities of EziScripts loaded by a user to be limited.
The View ption Security allo ce security setup page. Clearing the flag for this has a similar effect to clearing all the EziView security flag will be set.
The Properties option allows access to the properties of the meter. If this is not set a
Ena ev criptUpload security groups are used taded by a user. EziScripts
ate. To loathey need to operUpload write flag that correlows the access abil
Ezi o s relate to features of EziSetup – only the modify flag is used.ws ac ss to the
the security flags. If the security flags are set,
symbol will be displayed next to the meter in EziView.
The GeneralRegister option controls the use of the read register and write register commands.
Alternate Permissions Control
In addition to the tree view of permissions, there is another display that simply lists the
ctly. security groups. They both allow the same things to be done, but are simply presented in a different way. This way may be more useful when working with registers dire
Security 16-11

Right-clicking on the Permissions button brings up a small menu with options for ReaWrite and Modify. Selecting one of these will display the setup for that type of flags (Figure 16-11).
d,
• Figure 16-11 Alternate Permissions setup method.
All security groups are listed, along with their security group number in brackets. The left hand pane shows the enabled security groups, while the right hand pane shows the
ove all entries, regardless of selection. OK saves the changes, Cancel ignores the changes.
disabled ones. Selecting entries and selecting Enable or Disable will move them as directed one side to the other. The Enable All and Disable All buttons m
16-12 EDMI Genius User Manual
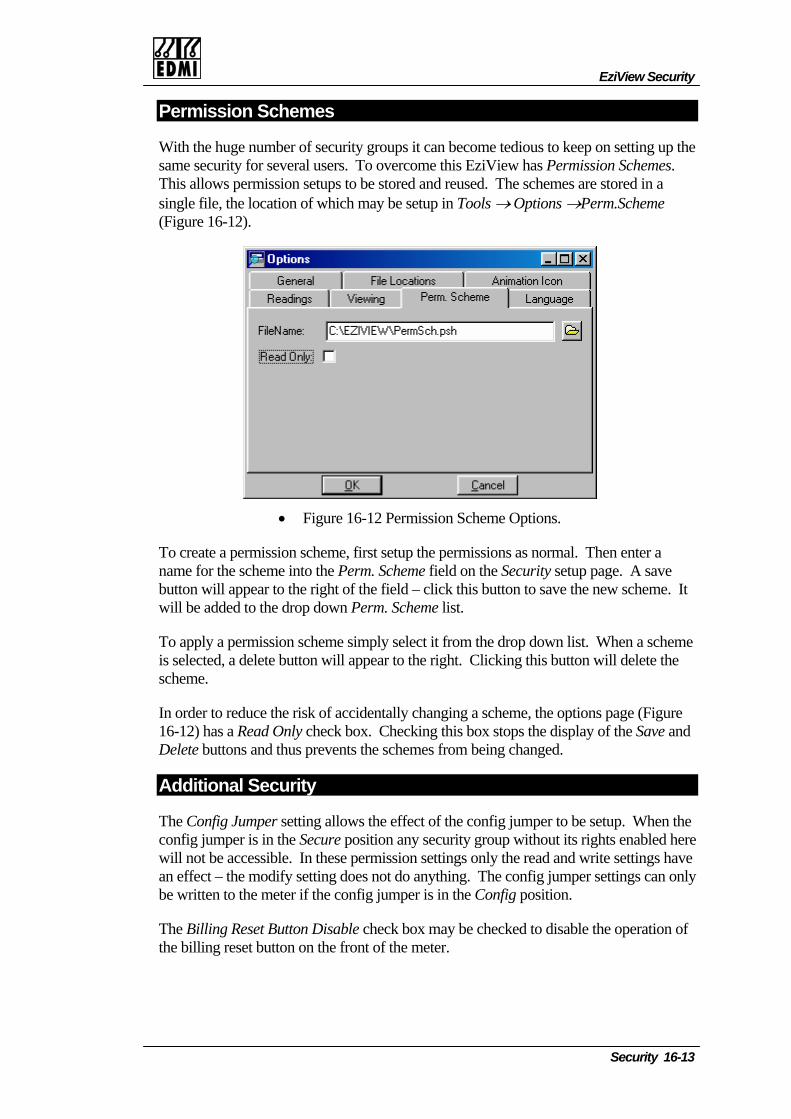
EziView Security
Permission Schemes
h the huge number of security groups it can become tedious to keep on setting up the security for several use
Wit e sam rs. To overcome this EziView has Permission Schemes. This allows permission setups to be stored and reused. The schemes are stored in a
(Figsingle file, the location of which may be setup in Tools → Options →Perm.Scheme
ure 16-12).
• Figure 16-12 Permission Scheme Options.
To create a permission scheme, first setup the permissions as normal. Then enter a name for the scheme into the Perm. Scheme field on the Security setup page. A save button will appear to the right of the field – click this button to save the new scheme. It will be added to the drop down Perm. Scheme list.
To apply a permission scheme simply select it from the drop down list. When a scheme is selected, a delete button will appear to the right. Clicking this button will delete the scheme.
In order to reduce the risk of accidentally changing a scheme, the options page (Figure 16-12) has a Read Only Save and Delete butt s
check box. Checking this box stops the display of the on and thus prevents the schemes from being changed.
Additional Security
The Config Jumper setting allows the effect of the config jumper to be setup. When the config jumper is in the Secure position any security group without its rights enabled here will not be accessible. In these permission settings only the read and write settings have an effect – the modify setting does not do anything. The config jumper settings can only be written to the meter if the config jumper is in the Config position.
The Billing Reset Button Disable check box may be checked to disable the operation of the billing reset button on the front of the meter.
Security 16-13

LCare should be taken that at least one user has permission to change user security information. Contact EDM manage to lock yourself out of the meter.
ost Passwords
I if you do
16-14 EDMI Genius User Manual

Lost Passwords
Intentionally Blank
Security 16-15

II
Part III EziScript Exte
lthough the meter has quite a range of built-in functions, there are here always seems to be something that needs to worr your application. This is where EziScript extension
to create new f
This section of the manual gives an overview of how EziScripts work and hthem into a meter. The t are av
”
• Chapter 21: “Modem Control”
Chapter 17 gives an introduction to EziScript extensions and the basics on them. Chapter 18 covers the use of toolbox to create customised extension other chapters document the available tools and may be read in any order.
versatility. Tdifferently foA EziScript is a kind of macro language that allows the meter’s oper
customised. It works just in the way a macro language for a word processospreadsheet works, by piecing together the existing features
following chapters then detail EziScripts thaspecific tasks:
• Chapter 17: “Using EziScript Extensions
• Chapter 18: “Toolbox”
• Chapter 19: “Survey Tools”
• Chapter 20: “Control Tools”
EziScr
P a r t
I
nsions
limits to its k a little bit s are useful.
unctionality.
ow to load ailable for
how to use tools. The
ation to be r or
ipt Extensions

Intentionally Blank
II EDMI Genius User Manual

Chapter 17 Using EziScript EAn EziScript extension is a macro that can be loaded into a meter to ex
allows multiple channels of data to be recorded and r
figured, and added t
the scripts can also be shown.
functionality. It works to tie together the operations of the meter to crefunctionality and customisations. Each EziScript extension consists ofcombine to produce the desired operation. The parts are:
• User defined registers. These can be used to store items of informameter’s built-in registers.
• Survey. Thisefficiently.
• Time Events. These allow operations to be scheduled to occur at s
• Scripts. These tie together the operation of the other parts and the efunctions.
There are two ways of using EziScript extensions. The easy way is to of the normal EziView setup pages. This allows EziScripts to be confilike other settings. EziView Toolbox contains a collection of scripts tovariety of tasks. These ‘tools’ can be selected, con
The second way is accessible when the meter is connected. A list of thcurrently in the meter can be displayed, and scripts added or removed. information about
The terms EziScript, EziScript extension and extension may be used inalthough extension is a slightly more generic term.
Win the meter for the stor
extensions and their data. EziView allocates a block of memory for a n
here are EziScript extensions stored? A block of 192KB of memory is provided with
then downloads it to the meter and links it. Linking checks the validityand activates it.
Using EziScri
e r C h a p t
17
xtensions tend itsetrieved
o the setup.
ate new several parts that
tion, just like the
et times.
xisting meter
use them as part gured offline just accomplish a
e scripts Status
terchangeably,
age of EziScript ew EziScript, of the extension
pt Extensions 17-1

The memory is mbe also stored in FLASH m
aintained by the meter’s battery, but a limited size of extensions may emory for more permanent storage. Approximately 32K of
extensions may be stored in this way.
EziScripts using setup and Toolbox This method of managing scripts views them as a method of achieving an end. The focus is on the task required. EziView uses the concept of tools, where a tool is made up of one or more scripts. A tool is taken from a toolbox, then adjusted and customised for the specific task. It can then be put into the meter, or kept in a holding area close at hand. Once in the meter, the tool performs its function, gathers data, controls outputs, etc.
The EziView Setup → Extensions page (Figure 17-1) is used to select the tools to be included in the meter.
• Figure 17-1 EziView Extensions Setup page.
EziView keeps a directory that holds all of the customised tools. This is common for all meters. The Extensions page lists all of these tools. Selecting a tool brings up its description in the Description field.
Each tool has a checkbox. Checking the checkbox for a tool marks it for loading into the meter.
The Memory and Flash bars indicate an estimate of the remaining memory in the meter for tools. This does not take account of non-toolbox extensions in the meter.
The tool is actually loaded into the meter when a write of setup occurs (by any of the setup methods). If a tool is already in a meter and the checkbox for it is unchecked, the
17-2 EDMI Genius User Manual
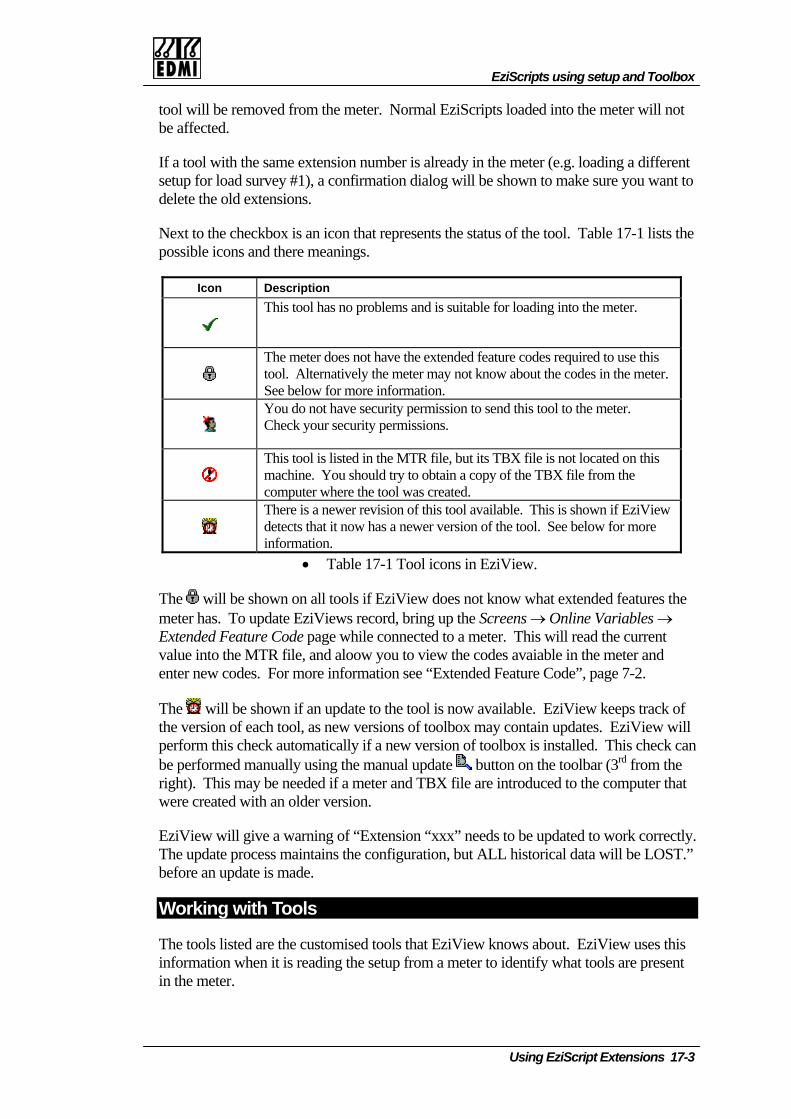
EziScripts using setup and Toolbox
tool will bbe affected.
e removed from the meter. Normal EziScripts loaded into the meter will not
.g. loading a different setup for load survey #1), a confirmation dialog will be shown to make sure you want to delete the old extensions.
Next to the checkbox is an icon that represents the status of the tool. Table 17-1 lists the possible icons and there meanings.
Icon Description
If a tool with the same extension number is already in the meter (e
This tool has no problems and is suitable for loading into the meter.
The meter does not have the extended feature codes required to use this tool. Alternatively the meter may not know about the codes in the meter. See below for more information.
You do not have security permission to send this tool to the meter. Check your security permissions.
This t his m h e from the
ool is listed in the MTR file, but its TBX file is not located on tac ine. You should try to obtain a copy of the TBX fil
computer where the tool was created. There is a newer revision of this tool available. This is shown if EziV
iew
detects that it now has a newer version of the tool. See below for more information.
• Table 17-1 Tool icons in EziView.
The will be shown on all tools if EziView does not know what extended features the meter has. To update EziViews record, bring up the Screens → Online Variables → Extended Feature Code page while connected to a meter. This will read the current value into the MTR file, and aloow you to view the codes avaiable in the meter and enter new codes. For more information see “Extended Feature Code”, page 7-2.
The will be shown if an update to the tool is now available. EziView keeps track of e version of each tool, as new versions of toolbox may contain updates. EziView will
perform this check automatically if a new version of toolbox is installed. This check can be performed manually using the manual update
th
button on the toolbar (3rd from the right). This may be needed if a meter and TBX file are introduced to the computer that were created with an older version.
EziView will give a warning of “Extension “xxx” needs to be updated to work correctly. The update process maintains the configuration, but ALL historical data will be LOST.” before an update is made.
Working with Tools
The tools listed are the customised tools that EziView knows about. EziView uses this information when it is reading the setup from a meter to identify what tools are present in the meter.
Using EziScript Extensions 17-3
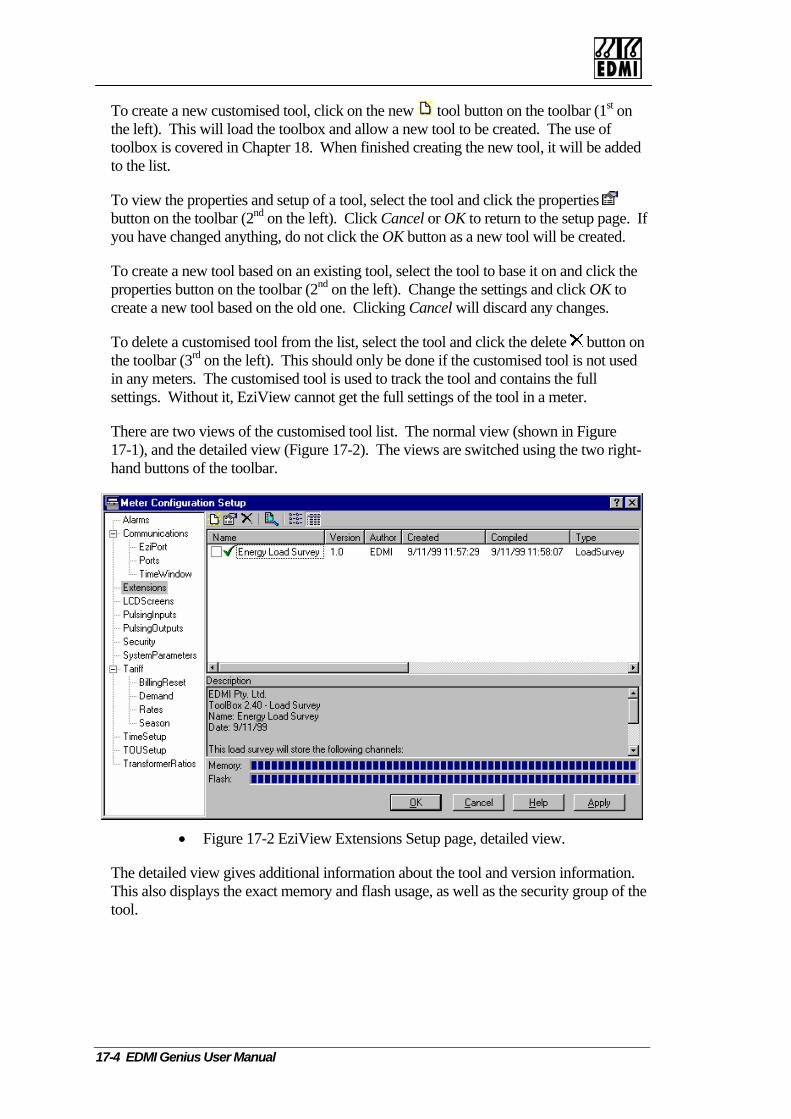
To create a new customised tool, click on the new tool button on the toolbar (1st on the left). This will load the toolbox and allow a new tool to be created. The use of toolbox is covered in Chapter 18. When finished creating the new tool, it will be added to the list.
To view the properties and setup of a tool, select the tool and click the properties button on the toolbar (2nd on the left). Click Cancel or OK to return to the setup page. If you have changed anything, do not click the OK button as a new tool will be created.
To create a new tool based on an existing tool, select the tool to base it on and click the properties button on the toolbar (2nd on the left). Change the settings and click OK to create a new tool based on the old one. Clicking Cancel will discard any changes.
To delete a customised tool from the list, select the tool and click the delete button on the toolbar (3rd on the left). This should only be done if the customised tool is not used in any meters. The customised tool is used to track the tool and contains the full settings. Without it, EziView cannot get the full settings of the tool in a meter.
There are two views of the customised tool list. The normal view (shown in Figure 17-1), and the detailed view (Figure 17-2). The views are switched using the two right-hand buttons of the toolbar.
• Figure 17-2 EziView Extensions Setup page, detailed view.
The detailed view gives additional information about the tool and version information. This also displays the exact memory and flash usage, as well as the security group of the tool.
17-4 EDMI Genius User Manual
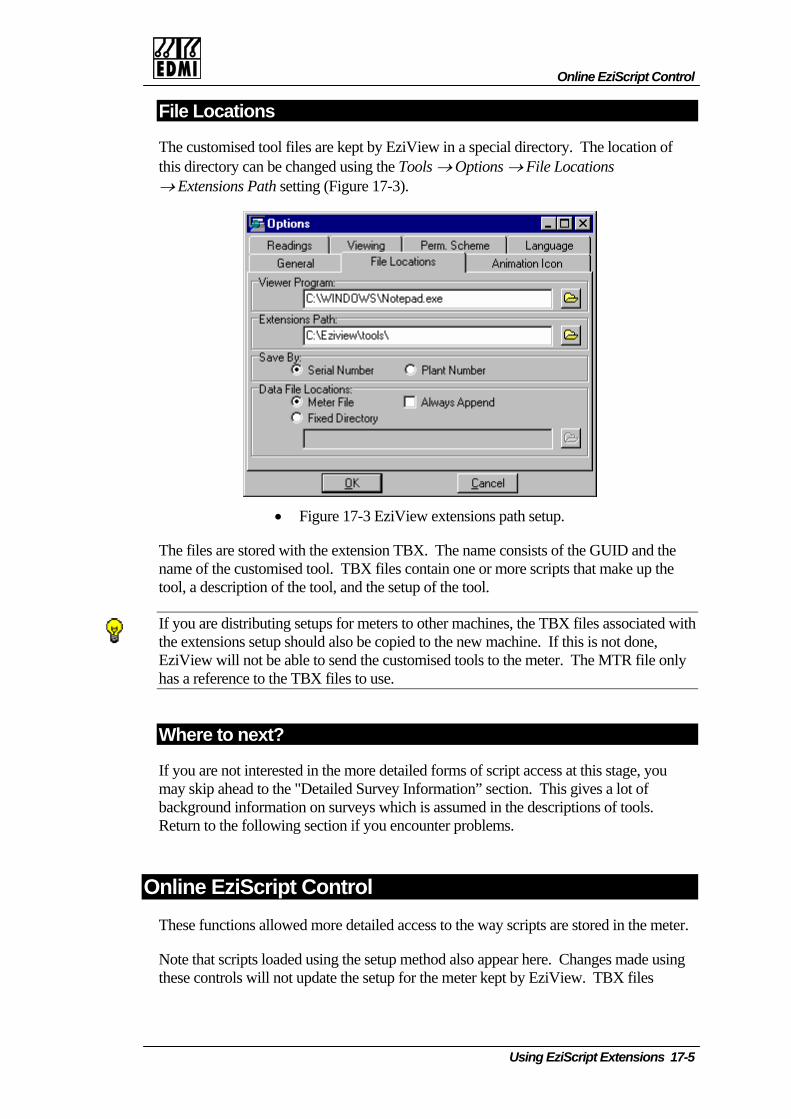
Online EziScript Control
File Locations
The customised tool files are kept by EziView in a special directory. The location of this directory can be changed using the Tools → Options → File Locations → Extensions Path setting (Figure 17-3).
• Figure 17-3 EziView extensions path setup.
The files are stored with the extension TBX. The name consists of the GUID and the name of the customised tool. TBX files contain one or more scripts that make up the tool, a description of the tool, and the setup of the tool.
If you are distributing setups for meters to other machines, the TBX files associated with the extensions setuEziView will not be able to send the custom
p should also be copied to the new machine. If this is not done, ised tools to the meter. The MTR file only
has a reference to the TBX files to use.
Where to next?
If you are not interested in the ccess at this stage, you may skip ahead to the "Detail This gives a lot of
more detailed forms of script aed Survey Information” section.
background information on surveys which is assumed in the descriptions of tools. Return to the following section if you encounter problems.
O
g
nline EziScript Control These functions allowed more detailed access to the way scripts are stored in the meter.
Note that scripts loaded using the setup method also appear here. Changes made usinthese controls will not update the setup for the meter kept by EziView. TBX files
Using EziScript Extensions 17-5
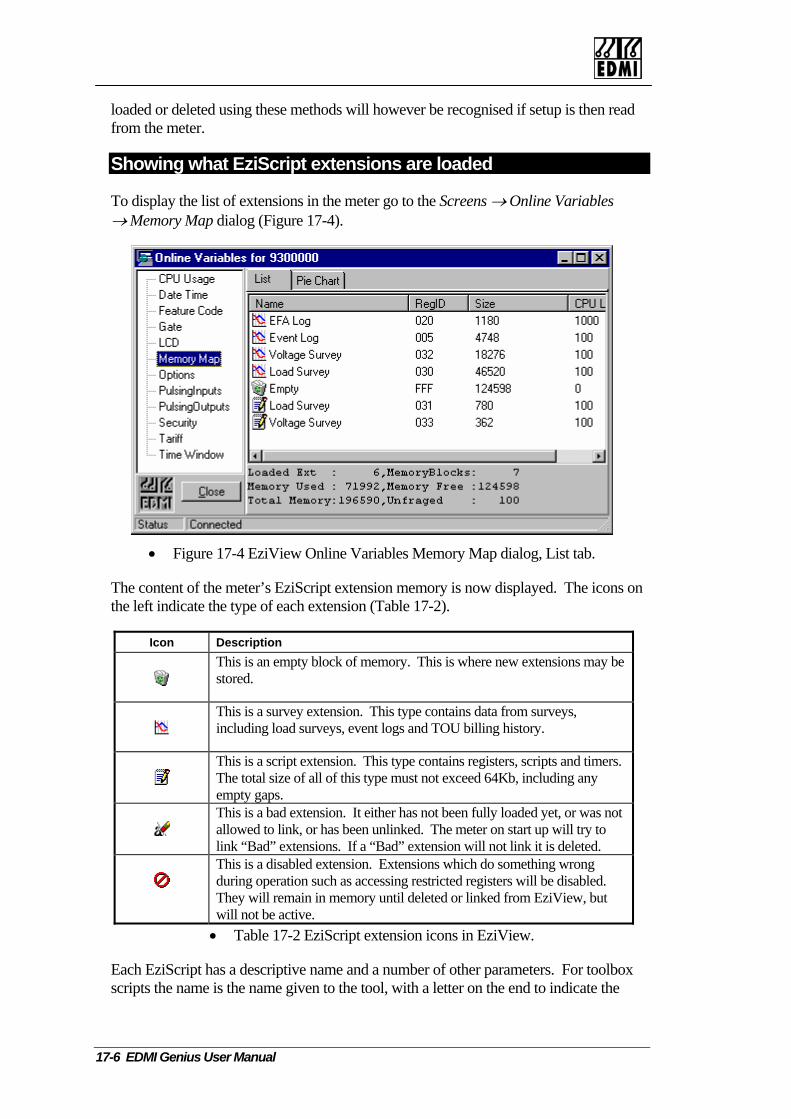
loaded or deleted using these methods will however be recognised if setup is then readfrom the meter.
Showing what EziScript extensions are loaded
To display the list of extensions in the meter go to the Screens → Online Variables → Memory Map dialog (Figure 17-4).
• Figure 17-4 EziView Online Variables Memory Map dialog, List tab.
The content of the meter’s EziScript extension memory is now displayed. The icons on the left indicate the type of each extension (Table 17-2).
Icon Description
This is an empty block of memory. This is where new extensions may be stored.
This is a survey extension. This type contains data from surveys, including load surveys, event logs and TOU billing history.
This is a script extension. This type contains registers, scripts and timers. The total size of all of this type must not exceed 64Kb, including any empty gaps.
This is a bad extension. It either has not been fully loaded yet, or was not allowed to link, or has been unlinked. The meter on start up will try to link “Bad” extensions. If a “Bad” extension will not link it is deleted.
This is a disabled extension. Extensions which do something wrong during operation such as accessing restricted registers will be disabled. They will remain in memory until deleted or linked from EziView, but will not be active.
• Table 17-2 EziScript extension icons in EziView.
Each EziScript has a descriptive name and a number of other parameters. For toolbox scripts the name is the name given to the tool, with a letter on the end to indicate the
17-6 EDMI Genius User Manual
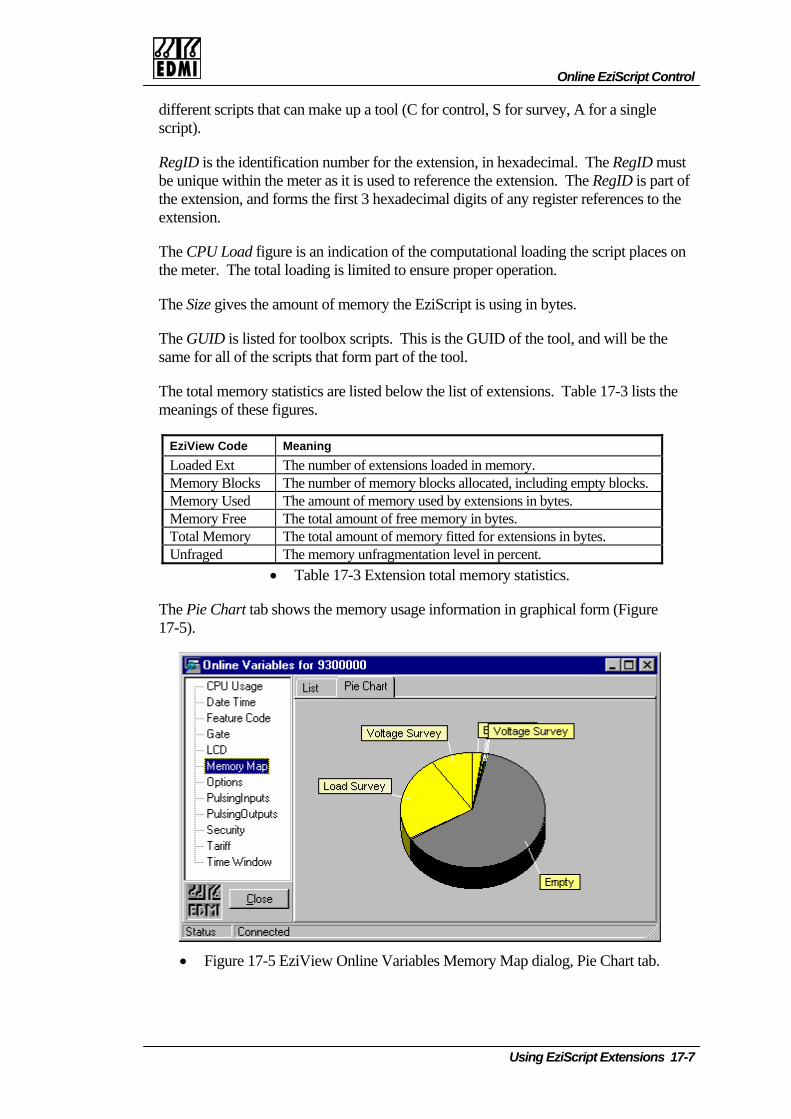
Online EziScript Control
different scripts that can mascript).
ke up a tool (C for control, S for survey, A for a single
RegID is the identification number for the extension, in hexadecimal. The RegID must
The CPU Load figure is an indication of the computational loading the script places on the meter. The total loading is limited to ensure proper operation.
The Size gives the amount of memory the EziScript is using in bytes.
The GUID is listed for toolbox scripts. This is the GUID of the tool, and will be the same for all of the scripts that form part of the tool.
The total memory statistics are listed below the list of extensions. Table 17-3 lists the meanings of these figures.
EziView Code Meaning
be unique within the meter as it is used to reference the extension. The RegID is part ofthe extension, and forms the first 3 hexadecimal digits of any register references to the extension.
Loaded Ext The number of extensions loaded in memory. Memory Blocks The number of memory blocks allocated, including empty blocks. Memory Used The amount of memory used by extensions in bytes. Memory Free The total amount of free memory in bytes. Total Memory The total amount of memory fitted for extensions in bytes. Unfraged The memory unfragmentation level in percent.
• Table 17-3 Extension total memory statistics.
The Pie Chart tab shows the memory usage information in graphical form (Figure 17-5).
• Figure 17-5 EziView Online Variables Memory Map dialog, Pie Chart tab.
Using EziScript Extensions 17-7
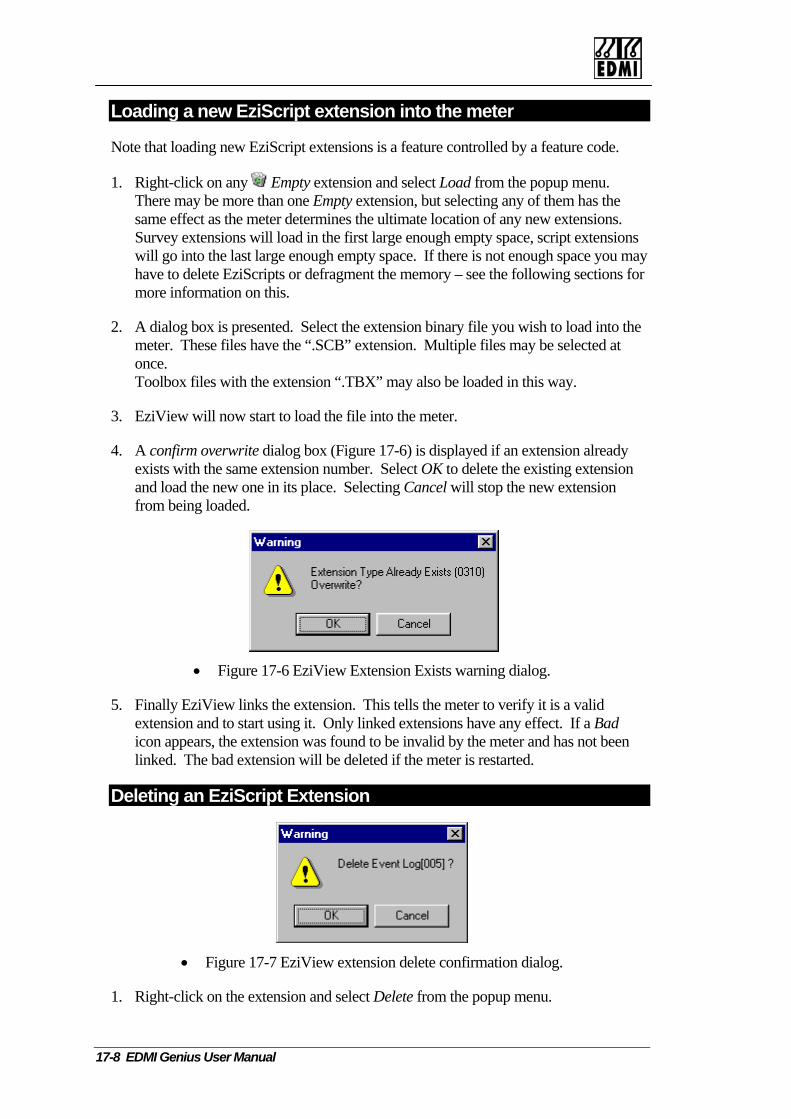
Loading a new EziScript extension into the meter
Note that loading new EziScript extensions is a feature controlled by a feature code.
1. Right-click on any EmThere may be more than
pty extension and select Load from the popup menu. one Empty extension, but selecting any of them has the
2. A dialog box is presented. Select the extension binary file you wish to load into the meter. These files have the “.SCB” extension. Multiple files may be selected at once. Toolbox files with the extension “.TBX” may also be loaded in this way.
3. EziView will now start to load the file into the meter.
4. A confirm overwrite dialog box (Figure 17-6) is displayed if an extension already exists with the same extension number. Select OK to delete the existing extension and load the new one in its place. Selecting Cancel will stop the new extension from being loaded.
same effect as the meter determines the ultimate location of any new extensions. Survey extensions will load in the first large enough empty space, script extensions will go into the last large enough empty space. If there is not enough space you may have to delete EziScripts or defragment the memory – see the following sections for more information on this.
• Figure 17-6 EziView Extension Exists warning dialog.
was found to be invalid by the meter and has not been linked. The bad extension will be deleted if the meter is restarted.
5. Finally EziView links the extension. This tells the meter to verify it is a valid extension and to start using it. Only linked extensions have any effect. If a Bad icon appears, the extension
Deleting an EziScript Extension
• Figure 17-7 EziView extension delete confirmation dialog.
1. Right-click on the extension and select Delete from the popup menu.
17-8 EDMI Genius User Manual

Online EziScript Control
2. A confirmation dialog box is presented. Click OK to delete the extension. Clicking Cancel will abort the delete operation.
3. The list will update showing that the extension has been deleted. If it was next to an Em pace will get larger - the spaces coalesce. Otherwise the extension will simply become another Empty extension, leading to fragmentation.
To delete more than one extension at once select all of the extensions to delete first
pty space the empty s
using the Ctrl or Shift Windows selection methods. Selecting delete for one of them will then delete all selected extensions.
Defragmenting the EziScript Memory
After several EziScripts have been loaded and deleted the memory may become fragmented. This is indicated by the occurrence of more than one Empty extension. The Unfraged indicator in the bottom pane is the percentage of memory not fragmented.
• Figure 17-8 EziView showing memory fragmentation.
The meter has a feature to defragment memory. This can be used when a new extension needs to be loaded, but there is no single empty block of memory in which it can fit. The meter will rearrange the extensions so that there is only a single block of empty memory. There is no performance advantage to defragmenting memory. In Figure 17-8 the largest free block is 124598 bytes, but the total free memory is 144416 bytes. Defragmenting will allow a larger extension to be loaded.
1. Right-click on an Empty extension and select Defrag. A confirmation dialog box is presented warning that all scripts will be temporarily unlinked. Click OK to continue. Clicking Cancel will abort the operation.
2. The meter now unlinks all scripts, rearranges them, and then links them again.
Using EziScript Extensions 17-9
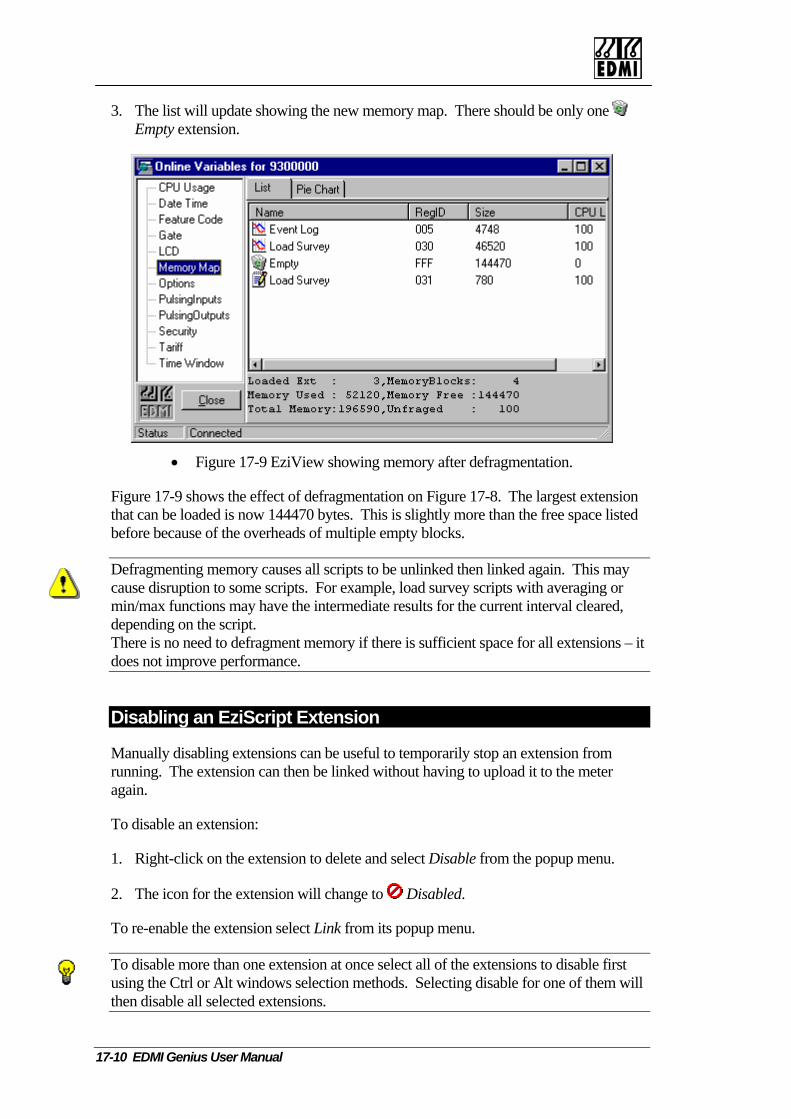
17-10 EDMI Genius User Manual
3. The list will update showing the new memory map. There should be only one Empty extension.
• Figure 17-9 EziView showing memory after defragmentation.
Figure 17-9 shows the effect of defragmentation on Figure 17-8. The largest extension that can be loaded is now 144470 bytes. This is slightly more than the free space listed before because of the overheads of multiple empty blocks.
Defragmenting memory causes all scripts to be unlinked then linked again. This may cause disruption to some scripts. For example, load survey scripts with averaging or min/max functions may have the intermediate results for the current interval cleared, depending on the script. There is no need to defragment memory if there is sufficient space for all extensions – it does not improve performance.
Disabling an EziScript Extension
Manually disabling extensions can be useful to temporarily stop an extension from running. The extension can then be linked without having to upload it to the meter again.
To disable an extension:
1. Right-click on the extension to delete and select Disable from the popup menu.
2. The icon for the extension will change to Disabled.
To re-enable the extension select Link from its popup menu.
To disable more than one extension at once select all of the extensions to disable first using the Ctrl or Alt windows selection methods. Selecting disable for one of them will then disable all selected extensions.

Detailed Survey Information
Detailed Survey Information Surveys allow the creation of a database for the recording of large amounts of historical data. This section explains the structure of a survey and its capabilities. This section does get quite detailed, but this overview will help in understanding how surveys organise the data they record, ways of accessing this data, and the effect of influences such as time changes.
An illustration will help at this point, see Figure 17-10 below.
Channel 0 (Status)
Channel 1 Channel 2 Channel 3 … Channel M
Record 0 Record 1 Record 2 Record 3 … Record N
• Figure 17-10 ge structure.
A survey consis number of records, each record then consisting of a number of channels (channels are called fields in database terminology). Each channel stores one particular quantity, and each record therefore stores a record of the values of those quantities at a specific moment in time. For example a load survey may have channels for Wh and VArh, with records at 15-minute intervals.
There may be up to 256 channels in a survey. Each channel may be of any width and of any data type, with the only constraint being that the total width of all channels must be less than 65536 bytes. Each channel has a source register. When a record is stored, the source register for each channel is read and the returned value is stored into that channel in the record.
The first channel (channel 0) of a survey is always used to record the status of the record. The information is stored in a 16-bit integer (type ‘H’). This consists of a set of flags that record the state of the system since the last record, and flags indicating the validity of the record. A complete list follows in Table 17-4.
Survey stora
ts of a
Using EziScript Extensions 17-11

EziView Code
Bit Meaning
K 0 An error occurred reading one of the registers. One or more channels of the record will be wrong.
A 1 Filled entry – no data. If bit 3 is set as well, then this interval was lost due to a survey rewind, caused by a backwards time change.
P 2 Power failed during interval. This is set in the interval where power was lost, not where it just continued to be lost or was restored. The I flag will be set for all intervals where power was not present, lost, or restored.
I 3 Incomplete interval. Caused by power failure or time change at some time since the last entry.
D 4 Daylight saving was in effect. L 5 Calibration lost. Meter was not calibrated. W 6 S,V,F,R or M alarm failure (any or all).
S – Asymmetric Power V – Voltage Tolerance Error F – VT Failure R – Incorrect Phase Rotation M – Reverse Power
U 7 User (U flag) alarm failure – User flag. B 8 Data check sum error – this record should be treated with caution.
9-15 Unused. • Table 17-4 Alarm names and flag letters.
Note that EziView displays the flags as the right-most column when using a reading file.
The number of records in a survey in theory may be over 4 billion, but in practice is limited by memory availability.
There are two basic types of survey, each best suited to a particular use. These are variable interval and fixed interval.
A variable interval survey simply stores a record when triggered. The interval between two triggers may be anything. Generally time is stored in this type of survey in a channel using the 0000F080 register, which is 4 bytes wide. This type of survey is good for things such as event logs and billing reset histories. Functions exist via the command line interface to search for a record by time, based on the 0000F080 channel, or on another time channel if present.
In contrast, a fixed interval survey stores with a fixed interval between records. The interval is specified in the survey set up, and the meter will ensure that each interval is of the specified length by filling, rewinding, or even restarting the survey to cope with time changes and power failures. Because the start time and recording interval of the survey is known, the time of any entry can be determined from the entry number, and no channel need be ‘wasted’ to record the time of the record. This type of survey is best for load surveys and other situations where readings must be taken at set intervals.
17-12 EDMI Genius User Manual

Detailed Survey Information
Using EziScript Extensions 17-13
Each record in a survey has a 32-bit record number, with record 0 being stored at the start time of the survey (stored when the first entry is triggered). This way each record has a unique number which should never ‘wrap around’ (32-bits gives over 130 years at 1-second intervals).
The incomplete interval flag is set if a time change or a power failure occurred between the previous entry and this entry. The first entry is always marked incomplete. At times this may seem confusing for variable interval surveys. For example, in the case of an event log the fact that there were incomplete intervals in the time between events has little meaning. Incomplete interval flags are mostly useful for fixed interval surveys, where recordings are usually continuous.
Another major setting for a survey is for how it deals with running out of space. The number of records a survey has is specified as part of the setup. When a survey records this many entries it has one of two choices. The first is simply to stop recording data until the survey is cleared. The second option is to start overwriting older records. The record numbers are preserved, but older records simply become unavailable. These two types are called no cycling and cycling respectively, and is part of the survey set up.
Surveys are triggered to store either by an event such as a billing reset, or from another script. For instance, load surveys usually consist of two scripts – one is the survey, the other controls the accumulation of data and triggering at the right time intervals.
The Effect of Time Changes
The most difficult part of load surveys is in handling time changes. Note that a power outage is simply a time change, but causes the P flag to be set as well.
Time change forward:
• If the time doesn’t go past the end of the current interval there are no special effects.
• If the time change goes past the end of the current interval, the current interval will be closed off (stored, calculated etc) and a new interval will be started.
• If the change crosses more than one interval, the in-between intervals will be filled with zeros, and marked as filled.
• If the time change is more than the number of entries the survey can record, the survey will be cleared and restarted.
Time change backward:
• If the time doesn’t go past the beginning of the current interval there are no special effects.
• If the time change goes past the beginning of the current interval but not into the interval before that, there are no special effects. (The current interval is the active interval, even though the time is before it started. This allows time changes back over to just into the previous interval to put the energy into the currently being calculated interval.)
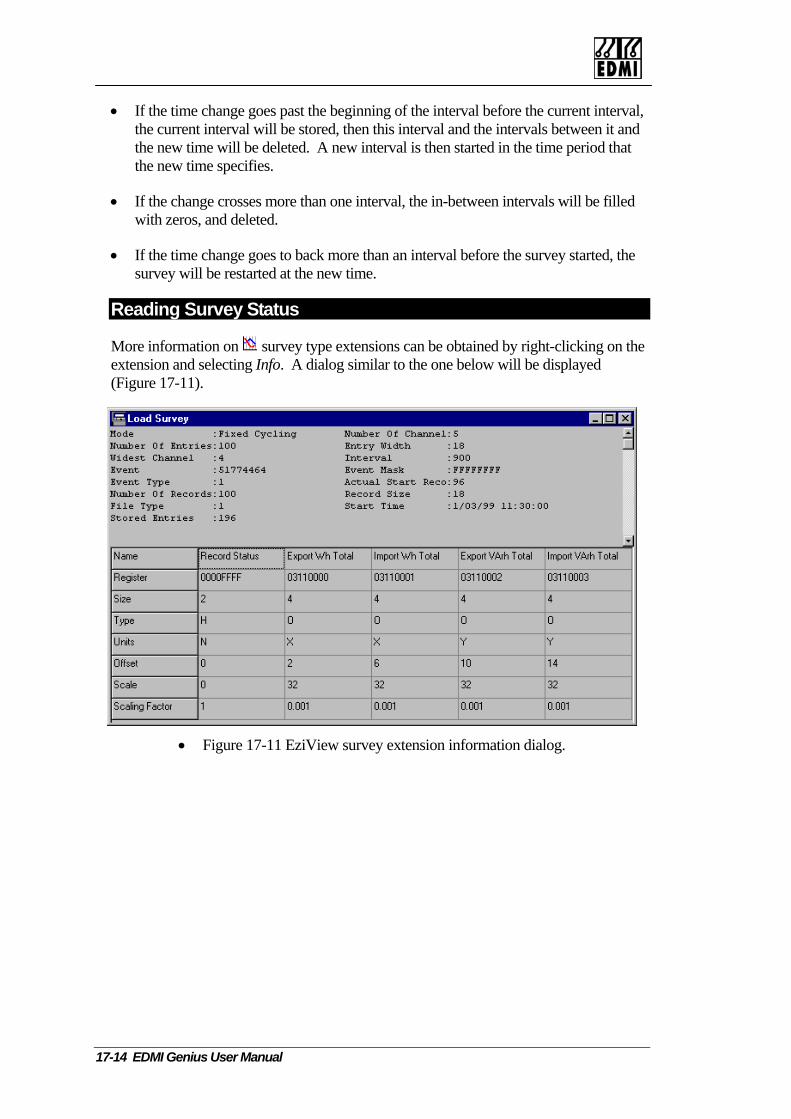
• If the time change goes past the beginning of the interval before the current interval, the current interval will be stored, then this interval and the intervals between it and the new time will be deleted. A new interval is then started in the time period that the new time specifies.
• If the change crosses more than one interval, the in-between intervals will be filled with zeros, and deleted.
• If the time change goes to back more than an interval before the survey started, the survey will be restarted at the new time.
Reading Survey Status
More information on survey type extensions can be obtained by right-clicking on the extension and selecting Info. A dialog similar to the one below will be displayed (Figure 17-11).
• Figure 17-11 EziView survey extension information dialog.
17-14 EDMI Genius User Manual

Detailed Survey Information
The top section gives a large number of statistics about the extension, most of which are for internal use only. The table below (Table 17-5) lists the important ones.
Line Description Mode This gives the cycling/no cycling, fixed/variable mode. Number of Entries The number of entries the survey can store. Number of Records The number of records stored in the survey. Stored Entries The number of records stored from the Start time. Number of Channels The number of channels of information stored. Interval For Fixed mode surveys this is the interval between records in
seconds. Otherwise it is ignored. Record Size The total size of each record in bytes. Start Time The time of record zero.
• Table 17-5 EziView survey extension channel statistics.
The bottom section of the dialog is a table that gives information about each channel. Table 17-6 lists the meanings of this information, with the most useful information shown in bold.
Statistic Description Name This is the name/title of the channel. Displayed in downloaded
surveys as the name of the channel. Register This is the source register of the channel. May be useful in
problem solving, but usually will be of little use. Size This is the size in bytes of the channel. Type This is the data type of the channel’s data. Units The units displayed if the channel is shown on the LCD etc. Offset The offset from the start of the record of the channel. Scale The scaling code, internal use. Used to get the scaling factor. Scaling Factor The factor to scale between stored and real world values for
some data types. • Table 17-6 EziView survey extension statistics.
Reading a Survey
Reading the data from a survey type extension is best done using a reading file. See Chapter 23, EziView Reading Files.
Using EziScript Extensions 17-15
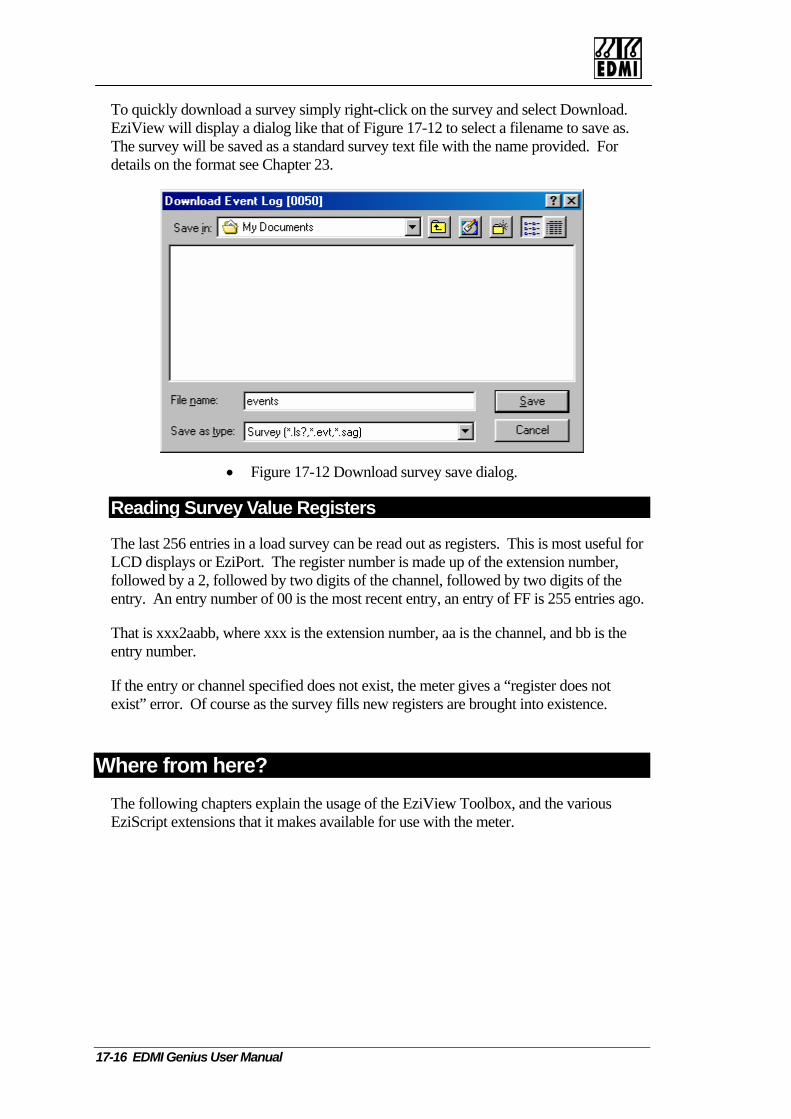
To quickly download a survey simply right-click on the survey and select Download. EziView will display a dialog like that of Figure 17-12 to select a filename to save as. The survey will be saved as a standard survey text file with the name provided. For details on the format see Chapter 23.
• Figure 17-12 Download survey save dialog.
Reading Survey Value Registers
The last 256 entries in a load survey can be read out as registers. This is most useful for LCD displays or EziPort. The register number is made up of the extension number, followed by a 2, followed by two digits of the channel, followed by two digits of the entry. An entry number of 00 is the most recent entry, an entry of FF is 255 entries ago.
That is xxx2aabb, where xxx is the extension number, aa is the channel, and bb is the entry number.
If the entry or channel specified does not exist, the meter gives a “register does not exist” error. Of course as the survey fills new registers are brought into existence.
Where from here? The following chapters explain the usage of the EziView Toolbox, and the various EziScript extensions that it makes available for use with the meter.
17-16 EDMI Genius User Manual
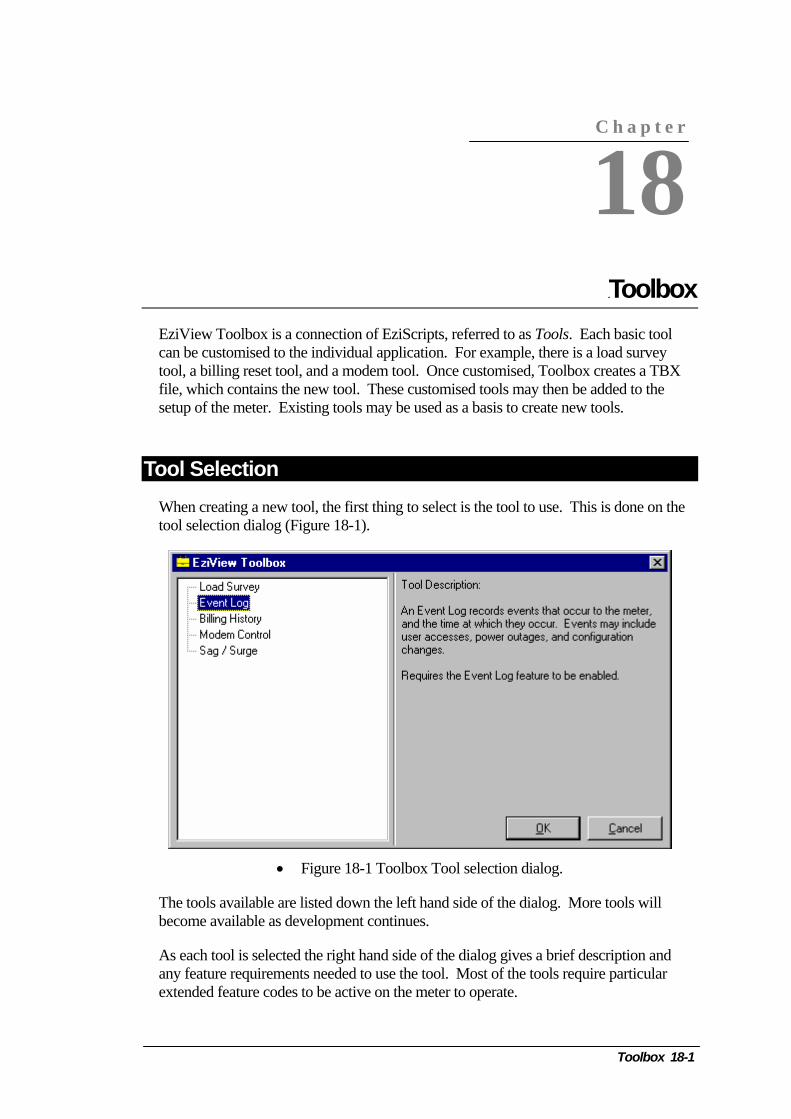
EziView Toolbox is a connection of EziScripts, referred to as Tools. Ecan be customised to the individual application. For example, there is tool, a billing reset tool, and a modem tool. Once customised, Toolboxfile, which contains the new tool. These customised tools may then besetup of the meter. Existing tools may be used as a basis to create new
Tool Selection When creating a new tool, the first thing to select is the tool to use. Thtool selection dialog (Figure 18-1).
• Figure 18-1 Toolbox Tool selection dialog.
The tools available are listed down the left hand side of the dialog. Mobecome available as development continues.
As each tool is selected the right hand side of the dialog gives a brief dany feature requirements needed to use the tool. Most of the tools requextended feature codes to be active on the meter to operate.
C h a p t e r
18
Toolbox 18-1
Chapter 18 Toolbox ach basic tool a load survey creates a TBX added to the tools.
is is done on the
re tools will
escription and ire particular
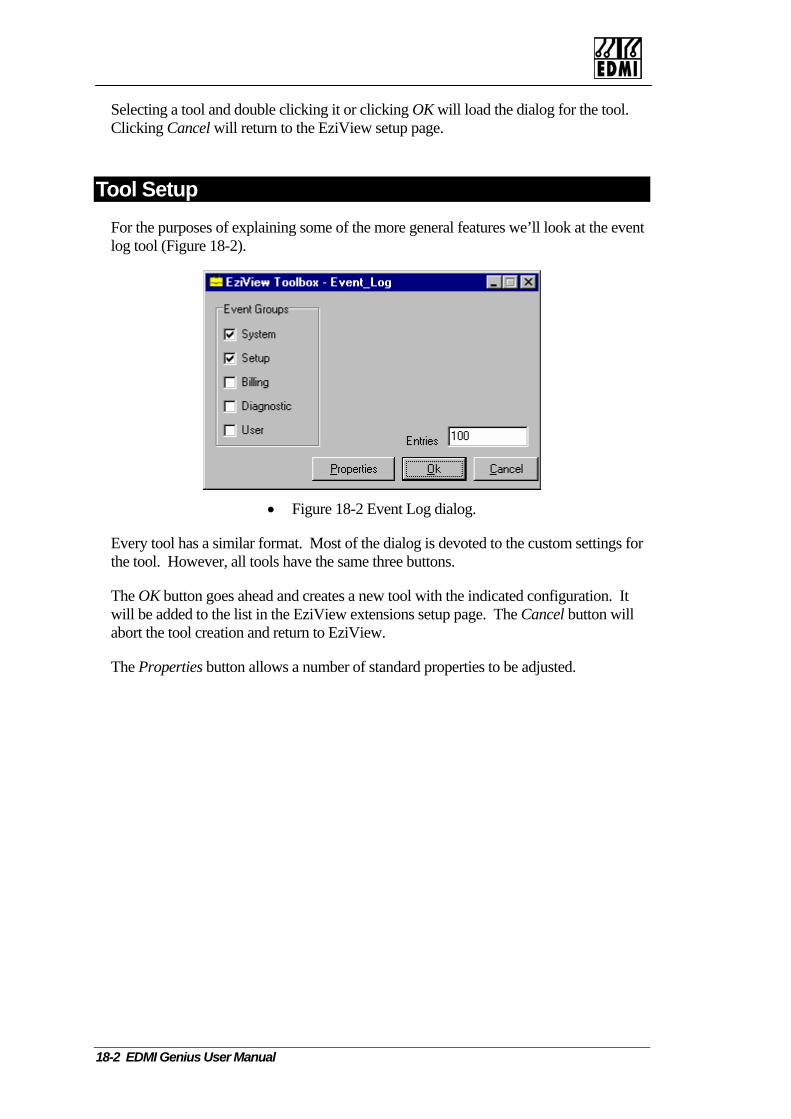
Selecting a tool and double clicking it or clicking OK will load the dialog for the tool. Clicking Cancel will return to the EziView setup page.
Tool Setup For the purposes of explaining some of the more general features we’ll look at the event log tool (Figure 18-2).
• Figure 18-2 Event Log dialog.
Every tool has a similar format. Most of the dialog is devoted to the custom settings for the tool. However, all tools have the same three buttons.
The OK button goes ahead and creates a new tool with the indicated configuration. It will be added to the list in the EziView extensions setup page. The Cancel button will abort the tool creation and return to EziView.
The Properties button allows a number of standard properties to be adjusted.
18-2 EDMI Genius User Manual
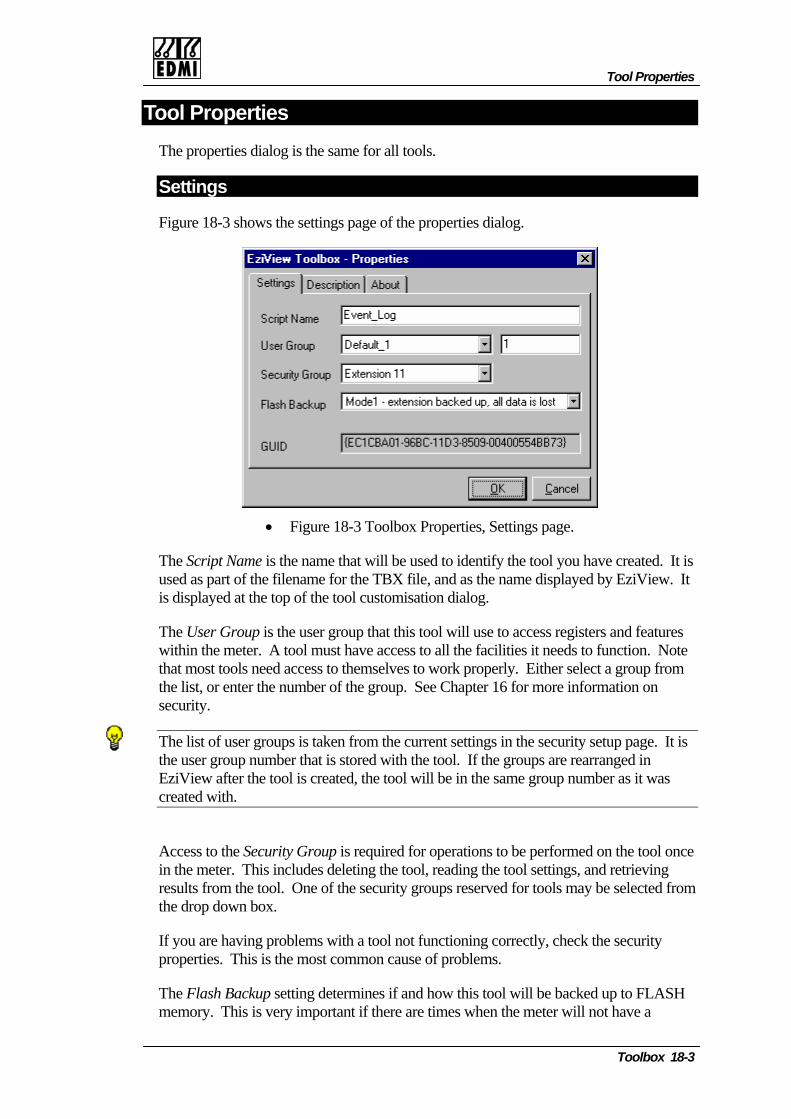
Tool Properties
Toolbox 18-3
Tool Properties The properties dialog is the same for all tools.
Settings
Figure 18-3 shows the settings page of the properties dialog.
• Figure 18-3 Toolbox Properties, Settings page.
The Script Name is the name that will be used to identify the tool you have created. It is used as part of the filename for the TBX file, and as the name displayed by EziView. It is displayed at the top of the tool customisation dialog.
The User Group is the user group that this tool will use to access registers and features within the meter. A tool must have access to all the facilities it needs to function. Note that most tools need access to themselves to work properly. Either select a group from the list, or enter the number of the group. See Chapter 16 for more information on security.
The list of user groups is taken from the current settings in the security setup page. It is the user group number that is stored with the tool. If the groups are rearranged in EziView after the tool is created, the tool will be in the same group number as it was created with.
Access to the Security Group is required for operations to be performed on the tool once in the meter. This includes deleting the tool, reading the tool settings, and retrieving results from the tool. One of the security groups reserved for tools may be selected from the drop down box.
If you are having problems with a tool not functioning correctly, check the security properties. This is the most common cause of problems.
The Flash Backup setting determines if and how this tool will be backed up to FLASH memory. This is very important if there are times when the meter will not have a

battery fitted. All EziScript extensions (which is of course what tools are) are stored in battery backed up memory so that they and their accumulated data are not lost during a power outage. This does not protect against the battery being removed however, which is particularly important if meters are going to be setup, then stored with the battery disconnected.
There are several levels of battery backup. This is to balance the fact that there is only a limited amount of FLASH memory, around 32KB. This prevents large items such as load surveys from being completely backed up, but their setup still can be.
Mode 0 – extension stored in battery backed RAM does not back up any of the tool to FLASH.
Mode 1 – extension is backed up, all data is lost backs up the tool itself to FLASH, but none of its data. This is the minimum setting if you have a situation where meters will not have a battery fitted at some time after setup.
Mode 2 – extension/registers backed up backs up the tool and its registers to FLASH. It does not however back up any survey data. For tools without surveys this has the same effect as Mode 3.
Mode 3 – extension/registers/survey backed up backs up everything, including surveys. This option should be used with care as surveys can be quite large. Generally it should only be used with small surveys, such as billing history and perhaps event logs.
Selecting the right modes will prevent against data loss in the case of a removed or flat battery when the main power to the meter is not present. If the meter runs out of FLASH memory, not all extensions requesting flash storage will be stored to flash. The meter will skip any extension that will not fit.
The GUID is a totally unique identifier created by toolbox for this tool configuration. This code allows the tool to be tracked, and forms part of the TBX filename. Two tools created with the exact same settings will still result in different GUID’s. It cannot be edited.
18-4 EDMI Genius User Manual
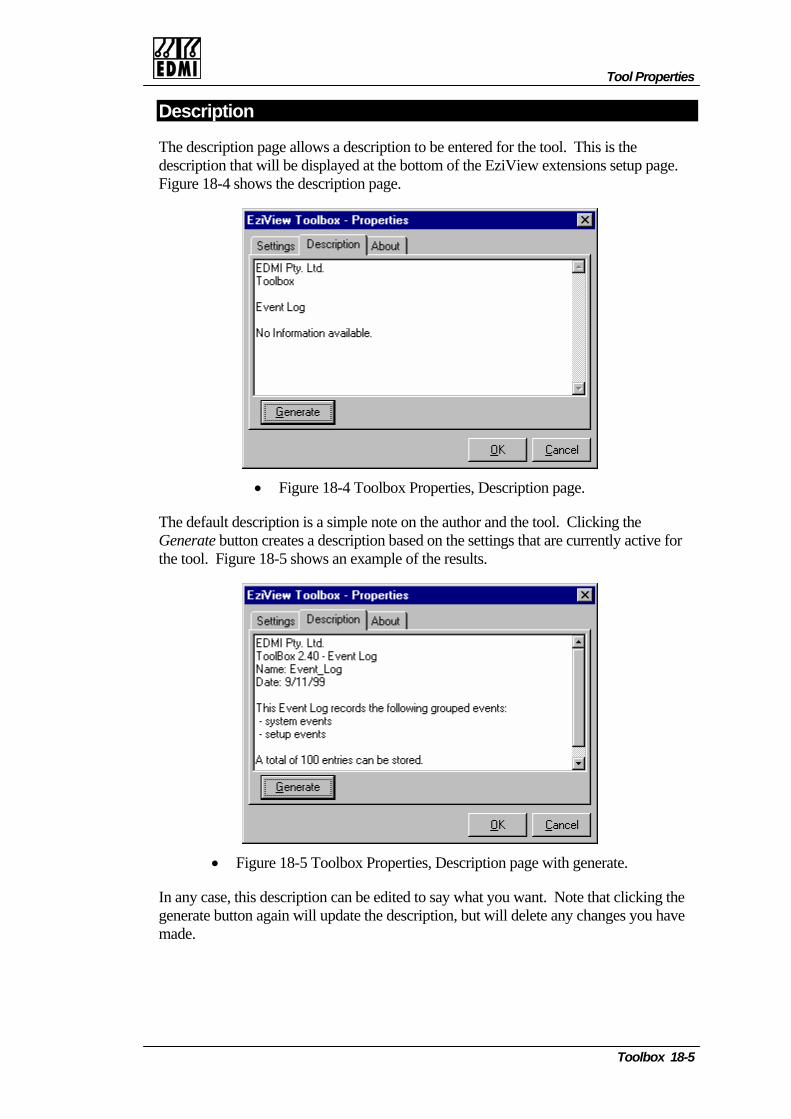
Tool Properties
Description
The description page allows a description to be entered for the tool. This is the description that will be displayed at the bottom of the EziView extensions setup page. Figure 18-4 shows the description page.
• Figure 18-4 Toolbox Properties, Description page.
The default description is a simple note on the author and the tool. Clicking the Generate button creates a description based on the settings that are currently active for the tool. Figure 18-5 shows an example of the results.
• Figure 18-5 Toolbox Properties, Description page with generate.
In any case, this description can be edited to say what you want. Note that clicking the generate button again will update the description, but will delete any changes you have made.
Toolbox 18-5
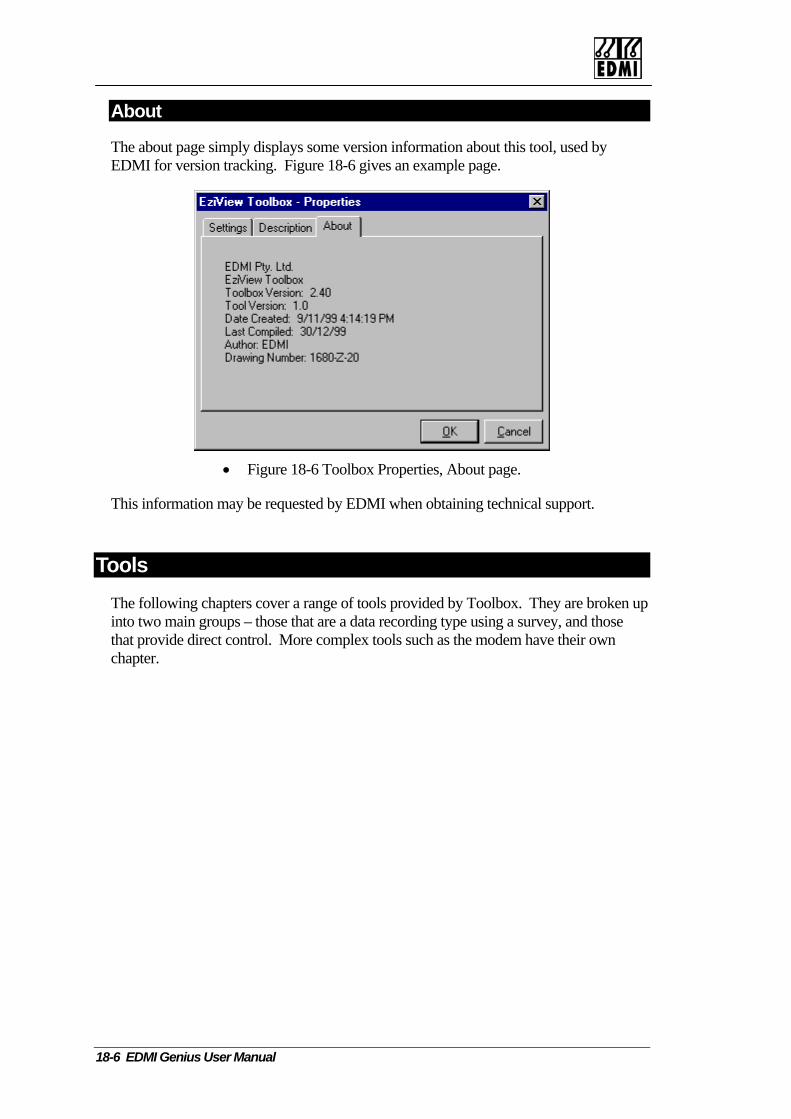
About
The about page simply displays some version information about this tool, used by EDMI for version tracking. Figure 18-6 gives an example page.
• Figure 18-6 Toolbox Properties, About page.
This information may be requested by EDMI when obtaining technical support.
Tools The following chapters cover a range of tools provided by Toolbox. They are broken up into two main groups – those that are a data recording type using a survey, and those that provide direct control. More complex tools such as the modem have their own chapter.
18-6 EDMI Genius User Manual

Chapter 19 SurThis chapter covers all of the general tools that record information in aare at present:
• Load Survey
• Billing History
• Event Log
• Sag/Swell Log
Work is ongoing on creating new tools. Contact EDMI for more infor
The preceding 2 chapters should be read before this chapter as knowledassumed.
C h a p t e r
19
Survey Tools 19-1
vey Tools survey. These
mation.
ge of them is
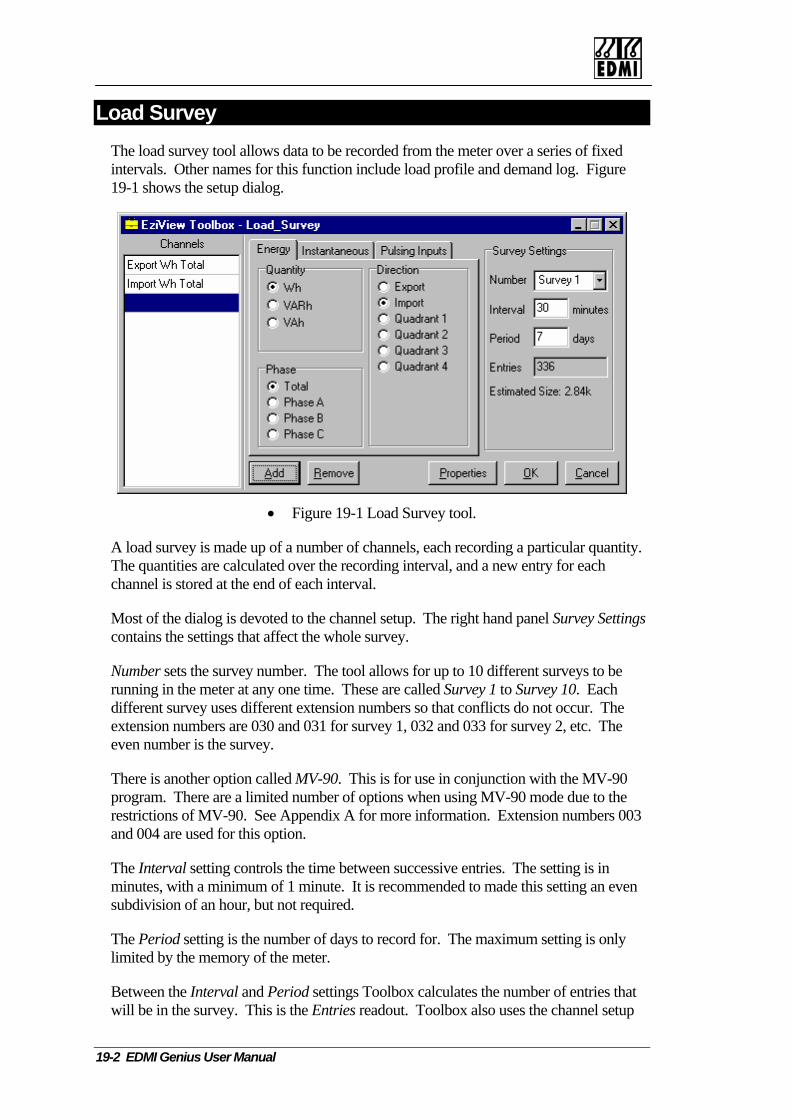
Load Survey The load survey tool allows data to be recorded from the meter over a series of fixed intervals. Other names for this function include load profile and demand log. Figure 19-1 shows the setup dialog.
• Figure 19-1 Load Survey tool.
A load survey is made up of a number of channels, each recording a particular quantity. The quantities are calculated over the recording interval, and a new entry for each channel is stored at the end of each interval.
Most of the dialog is devoted to the channel setup. The right hand panel Survey Settings contains the settings that affect the whole survey.
Number sets the survey number. The tool allows for up to 10 different surveys to be running in the meter at any one time. These are called Survey 1 to Survey 10. Each different survey uses different extension numbers so that conflicts do not occur. The extension numbers are 030 and 031 for survey 1, 032 and 033 for survey 2, etc. The even number is the survey.
There is another option called MV-90. This is for use in conjunction with the MV-90 program. There are a limited number of options when using MV-90 mode due to the restrictions of MV-90. See Appendix A for more information. Extension numbers 003 and 004 are used for this option.
The Interval setting controls the time between successive entries. The setting is in minutes, with a minimum of 1 minute. It is recommended to made this setting an even subdivision of an hour, but not required.
The Period setting is the number of days to record for. The maximum setting is only limited by the memory of the meter.
Between the Interval and Period settings Toolbox calculates the number of entries that will be in the survey. This is the Entries readout. Toolbox also uses the channel setup
19-2 EDMI Genius User Manual
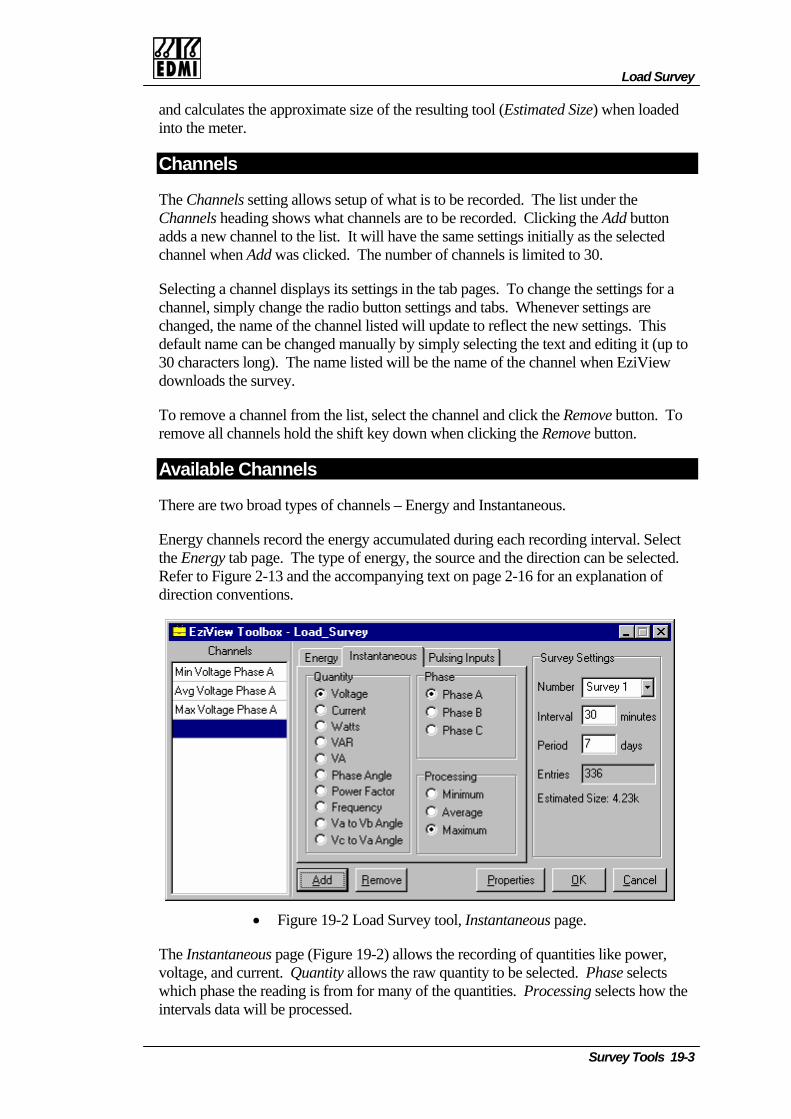
Load Survey
and calculates the approximate size of the resulting tool (Estimated Size) when loaded into the meter.
Channels
The Channels setting allows setup of what is to be recorded. The list under the Channels heading shows what channels are to be recorded. Clicking the Add button adds a new channel to the list. It will have the same settings initially as the selected channel when Add was clicked. The number of channels is limited to 30.
Selecting a channel displays its settings in the tab pages. To change the settings for a channel, simply change the radio button settings and tabs. Whenever settings are changed, the name of the channel listed will update to reflect the new settings. This default name can be changed manually by simply selecting the text and editing it (up to 30 characters long). The name listed will be the name of the channel when EziView downloads the survey.
To remove a channel from the list, select the channel and click the Remove button. To remove all channels hold the shift key down when clicking the Remove button.
Available Channels
There are two broad types of channels – Energy and Instantaneous.
Energy channels record the energy accumulated during each recording interval. Select the Energy tab page. The type of energy, the source and the direction can be selected. Refer to Figure 2-13 and the accompanying text on page 2-16 for an explanation of direction conventions.
• Figure 19-2 Load Survey tool, Instantaneous page.
The Instantaneous page (Figure 19-2) allows the recording of quantities like power, voltage, and current. Quantity allows the raw quantity to be selected. Phase selects which phase the reading is from for many of the quantities. Processing selects how the intervals data will be processed.
Survey Tools 19-3
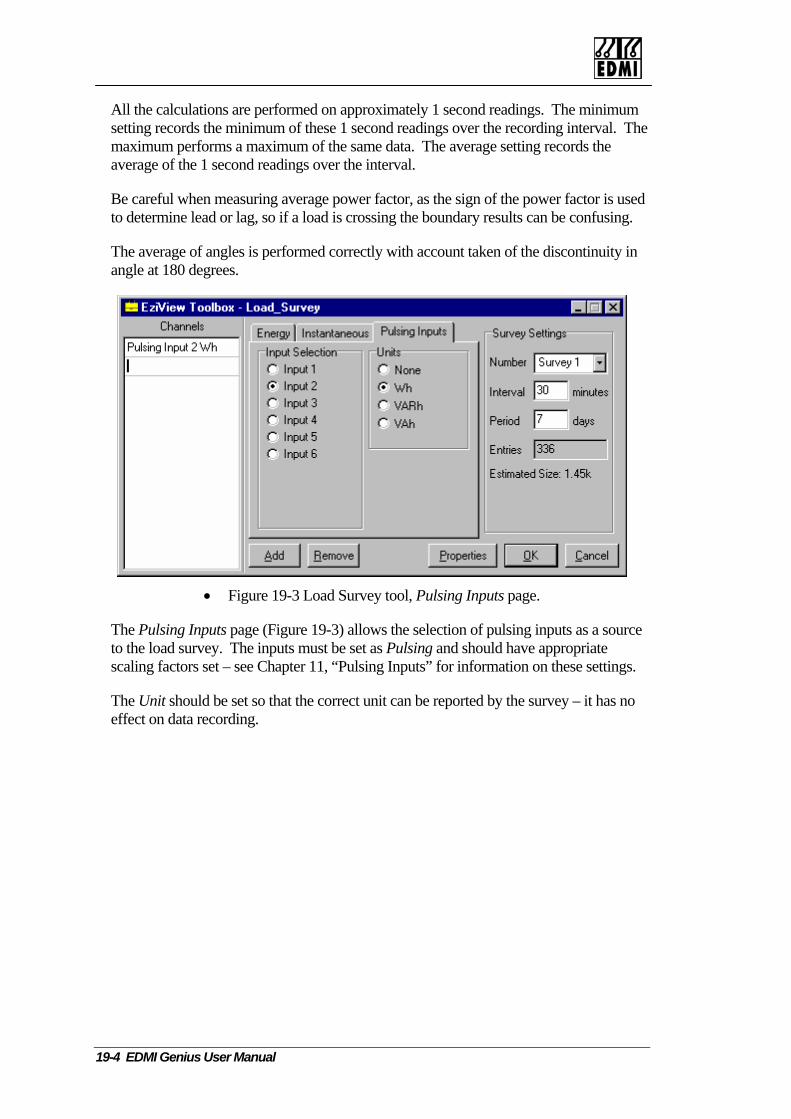
All the calculations are performed on approximately 1 second readings. The minimum setting records the minimum of these 1 second readings over the recording interval. The maximum performs a maximum of the same data. The average setting records the average of the 1 second readings over the interval.
Be careful when measuring average power factor, as the sign of the power factor is used to determine lead or lag, so if a load is crossing the boundary results can be confusing.
The average of angles is performed correctly with account taken of the discontinuity in angle at 180 degrees.
• Figure 19-3 Load Survey tool, Pulsing Inputs page.
The Pulsing Inputs page (Figure 19-3) allows the selection of pulsing inputs as a source to the load survey. The inputs must be set as Pulsing and should have appropriate scaling factors set – see Chapter 11, “Pulsing Inputs” for information on these settings.
The Unit should be set so that the correct unit can be reported by the survey – it has no effect on data recording.
19-4 EDMI Genius User Manual

Billing History Tool
Billing History Tool The billing history tool is used to extend the TOU system (Chapter 13). Normally the TOU system only records historical information for the last billing period. The billing history tool allows the data to be logged for many more billing periods. It does this by storing selected data items in a survey when billing resets occur. Figure 19-4 shows the setup dialog.
• Figure 19-4 Billing History tool.
The structure is similar to the load survey tool. The big difference is that stores occur when a billing reset occurs, not at a specific time interval. The other difference is of course that different data is available for recording.
The left hand Readings pane lists the reads to be recorded. The number in the box besides each entry indicates the channel number, 1 to 12. The name is automatically generated, but can be edited.
The rest of the dialog shows the settings for the selected reading. Clicking Add adds a new reading with the same settings as that selected. Clicking Delete deletes the selected reading, and clicking Delete with the shift key down will delete all readings.
The Meters Channel Name selects which TOU channel to record for the selected reading. The names are taken from the TOU channel setup page in EziView.
The Type section selects the type of reading to take – Energy, Maximum Demand, or Time of Maximum Demand.
The Rate setting selects which rate to record in the reading. The Entries setting sets how many previous periods will be recorded. Estimated Size gives an estimated size for the tool when in the meter.
Survey Tools 19-5

The Interval setting selects whether to take a reading of the value over the billing period, or to take a reading of the cumulative value over ‘all’ time. Figure 19-5 gives an illustration of the billing history.
Current Previous 1 Previous 2 Previous 3 Previous 4 Previous…
• Figure 19-5 Billing Period Diagram.
The Current period is data form now back till the last billing reset. The Previous x periods are periods between billing resets. The Previous… period is all previous data back to when the TOU system was cleared.
A setup with Entries set to 4 would record data for the 4 numbers periods shown. If Interval is set to Period the data recorded between the two billing resets that surround the period is recorded. If set to Cumulative, the cumulative data at the time of the last 4 billing resets is recorded. Cumulative data is data since the TOU system was cleared. Time of Max. Dem. is not available for cumulative readings as it has no meaning.
Notes
Generally the size of this tool is quite small because the data rate is so low. This allows it to be setup for FLASH backup if so desired.
The extension number for the survey is 001.
To display the previous periods on the LCD or read them out individually the survey recent data registers can be used. For this tool the register number format is 0012aabb. The aa is the reading, 0 being the reading status, then 1 onwards is the readings in the order listed in the tool. The bb is the reading number, 0 being the most recent reading.
Note that before a reading has been recorded, the recent data register for it does not exist and will display on the LCD as undefined.
19-6 EDMI Genius User Manual
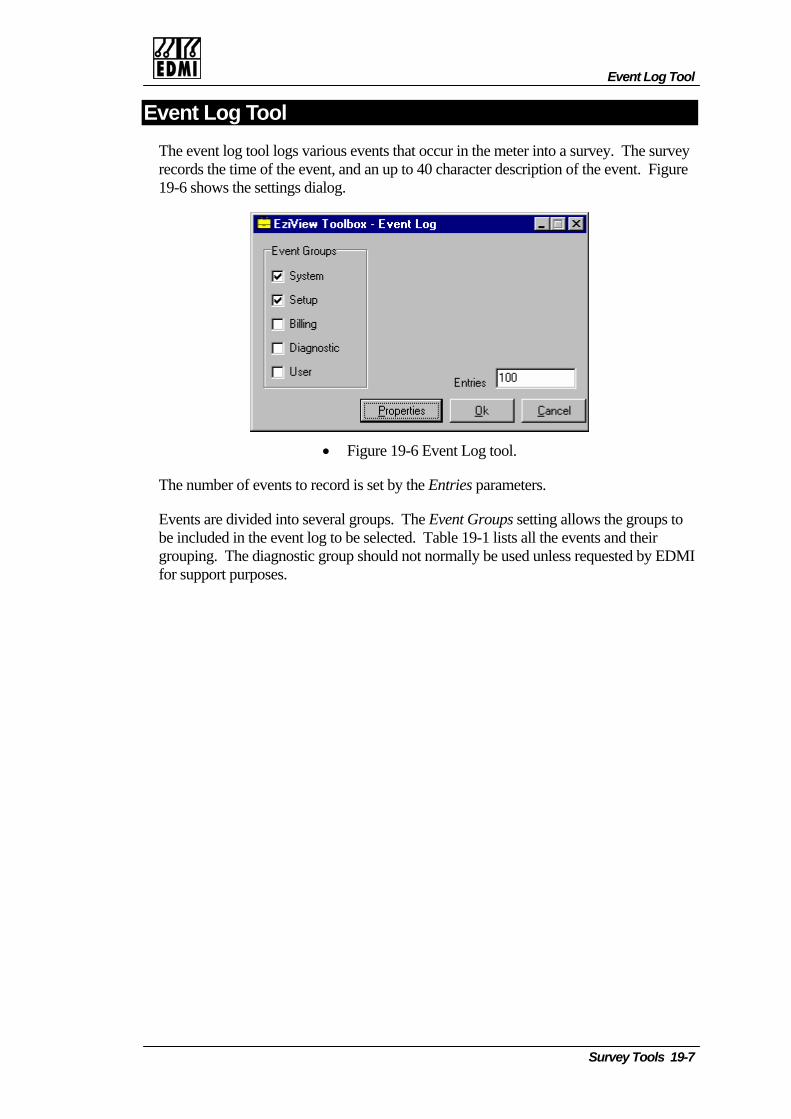
Event Log Tool
Event Log Tool The event log tool logs various events that occur in the meter into a survey. The survey records the time of the event, and an up to 40 character description of the event. Figure 19-6 shows the settings dialog.
• Figure 19-6 Event Log tool.
The number of events to record is set by the Entries parameters.
Events are divided into several groups. The Event Groups setting allows the groups to be included in the event log to be selected. Table 19-1 lists all the events and their grouping. The diagnostic group should not normally be used unless requested by EDMI for support purposes.
Survey Tools 19-7
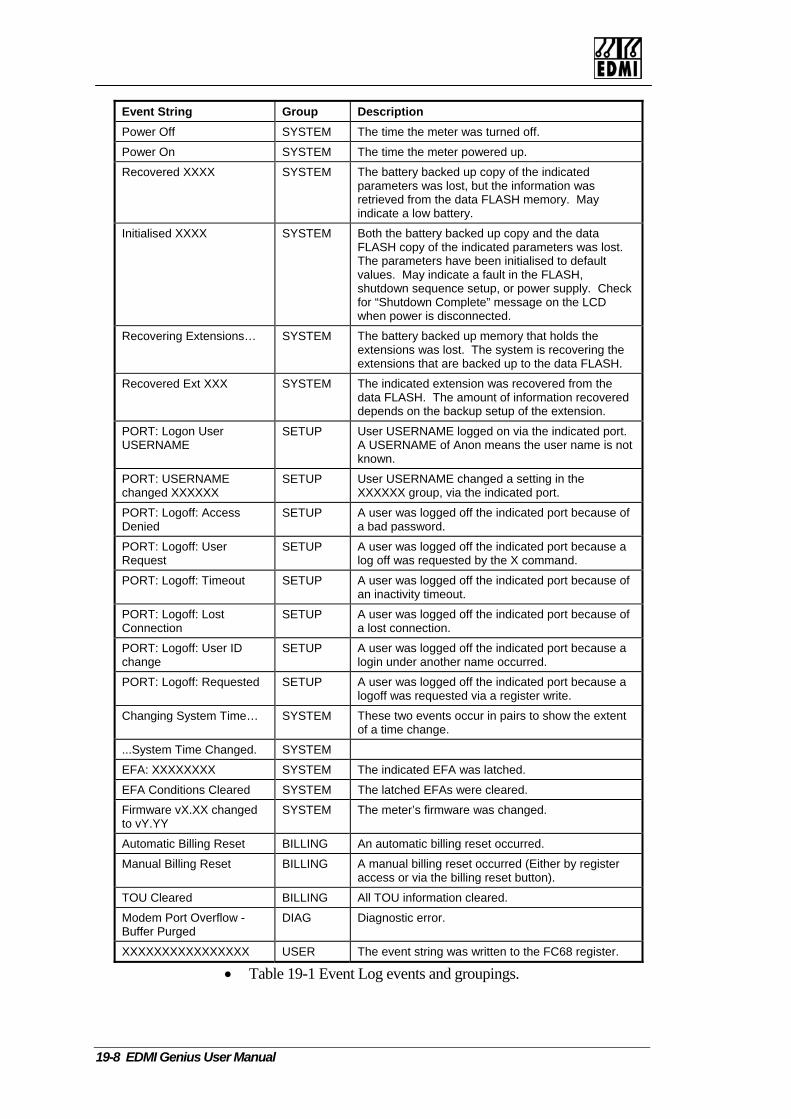
Event String Group Description Power Off SYSTEM The time the meter was turned off.
Power On SYSTEM The time the meter powered up.
Recovered XXXX SYSTEM The battery backed up copy of the indicated parameters was lost, but the information was retrieved from the data FLASH memory. May indicate a low battery.
Initialised XXXX SYSTEM Both the battery backed up copy and the data FLASH copy of the indicated parameters was lost. The parameters have been initialised to default values. May indicate a fault in the FLASH, shutdown sequence setup, or power supply. Check for “Shutdown Complete” message on the LCD when power is disconnected.
Recovering Extensions… SYSTEM The battery backed up memory that holds the extensions was lost. The system is recovering the extensions that are backed up to the data FLASH.
Recovered Ext XXX SYSTEM The indicated extension was recovered from the data FLASH. The amount of information recovered depends on the backup setup of the extension.
PORT: Logon User USERNAME
SETUP User USERNAME logged on via the indicated port. A USERNAME of Anon means the user name is not known.
PORT: USERNAME changed XXXXXX
SETUP User USERNAME changed a setting in the XXXXXX group, via the indicated port.
PORT: Logoff: Access Denied
SETUP A user was logged off the indicated port because of a bad password.
PORT: Logoff: User Request
SETUP A user was logged off the indicated port because a log off was requested by the X command.
PORT: Logoff: Timeout SETUP A user was logged off the indicated port because of an inactivity timeout.
PORT: Logoff: Lost Connection
SETUP A user was logged off the indicated port because of a lost connection.
PORT: Logoff: User ID change
SETUP A user was logged off the indicated port because a login under another name occurred.
PORT: Logoff: Requested SETUP A user was logged off the indicated port because a logoff was requested via a register write.
Changing System Time… SYSTEM These two events occur in pairs to show the extent of a time change.
...System Time Changed. SYSTEM
EFA: XXXXXXXX SYSTEM The indicated EFA was latched.
EFA Conditions Cleared SYSTEM The latched EFAs were cleared.
Firmware vX.XX changed to vY.YY
SYSTEM The meter’s firmware was changed.
Automatic Billing Reset BILLING An automatic billing reset occurred.
Manual Billing Reset BILLING A manual billing reset occurred (Either by register access or via the billing reset button).
TOU Cleared BILLING All TOU information cleared.
Modem Port Overflow - Buffer Purged
DIAG Diagnostic error.
XXXXXXXXXXXXXXXX USER The event string was written to the FC68 register.
• Table 19-1 Event Log events and groupings.
19-8 EDMI Genius User Manual

Event Log Tool
Survey Tools 19-9
Writing a string to register FC68 will manually create an event in the USER group, with a time stamp of the current time.
The groupings of setup are based on the security groups, and are designed to correspond with EziView setup pages. A setup change event is generated when a write is performed on the indicated groups for the first time in a logon session. Table 19-2 lists the setup groupings.
Setup Group Security Groups Alarms 18, 25, 26, 117 - 121
Calibration 65, 67 – 77
Eziport 205
Com ports 103 - 114, 206
Time window 102
LCD screens 78, 85 – 89
Inputs 22, 188 – 193
Outputs 146 – 154
Security 123, 124, 137 - 143
System param 3, 4, 5, 11, 12, 13
TOU times 91
Time setup 94, 187, 203
TOU setup 122, 136
Ratios 6, 66
Extensions 198
• Table 19-2 Event Log setup change events.
The event log has an extension number of 005.
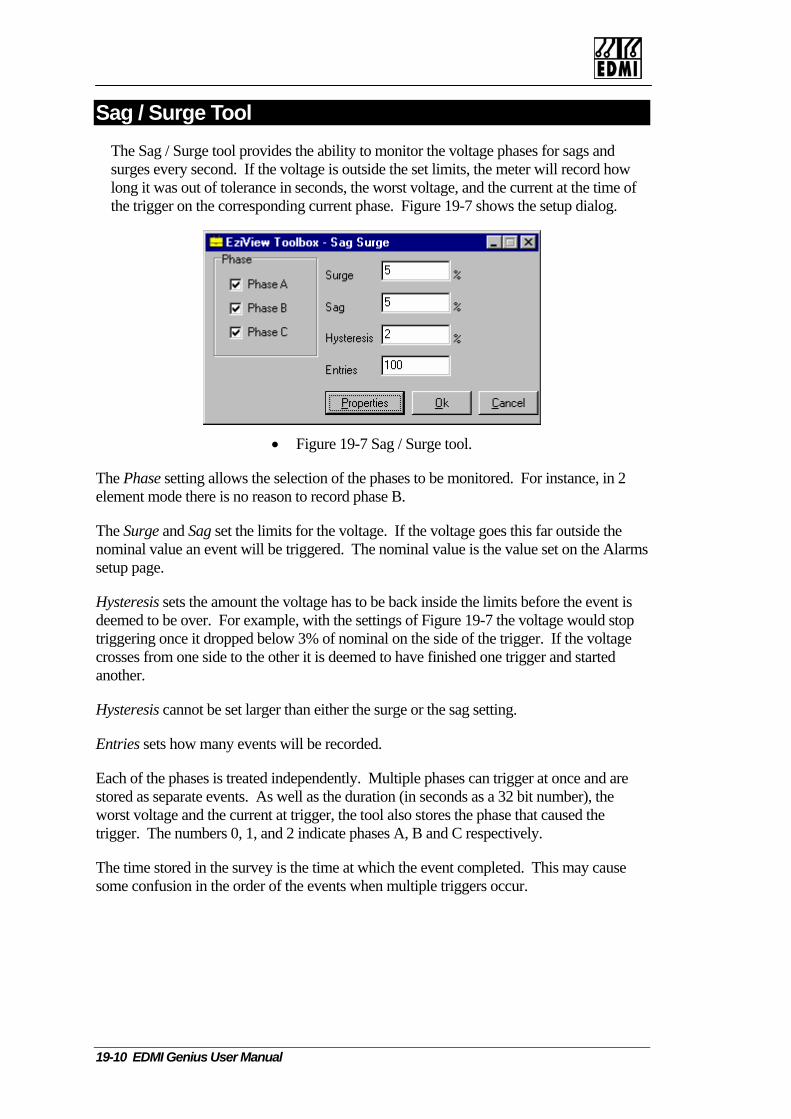
Sag / Surge Tool The Sag / Surge tool provides the ability to monitor the voltage phases for sags and surges every second. If the voltage is outside the set limits, the meter will record how long it was out of tolerance in seconds, the worst voltage, and the current at the time of the trigger on the corresponding current phase. Figure 19-7 shows the setup dialog.
• Figure 19-7 Sag / Surge tool.
The Phase setting allows the selection of the phases to be monitored. For instance, in 2 element mode there is no reason to record phase B.
The Surge and Sag set the limits for the voltage. If the voltage goes this far outside the nominal value an event will be triggered. The nominal value is the value set on the Alarms setup page.
Hysteresis sets the amount the voltage has to be back inside the limits before the event is deemed to be over. For example, with the settings of Figure 19-7 the voltage would stop triggering once it dropped below 3% of nominal on the side of the trigger. If the voltage crosses from one side to the other it is deemed to have finished one trigger and started another.
Hysteresis cannot be set larger than either the surge or the sag setting.
Entries sets how many events will be recorded.
Each of the phases is treated independently. Multiple phases can trigger at once and are stored as separate events. As well as the duration (in seconds as a 32 bit number), the worst voltage and the current at trigger, the tool also stores the phase that caused the trigger. The numbers 0, 1, and 2 indicate phases A, B and C respectively.
The time stored in the survey is the time at which the event completed. This may cause some confusion in the order of the events when multiple triggers occur.
19-10 EDMI Genius User Manual

Chapter 20 ConThere are no pure control tools available at this time. Check with EDMreleases.
C h a p t e r
20
Control Tools 20-1
trol Tools I for new

Intentionally Blank
20-2 EDMI Genius User Manual

M
Chapter 21 ModeThis chapter describes how to configure the EDMI Genius Energy Memodem.
Required setup components The following is required for modem operation:
• A Genius Energy meter with the modem port option.
• A Hayes compatible modem.
• A cable to connect the modem to the meter.
• The Modem tool must be loaded into the meter.
• The meter must be configured for the modem using EziView.
Compatible Modems The meter is designed for use with modems that use the Hayes AT comcontrol the modem. The modem should have an RS-232 connection, winclude the signals Ground, Tx, Rx, DCD, and DTR. The hardware hasignals RTS and CTS are also supported. The meter does not use the R
The modem must be able to support
• No command echo
• Hang up on DTR drop
• DCD follows carrier detect
• Auto answer
C h a p t e r
21
odem Control 21-1
m Control ter for use with a
mand set to hich must ndshaking I signal.
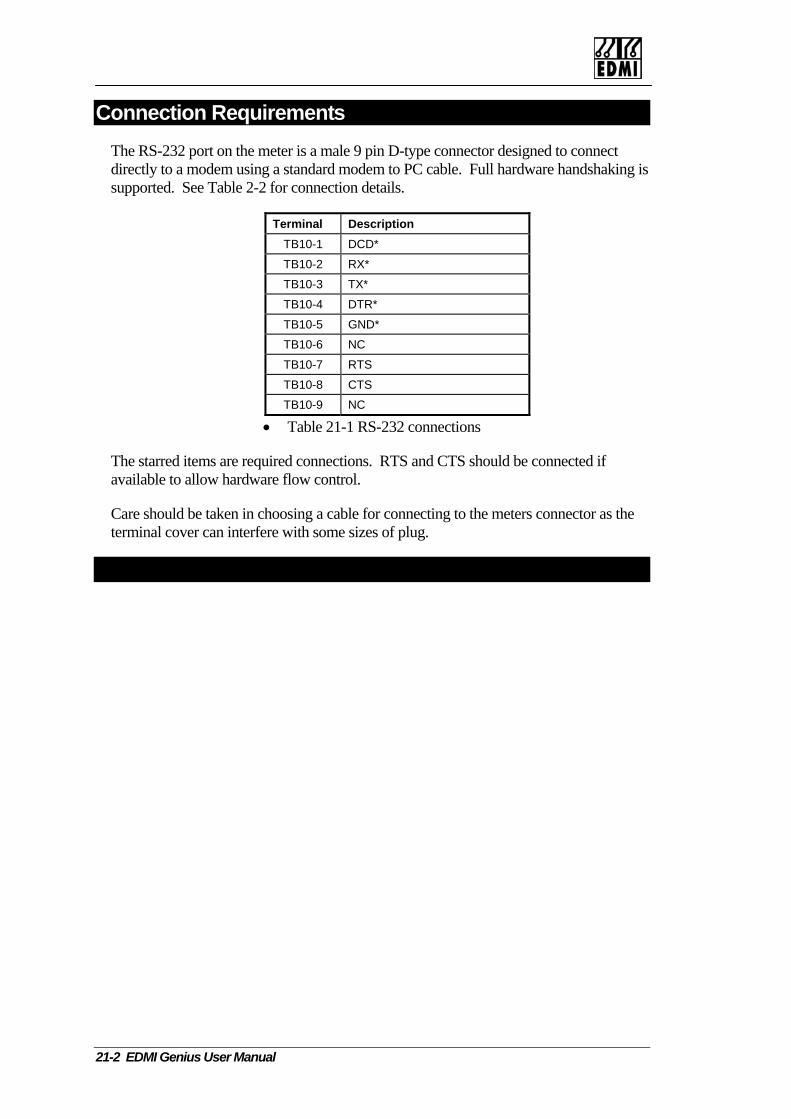
Connection Requirements The RS-232 port on the meter is a male 9 pin D-type connector designed to connect directly to a modem using a standard modem to PC cable. Full hardware handshaking is supported. See Table 2-2 for connection details.
Terminal Description TB10-1 DCD*
TB10-2 RX*
TB10-3 TX*
TB10-4 DTR*
TB10-5 GND*
TB10-6 NC
TB10-7 RTS
TB10-8 CTS
TB10-9 NC
• Table 21-1 RS-232 connections
The starred items are required connections. RTS and CTS should be connected if available to allow hardware flow control.
Care should be taken in choosing a cable for connecting to the meters connector as the terminal cover can interfere with some sizes of plug.
21-2 EDMI Genius User Manual
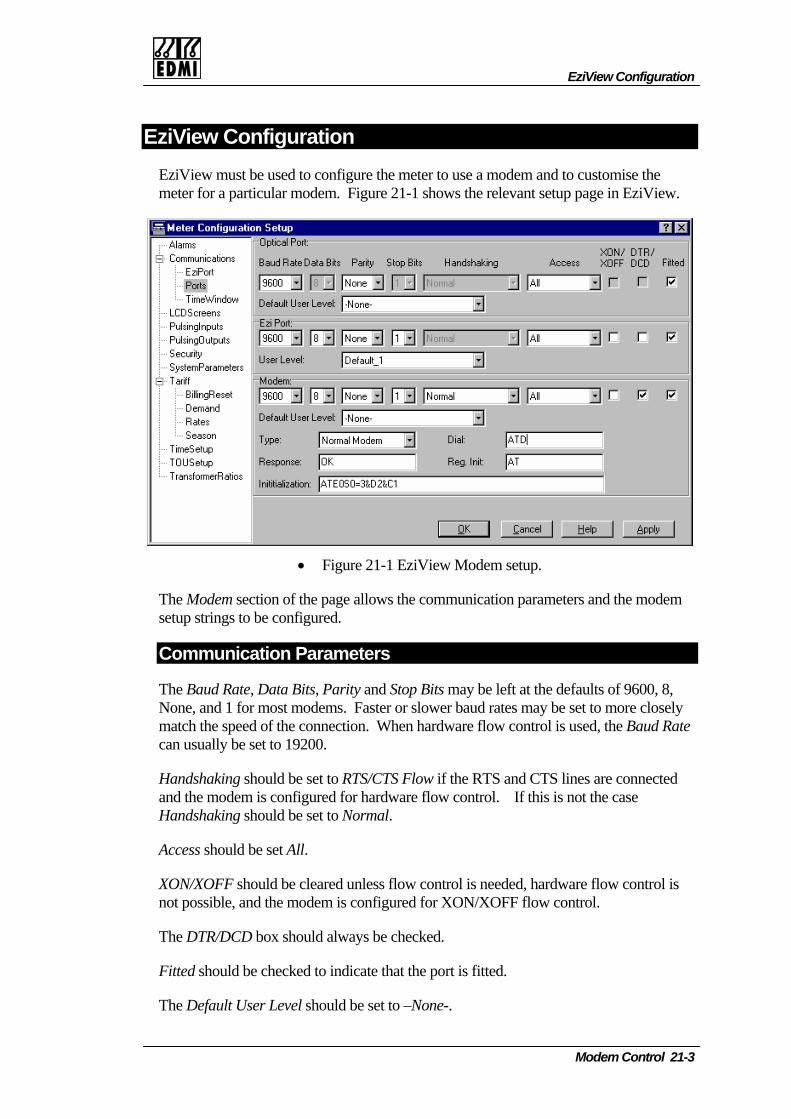
EziView Configuration
EziView Configuration EziView must be used to configure the meter to use a modem and to customise the meter for a particular modem. Figure 21-1 shows the relevant setup page in EziView.
• Figure 21-1 EziView Modem setup.
The Modem section of the page allows the communication parameters and the modem setup strings to be configured.
Communication Parameters
The Baud Rate, Data Bits, Parity and Stop Bits may be left at the defaults of 9600, 8, None, and 1 for most modems. Faster or slower baud rates may be set to more closely match the speed of the connection. When hardware flow control is used, the Baud Rate can usually be set to 19200.
Handshaking should be set to RTS/CTS Flow if the RTS and CTS lines are connected and the modem is configured for hardware flow control. If this is not the case Handshaking should be set to Normal.
Access should be set All.
XON/XOFF should be cleared unless flow control is needed, hardware flow control is not possible, and the modem is configured for XON/XOFF flow control.
The DTR/DCD box should always be checked.
Fitted should be checked to indicate that the port is fitted.
The Default User Level should be set to –None-.
Modem Control 21-3

Modem Setup
Type should be set to Normal Modem for most circumstances. The meter will send the initialisation string to the modem regularly. For some modems this causes problems. In this case the Modem No Init setting should be used and the setup string for the modem should be written permanently to the modem using a PC.
Response should be set to the response received when a valid command line is received (generally 'OK')
The initialisation string must include the AT and:
• It must also turn echo off (generally E0)
• It must set auto answer to on (S0=x, where x is the number of rings before answering and is not zero)
• It must be set to go on hook and return to command state when DTR drops (&D2)
• It must set DCD to follow carrier when modem is online (&C1)
• There may also be a command for modem flow control (&K2)
This gives a string such as “ATE0S0=3&D2&C1” for no flow control. These commands are common for most modems, but some modems use slightly different commands. See your modem manual for details.
The Reg. Init and Dial fields are unused.
The time between sending the initialisation string is 60 seconds. After 5 failed attempts at initialisation the meter will set the modem EFA but keep trying to initialise it. As soon as the modem responds the EFA is cleared and the failed counter is zeroed.
The script does not turn DTR/DCD handshaking on (&C1 turns it on for most modems) or RTS/CTS flow control (&K2 turns it on for most modems) on. These must be setup in the initialisation string in EziView.
21-4 EDMI Genius User Manual
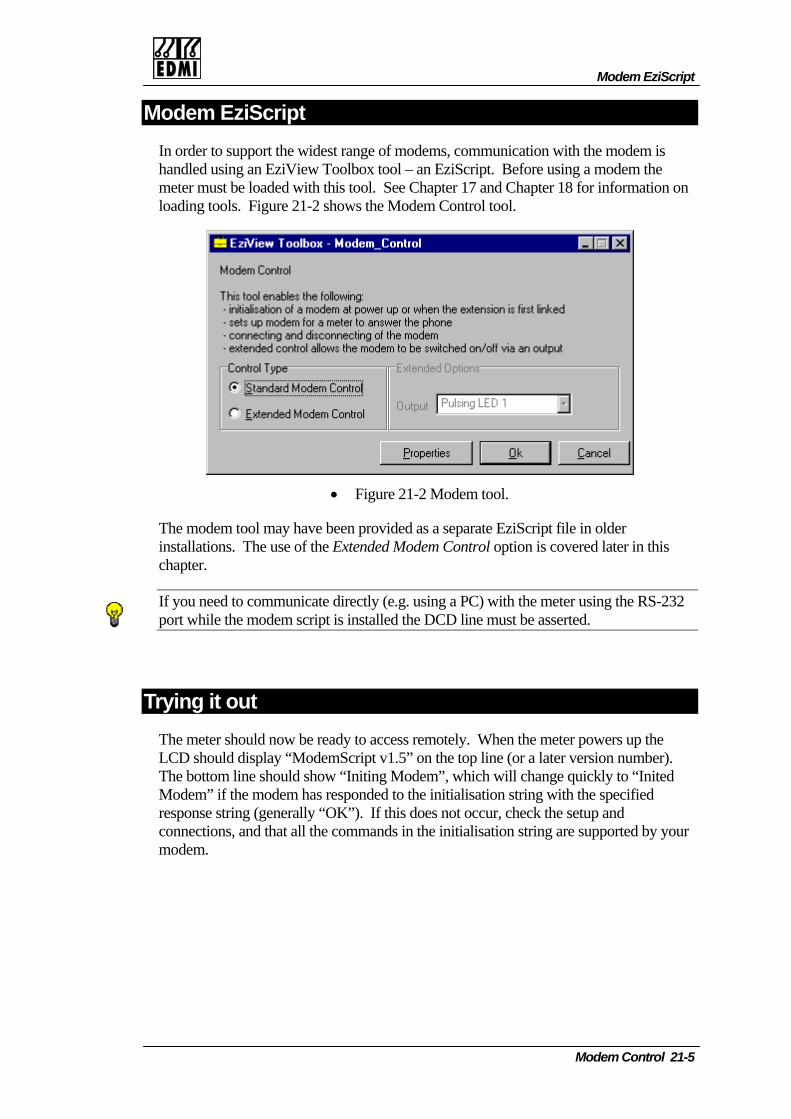
Modem EziScript
Modem Control 21-5
Modem EziScript In order to support the widest range of modems, communication with the modem is handled using an EziView Toolbox tool – an EziScript. Before using a modem the meter must be loaded with this tool. See Chapter 17 and Chapter 18 for information on loading tools. Figure 21-2 shows the Modem Control tool.
• Figure 21-2 Modem tool.
The modem tool may have been provided as a separate EziScript file in older installations. The use of the Extended Modem Control option is covered later in this chapter.
If you need to communicate directly (e.g. using a PC) with the meter using the RS-232 port while the modem script is installed the DCD line must be asserted.
Trying it out The meter should now be ready to access remotely. When the meter powers up the LCD should display “ModemScript v1.5” on the top line (or a later version number). The bottom line should show “Initing Modem”, which will change quickly to “Inited Modem” if the modem has responded to the initialisation string with the specified response string (generally “OK”). If this does not occur, check the setup and connections, and that all the commands in the initialisation string are supported by your modem.

Try ringing into the meter using EziView. You’ll need to set a modem as the connection method and a phone number to dial. (See Figure 21-3).
• Figure 21-3 EziView Site Properties Setup.
These are fairly normal dialing properties for Windows. The Configure button will let you configure the modem attached to the computer. To change dialing location details use Tools → Location (Figure 21-4).
• Figure 21-4 Dialing Location Properties.
21-6 EDMI Genius User Manual
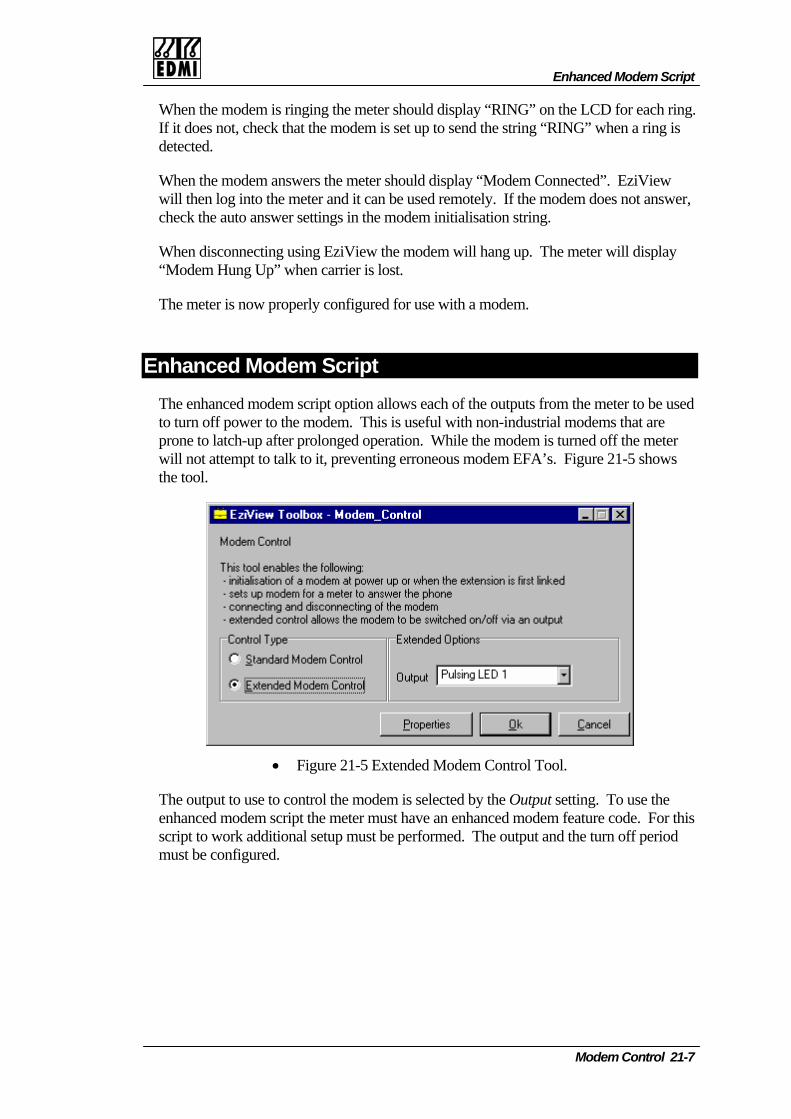
Enhanced Modem Script
When the modem is ringing the meter should display “RING” on the LCD for each ring. If it does not, check that the modem is set up to send the string “RING” when a ring is detected.
When the modem answers the meter should display “Modem Connected”. EziView will then log into the meter and it can be used remotely. If the modem does not answer, check the auto answer settings in the modem initialisation string.
When disconnecting using EziView the modem will hang up. The meter will display “Modem Hung Up” when carrier is lost.
The meter is now properly configured for use with a modem.
Enhanced Modem Script The enhanced modem script option allows each of the outputs from the meter to be used to turn off power to the modem. This is useful with non-industrial modems that are prone to latch-up after prolonged operation. While the modem is turned off the meter will not attempt to talk to it, preventing erroneous modem EFA’s. Figure 21-5 shows the tool.
• Figure 21-5 Extended Modem Control Tool.
The output to use to control the modem is selected by the Output setting. To use the enhanced modem script the meter must have an enhanced modem feature code. For this script to work additional setup must be performed. The output and the turn off period must be configured.
Modem Control 21-7

Output Setup
The output configured for use in the Modem Control tool must be configured as a Fixed Output. (See Figure 21-6, e.g. Output 3)
• Figure 21-6 EziView Pulsing Output Properties Setup.
With the Inv box cleared the relay will close when the modem is to be turned on. If this is the wrong way around for your application the Inv box can be checked to change the polarity.
21-8 EDMI Genius User Manual
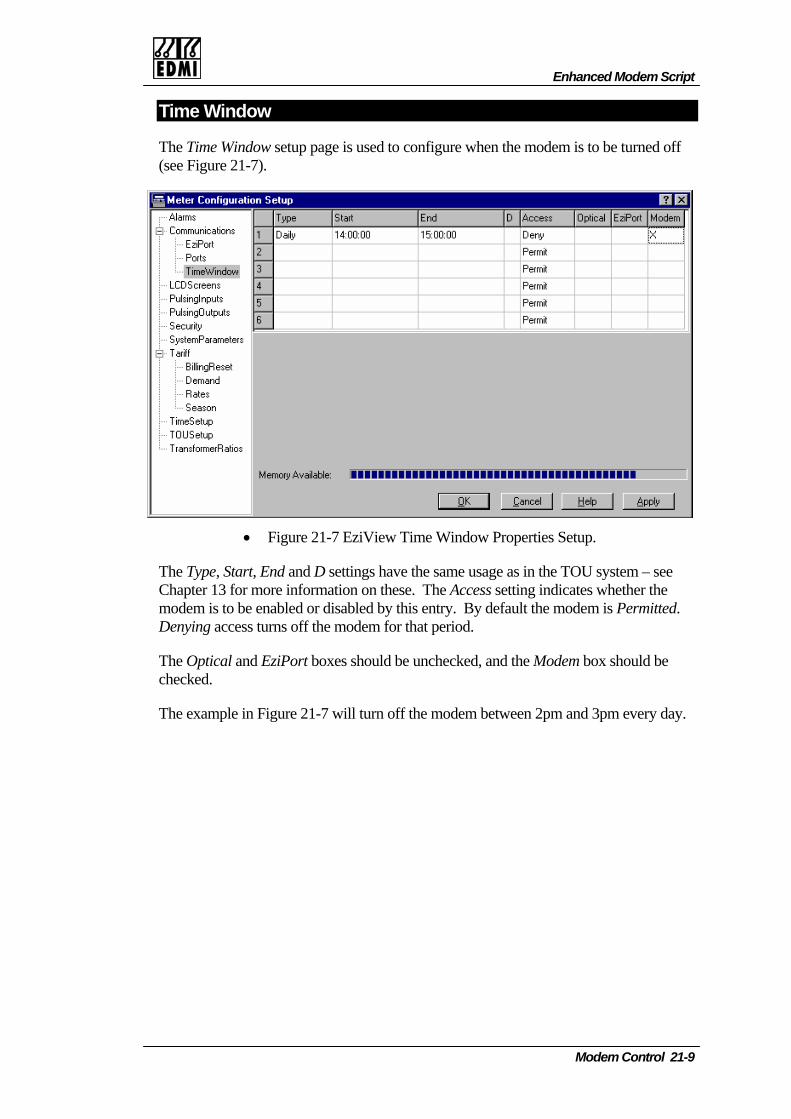
Enhanced Modem Script
Time Window
The Time Window setup page is used to configure when the modem is to be turned off (see Figure 21-7).
• Figure 21-7 EziView Time Window Properties Setup.
The Type, Start, End and D settings have the same usage as in the TOU system – see Chapter 13 for more information on these. The Access setting indicates whether the modem is to be enabled or disabled by this entry. By default the modem is Permitted. Denying access turns off the modem for that period.
The Optical and EziPort boxes should be unchecked, and the Modem box should be checked.
The example in Figure 21-7 will turn off the modem between 2pm and 3pm every day.
Modem Control 21-9

Intentionally Blank
21-10 EDMI Genius User Manual

Adv
Part IV Advanced
his section covers topics in some of the more advanced usages of thave not been covered so far. The chapters in this section may beorder, but familiarity with the previous parts of the manual is assu
• Chapter 22: “Testing”
• Chapter 23: “EziView Reading Files”
• Chapter 24: “EziView Script Files”
• Chapter 25: “Summation”
T
IV
P a r tanced Topics
Topics
he meter that read in any med.

Intentionally Blank
II EDMI Genius User Manual
There are two main ways to test the accuracy of the meter. These are voutputs, or via gated energy. Use the method that best suits your testin
Using the Pulsing Outputs The easiest way to test the accuracy is to use a pulsing LED (or pulsingmeter. The testing is then performed as it would be for a rotating disk meter.
Pulsing outputs are configured using EziView. For best results the pulno faster than 10 pulses per second. The test time should be at least 10
Using Gated Energy The meter has the ability to measure the energy between two gating putesting against another standard such as Radian RM-10’s that also has capability. The meters are gated for the same period of time, and the recompared.
This method of testing is only feasible if a gate input can be supplied tothe standard being tested against. Another method is to gate the meter pulses from another meter.
C h a p t e r
22
Testing 22-1
Chapter 22 Testing ia pulsing g system.
output) from the (Ferraris-type)
se rate should be seconds.
lses. This allows a gating adings are then
the meter and using the energy
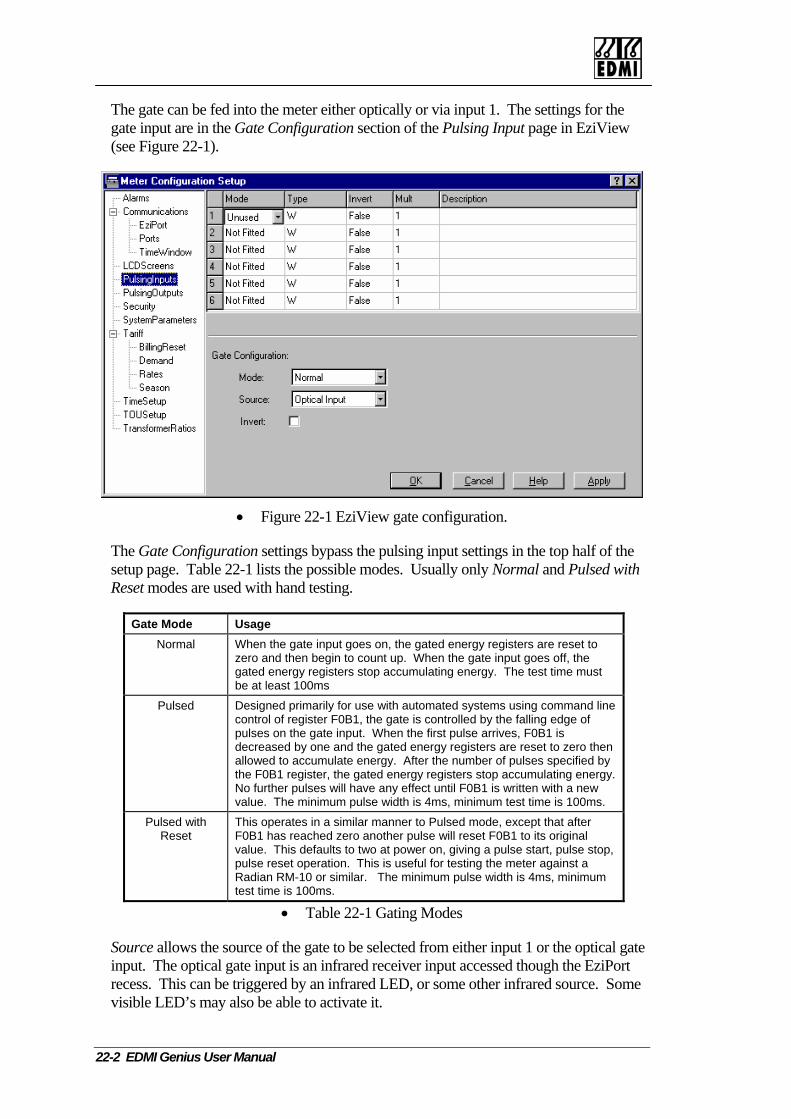
The gate can be fed into the meter either optically or via input 1. The settings for the gate input are in the Gate Configuration section of the Pulsing Input page in EziView (see Figure 22-1).
• Figure 22-1 EziView gate configuration.
The Gate Configuration settings bypass the pulsing input settings in the top half of the setup page. Table 22-1 lists the possible modes. Usually only Normal and Pulsed with Reset modes are used with hand testing.
Gate Mode Usage Normal When the gate input goes on, the gated energy registers are reset to
zero and then begin to count up. When the gate input goes off, the gated energy registers stop accumulating energy. The test time must be at least 100ms
Pulsed Designed primarily for use with automated systems using command line control of register F0B1, the gate is controlled by the falling edge of pulses on the gate input. When the first pulse arrives, F0B1 is decreased by one and the gated energy registers are reset to zero then allowed to accumulate energy. After the number of pulses specified by the F0B1 register, the gated energy registers stop accumulating energy. No further pulses will have any effect until F0B1 is written with a new value. The minimum pulse width is 4ms, minimum test time is 100ms.
Pulsed with Reset
This operates in a similar manner to Pulsed mode, except that after F0B1 has reached zero another pulse will reset F0B1 to its original value. This defaults to two at power on, giving a pulse start, pulse stop, pulse reset operation. This is useful for testing the meter against a Radian RM-10 or similar. The minimum pulse width is 4ms, minimum test time is 100ms.
• Table 22-1 Gating Modes
Source allows the source of the gate to be selected from either input 1 or the optical gate input. The optical gate input is an infrared receiver input accessed though the EziPort recess. This can be triggered by an infrared LED, or some other infrared source. Some visible LED’s may also be able to activate it.
22-2 EDMI Genius User Manual

Using Gated Energy
The normal sense of input 1 is gate off. The normal sense of the optical gate input is no light. The invert option allows the sense of the gate to be reversed.
The current gate input can be viewed in the Online Variables → Gate page (see Figure 22-2).
• Figure 22-2 EziView Online Variables gate status.
This page gives a lot of information about the gate input. The Gate Status indicator will light up if the gate input is currently active (e.g. light is shining on the optical gate input). The Gate Active indicator will light up if the meter is currently accumulating gated energy. These indicators can be very useful in tracking down gate level and polarity problems.
The Pulses box gives the number of pulses to count – this is the starting value for register F0B1 described in Table 22-1. To change this value enter the new number into the Pulses box under Gate Setting. Click the Set Meter button to confirm the change. By default Pulses will be 2, which gives the pulse on, pulse off action commonly used. It can of course be set to any value, useful if the gate is fed from the pulsing output of another meter.
The Gate Override box allows the gate inputs to be overridden. When this box is checked the gate is controlled by the Gate Status checkbox, normally greyed out.
Testing 22-3
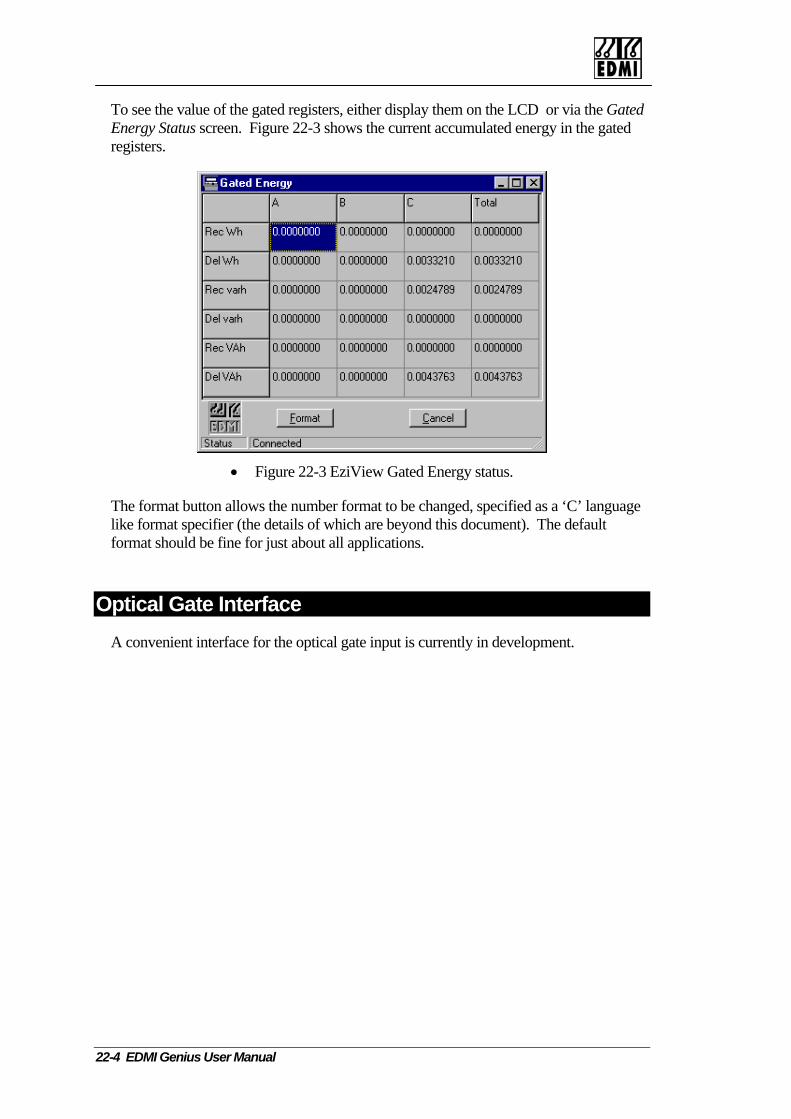
To see the value of the gated registers, either display them on the LCD or via the Gated Energy Status screen. Figure 22-3 shows the current accumulated energy in the gated registers.
• Figure 22-3 EziView Gated Energy status.
The format button allows the number format to be changed, specified as a ‘C’ language like format specifier (the details of which are beyond this document). The default format should be fine for just about all applications.
Optical Gate Interface A convenient interface for the optical gate input is currently in development.
22-4 EDMI Genius User Manual
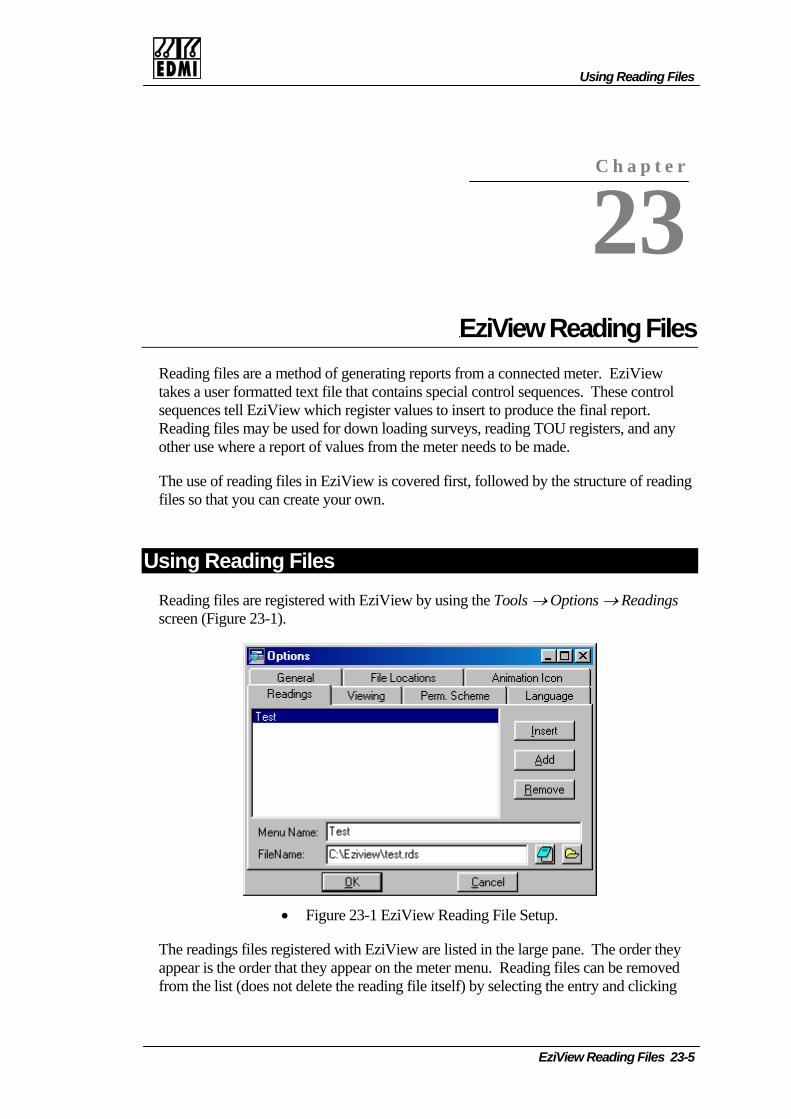
Using Reading Files
EziView
Chapter 23 EziView ReaReading files are a method of generating reports from a connected mettakes a user formatted text file that contains special control sequences. sequences tell EziView which register values to insert to produce the fiReading files may be used for down loading surveys, reading TOU regother use where a report of values from the meter needs to be made.
The use of reading files in EziView is covered first, followed by the strfiles so that you can create your own.
Using Reading Files
Reading files are registered with EziView by using the Tools → Optionscreen (Figure 23-1).
• Figure 23-1 EziView Reading File Setup.
The readings files registered with EziView are listed in the large pane. appear is the order that they appear on the meter menu. Reading files cfrom the list (does not delete the reading file itself) by selecting the ent
C h a p t e r
23
Reading Files 23-5
ding Files er. EziView These control nal report. isters, and any
ucture of reading
s → Readings
The order they an be removed
ry and clicking

the Remove button. Entries can be moved around by dragging them with the mouse using the left button.
To add a new reading file entry to the list use the Insert or Add buttons. Insert creates the entry ahead of the currently selected entry. Add creates the new entry at the end of the list.
The name of the reading file to appear on the menu is entered under Menu Name. This is also the name shown in the list. The Filename is the reading file name and location. It can be selected using the browse button, or simply typed in.
The notepad button causes the reading file to be opened by the default viewer (Notepad works quite well for this).
The entries in the list are added to the Meter menu under the item Readings (Figure 23-2) when the meter is connected.
• Figure 23-2 Reading files on the meter menu.
Selecting a reading causes the reading file to be processed and generates the output file as detailed by the reading file.
23-2 EDMI Genius User Manual
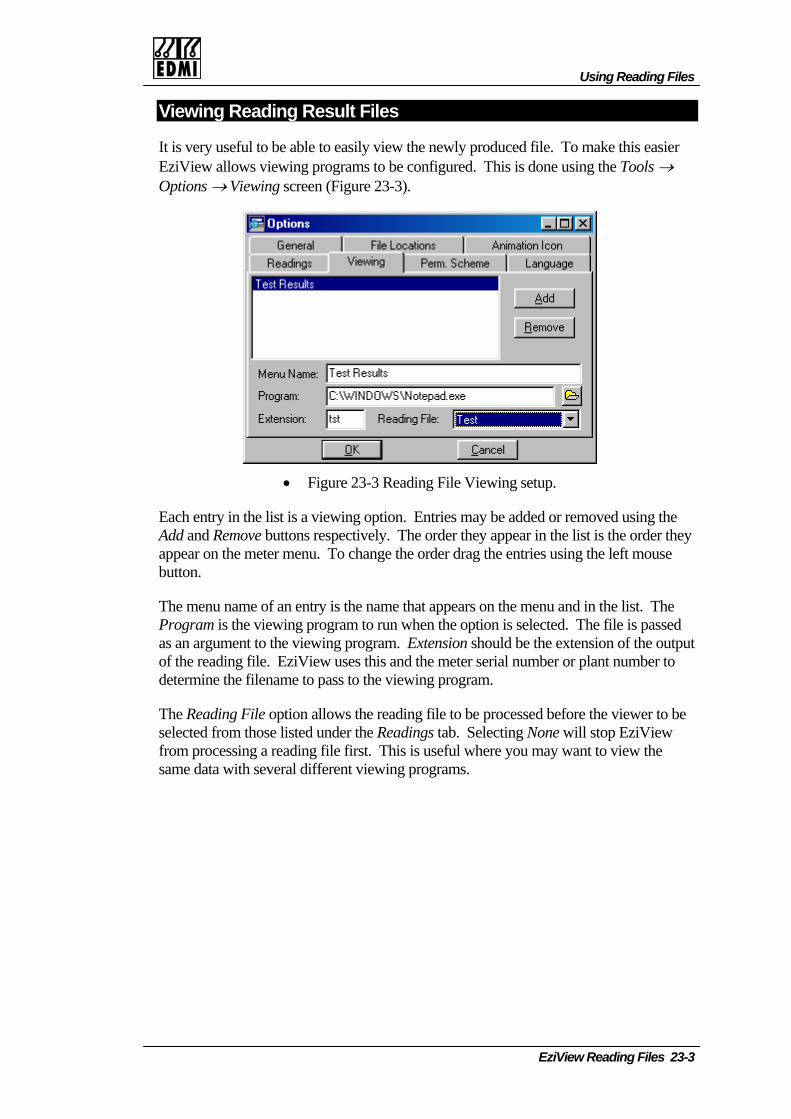
Using Reading Files
Viewing Reading Result Files
It is very useful to be able to easily view the newly produced file. To make this easier EziView allows viewing programs to be configured. This is done using the Tools → Options → Viewing screen (Figure 23-3).
• Figure 23-3 Reading File Viewing setup.
Each entry in the list is a viewing option. Entries may be added or removed using the Add and Remove buttons respectively. The order they appear in the list is the order they appear on the meter menu. To change the order drag the entries using the left mouse button.
The menu name of an entry is the name that appears on the menu and in the list. The Program is the viewing program to run when the option is selected. The file is passed as an argument to the viewing program. Extension should be the extension of the output of the reading file. EziView uses this and the meter serial number or plant number to determine the filename to pass to the viewing program.
The Reading File option allows the reading file to be processed before the viewer to be selected from those listed under the Readings tab. Selecting None will stop EziView from processing a reading file first. This is useful where you may want to view the same data with several different viewing programs.
EziView Reading Files 23-3
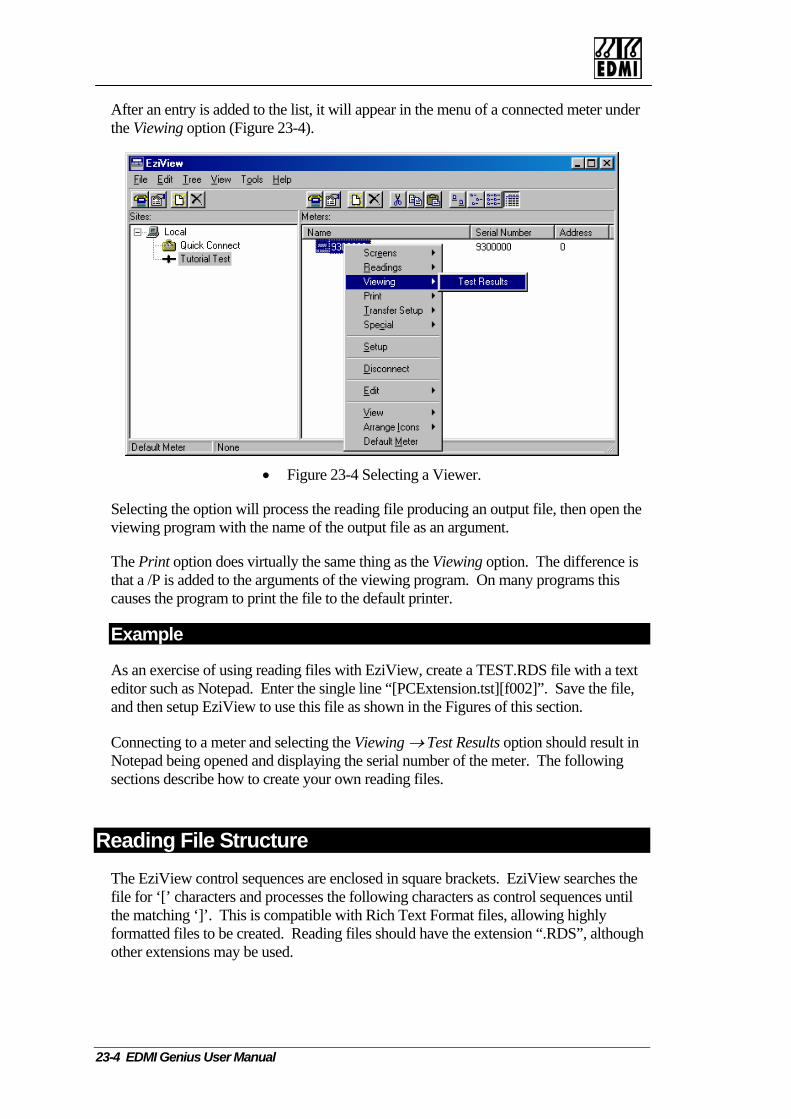
After an entry is added to the list, it will appear in the menu of a connected meter under the Viewing option (Figure 23-4).
• Figure 23-4 Selecting a Viewer.
Selecting the option will process the reading file producing an output file, then open the viewing program with the name of the output file as an argument.
The Print option does virtually the same thing as the Viewing option. The difference is that a /P is added to the arguments of the viewing program. On many programs this causes the program to print the file to the default printer.
Example
As an exercise of using reading files with EziView, create a TEST.RDS file with a text editor such as Notepad. Enter the single line “[PCExtension.tst][f002]”. Save the file, and then setup EziView to use this file as shown in the Figures of this section.
Connecting to a meter and selecting the Viewing → Test Results option should result in Notepad being opened and displaying the serial number of the meter. The following sections describe how to create your own reading files.
Reading File Structure The EziView control sequences are enclosed in square brackets. EziView searches the file for ‘[’ characters and processes the following characters as control sequences until the matching ‘]’. This is compatible with Rich Text Format files, allowing highly formatted files to be created. Reading files should have the extension “.RDS”, although other extensions may be used.
23-4 EDMI Genius User Manual
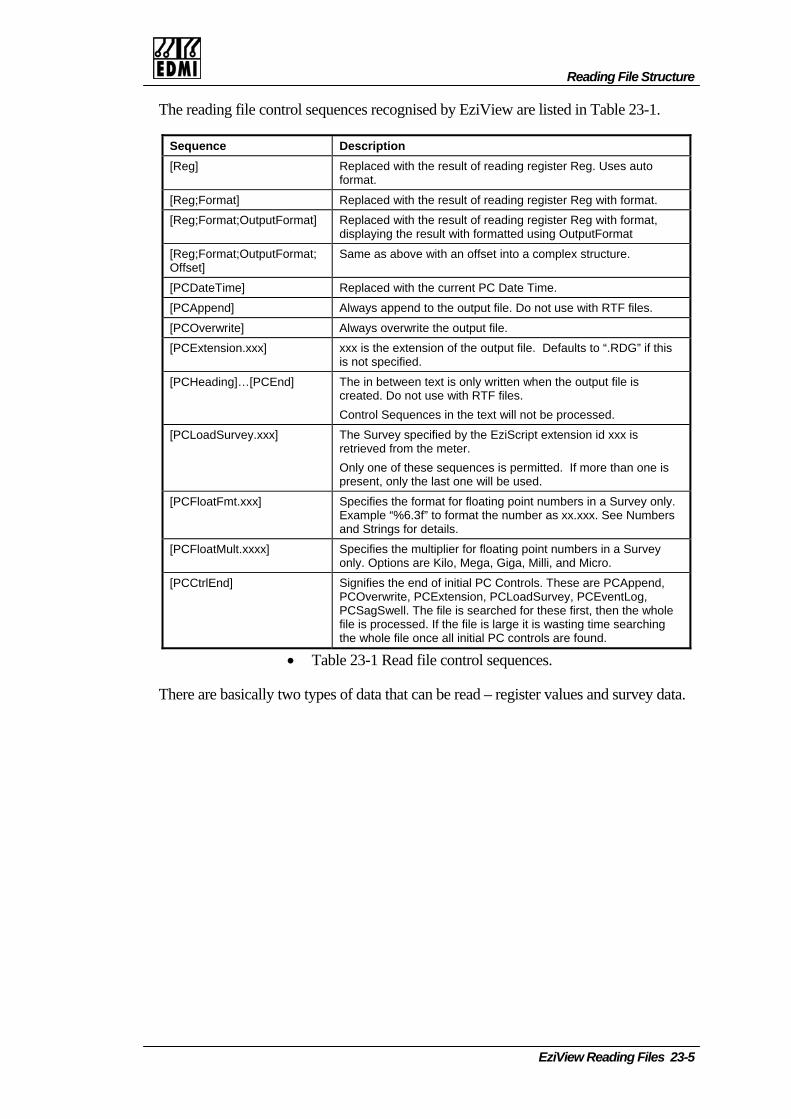
Reading File Structure
EziView Reading Files 23-5
The reading file control sequences recognised by EziView are listed in Table 23-1.
Sequence Description [Reg] Replaced with the result of reading register Reg. Uses auto
format.
[Reg;Format] Replaced with the result of reading register Reg with format.
[Reg;Format;OutputFormat] Replaced with the result of reading register Reg with format, displaying the result with formatted using OutputFormat
[Reg;Format;OutputFormat;Offset]
Same as above with an offset into a complex structure.
[PCDateTime] Replaced with the current PC Date Time.
[PCAppend] Always append to the output file. Do not use with RTF files.
[PCOverwrite] Always overwrite the output file.
[PCExtension.xxx] xxx is the extension of the output file. Defaults to “.RDG” if this is not specified.
[PCHeading]…[PCEnd] The in between text is only written when the output file is created. Do not use with RTF files. Control Sequences in the text will not be processed.
[PCLoadSurvey.xxx] The Survey specified by the EziScript extension id xxx is retrieved from the meter. Only one of these sequences is permitted. If more than one is present, only the last one will be used.
[PCFloatFmt.xxx] Specifies the format for floating point numbers in a Survey only. Example “%6.3f” to format the number as xx.xxx. See Numbers and Strings for details.
[PCFloatMult.xxxx] Specifies the multiplier for floating point numbers in a Survey only. Options are Kilo, Mega, Giga, Milli, and Micro.
[PCCtrlEnd] Signifies the end of initial PC Controls. These are PCAppend, PCOverwrite, PCExtension, PCLoadSurvey, PCEventLog, PCSagSwell. The file is searched for these first, then the whole file is processed. If the file is large it is wasting time searching the whole file once all initial PC controls are found.
• Table 23-1 Read file control sequences.
There are basically two types of data that can be read – register values and survey data.

Register values – Format
The format specifier is the same as in the Special → General Read screen. This screen can be used to become familiar with the way formatting works. Table 23-2 lists the available format characters.
Format Description ‘A’ Auto detect type. Display Bytes, Words, and Longs in Hexadecimal
‘a’ Auto detect type. Display Bytes, Words, and Longs in Decimal.
‘B’ Hexadecimal Byte
‘b’ Decimal Byte
‘W’ Hexadecimal Word
‘w’ Decimal Word
‘L’ Hexadecimal Long
‘l’ Decimal Long
‘F’,’f’ Float
‘D’,’d’ Double
‘S’,’s’ String
‘T’,’t’ Boolean
‘V’,’v’ Time
‘X’,’x’ Date Time
‘Y’,’y’ Binary Byte
‘Z’,’z’ Date
• Table 23-2 Format characters.
The format can be followed by a number to specify the number of that type, eg “b3” is the same as “bbb”. If the number is omitted the default is the number of that type that can fit in the message, eg if the message is 2 bytes long, ‘b’ will display 2 bytes.
Notes:
• If no format is specified the default is ‘a’.
• Auto format asks the meter what format the register is. This takes an extra message and is slower. Therefore it is recommended that the register format be specified.
• Some registers have no simple type in the meter. In that case Auto doesn’t work. These are specialised registers that will probably never be used.
23-6 EDMI Genius User Manual

Reading File Structure
EziView Reading Files 23-7
Register Values – OutputFormat
The OutputFormat specifies how the value of the register is to be formatted and printed.
Do not specify an OutputFormat when there are multiple types. For example “[F119,fbb,%6.2f]” will fail because the OutputFormat “%6.2f” will be applied to a Byte.
Numbers and Strings Format specifiers have the following form:
"%" ["-"] [width] ["." prec] type
A format specifier begins with a % character. After the % come the following, in this order:
• An optional left justification indicator, ["-"].
• An optional width specifier, [width].
• An optional precision specifier, ["." prec].
• The conversion type character, type.
The Table 23-3 summarises the possible values for type:

Type Description ‘d’ Decimal. The argument must be an integer value. The value is
converted to a string of decimal digits. If the format string contains a precision specifier, it indicates that the resulting string must contain at least the specified number of digits; if the value has fewer digits, the resulting string is left-padded with zeros.
‘e’ Scientific. The argument must be a floating-point value. The value is converted to a string of the form "-d.ddd...E+ddd". The resulting string starts with a minus sign if the number is negative. One digit always precedes the decimal point. The total number of digits in the resulting string (including the one before the decimal point) is given by the precision specifier in the format string--a default precision of 15 is assumed if no precision specifier is present. The "E" exponent character in the resulting string is always followed by a plus or minus sign and at least three digits.
‘f’ Fixed. The argument must be a floating-point value. The value is converted to a string of the form "-ddd.ddd...". The resulting string starts with a minus sign if the number is negative.
‘.’ The number of digits after the decimal point is given by the precision specifier in the format string--a default of 2 decimal digits is assumed if no precision specifier is present.
‘g’ General. The argument must be a floating-point value. The value is converted to the shortest possible decimal string using fixed or scientific format. The number of significant digits in the resulting string is given by the precision specifier in the format string--a default precision of 15 is assumed if no precision specifier is present. Trailing zeros are removed from the resulting string, and a decimal point appears only if necessary. The resulting string uses fixed point format if the number of digits to the left of the decimal point in the value is less than or equal to the specified precision, and if the value is greater than or equal to 0.00001. Otherwise the resulting string uses scientific format.
‘n’ Number. The argument must be a floating-point value. The value is converted to a string of the form "-d,ddd,ddd.ddd...". The "n" format corresponds to the "f" format, except that the resulting string contains thousand separators.
‘m’ Money. The argument must be a floating-point value. The value is converted to a string that represents a currency amount. The conversion is controlled by the CurrencyString, CurrencyFormat, NegCurrFormat, ThousandSeparator, DecimalSeparator, and CurrencyDecimals global variables, all of which are initialized from the Currency Format in the International section of the Windows Control Panel. If the format string contains a precision specifier, it overrides the value given by the CurrencyDecimals global variable.
‘s’ String. The argument must be a character, or a string value. The string or character is inserted in place of the format specifier. The precision specifier, if present in the format string, specifies the maximum length of the resulting string. If the argument is a string that is longer than this maximum, the string is truncated.
‘x’ Hexadecimal. The argument must be an integer value. The value is converted to a string of hexadecimal digits. If the format string contains a precision specifier, it indicates that the resulting string must contain at least the specified number of digits; if the value has fewer digits, the resulting string is left-padded with zeros.
• Table 23-3 OutputFormat specifiers.
Conversion characters may be specified in uppercase as well as in lowercase--both produce the same results.
23-8 EDMI Genius User Manual

Reading File Structure
EziView Reading Files 23-9
For all floating-point formats, the actual characters used as decimal and thousand separators are obtained from the DecimalSeparator and ThousandSeparator Windows Control Panel variables.
A width specifier sets the minimum field width for a conversion. If the resulting string is shorter than the minimum field width, it is padded with blanks to increase the field width. The default is to right-justify the result by adding blanks in front of the value, but if the format specifier contains a left-justification indicator (a "-" character preceding the width specifier), the result is left-justified by adding blanks after the value.
Date Time
Date and time values have their own format specifiers. Table 23-4 lists the available formats.
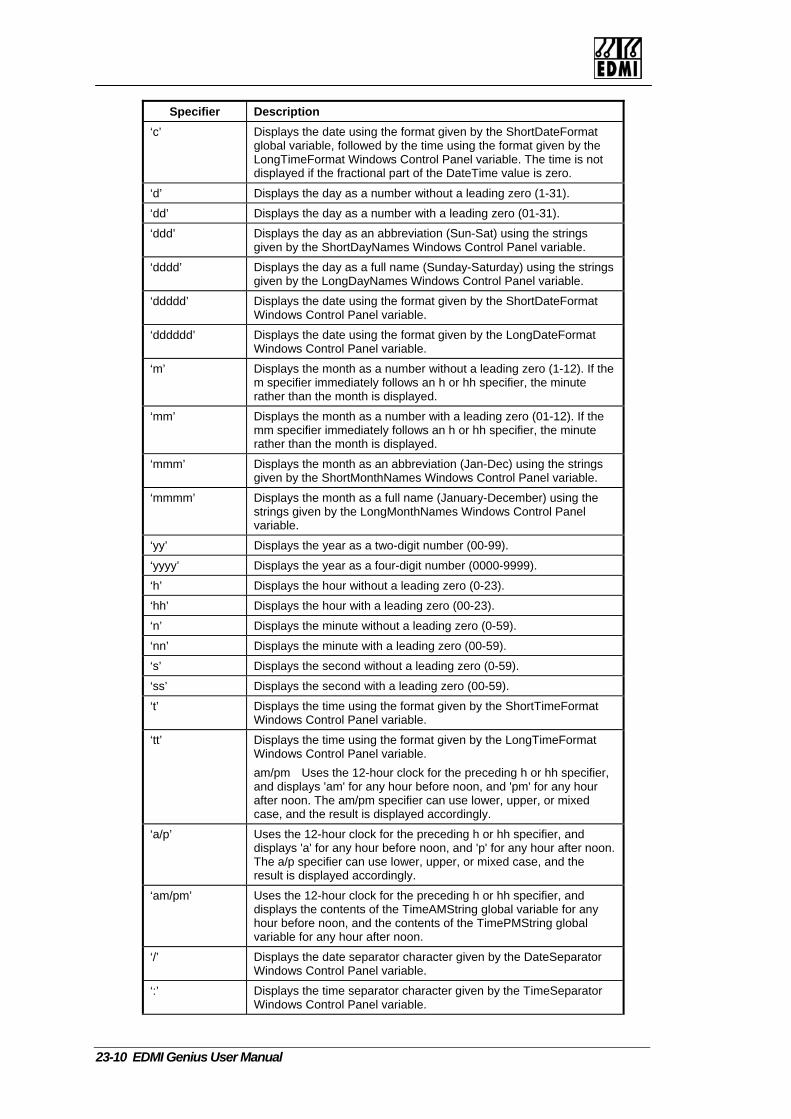
Specifier Description ‘c’ Displays the date using the format given by the ShortDateFormat
global variable, followed by the time using the format given by the LongTimeFormat Windows Control Panel variable. The time is not displayed if the fractional part of the DateTime value is zero.
‘d’ Displays the day as a number without a leading zero (1-31).
‘dd’ Displays the day as a number with a leading zero (01-31).
‘ddd’ Displays the day as an abbreviation (Sun-Sat) using the strings given by the ShortDayNames Windows Control Panel variable.
‘dddd’ Displays the day as a full name (Sunday-Saturday) using the strings given by the LongDayNames Windows Control Panel variable.
‘ddddd’ Displays the date using the format given by the ShortDateFormat Windows Control Panel variable.
‘dddddd’ Displays the date using the format given by the LongDateFormat Windows Control Panel variable.
‘m’ Displays the month as a number without a leading zero (1-12). If the m specifier immediately follows an h or hh specifier, the minute rather than the month is displayed.
‘mm’ Displays the month as a number with a leading zero (01-12). If the mm specifier immediately follows an h or hh specifier, the minute rather than the month is displayed.
‘mmm’ Displays the month as an abbreviation (Jan-Dec) using the strings given by the ShortMonthNames Windows Control Panel variable.
‘mmmm’ Displays the month as a full name (January-December) using the strings given by the LongMonthNames Windows Control Panel variable.
‘yy’ Displays the year as a two-digit number (00-99).
‘yyyy’ Displays the year as a four-digit number (0000-9999).
‘h’ Displays the hour without a leading zero (0-23).
‘hh’ Displays the hour with a leading zero (00-23).
‘n’ Displays the minute without a leading zero (0-59).
‘nn’ Displays the minute with a leading zero (00-59).
‘s’ Displays the second without a leading zero (0-59).
‘ss’ Displays the second with a leading zero (00-59).
‘t’ Displays the time using the format given by the ShortTimeFormat Windows Control Panel variable.
‘tt’ Displays the time using the format given by the LongTimeFormat Windows Control Panel variable. am/pm Uses the 12-hour clock for the preceding h or hh specifier, and displays 'am' for any hour before noon, and 'pm' for any hour after noon. The am/pm specifier can use lower, upper, or mixed case, and the result is displayed accordingly.
‘a/p’ Uses the 12-hour clock for the preceding h or hh specifier, and displays 'a' for any hour before noon, and 'p' for any hour after noon. The a/p specifier can use lower, upper, or mixed case, and the result is displayed accordingly.
‘am/pm’ Uses the 12-hour clock for the preceding h or hh specifier, and displays the contents of the TimeAMString global variable for any hour before noon, and the contents of the TimePMString global variable for any hour after noon.
‘/’ Displays the date separator character given by the DateSeparator Windows Control Panel variable.
‘:’ Displays the time separator character given by the TimeSeparator Windows Control Panel variable.
23-10 EDMI Genius User Manual
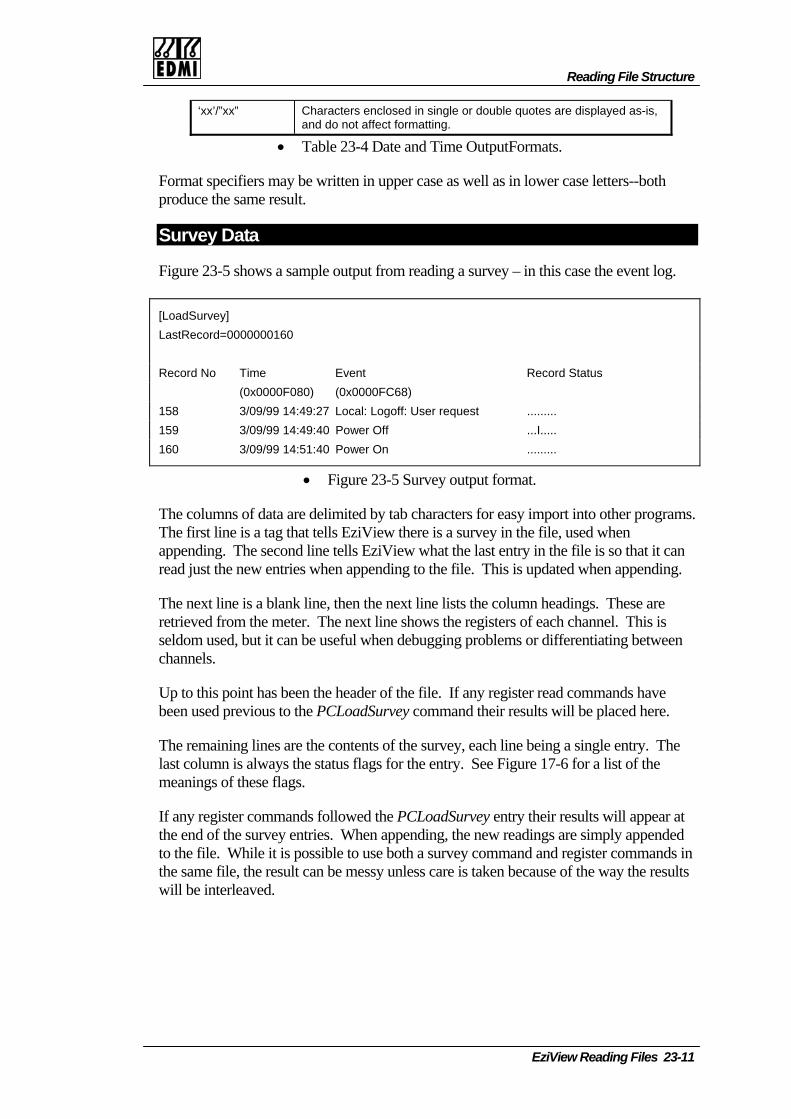
Reading File Structure
EziView Reading Files 23-11
‘xx’/”xx” Characters enclosed in single or double quotes are displayed as-is, and do not affect formatting.
• Table 23-4 Date and Time OutputFormats.
Format specifiers may be written in upper case as well as in lower case letters--both produce the same result.
Survey Data
Figure 23-5 shows a sample output from reading a survey – in this case the event log.
[LoadSurvey] LastRecord=0000000160 Record No Time Event Record Status (0x0000F080) (0x0000FC68) 158 3/09/99 14:49:27 Local: Logoff: User request ......... 159 3/09/99 14:49:40 Power Off ...I..... 160 3/09/99 14:51:40 Power On .........
• Figure 23-5 Survey output format.
The columns of data are delimited by tab characters for easy import into other programs. The first line is a tag that tells EziView there is a survey in the file, used when appending. The second line tells EziView what the last entry in the file is so that it can read just the new entries when appending to the file. This is updated when appending.
The next line is a blank line, then the next line lists the column headings. These are retrieved from the meter. The next line shows the registers of each channel. This is seldom used, but it can be useful when debugging problems or differentiating between channels.
Up to this point has been the header of the file. If any register read commands have been used previous to the PCLoadSurvey command their results will be placed here.
The remaining lines are the contents of the survey, each line being a single entry. The last column is always the status flags for the entry. See Figure 17-6 for a list of the meanings of these flags.
If any register commands followed the PCLoadSurvey entry their results will appear at the end of the survey entries. When appending, the new readings are simply appended to the file. While it is possible to use both a survey command and register commands in the same file, the result can be messy unless care is taken because of the way the results will be interleaved.
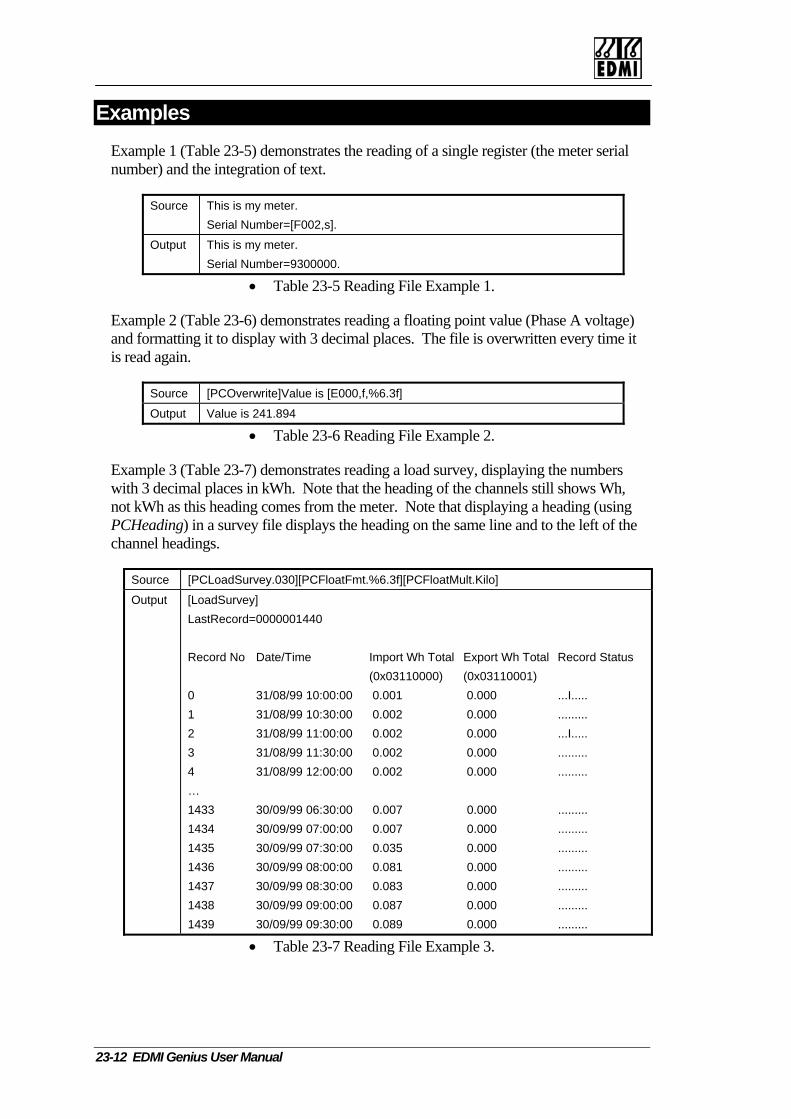
Examples Example 1 (Table 23-5) demonstrates the reading of a single register (the meter serial number) and the integration of text.
Source This is my meter. Serial Number=[F002,s].
Output This is my meter. Serial Number=9300000.
• Table 23-5 Reading File Example 1.
Example 2 (Table 23-6) demonstrates reading a floating point value (Phase A voltage) and formatting it to display with 3 decimal places. The file is overwritten every time it is read again.
Source [PCOverwrite]Value is [E000,f,%6.3f]
Output Value is 241.894
• Table 23-6 Reading File Example 2.
Example 3 (Table 23-7) demonstrates reading a load survey, displaying the numbers with 3 decimal places in kWh. Note that the heading of the channels still shows Wh, not kWh as this heading comes from the meter. Note that displaying a heading (using PCHeading) in a survey file displays the heading on the same line and to the left of the channel headings.
Source [PCLoadSurvey.030][PCFloatFmt.%6.3f][PCFloatMult.Kilo]
Output [LoadSurvey] LastRecord=0000001440 Record No Date/Time Import Wh Total Export Wh Total Record Status (0x03110000) (0x03110001) 0 31/08/99 10:00:00 0.001 0.000 ...I..... 1 31/08/99 10:30:00 0.002 0.000 ......... 2 31/08/99 11:00:00 0.002 0.000 ...I..... 3 31/08/99 11:30:00 0.002 0.000 ......... 4 31/08/99 12:00:00 0.002 0.000 ......... … 1433 30/09/99 06:30:00 0.007 0.000 ......... 1434 30/09/99 07:00:00 0.007 0.000 ......... 1435 30/09/99 07:30:00 0.035 0.000 ......... 1436 30/09/99 08:00:00 0.081 0.000 ......... 1437 30/09/99 08:30:00 0.083 0.000 ......... 1438 30/09/99 09:00:00 0.087 0.000 ......... 1439 30/09/99 09:30:00 0.089 0.000 .........
• Table 23-7 Reading File Example 3.
23-12 EDMI Genius User Manual
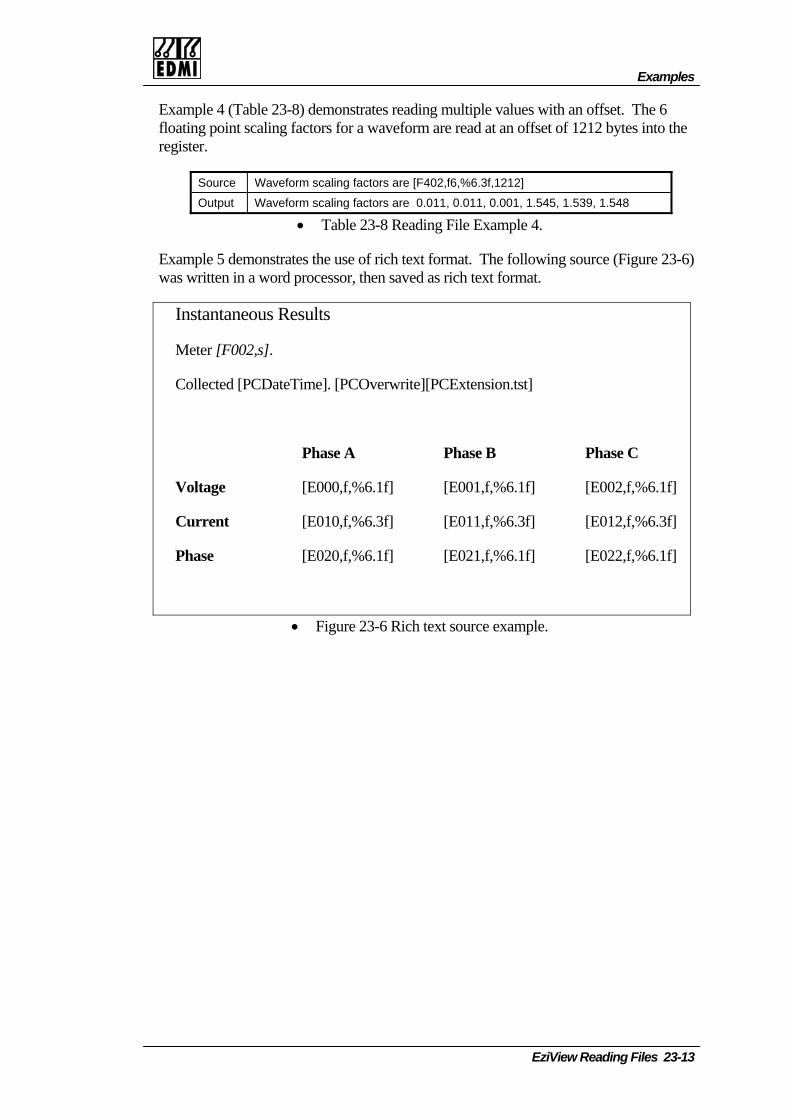
Examples
EziView Reading Files 23-13
Example 4 (Table 23-8) demonstrates reading multiple values with an offset. The 6 floating point scaling factors for a waveform are read at an offset of 1212 bytes into the register.
Source Waveform scaling factors are [F402,f6,%6.3f,1212]
Output Waveform scaling factors are 0.011, 0.011, 0.001, 1.545, 1.539, 1.548
• Table 23-8 Reading File Example 4.
Example 5 demonstrates the use of rich text format. The following source (Figure 23-6) was written in a word processor, then saved as rich text format.
Instantaneous Results
Meter [F002,s].
Collected [PCDateTime]. [PCOverwrite][PCExtension.tst]
Phase A Phase B Phase C
Voltage [E000,f,%6.1f] [E001,f,%6.1f] [E002,f,%6.1f]
Current [E010,f,%6.3f] [E011,f,%6.3f] [E012,f,%6.3f]
Phase [E020,f,%6.1f] [E021,f,%6.1f] [E022,f,%6.1f]
• Figure 23-6 Rich text source example.
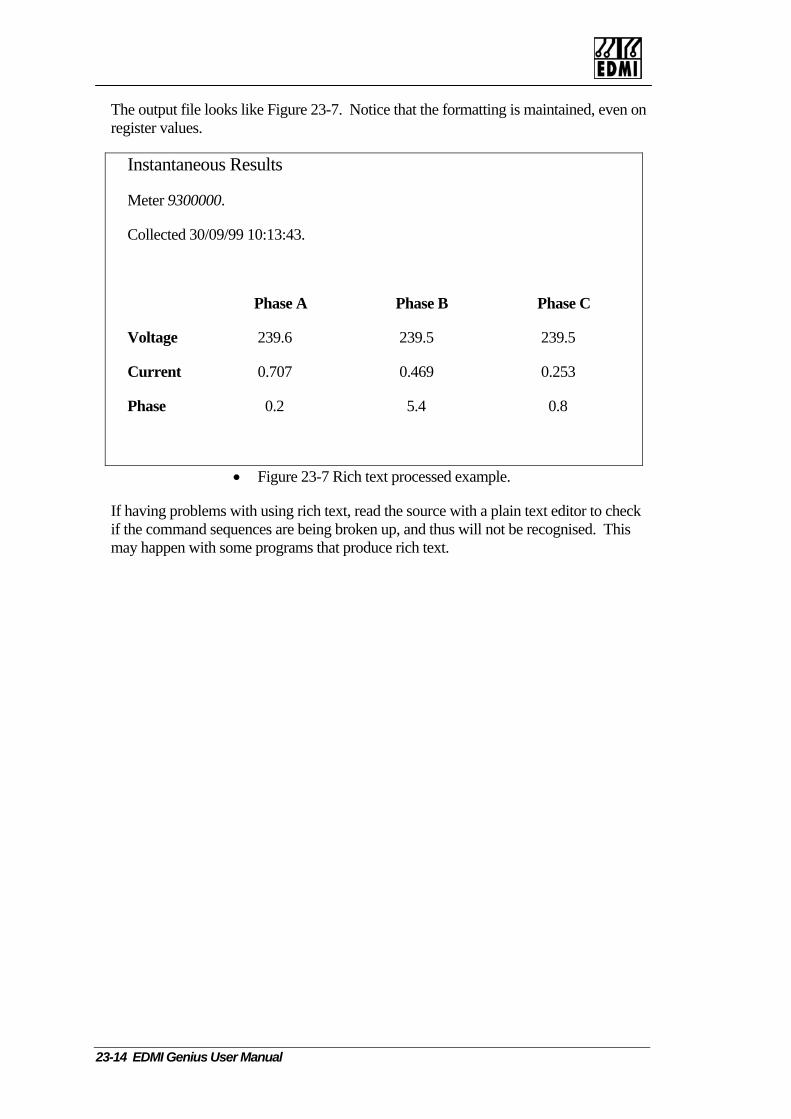
The output file looks like Figure 23-7. Notice that the formatting is maintained, even on register values.
Instantaneous Results
Meter 9300000.
Collected 30/09/99 10:13:43.
Phase A Phase B Phase C
Voltage 239.6 239.5 239.5
Current 0.707 0.469 0.253
Phase 0.2 5.4 0.8
• Figure 23-7 Rich text processed example.
If having problems with using rich text, read the source with a plain text editor to check if the command sequences are being broken up, and thus will not be recognised. This may happen with some programs that produce rich text.
23-14 EDMI Genius User Manual

EziVie
Chapter 24 EziView SSince there are lots of other devices such as Datagates and special modMeters, EziView needed a way to automatically control these devices. scripting language was added to EziView. A script is a simple languagtransmitting and receiving messages. Once the communications port isrun. The script will control the special device by sending and receivingwhen finished EziView will continue the log on sequence as normal.
This chapter assumes that the reader is familiar with basic programminis for advanced users. The EziView Script language is different to EziS
Structure The structure of a script is quite simple. A script is made up of a sequenor instructions, with one instruction per line. Each instruction consists oname and parameters. These are case sensitive. See Figure 24-1.
//Create a new variable named x1 of type integer Create(“x1”,Integer) //x1=2 Assign(x1,2) //x1=x1+3 Add(x1,3)
• Figure 24-1 Simple example.
Comments are denoted by “//” characters, and the rest of the line is ign
Each instruction is a single simple instruction. Compound instructions ie x1=x1+x2+2 would be written as in Figure 24-2.
Add(x1,x2) Add(x1,2)
• Figure 24-2 Compound add example.
C h a p t e r
24
w Script Files 24-1
cript Files ems connected to As a result a e allowing open the script is messages, and
g techniques and cript Extensions.
ce of operations f the instruction
ored.
are not allowed,

A group of instructions that perform a certain task is called a function. Functions are defined as in Figure 24-3.
//Function to Add three numbers and returns the result in x1 //x1=x1+x2+x3 Function(Add3,var x1:Integer,x2:Integer,x3:Integer) Add(x1,x2) Add(x1,x3) End … Call(“Add3”,x1,x2,2)
• Figure 24-3 Function example.
Numbers can also be in hexadecimal by preceding it with a dollar sign, eg $0F. Non printable characters are preceded by a hash, eg #13 is character 13 (carriage return).
24-2 EDMI Genius User Manual
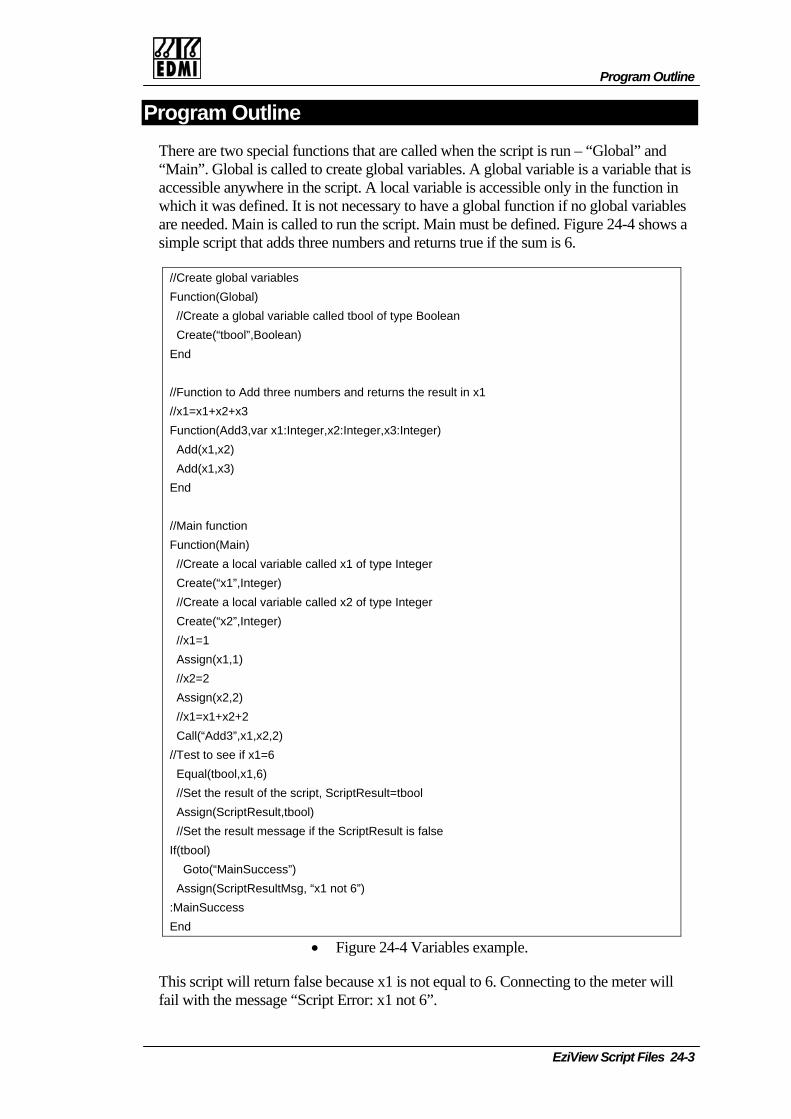
Program Outline
EziView Script Files 24-3
Program Outline There are two special functions that are called when the script is run – “Global” and “Main”. Global is called to create global variables. A global variable is a variable that is accessible anywhere in the script. A local variable is accessible only in the function in which it was defined. It is not necessary to have a global function if no global variables are needed. Main is called to run the script. Main must be defined. Figure 24-4 shows a simple script that adds three numbers and returns true if the sum is 6.
//Create global variables Function(Global) //Create a global variable called tbool of type Boolean Create(“tbool”,Boolean) End //Function to Add three numbers and returns the result in x1 //x1=x1+x2+x3 Function(Add3,var x1:Integer,x2:Integer,x3:Integer) Add(x1,x2) Add(x1,x3) End //Main function Function(Main) //Create a local variable called x1 of type Integer Create(“x1”,Integer) //Create a local variable called x2 of type Integer Create(“x2”,Integer) //x1=1 Assign(x1,1) //x2=2 Assign(x2,2) //x1=x1+x2+2 Call(“Add3”,x1,x2,2) //Test to see if x1=6 Equal(tbool,x1,6) //Set the result of the script, ScriptResult=tbool Assign(ScriptResult,tbool) //Set the result message if the ScriptResult is false If(tbool) Goto(“MainSuccess”) Assign(ScriptResultMsg, “x1 not 6”) :MainSuccess End
• Figure 24-4 Variables example.
This script will return false because x1 is not equal to 6. Connecting to the meter will fail with the message “Script Error: x1 not 6”.

Predefined Global Variables
There are three predefined global variables:
1. ScriptResult is a Boolean that indicates the success or failure of the script. This is set to true by default. If ScriptResult is true the script is successful and EziView continues the log on process. If ScriptResult is false the script failed and EziView closes the port and displayes an error message.
2. ScriptResultMsg is a string that contains the error message to display to the user when the script fails.
3. Result is a variable that contains the result of specific instructions, eg CommWaitFor(2000,"OK",”ERROR”) will wait for 2 seconds to receive an “OK” or “ERROR” message. Result is set to 0 if timed out, 1 if “OK” received, or 2 if “ERROR” received.
Main Parameters
The main function has three parameters passed to it:
1. UserID:String
2. Password:String
3. Parameters:String
These are entered in the Site Properties, Script page. These strings are not used by EziView, they are for script use only, so there is no restriction on their use.
Program Flow There are two ways to control the program flow:
1. Call(FunctionName,Parameters) runs the function and goes to the next instruction when the function is finished. In Figure 24-4, Call(“Add3”,x1,x2,2) jumps to the first instruction in the function Add3. When Add3 is finished, “End”, the next instruction after the “Call”, is run.
2. Goto(LabelName) jumps to the label and runs from there. In Figure 24-4, Goto(“MainSuccess”) jumps to the first instruction after the label “:MainSuccess”. There is no return from this jump. When “End” is reached this is the end of the Main function and the script is finished.
A label is defined as a colon, ‘:’, followed by its name. Labels are global, ie any label can be called from anywhere. Care should be taken not to jump to a label outside a function. A suggestion is to start the label with the name of the function, eg “MainSuccess” is “Success” in the main function. The label name may be in a string variable. This can be used to implement a case statement.
24-4 EDMI Genius User Manual
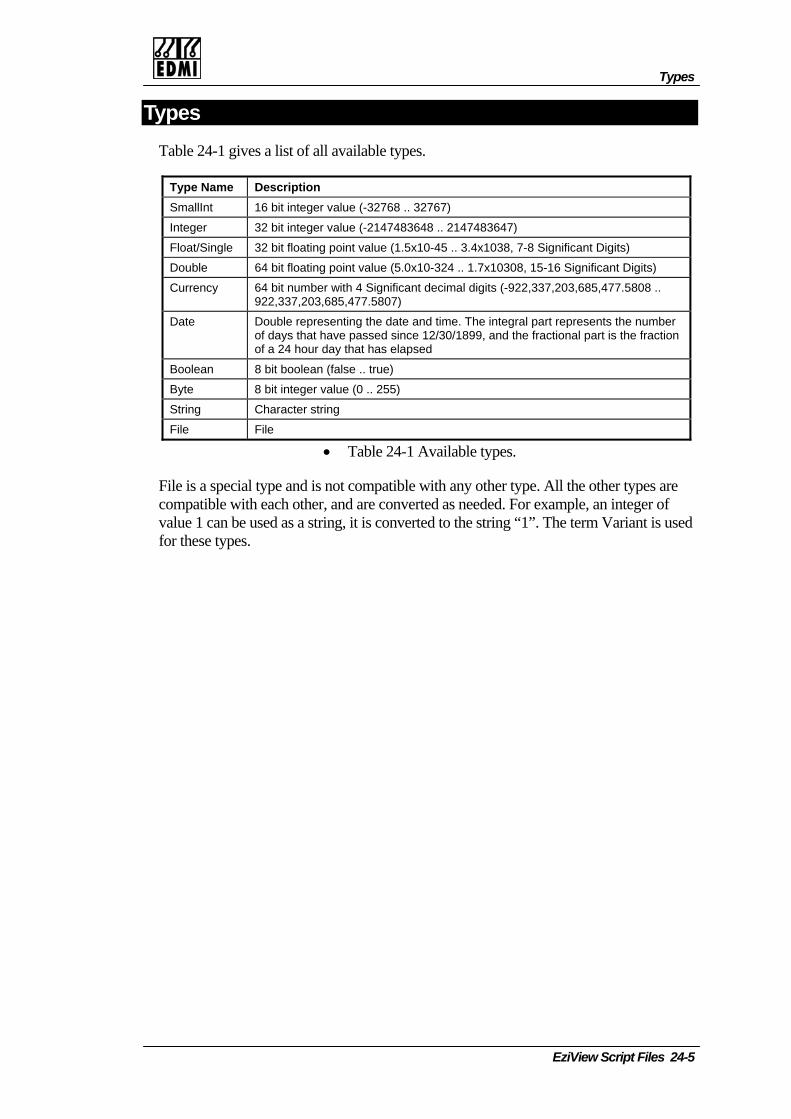
Types
EziView Script Files 24-5
Types Table 24-1 gives a list of all available types.
Type Name Description SmallInt 16 bit integer value (-32768 .. 32767)
Integer 32 bit integer value (-2147483648 .. 2147483647)
Float/Single 32 bit floating point value (1.5x10-45 .. 3.4x1038, 7-8 Significant Digits)
Double 64 bit floating point value (5.0x10-324 .. 1.7x10308, 15-16 Significant Digits)
Currency 64 bit number with 4 Significant decimal digits (-922,337,203,685,477.5808 .. 922,337,203,685,477.5807)
Date Double representing the date and time. The integral part represents the number of days that have passed since 12/30/1899, and the fractional part is the fraction of a 24 hour day that has elapsed
Boolean 8 bit boolean (false .. true)
Byte 8 bit integer value (0 .. 255)
String Character string
File File
• Table 24-1 Available types.
File is a special type and is not compatible with any other type. All the other types are compatible with each other, and are converted as needed. For example, an integer of value 1 can be used as a string, it is converted to the string “1”. The term Variant is used for these types.

Instructions The instructions are broken up into the groups of basic, string, file, and communications.
Basic Instructions
This covers mathematics, variables and flow control instructions (Table 24-2).
Instruction Description Add(var Value1:Variant,Value2:Variant) Value1:=Value1+Value2
Example 1: Value1:Integer=2 Add(Value1,3) //Value1=5 Example 2: Value1:String=“hello “ Add(Value1, ”world”) ..Value1=“hello world”
And(var Value1:Variant,Value2:Variant) Value1:=Value1 and Value 2 Example 1: Value1:Integer=17 And(Value1,$F) //Value1=1 Example 2:Value1:Boolean=True, Value2:Boolean=False And(Value1,Value2) //Value1=False
Assign(var Value1:Variant,Value2:Variant) Value1:=Value2 Example 1: Value1:Integer=0 Assign(Value1,2) //Value1=2
Call(FunctionName:String,[Parameters:String]) Calls the function and runs the next instruction when the function finishes. Example 1: Call(“MyFunc1”) Example 2: FuncPtr:String=“MyFunc2”, Parameter1:Integer=2 Call(FuncPtr,Parameter1) //Calls MyFunc2 with Parameter1
CastValue(var Value1:Variant ,CastType:String)
Value1:=CastType(Value1), converts Value1 to another type. Example 1:Value1:String=“1” CastValue(Value1,Integer) //Value1:Integer=1
Create(VariableName:String,Type:String ,[Option:Variant])
Creates a new variable with Name of Type Example 1: Create(“Value1”,Integer) //Value1:Integer=0 Example 2: Create(“f”,File, “Text”) //f:File= unopened text file
Display(Message:String) Displays the message in a popup box
Divide(var Value1:Variant,Value2:Variant) Value1:=Value1 / Value2 Example 1: Value1:Integer=8 Divide(Value1,2) //Value1=4 Example 2: Value1:Float=8.2 Divide(Value1,2) //Value1=4.1
Equal(var Result:Boolean,Compare1:Variant ,Compare2:Variant)
Result:=(Compare1=Compare2) Example 1: Compare1:Integer=7, tbool:Boolean=False Equal(tbool,Compare1,7) //tbool=True
Goto(Label:String) Jumps to the Label Example 1: Goto(“MyLabel”) Example 2: LabelPtr:String=“MyLabel” Goto(LabelPtr) //Same as example 1
Greater(var Result:Boolean,Compare1:Variant ,Compare2:Variant)
Result:=(Compare1>Compare2) Example 1: Compare1:Integer=7, tbool:Boolean=False Greater(tbool,Compare1,7) //tbool=False
GreaterEq(var Result:Boolean,Compare1:Variant
Result:=(Compare1>=Compare2) Example 1: Compare1:Integer=7, tbool:Boolean=False
24-6 EDMI Genius User Manual
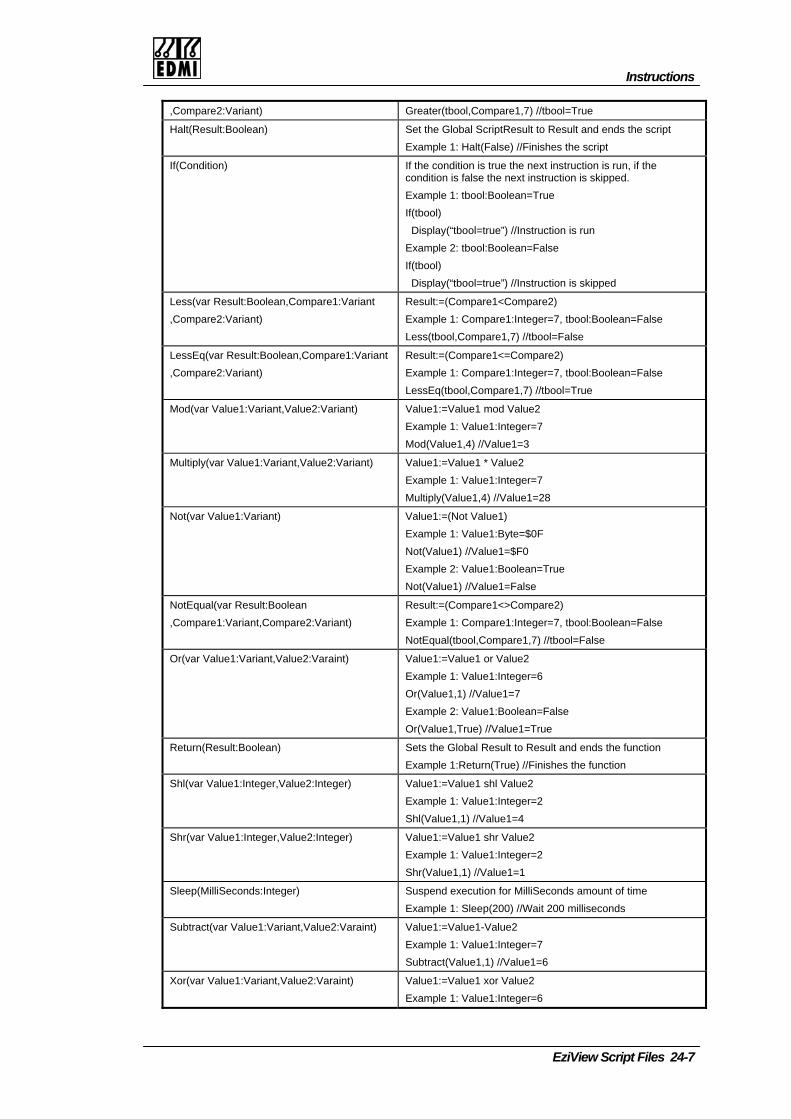
Instructions
EziView Script Files 24-7
,Compare2:Variant) Greater(tbool,Compare1,7) //tbool=True
Halt(Result:Boolean) Set the Global ScriptResult to Result and ends the script Example 1: Halt(False) //Finishes the script
If(Condition) If the condition is true the next instruction is run, if the condition is false the next instruction is skipped. Example 1: tbool:Boolean=True If(tbool) Display(“tbool=true”) //Instruction is run Example 2: tbool:Boolean=False If(tbool) Display(“tbool=true”) //Instruction is skipped
Less(var Result:Boolean,Compare1:Variant ,Compare2:Variant)
Result:=(Compare1<Compare2) Example 1: Compare1:Integer=7, tbool:Boolean=False Less(tbool,Compare1,7) //tbool=False
LessEq(var Result:Boolean,Compare1:Variant ,Compare2:Variant)
Result:=(Compare1<=Compare2) Example 1: Compare1:Integer=7, tbool:Boolean=False LessEq(tbool,Compare1,7) //tbool=True
Mod(var Value1:Variant,Value2:Variant) Value1:=Value1 mod Value2 Example 1: Value1:Integer=7 Mod(Value1,4) //Value1=3
Multiply(var Value1:Variant,Value2:Variant) Value1:=Value1 * Value2 Example 1: Value1:Integer=7 Multiply(Value1,4) //Value1=28
Not(var Value1:Variant) Value1:=(Not Value1) Example 1: Value1:Byte=$0F Not(Value1) //Value1=$F0 Example 2: Value1:Boolean=True Not(Value1) //Value1=False
NotEqual(var Result:Boolean ,Compare1:Variant,Compare2:Variant)
Result:=(Compare1<>Compare2) Example 1: Compare1:Integer=7, tbool:Boolean=False NotEqual(tbool,Compare1,7) //tbool=False
Or(var Value1:Variant,Value2:Varaint) Value1:=Value1 or Value2 Example 1: Value1:Integer=6 Or(Value1,1) //Value1=7 Example 2: Value1:Boolean=False Or(Value1,True) //Value1=True
Return(Result:Boolean) Sets the Global Result to Result and ends the function Example 1:Return(True) //Finishes the function
Shl(var Value1:Integer,Value2:Integer) Value1:=Value1 shl Value2 Example 1: Value1:Integer=2 Shl(Value1,1) //Value1=4
Shr(var Value1:Integer,Value2:Integer) Value1:=Value1 shr Value2 Example 1: Value1:Integer=2 Shr(Value1,1) //Value1=1
Sleep(MilliSeconds:Integer) Suspend execution for MilliSeconds amount of time Example 1: Sleep(200) //Wait 200 milliseconds
Subtract(var Value1:Variant,Value2:Varaint) Value1:=Value1-Value2 Example 1: Value1:Integer=7 Subtract(Value1,1) //Value1=6
Xor(var Value1:Variant,Value2:Varaint) Value1:=Value1 xor Value2 Example 1: Value1:Integer=6
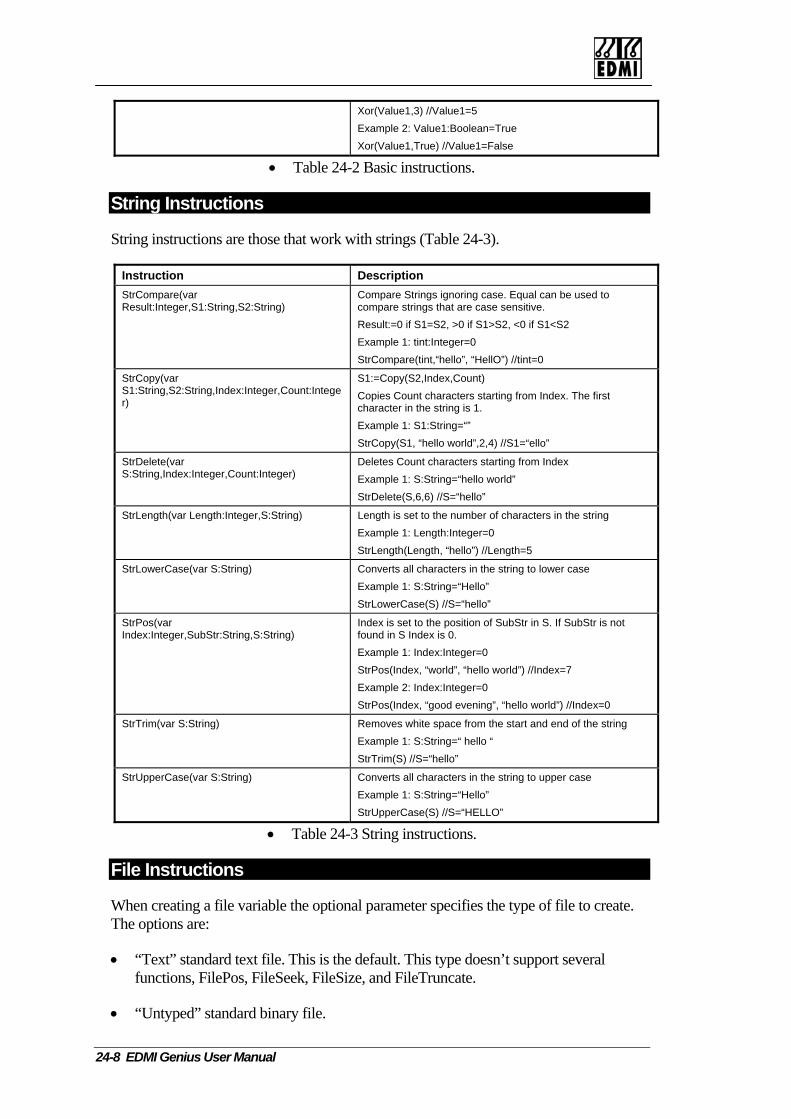
24-8 EDMI Genius User Manual
Xor(Value1,3) //Value1=5 Example 2: Value1:Boolean=True Xor(Value1,True) //Value1=False
• Table 24-2 Basic instructions.
String Instructions
String instructions are those that work with strings (Table 24-3).
Instruction Description StrCompare(var Result:Integer,S1:String,S2:String)
Compare Strings ignoring case. Equal can be used to compare strings that are case sensitive. Result:=0 if S1=S2, >0 if S1>S2, <0 if S1<S2 Example 1: tint:Integer=0 StrCompare(tint,“hello”, “HellO”) //tint=0
StrCopy(var S1:String,S2:String,Index:Integer,Count:Integer)
S1:=Copy(S2,Index,Count) Copies Count characters starting from Index. The first character in the string is 1. Example 1: S1:String=“” StrCopy(S1, “hello world”,2,4) //S1=“ello”
StrDelete(var S:String,Index:Integer,Count:Integer)
Deletes Count characters starting from Index Example 1: S:String=“hello world” StrDelete(S,6,6) //S=“hello”
StrLength(var Length:Integer,S:String) Length is set to the number of characters in the string Example 1: Length:Integer=0 StrLength(Length, “hello”) //Length=5
StrLowerCase(var S:String) Converts all characters in the string to lower case Example 1: S:String=“Hello” StrLowerCase(S) //S=“hello”
StrPos(var Index:Integer,SubStr:String,S:String)
Index is set to the position of SubStr in S. If SubStr is not found in S Index is 0. Example 1: Index:Integer=0 StrPos(Index, “world”, “hello world”) //Index=7 Example 2: Index:Integer=0 StrPos(Index, “good evening”, “hello world”) //Index=0
StrTrim(var S:String) Removes white space from the start and end of the string Example 1: S:String=“ hello “ StrTrim(S) //S=“hello”
StrUpperCase(var S:String) Converts all characters in the string to upper case Example 1: S:String=“Hello” StrUpperCase(S) //S=“HELLO”
• Table 24-3 String instructions.
File Instructions
When creating a file variable the optional parameter specifies the type of file to create. The options are:
• “Text” standard text file. This is the default. This type doesn’t support several functions, FilePos, FileSeek, FileSize, and FileTruncate.
• “Untyped” standard binary file.

Instructions
EziView Script Files 24-9
• “Handle” standard Windows binary file.
• “HandleRead” read only Windows binary file.
All file instructions set the Global Result variable to True if the operation is successful and False if the operation failed and the Global ScriptResultMsg to the reason for the failure.
Table 24-4 lists all of the file instructions.
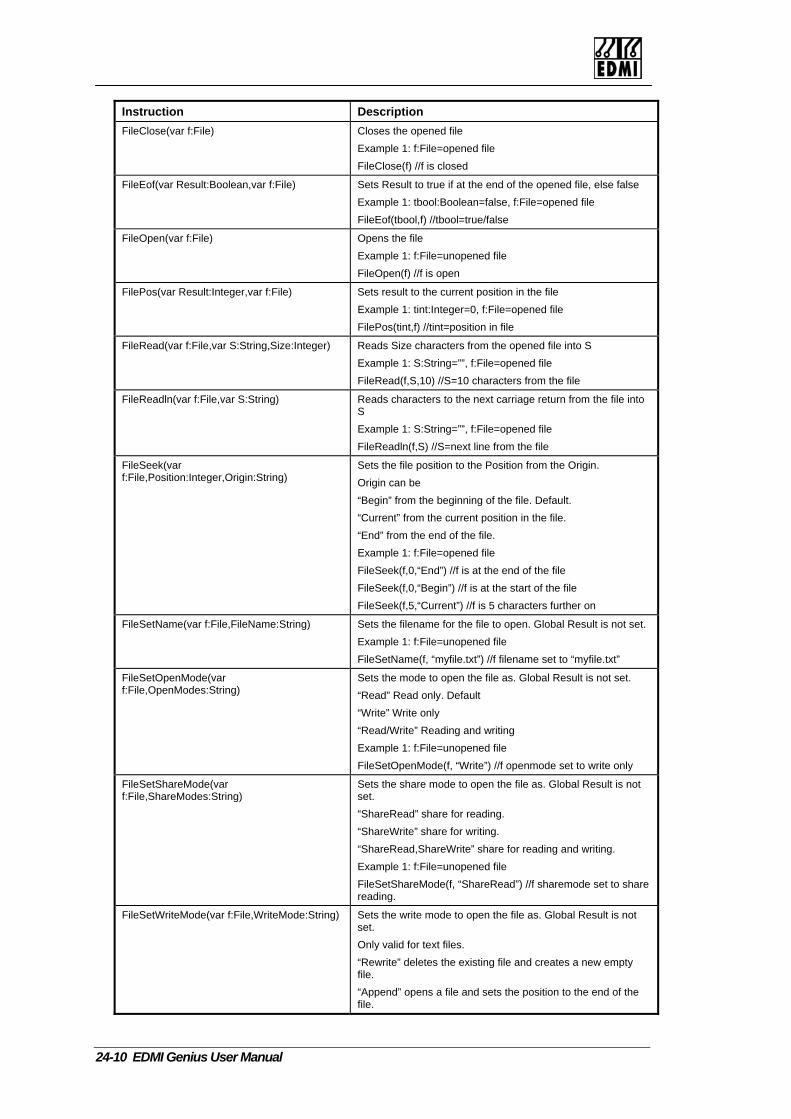
24-10 EDMI Genius User Manual
Instruction Description FileClose(var f:File) Closes the opened file
Example 1: f:File=opened file FileClose(f) //f is closed
FileEof(var Result:Boolean,var f:File) Sets Result to true if at the end of the opened file, else false Example 1: tbool:Boolean=false, f:File=opened file FileEof(tbool,f) //tbool=true/false
FileOpen(var f:File) Opens the file Example 1: f:File=unopened file FileOpen(f) //f is open
FilePos(var Result:Integer,var f:File) Sets result to the current position in the file Example 1: tint:Integer=0, f:File=opened file FilePos(tint,f) //tint=position in file
FileRead(var f:File,var S:String,Size:Integer) Reads Size characters from the opened file into S Example 1: S:String=””, f:File=opened file FileRead(f,S,10) //S=10 characters from the file
FileReadln(var f:File,var S:String) Reads characters to the next carriage return from the file into S Example 1: S:String=””, f:File=opened file FileReadln(f,S) //S=next line from the file
FileSeek(var f:File,Position:Integer,Origin:String)
Sets the file position to the Position from the Origin. Origin can be “Begin” from the beginning of the file. Default. “Current” from the current position in the file. “End” from the end of the file. Example 1: f:File=opened file FileSeek(f,0,“End”) //f is at the end of the file FileSeek(f,0,“Begin”) //f is at the start of the file FileSeek(f,5,“Current”) //f is 5 characters further on
FileSetName(var f:File,FileName:String) Sets the filename for the file to open. Global Result is not set. Example 1: f:File=unopened file FileSetName(f, “myfile.txt”) //f filename set to “myfile.txt”
FileSetOpenMode(var f:File,OpenModes:String)
Sets the mode to open the file as. Global Result is not set. “Read” Read only. Default “Write” Write only “Read/Write” Reading and writing Example 1: f:File=unopened file FileSetOpenMode(f, “Write”) //f openmode set to write only
FileSetShareMode(var f:File,ShareModes:String)
Sets the share mode to open the file as. Global Result is not set. “ShareRead” share for reading. “ShareWrite” share for writing. “ShareRead,ShareWrite” share for reading and writing. Example 1: f:File=unopened file FileSetShareMode(f, “ShareRead”) //f sharemode set to share reading.
FileSetWriteMode(var f:File,WriteMode:String) Sets the write mode to open the file as. Global Result is not set. Only valid for text files. “Rewrite” deletes the existing file and creates a new empty file. “Append” opens a file and sets the position to the end of the file.
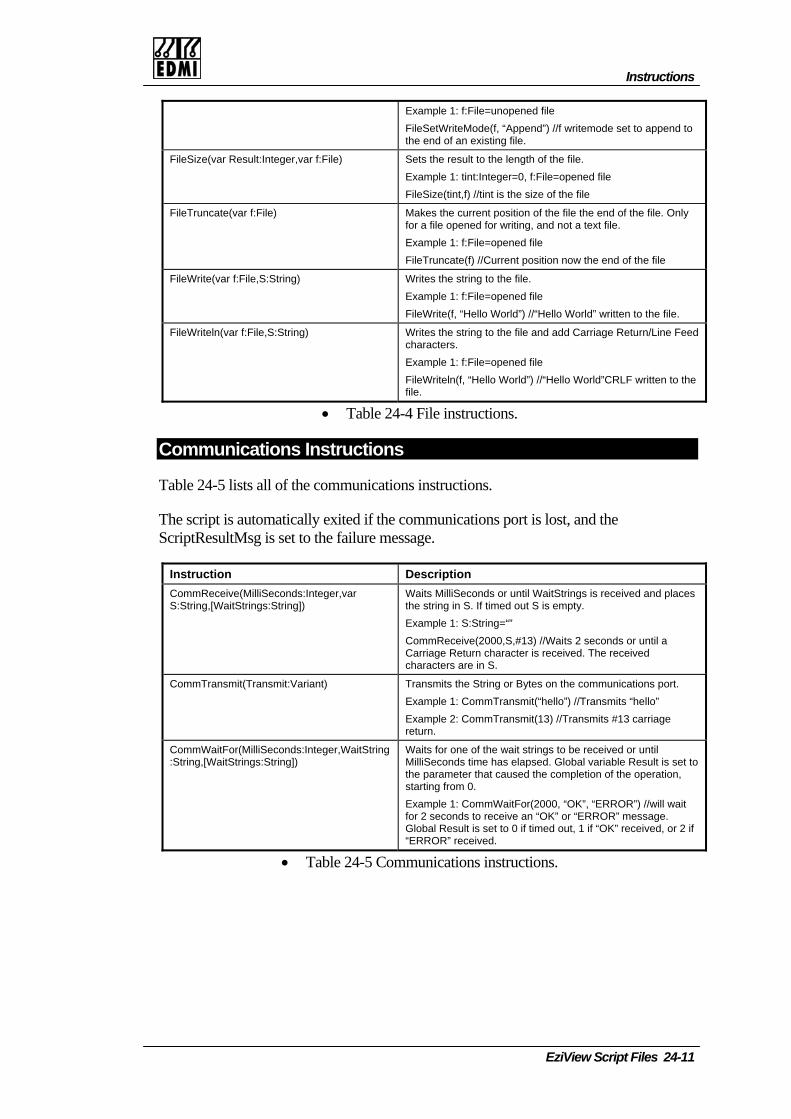
Instructions
EziView Script Files 24-11
Example 1: f:File=unopened file FileSetWriteMode(f, “Append”) //f writemode set to append to the end of an existing file.
FileSize(var Result:Integer,var f:File) Sets the result to the length of the file. Example 1: tint:Integer=0, f:File=opened file FileSize(tint,f) //tint is the size of the file
FileTruncate(var f:File) Makes the current position of the file the end of the file. Only for a file opened for writing, and not a text file. Example 1: f:File=opened file FileTruncate(f) //Current position now the end of the file
FileWrite(var f:File,S:String) Writes the string to the file. Example 1: f:File=opened file FileWrite(f, “Hello World”) //“Hello World” written to the file.
FileWriteln(var f:File,S:String) Writes the string to the file and add Carriage Return/Line Feed characters. Example 1: f:File=opened file FileWriteln(f, “Hello World”) //“Hello World”CRLF written to the file.
• Table 24-4 File instructions.
Communications Instructions
Table 24-5 lists all of the communications instructions.
The script is automatically exited if the communications port is lost, and the ScriptResultMsg is set to the failure message.
Instruction Description CommReceive(MilliSeconds:Integer,var S:String,[WaitStrings:String])
Waits MilliSeconds or until WaitStrings is received and places the string in S. If timed out S is empty. Example 1: S:String=“” CommReceive(2000,S,#13) //Waits 2 seconds or until a Carriage Return character is received. The received characters are in S.
CommTransmit(Transmit:Variant) Transmits the String or Bytes on the communications port. Example 1: CommTransmit(“hello”) //Transmits “hello” Example 2: CommTransmit(13) //Transmits #13 carriage return.
CommWaitFor(MilliSeconds:Integer,WaitString:String,[WaitStrings:String])
Waits for one of the wait strings to be received or until MilliSeconds time has elapsed. Global variable Result is set to the parameter that caused the completion of the operation, starting from 0. Example 1: CommWaitFor(2000, “OK”, “ERROR”) //will wait for 2 seconds to receive an “OK” or “ERROR” message. Global Result is set to 0 if timed out, 1 if “OK” received, or 2 if “ERROR” received.
• Table 24-5 Communications instructions.
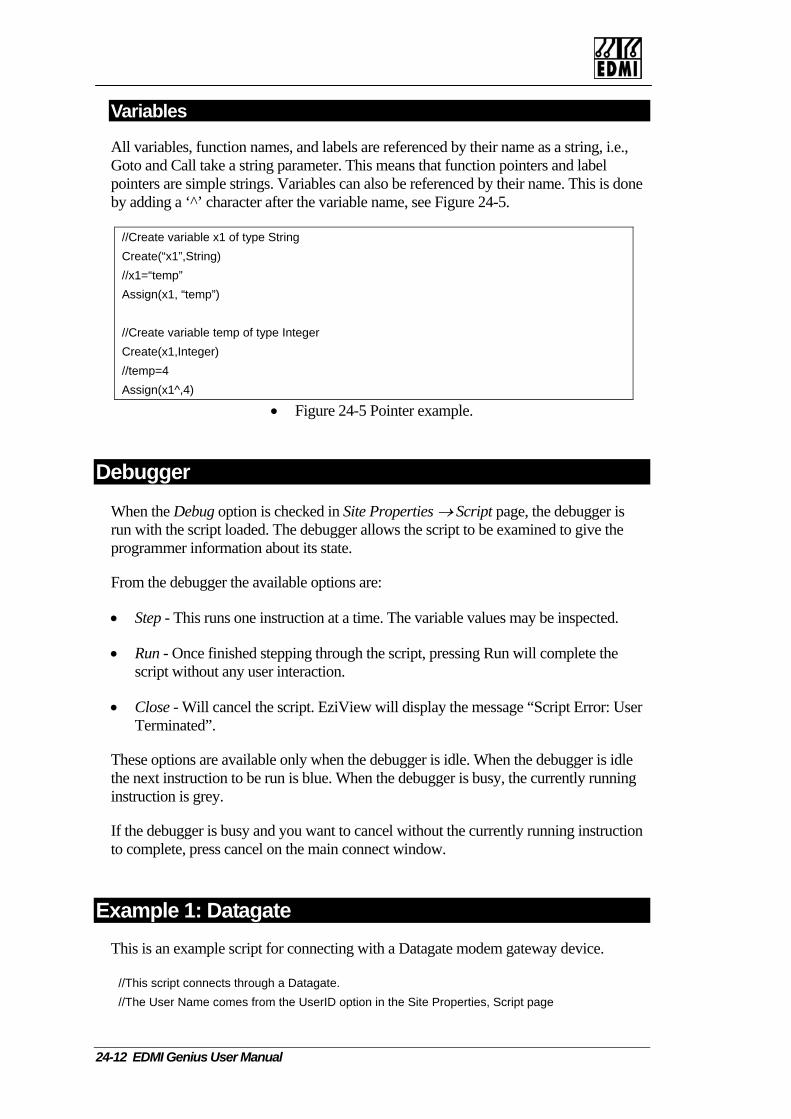
24-12 EDMI Genius User Manual
Variables
All variables, function names, and labels are referenced by their name as a string, i.e., Goto and Call take a string parameter. This means that function pointers and label pointers are simple strings. Variables can also be referenced by their name. This is done by adding a ‘^’ character after the variable name, see Figure 24-5.
//Create variable x1 of type String Create(“x1”,String) //x1=“temp” Assign(x1, “temp”) //Create variable temp of type Integer Create(x1,Integer) //temp=4 Assign(x1^,4)
• Figure 24-5 Pointer example.
Debugger
When the Debug option is checked in Site Properties → Script page, the debugger is run with the script loaded. The debugger allows the script to be examined to give the programmer information about its state.
From the debugger the available options are:
• Step - This runs one instruction at a time. The variable values may be inspected.
• Run - Once finished stepping through the script, pressing Run will complete the script without any user interaction.
• Close - Will cancel the script. EziView will display the message “Script Error: User Terminated”.
These options are available only when the debugger is idle. When the debugger is idle the next instruction to be run is blue. When the debugger is busy, the currently running instruction is grey.
If the debugger is busy and you want to cancel without the currently running instruction to complete, press cancel on the main connect window.
Example 1: Datagate This is an example script for connecting with a Datagate modem gateway device.
//This script connects through a Datagate. //The User Name comes from the UserID option in the Site Properties, Script page

Example 1: Datagate
EziView Script Files 24-13
//The Password comes from the Password option in the Site Properties, Script page //The Port Number comes from the Parameters option in the Site Properties, Script page //Global Variables Function(Global) //Temporary Boolean to use with If statement Create("tbool",Boolean) End //Writes a string to the communications port and adds a CR character. //Halts the script if the port is lost Function(Writeln,s:String) //Transmit s CommTransmit(s) //Transmit the carriage return CommTransmit(13) End //Main execution of the script Function(Main) //Create local variables Create("RetryCount",Integer) Create("s1",String) //Set the RetryCount to 2, when it reaches 0 quit with a timed out message Assign(RetryCount,2) :MainWaitInput //Wait for the datagate response //Result is the 0 for timeout, 1 - login:, 2 - password, 3 - Enter Option, 4 - Enter User ID, 5 - Access Denied. CommWaitFor(3000,"login:","password:","Enter Option","Enter User ID","Access Denied.") Assign(s1,"MainCase") //Convert the Result Integer to a String because can't add a String and an Integer CastValue(Result,String) Add(s1,Result) Goto(s1) :MainCase0 //Timed out Subtract(RetryCount,1) Equal(tbool,RetryCount,0) If(tbool) Goto("MainTimedOut") CommTransmit(#27) Goto("MainWaitInput") :MainCase1 //login: Call("Writeln",UserID)
24-14 EDMI Genius User Manual
Goto("MainWaitInput") :MainCase2 //password: Call("Writeln",Password) Goto("MainWaitInput") :MainCase3 //Enter Option Call("Writeln",Parameters) Goto("MainWaitInput") :MainCase4 //Enter User ID Return(True) :MainCase5 //Access Denied. Assign(ScriptResultMsg,"Incorrect User Name or Password") Return(False) :MainTimedOut Assign(ScriptResultMsg,"Datagate Not Responding") Return(False) End
Example 2: Special Modem This is an example that dials the modem directly, using AT commands. “AT” is sent and “OK” is expected in 2 seconds. If this fails twice the script returns false with the message “Response Failed (OK)”. If successful “ATDT phone number” is sent and “CONNECT” or fail string is expected in 2 minutes. If “CONNECT” is found the script returns successful, else an error string is returned.
//This script dials up with using a special modem that is not supported //from Windows //Global Variables Function(Global) //Temporary Boolean to use with If statement Create("tbool",Boolean) End //Writes a string to the communications port and adds a CR character. //Halts the script if the port is lost Function(Writeln,s:String) //Transmit s CommTransmit(s) //Transmit the carriage return CommTransmit(13) End //Sends the Command and waits for the response to be received on the communications port. //Halts the script if the port is lost or the Response is not found after retrying Function(SendCommand,Command:String,Response:String,Timeout:Integer,RetryCount:Integer) :SendCommandRetry Call("Writeln",Command)
Example 2: Special Modem
EziView Script Files 24-15
CommWaitFor(Timeout,Response) If(Result) Goto("SendCommandSuccess") Subtract(RetryCount,1) GreaterEq(tbool,RetryCount,0) If(tbool) Goto("SendCommandRetry") //Failed in the number of retrys Assign(ScriptResultMsg,"Response Failed '") Add(ScriptResultMsg,Response) Add(ScriptResultMsg,"'") Halt(False) :SendCommandSuccess End //Main execution of the script Function(Main) //Create local variables Create("s1",String) Create("DialString",String) //Send AT Call("SendCommand","AT","OK",2000,1) //Modem needs a pause time otherwise it will miss characters Sleep(100) //Send ATD number Assign(DialString,"ATDT ") Add(DialString,Parameters) Call("Writeln",DialString) //Wait for the response from the modem CommWaitFor(120000,"CONNECT","BUSY","NO CARRIER","NO DIALTONE","NO ANSWER") //Result is the 0 for timeout, 1 - Connect, 2 - Busy... Assign(s1,"MainCase") //Convert the Result Integer to a String because can't add a String and an Integer CastValue(Result,String) Add(s1,Result) Goto(s1) :MainCase0 //Timed out Assign(ScriptResultMsg,"Modem Timed Out") Goto("MainEnd") :MainCase1 //Connect Return(True) //Successfully connected :MainCase2 //Busy Assign(ScriptResultMsg,"Modem Busy") Goto("MainEnd") :MainCase3 //No Carrier Assign(ScriptResultMsg,"Modem Failed with No Carrier")

24-16 EDMI Genius User Manual
Goto("MainEnd") :MainCase4 //No Dialtone Assign(ScriptResultMsg,"Modem Not Connected") Goto("MainEnd") :MainCase5 //No Answer Assign(ScriptResultMsg,"Modem Not Answering") :MainEnd Return(False) End
Summary EziView scripts provide a way to perform almost any function in a customisable way while connecting to a site.
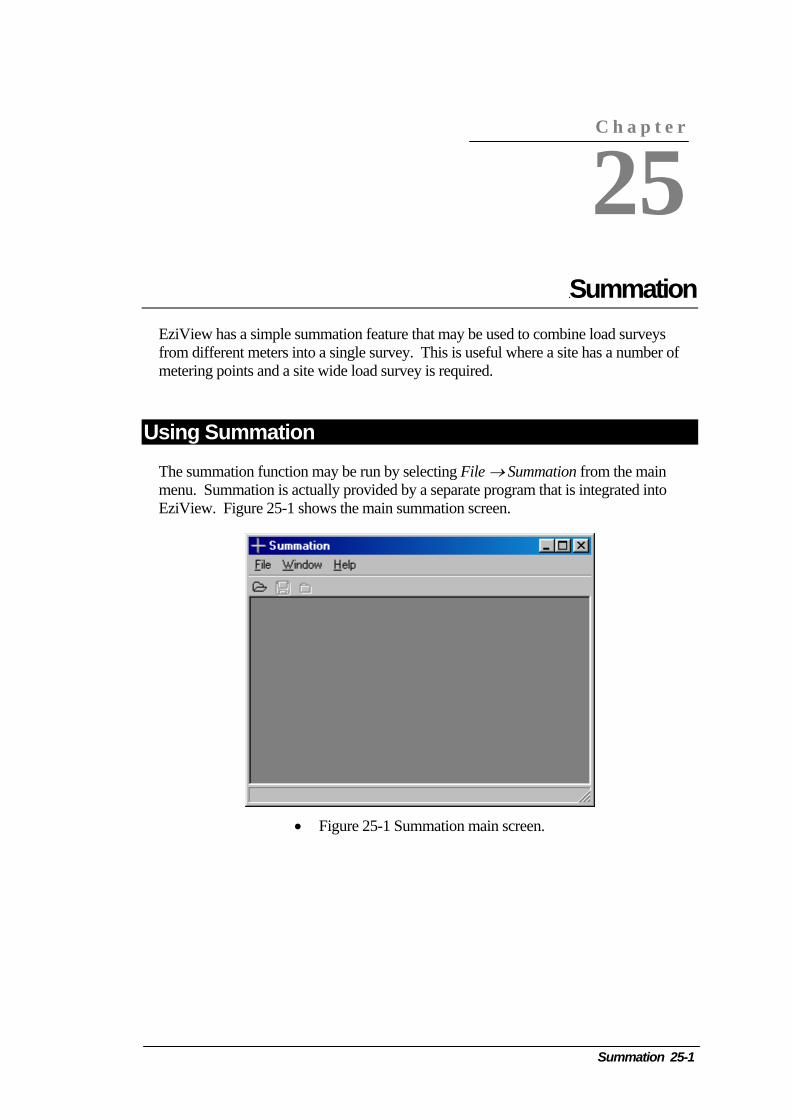
Chapter 25 SuEziView has a simple summation feature that may be used to combinefrom different meters into a single survey. This is useful where a site hmetering points and a site wide load survey is required.
Using Summation
The summation function may be run by selecting File → Summation frmenu. Summation is actually provided by a separate program that is inEziView. Figure 25-1 shows the main summation screen.
• Figure 25-1 Summation main screen.
C h a p t e r
25
Summation 25-1
mmation load surveys as a number of
om the main tegrated into
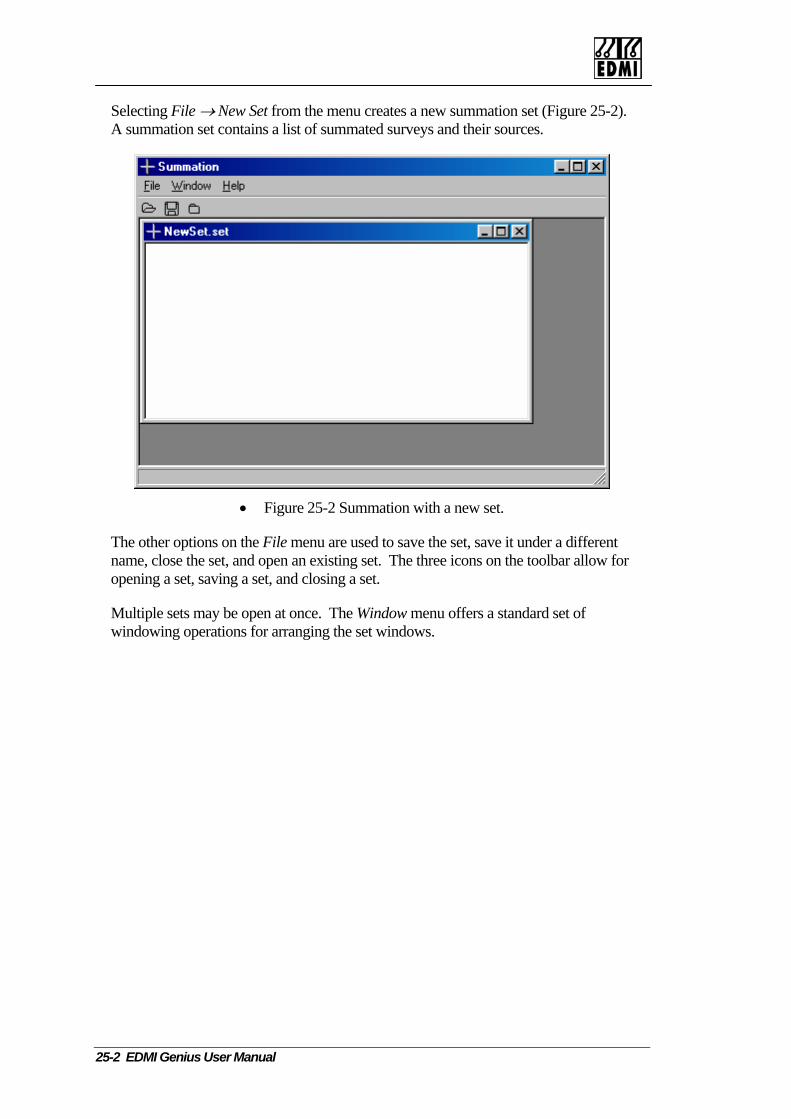
25-2 EDMI Genius User Manual
Selecting File → New Set from the menu creates a new summation set (Figure 25-2). A summation set contains a list of summated surveys and their sources.
• Figure 25-2 Summation with a new set.
The other options on the File menu are used to save the set, save it under a different name, close the set, and open an existing set. The three icons on the toolbar allow for opening a set, saving a set, and closing a set.
Multiple sets may be open at once. The Window menu offers a standard set of windowing operations for arranging the set windows.
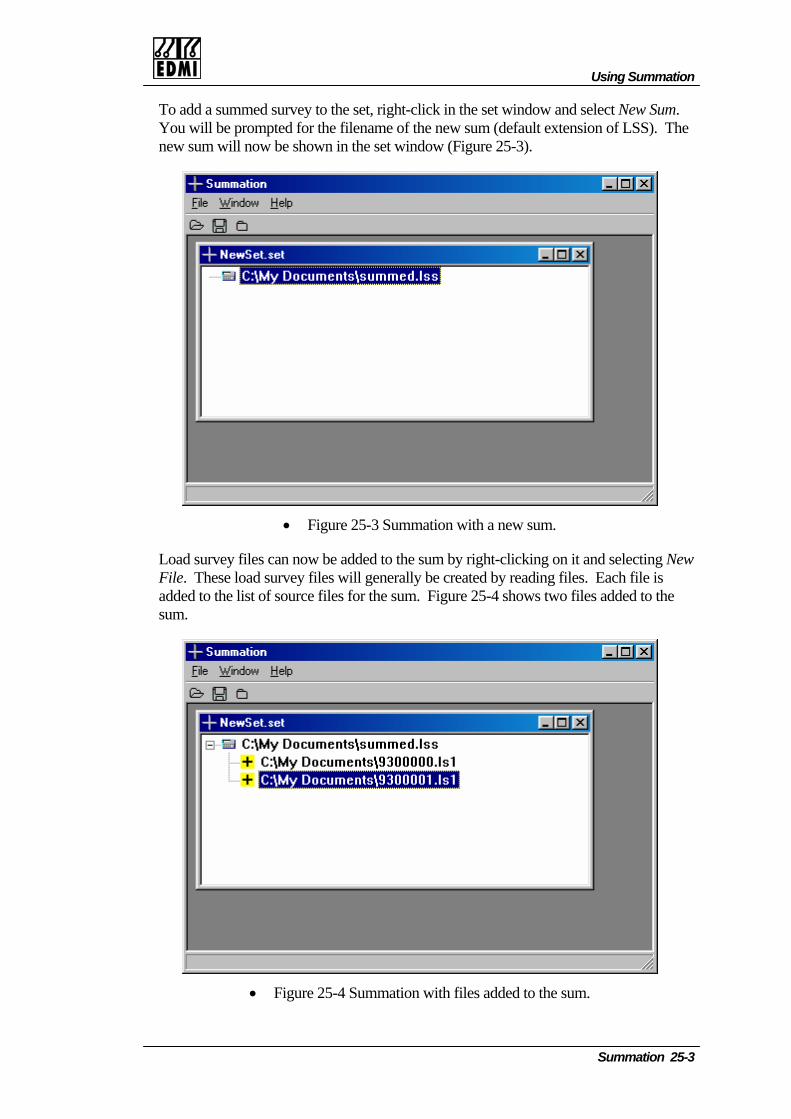
Using Summation
Summation 25-3
To add a summed survey to the set, right-click in the set window and select New Sum. You will be prompted for the filename of the new sum (default extension of LSS). The new sum will now be shown in the set window (Figure 25-3).
• Figure 25-3 Summation with a new sum.
Load survey files can now be added to the sum by right-clicking on it and selecting New File. These load survey files will generally be created by reading files. Each file is added to the list of source files for the sum. Figure 25-4 shows two files added to the sum.
• Figure 25-4 Summation with files added to the sum.

25-4 EDMI Genius User Manual
The plus sign in front of a file indicates that the file will be added to the sum. Right-clicking on the file and selecting Invert will change the sign to a minus sign. This means that the file will be subtracted from the total.
Files can be moved around between sums using the Cut, Copy, Paste, and Delete commands.
Right-clicking in the window and selecting Sum will cause all the summated load surveys to be generated from their source files. The program will take channels with the same register number and add them together to create a channel in the sum. This generally means for surveys created with toolbox that the surveys in the meters will have the corresponding channel numbers added up. It is recommended that all the meters have the same survey loaded to ensure correct results.
Quick Data Display The summation program also has a simple viewing function. This is accessed by right-clicking on a survey and selecting Display (Figure 25-5).
• Figure 25-5 Display example.
The top part of the display shows the data in a tabular format. The bottom part shows the data for one channel graphically. The date is shown along the bottom, and the left-hand side shows the scale. Selecting data from a particular channel in the table shows that channel on the graph.
The graph can be zoomed in by using the left mouse button to select a zoom box.

Notes
Summation 25-5
Notes Summation also works with surveys from other EDMI meters. It can not generally be used to sum surveys from different types of meters together because of differences in the channel naming conventions.
Summation is designed only for simple summation duties. For more complex operations a spreadsheet or billing package should be used.

25-6 EDMI Genius User Manual
Intentionally Blank

Appen
Appendi
his section covers the appendixes.
T
A
dixes
xes

II EDMI Genius User Manual
Intentionally Blank

U
Appendix AUse wThis chapter describes how to configure the EDMI Genius Energy Methe MV90 software package from UTS, in conjunction with the EDM specific TIM is now available called EDM6 – call EDMI for more info
Setting up the meter There are a number of scripts that need to be loaded into the meter for work. MV90 does not support the full range of features of the meter, ssurveys must be used which are compatible with MV90. The required
1. The event log extension (005) must be loaded for MV90 to work c
2. Both MV90 load survey scripts generated by Toolbox must be loa004). The load survey must be of MV90 type.
3. The first four Time of Use (TOU) registers must be set up as follow Channel 0 : Energy - Import W - Total (register 1E393) Channel 1 : Energy - Export W - Total (register 1E397) Channel 2 : Energy - Import VAr - Total (register 1E39B) Channel 3 : Energy - Export VAr – Total (register 1E39F) It appears MV90 will function without the TOU registers setup bucross check against the recorded data.
4. The Modem script needs to be installed if the unit is to be accessed
Notes MV90 will list a number of unrecognised event codes. These refer to fsupported by MV90. Retrieving the event log using EziView will giveevent description.
In MV90 Phone Password 1 should be set to the username to log into tPhone Password 2 should be set to the password for that username.
In MV90 Device S/N should be set to the serial number of the meter.
A p p e n d i x
A
se with MV-90 A-1
ith MV-90 ter for use with TIM. A Genius rmation.
MV90 access to o special load setups are:
orrectly.
ded (003 and
s:
t it uses them to
remotely.
eatures not the complete
he meter with.

A-2 EDMI Genius User Manual
Intentionally Blank

System
Appendix BSystem SpeThis appendix covers the basic specifications of the meter. The Class meters comply to IEC1036. Class 0.5 meters comply with IEC687. Tcomply with the relevant parts of AS1284.
Measured Quantities and Methods The meter can measure the quantities listed in Table 25-1. Note that someasurements are optional features.
Quantity Units Description Watt hours Wh The total Wh (fundamental and harmonic compone
VAr hours VArh The fundamental Varh.
VA hours VAh The total VAh, calculated from Vrms * Irms.
Watts W The total W (fundamental and harmonic componen
VArs VAr The fundamental VAr.
VA VA The total VA, calculated from Vrms * Irms.
Voltage V True RMS voltage.
Current I True RMS current.
Frequency Hz Fundamental system frequency.
Phase Angle Degrees Angle between Fundamental Voltage and Fundam
Phase to Phase Angle
Degrees Angle between Fundamental Voltages.
Power Factor
Ratio Watts divided by VA. Lead or lag determines the s
• Table 25-1 Measurements.
Notes
The sign of VAh is based on the sign of the Wh, as VA itself has no si
When measuring in 2 element mode, a VA reading is computed for theif the meter was connected in three element mode. The direction of thegate registers is determined by the direction of the total power.
A p p e n d i x
B
Specifications B-1
cifications 1 and Class 2 he meters also
me
nts).
ts).
ental Current.
ign.
gn.
three phases as phase by phase

Recommended