GCE
Chemistry
Edexcel Advanced Subsidiary GCE in Chemistry (8CH01)
Edexcel Advanced GCE in Chemistry (9CH01)
Analysis of Chemicals for A2 October 2007
Context study
Edexcel, a Pearson company, is the UK’s largest awarding body offering academic and vocational qualifications and testing to more than 25,000 schools, colleges, employers and other places of learning here and in over 100 countries worldwide. Our qualifications include GCSE, AS and A Level, GNVQ, NVQ and the BTEC suite of vocational qualifications from entry level to BTEC Higher National Diplomas and Foundation Degrees.
We deliver 9.4 million exam scripts each year, with over 3.8 million marked onscreen in 2006. As part of Pearson, Edexcel has been able to invest in cutting-edge technology that has revolutionised the examinations system, this includes the ability to provide detailed performance data to teachers.
References to third party material made in this specification are made in good faith. Edexcel does not endorse, approve or accept responsibility for the content of materials, which may be subject to change, or any opinions expressed therein. (Material may include textbooks, journals, magazines and other publications and websites.)
Authorised by Roger Beard Prepared by Sarah Harrison
All the material in this publication is copyright © Edexcel Limited 2007
Contents
Introduction 1
Analysis of chemicals 3 Electromagnetic radiation as a diagnostic tool 3
Technically differentiating between spectroscopy and spectrometry 3
Ultraviolet radiation 4
NMR 4
Gas chromatography 8 Introduction 8
Food analysis 9
References 11


Context study (Analysis of Chemicals for A2) — Edexcel AS/A GCE in Chemistry (8CH01/9CH01) — Issue 1 — October 2007 © Edexcel Limited 2007
1
Introduction
This document is designed to help teachers to understand the contemporary context of the analysis of chemicals. It should give teachers information on this context and on how to research it further if they wish. This document could also be given to students as introductory material.

Context study (Analysis of Chemicals for A2) — Edexcel AS/A GCE in Chemistry (8CH01/9CH01) — Issue 1 — October 2007 © Edexcel Limited 2007
2
Context study (Analysis of Chemicals for A2) — Edexcel AS/A GCE in Chemistry (8CH01/9CH01) — Issue 1 — October 2007 © Edexcel Limited 2007
3
Analysis of chemicals
Electromagnetic radiation as a diagnostic tool
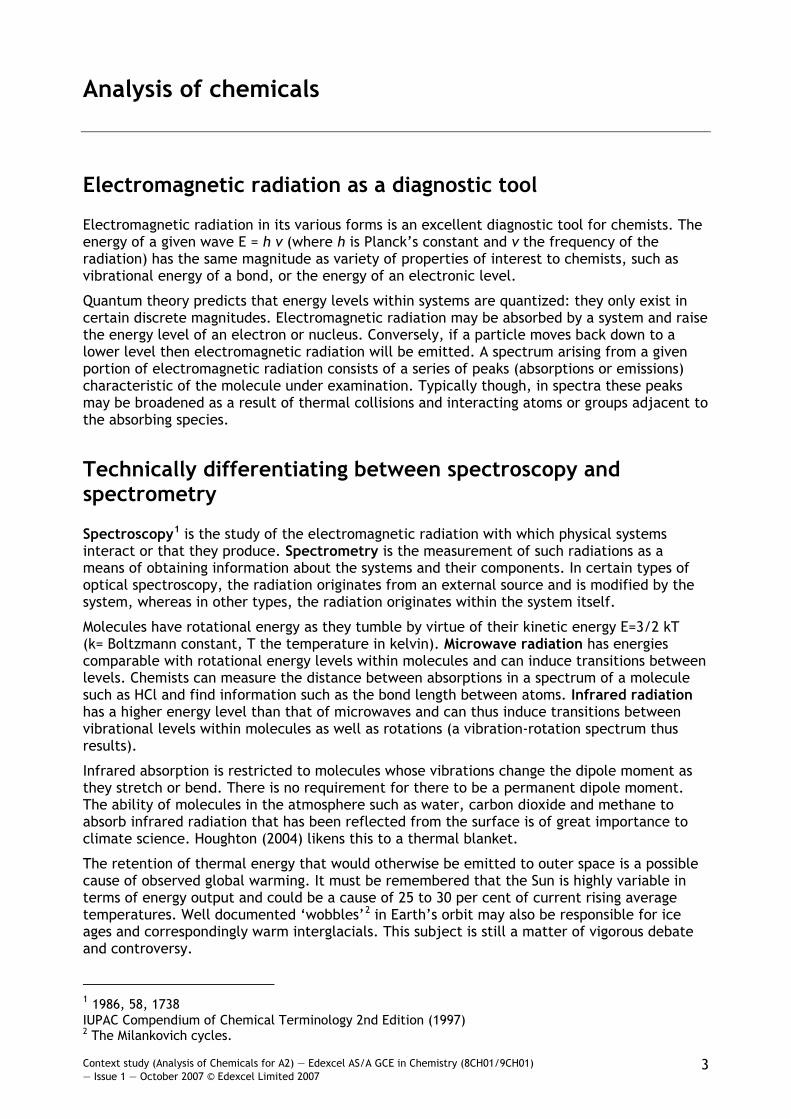
Electromagnetic radiation in its various forms is an excellent diagnostic tool for chemists. The energy of a given wave E = h v (where h is Planck’s constant and v the frequency of the radiation) has the same magnitude as variety of properties of interest to chemists, such as vibrational energy of a bond, or the energy of an electronic level.
Quantum theory predicts that energy levels within systems are quantized: they only exist in certain discrete magnitudes. Electromagnetic radiation may be absorbed by a system and raise the energy level of an electron or nucleus. Conversely, if a particle moves back down to a lower level then electromagnetic radiation will be emitted. A spectrum arising from a given portion of electromagnetic radiation consists of a series of peaks (absorptions or emissions) characteristic of the molecule under examination. Typically though, in spectra these peaks may be broadened as a result of thermal collisions and interacting atoms or groups adjacent to the absorbing species.
Technically differentiating between spectroscopy and spectrometry
Spectroscopy1 is the study of the electromagnetic radiation with which physical systems interact or that they produce. Spectrometry is the measurement of such radiations as a means of obtaining information about the systems and their components. In certain types of optical spectroscopy, the radiation originates from an external source and is modified by the system, whereas in other types, the radiation originates within the system itself.
Molecules have rotational energy as they tumble by virtue of their kinetic energy E=3/2 kT (k= Boltzmann constant, T the temperature in kelvin). Microwave radiation has energies comparable with rotational energy levels within molecules and can induce transitions between levels. Chemists can measure the distance between absorptions in a spectrum of a molecule such as HCl and find information such as the bond length between atoms. Infrared radiation has a higher energy level than that of microwaves and can thus induce transitions between vibrational levels within molecules as well as rotations (a vibration-rotation spectrum thus results).
Infrared absorption is restricted to molecules whose vibrations change the dipole moment as they stretch or bend. There is no requirement for there to be a permanent dipole moment. The ability of molecules in the atmosphere such as water, carbon dioxide and methane to absorb infrared radiation that has been reflected from the surface is of great importance to climate science. Houghton (2004) likens this to a thermal blanket.
The retention of thermal energy that would otherwise be emitted to outer space is a possible cause of observed global warming. It must be remembered that the Sun is highly variable in terms of energy output and could be a cause of 25 to 30 per cent of current rising average temperatures. Well documented ‘wobbles’2 in Earth’s orbit may also be responsible for ice ages and correspondingly warm interglacials. This subject is still a matter of vigorous debate and controversy.
1 1986, 58, 1738 IUPAC Compendium of Chemical Terminology 2nd Edition (1997) 2 The Milankovich cycles.
Context study (Analysis of Chemicals for A2) — Edexcel AS/A GCE in Chemistry (8CH01/9CH01) — Issue 1 — October 2007 © Edexcel Limited 2007
4
Ultraviolet radiation
Of greater energy still is ultraviolet radiation (UV). This radiation induces transitions between electronic levels in the molecule. In absorption, energy is always taken in by the molecule and a transition to a higher level takes place. In emission spectra, electromagnetic energy is emitted when a transition to a lower energy level takes place.
Chemists are particularly interested in conjugated systems where systems of π electrons may overlap, as in benzene, or where carbonyl groups may be adjacent to carbon multiple bond systems. Here UV spectra are particularly informative as to chemical structure. Conjugation changes the absorption to longer wavelengths and gives a more intense absorption.
NMR
Nuclear Magnetic Resonance spectroscopy (nmr) and its lesser known cousin Electron Spin Resonance (ESR) use energy radiation in the radio frequency range. Nmr involves transitions of nuclei from one spin state to another. ESR involves unpaired electron spins, rather than the spins of atomic nuclei. Proton Magnetic Resonance spectroscopy is particularly suitable for organic chemists as there are only two levels (+½ and -½) and the interpretations of the spectra are reasonably straightforward. Chemists also use carbon-13 nmr as this shows the carbon environments as well as coupling between hydrogen and carbon nuclei. Inorganic chemistry is also well served as various nuclei such as 31P and 19F have the appropriate spin states.
Nmr spectra arise from a property that some nuclei have, loosely termed spin. This is a quantum effect; a simplified model of it imagines the nucleus spinning on its axis, this spin being quantised ie having only two directions (up and down). The nuclear spin is a characteristic property of the nucleus.
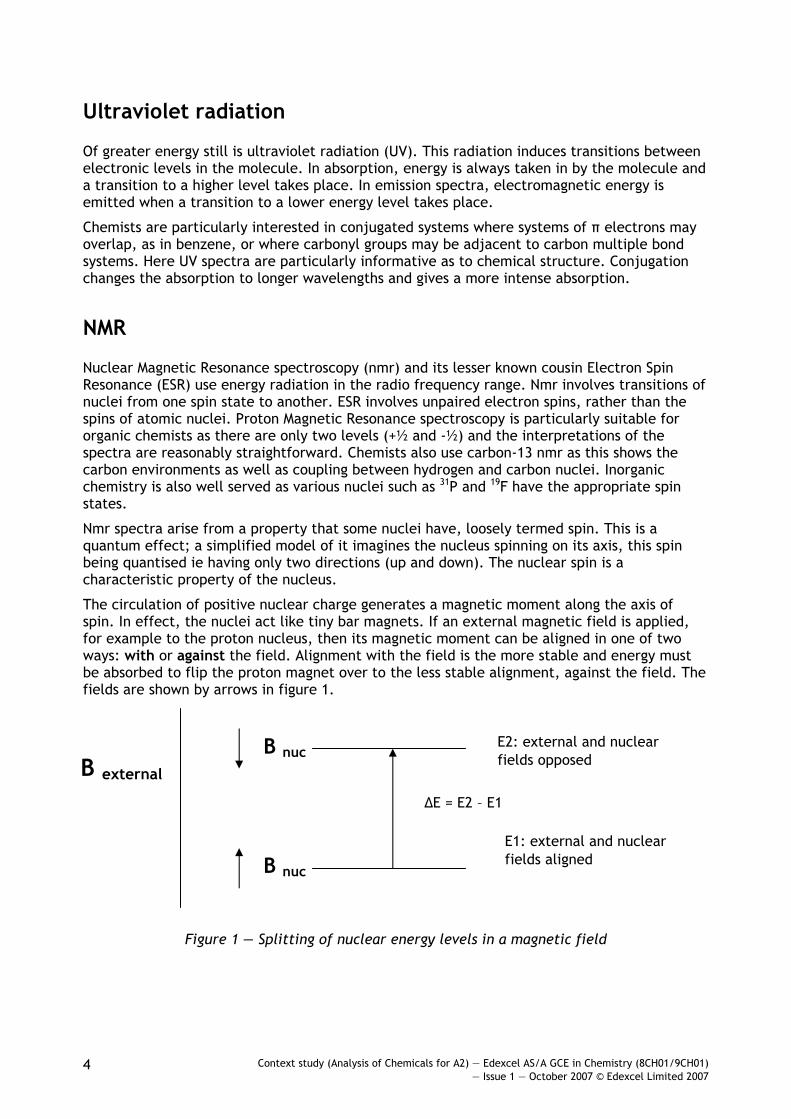
The circulation of positive nuclear charge generates a magnetic moment along the axis of spin. In effect, the nuclei act like tiny bar magnets. If an external magnetic field is applied, for example to the proton nucleus, then its magnetic moment can be aligned in one of two ways: with or against the field. Alignment with the field is the more stable and energy must be absorbed to flip the proton magnet over to the less stable alignment, against the field. The fields are shown by arrows in figure 1.
Figure 1 — Splitting of nuclear energy levels in a magnetic field
B external
B nuc
B nuc
ΔE = E2 – E1
E2: external and nuclear fields opposed
E1: external and nuclear fields aligned
Context study (Analysis of Chemicals for A2) — Edexcel AS/A GCE in Chemistry (8CH01/9CH01) — Issue 1 — October 2007 © Edexcel Limited 2007
5
Transitions between the nuclear spin states are accomplished through the input of radio frequency waves together with the applied magnetic field. For proton magnetic resonance the frequency and field strength are related via the following formula.
πμ
=2B
v
Where v is the frequency, B the applied magnetic field strength (Tesla or gauss) and µ is a nuclear constant, the magnetogyric ratio is 26750 for the proton. Thus the radio frequency used depends upon the strength of the magnetic field. In a field of 14092 gauss (1.4092 Tesla) a frequency of 60 MHz will induce transitions. Using superconducting magnets, very higher magnetic fields of around 5 T (50 kG) allow resonances of 200 MHz to be used. The nmr spectrum arises because nuclei in different parts of the molecule experience different local magnetic fields according to the molecular structure, and so have different frequencies at which they absorb. This difference is called the chemical shift.
In practice the radio frequency is kept constant, and the magnetic field is then swept over a narrow range of field strength. The absorptions are plotted on a graph where the frequency differences (in reality magnetic field differences) are plotted relative to some standard compound which defines the zero; for proton magnetic resonance. The compound normally chosen as a standard is TMS, tetramethylsilane, Si(CH3)4.
The chemical shift given by a particular proton is the frequency difference between its absorption and the absorption from tetramethylsilane, TMS, Si(CH3)4. The actual chemical shift depends on the radio frequency used, which in turn depends on the magnetic field strength. The shift can be made field-independent by defining it as shown.
( )0
6
0
6o 10x10x
ννΔ
=ν
ν−ν=δ
The value of δ is quoted in parts per million. This means for frequencies of approximately 200 MHz the shifts correspond to frequency differences of a few hundred Hz.
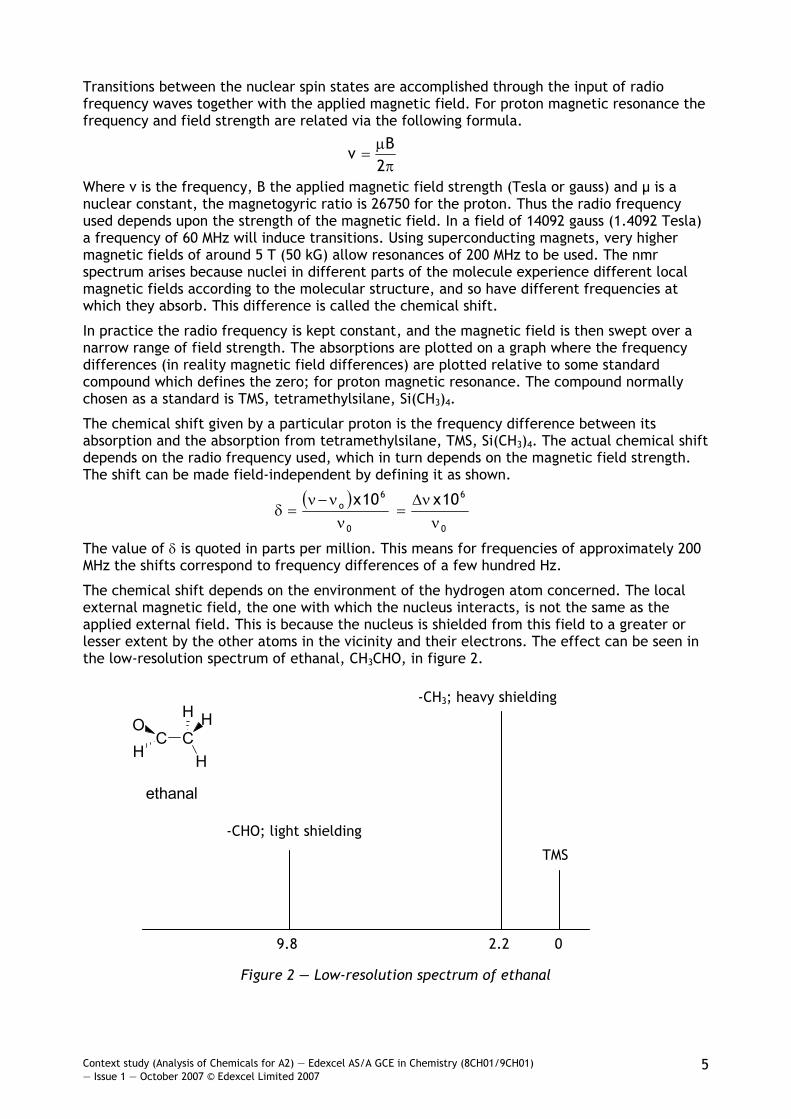
The chemical shift depends on the environment of the hydrogen atom concerned. The local external magnetic field, the one with which the nucleus interacts, is not the same as the applied external field. This is because the nucleus is shielded from this field to a greater or lesser extent by the other atoms in the vicinity and their electrons. The effect can be seen in the low-resolution spectrum of ethanal, CH3CHO, in figure 2.
HC
H HO
ethanal
CH
Figure 2 — Low-resolution spectrum of ethanal
-CHO; light shielding
9.8 2.2 0
TMS
-CH3; heavy shielding
Context study (Analysis of Chemicals for A2) — Edexcel AS/A GCE in Chemistry (8CH01/9CH01) — Issue 1 — October 2007 © Edexcel Limited 2007
6
The less the nucleus is shielded, the higher the chemical shift. The relatively exposed hydrogen in the aldehyde group has δ = 9.8, so oxygen charge clouds shift the absorption downfield. The more heavily shielded hydrogen atoms in the methyl group are found at δ = 2.2. TMS hydrogen atoms are have a chemical shift of δ = 0.
Typical 1H chemical shifts relative to TMS = 0
RCOOH carboxylic acids +9 to +13 Can be broad and solvent-dependent
RCONH2 amide +5 to +12 Broad and solvent-dependent
RCHO aldehyde +8 to +10 Sharp
C6H6 etc aromatics +6 to +10
R2C=CHR alkene +4 to +8
RNH2 amines +1 to +6 Broad and solvent-dependent
ROH alcohols +0.5 to +8 Broad and solvent-dependent
RCH2R methylene +1.5 to +4.5
RCH3 methyl 0 to +4
Table 1 — NMR data for typical 1H chemical shifts (Sources: Morrison and Boyd)
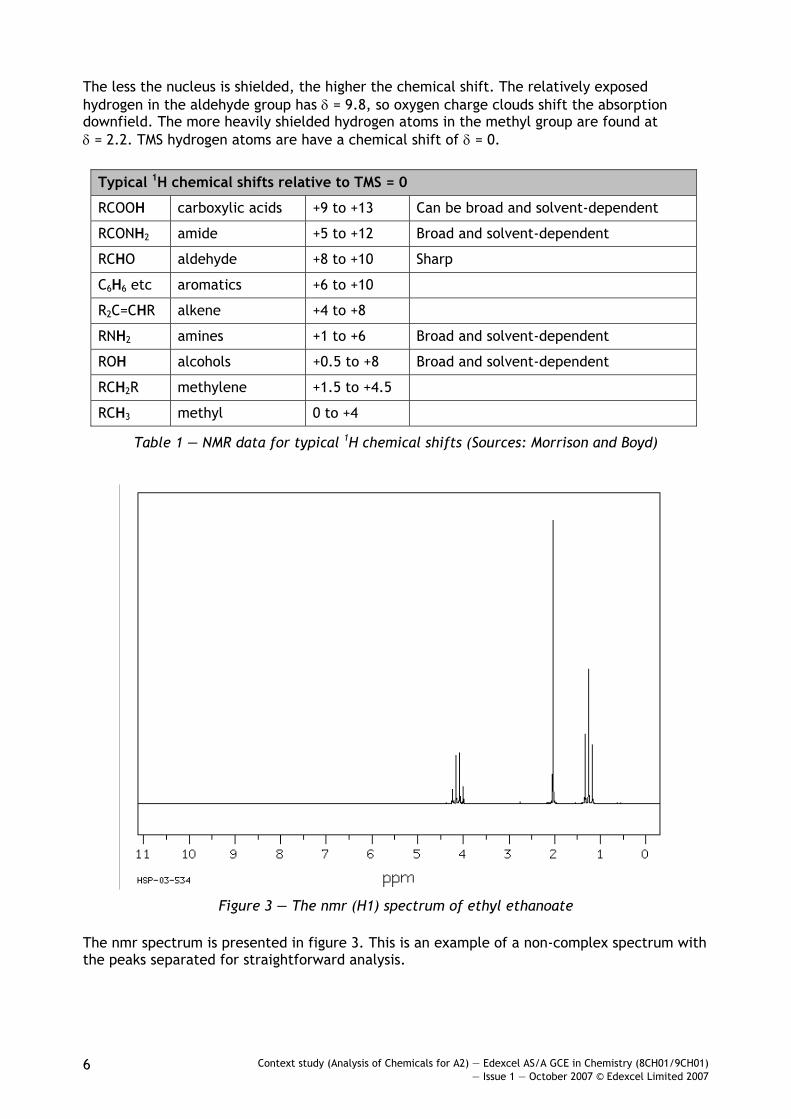
Figure 3 — The nmr (H1) spectrum of ethyl ethanoate
The nmr spectrum is presented in figure 3. This is an example of a non-complex spectrum with the peaks separated for straightforward analysis.
Context study (Analysis of Chemicals for A2) — Edexcel AS/A GCE in Chemistry (8CH01/9CH01) — Issue 1 — October 2007 © Edexcel Limited 2007
7
Note that in some spectra an integration line is provided which can be used to calculate the number of protons under each peak. This is extremely useful. The radio of the peak heights can also give us this information. The triplet at δ ∼1.2 and the singlet at δ = 2 are low chemical shifts, indicative of well-shielded CH3 protons. The former is due to the CH3 next to the Ch2 and the latter the CH3 bonded to the C=O group. The methylene (CH2) protons are in a higher chemical shift range at δ =4 (see table 2).
The multiplet structure is in fact extremely informative and we can demonstrate spin-spin coupling using the ‘n+1 splitting rule’. Looking at the structure of ethyl ethanoate, see figure 4 and the numbering of the carbon atoms.
Figure 4 — Structure of ethyl ethanoate
Focus on the methyl group carbon number 1, and look at its leftward neighbour the methylene group carbon number 2. Count the number of protons on the neighbour, 2, and add 1. This rule predicts the number of peaks present in the carbon number 1 environment. Pascal’s triangle, summarised in table 2, helps to identify a ratio of height, in this case 1:2:1.
Similarly focussing on carbon number 2, its neighbour, the right has three protons, add 1 to give a quartet. We say colloquially that the methyl protons split the methlylene protons in the ratio of 1:3:3:1.
Finally carbon number 4 is not adjacent to a carbon atom with protons, so no splitting occurs and a single peak at Δ = 4 is observed. Note also this methyl group is ‘downfield’ of the first methyl due to the electron-withdrawing properties of the oxygen atoms.
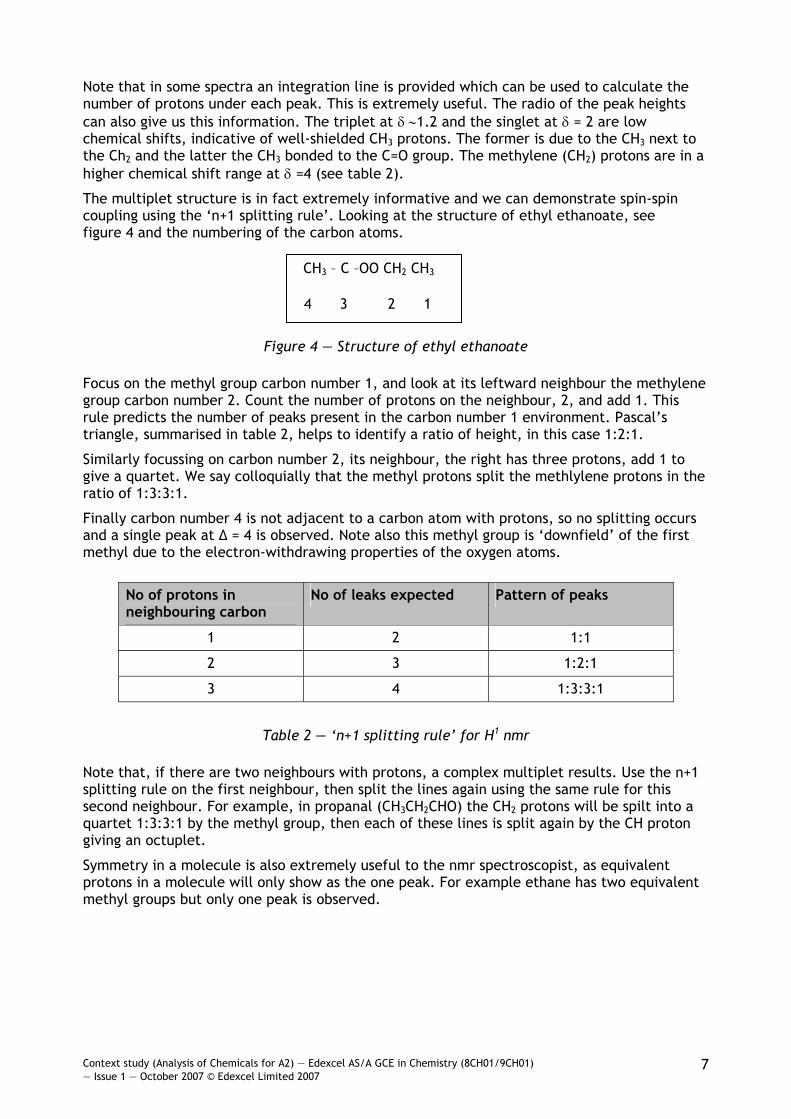
Table 2 — ‘n+1 splitting rule’ for H1 nmr
Note that, if there are two neighbours with protons, a complex multiplet results. Use the n+1 splitting rule on the first neighbour, then split the lines again using the same rule for this second neighbour. For example, in propanal (CH3CH2CHO) the CH2 protons will be spilt into a quartet 1:3:3:1 by the methyl group, then each of these lines is split again by the CH proton giving an octuplet.
Symmetry in a molecule is also extremely useful to the nmr spectroscopist, as equivalent protons in a molecule will only show as the one peak. For example ethane has two equivalent methyl groups but only one peak is observed.
No of protons in neighbouring carbon
No of leaks expected Pattern of peaks
1 2 1:1
2 3 1:2:1
3 4 1:3:3:1
CH3 – C –OO CH2 CH3
4 3 2 1
Context study (Analysis of Chemicals for A2) — Edexcel AS/A GCE in Chemistry (8CH01/9CH01) — Issue 1 — October 2007 © Edexcel Limited 2007
8
Gas chromatography
Introduction
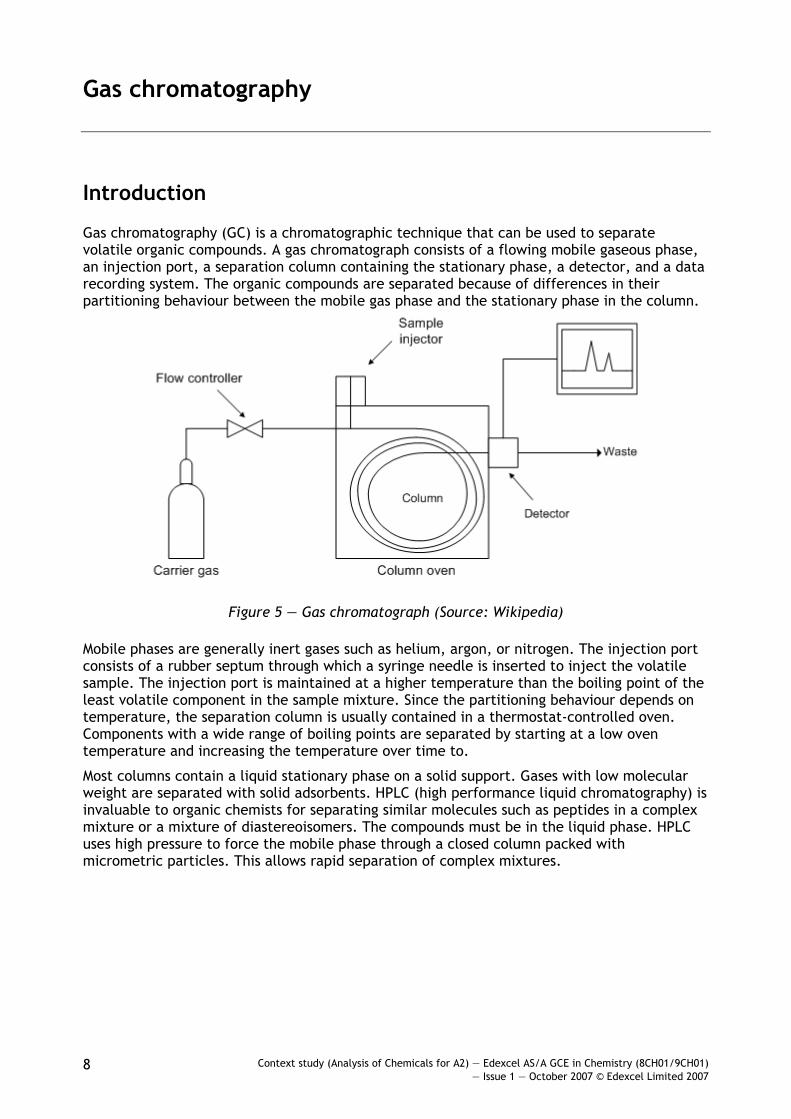
Gas chromatography (GC) is a chromatographic technique that can be used to separate volatile organic compounds. A gas chromatograph consists of a flowing mobile gaseous phase, an injection port, a separation column containing the stationary phase, a detector, and a data recording system. The organic compounds are separated because of differences in their partitioning behaviour between the mobile gas phase and the stationary phase in the column.
Figure 5 — Gas chromatograph (Source: Wikipedia)
Mobile phases are generally inert gases such as helium, argon, or nitrogen. The injection port consists of a rubber septum through which a syringe needle is inserted to inject the volatile sample. The injection port is maintained at a higher temperature than the boiling point of the least volatile component in the sample mixture. Since the partitioning behaviour depends on temperature, the separation column is usually contained in a thermostat-controlled oven. Components with a wide range of boiling points are separated by starting at a low oven temperature and increasing the temperature over time to.
Most columns contain a liquid stationary phase on a solid support. Gases with low molecular weight are separated with solid adsorbents. HPLC (high performance liquid chromatography) is invaluable to organic chemists for separating similar molecules such as peptides in a complex mixture or a mixture of diastereoisomers. The compounds must be in the liquid phase. HPLC uses high pressure to force the mobile phase through a closed column packed with micrometric particles. This allows rapid separation of complex mixtures.
Context study (Analysis of Chemicals for A2) — Edexcel AS/A GCE in Chemistry (8CH01/9CH01) — Issue 1 — October 2007 © Edexcel Limited 2007
9
There is a wide variety of stationary and variable phases in use which makes the technique very versatile. In normal phase (NPHPLC) the sample should be non-ionic and soluble in a hydrophobic solvent (eg hexanoic acid). The mobile phase is non-polar and the stationary phase is polar (eg silica), or containing cyano or amino groups. The sample is introduced via a rotatory valve. Most HPLC systems are linked to a continuous monitoring detector of high selectivity. Examples include UV/visible detectors good for phenols or diode array detection (DAD) and fluorescence detection for aromatic compounds. Electrochemical detectors can detect femto amounts of electro active compounds such as vitamins and purines. In GC and HLPC connection to software records and calculates the retention times and sizes (areas) of peaks for quantitative analysis.
Typically, GC is useful for analyzing non-polar and semi-polar, volatile and semi-volatile chemicals. Without chemical derivatization, GC is often used for the analysis of sterols, oils, low chain fatty acids, aroma components and off-flavors, and many contaminants, such as pesticides, industrial pollutants, and certain types of drug in foods.
Food analysis
As a case study the application of chromatography to the food industry will be examined. GC is used widely in applications involving food analysis. Typical applications pertain to the quantitative and/or qualitative analysis of food composition, natural products, food additives, flavor and aroma components, a variety of transformation products, and contaminants, such as pesticides, fumigants, environmental pollutants, natural toxins, veterinary drugs, and packaging materials.
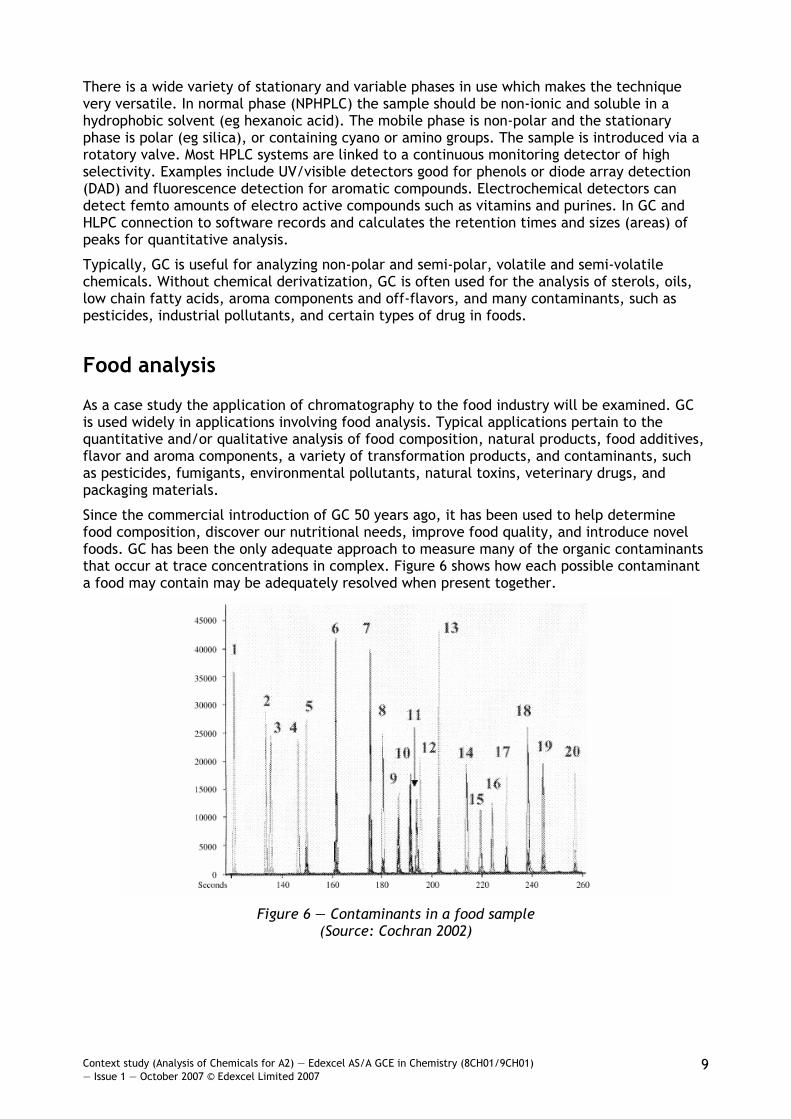
Since the commercial introduction of GC 50 years ago, it has been used to help determine food composition, discover our nutritional needs, improve food quality, and introduce novel foods. GC has been the only adequate approach to measure many of the organic contaminants that occur at trace concentrations in complex. Figure 6 shows how each possible contaminant a food may contain may be adequately resolved when present together.
Figure 6 — Contaminants in a food sample
(Source: Cochran 2002)
Context study (Analysis of Chemicals for A2) — Edexcel AS/A GCE in Chemistry (8CH01/9CH01) — Issue 1 — October 2007 © Edexcel Limited 2007
10
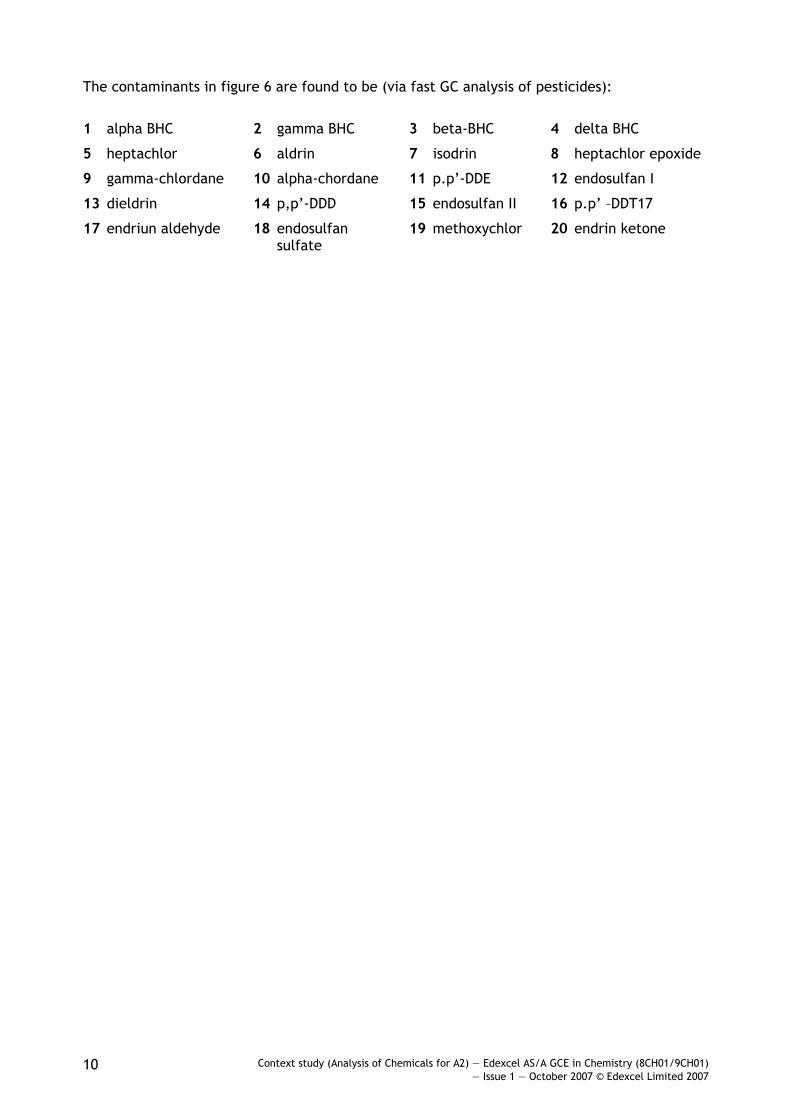
The contaminants in figure 6 are found to be (via fast GC analysis of pesticides):
1 alpha BHC 2 gamma BHC 3 beta-BHC 4 delta BHC
5 heptachlor 6 aldrin 7 isodrin 8 heptachlor epoxide
9 gamma-chlordane 10 alpha-chordane 11 p.p’-DDE 12 endosulfan I
13 dieldrin 14 p,p’-DDD 15 endosulfan II 16 p.p’ –DDT17
17 endriun aldehyde 18 endosulfan sulfate
19 methoxychlor 20 endrin ketone
Context study (Analysis of Chemicals for A2) — Edexcel AS/A GCE in Chemistry (8CH01/9CH01) — Issue 1 — October 2007 © Edexcel Limited 2007
11
References
Krane K S — Introductory Nuclear Physics (Wiley, 1987)
Lee M S — Spectroscopic methods of analysis — Mass spectrometry Vol 1 issue 1, pp 2535-2551 (available online www.dekker.com/sdek/linking~db=enc~content=a713491567, 2002)
Morrison R T and Boyd R N — Organic Chemistry, 5th edition (Allyn and Bacon, Inc, 1987)
Structure spectroscopy examples for GCE
Chapman B — Transition Metal, Quantitative Kinetics and Applied Organic Chemistry (Nelson, 2001)
Houghton J — Global warming: The complete briefing, 3rd edition (Cambridge University Press, 2004)
Extra reading
A detailed and in-depth overview of current MS technologies and applications can be obtained from the recent proceedings of the American Society for Mass Spectrometry Conference on Mass Spectrometry and Allied Topics (www.asms.org) and the Association of Biomolecular Resource Facilities (www.abrf.org).
Websites
Dr Rod Beavon’s Chemistry pages
http://home.clara.net/rod.beavon/chemistry_contents.htm
Extended periodic table www.apsidium.com/ext_pt/expertab.htm
1570rl191007S:\LT\PD\SUPPORT\GCE in Chemistry Analysis of Chemicals A2 CS.doc.DOC.1-16/0

October 2007 For more information on Edexcel and BTEC qualifications please contact Customer Services on 0870 240 9800 or http://enquiries.edexcel.org.uk or visit our website: www.edexcel.org.uk Edexcel Limited. Registered in England and Wales No. 4496750 Registered Office: One90 High Holborn, London WC1V 7BH. VAT Reg No 780 0898 07
Recommended