2106 IEEE TRANSACTIONS ON MAGNETICS, VOL. MAG-19, NO. 5 , SEPTEMBER 1983
FULL SCALE LABORATORY INVESTIGATIONS ON THE THREE SINGLE PHASE FERRORESONANCE PHENOMENON
Ph. GUUINIC (Electricit6 de France) and N. JANSSENS (Laborelec)
Abstract - The paper deals with full scale laboratory investi- gations on a circuit composed of three single phase voltage transformers (10/$3 kV, 50 VA) connected to an ungrounded source supply with a zero sequence capacitance. About a hundred energizing operations were performed. Some records of transient states obtained by varying the value of t h e capacitor bank and the voltage of the source are shown. The stroboscopic method and its original adaptation to the three single phase ferroresonance phenomenon are presented. Finally, observations are made about digital simulations.
I- INTRODUCTION
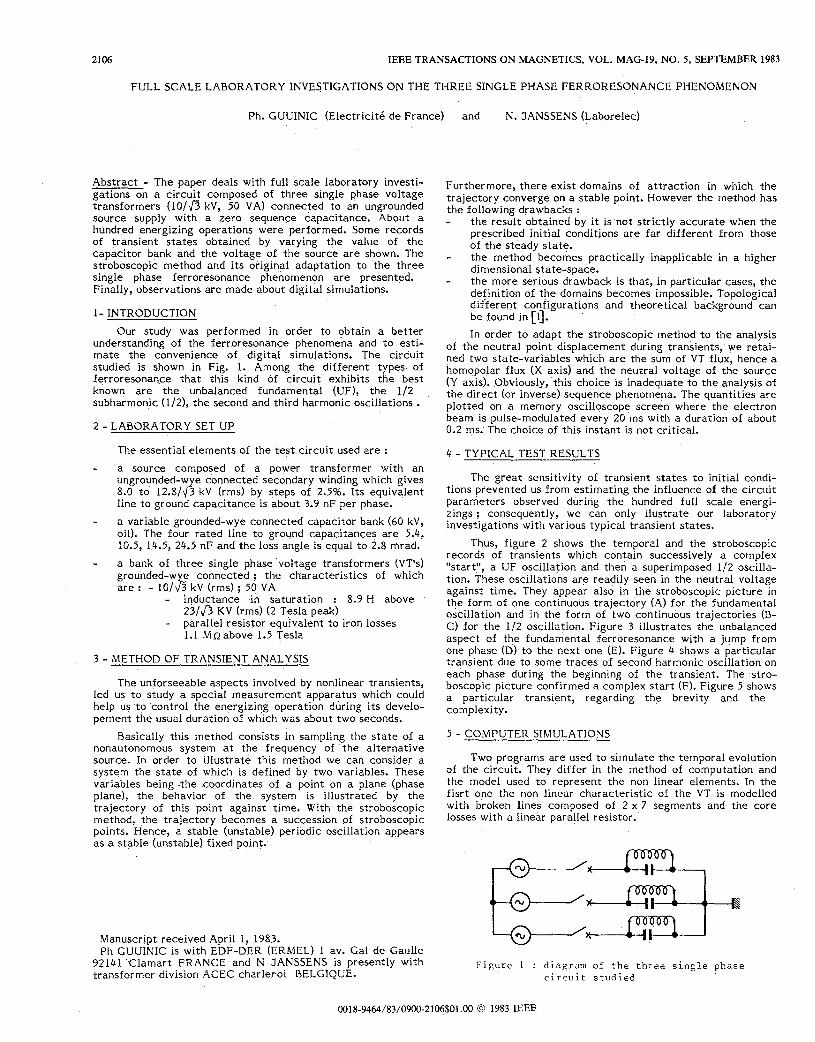
Our study was performed in order to obtain a bet ter understanding of the ferroresonance phenomena and to esti- mate the convenience of digital simulations. The circuit studied is shown in Fig. 1. Among the different - types of ferroresonance that this kind of circuit exhibits the best known are the unbalanced fundamental (UF), t h e 1/2 subharmonic (1/2), the second and third harmonic oscillations . 2 - LABORATORY SET UP
The essential elements of t h e test circuit used are :
- a source composed of a power transformer with an ungrounded-wye connected secondary winding which gives 8.0 t o 12.8/T3 kV (rms) by steps of 2.5%. Its equivalent line to ground capacitance is about 3.9 nF per phase.
- a variable grounded-wye connected capacitor bank (60 kV, oil). The four rated line to ground capacitances are 5.4, 10.5, 14.5, 24.5 nF and the loss angle is equal to 2.8 m a d .
- a bank of three single phase voltage transformers (VT's) grounded-wye connected ; the character is t ics of which a r e : - lO/fi k V (rms) ; 50 VA
- inductance in saturation : 8.9 H above
- parallel resistor equivalent to iron losses 23/$3 KV (rms) (2 Tesla peak)
1.1 Ma above 1.5 Tesla
3 - METHOD OF TRANSIENT ANALYSIS
The unforseeable aspects involved by nonlinear transients, led us to study a special measurement apparatus which could help us to control the energizing operation during its develo- pement the usual duration of which was about two seconds.
Basically this method consists in sampling the state of a nonautonomous system at the frequency of the a l ternat ive source. In order to illustrate this method we can consider a system the state of which is defined by two variables. These variables being -the coordinates of a point on a plane (phase plane), t he behavior of the system is illustrated by t h e trajectory of this point against time. With the stroboscopic method, the trajectory becomes a succession of stroboscopic points. Hence, a stable (unstable) periodic oscillation appears as a stable (unstable) fixed point.
Manuscript received April 1, 1983. Ph GUUINIC is with EDF-DER (ERMEL) 1 av. Gal de Gaulle
92141 .Clamart FRANCE and N JANSSENS is presently with transformer division ACEC charleroi BELGIQUE.
Furthermore, there exist domains of a t t ract ion in which t h e trajectory converge on a stable point. However the method has t h e following drawbacks : - the result obtained by it is not strictly accurate when the
prescribed initial conditions are far different from those of the s teady state.
- the method becomes practically inapplicable in a higher dimensional state-space.
- the more serious drawback is that, in particular cases, t h e definition of the domains becomes impossible. Topological different configurations and theoretical background can be found in [I]. In order to adapt the stroboscopic method to the analysis
of the neutral point displacement during transients, we retai- ned two state-variables which are the sum of VT flux, hence a homopolar flux (X axis) and the neutral voltage of the source (Y axis). Obviously, this choice is inadequate to the analysis of the direct (or inverse) sequence phenomena. The quantities are plotted on a memory oscilloscope screen where the electron beam is pulse-modulated every 20 ms with a duration of about 0.2 ms. The choice of this instant is not critical.
4 - TYPICAL TEST RESULTS
The great sensitivity of transient states to initial condi- tions prevented us from estimating the influence of the circuit parameters observed during the hundred full scale energi- zings ; consequently, we can only ilustrate our laboratory investigations with various typical transient states.
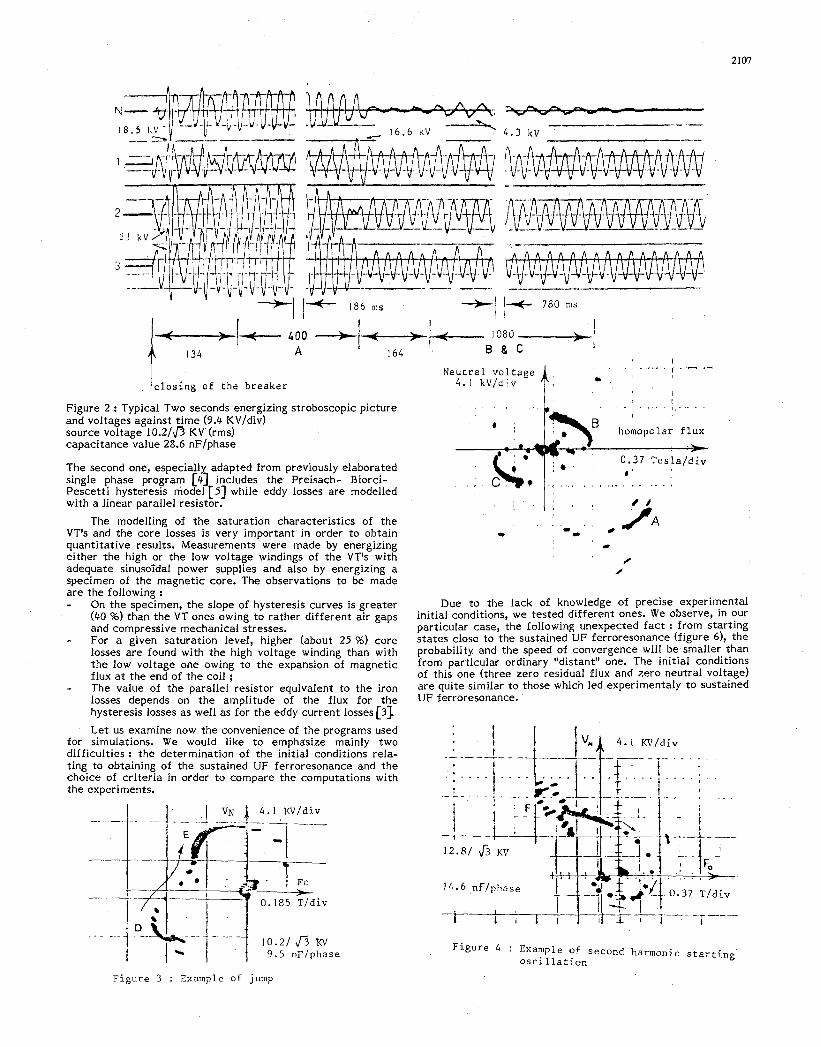
Thus, figure 2 shows the temporal and the stroboscopic records of transients which contain successively a complex "start", a UF oscillation and then a superimposed 1/2 oscilla- tion. These oscillations are readily seen in the neutral voltage against time. They appear also in the stroboscopic picture in the form of one Continuous trajectory (A) for the fundamental oscillation and in the form of two continuous trajectories (B- C) for the 1/2 oscillation. Figure 3 illustrates the unbalanced aspect of the fundamental ferroresonance with a jump from one phase (D) to the next one (E). Figure 4 shows a particular t ransient due to some t races of second harmonic oscillation on each phase during ttie beginning of the transient. The stro- boscopic picture confirmed a complex start (F). Figure 5 shows a particular transient, regarding the brevity and the complexity.
5 - COMPUTER SIMULATIONS
Two programs are used to simulate the temporal evolution of the circuit. They differ in the method of computation and t h e model used to represent the non linear elements. In the fisrt one the non linear characteristic of the VT is modelled with broken lines composed of 2 x 7 segments and the core losses with a linear parallel resistor.
Figure 1 : d i a g r a m of t h e t h r e e s i n g l e p h a s e c i r c u i t s t u d i e d
0018-9464/83/0900-2106$01.00 0 1983 IEEE
2107
,
Neutral voltage
Figure 2 : Typical Two seconds energizing stroboscopic picture and voltages against time (9.4 KV/div) source voltage 10.2/$3 K V (rms) capacitance value 28.6 nF/phase
The second one, especial1 adapted from previously elaborated single phase program [45 includes the Preisach- Biorci- Pescetti hysteresis model [ 5 ] while eddy losses are modelled with a linear parallel resistor.
The modelling of t h e saturation characteristics of the VT's and t h e core losses is very important in order to obtain quantitative results. Measurements were made by energizing either the high or the low voltage windings of t h e VT's with adequate sinusoTdal power supplies and also by energizing a specimen of the magnetic core. The observations to be made are the following : - On the specimen, the slope of hysteresis curves is greater
(40 5%) than t h e VT ones owing to rather different air gaps and compressive mechanical stresses.
- For a given saturation level, higher (about 25 %) core losses are found with the high voltage winding t h a n with t h e low voltage one owing to the expansion of magnetic flux at the end of t h e coil ; - The value of t h e parallel resistor equivalent to t h e iron losses depends on the amplitude of the f lux for t h e hysteresis losses as well as for the eddy current losses [SI. Let us examine now t h e convenience of the programs used
for simulations. We would like to emphasize mainly two difficulties : the determination of the initial conditions rela- ting to obtaining of the sustained UF ferroresonance and t h e choice of criteria in order to compare the computations with t h e experiments.
Figure 3 : Example of jump
2108
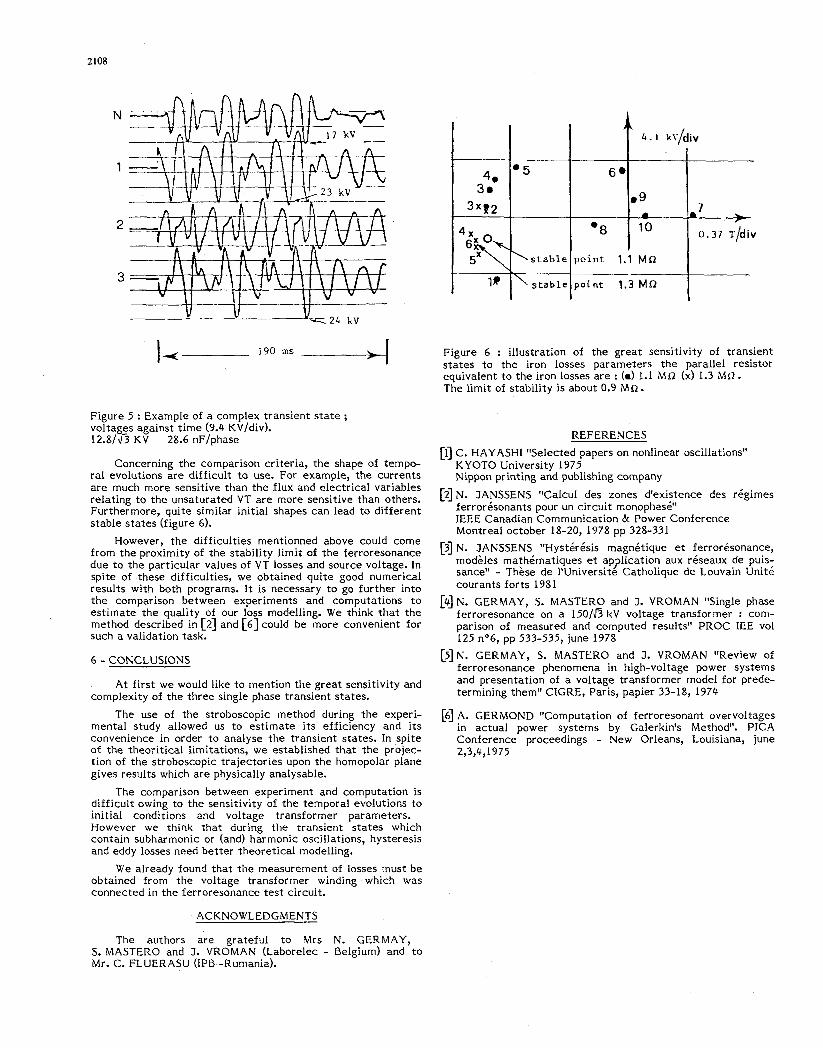
Figure 5 : Example of a complex transient state ; voltages against time (9.4 KV/div). 12.8/$3 KV 28.6 nF/phase
Concerning the comparison criteria, the shape of tempo- ral evolutions are difficult to use. For example, the currents a r e much more sensitive than the flux and electrical variables relating to the unsaturated VT are more sensitive than others. Furthermore, quite similar initial shapes can lead to different stable states (figure 6).
However, the difficulties mentionned above could come from the proximity of the stability limit of the ferroresonance due to the particular values of VT losses and source voltage. In spite of these difficulties, we obtained quite good numerical results with both programs. I t is necessary to go further into the comparison between experiments and computations to es t imate the qual i ty of our loss modelling. We think that the method described in [2] and [6] could be more convenient for such a validation task.
6 - CONCLUSIONS
At first we would like to mention the great sensitivity and complexity of the three single phase transient states.
The use of the stroboscopic method during the experi- mental study allowed us to estimate its efficiency and its convenience in order to analyse the transient states. In spite of the theoritical limitations, we established that the projec- t ion of the stroboscopic trajectories upon the homopolar plane gives results which are physically analysable.
The comparison between experiment and computation is difficult owing to the sensitivity of the temporal evolutions to initial conditions and voltage transformer parameters. However we think t h a t during the transient states which contain subharmonic or (and) harmonic oscillations, hysteresis and eddy losses need better theoretical modelling.
We already found that the measurement of losses must be obtained from the voltage transformer winding which was connected in the ferroresonance test circuit.
ACKNOWLEDGMENTS
The authors are grateful to Mrs N. GERMAY, S. MASTERO and J. VROMAN (Laborelec - Belgium) and t o Mr. C. FLUERASU (IPB -Rumania).
Figure 6 : illustration of the great sensitivity of transient states to the iron losses parameters the parallel resistor equivalent to the iron losses are : (a) 1.1 Ma (x) 1.3 MsZ. The limit of stability is about 0.9 Mn .
REFERENCES [I] C. HAYASHI "Selected papers on nonlinear oscillations"
KYOTO University 1975 Nippon printing and publishing company
ferrorbsonants pour un circuit monophasb" IEEE Canadian Communication & Power Conference Montreal October 18-20, 1978 pp 328-331
[3] N. JANSSENS "Hyst6rksis magnbtique et ferrorbsonance, mod&es mathbmatiques et application aux r6seaux de puis- sance" - T h k e d e 1'Universite Catholique de Louvain Unit6 courants forts 1981
[4] N. CERMAY, S. MASTERO and 3. VROMAN "Single phase ferroresonance on a 150/$3 kV voltage transformer : com- parison of measured and computed results" PROC IEE vol 125 n06, pp 533-535, june 1978
[5]N. GERMAY, S. MASTERO and J. VROMAN "Review of ferroresonance phenomena in high-voltage power systems and presentation of a voltage transformer model for prede- termining them" CIGRE, Paris, papier 33-18, 1974
[2] N. JANSSENS "Calcul des zones d'existence des rkgimes
[6] A. CERMOND "Computation of ferroresonant overvoltages in actual power systems by Galerkin's Method". PICA Conference proceedings - New Orleans, Louisiana, june 2,3,4,1975
Recommended


