Conventional GPC
Polymers and
Molecular Weight
GPC On Tour, Barcelona,
28th February 2012
1
What are Polymers?
2
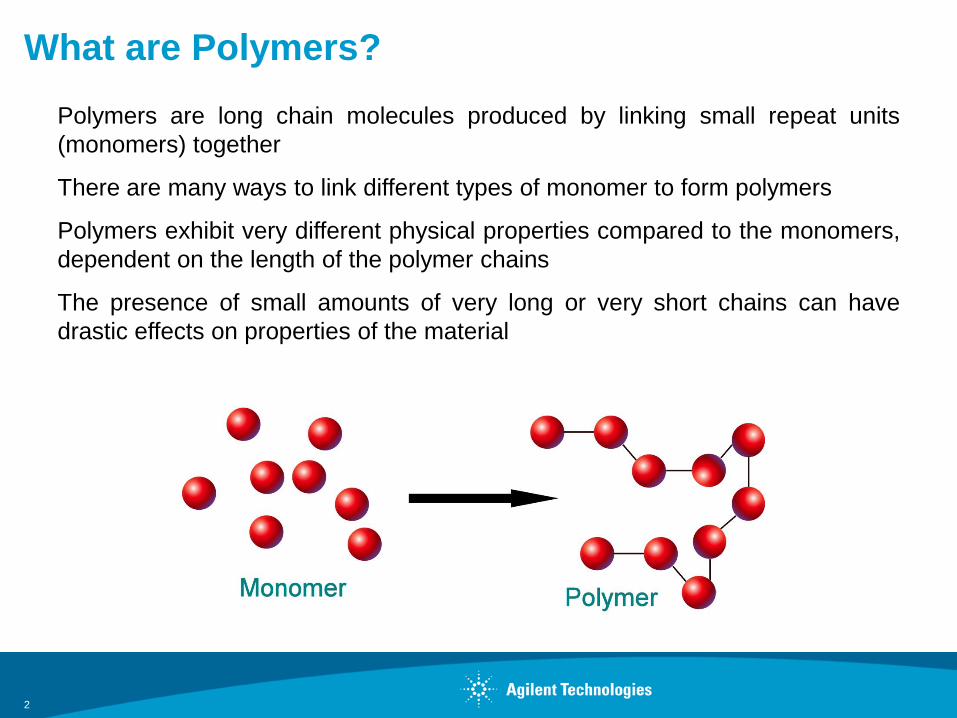
Polymers are long chain molecules produced by linking small repeat units
(monomers) together
There are many ways to link different types of monomer to form polymers
Polymers exhibit very different physical properties compared to the monomers,
dependent on the length of the polymer chains
The presence of small amounts of very long or very short chains can have
drastic effects on properties of the material
Variations in Polymers
3
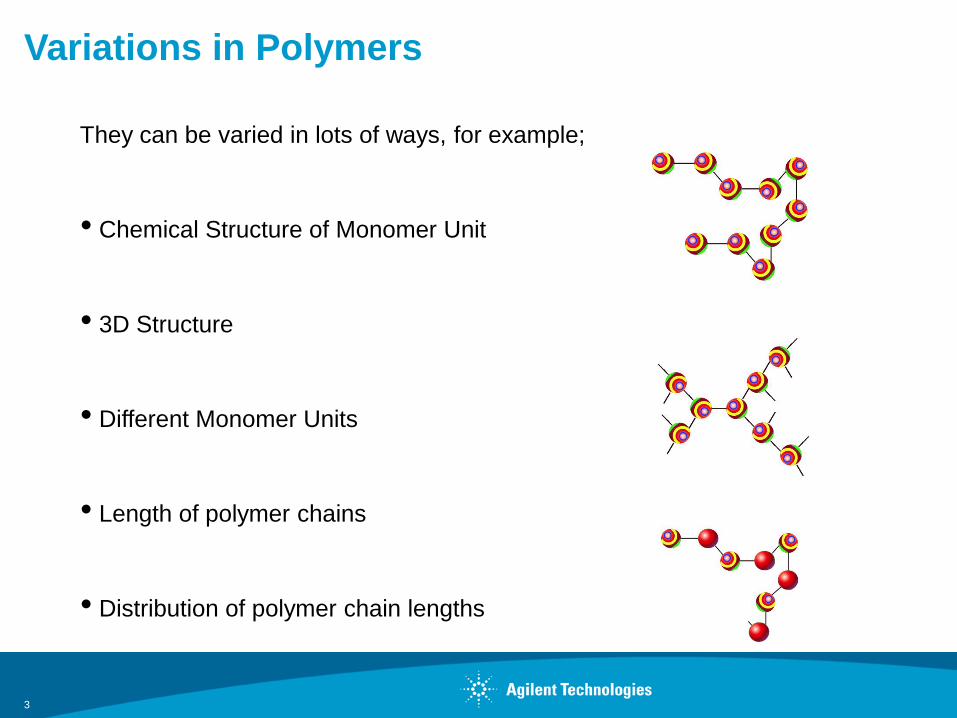
They can be varied in lots of ways, for example;
• Chemical Structure of Monomer Unit
• 3D Structure
• Different Monomer Units
• Length of polymer chains
• Distribution of polymer chain lengths
Example 1 - Nitrocellulose
4
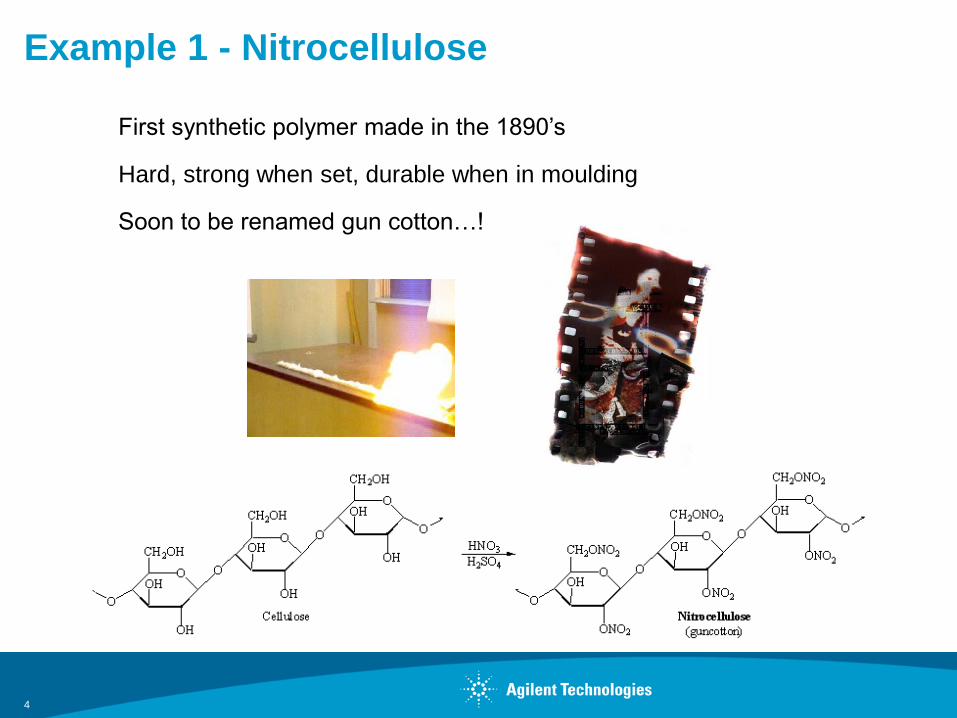
First synthetic polymer made in the 1890’s
Hard, strong when set, durable when in moulding
Soon to be renamed gun cotton…!
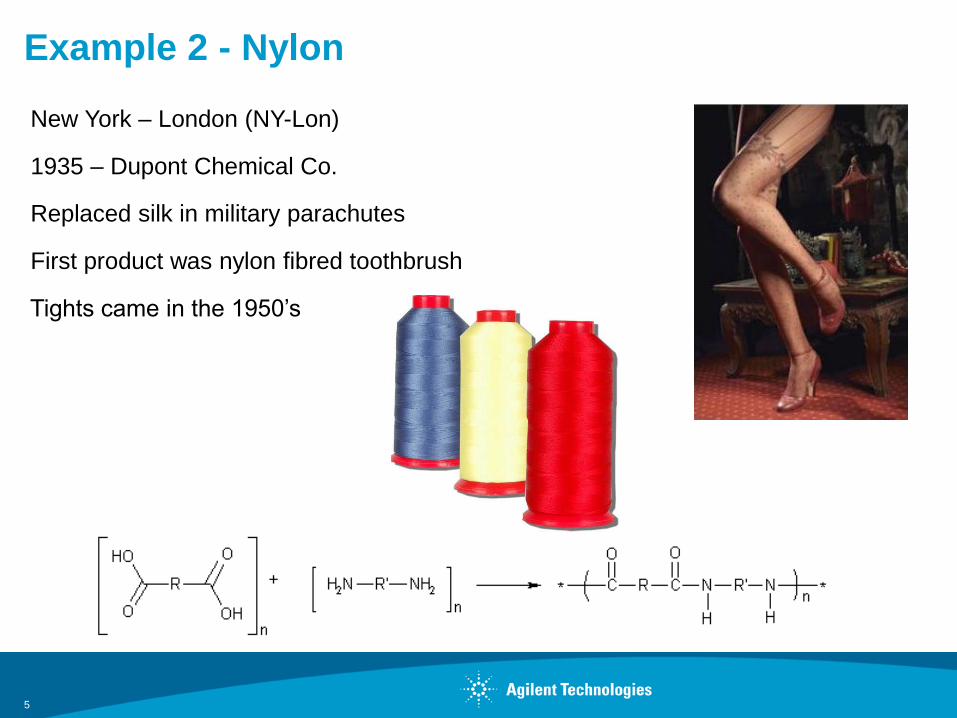
Example 2 - Nylon
5
New York – London (NY-Lon)
1935 – Dupont Chemical Co.
Replaced silk in military parachutes
First product was nylon fibred toothbrush
Tights came in the 1950’s
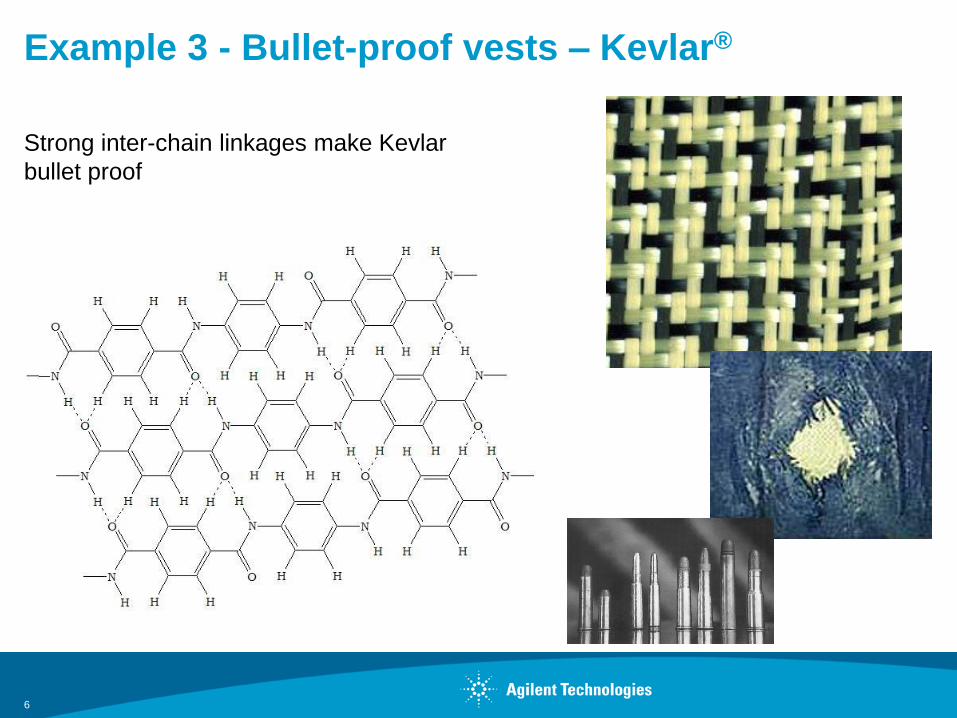
Example 3 - Bullet-proof vests – Kevlar®
6
Strong inter-chain linkages make Kevlar
bullet proof
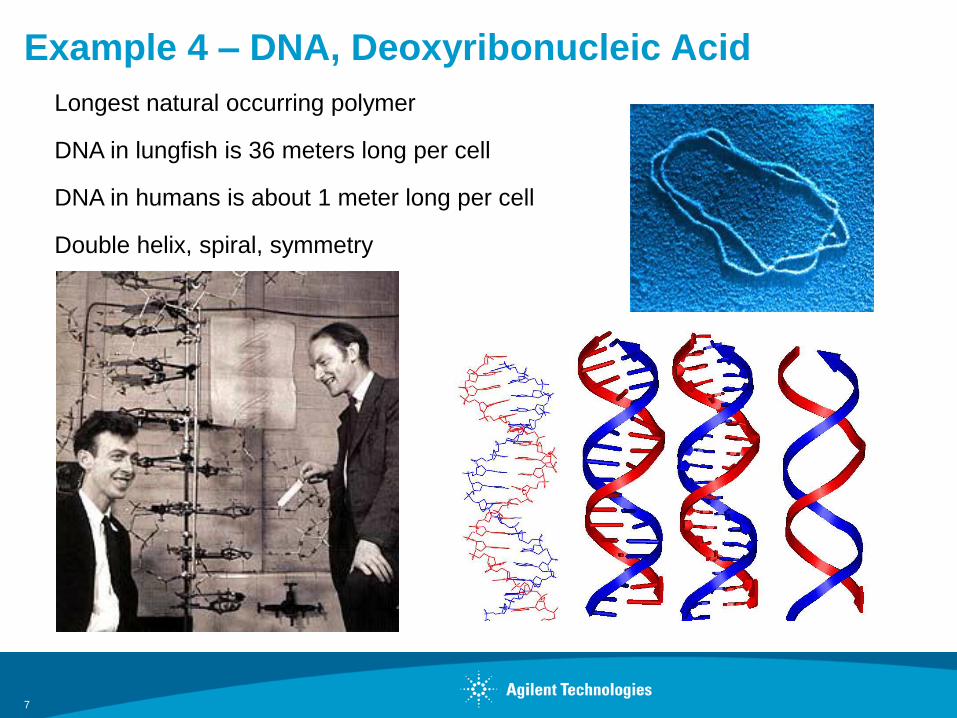
Example 4 – DNA, Deoxyribonucleic Acid
7
Longest natural occurring polymer
DNA in lungfish is 36 meters long per cell
DNA in humans is about 1 meter long per cell
Double helix, spiral, symmetry
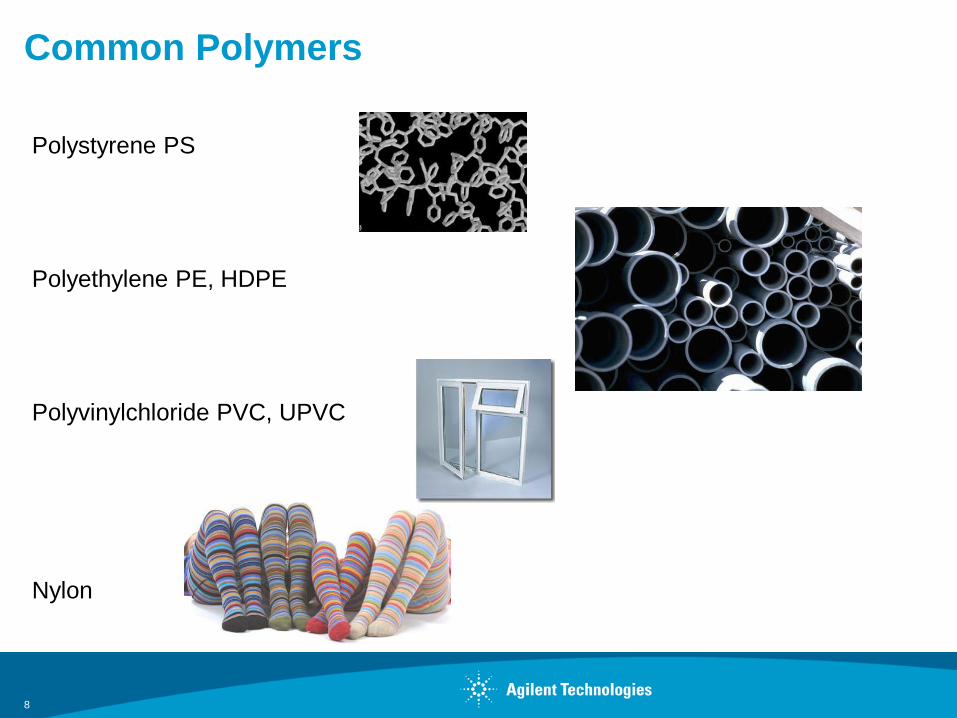
Common Polymers
8
Polystyrene PS
Polyethylene PE, HDPE
Polyvinylchloride PVC, UPVC
Nylon
Molecular Weight
9
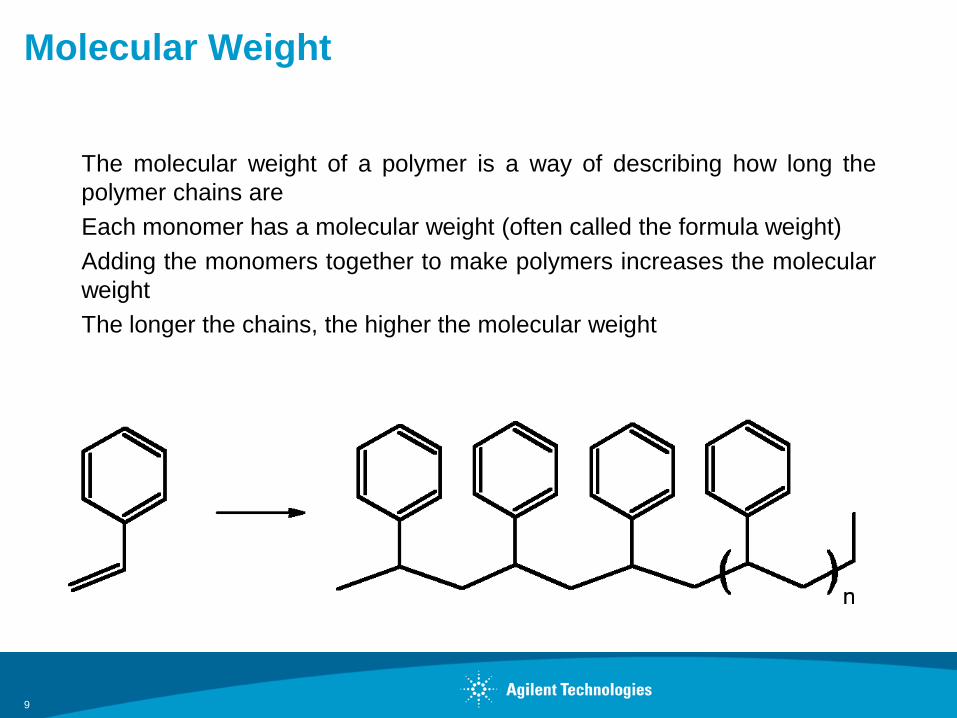
The molecular weight of a polymer is a way of describing how long the
polymer chains are
Each monomer has a molecular weight (often called the formula weight)
Adding the monomers together to make polymers increases the molecular
weight
The longer the chains, the higher the molecular weight
Effect of Molecular Weight
10
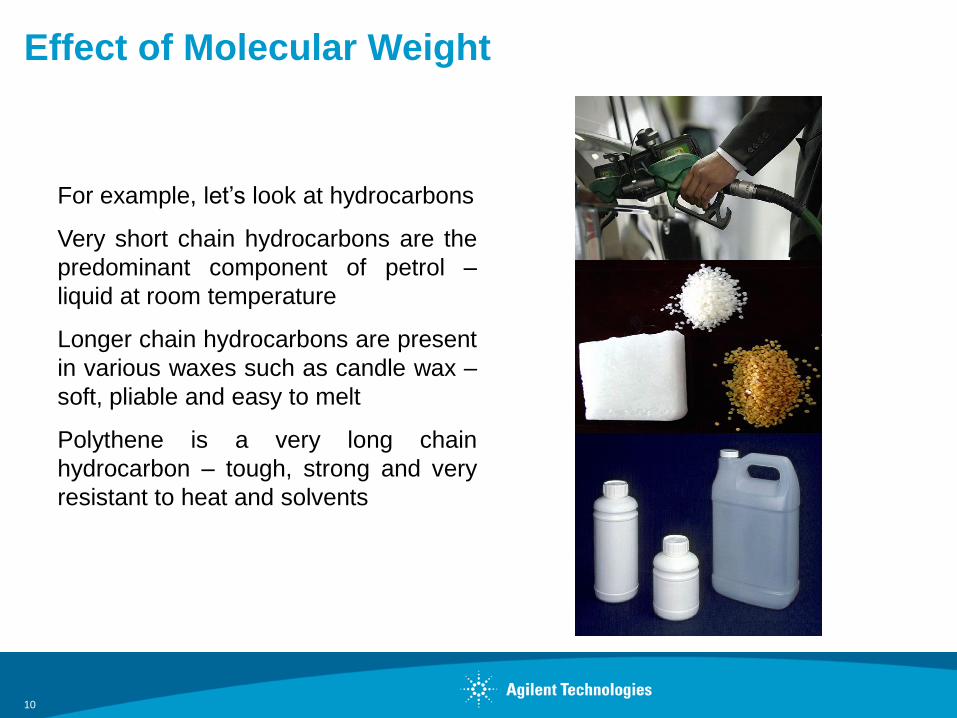
For example, let’s look at hydrocarbons
Very short chain hydrocarbons are the
predominant component of petrol –
liquid at room temperature
Longer chain hydrocarbons are present
in various waxes such as candle wax –
soft, pliable and easy to melt
Polythene is a very long chain
hydrocarbon – tough, strong and very
resistant to heat and solvents

Polymer Molecular Weight Distributions
11
Samples of synthetic polymers always contain polymer chains with a range
of chain lengths
One way to describe the length of the polymer chains is in terms of an
average molecular weight, i.e the average of all the chain lengths in the
sample
HOWEVER….
Different samples of the same polymer can have the same average chain
length but very different distributions of chain lengths depending on the
method of production
In polymer science it is the molecular weight distribution that is important
Molecular Weight Averages by GPC
12
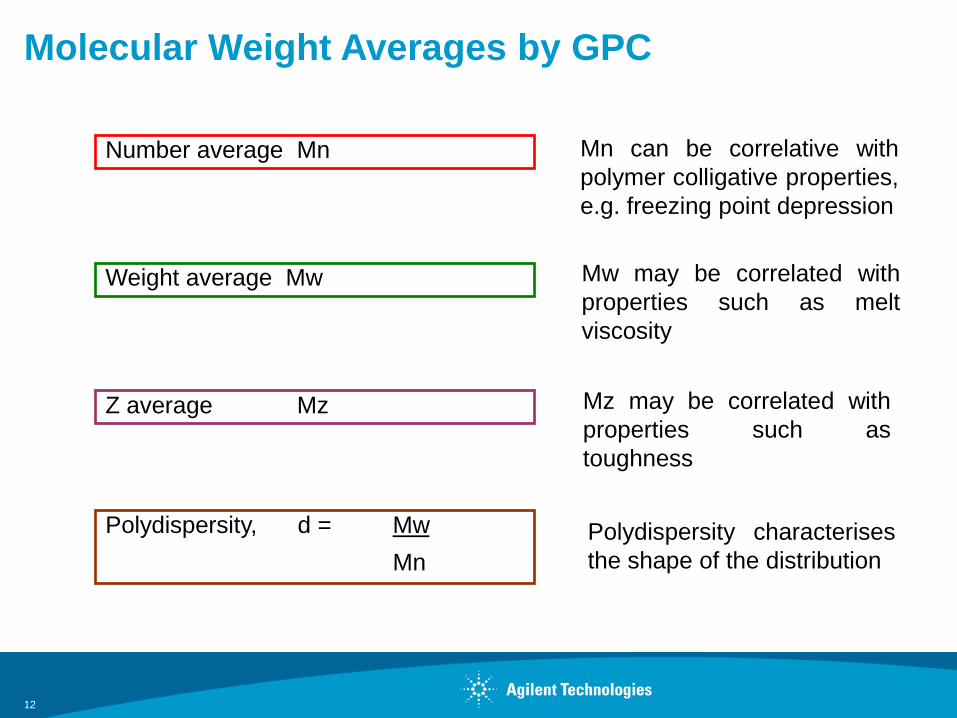
Number average Mn
Weight average Mw
Z average Mz
Polydispersity, d = Mw
Mn
Mn can be correlative with
polymer colligative properties,
e.g. freezing point depression
Mw may be correlated with
properties such as melt
viscosity
Mz may be correlated with
properties such as
toughness
Polydispersity characterises
the shape of the distribution
Defining the Molecular Weight Distribution
13
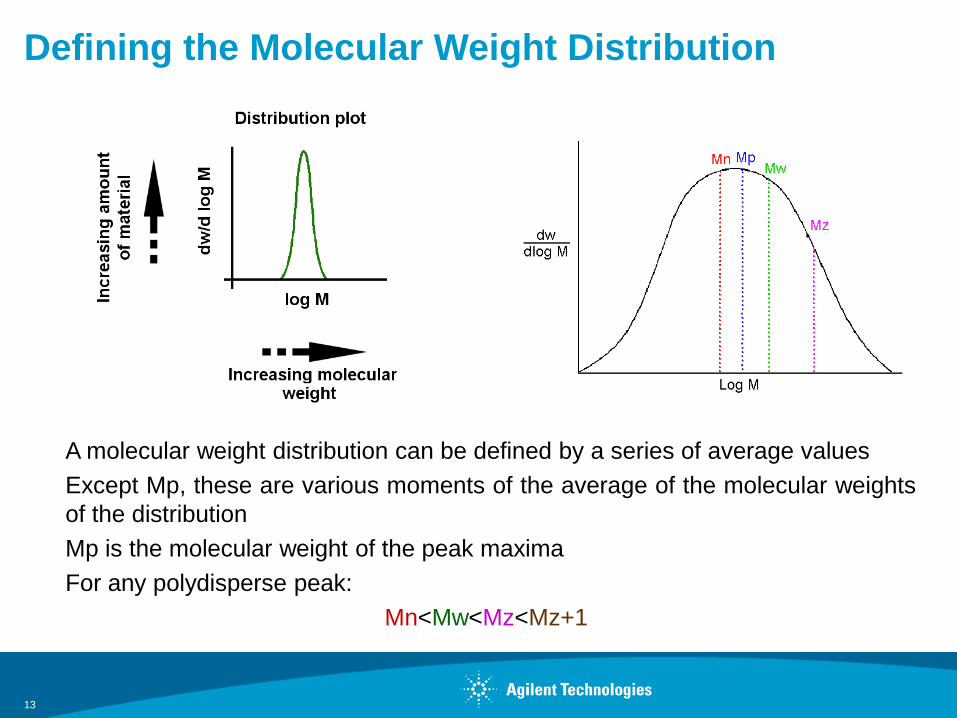
A molecular weight distribution can be defined by a series of average values
Except Mp, these are various moments of the average of the molecular weights
of the distribution
Mp is the molecular weight of the peak maxima
For any polydisperse peak:
Mn<Mw<Mz<Mz+1
Shape of Distributions
14
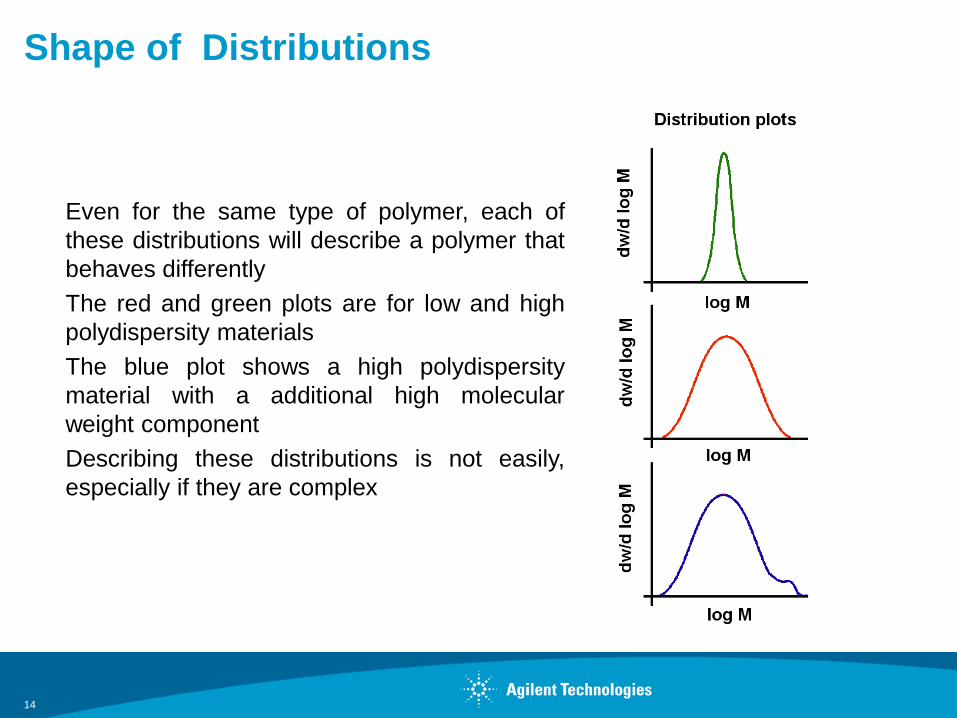
Even for the same type of polymer, each of
these distributions will describe a polymer that
behaves differently
The red and green plots are for low and high
polydispersity materials
The blue plot shows a high polydispersity
material with a additional high molecular
weight component
Describing these distributions is not easily,
especially if they are complex
Effect of Polydispersity on a Polymer
15
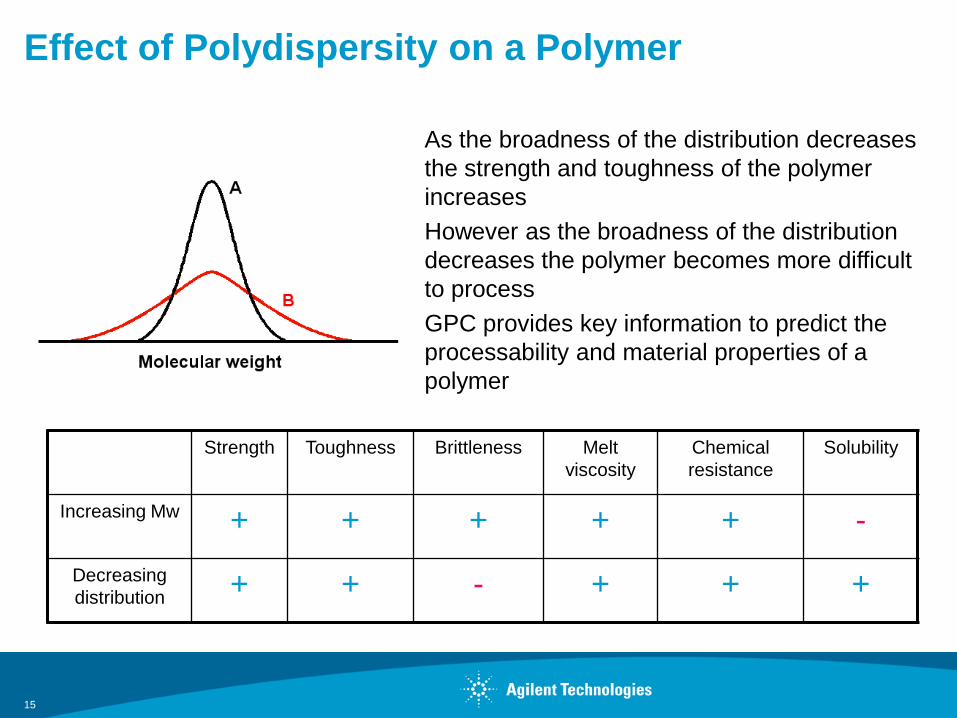
As the broadness of the distribution decreases
the strength and toughness of the polymer
increases
However as the broadness of the distribution
decreases the polymer becomes more difficult
to process
GPC provides key information to predict the
processability and material properties of a
polymer
Strength Toughness Brittleness Melt
viscosity
Chemical
resistance
Solubility
Increasing Mw + + + + + -
Decreasing
distribution + + - + + +
Measuring Molecular Weight
16
There are many ways to measure molecular weights
Examples include osmometry, centrifugation and batch light scattering
Each of these methodologies gives a single measurement, and average
molecular weight
For example, light scattering measures Mw, osmometry measures Mn and
centrifugation measures Mz
Although these methods give you a molecular weight, they do not describe a
distribution
Gel permeation chromatography (sometimes called size exclusion
chromatography) is a method of measuring molecular weights
The advantage of GPC is that it is a separation technique, and as such it is the
only common technique that allows the measurement of the molecular weight
distribution, not just a single average value
So where in Chromatography is GPC
17
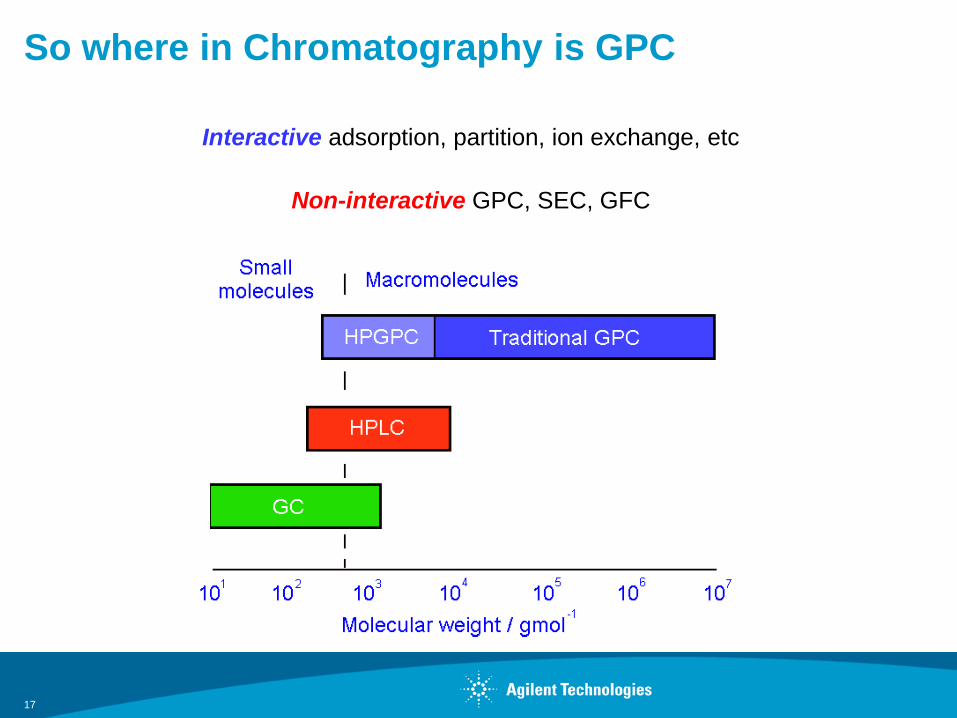
Interactive adsorption, partition, ion exchange, etc
Non-interactive GPC, SEC, GFC
Nomenclature
There are many ways of measuring the molecular weight
of a polymer however, there is only one technique that
measures the molecular weight distribution.
• Gel Permeation Chromatography, GPC (Polymer Industry)
One technique but multiple acronyms, also known as
• Size Exclusion Chromatography, SEC (Academia)
and
• Gel Filtration Chromatography, GFC (Protein/Pharma)
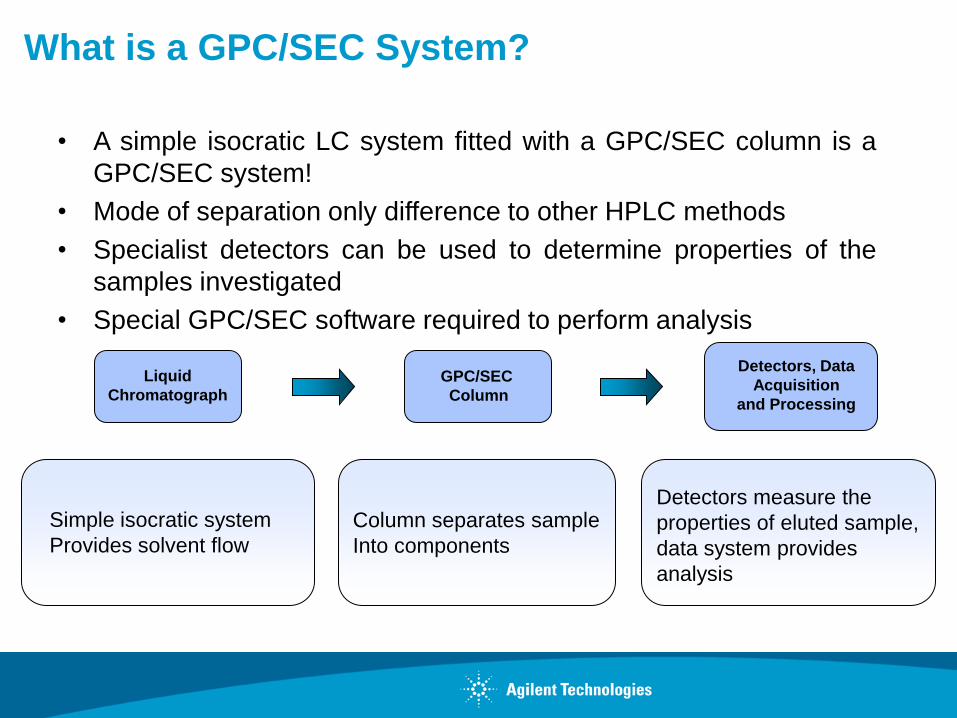
Liquid
Chromatograph
GPC/SEC
Column
Detectors, Data
Acquisition
and Processing
Simple isocratic system
Provides solvent flow
Column separates sample
Into components
Detectors measure the
properties of eluted sample,
data system provides
analysis
• A simple isocratic LC system fitted with a GPC/SEC column is a
GPC/SEC system!
• Mode of separation only difference to other HPLC methods
• Specialist detectors can be used to determine properties of the
samples investigated
• Special GPC/SEC software required to perform analysis
What is a GPC/SEC System?
Additional Components Used in GPC
20
Concentration detectors
• Differential refractometer (RI)
• Ultraviolet absorbance (UV)
• Evaporative light scattering or mass detector (ELS, EMD)
• Infra-red (IR)
Molecular weight sensitive detectors
• Viscometry
• Light scattering
Additional systems
• Online degasser
• Autosampler
• Column oven
• Additional specific detectors
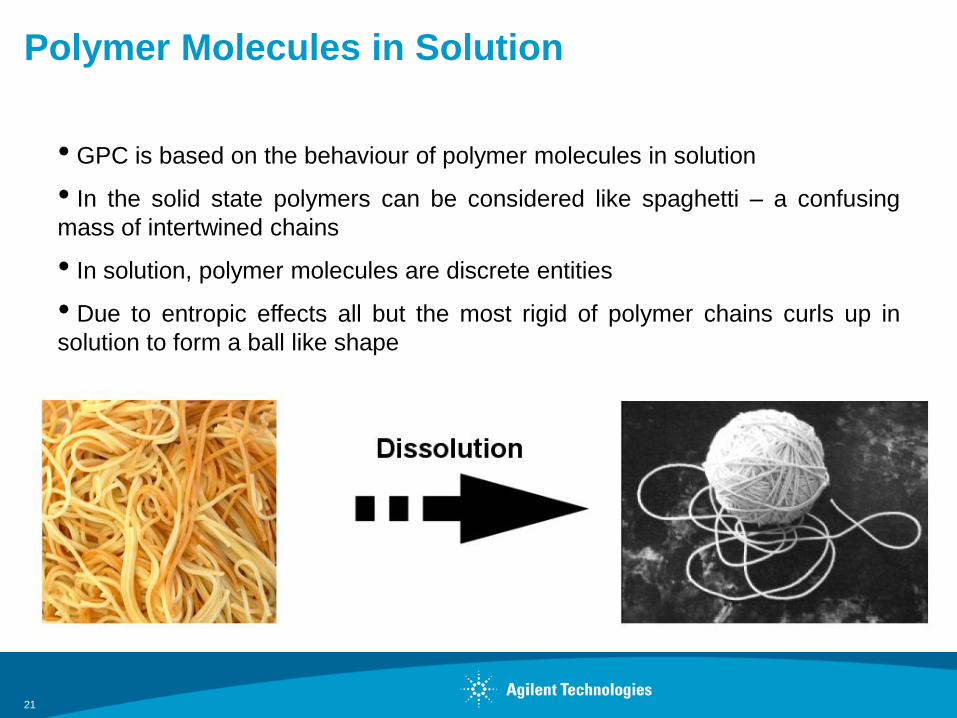
Polymer Molecules in Solution
21
• GPC is based on the behaviour of polymer molecules in solution
• In the solid state polymers can be considered like spaghetti – a confusing
mass of intertwined chains
• In solution, polymer molecules are discrete entities
• Due to entropic effects all but the most rigid of polymer chains curls up in
solution to form a ball like shape
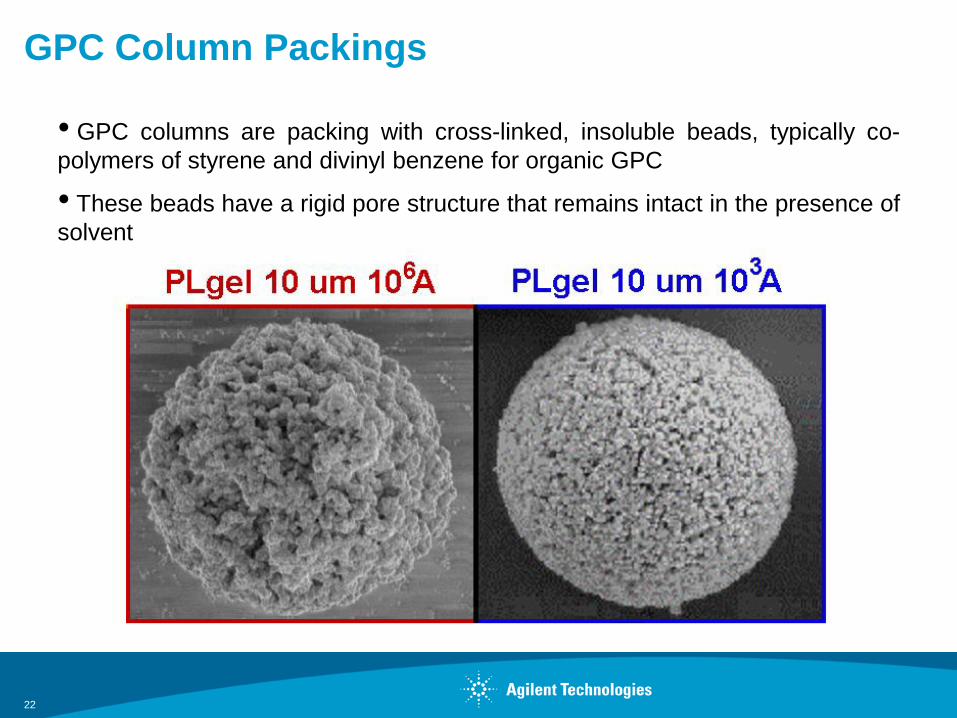
GPC Column Packings
22
• GPC columns are packing with cross-linked, insoluble beads, typically co-
polymers of styrene and divinyl benzene for organic GPC
• These beads have a rigid pore structure that remains intact in the presence of
solvent
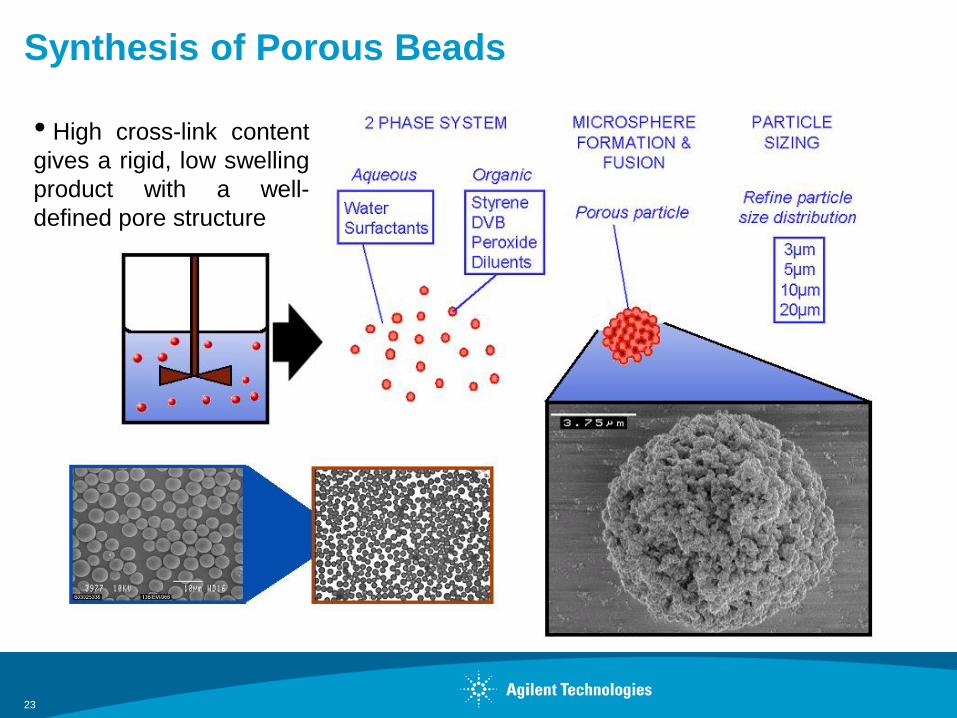
Synthesis of Porous Beads
23
• High cross-link content
gives a rigid, low swelling
product with a well-
defined pore structure
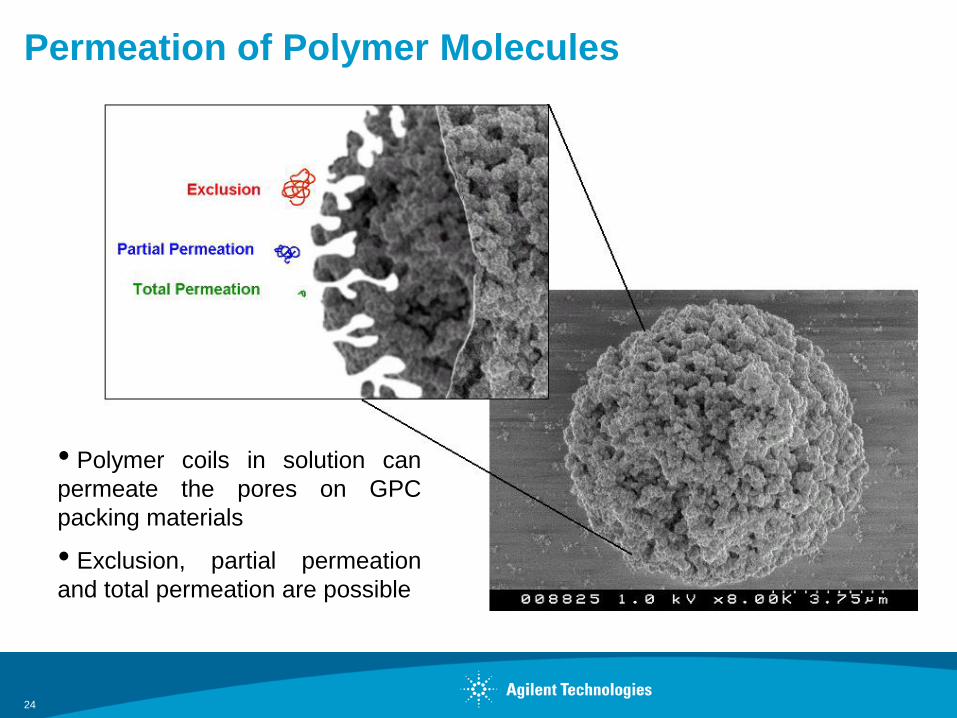
Permeation of Polymer Molecules
24
• Polymer coils in solution can
permeate the pores on GPC
packing materials
• Exclusion, partial permeation
and total permeation are possible
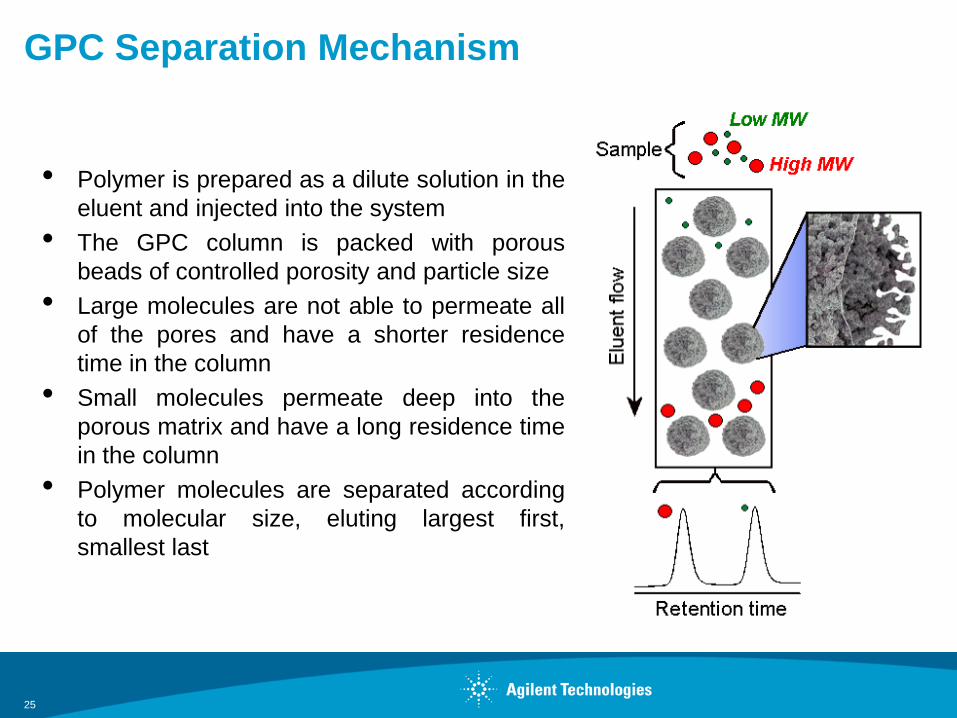
GPC Separation Mechanism
25
• Polymer is prepared as a dilute solution in the
eluent and injected into the system
• The GPC column is packed with porous
beads of controlled porosity and particle size
• Large molecules are not able to permeate all
of the pores and have a shorter residence
time in the column
• Small molecules permeate deep into the
porous matrix and have a long residence time
in the column
• Polymer molecules are separated according
to molecular size, eluting largest first,
smallest last
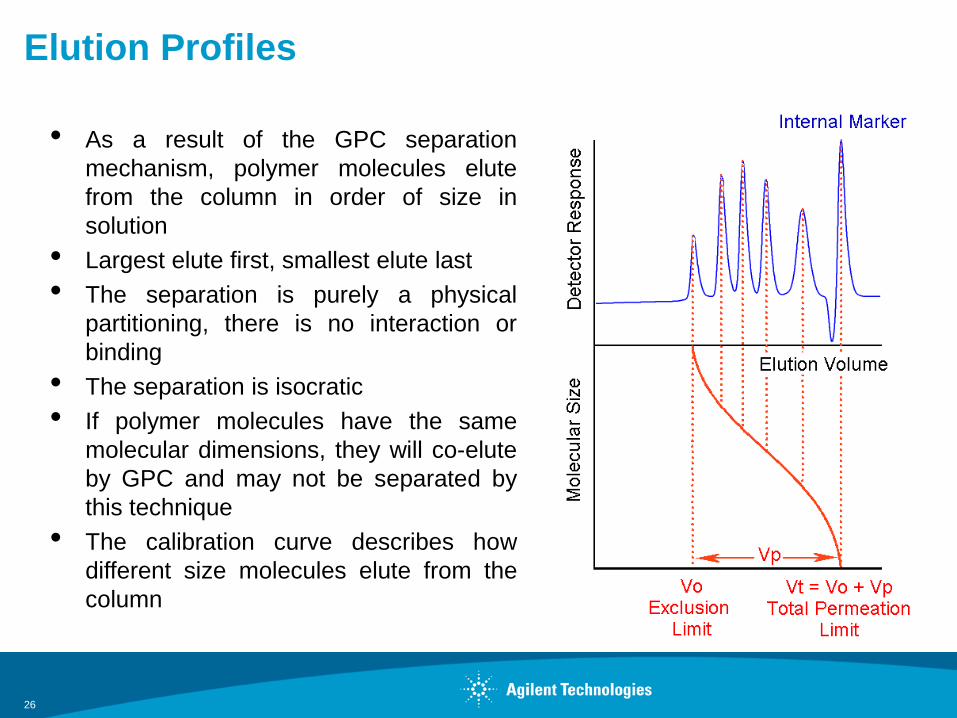
Elution Profiles
26
• As a result of the GPC separation
mechanism, polymer molecules elute
from the column in order of size in
solution
• Largest elute first, smallest elute last
• The separation is purely a physical
partitioning, there is no interaction or
binding
• The separation is isocratic
• If polymer molecules have the same
molecular dimensions, they will co-elute
by GPC and may not be separated by
this technique
• The calibration curve describes how
different size molecules elute from the
column
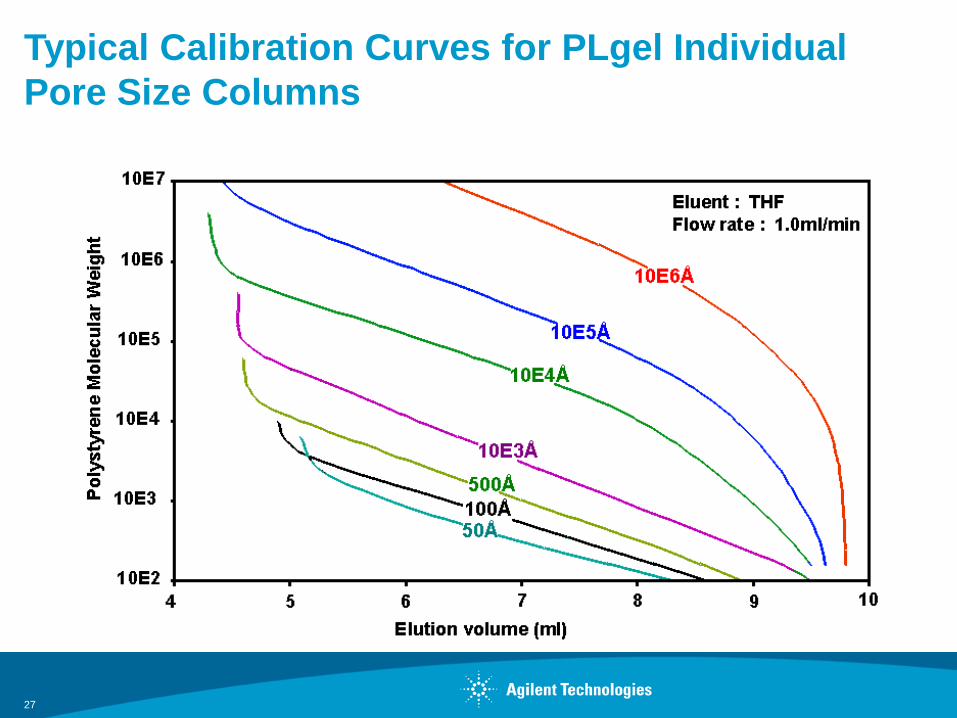
Typical Calibration Curves for PLgel Individual
Pore Size Columns
27
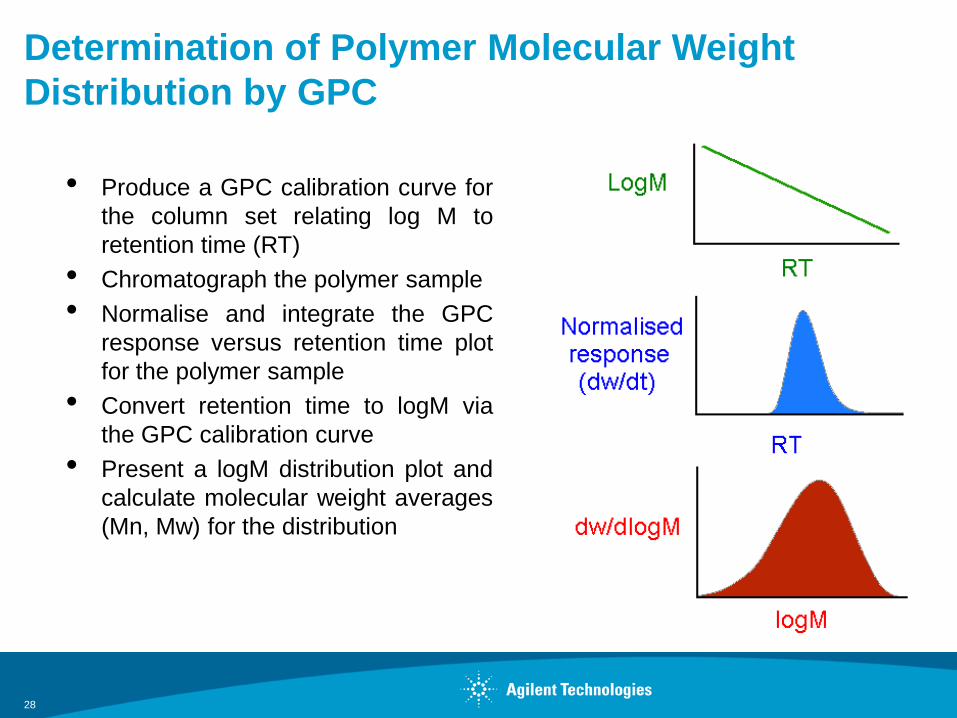
Determination of Polymer Molecular Weight
Distribution by GPC
28
• Produce a GPC calibration curve for
the column set relating log M to
retention time (RT)
• Chromatograph the polymer sample
• Normalise and integrate the GPC
response versus retention time plot
for the polymer sample
• Convert retention time to logM via
the GPC calibration curve
• Present a logM distribution plot and
calculate molecular weight averages
(Mn, Mw) for the distribution
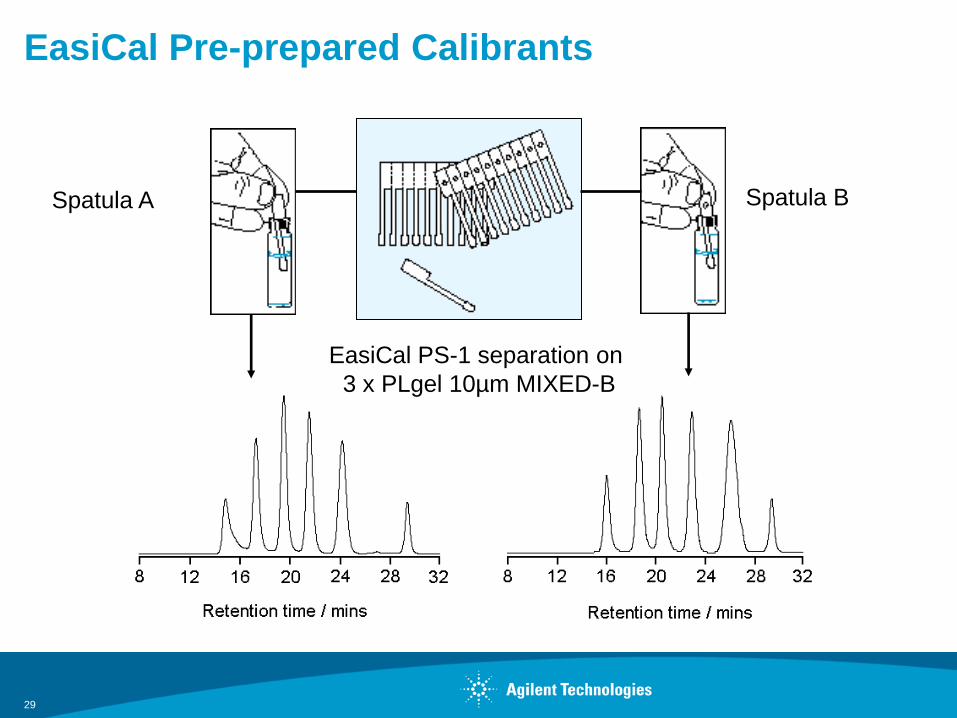
EasiCal Pre-prepared Calibrants
29
EasiCal PS-1 separation on
3 x PLgel 10µm MIXED-B
Spatula A Spatula B
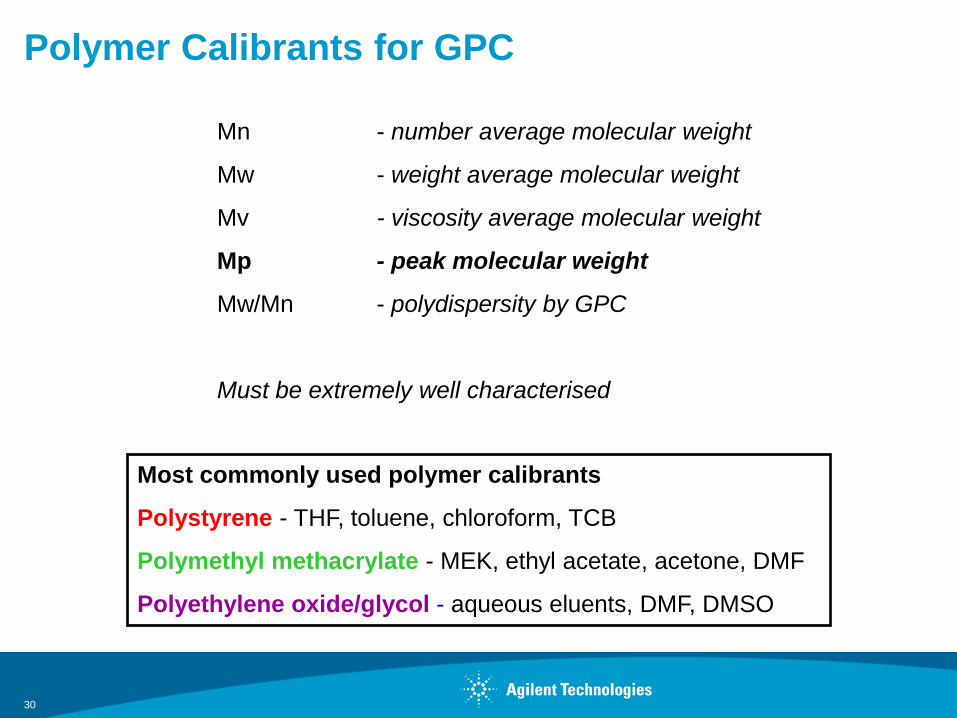
Polymer Calibrants for GPC
30
Most commonly used polymer calibrants
Polystyrene - THF, toluene, chloroform, TCB
Polymethyl methacrylate - MEK, ethyl acetate, acetone, DMF
Polyethylene oxide/glycol - aqueous eluents, DMF, DMSO
Mn - number average molecular weight
Mw - weight average molecular weight
Mv - viscosity average molecular weight
Mp - peak molecular weight
Mw/Mn - polydispersity by GPC
Must be extremely well characterised
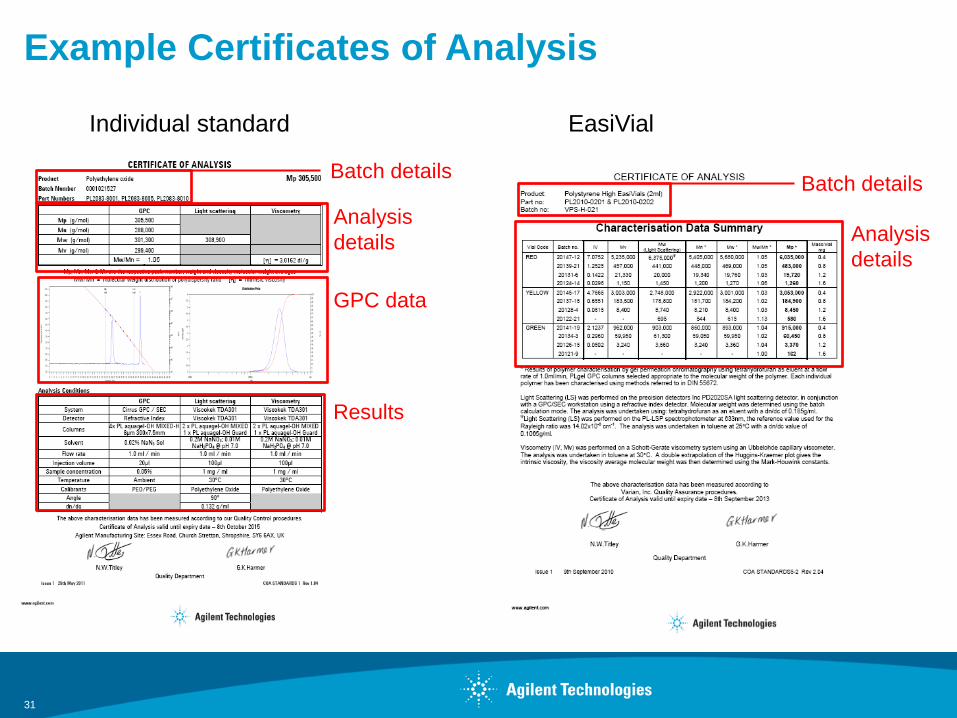
Example Certificates of Analysis
31
Individual standard EasiVial
Batch details
Analysis
details
Batch details
Analysis
details
GPC data
Results
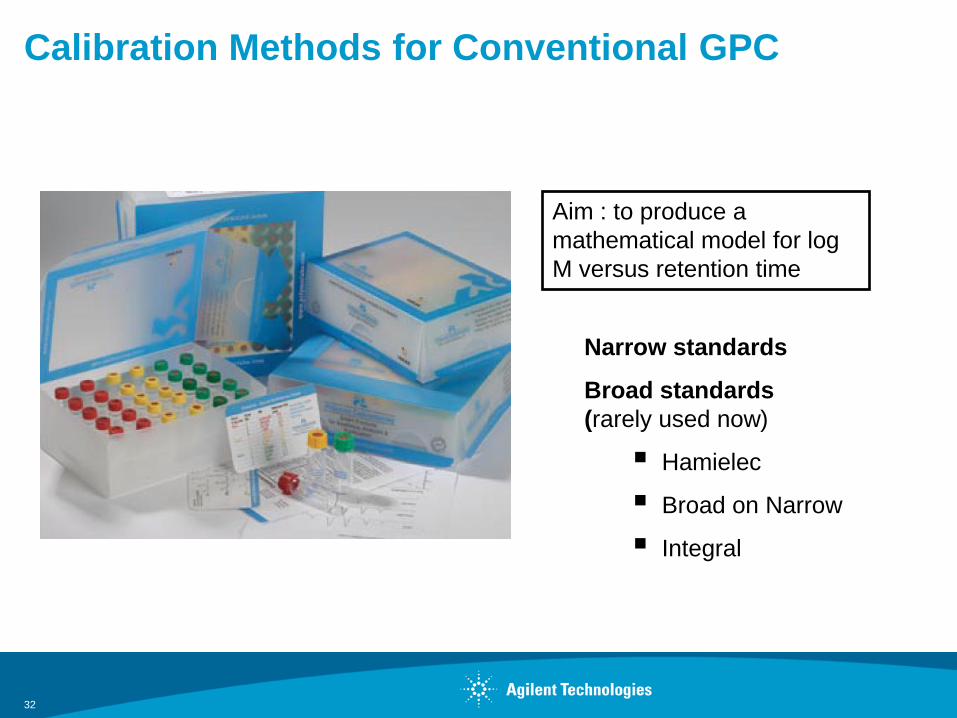
Calibration Methods for Conventional GPC
32
Narrow standards
Broad standards
(rarely used now)
Hamielec
Broad on Narrow
Integral
Aim : to produce a
mathematical model for log
M versus retention time
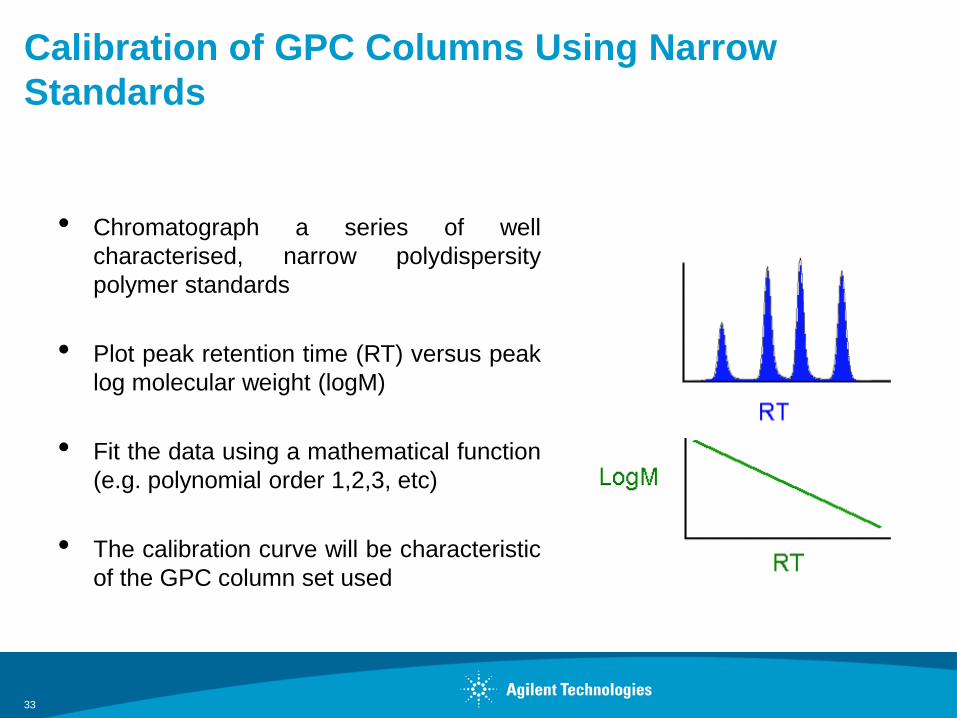
Calibration of GPC Columns Using Narrow
Standards
33
• Chromatograph a series of well
characterised, narrow polydispersity
polymer standards
• Plot peak retention time (RT) versus peak
log molecular weight (logM)
• Fit the data using a mathematical function
(e.g. polynomial order 1,2,3, etc)
• The calibration curve will be characteristic
of the GPC column set used
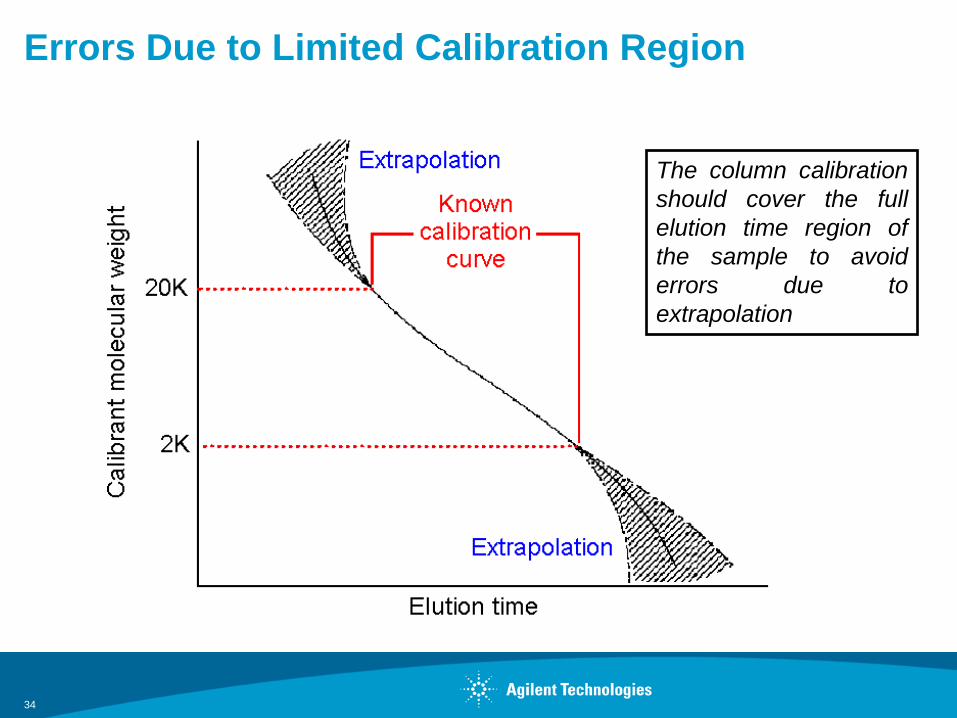
Errors Due to Limited Calibration Region
34
The column calibration
should cover the full
elution time region of
the sample to avoid
errors due to
extrapolation
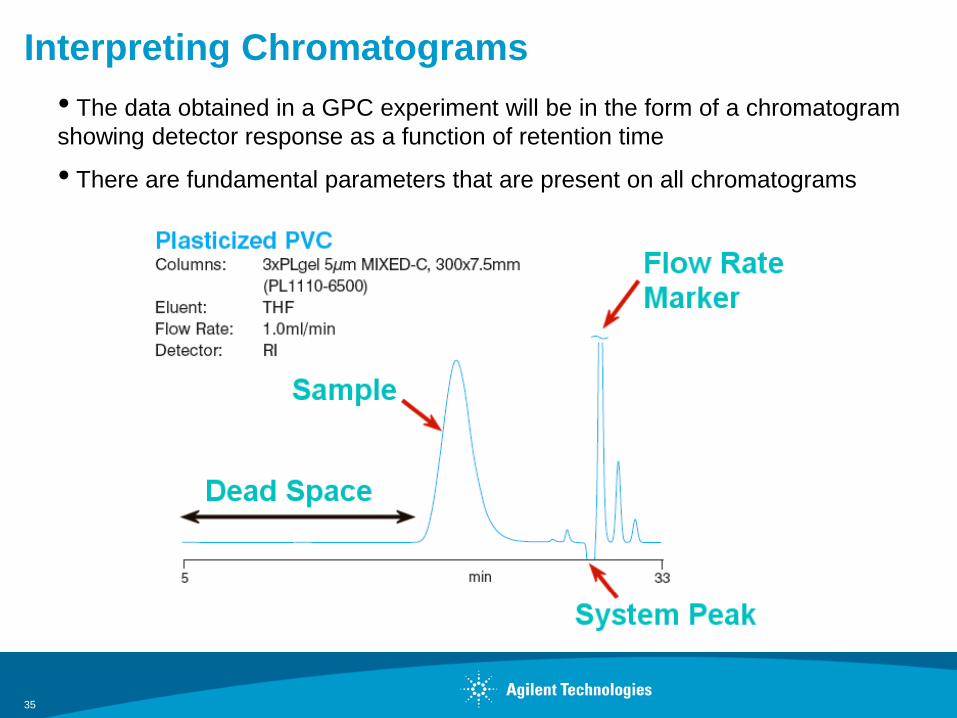
Interpreting Chromatograms
35
• The data obtained in a GPC experiment will be in the form of a chromatogram
showing detector response as a function of retention time
• There are fundamental parameters that are present on all chromatograms
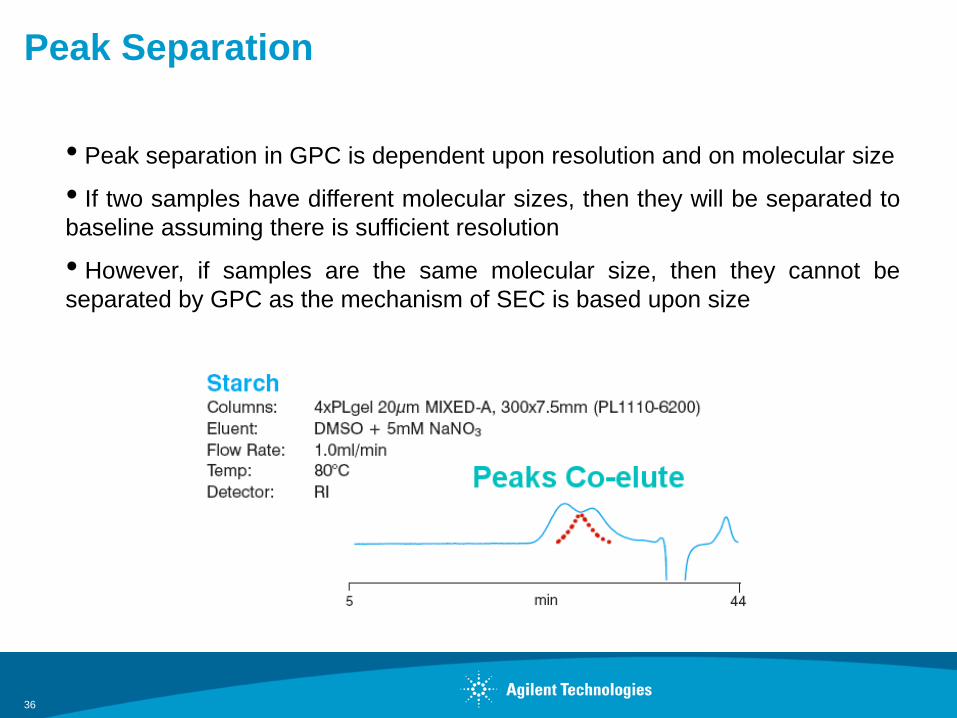
Peak Separation
36
• Peak separation in GPC is dependent upon resolution and on molecular size
• If two samples have different molecular sizes, then they will be separated to
baseline assuming there is sufficient resolution
• However, if samples are the same molecular size, then they cannot be
separated by GPC as the mechanism of SEC is based upon size
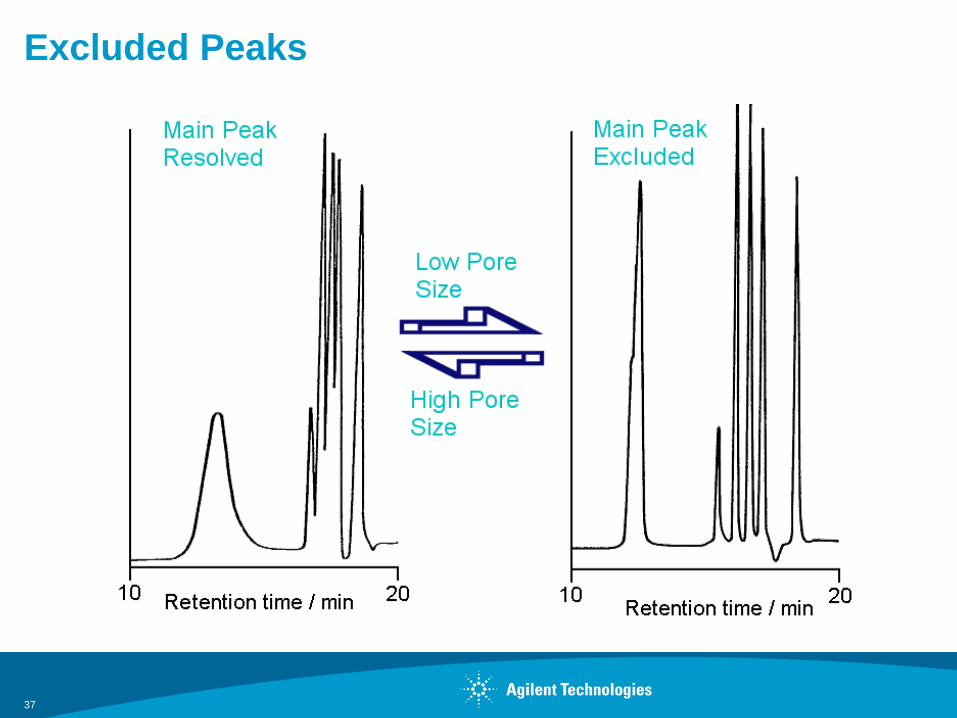
Excluded Peaks
37
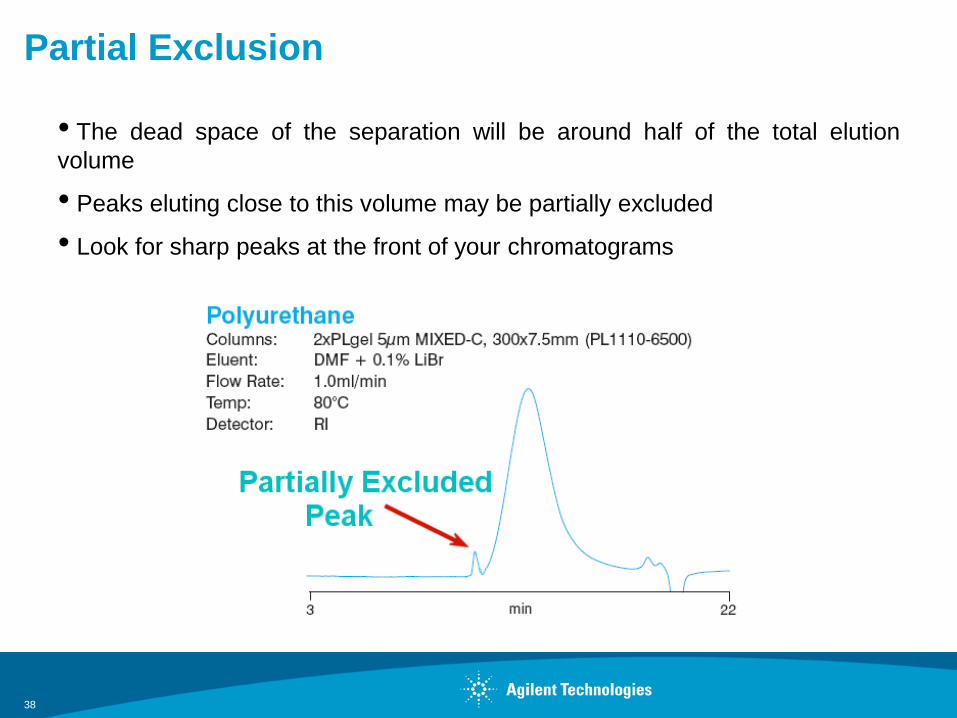
Partial Exclusion
38
• The dead space of the separation will be around half of the total elution
volume
• Peaks eluting close to this volume may be partially excluded
• Look for sharp peaks at the front of your chromatograms
Oligomeric Resolution
39
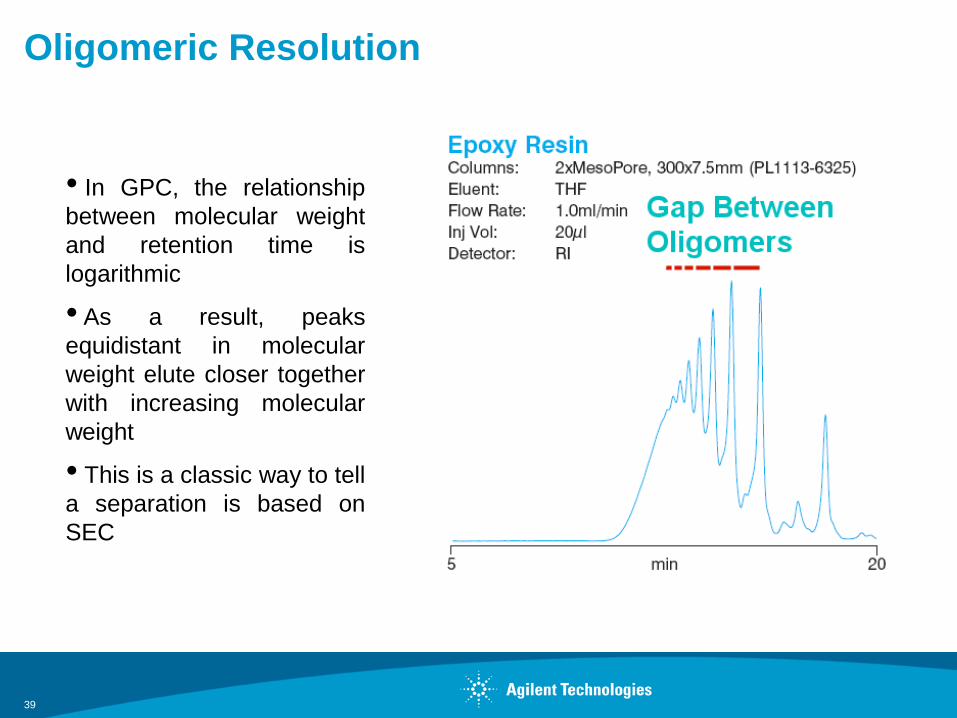
• In GPC, the relationship
between molecular weight
and retention time is
logarithmic
• As a result, peaks
equidistant in molecular
weight elute closer together
with increasing molecular
weight
• This is a classic way to tell
a separation is based on
SEC
40
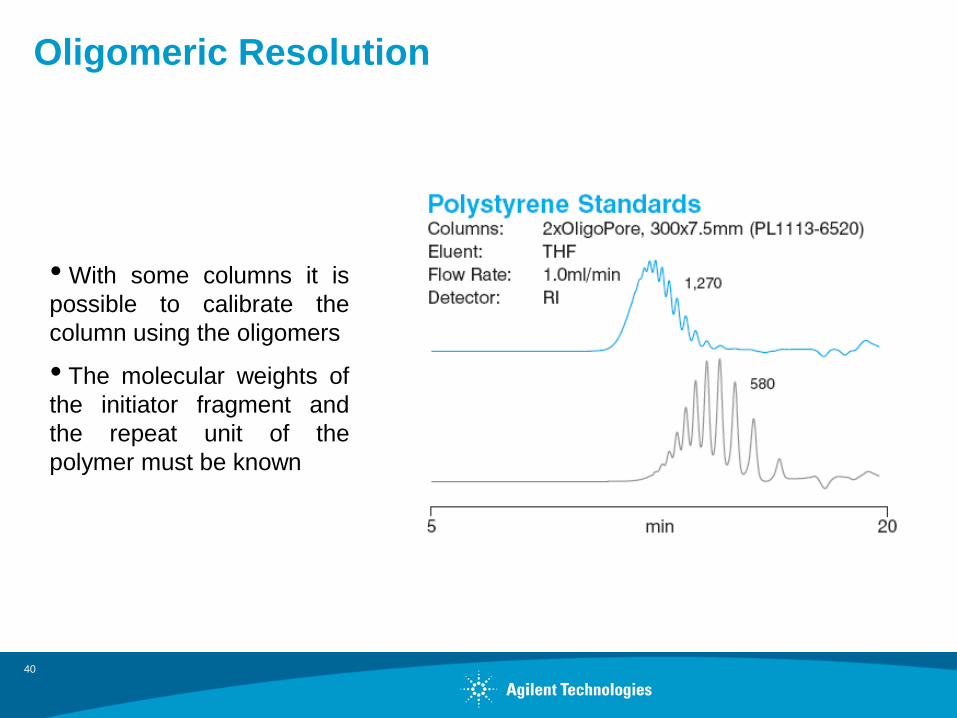
• With some columns it is
possible to calibrate the
column using the oligomers
• The molecular weights of
the initiator fragment and
the repeat unit of the
polymer must be known
Oligomeric Resolution
Interpreting Molecular Weight Distributions
41
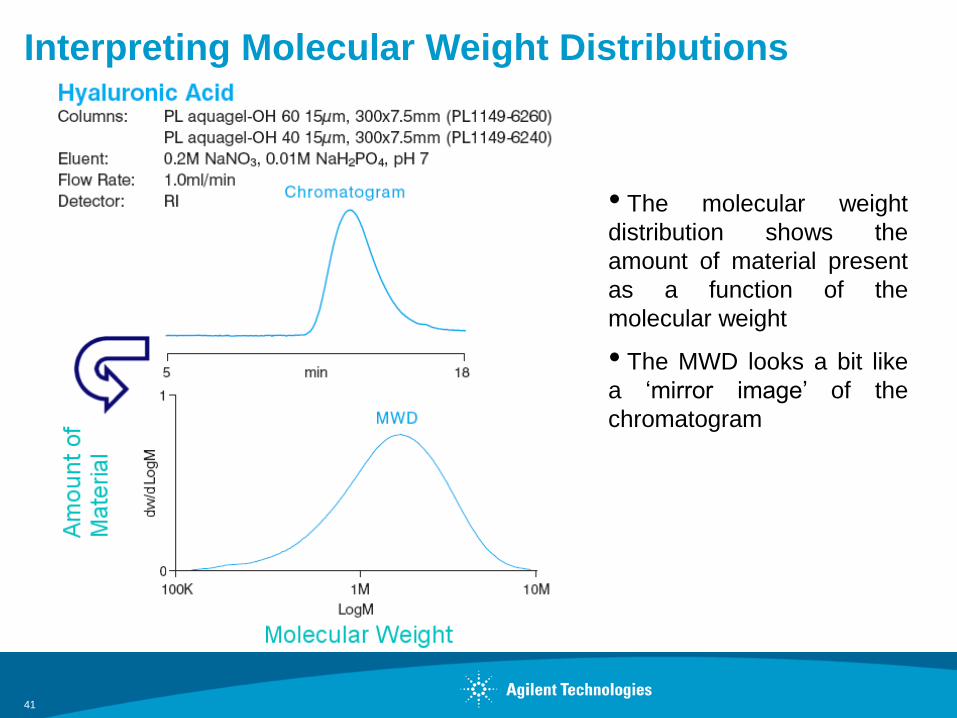
• The molecular weight
distribution shows the
amount of material present
as a function of the
molecular weight
• The MWD looks a bit like
a ‘mirror image’ of the
chromatogram
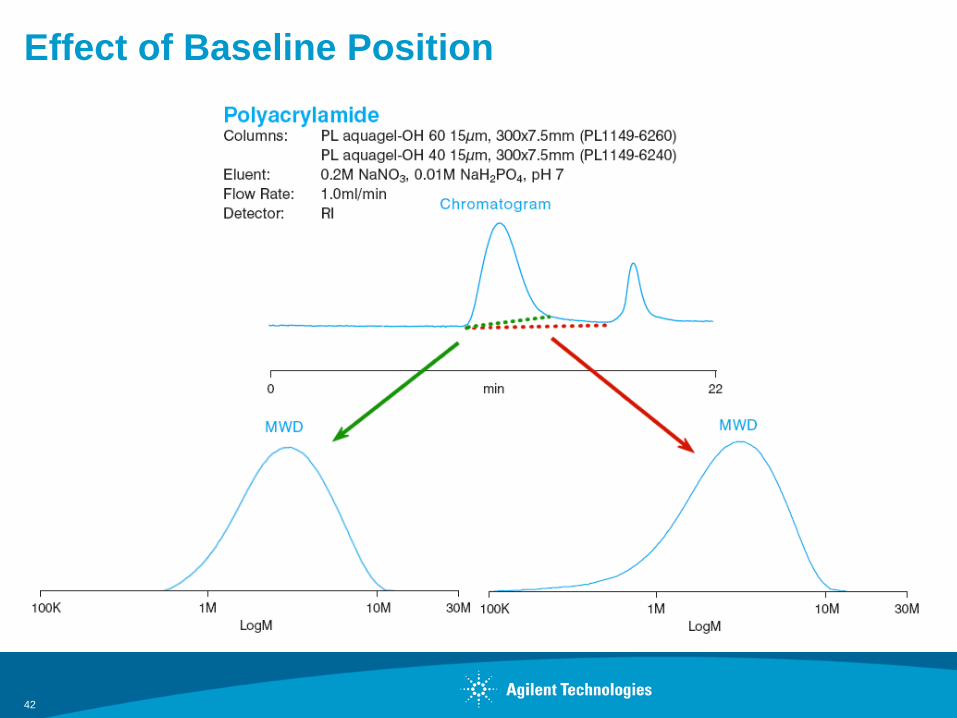
Effect of Baseline Position
42
43
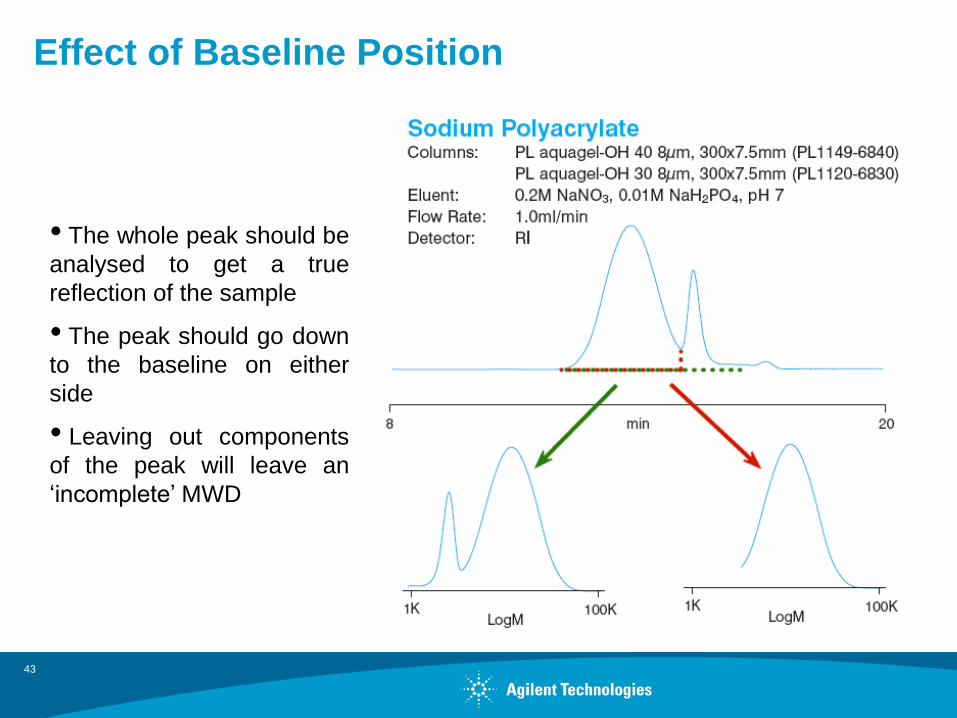
• The whole peak should be
analysed to get a true
reflection of the sample
• The peak should go down
to the baseline on either
side
• Leaving out components
of the peak will leave an
‘incomplete’ MWD
Effect of Baseline Position
Conventional GPC
44
Now lets take a look at ways we can improve the quality of our
‘Conventional GPC Analysis’
Recommended