June 2013
Final Report
Triple-Bottom Line Assessment of Future Mississippi Intermodal Facility
Study No. 235
Prepared for:
Under the Supervision of: Mr. Robert Burt and Ms. Paula Morgan
Prepared by:
Dr. Tulio Sulbaran – Center for Logistics, Trade and Transportation Dr. MD Sarder – School of Construction
Dr. Chad Miller – Dept of Economic Development Dr. Brian Richard – Dept of Economic Development
Dr. Martin E. Lipinski – University of Memphis, Intermodal Freight Transportation Institute
Triple-Bottom Line Assessment of Future Mississippi Intermodal Facility
Study No. 235
June 2013 Copyright 2013, by Dr. Tulio Sulbaran, Dr. MD Sarder, Dr. Chad Miller, Dr. Brian Richard, and
Dr. Martin E. Lipinski All Rights Reserved. This book, or parts thereof, may be reproduced only with written
permission of the authors. Printed in the United States of America
Technical Report Documentation Page
1.Report No. FHWA/MS-DOT-RD-13-235
2. Government Accession No.
3. Recipient’s Catalog No.
4. Title and Subtitle TRIPLE-BOTTOM LINE ASSESSMENT OF FUTURE MISSISSIPPI INTERMODAL FACILITY
5. Report Date June 2013 6. Performing Organization Code
7. Author(s) Dr. Tulio Sulbaran - Principal Investigator Dr. MD Sarder - Co-Principal Investigator Dr. Chad Miller - Co-Principal Investigator Dr. Brian Richard - Co-Principal Investigator Dr. Martin Lipinski – Co-Principal Investigator
8. Performing Organization Report No. MS-DOT-RD-13-235
9. Performing Organization Name and Address The University of Southern Mississippi School of Construction 118 College Drive #5138 Hattiesburg, MS 39406-0001 Intermodal Freight Transportation Institute University of Memphis, 302 Engr. Admin 3815 Central Ave, Memphis, TN 38152
10. Work Unit No. (TRAIS) 11. Contract or Grant No.
12. Sponsoring Agency Name and Address Federal Highway Administration and Mississippi Department of Transportation Freight, Rail, Ports & Waterways Division, Mississippi Department of Transportation Paula H. Morgan. Freight Policy and Project Manager 401 North West Street, Suite 8025 Jackson, MS 39201 Phone: 601-359-1090 Fax: 601-359-9775 Email: [email protected]
13. Type Report and Period Covered Final Report (June 2013) 14. Sponsoring Agency Code
15. Supplementary Notes
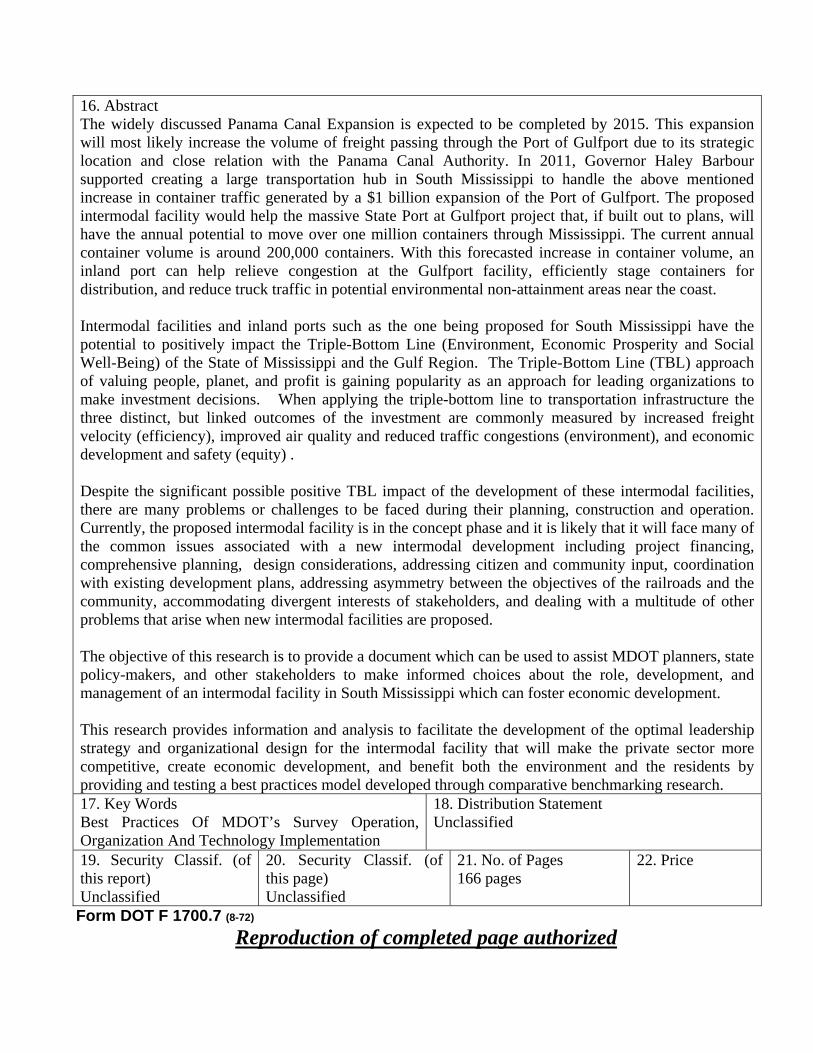
16. Abstract The widely discussed Panama Canal Expansion is expected to be completed by 2015. This expansion will most likely increase the volume of freight passing through the Port of Gulfport due to its strategic location and close relation with the Panama Canal Authority. In 2011, Governor Haley Barbour supported creating a large transportation hub in South Mississippi to handle the above mentioned increase in container traffic generated by a $1 billion expansion of the Port of Gulfport. The proposed intermodal facility would help the massive State Port at Gulfport project that, if built out to plans, will have the annual potential to move over one million containers through Mississippi. The current annual container volume is around 200,000 containers. With this forecasted increase in container volume, an inland port can help relieve congestion at the Gulfport facility, efficiently stage containers for distribution, and reduce truck traffic in potential environmental non-attainment areas near the coast. Intermodal facilities and inland ports such as the one being proposed for South Mississippi have the potential to positively impact the Triple-Bottom Line (Environment, Economic Prosperity and Social Well-Being) of the State of Mississippi and the Gulf Region. The Triple-Bottom Line (TBL) approach of valuing people, planet, and profit is gaining popularity as an approach for leading organizations to make investment decisions. When applying the triple-bottom line to transportation infrastructure the three distinct, but linked outcomes of the investment are commonly measured by increased freight velocity (efficiency), improved air quality and reduced traffic congestions (environment), and economic development and safety (equity) . Despite the significant possible positive TBL impact of the development of these intermodal facilities, there are many problems or challenges to be faced during their planning, construction and operation. Currently, the proposed intermodal facility is in the concept phase and it is likely that it will face many of the common issues associated with a new intermodal development including project financing, comprehensive planning, design considerations, addressing citizen and community input, coordination with existing development plans, addressing asymmetry between the objectives of the railroads and the community, accommodating divergent interests of stakeholders, and dealing with a multitude of other problems that arise when new intermodal facilities are proposed. The objective of this research is to provide a document which can be used to assist MDOT planners, state policy-makers, and other stakeholders to make informed choices about the role, development, and management of an intermodal facility in South Mississippi which can foster economic development. This research provides information and analysis to facilitate the development of the optimal leadership strategy and organizational design for the intermodal facility that will make the private sector more competitive, create economic development, and benefit both the environment and the residents by providing and testing a best practices model developed through comparative benchmarking research. 17. Key Words Best Practices Of MDOT’s Survey Operation, Organization And Technology Implementation
18. Distribution Statement Unclassified
19. Security Classif. (of this report) Unclassified
20. Security Classif. (of this page) Unclassified
21. No. of Pages 166 pages
22. Price
Form DOT F 1700.7 (8-72)
Reproduction of completed page authorized
Triple-Bottom Line Assessment of Future Mississippi Intermodal Facility Page i
NOTICE
The contents of this report reflect the views of the authors, who are responsible for the facts and accuracy of the data presented herein. The contents do not necessarily reflect the views or policies of the Mississippi Department of Transportation or the Federal Highway Administration. This report does not constitute a standard, specification, or regulation. This document is disseminated under the sponsorship of the Department of Transportation in the interest of information exchange. The United States Government and the State of Mississippi assume no liability for its contents or use thereof. The United States Government and the State of Mississippi do not endorse products or manufacturers. Trade or manufacturer’s names appear herein solely because they are considered essential to the object of this report.
Triple-Bottom Line Assessment of Future Mississippi Intermodal Facility Page ii
FORWARD This report provides a valuable resource to assist in making informed choices about the role, development, and management of a possible future intermodal facility in South Mississippi to foster economic development of the State fueled by the expanded Port of the Future at Gulfport. This Mississippi Department of Transportation Study No. 235 “Triple-Bottom Line Assessment of Future Mississippi Intermodal Facility” was conducted by the University of Southern Mississippi in collaboration and the University of Memphis under the direction of MDOT. This document will be of particular interest to individuals who plan and evaluate intermodal facilities. Other audiences for this document include policymakers, transportation professionals, and students in related fields.
Triple-Bottom Line Assessment of Future Mississippi Intermodal Facility Page iii
ACKNOWLEDGEMENTS The PI and Co-PIs from the University of Southern Mississippi and University of Memphis would like to thank MDOT Technology Advisory Committee members for their all the supports and thoughtful comments during the meetings and review of the project reports. The PI and Co-PIs would like to give special thanks to Mr. Robert Biedenharn, Mr. Hisham Gnedy, Mr. Faisal Mallum, Mr. Lee Johnson, and Ms. Doris Martir for their significant contribution to this project. Additionally, the research team for this project would like to express appreciation to the following individuals for guidance, support, and/or contribution to this collaborative effort:
U.S. Department of Transportation Research and Innovative Technology Administration University Transportation Center (UTC) Program
Institute for Trade and Transportation Studies: Mr. Bruce Lambert
The MDOT Technical Advisory Committee: Mr. Robert Burt, Mr. Michael Venski,
and Mr. Juan Flores
The MDOT Research Division: Mr. James Watkins, Mrs. Cynthia Drake Smith, and Mr. William Barstis
Triple-Bottom Line Assessment of Future Mississippi Intermodal Facility Page 4
TABLE OF CONTENTS
Notice ............................................................................................................................................... i Forward ........................................................................................................................................... ii Acknowledgements ........................................................................................................................ iii Table of Contents ............................................................................................................................ 4 List of Figures ................................................................................................................................. 7 List of Tables .................................................................................................................................. 8 Executive Summary ........................................................................................................................ 9 Chapter 1. Triple-Bottom Line Assessment of Future Mississippi Intermodal Facility ............... 12
1.1. Problem Statement ............................................................................................................. 12 1.2. Overall Project Goal .......................................................................................................... 12 1.3. Methodology ...................................................................................................................... 13 1.4. Summary ............................................................................................................................ 20
Chapter 2. Key Aspects State-of-the-Art on Intermodal Facilities .............................................. 21 2.1. Introduction to Intermodal Facility .................................................................................... 21 2.2. Logistical Impact of Intermodal Facilities ......................................................................... 23
2.2.1. Reduction of Congestion............................................................................................. 23 2.2.2. Improved Freight Velocity .......................................................................................... 24 2.2.3. Efficient Customs Handling ........................................................................................ 25 2.2.4. Enhanced Security ...................................................................................................... 26 2.2.5. Improved Connectivity (Network Analysis) ............................................................... 27 2.2.6. Intermodal Facility Location ....................................................................................... 28 2.2.7. Physical Characteristics of Intermodal Facilities ........................................................ 30
2.3. Environmental Impact ........................................................................................................ 32 2.3.1. Air Quality .................................................................................................................. 32 2.3.2. Noise Pollution............................................................................................................ 34 2.3.3. Destruction of Marshland or other Natural Resources ............................................... 34 2.4.4. Environmental Review ................................................................................................ 35 2.4.5. Utilization of Green Technology ................................................................................ 35
2.5. Economic Development Considerations ............................................................................ 38 2.5.1. Economic Impact ........................................................................................................ 38 2.5.2. Economic Development Incentives ............................................................................ 40
2.6. Value Added Intermodal Facility ....................................................................................... 42 2.7. Leadership, Strategy, Organizational design ..................................................................... 44
2.7.1. Private Sector Developers ........................................................................................... 46 2.8. Public Resistance to Intermodal Facilities ......................................................................... 47 2.9. Summary ............................................................................................................................ 48
Chapter 3. Data Collection Methodology ..................................................................................... 49 3.1. Introduction ........................................................................................................................ 49 3.2. Research Methodology Logistic Data ................................................................................ 49 3.3. Primary Data Collection Logistic Data .............................................................................. 49 3.4. Secondary Data Collection Logistic Data .......................................................................... 51 3.5. Economic Impact Methodology ......................................................................................... 51
3.5.1. Sampling of Intermodal Facilities ............................................................................... 51 3.5.2. Dependent Variable: Impact of Transportation Employment ..................................... 51
Triple-Bottom Line Assessment of Future Mississippi Intermodal Facility Page 5
3.5.3. Independent Variables: Facility Characteristics Expected to Influence Job Creation 53 3.5.4. Statistical Analysis ...................................................................................................... 54 3.5.5. Evaluation of Hypotheses ........................................................................................... 56 3.5.6. Sampling of Near-Dock Intermodal Facilities ............................................................ 56 3.5.7. Dependent Variable: Impact of Transportation Employment ..................................... 57 3.5.8. Independent Variables: Facility Characteristics Expected to Influence Job Creation 58 3.5.9. Statistical Analysis ...................................................................................................... 59 3.5.10. Evaluation of Hypotheses ......................................................................................... 59
3.6. Summary of Economic Development Results ................................................................... 59 3.7. South Mississippi Intermodal Stakeholders Data Collection ........................................... 60 3.8. Summary ............................................................................................................................ 65
Chapter 4: Statistical Analysis and Benchmarking of ................................................................. 67 Intermodal Facilities ..................................................................................................................... 67
4.1. Introduction ........................................................................................................................ 67 4.2. Issues In Benchmarking ..................................................................................................... 68
4.2.1. Choice of Indicators of Performance .......................................................................... 69 4.2.2. Choice of Reference Sector ........................................................................................ 71 4.2.3. Measurement Issues .................................................................................................... 71 4.2.4. Comparison of the Sector Under Consideration With The Reference Sector ............ 72
4.3. Methods Used In Benchmarking ....................................................................................... 72 4.4. Benchmarks Of Intermodal Facilities ................................................................................ 73 4.5. Summary ............................................................................................................................ 79
Chapter 5: Logistical Impact Analysis: ........................................................................................ 80 Location, Environmental, Congestion, & Freight Performance Analysis .................................... 80
5.1. Introduction To Logistical Impact Analysis ...................................................................... 80 5.2. Literature Review ............................................................................................................... 80 5.3. Site/Location Analysis ....................................................................................................... 81
5.3.1. Characteristics of Ideal Sites ....................................................................................... 81 5.3.2. Potential Sites Selection .............................................................................................. 82 5.3.3. Pair-wise Comparison ................................................................................................. 84
5.4. Facility Layout ................................................................................................................... 87 5.4.1. Identification of Comparable ...................................................................................... 88 5.4.2. Facility Layout ............................................................................................................ 91 5.4.3. Potential Layout for Proposed Facility ....................................................................... 93
5.5. Facility Impact ................................................................................................................... 95 5.5.1. Freight Volume Analysis ............................................................................................ 96 5.5.2. Freight Movement Analysis ........................................................................................ 98 5.5.3. Congestion Analysis ................................................................................................. 105 5.5.4. Air Pollution.............................................................................................................. 106 5.5.4. Water & Land Pollution ............................................................................................ 108 5.5.5. Noise and Light Pollution ......................................................................................... 109 5.5.6. Safety ........................................................................................................................ 110 5.5.7. Livability ................................................................................................................... 110
5.6. Summary .......................................................................................................................... 111 Chapter 6: Best Practices, Leadership, Strategy and Organizational Design ............................ 113
6.1. Introduction ...................................................................................................................... 113
Triple-Bottom Line Assessment of Future Mississippi Intermodal Facility Page 6
6.2. Management & Organizational Models of Intermodal Facilities ................................... 113 6.2.1. Landlord Intermodal Facility ................................................................................... 114 6.2.2. Operator Intermodal Facility ..................................................................................... 114 6.2.3. Developer Model Intermodal Facility ....................................................................... 114
6.3. The Role of Port Authorities (PA’s) ............................................................................... 114 6.4. Dryports .......................................................................................................................... 115 6.5. Strategic Direction of Development ............................................................................... 115 6.6. Summary ......................................................................................................................... 116 References ............................................................................................................................... 117
Appendices .................................................................................................................................. 123 Appendix A: Survey Questionnaire ............................................................................................ 124 Appendix B: Survey Responses .................................................................................................. 134 Appendix C: Issue Book ............................................................................................................. 140 Appendix D: WISER Trade Import and Export Statistics for the Port of Gulfport .................... 159
Triple-Bottom Line Assessment of Future Mississippi Intermodal Facility Page 7
LIST OF FIGURES Figure 1.1. Port of Gulfport’s influence (a) and proximity (b) in the nation ................................ 17 Figure 1.2. Site Analysis for (a) Wiggins and (b) Hattiesburg ..................................................... 19 Figure 2.1. Sample Intermodal Facility ........................................................................................ 21 Figure 2.2. Cost of Wasted Time and Wasted Fuel (AAR, 2010) ................................................ 24 Figure 2.3. Sample Loading and Unloading of Containers at the Seaport ................................... 25 Figure 2.4. Memphis BNSF Intermodal Facility .......................................................................... 30 Figure 2.5. US Greenhouse Gas Emissions in 2006 by Source .................................................... 33 Figure 2.6. Intermodal Facility Study (WZI, Inc., 2008) .............................................................. 34 Figure 2.7. Virginia Inland Port .................................................................................................... 43 Figure 3.1. Range of Job Creation Associated with IFFs ............................................................. 53 Figure 3.2. The Range of Employment Change in the Vicinity of Near Dock Facilities ............. 58 Figure 4.1. The Balance Scorecard (Kaplan and Norton, 1996) ................................................... 67 Figure 5.1. Location of 10 South Mississippi cities to host potential intermodal facility ............ 83 Figure 5.2. (a): Wiggins 250 acres (b): Wiggins 190 acres [Google Earth,2011] ........................ 85 Figure 5.3. (a) Hattiesburg 585 acres (b): Hattiesburg 500 acres [Google Earth, 2011]………...86 Figure 5.4. Population Proximity from Hattiesburg ..................................................................... 87 Figure 5.5. ICTF actual areas, (Google Earth 2011) ..................................................................... 88 Figure 5.6. Different Facilities, [Dallas Hub, 2007] ..................................................................... 89 Figure 5.7. Dallas Intermodal Facility actual areas, [Google Earth 2011] ................................... 90 Figure 5.8. NS Memphis Facility Site (AREMA, 2009) .............................................................. 90 Figure 5.9. Six options for transport from and origin (O) to a destination (D) ........................... 93 Figure 5.10. Hypothetical Layout with 200 acres ......................................................................... 94 Figure 5.11. Hypothetical Layout with 350 acres ......................................................................... 95 Figure 5.12. Projected Containers Movement from the Port of Gulfport ..................................... 97 Figure 5.13. Projected Modal Shift at the Port of Gulfport .......................................................... 98 Figure 5.14. Centralization of Freight Activity (Cidell 2010) ...................................................... 99 Figure 5.15. Destination State [Wiser Trade, 2010] ................................................................... 100 Figure 5.16. The freight distribution area covered by Chiquita .................................................. 102 Figure 5.17. Market Coverage by Modes of Transportation ...................................................... 102 Figure 5.18. Actual vs Future transit times for Hattiesburg and Wiggins .................................. 103 Figure 5.19. Comparison time by Truck vs. Train from Wiggins .............................................. 104 Figure 5.20. Comparison time by Truck vs. Train from Hattiesburg ......................................... 105 Figure 5.21. Comparison time by Truck vs. Train actual and future .......................................... 106 Figure 5.22. Typical sound level of intermodal facility equipment ............................................ 109
Triple-Bottom Line Assessment of Future Mississippi Intermodal Facility Page 8
LIST OF TABLES
Table 1.1. Project Tasks And Deliverables ................................................................................... 13 Table 1.2. Potential Benchmark Intermodal Facilities .................................................................. 15 Table 1.3. Community Impact (Meyrick and Associates, 2006) .................................................. 17 Table 2.1. Freight Modes Compared (per ton-mile) (TR NEWS, 2002) ....................................... 24 Table 2.2. Intermodal Facilities Used for Benchmarking. ............................................................ 31 Table 2.3. US Greenhouse Gas Emission in 2006 from Transportation Industry by Modes ....... 33 Table 2.4. Implementation of Green Technology in Sample Intermodal Facility ........................ 37 Table 2.5. Types and Purpose of Green Technologies ................................................................. 38 Table 2.6 Economic Impact Studies of Intermodal Facilities ....................................................... 39 Table 2.7. 2007-2009 Employment Changes at Selected Intermodal Centers ............................. 40 Table 2.8. Government Funding of Intermodal Facilities ............................................................. 41 Table 2.9. Benchmarking Facilities .............................................................................................. 44 Table 2.10. Intermodal Freight Facilities Planning Process (Shafran and Strauss-Weider, 2003)45 Table 2.11. Private Sector Intermodal Developers. ...................................................................... 46 Table 3.1. Facility Contacts. ......................................................................................................... 50 Table 3.2. Transportation and Logistics Related Occupations ..................................................... 52 Table 3.3. Results of Statistical Analysis...................................................................................... 55 Table 3.4. Results of Statistical Analysis...................................................................................... 56 Table 3.5. Results of Statistical Analysis...................................................................................... 59 Table 4.1 Typical Productivity Performance Indicators for Intermodal Facility (Gordon Rankine, 2003) ............................................................................................................................................. 70 Table 4.2. Growth Rate of Container Throughputs at Top Container Ports from 1996 to 2005 (Million TEU) (UN ESCAPE, 2005) ............................................................................................ 71 Table 4.3. Complete Listing of Intermodal Facilities Considered for Data Collection ................ 73 Table 4.4. Survey/interview summary for site selection criteria .................................................. 78 Table 4.5. Survey/interview summary for operational capacity ................................................... 79 Table 5.1. Ideal Characteristics of Intermodal Facility Location ................................................. 82 Table 5.2. Survey/interview summary for site selection criteria .................................................. 82 Table 5.3. Location Analysis of South Mississippi Cities ............................................................ 84 Table 5.3b. Potential Site Table, [Google Earth 2011] ………………………………………... 87 Table 5.4. Martin Associates Study (2009) .................................................................................. 96 Table 5.5. TranSystems Study (2011) ........................................................................................... 96 Table 5.6. KCS Study (2011) ........................................................................................................ 96 Table 5.7. Distance and travel time from Gulfport ..................................................................... 101 Table 5.8. Destination and travel time from Hattiesburg ............................................................ 103 Table 5.9. Destination and Travel time from Wiggins ............................................................... 104 Table 5.10. Annual Truck Load Estimates ................................................................................. 105 Table 5.11. CO2 Emissions per Freight Transport (Institute for Energy and Environmental Research, Database Environment and Traffic, 2008) ................................................................. 107 Table 5.12. The reduction of CO2 emissions due to the projected modal shift of containers from the port of Gulfport. .................................................................................................................... 107 Table 5.13. Greenhouse Gas Emissions per Freight Transport (Caretto, 2004) ......................... 108 Table 5.14. The reduction of greenhouse emissions due to the projected modal shift of containers from the port of Gulfport. ........................................................................................................... 108
Triple-Bottom Line Assessment of Future Mississippi Intermodal Facility Page 9
EXECUTIVE SUMMARY
The potential impact of Panama Canal expansion and gradual growth of container volumes at the US ports made this project very timely and relevant for the state of Mississippi. This project focused on a Triple-Bottom Line (TBL) analysis of a possible future Mississippi Intermodal Facility. The TBL analysis includes freight velocity (efficiency), air quality and traffic congestions (environment), and economic development and safety (equity) of the State of Mississippi and the Gulf Region. The primary objective of this project was to assist MDOT planners, state policy-makers, and other stakeholders to make informed choices regarding a possible Intermodal Facility in Mississippi. An Intermodal Facility is a component of the cargo transportation network where containerized goods are transferred from one mode to other such as truck-to-rail and from rail-to-truck. Intermodal facilities are important components of global supply chains and have a major impact on local economic development. Intermodal facilities are designed to increase the velocity of containerized freight, reduce the congestions at the port city, improve the efficiency at the port, and maximize local economic development. According to the literature, intermodal facilities also provides faster customs clearing process, better security of goods through Automated Gate System (AGS) with biometric technology, better access to multi modes, and more opportunity for companies to meet the demand of the market place with flexibility. As part of this project, other intermodal facilities in the nation and identified best practices model for leadership, strategy, and organizational design of a TBL intermodal facility that are suitable for south Mississippi. It also conducted logistical impact analysis to identify the possible locations of the facility that maximizes economic development, reduces congestions, increases freight velocity, and minimizes environmental impact. A prototypical layout was designed that included major functional areas of intermodal facility. This project neither cover the details of location selection and environmental impact analysis nor suggested the best options, rather it provides a set of possible alternatives with their respective pros and cons. The logistical impact analysis of this TBL project was designed to identify the potential impact of container growth at the port on freight velocity, congestions, and environment. This report includes connectivity analysis, freight flow analysis, congestion analysis, and top level environmental analysis. Connectivity analysis was designed to identify existing infrastructure near the potential sites. Congestion analysis was performed based on future freight flows to determine the potential impact on the port city. A freight movement performance analysis was conducted to determine the implications of potential intermodal facilities on freight transit times and productivity. This project also performed a location screening and facility layout design. Finding the right location for intermodal site has a huge impact on the logistical performance. An ideal site can reduce the freight movement time, reduce congestion at the port city, improve facility performance, and maximize economic impact. According to the survey results and literature review, a set of location criteria was identified and ten South Mississippi cities were selected that meet at least one of those site selection criteria. Further pairwise comparative analysis was conducted to identify the strengths and weaknesses of top two potential sites.
Triple-Bottom Line Assessment of Future Mississippi Intermodal Facility Page 10
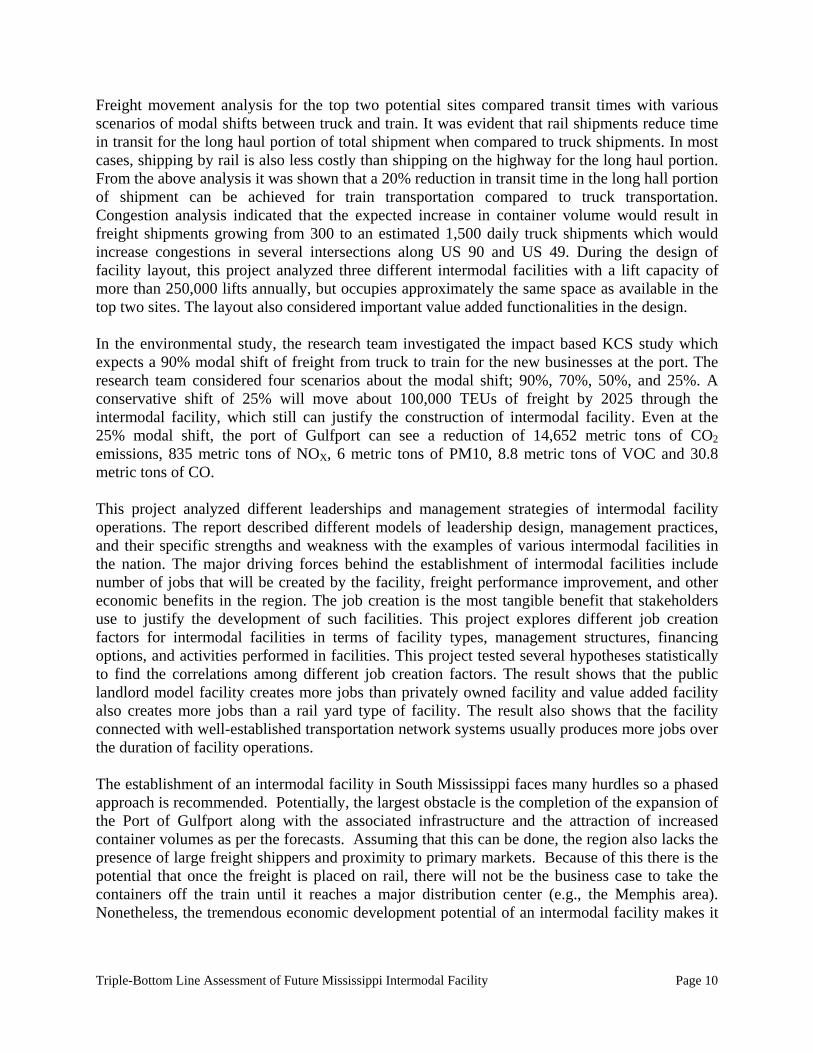
Freight movement analysis for the top two potential sites compared transit times with various scenarios of modal shifts between truck and train. It was evident that rail shipments reduce time in transit for the long haul portion of total shipment when compared to truck shipments. In most cases, shipping by rail is also less costly than shipping on the highway for the long haul portion. From the above analysis it was shown that a 20% reduction in transit time in the long hall portion of shipment can be achieved for train transportation compared to truck transportation. Congestion analysis indicated that the expected increase in container volume would result in freight shipments growing from 300 to an estimated 1,500 daily truck shipments which would increase congestions in several intersections along US 90 and US 49. During the design of facility layout, this project analyzed three different intermodal facilities with a lift capacity of more than 250,000 lifts annually, but occupies approximately the same space as available in the top two sites. The layout also considered important value added functionalities in the design. In the environmental study, the research team investigated the impact based KCS study which expects a 90% modal shift of freight from truck to train for the new businesses at the port. The research team considered four scenarios about the modal shift; 90%, 70%, 50%, and 25%. A conservative shift of 25% will move about 100,000 TEUs of freight by 2025 through the intermodal facility, which still can justify the construction of intermodal facility. Even at the 25% modal shift, the port of Gulfport can see a reduction of 14,652 metric tons of CO2 emissions, 835 metric tons of NOX, 6 metric tons of PM10, 8.8 metric tons of VOC and 30.8 metric tons of CO. This project analyzed different leaderships and management strategies of intermodal facility operations. The report described different models of leadership design, management practices, and their specific strengths and weakness with the examples of various intermodal facilities in the nation. The major driving forces behind the establishment of intermodal facilities include number of jobs that will be created by the facility, freight performance improvement, and other economic benefits in the region. The job creation is the most tangible benefit that stakeholders use to justify the development of such facilities. This project explores different job creation factors for intermodal facilities in terms of facility types, management structures, financing options, and activities performed in facilities. This project tested several hypotheses statistically to find the correlations among different job creation factors. The result shows that the public landlord model facility creates more jobs than privately owned facility and value added facility also creates more jobs than a rail yard type of facility. The result also shows that the facility connected with well-established transportation network systems usually produces more jobs over the duration of facility operations. The establishment of an intermodal facility in South Mississippi faces many hurdles so a phased approach is recommended. Potentially, the largest obstacle is the completion of the expansion of the Port of Gulfport along with the associated infrastructure and the attraction of increased container volumes as per the forecasts. Assuming that this can be done, the region also lacks the presence of large freight shippers and proximity to primary markets. Because of this there is the potential that once the freight is placed on rail, there will not be the business case to take the containers off the train until it reaches a major distribution center (e.g., the Memphis area). Nonetheless, the tremendous economic development potential of an intermodal facility makes it

Triple-Bottom Line Assessment of Future Mississippi Intermodal Facility Page 11
imperative that South Mississippi not drop the effort to establish a facility. The region needs to continue to study, plan, and organize. The region needs to establish an overall public-private governing body or at least a consortium of stakeholders collaborating in a cohesive manner for the long term goal of establishing an intermodal facility that provides triple-bottom line results for the citizens of Mississippi.
Triple-Bottom Line Assessment of Future Mississippi Intermodal Facility Page 12
CHAPTER 1. TRIPLE-BOTTOM LINE ASSESSMENT OF FUTURE MISSISSIPPI
INTERMODAL FACILITY 1.1. PROBLEM STATEMENT Expecting increased freight traffic from the 2014 expansion of the Panama Canal, former-Governor Haley Barbour proposed creating a large transportation hub in South Mississippi to handle increased container traffic from a $1 billion expansion of the Port of Gulfport. The proposed rail-to-truck intermodal facility would support the State Port at Gulfport expansion project that, when completed, will have the annual potential to move 1 million containers through Mississippi. The current annual container volume at Gulfport is 200,000 containers. With this proposed increase in container volume, an inland intermodal facility would help relieve congestion at the port, efficiently stage containers for distribution, and reduce truck traffic in potential EPA environmental nonattainment zones near the coast. According to the former Governor, the intermodal facility might resemble the CenterPoint Intermodal Center in Joliet, Illinois near Chicago. This facility is on about 2,500 acres, including two rail intermodal yards, the 770-acre BNSF facility and the 550 acre Union Pacific terminal. The Illinois project represents a $1 billion investment and, according to the CenterPoint Web site, it could create as many as 8,000 jobs. Intermodal facilities and inland ports such as is being proposed for South Mississippi have the potential to positively impact the Triple-Bottom Line (People, Planet, and Profit) of the State of Mississippi and the Gulf Region (Pisano et al., 2010). The Triple-Bottom Line (TBL) approach of valuing people, planet, and profit is gaining popularity as an approach for leading organizations to make investment decisions (Savitz & Weber, 2006). When applying the triple-bottom line to transportation infrastructure the three distinct, but linked outcomes of the investment are commonly measured by more efficient freight movement (profit), improved air quality and reduced traffic congestions (planet), and economic development and safety (people). Achieving triple-bottom results requires the public and private sector to work together and there are many problems or challenges during the planning, construction and operation of this type of facilities. Currently, the proposed intermodal facility is in the concept phase and it is likely that it will face many of the common issues associated with a new intermodal development including project financing, comprehensive planning, design considerations, addressing citizen and community input, coordination with existing development plans, addressing asymmetry between the objectives of the railroads and the community, accommodating divergent interests of stakeholders, and dealing with a multitude of other problems that arise when new intermodal facilities are proposed. This report should provide the stakeholders involved with the development of the project some of the background information needed address these issues. 1.2. OVERALL PROJECT GOAL The objective of this project was to assist MDOT planners, state policy-makers, and other stakeholders to make informed choices about the role, development, and management of an
Triple-Bottom Line Assessment of Future Mississippi Intermodal Facility Page 13
intermodal facility in South Mississippi to foster economic development in the State fueled by the expanded Port of the Future at Gulfport. This project will facilitate the development of the optimal leadership, strategy, and organizational design for the intermodal facility that will make the private sector more competitive, create economic development, benefit the environment and the residents by providing and testing a best practices model. The following are the specific deliverables that support the overall goal of this project: 1. A best practices model for leadership, strategy, and organizational design of a TBL
intermodal facility based on an analysis of comparable facilities. This analysis includes prototypical layouts and site requirements.
2. A preliminary evaluation of sites in South Mississippi that meet the needs of a TBL intermodal facility. This includes broad environmental considerations.
3. An analysis of markets and industries that would potentially be served by a new facility. 4. A report that provides stakeholders with a clear commercial picture of the cost and
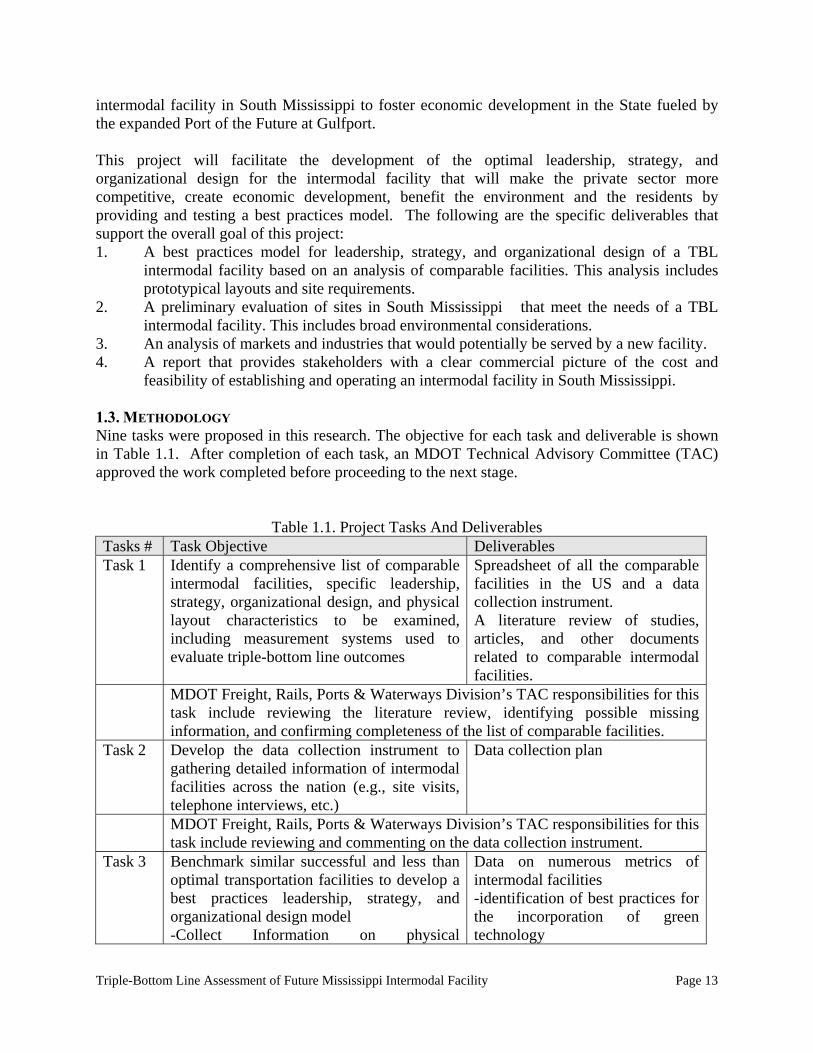
feasibility of establishing and operating an intermodal facility in South Mississippi. 1.3. METHODOLOGY Nine tasks were proposed in this research. The objective for each task and deliverable is shown in Table 1.1. After completion of each task, an MDOT Technical Advisory Committee (TAC) approved the work completed before proceeding to the next stage.
Table 1.1. Project Tasks And Deliverables Tasks # Task Objective Deliverables Task 1 Identify a comprehensive list of comparable
intermodal facilities, specific leadership, strategy, organizational design, and physical layout characteristics to be examined, including measurement systems used to evaluate triple-bottom line outcomes
Spreadsheet of all the comparable facilities in the US and a data collection instrument. A literature review of studies, articles, and other documents related to comparable intermodal facilities.
MDOT Freight, Rails, Ports & Waterways Division’s TAC responsibilities for this task include reviewing the literature review, identifying possible missing information, and confirming completeness of the list of comparable facilities.
Task 2 Develop the data collection instrument to gathering detailed information of intermodal facilities across the nation (e.g., site visits, telephone interviews, etc.)
Data collection plan
MDOT Freight, Rails, Ports & Waterways Division’s TAC responsibilities for this task include reviewing and commenting on the data collection instrument.
Task 3 Benchmark similar successful and less than optimal transportation facilities to develop a best practices leadership, strategy, and organizational design model -Collect Information on physical
Data on numerous metrics of intermodal facilities -identification of best practices for the incorporation of green technology
Triple-Bottom Line Assessment of Future Mississippi Intermodal Facility Page 14
characteristics such as layout, equipment, cost, etc. -Overview environmental analysis will be conducted
- high level environmental study report - hypothetical facility layouts
MDOT Freight, Rails, Ports & Waterways Division’s TAC responsibilities for this task include reviewing the data obtained in Task 3 and providing insights on successful and less than optimal facilities. Also, TAC will be asked to provide introduction letters to operators and users of intermodal facilities requesting assistance in the study.
Task 4 Develop a best practices concept for leadership, strategy, and organizational design
A concept paper for a leadership, strategy, and organization design that based on an analysis of comparable facilities will most likely achieve the TBL outcomes
Task 5 Establish potential site requirements based on analysis of comparable facility designs -conduct a hypothetical congestion analysis at the port -conduct a hypothetical freight movement performance analysis
A prototypical layout for an intermodal facility that can be used to evaluate potential sites including - a list of advantages and disadvantages of potential sites - a report on potential impact of this facility on port congestion - a report on freight movement performance analysis
Task 6 Market and Commodity Analysis for the Port of the Future
A theoretical commodity flow map of the proposed facility and an analysis of potential markets?
Task 7 Identify stakeholders and develop the procedures for conducting focus groups of stakeholders to analysis their opinions regarding the best practices in leadership, strategy, organizational design, and site plan.
Protocols for conducting stakeholder meetings
MDOT Freight, Rails, Ports & Waterways Division’s TAC responsibilities including helping to identify stakeholders, possible inviting certain key stakeholders, and participating on the focus groups.
Task 8 Prepare a draft report presenting strengths and weakness of various scenarios
Kettering Issues Guides
MDOT Freight, Rails, Ports & Waterways Division’s TAC will review the draft report
Task 9 Prepare final report with all the elements of the project
Final Report that provides a TBL assessment of possibilities for an intermodal facility in South Mississippi.
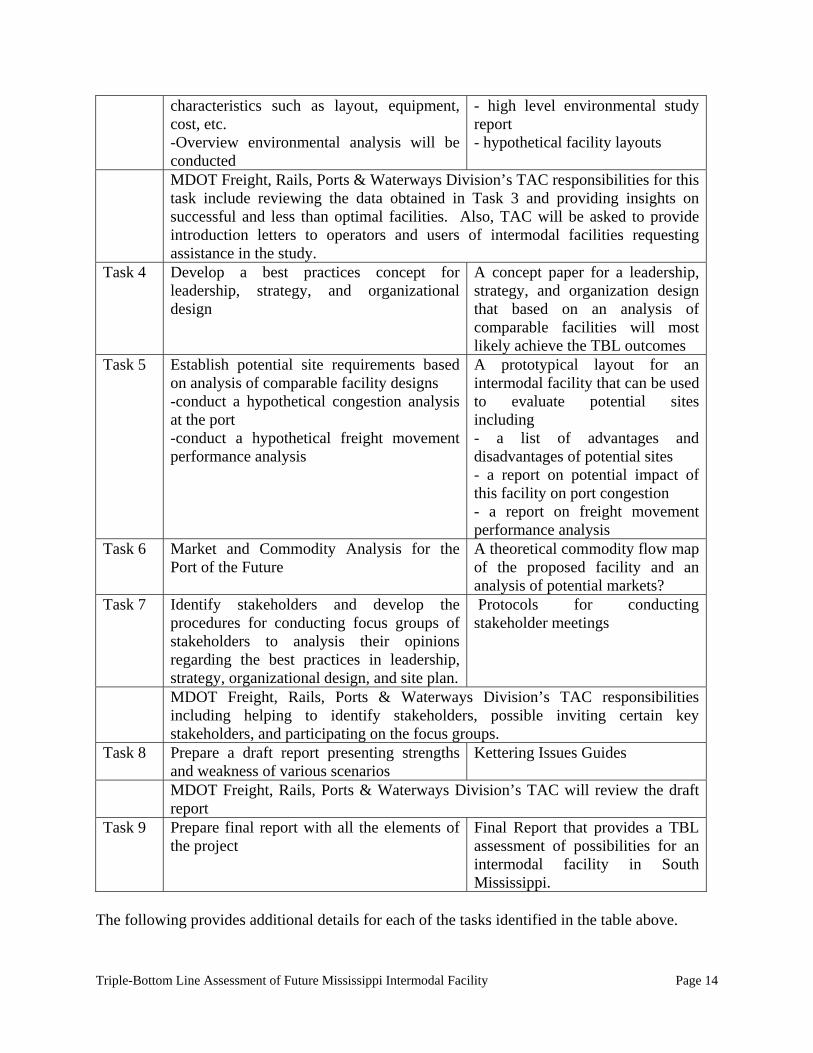
The following provides additional details for each of the tasks identified in the table above.
Triple-Bottom Line Assessment of Future Mississippi Intermodal Facility Page 15
Task 1. Identification of Intermodal Facilities Across the Nation: A preliminary list of potential benchmark facilities was compiled (See Table 1.2). In Task 1, this list of potential comparable intermodal facilities in the US was expanded. In addition, organizations and firms (e.g., Site Selection Magazine, Cushman & Wakefield, CenterPoint Properties, etc) that are involved in the planning and development of major projects of this type were contacted to identify additional developments. The data collection included email and phone surveys of transportation providers, site development-related organizations, and local economic development professionals (local and regional chambers of commerce, state economic development agencies, etc.)
Table 1.2. Potential Benchmark Intermodal Facilities 1 Port San Antonio (Kelly USA) San Antonio TX 2 UP: Dallas Intermodal Terminal Wilmer TX
3 UP: Joliet Intermodal Terminal (Illinois) Joliet IL
4 Auburn Intermodal Facility (Maine) Auburn ME 5 Virginia Inland Port Front Royal VA 6 Somerset Rail Park Ferguson KY 7 UP: ICTF (Long Beach) Long Beach CA 8 UP: Tacoma South Intermodal Facility Tacoma WA 9 UP: San Antonio Intermodal Facility Von Ormy TX 10 UP: Salt Lake City Intermodal Facility Salt Lake City UT
11 Rochelle Global III Intermodal Terminal Rochelle IL
12 Port of Pasco Intermodal Terminal Pasco WA 13 NS: Titusville Intermodal Terminal Titusville FL 14 NS: Charlotte Intermodal Facility Charlotte NC 15 Charlotte Inland Terminal Charlotte NC 16 BNSF: Birmingham Intermodal Facility Birmingham AL 17 BNSF: Atlanta Intermodal Facility Atlanta GA 18 Piedmont Triad Inland Terminal (PTIT) Greensboro NC 19 BNSF: Chicago Intermodal Facility Chicago IL
20 Huntsville International Intermodal Center Huntsville AL
21 California Integrated Logistics Center Shafter CA 22 Port of Quincy Intermodal Terminal Quincy WA 23 Stark County Neomodal Terminal Stark County OH 24 Port of Montana Butte MT 25 Port of New York and New Jersey New York NY 26 Rickenbacker Intermodal Terminal Columbus OH 27 Kansas City Smart Port Kansas City MO 28 Hillsborough Compact Freight Village Hillsborough NJ
A profile for each site identified was created. This profile consisted of a map, a description of the transportation infrastructure including all rail and highway access, and the size/capacity of all
Triple-Bottom Line Assessment of Future Mississippi Intermodal Facility Page 16
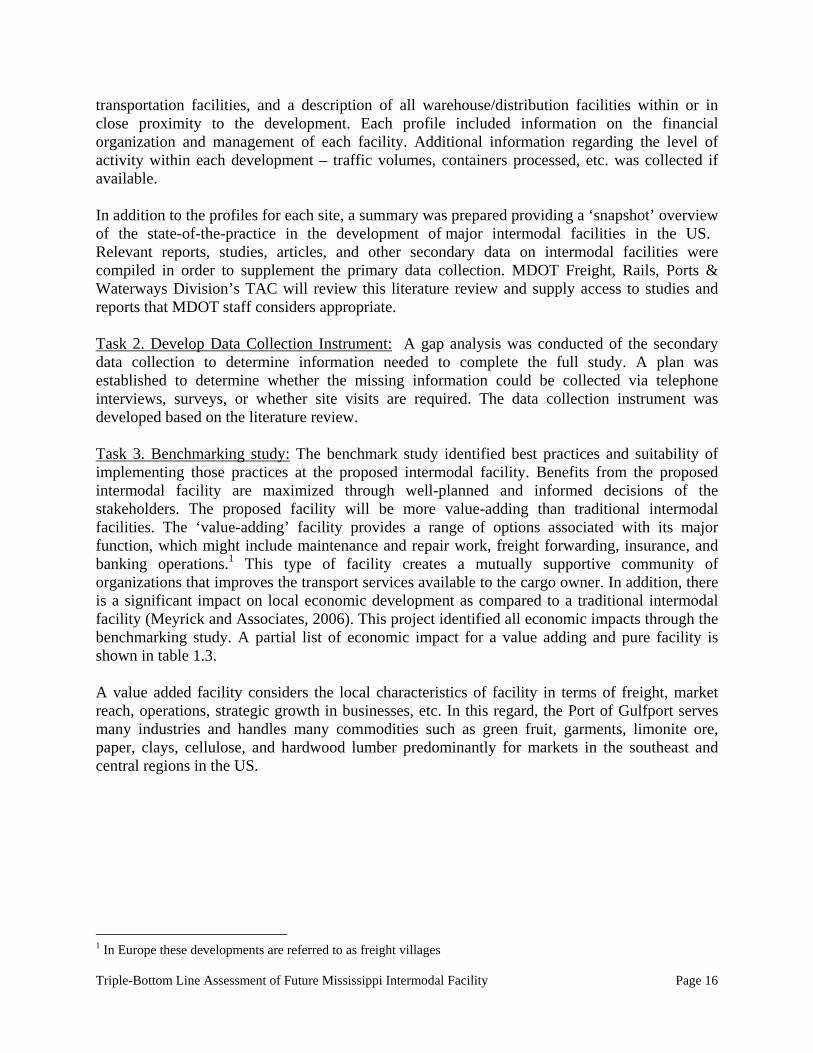
transportation facilities, and a description of all warehouse/distribution facilities within or in close proximity to the development. Each profile included information on the financial organization and management of each facility. Additional information regarding the level of activity within each development – traffic volumes, containers processed, etc. was collected if available. In addition to the profiles for each site, a summary was prepared providing a ‘snapshot’ overview of the state-of-the-practice in the development of major intermodal facilities in the US. Relevant reports, studies, articles, and other secondary data on intermodal facilities were compiled in order to supplement the primary data collection. MDOT Freight, Rails, Ports & Waterways Division’s TAC will review this literature review and supply access to studies and reports that MDOT staff considers appropriate. Task 2. Develop Data Collection Instrument: A gap analysis was conducted of the secondary data collection to determine information needed to complete the full study. A plan was established to determine whether the missing information could be collected via telephone interviews, surveys, or whether site visits are required. The data collection instrument was developed based on the literature review. Task 3. Benchmarking study: The benchmark study identified best practices and suitability of implementing those practices at the proposed intermodal facility. Benefits from the proposed intermodal facility are maximized through well-planned and informed decisions of the stakeholders. The proposed facility will be more value-adding than traditional intermodal facilities. The ‘value-adding’ facility provides a range of options associated with its major function, which might include maintenance and repair work, freight forwarding, insurance, and banking operations.1 This type of facility creates a mutually supportive community of organizations that improves the transport services available to the cargo owner. In addition, there is a significant impact on local economic development as compared to a traditional intermodal facility (Meyrick and Associates, 2006). This project identified all economic impacts through the benchmarking study. A partial list of economic impact for a value adding and pure facility is shown in table 1.3. A value added facility considers the local characteristics of facility in terms of freight, market reach, operations, strategic growth in businesses, etc. In this regard, the Port of Gulfport serves many industries and handles many commodities such as green fruit, garments, limonite ore, paper, clays, cellulose, and hardwood lumber predominantly for markets in the southeast and central regions in the US.
1 In Europe these developments are referred to as freight villages
Triple-Bottom Line Assessment of Future Mississippi Intermodal Facility Page 17
Table 1.3. Community Impact (Meyrick and Associates, 2006) Pure Intermodal Facility
Exchange containers between transport modes Storage for full and empty containers
Low level of local economic benefit
Value Adding Intermodal Facility Bonded facilities Warehousing Container repairs and cleaning Truck and trailer parking and repair Office locations for customs Security Inspections Freight consolidations
High level of local economic benefit
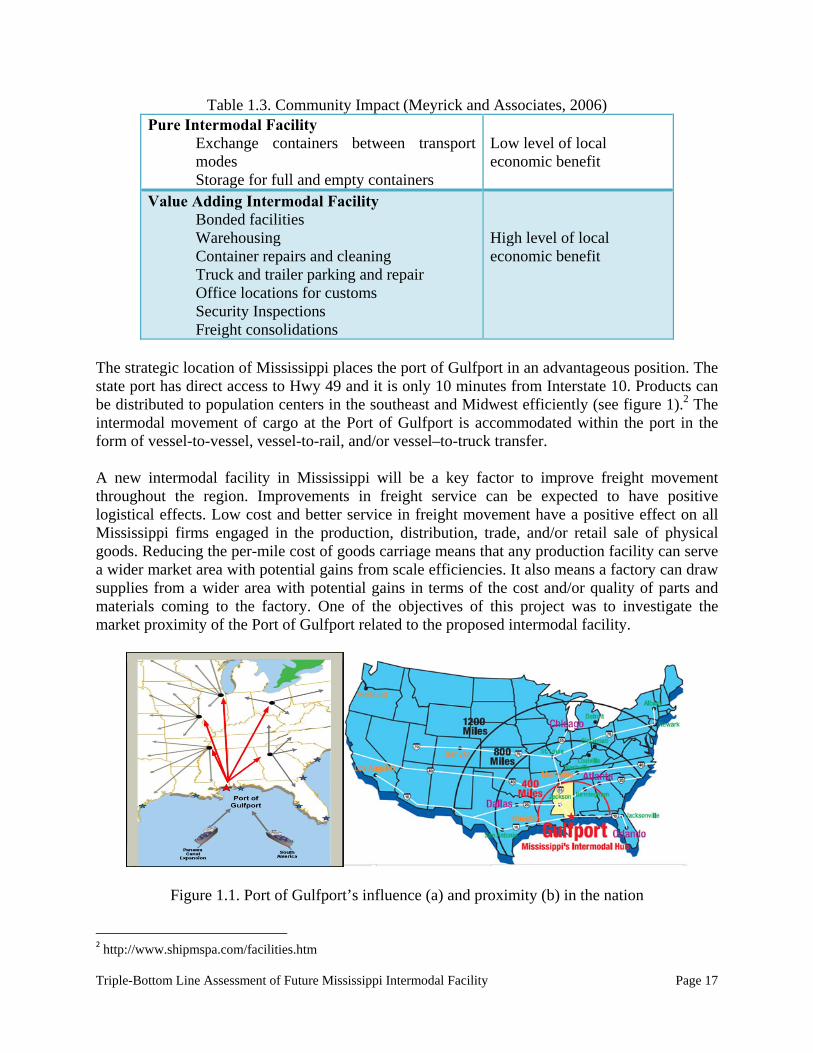
The strategic location of Mississippi places the port of Gulfport in an advantageous position. The state port has direct access to Hwy 49 and it is only 10 minutes from Interstate 10. Products can be distributed to population centers in the southeast and Midwest efficiently (see figure 1).2 The intermodal movement of cargo at the Port of Gulfport is accommodated within the port in the form of vessel-to-vessel, vessel-to-rail, and/or vessel–to-truck transfer. A new intermodal facility in Mississippi will be a key factor to improve freight movement throughout the region. Improvements in freight service can be expected to have positive logistical effects. Low cost and better service in freight movement have a positive effect on all Mississippi firms engaged in the production, distribution, trade, and/or retail sale of physical goods. Reducing the per-mile cost of goods carriage means that any production facility can serve a wider market area with potential gains from scale efficiencies. It also means a factory can draw supplies from a wider area with potential gains in terms of the cost and/or quality of parts and materials coming to the factory. One of the objectives of this project was to investigate the market proximity of the Port of Gulfport related to the proposed intermodal facility.
Figure 1.1. Port of Gulfport’s influence (a) and proximity (b) in the nation 2 http://www.shipmspa.com/facilities.htm
Triple-Bottom Line Assessment of Future Mississippi Intermodal Facility Page 18
Intermodal facilities impact the local environment in many ways. These effects are evaluated based on the significance and likelihood of impacts. The significance of adverse impacts depends on their magnitude, geographic extent, duration and frequency, irreversibility, ecological context, social context, and economic context. Likelihood is determined by probability of occurrence and scientific uncertainty (Camponovo et al., 2006). Major issues raised in assessing significance of environmental impact are: 1. Will the project create unwarranted losses in precious or irreplaceable biodiversity or
other resources? 2. Will the project induce an unwarranted acceleration in the use of scarce resources and
favor short-term over long-term economic gains? 3. Will the project adversely affect national resources such as wet land, energy to an
unwarranted degree? 4. Will the project result in unwarranted hazards to endangered species? 5. Will the project contribute to affect air quality in the region? 6. Will there be an available option to use green technology/ green construction to reduce
the environmental impact? There are a number of options available for minimizing the impact of new terminal developments on local communities. According to NCFRP Report 13 Freight Facility Location Selection: A Guide for Public Officials (2011), these include: 1. Careful selection of the terminal site 2. Appropriate land use planning, including the provision of buffer zones 3. Investment in environmental improvements beyond that required by regulation Environmental considerations are a key consideration when planning the construction of a new intermodal facility. A detailed analysis of potential environmental impacts is often necessary to identify the scope of the potential impacts. This is particularly true if federal or state monies/permits are involved in the planned project. Projects using federal, and in some cases state, funding are regulated under the National Environmental Policy Act (NEPA). This study, by no means, will analyze the comprehensive environmental impact of proposed intermodal facility. One of the aims of this proposed study was to establish, analyze and interpret, in broader terms, the environmental impacts of a various proposed intermodal facility location. A comparative environmental study for those sites included the following:
Air Pollution Noise Pollution Light & Glare Pollution Damage in Scenic Resources Damage in Wetland Resources Use of Green Technology in the Construction
Task 4 & 5 Develop Best Practice and Establish Mississippi Site Requirements: These were developed using the analysis of comparable facilities, best practices in leadership, strategy, organizational design, site layout, and utilization of green technology with interaction and feedback from stakeholders. These best practices and site requirements are framed by TBL
Triple-Bottom Line Assessment of Future Mississippi Intermodal Facility Page 19
considerations. According to the Transportation Research Board’s report (NCFRP Report # 13), the primary criteria for intermodal facility location selection are as follows;
1) Access to Markets or Customers 2) Availability of Transportation Networks 3) Availability of Workforce 4) Total Cost of Operation 5) Proximity to Ports 6) Permitting and Regulations 7) Availability & cost of Facility Space
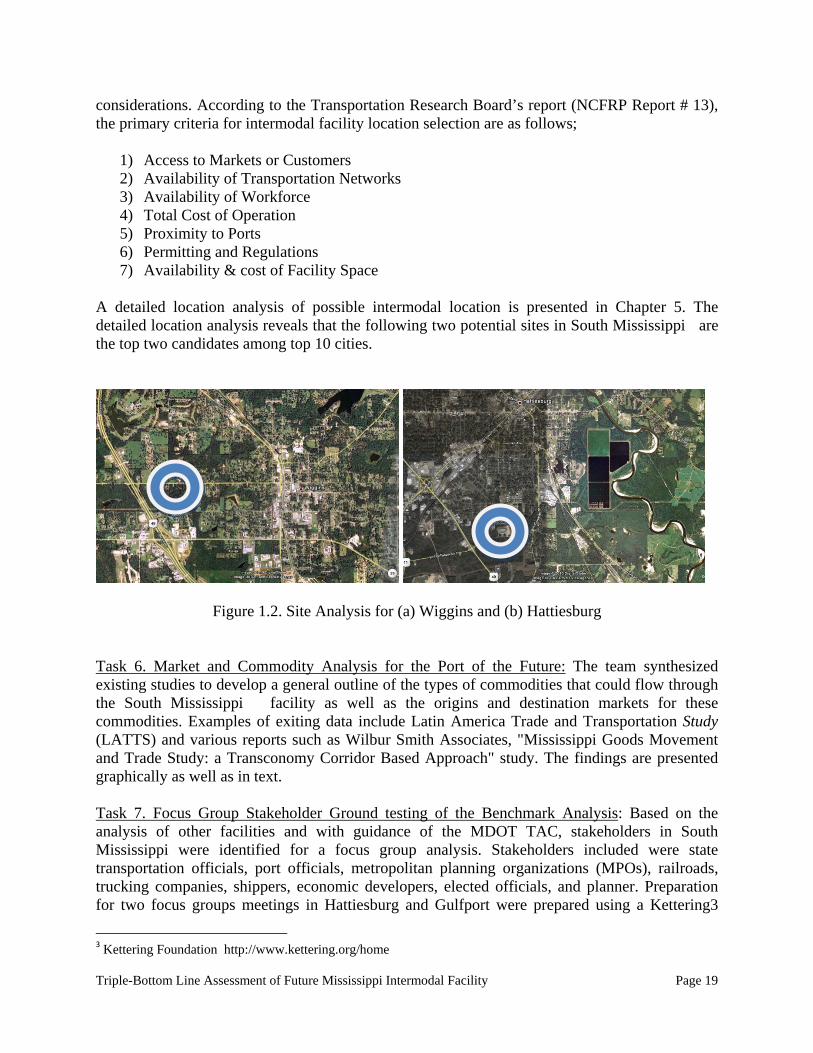
A detailed location analysis of possible intermodal location is presented in Chapter 5. The detailed location analysis reveals that the following two potential sites in South Mississippi are the top two candidates among top 10 cities.
Figure 1.2. Site Analysis for (a) Wiggins and (b) Hattiesburg Task 6. Market and Commodity Analysis for the Port of the Future: The team synthesized existing studies to develop a general outline of the types of commodities that could flow through the South Mississippi facility as well as the origins and destination markets for these commodities. Examples of exiting data include Latin America Trade and Transportation Study (LATTS) and various reports such as Wilbur Smith Associates, "Mississippi Goods Movement and Trade Study: a Transconomy Corridor Based Approach" study. The findings are presented graphically as well as in text. Task 7. Focus Group Stakeholder Ground testing of the Benchmark Analysis: Based on the analysis of other facilities and with guidance of the MDOT TAC, stakeholders in South Mississippi were identified for a focus group analysis. Stakeholders included were state transportation officials, port officials, metropolitan planning organizations (MPOs), railroads, trucking companies, shippers, economic developers, elected officials, and planner. Preparation for two focus groups meetings in Hattiesburg and Gulfport were prepared using a Kettering3
3 Kettering Foundation http://www.kettering.org/home
Triple-Bottom Line Assessment of Future Mississippi Intermodal Facility Page 20
type approach. When the focus groups are actually held the results will include summaries with benefits and trade-offs identified by the participants of options for leadership, organizational design, strategy, and potential locations for a South Mississippi intermodal facility. Task 8 & 9 Scenarios Report and Final Report: The scenarios report focused on summarizing the different scenarios that were studied as part of this project. The final report was built upon the scenarios report to consolidate the analysis and information of all preceding tasks into a concise report accessible to all stakeholders. The final report applied the triple-bottom line principles of increased freight velocity (efficiency), improved air quality and reduced traffic congestions (environment), and economic development and safety (equity) to potential intermodal facilities in South Mississippi. 1.4. SUMMARY This triple-bottom line assessment of comparable facilities provides the base information needed by the citizens, governments, and businesses involved with the realization of the South Mississippi intermodal complex. This final report provides preliminary location and environmental analysis, potential economic impact in the region, and best leadership models of facility management with best practice examples. The stakeholders can learn from the mistakes and successes of other intermodal transportation endeavors. This report provides guidelines that will allow the region to develop a world-class inland port intermodal facility that improves the competitiveness of the businesses involved, protects the environment and quality-of-life of South Mississippi, and creates equitable and sustainable economic development. This study helps give the inland regions in proximity to Gulfport the knowledge to leverage the opportunity created by the Port of the Future to benefit the profits, planet, and people in South Mississippi.
Triple-Bottom Line Assessment of Future Mississippi Intermodal Facility Page 21
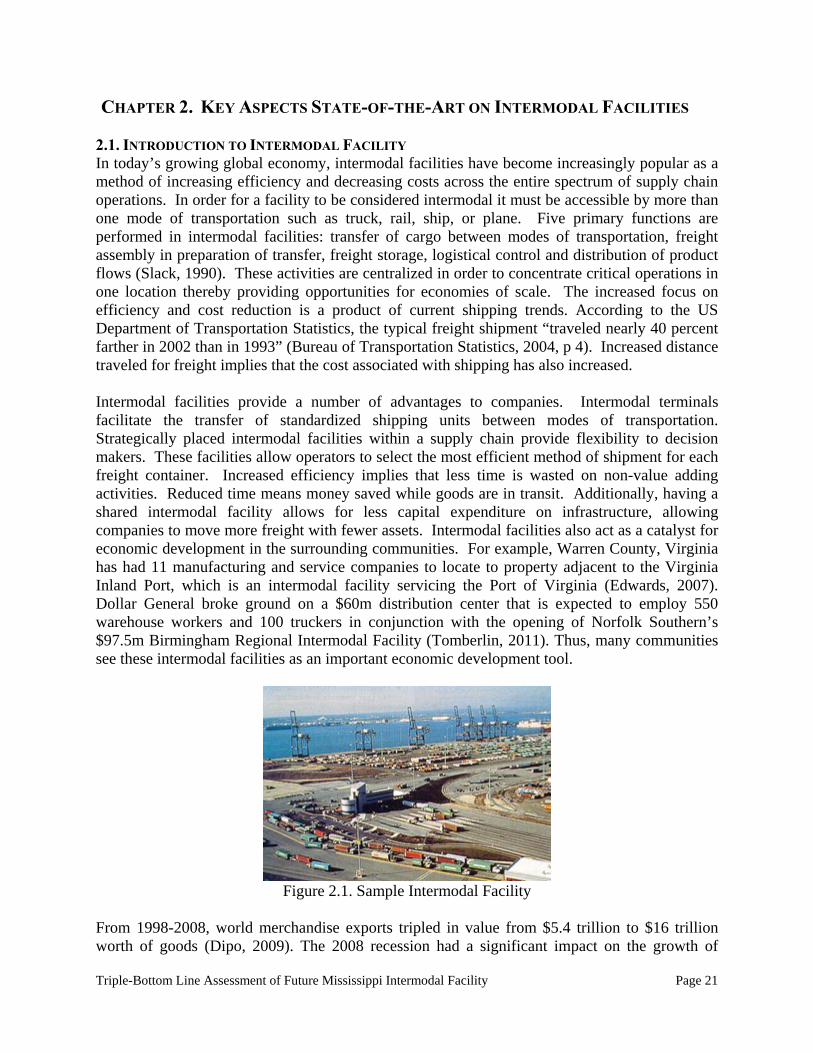
CHAPTER 2. KEY ASPECTS STATE-OF-THE-ART ON INTERMODAL FACILITIES 2.1. INTRODUCTION TO INTERMODAL FACILITY In today’s growing global economy, intermodal facilities have become increasingly popular as a method of increasing efficiency and decreasing costs across the entire spectrum of supply chain operations. In order for a facility to be considered intermodal it must be accessible by more than one mode of transportation such as truck, rail, ship, or plane. Five primary functions are performed in intermodal facilities: transfer of cargo between modes of transportation, freight assembly in preparation of transfer, freight storage, logistical control and distribution of product flows (Slack, 1990). These activities are centralized in order to concentrate critical operations in one location thereby providing opportunities for economies of scale. The increased focus on efficiency and cost reduction is a product of current shipping trends. According to the US Department of Transportation Statistics, the typical freight shipment “traveled nearly 40 percent farther in 2002 than in 1993” (Bureau of Transportation Statistics, 2004, p 4). Increased distance traveled for freight implies that the cost associated with shipping has also increased. Intermodal facilities provide a number of advantages to companies. Intermodal terminals facilitate the transfer of standardized shipping units between modes of transportation. Strategically placed intermodal facilities within a supply chain provide flexibility to decision makers. These facilities allow operators to select the most efficient method of shipment for each freight container. Increased efficiency implies that less time is wasted on non-value adding activities. Reduced time means money saved while goods are in transit. Additionally, having a shared intermodal facility allows for less capital expenditure on infrastructure, allowing companies to move more freight with fewer assets. Intermodal facilities also act as a catalyst for economic development in the surrounding communities. For example, Warren County, Virginia has had 11 manufacturing and service companies to locate to property adjacent to the Virginia Inland Port, which is an intermodal facility servicing the Port of Virginia (Edwards, 2007). Dollar General broke ground on a $60m distribution center that is expected to employ 550 warehouse workers and 100 truckers in conjunction with the opening of Norfolk Southern’s $97.5m Birmingham Regional Intermodal Facility (Tomberlin, 2011). Thus, many communities see these intermodal facilities as an important economic development tool.
Figure 2.1. Sample Intermodal Facility
From 1998-2008, world merchandise exports tripled in value from $5.4 trillion to $16 trillion worth of goods (Dipo, 2009). The 2008 recession had a significant impact on the growth of
Triple-Bottom Line Assessment of Future Mississippi Intermodal Facility Page 22
exports severely. However, according to World Trade Organization statistics, trade rebounded and world merchandise exports, about $12.2 trillion in 2009, went up to $14.8 trillion in 2010 (International Trade statistics, 2011). For the 2008-2010 time periods, U.S. freight exports realized a doubling of value from $682 billion to $1.3 trillion. The U.S. also realized a sharp decline in freight exports in 2009 but recovered most of that value by 2010. The steady rise of exports and imports indicate that more freight is shipped globally and that it is being shipped using multiple modes of transportation. This major increase in intermodal activity shows that intermodal facilities will increasingly become more important to the strategic operation goals of local and international companies. One intermodal solution to meet the growing need for capacity has been an increased interest in satellite intermodal facilities, also known as inland ports or remote hubs. Hinterland facilities have been seen as an opportunity to accommodate future growth of load centers, while minimizing the dislocations on port communities (Slack, 1990). Satellites terminals are smaller than the terminals that they support, making them easier to develop. The land surrounding freight terminals is generally developed and carries a high land value; therefore in many instances considerable expense would be incurred by developers seeking to expand an existing terminal facility such as an airport or seaport. Intermodal facilities play an important role in transportation which is facing many challenges. The challenges facing the transportation sector include:
1. The growing demand for freight transportation and logistics services, and the ability of the physical and information infrastructure to meet these demands.
2. The sometimes seemingly contradictory goals of meeting freight transportation demand and sustainable transportation strategies.
3. The impact of information technology on goods movement, and the issues surrounding the integration of complex systems in order to increase, rather than impede, transport efficiency.
4. Development of the necessary “connectivity linkages” in a global supply chain in which transportation service providers will increasingly find themselves acting as both competitors and partners on an ongoing basis.
There are several ways to categorize intermodal facilities. This study focuses on freight mobility and does not consider passenger intermodal facilities (e.g., bus stations). A Transportation Research Board guide (Steele et al., 2011) to intermodal facilities categorized various types of freight facilities by their function:
Distribution Centers Hub Terminals Ports City Terminals Intermodal Terminals Integrated Logistics Center or Freight
Village Bulk or Transload Terminals The latter model is popular in Europe and has started to garner attention in the U.S. For example, the New York Metropolitan Transportation Council recently commissioned a freight village feasibility study. Rather than the often serendipitous freight cluster development that is prevalent in the U.S., freight villages are planned distribution, logistics, and warehousing communities built around intermodal hubs with the expectation of exogenous growth. An example of a rural freight village is Promachon on the Greek-Bulgarian border. This program was launched in 2001
Triple-Bottom Line Assessment of Future Mississippi Intermodal Facility Page 23
and has become the economic basis of the region (Kyriazopoulos and Artavani, 2006). The area has attracted retail, warehousing, banking, insurance, hospitality, and transportation related businesses. This study focuses on one type of facility, rail-to-truck intermodal, designed to handle containers. This facility is an option for South Mississippi along the KCS Gulfport to Hattiesburg rail line. For this study, we are examining sites that function as intermodal terminals located either near a water port or inland. Various nomenclatures are used for these types of facilities. Terms used to describe facilities that handle containerized cargo transfer between modes includes inland port, dry port, container freight station, inland freight terminal, container freight station (CFS), and intermodal freight center (IFC). For the purposes of this study, we will use the term intermodal freight facility (IFF).
An Intermodal Freight Facility (IFF) is a component of the cargo transportation network where containerized goods are transferred from truck-to-rail and from rail-to-truck.
2.2. LOGISTICAL IMPACT OF INTERMODAL FACILITIES 2.2.1. Reduction of Congestion Intermodal facilities strategically located to directly support the operations of a seaport, rail terminal, or airport reduces the number of trucks hauling freight on highways and interstates in the surrounding region. In the current operating environment, freight is received in a central location, a port or large intermodal rail terminal, and then widely distributed via truck. This results in large freight volumes moving in congested urban areas in all directions from large terminals resulting in significant congestion on routes radiating from the ports and terminals. This is important when one considers that heavy trucks cause a greater degree of congestion than passenger cars. For example, the 35,000 truck trips per day at the ports of Los Angeles and Long Beach routinely clog the Long Beach Freeway and other arteries. A study by Washington State Department of Transportation and Washington State University (2012) found that nearly 60 percent of the over 1,000 freight-dependent businesses surveyed indicated that increases in costs due to congestion would be passed on through to the consumer by raising prices on goods and services. In Gulfport, the watchdog group, the Steps Coalition has raised concerns about the port expansion, which they claim will increase truck traffic of up to twenty times the present amount going through Gulfport. They note the planned Port Connector Road is slated to carry 60% of the truck traffic from the port to I-10 and highway 49, while the remainder of the traffic will go to highway 90 and other local roads. They have raised vocal concerns about the air pollution and traffic congestion from the truck traffic from the port.
Potentially congestion can be reduced by modifying the supply chain to ship freight from the port and ship containers to an inland port facility via rail Movement by rail removes many trucks from highways and interstates thereby reducing the amount of roadway congestion. According American Association of Railroad, freight trains are capable of carrying loads equivalent of 280 trucks in a single haul making space for 1,000 or more passenger automobiles.
Triple-Bottom Line Assessment of Future Mississippi Intermodal Facility Page 24
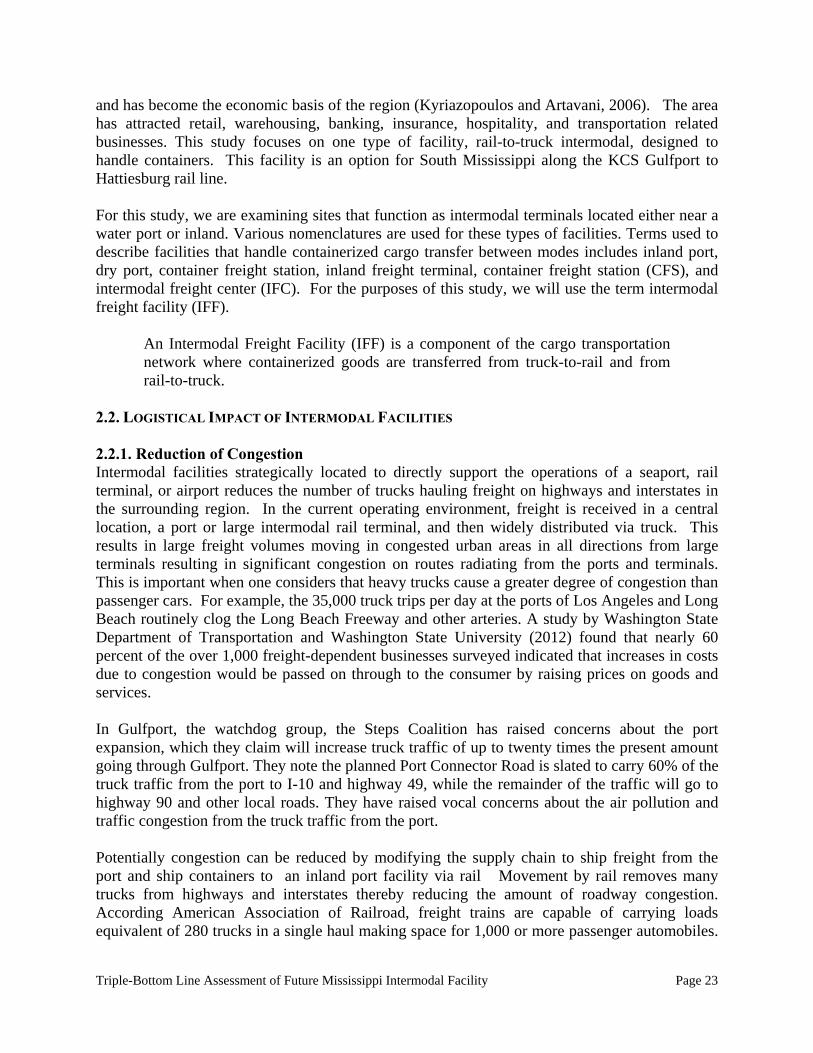
Freight rail advocates argue that increased rail freight movement significantly reduces highway infrastructure maintenance and expansion costs. In addition to reducing infrastructure costs, decreased congestion could result in billions worth of savings in travel time and fuel consumption. According to the Texas Transportation Institute, travelers wasted a total of 4.2 billion hours on travel time and 2.8 billion gallons of fuel annually.
Figure 2.2. Cost of Wasted Time and Wasted Fuel (AAR, 2010)
Modal shift from truck to rail can result in significant benefits to the overall transportation system by reducing congestion and overcoming capacity limitations on the U.S. highway network. Effective uses of multimodal shipping options can alleviate capacity constraints and improve cost performance and reliability of freight transportation. Rail transportation and water transportation offer competitive advantages to moving freight over road transportation. Mississippi can take advantage of water transportation (barge) for some of its routes since the state is surrounded by the either natural or manmade waterways. Water transportation not only provides cost per ton-mile advantage but also has lesser impact on the environment. Table 2.1 shows the comparative advantage of Water (Barge) shipment over Rail and Truck.
Table 2.1. Freight Modes Compared (per ton-mile) (TR NEWS, 2002)
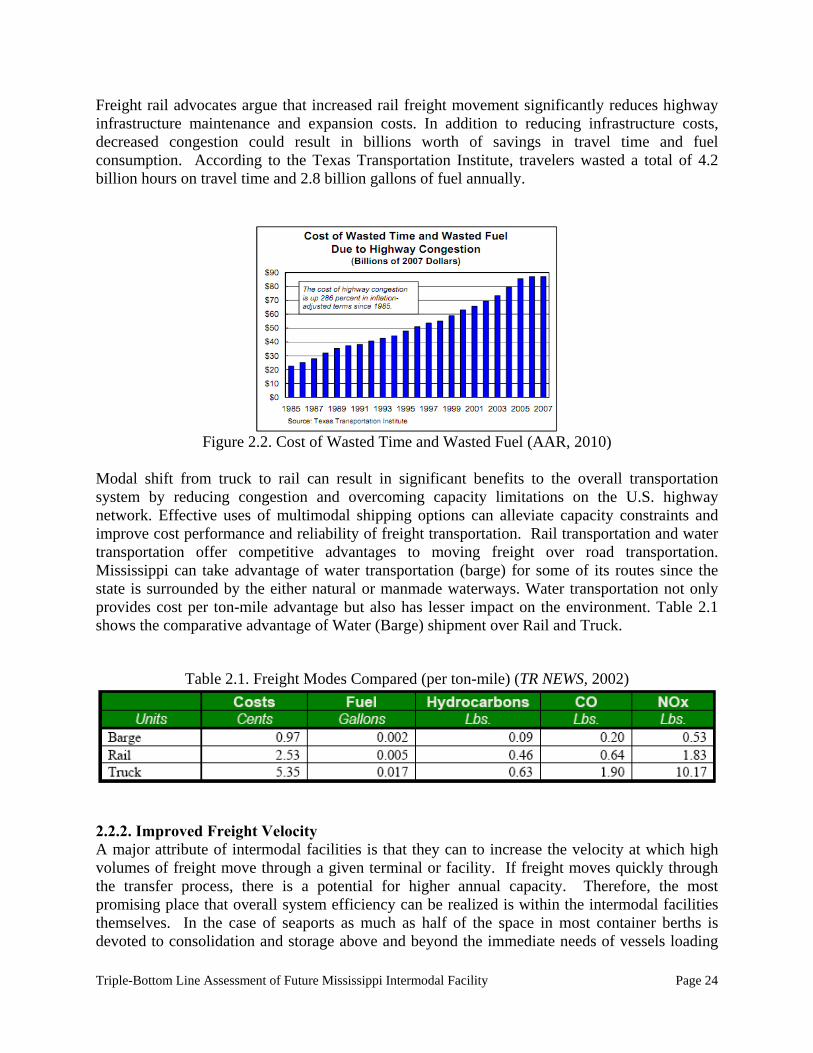
2.2.2. Improved Freight Velocity A major attribute of intermodal facilities is that they can to increase the velocity at which high volumes of freight move through a given terminal or facility. If freight moves quickly through the transfer process, there is a potential for higher annual capacity. Therefore, the most promising place that overall system efficiency can be realized is within the intermodal facilities themselves. In the case of seaports as much as half of the space in most container berths is devoted to consolidation and storage above and beyond the immediate needs of vessels loading
Triple-Bottom Line Assessment of Future Mississippi Intermodal Facility Page 25
and unloading (Slack 1990). Removing these activities from terminals, especially in the case of seaports, would allow for reconfiguration of existing sites with potentially large gains in throughput capacity.
Figure 2.3. Sample Loading and Unloading of Containers at the Seaport
The current waste in capacity is due, in large part, to the capacity constraints placed on ports by truck access limitations. Access at major port terminals has become problematic due to congestion and, in many cases, capacity expansion to accommodate truck traffic to service additional volumes is not an easy option (Rodrigue 2008). In addition to the accessibility problems of many ports, current law mandates that trucks are able to haul loads up to 80,000 lbs on most highways and interstates. These two limiting factors can have serious implications on the time for freight to move through the supply chain. Relocating freight from the area of port operations to inland facilities reduces the operational bottlenecks resulting from the overlap of high freight import and export volumes. Additionally, highway development costs are less expensive near hinterland facilities. In many cases, port expansion is very difficult because existing ports are congested, over capacitated, and adjacent land is very expensive. Conversely, capacity expansion and building infrastructure is less costly near inland intermodal facilities. 2.2.3. Efficient Customs Handling When cargo enters a freight terminal from a foreign country, it must go through a prescribed series of steps in order to be cleared for transport and delivery. These steps include: valuation of goods, verification of company information and freight, payment of duties, and physical inspection. All of these processes accumulate non-value adding time in transport and can take anywhere from a couple of hours to several days, depending on the amount of freight waiting for inspection. U.S. Customs and Border Protection clearance can take anywhere from 1-3 business days for air freight and 3-5 business for ocean freight. If freight is selected for intensive inspection the customs clearing process could increase by an additional 5-10 business days. Satellite terminals offer the opportunity for bonded freight to move through a terminal without being inspected until it reaches an inland or adjacent satellite terminal. This process simplification improves efficiency and speed of time critical deliveries (Harrison, 2002). The customs clearing process requires that freight wait for its inspection and clearance on the docks. This space could be devoted to more economical uses if customs clearing procedures were located in inland port facilities.
Triple-Bottom Line Assessment of Future Mississippi Intermodal Facility Page 26
2.2.4. Enhanced Security The current global political environment has required companies to step up efforts for increased security of freight shipments. The U.S. and European Union (EU) have increased cooperation efforts to ensure minimum security requirements are met by participating seaports. Initiatives such as U.S.-EU Customs Agreement (2004) have established information exchange networks, setting minimum security requirements for participating seaports, and identifying the best methods for preventing terrorist attacks within the global supply chain. This accord seeks to improve security by ensuring (1) that customs procedures and legitimate trade take security into account, and (2) that equal standards apply to both U.S. and EU transport companies (Meier 2004). In addition to global efforts for risk mitigation, the Federal Highway Administration (FHWA) has aggressively researched technology to improve freight identification method and increase freight security while in transit. They have tested a number of technologies for future application to include: Electronic Supply Chain Manifest (ESCM), electronic seals, and asset cargo tracking software. These efforts to increase freight security will have several implications for inland port terminals. Inland ports will need to provide adequate security to ensure that cargo and personnel are properly protected while within the confines of the facility. Port officials will need to partner with the appropriate governmental security agencies, such as the Transportation Security Agency and Department of Homeland Security, in order to establish security procedures and protocol. Since 9/11 there have been calls to inspect 100 percent inspection of all inbound cargo containers for weapons of mass destruction. A RAND study concludes that 100 percent inspection would be warranted only if the threat of damage from potential terrorism was quite high (Martonosi, Ortiz, and Willis, 2005). Another view is that 100 percent screening would be expensive and impractical, not in keeping with the threat and seen as more costly than the potential risk. Nonetheless, security is an issue that needs to be considered for IFFs. The trend in maritime ports is to establish satellite terminals in the hinterland to avoid congestion in coastal areas, the high cost of coastal land, and increasing levels of pollution near the ports. These facilities serve many of the functions traditionally conducted by ports including custom clearance, consolidation, warehousing, and inspection. However, the security and preparedness of these cargo handling facilities, as opposed to the major maritime ports, is uneven. As one security official pointed out, “For the majority of facilities we deal with, we are back in the stone age. Predominantly, the only tools we have at our disposal are lights, fences, locks and general employee vigilance” (Bedell, 2008, p 275). Thus, security is an issue at the numerous inland ports currently serve major ports and the many more are being developed. An example of an existing facility is the Virginia Inland Port (VIP) located 220 miles from the Port of Norfolk. Examples of satellite facilities being developed include inland ports for the Port of Gulfport, the Port of the Everglades, and the Port of Savannah. There are various management models for these inland ports including being led by port authorities, private land developers, and carriers such as railroads, but all of them face similar security concerns. There are examples of advanced technology and sophisticated command centers in place for some facilities. The Lazaro Cardenas-Kansas City Corridor Security Screening process is an
Triple-Bottom Line Assessment of Future Mississippi Intermodal Facility Page 27
example where shipments are pre-screened in the foreign port and the shipper is sent advance notification to Mexican and American Customs with the corresponding “pre-clearance” information on the cargo. Upon arrival in Mexico, containers pass through X-ray and gamma ray screenings, allowing any containers with anomalies to quickly be removed for further inspection. Container shipments are tracked using intelligent transportation systems (ITS) including global positioning systems (GPS) or radio frequency identification systems (RFID) and monitored by the ITS on their way to inland intermodal facility in Kansas City. Union Pacific's Salt Lake City Intermodal Terminal has eight-foot security fencing, remote camera system and lighting to provide a secure, theft-resistant environment for customers' cargo while at the terminal. It also has an Automated Gate System (AGS) with biometric technology employed to expedite ingate/outgate process. These security investments are becoming necessary to ensure customers that their cargo is safe and meet homeland security requirements. A secure inland port would allow containers to be:
1. "Sealed" as they are offloaded in maritime port 2. Transported via a secure rail to the hinterland facility 3. Offloaded from the rail line in a secure yard to line up for customs 4. "Un-sealed" and released to be loaded onto rails and trucks for transportation elsewhere
In conjunction with this there would need to be
1. A terminal for container scanning and sealing in the maritime port 2. Sensors along the tracks to detect tampering 3. A secure rail yard with matching container scanning technology and customs office 4. A command and control center that links the inland port to the main maritime port 5. Coordination with local law enforcement 6. An educational program to compliment the new secure corridor
The enhanced freight security presents challenges and opportunities for IFFs that serve sea ports. 2.2.5. Improved Connectivity (Network Analysis) Strategically placed intermodal hubs provide an opportunity for companies to meet the demand of the market place with flexibility. Companies are able to choose the most efficient modes or combination thereof for transporting goods to customers depending on the shipping requirements. The availability of multiple modes can facilitate more frequent, faster, more reliable, and competitively priced services (Harrison, 2002). This concept becomes critical as manufacturers are increasingly shifting to a time sensitive inventory systems, such as Just-in –time (JIT). JIT is a common production part supply model used to provide the right quantity of quality parts to the assembly line at the right time and in the exact sequence required (Lee, et al 2007). Inventory systems such as JIT minimize the amount of inventory on hand for manufacturers and distributors. Minimum inventories on hand emphasize the need for concise shipment timelines and provide only a slim margin for error. Therefore, shipping companies must improve their processes to consolidate freight shipments from far reaching ports of origin. Intermodal hubs serve this function by consolidating flows from the same origin with different destinations with those freight flows that have different origins but the same destinations
Triple-Bottom Line Assessment of Future Mississippi Intermodal Facility Page 28
(Alumar, 2006). Greater supply chain connectivity allows for companies to consolidate and ship freight by most cost effective means. 2.2.6. Intermodal Facility Location The Transportation Research Board (TRB) has sponsored several projects addressing critical issues in freight transportation. One that is particularly pertinent to this study is the National Cooperative Freight Research Program (NCFRP) Report 13, Freight Facility Location Selection: A Guide for Public Officials (2011) This report addresses location selection criteria, location screening process using those criteria, and the impact of best selection on the economy. As mentioned earlier, a careful selection of an intermodal facility can influence its maximum logistical and economic impact. Intermodal facilities are capable of providing significant economic benefits for companies operating such facilities. However, the selection of facility location is a critical matter for maximizing these benefits. Critical criteria for site selection include cost-to-benefit ratio, environmental impacts, and material flow densities. Potential facility locations must have a combination of assets available in order to provide an ideal location for an intermodal hub facility. According to NCFRP Report 13 and Poist and Walter study (2003), the ideal intermodal facility location must have the following:
Adequate transportation infrastructure, Proximity to primary markets, Geographic advantage, Presence of larger freight shippers State-of-the-art information infrastructure, Permitting and regulations Adequate support from the surround community to foster growth and propel the facility
and surrounding location into further development. Highly skilled logistics personnel, which are often found near U.S. military bases, are
another consideration. There are a variety of models for determining the optimal location for intermodal hub locations. The first of which is the agent based model developed by Ferreira, et al. (2007). This model is based on the assumption that location of intermodal hubs is a critical factor in operations success. The agent based modeling theory combines the interest of four dominant agents, namely, hub owners or operators, transport network infrastructure providers, hub users, and communities (Ferreira 2007). Bergqvist and Tornburg (2006) approach intermodal hub site selection by combining the interest of public and private entities by focusing on the economic and environmental (noise and vehicle emissions) interests of each. Their approach to site selection focuses on maximizing cost saving benefits while minimizing the environmental impact of the surrounding populous. Ishfaq and Sox (2010) derived a purely mathematical model for multiple hub site location. The prevailing themes throughout the models are that investors need to carefully consider the method and desired end results when selecting locations for intermodal hubs. Companies must be careful to maintain the delicate balance of cost effectiveness, efficiency improvement, and environmental concerns. An example of the types of requirements to be considered in establishing an intermodal hub is given by the process followed by the Norfolk Southern Railroad when they were looking to
Triple-Bottom Line Assessment of Future Mississippi Intermodal Facility Page 29
establish an intermodal facility along the Heartland Corridor in Virginia (Virginia Department of Rail and Public Transportation, 2008). These requirements included:
The railroad needed to be able to build the facility within their budget of $18m, assuming that Virginia would cover another $25m for connecting infrastructure.
The site needed to be a good railroad location along the east-west rail corridor, not degrade other rail traffic, and have potential to take truck traffic off the highway.
It needed to be easily accessible to an interstate. The railroad wanted 65 flat acres of land and the acreage needed to allow a continuous
track contiguous to the main rail line. It needed to avoid congested areas, have minimal blocking of grade crossings, and
minimize road improvements. The region needed the potential of supplying a sufficient balance of imports and exports. Finally, the intermodal facility needed to be an effective distance from the port to make
rail economical over truck. Similarsite selection criteria were used by NS to select its East Tennessee Terminal: Adjacent to the main line
Flat or gently rolling and minimally developed land Minimal highway/rail grade crossings Convenient access to Interstate highways Expansion potential for additional economic development
There are locations that potentially most of these criteria in the South Mississippi region, albeit the lack for existing large freight shippers and proximity to primary markets is a concern. Specific types of intermodal facilities have additional requirements. Inland ports or dry ports are intermodal facilities designed to service a maritime port from a hinterland location. They are designed to avoid the bottlenecks that arise from trying to position incoming and outgoing goods near the maritime port. The goal of an inland port is to achieve maximum efficiency for freight cargo by avoiding or bypassing congestion associated with the adjacent roadway and rail systems linking to seaports. These intermodal facilities are typically connected by a dedicated rail line that originates on-dock at the container terminal. The location criteria for these facilities include (Jones Lang LaSalle IP, 2011, p2):
Market proximity to at least 3 million people within 200 miles. A major, direct connection to an American seaport via a Class I railroad. This rail
corridor forms the “stem” of the coastal port/inland port barbell, as dedicated container trains—often comprising upwards of 250 double-stack cars—run steadily between the two locations. Some inland ports primarily serve one corresponding seaport, using one Class I railroad.
Foreign Trade Zone (FTZ) status and privileges. An abundance of reasonably priced commercial real estate for warehousing and
distribution, relative to the East and West Coasts. An overall governing body or at least a consortium of stakeholders collaborating in a
cohesive management plan for the overall effectiveness of the inland port.
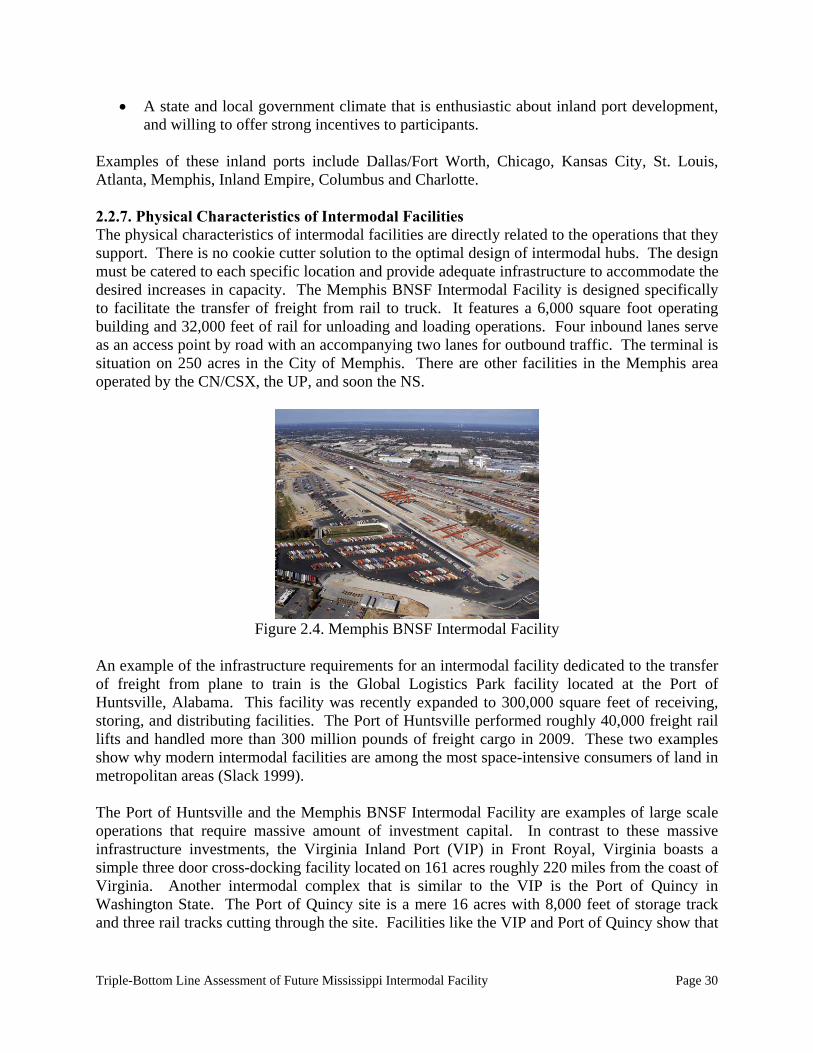
Triple-Bottom Line Assessment of Future Mississippi Intermodal Facility Page 30
A state and local government climate that is enthusiastic about inland port development, and willing to offer strong incentives to participants.
Examples of these inland ports include Dallas/Fort Worth, Chicago, Kansas City, St. Louis, Atlanta, Memphis, Inland Empire, Columbus and Charlotte. 2.2.7. Physical Characteristics of Intermodal Facilities The physical characteristics of intermodal facilities are directly related to the operations that they support. There is no cookie cutter solution to the optimal design of intermodal hubs. The design must be catered to each specific location and provide adequate infrastructure to accommodate the desired increases in capacity. The Memphis BNSF Intermodal Facility is designed specifically to facilitate the transfer of freight from rail to truck. It features a 6,000 square foot operating building and 32,000 feet of rail for unloading and loading operations. Four inbound lanes serve as an access point by road with an accompanying two lanes for outbound traffic. The terminal is situation on 250 acres in the City of Memphis. There are other facilities in the Memphis area operated by the CN/CSX, the UP, and soon the NS.
Figure 2.4. Memphis BNSF Intermodal Facility
An example of the infrastructure requirements for an intermodal facility dedicated to the transfer of freight from plane to train is the Global Logistics Park facility located at the Port of Huntsville, Alabama. This facility was recently expanded to 300,000 square feet of receiving, storing, and distributing facilities. The Port of Huntsville performed roughly 40,000 freight rail lifts and handled more than 300 million pounds of freight cargo in 2009. These two examples show why modern intermodal facilities are among the most space-intensive consumers of land in metropolitan areas (Slack 1999). The Port of Huntsville and the Memphis BNSF Intermodal Facility are examples of large scale operations that require massive amount of investment capital. In contrast to these massive infrastructure investments, the Virginia Inland Port (VIP) in Front Royal, Virginia boasts a simple three door cross-docking facility located on 161 acres roughly 220 miles from the coast of Virginia. Another intermodal complex that is similar to the VIP is the Port of Quincy in Washington State. The Port of Quincy site is a mere 16 acres with 8,000 feet of storage track and three rail tracks cutting through the site. Facilities like the VIP and Port of Quincy show that
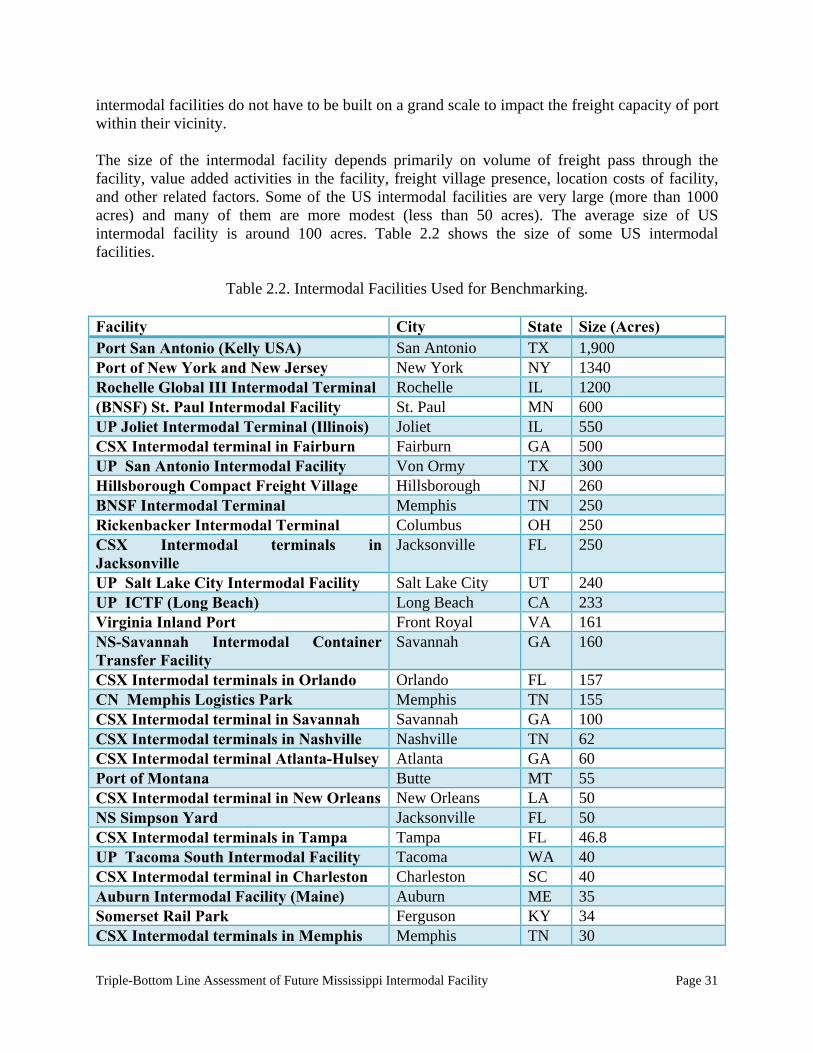
Triple-Bottom Line Assessment of Future Mississippi Intermodal Facility Page 31
intermodal facilities do not have to be built on a grand scale to impact the freight capacity of port within their vicinity. The size of the intermodal facility depends primarily on volume of freight pass through the facility, value added activities in the facility, freight village presence, location costs of facility, and other related factors. Some of the US intermodal facilities are very large (more than 1000 acres) and many of them are more modest (less than 50 acres). The average size of US intermodal facility is around 100 acres. Table 2.2 shows the size of some US intermodal facilities.
Table 2.2. Intermodal Facilities Used for Benchmarking. Facility City State Size (Acres) Port San Antonio (Kelly USA) San Antonio TX 1,900 Port of New York and New Jersey New York NY 1340 Rochelle Global III Intermodal Terminal Rochelle IL 1200 (BNSF) St. Paul Intermodal Facility St. Paul MN 600 UP Joliet Intermodal Terminal (Illinois) Joliet IL 550 CSX Intermodal terminal in Fairburn Fairburn GA 500 UP San Antonio Intermodal Facility Von Ormy TX 300 Hillsborough Compact Freight Village Hillsborough NJ 260 BNSF Intermodal Terminal Memphis TN 250 Rickenbacker Intermodal Terminal Columbus OH 250 CSX Intermodal terminals in Jacksonville
Jacksonville FL 250
UP Salt Lake City Intermodal Facility Salt Lake City UT 240 UP ICTF (Long Beach) Long Beach CA 233 Virginia Inland Port Front Royal VA 161 NS-Savannah Intermodal Container Transfer Facility
Savannah
GA 160
CSX Intermodal terminals in Orlando Orlando FL 157 CN Memphis Logistics Park Memphis TN 155 CSX Intermodal terminal in Savannah Savannah GA 100 CSX Intermodal terminals in Nashville Nashville TN 62 CSX Intermodal terminal Atlanta-Hulsey Atlanta GA 60 Port of Montana Butte MT 55 CSX Intermodal terminal in New Orleans New Orleans LA 50 NS Simpson Yard Jacksonville FL 50 CSX Intermodal terminals in Tampa Tampa FL 46.8 UP Tacoma South Intermodal Facility Tacoma WA 40 CSX Intermodal terminal in Charleston Charleston SC 40 Auburn Intermodal Facility (Maine) Auburn ME 35 Somerset Rail Park Ferguson KY 34 CSX Intermodal terminals in Memphis Memphis TN 30
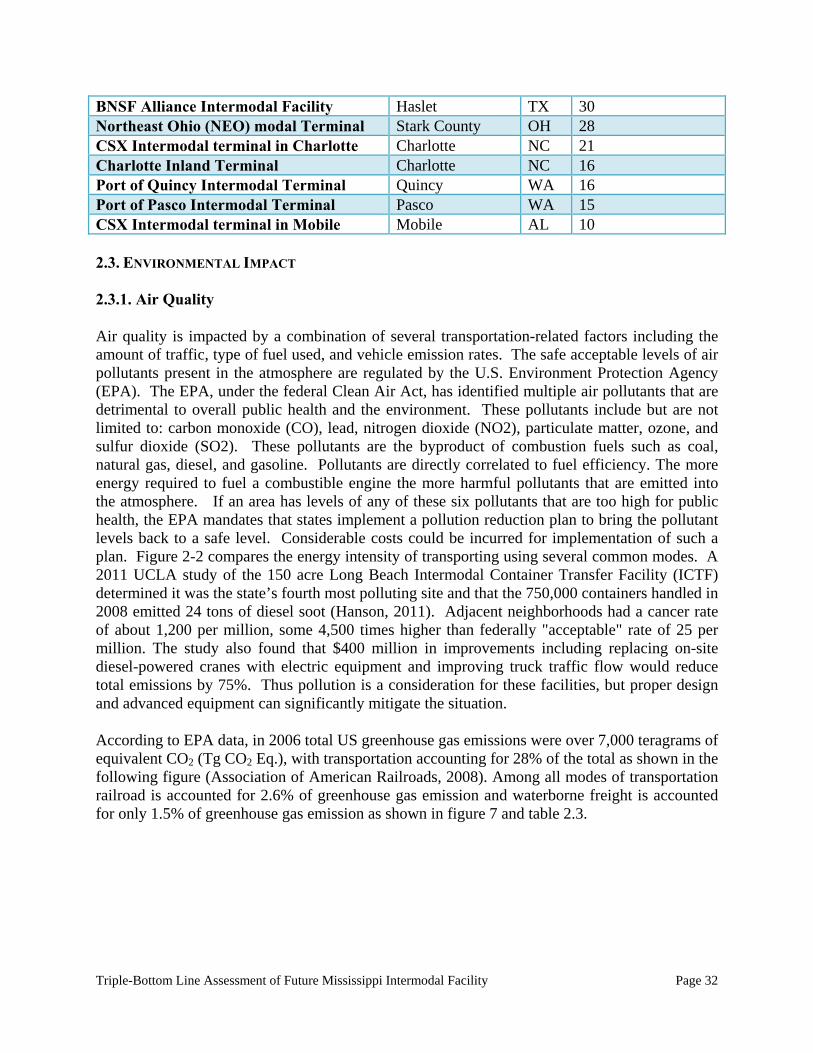
Triple-Bottom Line Assessment of Future Mississippi Intermodal Facility Page 32
BNSF Alliance Intermodal Facility Haslet TX 30 Northeast Ohio (NEO) modal Terminal Stark County OH 28 CSX Intermodal terminal in Charlotte Charlotte NC 21 Charlotte Inland Terminal Charlotte NC 16 Port of Quincy Intermodal Terminal Quincy WA 16 Port of Pasco Intermodal Terminal Pasco WA 15 CSX Intermodal terminal in Mobile Mobile AL 10 2.3. ENVIRONMENTAL IMPACT 2.3.1. Air Quality
Air quality is impacted by a combination of several transportation-related factors including the amount of traffic, type of fuel used, and vehicle emission rates. The safe acceptable levels of air pollutants present in the atmosphere are regulated by the U.S. Environment Protection Agency (EPA). The EPA, under the federal Clean Air Act, has identified multiple air pollutants that are detrimental to overall public health and the environment. These pollutants include but are not limited to: carbon monoxide (CO), lead, nitrogen dioxide (NO2), particulate matter, ozone, and sulfur dioxide (SO2). These pollutants are the byproduct of combustion fuels such as coal, natural gas, diesel, and gasoline. Pollutants are directly correlated to fuel efficiency. The more energy required to fuel a combustible engine the more harmful pollutants that are emitted into the atmosphere. If an area has levels of any of these six pollutants that are too high for public health, the EPA mandates that states implement a pollution reduction plan to bring the pollutant levels back to a safe level. Considerable costs could be incurred for implementation of such a plan. Figure 2-2 compares the energy intensity of transporting using several common modes. A 2011 UCLA study of the 150 acre Long Beach Intermodal Container Transfer Facility (ICTF) determined it was the state’s fourth most polluting site and that the 750,000 containers handled in 2008 emitted 24 tons of diesel soot (Hanson, 2011). Adjacent neighborhoods had a cancer rate of about 1,200 per million, some 4,500 times higher than federally "acceptable" rate of 25 per million. The study also found that $400 million in improvements including replacing on-site diesel-powered cranes with electric equipment and improving truck traffic flow would reduce total emissions by 75%. Thus pollution is a consideration for these facilities, but proper design and advanced equipment can significantly mitigate the situation.
According to EPA data, in 2006 total US greenhouse gas emissions were over 7,000 teragrams of equivalent CO2 (Tg CO2 Eq.), with transportation accounting for 28% of the total as shown in the following figure (Association of American Railroads, 2008). Among all modes of transportation railroad is accounted for 2.6% of greenhouse gas emission and waterborne freight is accounted for only 1.5% of greenhouse gas emission as shown in figure 7 and table 2.3.
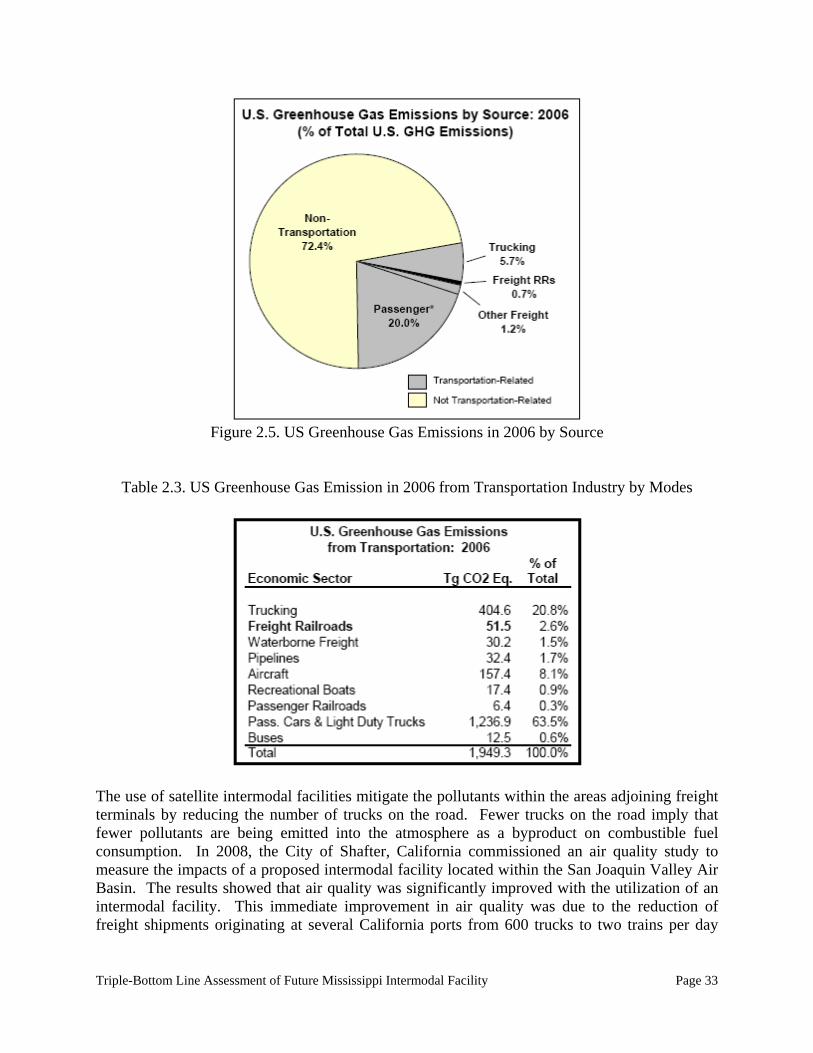
Triple-Bottom Line Assessment of Future Mississippi Intermodal Facility Page 33
Figure 2.5. US Greenhouse Gas Emissions in 2006 by Source
Table 2.3. US Greenhouse Gas Emission in 2006 from Transportation Industry by Modes
The use of satellite intermodal facilities mitigate the pollutants within the areas adjoining freight terminals by reducing the number of trucks on the road. Fewer trucks on the road imply that fewer pollutants are being emitted into the atmosphere as a byproduct on combustible fuel consumption. In 2008, the City of Shafter, California commissioned an air quality study to measure the impacts of a proposed intermodal facility located within the San Joaquin Valley Air Basin. The results showed that air quality was significantly improved with the utilization of an intermodal facility. This immediate improvement in air quality was due to the reduction of freight shipments originating at several California ports from 600 trucks to two trains per day
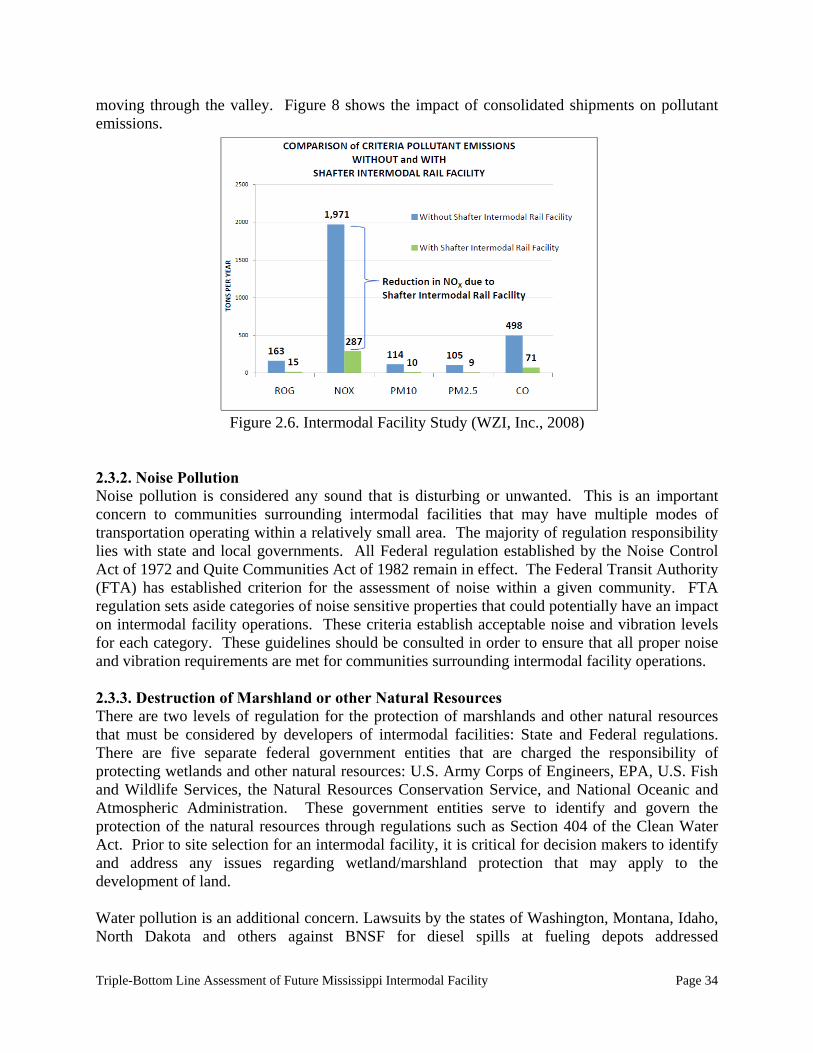
Triple-Bottom Line Assessment of Future Mississippi Intermodal Facility Page 34
moving through the valley. Figure 8 shows the impact of consolidated shipments on pollutant emissions.
Figure 2.6. Intermodal Facility Study (WZI, Inc., 2008)
2.3.2. Noise Pollution Noise pollution is considered any sound that is disturbing or unwanted. This is an important concern to communities surrounding intermodal facilities that may have multiple modes of transportation operating within a relatively small area. The majority of regulation responsibility lies with state and local governments. All Federal regulation established by the Noise Control Act of 1972 and Quite Communities Act of 1982 remain in effect. The Federal Transit Authority (FTA) has established criterion for the assessment of noise within a given community. FTA regulation sets aside categories of noise sensitive properties that could potentially have an impact on intermodal facility operations. These criteria establish acceptable noise and vibration levels for each category. These guidelines should be consulted in order to ensure that all proper noise and vibration requirements are met for communities surrounding intermodal facility operations. 2.3.3. Destruction of Marshland or other Natural Resources There are two levels of regulation for the protection of marshlands and other natural resources that must be considered by developers of intermodal facilities: State and Federal regulations. There are five separate federal government entities that are charged the responsibility of protecting wetlands and other natural resources: U.S. Army Corps of Engineers, EPA, U.S. Fish and Wildlife Services, the Natural Resources Conservation Service, and National Oceanic and Atmospheric Administration. These government entities serve to identify and govern the protection of the natural resources through regulations such as Section 404 of the Clean Water Act. Prior to site selection for an intermodal facility, it is critical for decision makers to identify and address any issues regarding wetland/marshland protection that may apply to the development of land. Water pollution is an additional concern. Lawsuits by the states of Washington, Montana, Idaho, North Dakota and others against BNSF for diesel spills at fueling depots addressed
Triple-Bottom Line Assessment of Future Mississippi Intermodal Facility Page 35
environmental issues related to fuel entering the water supply at locations where refueling is conducted. The large amount of paving associated with the construction of an intermodal facility affects the hydrology of an area. Provisions must be made to insure that an adequate storm water system is in place. A lawsuit filed by environmentalists seeking to block construction of a rail and truck freight transfer facility planned for Edgerton, Kansas was directed at these concerns. 2.4.4. Environmental Review Intermodal facilities are often owned by privately-held railroads and are not as likely to require federal permits and funding as highway projects, and in the past have not tended to trigger National Environmental Policy Act (NEPA) reviews. However, the railroads have begun to take more advantage of government funds so these projects can require a variety of NEPA documents including a Categorical Exclusion (CE), an environmental assessment (EA) or an environmental impact study (EIS). An EA briefly provides sufficient evidence and analysis for determining whether to prepare an EIS. In the summer of 2011, Burk-Kleinpeter, Inc. (BKI), Brown & Mitchell, and HDR engineering conducted the environmental assessment for the KCS $70m upgrade of the line from Gulfport to Hattiesburg to be completed by 2016. They based their assessment on 8 trains per week and found little negative impact. They found that the regional air shed might actually improve by taking trucks off the road. Existing right-of-way had no impact on wetlands. Noise (i.e., wayside, locomotive, and horns) might actually decrease because trains will move faster. The study found traffic impacts to be severe at only one location (Landon Road near Gulfport). MDOT completed its own diagnostic review of crossings based on the current and post upgrade conditions and have made their recommendations to KCS. It is important to note that this study area stopped short of Hattiesburg and did not consider the establishment of an intermodal facility. 2.4.5. Utilization of Green Technology The uses of green technology in intermodal facilities are getting momentum as part of lean and green initiatives. Even though it is evident that newer intermodal facilities are increasingly using various green technologies, a wider implementation data is not available. The success of green technology uses is rarely available. Due to lack of published data, this project couldn’t establish the best practice model for green technologies in the intermodal facility. The following section discusses some specific examples of green technology uses in some specific intermodal facilities. Many new facilities utilize the latest in gate and terminal automation technology, which shortens the waiting time for trucks entering the terminal, thereby reducing exhaust emissions and improving truck driver productivity. Additionally, state-of-the-art, low-emission cranes help reduce environmental impacts. BNSF has adopted electric wide-span cranes at several intermodal facilities that produce zero emissions on site while generating power each time they lower a load. The wide stance design of these new cranes eliminates as many as six diesel trucks (hostlers) for shuttling containers within the intermodal facility, reducing emissions and improving fuel efficiency. In addition to using new ultra low-emissions, EPA-certified diesel switch locomotives, idle-control mechanisms installed on locomotives reduce air emissions and fuel consumption by automatically shutting down locomotives that are not being used. CSX
Triple-Bottom Line Assessment of Future Mississippi Intermodal Facility Page 36
adopted Tideworks Technology, a provider of terminal management and planning software solutions for its operations at its Northwest Ohio intermodal terminal to maximize efficiencies. The 500 acre site promotes its use of cutting-edge technology and green designs, including ultra-efficient electric cranes that lower emissions, optical scanners that reduce truck idle times, and automated car tracking technologies and remote switches that increase operational efficiency. CSX has invested $175 million in the facility that employees more than 200, will service 800 trains per week, and handle an estimated 2 million containers annually. It is not just the equipment that is incorporating green technology. BNSF's proposed Kansas City Intermodal Facility (KCIMF) will also feature LEED certified buildings. The CSX Baltimore-Washington Rail Intermodal Facility will be developed with alternative energy sources, directional lighting, and the latest in storm water management practices. The NS Birmingham Regional Intermodal Facility was selected to participate in the Sustainable Sites Initiative (SITES) pilot program, a national initiative that seeks to establish and encourage sustainable practices throughout each phase of a landscape's design, construction, operation, and maintenance periods. Green is being incorporated in all aspects of the IFFs. It is predicted that many new intermodal terminals will move to denser operations and use stacking cranes instead of placing containers on chassis in vast parking lots. Denser, stacked terminals will require different operating systems, including graphical planning and management software for stacked containers, an effective system for tracking containers and equipment, and a system for automatically sending work orders and confirming that the position of moved containers is accurately recorded to operate efficiently. Following tables summarize types and purposes of green technology uses.
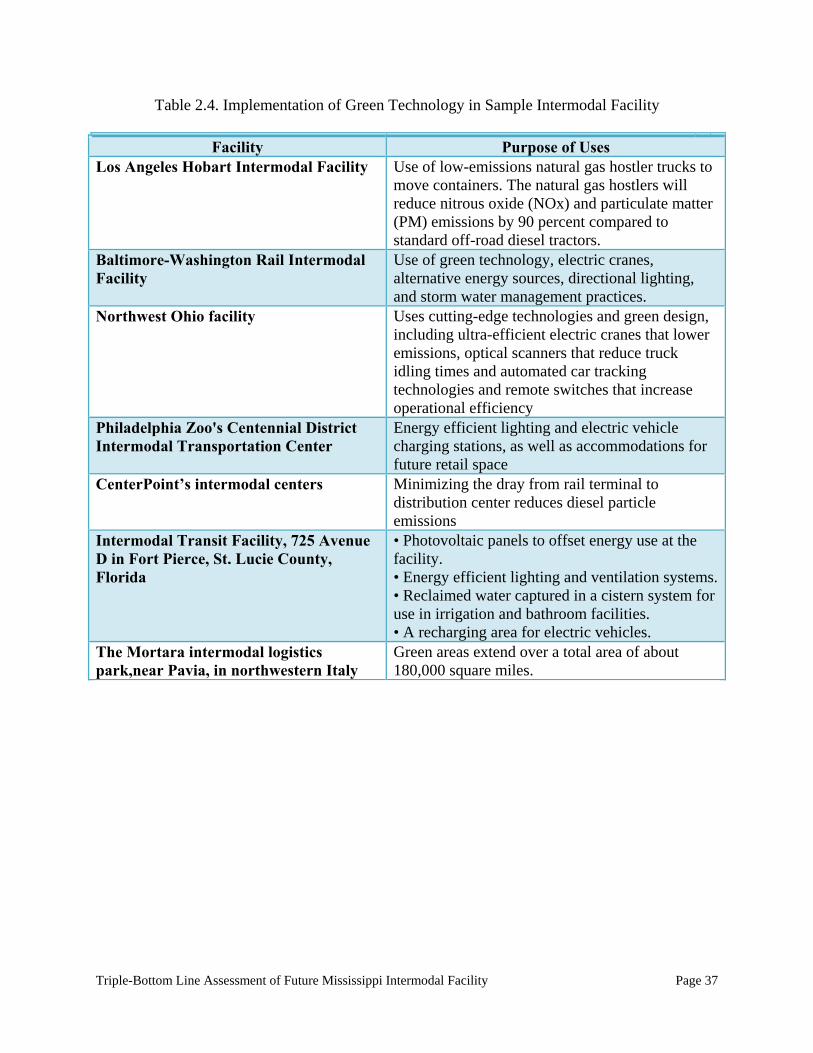
Triple-Bottom Line Assessment of Future Mississippi Intermodal Facility Page 37
Table 2.4. Implementation of Green Technology in Sample Intermodal Facility
Facility Purpose of Uses Los Angeles Hobart Intermodal Facility Use of low-emissions natural gas hostler trucks to
move containers. The natural gas hostlers will reduce nitrous oxide (NOx) and particulate matter (PM) emissions by 90 percent compared to standard off-road diesel tractors.
Baltimore-Washington Rail Intermodal Facility
Use of green technology, electric cranes, alternative energy sources, directional lighting, and storm water management practices.
Northwest Ohio facility Uses cutting-edge technologies and green design, including ultra-efficient electric cranes that lower emissions, optical scanners that reduce truck idling times and automated car tracking technologies and remote switches that increase operational efficiency
Philadelphia Zoo's Centennial District Intermodal Transportation Center
Energy efficient lighting and electric vehicle charging stations, as well as accommodations for future retail space
CenterPoint’s intermodal centers Minimizing the dray from rail terminal to distribution center reduces diesel particle emissions
Intermodal Transit Facility, 725 Avenue D in Fort Pierce, St. Lucie County, Florida
• Photovoltaic panels to offset energy use at the facility. • Energy efficient lighting and ventilation systems.• Reclaimed water captured in a cistern system for use in irrigation and bathroom facilities. • A recharging area for electric vehicles.
The Mortara intermodal logistics park,near Pavia, in northwestern Italy
Green areas extend over a total area of about 180,000 square miles.
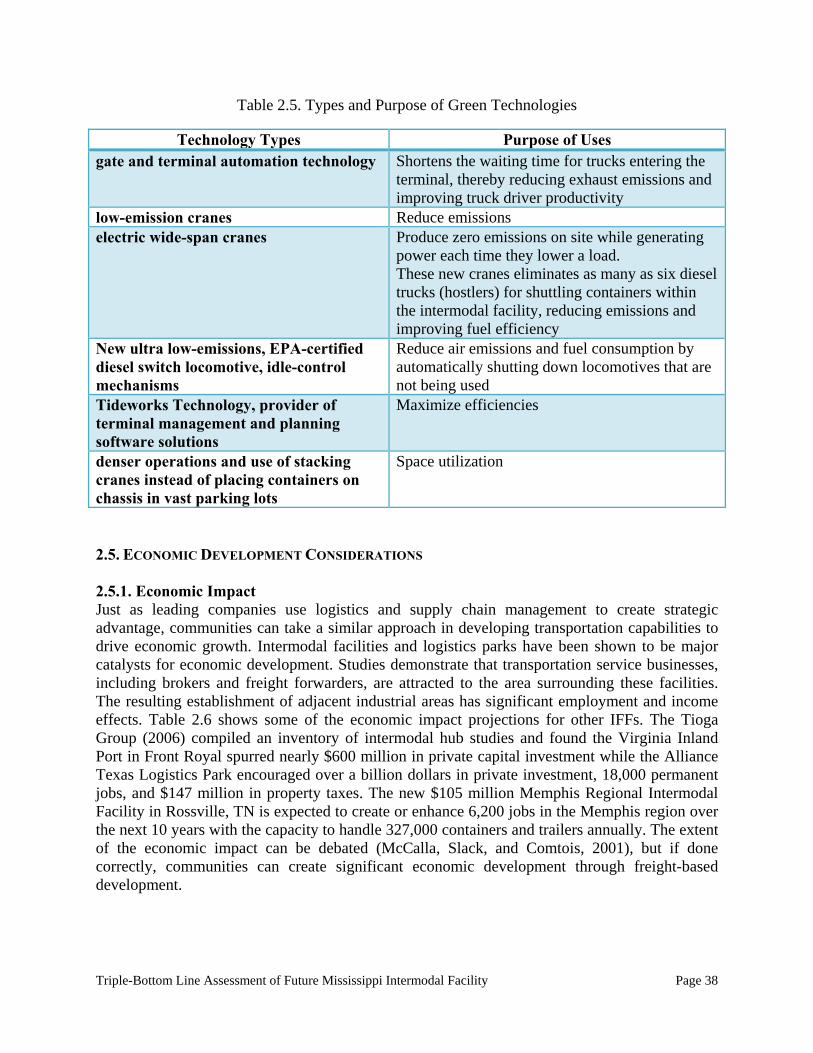
Triple-Bottom Line Assessment of Future Mississippi Intermodal Facility Page 38
Table 2.5. Types and Purpose of Green Technologies
Technology Types Purpose of Uses
gate and terminal automation technology Shortens the waiting time for trucks entering the terminal, thereby reducing exhaust emissions and improving truck driver productivity
low-emission cranes Reduce emissions
electric wide-span cranes Produce zero emissions on site while generating power each time they lower a load. These new cranes eliminates as many as six diesel trucks (hostlers) for shuttling containers within the intermodal facility, reducing emissions and improving fuel efficiency
New ultra low-emissions, EPA-certified diesel switch locomotive, idle-control mechanisms
Reduce air emissions and fuel consumption by automatically shutting down locomotives that are not being used
Tideworks Technology, provider of terminal management and planning software solutions
Maximize efficiencies
denser operations and use of stacking cranes instead of placing containers on chassis in vast parking lots
Space utilization
2.5. ECONOMIC DEVELOPMENT CONSIDERATIONS 2.5.1. Economic Impact Just as leading companies use logistics and supply chain management to create strategic advantage, communities can take a similar approach in developing transportation capabilities to drive economic growth. Intermodal facilities and logistics parks have been shown to be major catalysts for economic development. Studies demonstrate that transportation service businesses, including brokers and freight forwarders, are attracted to the area surrounding these facilities. The resulting establishment of adjacent industrial areas has significant employment and income effects. Table 2.6 shows some of the economic impact projections for other IFFs. The Tioga Group (2006) compiled an inventory of intermodal hub studies and found the Virginia Inland Port in Front Royal spurred nearly $600 million in private capital investment while the Alliance Texas Logistics Park encouraged over a billion dollars in private investment, 18,000 permanent jobs, and $147 million in property taxes. The new $105 million Memphis Regional Intermodal Facility in Rossville, TN is expected to create or enhance 6,200 jobs in the Memphis region over the next 10 years with the capacity to handle 327,000 containers and trailers annually. The extent of the economic impact can be debated (McCalla, Slack, and Comtois, 2001), but if done correctly, communities can create significant economic development through freight-based development.
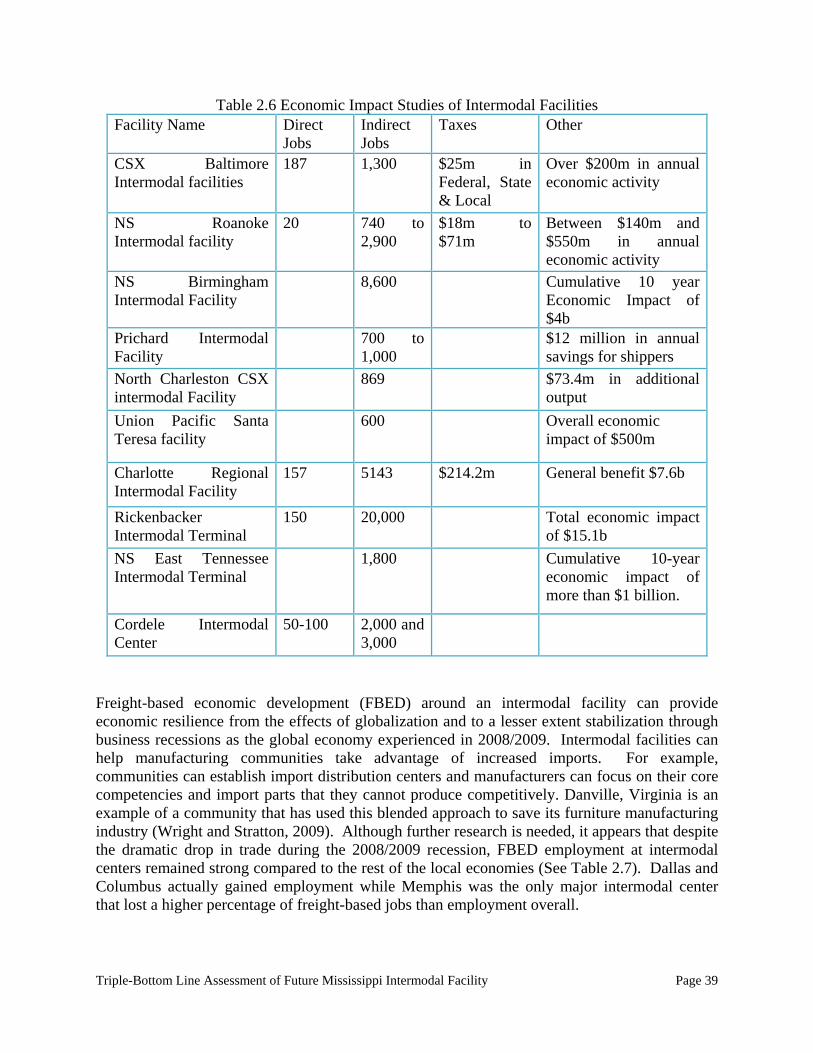
Triple-Bottom Line Assessment of Future Mississippi Intermodal Facility Page 39
Table 2.6 Economic Impact Studies of Intermodal Facilities Facility Name Direct
Jobs Indirect Jobs
Taxes Other
CSX Baltimore Intermodal facilities
187 1,300 $25m in Federal, State & Local
Over $200m in annual economic activity
NS Roanoke Intermodal facility
20 740 to 2,900
$18m to $71m
Between $140m and $550m in annual economic activity
NS Birmingham Intermodal Facility
8,600 Cumulative 10 year Economic Impact of $4b
Prichard Intermodal Facility
700 to 1,000
$12 million in annual savings for shippers
North Charleston CSX intermodal Facility
869 $73.4m in additional output
Union Pacific Santa Teresa facility
600 Overall economic impact of $500m
Charlotte Regional Intermodal Facility
157 5143 $214.2m General benefit $7.6b
Rickenbacker Intermodal Terminal
150 20,000 Total economic impact of $15.1b
NS East Tennessee Intermodal Terminal
1,800 Cumulative 10-year economic impact of more than $1 billion.
Cordele Intermodal Center
50-100 2,000 and 3,000
Freight-based economic development (FBED) around an intermodal facility can provide economic resilience from the effects of globalization and to a lesser extent stabilization through business recessions as the global economy experienced in 2008/2009. Intermodal facilities can help manufacturing communities take advantage of increased imports. For example, communities can establish import distribution centers and manufacturers can focus on their core competencies and import parts that they cannot produce competitively. Danville, Virginia is an example of a community that has used this blended approach to save its furniture manufacturing industry (Wright and Stratton, 2009). Although further research is needed, it appears that despite the dramatic drop in trade during the 2008/2009 recession, FBED employment at intermodal centers remained strong compared to the rest of the local economies (See Table 2.7). Dallas and Columbus actually gained employment while Memphis was the only major intermodal center that lost a higher percentage of freight-based jobs than employment overall.
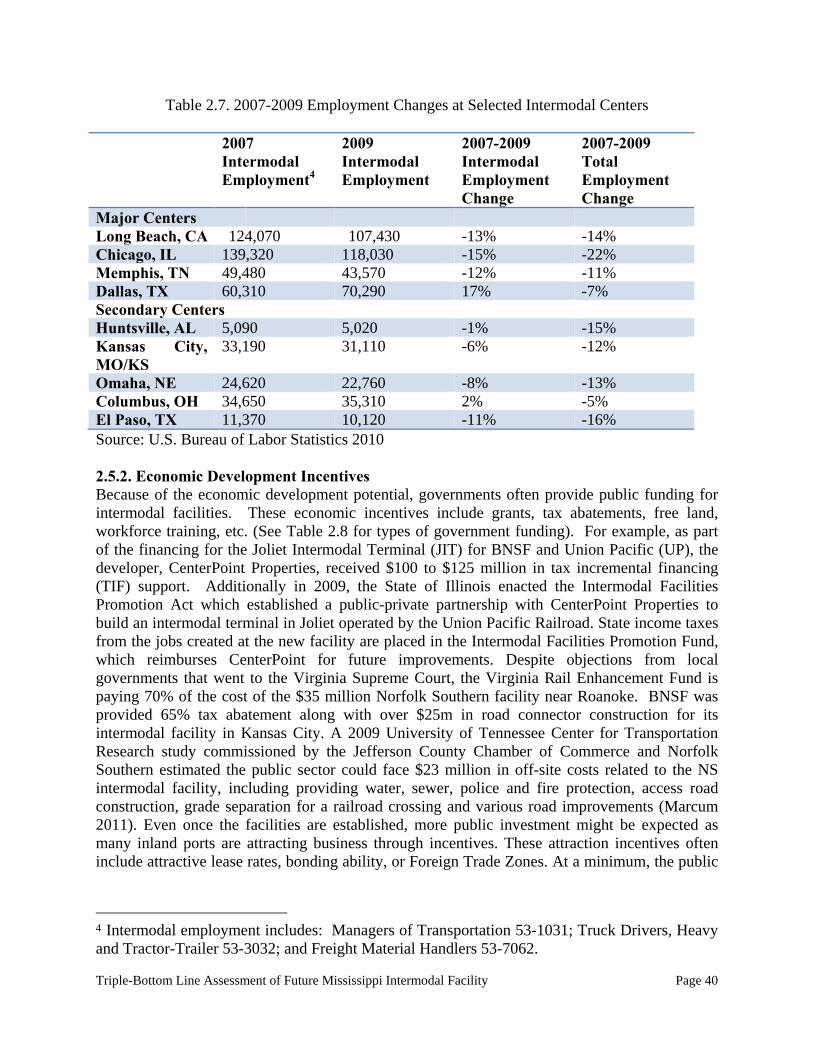
Triple-Bottom Line Assessment of Future Mississippi Intermodal Facility Page 40
Table 2.7. 2007-2009 Employment Changes at Selected Intermodal Centers 2007
Intermodal Employment4
2009 Intermodal Employment
2007-2009 Intermodal Employment Change
2007-2009 Total Employment Change
Major Centers Long Beach, CA 124,070 107,430 -13% -14% Chicago, IL 139,320 118,030 -15% -22% Memphis, TN 49,480 43,570 -12% -11% Dallas, TX 60,310 70,290 17% -7% Secondary Centers Huntsville, AL 5,090 5,020 -1% -15% Kansas City, MO/KS
33,190 31,110 -6% -12%
Omaha, NE 24,620 22,760 -8% -13% Columbus, OH 34,650 35,310 2% -5% El Paso, TX 11,370 10,120 -11% -16% Source: U.S. Bureau of Labor Statistics 2010 2.5.2. Economic Development Incentives Because of the economic development potential, governments often provide public funding for intermodal facilities. These economic incentives include grants, tax abatements, free land, workforce training, etc. (See Table 2.8 for types of government funding). For example, as part of the financing for the Joliet Intermodal Terminal (JIT) for BNSF and Union Pacific (UP), the developer, CenterPoint Properties, received $100 to $125 million in tax incremental financing (TIF) support. Additionally in 2009, the State of Illinois enacted the Intermodal Facilities Promotion Act which established a public-private partnership with CenterPoint Properties to build an intermodal terminal in Joliet operated by the Union Pacific Railroad. State income taxes from the jobs created at the new facility are placed in the Intermodal Facilities Promotion Fund, which reimburses CenterPoint for future improvements. Despite objections from local governments that went to the Virginia Supreme Court, the Virginia Rail Enhancement Fund is paying 70% of the cost of the $35 million Norfolk Southern facility near Roanoke. BNSF was provided 65% tax abatement along with over $25m in road connector construction for its intermodal facility in Kansas City. A 2009 University of Tennessee Center for Transportation Research study commissioned by the Jefferson County Chamber of Commerce and Norfolk Southern estimated the public sector could face $23 million in off-site costs related to the NS intermodal facility, including providing water, sewer, police and fire protection, access road construction, grade separation for a railroad crossing and various road improvements (Marcum 2011). Even once the facilities are established, more public investment might be expected as many inland ports are attracting business through incentives. These attraction incentives often include attractive lease rates, bonding ability, or Foreign Trade Zones. At a minimum, the public
4 Intermodal employment includes: Managers of Transportation 53-1031; Truck Drivers, Heavy and Tractor-Trailer 53-3032; and Freight Material Handlers 53-7062.
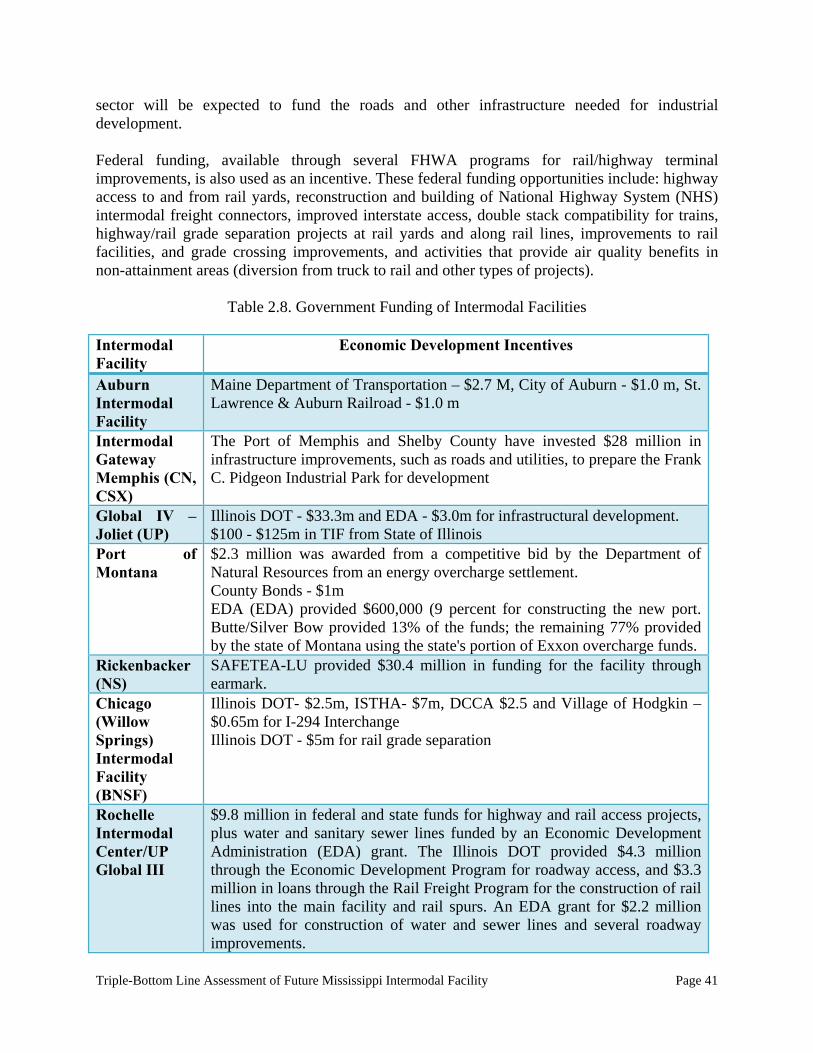
Triple-Bottom Line Assessment of Future Mississippi Intermodal Facility Page 41
sector will be expected to fund the roads and other infrastructure needed for industrial development. Federal funding, available through several FHWA programs for rail/highway terminal improvements, is also used as an incentive. These federal funding opportunities include: highway access to and from rail yards, reconstruction and building of National Highway System (NHS) intermodal freight connectors, improved interstate access, double stack compatibility for trains, highway/rail grade separation projects at rail yards and along rail lines, improvements to rail facilities, and grade crossing improvements, and activities that provide air quality benefits in non-attainment areas (diversion from truck to rail and other types of projects).
Table 2.8. Government Funding of Intermodal Facilities Intermodal Facility
Economic Development Incentives
Auburn Intermodal Facility
Maine Department of Transportation – $2.7 M, City of Auburn - $1.0 m, St. Lawrence & Auburn Railroad - $1.0 m
Intermodal Gateway Memphis (CN, CSX)
The Port of Memphis and Shelby County have invested $28 million in infrastructure improvements, such as roads and utilities, to prepare the Frank C. Pidgeon Industrial Park for development
Global IV – Joliet (UP)
Illinois DOT - $33.3m and EDA - $3.0m for infrastructural development. $100 - $125m in TIF from State of Illinois
Port of Montana
$2.3 million was awarded from a competitive bid by the Department of Natural Resources from an energy overcharge settlement. County Bonds - $1m EDA (EDA) provided $600,000 (9 percent for constructing the new port. Butte/Silver Bow provided 13% of the funds; the remaining 77% provided by the state of Montana using the state's portion of Exxon overcharge funds.
Rickenbacker (NS)
SAFETEA-LU provided $30.4 million in funding for the facility through earmark.
Chicago (Willow Springs) Intermodal Facility (BNSF)
Illinois DOT- $2.5m, ISTHA- $7m, DCCA $2.5 and Village of Hodgkin – $0.65m for I-294 Interchange Illinois DOT - $5m for rail grade separation
Rochelle Intermodal Center/UP Global III
$9.8 million in federal and state funds for highway and rail access projects, plus water and sanitary sewer lines funded by an Economic Development Administration (EDA) grant. The Illinois DOT provided $4.3 million through the Economic Development Program for roadway access, and $3.3 million in loans through the Rail Freight Program for the construction of rail lines into the main facility and rail spurs. An EDA grant for $2.2 million was used for construction of water and sewer lines and several roadway improvements.
Triple-Bottom Line Assessment of Future Mississippi Intermodal Facility Page 42
Somerset Rail Park
$8 million in federal funding from the Federal Highway Administration and the Appalachian Regional Commission
Stark County Neomodal Terminal
ODOT Using ISTEA’s Section 1012 loan provisions and the flexibility afforded by the TE-045 process lent $11.2 million of CMAQ funds to the local agency for 100 percent of total construction costs of the intermodal facility.
Virginia Inland Port
The $10m Virginia Inland Port was made possible by funding available from the Transportation Trust Fund and other smaller public sources.
Port of Quincy
$5.5m State and local funding
Ellis Intermodal Site
Virginia Rail Enhancement Fund paying 70% of cost of $35m NS facility near Roanoke
2.6. VALUE ADDED INTERMODAL FACILITY The uses of intermodal facilities have proven to be a viable means for companies to increase capacity and efficiency within supply chain operations. This section will highlight a number of intermodal facilities from different locations around the country that have proven to successfully provide bottom line benefits for the companies operating them. These are among the top revenue generating facilities for the operators. 1- Virginia Inland Port (Front Royal, VA): The VIP opened its doors for operation in 1989.
The inland port provides direct support for three separate seaports within the state of Virginia, located at Norfolk, Portsmouth, and Newport News. The facility encompasses 161 acres and has 17,820 feet of rail infrastructure on the premises and offers five days a week rail service. The facility is strategically located with within five miles of two interstates (I-66 & I-81). VIP is the largest intermodal facility on the east coast and offers daily train service to more the 25 major metropolitan areas.
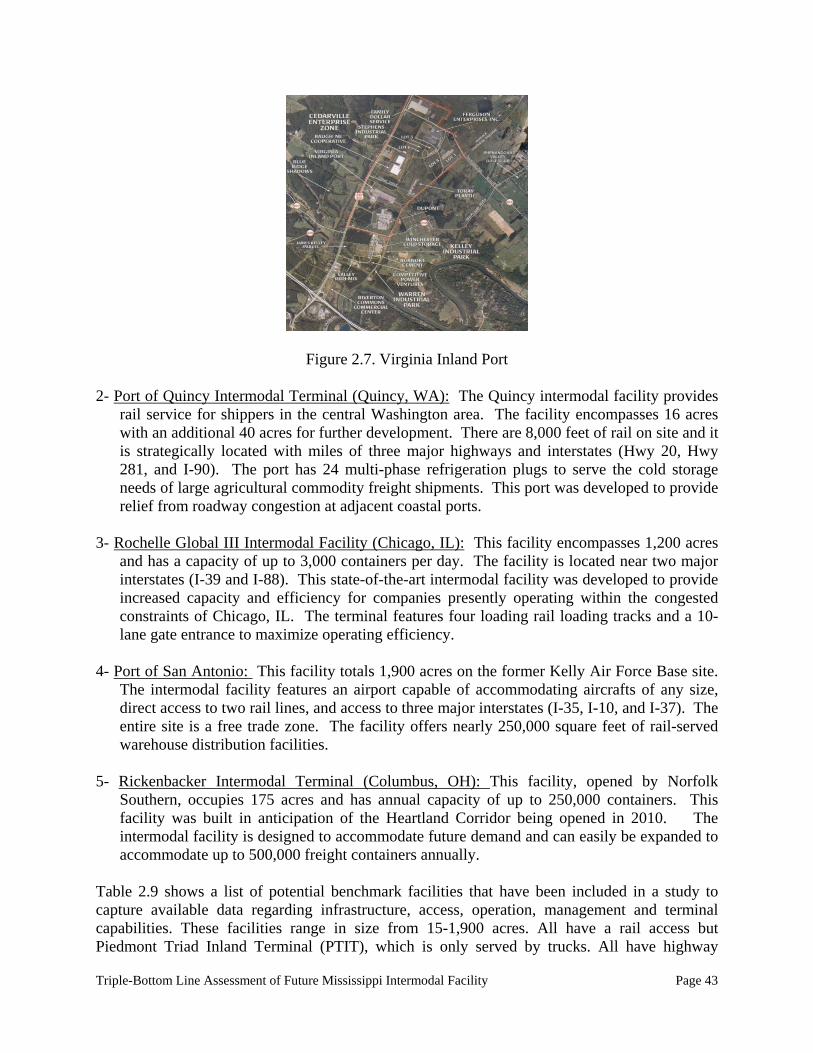
Triple-Bottom Line Assessment of Future Mississippi Intermodal Facility Page 43
Figure 2.7. Virginia Inland Port 2- Port of Quincy Intermodal Terminal (Quincy, WA): The Quincy intermodal facility provides
rail service for shippers in the central Washington area. The facility encompasses 16 acres with an additional 40 acres for further development. There are 8,000 feet of rail on site and it is strategically located with miles of three major highways and interstates (Hwy 20, Hwy 281, and I-90). The port has 24 multi-phase refrigeration plugs to serve the cold storage needs of large agricultural commodity freight shipments. This port was developed to provide relief from roadway congestion at adjacent coastal ports.
3- Rochelle Global III Intermodal Facility (Chicago, IL): This facility encompasses 1,200 acres
and has a capacity of up to 3,000 containers per day. The facility is located near two major interstates (I-39 and I-88). This state-of-the-art intermodal facility was developed to provide increased capacity and efficiency for companies presently operating within the congested constraints of Chicago, IL. The terminal features four loading rail loading tracks and a 10-lane gate entrance to maximize operating efficiency.
4- Port of San Antonio: This facility totals 1,900 acres on the former Kelly Air Force Base site.
The intermodal facility features an airport capable of accommodating aircrafts of any size, direct access to two rail lines, and access to three major interstates (I-35, I-10, and I-37). The entire site is a free trade zone. The facility offers nearly 250,000 square feet of rail-served warehouse distribution facilities.
5- Rickenbacker Intermodal Terminal (Columbus, OH): This facility, opened by Norfolk
Southern, occupies 175 acres and has annual capacity of up to 250,000 containers. This facility was built in anticipation of the Heartland Corridor being opened in 2010. The intermodal facility is designed to accommodate future demand and can easily be expanded to accommodate up to 500,000 freight containers annually.
Table 2.9 shows a list of potential benchmark facilities that have been included in a study to capture available data regarding infrastructure, access, operation, management and terminal capabilities. These facilities range in size from 15-1,900 acres. All have a rail access but Piedmont Triad Inland Terminal (PTIT), which is only served by trucks. All have highway
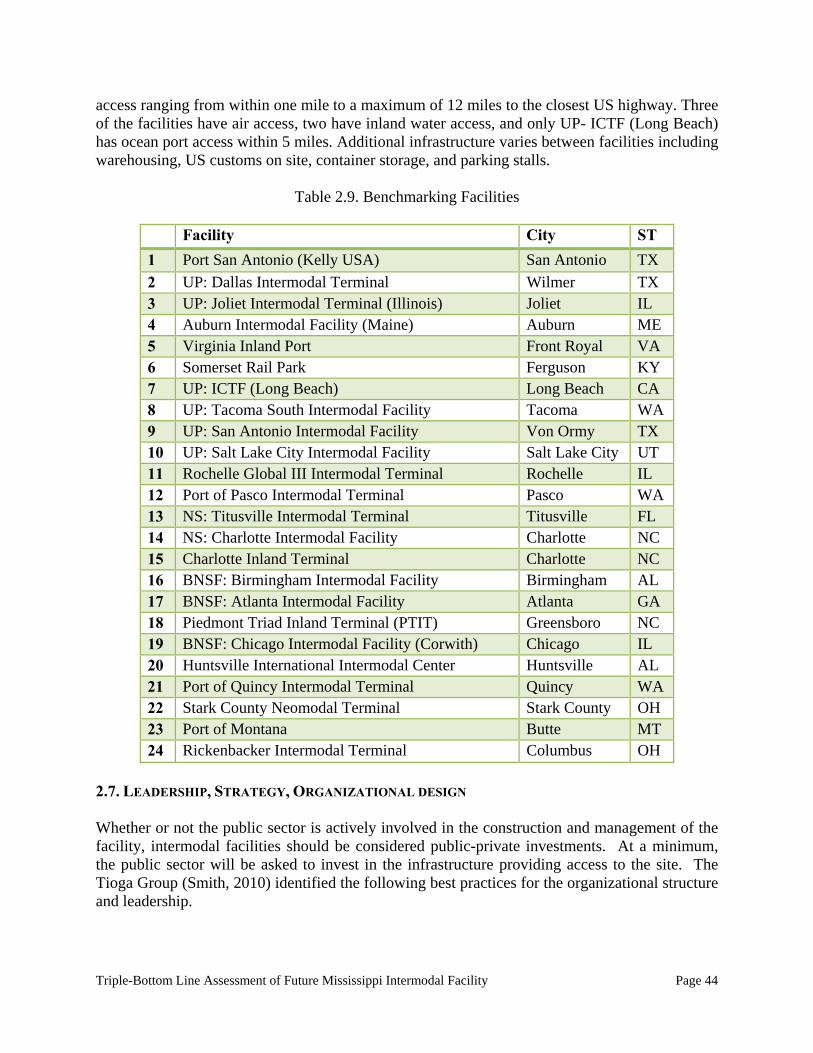
Triple-Bottom Line Assessment of Future Mississippi Intermodal Facility Page 44
access ranging from within one mile to a maximum of 12 miles to the closest US highway. Three of the facilities have air access, two have inland water access, and only UP- ICTF (Long Beach) has ocean port access within 5 miles. Additional infrastructure varies between facilities including warehousing, US customs on site, container storage, and parking stalls.
Table 2.9. Benchmarking Facilities
Facility City ST
1 Port San Antonio (Kelly USA) San Antonio TX
2 UP: Dallas Intermodal Terminal Wilmer TX 3 UP: Joliet Intermodal Terminal (Illinois) Joliet IL 4 Auburn Intermodal Facility (Maine) Auburn ME 5 Virginia Inland Port Front Royal VA 6 Somerset Rail Park Ferguson KY 7 UP: ICTF (Long Beach) Long Beach CA 8 UP: Tacoma South Intermodal Facility Tacoma WA 9 UP: San Antonio Intermodal Facility Von Ormy TX 10 UP: Salt Lake City Intermodal Facility Salt Lake City UT 11 Rochelle Global III Intermodal Terminal Rochelle IL 12 Port of Pasco Intermodal Terminal Pasco WA 13 NS: Titusville Intermodal Terminal Titusville FL 14 NS: Charlotte Intermodal Facility Charlotte NC 15 Charlotte Inland Terminal Charlotte NC 16 BNSF: Birmingham Intermodal Facility Birmingham AL 17 BNSF: Atlanta Intermodal Facility Atlanta GA 18 Piedmont Triad Inland Terminal (PTIT) Greensboro NC 19 BNSF: Chicago Intermodal Facility (Corwith) Chicago IL 20 Huntsville International Intermodal Center Huntsville AL 21 Port of Quincy Intermodal Terminal Quincy WA 22 Stark County Neomodal Terminal Stark County OH 23 Port of Montana Butte MT 24 Rickenbacker Intermodal Terminal Columbus OH
2.7. LEADERSHIP, STRATEGY, ORGANIZATIONAL DESIGN Whether or not the public sector is actively involved in the construction and management of the facility, intermodal facilities should be considered public-private investments. At a minimum, the public sector will be asked to invest in the infrastructure providing access to the site. The Tioga Group (Smith, 2010) identified the following best practices for the organizational structure and leadership.
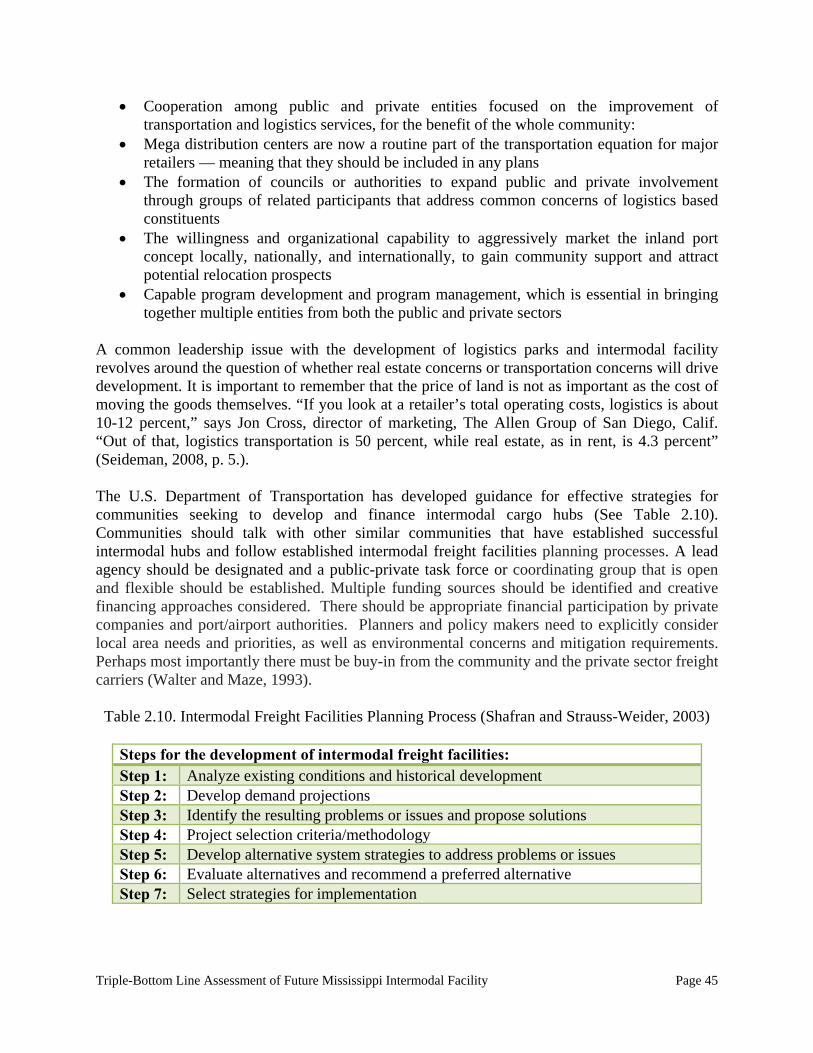
Triple-Bottom Line Assessment of Future Mississippi Intermodal Facility Page 45
Cooperation among public and private entities focused on the improvement of transportation and logistics services, for the benefit of the whole community:
Mega distribution centers are now a routine part of the transportation equation for major retailers — meaning that they should be included in any plans
The formation of councils or authorities to expand public and private involvement through groups of related participants that address common concerns of logistics based constituents
The willingness and organizational capability to aggressively market the inland port concept locally, nationally, and internationally, to gain community support and attract potential relocation prospects
Capable program development and program management, which is essential in bringing together multiple entities from both the public and private sectors
A common leadership issue with the development of logistics parks and intermodal facility revolves around the question of whether real estate concerns or transportation concerns will drive development. It is important to remember that the price of land is not as important as the cost of moving the goods themselves. “If you look at a retailer’s total operating costs, logistics is about 10-12 percent,” says Jon Cross, director of marketing, The Allen Group of San Diego, Calif. “Out of that, logistics transportation is 50 percent, while real estate, as in rent, is 4.3 percent” (Seideman, 2008, p. 5.). The U.S. Department of Transportation has developed guidance for effective strategies for communities seeking to develop and finance intermodal cargo hubs (See Table 2.10). Communities should talk with other similar communities that have established successful intermodal hubs and follow established intermodal freight facilities planning processes. A lead agency should be designated and a public-private task force or coordinating group that is open and flexible should be established. Multiple funding sources should be identified and creative financing approaches considered. There should be appropriate financial participation by private companies and port/airport authorities. Planners and policy makers need to explicitly consider local area needs and priorities, as well as environmental concerns and mitigation requirements. Perhaps most importantly there must be buy-in from the community and the private sector freight carriers (Walter and Maze, 1993).
Table 2.10. Intermodal Freight Facilities Planning Process (Shafran and Strauss-Weider, 2003)
Steps for the development of intermodal freight facilities:Step 1: Analyze existing conditions and historical development Step 2: Develop demand projections Step 3: Identify the resulting problems or issues and propose solutions Step 4: Project selection criteria/methodology Step 5: Develop alternative system strategies to address problems or issues Step 6: Evaluate alternatives and recommend a preferred alternative Step 7: Select strategies for implementation
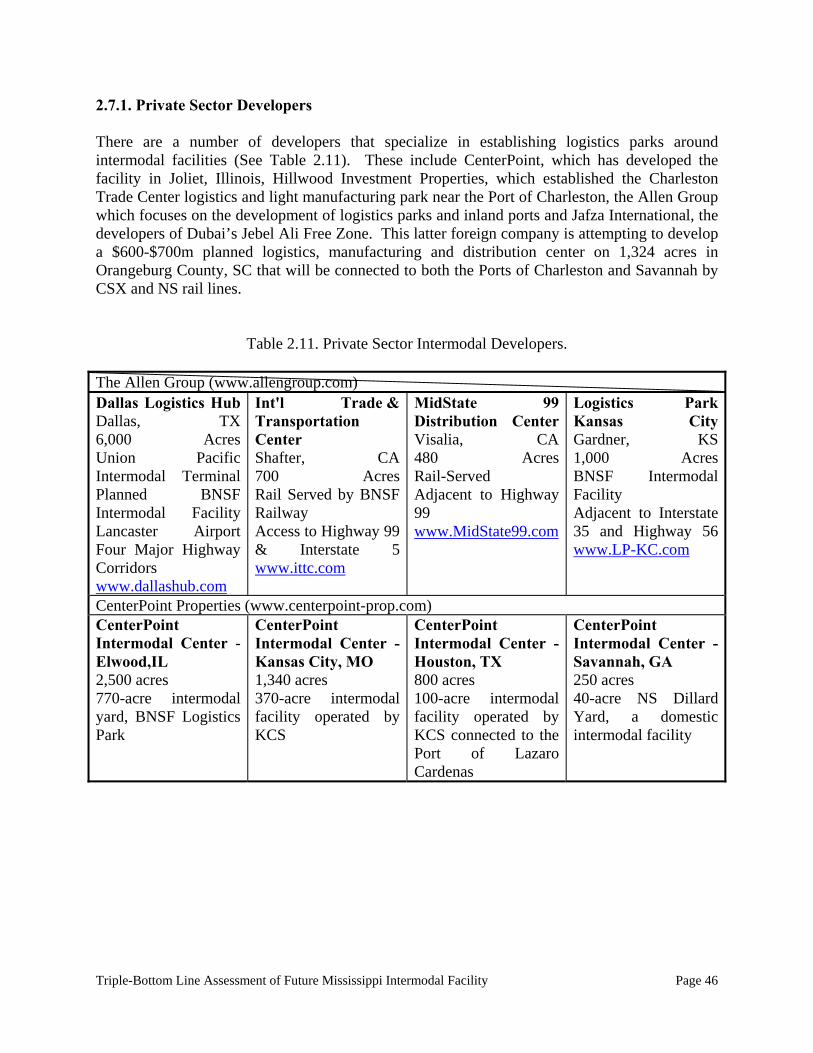
Triple-Bottom Line Assessment of Future Mississippi Intermodal Facility Page 46
2.7.1. Private Sector Developers There are a number of developers that specialize in establishing logistics parks around intermodal facilities (See Table 2.11). These include CenterPoint, which has developed the facility in Joliet, Illinois, Hillwood Investment Properties, which established the Charleston Trade Center logistics and light manufacturing park near the Port of Charleston, the Allen Group which focuses on the development of logistics parks and inland ports and Jafza International, the developers of Dubai’s Jebel Ali Free Zone. This latter foreign company is attempting to develop a $600-$700m planned logistics, manufacturing and distribution center on 1,324 acres in Orangeburg County, SC that will be connected to both the Ports of Charleston and Savannah by CSX and NS rail lines.
Table 2.11. Private Sector Intermodal Developers. The Allen Group (www.allengroup.com) Dallas Logistics Hub Dallas, TX 6,000 Acres Union Pacific Intermodal Terminal Planned BNSF Intermodal Facility Lancaster Airport Four Major Highway Corridors www.dallashub.com
Int'l Trade & Transportation Center Shafter, CA700 AcresRail Served by BNSF Railway Access to Highway 99 & Interstate 5www.ittc.com
MidState 99 Distribution CenterVisalia, CA480 AcresRail-Served Adjacent to Highway 99 www.MidState99.com
Logistics Park Kansas CityGardner, KS1,000 AcresBNSF Intermodal Facility Adjacent to Interstate 35 and Highway 56www.LP-KC.com
CenterPoint Properties (www.centerpoint-prop.com) CenterPoint Intermodal Center - Elwood,IL 2,500 acres 770-acre intermodal yard, BNSF Logistics Park
CenterPoint Intermodal Center - Kansas City, MO 1,340 acres 370-acre intermodal facility operated by KCS
CenterPoint Intermodal Center - Houston, TX 800 acres 100-acre intermodal facility operated by KCS connected to the Port of Lazaro Cardenas
CenterPoint Intermodal Center - Savannah, GA 250 acres 40-acre NS Dillard Yard, a domestic intermodal facility
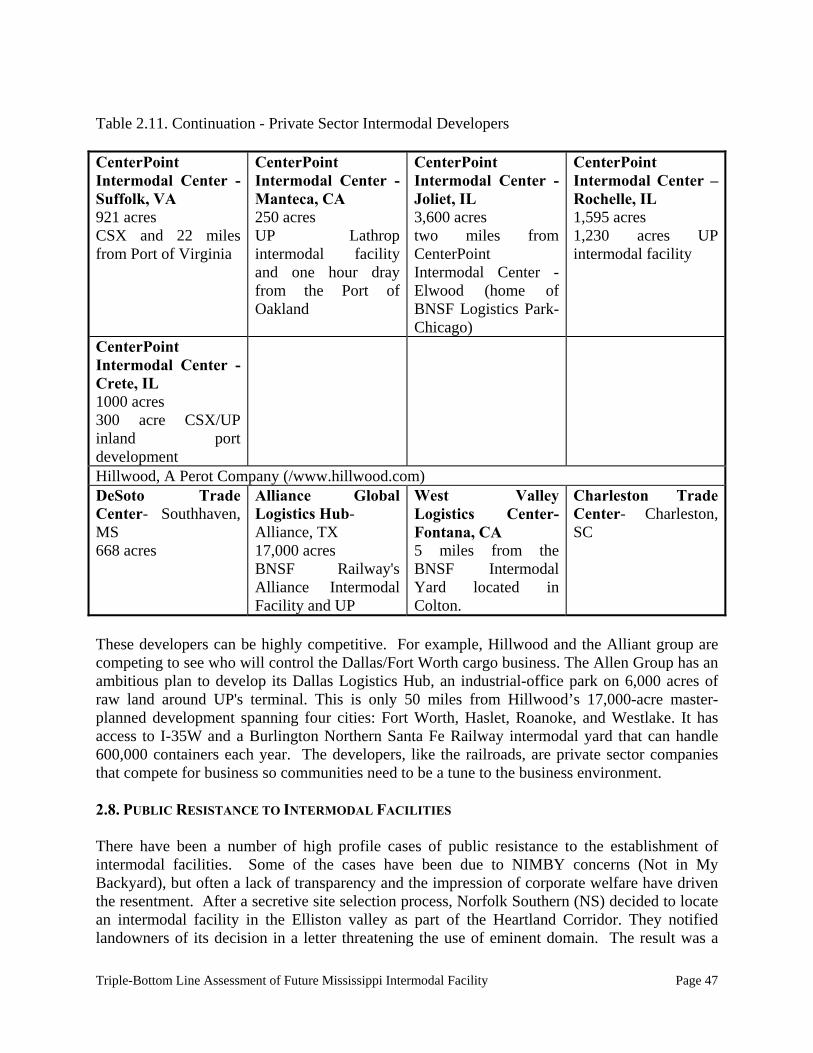
Triple-Bottom Line Assessment of Future Mississippi Intermodal Facility Page 47
Table 2.11. Continuation - Private Sector Intermodal Developers CenterPoint Intermodal Center - Suffolk, VA 921 acres CSX and 22 miles from Port of Virginia
CenterPoint Intermodal Center - Manteca, CA 250 acres UP Lathrop intermodal facility and one hour dray from the Port of Oakland
CenterPoint Intermodal Center - Joliet, IL 3,600 acres two miles from CenterPoint Intermodal Center - Elwood (home of BNSF Logistics Park-Chicago)
CenterPoint Intermodal Center – Rochelle, IL 1,595 acres 1,230 acres UP intermodal facility
CenterPoint Intermodal Center - Crete, IL 1000 acres 300 acre CSX/UP inland port development
Hillwood, A Perot Company (/www.hillwood.com) DeSoto Trade Center- Southhaven, MS 668 acres
Alliance Global Logistics Hub- Alliance, TX 17,000 acres BNSF Railway's Alliance Intermodal Facility and UP
West Valley Logistics Center-Fontana, CA 5 miles from the BNSF Intermodal Yard located in Colton.
Charleston Trade Center- Charleston, SC
These developers can be highly competitive. For example, Hillwood and the Alliant group are competing to see who will control the Dallas/Fort Worth cargo business. The Allen Group has an ambitious plan to develop its Dallas Logistics Hub, an industrial-office park on 6,000 acres of raw land around UP's terminal. This is only 50 miles from Hillwood’s 17,000-acre master-planned development spanning four cities: Fort Worth, Haslet, Roanoke, and Westlake. It has access to I-35W and a Burlington Northern Santa Fe Railway intermodal yard that can handle 600,000 containers each year. The developers, like the railroads, are private sector companies that compete for business so communities need to be a tune to the business environment. 2.8. PUBLIC RESISTANCE TO INTERMODAL FACILITIES There have been a number of high profile cases of public resistance to the establishment of intermodal facilities. Some of the cases have been due to NIMBY concerns (Not in My Backyard), but often a lack of transparency and the impression of corporate welfare have driven the resentment. After a secretive site selection process, Norfolk Southern (NS) decided to locate an intermodal facility in the Elliston valley as part of the Heartland Corridor. They notified landowners of its decision in a letter threatening the use of eminent domain. The result was a
Triple-Bottom Line Assessment of Future Mississippi Intermodal Facility Page 48
massive public relations problem for NS and the Virginia Department of Rail and Public Transportation, as well as a lawsuit from the county trying to prevent the state from paying 70% of the $35 million facility. In North Charleston, SC, the city has pledged to sue the state over the construction of new rail access to a new intermodal facility. NS made county officials sign confidentiality agreements regarding its proposed intermodal transportation hub in Eastern Tennessee, but eventually released officials from the agreements and were required to schedule a public meeting to outline the proposal. Protestors against CSX’s Elkridge Maryland facility claimed despite the Maryland Department of Transportation splitting the estimated $150 million cost of the facility that the selection was not an open and transparent process and there was no way for citizens to know what was being planned (McPherson, 2011). The $112 million NS intermodal facility in McCalla, AL that is forecast to create 8,600 jobs faced protests from residents called “No Hub 4 McCalla.” They were concerned with environmental hazards and the dangers of it being located so close to an elementary school (West Jefferson County Alliance 2011). Those opposing these developments often point out that the intermodal facilities employ very few people directly (e.g., the McCalla facility directly employs 20-25 and the Elliston facility 15-20). A common concern among the opposition is with the increased local truck traffic and the resulting environmental, safety, and road damage. Involving and informing the citizenry in the site selection and development process can be challenging and is antithetical to how railroads typically operate. However, because of the size and nature and significant regional impacts of these developments, it is vital that the public be informed and included in the planning process. This is key to avoiding litigation. 2.9. SUMMARY Intermodal facilities are important components of global supply chains and their importance will grow in the future. . Evidence has already shown that intermodal facilities are crucial to expanding the current capacity of existing port, air, and rail operations. This is demonstrated by massive investments in intermodal facilities such as the Port of San Antonio and the Port of Huntsville. Intermodal facilities are needed to accommodate the growing global volume of imported and exported freight. The primary functions performed within intermodal hubs are crucial activities to realizing these gains in capacity and efficiency in port operations. However, companies operating intermodal facilities must carefully balance the bottom line with environmental concerns. With proper planning and operations, communities hosting intermodal ports facilities will enjoy cleaner air, less traffic congestion, relatively quiet operating facilities, and protection of natural resources.
Triple-Bottom Line Assessment of Future Mississippi Intermodal Facility Page 49
CHAPTER 3. DATA COLLECTION METHODOLOGY 3.1. INTRODUCTION This chapter describes the method used to prepare and administer the questionnaire used to collect data. In order to gather the required data for this study, the USM team in conjunction with the MDOT Technical Advisory Committee developed three online questionnaires to collect data regarding Intermodal Facilities. The questionnaires targeted three groups of people at the Intermodal Facilities. These groups included the General Managers, Logistics Managers and Environmental Compliance Manager. The online questionnaires were developed based on the data requirements to identify triple-bottom Line (Environment, Economic Prosperity and Social Well-Being) of the intermodal facilities. The Triple-Bottom Line (TBL) linked outcomes of the intermodal facility focused on more efficient freight movement (profit), improved air quality and reduced traffic congestions (planet), and economic development and safety (people). The questions enabled the research team to collect the necessary information. Upon completing the online questionnaires, a series of e-mails and follow-ups were sent by the research team to collect all the required data. 3.2. RESEARCH METHODOLOGY LOGISTIC DATA This project utilized a variety of methods to gather information pertaining to intermodal facilities and their locations. Information was gleaned from a number of sources to compose an extensive body of research data to utilize for the research study. These sources are composed of both primary and secondary means of data collection. The primary sources of data collection include expert interviews, industry surveys, and email communication with leading local logistic and economic authorities. The secondary sources include data collection from scholarly journals, digital imaging, and intermodal facility case studies. These secondary sources are all electronic documents. All pertinent sources have been thoroughly cited throughout the body of the research project. This portion of the study will give detailed information regarding the data collection methods for both primary and secondary sources used during the duration of the MDOT commissioned study. 3.3. PRIMARY DATA COLLECTION LOGISTIC DATA Interviews- One means of primary data collection was through interviews of knowledgeable persons regarding specific aspects of logistics operations pertinent to the operations of an inland port. Researchers contacted the Mississippi State Port Authority Deputy Director of Trade Development, Mississippi Trucking Association Director of Safety, MDOT Environmental/Location Division Project Engineer, and management of the Virginia Inland Port. These individuals were selected on the knowledge base as well as reputations in their respective fields. Interviews were conducted via telephone and email communications. Telephone conversations focused on logistics, freight volume and capacity planning, and environmental concerns that each individual has addressed throughout their careers. The knowledge gleaned from the interviews and email communications allowed researchers to broaden the scope of their research data and provided much needed perspectives from within the logistics industry.
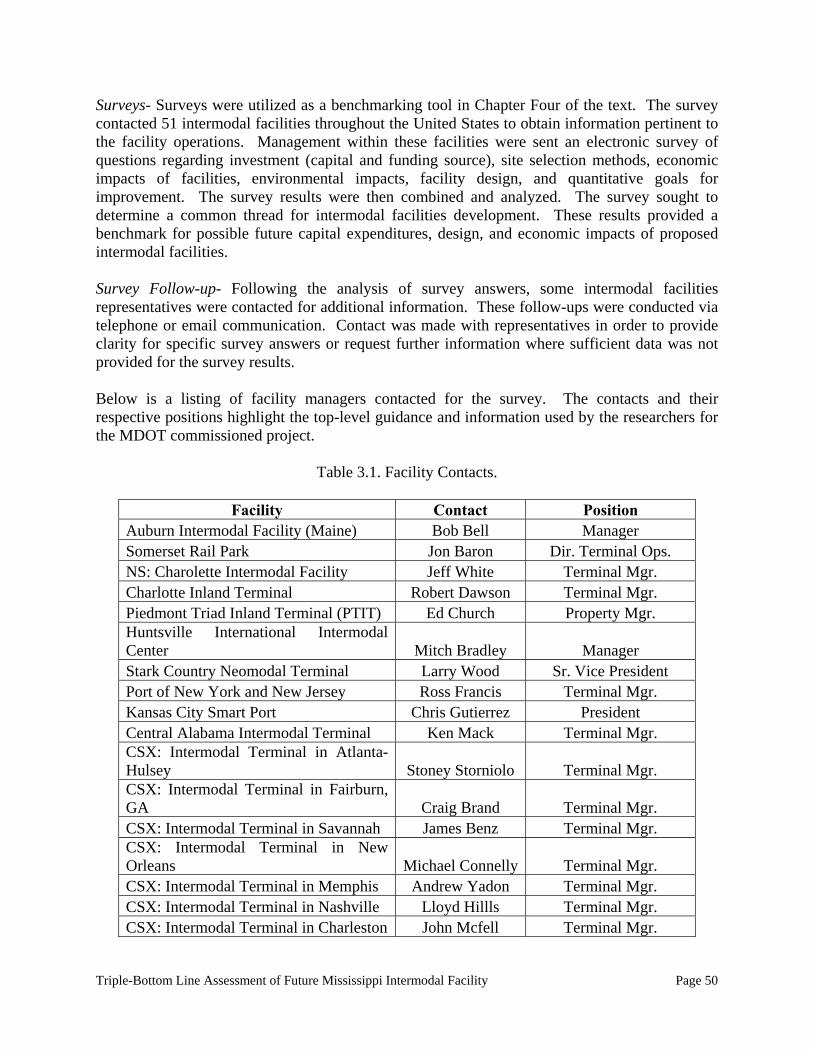
Triple-Bottom Line Assessment of Future Mississippi Intermodal Facility Page 50
Surveys- Surveys were utilized as a benchmarking tool in Chapter Four of the text. The survey contacted 51 intermodal facilities throughout the United States to obtain information pertinent to the facility operations. Management within these facilities were sent an electronic survey of questions regarding investment (capital and funding source), site selection methods, economic impacts of facilities, environmental impacts, facility design, and quantitative goals for improvement. The survey results were then combined and analyzed. The survey sought to determine a common thread for intermodal facilities development. These results provided a benchmark for possible future capital expenditures, design, and economic impacts of proposed intermodal facilities. Survey Follow-up- Following the analysis of survey answers, some intermodal facilities representatives were contacted for additional information. These follow-ups were conducted via telephone or email communication. Contact was made with representatives in order to provide clarity for specific survey answers or request further information where sufficient data was not provided for the survey results. Below is a listing of facility managers contacted for the survey. The contacts and their respective positions highlight the top-level guidance and information used by the researchers for the MDOT commissioned project.
Table 3.1. Facility Contacts.
Facility Contact Position
Auburn Intermodal Facility (Maine) Bob Bell Manager Somerset Rail Park Jon Baron Dir. Terminal Ops. NS: Charolette Intermodal Facility Jeff White Terminal Mgr. Charlotte Inland Terminal Robert Dawson Terminal Mgr. Piedmont Triad Inland Terminal (PTIT) Ed Church Property Mgr. Huntsville International Intermodal Center Mitch Bradley Manager Stark Country Neomodal Terminal Larry Wood Sr. Vice President Port of New York and New Jersey Ross Francis Terminal Mgr. Kansas City Smart Port Chris Gutierrez President Central Alabama Intermodal Terminal Ken Mack Terminal Mgr. CSX: Intermodal Terminal in Atlanta-Hulsey Stoney Storniolo Terminal Mgr. CSX: Intermodal Terminal in Fairburn, GA Craig Brand Terminal Mgr. CSX: Intermodal Terminal in Savannah James Benz Terminal Mgr. CSX: Intermodal Terminal in New Orleans Michael Connelly Terminal Mgr. CSX: Intermodal Terminal in Memphis Andrew Yadon Terminal Mgr. CSX: Intermodal Terminal in Nashville Lloyd Hillls Terminal Mgr. CSX: Intermodal Terminal in Charleston John Mcfell Terminal Mgr.
Triple-Bottom Line Assessment of Future Mississippi Intermodal Facility Page 51
CSX: Intermodal Terminal in Jacksonville
Neal Wiedermann Terminal Mgr.
CSX: Intermodal Terminal in Orlando John York Terminal Mgr. CSX: Intermodal Terminal in Tampa Jeff Brown Terminal Mgr. CSX: Intermodal Terminal in Charlotte Joe Horton Terminal Mgr.
3.4. SECONDARY DATA COLLECTION LOGISTIC DATA Literature Review- The literature review consisted of researching scholarly journal databases using key words. Terms related to the planning and operations of intermodal facilities were used. Case Studies- The internet was used as the basis for identifying case studies of similar intermodal projects to serve as a point of comparison for the proposed intermodal facility in southern Mississippi. Case studies were collected for both the current TEU capacity operations and proposed increase of up to one million TEU capacity operations. Following identification of benchmarking facilities and their case studies, researchers analyzed case study results and identified information pertinent to facility in southern Mississippi. Mapping Software- Mapping software (Google Earth) was utilized in Chapter 5 as a means of identifying available acreage for the building of proposed intermodal facility locations. Researchers identified sites that were free of federally protected marshlands, all parks and recreation areas, golf courses, USDA forest service lands, US National Parks, and US Game and Fish property. Following the identification of acreage free from said restrictions, the mapping software was used to identify the key logistical characteristics favorable for the MDOT study. These characteristics include access to major highway and interstate systems, rail access, proximity to inland waterways, and airport access. 3.5. ECONOMIC IMPACT METHODOLOGY This focus of this part of the research study was to determine what correlations exist, if any, between characteristics of intermodal facilities and economic development as measured by job growth in transportation-related occupations. Published secondary data sources were used to conduct this investigation. 3.5.1. Sampling of Intermodal Facilities Thirty-nine facilities were selected that have rail-to-truck container transfer facilities and had been open for at least four years so that there would be time for employment impacts to be identified. The sample was screened to ensure that there was broad geographic coverage. While 184 possible intermodal facilities were identified, only 39 facilities met the criteria and had available data.
3.5.2. Dependent Variable: Impact of Transportation Employment Data collected to analyze the economic impact of an intermodal facility for this study included total employment and average annual wage in logistic-related fields in the region three years prior to the opening of the intermodal facility. The three year data was averaged to measure pre-event employment. Data for the period three years after the establishment of the facility was used to measure the impact of the workforce trends. This allowed time for distribution centers and ancillary services to be attracted to the area by the new facility. The three years of post-event
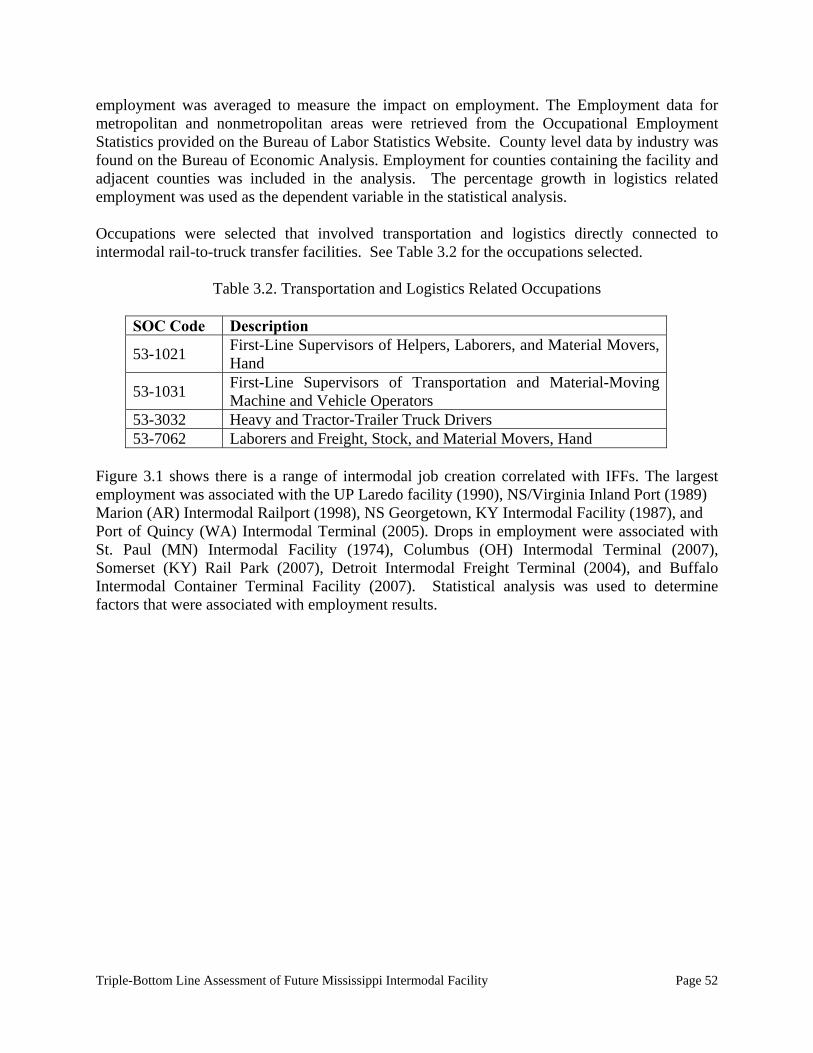
Triple-Bottom Line Assessment of Future Mississippi Intermodal Facility Page 52
employment was averaged to measure the impact on employment. The Employment data for metropolitan and nonmetropolitan areas were retrieved from the Occupational Employment Statistics provided on the Bureau of Labor Statistics Website. County level data by industry was found on the Bureau of Economic Analysis. Employment for counties containing the facility and adjacent counties was included in the analysis. The percentage growth in logistics related employment was used as the dependent variable in the statistical analysis. Occupations were selected that involved transportation and logistics directly connected to intermodal rail-to-truck transfer facilities. See Table 3.2 for the occupations selected.
Table 3.2. Transportation and Logistics Related Occupations
SOC Code Description
53-1021 First-Line Supervisors of Helpers, Laborers, and Material Movers, Hand
53-1031 First-Line Supervisors of Transportation and Material-Moving Machine and Vehicle Operators
53-3032 Heavy and Tractor-Trailer Truck Drivers 53-7062 Laborers and Freight, Stock, and Material Movers, Hand
Figure 3.1 shows there is a range of intermodal job creation correlated with IFFs. The largest employment was associated with the UP Laredo facility (1990), NS/Virginia Inland Port (1989) Marion (AR) Intermodal Railport (1998), NS Georgetown, KY Intermodal Facility (1987), and Port of Quincy (WA) Intermodal Terminal (2005). Drops in employment were associated with St. Paul (MN) Intermodal Facility (1974), Columbus (OH) Intermodal Terminal (2007), Somerset (KY) Rail Park (2007), Detroit Intermodal Freight Terminal (2004), and Buffalo Intermodal Container Terminal Facility (2007). Statistical analysis was used to determine factors that were associated with employment results.
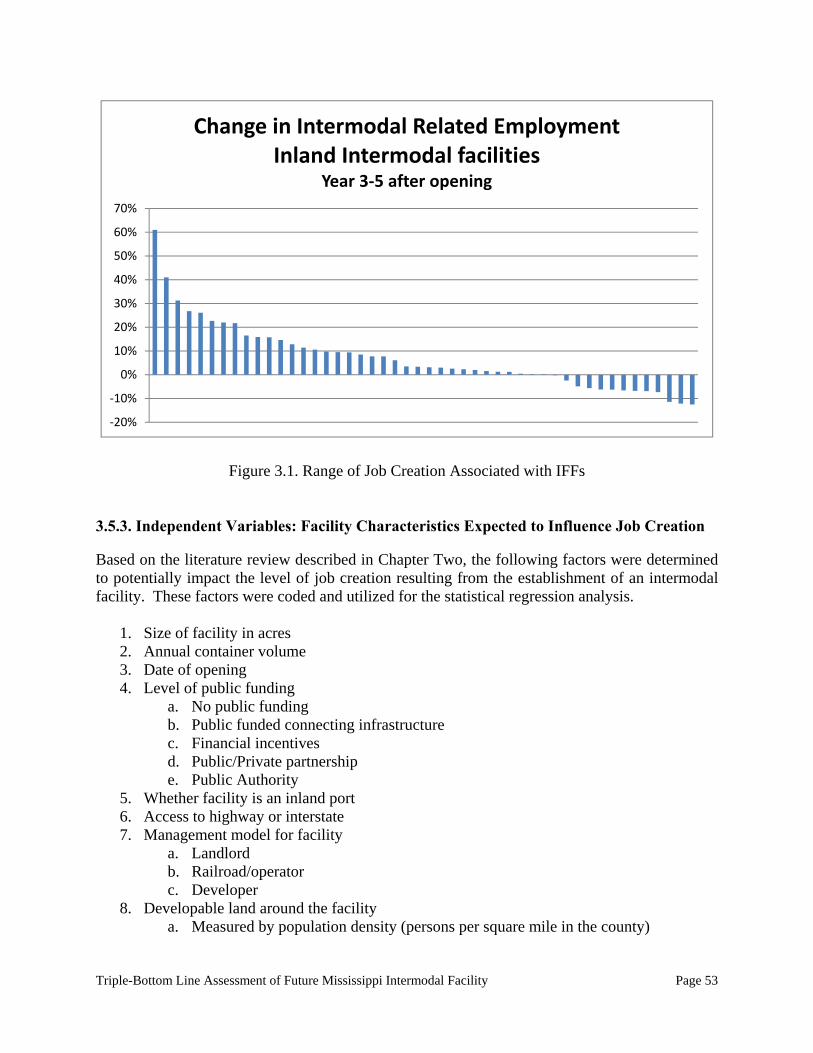
Triple-Bottom Line Assessment of Future Mississippi Intermodal Facility Page 53
‐20%
‐10%
0%
10%
20%
30%
40%
50%
60%
70%
Change in Intermodal Related EmploymentInland Intermodal facilities
Year 3‐5 after opening
Figure 3.1. Range of Job Creation Associated with IFFs
3.5.3. Independent Variables: Facility Characteristics Expected to Influence Job Creation Based on the literature review described in Chapter Two, the following factors were determined to potentially impact the level of job creation resulting from the establishment of an intermodal facility. These factors were coded and utilized for the statistical regression analysis.
1. Size of facility in acres 2. Annual container volume 3. Date of opening 4. Level of public funding
a. No public funding b. Public funded connecting infrastructure c. Financial incentives d. Public/Private partnership e. Public Authority
5. Whether facility is an inland port 6. Access to highway or interstate 7. Management model for facility
a. Landlord b. Railroad/operator c. Developer
8. Developable land around the facility a. Measured by population density (persons per square mile in the county)
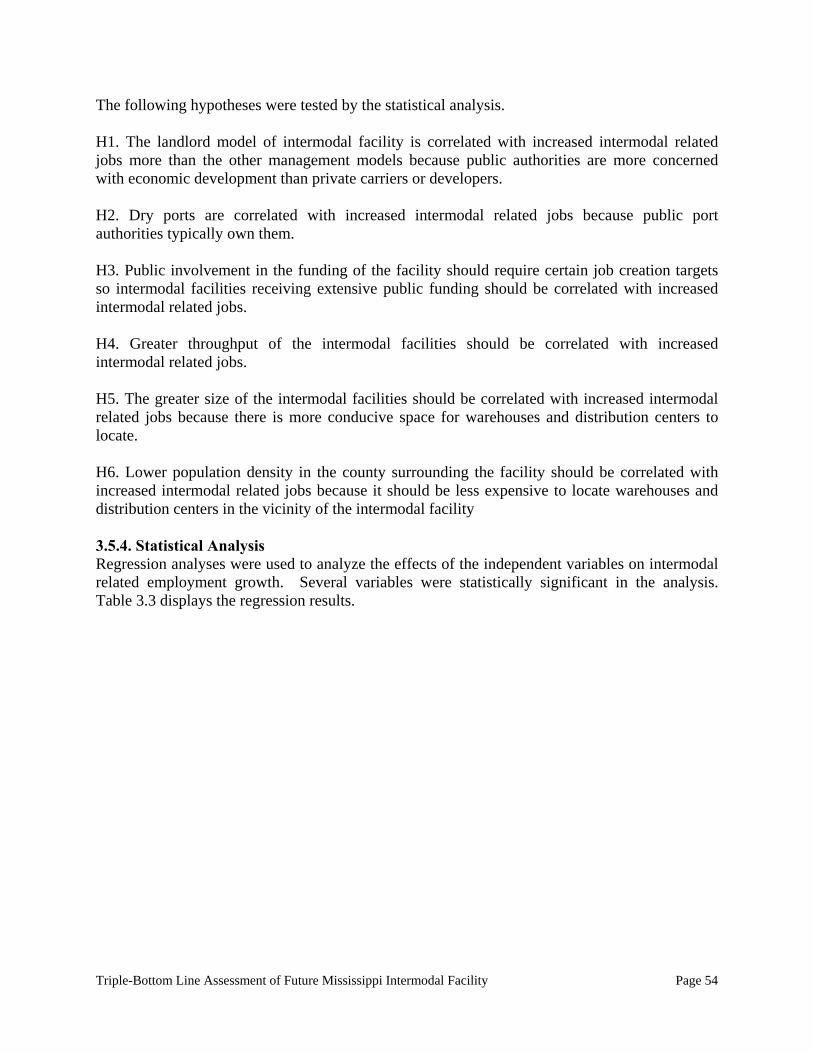
Triple-Bottom Line Assessment of Future Mississippi Intermodal Facility Page 54
The following hypotheses were tested by the statistical analysis. H1. The landlord model of intermodal facility is correlated with increased intermodal related jobs more than the other management models because public authorities are more concerned with economic development than private carriers or developers. H2. Dry ports are correlated with increased intermodal related jobs because public port authorities typically own them. H3. Public involvement in the funding of the facility should require certain job creation targets so intermodal facilities receiving extensive public funding should be correlated with increased intermodal related jobs. H4. Greater throughput of the intermodal facilities should be correlated with increased intermodal related jobs. H5. The greater size of the intermodal facilities should be correlated with increased intermodal related jobs because there is more conducive space for warehouses and distribution centers to locate. H6. Lower population density in the county surrounding the facility should be correlated with increased intermodal related jobs because it should be less expensive to locate warehouses and distribution centers in the vicinity of the intermodal facility 3.5.4. Statistical Analysis Regression analyses were used to analyze the effects of the independent variables on intermodal related employment growth. Several variables were statistically significant in the analysis. Table 3.3 displays the regression results.
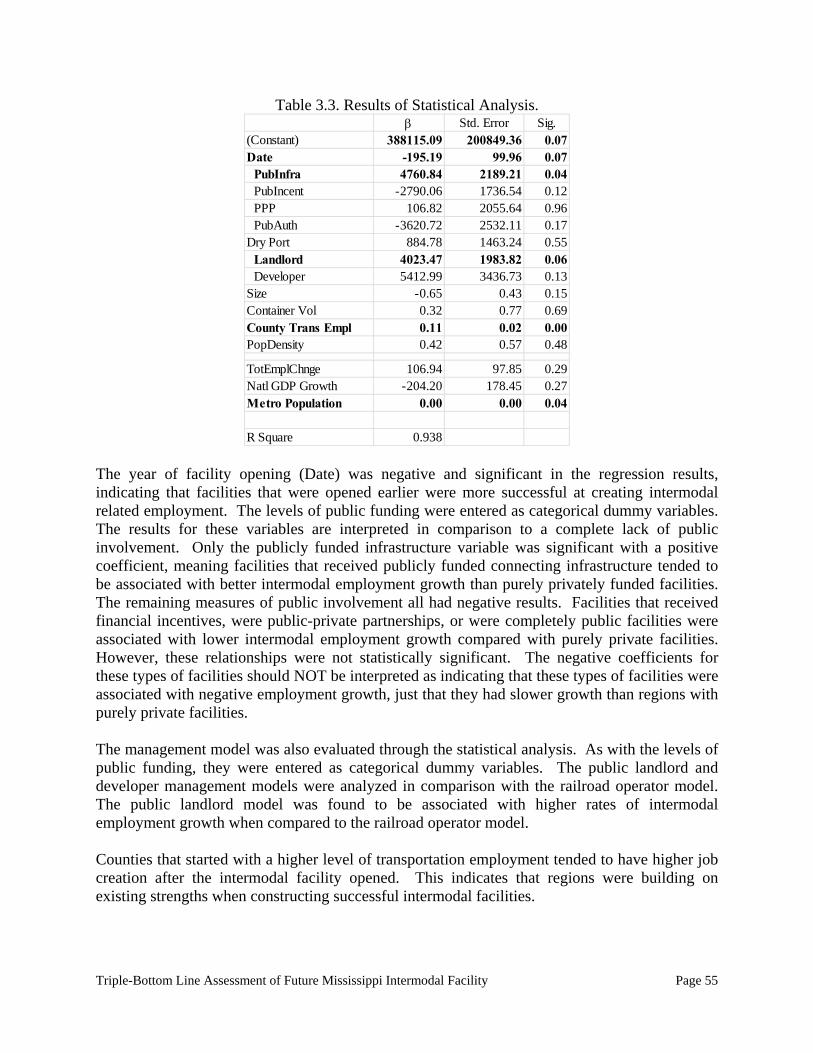
Triple-Bottom Line Assessment of Future Mississippi Intermodal Facility Page 55
Table 3.3. Results of Statistical Analysis. Std. Error Sig.
(Constant) 388115.09 200849.36 0.07Date -195.19 99.96 0.07
PubInfra 4760.84 2189.21 0.04PubIncent -2790.06 1736.54 0.12PPP 106.82 2055.64 0.96PubAuth -3620.72 2532.11 0.17
Dry Port 884.78 1463.24 0.55Landlord 4023.47 1983.82 0.06Developer 5412.99 3436.73 0.13
Size -0.65 0.43 0.15Container Vol 0.32 0.77 0.69County Trans Empl 0.11 0.02 0.00PopDensity 0.42 0.57 0.48
TotEmplChnge 106.94 97.85 0.29Natl GDP Growth -204.20 178.45 0.27Metro Population 0.00 0.00 0.04
R Square 0.938 The year of facility opening (Date) was negative and significant in the regression results, indicating that facilities that were opened earlier were more successful at creating intermodal related employment. The levels of public funding were entered as categorical dummy variables. The results for these variables are interpreted in comparison to a complete lack of public involvement. Only the publicly funded infrastructure variable was significant with a positive coefficient, meaning facilities that received publicly funded connecting infrastructure tended to be associated with better intermodal employment growth than purely privately funded facilities. The remaining measures of public involvement all had negative results. Facilities that received financial incentives, were public-private partnerships, or were completely public facilities were associated with lower intermodal employment growth compared with purely private facilities. However, these relationships were not statistically significant. The negative coefficients for these types of facilities should NOT be interpreted as indicating that these types of facilities were associated with negative employment growth, just that they had slower growth than regions with purely private facilities. The management model was also evaluated through the statistical analysis. As with the levels of public funding, they were entered as categorical dummy variables. The public landlord and developer management models were analyzed in comparison with the railroad operator model. The public landlord model was found to be associated with higher rates of intermodal employment growth when compared to the railroad operator model. Counties that started with a higher level of transportation employment tended to have higher job creation after the intermodal facility opened. This indicates that regions were building on existing strengths when constructing successful intermodal facilities.
Triple-Bottom Line Assessment of Future Mississippi Intermodal Facility Page 56
No other hypothesized relationships were found to be statistically significant. Total employment changes in the facility’s county and national GDP growth were used as control variables to account for broader economic conditions. Not surprisingly, the broad county employment growth measure was statistically significant in the model. 3.5.5. Evaluation of Hypotheses Statistically significant results supported many of the public funding related hypotheses. Hypotheses 1 was supported. The landlord management model was associated with higher intermodal related employment growth. The statistical results related to hypothesis 3 are a little more difficult to interpret. Each of the measures of public involvement was evaluated in comparison with purely private facilities. Only the measure of public involved related to public infrastructure yielded statistically significant results. Public support of connecting infrastructure tended to be associated with higher intermodal job growth in comparison with purely private facilities, supporting hypothesis 3. However, the other three measures of public involvement (all indicating greater public involvement than the infrastructure support measure) yielded mixed results, none of which were statistically significant. None of the remaining hypotheses were supported. The measures of facility size (hypothesis 4 and 5) were not statistically significant. Nor was the hypotheses related to developable land supported. 3.5.6. Sampling of Near-Dock Intermodal Facilities Twenty eight facilities were selected that are similar containerized near-dock facilities and had been open for at least four years so that there would be time for employment impacts to be identified (Table 3.4). The sample was screened to ensure that there was broad geographic coverage.
Table 3.4. Results of Statistical Analysis Dundalk Marine Terminal (1977) Seagirt Marine Terminal (1990) Ports America Packaging (1982) Mobile Container Terminal (2008) North Locust Point (1972) Port of Tacoma Terminal 7 (1967) Long Beach Container Terminal (1986) Port of Tacoma East Blair One (1980) Portsmouth Marine Terminal (1975) Barbour's Cut Terminal (1977) Pittsburgh Intermodal Terminal (1987) Bayport Terminal (2006) Elizabeth Marine Terminal (1958) Conley Terminal (1988) Wando Welch Terminal (1982) Boston Autoport (1998) Columbus Street Terminal (2007) Garden City Terminal (2002) North Charleston Terminal (1982) Ocean Terminal (2002) Baltimore Intermodal Container Transfer Facility (1988)
Target Corp Facility (2007)
Talleyrand Marine Terminal (1996) IKEA Facility (2007) FEC Rail Terminal (1996) Heineken USA Facility (2008) Norfolk International Terminals (1972) Seagirt Marine Terminal (1990)
Triple-Bottom Line Assessment of Future Mississippi Intermodal Facility Page 57
3.5.7. Dependent Variable: Impact of Transportation Employment Data collected to analyze the economic impact of an intermodal facility for this study included finding the total employment and average annual wage in logistic related fields in the region three years prior to the opening of the intermodal facility to present data. This three year data was averaged to measure pre-event employment. Data going out to three years after the establishment of the facility was chosen in order to determine the impact of the workforce trends. This allowed time for distribution centers and ancillary services to be attracted to the area by the new facility. The latest three years of post-event employment was averaged to measure the impact on employment. The Employment data for metropolitan and nonmetropolitan areas were retrieved from the Occupational Employment Statistics page of the Bureau of Labor Statistics Website. County level data by industry was found on the Bureau of Economic Analysis. Employment for counties containing the facility and adjacent counties was included in the analysis. The percentage growth in logistics related employment was used as the dependent variable in the statistical analysis. Occupations were selected that involved transportation and logistics directly connected to intermodal rail-to-truck transfer facilities. See Table 3.2 above for the occupations selected. Figure 3.2 demonstrates there is a range of employment changes correlated with various near dock facilities so the statistical analysis attempted to identify what factors could help explain the myriad of outcomes. It should be noted that most of the near dock facilities were correlated with little or no intermodal employment change. The Long Beach and Los Angeles near dock facilities were associated with the greatest employment growth.
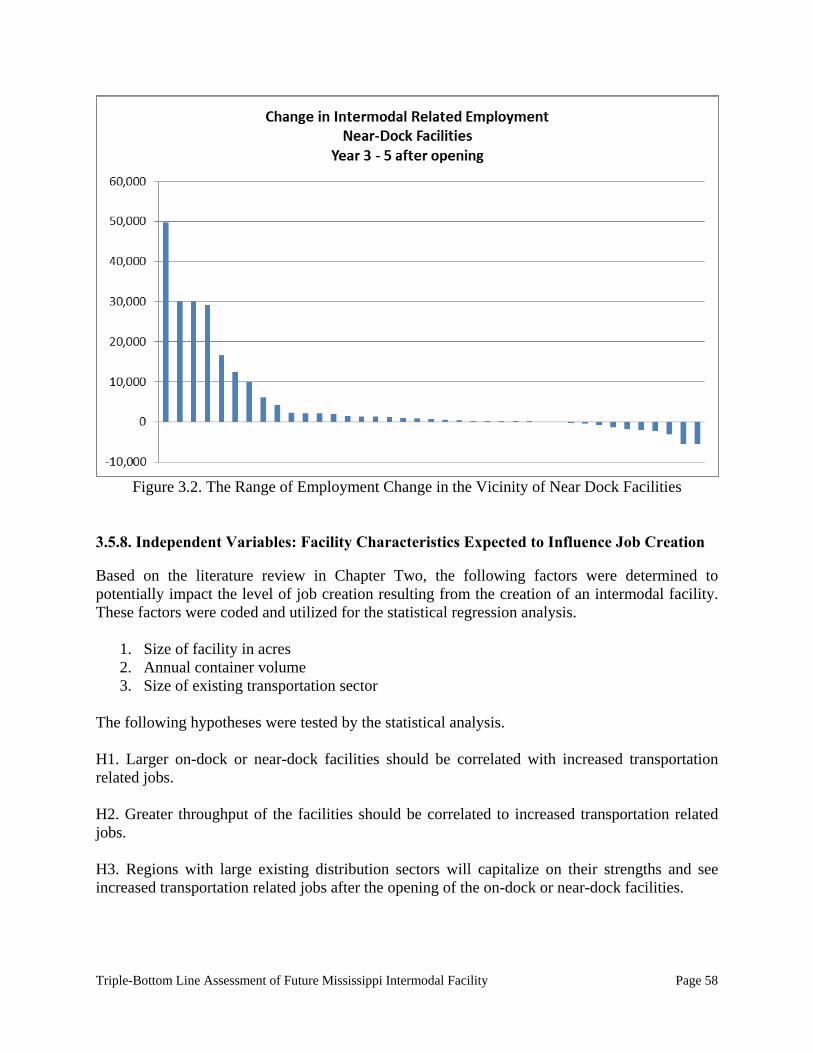
Triple-Bottom Line Assessment of Future Mississippi Intermodal Facility Page 58
Figure 3.2. The Range of Employment Change in the Vicinity of Near Dock Facilities
3.5.8. Independent Variables: Facility Characteristics Expected to Influence Job Creation Based on the literature review in Chapter Two, the following factors were determined to potentially impact the level of job creation resulting from the creation of an intermodal facility. These factors were coded and utilized for the statistical regression analysis.
1. Size of facility in acres 2. Annual container volume 3. Size of existing transportation sector
The following hypotheses were tested by the statistical analysis. H1. Larger on-dock or near-dock facilities should be correlated with increased transportation related jobs. H2. Greater throughput of the facilities should be correlated to increased transportation related jobs. H3. Regions with large existing distribution sectors will capitalize on their strengths and see increased transportation related jobs after the opening of the on-dock or near-dock facilities.
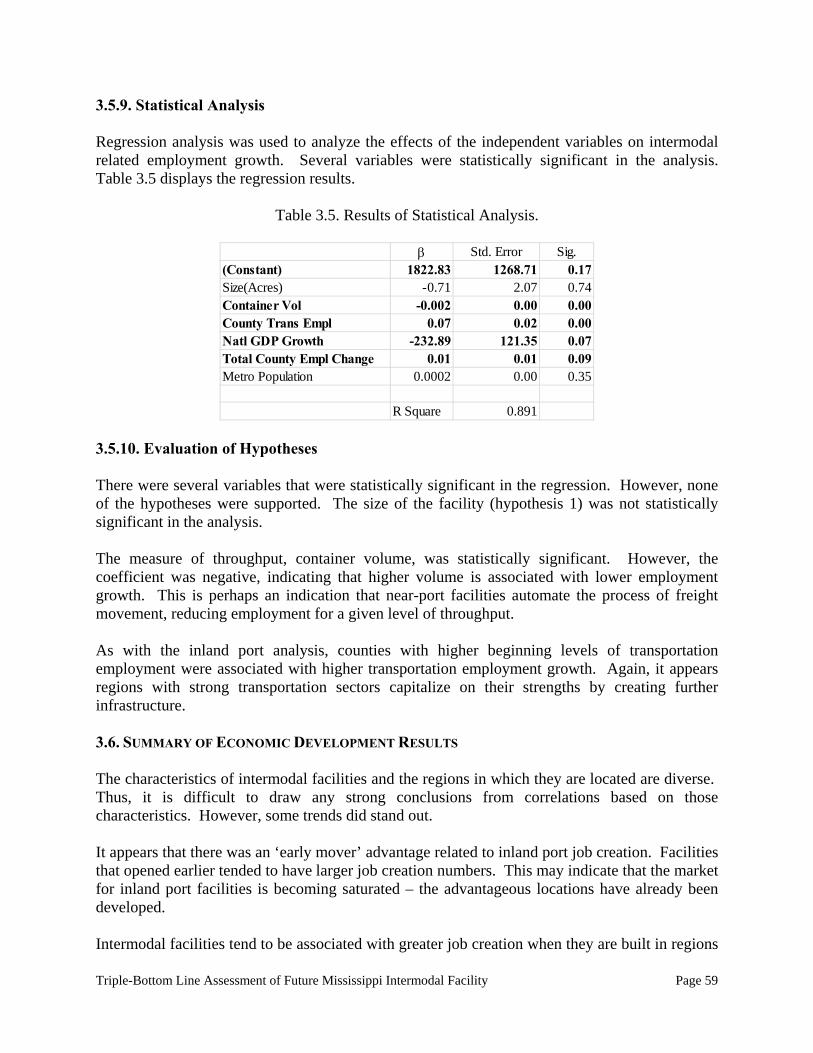
Triple-Bottom Line Assessment of Future Mississippi Intermodal Facility Page 59
3.5.9. Statistical Analysis Regression analysis was used to analyze the effects of the independent variables on intermodal related employment growth. Several variables were statistically significant in the analysis. Table 3.5 displays the regression results.
Table 3.5. Results of Statistical Analysis.
Std. Error Sig.(Constant) 1822.83 1268.71 0.17Size(Acres) -0.71 2.07 0.74Container Vol -0.002 0.00 0.00County Trans Empl 0.07 0.02 0.00Natl GDP Growth -232.89 121.35 0.07Total County Empl Change 0.01 0.01 0.09Metro Population 0.0002 0.00 0.35
R Square 0.891 3.5.10. Evaluation of Hypotheses There were several variables that were statistically significant in the regression. However, none of the hypotheses were supported. The size of the facility (hypothesis 1) was not statistically significant in the analysis. The measure of throughput, container volume, was statistically significant. However, the coefficient was negative, indicating that higher volume is associated with lower employment growth. This is perhaps an indication that near-port facilities automate the process of freight movement, reducing employment for a given level of throughput. As with the inland port analysis, counties with higher beginning levels of transportation employment were associated with higher transportation employment growth. Again, it appears regions with strong transportation sectors capitalize on their strengths by creating further infrastructure. 3.6. SUMMARY OF ECONOMIC DEVELOPMENT RESULTS The characteristics of intermodal facilities and the regions in which they are located are diverse. Thus, it is difficult to draw any strong conclusions from correlations based on those characteristics. However, some trends did stand out. It appears that there was an ‘early mover’ advantage related to inland port job creation. Facilities that opened earlier tended to have larger job creation numbers. This may indicate that the market for inland port facilities is becoming saturated – the advantageous locations have already been developed. Intermodal facilities tend to be associated with greater job creation when they are built in regions
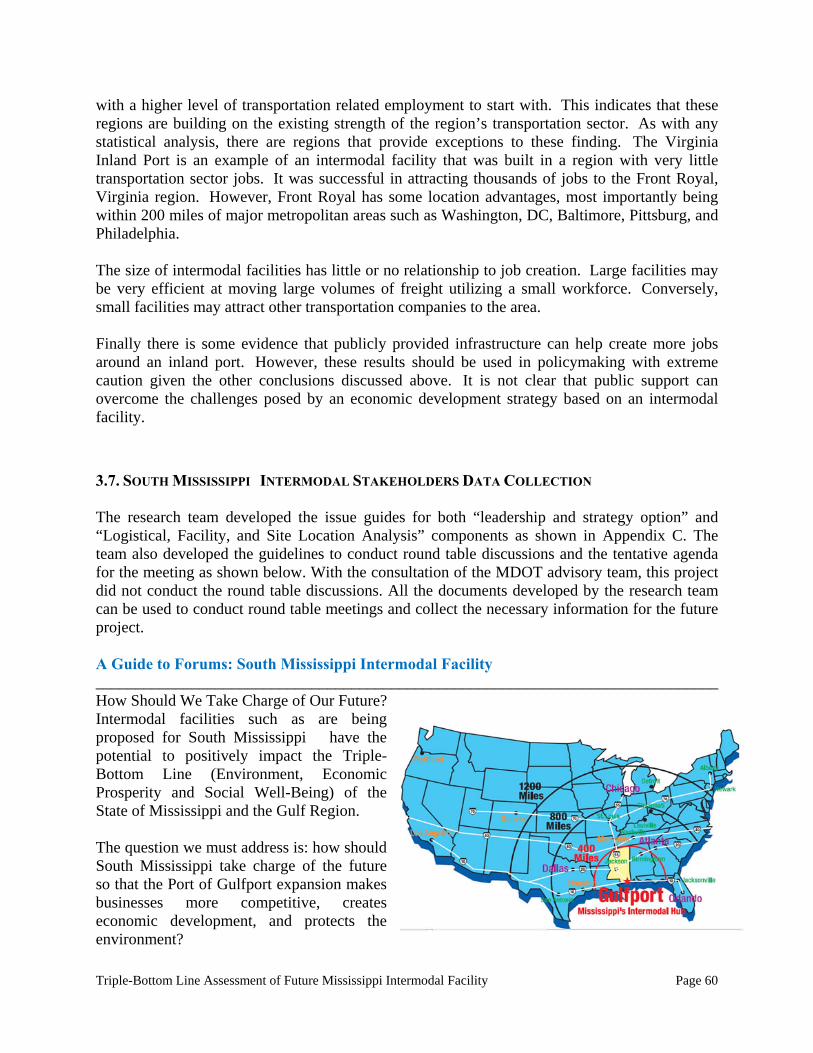
Triple-Bottom Line Assessment of Future Mississippi Intermodal Facility Page 60
with a higher level of transportation related employment to start with. This indicates that these regions are building on the existing strength of the region’s transportation sector. As with any statistical analysis, there are regions that provide exceptions to these finding. The Virginia Inland Port is an example of an intermodal facility that was built in a region with very little transportation sector jobs. It was successful in attracting thousands of jobs to the Front Royal, Virginia region. However, Front Royal has some location advantages, most importantly being within 200 miles of major metropolitan areas such as Washington, DC, Baltimore, Pittsburg, and Philadelphia. The size of intermodal facilities has little or no relationship to job creation. Large facilities may be very efficient at moving large volumes of freight utilizing a small workforce. Conversely, small facilities may attract other transportation companies to the area. Finally there is some evidence that publicly provided infrastructure can help create more jobs around an inland port. However, these results should be used in policymaking with extreme caution given the other conclusions discussed above. It is not clear that public support can overcome the challenges posed by an economic development strategy based on an intermodal facility.
3.7. SOUTH MISSISSIPPI INTERMODAL STAKEHOLDERS DATA COLLECTION The research team developed the issue guides for both “leadership and strategy option” and “Logistical, Facility, and Site Location Analysis” components as shown in Appendix C. The team also developed the guidelines to conduct round table discussions and the tentative agenda for the meeting as shown below. With the consultation of the MDOT advisory team, this project did not conduct the round table discussions. All the documents developed by the research team can be used to conduct round table meetings and collect the necessary information for the future project. A Guide to Forums: South Mississippi Intermodal Facility ______________________________________________________________________________ How Should We Take Charge of Our Future? Intermodal facilities such as are being proposed for South Mississippi have the potential to positively impact the Triple-Bottom Line (Environment, Economic Prosperity and Social Well-Being) of the State of Mississippi and the Gulf Region. The question we must address is: how should South Mississippi take charge of the future so that the Port of Gulfport expansion makes businesses more competitive, creates economic development, and protects the environment?
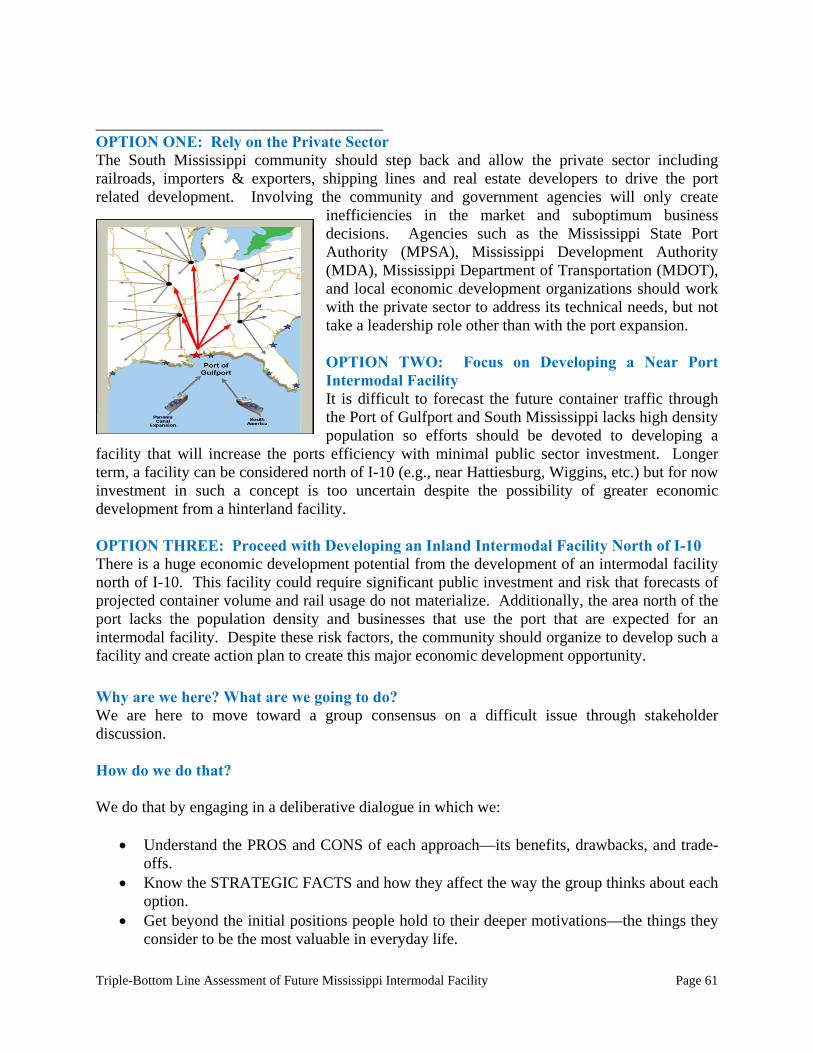
Triple-Bottom Line Assessment of Future Mississippi Intermodal Facility Page 61
____________________________________ OPTION ONE: Rely on the Private Sector The South Mississippi community should step back and allow the private sector including railroads, importers & exporters, shipping lines and real estate developers to drive the port related development. Involving the community and government agencies will only create
inefficiencies in the market and suboptimum business decisions. Agencies such as the Mississippi State Port Authority (MPSA), Mississippi Development Authority (MDA), Mississippi Department of Transportation (MDOT), and local economic development organizations should work with the private sector to address its technical needs, but not take a leadership role other than with the port expansion. OPTION TWO: Focus on Developing a Near Port Intermodal Facility It is difficult to forecast the future container traffic through the Port of Gulfport and South Mississippi lacks high density population so efforts should be devoted to developing a
facility that will increase the ports efficiency with minimal public sector investment. Longer term, a facility can be considered north of I-10 (e.g., near Hattiesburg, Wiggins, etc.) but for now investment in such a concept is too uncertain despite the possibility of greater economic development from a hinterland facility. OPTION THREE: Proceed with Developing an Inland Intermodal Facility North of I-10 There is a huge economic development potential from the development of an intermodal facility north of I-10. This facility could require significant public investment and risk that forecasts of projected container volume and rail usage do not materialize. Additionally, the area north of the port lacks the population density and businesses that use the port that are expected for an intermodal facility. Despite these risk factors, the community should organize to develop such a facility and create action plan to create this major economic development opportunity.
Why are we here? What are we going to do? We are here to move toward a group consensus on a difficult issue through stakeholder discussion. How do we do that? We do that by engaging in a deliberative dialogue in which we:
Understand the PROS and CONS of each approach—its benefits, drawbacks, and trade-offs.
Know the STRATEGIC FACTS and how they affect the way the group thinks about each option.
Get beyond the initial positions people hold to their deeper motivations—the things they consider to be the most valuable in everyday life.
Triple-Bottom Line Assessment of Future Mississippi Intermodal Facility Page 62
Weigh carefully the views of others; appreciate the impact various options would have on what others consider valuable.
Work through the conflicting issues that arise when various options pull and tug on what people consider valuable.
Communicating the Outcomes of Stakeholder Deliberation The Kettering approach provides a way for people to gain a shared understanding of problems and seek common ground for action in their communities and in their country. This forum on a proposed South Mississippi intermodal facility is also part of a research project that will present a clear commercial picture of the cost and feasibility of establishing and operating an intermodal facility in south Mississippi. This research will focus largely on a few important questions: What leadership, strategy, and organizational design would be optimal for South Mississippi? What are the site requirements for an intermodal facility? What markets and industries could potentially be served by a new facility? Your forum is important! Make sure that you return your questionnaires so voices from your organization are included in the research.

Triple-Bottom Line Assessment of Future Mississippi Intermodal Facility Page 63
Stages of a Forum Welcome
Ground rules: Participants and moderator review desired outcomes and agree on ground
rules.
Getting started: The team will present a 15 minute overview of the report findings
Deliberation: The participants are broken into groups and examine all the choices. An approximately equal amount of time should be spent on each choice.
Ending the forum: Participants reflect on what has been achieved.
Questionnaire: Participants complete the questionnaire.
If This Is Your First Experience as a Moderator
You don’t have to be an expert on the issue. Read the issue guide thoroughly. Consider questions that get to the heart of the issue and think through the essence of each option. This is a critical part of preparation.
Stay focused on what the forum is about—deliberation.
Ask questions that probe the underlying motivations of each approach, the trade-offs it might require, and the willingness of the participants to recognize them. Listen to others.
Keep the discussion moving and focused on the issue.
Sometimes it’s difficult to move on to another option when there is more that could be said. But to make progress, participants need time to weigh all the major options fairly.
Ask questions that encourage participants to consider trade-offs.
Think about questions like, “If we did this ________, what would we have to give up? Would you be willing to do that?” Listen carefully to participant responses and ask follow-up questions if appropriate.
Encourage discussion of many of the actions for each option.
Reserve ample time for reflections on the forum.
In many ways, this is the most important work the group will do. The moderator will provide reminders that time is passing, but it is up to all the participants to help preserve the time to reflect on what they have said and what they might want to do about it.
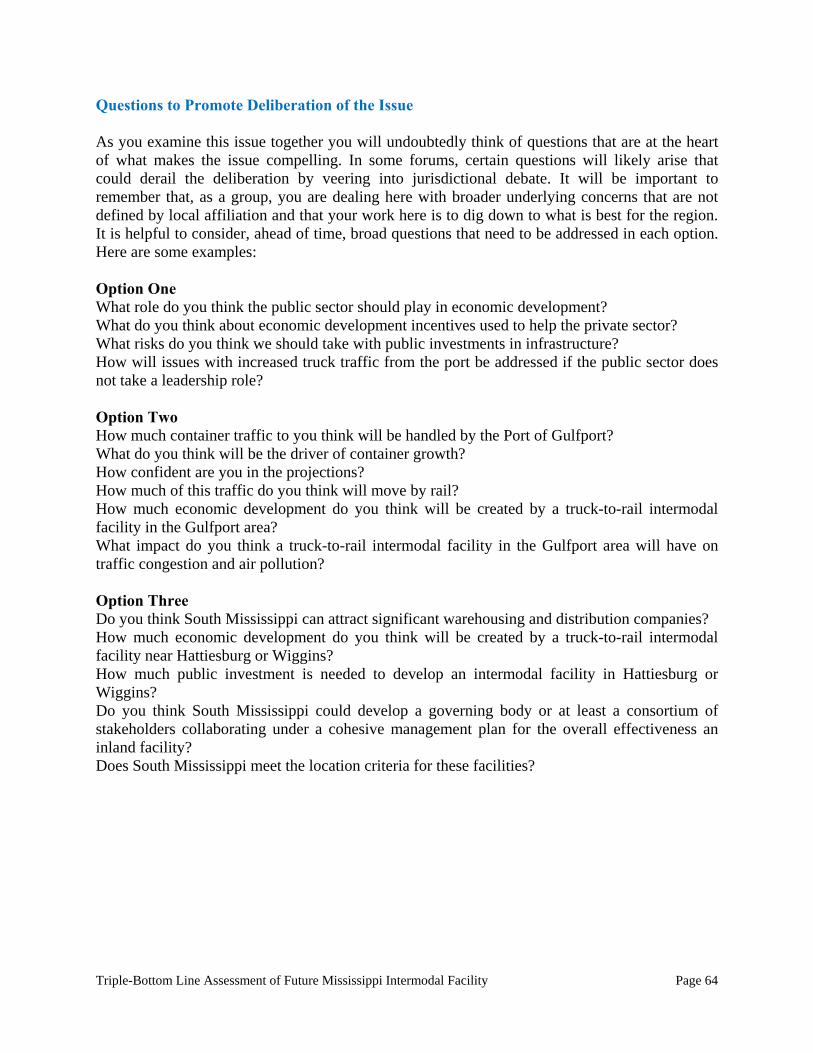
Triple-Bottom Line Assessment of Future Mississippi Intermodal Facility Page 64
Questions to Promote Deliberation of the Issue As you examine this issue together you will undoubtedly think of questions that are at the heart of what makes the issue compelling. In some forums, certain questions will likely arise that could derail the deliberation by veering into jurisdictional debate. It will be important to remember that, as a group, you are dealing here with broader underlying concerns that are not defined by local affiliation and that your work here is to dig down to what is best for the region. It is helpful to consider, ahead of time, broad questions that need to be addressed in each option. Here are some examples: Option One What role do you think the public sector should play in economic development? What do you think about economic development incentives used to help the private sector? What risks do you think we should take with public investments in infrastructure? How will issues with increased truck traffic from the port be addressed if the public sector does not take a leadership role? Option Two How much container traffic to you think will be handled by the Port of Gulfport? What do you think will be the driver of container growth? How confident are you in the projections? How much of this traffic do you think will move by rail? How much economic development do you think will be created by a truck-to-rail intermodal facility in the Gulfport area? What impact do you think a truck-to-rail intermodal facility in the Gulfport area will have on traffic congestion and air pollution? Option Three Do you think South Mississippi can attract significant warehousing and distribution companies? How much economic development do you think will be created by a truck-to-rail intermodal facility near Hattiesburg or Wiggins? How much public investment is needed to develop an intermodal facility in Hattiesburg or Wiggins? Do you think South Mississippi could develop a governing body or at least a consortium of stakeholders collaborating under a cohesive management plan for the overall effectiveness an inland facility? Does South Mississippi meet the location criteria for these facilities?
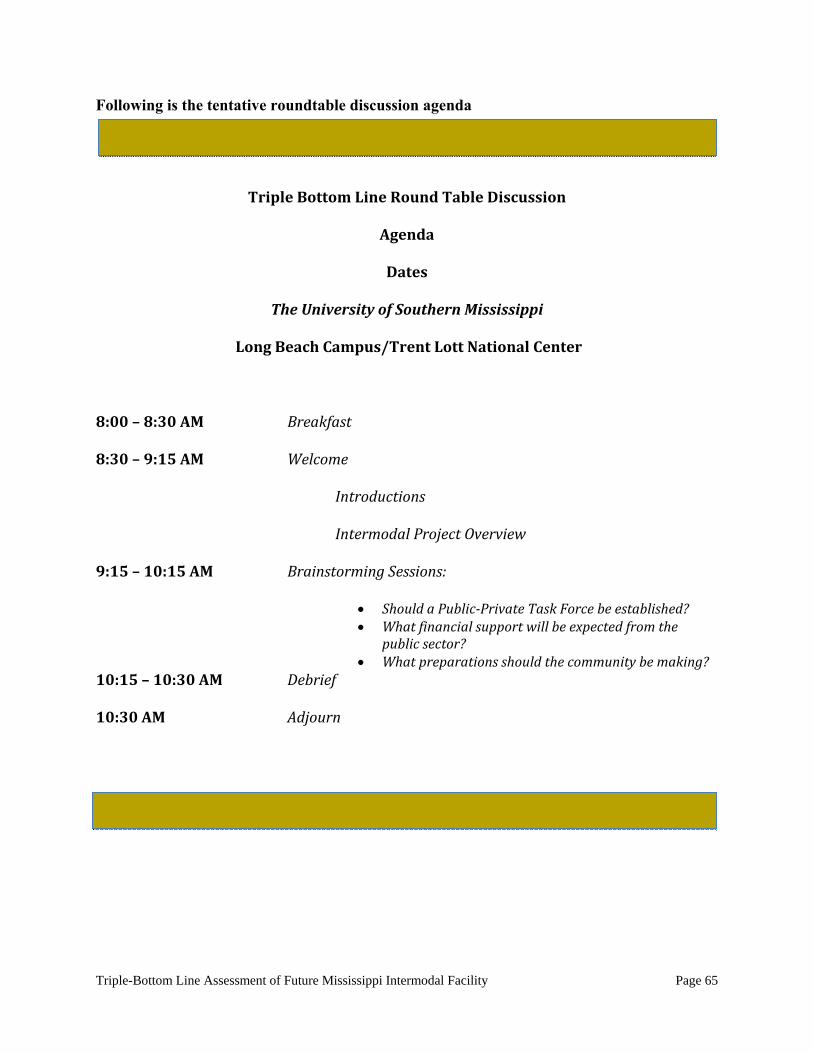
Triple-Bottom Line Assessment of Future Mississippi Intermodal Facility Page 65
Following is the tentative roundtable discussion agenda
TripleBottomLineRoundTableDiscussion
Agenda
Dates
TheUniversityofSouthernMississippi
LongBeachCampus/TrentLottNationalCenter
8:00–8:30AM Breakfast
8:30–9:15AM Welcome
Introductions
IntermodalProjectOverview
9:15–10:15AM BrainstormingSessions:
ShouldaPublic‐PrivateTaskForcebeestablished? Whatfinancialsupportwillbeexpectedfromthe
publicsector? Whatpreparationsshouldthecommunitybemaking?
10:15–10:30AM Debrief
10:30AM Adjourn
Triple-Bottom Line Assessment of Future Mississippi Intermodal Facility Page 66
3.8. SUMMARY A number of best practices resulted from the literature review (previous experience) and the statistical analysis in Section 3.5. These are the concepts that should be evaluated through the stakeholder meetings. Public Support. First, it is important that the general public support the development of these types of facilities. While they have the potential of creating jobs, there also is the possibility of increased traffic congestion and air pollution. Informing the public about the benefits and costs may alleviate some of their concerns. The discontent from citizens at other facilities and the public discontent over the Port of Gulfport expansion, make it evident that a smart and effective public relations campaign be conducted. Government Investment. Most intermodal facilities require some level of public investment. At a minimum, utilities and access to the site will likely be required. The statistical analysis indicated that facilities that included publicly funded infrastructure created more jobs on average than purely private sector facilities. From the literature review, it is clear that the trend is toward extensive public financing of intermodal facilities. The state and local governments need to be prepared to provide some level of financing for the project. Based on other comparable facilities to the sizes be considered, this investment will likely be at least $10m, if not more. Government Involvement. Public and private entities must cooperate to improve the overall logistics services in the region. Public involvement may involve councils or authorities to help manage the facility. The statistical analysis indicated that facilities operating under a public landlord model were associated with higher job creation than pure railroad operated facilities. Since transportation should be the driver of the facility, the port authority should be considered for the lead agency with close support from economic development organizations. Build on Existing Assets. Successful intermodal facility job creation results from communities building on existing transportation strengths. The planning and development of a facility should be driven by the transportation sector, rather than by real estate interests. The development of the facility should be based on the region’s current and near term transportation needs. A speculative “field of dreams” approach is not likely to be successful. A phased in approach that encourages the development of the regional transportation strengths is the recommended approach.
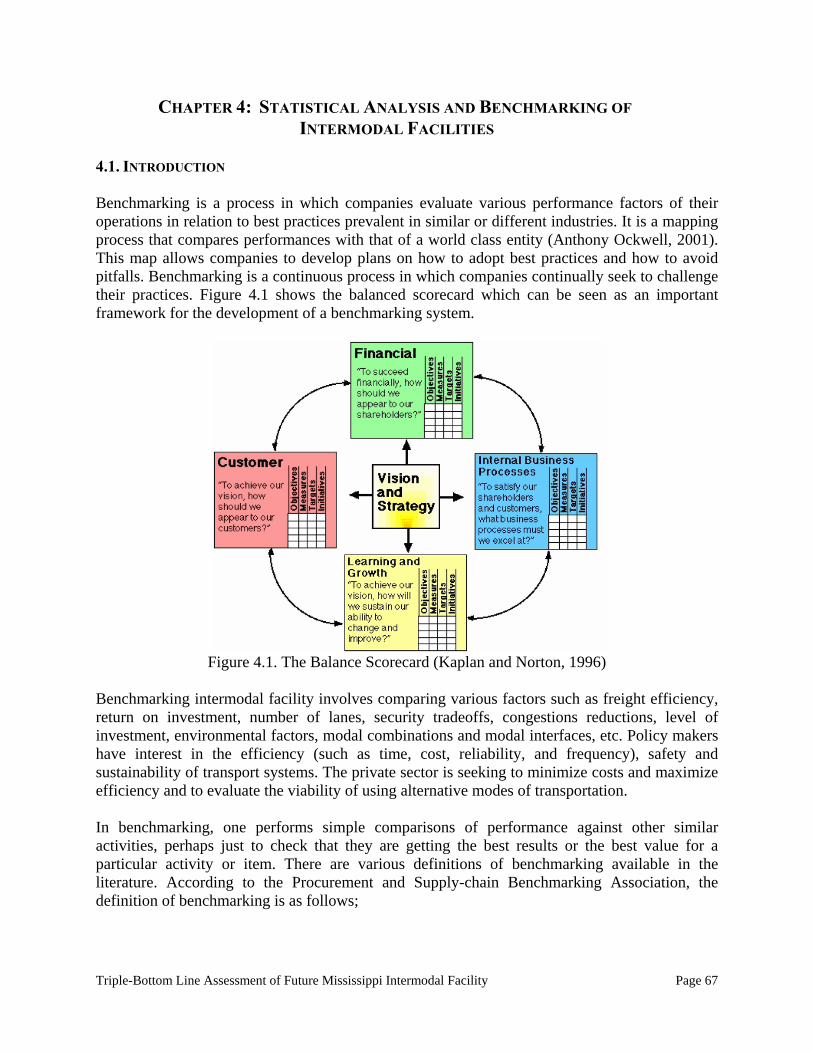
Triple-Bottom Line Assessment of Future Mississippi Intermodal Facility Page 67
CHAPTER 4: STATISTICAL ANALYSIS AND BENCHMARKING OF INTERMODAL FACILITIES
4.1. INTRODUCTION Benchmarking is a process in which companies evaluate various performance factors of their operations in relation to best practices prevalent in similar or different industries. It is a mapping process that compares performances with that of a world class entity (Anthony Ockwell, 2001). This map allows companies to develop plans on how to adopt best practices and how to avoid pitfalls. Benchmarking is a continuous process in which companies continually seek to challenge their practices. Figure 4.1 shows the balanced scorecard which can be seen as an important framework for the development of a benchmarking system.
Figure 4.1. The Balance Scorecard (Kaplan and Norton, 1996)
Benchmarking intermodal facility involves comparing various factors such as freight efficiency, return on investment, number of lanes, security tradeoffs, congestions reductions, level of investment, environmental factors, modal combinations and modal interfaces, etc. Policy makers have interest in the efficiency (such as time, cost, reliability, and frequency), safety and sustainability of transport systems. The private sector is seeking to minimize costs and maximize efficiency and to evaluate the viability of using alternative modes of transportation. In benchmarking, one performs simple comparisons of performance against other similar activities, perhaps just to check that they are getting the best results or the best value for a particular activity or item. There are various definitions of benchmarking available in the literature. According to the Procurement and Supply-chain Benchmarking Association, the definition of benchmarking is as follows;
Triple-Bottom Line Assessment of Future Mississippi Intermodal Facility Page 68
“Benchmarking is a performance measurement tool used in conjunction with improvement initiatives; it measures comparative operating performance of companies and identifies the ‘best practices.’ Benchmarking creates value by:
Focusing on key performance gaps; Identifying ideas from other companies; Creating a consensus to move an organization forward; Making better decisions from a larger base of facts.”
(Mission Statement for The Procurement and Supply-chain Benchmarking Association (PASBA™, 2011)) Intermodal facility benchmarking is focused primarily on comparing the relative performances of three major areas: (1) infrastructure performance, (2) asset performance, and (3) service level performance. Infrastructure performance comparison explores issues such as necessary infrastructure and investment justification. Asset performance comparison explores issues such as resource utilization and inventories. Service level performance comparison explores issues such as efficiency, economic impact, and social benefits. The Benchmarking analysis also seeks to develop policy options for governments to address impediments to intermodal transport efficiency, encompassing institutional aspects, technology, including the role of intelligent transportation systems (ITS) and infrastructure. As such, the focus is on organizational aspects, from a government public policy perspective, rather than on the performance of industry players. The main objectives of benchmarking (TNO, 2007) are:
- To establish a framework for the collection of performance indicators and benchmarks over the different facilities.
- To describe and derive performance indicators and benchmarks on key issues and processes in intermodal facility.
- To process indicators and benchmarks and define a framework allowing a self-assessment by users.
- To provide recommendations for process and quality improvement in intermodal operations.
- To provide recommendations on best practice issues. In order to find the desirable attributes of the future intermodal facility in relation to other leading and comparable intermodal facilities in the US, a comparative benchmarking study was conducted and presented in the following sections. 4.2. ISSUES IN BENCHMARKING Benchmarking is a learning process that helps the organizations focus and strive for consensus. This will help in providing the stimulus for improvement at all levels. Also, a cultural change promoted by encouraging organizations to look outside and helps to recognize that better
Triple-Bottom Line Assessment of Future Mississippi Intermodal Facility Page 69
practices are being utilized elsewhere. Benchmarking is mainly used to identify best practices and better ways of achieving goals in an organized way (Cuadrado et al., 2004; Ballis, 2003). Benchmarking process can help identify the best attributes of intermodal facility and avoid pitfalls through lessons learned from other facilities. Benchmarking is a tool that can help the governments and also the other stakeholder groups to meet the above challenges. Intermodal facilities must be prepared in a responsive manner to meet these challenges. Benchmarking involves the establishment of standards against which the performance of a facility can be judged (OECD, 2002). Key steps in a benchmarking process include:
i) The choice of indicators of performance; ii) The determination of the reference sector; iii) The measurement of indicators for the sector under consideration and the sector which serves as a reference; and iv) The comparison of the sector under consideration against the reference sector.
4.2.1. Choice of Indicators of Performance One of the first tasks in benchmarking is to reach consensus on the choice of indicators. The economists will choose indicators of efficiency or productivity, handling costs or freight velocity. Investors will use financial returns. Others will prefer safety or environmental performance (OECD, 2002). All these indicators are valid. The choice of a particular indicator will depend on the objectives of the analysis and the availability of data. The choice of potential indicators in the intermodal facility can be overwhelming. Following sections describes some typical performance indicators of intermodal facility benchmarking.
a. Facility Size Benchmark The throughput of a facility can be set against the available value added activities in the facility, the number of annual container lifts and the area of the facility to provide a reasonable benchmark as to how well it is performing. This can also be used to assess the likelihood of being able to expand without immediate further major capital investment.
b. Productivity Benchmarks When assessing productivity within a facility, operators will generally tend to look at issues such as the following:
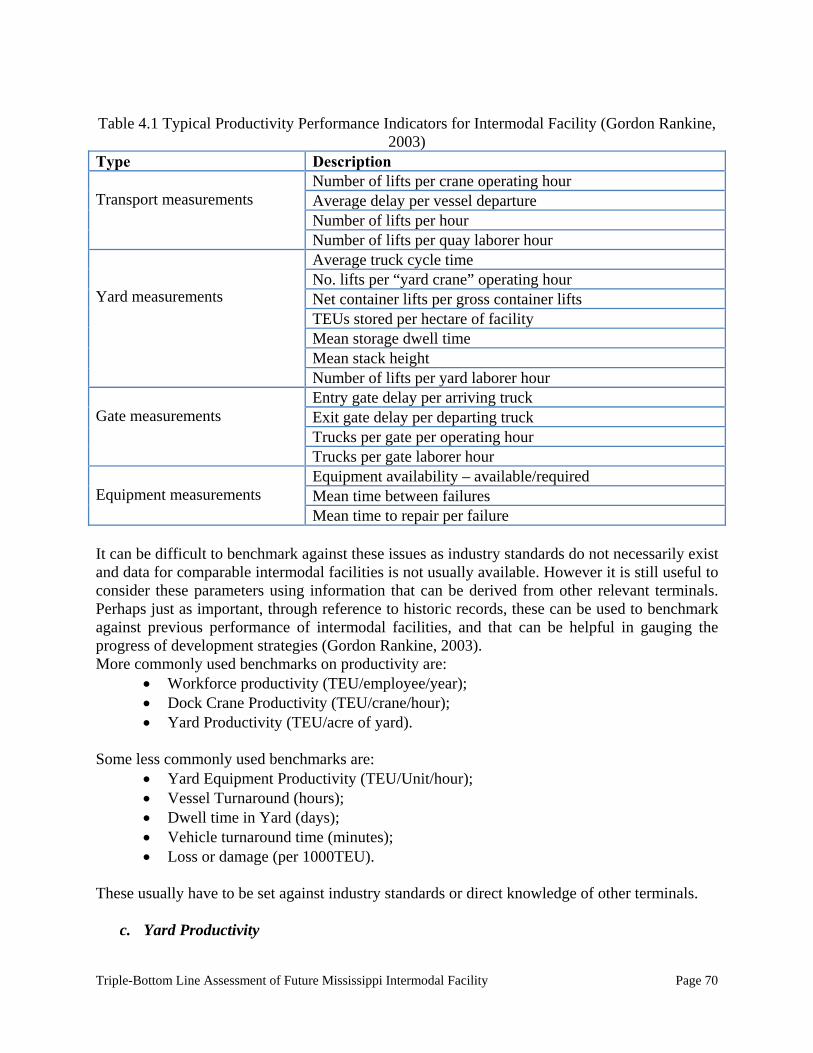
Triple-Bottom Line Assessment of Future Mississippi Intermodal Facility Page 70
Table 4.1 Typical Productivity Performance Indicators for Intermodal Facility (Gordon Rankine,
2003) Type Description Transport measurements
Number of lifts per crane operating hour Average delay per vessel departure Number of lifts per hour Number of lifts per quay laborer hour
Yard measurements
Average truck cycle time No. lifts per “yard crane” operating hour Net container lifts per gross container lifts TEUs stored per hectare of facility Mean storage dwell time Mean stack height Number of lifts per yard laborer hour
Gate measurements
Entry gate delay per arriving truck Exit gate delay per departing truck Trucks per gate per operating hour Trucks per gate laborer hour
Equipment measurements
Equipment availability – available/required Mean time between failures Mean time to repair per failure
It can be difficult to benchmark against these issues as industry standards do not necessarily exist and data for comparable intermodal facilities is not usually available. However it is still useful to consider these parameters using information that can be derived from other relevant terminals. Perhaps just as important, through reference to historic records, these can be used to benchmark against previous performance of intermodal facilities, and that can be helpful in gauging the progress of development strategies (Gordon Rankine, 2003). More commonly used benchmarks on productivity are:
Workforce productivity (TEU/employee/year); Dock Crane Productivity (TEU/crane/hour); Yard Productivity (TEU/acre of yard).
Some less commonly used benchmarks are:
Yard Equipment Productivity (TEU/Unit/hour); Vessel Turnaround (hours); Dwell time in Yard (days); Vehicle turnaround time (minutes); Loss or damage (per 1000TEU).
These usually have to be set against industry standards or direct knowledge of other terminals.
c. Yard Productivity
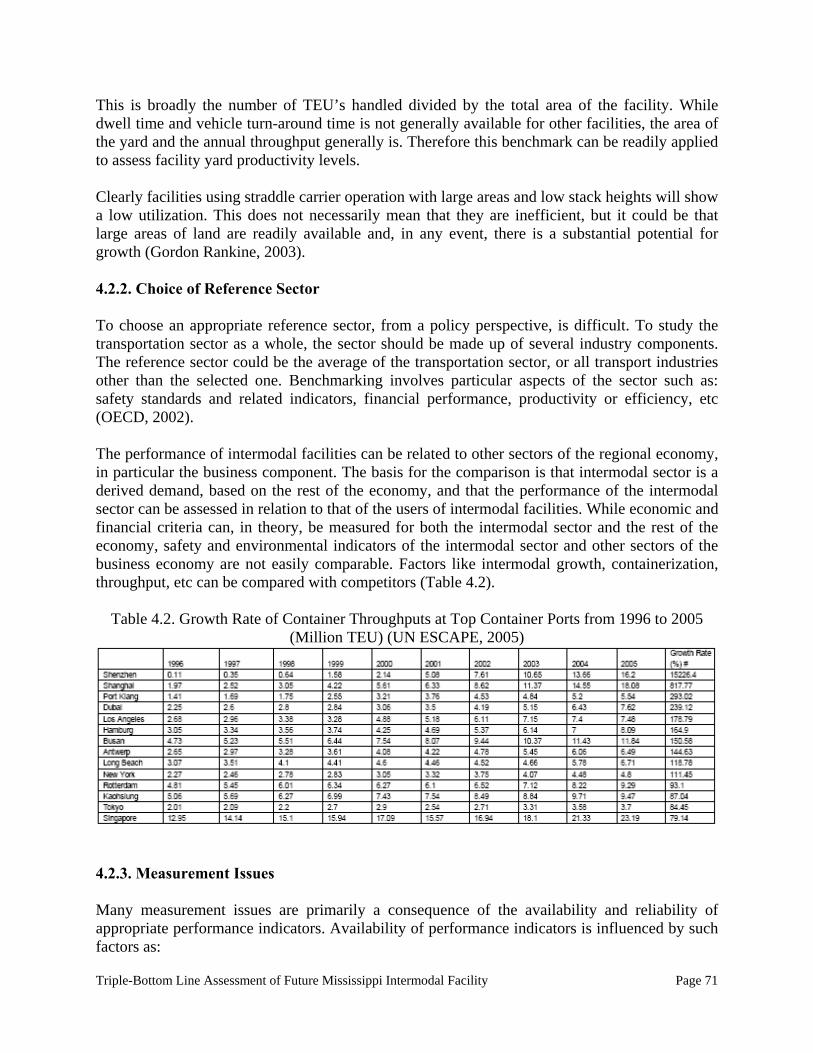
Triple-Bottom Line Assessment of Future Mississippi Intermodal Facility Page 71
This is broadly the number of TEU’s handled divided by the total area of the facility. While dwell time and vehicle turn-around time is not generally available for other facilities, the area of the yard and the annual throughput generally is. Therefore this benchmark can be readily applied to assess facility yard productivity levels. Clearly facilities using straddle carrier operation with large areas and low stack heights will show a low utilization. This does not necessarily mean that they are inefficient, but it could be that large areas of land are readily available and, in any event, there is a substantial potential for growth (Gordon Rankine, 2003). 4.2.2. Choice of Reference Sector To choose an appropriate reference sector, from a policy perspective, is difficult. To study the transportation sector as a whole, the sector should be made up of several industry components. The reference sector could be the average of the transportation sector, or all transport industries other than the selected one. Benchmarking involves particular aspects of the sector such as: safety standards and related indicators, financial performance, productivity or efficiency, etc (OECD, 2002). The performance of intermodal facilities can be related to other sectors of the regional economy, in particular the business component. The basis for the comparison is that intermodal sector is a derived demand, based on the rest of the economy, and that the performance of the intermodal sector can be assessed in relation to that of the users of intermodal facilities. While economic and financial criteria can, in theory, be measured for both the intermodal sector and the rest of the economy, safety and environmental indicators of the intermodal sector and other sectors of the business economy are not easily comparable. Factors like intermodal growth, containerization, throughput, etc can be compared with competitors (Table 4.2).
Table 4.2. Growth Rate of Container Throughputs at Top Container Ports from 1996 to 2005 (Million TEU) (UN ESCAPE, 2005)
4.2.3. Measurement Issues Many measurement issues are primarily a consequence of the availability and reliability of appropriate performance indicators. Availability of performance indicators is influenced by such factors as:
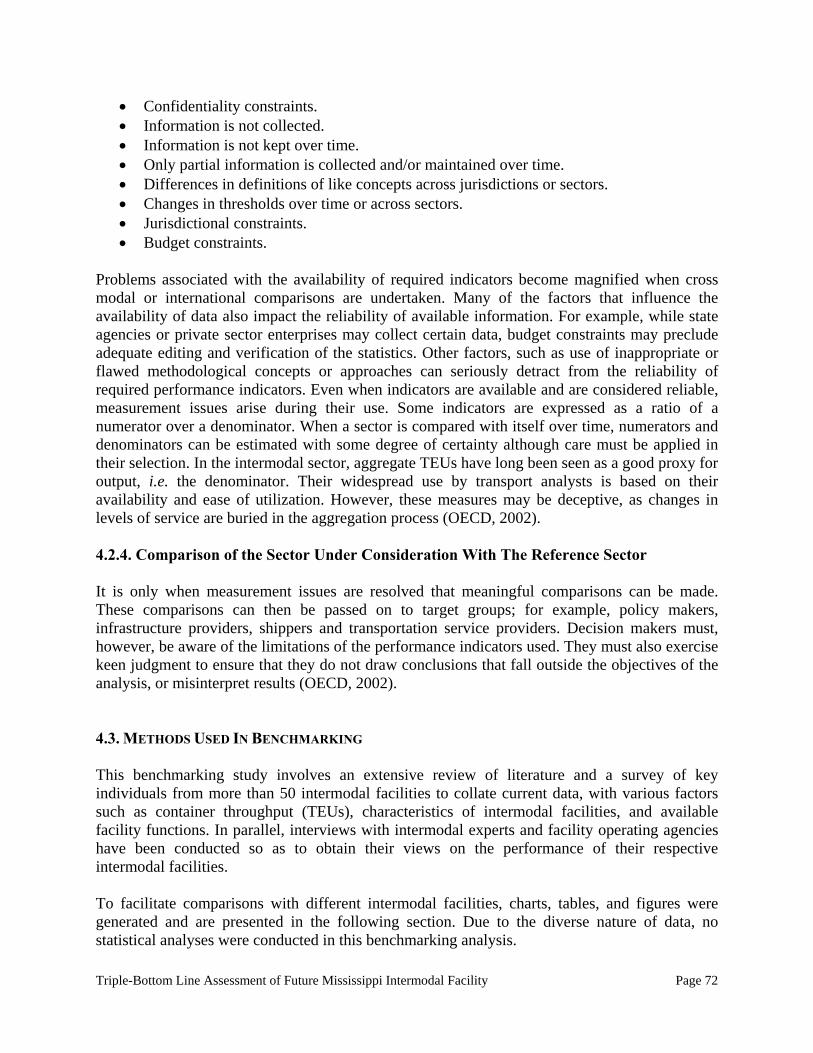
Triple-Bottom Line Assessment of Future Mississippi Intermodal Facility Page 72
Confidentiality constraints. Information is not collected. Information is not kept over time. Only partial information is collected and/or maintained over time. Differences in definitions of like concepts across jurisdictions or sectors. Changes in thresholds over time or across sectors. Jurisdictional constraints. Budget constraints.
Problems associated with the availability of required indicators become magnified when cross modal or international comparisons are undertaken. Many of the factors that influence the availability of data also impact the reliability of available information. For example, while state agencies or private sector enterprises may collect certain data, budget constraints may preclude adequate editing and verification of the statistics. Other factors, such as use of inappropriate or flawed methodological concepts or approaches can seriously detract from the reliability of required performance indicators. Even when indicators are available and are considered reliable, measurement issues arise during their use. Some indicators are expressed as a ratio of a numerator over a denominator. When a sector is compared with itself over time, numerators and denominators can be estimated with some degree of certainty although care must be applied in their selection. In the intermodal sector, aggregate TEUs have long been seen as a good proxy for output, i.e. the denominator. Their widespread use by transport analysts is based on their availability and ease of utilization. However, these measures may be deceptive, as changes in levels of service are buried in the aggregation process (OECD, 2002). 4.2.4. Comparison of the Sector Under Consideration With The Reference Sector It is only when measurement issues are resolved that meaningful comparisons can be made. These comparisons can then be passed on to target groups; for example, policy makers, infrastructure providers, shippers and transportation service providers. Decision makers must, however, be aware of the limitations of the performance indicators used. They must also exercise keen judgment to ensure that they do not draw conclusions that fall outside the objectives of the analysis, or misinterpret results (OECD, 2002). 4.3. METHODS USED IN BENCHMARKING This benchmarking study involves an extensive review of literature and a survey of key individuals from more than 50 intermodal facilities to collate current data, with various factors such as container throughput (TEUs), characteristics of intermodal facilities, and available facility functions. In parallel, interviews with intermodal experts and facility operating agencies have been conducted so as to obtain their views on the performance of their respective intermodal facilities. To facilitate comparisons with different intermodal facilities, charts, tables, and figures were generated and are presented in the following section. Due to the diverse nature of data, no statistical analyses were conducted in this benchmarking analysis.
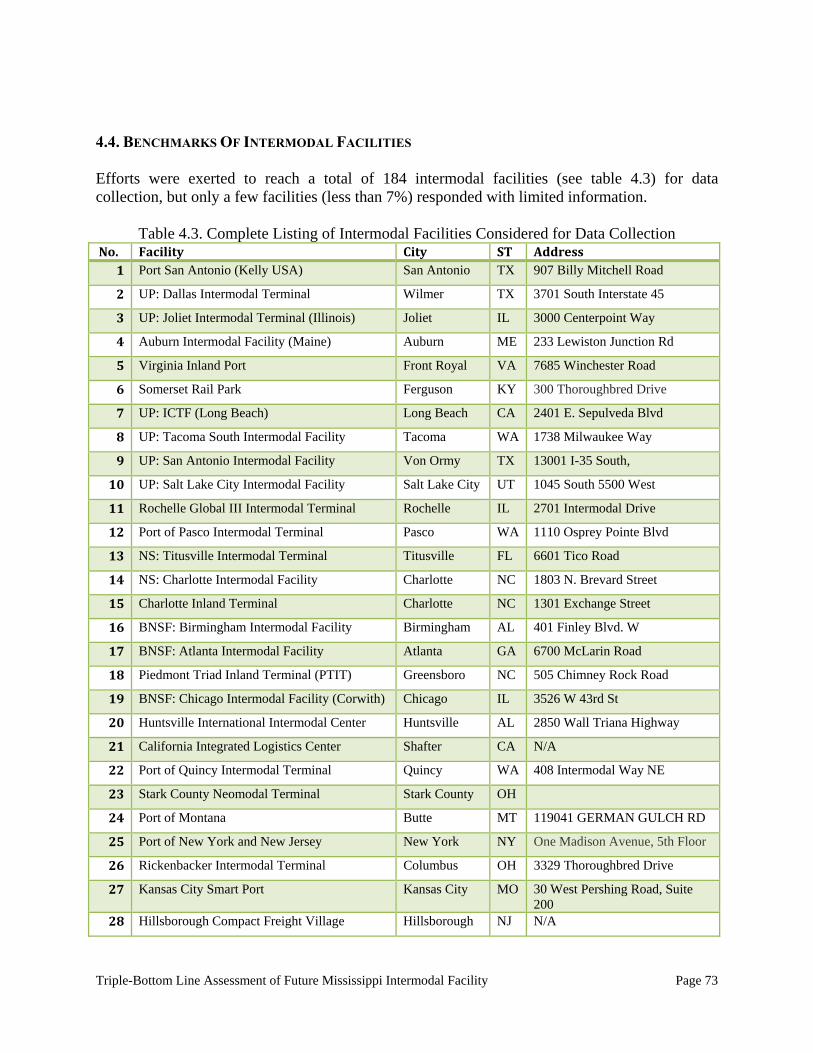
Triple-Bottom Line Assessment of Future Mississippi Intermodal Facility Page 73
4.4. BENCHMARKS OF INTERMODAL FACILITIES Efforts were exerted to reach a total of 184 intermodal facilities (see table 4.3) for data collection, but only a few facilities (less than 7%) responded with limited information.
Table 4.3. Complete Listing of Intermodal Facilities Considered for Data Collection No. Facility City ST Address
1 Port San Antonio (Kelly USA) San Antonio TX 907 Billy Mitchell Road
2 UP: Dallas Intermodal Terminal Wilmer TX 3701 South Interstate 45
3 UP: Joliet Intermodal Terminal (Illinois) Joliet IL 3000 Centerpoint Way
4 Auburn Intermodal Facility (Maine) Auburn ME 233 Lewiston Junction Rd
5 Virginia Inland Port Front Royal VA 7685 Winchester Road
6 Somerset Rail Park Ferguson KY 300 Thoroughbred Drive
7 UP: ICTF (Long Beach) Long Beach CA 2401 E. Sepulveda Blvd
8 UP: Tacoma South Intermodal Facility Tacoma WA 1738 Milwaukee Way
9 UP: San Antonio Intermodal Facility Von Ormy TX 13001 I-35 South,
10 UP: Salt Lake City Intermodal Facility Salt Lake City UT 1045 South 5500 West
11 Rochelle Global III Intermodal Terminal Rochelle IL 2701 Intermodal Drive
12 Port of Pasco Intermodal Terminal Pasco WA 1110 Osprey Pointe Blvd
13 NS: Titusville Intermodal Terminal Titusville FL 6601 Tico Road
14 NS: Charlotte Intermodal Facility Charlotte NC 1803 N. Brevard Street
15 Charlotte Inland Terminal Charlotte NC 1301 Exchange Street
16 BNSF: Birmingham Intermodal Facility Birmingham AL 401 Finley Blvd. W
17 BNSF: Atlanta Intermodal Facility Atlanta GA 6700 McLarin Road
18 Piedmont Triad Inland Terminal (PTIT) Greensboro NC 505 Chimney Rock Road
19 BNSF: Chicago Intermodal Facility (Corwith) Chicago IL 3526 W 43rd St
20 Huntsville International Intermodal Center Huntsville AL 2850 Wall Triana Highway
21 California Integrated Logistics Center Shafter CA N/A
22 Port of Quincy Intermodal Terminal Quincy WA 408 Intermodal Way NE
23 Stark County Neomodal Terminal Stark County OH
24 Port of Montana Butte MT 119041 GERMAN GULCH RD
25 Port of New York and New Jersey New York NY One Madison Avenue, 5th Floor
26 Rickenbacker Intermodal Terminal Columbus OH 3329 Thoroughbred Drive
27 Kansas City Smart Port Kansas City MO 30 West Pershing Road, Suite 200
28 Hillsborough Compact Freight Village Hillsborough NJ N/A
Triple-Bottom Line Assessment of Future Mississippi Intermodal Facility Page 74
29 CSX Intermodal terminal in Mobile Mobile AL Industrial Canal Road
30 Central Alabama Intermodal Container Transfer Facility
Bessemer AL 2401 5th Avenue & 24th Street
31 CSX Intermodal terminal Atlanta-Hulsey Atlanta GA 173 Boulevard SE
32 CSX Intermodal terminal in Fairburn Fairburn GA 6700 McLarin Road
33 CSX Intermodal terminal in Savannah Savannah GA 3000 Tremont Ave.
34 CSX Intermodal terminal in New Orleans New Orleans LA 7801 Almonaster Ave.
35 CSX Intermodal terminals in Memphis Memphis TN 3588 Paul Lowry Road
36 CSX Intermodal terminals in Nashville Nashville TN 3086 Sidco Dr.
37 CSX Intermodal terminal in Charleston Charleston SC 4201 Meeting St. Rd.
38 CSX Intermodal terminals in Jacksonville Jacksonville FL 5902 Sportsman Club Rd.
39 CSX Intermodal terminals in Orlando Orlando FL 8850 Atlantic Ave.
40 CSX Intermodal terminals in Tampa Tampa FL 1901 North 62nd St
41 CSX Intermodal terminal in Charlotte Charlotte NC 5430 Hovis Rd.
42 CN's Memphis Logistics Park Memphis TN 3588 Paul Lowry Road
43 CN Intermodal terminal in Jackson Jackson MS 360 Industrial Park Road
44 CN Intermodal terminal in New Orleans New Orleans LA 2351 Hickory Lane
45 BNSF New Orleans Intermodal Facility New Orleans LA 539 Bridge City Ave
46 Tennessee Yard (TNY ) Memphis TN 5280 Shelby Drive
47 NS-Austell Atlanta GA 6000 Westside Road
48 NS-Inman Atlanta GA 1600 Marietta Road SW
49 NS-North Charleston Charleston SC 4350 Goer Drive
50 NS-Simpson Yard Jacksonville FL 4267 North Edgewood Drive
51 NS-Savannah Intermodal Container Transfer Facility
Savannah GA 3 North Main Street
52 (BNSF) St. Paul Intermodal Facility St. Paul MN 1701 Pierce Butler Route
53 (BNSF) Alliance Intermodal Facility Haslet TX 1111 Intermodal Parkway
54 ((BNSF)) Stockton Intermodal Facility Stockton CA 6540 S. Austin Road
55 (BNSF) Logistics Park Chicago (LPC) Intermodal Facility
Elwood IL 26664 Baseline Road
56 (BNSF) Oakland International Gateway (OIG) Intermodal Facility
Oakland CA 333 Maritime Street
57 (BNSF) Kansas City Intermodal Facility Kansas City KS 720 S. 38th Street
58 (BNSF) Albuquerque Intermodal Facility Albuquerque NM 100 Woodward Road S.E.
59 (BNSF) Amarillo Intermodal Facility Amarillo TX 1801 Farmers Avenue
60 (BNSF) Billings Intermodal Facility Billings MT 3311 First Avenue South
61 (BNSF) Chicago (Cicero) Intermodal Facility Cicero IL 5601 W. 26th Street
62 (BNSF) Chicago (Willow Springs) Intermodal Facility
Hodgkins IL 7600 Santa Fe Drive
63 (BNSF) Denver Intermodal Facility (Irondale) Denver CO 585 W. 53rd Place
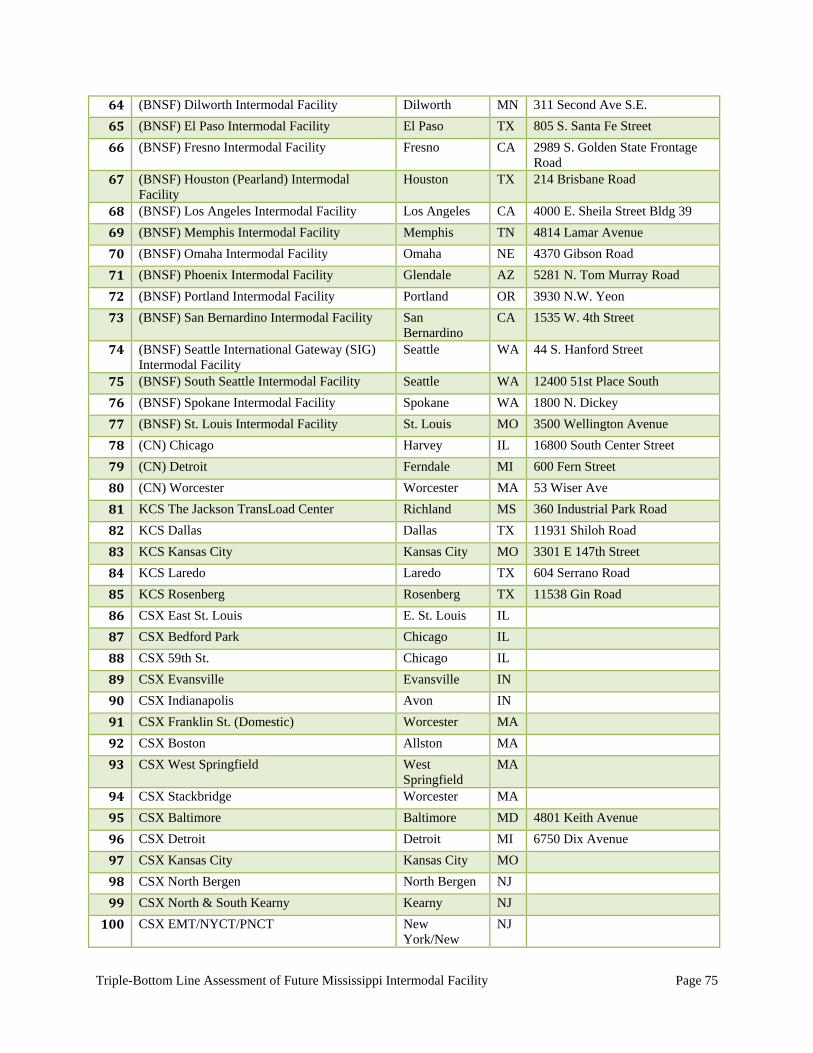
Triple-Bottom Line Assessment of Future Mississippi Intermodal Facility Page 75
64 (BNSF) Dilworth Intermodal Facility Dilworth MN 311 Second Ave S.E.
65 (BNSF) El Paso Intermodal Facility El Paso TX 805 S. Santa Fe Street
66 (BNSF) Fresno Intermodal Facility Fresno CA 2989 S. Golden State Frontage Road
67 (BNSF) Houston (Pearland) Intermodal Facility
Houston TX 214 Brisbane Road
68 (BNSF) Los Angeles Intermodal Facility Los Angeles CA 4000 E. Sheila Street Bldg 39
69 (BNSF) Memphis Intermodal Facility Memphis TN 4814 Lamar Avenue
70 (BNSF) Omaha Intermodal Facility Omaha NE 4370 Gibson Road
71 (BNSF) Phoenix Intermodal Facility Glendale AZ 5281 N. Tom Murray Road
72 (BNSF) Portland Intermodal Facility Portland OR 3930 N.W. Yeon
73 (BNSF) San Bernardino Intermodal Facility San Bernardino
CA 1535 W. 4th Street
74 (BNSF) Seattle International Gateway (SIG) Intermodal Facility
Seattle WA 44 S. Hanford Street
75 (BNSF) South Seattle Intermodal Facility Seattle WA 12400 51st Place South
76 (BNSF) Spokane Intermodal Facility Spokane WA 1800 N. Dickey
77 (BNSF) St. Louis Intermodal Facility St. Louis MO 3500 Wellington Avenue
78 (CN) Chicago Harvey IL 16800 South Center Street
79 (CN) Detroit Ferndale MI 600 Fern Street
80 (CN) Worcester Worcester MA 53 Wiser Ave
81 KCS The Jackson TransLoad Center Richland MS 360 Industrial Park Road
82 KCS Dallas Dallas TX 11931 Shiloh Road
83 KCS Kansas City Kansas City MO 3301 E 147th Street
84 KCS Laredo Laredo TX 604 Serrano Road
85 KCS Rosenberg Rosenberg TX 11538 Gin Road
86 CSX East St. Louis E. St. Louis IL
87 CSX Bedford Park Chicago IL
88 CSX 59th St. Chicago IL
89 CSX Evansville Evansville IN
90 CSX Indianapolis Avon IN
91 CSX Franklin St. (Domestic) Worcester MA
92 CSX Boston Allston MA
93 CSX West Springfield West Springfield
MA
94 CSX Stackbridge Worcester MA
95 CSX Baltimore Baltimore MD 4801 Keith Avenue
96 CSX Detroit Detroit MI 6750 Dix Avenue
97 CSX Kansas City Kansas City MO
98 CSX North Bergen North Bergen NJ
99 CSX North & South Kearny Kearny NJ
100 CSX EMT/NYCT/PNCT New York/New
NJ
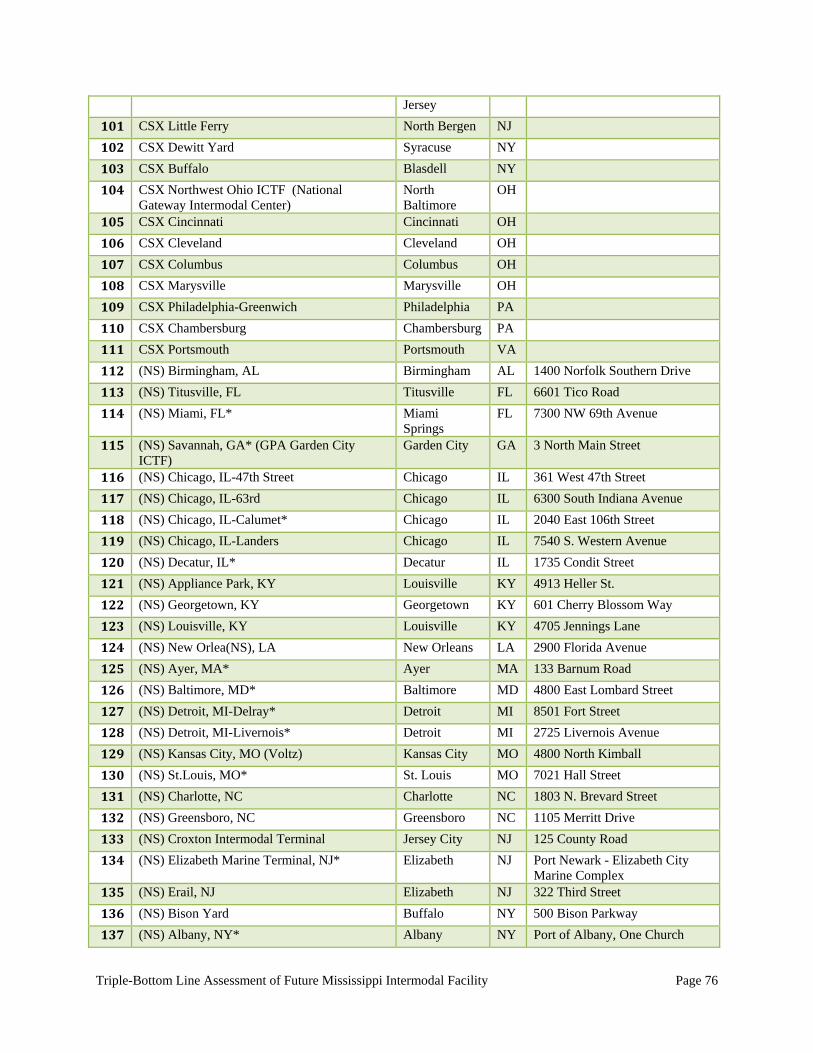
Triple-Bottom Line Assessment of Future Mississippi Intermodal Facility Page 76
Jersey
101 CSX Little Ferry North Bergen NJ
102 CSX Dewitt Yard Syracuse NY
103 CSX Buffalo Blasdell NY
104 CSX Northwest Ohio ICTF (National Gateway Intermodal Center)
North Baltimore
OH
105 CSX Cincinnati Cincinnati OH
106 CSX Cleveland Cleveland OH
107 CSX Columbus Columbus OH
108 CSX Marysville Marysville OH
109 CSX Philadelphia-Greenwich Philadelphia PA
110 CSX Chambersburg Chambersburg PA
111 CSX Portsmouth Portsmouth VA
112 (NS) Birmingham, AL Birmingham AL 1400 Norfolk Southern Drive
113 (NS) Titusville, FL Titusville FL 6601 Tico Road
114 (NS) Miami, FL* Miami Springs
FL 7300 NW 69th Avenue
115 (NS) Savannah, GA* (GPA Garden City ICTF)
Garden City GA 3 North Main Street
116 (NS) Chicago, IL-47th Street Chicago IL 361 West 47th Street
117 (NS) Chicago, IL-63rd Chicago IL 6300 South Indiana Avenue
118 (NS) Chicago, IL-Calumet* Chicago IL 2040 East 106th Street
119 (NS) Chicago, IL-Landers Chicago IL 7540 S. Western Avenue
120 (NS) Decatur, IL* Decatur IL 1735 Condit Street
121 (NS) Appliance Park, KY Louisville KY 4913 Heller St.
122 (NS) Georgetown, KY Georgetown KY 601 Cherry Blossom Way
123 (NS) Louisville, KY Louisville KY 4705 Jennings Lane
124 (NS) New Orlea(NS), LA New Orleans LA 2900 Florida Avenue
125 (NS) Ayer, MA* Ayer MA 133 Barnum Road
126 (NS) Baltimore, MD* Baltimore MD 4800 East Lombard Street
127 (NS) Detroit, MI-Delray* Detroit MI 8501 Fort Street
128 (NS) Detroit, MI-Livernois* Detroit MI 2725 Livernois Avenue
129 (NS) Kansas City, MO (Voltz) Kansas City MO 4800 North Kimball
130 (NS) St.Louis, MO* St. Louis MO 7021 Hall Street
131 (NS) Charlotte, NC Charlotte NC 1803 N. Brevard Street
132 (NS) Greensboro, NC Greensboro NC 1105 Merritt Drive
133 (NS) Croxton Intermodal Terminal Jersey City NJ 125 County Road
134 (NS) Elizabeth Marine Terminal, NJ* Elizabeth NJ Port Newark - Elizabeth City Marine Complex
135 (NS) Erail, NJ Elizabeth NJ 322 Third Street
136 (NS) Bison Yard Buffalo NY 500 Bison Parkway
137 (NS) Albany, NY* Albany NY Port of Albany, One Church
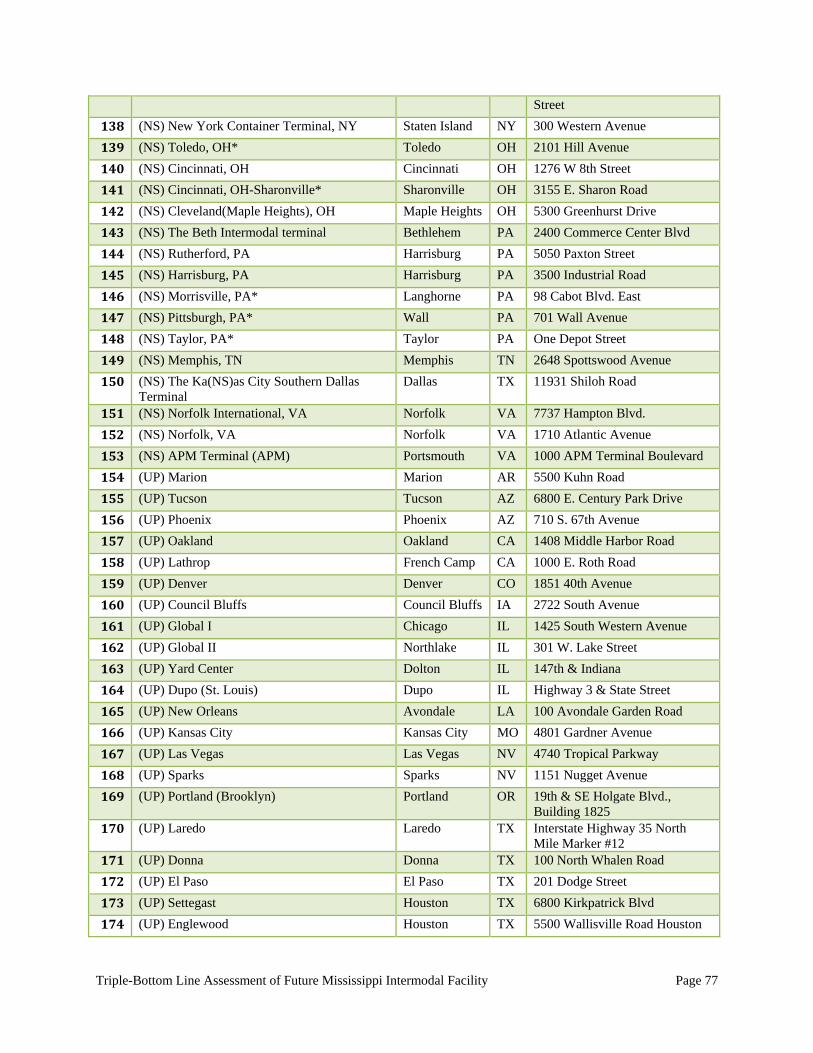
Triple-Bottom Line Assessment of Future Mississippi Intermodal Facility Page 77
Street
138 (NS) New York Container Terminal, NY Staten Island NY 300 Western Avenue
139 (NS) Toledo, OH* Toledo OH 2101 Hill Avenue
140 (NS) Cincinnati, OH Cincinnati OH 1276 W 8th Street
141 (NS) Cincinnati, OH-Sharonville* Sharonville OH 3155 E. Sharon Road
142 (NS) Cleveland(Maple Heights), OH Maple Heights OH 5300 Greenhurst Drive
143 (NS) The Beth Intermodal terminal Bethlehem PA 2400 Commerce Center Blvd
144 (NS) Rutherford, PA Harrisburg PA 5050 Paxton Street
145 (NS) Harrisburg, PA Harrisburg PA 3500 Industrial Road
146 (NS) Morrisville, PA* Langhorne PA 98 Cabot Blvd. East
147 (NS) Pittsburgh, PA* Wall PA 701 Wall Avenue
148 (NS) Taylor, PA* Taylor PA One Depot Street
149 (NS) Memphis, TN Memphis TN 2648 Spottswood Avenue
150 (NS) The Ka(NS)as City Southern Dallas Terminal
Dallas TX 11931 Shiloh Road
151 (NS) Norfolk International, VA Norfolk VA 7737 Hampton Blvd.
152 (NS) Norfolk, VA Norfolk VA 1710 Atlantic Avenue
153 (NS) APM Terminal (APM) Portsmouth VA 1000 APM Terminal Boulevard
154 (UP) Marion Marion AR 5500 Kuhn Road
155 (UP) Tucson Tucson AZ 6800 E. Century Park Drive
156 (UP) Phoenix Phoenix AZ 710 S. 67th Avenue
157 (UP) Oakland Oakland CA 1408 Middle Harbor Road
158 (UP) Lathrop French Camp CA 1000 E. Roth Road
159 (UP) Denver Denver CO 1851 40th Avenue
160 (UP) Council Bluffs Council Bluffs IA 2722 South Avenue
161 (UP) Global I Chicago IL 1425 South Western Avenue
162 (UP) Global II Northlake IL 301 W. Lake Street
163 (UP) Yard Center Dolton IL 147th & Indiana
164 (UP) Dupo (St. Louis) Dupo IL Highway 3 & State Street
165 (UP) New Orleans Avondale LA 100 Avondale Garden Road
166 (UP) Kansas City Kansas City MO 4801 Gardner Avenue
167 (UP) Las Vegas Las Vegas NV 4740 Tropical Parkway
168 (UP) Sparks Sparks NV 1151 Nugget Avenue
169 (UP) Portland (Brooklyn) Portland OR 19th & SE Holgate Blvd., Building 1825
170 (UP) Laredo Laredo TX Interstate Highway 35 North Mile Marker #12
171 (UP) Donna Donna TX 100 North Whalen Road
172 (UP) El Paso El Paso TX 201 Dodge Street
173 (UP) Settegast Houston TX 6800 Kirkpatrick Blvd
174 (UP) Englewood Houston TX 5500 Wallisville Road Houston
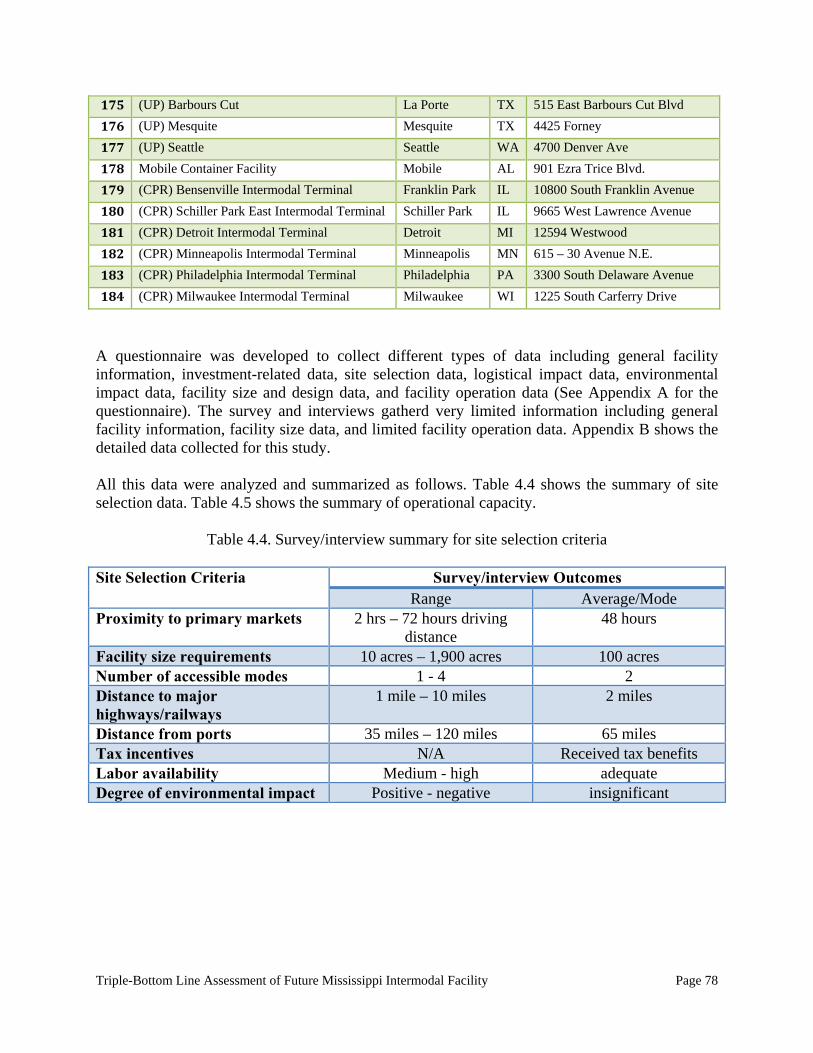
Triple-Bottom Line Assessment of Future Mississippi Intermodal Facility Page 78
175 (UP) Barbours Cut La Porte TX 515 East Barbours Cut Blvd
176 (UP) Mesquite Mesquite TX 4425 Forney
177 (UP) Seattle Seattle WA 4700 Denver Ave
178 Mobile Container Facility Mobile AL 901 Ezra Trice Blvd.
179 (CPR) Bensenville Intermodal Terminal Franklin Park IL 10800 South Franklin Avenue
180 (CPR) Schiller Park East Intermodal Terminal Schiller Park IL 9665 West Lawrence Avenue
181 (CPR) Detroit Intermodal Terminal Detroit MI 12594 Westwood
182 (CPR) Minneapolis Intermodal Terminal Minneapolis MN 615 – 30 Avenue N.E.
183 (CPR) Philadelphia Intermodal Terminal Philadelphia PA 3300 South Delaware Avenue
184 (CPR) Milwaukee Intermodal Terminal Milwaukee WI 1225 South Carferry Drive
A questionnaire was developed to collect different types of data including general facility information, investment-related data, site selection data, logistical impact data, environmental impact data, facility size and design data, and facility operation data (See Appendix A for the questionnaire). The survey and interviews gatherd very limited information including general facility information, facility size data, and limited facility operation data. Appendix B shows the detailed data collected for this study. All this data were analyzed and summarized as follows. Table 4.4 shows the summary of site selection data. Table 4.5 shows the summary of operational capacity.
Table 4.4. Survey/interview summary for site selection criteria Site Selection Criteria Survey/interview Outcomes
Range Average/Mode Proximity to primary markets 2 hrs – 72 hours driving
distance 48 hours
Facility size requirements 10 acres – 1,900 acres 100 acres Number of accessible modes 1 - 4 2 Distance to major highways/railways
1 mile – 10 miles 2 miles
Distance from ports 35 miles – 120 miles 65 miles Tax incentives N/A Received tax benefits Labor availability Medium - high adequate Degree of environmental impact Positive - negative insignificant
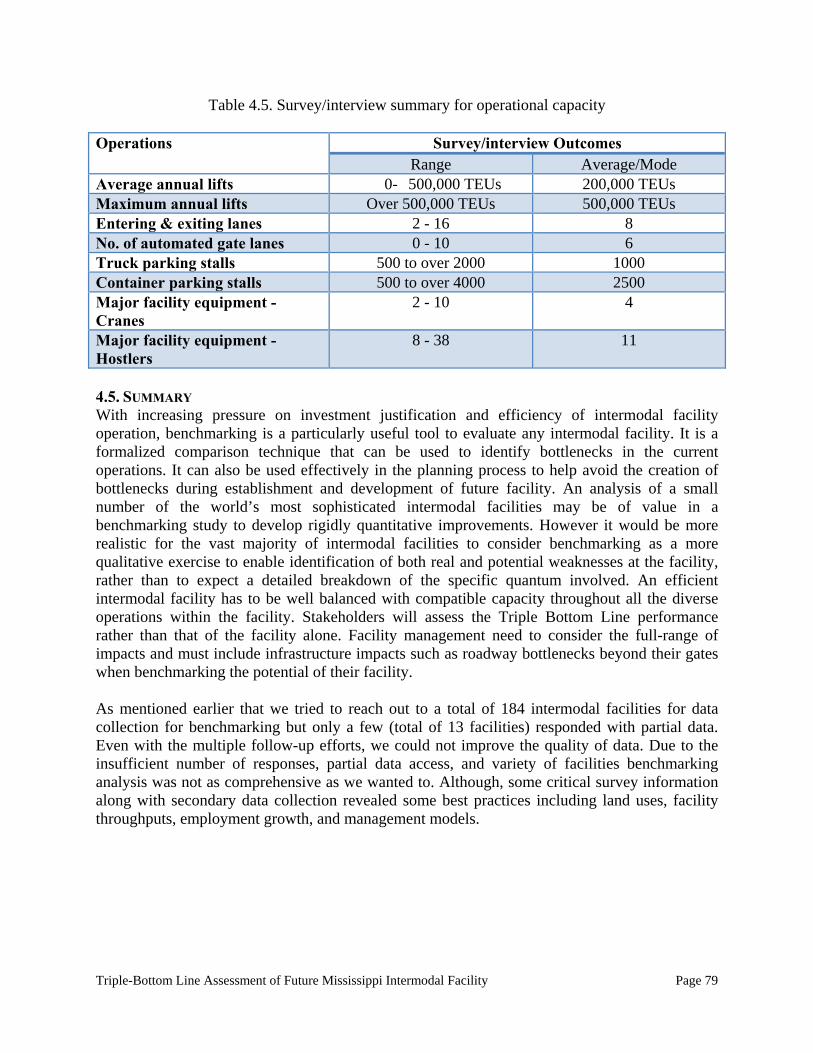
Triple-Bottom Line Assessment of Future Mississippi Intermodal Facility Page 79
Table 4.5. Survey/interview summary for operational capacity Operations Survey/interview Outcomes
Range Average/Mode Average annual lifts 0- 500,000 TEUs 200,000 TEUs Maximum annual lifts Over 500,000 TEUs 500,000 TEUs Entering & exiting lanes 2 - 16 8 No. of automated gate lanes 0 - 10 6 Truck parking stalls 500 to over 2000 1000 Container parking stalls 500 to over 4000 2500 Major facility equipment - Cranes
2 - 10 4
Major facility equipment - Hostlers
8 - 38 11
4.5. SUMMARY With increasing pressure on investment justification and efficiency of intermodal facility operation, benchmarking is a particularly useful tool to evaluate any intermodal facility. It is a formalized comparison technique that can be used to identify bottlenecks in the current operations. It can also be used effectively in the planning process to help avoid the creation of bottlenecks during establishment and development of future facility. An analysis of a small number of the world’s most sophisticated intermodal facilities may be of value in a benchmarking study to develop rigidly quantitative improvements. However it would be more realistic for the vast majority of intermodal facilities to consider benchmarking as a more qualitative exercise to enable identification of both real and potential weaknesses at the facility, rather than to expect a detailed breakdown of the specific quantum involved. An efficient intermodal facility has to be well balanced with compatible capacity throughout all the diverse operations within the facility. Stakeholders will assess the Triple Bottom Line performance rather than that of the facility alone. Facility management need to consider the full-range of impacts and must include infrastructure impacts such as roadway bottlenecks beyond their gates when benchmarking the potential of their facility. As mentioned earlier that we tried to reach out to a total of 184 intermodal facilities for data collection for benchmarking but only a few (total of 13 facilities) responded with partial data. Even with the multiple follow-up efforts, we could not improve the quality of data. Due to the insufficient number of responses, partial data access, and variety of facilities benchmarking analysis was not as comprehensive as we wanted to. Although, some critical survey information along with secondary data collection revealed some best practices including land uses, facility throughputs, employment growth, and management models.
Triple-Bottom Line Assessment of Future Mississippi Intermodal Facility Page 80
CHAPTER 5: LOGISTICAL IMPACT ANALYSIS:
LOCATION, ENVIRONMENTAL, CONGESTION, & FREIGHT PERFORMANCE ANALYSIS 5.1. INTRODUCTION TO LOGISTICAL IMPACT ANALYSIS Intermodal facilities can be important links in the supply chain, and with increased globalization in today’s business environment, it is critical that distinguishing characteristics of these facilities be analyzed to optimize transportation systems performance. Site selection can be a complicated issue. In this Chapter, various site selection parameters based on literature reviews are reviewed and the top10 locations in South Mississippi are identified. A comparative analysis was performed to determine the best two cities which yielded the highest benefits to all stakeholders. A pair-wise comparison was performed for these two cities to determine the top-ranked facility. Finding the right location for a site has a huge impact on the logistical performance of an intermodal facility. An ideal site can reduce the freight movement time, reduce congestion at the port city, improve facility performance, and maximize economic impact. Apart from selecting the best two sites, this report studied connectivity analysis, freight flow analysis, congestion analysis, and top level environmental analysis. Connectivity analysis was designed to identify existing infrastructure near the potential sites. Congestion analysis was performed based on future freight flows to determine the potential impact on the port city. A freight movement performance analysis was conducted to determine the implications of potential intermodal facilities on freight transit times and productivity. These analyses help to understand the logistical impact on potential intermodal facility. 5.2. LITERATURE REVIEW A study conducted in Los Angeles identified a methodology to be used to locate new facilities. It also mentioned that the use of facilities geographically close to the port minimizes truck miles. Without the intermodal facility, there was a total of 220,100 travel miles between all the trucks, an average of 11.6 miles per trip (Rehimi et al., 2008). The satellite inland port system currently under design will provide direct access to the port that will reduce the daily travel miles and also minimize the environmental footprint. Another article evaluated various businesses and concluded that less than 30% utilize the closest locale for the shipment of merchandise, with only 3% using the closest locale as a viable shipping option. It was recommended that this intermodal facility should be located close to large industries for improved synergies (Slack et al., 2001). They emphasized that future freight flows should be taken into consideration when selecting locations and designs for intermodal facilities. The connectivity between the rail and truck modes at the interface point is very important (Kandee, 2011). The U.S. surface transportation network, is reaching or has reached capacity in many areas, resulting in congested operations. There are two sources of congestion, recurring congestion which occurs from lack of capacity to meet traffic demand or lack of optimal operation of the infrastructure, and nonrecurring congestion results from unpredictable or
Triple-Bottom Line Assessment of Future Mississippi Intermodal Facility Page 81
unexpected disruption of the infrastructure. The latter causes an increase in the cost of transporting goods by 50 to 250 percent (Jones, 2007). Congestion on the transportation network diminishes productivity and increases the over- all cost of transportation services. Changes in freight handling, yard location and layout, scheduling, and shipment coordination can play a role in minimizing delay and moving freight more efficiently. The important of analyzing all the potential impacts and operational affects before construction was emphasized throughout the literature. Additionally, the importance of considering the infrastructure and land use in the area surrounding the site, keeping in mind the potential for possible expansion, was also identified. 5.3. SITE/LOCATION ANALYSIS As mentioned earlier, a careful selection of an intermodal facility can influence its maximum logistical and economic impact for its stakeholders. Intermodal facilities are capable of providing significant economic benefits for companies operating such facilities. However, the selection of facility location is a critical matter for maximizing these benefits. The details of site location factors are discussed in Chapter 2. 5.3.1. Characteristics of Ideal Sites Given the high volume of truck traffic generated by a large number of containers entering and exiting from an intermodal facility, a location with good access to major interstates and highways is important. In addition, excellent rail access is a prime requirement. Airport access t is beneficial if time sensitively and high value commodities are being shipped. The distance to the port should be minimized, if possible. Table 4.1 identifies a number of ideal characteristics to be considered in locating an intermodal facility. In terms of market access, intermodal facilities should be able to economically access markets in a 300 mile radius of its location. This market access allows for cost savings by reducing the total number of intermodal facilities necessary to accommodate customers and shipments. Fewer intermodal facilities mean less capital expenditure on multiple intermodal projects. Twenty thousand lifts per year is a rough estimate of 50% of the lifting capacity of the most economically priced lift devices. For a transshipment location served only by truck, twenty-five to thirty-five miles from port of entry allows truck drivers to make multiple trips each day when factoring in traffic and queue times at each facility location. If rail access were provided the optimal distance could increase significantly. As will be discussed in more detail, the more modes of transportation that an intermodal facility has access to the more capacity opportunities exist for that location. Whether it is by road -interstate and other highways, by river - inland canals or rivers, by rail, or by runway - airports, the inclusion of multiple modes of transportation allow managers to optimize shipping from each locale.
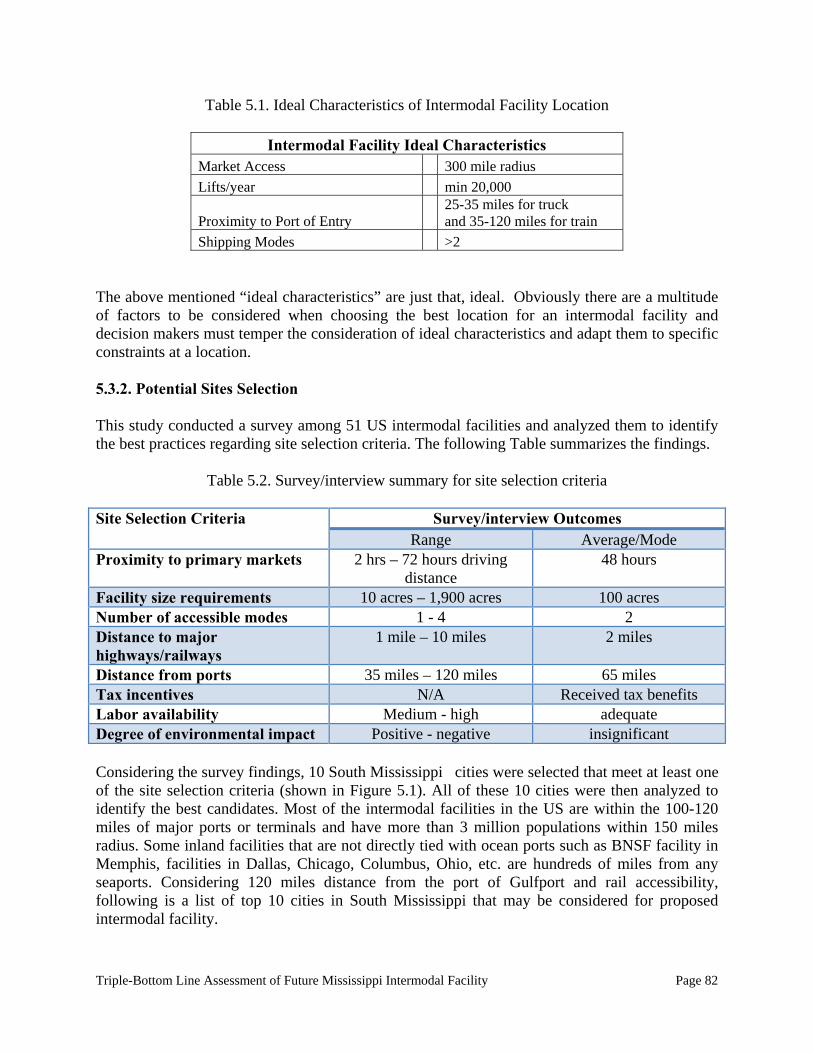
Triple-Bottom Line Assessment of Future Mississippi Intermodal Facility Page 82
Table 5.1. Ideal Characteristics of Intermodal Facility Location
Intermodal Facility Ideal Characteristics Market Access 300 mile radius
Lifts/year min 20,000
Proximity to Port of Entry 25-35 miles for truck and 35-120 miles for train
Shipping Modes >2
The above mentioned “ideal characteristics” are just that, ideal. Obviously there are a multitude of factors to be considered when choosing the best location for an intermodal facility and decision makers must temper the consideration of ideal characteristics and adapt them to specific constraints at a location. 5.3.2. Potential Sites Selection This study conducted a survey among 51 US intermodal facilities and analyzed them to identify the best practices regarding site selection criteria. The following Table summarizes the findings.
Table 5.2. Survey/interview summary for site selection criteria Site Selection Criteria Survey/interview Outcomes
Range Average/Mode Proximity to primary markets 2 hrs – 72 hours driving
distance 48 hours
Facility size requirements 10 acres – 1,900 acres 100 acres Number of accessible modes 1 - 4 2 Distance to major highways/railways
1 mile – 10 miles 2 miles
Distance from ports 35 miles – 120 miles 65 miles Tax incentives N/A Received tax benefits Labor availability Medium - high adequate Degree of environmental impact Positive - negative insignificant Considering the survey findings, 10 South Mississippi cities were selected that meet at least one of the site selection criteria (shown in Figure 5.1). All of these 10 cities were then analyzed to identify the best candidates. Most of the intermodal facilities in the US are within the 100-120 miles of major ports or terminals and have more than 3 million populations within 150 miles radius. Some inland facilities that are not directly tied with ocean ports such as BNSF facility in Memphis, facilities in Dallas, Chicago, Columbus, Ohio, etc. are hundreds of miles from any seaports. Considering 120 miles distance from the port of Gulfport and rail accessibility, following is a list of top 10 cities in South Mississippi that may be considered for proposed intermodal facility.
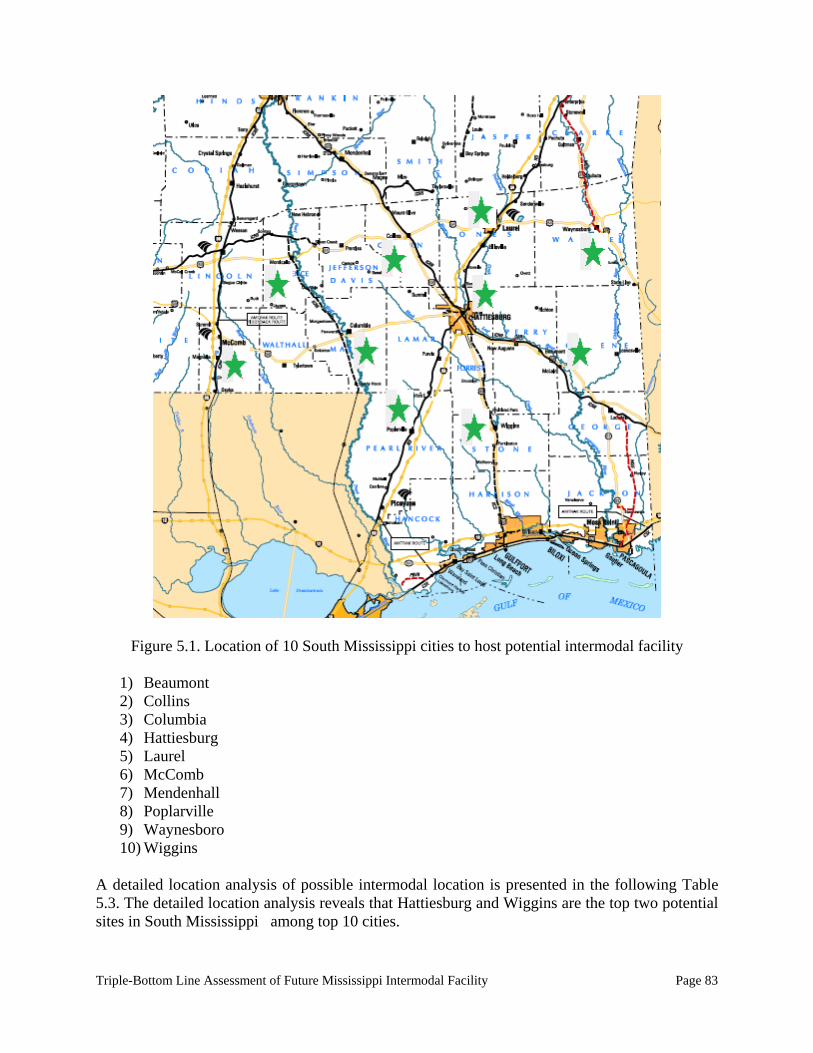
Triple-Bottom Line Assessment of Future Mississippi Intermodal Facility Page 83
Figure 5.1. Location of 10 South Mississippi cities to host potential intermodal facility
1) Beaumont 2) Collins 3) Columbia 4) Hattiesburg 5) Laurel 6) McComb 7) Mendenhall 8) Poplarville 9) Waynesboro 10) Wiggins
A detailed location analysis of possible intermodal location is presented in the following Table 5.3. The detailed location analysis reveals that Hattiesburg and Wiggins are the top two potential sites in South Mississippi among top 10 cities.
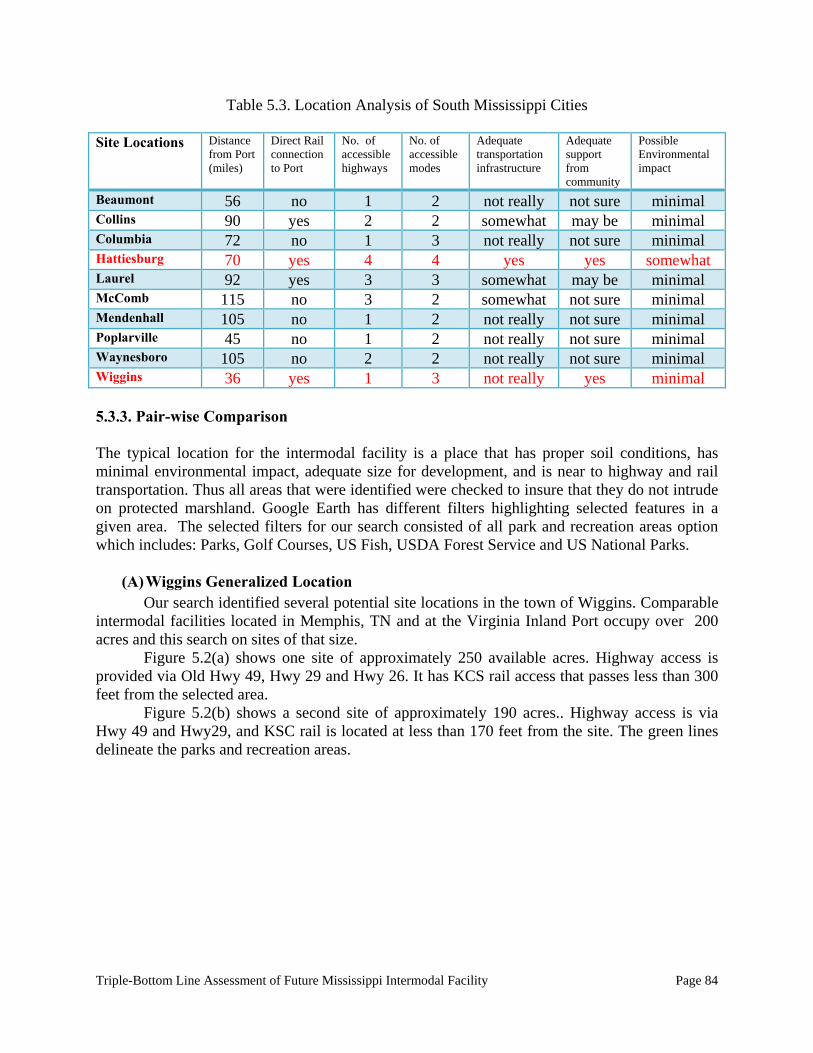
Triple-Bottom Line Assessment of Future Mississippi Intermodal Facility Page 84
Table 5.3. Location Analysis of South Mississippi Cities
Site Locations Distance from Port (miles)
Direct Rail connection to Port
No. of accessible highways
No. of accessible modes
Adequate transportation infrastructure
Adequate support from community
Possible Environmental impact
Beaumont 56 no 1 2 not really not sure minimal Collins 90 yes 2 2 somewhat may be minimal Columbia 72 no 1 3 not really not sure minimal Hattiesburg 70 yes 4 4 yes yes somewhat Laurel 92 yes 3 3 somewhat may be minimal McComb 115 no 3 2 somewhat not sure minimal Mendenhall 105 no 1 2 not really not sure minimal Poplarville 45 no 1 2 not really not sure minimal Waynesboro 105 no 2 2 not really not sure minimal Wiggins 36 yes 1 3 not really yes minimal 5.3.3. Pair-wise Comparison The typical location for the intermodal facility is a place that has proper soil conditions, has minimal environmental impact, adequate size for development, and is near to highway and rail transportation. Thus all areas that were identified were checked to insure that they do not intrude on protected marshland. Google Earth has different filters highlighting selected features in a given area. The selected filters for our search consisted of all park and recreation areas option which includes: Parks, Golf Courses, US Fish, USDA Forest Service and US National Parks.
(A) Wiggins Generalized Location Our search identified several potential site locations in the town of Wiggins. Comparable intermodal facilities located in Memphis, TN and at the Virginia Inland Port occupy over 200 acres and this search on sites of that size. Figure 5.2(a) shows one site of approximately 250 available acres. Highway access is provided via Old Hwy 49, Hwy 29 and Hwy 26. It has KCS rail access that passes less than 300 feet from the selected area. Figure 5.2(b) shows a second site of approximately 190 acres.. Highway access is via Hwy 49 and Hwy29, and KSC rail is located at less than 170 feet from the site. The green lines delineate the parks and recreation areas.
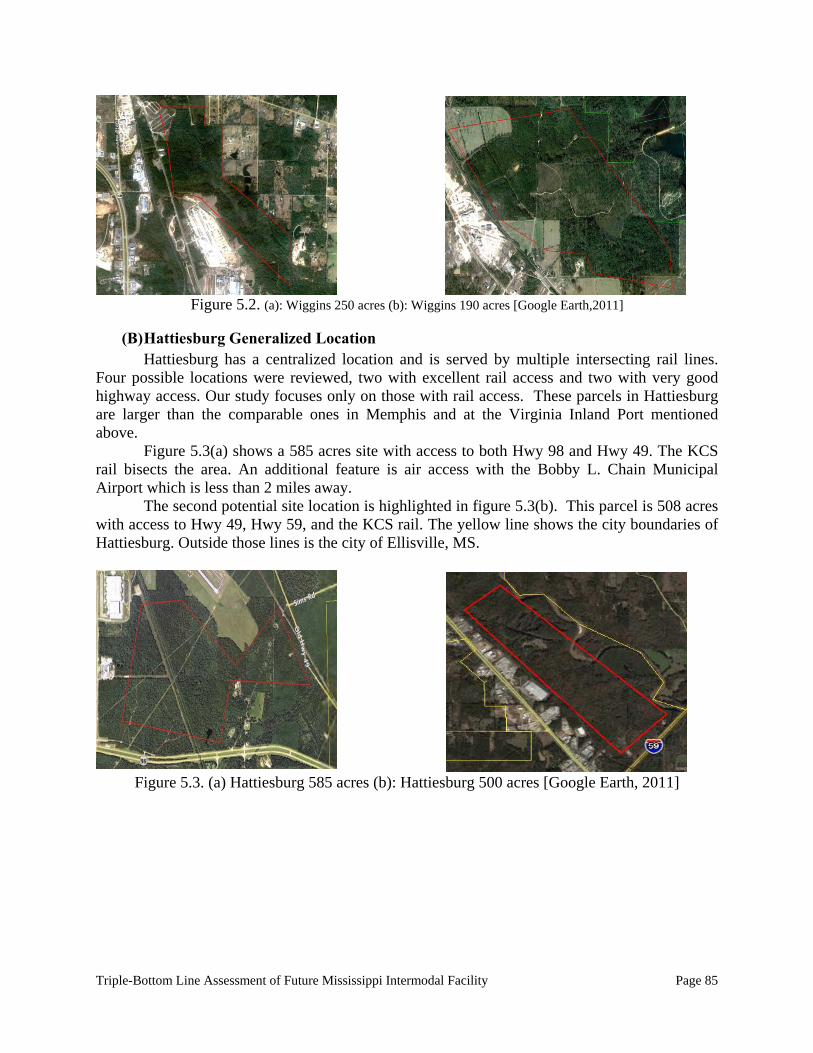
Triple-Bottom Line Assessment of Future Mississippi Intermodal Facility Page 85
Figure 5.2. (a): Wiggins 250 acres (b): Wiggins 190 acres [Google Earth,2011]
(B) Hattiesburg Generalized Location
Hattiesburg has a centralized location and is served by multiple intersecting rail lines. Four possible locations were reviewed, two with excellent rail access and two with very good highway access. Our study focuses only on those with rail access. These parcels in Hattiesburg are larger than the comparable ones in Memphis and at the Virginia Inland Port mentioned above. Figure 5.3(a) shows a 585 acres site with access to both Hwy 98 and Hwy 49. The KCS rail bisects the area. An additional feature is air access with the Bobby L. Chain Municipal Airport which is less than 2 miles away. The second potential site location is highlighted in figure 5.3(b). This parcel is 508 acres with access to Hwy 49, Hwy 59, and the KCS rail. The yellow line shows the city boundaries of Hattiesburg. Outside those lines is the city of Ellisville, MS.
Figure 5.3. (a) Hattiesburg 585 acres (b): Hattiesburg 500 acres [Google Earth, 2011]
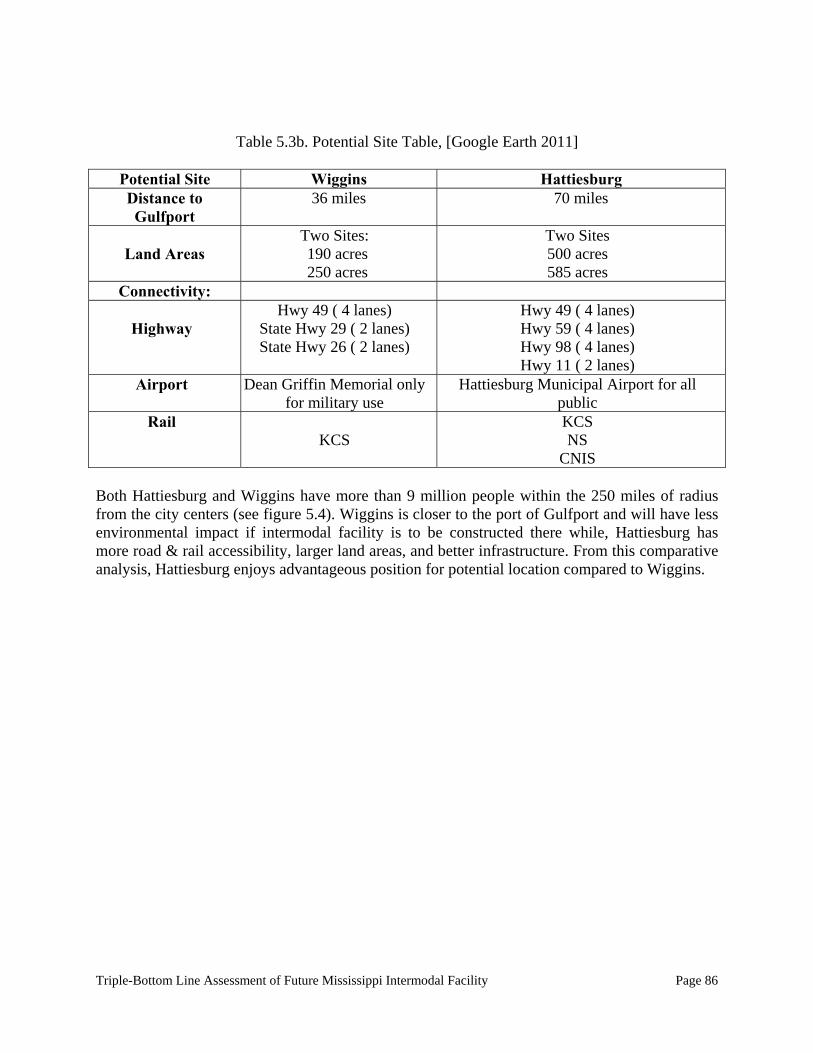
Triple-Bottom Line Assessment of Future Mississippi Intermodal Facility Page 86
Table 5.3b. Potential Site Table, [Google Earth 2011]
Potential Site Wiggins Hattiesburg Distance to Gulfport
36 miles 70 miles
Land Areas
Two Sites: 190 acres 250 acres
Two Sites 500 acres 585 acres
Connectivity:
Highway Hwy 49 ( 4 lanes)
State Hwy 29 ( 2 lanes) State Hwy 26 ( 2 lanes)
Hwy 49 ( 4 lanes) Hwy 59 ( 4 lanes) Hwy 98 ( 4 lanes) Hwy 11 ( 2 lanes)
Airport Dean Griffin Memorial only for military use
Hattiesburg Municipal Airport for all public
Rail KCS
KCS NS
CNIS Both Hattiesburg and Wiggins have more than 9 million people within the 250 miles of radius from the city centers (see figure 5.4). Wiggins is closer to the port of Gulfport and will have less environmental impact if intermodal facility is to be constructed there while, Hattiesburg has more road & rail accessibility, larger land areas, and better infrastructure. From this comparative analysis, Hattiesburg enjoys advantageous position for potential location compared to Wiggins.
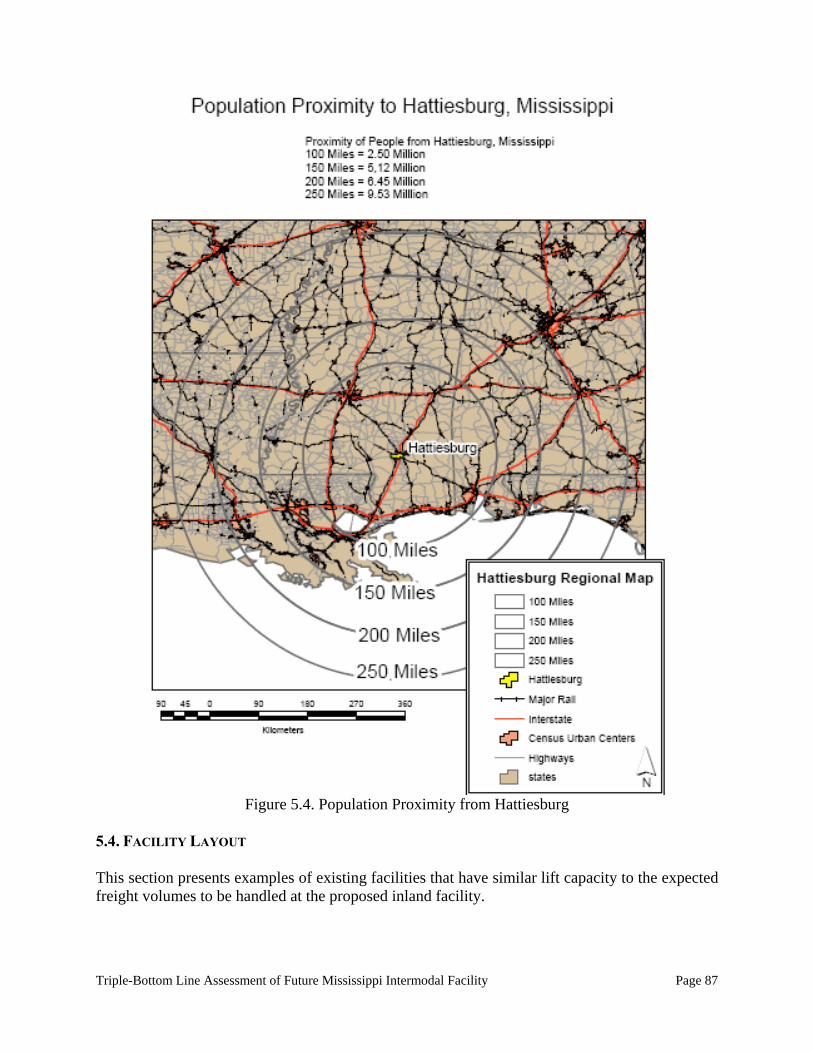
Triple-Bottom Line Assessment of Future Mississippi Intermodal Facility Page 87
Figure 5.4. Population Proximity from Hattiesburg
5.4. FACILITY LAYOUT This section presents examples of existing facilities that have similar lift capacity to the expected freight volumes to be handled at the proposed inland facility.
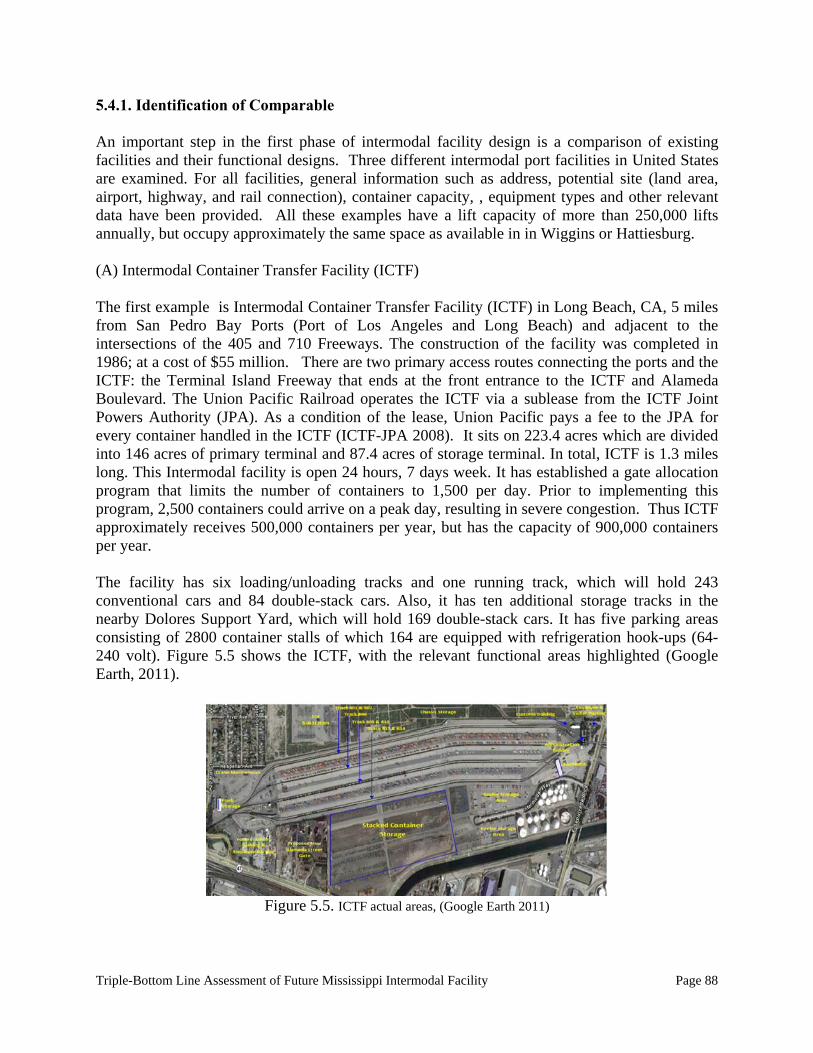
Triple-Bottom Line Assessment of Future Mississippi Intermodal Facility Page 88
5.4.1. Identification of Comparable An important step in the first phase of intermodal facility design is a comparison of existing facilities and their functional designs. Three different intermodal port facilities in United States are examined. For all facilities, general information such as address, potential site (land area, airport, highway, and rail connection), container capacity, , equipment types and other relevant data have been provided. All these examples have a lift capacity of more than 250,000 lifts annually, but occupy approximately the same space as available in in Wiggins or Hattiesburg. (A) Intermodal Container Transfer Facility (ICTF) The first example is Intermodal Container Transfer Facility (ICTF) in Long Beach, CA, 5 miles from San Pedro Bay Ports (Port of Los Angeles and Long Beach) and adjacent to the intersections of the 405 and 710 Freeways. The construction of the facility was completed in 1986; at a cost of $55 million. There are two primary access routes connecting the ports and the ICTF: the Terminal Island Freeway that ends at the front entrance to the ICTF and Alameda Boulevard. The Union Pacific Railroad operates the ICTF via a sublease from the ICTF Joint Powers Authority (JPA). As a condition of the lease, Union Pacific pays a fee to the JPA for every container handled in the ICTF (ICTF-JPA 2008). It sits on 223.4 acres which are divided into 146 acres of primary terminal and 87.4 acres of storage terminal. In total, ICTF is 1.3 miles long. This Intermodal facility is open 24 hours, 7 days week. It has established a gate allocation program that limits the number of containers to 1,500 per day. Prior to implementing this program, 2,500 containers could arrive on a peak day, resulting in severe congestion. Thus ICTF approximately receives 500,000 containers per year, but has the capacity of 900,000 containers per year. The facility has six loading/unloading tracks and one running track, which will hold 243 conventional cars and 84 double-stack cars. Also, it has ten additional storage tracks in the nearby Dolores Support Yard, which will hold 169 double-stack cars. It has five parking areas consisting of 2800 container stalls of which 164 are equipped with refrigeration hook-ups (64-240 volt). Figure 5.5 shows the ICTF, with the relevant functional areas highlighted (Google Earth, 2011).
Figure 5.5. ICTF actual areas, (Google Earth 2011)
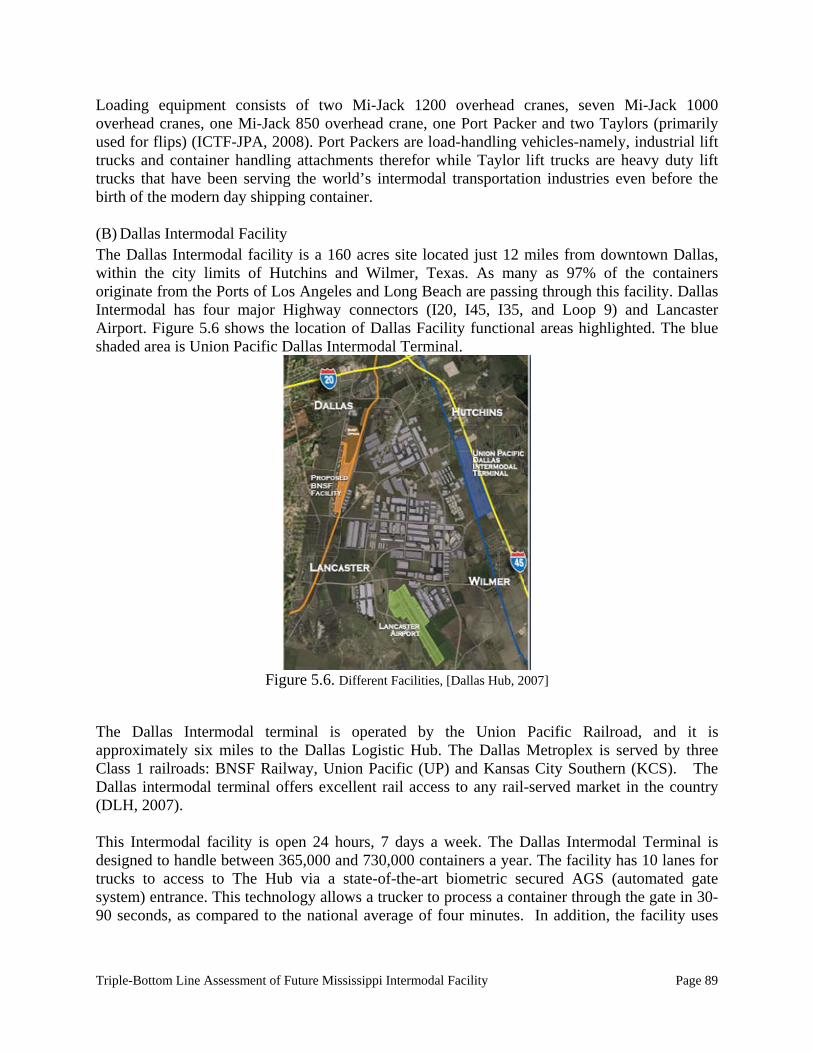
Triple-Bottom Line Assessment of Future Mississippi Intermodal Facility Page 89
Loading equipment consists of two Mi-Jack 1200 overhead cranes, seven Mi-Jack 1000 overhead cranes, one Mi-Jack 850 overhead crane, one Port Packer and two Taylors (primarily used for flips) (ICTF-JPA, 2008). Port Packers are load-handling vehicles-namely, industrial lift trucks and container handling attachments therefor while Taylor lift trucks are heavy duty lift trucks that have been serving the world’s intermodal transportation industries even before the birth of the modern day shipping container. (B) Dallas Intermodal Facility The Dallas Intermodal facility is a 160 acres site located just 12 miles from downtown Dallas, within the city limits of Hutchins and Wilmer, Texas. As many as 97% of the containers originate from the Ports of Los Angeles and Long Beach are passing through this facility. Dallas Intermodal has four major Highway connectors (I20, I45, I35, and Loop 9) and Lancaster Airport. Figure 5.6 shows the location of Dallas Facility functional areas highlighted. The blue shaded area is Union Pacific Dallas Intermodal Terminal.
Figure 5.6. Different Facilities, [Dallas Hub, 2007]
The Dallas Intermodal terminal is operated by the Union Pacific Railroad, and it is approximately six miles to the Dallas Logistic Hub. The Dallas Metroplex is served by three Class 1 railroads: BNSF Railway, Union Pacific (UP) and Kansas City Southern (KCS). The Dallas intermodal terminal offers excellent rail access to any rail-served market in the country (DLH, 2007). This Intermodal facility is open 24 hours, 7 days a week. The Dallas Intermodal Terminal is designed to handle between 365,000 and 730,000 containers a year. The facility has 10 lanes for trucks to access to The Hub via a state-of-the-art biometric secured AGS (automated gate system) entrance. This technology allows a trucker to process a container through the gate in 30-90 seconds, as compared to the national average of four minutes. In addition, the facility uses
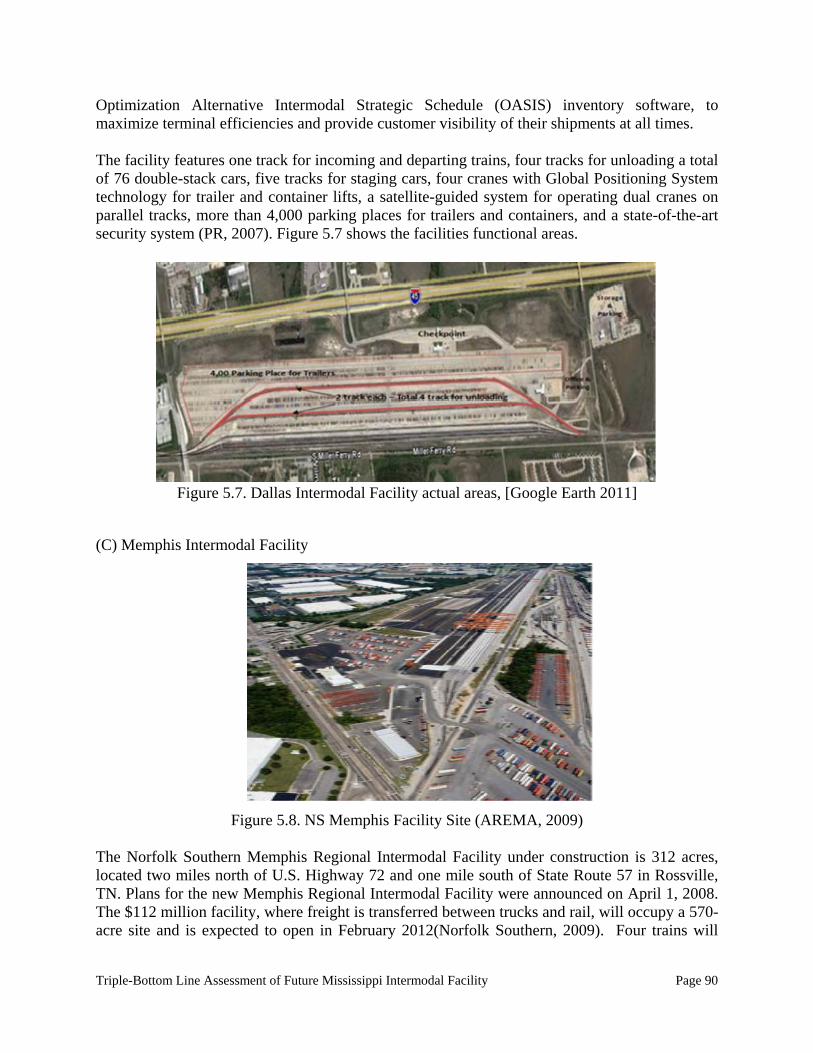
Triple-Bottom Line Assessment of Future Mississippi Intermodal Facility Page 90
Optimization Alternative Intermodal Strategic Schedule (OASIS) inventory software, to maximize terminal efficiencies and provide customer visibility of their shipments at all times. The facility features one track for incoming and departing trains, four tracks for unloading a total of 76 double-stack cars, five tracks for staging cars, four cranes with Global Positioning System technology for trailer and container lifts, a satellite-guided system for operating dual cranes on parallel tracks, more than 4,000 parking places for trailers and containers, and a state-of-the-art security system (PR, 2007). Figure 5.7 shows the facilities functional areas.
Figure 5.7. Dallas Intermodal Facility actual areas, [Google Earth 2011]
(C) Memphis Intermodal Facility
Figure 5.8. NS Memphis Facility Site (AREMA, 2009) The Norfolk Southern Memphis Regional Intermodal Facility under construction is 312 acres, located two miles north of U.S. Highway 72 and one mile south of State Route 57 in Rossville, TN. Plans for the new Memphis Regional Intermodal Facility were announced on April 1, 2008. The $112 million facility, where freight is transferred between trucks and rail, will occupy a 570-acre site and is expected to open in February 2012(Norfolk Southern, 2009). Four trains will
Triple-Bottom Line Assessment of Future Mississippi Intermodal Facility Page 91
arrive and depart the facility daily. The innovative intermodal facility will use rail-mounted wide-span cranes and an automated gate system. This reduces the time for each inspection from three to four minutes per unit to less than 90 seconds for inbound and less than 60 seconds for outbound inspections. The automated gate system (AGS) photos are stored electronically to defend against possible future damage claims (AREMA, 2009). The figure 5.8 shows the facility completed as of June 2009 with the AGS being the first portion of the facility to go into service. Drivers are also identified using a biometric system. These enhancements have increased security, while improving throughput, reducing truck idling time and emissions by 50 percent. The expansion increases the facility’s capacity from 250,000 annual cargo lifts to more than 1 million annual lifts. The facility also has 2,177 paved trailer/container parking spaces and the ability to stack more than 6,000 40-foot containers (Smith, 2010).
5.4.2. Facility Layout The proposed facility at the south Mississippi will most probably be a rail intermodal facility. This section of the report describes some theoretical background of layout design and relates with the comparable designs discussed in the previous section. According to literature an intermodal rail facility can be characterized by the following. (a) Task division between modes with respect to the short-haul and long-haul parts of the chain. Intermodal rail–truck freight transport typically includes the division of tasks between the short- and long-haul, as well as the synchronization of schedules. The rail haul involves large transport units that require the bundling of freight flows in order to reduce transport costs, which is a common objective in transportation. (b) Synchronized and seamless schedules between different modes. The synchronization of itineraries implies that freight transportation would arrive with no problems and that the intermodal facility flow with no delays and that everything goes according to the previously determined itinerary. (c) The use of standardized load units, which increases the efficiency in the transport chain. Many commodities can be handled by standardized transport and transfer equipment, and they can easily switch between any sequences of modes (Van Duin et al. 2002). When speaking of design, it is important to note the difference between drayage and rail-haul. Drayage operations take place by truck between a terminal and shippers or receivers. Drayage operations have some distinct features, which differ from simple pickup and delivery in rail and road transport. Despite the relatively short distance of the truck movement compared to the rail line haul, drayage accounts for a large fraction (between 25% and 40%) of origin to destination expenses (Bontekoning et al. 2004). High drayage costs seriously affect the profitability of intermodal service, and also limit the markets in which it can compete with road service. The rail haul is the terminal-to-terminal segment of the door-to-door intermodal trip. The intermodal rail transport distinguishes itself from traditional rail in four areas (Bontekoning et al, 2004). First, in intermodal transport, fixed schedules are used, while in traditional rail haul networks, trains run only when full and a lot of classification at intermediate nodes takes place.
Triple-Bottom Line Assessment of Future Mississippi Intermodal Facility Page 92
Second, fleet management issues in intermodal transport are more complex, because of the separation of the transport unit (rail flatcar) and the load unit (container/trailer). One aspect of the flatcar management problem is the tremendous variety of flatcars (including double stack cars), along with the variety of trailers and containers that the flatcars need to move. In contrast, in traditional rail transport, only boxcars (loaded and unloaded) are modeled. Third, because the transport unit can be separated from the load unit, rail–rail transshipment terminals can replace intermediate rail yards for classification. Fourth, location decisions for intermodal rail–road terminals are different from rail yards, as the former needs to connect two types of infrastructures. It is essentially to identify the optimum places and to incorporate the shipper’s objectives, the terminals operators, and objectives of consignees and carriers. Another objective of the most decisive factors is the location of potential clients since it is always good to have them close, this way sales can increase (Van Duin et al., 2002). Another of the articles for this investigation explain generic framework for consolidation and routing principles in a transport network. The framework consists of six significantly different theoretical designs: direct link, corridor, hub-and-spoke, connected hubs, static routes, and dynamic routes. The six designs shown below do not necessarily show all of the possible options to the freight transportation, because construction depends on geography, demography, infrastructure and the demand for transportation. Some designs are superfluous or strictly theoretical and the application of hybrids of designs is common. The terminology suggested here is kept on a level between abstract and applied. An abstract terminology would consistently use nodes and links. The advantage of using a compromise is that the theoretical rigor is regarded as acceptable, while familiarity is ensured for both researchers and practitioners. The figure 5.9 takes the perspective of a transport system operator. A fixed example with ten nodes illustrates the different links used for a transport assignment from the origin (O) to the destination (D) (Woxenius, 2007). The theory is based on the premise that an adequate supply of infrastructure allows direct links between all terminals of the network and that all terminals are capable of serving as source and destination and transfer points. Below is some general information about the six different designs: • In the direct link alternative, transport is obviously direct from O to D, and there is no
coordination with transport between other O-D pairs. • In the transport corridor is a design based on using a high-density flow along an artery and
short capillary services to nodes off the corridor. • In the hub-and-spoke layout, one node is designated the hub, and all transports call this node
for transfer, even for transports between adjacent origins and destinations. • In the connected hubs design is another hierarchical layout in which local flows are collected
at hubs that in turn are connected to other hubs in other regions. • In the static routes design, the transport operator designates a number of links to use on a
regular basis. Usually, only a part of the load is transferred, and the rest stays on the transport means to the next node.
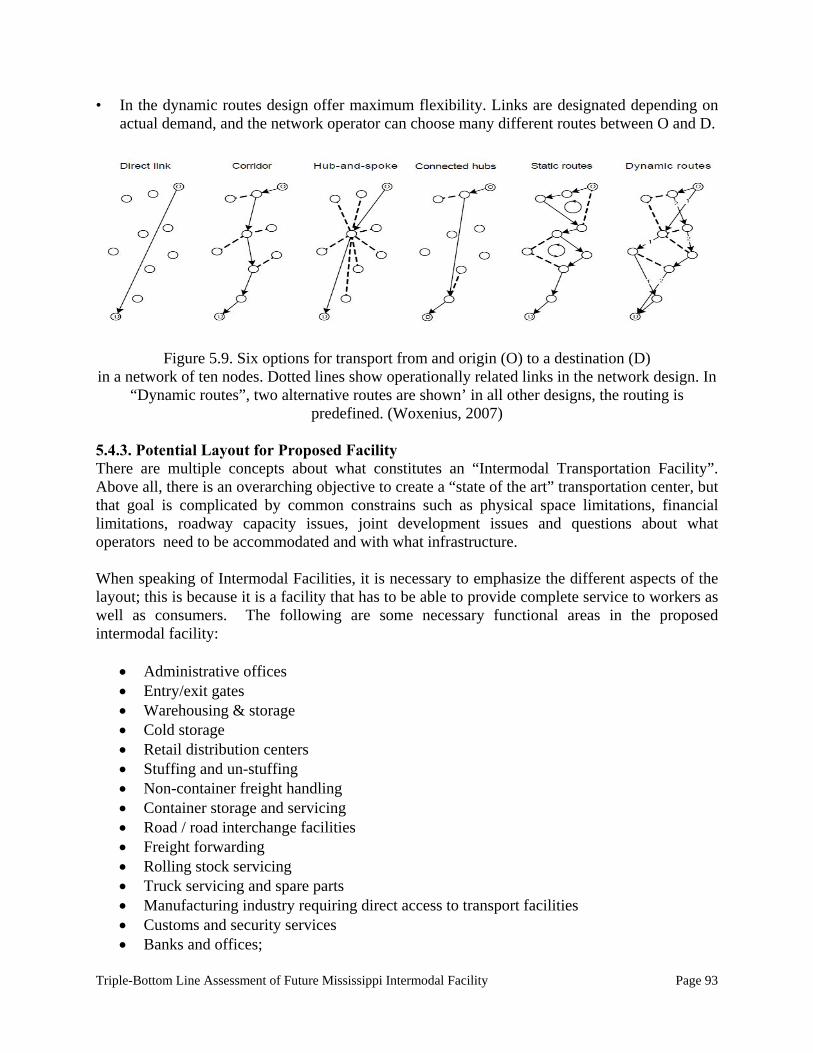
Triple-Bottom Line Assessment of Future Mississippi Intermodal Facility Page 93
• In the dynamic routes design offer maximum flexibility. Links are designated depending on actual demand, and the network operator can choose many different routes between O and D.
Figure 5.9. Six options for transport from and origin (O) to a destination (D)
in a network of ten nodes. Dotted lines show operationally related links in the network design. In “Dynamic routes”, two alternative routes are shown’ in all other designs, the routing is
predefined. (Woxenius, 2007) 5.4.3. Potential Layout for Proposed Facility There are multiple concepts about what constitutes an “Intermodal Transportation Facility”. Above all, there is an overarching objective to create a “state of the art” transportation center, but that goal is complicated by common constrains such as physical space limitations, financial limitations, roadway capacity issues, joint development issues and questions about what operators need to be accommodated and with what infrastructure. When speaking of Intermodal Facilities, it is necessary to emphasize the different aspects of the layout; this is because it is a facility that has to be able to provide complete service to workers as well as consumers. The following are some necessary functional areas in the proposed intermodal facility:
Administrative offices Entry/exit gates Warehousing & storage Cold storage Retail distribution centers Stuffing and un-stuffing Non-container freight handling Container storage and servicing Road / road interchange facilities Freight forwarding Rolling stock servicing Truck servicing and spare parts Manufacturing industry requiring direct access to transport facilities Customs and security services Banks and offices;
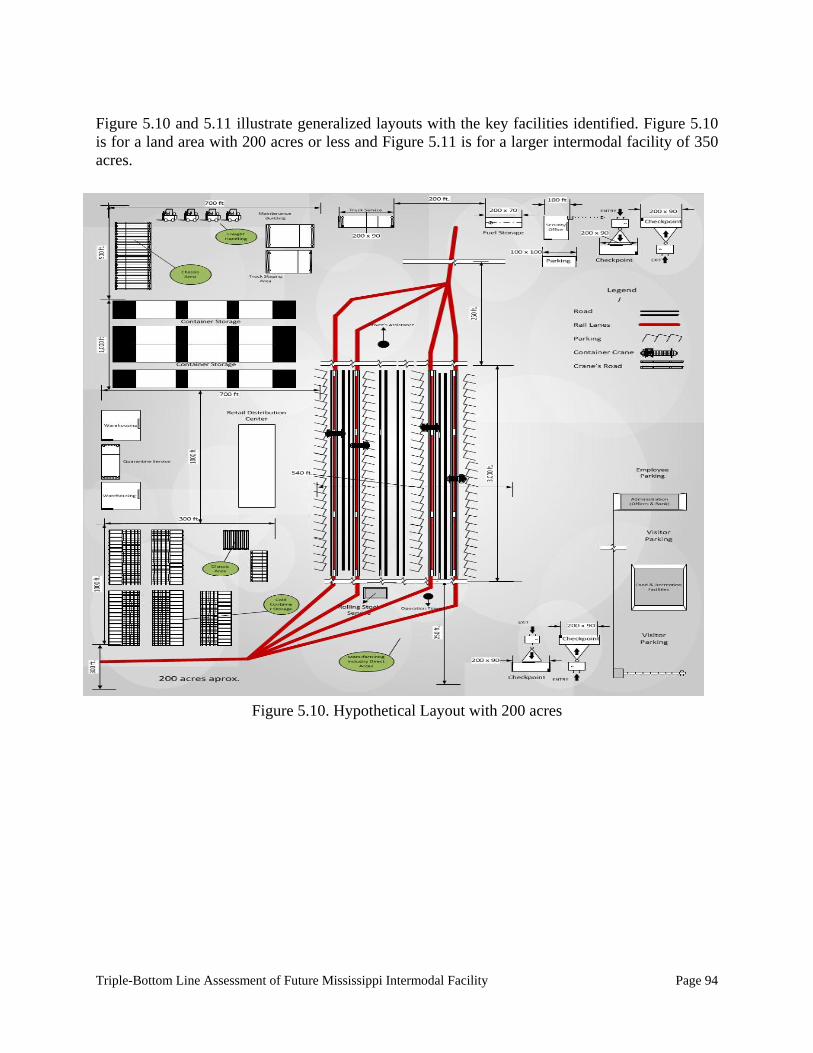
Triple-Bottom Line Assessment of Future Mississippi Intermodal Facility Page 94
Figure 5.10 and 5.11 illustrate generalized layouts with the key facilities identified. Figure 5.10 is for a land area with 200 acres or less and Figure 5.11 is for a larger intermodal facility of 350 acres.
Figure 5.10. Hypothetical Layout with 200 acres
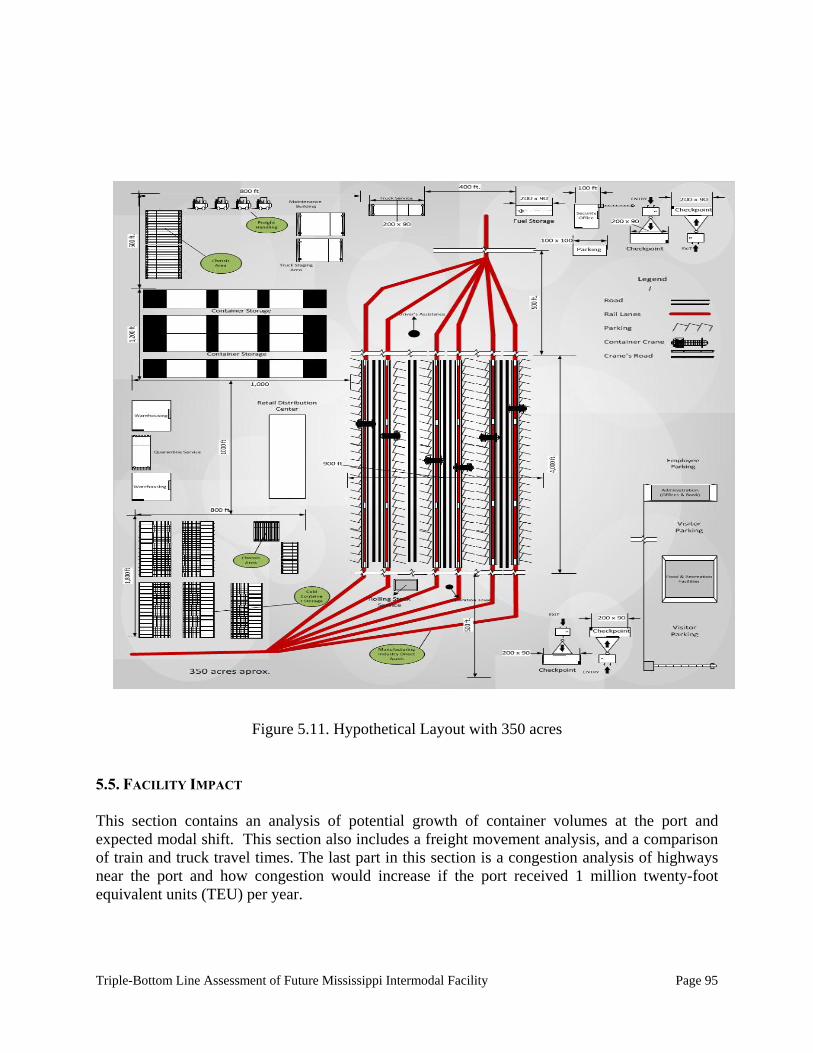
Triple-Bottom Line Assessment of Future Mississippi Intermodal Facility Page 95
Figure 5.11. Hypothetical Layout with 350 acres
5.5. FACILITY IMPACT This section contains an analysis of potential growth of container volumes at the port and expected modal shift. This section also includes a freight movement analysis, and a comparison of train and truck travel times. The last part in this section is a congestion analysis of highways near the port and how congestion would increase if the port received 1 million twenty-foot equivalent units (TEU) per year.
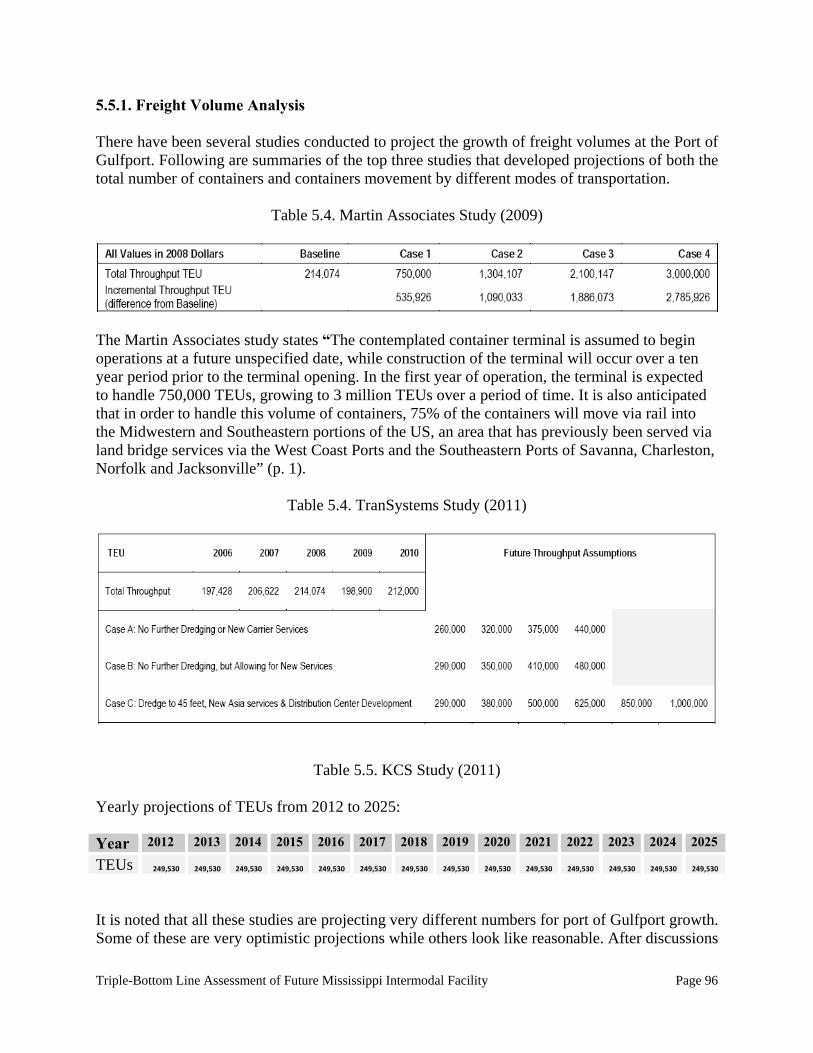
Triple-Bottom Line Assessment of Future Mississippi Intermodal Facility Page 96
5.5.1. Freight Volume Analysis There have been several studies conducted to project the growth of freight volumes at the Port of Gulfport. Following are summaries of the top three studies that developed projections of both the total number of containers and containers movement by different modes of transportation.
Table 5.4. Martin Associates Study (2009)
The Martin Associates study states “The contemplated container terminal is assumed to begin operations at a future unspecified date, while construction of the terminal will occur over a ten year period prior to the terminal opening. In the first year of operation, the terminal is expected to handle 750,000 TEUs, growing to 3 million TEUs over a period of time. It is also anticipated that in order to handle this volume of containers, 75% of the containers will move via rail into the Midwestern and Southeastern portions of the US, an area that has previously been served via land bridge services via the West Coast Ports and the Southeastern Ports of Savanna, Charleston, Norfolk and Jacksonville” (p. 1).
Table 5.4. TranSystems Study (2011)
Table 5.5. KCS Study (2011)
Yearly projections of TEUs from 2012 to 2025: Year 2012 2013 2014 2015 2016 2017 2018 2019 2020 2021 2022 2023 2024 2025
TEUs 249,530 249,530 249,530 249,530 249,530 249,530 249,530 249,530 249,530 249,530 249,530 249,530 249,530 249,530
It is noted that all these studies are projecting very different numbers for port of Gulfport growth. Some of these are very optimistic projections while others look like reasonable. After discussions
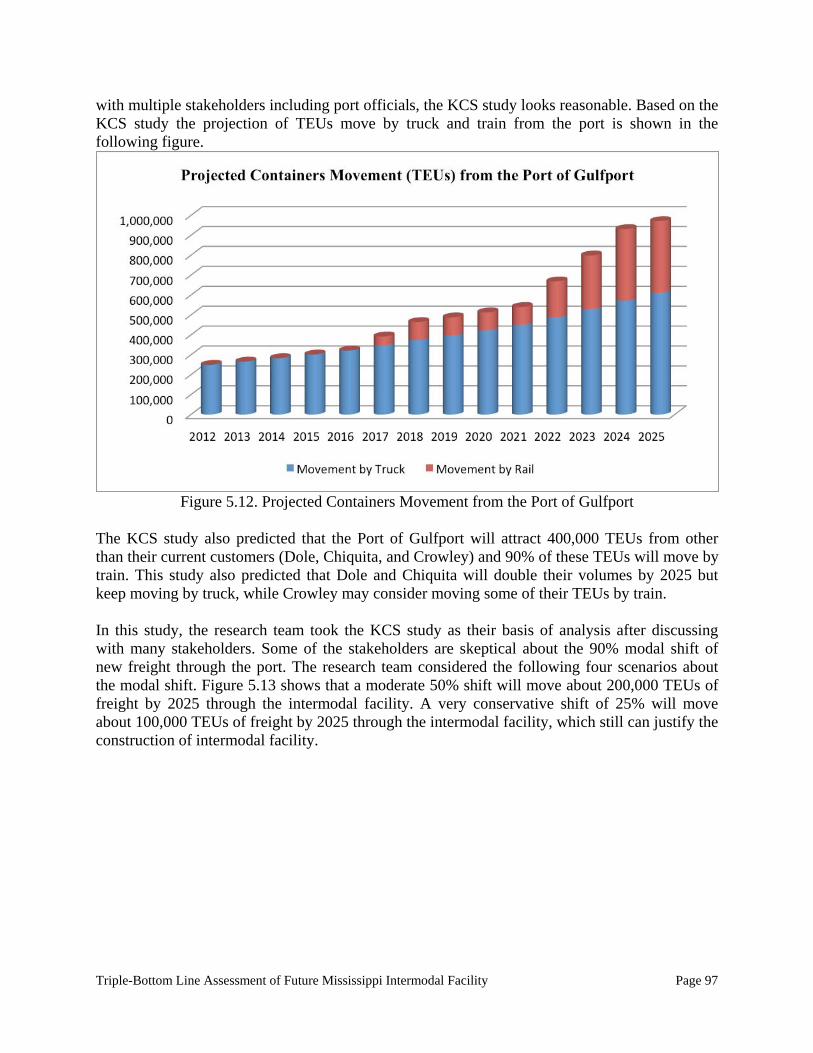
Triple-Bottom Line Assessment of Future Mississippi Intermodal Facility Page 97
with multiple stakeholders including port officials, the KCS study looks reasonable. Based on the KCS study the projection of TEUs move by truck and train from the port is shown in the following figure.
Figure 5.12. Projected Containers Movement from the Port of Gulfport
The KCS study also predicted that the Port of Gulfport will attract 400,000 TEUs from other than their current customers (Dole, Chiquita, and Crowley) and 90% of these TEUs will move by train. This study also predicted that Dole and Chiquita will double their volumes by 2025 but keep moving by truck, while Crowley may consider moving some of their TEUs by train. In this study, the research team took the KCS study as their basis of analysis after discussing with many stakeholders. Some of the stakeholders are skeptical about the 90% modal shift of new freight through the port. The research team considered the following four scenarios about the modal shift. Figure 5.13 shows that a moderate 50% shift will move about 200,000 TEUs of freight by 2025 through the intermodal facility. A very conservative shift of 25% will move about 100,000 TEUs of freight by 2025 through the intermodal facility, which still can justify the construction of intermodal facility.
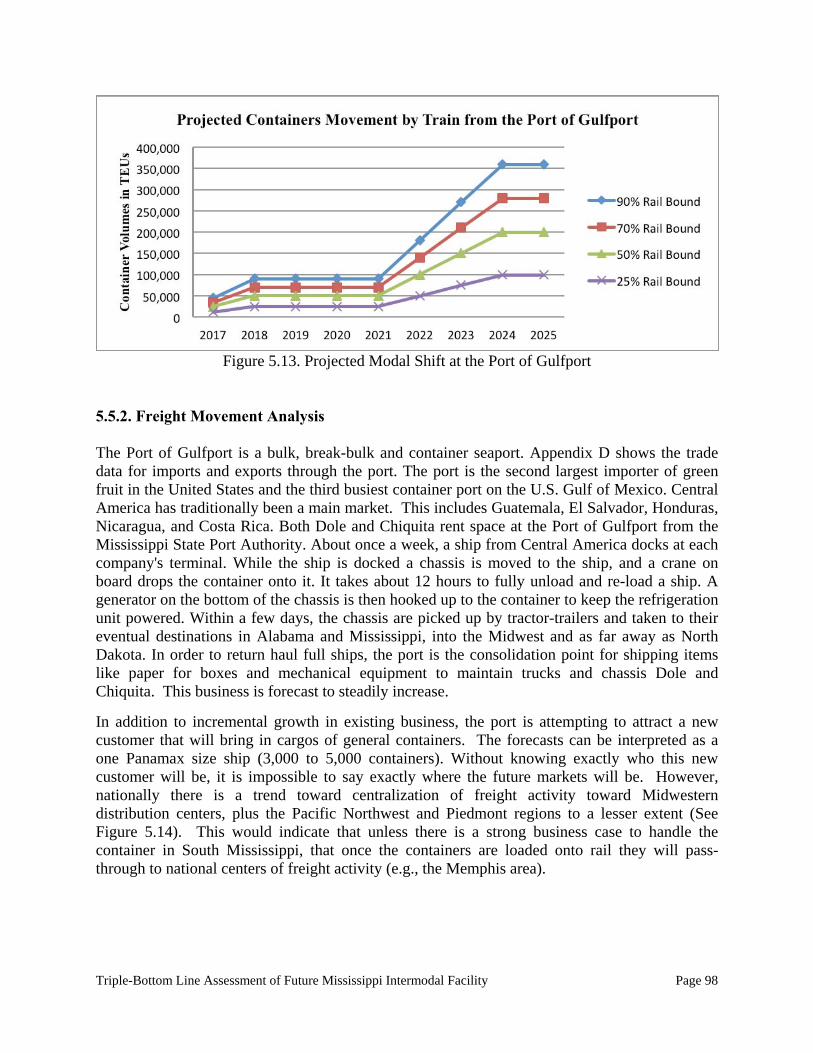
Triple-Bottom Line Assessment of Future Mississippi Intermodal Facility Page 98
Figure 5.13. Projected Modal Shift at the Port of Gulfport
5.5.2. Freight Movement Analysis The Port of Gulfport is a bulk, break-bulk and container seaport. Appendix D shows the trade data for imports and exports through the port. The port is the second largest importer of green fruit in the United States and the third busiest container port on the U.S. Gulf of Mexico. Central America has traditionally been a main market. This includes Guatemala, El Salvador, Honduras, Nicaragua, and Costa Rica. Both Dole and Chiquita rent space at the Port of Gulfport from the Mississippi State Port Authority. About once a week, a ship from Central America docks at each company's terminal. While the ship is docked a chassis is moved to the ship, and a crane on board drops the container onto it. It takes about 12 hours to fully unload and re-load a ship. A generator on the bottom of the chassis is then hooked up to the container to keep the refrigeration unit powered. Within a few days, the chassis are picked up by tractor-trailers and taken to their eventual destinations in Alabama and Mississippi, into the Midwest and as far away as North Dakota. In order to return haul full ships, the port is the consolidation point for shipping items like paper for boxes and mechanical equipment to maintain trucks and chassis Dole and Chiquita. This business is forecast to steadily increase.
In addition to incremental growth in existing business, the port is attempting to attract a new customer that will bring in cargos of general containers. The forecasts can be interpreted as a one Panamax size ship (3,000 to 5,000 containers). Without knowing exactly who this new customer will be, it is impossible to say exactly where the future markets will be. However, nationally there is a trend toward centralization of freight activity toward Midwestern distribution centers, plus the Pacific Northwest and Piedmont regions to a lesser extent (See Figure 5.14). This would indicate that unless there is a strong business case to handle the container in South Mississippi, that once the containers are loaded onto rail they will pass-through to national centers of freight activity (e.g., the Memphis area).
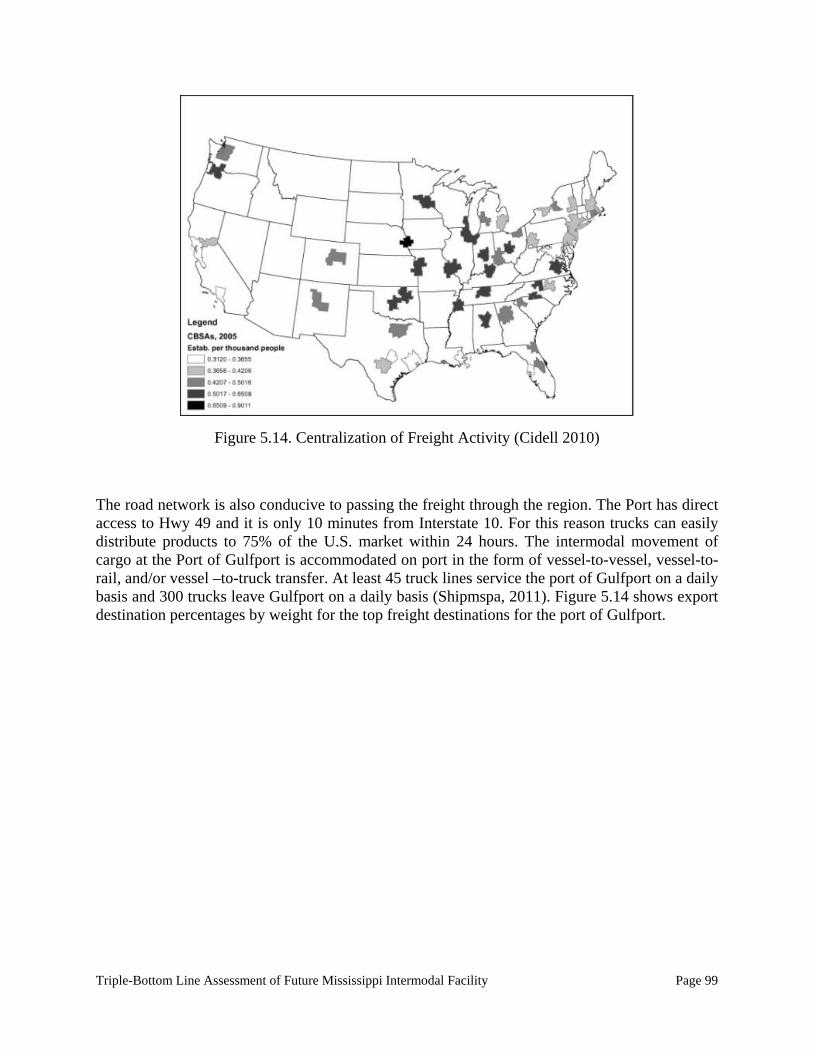
Triple-Bottom Line Assessment of Future Mississippi Intermodal Facility Page 99
Figure 5.14. Centralization of Freight Activity (Cidell 2010)
The road network is also conducive to passing the freight through the region. The Port has direct access to Hwy 49 and it is only 10 minutes from Interstate 10. For this reason trucks can easily distribute products to 75% of the U.S. market within 24 hours. The intermodal movement of cargo at the Port of Gulfport is accommodated on port in the form of vessel-to-vessel, vessel-to-rail, and/or vessel –to-truck transfer. At least 45 truck lines service the port of Gulfport on a daily basis and 300 trucks leave Gulfport on a daily basis (Shipmspa, 2011). Figure 5.14 shows export destination percentages by weight for the top freight destinations for the port of Gulfport.
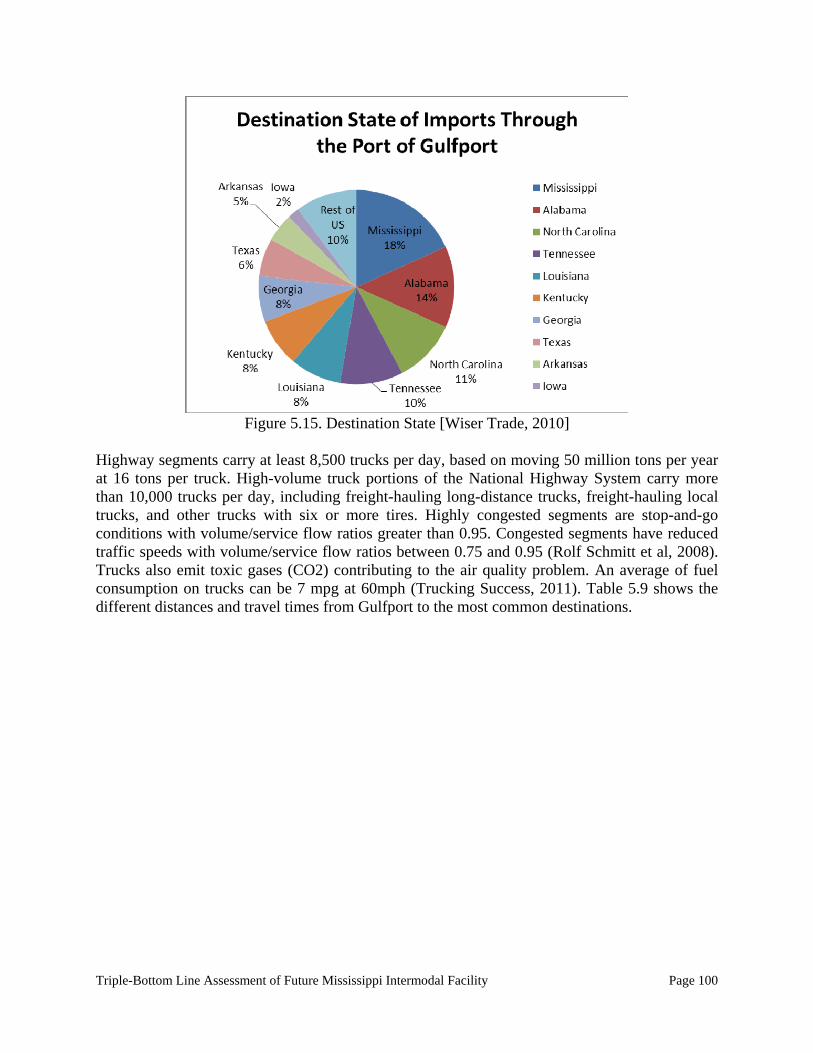
Triple-Bottom Line Assessment of Future Mississippi Intermodal Facility Page 100
Figure 5.15. Destination State [Wiser Trade, 2010]
Highway segments carry at least 8,500 trucks per day, based on moving 50 million tons per year at 16 tons per truck. High-volume truck portions of the National Highway System carry more than 10,000 trucks per day, including freight-hauling long-distance trucks, freight-hauling local trucks, and other trucks with six or more tires. Highly congested segments are stop-and-go conditions with volume/service flow ratios greater than 0.95. Congested segments have reduced traffic speeds with volume/service flow ratios between 0.75 and 0.95 (Rolf Schmitt et al, 2008). Trucks also emit toxic gases (CO2) contributing to the air quality problem. An average of fuel consumption on trucks can be 7 mpg at 60mph (Trucking Success, 2011). Table 5.9 shows the different distances and travel times from Gulfport to the most common destinations.
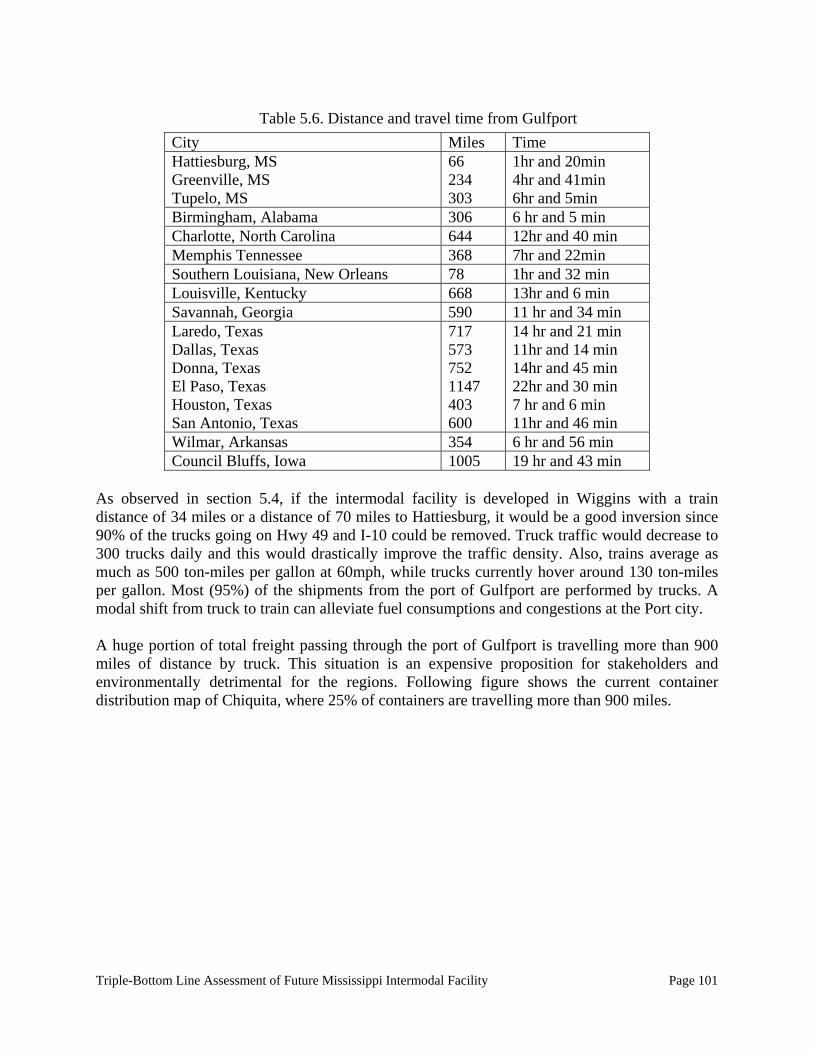
Triple-Bottom Line Assessment of Future Mississippi Intermodal Facility Page 101
City Miles Time Hattiesburg, MS Greenville, MS Tupelo, MS
66 234 303
1hr and 20min 4hr and 41min 6hr and 5min
Birmingham, Alabama 306 6 hr and 5 min Charlotte, North Carolina 644 12hr and 40 min Memphis Tennessee 368 7hr and 22min Southern Louisiana, New Orleans 78 1hr and 32 min Louisville, Kentucky 668 13hr and 6 min Savannah, Georgia 590 11 hr and 34 min Laredo, Texas Dallas, Texas Donna, Texas El Paso, Texas Houston, Texas San Antonio, Texas
717 573 752 1147 403 600
14 hr and 21 min 11hr and 14 min 14hr and 45 min 22hr and 30 min 7 hr and 6 min 11hr and 46 min
Wilmar, Arkansas 354 6 hr and 56 min Council Bluffs, Iowa 1005 19 hr and 43 min
As observed in section 5.4, if the intermodal facility is developed in Wiggins with a train distance of 34 miles or a distance of 70 miles to Hattiesburg, it would be a good inversion since 90% of the trucks going on Hwy 49 and I-10 could be removed. Truck traffic would decrease to 300 trucks daily and this would drastically improve the traffic density. Also, trains average as much as 500 ton-miles per gallon at 60mph, while trucks currently hover around 130 ton-miles per gallon. Most (95%) of the shipments from the port of Gulfport are performed by trucks. A modal shift from truck to train can alleviate fuel consumptions and congestions at the Port city. A huge portion of total freight passing through the port of Gulfport is travelling more than 900 miles of distance by truck. This situation is an expensive proposition for stakeholders and environmentally detrimental for the regions. Following figure shows the current container distribution map of Chiquita, where 25% of containers are travelling more than 900 miles.
Table 5.6. Distance and travel time from Gulfport
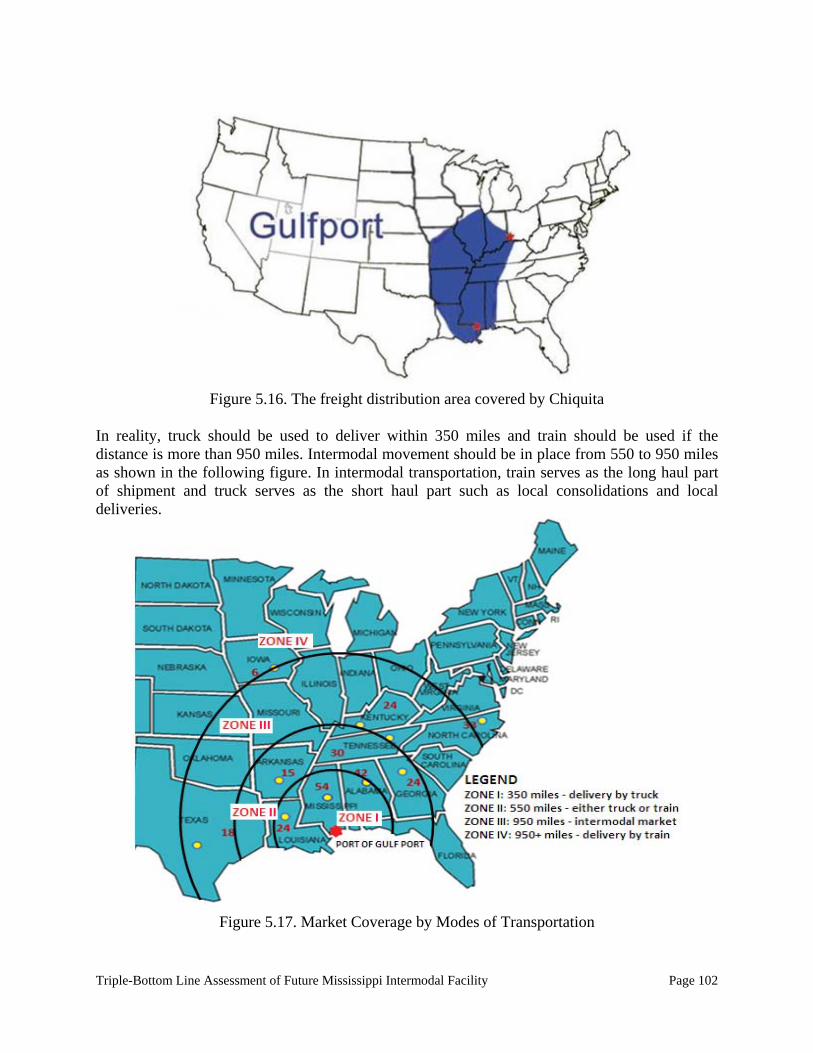
Triple-Bottom Line Assessment of Future Mississippi Intermodal Facility Page 102
Figure 5.16. The freight distribution area covered by Chiquita
In reality, truck should be used to deliver within 350 miles and train should be used if the distance is more than 950 miles. Intermodal movement should be in place from 550 to 950 miles as shown in the following figure. In intermodal transportation, train serves as the long haul part of shipment and truck serves as the short haul part such as local consolidations and local deliveries.
Figure 5.17. Market Coverage by Modes of Transportation
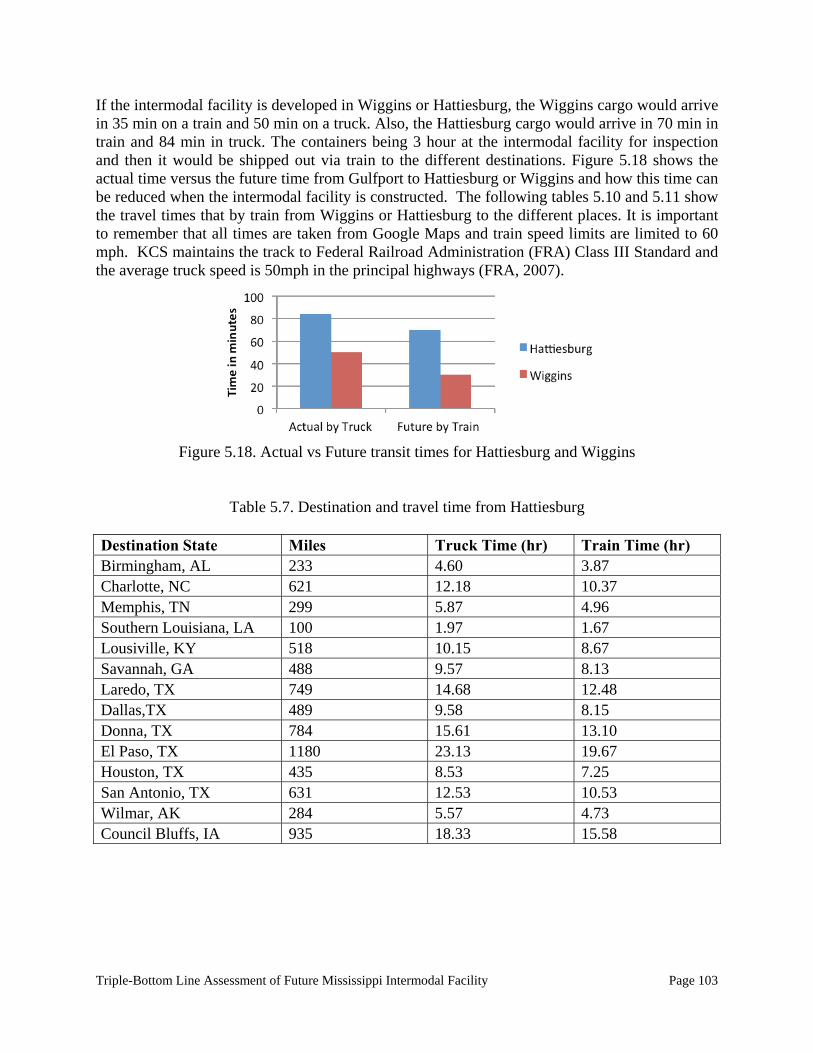
Triple-Bottom Line Assessment of Future Mississippi Intermodal Facility Page 103
If the intermodal facility is developed in Wiggins or Hattiesburg, the Wiggins cargo would arrive in 35 min on a train and 50 min on a truck. Also, the Hattiesburg cargo would arrive in 70 min in train and 84 min in truck. The containers being 3 hour at the intermodal facility for inspection and then it would be shipped out via train to the different destinations. Figure 5.18 shows the actual time versus the future time from Gulfport to Hattiesburg or Wiggins and how this time can be reduced when the intermodal facility is constructed. The following tables 5.10 and 5.11 show the travel times that by train from Wiggins or Hattiesburg to the different places. It is important to remember that all times are taken from Google Maps and train speed limits are limited to 60 mph. KCS maintains the track to Federal Railroad Administration (FRA) Class III Standard and the average truck speed is 50mph in the principal highways (FRA, 2007).
Figure 5.18. Actual vs Future transit times for Hattiesburg and Wiggins
Table 5.7. Destination and travel time from Hattiesburg Destination State Miles Truck Time (hr) Train Time (hr) Birmingham, AL 233 4.60 3.87 Charlotte, NC 621 12.18 10.37 Memphis, TN 299 5.87 4.96 Southern Louisiana, LA 100 1.97 1.67 Lousiville, KY 518 10.15 8.67 Savannah, GA 488 9.57 8.13 Laredo, TX 749 14.68 12.48 Dallas,TX 489 9.58 8.15 Donna, TX 784 15.61 13.10 El Paso, TX 1180 23.13 19.67 Houston, TX 435 8.53 7.25 San Antonio, TX 631 12.53 10.53 Wilmar, AK 284 5.57 4.73 Council Bluffs, IA 935 18.33 15.58
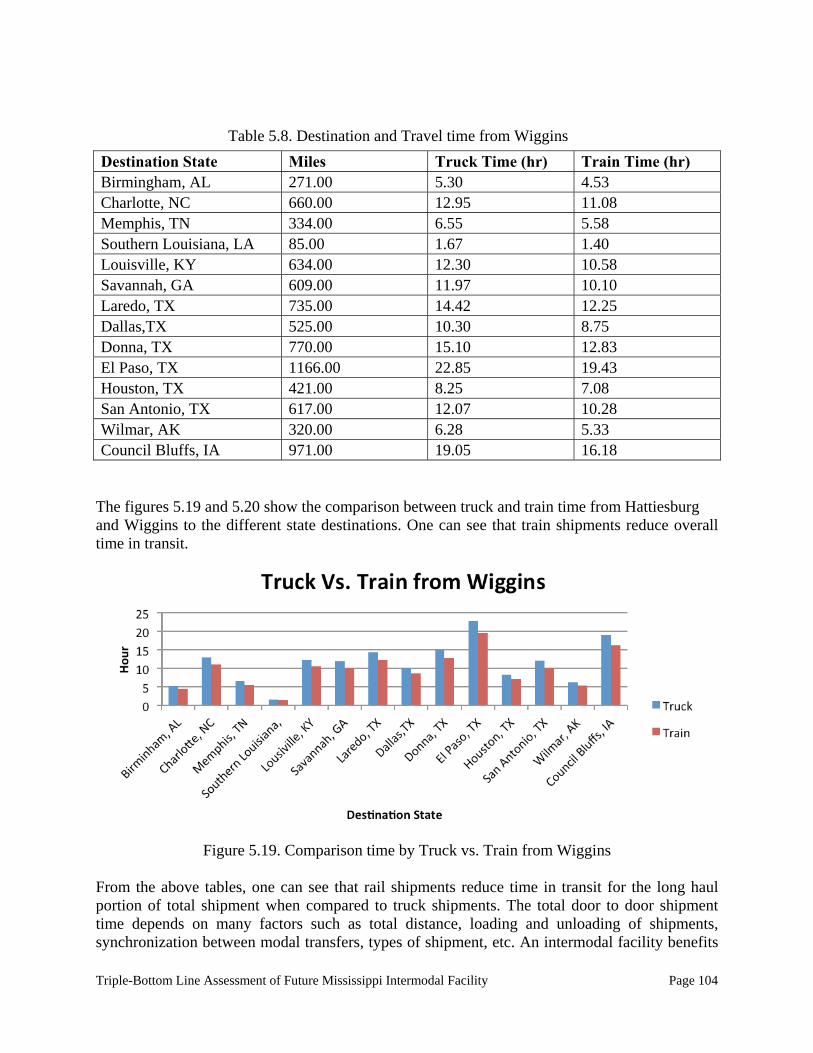
Triple-Bottom Line Assessment of Future Mississippi Intermodal Facility Page 104
Destination State Miles Truck Time (hr) Train Time (hr) Birmingham, AL 271.00 5.30 4.53 Charlotte, NC 660.00 12.95 11.08 Memphis, TN 334.00 6.55 5.58 Southern Louisiana, LA 85.00 1.67 1.40 Louisville, KY 634.00 12.30 10.58 Savannah, GA 609.00 11.97 10.10 Laredo, TX 735.00 14.42 12.25 Dallas,TX 525.00 10.30 8.75 Donna, TX 770.00 15.10 12.83 El Paso, TX 1166.00 22.85 19.43 Houston, TX 421.00 8.25 7.08 San Antonio, TX 617.00 12.07 10.28 Wilmar, AK 320.00 6.28 5.33 Council Bluffs, IA 971.00 19.05 16.18
The figures 5.19 and 5.20 show the comparison between truck and train time from Hattiesburg and Wiggins to the different state destinations. One can see that train shipments reduce overall time in transit.
Figure 5.19. Comparison time by Truck vs. Train from Wiggins
From the above tables, one can see that rail shipments reduce time in transit for the long haul portion of total shipment when compared to truck shipments. The total door to door shipment time depends on many factors such as total distance, loading and unloading of shipments, synchronization between modal transfers, types of shipment, etc. An intermodal facility benefits
Table 5.8. Destination and Travel time from Wiggins
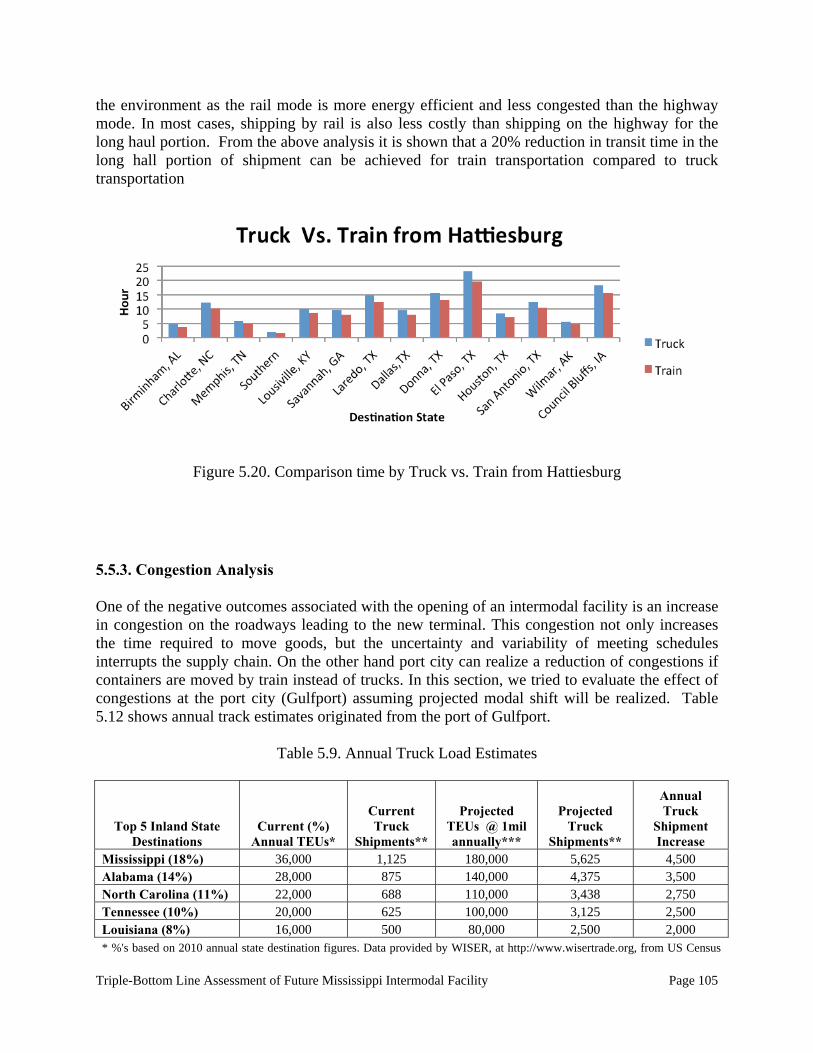
Triple-Bottom Line Assessment of Future Mississippi Intermodal Facility Page 105
the environment as the rail mode is more energy efficient and less congested than the highway mode. In most cases, shipping by rail is also less costly than shipping on the highway for the long haul portion. From the above analysis it is shown that a 20% reduction in transit time in the long hall portion of shipment can be achieved for train transportation compared to truck transportation
Figure 5.20. Comparison time by Truck vs. Train from Hattiesburg
5.5.3. Congestion Analysis One of the negative outcomes associated with the opening of an intermodal facility is an increase in congestion on the roadways leading to the new terminal. This congestion not only increases the time required to move goods, but the uncertainty and variability of meeting schedules interrupts the supply chain. On the other hand port city can realize a reduction of congestions if containers are moved by train instead of trucks. In this section, we tried to evaluate the effect of congestions at the port city (Gulfport) assuming projected modal shift will be realized. Table 5.12 shows annual track estimates originated from the port of Gulfport.
Table 5.9. Annual Truck Load Estimates
Top 5 Inland State Destinations
Current (%) Annual TEUs*
Current Truck
Shipments**
Projected TEUs @ 1mil annually***
Projected Truck
Shipments**
Annual Truck
Shipment Increase
Mississippi (18%) 36,000 1,125 180,000 5,625 4,500 Alabama (14%) 28,000 875 140,000 4,375 3,500 North Carolina (11%) 22,000 688 110,000 3,438 2,750 Tennessee (10%) 20,000 625 100,000 3,125 2,500 Louisiana (8%) 16,000 500 80,000 2,500 2,000 * %'s based on 2010 annual state destination figures. Data provided by WISER, at http://www.wisertrade.org, from US Census
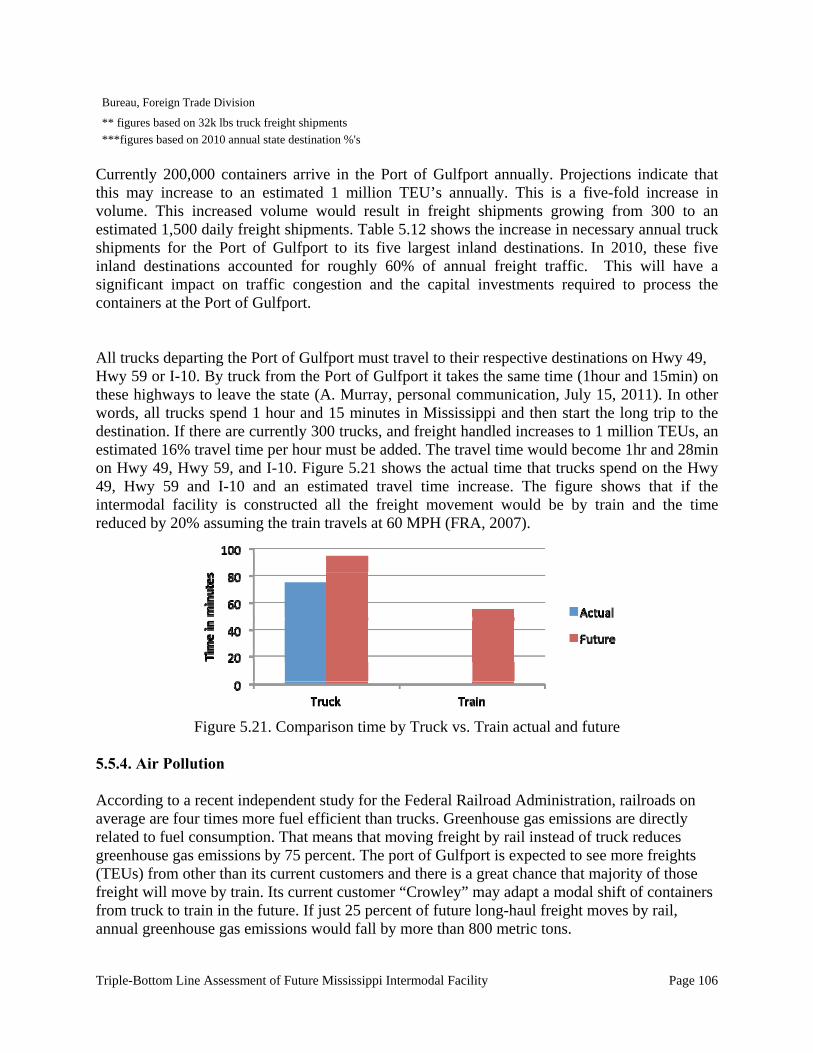
Triple-Bottom Line Assessment of Future Mississippi Intermodal Facility Page 106
Bureau, Foreign Trade Division
** figures based on 32k lbs truck freight shipments
***figures based on 2010 annual state destination %'s
Currently 200,000 containers arrive in the Port of Gulfport annually. Projections indicate that this may increase to an estimated 1 million TEU’s annually. This is a five-fold increase in volume. This increased volume would result in freight shipments growing from 300 to an estimated 1,500 daily freight shipments. Table 5.12 shows the increase in necessary annual truck shipments for the Port of Gulfport to its five largest inland destinations. In 2010, these five inland destinations accounted for roughly 60% of annual freight traffic. This will have a significant impact on traffic congestion and the capital investments required to process the containers at the Port of Gulfport. All trucks departing the Port of Gulfport must travel to their respective destinations on Hwy 49, Hwy 59 or I-10. By truck from the Port of Gulfport it takes the same time (1hour and 15min) on these highways to leave the state (A. Murray, personal communication, July 15, 2011). In other words, all trucks spend 1 hour and 15 minutes in Mississippi and then start the long trip to the destination. If there are currently 300 trucks, and freight handled increases to 1 million TEUs, an estimated 16% travel time per hour must be added. The travel time would become 1hr and 28min on Hwy 49, Hwy 59, and I-10. Figure 5.21 shows the actual time that trucks spend on the Hwy 49, Hwy 59 and I-10 and an estimated travel time increase. The figure shows that if the intermodal facility is constructed all the freight movement would be by train and the time reduced by 20% assuming the train travels at 60 MPH (FRA, 2007).
Figure 5.21. Comparison time by Truck vs. Train actual and future
5.5.4. Air Pollution According to a recent independent study for the Federal Railroad Administration, railroads on average are four times more fuel efficient than trucks. Greenhouse gas emissions are directly related to fuel consumption. That means that moving freight by rail instead of truck reduces greenhouse gas emissions by 75 percent. The port of Gulfport is expected to see more freights (TEUs) from other than its current customers and there is a great chance that majority of those freight will move by train. Its current customer “Crowley” may adapt a modal shift of containers from truck to train in the future. If just 25 percent of future long-haul freight moves by rail, annual greenhouse gas emissions would fall by more than 800 metric tons.
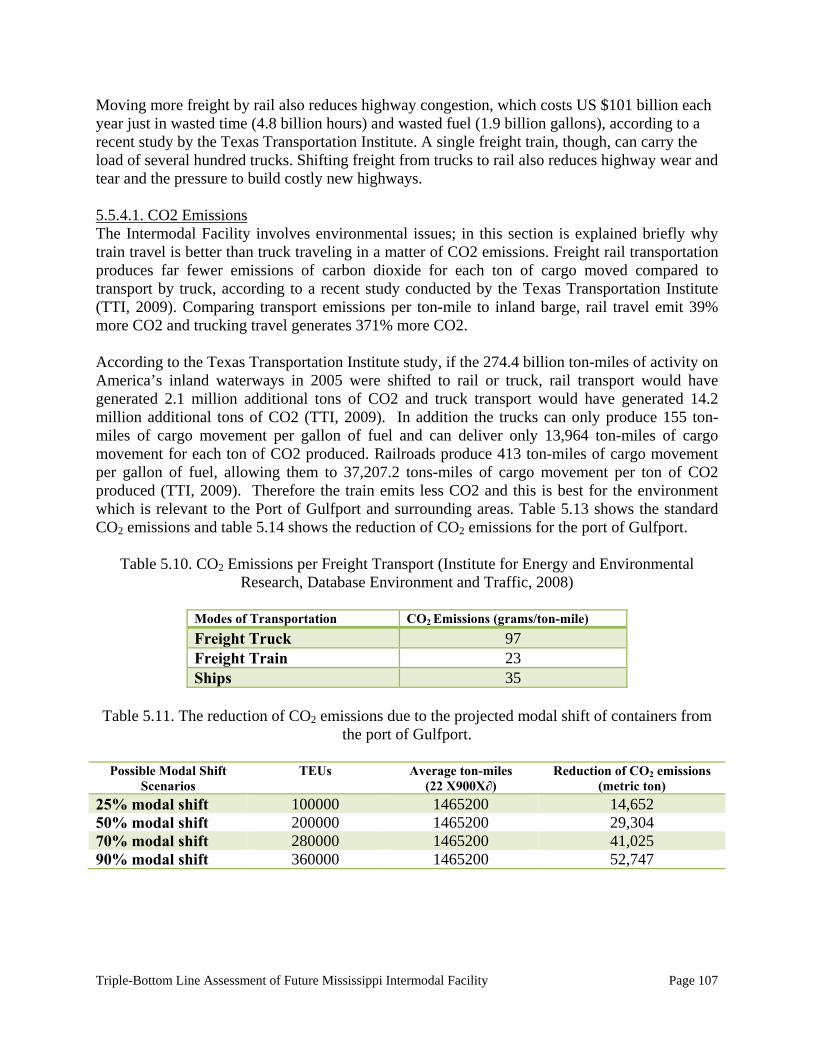
Triple-Bottom Line Assessment of Future Mississippi Intermodal Facility Page 107
Moving more freight by rail also reduces highway congestion, which costs US $101 billion each year just in wasted time (4.8 billion hours) and wasted fuel (1.9 billion gallons), according to a recent study by the Texas Transportation Institute. A single freight train, though, can carry the load of several hundred trucks. Shifting freight from trucks to rail also reduces highway wear and tear and the pressure to build costly new highways. 5.5.4.1. CO2 Emissions The Intermodal Facility involves environmental issues; in this section is explained briefly why train travel is better than truck traveling in a matter of CO2 emissions. Freight rail transportation produces far fewer emissions of carbon dioxide for each ton of cargo moved compared to transport by truck, according to a recent study conducted by the Texas Transportation Institute (TTI, 2009). Comparing transport emissions per ton-mile to inland barge, rail travel emit 39% more CO2 and trucking travel generates 371% more CO2. According to the Texas Transportation Institute study, if the 274.4 billion ton-miles of activity on America’s inland waterways in 2005 were shifted to rail or truck, rail transport would have generated 2.1 million additional tons of CO2 and truck transport would have generated 14.2 million additional tons of CO2 (TTI, 2009). In addition the trucks can only produce 155 ton-miles of cargo movement per gallon of fuel and can deliver only 13,964 ton-miles of cargo movement for each ton of CO2 produced. Railroads produce 413 ton-miles of cargo movement per gallon of fuel, allowing them to 37,207.2 tons-miles of cargo movement per ton of CO2 produced (TTI, 2009). Therefore the train emits less CO2 and this is best for the environment which is relevant to the Port of Gulfport and surrounding areas. Table 5.13 shows the standard CO2 emissions and table 5.14 shows the reduction of CO2 emissions for the port of Gulfport.
Table 5.10. CO2 Emissions per Freight Transport (Institute for Energy and Environmental Research, Database Environment and Traffic, 2008)
Modes of Transportation CO2 Emissions (grams/ton-mile)
Freight Truck 97 Freight Train 23 Ships 35
Table 5.11. The reduction of CO2 emissions due to the projected modal shift of containers from
the port of Gulfport.
Possible Modal Shift Scenarios
TEUs Average ton-miles (22 X900X∂)
Reduction of CO2 emissions (metric ton)
25% modal shift 100000 1465200 14,652 50% modal shift 200000 1465200 29,304 70% modal shift 280000 1465200 41,025 90% modal shift 360000 1465200 52,747
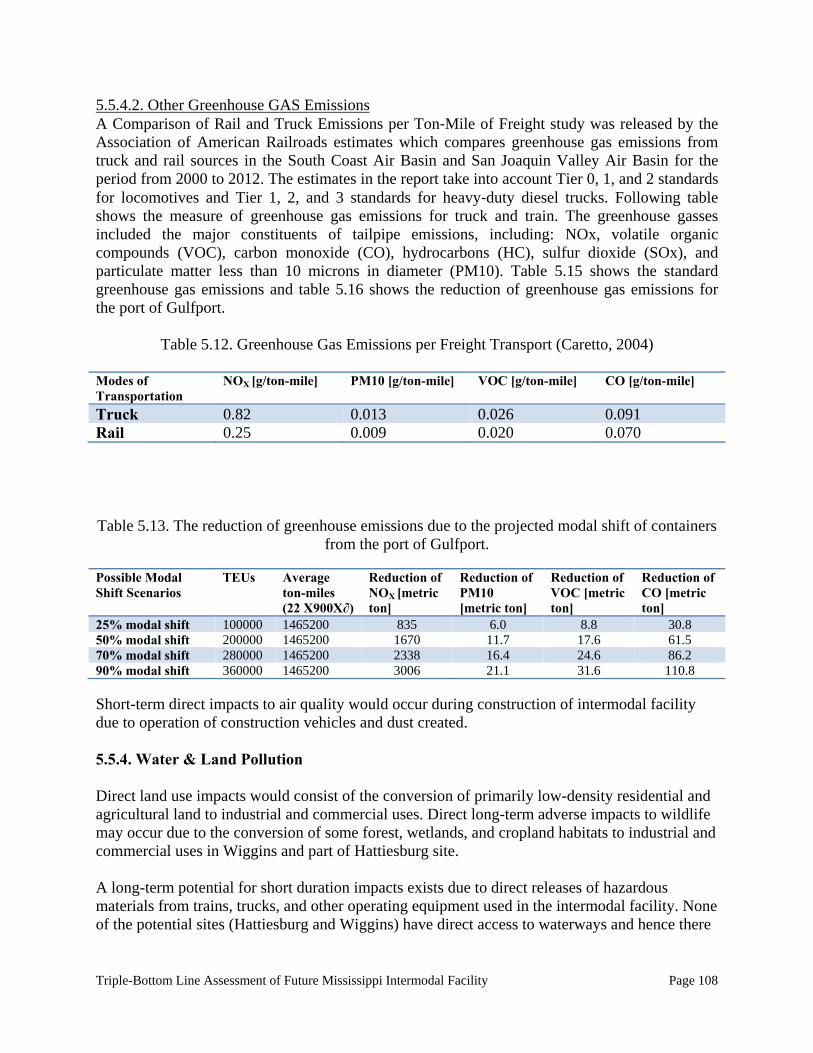
Triple-Bottom Line Assessment of Future Mississippi Intermodal Facility Page 108
5.5.4.2. Other Greenhouse GAS Emissions A Comparison of Rail and Truck Emissions per Ton‐Mile of Freight study was released by the Association of American Railroads estimates which compares greenhouse gas emissions from truck and rail sources in the South Coast Air Basin and San Joaquin Valley Air Basin for the period from 2000 to 2012. The estimates in the report take into account Tier 0, 1, and 2 standards for locomotives and Tier 1, 2, and 3 standards for heavy‐duty diesel trucks. Following table shows the measure of greenhouse gas emissions for truck and train. The greenhouse gasses included the major constituents of tailpipe emissions, including: NOx, volatile organic compounds (VOC), carbon monoxide (CO), hydrocarbons (HC), sulfur dioxide (SOx), and particulate matter less than 10 microns in diameter (PM10). Table 5.15 shows the standard greenhouse gas emissions and table 5.16 shows the reduction of greenhouse gas emissions for the port of Gulfport.
Table 5.12. Greenhouse Gas Emissions per Freight Transport (Caretto, 2004) Modes of Transportation
NOX [g/ton-mile] PM10 [g/ton-mile] VOC [g/ton-mile] CO [g/ton-mile]
Truck 0.82 0.013 0.026 0.091 Rail 0.25 0.009 0.020 0.070 Table 5.13. The reduction of greenhouse emissions due to the projected modal shift of containers
from the port of Gulfport. Possible Modal Shift Scenarios
TEUs Average ton-miles (22 X900X∂)
Reduction of NOX [metric ton]
Reduction of PM10 [metric ton]
Reduction of VOC [metric ton]
Reduction of CO [metric ton]
25% modal shift 100000 1465200 835 6.0 8.8 30.8 50% modal shift 200000 1465200 1670 11.7 17.6 61.5 70% modal shift 280000 1465200 2338 16.4 24.6 86.2 90% modal shift 360000 1465200 3006 21.1 31.6 110.8 Short-term direct impacts to air quality would occur during construction of intermodal facility due to operation of construction vehicles and dust created. 5.5.4. Water & Land Pollution Direct land use impacts would consist of the conversion of primarily low-density residential and agricultural land to industrial and commercial uses. Direct long-term adverse impacts to wildlife may occur due to the conversion of some forest, wetlands, and cropland habitats to industrial and commercial uses in Wiggins and part of Hattiesburg site. A long-term potential for short duration impacts exists due to direct releases of hazardous materials from trains, trucks, and other operating equipment used in the intermodal facility. None of the potential sites (Hattiesburg and Wiggins) have direct access to waterways and hence there
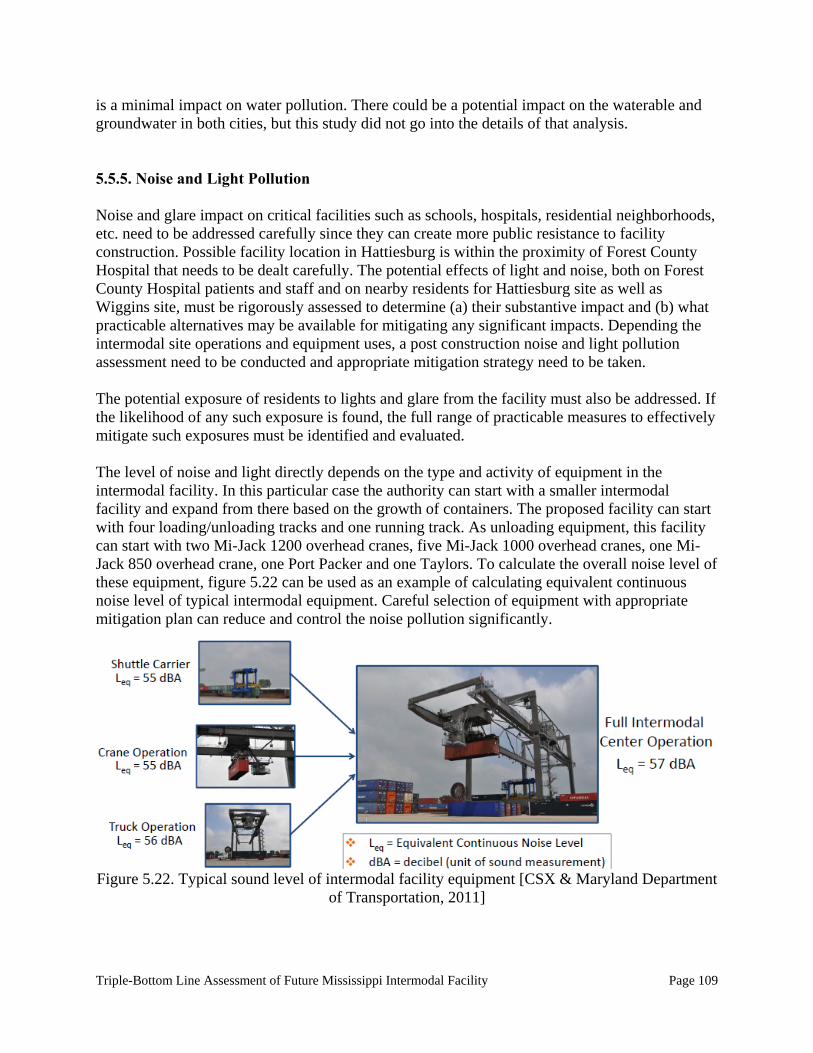
Triple-Bottom Line Assessment of Future Mississippi Intermodal Facility Page 109
is a minimal impact on water pollution. There could be a potential impact on the waterable and groundwater in both cities, but this study did not go into the details of that analysis. 5.5.5. Noise and Light Pollution Noise and glare impact on critical facilities such as schools, hospitals, residential neighborhoods, etc. need to be addressed carefully since they can create more public resistance to facility construction. Possible facility location in Hattiesburg is within the proximity of Forest County Hospital that needs to be dealt carefully. The potential effects of light and noise, both on Forest County Hospital patients and staff and on nearby residents for Hattiesburg site as well as Wiggins site, must be rigorously assessed to determine (a) their substantive impact and (b) what practicable alternatives may be available for mitigating any significant impacts. Depending the intermodal site operations and equipment uses, a post construction noise and light pollution assessment need to be conducted and appropriate mitigation strategy need to be taken. The potential exposure of residents to lights and glare from the facility must also be addressed. If the likelihood of any such exposure is found, the full range of practicable measures to effectively mitigate such exposures must be identified and evaluated. The level of noise and light directly depends on the type and activity of equipment in the intermodal facility. In this particular case the authority can start with a smaller intermodal facility and expand from there based on the growth of containers. The proposed facility can start with four loading/unloading tracks and one running track. As unloading equipment, this facility can start with two Mi-Jack 1200 overhead cranes, five Mi-Jack 1000 overhead cranes, one Mi-Jack 850 overhead crane, one Port Packer and one Taylors. To calculate the overall noise level of these equipment, figure 5.22 can be used as an example of calculating equivalent continuous noise level of typical intermodal equipment. Careful selection of equipment with appropriate mitigation plan can reduce and control the noise pollution significantly.
Figure 5.22. Typical sound level of intermodal facility equipment [CSX & Maryland Department
of Transportation, 2011]
Triple-Bottom Line Assessment of Future Mississippi Intermodal Facility Page 110
5.5.6. Safety Safety in the context of this evaluation addresses issue with roadway and rail infrastructure. The design of the roadway network used by trucks accessing the site must provide adequate capacity for the anticipated demand in a safe and efficient manner. Forecasts of future traffic volumes (both truck and automobile) and directional assignments based on origins and destinations provide the basis for determine the appropriate roadway types, by classification, to built the network connecting the proposed site to the interstate system or to major destinations in the region. If existing roadways will be part of this network, the design of these facilities must be reviewed to identify any potential safety problems related to design. For any new highway construction the design elements such as cross section, vertical and horizontal alignment, etc. must consider the operation of truck traffic. It is important to note that for roadways serving as primary access routes to intermodal facilities, the influence of high numbers of trucks in the traffic stream may require special treatment to take into account the operational characteristics of trucks. The primary safety concern of the rail infrastructure is the number and design of rail-highway grade crossings. The number of at-grade crossings should be kept to a minimum. Where feasible, grade separations should be provided. The design of at-grade crossings and the protective devices employed at the crossings should be based on truck dimensions and operating characteristics. 5.5.7. Livability One of the major initiatives of the US Department of Transportation is a focus on livability. Livability can be defined by six core principles:
Provide more transportation choices to decrease household transportation costs, reduce our dependence on oil, improve air quality and promote public health.
Expand location- and energy-efficient housing choices for people of all ages, incomes, races and ethnicities to increase mobility and lower the combined cost of housing and transportation.
Improve economic competitiveness of neighborhoods by giving people reliable access to employment centers, educational opportunities, services and other basic needs.
Target federal funding toward existing communities – through transit-oriented and land recycling – to revitalize communities, reduce public works costs, and safeguard rural landscapes.
Align federal policies and funding to remove barriers to collaboration, leverage funding and increase the effectiveness of programs to plan for future growth.
Enhance the unique characteristics of all communities by investing in healthy, safe and walkable neighborhoods, whether rural, urban or suburban.
Freight is often at odds with livability concepts, especially in older neighborhoods or corridors that retain industrial viability. Traditional land use planning methods and commodity flow data do not capture intra-city freight movements and thus measuring the impact of urban freight is difficult. The Federal initiative, the Partnership for Sustainable Communities, does not adequately embrace freight and its impacts within the livability context.
Triple-Bottom Line Assessment of Future Mississippi Intermodal Facility Page 111
For the purpose of evaluating the impact of a major new intermodal freight facility, livability includes the factors, mentioned in the previous sections – air quality, noise and light impacts, safety, etc., plus compatibility of land uses, integration with local and regional plans, employment accessibility, and related considerations. All must be considered in the evaluation of alternatives. 5.6. SUMMARY An intermodal facility requires unique site specifications to build a facility that has all the necessary aspects to increase efficiency. Proximity of inland ports to actual port operations increases efficiency and productivity. Currently, Wiggins and Hattiesburg are able to develop the intermodal facility within their city limits. It is important to mention that the distance from Gulfport to Wiggins is 36 miles. This is 50 minutes by truck and the distance from Gulfport to Hattiesburg is 70 miles. This is 84 minutes by truck. Both places have available areas based on Google Earth that do not fall under the classification of protected marshlands. It is observed after analyzing different options that the Hattiesburg city has more possibilities because it has more acres, more Hwy connectivity, airport access and multiple rail stations. The available sites in Mississippi were compared to existing inland port facilities located throughout the U.S. with current lift capacities of 250,000 per year. If the Port of Gulfport increases its lifting capacity to 1 million TEU, it is necessary for the port to acquire approximately 220 to 500 acres for an inland facility. Also the Port needs 4 to 6 loading/ unloading tracks to handle 1 million TEU per year, 2,200 – 4,000 parking spaces and approximately 3,000 more space for storage capacity. All these areas and others can be seen in the section 5.5.3 in the hypothetical layout with average measure. In addition, as discussed in section 5.5.1, the facility will require two relevant programs to improve the service. The first is Optimization Alternative Intermodal Strategic Scheduler (OASIS), which is used to operate the inventory and via internet notify truckers to obtain the location of containers in yard. The second is Automated Gate System (AGS). This reduces inspection times to less than 90 seconds for inbound and less than 60 seconds for outbound inspection. The hypothetical freight analysis found that actually more than 8,500 to 10,000 freight trucks per day pass through the principal Highways that connects with the Port of Gulfport ( Hwy 49, Hwy 59 and I-10), and only 300 trucks leave the Port daily to the following principal states: Alabama, North Carolina, Tennessee, Louisiana, and throughout Mississippi. All the transportation, especially to those principal states, from Wiggins or Hattiesburg would be by truck with an average travel time of 12 hr and 50min to 12hr and 30min. An average truck has the capacity for 180 to 220 gallons of fuel, and consumes an average of 8 mpg at 50mph or 7mpg at 60 mph in the principal highways. The average train travel to those states, from Wiggins or Hattiesburg, would be 1hr and 25min to 11 hours with an average fuel consumption of 500 tons-miles per gallon at 60mph. If the intermodal facility is constructed traveling time is reduced by 20%, and train use 99% mpg less than the trucks. The congestion analysis concluded that currently 200,000 TEUs arrive in the Port of Gulfport. It is expected in the future that the port will get 1 million TEUs, so the capacity will increase fivefold. This is an increase of 300 to approximately 1,500 trucks that will leave from Gulfport. Also, trucks spend 1 hr and 15 min before leaving highways 49, 59 and I-10. With this increase

Triple-Bottom Line Assessment of Future Mississippi Intermodal Facility Page 112
the travel time would become 1hr and 28min on Hwy 49, 59 and I-10. This is 16% more in travel truck time because in the future those highways expect a volume of 9,000 to 11,500 freight trucks per day. The fuel usage led to an analysis of the CO2 emission and when comparing transport emissions per ton-mile to inland barrage, rail travel emits 39% more Co2 and trucking travel generates 371% more CO2, resulting in more pollution. It is important to remember the trucks can deliver only 13,963 ton-miles of cargo movement for each ton of Co2 versus the train allowing 37,207 tons-miles of cargo movement per ton of CO2.
Triple-Bottom Line Assessment of Future Mississippi Intermodal Facility Page 113
CHAPTER 6: BEST PRACTICES, LEADERSHIP, STRATEGY AND ORGANIZATIONAL
DESIGN 6.1. INTRODUCTION Inland distribution is becoming a very important dimension of the globalization, maritime transportation and freight distribution paradigm (Notteboom and Rodrigue, 2005). Structural changes in logistics have generated new patterns of freight distribution and necessitated new approaches to port hierarchy. The organization of an intermodal facility depends mostly on the owners or stakeholders involved in the development of the facility. While some intermodal facilities around the US are dominantly private and linked with the supply chains quite unrelated to the regions they set in (such as those implemented by terminal operators), others are the outcome of public initiatives with the goal to anchor and develop freight distribution within regional economies (Rodrigue et al., 2010). Some are strongly commercial as they finance their operations through the revenue they generate while others are heavily subsidized, particularly for infrastructure provision. In some cases inland ports can be dedicated to a specific metropolitan area or even to a single customer. Additionally, actors have various relations, particularly if public and private interests are at stake, implying different possible outcomes that can service the functions related to an inland port (Rodrigue et al., 2010). A particular relevant development that has placed inland ports within the agenda has been several public and private actors capturing the term as a symbol helping articulate their strategies and the expectation to capture added value activities. Many inland intermodal centers have thus been labeled as inland ports, a simple process that should not be underestimated, even if they are established to suit rather unique functional and operational realities for freight distribution (Rodrigue et al., 2010). The setting up of inland ports (or the labeling of existing facilities) often involves private and public interests. Public intervention is justified by two types of goals related to development objectives and planning objectives. The first public goal is based on the need to attract logistics activities to develop the local economy (employment, income, taxes, etc.). Local or regional collectivities, public agencies or trade groups all attempt to develop land and infrastructure policies to assist in the implementation of these inland structures. The second public goal is generally based on planning and regulation objectives. Inland ports can contribute to policy objectives related to sustainability, by promoting the use of rail and river transport, reducing traffic congestion and reorganizing freight distribution to fit better local characteristics, such as urban density. These two functions (development/ planning) help explain the contributions of public actors in the establishment of inland ports. 6.2. MANAGEMENT & ORGANIZATIONAL MODELS OF INTERMODAL FACILITIES Intermodal facilities in the nation can be categorized into three different models according to their organizational design and management. These models are basically based on ownership of the facilities, management and over all leadership design. The models are;
(i) the Landlord Model Intermodal Facility (ii) the Operator Intermodal Facility and (iii) the Developer Model Facility
Triple-Bottom Line Assessment of Future Mississippi Intermodal Facility Page 114
6.2.1. Landlord Intermodal Facility This is one of the most common model where intermodal infrastructures set up or built by the government are leased out to operators on a landlord-tenant basis, consequently, the main revenue streams are land rents and dues on the facilities. In general, landlord intermodal facilities do not aim for profit maximization, but have other objectives, such as economic development, traffic decongestion, pollution reduction, and the creation of efficient supply chain for industries in the area. However, landlord intermodal facilities are self-sustaining. This implies landlord intermodal facilities need to generate sufficient return on investment to finance new investments, therefore apart from leasing out the facilities, they also engage in active investments to improve the efficiency of the transport chain and the competitiveness of the intermodal facilities. The Virginia Inland Port (VIP) is a typical example of a landlord model. It is basically an Inland Port located west of Washington DC in Warren County, and it is owned by the Virginia Port Authority. Cargos from the other 3 state –owned terminals travel to VIP 5 days a week bringing the port 220 miles closer to the US market and 75 international shipping lines. The site also contains 17,820 of on-site rail serviced by Norfolk Southern. It is within 1mile form I-66 and within 5miles of I-81.VIP is also Customs designated Port of entry and a full range Customs functions is available to customers. Household names like Wal-Mart, Target, Home Depot, Dollar Tree, and Family Dollar & Cost plus have distribution facilities in the Commonwealth in large measure due to the presence of world class port facility and structure. 6.2.2. Operator Intermodal Facility Most intermodal facilities in North America are driven by the operator model. Here, operators who are the rail companies own and manage such facilities. In most cases public involvement, for example is such that they may only provide an infrastructure in form of roads that may provide link to the facility. An example of such facility is the Union Pacific at Laredo, Texas. 6.2.3. Developer Model Intermodal Facility Here, a real estate developer owns the intermodal facility. There are several large companies (e.g., CenterPoint Properties) discussed in Chapter 2 that specialize in this type of business venture. The Somerset (KY) Rail Park is an example of the Developer Model done on a smaller scale. Somerset Rail Park is a 34-acre state-of-the-art facility in Pulaski County integrating several modes of transportation designed to handle various bulk products from truck to railcar, railcar to truck with warehousing capabilities. This Norfolk Southern TBT terminal (Thoroughbred Bulk Terminals) is a top-quality rail-to-truck and truck-to-rail transfer facility and considered among one of the best in the transportation industry. 6.3. THE ROLE OF PORT AUTHORITIES (PA’S) The public sector has redefined its role in the port and shipping industries through privatization and corporatization schemes (Rodrigue 2000). With the reassessment of the role of the government much attention is now paid to governance issues in ports and shipping. Port authorities assume a role of facilitation, creating a platform in which port authorities are working together with various actors in the freight business. In most parts of the world, a port plays a central role. Most of the largest container ports worldwide are organized according to the landlord model, where publicly owned port authority plays a central role (Baird 2002). PA’s generally invest in facilities such as (dredging of) maritime access channels, breakwaters, berth & quays, sites for terminals, sites for manufacturing & logistics activities and road and rail
Triple-Bottom Line Assessment of Future Mississippi Intermodal Facility Page 115
infrastructure. PA’s provide sites to tenants and port access to ships. . Their interest concerns generally the overall efficiency and the growth of trade rather than the performance of particular sectors. The PA’s can be a catalyst even when its direct impact on cargo flows may be limited (Rodrigue, 2000). The PA’s, in this case the Mississippi State Port Authority (MSPA) is in an excellent position to play a leading role in such initiatives, and as the pivotal location for movement of freight. Landlord PA’s generally have the planning initiative for expanding or re-developing the port area and (maritime) infrastructure and their basic functions according to Langen (2008) include (i) traffic management: ensuring safe, secure, fast and reliable vessel traffic management. They also create partnerships for traffic management on road and rail.(ii) area management: they provide space (to new companies) for growth, intensify land use, develop the required (public) transport infrastructure and provides secure environmental performance in the port area. (iii) customer management: attract new customers to the port, create customer satisfaction and provide value added for customers as business partner’. (iv) stakeholder management: invest in an attractive location climate , in partnership with other (public) stakeholders, influence relevant regulation and invest to maintain a license to operate. The MSPA is governed by a board of commissioners. The state ports five-member board represents a cross-section of Harrison County and the city of Gulfport and is appointed to staggered, five-year terms. Three members are appointed by the Governor, one by the Harrison County Board of supervisors, and one by the city of Gulfport. 6.4. DRYPORTS In order minimize crowding at the terminals, congestion, and prolonged dwell times, port authorities often establish dryports.
A dryport is an inland intermodal terminal directly connected to seaport(s) with high capacity transport means(s), where customers can leave/pick up their standardized units as if directly to the seaport (Leveque and Roso 2002).
The best known example of a dryport in the US is the Virginia Inland Port run by the Virginia Port Authority, which is a midrange dryport. There are three categories of dryports (Roso, Woxenius, and Lumsden, 2009). Distant dryports are typically over 300 miles from the seaport. The distance and freight flow make rail viable on a strict cost perspective. Midrange dry ports are situated within a distance that can be efficiently covered by trucks, but other factors (e.g., congestion in the port area) make consolidation cost effective. Finally, there are close dryports such as the Alameda Corridor that is only 18 miles from the Ports of Long Beach and Los Angeles. These types of intermodal facilities secure market in the hinterland for port authorities, increase throughput of the port without expansion, and mitigate road congestion near the seaport. This is a possible strategy that the Mississippi State Port Authority (MSPA) might pursue. 6.5. STRATEGIC DIRECTION OF DEVELOPMENT The dry port concept where the user faces a single interface whether at the seaport or the dry port raises the question of what direction of transport should drive the development of an intermodal facility. Should it be the rail company wanting to reach the port or where the port wants to extend its reach to the hinterland? This is the issue of landside or inside-out development or seaside outside-in development (Wilmsmeir, Monios, and Lambert, 2010).
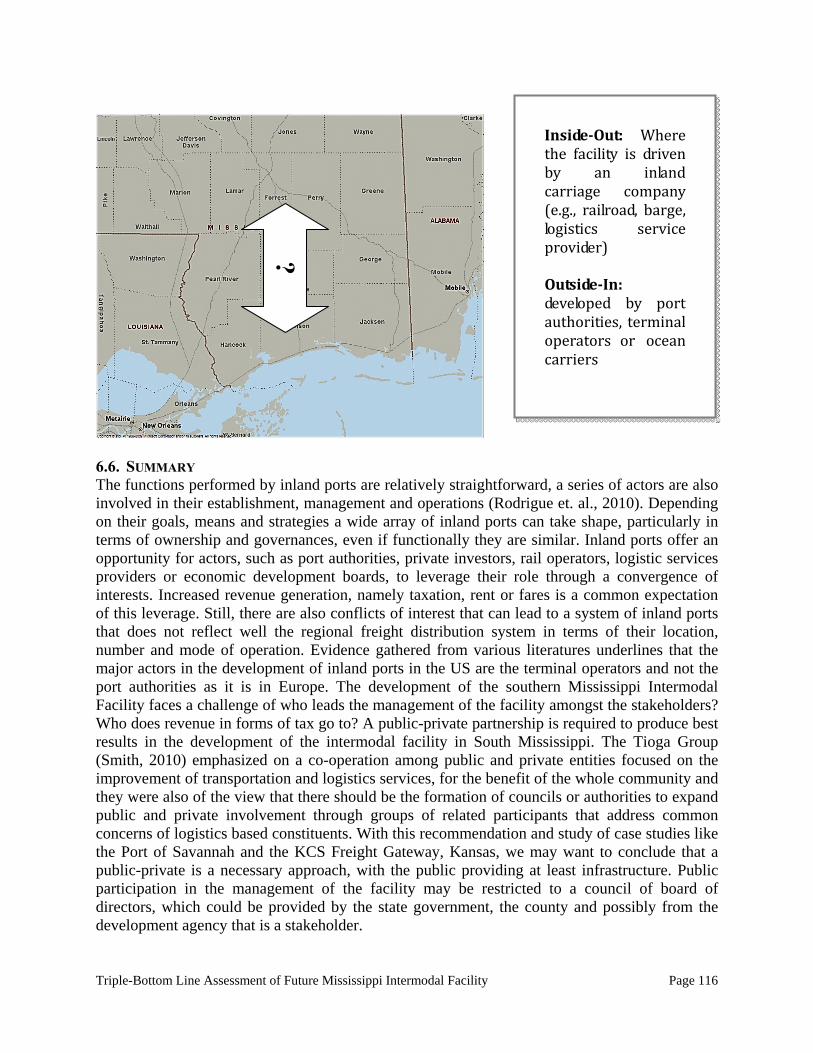
Triple-Bottom Line Assessment of Future Mississippi Intermodal Facility Page 116
6.6. SUMMARY The functions performed by inland ports are relatively straightforward, a series of actors are also involved in their establishment, management and operations (Rodrigue et. al., 2010). Depending on their goals, means and strategies a wide array of inland ports can take shape, particularly in terms of ownership and governances, even if functionally they are similar. Inland ports offer an opportunity for actors, such as port authorities, private investors, rail operators, logistic services providers or economic development boards, to leverage their role through a convergence of interests. Increased revenue generation, namely taxation, rent or fares is a common expectation of this leverage. Still, there are also conflicts of interest that can lead to a system of inland ports that does not reflect well the regional freight distribution system in terms of their location, number and mode of operation. Evidence gathered from various literatures underlines that the major actors in the development of inland ports in the US are the terminal operators and not the port authorities as it is in Europe. The development of the southern Mississippi Intermodal Facility faces a challenge of who leads the management of the facility amongst the stakeholders? Who does revenue in forms of tax go to? A public-private partnership is required to produce best results in the development of the intermodal facility in South Mississippi. The Tioga Group (Smith, 2010) emphasized on a co-operation among public and private entities focused on the improvement of transportation and logistics services, for the benefit of the whole community and they were also of the view that there should be the formation of councils or authorities to expand public and private involvement through groups of related participants that address common concerns of logistics based constituents. With this recommendation and study of case studies like the Port of Savannah and the KCS Freight Gateway, Kansas, we may want to conclude that a public-private is a necessary approach, with the public providing at least infrastructure. Public participation in the management of the facility may be restricted to a council of board of directors, which could be provided by the state government, the county and possibly from the development agency that is a stakeholder.
Inside‐Out: Wherethe facility is drivenby an inlandcarriage company(e.g., railroad, barge,logistics serviceprovider) Outside‐In:developed by portauthorities, terminaloperators or oceancarriers
?
Triple-Bottom Line Assessment of Future Mississippi Intermodal Facility Page 117
REFERENCES
Alumar, S. and B. Kara (2007). Invited Review: Network Hub location problems: The state of
the Art.” European Journal of Operational Research 190(1): 1-21. Anthony (2001). Benchmarking the Performance of Intermodal Transport, OECD Division of
Transport Association of American Railroads. “Freight Railroads: Reducing Highway Gridlock.” (May
2010). Retrieved from: http://www.aar.org/~/media/aar/backgroundpapers/freightrailroadslesshighwaygridlock.ashx. Accessed: 4.18.11
Association of American Railroads. “Keep federal truck size and weight limits.” (March 2011). Retrieved from: http://www.aar.org/~/media/aar/Background-Papers/Keep-Fed-Truck-Size.ashx. Accessed: 4.18.11.
Association of American Railroads. “The Economic Impact of America’s freight railroads.” (March 2011). Retrieved from: http://www.aar.org/~/media/aar/Background-Papers/The-Economic-Impact.ashx. Accessed; 4.18.11.
Ballis, A. (2003): Introducing Level of Service Standards for Intermodal Freight Terminals. TRB 2003 Annual Meeting, Washington D.C. 2003
Bedell, Doug (2008). Inland Port Security Needs Attention, Barrier Briefs Accessed July 24, 2012 http://www.barrierbriefs.probarrier.com/?p=275
Benjamin J. Allen, T. H. Maze and Clyde K. Walter, "Intrastate Trucking Deregulation: Have Both the Negative and Positive Impacts Been Overstated?" Transportation Journal, Vol. 33, No. 1 (Fall 1993), pp. 30-39.
Bergquist, R. and J. Tornberg. “Evaluating locations for Intermodal transport Terminals.” Transportation Planning and Technology, August 2008 31(4) pg 465-485.
BNSF Memphis Intermodal Facility. (n.d.). AREMA.org. Retrieved October 8, 2012, from www.arema.org/files/library/2009_Conference_Proceedings/BNSF_Memphis_Intermodal_Facility.pdf
Bontekoning,Y.M., Macharis,C., Trip,J.J (2004). Is a new applied transportation research field emerging?––A review of intermodal rail–truck freight transport literature. Transportation Research Part A: Policy & Practice. 38(1), 1,34.
Cambridge Systematic, with Jack Faucett Associates, and Sierra Research. (1997). Federal Railroad Administration, Federal Highway Administration, and Environmental Protection Agency, Air Quality Issues in Intercity Freight.
Caretto, Larry (2004). “Revised Guidance for Locomotive Emissions,” prepared for Southeastern States Air Quality Managers under EPA Emission Inventory Improvement Project, Sierra Research Report SR2004-06-01, June 2004
Cidell, J. (2010). Concentration and decentralization: The new geography of freight distribution in US metropolitan areas. Journal of Transport Geography, 18(3), 363-371
Corbett, J., A. Falazarano, J. Hawker, S. Ketha, J. Winebrake, and S. Zilora (2008). “Assessing Energy, Environmental, and Economic Tradeoffs in Intermodal Freight Transportation.” Journal of Air and Waste Management (Aug 2008) 58(8) pg 1004-1013
Cost-Per-Mile Calculation. (2011) Trucking Success. Retrieved July 24, 2011, from http://www.truckingsuccess.com/index.php?main_page=page&id=13&chapter=0
Triple-Bottom Line Assessment of Future Mississippi Intermodal Facility Page 118
Crystal Jones, Transportation specialist, FHWA Office of Freight Management and Operations (2007). Perspective on Freight Congestion. Public Road, 71(1), 1-2.
CSX And MDOT To Host Second Round Of Public Workshops In November For The Baltimore-Washington Rail Intermodal Facility. (2011, September 28). Maryland Department of Transportation Homepage. Retrieved October 8, 2012, from http://www.mdot.maryland.gov/News/2011/September%202011/CSX%20AND%20MDOT%20TO%20HOST%20SECOND%20ROUND%20OF%20PUBLIC%20WORKSHOPS%20IN%20NOVEMBER%20FOR%20THE%20BALTIMORE-WASHINGTON%20RAIL%20INTERMODAL%20FACILITY
Dallas Logistic Hub. (2007) Retrieved from http://www.dallashub.com Database for Environment and Traffic. (n.d.). Institute for Energy and Environmental Research.
Retrieved October 8, 2012, from http://ieer.org Dipo, A., C. Ford, and M. Margreta. “U.S. freight on the move: Highlights from the 2007
commodity flow survey preliminary data.” Bureau of Transportation Statistics (Sept 2009). Retrieved from: http://www.bts.gov/publications/special_reports_and_issue_briefs/special_report/2009_09_30/html/entire.html . Accessed 4.10.11.
Duin,V., and Ham,V. (2002). Three-stage modeling approach for the design and organization of intermodal transportation services. Proceedings of the IEEE International Conference on Systems, Man and Cybernetics. 4, 4051–4056
Eastern Research Group (2007). Dallas Intermodal Terminal 2006 Baseline and Projected 2009 and 2012 Emissions Inventory
Edwards, Greg (Nov 7, 2007). “Port Of Virginia: the Virginia Inland Port.” Presented to Commonwealth Transportation Board (Nov 7, 2007).
Federal Highway Administration. “Intermodal freight technology overview.” Freight Management and Operations (2004). Retrieved from: http://ops.fhwa.dot.gov/freight/intermodal/ift_overview.htm. Accessed: 4.4.11.
Federal Railroad Administration (2007). Track Safety Standards Classes 1. Truck Safety Standards Compliance Manual. Chapter 5,155. Retrieved July 8, 2011, fromhttp://www.fra.dot.gov/rrs/pages/fp_460.shtml
Ferreira, L., Z.Lukszo, A. Srikijpanichkul, and K. Van Dam (2007). “Optimizing the Location of Intermodal Freight Hubs: An Overview of the Agent Based Modeling Approach.” Journal of Transportation Systems Engineering and Information Technology 7(4):71-81.
Forkenbrock.D. (2001). Comparison of external costs of rail and truck freight transportation. Transportation Research. Part A (35), 321–337
Frezier,C., Aeppli,A., Martland,CD., Norries,B. (1996). Analysis of intermodal terminal highway access to economic activity centers. Intermodal freight terminal of the future.
Gordon Rankine, Benchmarking Container Terminal Performance, Container Port Conference – Rotterdam, February 2003
Greater Memphis Chamber (2010). Memphis regional freight infrastructure plan. Memphis Chamber. Retrieved June 25, 2011, from http://www.memphischamber.com/CMSPages/GetFile.aspx?nodeguid=22aba16b-f7d8-46ef-8a0a-65d589808965
Hanson, K. (2011, June 13). Study looks at air quality of West LB rail yard, Press-Telegram, p. B1. Retrieved from http://www.presstelegram.com/business/ci_18267957
Triple-Bottom Line Assessment of Future Mississippi Intermodal Facility Page 119
Harrison, R., R. Henk, J. McCray, and J. Prozzi. “Inland Ports: Planning Successful Development.” The University of Texas at Austin: Center for Transportation Research. August 2002. Retrieved from: http://www.utexas.edu/research/ctr/pdf_reports/4083_2.pdf
Hudak,T., Thomas,R., White,J., Lesovsky,S., (2009). BNFS Intermodal Facility ICFI, “Greenhouse Gas Emissions from Freight Trucks”, International Emissions Inventory
Conference May 16, 2007. Accessed: 3.12.11 Intermodal Container Transfer Facility. (2008). Retrieved from http://www.ictf-jpa.org International Trade Statistics 2011. (n.d.). World Trade Organization. Retrieved October 8,
2012, from http://www.wto.org/english/res_e/statis_e/ Ishfaq, R. and C. Sox (2010). “Production, Manufacturing, and Logistics Hub location-
allocation in intermodal logistic networks.” European Journal of Operational Research 210 (2); 213-230.
Kyriazopoulos, Evangelos, and Maria Artavani. " Kyriazopoulos, Evangelos, and Maria Artavani. "The Role of Freight Villages to the Development of the Balkan Region. The Case of Promachon Freight Village." In 46th Congress of the European Regional Science Association. Volos, Greece, 2006.." In 46th Congress of the European Regional Science Association. Volos, Greece, 2006.
Lee, W., C. Lin, G. Lin, and C. Trappey (2007). “Business and logistics hub integration to facilitate global supply chain linkage.” Proceedings of the Institution of Mechanical Engineers Part B- Engineering Manufacturing 221(7) pg 1221-1233.
Macario,R., Reis,V., Inst. Super. Teenico, Lisbon (2008). Architecture of an information system for an intermodal transport service. Engineering Management Conference, 2008. IEMC Europe 2008. IEEE International. (28-30), 1-5.
Maccalla,R., Slack,B., Comtois,C. (2001). Intermodal freight terminal: locality and industrial linkages. Canadian Geographer 45(3), 404-413.
Manuel Cuadrado, Marta Frasquet, Amparo Cervera, (2004) "Benchmarking the port services: a customer oriented proposal", Benchmarking: An International Journal, Vol. 11 Iss: 3, pp.320 – 330
Martonosi, Susan, David Ortiz, and Henry Willis (2005). Evaluating the Viability of 100 Per Cent Container Inspection at America’s Ports, RAND Corporation
McPherson, L. (2012, June 5). CSX drops agreements to purchase property in Elkridge for intermodal facility - baltimoresun.com. The Baltimore Sun | Breaking news, sports, weather and traffic in Baltimore - baltimoresun.com. Retrieved October 9, 2012, from http://www.baltimoresun.com/explore/howard/news/community/ph-ho-cf-csx-0607-20120605,0,1478399.story
Meier, M. and J.R. Schmertz. “Transportation Security.” International Law Update, vol. 10, November 2004.
Meyrick and Associates. (2006). National intermodal terminal study. Meyrick and Associates. Mississippi Department of Transportation; Planning division in cooperation with the U.S
Department of Transportation federal highway administration; 2009 Mississippi State Port Authority. (2011). Retrieved from www.shipmspa.com Notteboom, T. and J-P Rodrigue (2005) “Port Regionalization: Towards a New Phase in Port Oak Ridge National Laboratory (2004). Temporary Losses of Highway Capacity and Impacts on
Performance. Retrieved July 19,2011, from: www. cta.ornl.gov/cta/Publications/tlc/tlc2_ title.shtml.
OECD (2002), Intermodal Freight Transport, Paris, 2002
Triple-Bottom Line Assessment of Future Mississippi Intermodal Facility Page 120
PASBA™ (2011); Mission Statement for The Procurement and Supply-chain Benchmarking Association
Pisano, M., Mazmanian, D. A., Little, R. G., Linder, A., & Perry, B. (2010). Toward a National Strategic Investment Framework. Public Works Management Policy, 14(3), 246-262. doi: 10.1177/1087724x09360033
Poist, R. and C. Walter (2003). “Desired attributes of an Inland Port: Shipper vs. Carrier Perspectives.” Transportation Journal 42(5) pg 42-55.
Port Benchmarking for Assessing Hong Kong’s Maritime Services and Associated Costs with other Major International Ports, Marine Department Planning, Development and Port Security Branch, December 2006
Progressive Railroading editorial staff (2005). UP opens $100 million Dallas intermodal terminal. Retrieved June 26, 2011, from http://www.highbeam.com/doc/1G1-139518396.html
Quinet,E., Baum,M., Hohnscheid,K., Evans,A., Persson,U., Wesemmann,P. (2000). Economic Evaluation of Road Safety Measure. European Conference of Ministers of Transport.
Regional Shipping and Port Development Strategies (Container Traffic Forecast), UN ESCAPE, 2005
Rehimi,M., Asef-Vaziri, Harrison,R. (2008). An Inland Port Location-Allocation Model for a Regional Intermodal Goods Movement System. Maritime Economic & Logistics. 10(4), 362-379
Reto Camponovo, Catherine Merz and Laurent Vorlet (2006). Environmental Impact Assessment Of Building Construction Systems. The 23rd Conference on Passive and Low Energy Architecture, Geneva, Switzerland, 6-8 September 2006
Robert S. Kaplan and David P. Norton, “Using the Balanced Scorecard as a Strategic Management System,” Harvard Business Review (January-February 1996): 76.
Rodrigue, J-P and M. Hesse (2010) "North American Logistics", in D. Waters (ed) Global Logistics: New Directions in Supply Chain Management, 6th Edition, London: Kogan Page, pp. 477-504.
Rodrigue, Jean-Paul. “The Thruport concept and transmodal rail freight distribution in North America.” Journal of Transport Geography 16 (2008) pg 233-246.
Roso, V. (2009). The Dry Port Concept. Sweden: Chalmers University of Technology. S.Kandee (2011). Intermodal Conception Railway station Design. Savitz, A. W., & Weber, K. (2006). The triple bottom line: how today's best-run companies are
achieving economic, social, and environmental success-and how you can too. San Francisco, CA: Jossey-Bass.
Schmitt,R., Strocko,E., Sprung,M., Sedor,J. (2008). Freight Story 2008. Freight Management and Operations. Retrieved July 5, 2011, from http://ops.fhwa.dot.gov/freight/freight_analysis/freight_story/congestion.htm
Seideman, T. (n.d.). Features | The Logistics Park of the Future. Cargo Business News . Retrieved October 8, 2012, from
Shafran, I., and A. Strauss-Weider, 2003. FINANCING AND IMPROVING LAND ACCESS TO U.S. INTERMODAL CARGO HUBS. NCHRP Report 497. Washington, DC: National Cooperative Highway Research Program, Transportation Research Board.
Slack, B. (1990). “Intermodal transportation in north America and the development of inland load centers.” Professional Geographer (Feb 1990) 42(1) pg 72-83.
Triple-Bottom Line Assessment of Future Mississippi Intermodal Facility Page 121
Slack, B. (1999). “Satellite terminals: a local solution to hub congestion?” Journal of Transport Geography 7(4): 241-246.
Smith,E. (2010). BNSF Opens New Rail Yard Site After Finishing Upgrades. The Daily News. 125(78)
State Exports by Port Database. (2010). Retrieved from www.wisertrade.org Steele C., D. Hodge, Halcrow Inc, Fitzgerald & Halliday Inc, and Resource Systems Group
Inc,(2011). Freight Facility Location Selection: A Guide for Public Officials NCFRP 13, Transportation Research Board, Washington, DC.
Texas Transportation Institute (2007). A Modal Comparision of Domestic Freight Transportation Effects on the General Public. Prepared for the U.S. Department of Transportation Maritime Administration, Texas Transportation Institute, Houston, TX
Texas Transportation Institute, Center for Ports and Waterways (2009). A Modal Comparison of Domestic Freight Transportation Effects on the General Public. Retreived July 18,2011, from www.nationalwaterwaysfoundation.org
The emergence of the inland port. (n.d.). Perspectives on the global supply chain. Retrieved October 8, 2012, from www.us.am.joneslanglasalle.com/ResearchLevel1/The%20emergence%20of%20the%20inland%20port.pdf
TNO (2007), Promoting Innovative Intermodal Freight Transport, Report-2007 –D-R0277, March 19, 2007
Tomberlin, M. (2011, June 5). Birmingham Area Distribution Projects May Be First of Many. Alabama.gov. Retrieved October 8, 2012, from http://ado.alabama.gov/content/media/press/BN.aspx?ID=5235
U.S. Department of Transportation, Federal Highway Administration, Office of Freight Management and Operations, Freight Analysis Framework (2007). Major Truck Routes on the National Highway System: 2002. Freight Facts and Figures 2008. Retrieved July 8, 2011, from: http://ops.fhwa.dot.gov/freight/freight_analysis/nat_freight_stats/docs/08factsfigures/figure3_6.htm
Vandeveer,D. (1996). Intermodal Rail Facility Design for the next century. Intermodal Freight Terminal Of The Future
Washington State Department of Transportation and Washington State University (2012). The Impact of Truck Congestion on Washington State's Economy, Washington State Department of Transportation, Tacoma, WA.
Willis,R. (2009). Norfolk southern selects Fayette county site for new Memphis Intermodal Terminal. Norfolk Southern.
Wilmsmeier, Gordon, Monios, Jason and Lambert, Bruce (2010) Observations on the regulation of ‘Dry Ports’ by national governments. In: Proceedings of the Annual Conference of the International Association of Maritime Economists. IAME, Lisbon, Portugal.
Woxenius,J. (2007). Generic Framework for Transport Network Designs: Applications and Treatment in Intermodal Freight. Transport Literature Transport Reviews. 27(6), 733-749,17
Wright, L., & Stratton, J. (2009). Partnerships and Collaboration . The IEDC Economic Development Journal, 9(3), 30-38.
www. cta.ornl.gov/cta/Publications/tlc/tlc2_title.shtml.

Triple-Bottom Line Assessment of Future Mississippi Intermodal Facility Page 122
WZI, Inc. “Intermodal Impact Study.” January 16, 2008. Retrieved from: www.shafter.com/DocumentView.asp?DID=186. Accessed: 3.12.11.

Triple-Bottom Line Assessment of Future Mississippi Intermodal Facility Page 123
APPENDICES
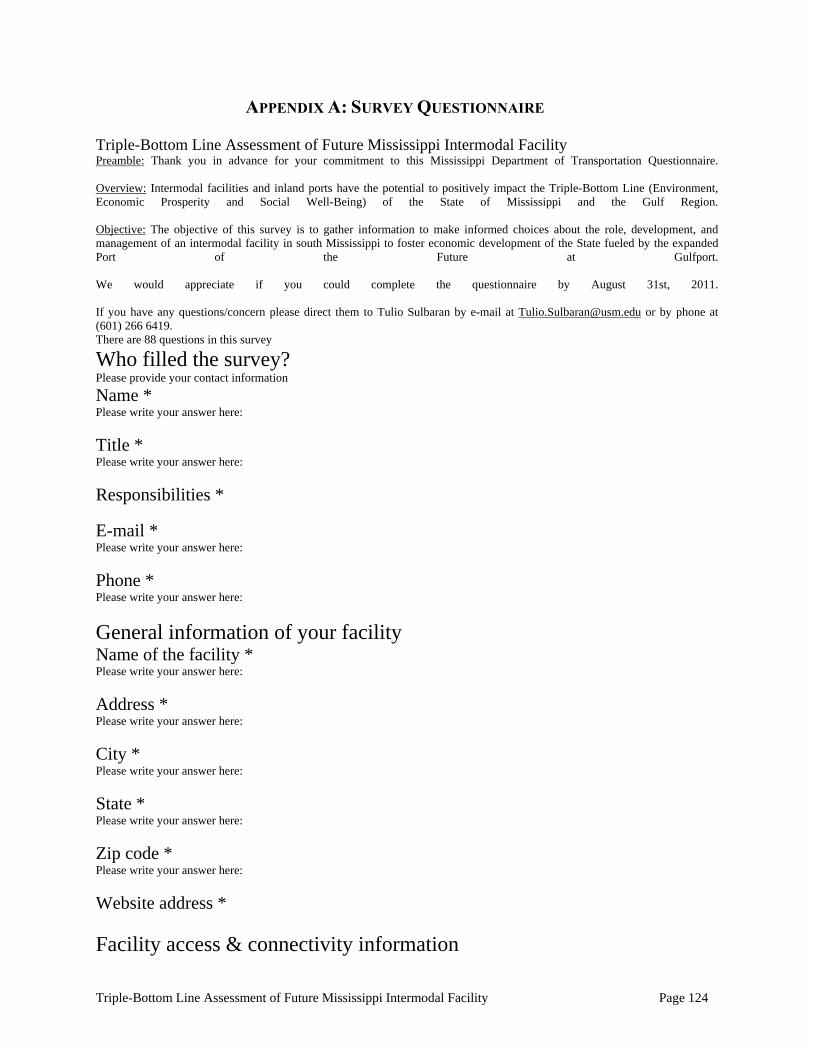
Triple-Bottom Line Assessment of Future Mississippi Intermodal Facility Page 124
APPENDIX A: SURVEY QUESTIONNAIRE Triple-Bottom Line Assessment of Future Mississippi Intermodal Facility Preamble: Thank you in advance for your commitment to this Mississippi Department of Transportation Questionnaire. Overview: Intermodal facilities and inland ports have the potential to positively impact the Triple-Bottom Line (Environment, Economic Prosperity and Social Well-Being) of the State of Mississippi and the Gulf Region. Objective: The objective of this survey is to gather information to make informed choices about the role, development, and management of an intermodal facility in south Mississippi to foster economic development of the State fueled by the expanded Port of the Future at Gulfport. We would appreciate if you could complete the questionnaire by August 31st, 2011. If you have any questions/concern please direct them to Tulio Sulbaran by e-mail at [email protected] or by phone at (601) 266 6419. There are 88 questions in this survey
Who filled the survey? Please provide your contact information
Name * Please write your answer here:
Title * Please write your answer here:
Responsibilities *
E-mail * Please write your answer here:
Phone * Please write your answer here:
General information of your facility Name of the facility * Please write your answer here:
Address * Please write your answer here:
City * Please write your answer here:
State * Please write your answer here:
Zip code * Please write your answer here:
Website address *
Facility access & connectivity information
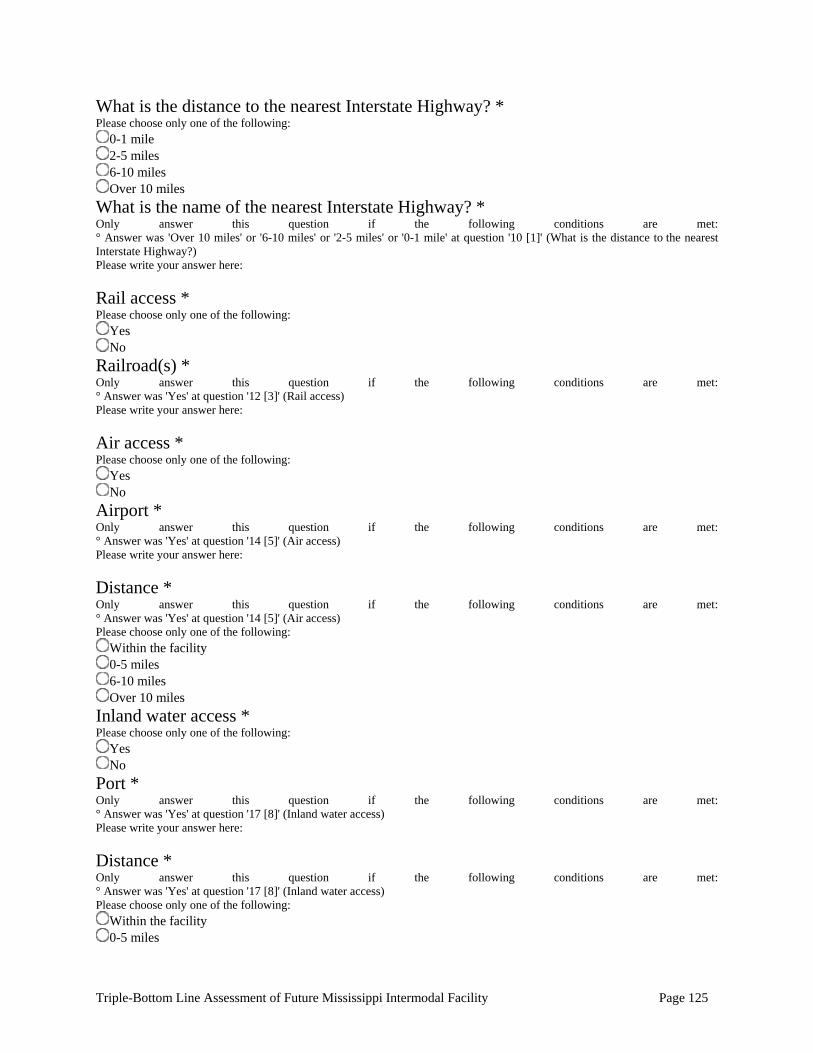
Triple-Bottom Line Assessment of Future Mississippi Intermodal Facility Page 125
What is the distance to the nearest Interstate Highway? * Please choose only one of the following:
0-1 mile 2-5 miles 6-10 miles Over 10 miles
What is the name of the nearest Interstate Highway? * Only answer this question if the following conditions are met: ° Answer was 'Over 10 miles' or '6-10 miles' or '2-5 miles' or '0-1 mile' at question '10 [1]' (What is the distance to the nearest Interstate Highway?) Please write your answer here:
Rail access * Please choose only one of the following:
Yes No
Railroad(s) * Only answer this question if the following conditions are met: ° Answer was 'Yes' at question '12 [3]' (Rail access) Please write your answer here:
Air access * Please choose only one of the following:
Yes No
Airport * Only answer this question if the following conditions are met: ° Answer was 'Yes' at question '14 [5]' (Air access) Please write your answer here:
Distance * Only answer this question if the following conditions are met: ° Answer was 'Yes' at question '14 [5]' (Air access) Please choose only one of the following:
Within the facility 0-5 miles 6-10 miles Over 10 miles
Inland water access * Please choose only one of the following:
Yes No
Port * Only answer this question if the following conditions are met: ° Answer was 'Yes' at question '17 [8]' (Inland water access) Please write your answer here:
Distance * Only answer this question if the following conditions are met: ° Answer was 'Yes' at question '17 [8]' (Inland water access) Please choose only one of the following:
Within the facility 0-5 miles
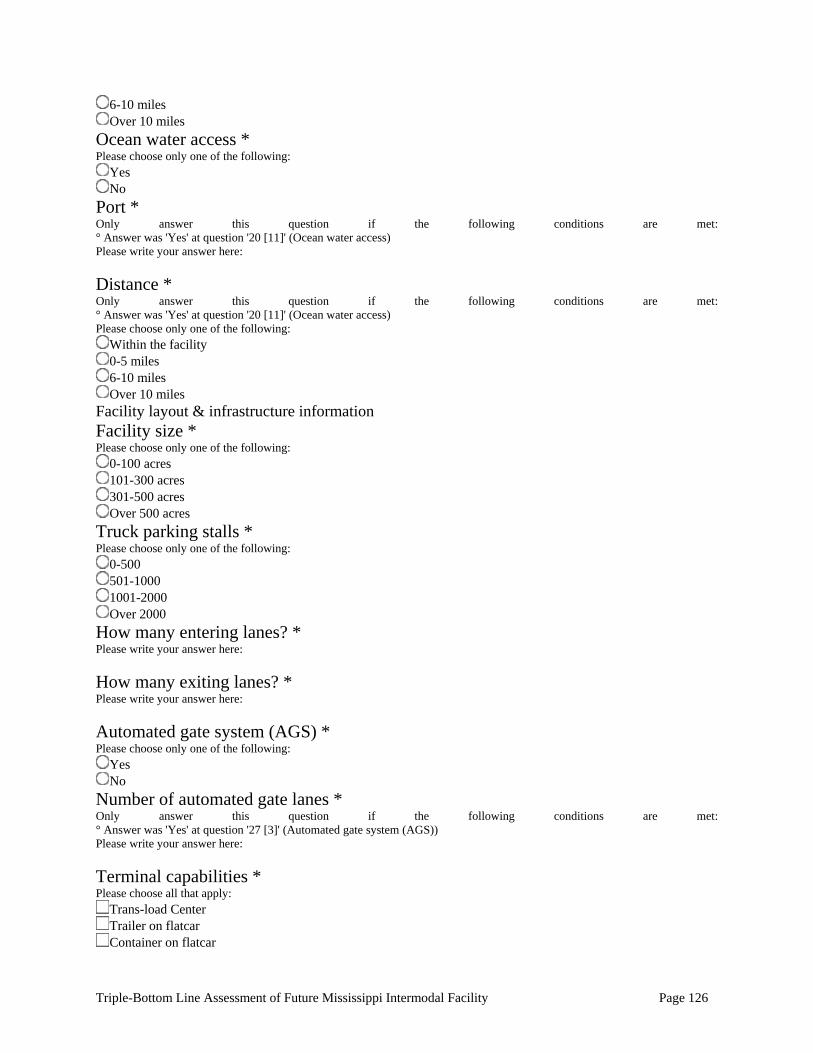
Triple-Bottom Line Assessment of Future Mississippi Intermodal Facility Page 126
6-10 miles Over 10 miles
Ocean water access * Please choose only one of the following:
Yes No
Port * Only answer this question if the following conditions are met: ° Answer was 'Yes' at question '20 [11]' (Ocean water access) Please write your answer here:
Distance * Only answer this question if the following conditions are met: ° Answer was 'Yes' at question '20 [11]' (Ocean water access) Please choose only one of the following:
Within the facility 0-5 miles 6-10 miles Over 10 miles
Facility layout & infrastructure information Facility size * Please choose only one of the following:
0-100 acres 101-300 acres 301-500 acres Over 500 acres
Truck parking stalls * Please choose only one of the following:
0-500 501-1000 1001-2000 Over 2000
How many entering lanes? * Please write your answer here:
How many exiting lanes? * Please write your answer here:
Automated gate system (AGS) * Please choose only one of the following:
Yes No
Number of automated gate lanes * Only answer this question if the following conditions are met: ° Answer was 'Yes' at question '27 [3]' (Automated gate system (AGS)) Please write your answer here:
Terminal capabilities * Please choose all that apply:
Trans-load Center Trailer on flatcar Container on flatcar
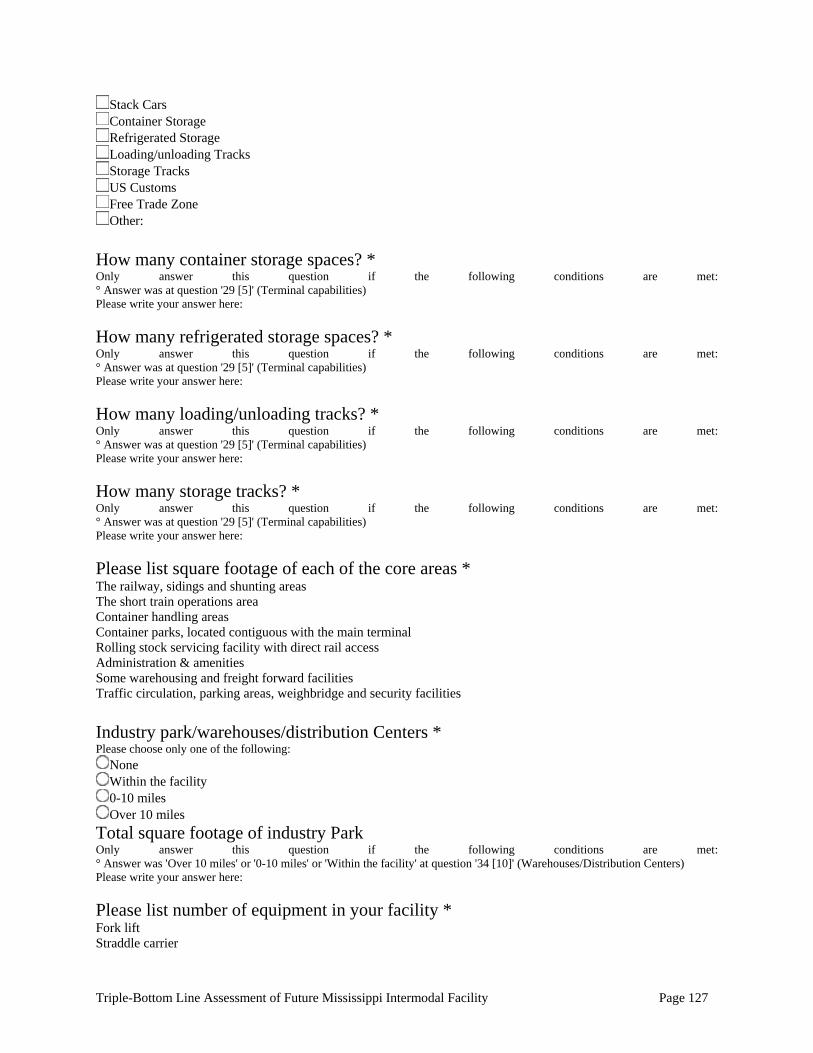
Triple-Bottom Line Assessment of Future Mississippi Intermodal Facility Page 127
Stack Cars Container Storage Refrigerated Storage Loading/unloading Tracks Storage Tracks US Customs Free Trade Zone Other:
How many container storage spaces? * Only answer this question if the following conditions are met: ° Answer was at question '29 [5]' (Terminal capabilities) Please write your answer here:
How many refrigerated storage spaces? * Only answer this question if the following conditions are met: ° Answer was at question '29 [5]' (Terminal capabilities) Please write your answer here:
How many loading/unloading tracks? * Only answer this question if the following conditions are met: ° Answer was at question '29 [5]' (Terminal capabilities) Please write your answer here:
How many storage tracks? * Only answer this question if the following conditions are met: ° Answer was at question '29 [5]' (Terminal capabilities) Please write your answer here:
Please list square footage of each of the core areas * The railway, sidings and shunting areas The short train operations area Container handling areas Container parks, located contiguous with the main terminal Rolling stock servicing facility with direct rail access Administration & amenities Some warehousing and freight forward facilities Traffic circulation, parking areas, weighbridge and security facilities Industry park/warehouses/distribution Centers * Please choose only one of the following:
None Within the facility 0-10 miles Over 10 miles
Total square footage of industry Park Only answer this question if the following conditions are met: ° Answer was 'Over 10 miles' or '0-10 miles' or 'Within the facility' at question '34 [10]' (Warehouses/Distribution Centers) Please write your answer here:
Please list number of equipment in your facility * Fork lift Straddle carrier
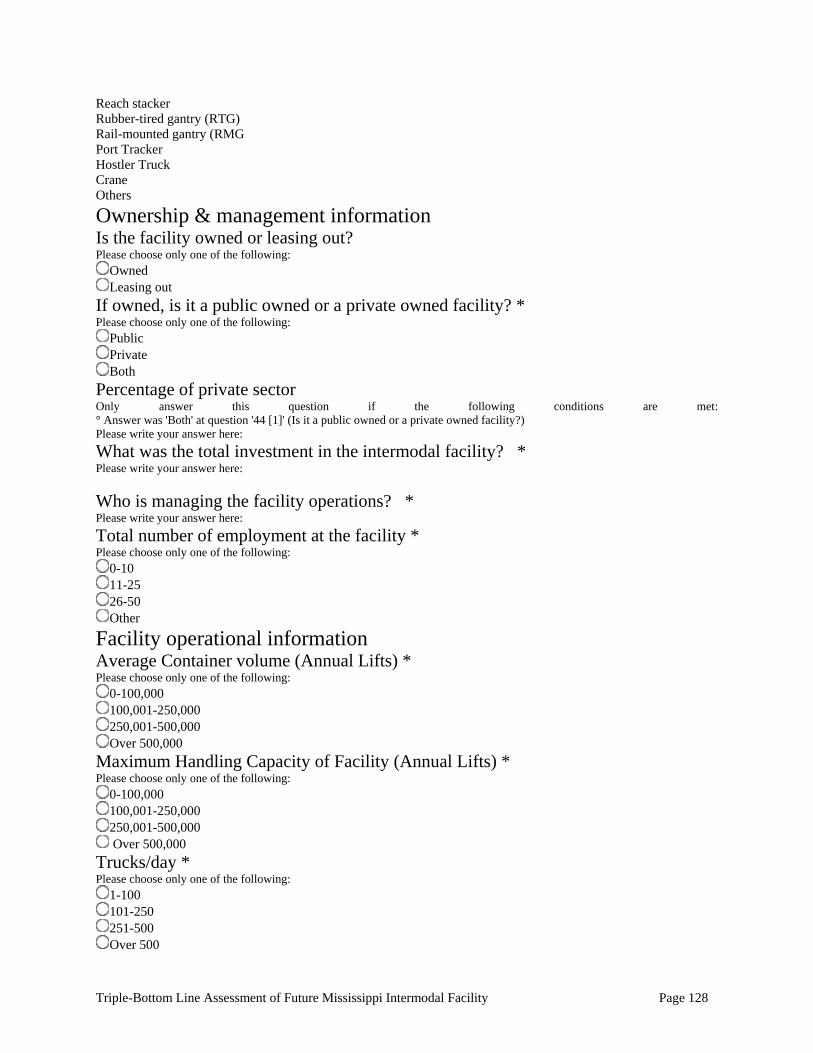
Triple-Bottom Line Assessment of Future Mississippi Intermodal Facility Page 128
Reach stacker Rubber-tired gantry (RTG) Rail-mounted gantry (RMG Port Tracker Hostler Truck Crane Others
Ownership & management information Is the facility owned or leasing out? Please choose only one of the following:
Owned Leasing out
If owned, is it a public owned or a private owned facility? * Please choose only one of the following:
Public Private Both
Percentage of private sector Only answer this question if the following conditions are met: ° Answer was 'Both' at question '44 [1]' (Is it a public owned or a private owned facility?) Please write your answer here:
What was the total investment in the intermodal facility? * Please write your answer here:
Who is managing the facility operations? * Please write your answer here:
Total number of employment at the facility * Please choose only one of the following:
0-10 11-25 26-50 Other
Facility operational information Average Container volume (Annual Lifts) * Please choose only one of the following:
0-100,000 100,001-250,000 250,001-500,000 Over 500,000
Maximum Handling Capacity of Facility (Annual Lifts) * Please choose only one of the following:
0-100,000 100,001-250,000 250,001-500,000 Over 500,000
Trucks/day * Please choose only one of the following:
1-100 101-250 251-500 Over 500

Triple-Bottom Line Assessment of Future Mississippi Intermodal Facility Page 129
Trains/day * Please choose only one of the following:
0 1-5 6-10 Over 10
Barges/day * Please choose only one of the following:
0 1-5 6-10 Over 10
Ships/day * Please choose only one of the following:
0 1-5 6-10 Over 10
Please list freight volume in by the modes * Road - % Rail -% Water - % Air - %
Please list freight volume out by the modes * Road - % Rail -% Water - % Air - %
Please check available freight village activities * _ warehousing; _ cold storage; _ retail distribution centers; _ containing stuffing and un-stuffing; _ non-container freight handling; _ container storage and servicing; _ road / road interchange facilities; _ freight forwarding agents; _ rolling stock servicing; _ truck servicing and spare parts; _ food outlets and appropriate recreation facilities; _ manufacturing industry requiring direct access to transport facilities; _ customs and quarantine services; _ banks and offices;
Site selection information When considering site locations for investment:
Did to build necessary infrastructure or did your company rely on existing infrastructure? Please write your answer here: What is the optimum proximity to primary markets (in mileage)? Please write your answer here:
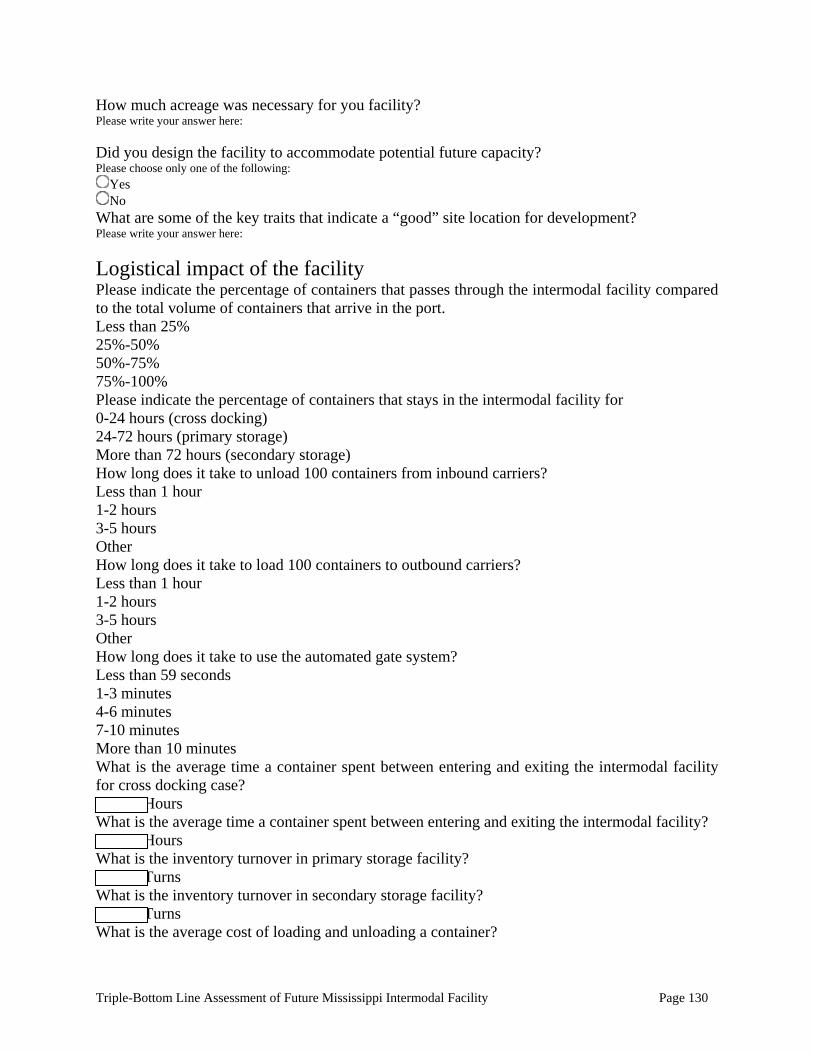
Triple-Bottom Line Assessment of Future Mississippi Intermodal Facility Page 130
How much acreage was necessary for you facility? Please write your answer here: Did you design the facility to accommodate potential future capacity? Please choose only one of the following:
Yes No
What are some of the key traits that indicate a “good” site location for development? Please write your answer here:
Logistical impact of the facility Please indicate the percentage of containers that passes through the intermodal facility compared to the total volume of containers that arrive in the port. Less than 25% 25%-50% 50%-75% 75%-100% Please indicate the percentage of containers that stays in the intermodal facility for 0-24 hours (cross docking) 24-72 hours (primary storage) More than 72 hours (secondary storage) How long does it take to unload 100 containers from inbound carriers? Less than 1 hour 1-2 hours 3-5 hours Other How long does it take to load 100 containers to outbound carriers? Less than 1 hour 1-2 hours 3-5 hours Other How long does it take to use the automated gate system? Less than 59 seconds 1-3 minutes 4-6 minutes 7-10 minutes More than 10 minutes What is the average time a container spent between entering and exiting the intermodal facility for cross docking case? Hours What is the average time a container spent between entering and exiting the intermodal facility? Hours What is the inventory turnover in primary storage facility? Turns What is the inventory turnover in secondary storage facility? Turns What is the average cost of loading and unloading a container?
Triple-Bottom Line Assessment of Future Mississippi Intermodal Facility Page 131
Dollars What is the average cost of storage of a container in the primary facility? Dollars What is the average cost of storage of a container in the secondary facility? Dollars What is the average total cost of a container for the use of intermodal facility? Dollars What is the average distance from port to primary destination (s)? Miles What was the average transit time from port to primary destination (s) prior to the establishment of your intermodal facility? Hours What is the increase or decrease in average transit time from port to primary destination (s) prior to the establishment of your intermodal facility? Hours (+ for decrease and, – for increase) What is the impact of congestions (Peak) in the port due to the intermodal facility? No change in congestions Congestions reduced by 0-15% Congestions reduced by 16-30% Congestions reduced by 31-50% Congestions reduced by more than 50% What is the impact of congestions (Peak) in surrounding area of the intermodal facility? No change in congestions Congestions increased by 0-15% Congestions increased by 16-30% Congestions increased by 31-50% Congestions increased by more than 50% What is your quantitative goal for improvement in freight velocity within next 5 years? Improve by 0-10% Improve by 11%-20% Improve by 21%-25% Improve by more than 25% Who performs most of your logistical functions? Management Freight forwarders 3 PL providers 4 PL providers
Environmental impact of the facility Did you conduct any environmental study before establishing the facility? Please choose only one of the following:
Yes No
What were your environmental impediments to build the facility? Did you prefer Greenfield or Brownfield development locations? Please choose only one of the following:

Triple-Bottom Line Assessment of Future Mississippi Intermodal Facility Page 132
Greenfield Brownfield Other
What steps did you take to ensure that social well-being of the surrounding community considered? (Environmental Justice) Please write your answer here: Did you solicit outside representation to conduct environmental impact surveys? Please choose only one of the following:
Yes No
Is your company currently involved in any environmental conservation efforts? Please choose only one of the following:
Yes No
Do you monitor emissions for your intermodal facility? Yes No
What was the emission level of your intermodal facility in the last time you measured? CO CO2 CH4 N2O etc What was the noise level of your intermodal facility in the last time you measured? Below 80 DB 80-90 DB 90-100 DB Above 100 DB Please list any environmental conservation efforts Only answer this question if the following conditions are met: ° Answer was 'Yes' at question '75 [5]' (Is your company currently involved in any environmental conservation efforts?) Please write your answer here:
Facility Size/Design When considering the size and design of your future facility: How many annual lifts does your company plan to build for? Please write your answer here: How many lanes of ingress and egress do you plan to build? Please write your answer here: How many acres would your proposed facility encompass? Please write your answer here:
Triple-Bottom Line Assessment of Future Mississippi Intermodal Facility Page 133
Does your company plan on accommodating U.S. Customs and Border Protection facilities into your design? Please choose only one of the following:
Yes No
What primary modes of transportation should be represented for your intermodal facility to be successful? Please write your answer here: What type of docking procedures does your company plan on operating? Please write your answer here: What will be done to accommodate safety and security in your facility? Please write your answer here:
Performance Evaluation When evaluating operational improvements: What are some performance metrics for evaluation? Please write your answer here: What are your quantitative goals for improvement? Please write your answer here: What value-added services would improve operations? Please write your answer here: What services improve the overall operating environment of your company? Please write your answer here: What are the desired impacts on efficiency? (%) Please write your answer here:
What are some additional concerns of your company? Please write your answer here: TEUs per hectare TEUs per annum Dwell time Crane productivity Crane cycle time Lifts per hour Moves per hour
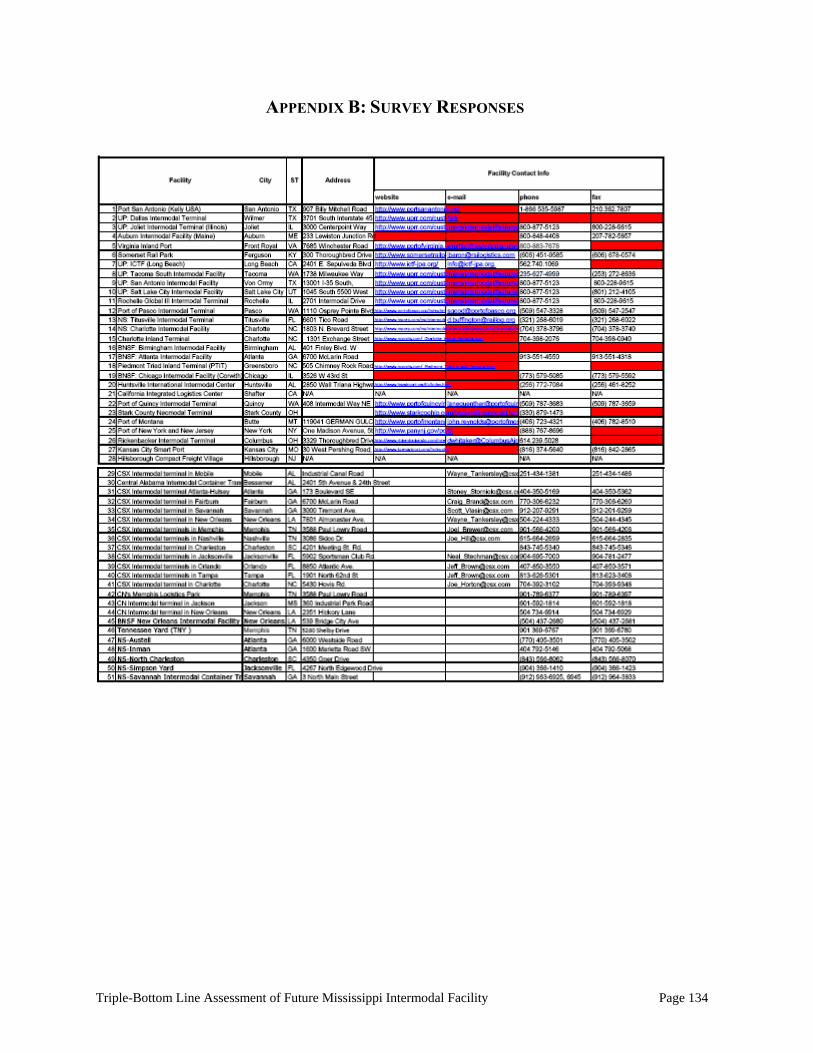
Triple-Bottom Line Assessment of Future Mississippi Intermodal Facility Page 134
APPENDIX B: SURVEY RESPONSES
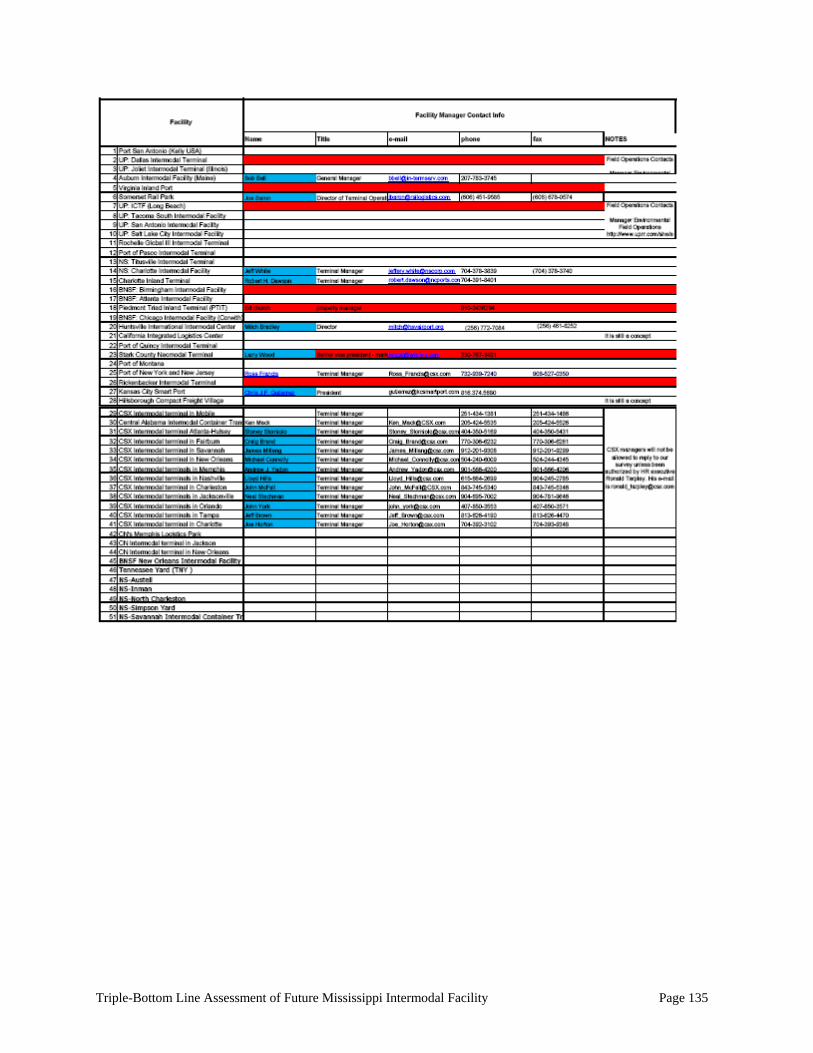
Triple-Bottom Line Assessment of Future Mississippi Intermodal Facility Page 135
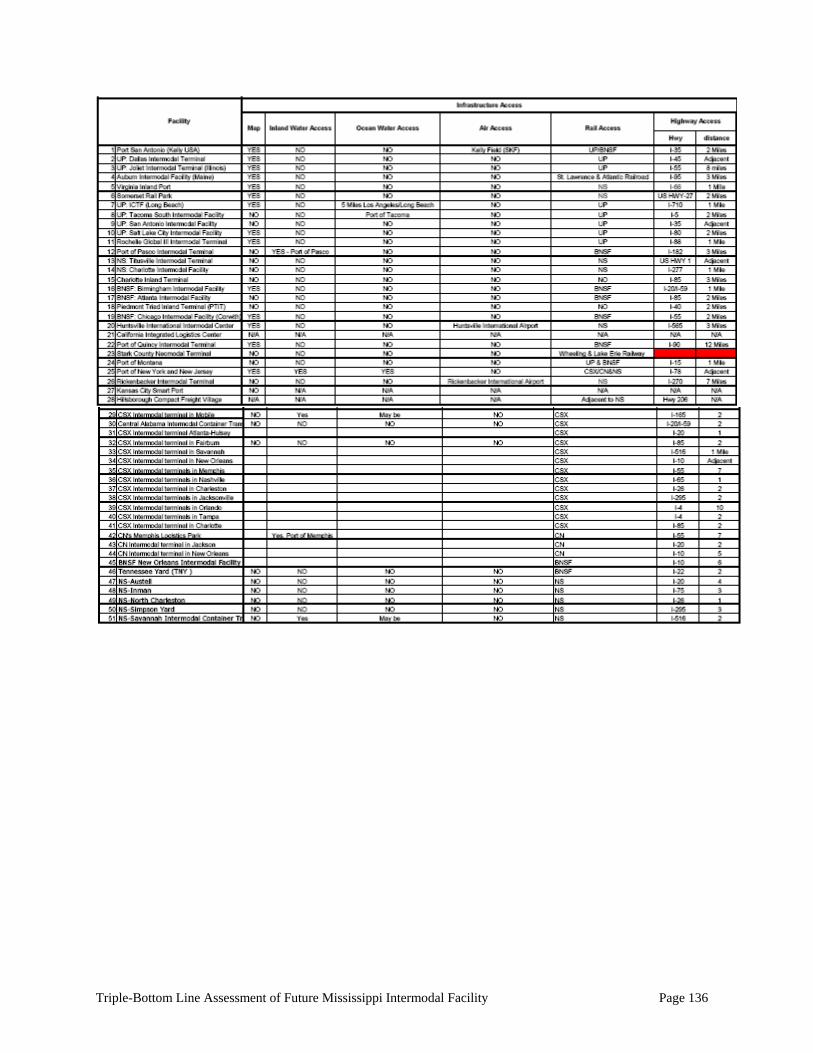
Triple-Bottom Line Assessment of Future Mississippi Intermodal Facility Page 136
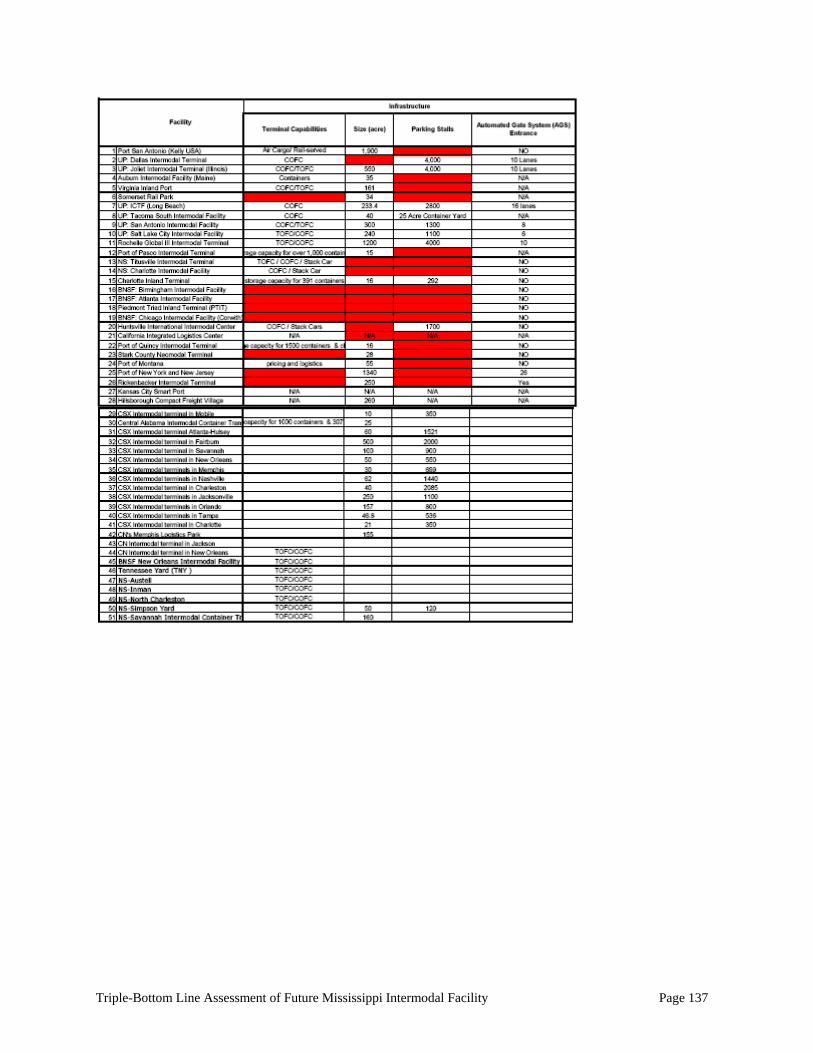
Triple-Bottom Line Assessment of Future Mississippi Intermodal Facility Page 137
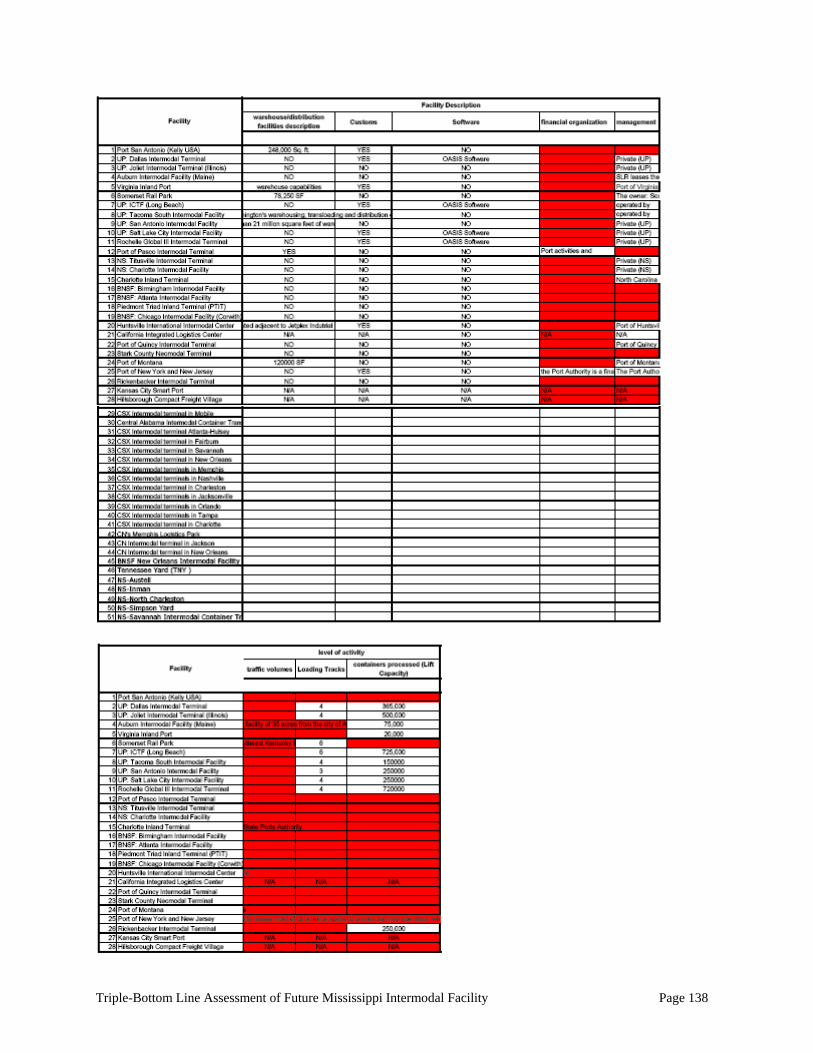
Triple-Bottom Line Assessment of Future Mississippi Intermodal Facility Page 138
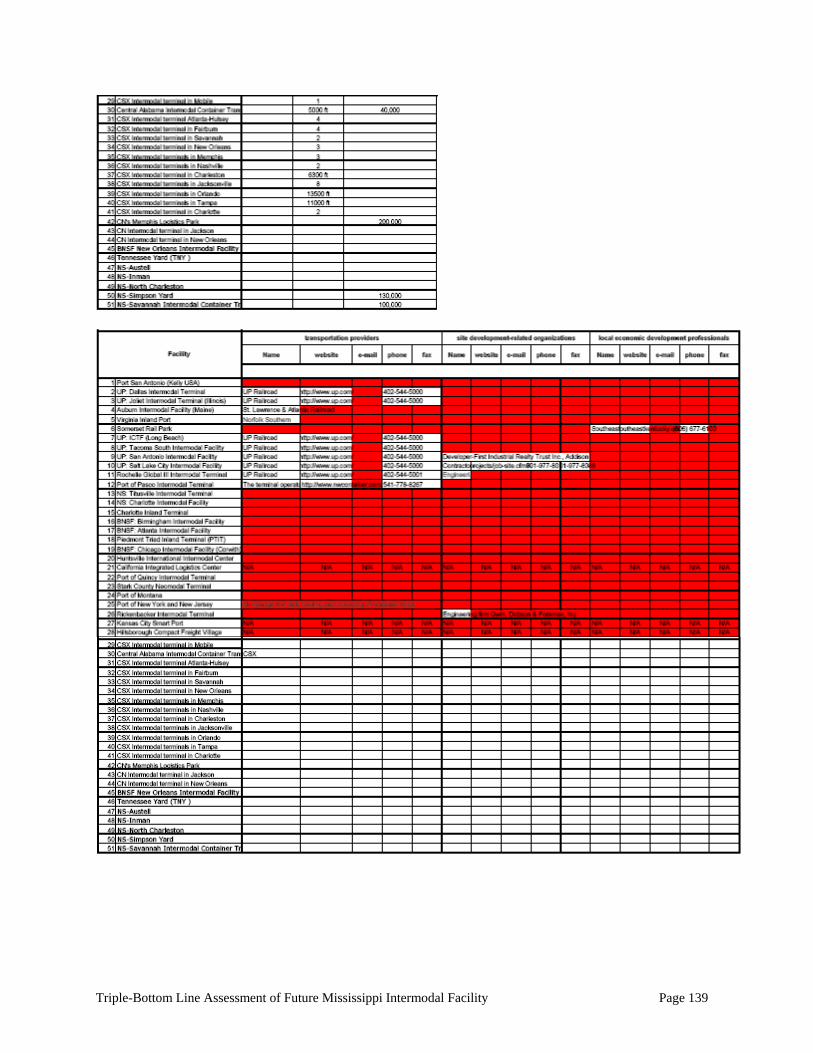
Triple-Bottom Line Assessment of Future Mississippi Intermodal Facility Page 139
Triple-Bottom Line Assessment of Future Mississippi Intermodal Facility Page 140
APPENDIX C: ISSUE BOOK
ISSUE GUIDE 2012
South Mississippi Intermodal Facility
How Should We Take Charge of Our Future?
Leadership and Strategy Options
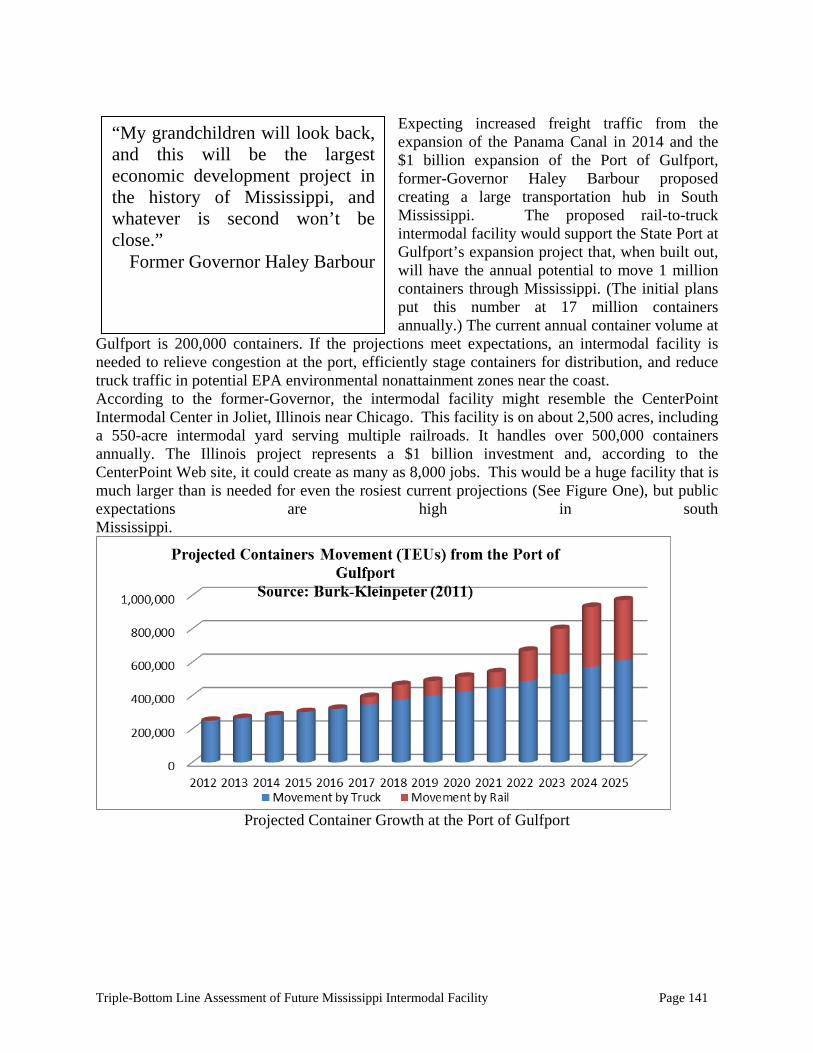
Triple-Bottom Line Assessment of Future Mississippi Intermodal Facility Page 141
“My grandchildren will look back, and this will be the largest economic development project in the history of Mississippi, and whatever is second won’t be close.”
Former Governor Haley Barbour
Expecting increased freight traffic from the expansion of the Panama Canal in 2014 and the $1 billion expansion of the Port of Gulfport, former-Governor Haley Barbour proposed creating a large transportation hub in South Mississippi. The proposed rail-to-truck intermodal facility would support the State Port at Gulfport’s expansion project that, when built out, will have the annual potential to move 1 million containers through Mississippi. (The initial plans put this number at 17 million containers annually.) The current annual container volume at
Gulfport is 200,000 containers. If the projections meet expectations, an intermodal facility is needed to relieve congestion at the port, efficiently stage containers for distribution, and reduce truck traffic in potential EPA environmental nonattainment zones near the coast. According to the former-Governor, the intermodal facility might resemble the CenterPoint Intermodal Center in Joliet, Illinois near Chicago. This facility is on about 2,500 acres, including a 550-acre intermodal yard serving multiple railroads. It handles over 500,000 containers annually. The Illinois project represents a $1 billion investment and, according to the CenterPoint Web site, it could create as many as 8,000 jobs. This would be a huge facility that is much larger than is needed for even the rosiest current projections (See Figure One), but public expectations are high in south Mississippi.
Projected Container Growth at the Port of Gulfport
Triple-Bottom Line Assessment of Future Mississippi Intermodal Facility Page 142
Organizational Design, Strategy, and Leadership: Intermodal facilities can be categorized into three different models according to their organizational design and management. These models are based on the ownership of the facilities, management, and over all leadership design. The models are:
(i) the Landlord Model Intermodal Facility (ii) the Operator Intermodal Facility and (iii) the Developer Model Facility
Landlord Intermodal Facility This is where the intermodal infrastructures is set up or built by the government and leased out to operators on a landlord-tenant basis, consequently, the main revenue streams are land rents and dues on the facilities. In general, landlord intermodal facilities do not aim for profit maximization, but have other objectives, such as economic development, traffic decongestion, pollution reduction, and the creation of efficient supply chain for industries in the area. However, landlord intermodal facilities are self-sustaining. This implies landlord intermodal facilities need to generate sufficient return on investment to finance new investments, therefore apart from leasing out the facilities, they also engage in active investments to improve the efficiency of the transport chain and the competitiveness of the intermodal facilities. The Virginia Inland Port (VIP) is a typical example of a landlord model. Operator Intermodal Facility Most intermodal facilities in North America are driven by the operator model. Operators, who are typically the rail companies, own and manage such facilities. In most cases public involvement consists of financing infrastructure such as roads to the facility. An example of such facility is the Union Pacific at Laredo, Texas. Developer Model Intermodal Facility Here, a real estate developer owns the intermodal facility. There are several large companies that specialize in this type of business venture. The Allen Group (www.allengroup.com) Dallas Logistics Hub Dallas, TX 6,000 Acres
Int'l Trade & Transportation CenterShafter, CA700 Acres
MidState 99 Distribution CenterVisalia, CA480 Acres
Logistics Park Kansas City Gardner, KS1,000 Acres
CenterPoint Properties (www.centerpoint-prop.com) CenterPoint Intermodal Center - Elwood,IL 2,500 acres
CenterPoint Intermodal Center - Kansas City, MO 1,340 acres
CenterPoint Intermodal Center - Houston, TX 800 acres
CenterPoint Intermodal Center - Savannah, GA 250 acres
CenterPoint Intermodal Center - Suffolk, VA 921 acres
CenterPoint Intermodal Center - Manteca, CA 250 acres
CenterPoint Intermodal Center - Joliet, IL 3,600 acres
CenterPoint Intermodal Center – Rochelle, IL 1,595 acres
Hillwood, A Perot Company (/www.hillwood.com) DeSoto Trade Center- Alliance Global West Valley Logistics Charleston Trade
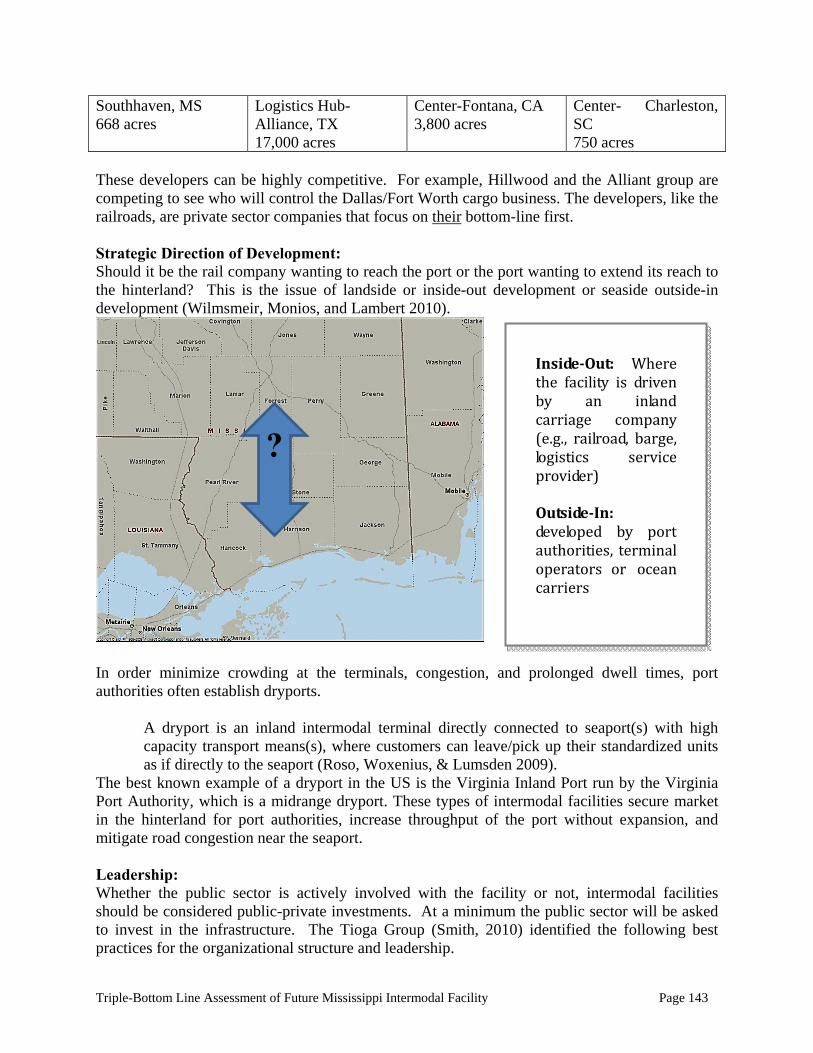
Triple-Bottom Line Assessment of Future Mississippi Intermodal Facility Page 143
Southhaven, MS 668 acres
Logistics Hub- Alliance, TX 17,000 acres
Center-Fontana, CA 3,800 acres
Center- Charleston, SC 750 acres
These developers can be highly competitive. For example, Hillwood and the Alliant group are competing to see who will control the Dallas/Fort Worth cargo business. The developers, like the railroads, are private sector companies that focus on their bottom-line first. Strategic Direction of Development: Should it be the rail company wanting to reach the port or the port wanting to extend its reach to the hinterland? This is the issue of landside or inside-out development or seaside outside-in development (Wilmsmeir, Monios, and Lambert 2010).
In order minimize crowding at the terminals, congestion, and prolonged dwell times, port authorities often establish dryports.
A dryport is an inland intermodal terminal directly connected to seaport(s) with high capacity transport means(s), where customers can leave/pick up their standardized units as if directly to the seaport (Roso, Woxenius, & Lumsden 2009).
The best known example of a dryport in the US is the Virginia Inland Port run by the Virginia Port Authority, which is a midrange dryport. These types of intermodal facilities secure market in the hinterland for port authorities, increase throughput of the port without expansion, and mitigate road congestion near the seaport. Leadership: Whether the public sector is actively involved with the facility or not, intermodal facilities should be considered public-private investments. At a minimum the public sector will be asked to invest in the infrastructure. The Tioga Group (Smith, 2010) identified the following best practices for the organizational structure and leadership.
Inside‐Out: Wherethe facility is drivenby an inlandcarriage company(e.g., railroad, barge,logistics serviceprovider) Outside‐In:developed by portauthorities, terminaloperators or oceancarriers
?
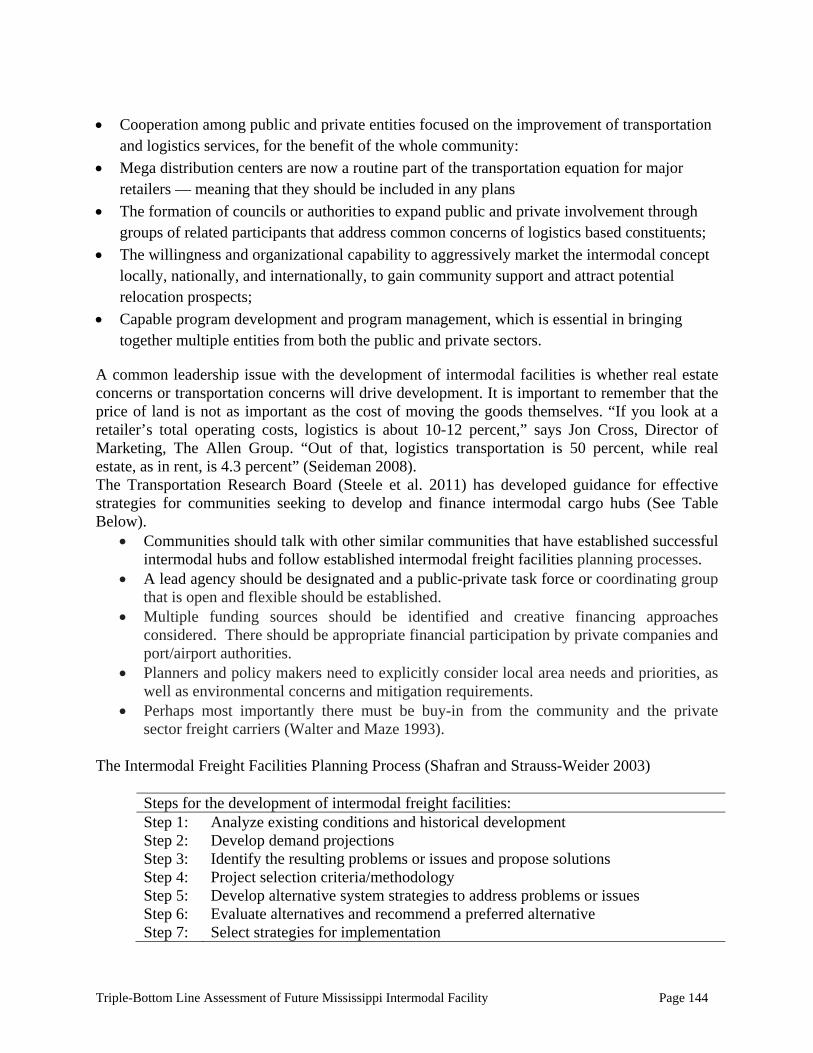
Triple-Bottom Line Assessment of Future Mississippi Intermodal Facility Page 144
Cooperation among public and private entities focused on the improvement of transportation
and logistics services, for the benefit of the whole community:
Mega distribution centers are now a routine part of the transportation equation for major retailers — meaning that they should be included in any plans
The formation of councils or authorities to expand public and private involvement through groups of related participants that address common concerns of logistics based constituents;
The willingness and organizational capability to aggressively market the intermodal concept locally, nationally, and internationally, to gain community support and attract potential relocation prospects;
Capable program development and program management, which is essential in bringing together multiple entities from both the public and private sectors.
A common leadership issue with the development of intermodal facilities is whether real estate concerns or transportation concerns will drive development. It is important to remember that the price of land is not as important as the cost of moving the goods themselves. “If you look at a retailer’s total operating costs, logistics is about 10-12 percent,” says Jon Cross, Director of Marketing, The Allen Group. “Out of that, logistics transportation is 50 percent, while real estate, as in rent, is 4.3 percent” (Seideman 2008). The Transportation Research Board (Steele et al. 2011) has developed guidance for effective strategies for communities seeking to develop and finance intermodal cargo hubs (See Table Below).
Communities should talk with other similar communities that have established successful intermodal hubs and follow established intermodal freight facilities planning processes.
A lead agency should be designated and a public-private task force or coordinating group that is open and flexible should be established.
Multiple funding sources should be identified and creative financing approaches considered. There should be appropriate financial participation by private companies and port/airport authorities.
Planners and policy makers need to explicitly consider local area needs and priorities, as well as environmental concerns and mitigation requirements.
Perhaps most importantly there must be buy-in from the community and the private sector freight carriers (Walter and Maze 1993).
The Intermodal Freight Facilities Planning Process (Shafran and Strauss-Weider 2003)
Steps for the development of intermodal freight facilities: Step 1: Analyze existing conditions and historical development Step 2: Develop demand projections Step 3: Identify the resulting problems or issues and propose solutions Step 4: Project selection criteria/methodology Step 5: Develop alternative system strategies to address problems or issues Step 6: Evaluate alternatives and recommend a preferred alternative Step 7: Select strategies for implementation
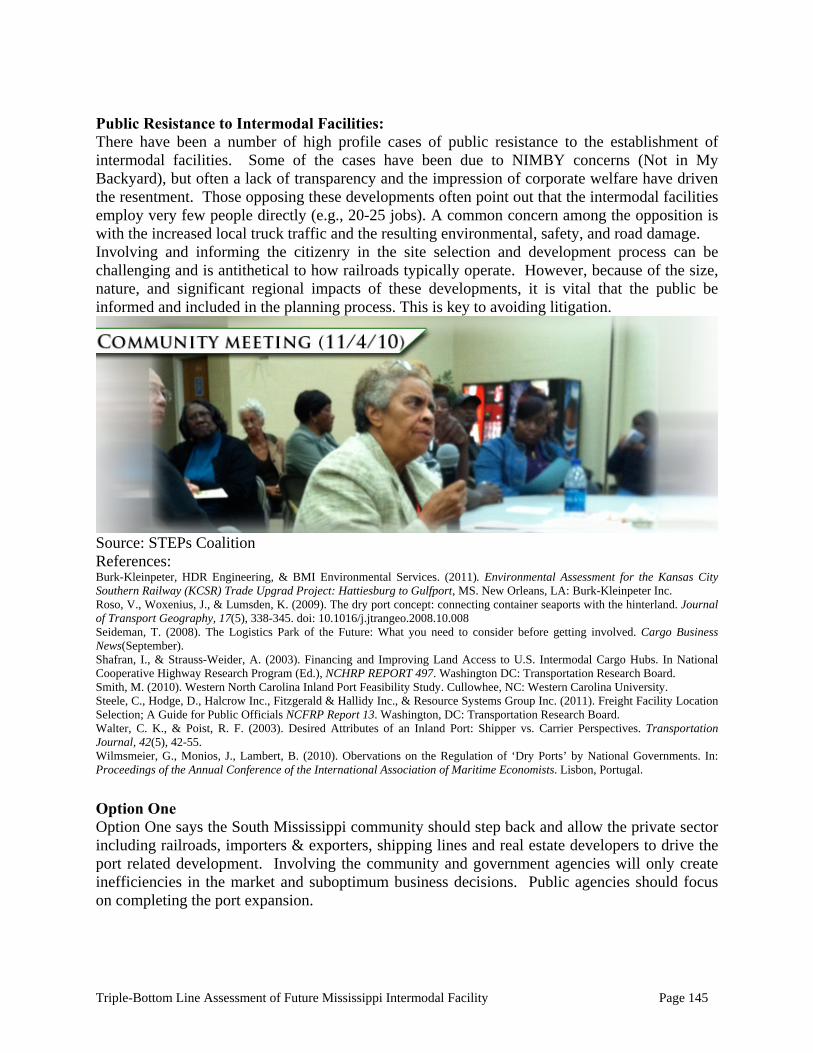
Triple-Bottom Line Assessment of Future Mississippi Intermodal Facility Page 145
Public Resistance to Intermodal Facilities: There have been a number of high profile cases of public resistance to the establishment of intermodal facilities. Some of the cases have been due to NIMBY concerns (Not in My Backyard), but often a lack of transparency and the impression of corporate welfare have driven the resentment. Those opposing these developments often point out that the intermodal facilities employ very few people directly (e.g., 20-25 jobs). A common concern among the opposition is with the increased local truck traffic and the resulting environmental, safety, and road damage. Involving and informing the citizenry in the site selection and development process can be challenging and is antithetical to how railroads typically operate. However, because of the size, nature, and significant regional impacts of these developments, it is vital that the public be informed and included in the planning process. This is key to avoiding litigation.
Source: STEPs Coalition References: Burk-Kleinpeter, HDR Engineering, & BMI Environmental Services. (2011). Environmental Assessment for the Kansas City Southern Railway (KCSR) Trade Upgrad Project: Hattiesburg to Gulfport, MS. New Orleans, LA: Burk-Kleinpeter Inc. Roso, V., Woxenius, J., & Lumsden, K. (2009). The dry port concept: connecting container seaports with the hinterland. Journal of Transport Geography, 17(5), 338-345. doi: 10.1016/j.jtrangeo.2008.10.008 Seideman, T. (2008). The Logistics Park of the Future: What you need to consider before getting involved. Cargo Business News(September). Shafran, I., & Strauss-Weider, A. (2003). Financing and Improving Land Access to U.S. Intermodal Cargo Hubs. In National Cooperative Highway Research Program (Ed.), NCHRP REPORT 497. Washington DC: Transportation Research Board. Smith, M. (2010). Western North Carolina Inland Port Feasibility Study. Cullowhee, NC: Western Carolina University. Steele, C., Hodge, D., Halcrow Inc., Fitzgerald & Hallidy Inc., & Resource Systems Group Inc. (2011). Freight Facility Location Selection; A Guide for Public Officials NCFRP Report 13. Washington, DC: Transportation Research Board. Walter, C. K., & Poist, R. F. (2003). Desired Attributes of an Inland Port: Shipper vs. Carrier Perspectives. Transportation Journal, 42(5), 42-55. Wilmsmeier, G., Monios, J., Lambert, B. (2010). Obervations on the Regulation of ‘Dry Ports’ by National Governments. In: Proceedings of the Annual Conference of the International Association of Maritime Economists. Lisbon, Portugal.
Option One Option One says the South Mississippi community should step back and allow the private sector including railroads, importers & exporters, shipping lines and real estate developers to drive the port related development. Involving the community and government agencies will only create inefficiencies in the market and suboptimum business decisions. Public agencies should focus on completing the port expansion.
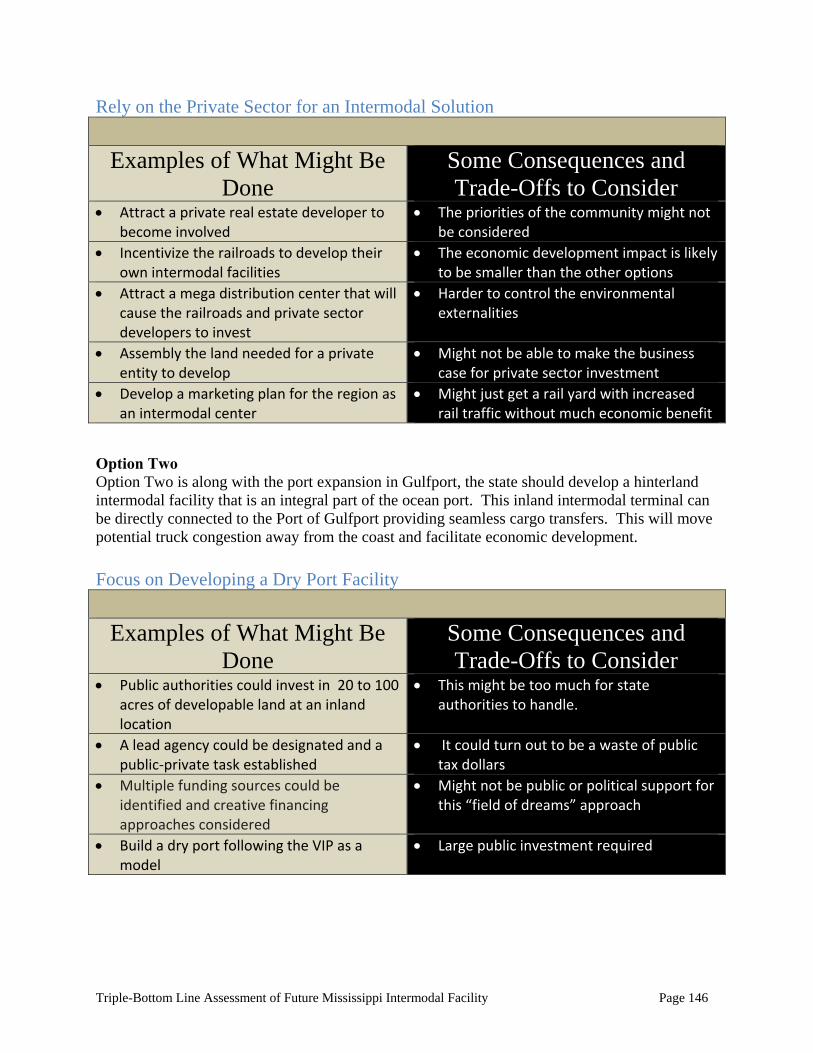
Triple-Bottom Line Assessment of Future Mississippi Intermodal Facility Page 146
Rely on the Private Sector for an Intermodal Solution
Examples of What Might Be Done
Some Consequences and Trade-Offs to Consider
Attract a private real estate developer to become involved
The priorities of the community might not be considered
Incentivize the railroads to develop their own intermodal facilities
The economic development impact is likely to be smaller than the other options
Attract a mega distribution center that will cause the railroads and private sector developers to invest
Harder to control the environmental externalities
Assembly the land needed for a private entity to develop
Might not be able to make the business case for private sector investment
Develop a marketing plan for the region as an intermodal center
Might just get a rail yard with increased rail traffic without much economic benefit
Option Two Option Two is along with the port expansion in Gulfport, the state should develop a hinterland intermodal facility that is an integral part of the ocean port. This inland intermodal terminal can be directly connected to the Port of Gulfport providing seamless cargo transfers. This will move potential truck congestion away from the coast and facilitate economic development.
Focus on Developing a Dry Port Facility
Examples of What Might Be
Done Some Consequences and Trade-Offs to Consider
Public authorities could invest in 20 to 100 acres of developable land at an inland location
This might be too much for state authorities to handle.
A lead agency could be designated and a public‐private task established
It could turn out to be a waste of public tax dollars
Multiple funding sources could be identified and creative financing approaches considered
Might not be public or political support for this “field of dreams” approach
Build a dry port following the VIP as a model
Large public investment required
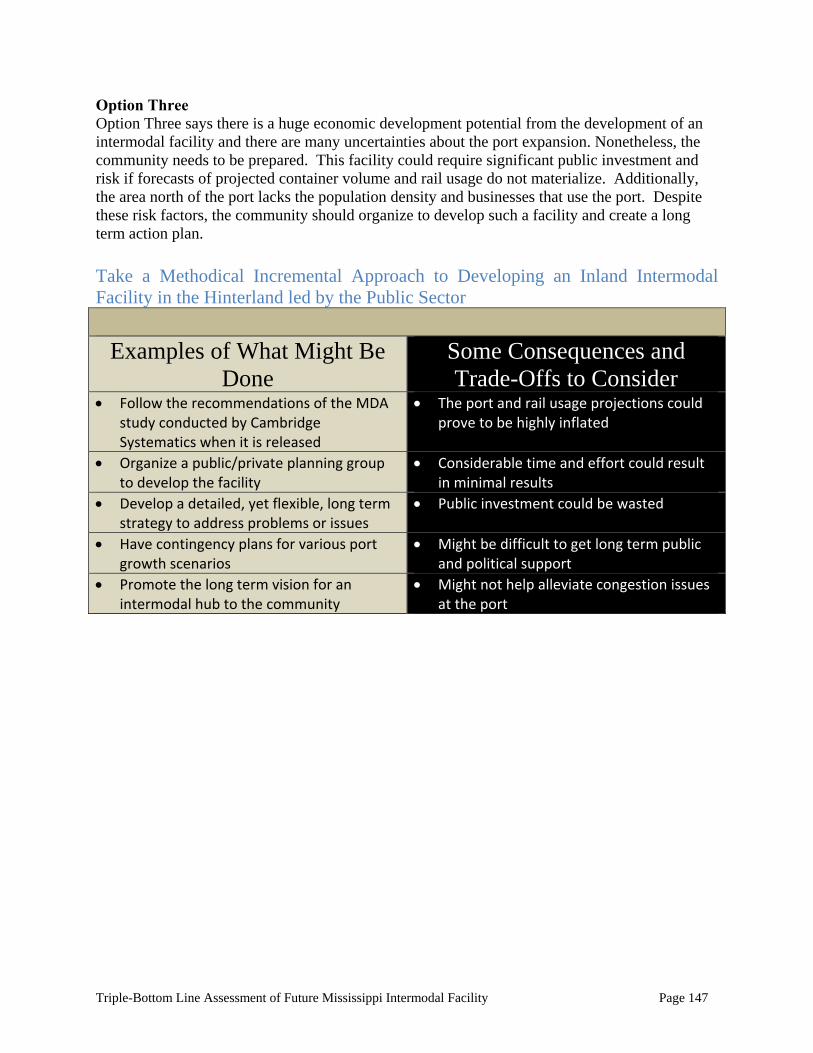
Triple-Bottom Line Assessment of Future Mississippi Intermodal Facility Page 147
Option Three Option Three says there is a huge economic development potential from the development of an intermodal facility and there are many uncertainties about the port expansion. Nonetheless, the community needs to be prepared. This facility could require significant public investment and risk if forecasts of projected container volume and rail usage do not materialize. Additionally, the area north of the port lacks the population density and businesses that use the port. Despite these risk factors, the community should organize to develop such a facility and create a long term action plan.
Take a Methodical Incremental Approach to Developing an Inland Intermodal Facility in the Hinterland led by the Public Sector
Examples of What Might Be
Done Some Consequences and Trade-Offs to Consider
Follow the recommendations of the MDA study conducted by Cambridge Systematics when it is released
The port and rail usage projections could prove to be highly inflated
Organize a public/private planning group to develop the facility
Considerable time and effort could result in minimal results
Develop a detailed, yet flexible, long term strategy to address problems or issues
Public investment could be wasted
Have contingency plans for various port growth scenarios
Might be difficult to get long term public and political support
Promote the long term vision for an intermodal hub to the community
Might not help alleviate congestion issues at the port
Triple-Bottom Line Assessment of Future Mississippi Intermodal Facility Page 148
ISSUE GUIDE 2012
South Mississippi Intermodal Facility
How Should We Take Charge of Our Future?
Logistical & Environmental Analysis
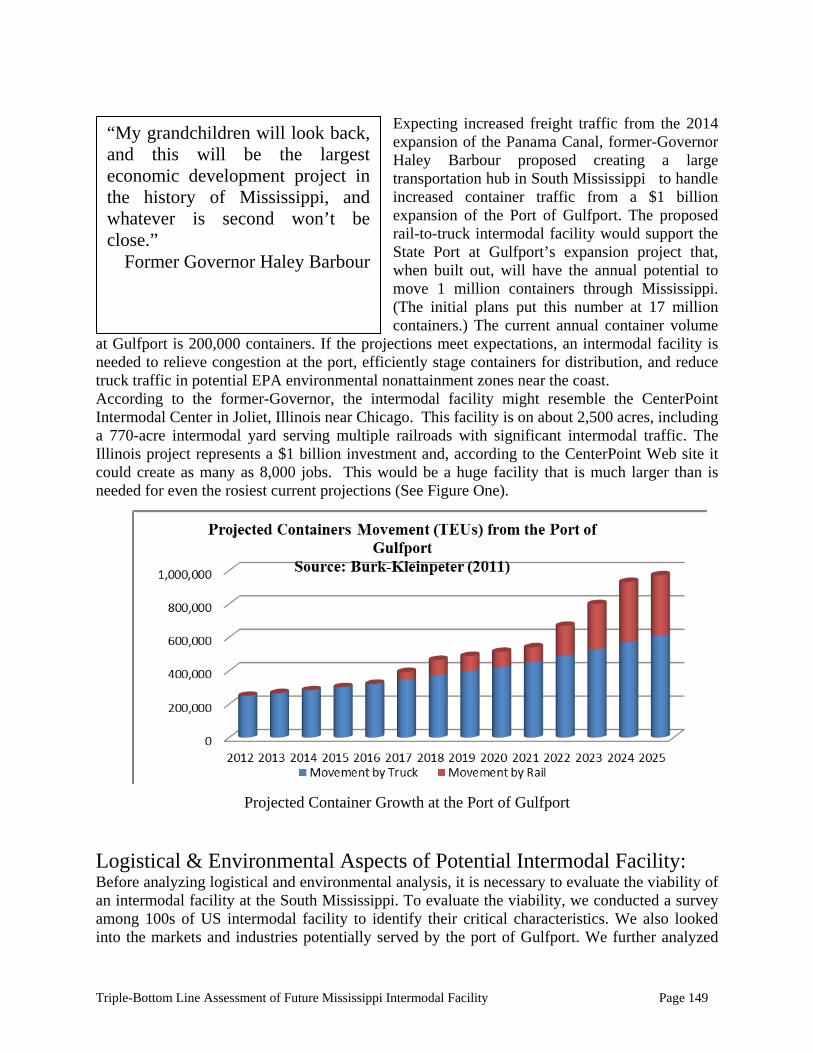
Triple-Bottom Line Assessment of Future Mississippi Intermodal Facility Page 149
“My grandchildren will look back, and this will be the largest economic development project in the history of Mississippi, and whatever is second won’t be close.”
Former Governor Haley Barbour
Expecting increased freight traffic from the 2014 expansion of the Panama Canal, former-Governor Haley Barbour proposed creating a large transportation hub in South Mississippi to handle increased container traffic from a $1 billion expansion of the Port of Gulfport. The proposed rail-to-truck intermodal facility would support the State Port at Gulfport’s expansion project that, when built out, will have the annual potential to move 1 million containers through Mississippi. (The initial plans put this number at 17 million containers.) The current annual container volume
at Gulfport is 200,000 containers. If the projections meet expectations, an intermodal facility is needed to relieve congestion at the port, efficiently stage containers for distribution, and reduce truck traffic in potential EPA environmental nonattainment zones near the coast. According to the former-Governor, the intermodal facility might resemble the CenterPoint Intermodal Center in Joliet, Illinois near Chicago. This facility is on about 2,500 acres, including a 770-acre intermodal yard serving multiple railroads with significant intermodal traffic. The Illinois project represents a $1 billion investment and, according to the CenterPoint Web site it could create as many as 8,000 jobs. This would be a huge facility that is much larger than is needed for even the rosiest current projections (See Figure One).
Projected Container Growth at the Port of Gulfport
Logistical & Environmental Aspects of Potential Intermodal Facility: Before analyzing logistical and environmental analysis, it is necessary to evaluate the viability of an intermodal facility at the South Mississippi. To evaluate the viability, we conducted a survey among 100s of US intermodal facility to identify their critical characteristics. We also looked into the markets and industries potentially served by the port of Gulfport. We further analyzed
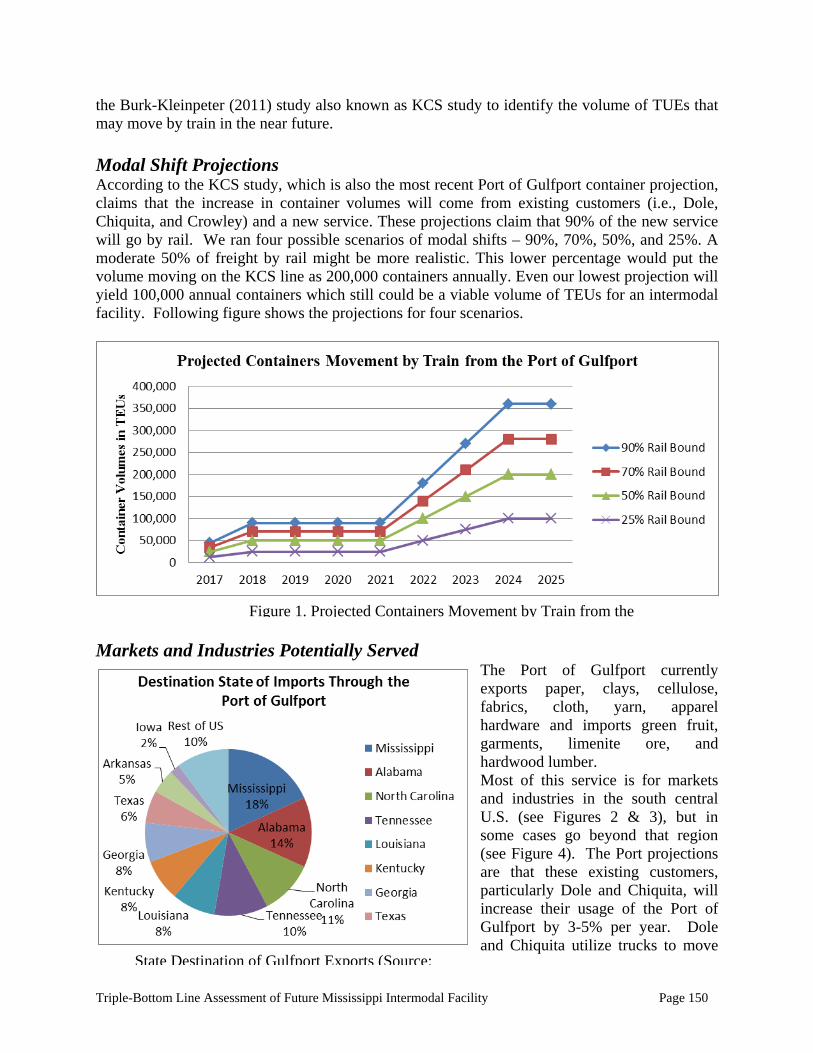
Triple-Bottom Line Assessment of Future Mississippi Intermodal Facility Page 150
the Burk-Kleinpeter (2011) study also known as KCS study to identify the volume of TUEs that may move by train in the near future. Modal Shift Projections According to the KCS study, which is also the most recent Port of Gulfport container projection, claims that the increase in container volumes will come from existing customers (i.e., Dole, Chiquita, and Crowley) and a new service. These projections claim that 90% of the new service will go by rail. We ran four possible scenarios of modal shifts – 90%, 70%, 50%, and 25%. A moderate 50% of freight by rail might be more realistic. This lower percentage would put the volume moving on the KCS line as 200,000 containers annually. Even our lowest projection will yield 100,000 annual containers which still could be a viable volume of TEUs for an intermodal facility. Following figure shows the projections for four scenarios.
Markets and Industries Potentially Served
The Port of Gulfport currently exports paper, clays, cellulose, fabrics, cloth, yarn, apparel hardware and imports green fruit, garments, limenite ore, and hardwood lumber. Most of this service is for markets and industries in the south central U.S. (see Figures 2 & 3), but in some cases go beyond that region (see Figure 4). The Port projections are that these existing customers, particularly Dole and Chiquita, will increase their usage of the Port of Gulfport by 3-5% per year. Dole and Chiquita utilize trucks to move
State Destination of Gulfport Exports (Source:
Figure 1. Projected Containers Movement by Train from the
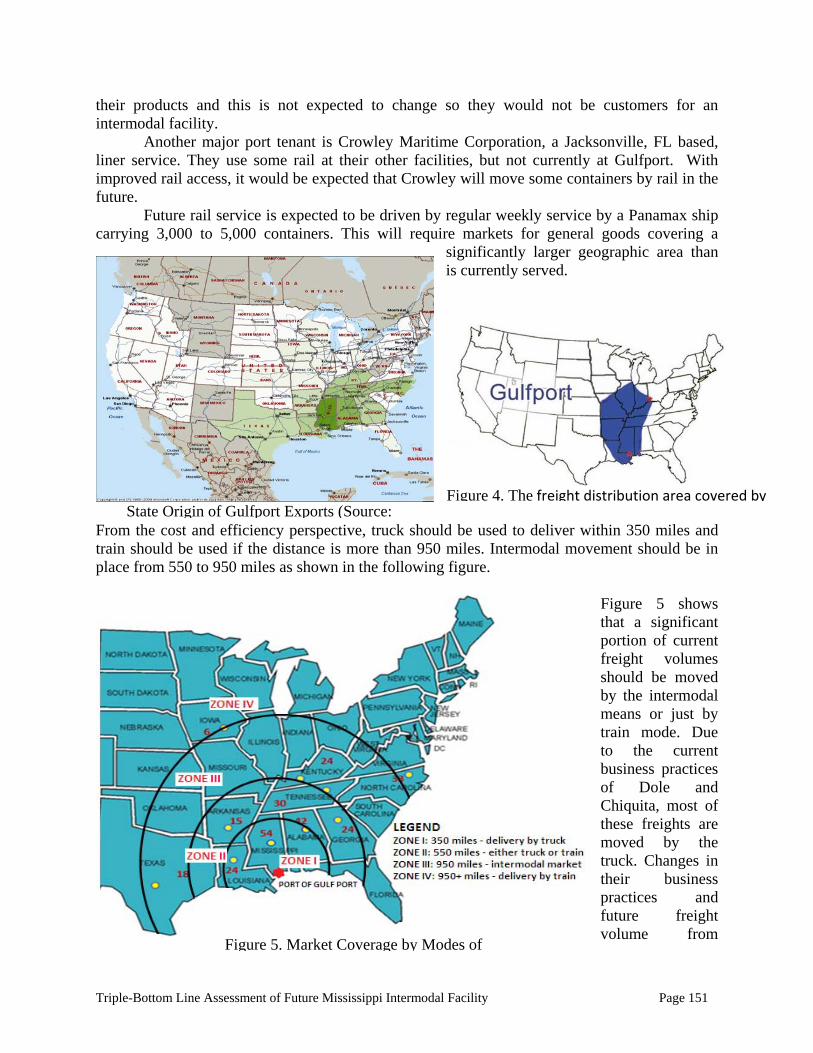
Triple-Bottom Line Assessment of Future Mississippi Intermodal Facility Page 151
their products and this is not expected to change so they would not be customers for an intermodal facility.
Another major port tenant is Crowley Maritime Corporation, a Jacksonville, FL based, liner service. They use some rail at their other facilities, but not currently at Gulfport. With improved rail access, it would be expected that Crowley will move some containers by rail in the future. Future rail service is expected to be driven by regular weekly service by a Panamax ship carrying 3,000 to 5,000 containers. This will require markets for general goods covering a
significantly larger geographic area than is currently served.
From the cost and efficiency perspective, truck should be used to deliver within 350 miles and train should be used if the distance is more than 950 miles. Intermodal movement should be in place from 550 to 950 miles as shown in the following figure.
Figure 5 shows that a significant portion of current freight volumes should be moved by the intermodal means or just by train mode. Due to the current business practices of Dole and Chiquita, most of these freights are moved by the truck. Changes in their business practices and future freight volume from
State Origin of Gulfport Exports (Source: Figure 4. The freight distribution area covered by
Figure 5. Market Coverage by Modes of
Triple-Bottom Line Assessment of Future Mississippi Intermodal Facility Page 152
other companies can alter this dynamics significantly. Our study found that there is a huge potential of modal shift of TEUs and the expected volume of freight moved by train can justify an intermodal facility as many US intermodal facility runs at the same volume. Even though, our study shows the viability of an intermodal facility in south Mississippi, whether it will be realized or not will depend on many other factors including the actual freight volumes moved by train in the future.
Logistical and Environmental Analysis:
A new intermodal facility in Mississippi and its location will be a key factor to improve freight movement throughout the region. Improvements in freight service can be expected to have positive logistical effects. Low cost and better service in freight movement have a positive effect on all Mississippi firms engaged in the production, distribution, trade, and/or retail sale of physical goods. Reducing the per-mile cost of goods carriage means that any production facility can serve a wider market area, with potential gains from scale efficiencies. Intermodal facilities impact the local environment in many ways. These effects are evaluated based on the significance and likelihood of impacts. The significance of adverse impacts depends on magnitude, geographic extent, duration and frequency, irreversibility, ecological context, social context, and economic context. In this study, we conducted a preliminary site location analysis, facility analysis, congestions analysis, and broader environmental impact analysis.
Site requirements for an intermodal facility:
Intermodal facilities can greatly benefit from present day business climate, thus it is necessary to observe distinguishing characteristics of facilities in order to optimize and obtain efficient transportation systems. Site selection can be a complicated issue and in this study it is necessary to choose the best site among all alternatives. This study identified various site selection parameters based on literature reviews and survey and identified top 10 cities in South Mississippi that are potential candidates for the proposed intermodal facility. Transportation Research Board (TRB) has conducted some good research on facility location analysis. The NCFRP Freight Facility Location Selection: A Guide for Public Officials Report 13 (2011) is the best among them. This report discusses the location selection criteria, location screening process using those criteria, and the impact of best selection on the economy. As mentioned earlier that careful selection of intermodal facility can have the maximum logistical and economic impact. Intermodal facilities are capable of providing significant economic benefits for companies operating such facilities; however, the selection of facility location is a critical matter for maximizing these benefits. Critical criteria for site selection include cost-to-benefit ratio, environmental impacts, and material flow densities. Potential facility locations must have a combination of assets available in order to provide an ideal location for an intermodal hub facility. According to the NCFRP report 13 and Poist and Walter (2003) study, the ideal intermodal facility location must have the following:
Adequate transportation infrastructure,
Proximity to primary markets,
Geographic advantage,
Presence of larger freight shippers
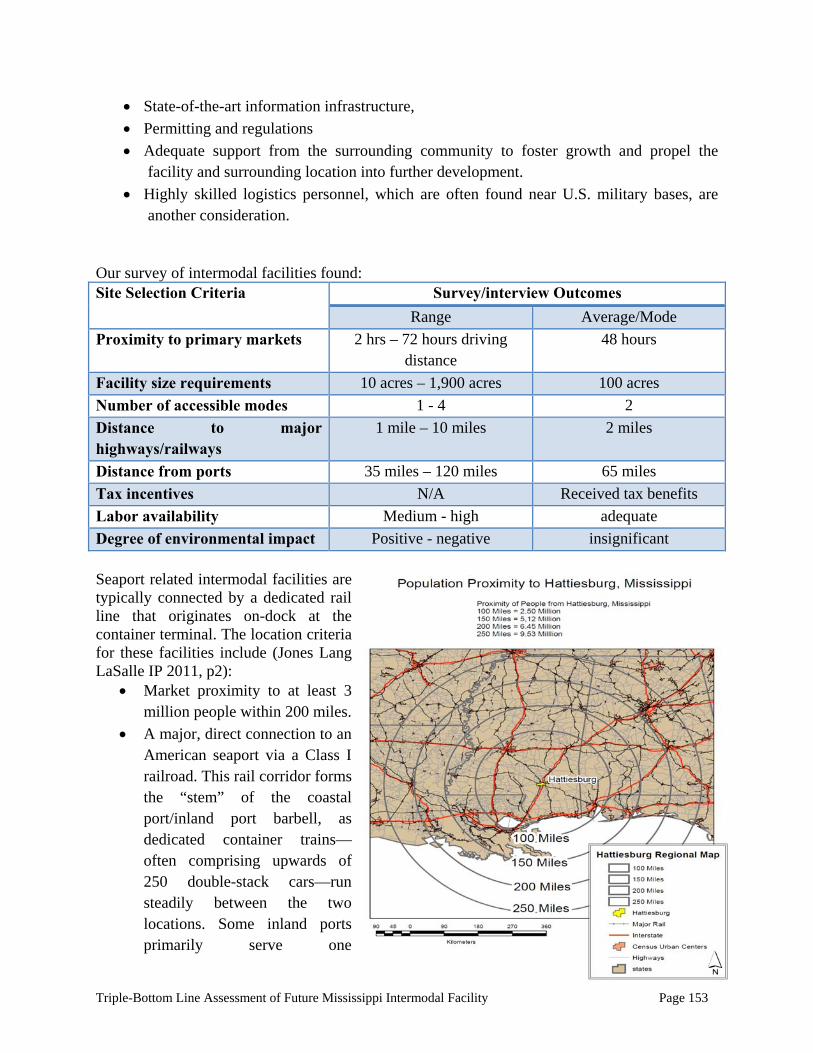
Triple-Bottom Line Assessment of Future Mississippi Intermodal Facility Page 153
State-of-the-art information infrastructure,
Permitting and regulations
Adequate support from the surrounding community to foster growth and propel the facility and surrounding location into further development.
Highly skilled logistics personnel, which are often found near U.S. military bases, are another consideration.
Our survey of intermodal facilities found: Site Selection Criteria Survey/interview Outcomes
Range Average/Mode
Proximity to primary markets 2 hrs – 72 hours driving distance
48 hours
Facility size requirements 10 acres – 1,900 acres 100 acres
Number of accessible modes 1 - 4 2
Distance to major highways/railways
1 mile – 10 miles 2 miles
Distance from ports 35 miles – 120 miles 65 miles
Tax incentives N/A Received tax benefits
Labor availability Medium - high adequate
Degree of environmental impact Positive - negative insignificant
Seaport related intermodal facilities are typically connected by a dedicated rail line that originates on-dock at the container terminal. The location criteria for these facilities include (Jones Lang LaSalle IP 2011, p2):
Market proximity to at least 3 million people within 200 miles.
A major, direct connection to an American seaport via a Class I railroad. This rail corridor forms the “stem” of the coastal port/inland port barbell, as dedicated container trains—often comprising upwards of 250 double-stack cars—run steadily between the two locations. Some inland ports primarily serve one
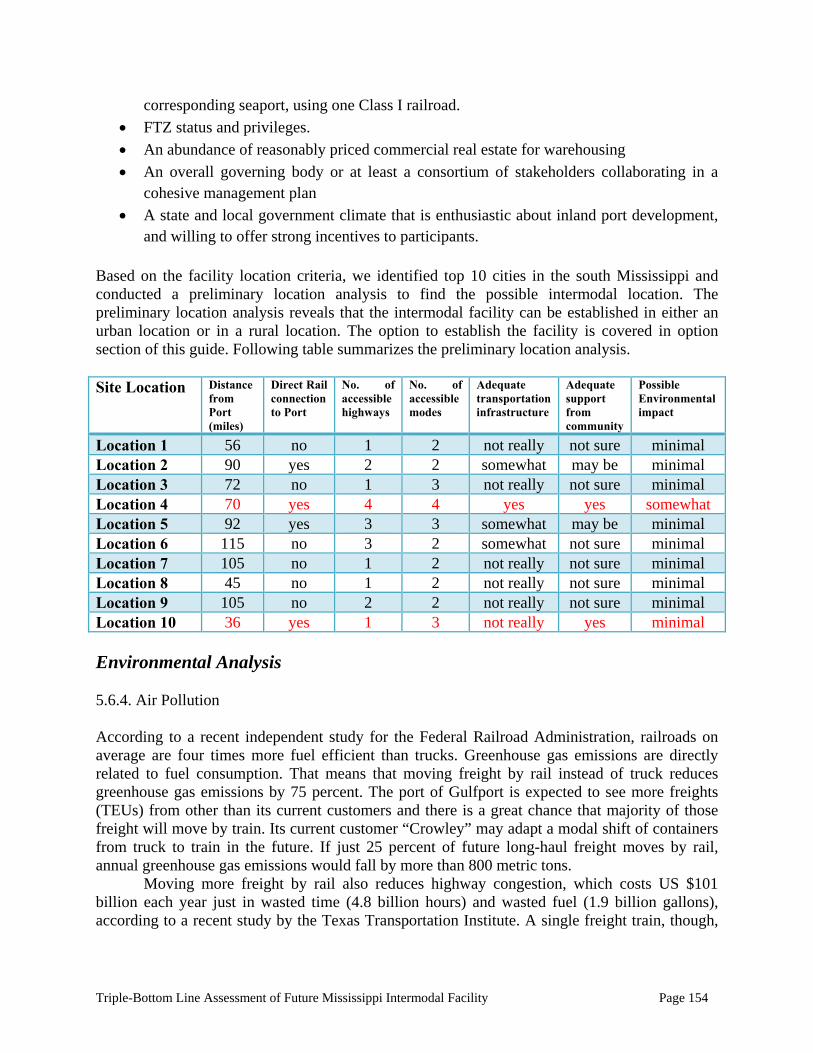
Triple-Bottom Line Assessment of Future Mississippi Intermodal Facility Page 154
corresponding seaport, using one Class I railroad.
FTZ status and privileges.
An abundance of reasonably priced commercial real estate for warehousing
An overall governing body or at least a consortium of stakeholders collaborating in a cohesive management plan
A state and local government climate that is enthusiastic about inland port development, and willing to offer strong incentives to participants.
Based on the facility location criteria, we identified top 10 cities in the south Mississippi and conducted a preliminary location analysis to find the possible intermodal location. The preliminary location analysis reveals that the intermodal facility can be established in either an urban location or in a rural location. The option to establish the facility is covered in option section of this guide. Following table summarizes the preliminary location analysis. Site Location Distance
from Port (miles)
Direct Rail connection to Port
No. of accessible highways
No. of accessible modes
Adequate transportation infrastructure
Adequate support from community
Possible Environmental impact
Location 1 56 no 1 2 not really not sure minimal Location 2 90 yes 2 2 somewhat may be minimal Location 3 72 no 1 3 not really not sure minimal Location 4 70 yes 4 4 yes yes somewhat Location 5 92 yes 3 3 somewhat may be minimal Location 6 115 no 3 2 somewhat not sure minimal Location 7 105 no 1 2 not really not sure minimal Location 8 45 no 1 2 not really not sure minimal Location 9 105 no 2 2 not really not sure minimal Location 10 36 yes 1 3 not really yes minimal Environmental Analysis 5.6.4. Air Pollution According to a recent independent study for the Federal Railroad Administration, railroads on average are four times more fuel efficient than trucks. Greenhouse gas emissions are directly related to fuel consumption. That means that moving freight by rail instead of truck reduces greenhouse gas emissions by 75 percent. The port of Gulfport is expected to see more freights (TEUs) from other than its current customers and there is a great chance that majority of those freight will move by train. Its current customer “Crowley” may adapt a modal shift of containers from truck to train in the future. If just 25 percent of future long-haul freight moves by rail, annual greenhouse gas emissions would fall by more than 800 metric tons.
Moving more freight by rail also reduces highway congestion, which costs US $101 billion each year just in wasted time (4.8 billion hours) and wasted fuel (1.9 billion gallons), according to a recent study by the Texas Transportation Institute. A single freight train, though,
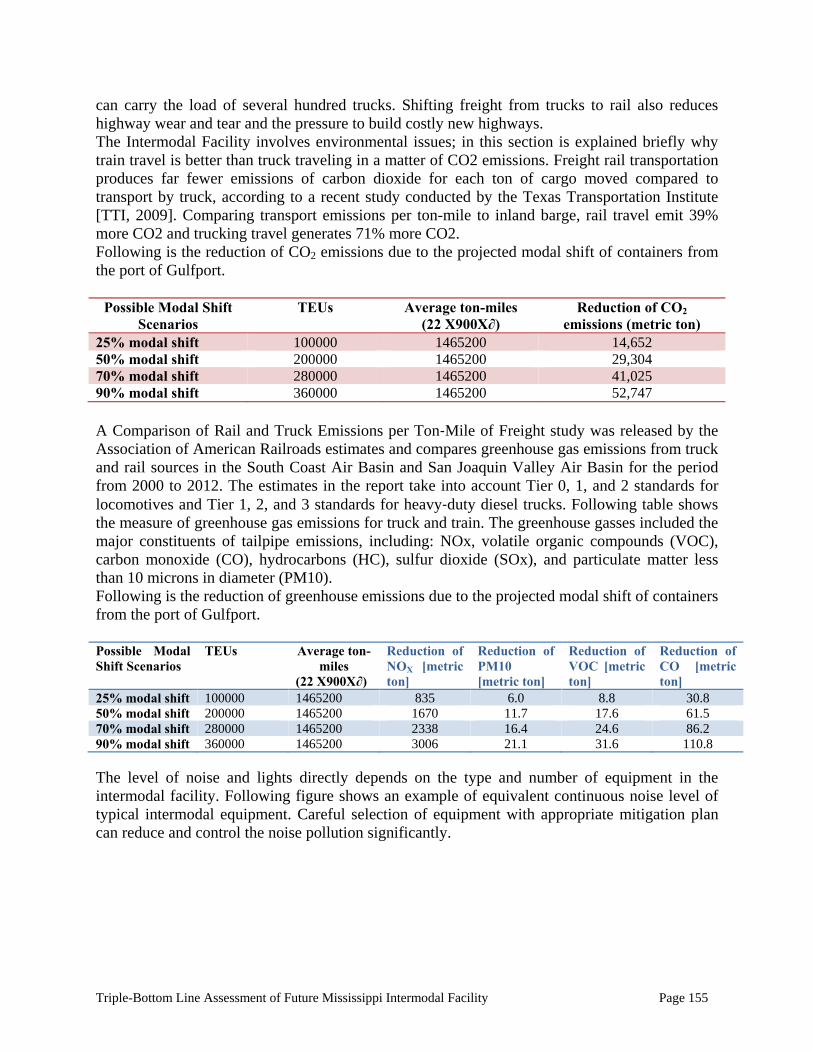
Triple-Bottom Line Assessment of Future Mississippi Intermodal Facility Page 155
can carry the load of several hundred trucks. Shifting freight from trucks to rail also reduces highway wear and tear and the pressure to build costly new highways. The Intermodal Facility involves environmental issues; in this section is explained briefly why train travel is better than truck traveling in a matter of CO2 emissions. Freight rail transportation produces far fewer emissions of carbon dioxide for each ton of cargo moved compared to transport by truck, according to a recent study conducted by the Texas Transportation Institute [TTI, 2009]. Comparing transport emissions per ton-mile to inland barge, rail travel emit 39% more CO2 and trucking travel generates 71% more CO2. Following is the reduction of CO2 emissions due to the projected modal shift of containers from the port of Gulfport.
Possible Modal Shift Scenarios
TEUs Average ton-miles (22 X900X∂)
Reduction of CO2 emissions (metric ton)
25% modal shift 100000 1465200 14,652 50% modal shift 200000 1465200 29,304 70% modal shift 280000 1465200 41,025 90% modal shift 360000 1465200 52,747 A Comparison of Rail and Truck Emissions per Ton‐Mile of Freight study was released by the Association of American Railroads estimates and compares greenhouse gas emissions from truck and rail sources in the South Coast Air Basin and San Joaquin Valley Air Basin for the period from 2000 to 2012. The estimates in the report take into account Tier 0, 1, and 2 standards for locomotives and Tier 1, 2, and 3 standards for heavy‐duty diesel trucks. Following table shows the measure of greenhouse gas emissions for truck and train. The greenhouse gasses included the major constituents of tailpipe emissions, including: NOx, volatile organic compounds (VOC), carbon monoxide (CO), hydrocarbons (HC), sulfur dioxide (SOx), and particulate matter less than 10 microns in diameter (PM10). Following is the reduction of greenhouse emissions due to the projected modal shift of containers from the port of Gulfport. Possible Modal Shift Scenarios
TEUs Average ton-miles
(22 X900X∂)
Reduction of NOX [metric ton]
Reduction of PM10 [metric ton]
Reduction of VOC [metric ton]
Reduction of CO [metric ton]
25% modal shift 100000 1465200 835 6.0 8.8 30.8 50% modal shift 200000 1465200 1670 11.7 17.6 61.5 70% modal shift 280000 1465200 2338 16.4 24.6 86.2 90% modal shift 360000 1465200 3006 21.1 31.6 110.8 The level of noise and lights directly depends on the type and number of equipment in the intermodal facility. Following figure shows an example of equivalent continuous noise level of typical intermodal equipment. Careful selection of equipment with appropriate mitigation plan can reduce and control the noise pollution significantly.
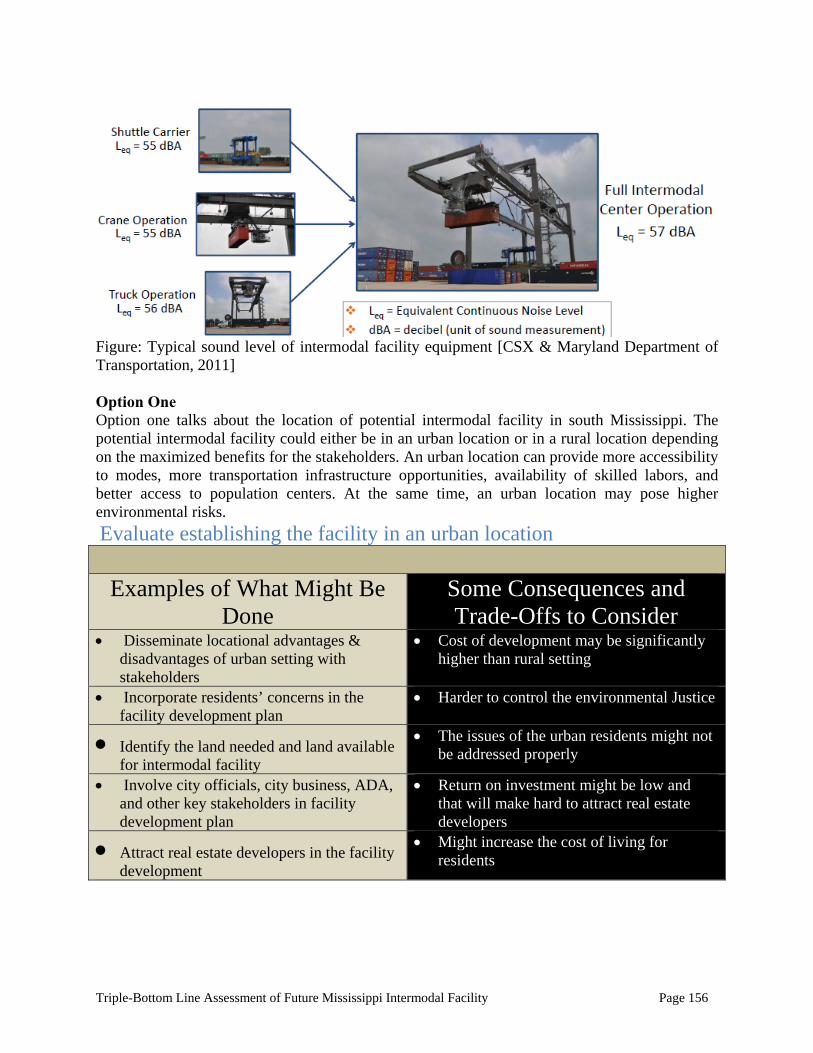
Triple-Bottom Line Assessment of Future Mississippi Intermodal Facility Page 156
Figure: Typical sound level of intermodal facility equipment [CSX & Maryland Department of Transportation, 2011] Option One Option one talks about the location of potential intermodal facility in south Mississippi. The potential intermodal facility could either be in an urban location or in a rural location depending on the maximized benefits for the stakeholders. An urban location can provide more accessibility to modes, more transportation infrastructure opportunities, availability of skilled labors, and better access to population centers. At the same time, an urban location may pose higher environmental risks.
Evaluate establishing the facility in an urban location
Examples of What Might Be Done
Some Consequences and Trade-Offs to Consider
Disseminate locational advantages & disadvantages of urban setting with stakeholders
Cost of development may be significantly higher than rural setting
Incorporate residents’ concerns in the facility development plan
Harder to control the environmental Justice
Identify the land needed and land available for intermodal facility
The issues of the urban residents might not be addressed properly
Involve city officials, city business, ADA, and other key stakeholders in facility development plan
Return on investment might be low and that will make hard to attract real estate developers
Attract real estate developers in the facility development
Might increase the cost of living for residents
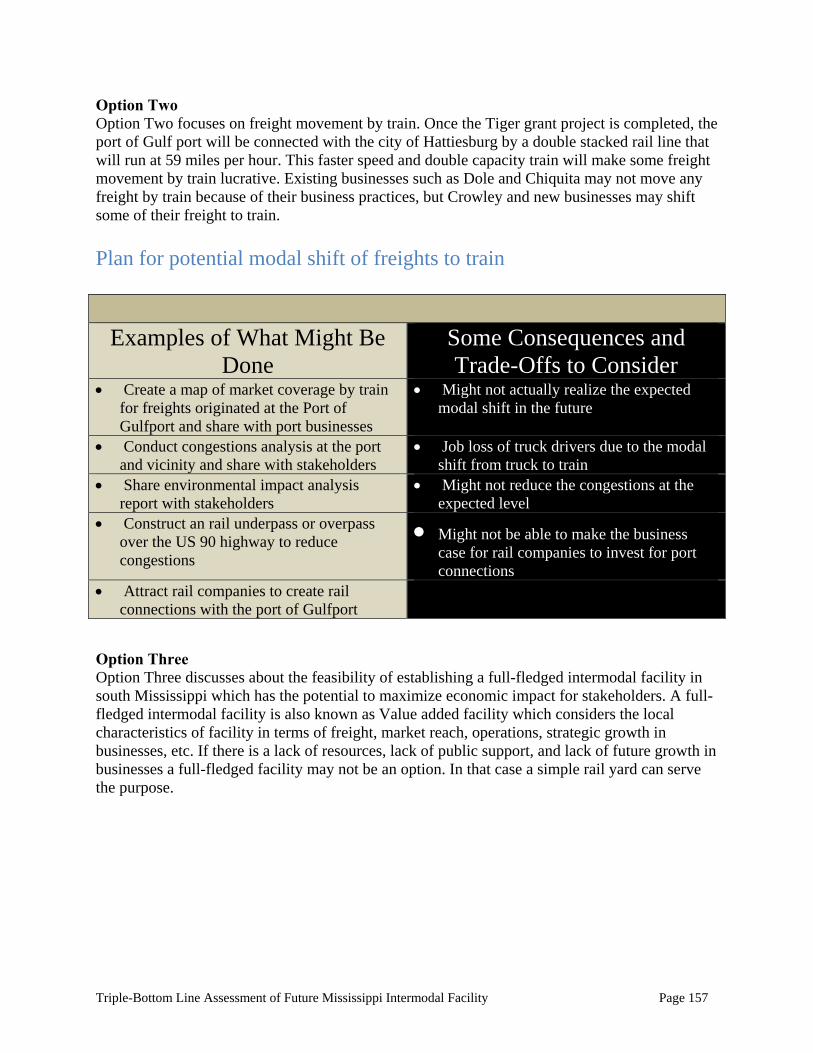
Triple-Bottom Line Assessment of Future Mississippi Intermodal Facility Page 157
Option Two Option Two focuses on freight movement by train. Once the Tiger grant project is completed, the port of Gulf port will be connected with the city of Hattiesburg by a double stacked rail line that will run at 59 miles per hour. This faster speed and double capacity train will make some freight movement by train lucrative. Existing businesses such as Dole and Chiquita may not move any freight by train because of their business practices, but Crowley and new businesses may shift some of their freight to train. Plan for potential modal shift of freights to train
Examples of What Might Be
Done Some Consequences and Trade-Offs to Consider
Create a map of market coverage by train for freights originated at the Port of Gulfport and share with port businesses
Might not actually realize the expected modal shift in the future
Conduct congestions analysis at the port and vicinity and share with stakeholders
Job loss of truck drivers due to the modal shift from truck to train
Share environmental impact analysis report with stakeholders
Might not reduce the congestions at the expected level
Construct an rail underpass or overpass over the US 90 highway to reduce congestions
Might not be able to make the business case for rail companies to invest for port connections
Attract rail companies to create rail connections with the port of Gulfport
Option Three Option Three discusses about the feasibility of establishing a full-fledged intermodal facility in south Mississippi which has the potential to maximize economic impact for stakeholders. A full-fledged intermodal facility is also known as Value added facility which considers the local characteristics of facility in terms of freight, market reach, operations, strategic growth in businesses, etc. If there is a lack of resources, lack of public support, and lack of future growth in businesses a full-fledged facility may not be an option. In that case a simple rail yard can serve the purpose.
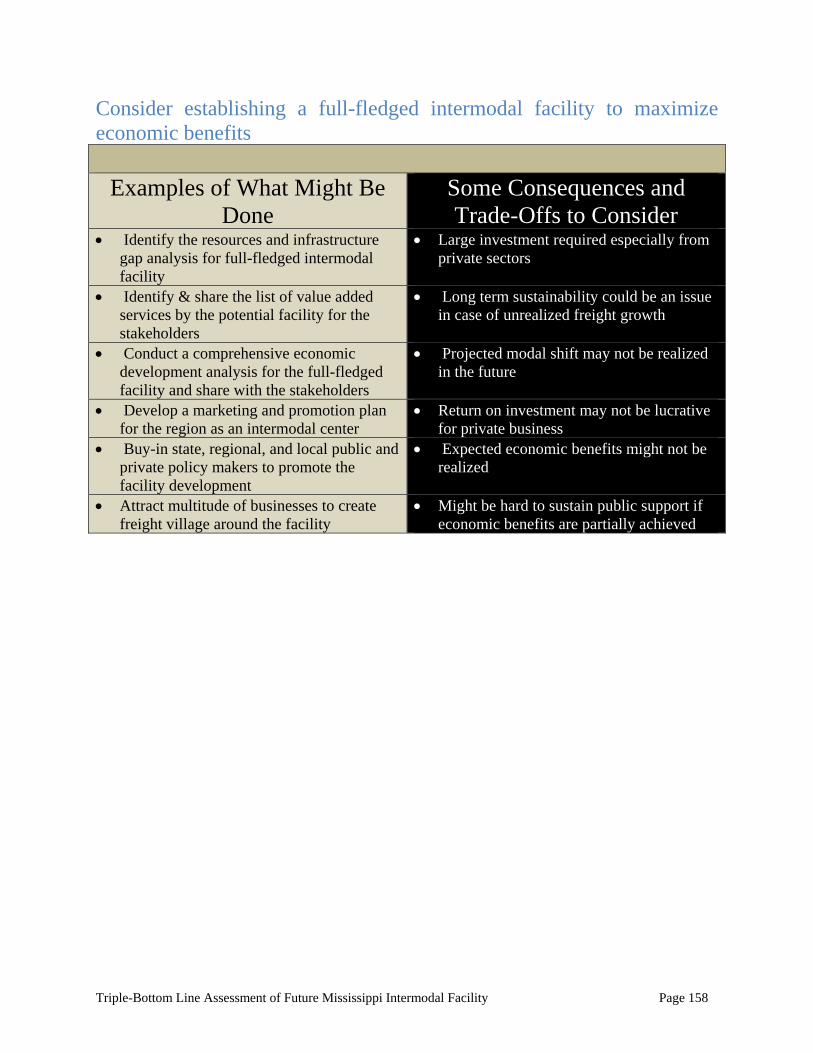
Triple-Bottom Line Assessment of Future Mississippi Intermodal Facility Page 158
Consider establishing a full-fledged intermodal facility to maximize economic benefits
Examples of What Might Be
Done Some Consequences and Trade-Offs to Consider
Identify the resources and infrastructure gap analysis for full-fledged intermodal facility
Large investment required especially from private sectors
Identify & share the list of value added services by the potential facility for the stakeholders
Long term sustainability could be an issue in case of unrealized freight growth
Conduct a comprehensive economic development analysis for the full-fledged facility and share with the stakeholders
Projected modal shift may not be realized in the future
Develop a marketing and promotion plan for the region as an intermodal center
Return on investment may not be lucrative for private business
Buy-in state, regional, and local public and private policy makers to promote the facility development
Expected economic benefits might not be realized
Attract multitude of businesses to create freight village around the facility
Might be hard to sustain public support if economic benefits are partially achieved
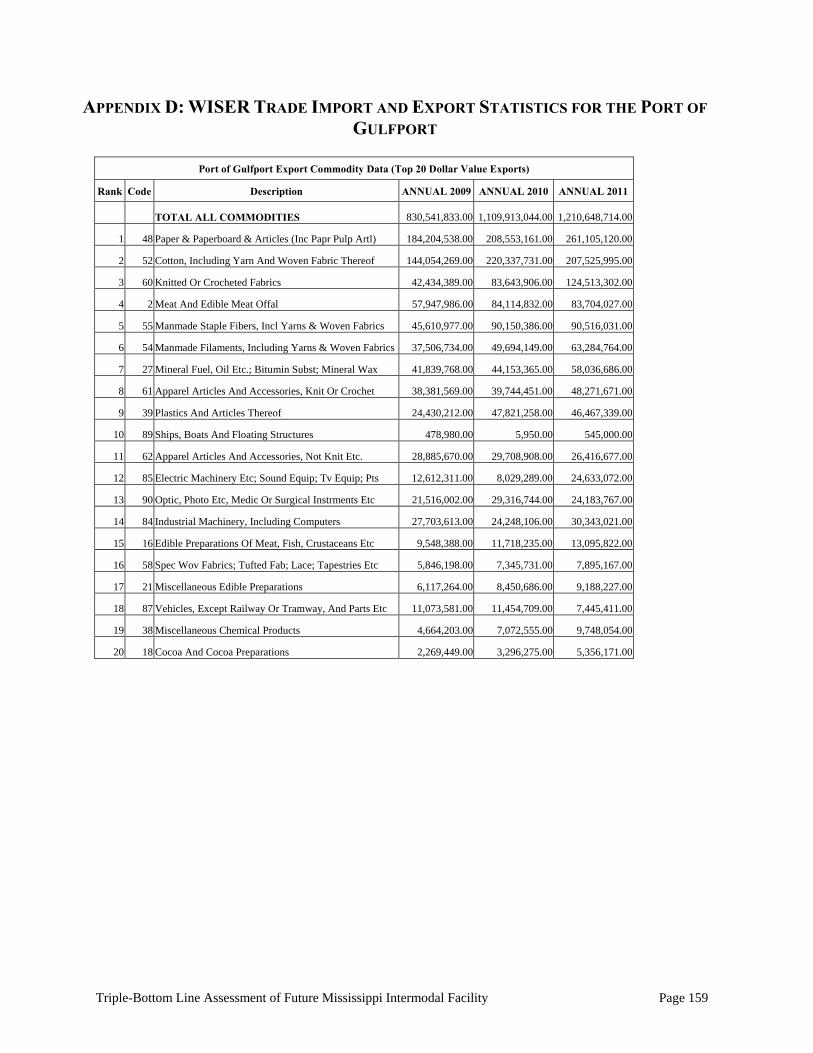
Triple-Bottom Line Assessment of Future Mississippi Intermodal Facility Page 159
APPENDIX D: WISER TRADE IMPORT AND EXPORT STATISTICS FOR THE PORT OF
GULFPORT
Port of Gulfport Export Commodity Data (Top 20 Dollar Value Exports)
Rank Code Description ANNUAL 2009 ANNUAL 2010 ANNUAL 2011
TOTAL ALL COMMODITIES 830,541,833.00 1,109,913,044.00 1,210,648,714.00
1 48 Paper & Paperboard & Articles (Inc Papr Pulp Artl) 184,204,538.00 208,553,161.00 261,105,120.00
2 52 Cotton, Including Yarn And Woven Fabric Thereof 144,054,269.00 220,337,731.00 207,525,995.00
3 60 Knitted Or Crocheted Fabrics 42,434,389.00 83,643,906.00 124,513,302.00
4 2 Meat And Edible Meat Offal 57,947,986.00 84,114,832.00 83,704,027.00
5 55 Manmade Staple Fibers, Incl Yarns & Woven Fabrics 45,610,977.00 90,150,386.00 90,516,031.00
6 54 Manmade Filaments, Including Yarns & Woven Fabrics 37,506,734.00 49,694,149.00 63,284,764.00
7 27 Mineral Fuel, Oil Etc.; Bitumin Subst; Mineral Wax 41,839,768.00 44,153,365.00 58,036,686.00
8 61 Apparel Articles And Accessories, Knit Or Crochet 38,381,569.00 39,744,451.00 48,271,671.00
9 39 Plastics And Articles Thereof 24,430,212.00 47,821,258.00 46,467,339.00
10 89 Ships, Boats And Floating Structures 478,980.00 5,950.00 545,000.00
11 62 Apparel Articles And Accessories, Not Knit Etc. 28,885,670.00 29,708,908.00 26,416,677.00
12 85 Electric Machinery Etc; Sound Equip; Tv Equip; Pts 12,612,311.00 8,029,289.00 24,633,072.00
13 90 Optic, Photo Etc, Medic Or Surgical Instrments Etc 21,516,002.00 29,316,744.00 24,183,767.00
14 84 Industrial Machinery, Including Computers 27,703,613.00 24,248,106.00 30,343,021.00
15 16 Edible Preparations Of Meat, Fish, Crustaceans Etc 9,548,388.00 11,718,235.00 13,095,822.00
16 58 Spec Wov Fabrics; Tufted Fab; Lace; Tapestries Etc 5,846,198.00 7,345,731.00 7,895,167.00
17 21 Miscellaneous Edible Preparations 6,117,264.00 8,450,686.00 9,188,227.00
18 87 Vehicles, Except Railway Or Tramway, And Parts Etc 11,073,581.00 11,454,709.00 7,445,411.00
19 38 Miscellaneous Chemical Products 4,664,203.00 7,072,555.00 9,748,054.00
20 18 Cocoa And Cocoa Preparations 2,269,449.00 3,296,275.00 5,356,171.00
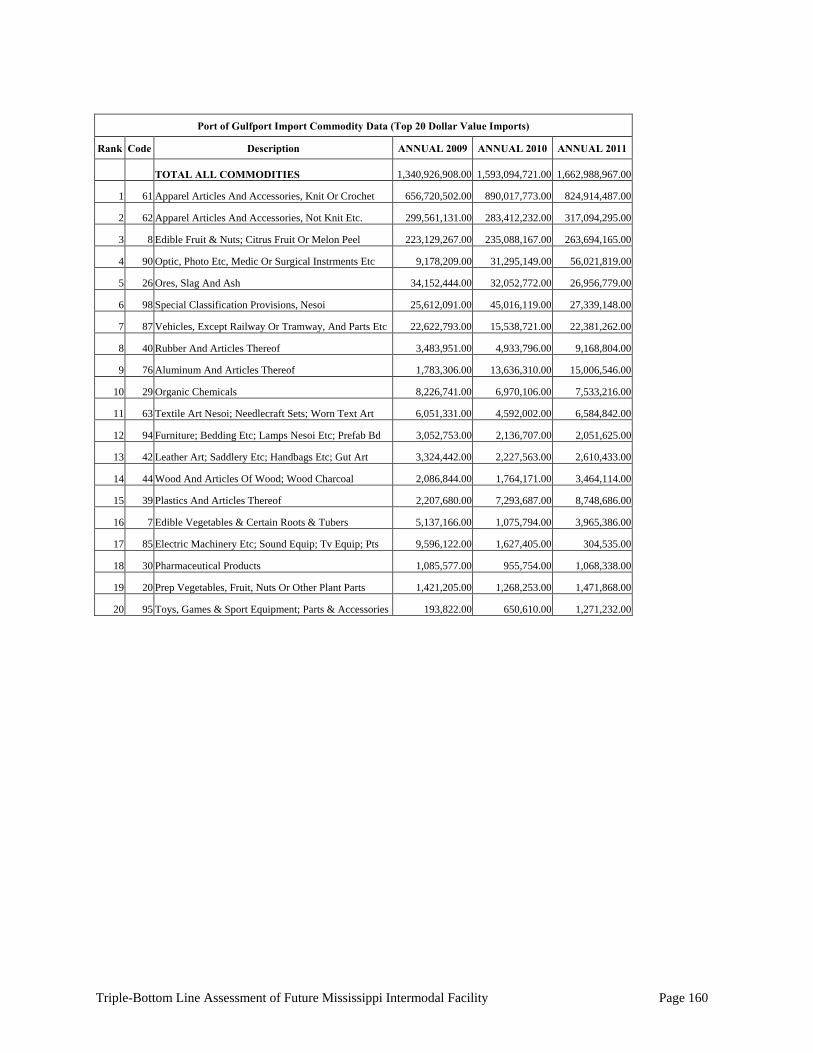
Triple-Bottom Line Assessment of Future Mississippi Intermodal Facility Page 160
Port of Gulfport Import Commodity Data (Top 20 Dollar Value Imports)
Rank Code Description ANNUAL 2009 ANNUAL 2010 ANNUAL 2011
TOTAL ALL COMMODITIES 1,340,926,908.00 1,593,094,721.00 1,662,988,967.00
1 61 Apparel Articles And Accessories, Knit Or Crochet 656,720,502.00 890,017,773.00 824,914,487.00
2 62 Apparel Articles And Accessories, Not Knit Etc. 299,561,131.00 283,412,232.00 317,094,295.00
3 8 Edible Fruit & Nuts; Citrus Fruit Or Melon Peel 223,129,267.00 235,088,167.00 263,694,165.00
4 90 Optic, Photo Etc, Medic Or Surgical Instrments Etc 9,178,209.00 31,295,149.00 56,021,819.00
5 26 Ores, Slag And Ash 34,152,444.00 32,052,772.00 26,956,779.00
6 98 Special Classification Provisions, Nesoi 25,612,091.00 45,016,119.00 27,339,148.00
7 87 Vehicles, Except Railway Or Tramway, And Parts Etc 22,622,793.00 15,538,721.00 22,381,262.00
8 40 Rubber And Articles Thereof 3,483,951.00 4,933,796.00 9,168,804.00
9 76 Aluminum And Articles Thereof 1,783,306.00 13,636,310.00 15,006,546.00
10 29 Organic Chemicals 8,226,741.00 6,970,106.00 7,533,216.00
11 63 Textile Art Nesoi; Needlecraft Sets; Worn Text Art 6,051,331.00 4,592,002.00 6,584,842.00
12 94 Furniture; Bedding Etc; Lamps Nesoi Etc; Prefab Bd 3,052,753.00 2,136,707.00 2,051,625.00
13 42 Leather Art; Saddlery Etc; Handbags Etc; Gut Art 3,324,442.00 2,227,563.00 2,610,433.00
14 44 Wood And Articles Of Wood; Wood Charcoal 2,086,844.00 1,764,171.00 3,464,114.00
15 39 Plastics And Articles Thereof 2,207,680.00 7,293,687.00 8,748,686.00
16 7 Edible Vegetables & Certain Roots & Tubers 5,137,166.00 1,075,794.00 3,965,386.00
17 85 Electric Machinery Etc; Sound Equip; Tv Equip; Pts 9,596,122.00 1,627,405.00 304,535.00
18 30 Pharmaceutical Products 1,085,577.00 955,754.00 1,068,338.00
19 20 Prep Vegetables, Fruit, Nuts Or Other Plant Parts 1,421,205.00 1,268,253.00 1,471,868.00
20 95 Toys, Games & Sport Equipment; Parts & Accessories 193,822.00 650,610.00 1,271,232.00

Triple-Bottom Line Assessment of Future Mississippi Intermodal Facility Page 161
Recommended