1
INVESTORPRESENTATION
AUGUST 2017
Cautionary Statements
This presentation includes "forward-looking statements" within the meaning of Section 27A of the Securities Act of 1933, as amended, and Section 21E of the
Securities Exchange Act of 1934, as amended. These statements express a belief, expectation or intention and are generally accompanied by words that convey
projected future events or outcomes. The forward-looking statements include statements about the company’s corporate strategies, future operations, development
plans and appraisal programs, our drilling inventory and locations, estimated production, rates of return, reserves, projected capital expenditures, projected operating
and other costs, operational optimization initiatives, anticipated efficiency improvements and cost reductions, liquidity and capital structure. We have based these
forward-looking statements on our current expectations and assumptions and analyses made by us in light of our experience and our perception of historical trends,
current conditions and expected future developments, as well as other factors we believe are appropriate under the circumstances. However, whether actual results
and developments will conform with our expectations and predictions is subject to a number of risks and uncertainties, including the volatility of oil and natural gas
prices, our success in discovering, estimating, and developing oil and natural gas reserves, the availability and terms of capital, our timely execution of hedge
transactions, credit conditions of global capital markets, changes in economic conditions, regulatory changes and other factors, many of which are beyond our
control.
We refer you to the discussion of risk factors in Part I, Item 1A – “Risk Factors” of our Annual Report on Form 10-K for the year ended December 31, 2016 and in
comparable “Risk Factors” sections of our Quarterly Reports on Form 10-Q filed after such Form 10-K. All of the forward-looking statements made in this
presentation are qualified by these cautionary statements. The actual results or developments anticipated may not be realized or, even if substantially realized, they
may not have the expected consequences to or effects on our company or our business or operations. Such statements are not guarantees of future performance
and actual results or developments may differ materially from those projected in the forward-looking statements. We undertake no obligation to update or revise any
forward-looking statements.
The SEC permits oil and natural gas companies, in their filings with the SEC, to disclose only proved, probable and possible reserves, as each is defined by the SEC.
At times we use the terms "EUR" (estimated ultimate recovery) and “recoverable reserves” that the SEC’s guidelines prohibit us from including in filings with the SEC.
These estimates are by their nature more speculative than estimates of proved, probable or possible reserves and, accordingly, are subject to substantially greater
risk of being actually realized by the company. For a discussion of the company’s proved reserves, as calculated under curren t SEC rules, we refer you to the
company’s amended Annual Report on Form 10-K referenced above, which is available on our website at www.sandridgeenergy.com and at the SEC’s website at
www.sec.gov.
1
Forward Looking Statement
www.sandridgeenergy.com
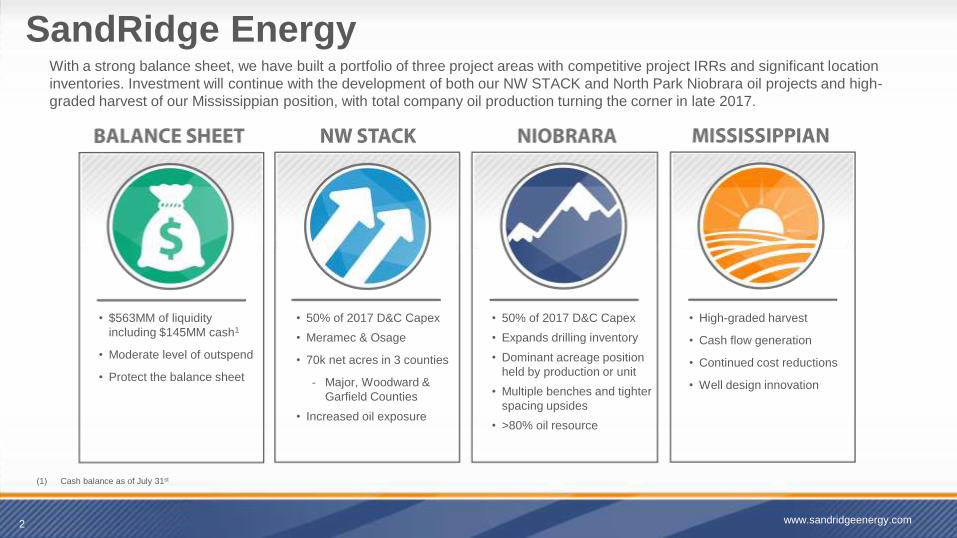
SandRidge EnergyWith a strong balance sheet, we have built a portfolio of three project areas with competitive project IRRs and significant location
inventories. Investment will continue with the development of both our NW STACK and North Park Niobrara oil projects and high-
graded harvest of our Mississippian position, with total company oil production turning the corner in late 2017.
2 www.sandridgeenergy.com
• $563MM of liquidity
including $145MM cash1
• Moderate level of outspend
• Protect the balance sheet
• High-graded harvest
• Cash flow generation
• Continued cost reductions
• Well design innovation
• 50% of 2017 D&C Capex
• Expands drilling inventory
• Dominant acreage position
held by production or unit
• Multiple benches and tighter
spacing upsides
• >80% oil resource
• 50% of 2017 D&C Capex
• Meramec & Osage
• 70k net acres in 3 counties
‐ Major, Woodward &
Garfield Counties
• Increased oil exposure
(1) Cash balance as of July 31st

Valuation as of August 2, 2017
Market Capitalization $690 Million
Debt 38
Less: Available Cash (145)
Enterprise Value $583 Million
Liquidity
Cash $145 Million
Undrawn Revolver2 418
Cash + RBL $563 Million
Production & Reserves
Q2’17 Production 42.1 MBoepd (27% oil)
YE’16 Proved
Reserves3
180 MMBoe (31% oil)
$763MM Strip PV-10
3
SandRidge Energy Overview
Unlevered with strong liquidity and portfolio of oil-weighted opportunities
(1) Held by production (HBP) or held by unit
(2) $425 million borrowing base less $7 million in letters of credit
(3) Reserves as of 12.31.16 and PV-10 using actual realized pricing and 3.20.17 Strip pricing (~$50/$3.00). The PV-10 of strip-based
proved reserves is a non-GAAP financial measure. A reconciliation of the standardized measure (GAAP) to the PV-10 of our proved reserves is located on the final slide.
390k79% HBP
125k57% HBP1
70k30% HBP
Large Acreage Positions in Three Assets
Held by Production or Federal Unit
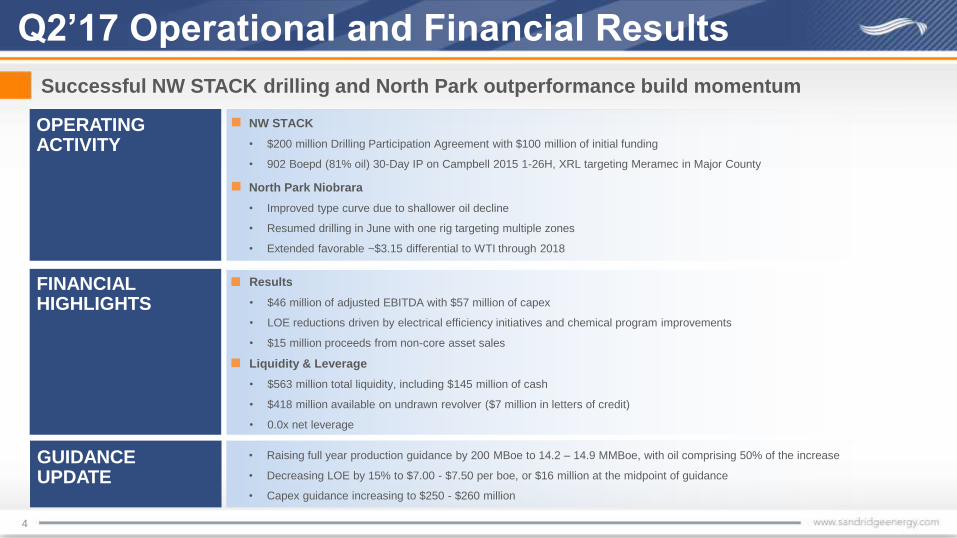
NW STACK
• $200 million Drilling Participation Agreement with $100 million of initial funding
• 902 Boepd (81% oil) 30-Day IP on Campbell 2015 1-26H, XRL targeting Meramec in Major County
4
Q2’17 Operational and Financial Results
GUIDANCE UPDATE
Successful NW STACK drilling and North Park outperformance build momentum
FINANCIAL HIGHLIGHTS
North Park Niobrara
• Improved type curve due to shallower oil decline
• Resumed drilling in June with one rig targeting multiple zones
• Extended favorable ~$3.15 differential to WTI through 2018
Results
• $46 million of adjusted EBITDA with $57 million of capex
• LOE reductions driven by electrical efficiency initiatives and chemical program improvements
• $15 million proceeds from non-core asset sales
Liquidity & Leverage
• $563 million total liquidity, including $145 million of cash
• $418 million available on undrawn revolver ($7 million in letters of credit)
• 0.0x net leverage
• Raising full year production guidance by 200 MBoe to 14.2 – 14.9 MMBoe, with oil comprising 50% of the increase
• Decreasing LOE by 15% to $7.00 - $7.50 per boe, or $16 million at the midpoint of guidance
• Capex guidance increasing to $250 - $260 million
OPERATING ACTIVITY
5
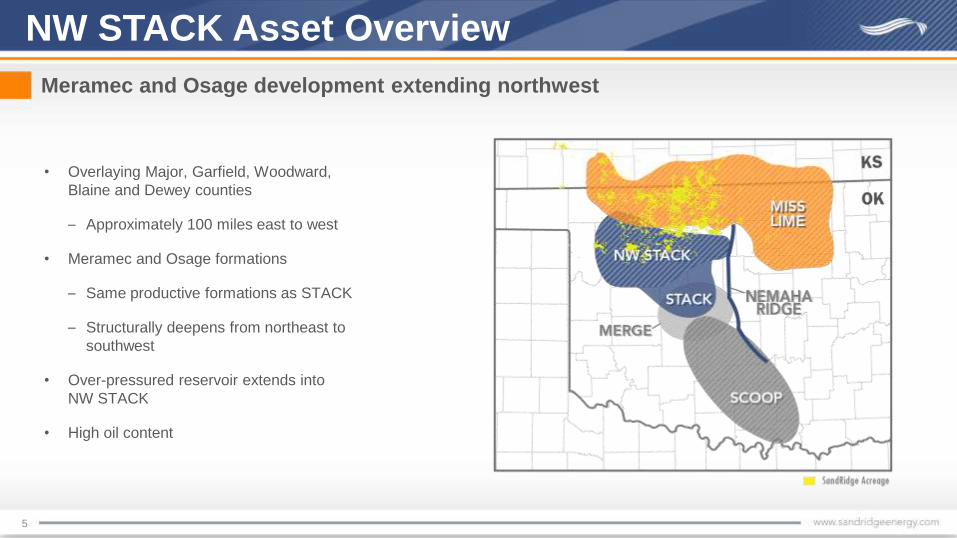
NW STACK Asset Overview
Meramec and Osage development extending northwest
• Overlaying Major, Garfield, Woodward,
Blaine and Dewey counties
– Approximately 100 miles east to west
• Meramec and Osage formations
– Same productive formations as STACK
– Structurally deepens from northeast to
southwest
• Over-pressured reservoir extends into
NW STACK
• High oil content
6
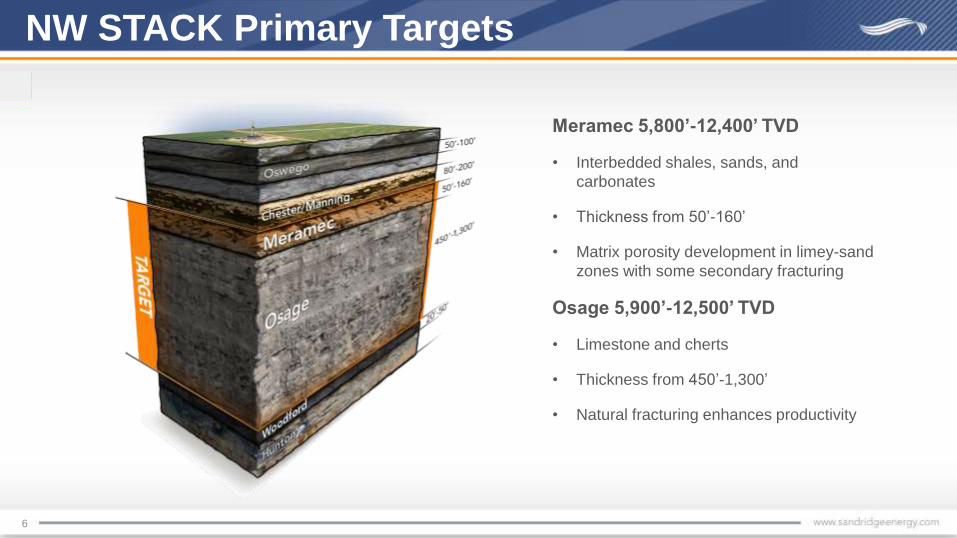
NW STACK Primary Targets
Meramec 5,800’-12,400’ TVD
• Interbedded shales, sands, and
carbonates
• Thickness from 50’-160’
• Matrix porosity development in limey-sand
zones with some secondary fracturing
Osage 5,900’-12,500’ TVD
• Limestone and cherts
• Thickness from 450’-1,300’
• Natural fracturing enhances productivity
7
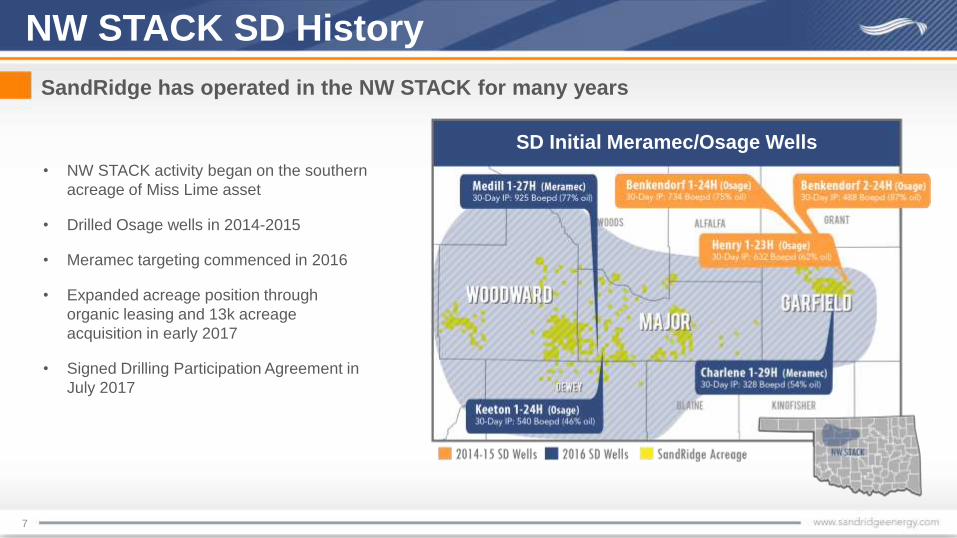
NW STACK SD History
SandRidge has operated in the NW STACK for many years
• NW STACK activity began on the southern
acreage of Miss Lime asset
• Drilled Osage wells in 2014-2015
• Meramec targeting commenced in 2016
• Expanded acreage position through
organic leasing and 13k acreage
acquisition in early 2017
• Signed Drilling Participation Agreement in
July 2017
SD Initial Meramec/Osage Wells
8
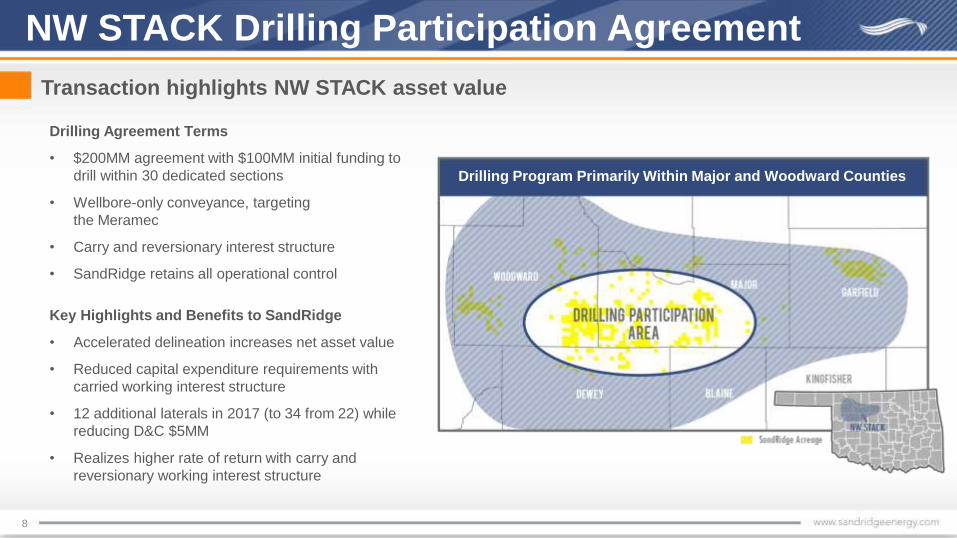
NW STACK Drilling Participation Agreement
Transaction highlights NW STACK asset value
Drilling Agreement Terms
• $200MM agreement with $100MM initial funding to
drill within 30 dedicated sections
• Wellbore-only conveyance, targeting
the Meramec
• Carry and reversionary interest structure
• SandRidge retains all operational control
Key Highlights and Benefits to SandRidge
• Accelerated delineation increases net asset value
• Reduced capital expenditure requirements with
carried working interest structure
• 12 additional laterals in 2017 (to 34 from 22) while
reducing D&C $5MM
• Realizes higher rate of return with carry and
reversionary working interest structure
Drilling Program Primarily Within Major and Woodward Counties
9
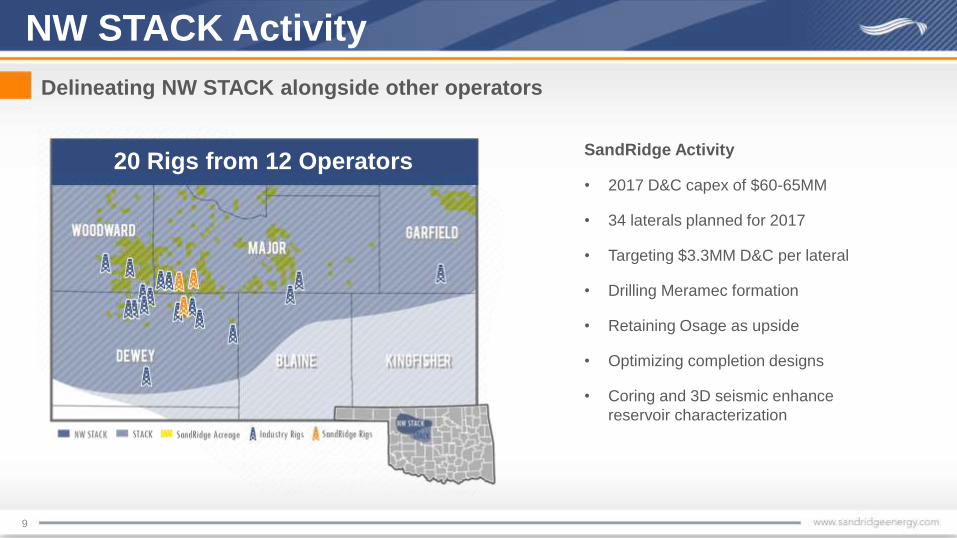
NW STACK Activity
Delineating NW STACK alongside other operators
20 Rigs from 12 OperatorsSandRidge Activity
• 2017 D&C capex of $60-65MM
• 34 laterals planned for 2017
• Targeting $3.3MM D&C per lateral
• Drilling Meramec formation
• Retaining Osage as upside
• Optimizing completion designs
• Coring and 3D seismic enhance
reservoir characterization
10
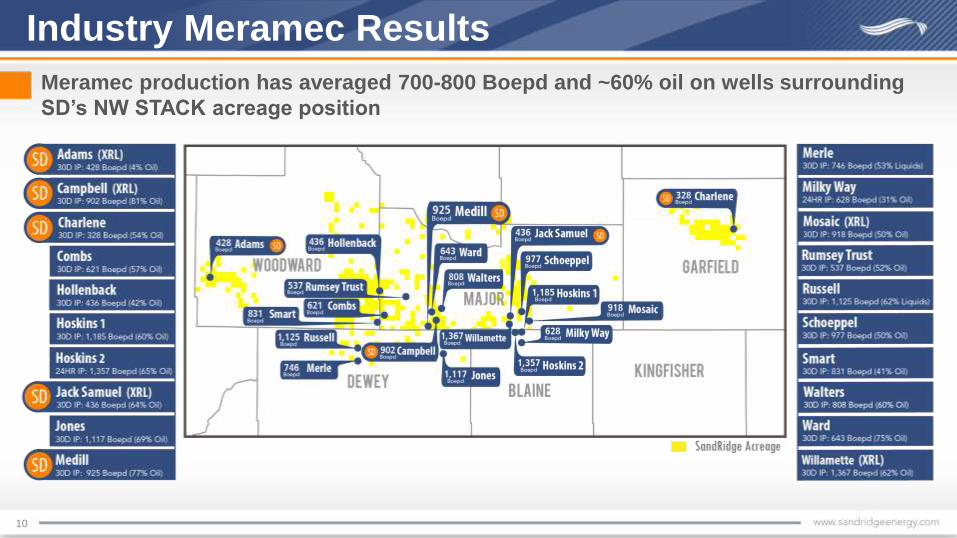
Industry Meramec Results
Meramec production has averaged 700-800 Boepd and ~60% oil on wells surrounding
SD’s NW STACK acreage position
11
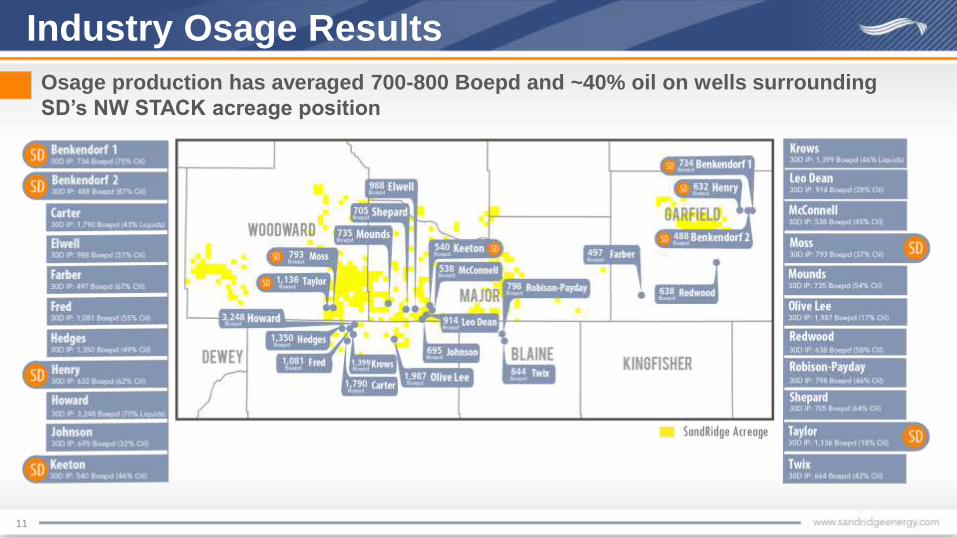
Industry Osage Results
Osage production has averaged 700-800 Boepd and ~40% oil on wells surrounding
SD’s NW STACK acreage position
12
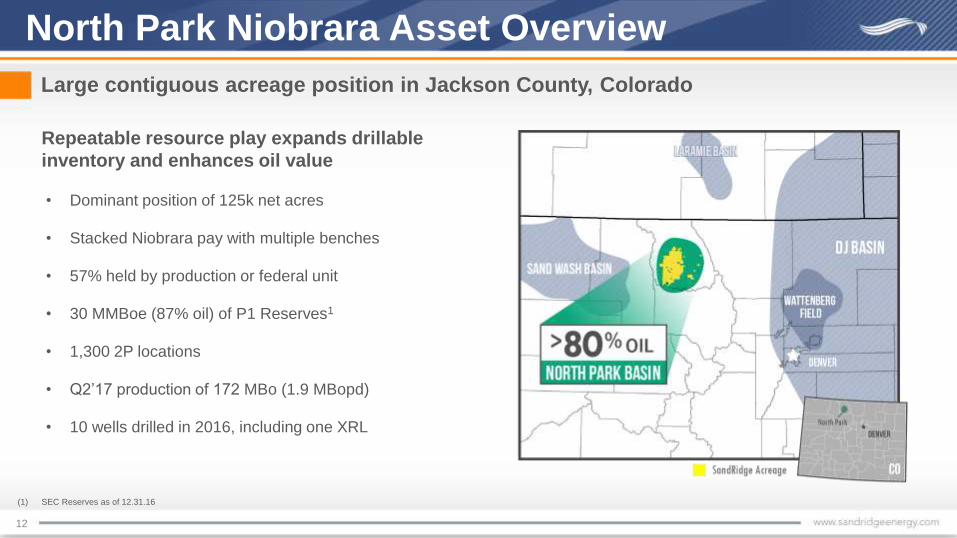
• Dominant position of 125k net acres
• Stacked Niobrara pay with multiple benches
• 57% held by production or federal unit
• 30 MMBoe (87% oil) of P1 Reserves1
• 1,300 2P locations
• Q2’17 production of 172 MBo (1.9 MBopd)
• 10 wells drilled in 2016, including one XRL
North Park Niobrara Asset Overview
Large contiguous acreage position in Jackson County, Colorado
Repeatable resource play expands drillable
inventory and enhances oil value
(1) SEC Reserves as of 12.31.16
13
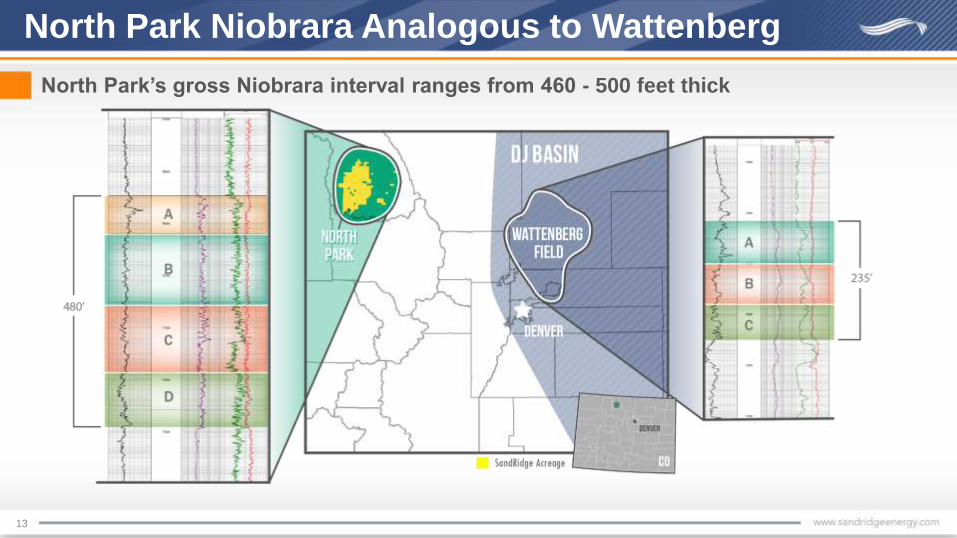
North Park Niobrara Analogous to Wattenberg
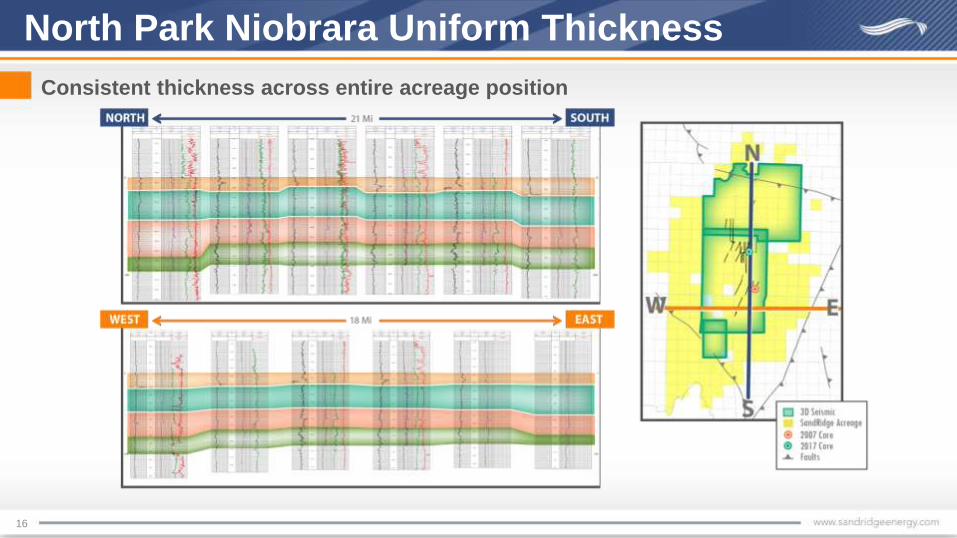
North Park’s gross Niobrara interval ranges from 460 - 500 feet thick
14
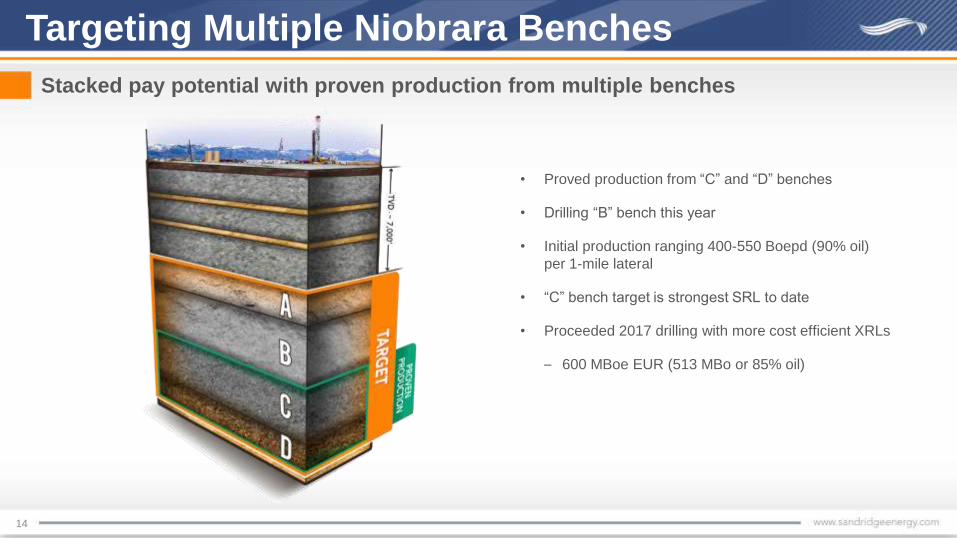
Targeting Multiple Niobrara Benches
Stacked pay potential with proven production from multiple benches
• Proved production from “C” and “D” benches
• Drilling “B” bench this year
• Initial production ranging 400-550 Boepd (90% oil)
per 1-mile lateral
• “C” bench target is strongest SRL to date
• Proceeded 2017 drilling with more cost efficient XRLs
– 600 MBoe EUR (513 MBo or 85% oil)
RABBITEARS UNIT
24k Net Acres
SURPRISE UNIT22k Net Acres
PETERSON RIDGE UNIT
22k Net Acres
15
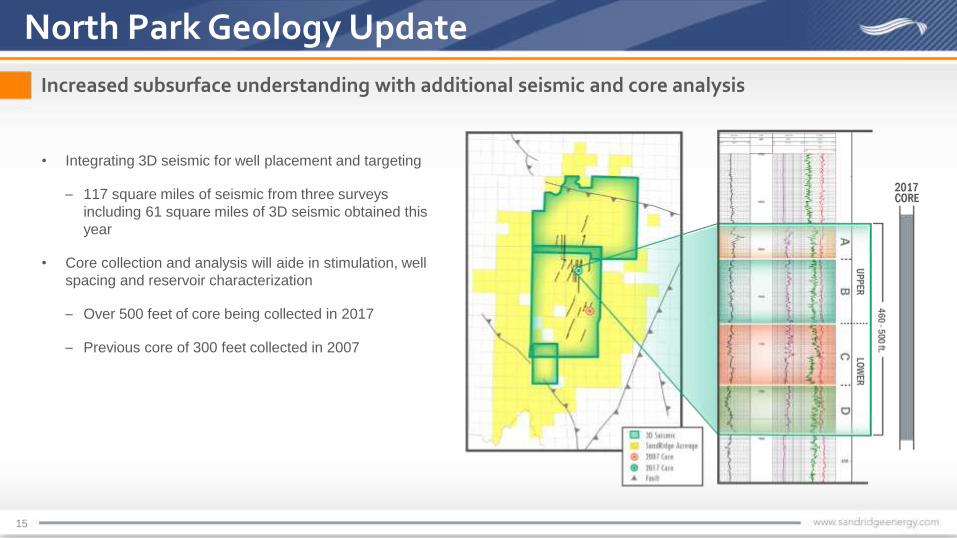
North Park Geology Update
Increased subsurface understanding with additional seismic and core analysis
• Integrating 3D seismic for well placement and targeting
– 117 square miles of seismic from three surveys
including 61 square miles of 3D seismic obtained this
year
• Core collection and analysis will aide in stimulation, well
spacing and reservoir characterization
– Over 500 feet of core being collected in 2017
– Previous core of 300 feet collected in 2007
16
North Park Niobrara Uniform Thickness
Consistent thickness across entire acreage position
17
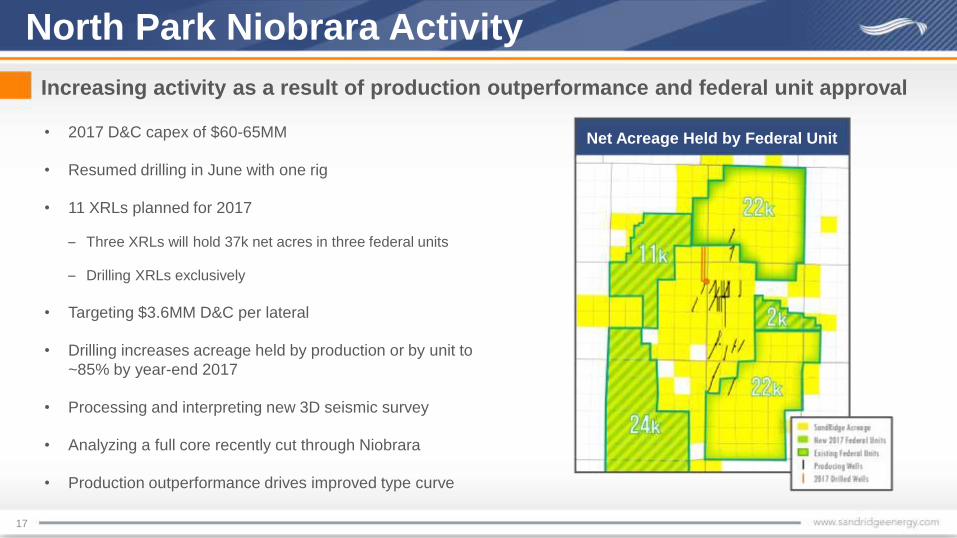
• 2017 D&C capex of $60-65MM
• Resumed drilling in June with one rig
• 11 XRLs planned for 2017
– Three XRLs will hold 37k net acres in three federal units
– Drilling XRLs exclusively
• Targeting $3.6MM D&C per lateral
• Drilling increases acreage held by production or by unit to
~85% by year-end 2017
• Processing and interpreting new 3D seismic survey
• Analyzing a full core recently cut through Niobrara
• Production outperformance drives improved type curve
North Park Niobrara Activity
Increasing activity as a result of production outperformance and federal unit approval
Net Acreage Held by Federal Unit
18
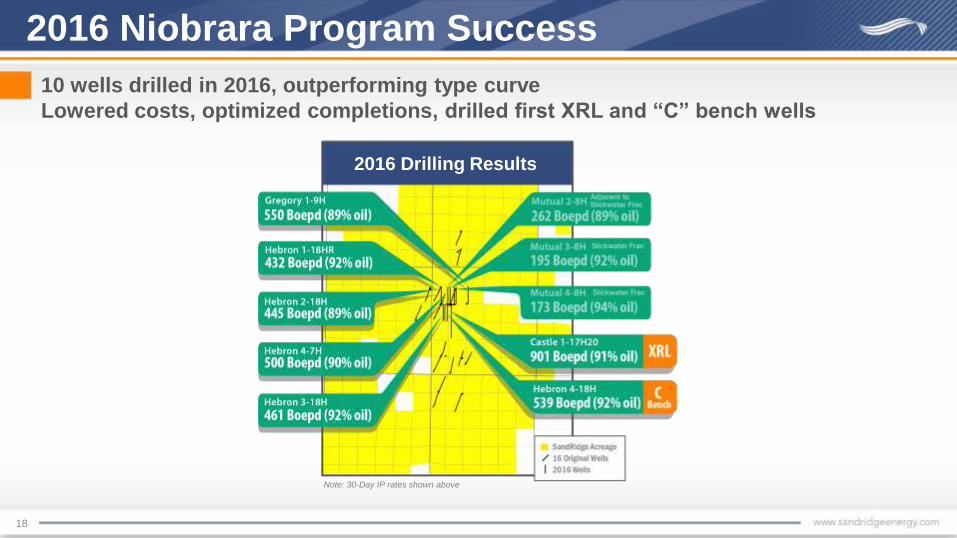
2016 Niobrara Program Success
2016 Drilling Results
Note: 30-Day IP rates shown above
10 wells drilled in 2016, outperforming type curve
Lowered costs, optimized completions, drilled first XRL and “C” bench wells
19
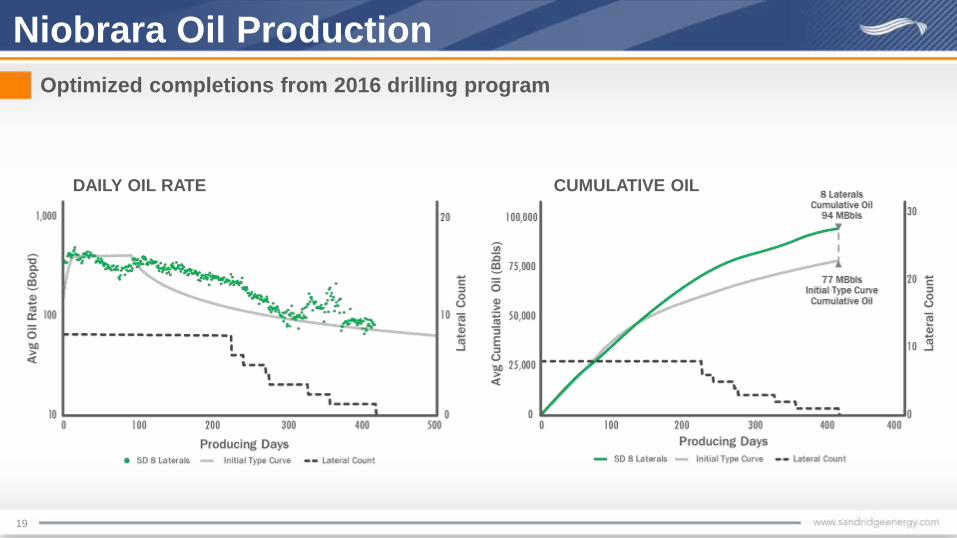
Optimized completions from 2016 drilling program
Niobrara Oil Production
DAILY OIL RATE CUMULATIVE OIL

20
Niobrara Type Curve Update
Jet Pump Installed
Shallower decline vs initial estimates drive value improvement
Type Curve Cumulative Oil Production (MBo)
Initial Current
90 Days 66 66
180 Days 103 113
365 Days 139 164
50 Years 513 513
XRL TYPE CURVE UPLIFT IMPROVED ECONOMICS
• PV-10 increase of ~$1MM
• IRR uplift

21
North Park Basin Oil and Gas Takeaway
Favorable oil marketing and gas processing will create additional revenue
Current Marketing and Takeaway Short term in-field gas processing options include:
Mechanical Refrigeration Units (MRU) for NGL
extraction – first contract executed
Gas-to-liquids (GTL)
Gas injection – currently drilling test well
Potential to generate additional revenue, reduce
emissions and augment longer term pipeline plans
Oil trucked to market (up to 40 MBopd)
Extended favorable ~$3.15 differential to WTI through
2018
Gas combusted under appropriate permits
Building out field gathering infrastructure; centralized tank
battery used for processing, storage and export
APPENDIX
22
23
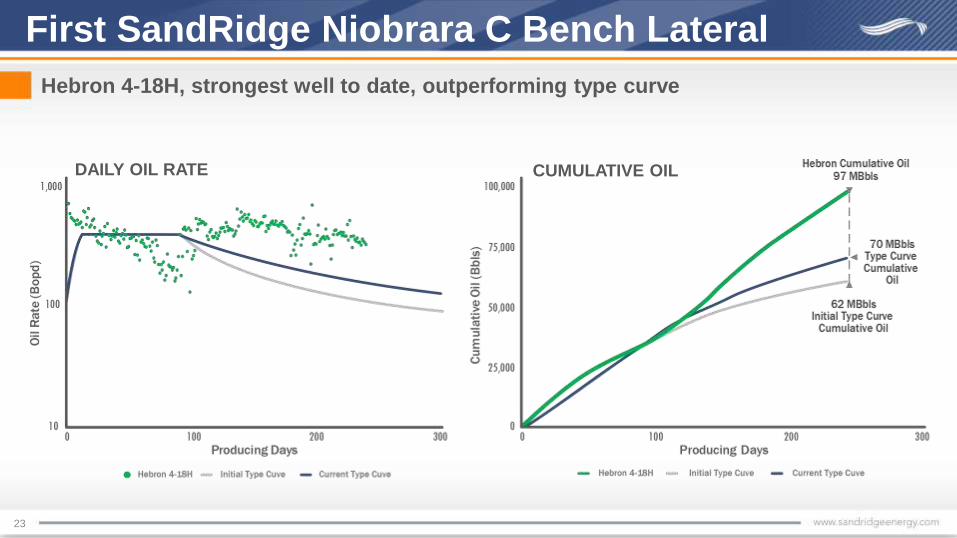
First SandRidge Niobrara C Bench Lateral
Hebron 4-18H, strongest well to date, outperforming type curve
DAILY OIL RATE CUMULATIVE OIL
Jet Pump Installed
24
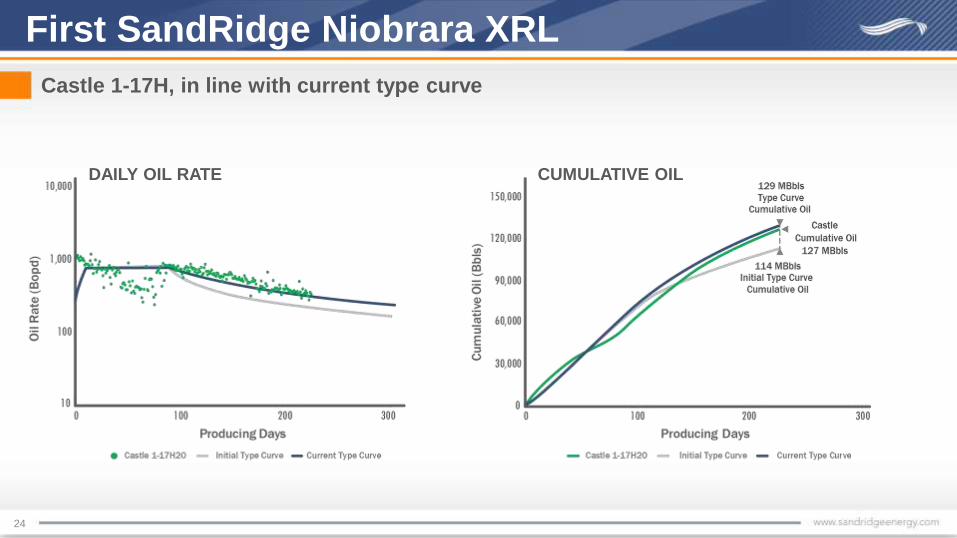
First SandRidge Niobrara XRL
Castle 1-17H, in line with current type curve
DAILY OIL RATE CUMULATIVE OILJet Pump Installed
Jet Pump Installed

25
2017 Project EURs, Economics & Inventory
EURs &
ECONOMICS
MERAMEC NIOBRARA MISSISSIPPIAN
XRL* SINGLE XRL FSD* SINGLE
EUR, MBoe
% Oil
800 – 1,000
40%+
500 – 600
40%+
600
80%+
1,350
20%
550
20%
D&C per lateral ($MM) $3.3 $4.3 $3.6 $2.0 $2.4
IRR(a)
16 - 28% 14 - 23% 32% 49% 14%
PV-10(a) ($MM) $1.2 - $3.3 $0.5 - $1.5 $3.3 $4.4 $0.3
YE’16 INVENTORY NW STACK NIOBRARA MISSISSIPPIAN
PUDs (laterals) 6 106 51(b)
Probables (laterals) Under evaluation
(4-8 per section)~1,180 ~180(b)
Net acres 70k 125k 390k
HBP or HBU 30% 57% 79%
a) @ July 28th Strip avg pricing (~$50 /~$3.00) at 100% Working Interest
b) Excluding ~70 Proven + Probable Chester locations
Diverse and material location inventory in three areas
*FSD = “Full Section Development”, equivalent to 3 laterals
*XRL = “Extended Reach Lateral”, 2-mile lateral

Year End 2016 Reserves and PV-10
26
PROVED RESERVES OIL
MBBLS
NGLS
MBBLS
GAS
MMCFEQUIVALENT
MBOE1
PV-102
$MM
Proved Reserves as of Dec 31, 2015@ SEC Pricing ($50.28 / $2.59)
77,911 61,075 1,113,840 324,626 $1,315_
Production (5,529) (4,357) (56,895) (19,369)
Sale of assets (387) 0 (145,267) (24,598)
Change in accounting for trusts (6,971) (3,695) (50,508) (19,084)
Performance revisions (14,796) (21,717) (349,244) (94,720)
Pricing revisions (1,510) 876 (68,865) (12,112)
Extensions & additions 4,166 1,425 21,720 9,210
Proved Reserves as of Dec 31, 2016
@ SEC Pricing ($42.75 / $2.48)52,884 33,607 464,782 163,955 $438_
Proved Reserves as of Dec 31, 2016
@ NYMEX Pricing (~$50 / ~$3)55,686 37,687 521,173 180,235 $763_
(1) Equivalent Boe are calculated using an energy equivalent ratio of six Mcf of natural gas to one Bbl of crude oil. Using an energy-equivalent ratio does not factor in price differences and energy-equivalent prices may differ
significantly among produced products.
(2) PV-10 is a non-GAAP financial measure and generally differs from Standardized Measure, the most directly comparable GAAP financial measure, because it does not include the effect of income taxes on discounted future net
cash flows.
www.sandridgeenergy.com
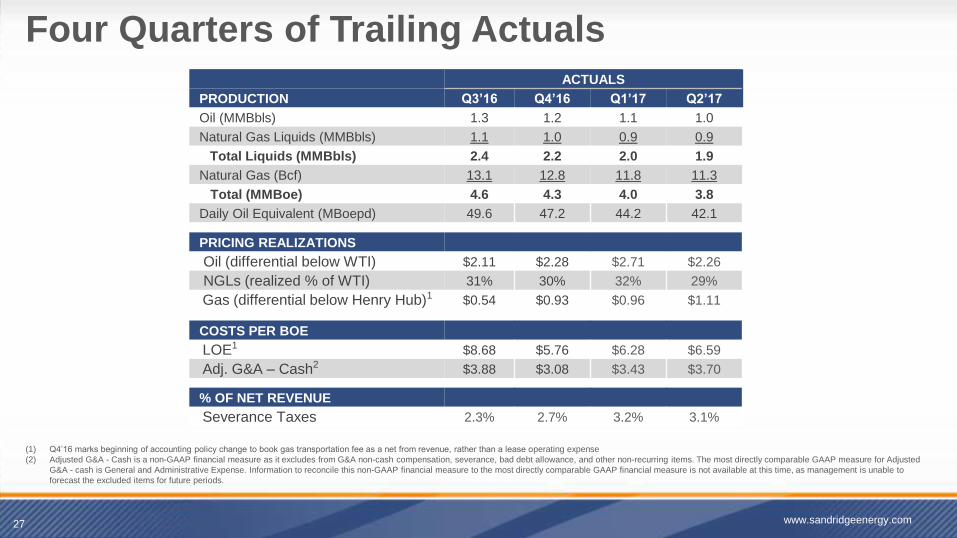
Four Quarters of Trailing Actuals
27
ACTUALS
PRODUCTION Q3’16 Q4’16 Q1’17 Q2’17
Oil (MMBbls) 1.3 1.2 1.1 1.0
Natural Gas Liquids (MMBbls) 1.1 1.0 0.9 0.9
Total Liquids (MMBbls) 2.4 2.2 2.0 1.9
Natural Gas (Bcf) 13.1 12.8 11.8 11.3
Total (MMBoe) 4.6 4.3 4.0 3.8
Daily Oil Equivalent (MBoepd) 49.6 47.2 44.2 42.1
PRICING REALIZATIONS
Oil (differential below WTI) $2.11 $2.28 $2.71 $2.26
NGLs (realized % of WTI) 31% 30% 32% 29%
Gas (differential below Henry Hub)1 $0.54 $0.93 $0.96 $1.11
COSTS PER BOE
LOE1 $8.68 $5.76 $6.28 $6.59
Adj. G&A – Cash2 $3.88 $3.08 $3.43 $3.70
% OF NET REVENUE
Severance Taxes 2.3% 2.7% 3.2% 3.1%
(1) Q4’16 marks beginning of accounting policy change to book gas transportation fee as a net from revenue, rather than a lease operating expense
(2) Adjusted G&A - Cash is a non-GAAP financial measure as it excludes from G&A non-cash compensation, severance, bad debt allowance, and other non-recurring items. The most directly comparable GAAP measure for Adjusted
G&A - cash is General and Administrative Expense. Information to reconcile this non-GAAP financial measure to the most directly comparable GAAP financial measure is not available at this time, as management is unable to
forecast the excluded items for future periods.
www.sandridgeenergy.com
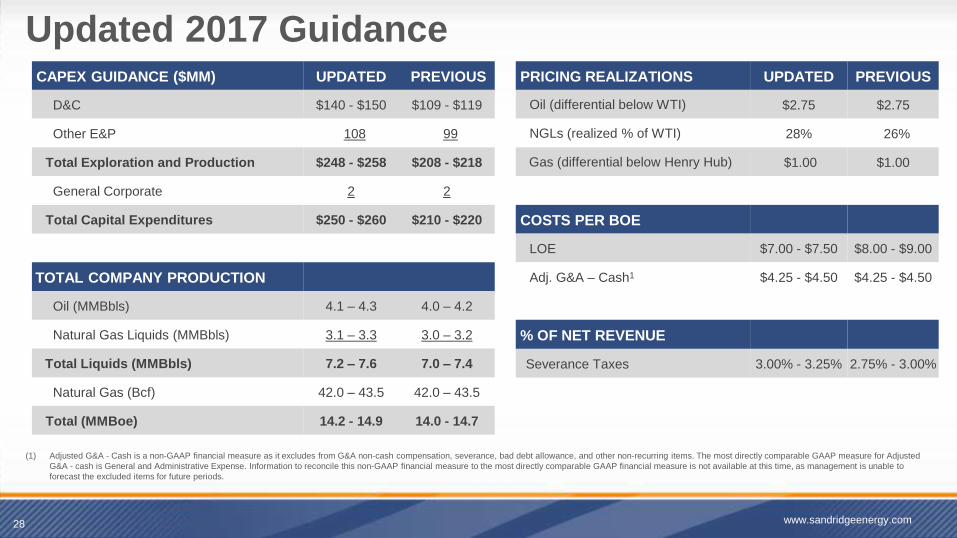
Updated 2017 Guidance
28
CAPEX GUIDANCE ($MM) UPDATED PREVIOUS
D&C $140 - $150 $109 - $119
Other E&P 108 99
Total Exploration and Production $248 - $258 $208 - $218
General Corporate 2 2
Total Capital Expenditures $250 - $260 $210 - $220
TOTAL COMPANY PRODUCTION
Oil (MMBbls) 4.1 – 4.3 4.0 – 4.2
Natural Gas Liquids (MMBbls) 3.1 – 3.3 3.0 – 3.2
Total Liquids (MMBbls) 7.2 – 7.6 7.0 – 7.4
Natural Gas (Bcf) 42.0 – 43.5 42.0 – 43.5
Total (MMBoe) 14.2 - 14.9 14.0 - 14.7
www.sandridgeenergy.com
PRICING REALIZATIONS UPDATED PREVIOUS
Oil (differential below WTI) $2.75 $2.75
NGLs (realized % of WTI) 28% 26%
Gas (differential below Henry Hub) $1.00 $1.00
COSTS PER BOE
LOE $7.00 - $7.50 $8.00 - $9.00
Adj. G&A – Cash1 $4.25 - $4.50 $4.25 - $4.50
% OF NET REVENUE
Severance Taxes 3.00% - 3.25% 2.75% - 3.00%
(1) Adjusted G&A - Cash is a non-GAAP financial measure as it excludes from G&A non-cash compensation, severance, bad debt allowance, and other non-recurring items. The most directly comparable GAAP measure for Adjusted
G&A - cash is General and Administrative Expense. Information to reconcile this non-GAAP financial measure to the most directly comparable GAAP financial measure is not available at this time, as management is unable to
forecast the excluded items for future periods.
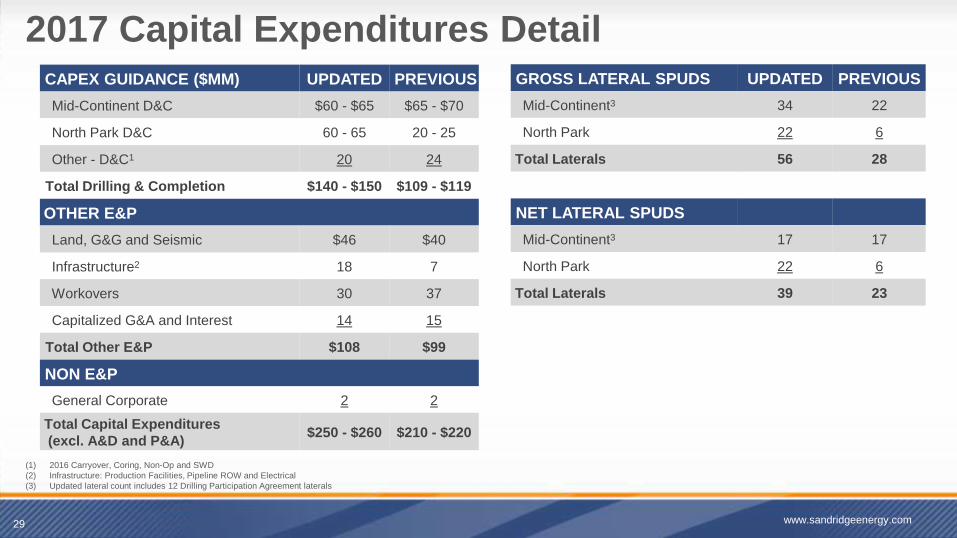
2017 Capital Expenditures Detail
29
CAPEX GUIDANCE ($MM) UPDATED PREVIOUS
Mid-Continent D&C $60 - $65 $65 - $70
North Park D&C 60 - 65 20 - 25
Other - D&C1 20 24
Total Drilling & Completion $140 - $150 $109 - $119
OTHER E&P
Land, G&G and Seismic $46 $40
Infrastructure2 18 7
Workovers 30 37
Capitalized G&A and Interest 14 15
Total Other E&P $108 $99
NON E&P
General Corporate 2 2
Total Capital Expenditures
(excl. A&D and P&A)$250 - $260 $210 - $220
GROSS LATERAL SPUDS UPDATED PREVIOUS
Mid-Continent3 34 22
North Park 22 6
Total Laterals 56 28
NET LATERAL SPUDS
Mid-Continent3 17 17
North Park 22 6
Total Laterals 39 23
(1) 2016 Carryover, Coring, Non-Op and SWD
(2) Infrastructure: Production Facilities, Pipeline ROW and Electrical
(3) Updated lateral count includes 12 Drilling Participation Agreement laterals
www.sandridgeenergy.com
30
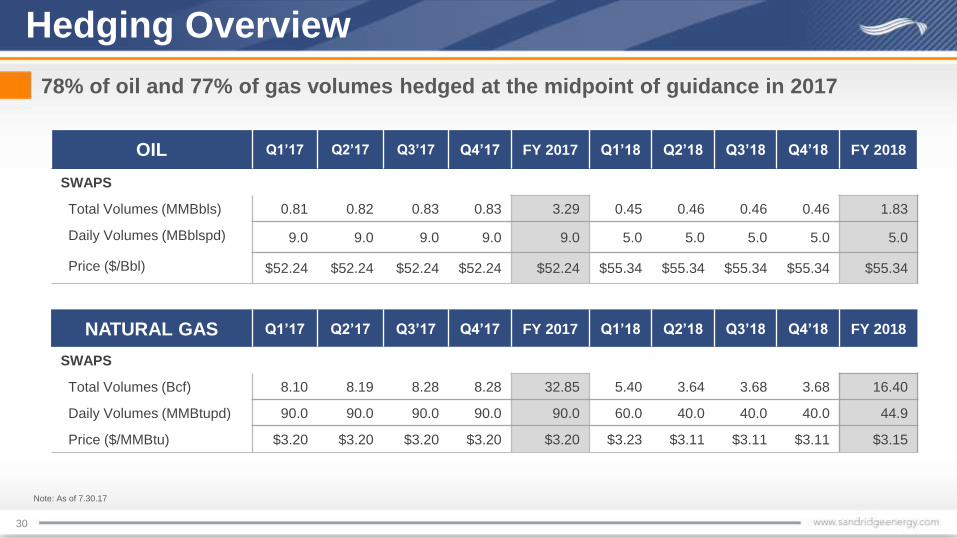
Hedging Overview
78% of oil and 77% of gas volumes hedged at the midpoint of guidance in 2017
OIL Q1’17 Q2’17 Q3’17 Q4’17 FY 2017 Q1’18 Q2’18 Q3’18 Q4’18 FY 2018
SWAPS
Total Volumes (MMBbls) 0.81 0.82 0.83 0.83 3.29 0.45 0.46 0.46 0.46 1.83
Daily Volumes (MBblspd) 9.0 9.0 9.0 9.0 9.0 5.0 5.0 5.0 5.0 5.0
Price ($/Bbl) $52.24 $52.24 $52.24 $52.24 $52.24 $55.34 $55.34 $55.34 $55.34 $55.34
NATURAL GAS Q1’17 Q2’17 Q3’17 Q4’17 FY 2017 Q1’18 Q2’18 Q3’18 Q4’18 FY 2018
SWAPS
Total Volumes (Bcf) 8.10 8.19 8.28 8.28 32.85 5.40 3.64 3.68 3.68 16.40
Daily Volumes (MMBtupd) 90.0 90.0 90.0 90.0 90.0 60.0 40.0 40.0 40.0 44.9
Price ($/MMBtu) $3.20 $3.20 $3.20 $3.20 $3.20 $3.23 $3.11 $3.11 $3.11 $3.15
Note: As of 7.30.17
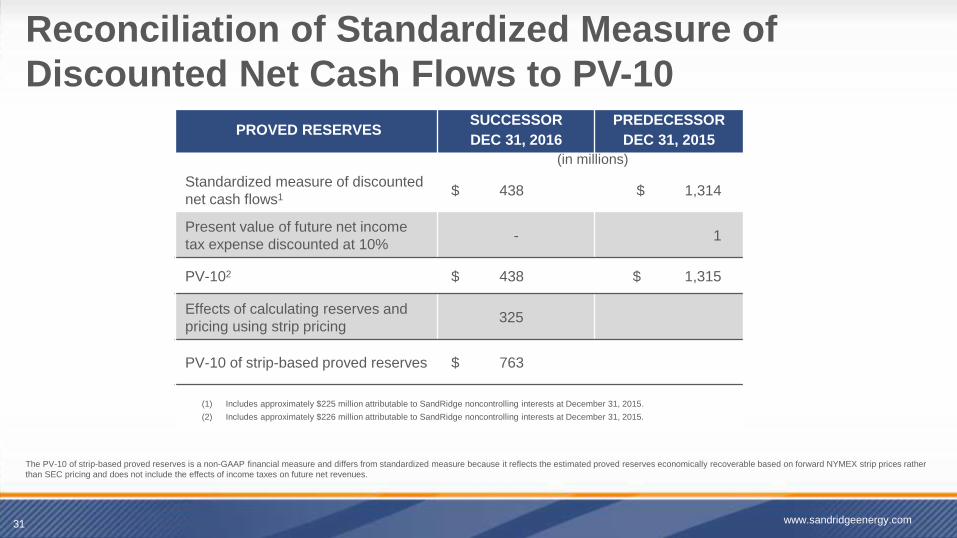
Reconciliation of Standardized Measure of
Discounted Net Cash Flows to PV-10
31 www.sandridgeenergy.com
The PV-10 of strip-based proved reserves is a non-GAAP financial measure and differs from standardized measure because it reflects the estimated proved reserves economically recoverable based on forward NYMEX strip prices rather
than SEC pricing and does not include the effects of income taxes on future net revenues.
PROVED RESERVES SUCCESSOR
DEC 31, 2016
PREDECESSOR
DEC 31, 2015
((in millions)
Standardized measure of discounted
net cash flows1$ 438 $ 1,314
Present value of future net income
tax expense discounted at 10%- 1
PV-102 $ 438 $ 1,315
Effects of calculating reserves and
pricing using strip pricing325
PV-10 of strip-based proved reserves $ 763
(1) Includes approximately $225 million attributable to SandRidge noncontrolling interests at December 31, 2015.
(2) Includes approximately $226 million attributable to SandRidge noncontrolling interests at December 31, 2015.
Recommended