FEASIBILITY STUDY FOR THE
BOARDMAN RIVER
GRAND TRAVERSE COUNTY, MICHIGAN
APPENDIX C - COST ENGINEERING GREAT LAKES FISHERIES AND ECOSYSTEM RESTORATION PROGRAM
US Army Engineer District, Detroit
477 Michigan Avenue
Detroit, MI 48226-2523
US Army Corps
of Engineers
Detroit District

Boardman River Feasibility Study Cost Engineering Appendix
i
TABLE OF CONTENTS
1 Purpose and Scope of Cost Engineering Appendix .......................................................... C-1
2 Project Overview ................................................................................................................. C-1
3 Identification of Measures .................................................................................................. C-1 3.1 Full / Partial Dam Removal Measures ............................................................. C-2
3.1.1 Union Street Dam ................................................................................ C-2 3.1.2 Sabin Dam ............................................................................................ C-2 3.1.3 Boardman Dam .................................................................................... C-3
3.2 Dam Modification for Fish Passage ................................................................. C-3 3.2.1 Union Street Dam ................................................................................ C-4 3.2.2 Sabin and Boardman Dams .................................................................. C-4
4 Development of Alternatives .............................................................................................. C-7 4.1 Alternative 1 – Without Project ....................................................................... C-8
4.2 Alternative 2 – Modify Union Street Dam ....................................................... C-8 4.3 Alternative 3 – Modify Union Street Dam, Remove Sabin Dam.................... C-8
4.4 Alternative 4 – Modify Union Street Dam, Remove Boardman Dam ............. C-9
4.5 Alternative 5 - Modify Union Street Dam, Remove Sabin
Boardman Dams………………………………………………C-9 4.6 Alternative 6 – Remove Sabin Dam ............................................................... C-10 4.7 Alternative 7 – Remove Boardman Dam ....................................................... C-10
4.8 Alternative 8 – Remove Sabin and Boardman Dams ..................................... C-10
5 Plan Selection .................................................................................................................... C-11
6 Cost Estimating Methodology .......................................................................................... C-12
7 Selected Alternative .......................................................................................................... C-12 7.1 Price Level...................................................................................................... C-12 7.2 Quantities ....................................................................................................... C-12
7.3 Markups .......................................................................................................... C-12 7.4 PED and Construction Management .............................................................. C-13
8 Schedule ............................................................................................................................. C-13
9 Cost and Schedule Risk Analysis ..................................................................................... C-14
10 Total Project Cost Summary ........................................................................................... C-14

Boardman River Feasibility Study Cost Engineering Appendix
ii
List of Tables
Table 3-1: Physical Characteristics of Upstream Fish Passage Structures. ........................ 5
Table 3-2: Upstream Fish Passage Details for Union Street, Sabin and Boardman Dams . 6
Table 4-1: Alternatives Selected for Further Analysis ....................................................... 8
Table 4-2: Alternative Cost Summary .............................................................................. 11
Table 10-1: Estimated Total Project Cost ......................................................................... 14
List of Attachments
Attachment 1 – Dam Removal/Breach Measures
Attachment 2 – Dam Modification for Fish Passage Measures
Attachment 3 – Screening Level Cost Estimates
Attachment 4 – Design and Construction Schedule
Attachment 5 – Abbreviated Risk Analysis
Attachment 6 – Total Project Cost Summary
Attachment 7 – MII Cost Estimate
Attachment 8 – Design Details and Quantity Documentation
Boardman River Feasibility Study Cost Engineering Appendix
C-1
1 PURPOSE AND SCOPE OF COST ENGINEERING APPENDIX
This technical appendix presents an overview of the project, a description of alternatives
considered, the methodology for cost estimating and detailed costs for the selected
alternative, or National Ecosystem Restoration (NER) Plan. Detailed costs prepared using
the Micro-Computer Aided Cost Estimating System (MCACES), Second Generation
(MII) software are presented.
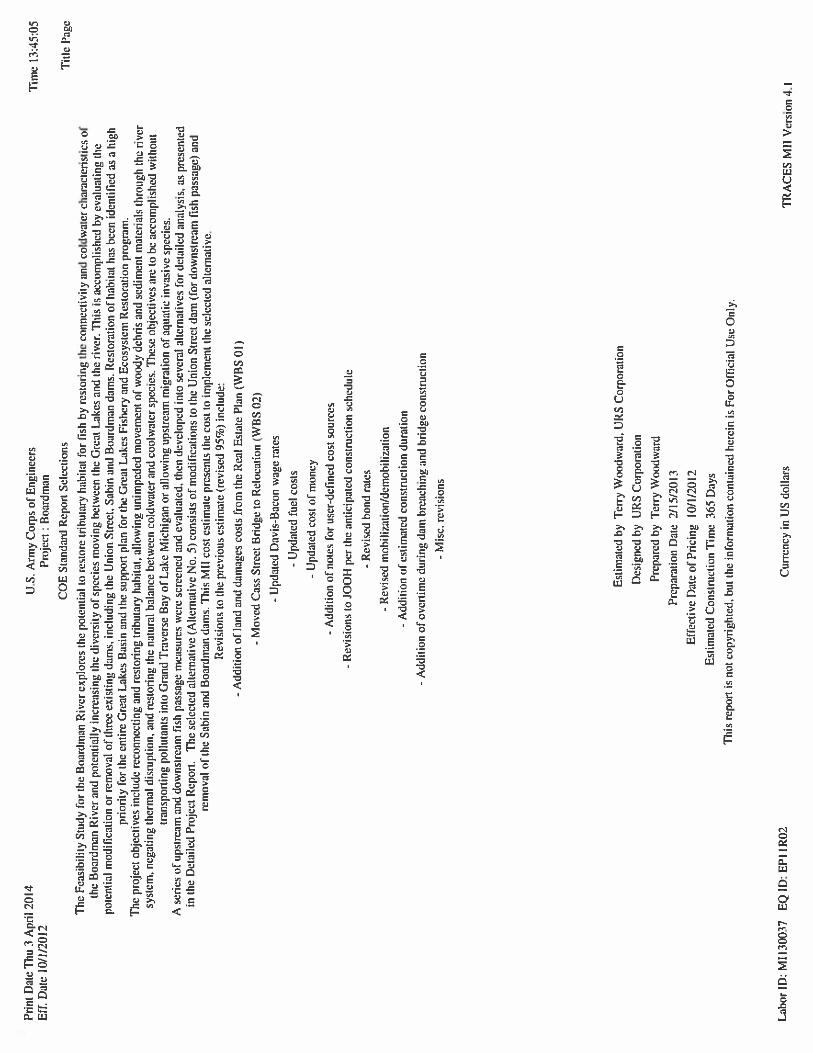
2 PROJECT OVERVIEW
The Feasibility Study for the Boardman River explores the potential to restore tributary
habitat for fish by restoring the connectivity and coldwater characteristics of the
Boardman River and potentially increasing the diversity of species moving between the
Great Lakes and the river. This is accomplished by evaluating the potential modification
or removal of the four dams. Restoration of habitat has been identified as a high priority
for the entire Great Lakes Basin the support plan for the Great Lakes Fishery and
Ecosystem Restoration program.
The project objectives include reconnecting and restoring tributary habitat, allowing
unimpeded movement of woody debris and sediment materials through the river system,
negating thermal disruption, and restoring the natural balance between coldwater and
coolwater species. These objectives shall be accomplished without transporting pollutants
into Grand Traverse Bay of Lake Michigan or allowing upstream migration of aquatic
invasive species.
3 IDENTIFICATION OF MEASURES
Development of alternative plans followed a two-step process. First, measures to address
problems and opportunities were identified at a conceptual level. Then these measures
were combined in alternative plans using a tiered evaluation of conceptual level costs and
environmental benefits. The alternative plans then underwent a detailed evaluation to
identify a preferred alternative.
Based on the results of past studies and plans for the Boardman River dams, a menu of
measures was developed to address the identified problems and opportunities. These
measures include no action, creating systems to allow fish passage over or around the
dams, and the removal of the dams and restoration of the waterway.
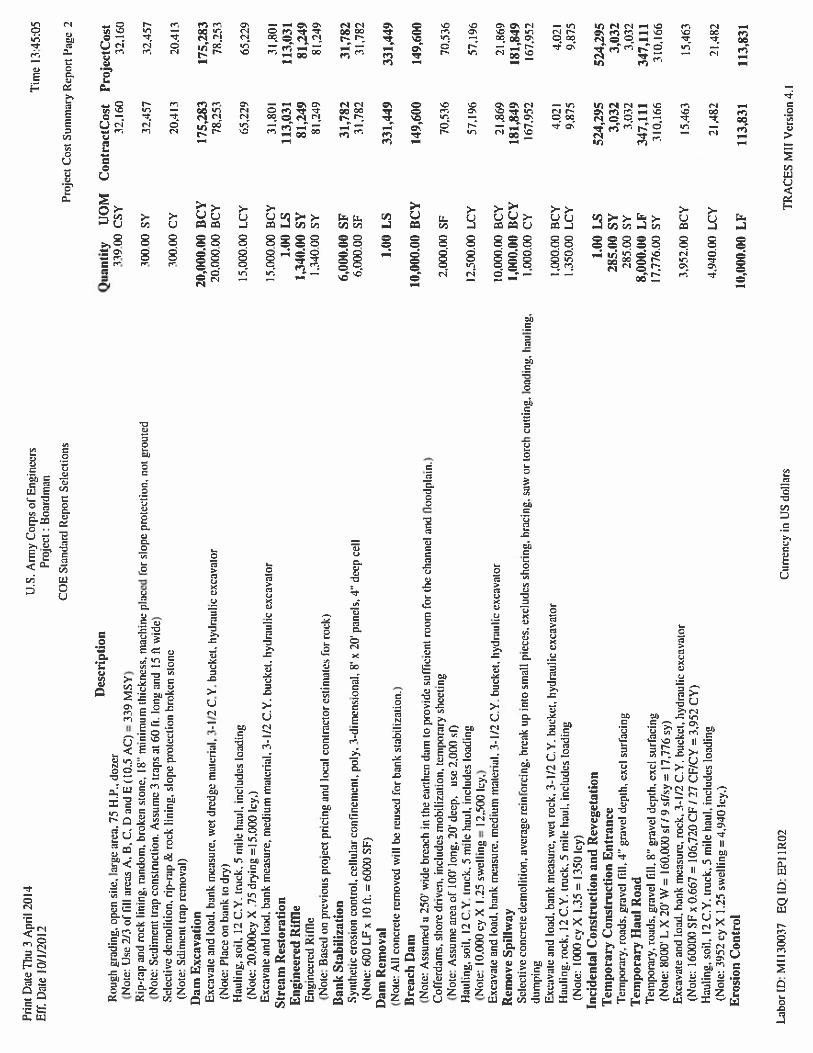
Screening level cost estimates were prepared for the various measures identified in the
Detailed Project Report (DPR). The costs estimates for each of the measures were
developed from unit costs obtained from local contractors, approximated based on
previously bid projects or from published unit costs (Michigan Department of
Transportation [MDOT] Weighted Average Item Price Report). The overall project costs
were then compared to similar projects in the region to verify the validity of the

Boardman River Feasibility Study Cost Engineering Appendix
C-2
estimates. Below is a brief discussion of major cost components of each measure and a
description of the assumptions associated with those costs.
3.1 FULL / PARTIAL DAM REMOVAL MEASURES
Cost estimates are provided in Attachment 1 for the full removal of the Sabin and
Boardman Dams. For each dam an “expected” and “high” cost was developed. The
“expected” cost is the cost that is most likely to occur based on the information currently
available. The “high” cost is an estimate of costs if the worst case assumptions prove to
be correct. The cost differences between the “expected” and “high” costs are entirely a
result of contaminated sediment issues.
3.1.1 Union Street Dam
The Union Street Dam is not proposed for full or partial removal because of concerns
related to upstream migration of aquatic nuisance species.
3.1.2 Sabin Dam
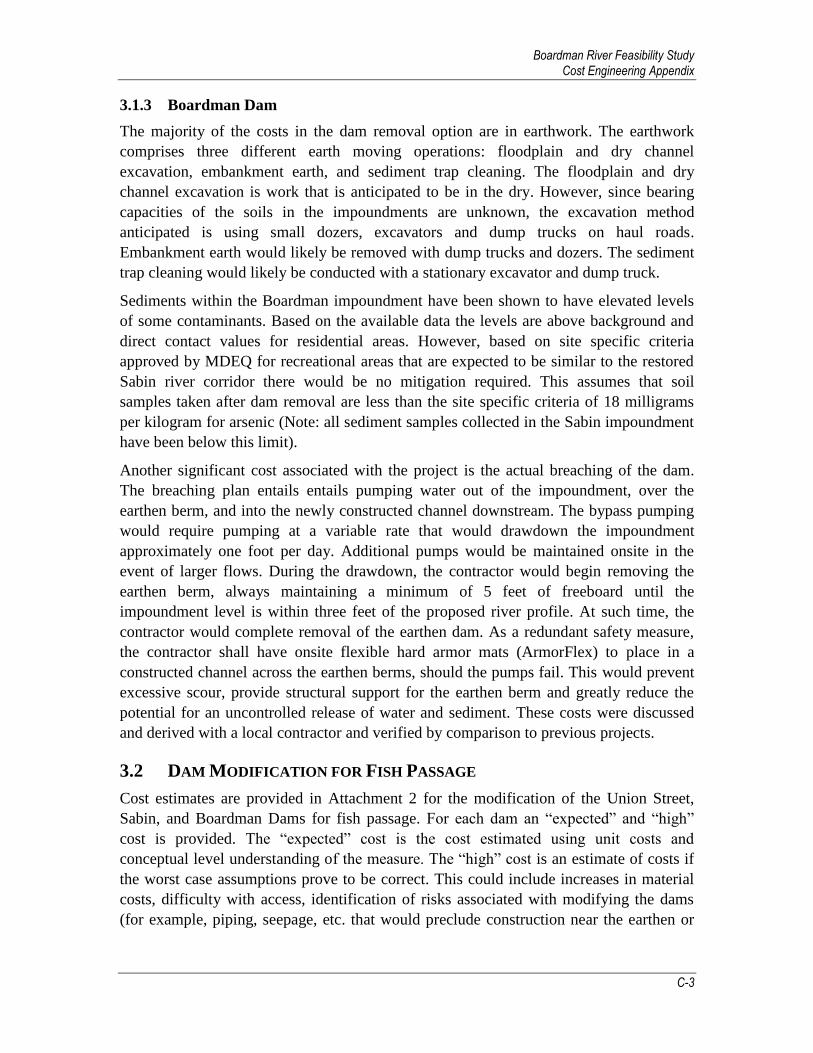
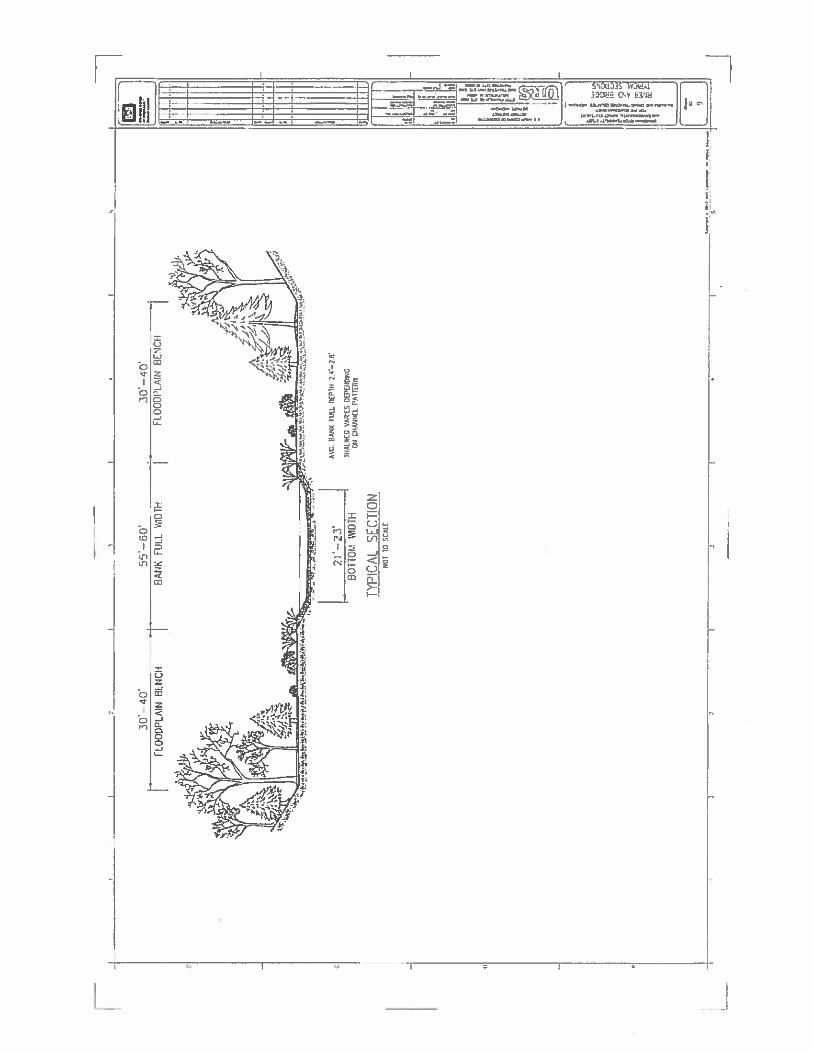
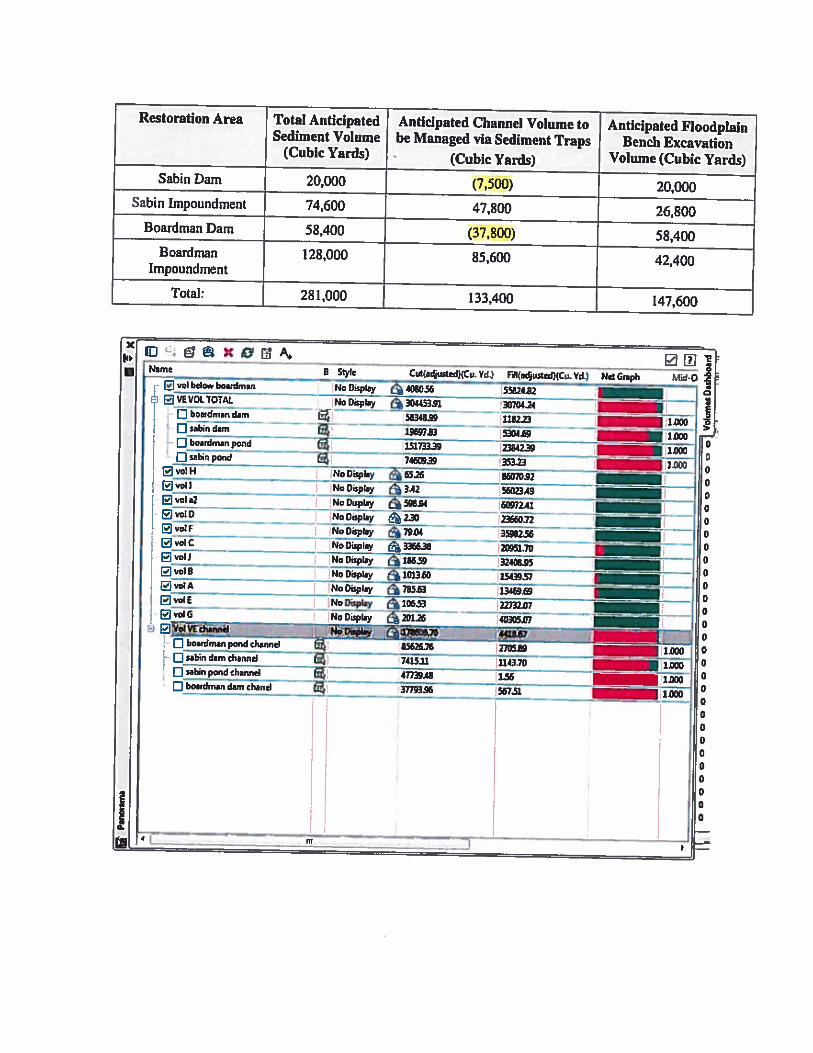
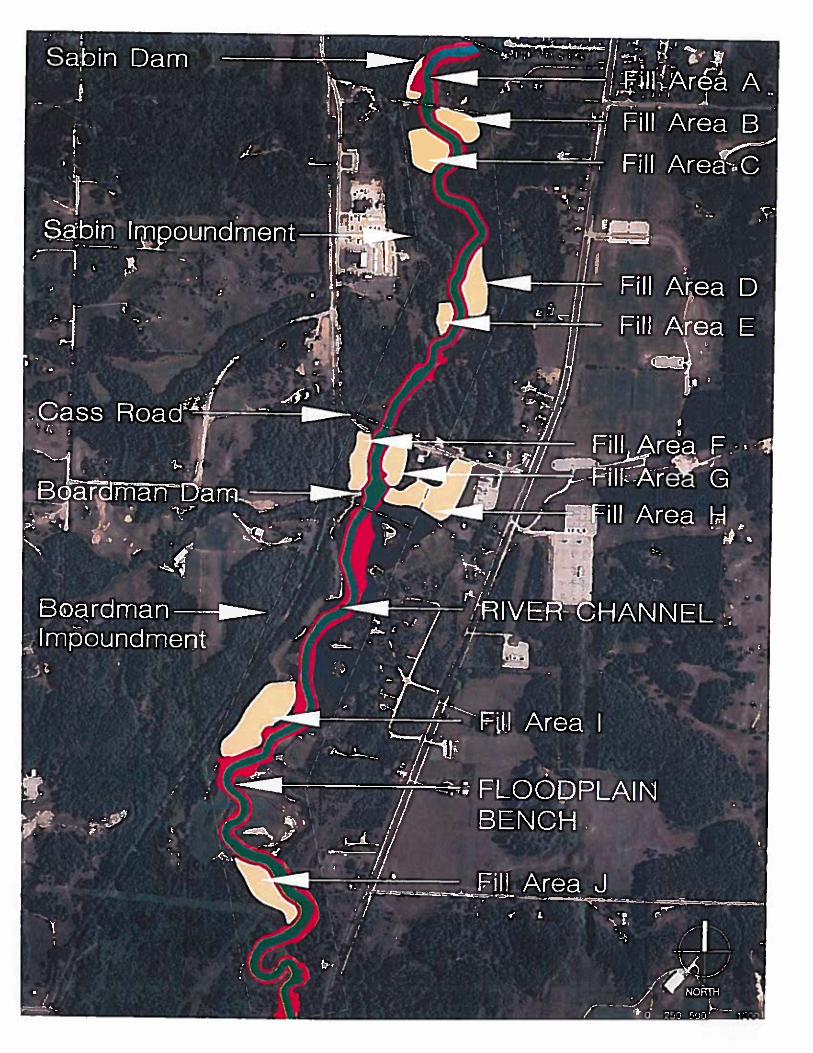
The majority of the costs in the dam removal option are in earthwork. The earthwork is
comprised of three different earth moving operations: floodplain and dry channel
excavation, embankment earth, and sediment trap cleaning. The floodplain and dry
channel excavation is work that is anticipated to be in the dry. However, since bearing
capacities of the soils in the impoundments is unknown, the excavation method
anticipated is using small dozers, excavators and dump trucks on haul roads.
Embankment earth would likely be removed with dump trucks and dozers. The sediment
trap cleaning would likely be conducted with a stationary excavator and dump truck.
Sediments within the Sabin impoundment have been shown to have elevated levels of
some contaminants. Based on the available data the levels are above background and
direct contact values for residential areas. However, based on site specific criteria
approved by the Michigan Department of Environmental Quality (MDEQ) for
recreational areas that are expected to be similar to the restored Sabin river corridor there
would be no mitigation required. This assumes that soil samples taken after dam removal
are less than the site specific criteria of 18 milligrams per kilogram for arsenic (Note: all
sediment samples collected in the Sabin impoundment have been below this limit).
Another significant cost associated with the project is the actual breaching of the dam.
The breaching plan entails notching and removing concrete at the Sabin Dam spillway to
lower the impoundment water surface elevation at a maximum rate of one foot per day.
This would minimize velocities and sediment transport outside of channel areas, and
therefore minimize the need for active sediment management. During the drawdown
process, sediment traps would be maintained immediately above and below the breach, as
well as throughout the impoundment.
Boardman River Feasibility Study Cost Engineering Appendix
C-3
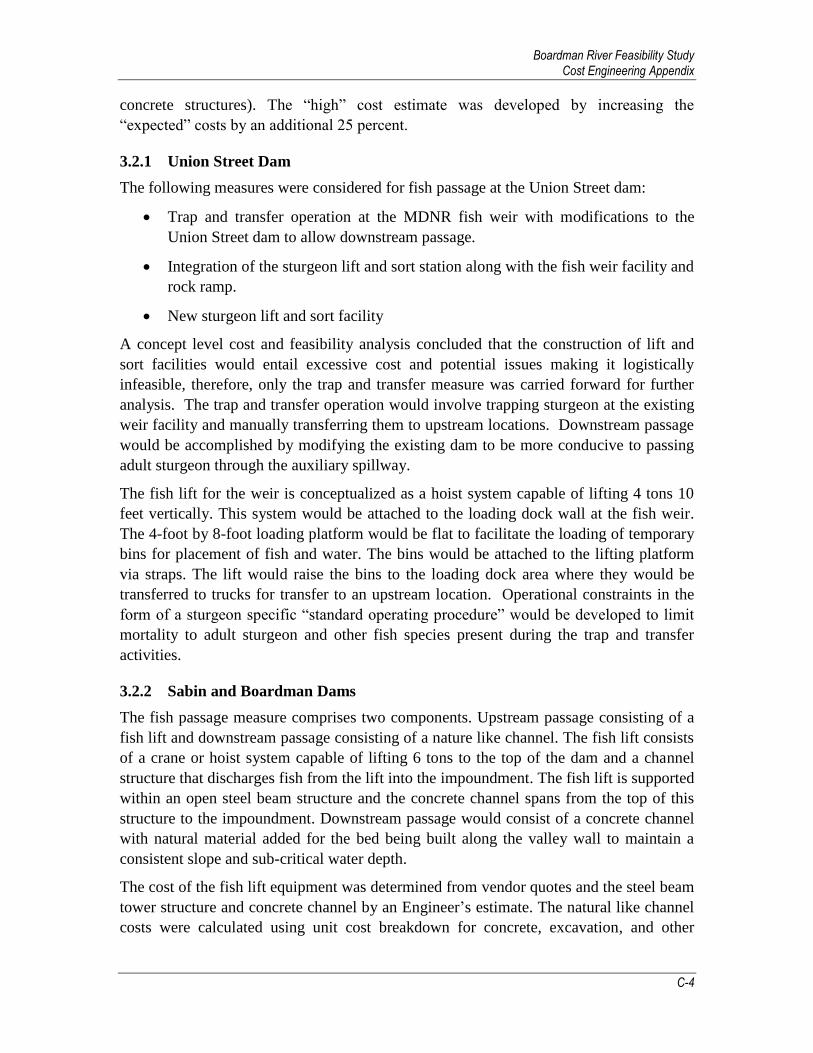
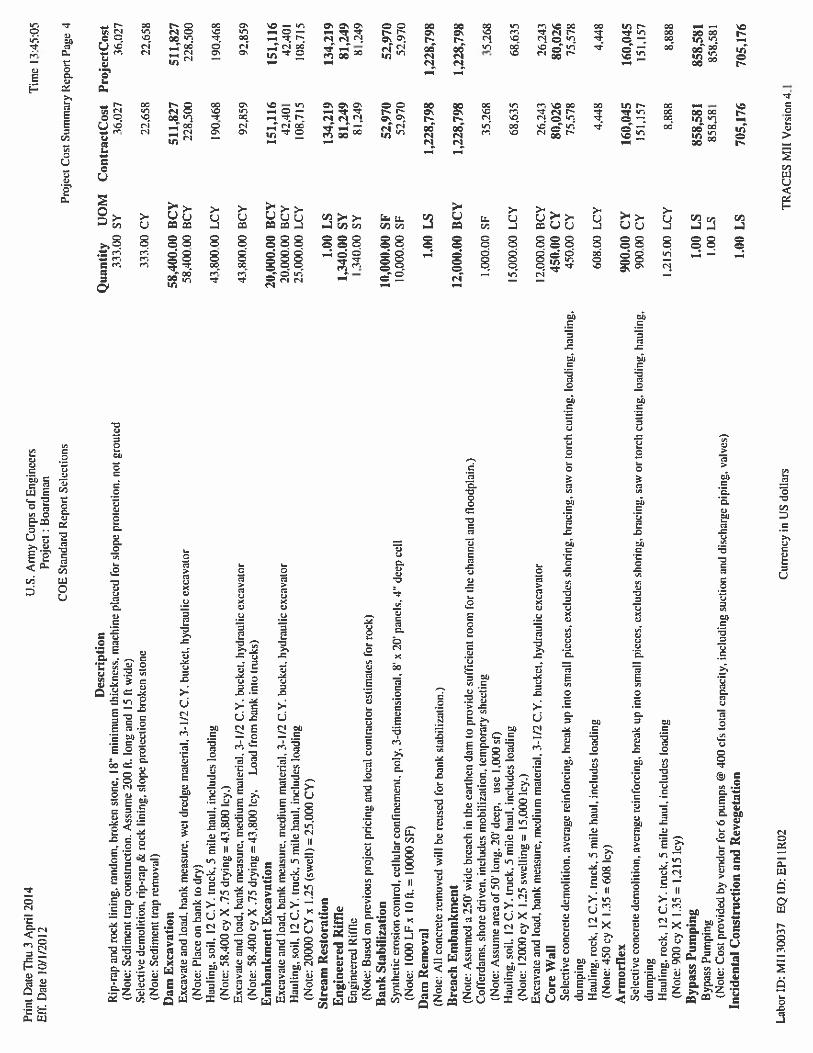
3.1.3 Boardman Dam
The majority of the costs in the dam removal option are in earthwork. The earthwork
comprises three different earth moving operations: floodplain and dry channel
excavation, embankment earth, and sediment trap cleaning. The floodplain and dry
channel excavation is work that is anticipated to be in the dry. However, since bearing
capacities of the soils in the impoundments are unknown, the excavation method
anticipated is using small dozers, excavators and dump trucks on haul roads.
Embankment earth would likely be removed with dump trucks and dozers. The sediment
trap cleaning would likely be conducted with a stationary excavator and dump truck.
Sediments within the Boardman impoundment have been shown to have elevated levels
of some contaminants. Based on the available data the levels are above background and
direct contact values for residential areas. However, based on site specific criteria
approved by MDEQ for recreational areas that are expected to be similar to the restored
Sabin river corridor there would be no mitigation required. This assumes that soil
samples taken after dam removal are less than the site specific criteria of 18 milligrams
per kilogram for arsenic (Note: all sediment samples collected in the Sabin impoundment
have been below this limit).
Another significant cost associated with the project is the actual breaching of the dam.
The breaching plan entails entails pumping water out of the impoundment, over the
earthen berm, and into the newly constructed channel downstream. The bypass pumping
would require pumping at a variable rate that would drawdown the impoundment
approximately one foot per day. Additional pumps would be maintained onsite in the
event of larger flows. During the drawdown, the contractor would begin removing the
earthen berm, always maintaining a minimum of 5 feet of freeboard until the
impoundment level is within three feet of the proposed river profile. At such time, the
contractor would complete removal of the earthen dam. As a redundant safety measure,
the contractor shall have onsite flexible hard armor mats (ArmorFlex) to place in a
constructed channel across the earthen berms, should the pumps fail. This would prevent
excessive scour, provide structural support for the earthen berm and greatly reduce the
potential for an uncontrolled release of water and sediment. These costs were discussed
and derived with a local contractor and verified by comparison to previous projects.
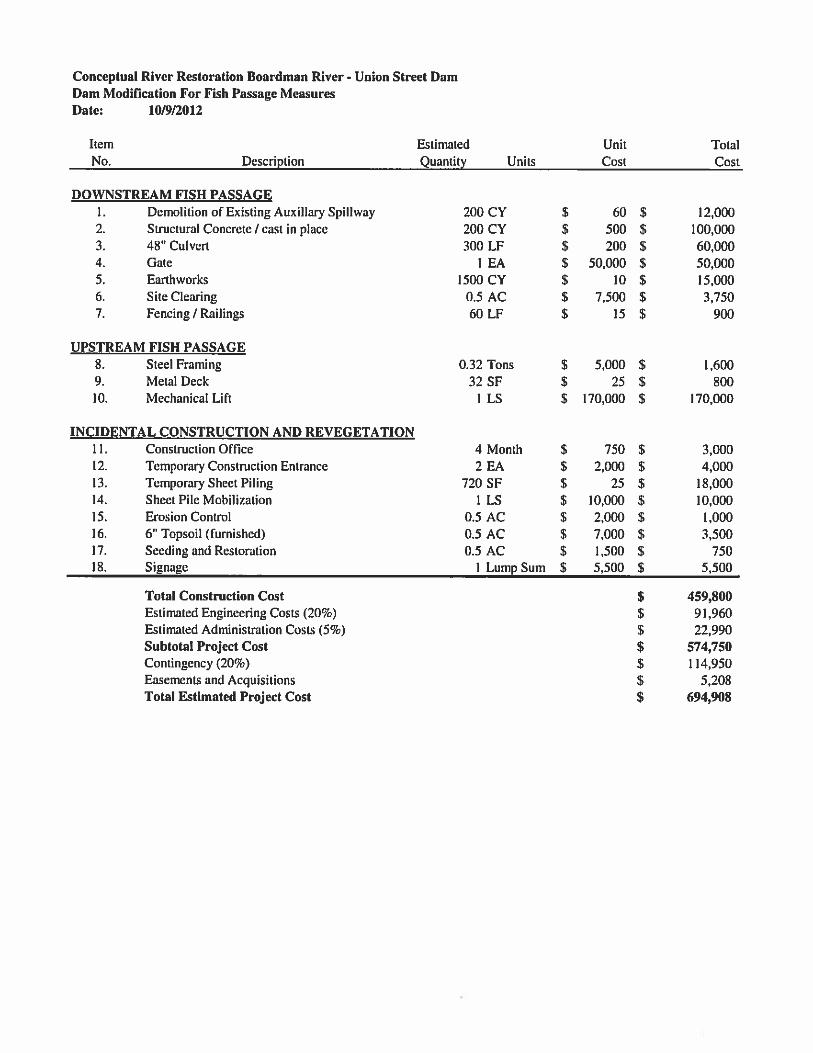
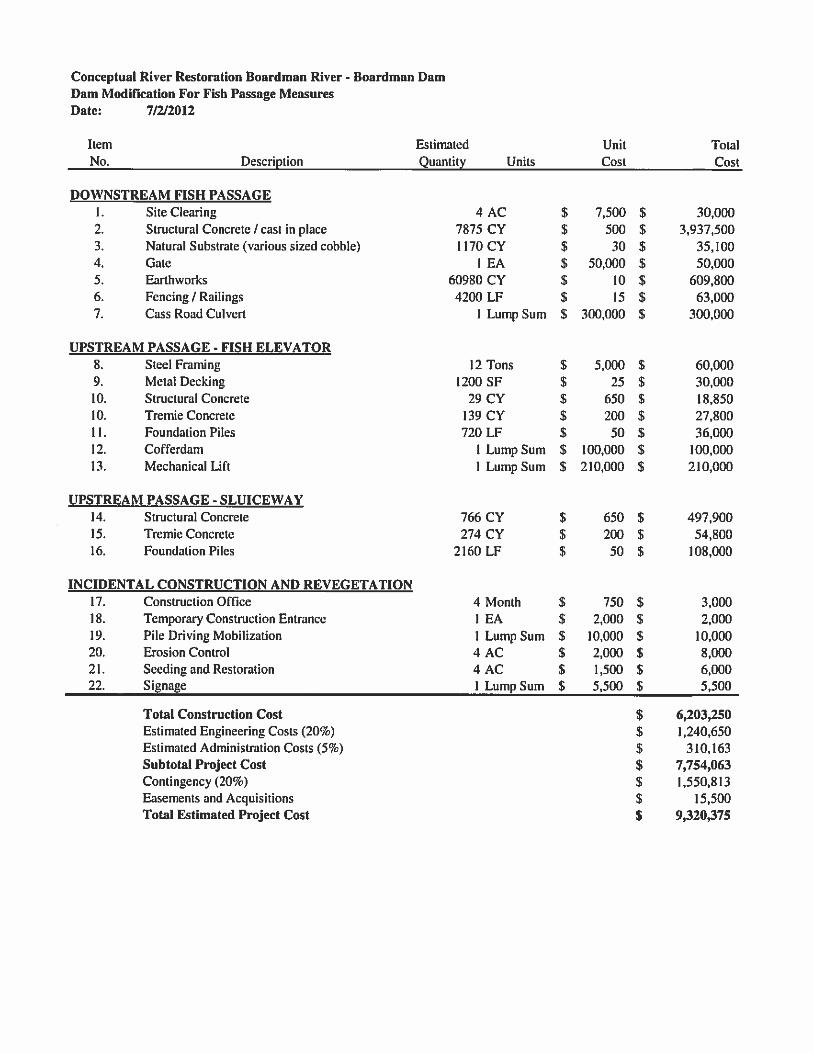
3.2 DAM MODIFICATION FOR FISH PASSAGE
Cost estimates are provided in Attachment 2 for the modification of the Union Street,
Sabin, and Boardman Dams for fish passage. For each dam an “expected” and “high”
cost is provided. The “expected” cost is the cost estimated using unit costs and
conceptual level understanding of the measure. The “high” cost is an estimate of costs if
the worst case assumptions prove to be correct. This could include increases in material
costs, difficulty with access, identification of risks associated with modifying the dams
(for example, piping, seepage, etc. that would preclude construction near the earthen or
Boardman River Feasibility Study Cost Engineering Appendix
C-4
concrete structures). The “high” cost estimate was developed by increasing the
“expected” costs by an additional 25 percent.
3.2.1 Union Street Dam
The following measures were considered for fish passage at the Union Street dam:
Trap and transfer operation at the MDNR fish weir with modifications to the
Union Street dam to allow downstream passage.
Integration of the sturgeon lift and sort station along with the fish weir facility and
rock ramp.
New sturgeon lift and sort facility
A concept level cost and feasibility analysis concluded that the construction of lift and
sort facilities would entail excessive cost and potential issues making it logistically
infeasible, therefore, only the trap and transfer measure was carried forward for further
analysis. The trap and transfer operation would involve trapping sturgeon at the existing
weir facility and manually transferring them to upstream locations. Downstream passage
would be accomplished by modifying the existing dam to be more conducive to passing
adult sturgeon through the auxiliary spillway.
The fish lift for the weir is conceptualized as a hoist system capable of lifting 4 tons 10
feet vertically. This system would be attached to the loading dock wall at the fish weir.
The 4-foot by 8-foot loading platform would be flat to facilitate the loading of temporary
bins for placement of fish and water. The bins would be attached to the lifting platform
via straps. The lift would raise the bins to the loading dock area where they would be
transferred to trucks for transfer to an upstream location. Operational constraints in the
form of a sturgeon specific “standard operating procedure” would be developed to limit
mortality to adult sturgeon and other fish species present during the trap and transfer
activities.
3.2.2 Sabin and Boardman Dams
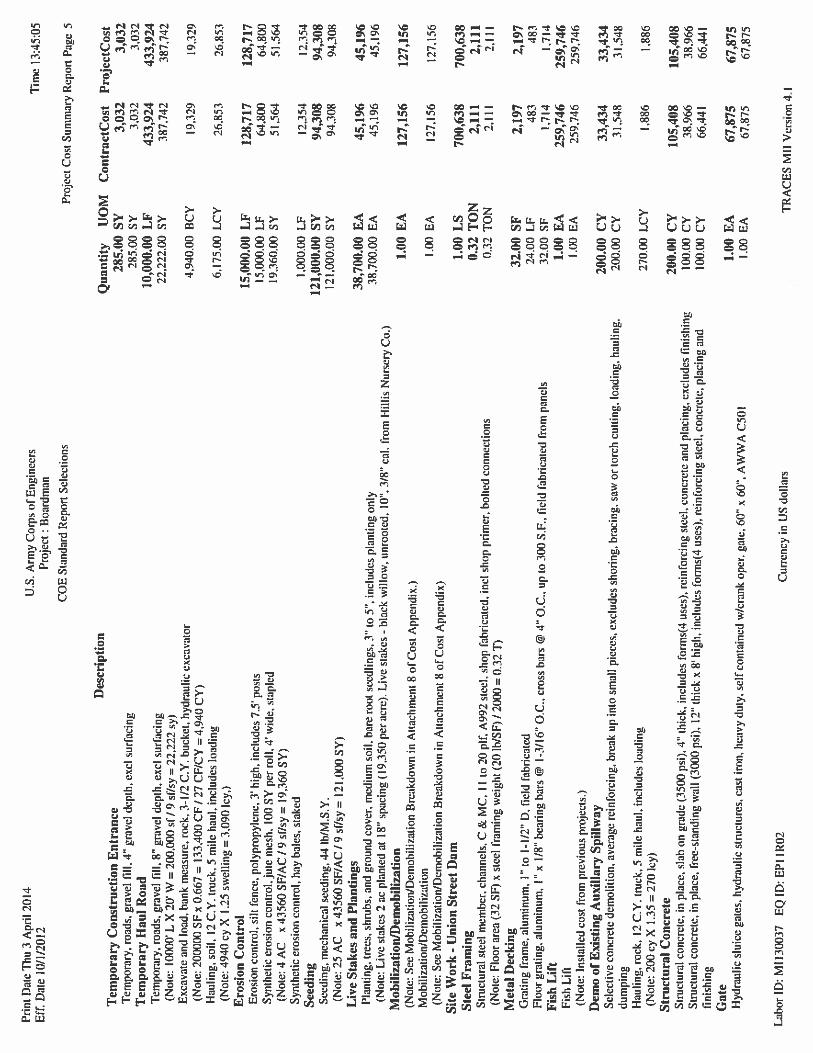
The fish passage measure comprises two components. Upstream passage consisting of a
fish lift and downstream passage consisting of a nature like channel. The fish lift consists
of a crane or hoist system capable of lifting 6 tons to the top of the dam and a channel
structure that discharges fish from the lift into the impoundment. The fish lift is supported
within an open steel beam structure and the concrete channel spans from the top of this
structure to the impoundment. Downstream passage would consist of a concrete channel
with natural material added for the bed being built along the valley wall to maintain a
consistent slope and sub-critical water depth.
The cost of the fish lift equipment was determined from vendor quotes and the steel beam
tower structure and concrete channel by an Engineer’s estimate. The natural like channel
costs were calculated using unit cost breakdown for concrete, excavation, and other
Boardman River Feasibility Study Cost Engineering Appendix
C-5
material. Unit costs were derived from contractor quotes and previous projects. The
primary costs associated with upstream passage would be the steel beam tower and
elevated concrete discharge channel. Downstream fish passage costs would mainly be
from excavation and concrete costs. Access along the valley walls for the downstream
passage and to below the dam structures would be a complicating factor for this measure
and would likely increase construction costs.
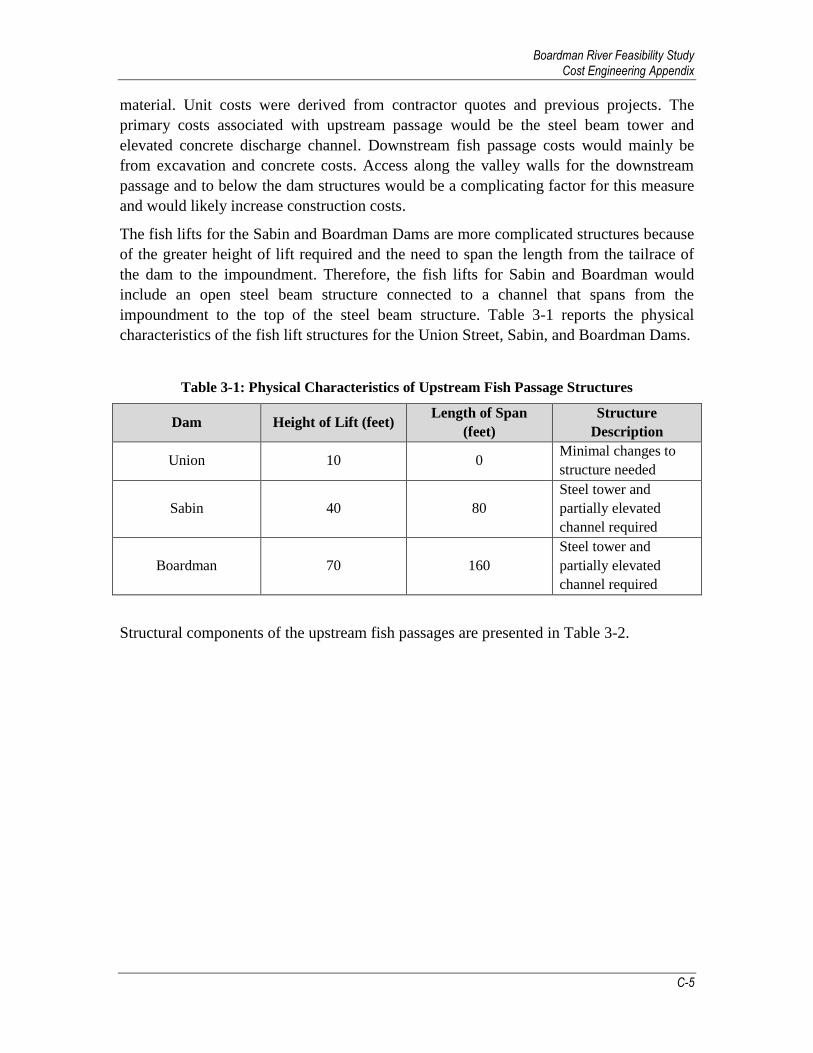
The fish lifts for the Sabin and Boardman Dams are more complicated structures because
of the greater height of lift required and the need to span the length from the tailrace of
the dam to the impoundment. Therefore, the fish lifts for Sabin and Boardman would
include an open steel beam structure connected to a channel that spans from the
impoundment to the top of the steel beam structure. Table 3-1 reports the physical
characteristics of the fish lift structures for the Union Street, Sabin, and Boardman Dams.
Table 3-1: Physical Characteristics of Upstream Fish Passage Structures
Dam Height of Lift (feet) Length of Span
(feet)
Structure
Description
Union 10 0 Minimal changes to
structure needed
Sabin 40 80
Steel tower and
partially elevated
channel required
Boardman 70 160
Steel tower and
partially elevated
channel required
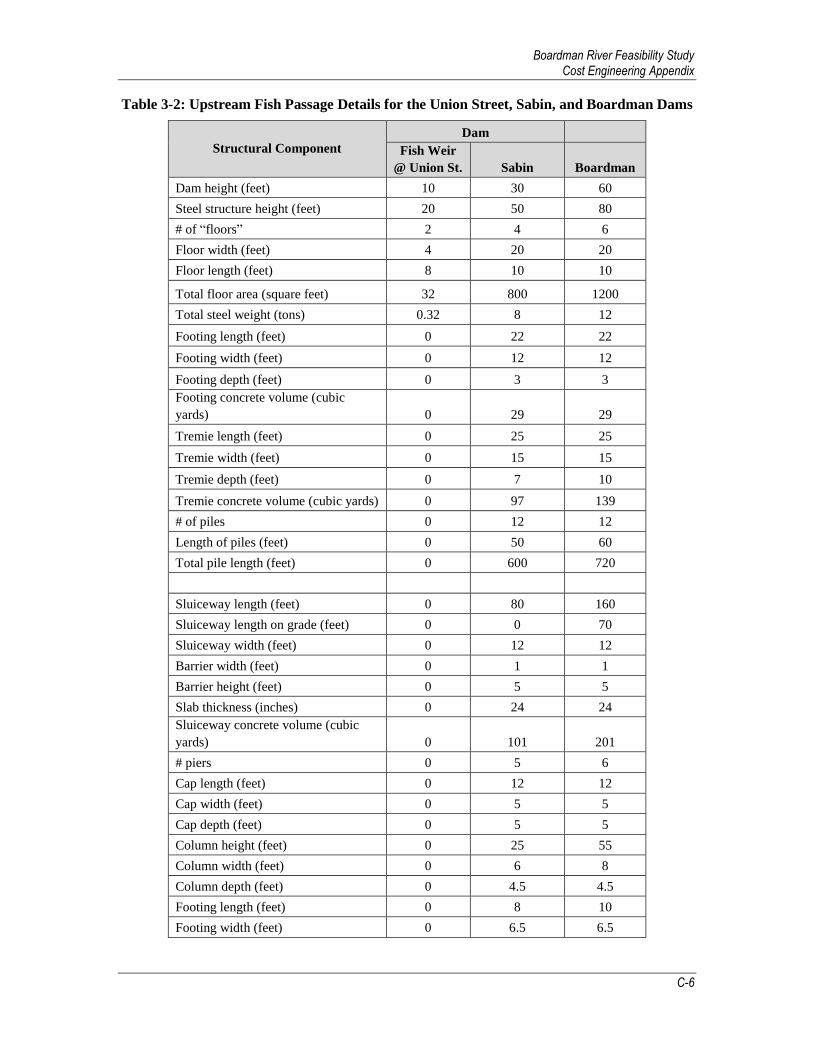
Structural components of the upstream fish passages are presented in Table 3-2.
Boardman River Feasibility Study Cost Engineering Appendix
C-6
Table 3-2: Upstream Fish Passage Details for the Union Street, Sabin, and Boardman Dams
Structural Component
Dam
Fish Weir
@ Union St. Sabin Boardman
Dam height (feet) 10 30 60
Steel structure height (feet) 20 50 80
# of “floors” 2 4 6
Floor width (feet) 4 20 20
Floor length (feet) 8 10 10
Total floor area (square feet) 32 800 1200
Total steel weight (tons) 0.32 8 12
Footing length (feet) 0 22 22
Footing width (feet) 0 12 12
Footing depth (feet) 0 3 3
Footing concrete volume (cubic
yards) 0 29 29
Tremie length (feet) 0 25 25
Tremie width (feet) 0 15 15
Tremie depth (feet) 0 7 10
Tremie concrete volume (cubic yards) 0 97 139
# of piles 0 12 12
Length of piles (feet) 0 50 60
Total pile length (feet) 0 600 720
Sluiceway length (feet) 0 80 160
Sluiceway length on grade (feet) 0 0 70
Sluiceway width (feet) 0 12 12
Barrier width (feet) 0 1 1
Barrier height (feet) 0 5 5
Slab thickness (inches) 0 24 24
Sluiceway concrete volume (cubic
yards) 0 101 201
# piers 0 5 6
Cap length (feet) 0 12 12
Cap width (feet) 0 5 5
Cap depth (feet) 0 5 5
Column height (feet) 0 25 55
Column width (feet) 0 6 8
Column depth (feet) 0 4.5 4.5
Footing length (feet) 0 8 10
Footing width (feet) 0 6.5 6.5

Boardman River Feasibility Study Cost Engineering Appendix
C-7
Structural Component
Dam
Fish Weir
@ Union St. Sabin Boardman
Footing depth (feet) 0 4 4
Tremie length (feet) 0 11 13
Tremie width (feet) 0 9.5 9.5
Tremie depth (feet) 0 7 10
Pier concrete volume (cubic yards) 0 219 564
Tremie concrete volume (cubic yards) 0 135 274
# of piles per column 0 6 6
Length of piles (feet) 0 50 60
Total pile length (feet) 0 1500 2160
4 DEVELOPMENT OF ALTERNATIVES
The dam removal and fish passage measures, as described above, were evaluated during a
preliminary screening. A few measures were eliminated from further consideration and
the remaining measures were combined to create alternatives.
The preliminary screening evaluated the measures and eliminated measures that did not
meet the objectives of the study or were not cost effective. In accordance with the U.S.
Fish and Wildlife Service desire to retain the Union Street Dam as a lamprey barrier, the
removal of Union Street Dam was not considered further. Since modification of the Sabin
Dam and Boardman Dams is costly, provides minimal habitat benefits, and does not meet
the objectives of the project, these measures and the associated alternatives were removed
from further consideration. Moreover, the cost to modify the Sabin Dam is more
expensive than removal and the cost to modify Boardman Dam is nearly the same cost as
removal.
After three measures were eliminated during the preliminary screening, the remaining
measures were combined to create alternatives. The preliminary screening resulted in
eight alternatives carried forward for further analysis, displayed in Table 4-1 below.

Boardman River Feasibility Study Cost Engineering Appendix
C-8
Table 4-1: Alternatives Selected for Further Analysis
Alternative Union Street Dam Sabin Dam Boardman Dam
Alternative 1 No Action No Action No Action
Alternative 2 Modify No Action No Action
Alternative 3 Modify Remove No Action
Alternative 4 Modify No Action Remove
Alternative 5 Modify Remove Remove
Alternative 6 No Action Remove No Action
Alternative 7 No Action No Action Remove
Alternative 8 No Action Remove Remove
Summarized below is the final array of alternative plans that were screened for further
evaluation to determine the alternative that best fit the selection criteria.
4.1 ALTERNATIVE 1 – NO ACTION
Alternative 1 (No Action Alternative) consists of retaining and maintaining all of the
dams, powerhouses, and spillways. No measures would be implemented to restore or
improve coldwater habitat. Water levels and impoundment sizes would not change. The
dams would not be modified to allow increased fish passage. The fish ladder at the Union
Street Dam would be maintained, along with the MDNR Boardman River fish weir. The
No Action Alternative is included in the analysis to provide a baseline against which the
beneficial and adverse impacts of the with-project alternatives may be compared.
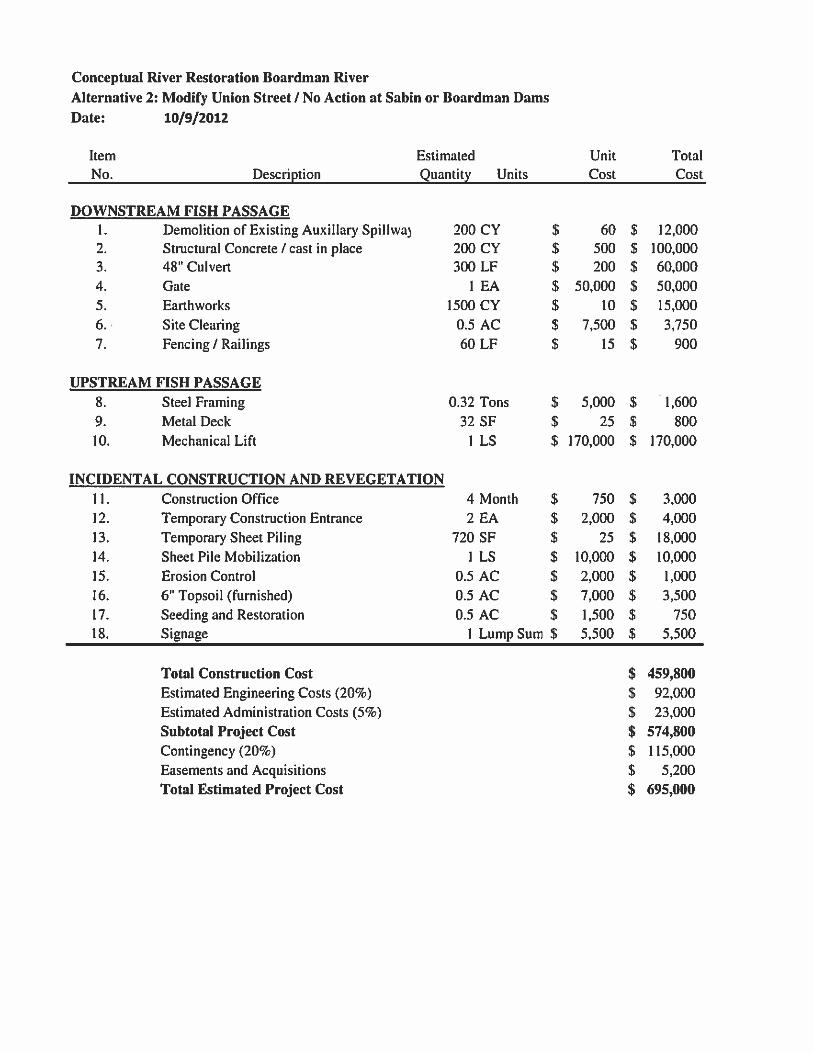
4.2 ALTERNATIVE 2 – MODIFY UNION STREET DAM
Alternative 2 consists of modifying the Union Street Dam to improve fish passage with
the establishment of a trap-and-transfer operation at the MDNR Boardman River fish
weir. It would provide spawning and foraging habitat in Boardman Lake and the
Boardman River up to Sabin Dam for lake sturgeon that were manually transferred past
the weir/dam. The dam and existing fish ladder would remain in place to maintain the
current Boardman Lake level, but downstream passage would be improved through the
dam’s auxiliary spillway. The Sabin Dam would be maintained as it currently exists. The
Boardman Dam would be retained and the pool elevation would remain lowered to meet
the Dam Safety Act requirements of the MDEQ.
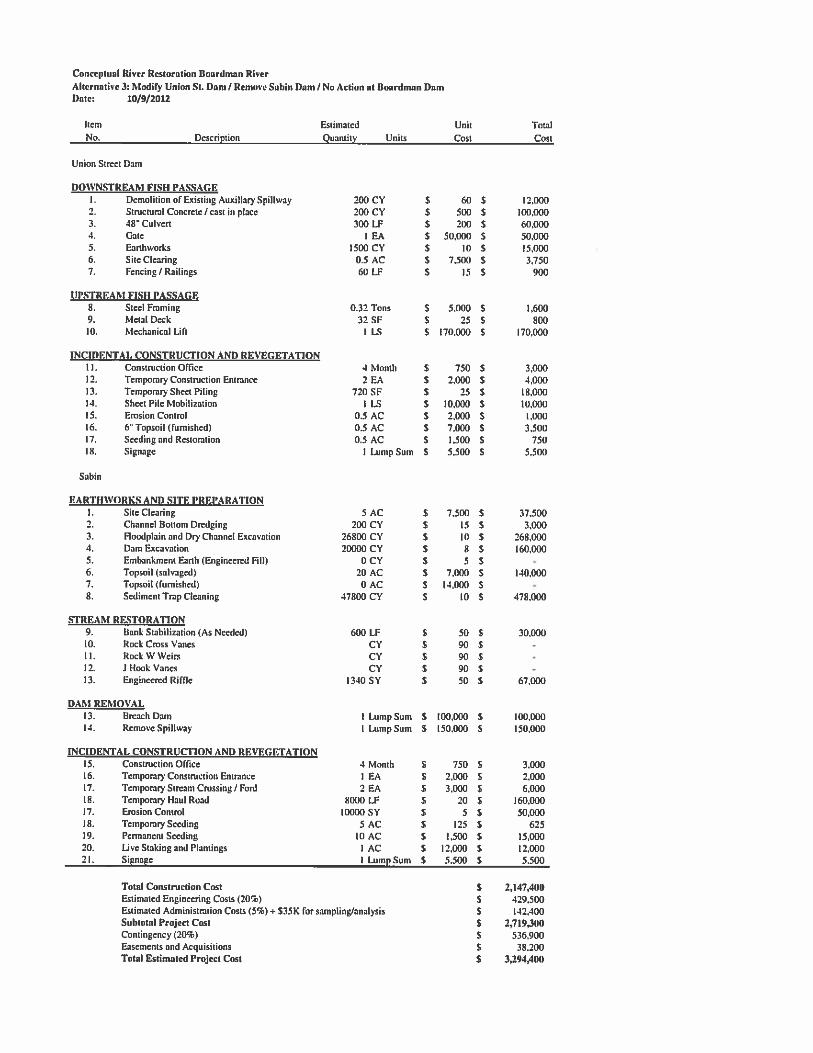
4.3 ALTERNATIVE 3 – MODIFY UNION STREET DAM, REMOVE SABIN
DAM
Alternative 3 consists of modifying the Union Street Dam to improve fish passage with
the establishment of a trap-and-transfer operation at the MDNR Boardman River fish
Boardman River Feasibility Study Cost Engineering Appendix
C-9
weir. The dam and existing fish ladder would remain in place to maintain the current
Boardman Lake level, but downstream passage would be improved through the dam’s
auxiliary spillway. The Sabin Dam would be removed to allow a free-flowing river to be
restored from the Boardman Dam to Boardman Lake. The Sabin Dam would be breached
in the area of the auxiliary spillway. In this area the river and floodplain would be
designed. All other parts of the dam (i.e. the powerhouses and other portions of the
earthen embankment) would remain in place. The proposed river alignment would
include engineered riffles/grade control structures at the former Sabin Dam location that
would add stability to the restored channel in areas of relatively steep slopes. In addition
to engineered rock riffles, other bank stabilization measures might be used at this location
to redirect the channel and protect stream banks. The Boardman Dam would be retained
and the pool elevation would remain lowered to meet the Dam Safety Act requirements
of the MDEQ.
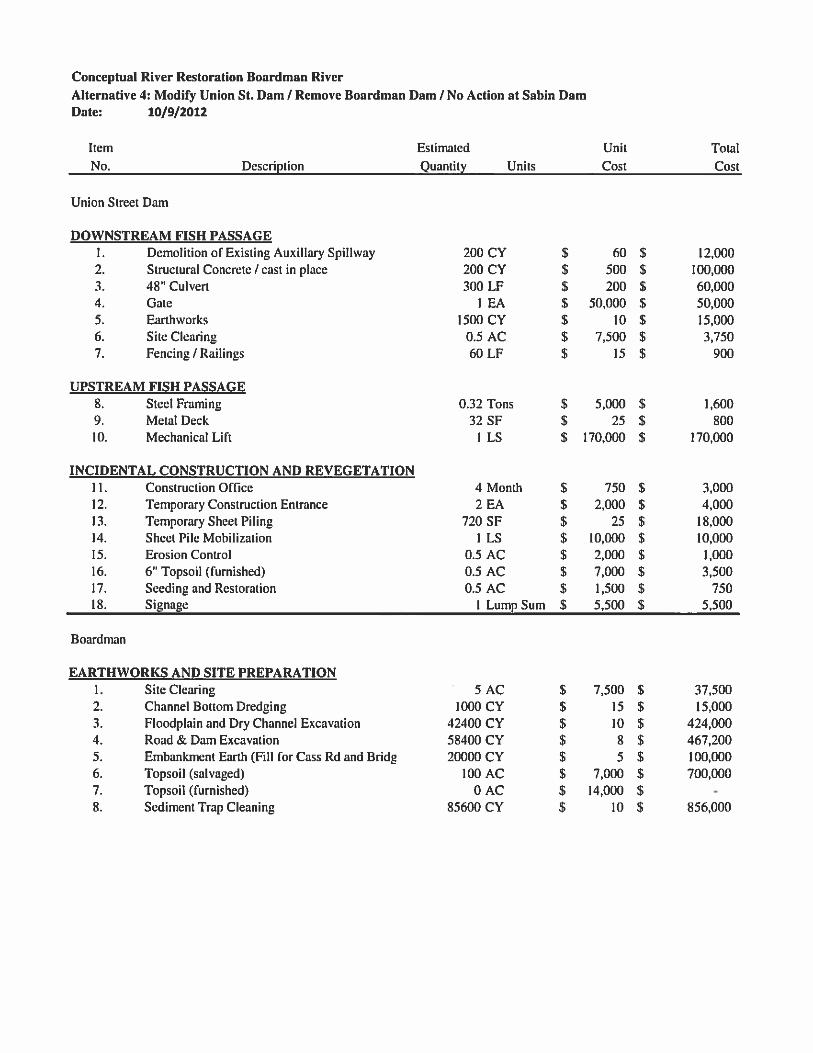
4.4 ALTERNATIVE 4 – MODIFY UNION STREET DAM, REMOVE
BOARDMAN DAM
Alternative 4 consists of modifying the Union Street Dam to improve fish passage with
the establishment of a trap-and-transfer operation at the MDNR Boardman River fish
weir. The dam and existing fish ladder would remain in place to maintain the current
Boardman Lake level, but downstream passage would be improved through the dam’s
auxiliary spillway. The Sabin Dam would be maintained as it currently exists. The
Boardman Dam would be removed and Boardman Pond would return to a more natural
riverine state. The proposed river alignment would include engineered riffles/grade
control structures at the former location of the Boardman Dam that would add stability to
the restored channel in areas of relatively steep slopes. In addition to engineered rock
riffles, other bank stabilization measures might be used at this location to redirect the
channel and protect stream banks. The bridge and road construction project required as a
result of moving the river channel is being undertaken by the Grand Traverse County
Road Commission and is not part of the USACE Ecosystem Restoration Project.
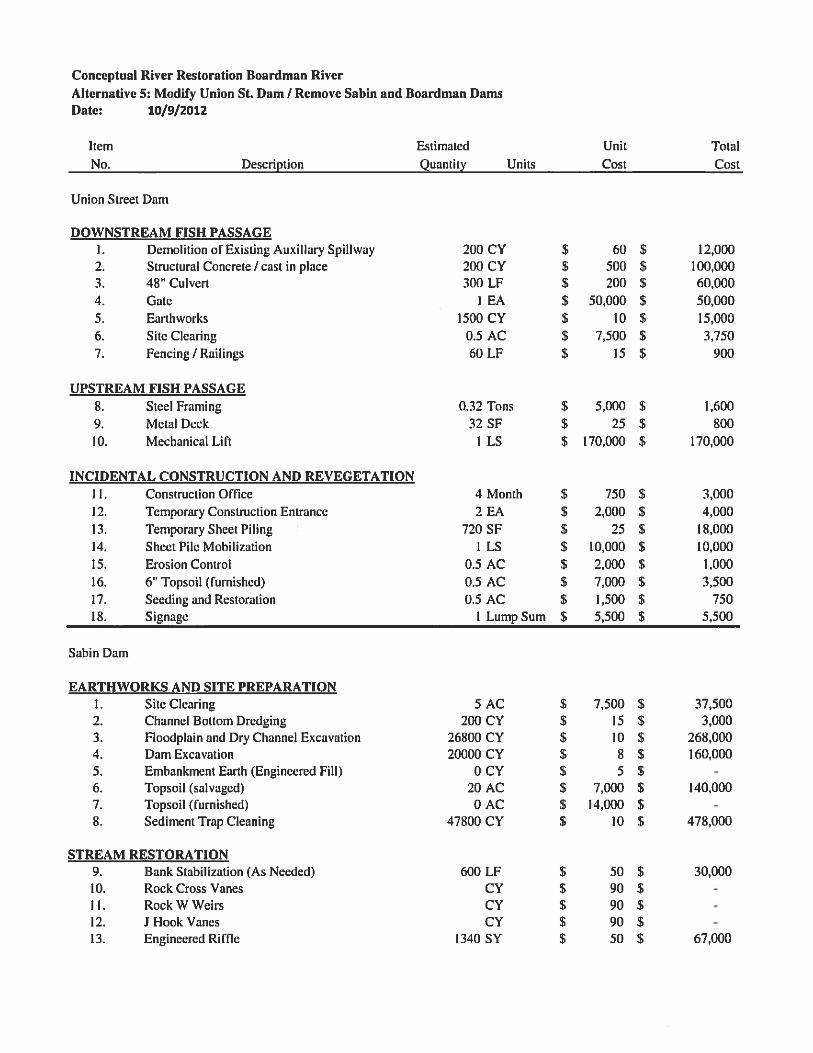
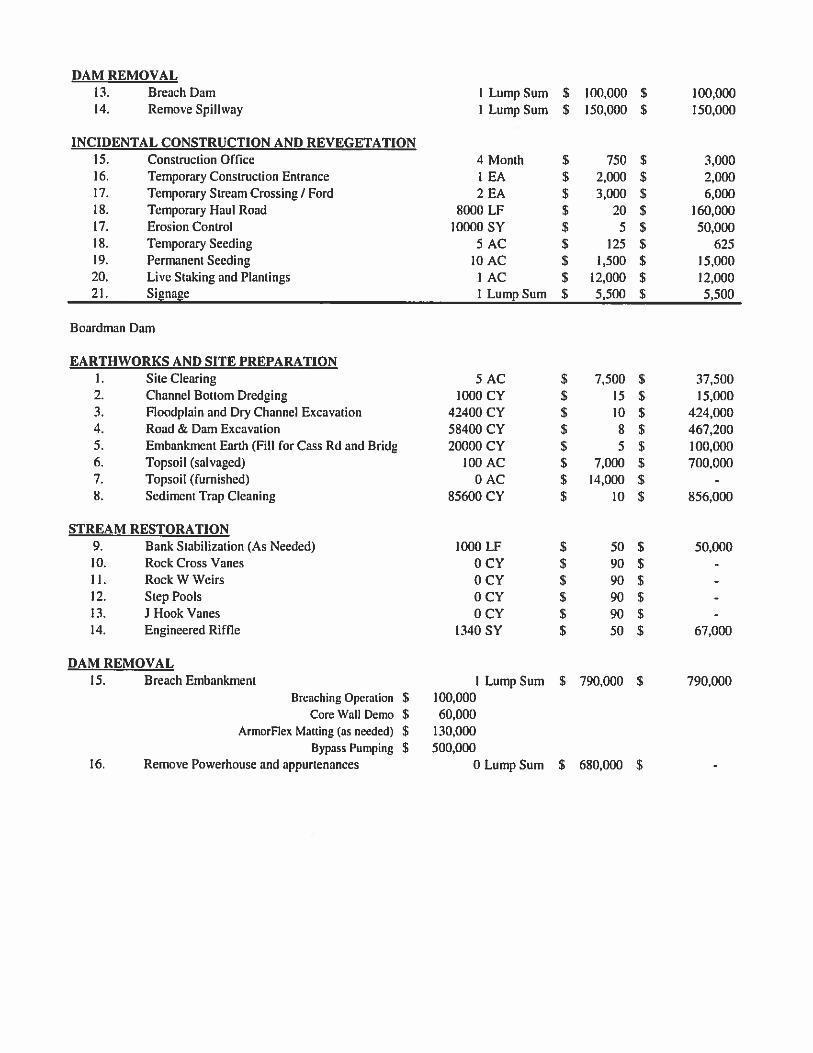
4.5 ALTERNATIVE 5 – MODIFY UNION STREET DAM, REMOVE SABIN
AND BOARDMAN DAMS
Alternative 5 consists of modifying the Union Street Dam to improve fish passage with
the establishment of a trap-and-transfer operation at the MDNR Boardman River fish
weir. The dam and existing fish ladder would remain in place to maintain the current
Boardman Lake level, but downstream passage would be improved through the dam’s
auxiliary spillway. The Sabin Dam and the Boardman Dam would be removed to allow a
free-flowing river to be restored from the Boardman Pond to Boardman Lake. The dams
would be breached in the location of the historic channel. In this area the river and
floodplain would be designed. All other parts of the dam (i.e. the powerhouses and other
portions of the earthen embankment) would remain in place. The proposed river
alignment would include engineered riffle/grade control structures at both dams that
would add stability to the restored channel in areas of relatively steep slopes. In addition
to engineered rock riffles, other bank stabilization measures might be used at the dams to
Boardman River Feasibility Study Cost Engineering Appendix
C-10
redirect the channel and protect stream banks. The bridge and road construction project
required as a result of moving the river channel is being undertaken by the Grand
Traverse County Road Commission and is not part of the USACE Ecosystem Restoration
Project.
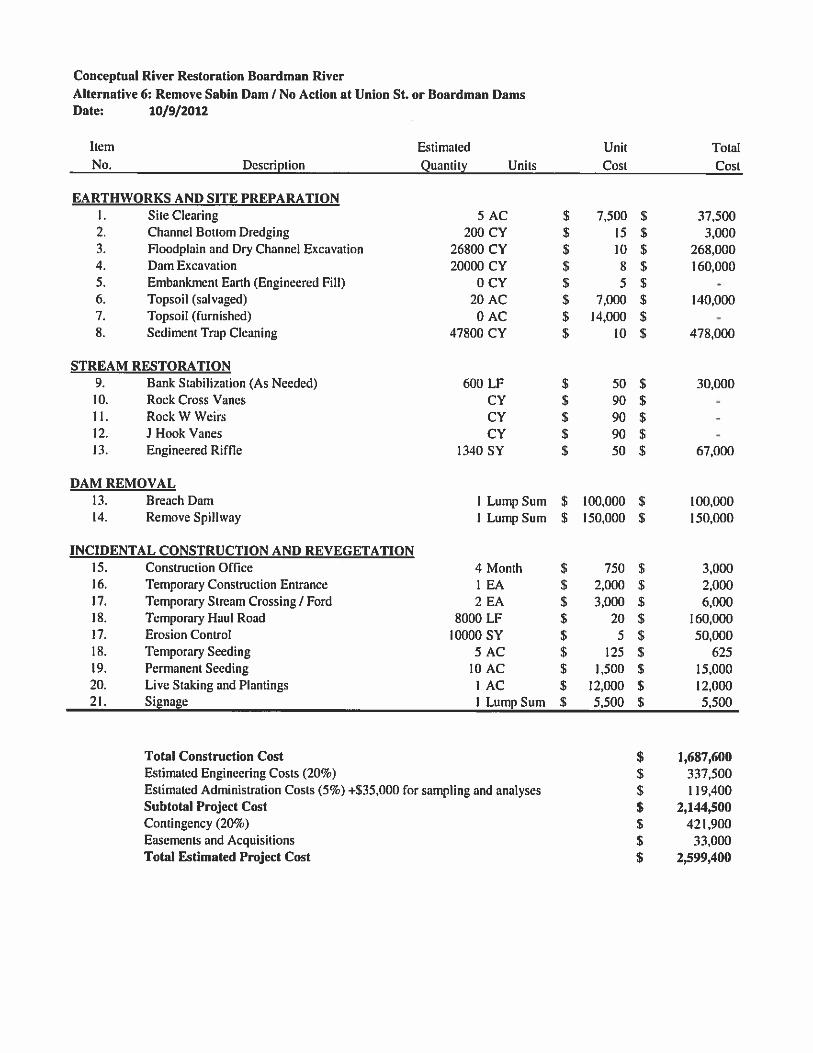
4.6 ALTERNATIVE 6 – REMOVE SABIN DAM
Alternative 6 consists of retaining the Union Street Dam, along with the existing fish
ladder and fish weir operation. The current fish ladder operation would continue. The
Sabin Dam would be removed to allow a free-flowing river to be restored from the
Boardman Pond Dam to Boardman Lake. The Sabin Dam would be breached in the area
of the auxiliary spillway. In this area the river and floodplain would be designed. All
other parts of the dam (i.e. the powerhouses and other portions of the earthen
embankment) would remain in place. The proposed river alignment would include
engineered riffles/grade control structures at the Sabin Dam that would add stability to
the restored channel in areas of relatively steep slopes. In addition to engineered rock
riffles, other bank stabilization measures might be used at the former Sabin Dam location
to redirect the channel and protect stream banks. The Boardman Dam would be retained
and the pool elevation would remain lowered to meet the Dam Safety Act requirements
of the MDEQ.
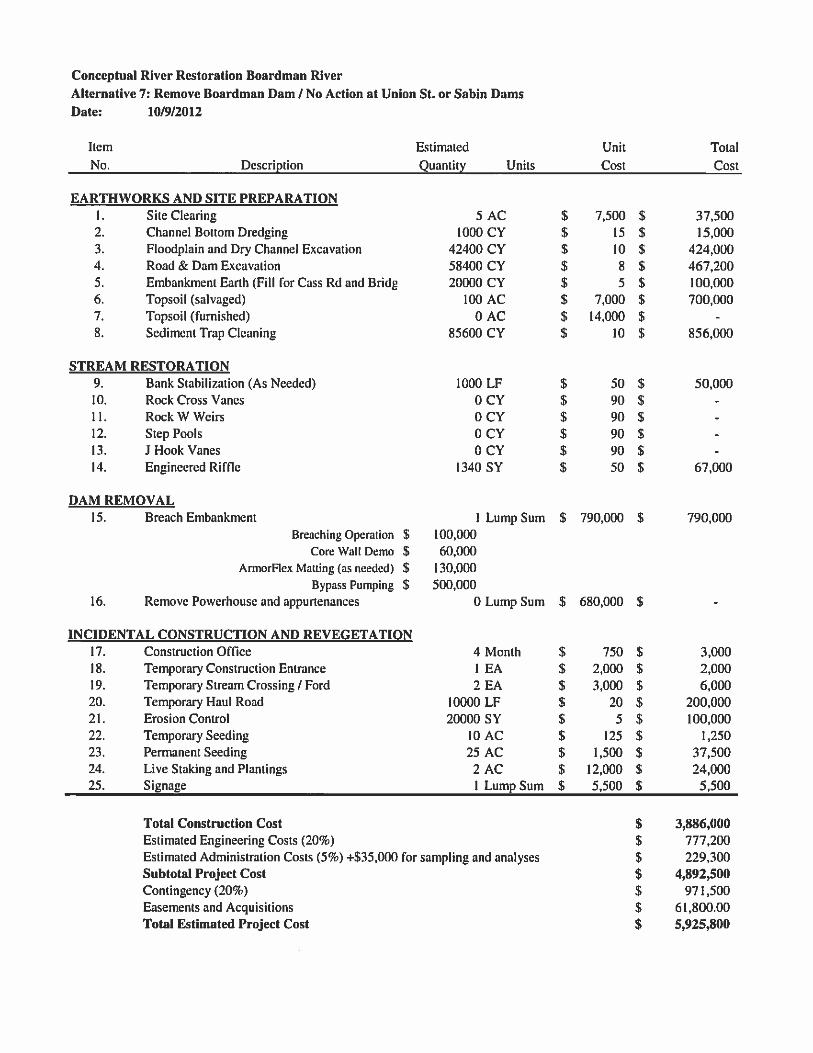
4.7 ALTERNATIVE 7 – REMOVE BOARDMAN DAM
Alternative 7 consists of retaining the Union Street Dam, along with the existing fish
ladder and fish weir operation. The Sabin Dam would be maintained as it currently exists.
The Boardman Dam would be removed and Boardman Pond would return to a more
natural riverine state. The Boardman dam would be breached through the earthen
embankment in the location of the historic channel. In this area the river and floodplain
would be designed. All other parts of the dam (i.e. the powerhouses and other portions of
the earthen embankment) would remain in place. The proposed river alignment would
include engineered riffles/grade control structures at the former Boardman Dam location
that would add stability to the restored channel in areas of relatively steep slopes. In
addition to engineered rock riffles, other bank stabilization measures might be used at this
location to redirect the channel and protect stream banks. The bridge and road
construction project required as a result of moving the river channel is being undertaken
by the Grand Traverse County Road Commission and is not part of the USACE
Ecosystem Restoration Project.
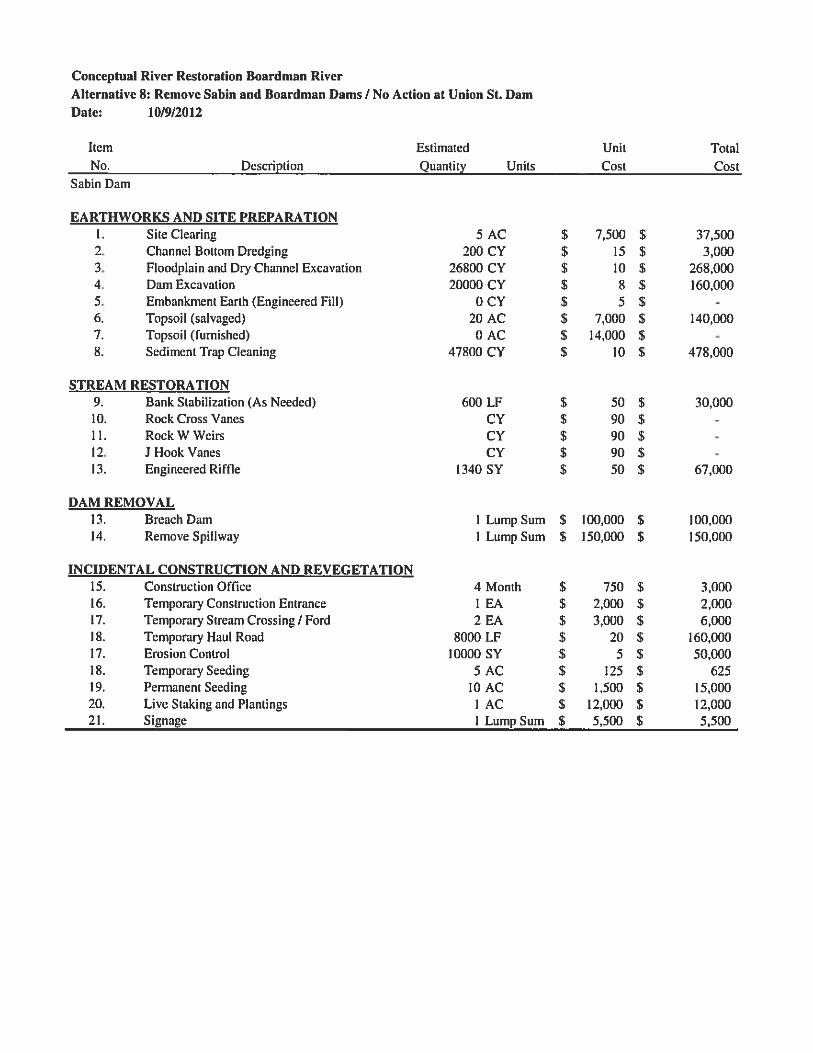
4.8 ALTERNATIVE 8 – REMOVE SABIN AND BOARDMAN DAMS
Alternative 8 consists of retaining the Union Street Dam, along with the existing fish
ladder and fish weir operation. The Sabin Dam and Boardman Dam would be removed to
allow a free-flowing river to be restored from the Boardman Pond to Boardman Lake.
The dams would be breached in the location of the historic channel. In this area the river
and floodplain would be designed. All other parts of the dam (i.e. the powerhouses and

Boardman River Feasibility Study Cost Engineering Appendix
C-11
other portions of the earthen embankment) would remain in place. The proposed river
alignment would include engineered riffle/grade control structures at both dams that
would add stability to the restored channel in areas of relatively steep slopes. In addition
to engineered rock riffles, other bank stabilization measures might be used at the dams to
redirect the channel and protect stream banks. The bridge and road construction project
required as a result of moving the river channel is being undertaken by the Grand
Traverse County Road Commission and is not part of the USACE Ecosystem Restoration
Project.
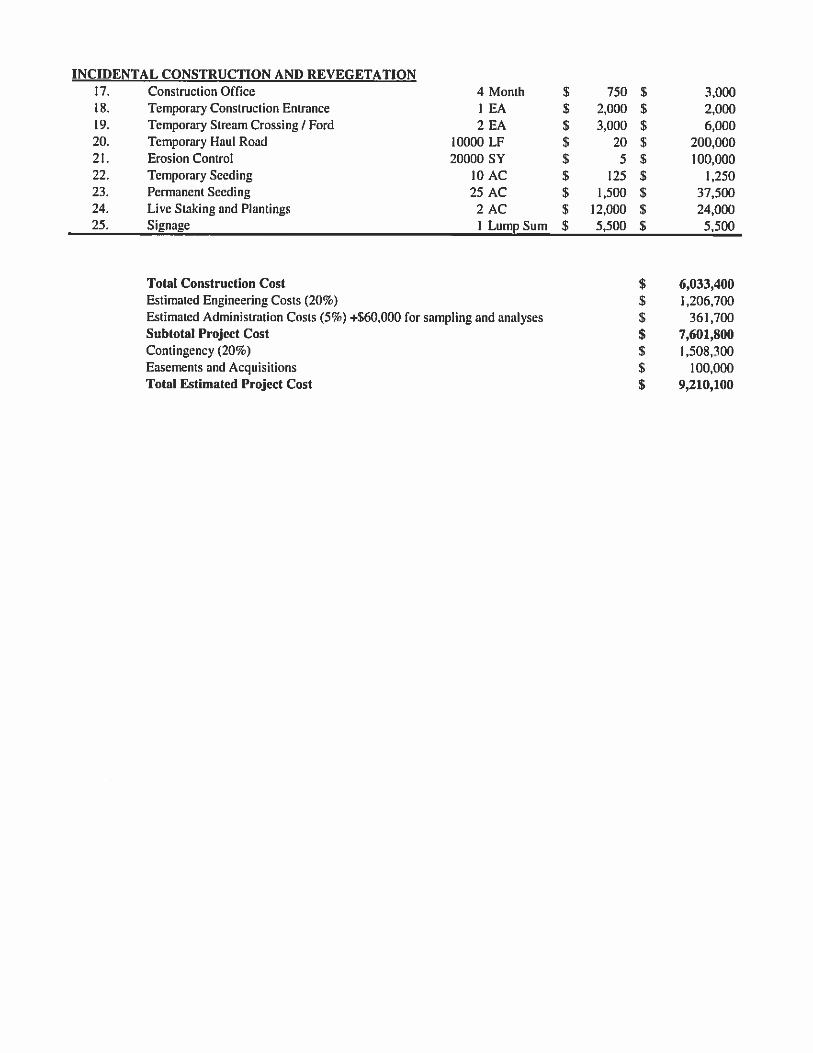
The cost of each alternative, developed from the combined cost of individual measures is
presented in Attachment 3.
First and annual costs for the alternative plans are presented in Table 4-2.
Table 4-2: Alternative Cost Summary
Alternative Union
Street Dam
Sabin Dam Boardman
Dam
First Cost Net Avg.
Annual
Cost*
Alternative 1 No Action No Action No Action $0 $0
Alternative 2 Modify No Action No Action $695,000 $14,400
Alternative 3 Modify Remove No Action $3,294,400 $105,200
Alternative 4 Modify No Action Remove $6,620,700 $248,100
Alternative 5 Modify Remove Remove $9,210,100 $338,400
Alternative 6 No Action Remove No Action $2,599,400 $92,000
Alternative 7 No Action No Action Remove $5,925,800 $234,800
Alternative 8 No Action Remove Remove $8,515,200 $325,200
* - Net Average Annual Costs (AACs) are presented in detail in the Economics Appendix. The AACs
include real estate, construction, engineering, administration, contingency, interest during construction,
present value of monitoring costs and present value of OMRR&R. AACs were calculated using the FY14
Federal discount rate of 3.50 percent and a 50-year period of analysis. All costs are in 2012 dollars and
were rounded to the nearest hundred.
5 PLAN SELECTION
A detailed discussion evaluating all final alternatives is included in the DPR under
Section 4.6, “Evaluation of Alternative Plans.” The selected alternative provides the
highest net benefits, and meets the formulation and evaluation criteria of being
technically effective, environmentally sound, socially/politically acceptable, cost
effective (implementation cost, and operation and maintenance cost), and constructible.
Boardman River Feasibility Study Cost Engineering Appendix
C-12
As such, the selected plan is Alternative 5 – Modify Union Street Dam and Remove
Sabin and Boardman Dams. A detailed description of the selected plan is included in the
DPR Section 5, “Selected Plan.”
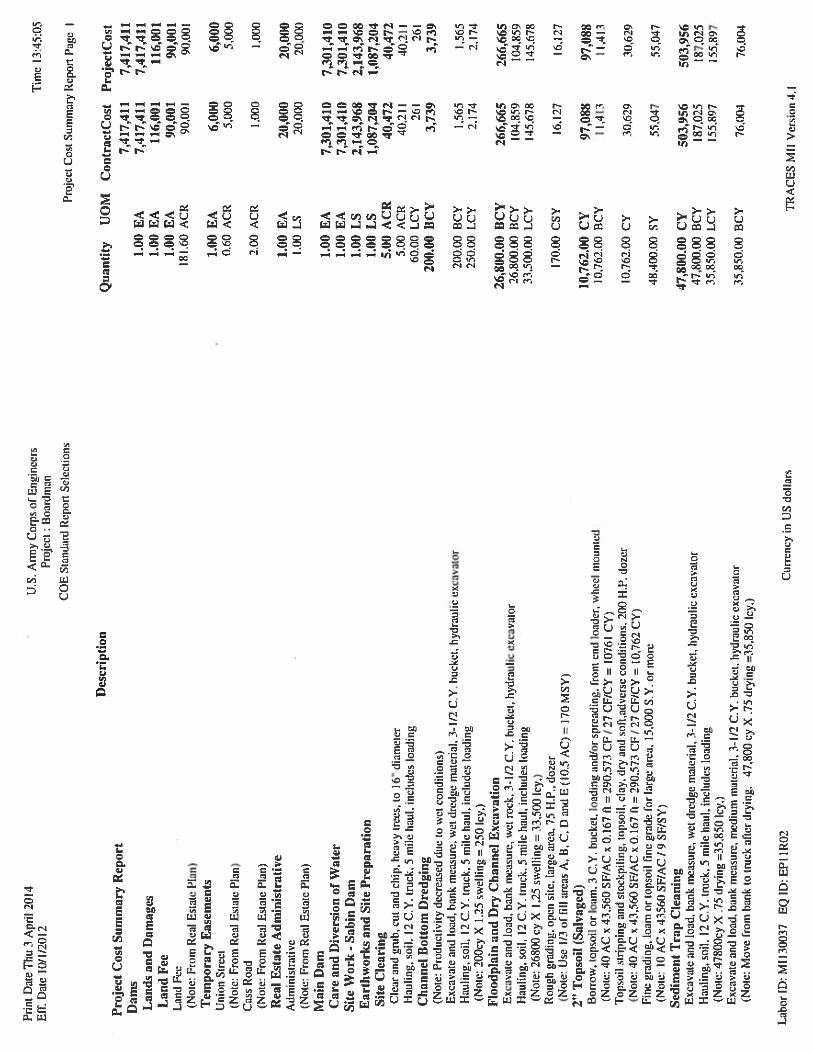
6 COST ESTIMATING METHODOLOGY
Construction quantities shown in the Engineering Appendix (Appendix A) were used for
the Detailed Cost Estimate. Additional quantities and features developed for the selected
plan were computed by cost engineering personnel and included in the cost estimate. The
quantities are substantially complete regarding biddability, constructability, and
operability of the selected plan.
Guidance for the preparation of the estimate and attachments was obtained from ER
1110-2-1150, Engineering and Design for Civil Works Projects; ER 1110-2-1302 Civil
Works Cost Engineering; ETL 1110-2-573, Construction Cost Estimating Guide for Civil
Works; and EM 1110-2-1304, Civil Works Construction Cost Index System (CWCCIS).
The estimate was prepared using the MII version 4.1 software.
7 SELECTED ALTERNATIVE
7.1 PRICE LEVEL
Project costs are based on MII 2010 English Cost Book prices, unless otherwise noted.
Equipment rates were based on the MII 2011 Region 2 equipment cost library. Labor
rates were updated using the current Davis Bacon rates, including fringes from MI
130037, dated January 4, 2013, for Grand Traverse County, MI. Fuel rates were updated
for the Midwest as of February 4, 2013. The price for off-road diesel was computed by
subtracting State and Federal taxes from retail diesel prices. Michigan sales tax of 6
percent was applied to materials.
7.2 QUANTITIES
Costs are based on quantities developed from the design plans presented in the
Engineering Appendix. Earthwork volume load/swell factors used in the MII estimate are
based on average values from RSMeans Heavy Construction Handbook (bank cubic yard
x 1.2 = loose cubic yard).
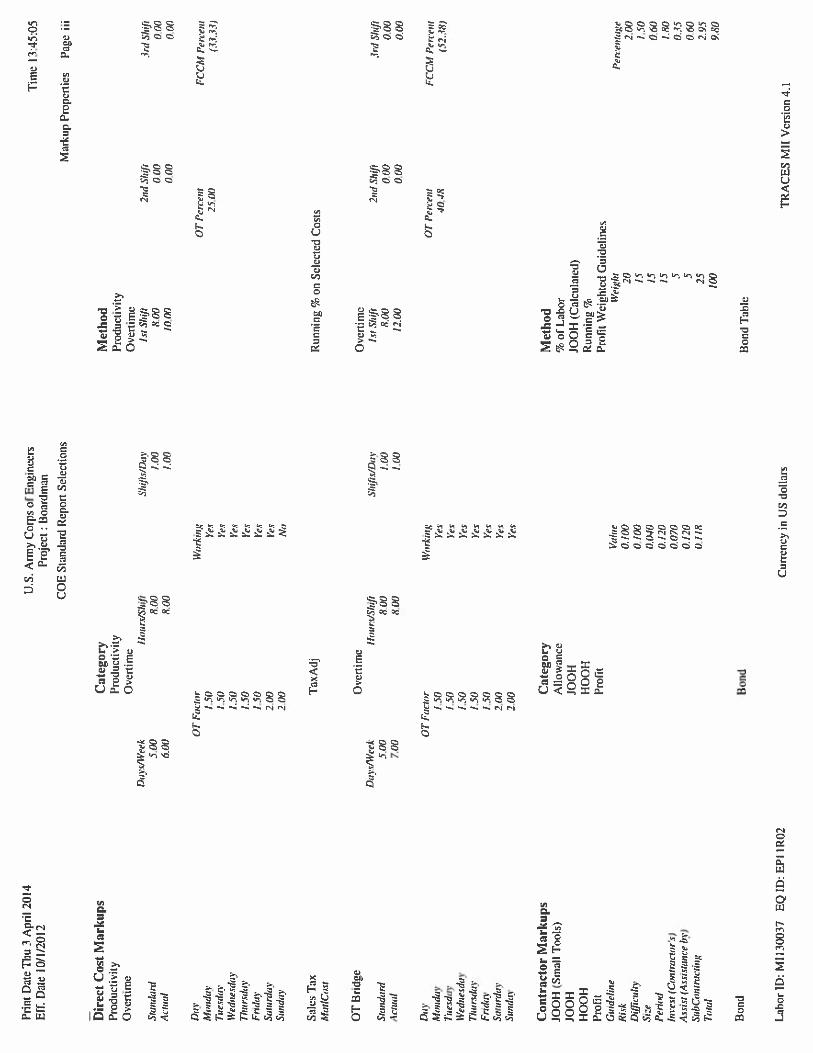
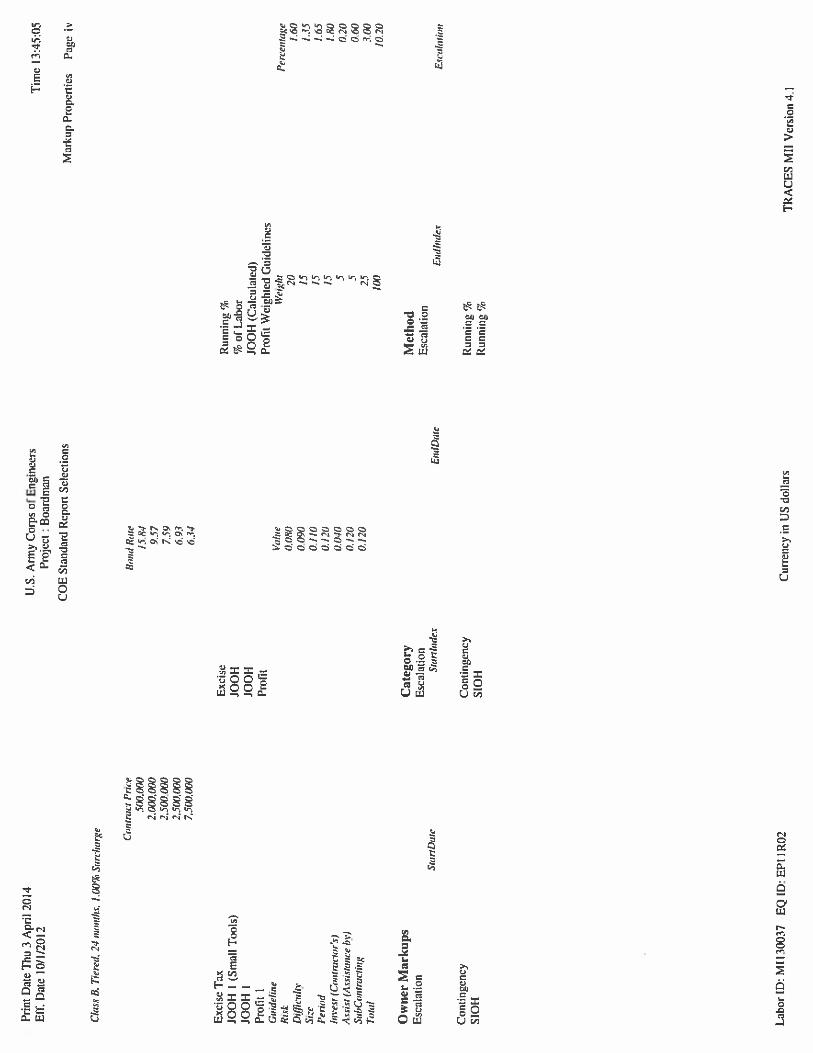
7.3 MARKUPS
Markups were developed for the cost estimate as follows:
The work was assumed to be completed on a 6-day, 10-hour/day work week.
Work associated with dam breaching was assumed to be completed on a 7-day,
12-hour day basis.
Contractor markups (job office overhead, home office overhead, profit, and
bonds) were based on markups used on similar projects:

Boardman River Feasibility Study Cost Engineering Appendix
C-13
Job Office Overhead (JOOH) for the prime contractor includes itemized
equipment and personnel needed to accomplish supervision and support tasks.
An additional 2 percent of labor was added for small tools and to cover
miscellaneous field overhead costs.
Home Office Overhead (HOOH) for the prime contractor includes general and
administrative costs. HOOH was set at 13 percent of the running cost to
prime.
JOOH for the subcontractors includes itemized equipment and field trailers.
Profit was established on a weighted guideline percentage for both prime and
subcontractors.
Bond costs were based on bond tables for Class B. The prime contractor’s
bond covers work by the subcontractors.
7.4 PED AND CONSTRUCTION MANAGEMENT
The cost for planning, engineering, and design (PED) was assumed to be 17.8 percent of
the construction contract cost (3 percent for planning after the Feasibility Study and 14.8
percent for engineering design and engineering during construction). The cost for
construction management was set at 8.9 percent of the contract cost based on general
estimates from past experience. The PED costs include soil sampling and analysis for the
Sabin and Boardman dam sediments, to be conducted during the PED. Construction
management includes environmental compliance monitoring to be complete following
construction.
8 SCHEDULE
A timeline for implementing the major components of the selected plan is presented in
Attachment 4. The construction schedule is dependent on several factors that include, but
are not limited to, the availability of funding, acquisition of temporary and permanent
easements, market forces in the construction industry, such as the availability of
experienced contractors and labor forces, and availability of agency approvals and
permits. The funding stream is important throughout the design and construction phases
of the project. The schedule shown assumes that both Federal and local funding would be
available to support design and construction.
Assuming Final LDR approval in the 3rd quarter of FY 2014, the PED phase would begin
immediately. A 12-month PED period is anticipated. Following development of the plans
and specifications, a Design Documentation Report (DDR) would be prepared and
reviewed. Easement acquisition and utility relocations would begin upon acceptance of
the DDR, and are expected to be completed by the 1st quarter of FY 2016. Bidding and
award of a construction contract is expected in the 2nd quarter of FY 2016. Mobilization
and construction could begin in early 2016. A construction duration of 12 months is
anticipated, with project closeout in early 2017.
Boardman River Feasibility Study Cost Engineering Appendix
C-14
The project is likely to be completed as a single construction contract.
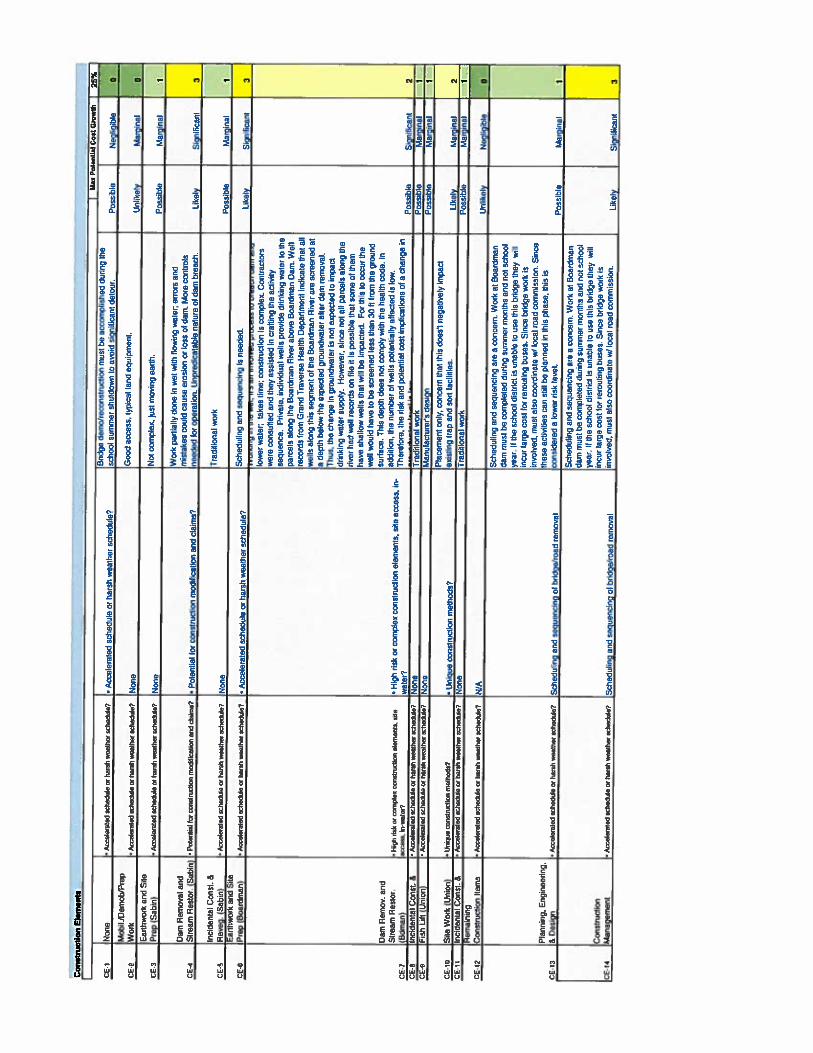
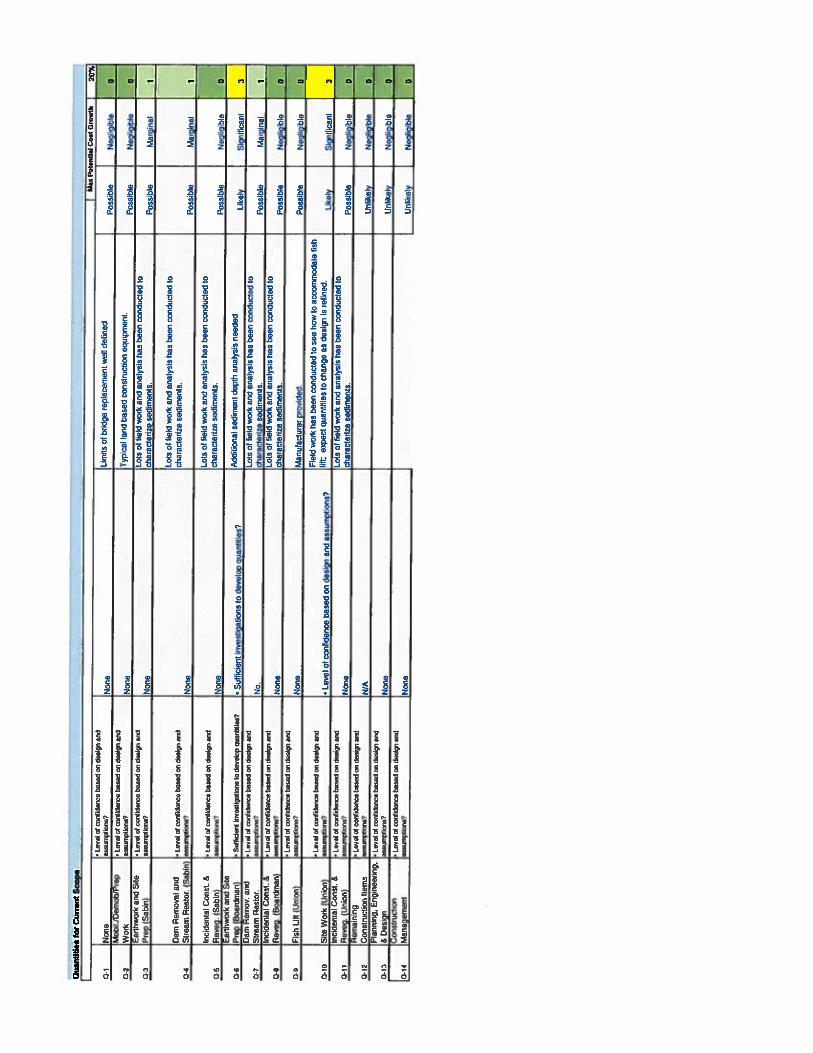
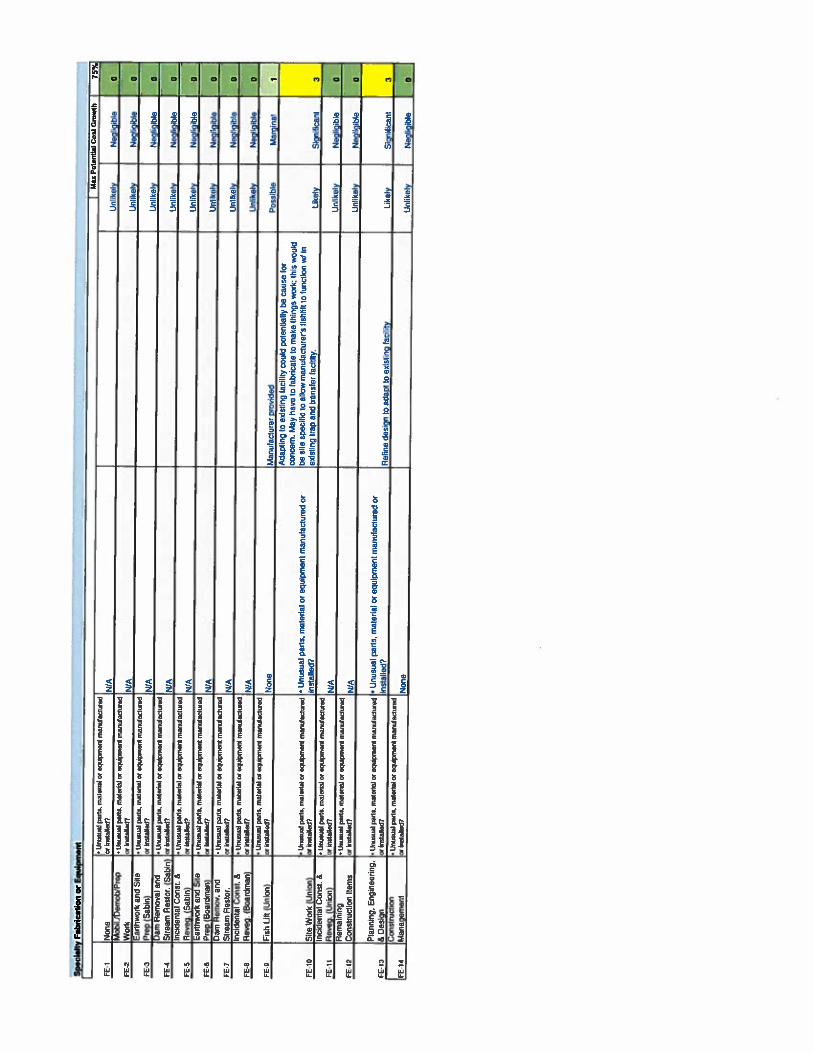
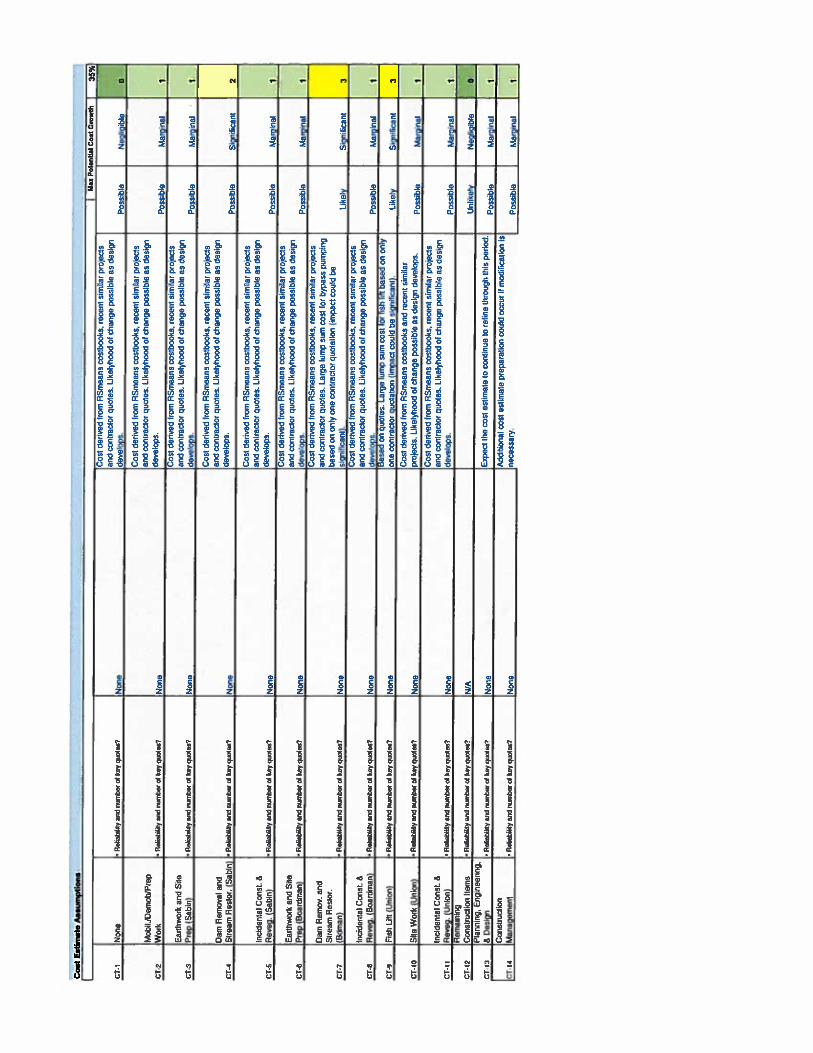
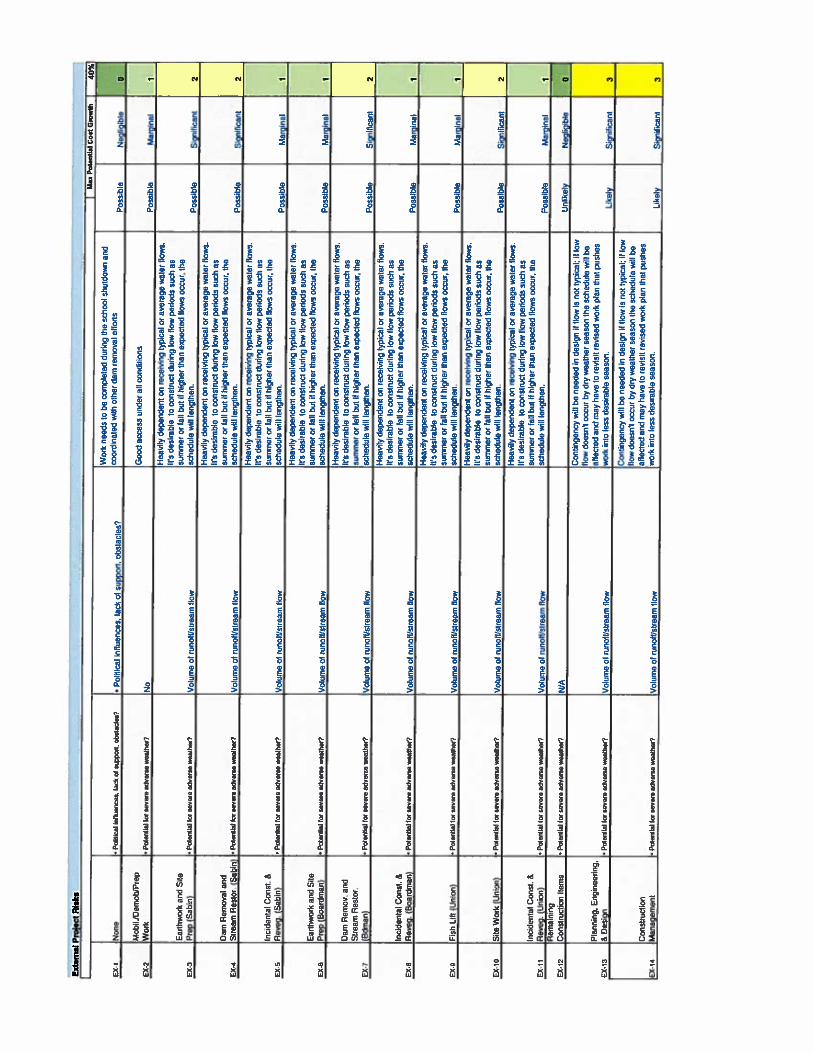
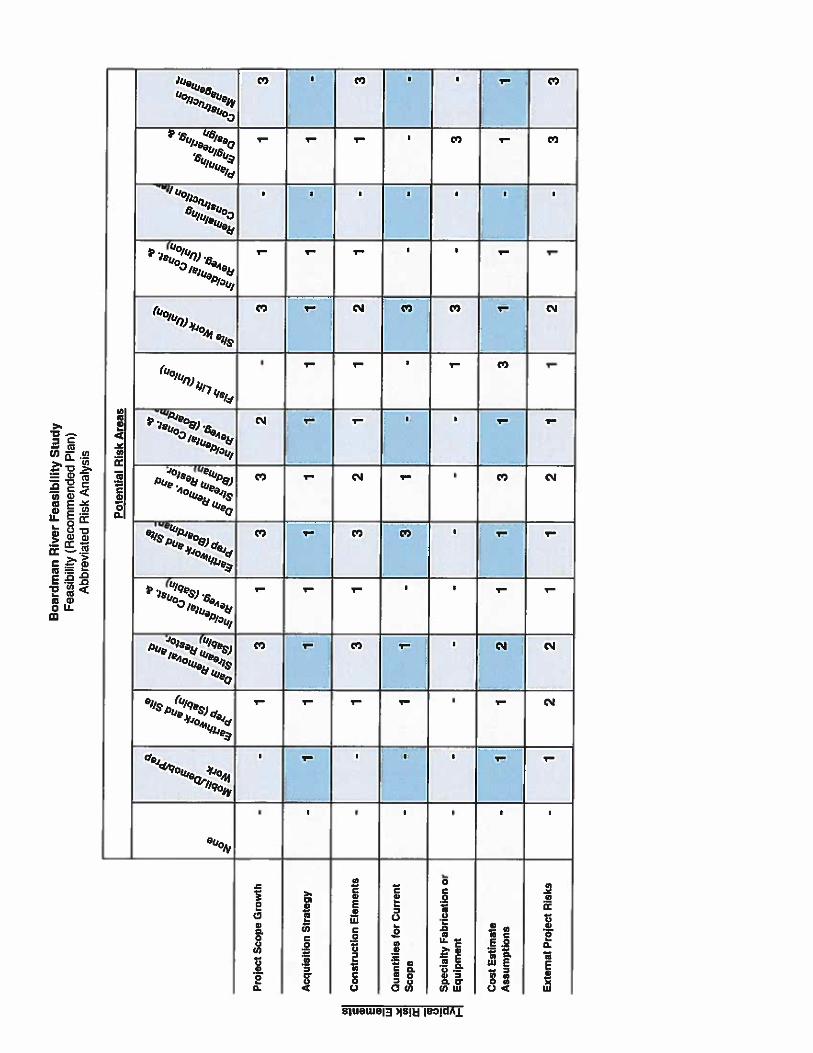
9 COST AND SCHEDULE RISK ANALYSIS
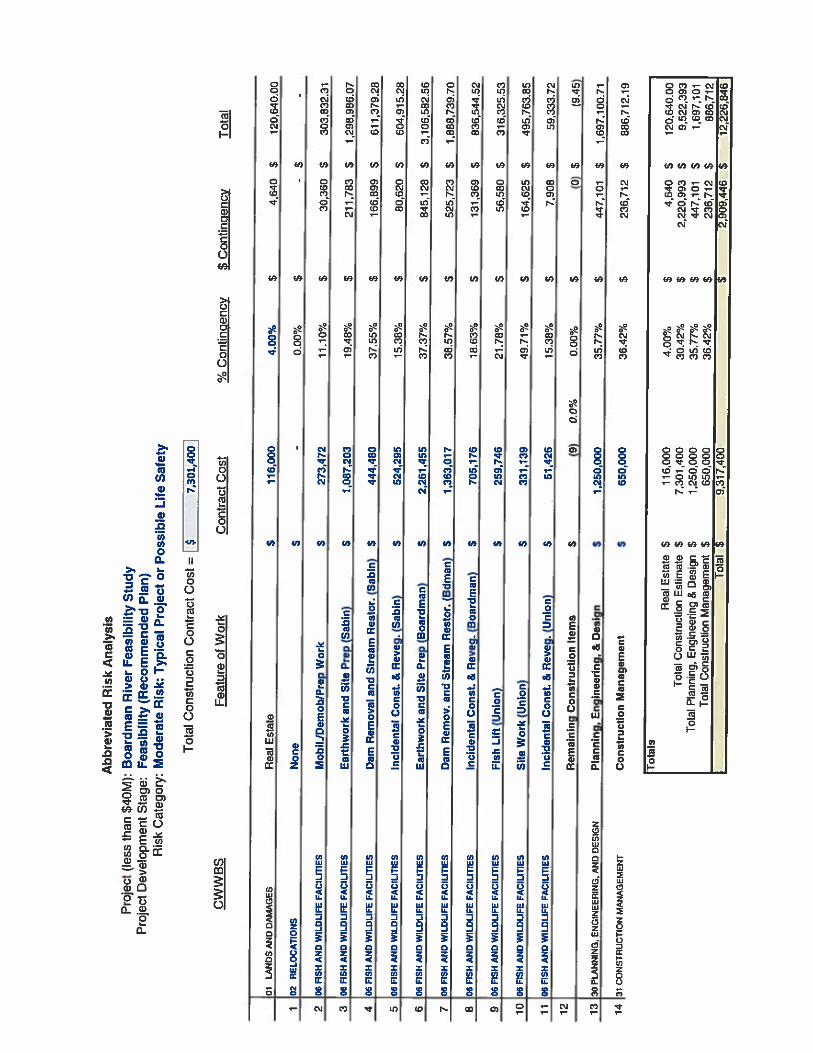
Guidance from ER 1110-2-1302, Civil Works for Cost Engineering, indicates that
construction feature contingencies for a Class 3 (Pre-Authorization Alternative Study)
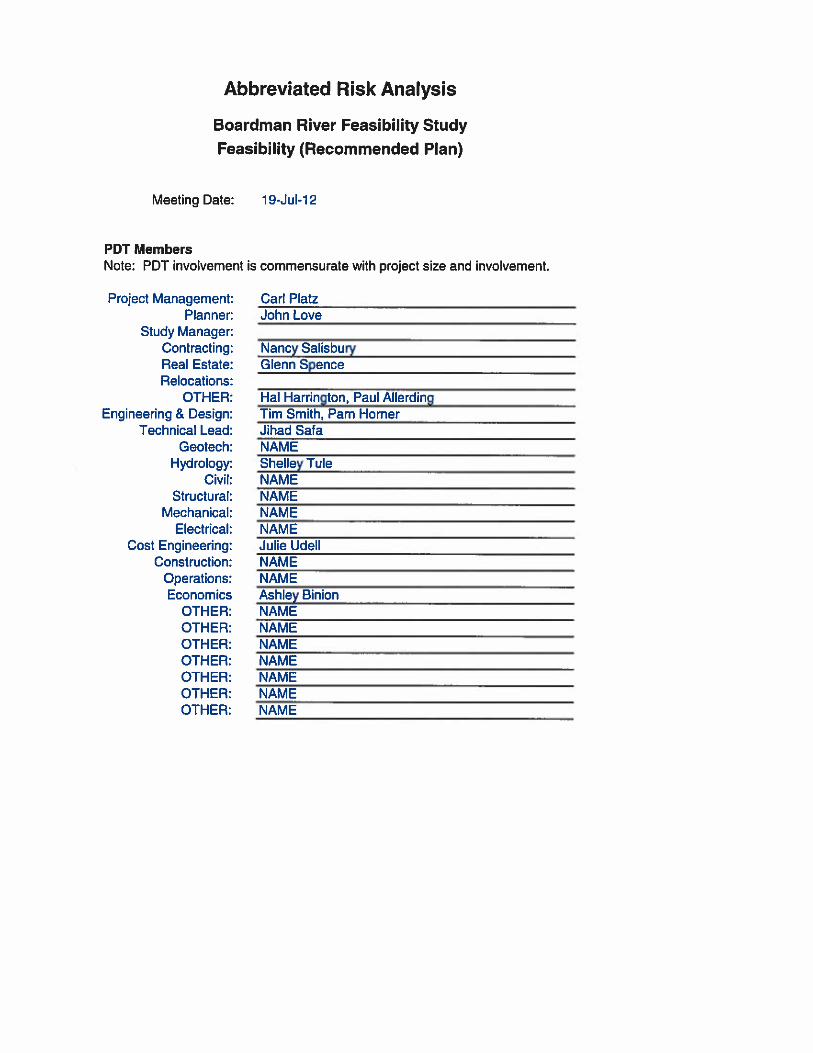
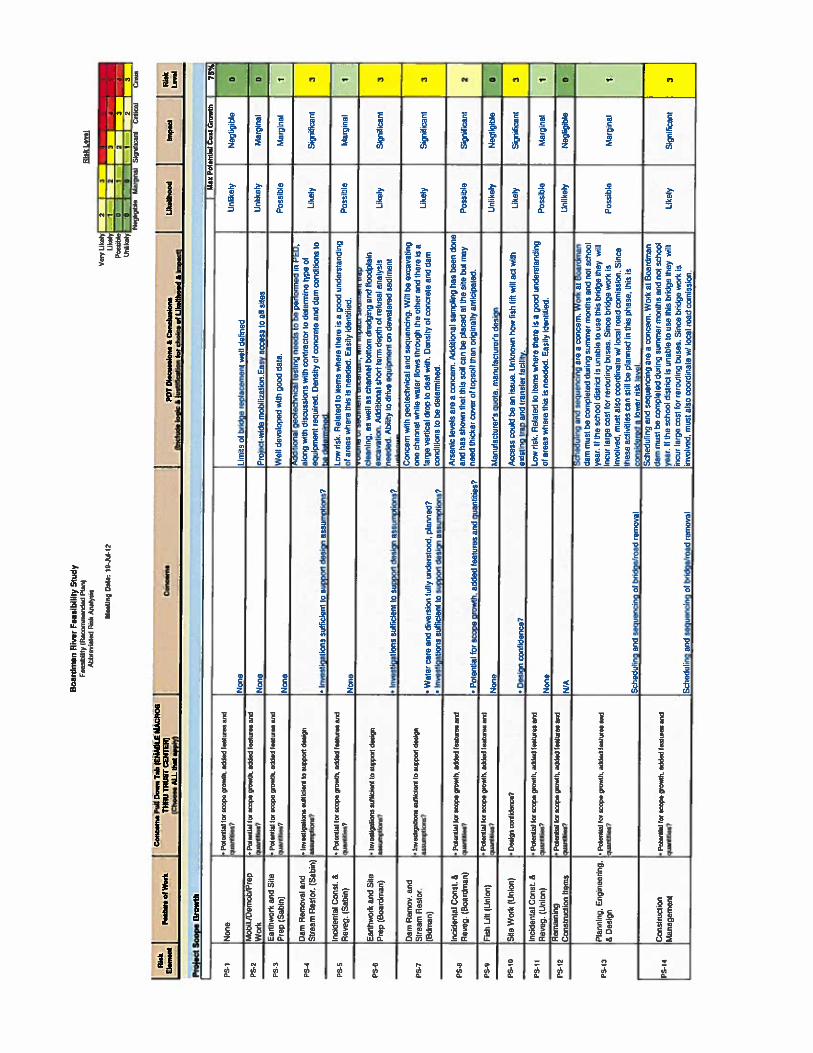
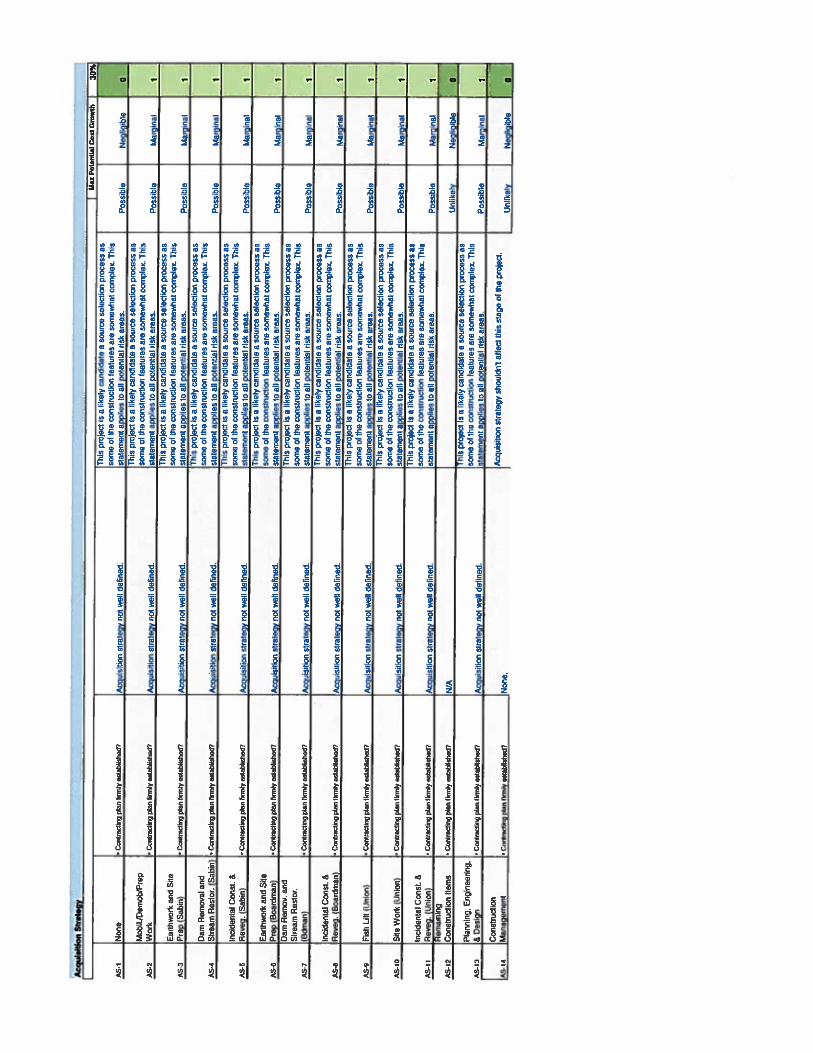
level estimate should be between 20 percent and 60 percent. An Abbreviated Risk
Analysis by the Project Delivery Team was conducted to establish the application of
contingencies to properly weigh the uncertainties associated with each major construction
cost item. The Total Project Cost Summary, described in Section 10, includes the
contingencies established through the Cost and Schedule Risk Analysis process. The
Abbreviated Risk Analysis documentation is located in Attachment 5.
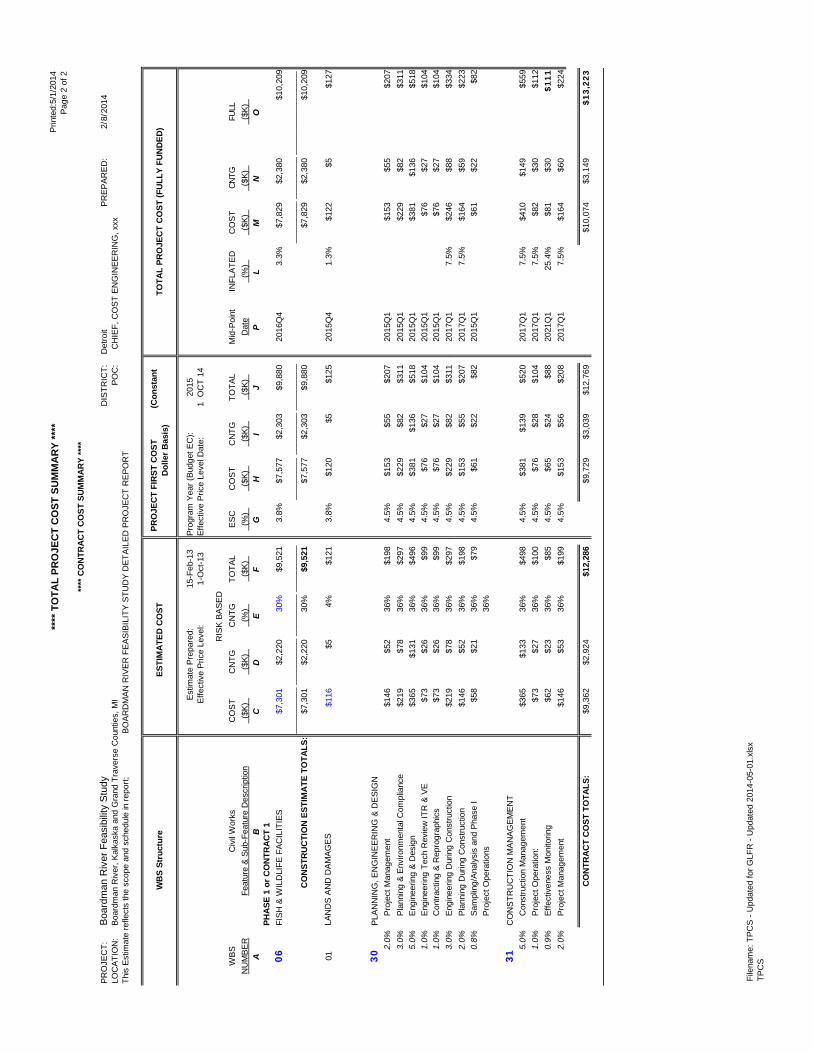
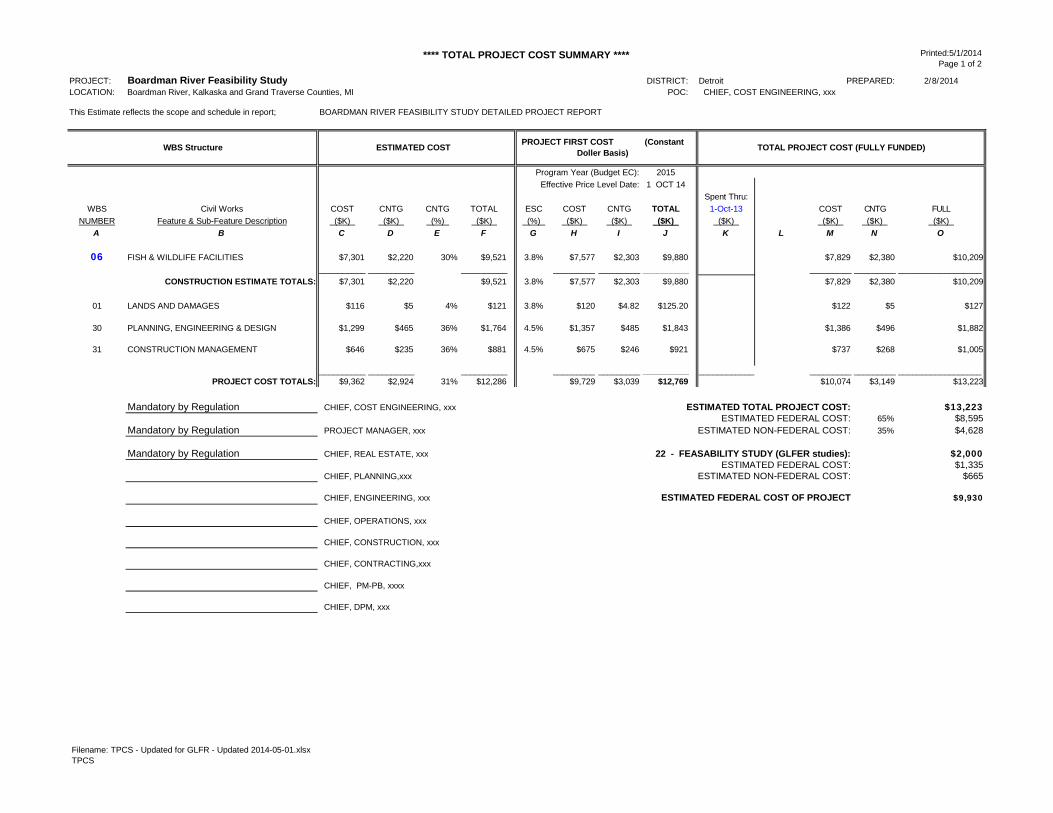
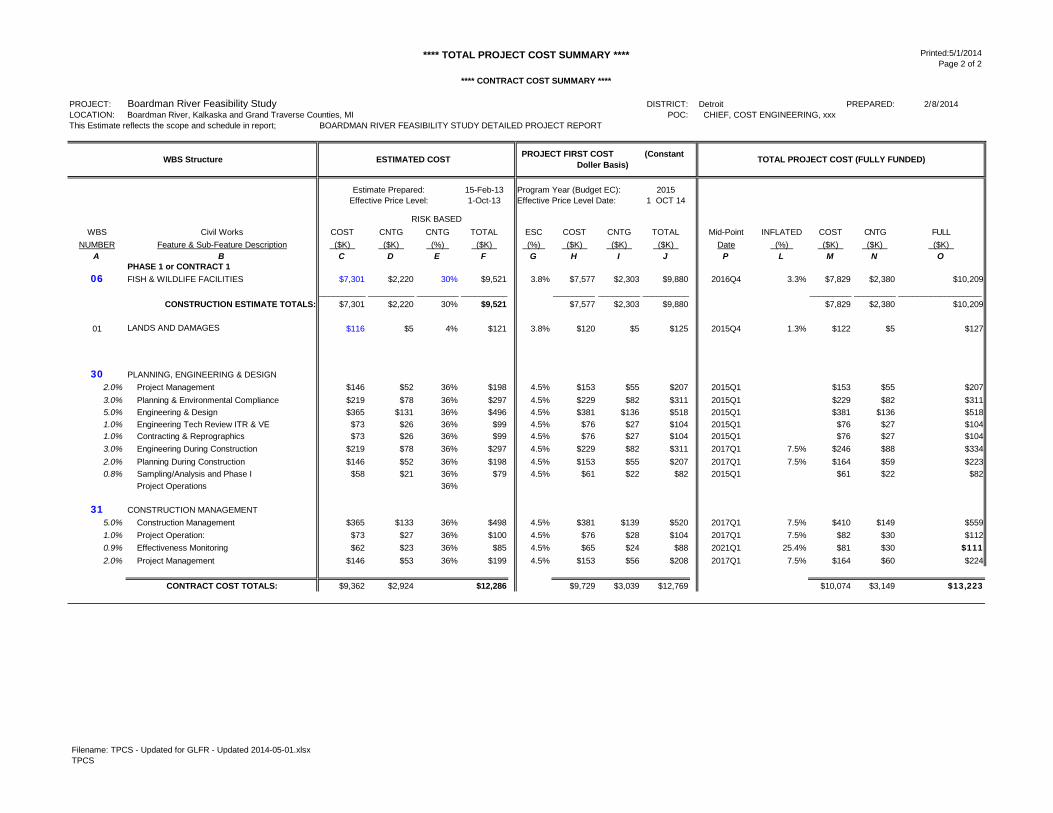
10 TOTAL PROJECT COST SUMMARY
The Total Project Cost Summary (TPCS) for the fully funded project was developed by
adding the contingency amounts (discussed above) to the initial costs, and then escalating
those costs to the midpoint of design and construction for the major components based on
the project schedule. The midpoint for PED is 1st quarter FY 2015. The construction
midpoint was assumed to occur in the 4th quarter of FY 2016.
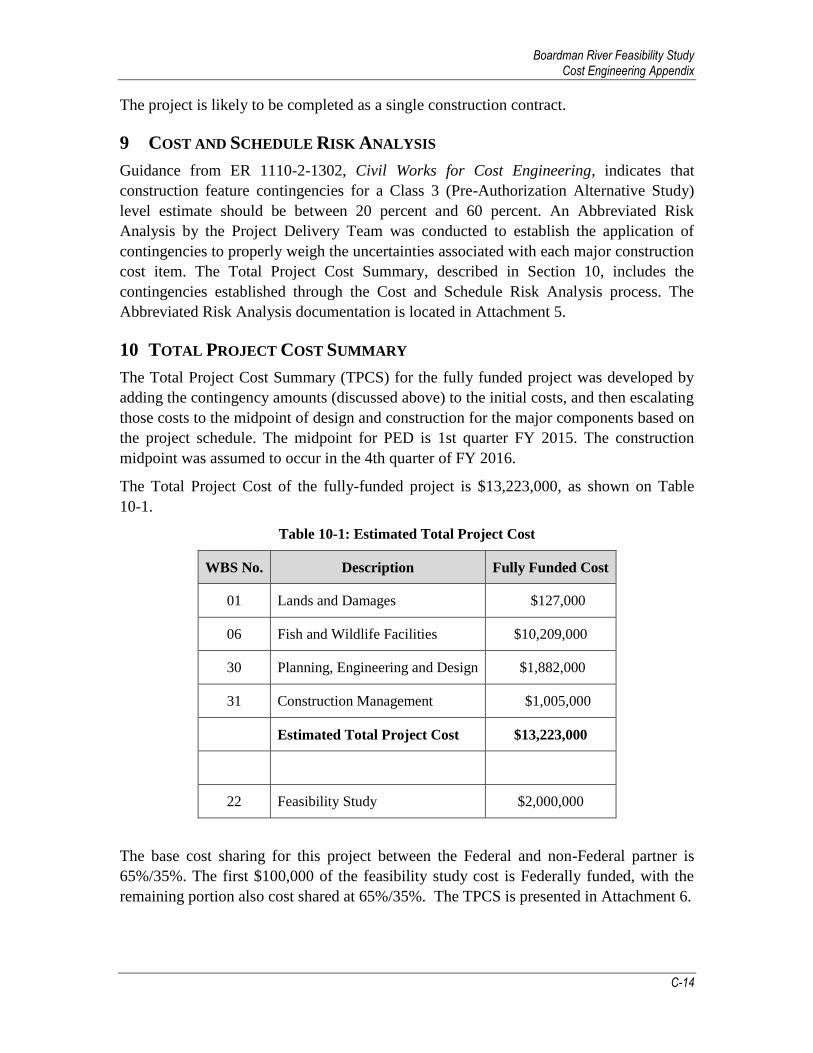
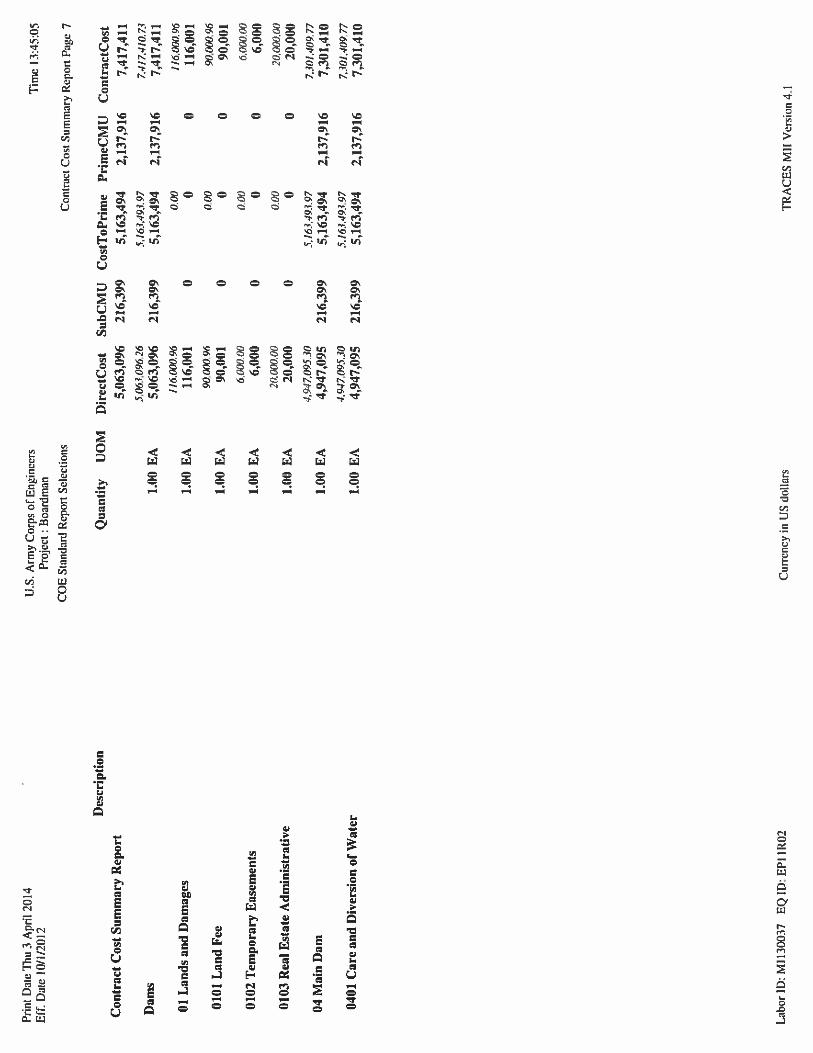
The Total Project Cost of the fully-funded project is $13,223,000, as shown on Table
10-1.
Table 10-1: Estimated Total Project Cost
WBS No. Description Fully Funded Cost
01 Lands and Damages $127,000
06 Fish and Wildlife Facilities $10,209,000
30 Planning, Engineering and Design $1,882,000
31 Construction Management $1,005,000
Estimated Total Project Cost $13,223,000
22 Feasibility Study $2,000,000
The base cost sharing for this project between the Federal and non-Federal partner is
65%/35%. The first $100,000 of the feasibility study cost is Federally funded, with the
remaining portion also cost shared at 65%/35%. The TPCS is presented in Attachment 6.
Boardman River Feasibility Study Cost Engineering Appendix
C-15
The MII cost estimate is presented in Attachment 7. Design details and quantity
documentation are presented in Attachment 8.


WALLA WALLA COST ENGINEERING MANDATORY CENTER OF EXPERTISE
COST AGENCY TECHNICAL REVIEW
CERTIFICATION STATEMENT
LRE - PN 127507 Boardman River
Section 5011 Great Lakes Fishery & Ecosystem Restoration Program
The Boardman River – Section 5011 Great Lakes Fishery & Ecosystem Restoration Project, as presented by the Detroit District, has undergone a successful Cost Agency Technical Review (Cost ATR) of remaining costs, performed by the Walla Walla District Cost Engineering Mandatory Center of Expertise (Cost MCX) team. The Cost ATR included study of the project scope, report, cost estimates, schedules, escalation, and risk-based contingencies. This certification signifies the cost products meet the quality standards as prescribed in ER 1110-2-1150 Engineering and Design for Civil Works Projects and ER 1110-2-1302 Civil Works Cost Engineering. As of April 30, 2014, the Cost MCX certifies the estimated total project cost: FY2014 First Costs: $12,769,000 Total Project Costs: $ 13,233,000 Estimated Federal Costs: $ 9,930,000 Note: Cost ATR was devoted to remaining work. It did not review spent costs, which requires an audit process. It remains the responsibility of the District to correctly reflect these cost values within the Final Report and to implement effective project management controls and implementation procedures including risk management throughout the life of the project. Kim C. Callan, PE, CCE, PM Chief, Cost Engineering MCX Walla Walla District

****
TO
TAL
PRO
JEC
T C
OST
SU
MM
AR
Y **
**Pr
inte
d:5/
1/20
14
Page
1 o
f 2
PRO
JEC
T:D
ISTR
ICT:
Det
roit
PREP
ARED
:2/
8/20
14LO
CAT
ION
:Bo
ardm
an R
iver
, Kal
kask
a an
d G
rand
Tra
vers
e C
ount
ies,
MI
POC
: C
HIE
F, C
OST
EN
GIN
EER
ING
, xxx
This
Est
imat
e re
flect
s th
e sc
ope
and
sche
dule
in re
port;
BOAR
DM
AN R
IVER
FEA
SIBI
LITY
STU
DY
DET
AILE
D P
RO
JEC
T R
EPO
RT
Prog
ram
Yea
r (Bu
dget
EC
):20
15Ef
fect
ive
Pric
e Le
vel D
ate:
1 O
CT
14
Spen
t Thr
u:W
BSC
ivil
Wor
ksC
OST
CN
TGC
NTG
TOTA
LES
CC
OST
CN
TGTO
TAL
1-O
ct-1
3C
OST
CNTG
FULL
NU
MBE
RFe
atur
e &
Sub-
Feat
ure
Des
crip
tion
($K
) (
$K)
(%
) (
$K)
(%
) (
$K)
($K
) (
$K)
($K
) (
$K)
($K
) (
$K)
AB
CD
EF
GH
IJ
KL
MN
O
06FI
SH &
WIL
DLI
FE F
ACIL
ITIE
S$7
,301
$2,2
2030
%$9
,521
3.8%
$7,5
77$2
,303
$9,8
80$7
,829
$2,3
80$1
0,20
9__
____
____
____
____
__
__
____
____
____
____
___
____
___
____
____
__
____
____
___
____
___
____
____
____
____
__C
ON
STR
UC
TIO
N E
STIM
ATE
TO
TALS
:$7
,301
$2,2
20$9
,521
3.8%
$7,5
77$2
,303
$9,8
80$7
,829
$2,3
80$1
0,20
9
01LA
ND
S AN
D D
AMAG
ES$1
16$5
4%$1
213.
8%$1
20$4
.82
$125
.20
$122
$5$1
27
30PL
ANN
ING
, EN
GIN
EER
ING
& D
ESIG
N$1
,299
$465
36%
$1,7
644.
5%$1
,357
$485
$1,8
43
$1,3
86$4
96$1
,882
31C
ON
STR
UC
TIO
N M
ANAG
EMEN
T$6
46$2
3536
%$8
814.
5%$6
75$2
46$9
21$7
37$2
68$1
,005
____
____
____
____
____
____
____
____
____
___
____
____
___
____
____
____
____
____
____
____
___
____
___
____
____
____
____
__PR
OJE
CT
CO
ST T
OTA
LS:
$9,3
62$2
,924
31%
$12,
286
$9
,729
$3,0
39$1
2,76
9$1
0,07
4$3
,149
$13,
223
Man
dato
ry b
y R
egul
atio
n C
HIE
F, C
OST
EN
GIN
EER
ING
, xxx
ESTI
MA
TED
TO
TAL
PRO
JEC
T C
OST
:$1
3,22
3E
STI
MA
TED
FE
DE
RA
L C
OS
T:65
%$8
,595
Man
dato
ry b
y R
egul
atio
n P
RO
JEC
T M
ANAG
ER, x
xx
ES
TIM
ATE
D N
ON
-FE
DE
RA
L C
OS
T:35
%$4
,628
Man
dato
ryby
Reg
ulat
ion
CH
IEF
REA
LES
TATE
xxx
22-
FEA
SAB
ILIT
YST
UD
Y(G
LFER
stud
ies)
:$2
000
Boa
rdm
an R
iver
Fea
sibi
lity
Stud
y
WB
S St
ruct
ure
ESTI
MA
TED
CO
STPR
OJE
CT
FIR
ST C
OST
(Con
stan
t D
olle
r Bas
is)
TOTA
L PR
OJE
CT
CO
ST (F
ULL
Y FU
ND
ED)
Man
dato
ry b
y R
egul
atio
n C
HIE
F, R
EAL
ESTA
TE, x
xx22
- F
EASA
BIL
ITY
STU
DY
(GLF
ER s
tudi
es):
$2,0
00E
STI
MA
TED
FE
DE
RA
L C
OS
T:$1
,335
CH
IEF,
PLA
NN
ING
,xxx
ES
TIM
ATE
D N
ON
-FE
DE
RA
L C
OS
T:$6
65
CH
IEF,
EN
GIN
EER
ING
, xxx
ESTI
MA
TED
FED
ERA
L C
OST
OF
PRO
JEC
T$
9,9
30
CH
IEF,
OPE
RAT
ION
S, x
xx
CH
IEF,
CO
NST
RU
CTI
ON
, xxx
CH
IEF,
CO
NTR
ACTI
NG
,xxx
CH
IEF,
PM
-PB,
xxx
x
CH
IEF,
DPM
, xxx
File
nam
e: T
PCS
- Upd
ated
for G
LFR
- U
pdat
ed 2
014-
05-0
1.xl
sxTP
CS
****
TO
TAL
PRO
JEC
T C
OST
SU
MM
AR
Y **
**Pr
inte
d:5/
1/20
14
Page
2 o
f 2
****
CO
NTR
AC
T C
OST
SU
MM
AR
Y **
**
PRO
JEC
T:D
ISTR
ICT:
Det
roit
PREP
ARED
:2/
8/20
14LO
CAT
ION
:Bo
ardm
an R
iver
, Kal
kask
a an
d G
rand
Tra
vers
e C
ount
ies,
MI
POC
: C
HIE
F, C
OST
EN
GIN
EER
ING
, xxx
This
Est
imat
e re
flect
s th
e sc
ope
and
sche
dule
in re
port;
BOAR
DM
AN R
IVER
FEA
SIBI
LITY
STU
DY
DET
AILE
D P
RO
JEC
T R
EPO
RT
15-F
eb-1
3Pr
ogra
m Y
ear (
Budg
et E
C):
2015
1-
Oct
-13
Effe
ctiv
e Pr
ice
Leve
l Dat
e:1
OC
T 14
RIS
K BA
SED
W
BSC
ivil
Wor
ksC
OST
CN
TGC
NTG
TOTA
LES
CC
OST
CN
TGTO
TAL
Mid
-Poi
ntIN
FLAT
EDC
OST
CNTG
FULL
NU
MBE
RFe
atur
e &
Sub-
Feat
ure
Des
crip
tion
($K
) (
$K)
(%
) (
$K)
(%
) (
$K)
($K
) (
$K)
Dat
e (
%)
($K
) (
$K)
($K
) A
BC
DE
FG
HI
JP
LM
NO
PHA
SE 1
or C
ON
TRA
CT
106
FISH
& W
ILD
LIFE
FAC
ILIT
IES
$7,3
01$2
,220
30%
$9,5
213.
8%$7
,577
$2,3
03$9
,880
2016
Q4
3.3%
$7,8
29$2
,380
$10,
209
____
____
____
____
____
____
____
___
____
____
____
____
___
____
___
____
____
____
____
___
____
____
___
____
____
____
____
CO
NST
RU
CTI
ON
EST
IMA
TE T
OTA
LS:
$7,3
01$2
,220
30%
$9,5
21$7
,577
$2,3
03$9
,880
$7,8
29$2
,380
$10,
209
01LA
ND
S AN
D D
AMAG
ES$1
16$5
4%$1
213.
8%$1
20$5
$125
2015
Q4
1.3%
$122
$5$1
27
30PL
ANN
ING
, EN
GIN
EER
ING
& D
ESIG
N2.
0%
Pro
ject
Man
agem
ent
$146
$52
36%
$198
4.5%
$153
$55
$207
2015
Q1
$153
$55
$207
3.0%
P
lann
ing
& En
viro
nmen
tal C
ompl
ianc
e$2
19$7
836
%$2
974.
5%$2
29$8
2$3
1120
15Q
1$2
29$8
2$3
115.
0%
Eng
inee
ring
& D
esig
n $3
65$1
3136
%$4
964.
5%$3
81$1
36$5
1820
15Q
1$3
81$1
36$5
181.
0%
Eng
inee
ring
Tech
Rev
iew
ITR
& V
E$7
3$2
636
%$9
94.
5%$7
6$2
7$1
0420
15Q
1$7
6$2
7$1
041.
0%
Con
tract
ing
& R
epro
grap
hics
$73
$26
36%
$99
4.5%
$76
$27
$104
2015
Q1
$76
$27
$104
3.0%
E
ngin
eerin
g D
urin
g C
onst
ruct
ion
$219
$78
36%
$297
4.5%
$229
$82
$311
2017
Q1
7.5%
$246
$88
$334
PRO
JEC
T FI
RST
CO
ST
(C
onst
ant
Dol
ler B
asis
)
Estim
ate
Prep
ared
:Ef
fect
ive
Pric
e Le
vel:
Boa
rdm
an R
iver
Fea
sibi
lity
Stu
dy
ESTI
MA
TED
CO
STW
BS
Stru
ctur
eTO
TAL
PRO
JEC
T C
OST
(FU
LLY
FUN
DED
)
2.0%
P
lann
ing
Dur
ing
Con
stru
ctio
n$1
46$5
236
%$1
984.
5%$1
53$5
5$2
0720
17Q
17.
5%$1
64$5
9$2
230.
8%
Sam
plin
g/An
alys
is a
nd P
hase
I$5
8$2
136
%$7
94.
5%$6
1$2
2$8
220
15Q
1$6
1$2
2$8
2
Pro
ject
Ope
ratio
ns36
%
31C
ON
STR
UC
TIO
N M
ANAG
EMEN
T5.
0%
Con
stru
ctio
n M
anag
emen
t$3
65$1
3336
%$4
984.
5%$3
81$1
39$5
2020
17Q
17.
5%$4
10$1
49$5
591.
0%
Pro
ject
Ope
ratio
n:$7
3$2
736
%$1
004.
5%$7
6$2
8$1
0420
17Q
17.
5%$8
2$3
0$1
120.
9%
Effe
ctiv
enes
s M
onito
ring
$62
$23
36%
$85
4.5%
$65
$24
$88
2021
Q1
25.4
%$8
1$3
0$
11
12.
0%
Pro
ject
Man
agem
ent
$146
$53
36%
$199
4.5%
$153
$56
$208
2017
Q1
7.5%
$164
$60
$224
CO
NTR
AC
T C
OST
TO
TALS
:$9
,362
$2,9
24$1
2,28
6$9
,729
$3,0
39$1
2,76
9$1
0,07
4$3
,149
$1
3,2
23
File
nam
e: T
PCS
- Upd
ated
for G
LFR
- U
pdat
ed 2
014-
05-0
1.xl
sxTP
CS


WALLA WALLA COST ENGINEERING MANDATORY CENTER OF EXPERTISE
COST AGENCY TECHNICAL REVIEW
CERTIFICATION STATEMENT
LRE - PN 127507 Boardman River
Section 5011 Great Lakes Fishery & Ecosystem Restoration Program
The Boardman River – Section 5011 Great Lakes Fishery & Ecosystem Restoration Project, as presented by the Detroit District, has undergone a successful Cost Agency Technical Review (Cost ATR) of remaining costs, performed by the Walla Walla District Cost Engineering Mandatory Center of Expertise (Cost MCX) team. The Cost ATR included study of the project scope, report, cost estimates, schedules, escalation, and risk-based contingencies. This certification signifies the cost products meet the quality standards as prescribed in ER 1110-2-1150 Engineering and Design for Civil Works Projects and ER 1110-2-1302 Civil Works Cost Engineering. As of April 30, 2014, the Cost MCX certifies the estimated total project cost: FY2014 First Costs: $12,769,000 Total Project Costs: $ 13,233,000 Estimated Federal Costs: $ 9,930,000 Note: Cost ATR was devoted to remaining work. It did not review spent costs, which requires an audit process. It remains the responsibility of the District to correctly reflect these cost values within the Final Report and to implement effective project management controls and implementation procedures including risk management throughout the life of the project. Kim C. Callan, PE, CCE, PM Chief, Cost Engineering MCX Walla Walla District
**** TOTAL PROJECT COST SUMMARY **** Printed:5/1/2014 Page 1 of 2
PROJECT: DISTRICT: Detroit PREPARED: 2/8/2014LOCATION: Boardman River, Kalkaska and Grand Traverse Counties, MI POC: CHIEF, COST ENGINEERING, xxx
This Estimate reflects the scope and schedule in report; BOARDMAN RIVER FEASIBILITY STUDY DETAILED PROJECT REPORT
Program Year (Budget EC): 2015Effective Price Level Date: 1 OCT 14
Spent Thru:WBS Civil Works COST CNTG CNTG TOTAL ESC COST CNTG TOTAL 1-Oct-13 COST CNTG FULL
NUMBER Feature & Sub-Feature Description ($K) ($K) (%) ($K) (%) ($K) ($K) ($K) ($K) ($K) ($K) ($K) A B C D E F G H I J K L M N O
06 FISH & WILDLIFE FACILITIES $7,301 $2,220 30% $9,521 3.8% $7,577 $2,303 $9,880 $7,829 $2,380 $10,209__________ __________ __________ _________ _________ __________ _________ _________ __________________
CONSTRUCTION ESTIMATE TOTALS: $7,301 $2,220 $9,521 3.8% $7,577 $2,303 $9,880 $7,829 $2,380 $10,209
01 LANDS AND DAMAGES $116 $5 4% $121 3.8% $120 $4.82 $125.20 $122 $5 $127
30 PLANNING, ENGINEERING & DESIGN $1,299 $465 36% $1,764 4.5% $1,357 $485 $1,843 $1,386 $496 $1,882
31 CONSTRUCTION MANAGEMENT $646 $235 36% $881 4.5% $675 $246 $921 $737 $268 $1,005
__________ __________ __________ _________ _________ __________ ____________ _________ _________ __________________PROJECT COST TOTALS: $9,362 $2,924 31% $12,286 $9,729 $3,039 $12,769 $10,074 $3,149 $13,223
Mandatory by Regulation CHIEF, COST ENGINEERING, xxx ESTIMATED TOTAL PROJECT COST: $13,223ESTIMATED FEDERAL COST: 65% $8,595
Mandatory by Regulation PROJECT MANAGER, xxx ESTIMATED NON-FEDERAL COST: 35% $4,628
Mandatory by Regulation CHIEF REAL ESTATE xxx 22 - FEASABILITY STUDY (GLFER studies): $2 000
Boardman River Feasibility Study
WBS Structure ESTIMATED COST PROJECT FIRST COST (Constant Doller Basis) TOTAL PROJECT COST (FULLY FUNDED)
Mandatory by Regulation CHIEF, REAL ESTATE, xxx 22 - FEASABILITY STUDY (GLFER studies): $2,000ESTIMATED FEDERAL COST: $1,335
CHIEF, PLANNING,xxx ESTIMATED NON-FEDERAL COST: $665
CHIEF, ENGINEERING, xxx ESTIMATED FEDERAL COST OF PROJECT $9,930
CHIEF, OPERATIONS, xxx
CHIEF, CONSTRUCTION, xxx
CHIEF, CONTRACTING,xxx
CHIEF, PM-PB, xxxx
CHIEF, DPM, xxx
Filename: TPCS - Updated for GLFR - Updated 2014-05-01.xlsxTPCS
**** TOTAL PROJECT COST SUMMARY **** Printed:5/1/2014 Page 2 of 2
**** CONTRACT COST SUMMARY ****
PROJECT: DISTRICT: Detroit PREPARED: 2/8/2014LOCATION: Boardman River, Kalkaska and Grand Traverse Counties, MI POC: CHIEF, COST ENGINEERING, xxxThis Estimate reflects the scope and schedule in report; BOARDMAN RIVER FEASIBILITY STUDY DETAILED PROJECT REPORT
15-Feb-13 Program Year (Budget EC): 2015 1-Oct-13 Effective Price Level Date: 1 OCT 14
RISK BASED WBS Civil Works COST CNTG CNTG TOTAL ESC COST CNTG TOTAL Mid-Point INFLATED COST CNTG FULL
NUMBER Feature & Sub-Feature Description ($K) ($K) (%) ($K) (%) ($K) ($K) ($K) Date (%) ($K) ($K) ($K) A B C D E F G H I J P L M N O
PHASE 1 or CONTRACT 106 FISH & WILDLIFE FACILITIES $7,301 $2,220 30% $9,521 3.8% $7,577 $2,303 $9,880 2016Q4 3.3% $7,829 $2,380 $10,209
__________ __________ _________ __________ _________ _________ __________ _________ _________ __________________CONSTRUCTION ESTIMATE TOTALS: $7,301 $2,220 30% $9,521 $7,577 $2,303 $9,880 $7,829 $2,380 $10,209
01 LANDS AND DAMAGES $116 $5 4% $121 3.8% $120 $5 $125 2015Q4 1.3% $122 $5 $127
30 PLANNING, ENGINEERING & DESIGN2.0% Project Management $146 $52 36% $198 4.5% $153 $55 $207 2015Q1 $153 $55 $2073.0% Planning & Environmental Compliance $219 $78 36% $297 4.5% $229 $82 $311 2015Q1 $229 $82 $3115.0% Engineering & Design $365 $131 36% $496 4.5% $381 $136 $518 2015Q1 $381 $136 $5181.0% Engineering Tech Review ITR & VE $73 $26 36% $99 4.5% $76 $27 $104 2015Q1 $76 $27 $1041.0% Contracting & Reprographics $73 $26 36% $99 4.5% $76 $27 $104 2015Q1 $76 $27 $1043.0% Engineering During Construction $219 $78 36% $297 4.5% $229 $82 $311 2017Q1 7.5% $246 $88 $334
PROJECT FIRST COST (Constant Doller Basis)
Estimate Prepared:Effective Price Level:
Boardman River Feasibility Study
ESTIMATED COSTWBS Structure TOTAL PROJECT COST (FULLY FUNDED)
2.0% Planning During Construction $146 $52 36% $198 4.5% $153 $55 $207 2017Q1 7.5% $164 $59 $2230.8% Sampling/Analysis and Phase I $58 $21 36% $79 4.5% $61 $22 $82 2015Q1 $61 $22 $82
Project Operations 36%
31 CONSTRUCTION MANAGEMENT5.0% Construction Management $365 $133 36% $498 4.5% $381 $139 $520 2017Q1 7.5% $410 $149 $5591.0% Project Operation: $73 $27 36% $100 4.5% $76 $28 $104 2017Q1 7.5% $82 $30 $1120.9% Effectiveness Monitoring $62 $23 36% $85 4.5% $65 $24 $88 2021Q1 25.4% $81 $30 $1112.0% Project Management $146 $53 36% $199 4.5% $153 $56 $208 2017Q1 7.5% $164 $60 $224
CONTRACT COST TOTALS: $9,362 $2,924 $12,286 $9,729 $3,039 $12,769 $10,074 $3,149 $13,223
Filename: TPCS - Updated for GLFR - Updated 2014-05-01.xlsxTPCS
Recommended