i
Extraction and characterization of microalgae proteins from
the extremophile Dunaliella
Diana Isabel Costa Gomes
Thesis to obtain the Master of Science Degree in
Biological Engineering
Supervisors: Professor Marília Clemente Velez Mateus
Doctor Sara Martins Badenes
Examination Committee
Chairperson: Professor Maria Ângela Cabral Garcia Taipa Meneses de Oliveira
Supervisor: Professor Marília Clemente Velez Mateus
Members of the Committee: Professor Ana Margarida Nunes da Mata Pires de Azevedo
November 2017

i
Acknowledgements
I would like to express my gratitude towards my supervisors, Professor Marília Mateus and Doctor Sara
Badenes, for all the support, guidance and knowledge that they gave me during the development of this
thesis and for all the time dispended discussing the results obtained and the next steps.
I would also like to thank to all members of A4F, specially my laboratory colleges, for sharing their
knowledge with me, helping me solving problems, making me feel comfortable and a part of the team.
To my colleges at IST laboratory, for all the help and orientation that they gave me.
To my boyfriend, for being always on my side, supporting me in my bad days and helping me moving
forward and also to my closest friends for all the good moments that we construct together.
A special thanks to my parents and my brother for their constant presence, for loving me, for all the
support along these years and for giving me the opportunity to follow my dreams.
ii
Resumo
As proteínas enquanto componentes de microalgas unicelulares têm sido utilizadas no sector da
alimentação saudável e como alimento de aquacultura, devido à presença de todos os aminoácidos
essenciais. Contudo, podem ter várias aplicações biotecnológicas, em áreas como alimentar e
farmacêutica, como proteínas funcionais (e.g. agentes de emulsão e gelificação) e como fonte de enzimas
importantes, como a glicerol-3-fosfato desidrogenase.
O objetivo deste trabalho foi promover a acumulação de proteínas – enzimas do ciclo do glicerol,
anidrase carbónica e enzimas antioxidantes – na microalga Dunaliella sp., através da aplicação de três
condições de stress – stress salino, pH e oxidativo, respetivamente – e também caracterizar e fracionar os
extratos proteicos.
A caracterização dos extratos proteicos (por quantificação de proteínas e 2D-PAGE) revelou que a maior
alteração no perfil de expressão proteico ocorreu quando as células foram expostas ao stress salino. Entre
as proteínas sobrexpressas estava a glicerol-3-fosfato desidrogenase, responsável pela produção de
glicerol durante a resposta osmótica de Dunaliella ao ambiente hipersalino. Devido às várias aplicações
desta enzima (e.g. biossensor em diagnóstico clinico e na monitorização da produção de glicerol durante a
fermentação do vinho), foram realizados ensaios de fracionamento para a sua obtenção numa única fração.
A utilização de cromatografia de troca aniónica, com ligandos DEAE, provou a sua aplicação como primeiro
passo na purificação da enzima glicerol-3-fosfato desidrogenase. Iniciou-se ainda o estudo de uma
propriedade funcional – capacidade de gelificação das proteínas da fração flow-through da coluna
cromatográfica. Os resultados mostraram a sua capacidade de agregação induzida pelo calor.
Palavras-chave: capacidade de gelificação, caracterização de proteínas, Dunaliella sp., extração proteínas
de microalgas, fracionamento cromatográfico, glicerol-3-fosfato desidrogenase.
iii
Abstract
Microalgae proteins, in the form of single-cell protein, have been used in the health food sector and as
aquaculture feed, due to the presence of all essential amino acids. However, they can be used in several
biotechnological applications, in areas as food and pharmaceuticals, as functional proteins (e.g. emulsifying
and gelation agents) and as a source of important enzymes, like glycerol-3-phosphate dehydrogenase.
This work aimed at enhancing the accumulation of proteins – glycerol cycle enzymes, carbonic
anhydrase and antioxidant enzymes – in the microalgae Dunaliella sp. through the application of three stress
strategies – salt, pH and oxidative stress, respectively – and further characterize and fractionate the protein
extracts obtained from them.
The characterization of the protein extracts (by protein quantification and 2D-PAGE) revealed that the
biggest change in the protein expression profile occurred when cells were exposed to salt stress. Between
the proteins overexpressed was glycerol-3-phosphate dehydrogenase, responsible for the production of
glycerol during the osmotic response of Dunaliella to a hypersaline environment. Due to the several possible
applications of this enzyme (e.g. biosensor in clinical diagnosis and in the monitoring of glycerol production
during wine fermentation), fractionation assays were performed to obtain it in a single fraction. The use of
an anion exchange chromatography, with DEAE ligands, prove its applicability as a first step in the
purification of glycerol-3-phosphate dehydrogenase. The study of a functionality property was initiated – the
gelation capacity of the flow-through protein fraction from the chromatographic column. The results showed
its heat-induced aggregation capacity.
Keywords: chromatographic fractionation, Dunaliella sp., gelation capacity, glycerol-3-phosphate
dehydrogenase, microalgae protein extraction, protein characterization.
iv
Index
Acknowledgements .............................................................................................................................. i
Resumo ............................................................................................................................................... ii
Abstract .............................................................................................................................................. iii
List of Tables ..................................................................................................................................... vii
List of Equations ................................................................................................................................ vii
List of Figures ................................................................................................................................... viii
List of Abbreviations ............................................................................................................................ xi
1. Introduction............................................................................................................................... 1
1.1. Biotechnological Applications of Proteins .............................................................................. 1
1.1.1. Diagnostic/ Analytical Purposes..................................................................................... 1
1.1.2. Biocatalysts ................................................................................................................... 2
1.1.3. Functional Properties .................................................................................................... 2
1.2. Sources of Proteins............................................................................................................... 4
1.3. Microalgae Proteins .............................................................................................................. 4
1.4. Dunaliella sp. ........................................................................................................................ 5
1.4.1. Morphological Characteristics ........................................................................................ 6
1.4.2. Growth Requirements ................................................................................................... 6
1.4.3. Adaptation to Osmotic Changes .................................................................................... 7
1.4.4. Production of β-carotene ............................................................................................... 8
1.4.5. Biotechnological Applications ........................................................................................ 9
1.5. Expression of Proteins under Stress ................................................................................... 10
1.5.1. Antioxidant Enzymes ................................................................................................... 10
1.5.2. Carbonic Anhydrase .................................................................................................... 11
1.5.3. Glycerol Cycle Enzymes .............................................................................................. 11
2. Materials and Methods ............................................................................................................ 14
2.1. Cultivation of Dunaliella sp. ................................................................................................. 15
2.1.1. Control Culture and Inoculum ...................................................................................... 15
2.1.2. Salt Stress Culture ...................................................................................................... 15
v
2.1.3. pH Stress Culture ........................................................................................................ 16
2.1.4. Oxidative Stress Culture .............................................................................................. 16
2.1.5. Induction Culture ......................................................................................................... 16
2.2. Estimation of Cell Number................................................................................................... 17
2.3. Protein Extraction ............................................................................................................... 17
2.3.1. Mechanical Cell Rupture ............................................................................................. 17
2.3.2. Osmotic Shock ............................................................................................................ 17
2.4. Microdialysis ....................................................................................................................... 18
2.5. Quantification of Proteins .................................................................................................... 18
2.6. 2D Polyacrylamide Gel Electrophoresis (2D-PAGE) ............................................................ 19
2.6.1. Precipitation of Proteins............................................................................................... 19
2.6.2. Isoelectric Focusing..................................................................................................... 19
2.6.3. SDS-PAGE ................................................................................................................. 19
2.6.4. Gel Staining, Scanning and Analysis ........................................................................... 20
2.7. Protein Fractionation ........................................................................................................... 20
2.7.1. Concentration of Protein Samples ............................................................................... 21
2.7.2. Anion Exchange Chromatography ............................................................................... 21
2.7.3. SDS-PAGE ................................................................................................................. 22
2.8. Acid Gelation ...................................................................................................................... 23
2.9. Statistical Analysis .............................................................................................................. 23
3. Results and Discussion ........................................................................................................... 24
3.1. Cellular Growth ................................................................................................................... 24
3.2. Protein Content of Dunaliella sp. ......................................................................................... 26
3.2.1. Development of a Protein Quantification Method ......................................................... 26
3.2.2. Adequacy of the Protein Quantification Method ........................................................... 27
3.2.3. Protein Content from Salt Stress Culture ..................................................................... 28
3.2.4. Protein Content from pH Stress Culture ....................................................................... 30
3.2.5. Protein Content from Oxidative Stress Culture ............................................................. 31
3.2.6. Protein Content from Control and Induction Cultures ................................................... 32
vi
3.3. Characterization of Protein Samples by 2D-PAGE .............................................................. 33
3.3.1. Salt Stress Characterization ........................................................................................ 33
3.3.2. pH Stress Characterization .......................................................................................... 36
3.3.3. Oxidative Stress Characterization ................................................................................ 37
3.4. Fractionation of Protein Extracts – Anion Exchange Chromatography.................................. 39
3.4.1. Linear Elution .............................................................................................................. 40
3.4.2. Step Elution ................................................................................................................ 41
3.4.3. Characterization of Elution Peak P1 from 2L Fractionation Assay ................................ 43
3.4.4. Summary of Fractionation Assays ............................................................................... 44
3.5. Acid Gelation ...................................................................................................................... 45
4. Conclusions ............................................................................................................................ 48
5. References ............................................................................................................................. 50
6. Attachments ........................................................................................................................... 53
vii
List of Tables
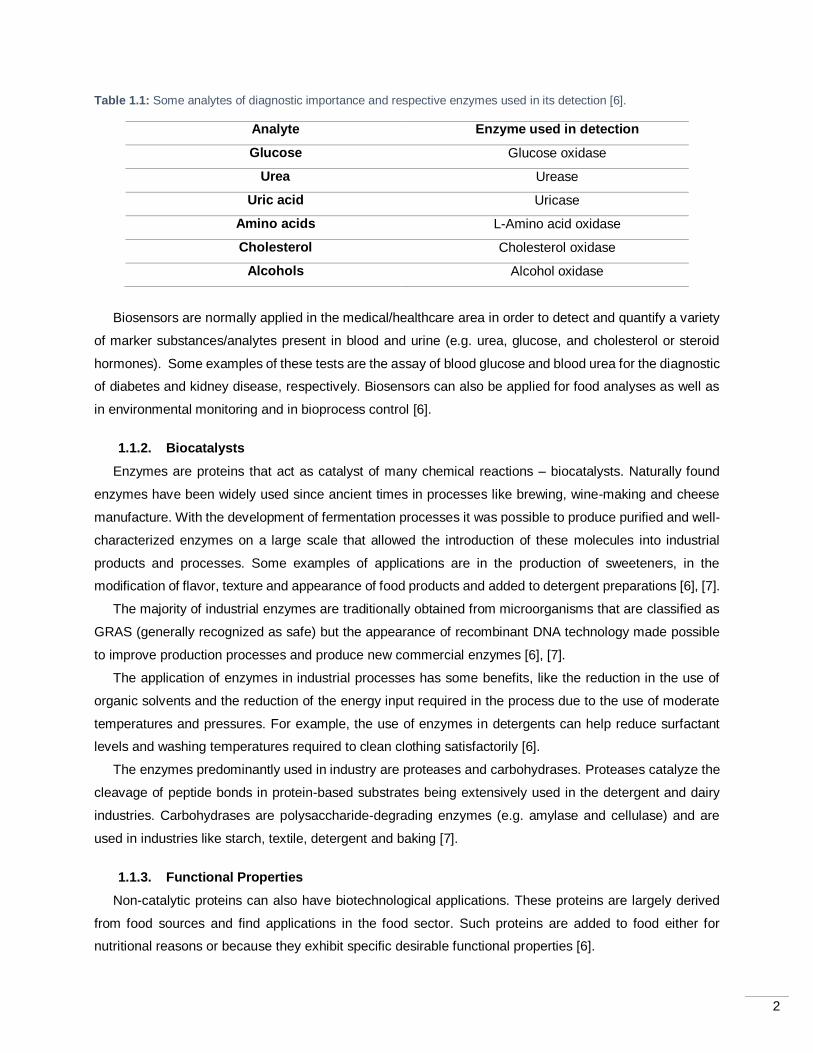
Table 1.1: Some analytes of diagnostic importance and respective enzymes used in its detection [6]. . 2
Table 1.2: General composition of different microalgae (% of dry weight) [5]. ...................................... 5
Table 1.3: Comparison of the G3PDH enzyme productivities obtained for each organism. ................ 13
Table 2.1: Description of the main reagents used in the experiments. ............................................... 14
Table 3.1: Protein content obtained from fresh control cultures of Dunaliella using different extraction
methods. The method using osmotic shock followed by centrifugation was used to determine the soluble
protein content. Data are given as mean ± standard deviation (n=2). ...................................................... 26
Table 3.2: Total protein content of freeze-dried samples using the osmotic shock extraction method.
1The method used in this sample was mechanical rupture using Tris-HCl buffer as solvent (method
described in chapter 2, section 2.3.1.2). Data are given as mean ± standard deviation (n=2). ................. 27
Table 3.3: Molecular weight (MW) and isoelectric point (pI) values obtained in the literature for the
proteins of interest. G3P - glycerol-3-phosphate. .................................................................................... 33
Table 3.4: Possible identification of protein spots of interest overexpressed by salt stress, their
respective estimated molecular weight (MW) and isoelectric point (pI) and the expression ratio between the
stress and control conditions. G3PP – glycerol-3-phosphate phosphatase, SOD – superoxide dismutase,
CAT – catalase, G3PDH – glycerol-3-phosphate dehydrogenase. .......................................................... 35
Table 3.5: Possible identification of protein spots of interest downregulated by oxidative stress, their
respective estimated molecular weight (MW) and isoelectric point (pI) and the expression ratio between the
stress and control conditions. SOD – superoxide dismutase. .................................................................. 39
Table 3.6: Data for the protein mass balance over the anion exchange (DEAE ligands) chromatography.
.............................................................................................................................................................. 45
Table 3.7: Values of gluconic acid concentration, pH and average particles size ratios from gelation
samples. DX – particles diameter in the sample; DCnative –diameter of proteins of the native control; 0 – no
significant changes in size; ↑ - increase in DX size. ................................................................................. 46
List of Equations
Equation 1………………………………………………………………………………………………………..19
viii
List of Figures
Figure 1.1: Schematic representation (left) and optical microscope image (right) of Dunaliella. A –
plasma membrane; B – pyrenoid surrounded by starch granules; C – chloroplast; D – vacuoles; E – nucleus;
F – flagellum [17]. .................................................................................................................................... 6
Figure 1.2: Schematic representation of the adjustment of Dunaliella to osmotic shock [18]. ............... 7
Figure 1.3: Schematic representation of the biosynthesis pathway of glycerol in Dunaliella [17]. ......... 8
Figure 1.4: Light microscope image of D. salina cells in induction phase [16]. ..................................... 9
Figure 3.1: Image of the photobioreactors used for cultivations of Dunaliella sp. The culture under
oxidative stress is the green bubble column and the induction culture is the orange bubble column. ....... 24
Figure 3.2: Graphic representation of growth curves for the control ( ), salt stress ( ), pH stress
( ), oxidative stress ( ) and induction ( ) cultures. X represents the cellular concentration in
cell/mL and X0 represents the initial cellular concentration. For the stress cultures, data are given as mean
± standard deviation (n=3). The continuous lines are present only to facilitate the analysis. .................... 25
Figure 3.3: Dunaliella sp. (2) samples before (A) and after (B) the application of zirconia beads. ...... 27
Figure 3.4: Graphic representation of protein content during the time of exposure to the stress, for fresh
culture samples of salt stress. ( ) represents total protein content, ( ) represents total protein
content after microdialysis, ( ) represents soluble protein content after microdialysis and ( )
represents the salinity at each time. Significant differences from the 0h sample are indicated by an asterisk
(*; p ≤ 0.05). Data are given as mean ± standard deviation (n=3). ........................................................... 28
Figure 3.5: Graphic representation of protein content of fresh pH stress samples (after microdialysis)
during the time of exposure to the stress and the respective variation of culture medium pH. ( )
represents total protein content, ( ) represents soluble protein content, ( ) represents pH variation.
Data are given as mean ± standard deviation (n=3). ............................................................................... 30
Figure 3.6: Graphic representation of protein content of fresh oxidative stress samples (after
microdialysis) during the time of exposure to the stress and the respective variation of culture medium pH.
( ) represents total protein content, ( ) represents soluble protein content, ( ) represents pH
variation. Data are given as mean ± standard deviation (n=3). ................................................................ 31
Figure 3.7: Graphic representation of protein content from the fresh samples of control culture (grey
colunms) and induction culture (orange columns) after microdialysis. ( ; ) represents total protein content
and ( ; ) represents soluble protein content. Significant differences from the control sample are indicated
by an asterisk (*; p ≤ 0.05). Data are given as mean ± standard deviation (n=3). .................................... 32
Figure 3.8: Two dimensional gel electrophoresis of the control sample (A) and the 96h sample from salt
stress (B). Proteins (100 µg) were precipitated and separated on 7 cm IPG strips (pH 3-10) and then applied
on SDS-PAGE gel. Gels were silver stained. The numbers indicate spots that were overexpressed in the
stress condition and possibly represent some proteins of interest. .......................................................... 34
ix
Figure 3.9: Master gel representing all the spots, which could correspond to proteins, present in both
2D gels. The differentially expressed protein spots, which result from analysis between the control and the
salt stress 2D gels, are represented by the circles. ................................................................................. 34
Figure 3.10: Two dimensional gel electrophoresis of the control sample (A) and the 24h sample from pH
stress (B). Proteins (100 µg) were precipitated and separated on 7 cm IPG strips (pH 3-10) and then applied
on SDS-PAGE gel. Gels were silver stained. The number indicates a spot that was overexpressed in the
stress condition and possibly represents a protein of interest.................................................................. 36
Figure 3.11: Master gel representing all the spots, which could correspond to proteins, present in both
2D gels. The differentially expressed protein spots, which result from analysis between the control and the
pH stress 2D gels, are represented by the circles. .................................................................................. 37
Figure 3.12: Two dimensional gel electrophoresis of the control sample (A) and the 24h sample from
oxidative stress (B). Proteins (100 µg) were precipitated and separated on 7 cm IPG strips (pH 3-10) and
then applied on SDS-PAGE gel. Gels were silver stained. The numbers indicate spots which expression
was repressed in the stress condition and possibly represent a protein of interest. ................................. 38
Figure 3.13: Master gel representing all the spots, which could correspond proteins, present in both 2D
gels. The differentially expressed protein spots of interest, which result from analysis between the control
and the salt stress 2D gels, are represented by the yellow circles. .......................................................... 38
Figure 3.14: A) Graphic representation of the chromatogram from 2L fractionation assay using a DEAE
prepacked column, 2 mL loop and a linear elution mode (from 0 to 400 mM NaCl). ( ) represents the
absorbance value at 280 nm and ( ) represents conductivity. B) SDS-PAGE profile of the peak fractions
eluted from the column. M – molecular weight marker; Feed (12 µg) – sample injected into the column; FT
(1.5 µg) – flow-through; P1 (0.6 µg) – first elution peak at 176 mM NaCl (16.07 mS/cm); P2 (0.1 µg) – second
elution peak at 413 mM NaCl (37.69 mS/cm); P3 (0.1 µg) – regeneration peak. SDS-PAGE gel was silver
stained. The red rectangles possibly include the G3PDH molecular weight band localization. ................. 40
Figure 3.15: A) Graphic representation of the chromatogram from 1L fractionation assay using a DEAE
prepacked column, 1 mL loop and a linear elution mode (from 0 to 400 mM NaCl). ( ) represents the
absorbance value at 280 nm and ( ) represents conductivity. B) SDS-PAGE profile of the peak fractions
eluted from the column. M – molecular weight marker; Feed (12 µg) – sample injected into column; FT (2.8
µg) – flow-through; P1 (0.4 µg) – first elution peak at 137 mM NaCl (12.51 mS/cm); P1’ (1.1 µg) – portion of
first elution peak at 167 mM NaCl (15.28 mS/cm); P2 (0.4 µg) – second elution peak at 355 mM NaCl (32.41
mS/cm); P3 (0.5 µg) – regeneration peak. SDS-PAGE gel was silver stained. The red rectangle possibly
include the G3PDH molecular weight band localization. ......................................................................... 41
Figure 3.16: A) Graphic representation of the chromatogram from 1S fractionation assay using a DEAE
prepacked column, 1 mL loop and a step elution mode (from 0 to 400 mM NaCl). ( ) represents the
absorbance value at 280 nm and ( ) represents conductivity. B) SDS-PAGE profile of the peak fractions
eluted from the column. M – molecular weight marker; Feed (12 µg) – sample injected into the column; FT
(0.8 µg) – flow-through; P1 (1.0 µg) – first elution peak at 200 mM NaCl (17.99 mS/cm); P2 (0.1 µg) – second
x
elution peak at 378 mM NaCl (32.91 mS/cm); P3 – regeneration peak (not represented in SDS-PAGE gel).
SDS-PAGE gel was silver stained. The red rectangle possibly include the G3PDH molecular weight band
localization. ............................................................................................................................................ 42
Figure 3.17: A) Graphic representation of the chromatogram from 5S fractionation assay using a DEAE
prepacked column, 5 mL loop and a step elution mode (from 0 to 400 mM NaCl). ( ) represents the
absorbance value at 280 nm and ( ) represents conductivity. B) SDS-PAGE profile of the peak fractions
eluted from the column. M – molecular weight marker; Feed (12 µg) – sample injected into the column; FT
(1.3 µg) – flow-through; P1 (0.5 µg) – first elution peak at 142 mM NaCl (12.94 mS/cm); P2 (0.7 µg) – portion
of the second elution peak at 239 mM NaCl (21.85 mS/cm); P2’ (0.7 µg) – portion of the second elution
peak at 360 mM NaCl (32.83 mS/cm); P3 – regeneration peak. SDS-PAGE gel was silver stained. The red
rectangle possibly include the G3PDH molecular weight band localization. ............................................. 43
Figure 3.18: Two dimensional gel electrophoresis of elution peak P1 from 2L fractionation assay.
Proteins (100 µg) were precipitated and separated on 7 cm IPG strips (pH 3-10) and then applied on SDS-
PAGE gel. Gels were silver stained. The number identify the possible presence of the enzyme G3PDH. 44
Figure 3.19: Particles size measurement from the native control sample (A) and heat denatured control
sample (B) obtained by Zetasizer software. ............................................................................................ 47
Figure 6.1: Graphic representation of the absorbance at 562 nm in function of the BSA concentration,
using deionized water as solvent. The BCA calibration curve obtained by linear regression was y = 1.47e-
3x + 1.35e-2, R² = 0.9977, where y represents Abs 562 and x represents [BSA] in mg/L. ....................... 53
Figure 6.2: Graphic representation of the absorbance at 562 nm in function of the BSA concentration,
using 100 mM Tris-HCl buffer (pH 6.9) as solvent. The BCA calibration curve obtained by linear regression
was y = 5.40e-4x + 8.02e-3, R² = 0.9965, where y represents Abs 562 and x represents [BSA] in mg/L.. 53
Figure 6.3: Graphic representation of the absorbance at 562 nm in function of the BSA concentration,
using 100 mM Tris-HCl buffer (pH 6.9) and 2.5% (v/v) glycerol as solvent. The BCA calibration curve
obtained by linear regression was y = 9.13e-4x + 1.86e-3, R² = 0.9999, where y represents Abs 562 and x
represents [BSA] in mg/L. ...................................................................................................................... 54
xi
List of Abbreviations
1L 1mL linear assay
1S 1mL step assay
2D Two dimensional
2L 2mL linear assay
5S 5mL step assay
A4F Algafuel S.A.
Abs 562 Absorbance at 562 nm
ANOVA Analysis of variance
APS Ammonium persulfate
BCA Bicinchoninic acid
BSA Bovine serum albumin
CA Carbonic anhydrase
CAT Catalase
CF Concentration factor
CV Column volumes
DEAE Diethilaminoethil
DHA Dihydroxyacetone
DHAP Dihydroxyacetone phosphate
DLS Dynamic light scattering
DTT dithiothreitol
DW Dry weight
FT Flow-through
G3P Glycerol-3-phosphate
G3PDH Glycerol-3-phosphate dehydrogenase
G3PP Glycerol-3-phosphate phosphatase
GRAS Generally recognized as safe
iBB Institute for Bioengineering and
Biosciences
IEF Isoelectric focusing
IPG Immobilized pH gradient
IST Instituto Superior Técnico
MW Molecular weight
P1 Peak one
P2 Peak two
P3 Peak three
PAGE Polyacrylamide gel electrophoresis
PdI Polydispersity index
pI Isoelectric point
RH buffer Rehydration buffer
ROS Reactive oxygen species
SCP Single cell protein
SDS Sodium dodecyl sulfate
SOD Superoxide dismutase
TEMED Tetramethylethylenediamine
UV Ultraviolet
1
1. Introduction
Proteins are present in every cell that composes an organism and have a key role in many biological
processes such as cell signaling, cell adhesion, immune response and structural and mechanical functions
[1]. Proteins are also widely used in industries such as food, cosmetics, pharmaceuticals, packaging and
coatings and these biopolymers can have several biotechnological applications [2].
Proteins can be obtained from animal, vegetable and microbial sources. Due to the lower productivities
of animal and vegetable protein sources, microorganisms appear as a sustainable alternative to obtain high
quality protein. From the microbial sources, microalgae have been rising as an alternative protein source
with great potential. Microalgae cells contain all essential amino acids and have unique growth requirements
– consumption of carbon dioxide in the presence of light and growth in salt waters, for example. Due to their
high protein content and other important compounds, such as lipids and pigments, microalgae have been
used as a source of single cell protein. Besides, their protein extracts can be used for the isolation of
biotechnological important enzymes and for the study of functional properties, such as gelation or
emulsifying capacity [3]–[5].
The aim of this work is to extract proteins from the microalgae Dunaliella sp., through its cultivation under
stress conditions, in order to characterize and fractionate the protein extracts. The production of Dunaliella
protein extracts occurred in A4F – Algafuel, S.A, Lisbon, and their characterization was done in iBB –
Institute for Bioengineering and Biosciences, at Instituto Superior Técnico, Lisbon.
1.1. Biotechnological Applications of Proteins
Proteins have several biotechnological applications. They can be used for diagnostic/analytical purposes
(e.g. biosensors), as biocatalysts in food processing, detergents and production of antibiotics and for
nutritional and functional purposes (e.g. source of essential amino acids and controlled delivery of bioactive
compounds, respectively) [2].
1.1.1. Diagnostic/ Analytical Purposes
Some types of proteins can be used for analytical purposes, like enzymes and antibodies. Due to their
biospecificity, these proteins are capable of detect and quantify specific analytes of interest in complex
mixtures and so they can be used as biosensors. Table 1.1 shows a summary of some enzymes and
analytes used for this purpose [6].
2
Table 1.1: Some analytes of diagnostic importance and respective enzymes used in its detection [6].
Analyte Enzyme used in detection
Glucose Glucose oxidase
Urea Urease
Uric acid Uricase
Amino acids L-Amino acid oxidase
Cholesterol Cholesterol oxidase
Alcohols Alcohol oxidase
Biosensors are normally applied in the medical/healthcare area in order to detect and quantify a variety
of marker substances/analytes present in blood and urine (e.g. urea, glucose, and cholesterol or steroid
hormones). Some examples of these tests are the assay of blood glucose and blood urea for the diagnostic
of diabetes and kidney disease, respectively. Biosensors can also be applied for food analyses as well as
in environmental monitoring and in bioprocess control [6].
1.1.2. Biocatalysts
Enzymes are proteins that act as catalyst of many chemical reactions – biocatalysts. Naturally found
enzymes have been widely used since ancient times in processes like brewing, wine-making and cheese
manufacture. With the development of fermentation processes it was possible to produce purified and well-
characterized enzymes on a large scale that allowed the introduction of these molecules into industrial
products and processes. Some examples of applications are in the production of sweeteners, in the
modification of flavor, texture and appearance of food products and added to detergent preparations [6], [7].
The majority of industrial enzymes are traditionally obtained from microorganisms that are classified as
GRAS (generally recognized as safe) but the appearance of recombinant DNA technology made possible
to improve production processes and produce new commercial enzymes [6], [7].
The application of enzymes in industrial processes has some benefits, like the reduction in the use of
organic solvents and the reduction of the energy input required in the process due to the use of moderate
temperatures and pressures. For example, the use of enzymes in detergents can help reduce surfactant
levels and washing temperatures required to clean clothing satisfactorily [6].
The enzymes predominantly used in industry are proteases and carbohydrases. Proteases catalyze the
cleavage of peptide bonds in protein-based substrates being extensively used in the detergent and dairy
industries. Carbohydrases are polysaccharide-degrading enzymes (e.g. amylase and cellulase) and are
used in industries like starch, textile, detergent and baking [7].
1.1.3. Functional Properties
Non-catalytic proteins can also have biotechnological applications. These proteins are largely derived
from food sources and find applications in the food sector. Such proteins are added to food either for
nutritional reasons or because they exhibit specific desirable functional properties [6].
3
The functional properties of proteins that make them interesting for the food sector are hydration-related
properties (e.g. solubility, dispersibility, viscosity and gelation) or surface-related properties (e.g. foaming
and emulsification). Some examples of these types of proteins are milk proteins (caseins and whey protein),
collagen, egg and soy proteins [6].
This type of proteins can also be used in drug and gene delivery systems as protein-based nanocarriers,
as film-coaters and hydrogels. For example, whey proteins are used as hydrogels, nanoparticle systems for
encapsulation and controlled delivery of bioactive compounds [2]. Collagen has also been used in the
encapsulation of biomolecules and nanomaterials using an electrochemical encapsulation method. Studies
using this method are being carry out in order to use it in biomedical applications (e.g. cell attachment and
proliferation onto these materials) [8].
1.1.3.1 Gelation
The gelation capacity is one example of a functional property of proteins. Gelation is a general way to
convert a fluid to a solid and has been used since antiquity to produce a variety of food with distinctive
textures that are desirable to costumers. This phenomenon is responsible for the solid-like, viscoelastic
properties of foods, increased viscosity, adhesiveness and improved water retention. Some examples are
gelatin, cooked egg products and tofu. Protein gels like gelatin, have other applications, such as
photographic and pharmaceutical (gelatin films and capsules) being also used in the immobilization of
enzymes [9]–[11].
The formation of protein gels requires an initial structural transition from an unreactive to a reactive
structure that increases the probability of intermolecular interactions. Gels are formed when partially
unfolded proteins develop uncoiled polypeptide segments that interact at specific points to form a three
dimensional cross-linked network. The first step in protein gelation involves modifications of protein
structure, or solvent conditions, such that protein-protein interactions are favored. The interactions linking
protein molecules into a gel network can either be covalent (disulfide), non-covalent (hydrogen bonds,
hydrophobic and electrostatic interactions) or a combination of both. Cross-links are the determining factor
in the formation of the viscoelastic nature of protein gels [10], [11].
The mechanisms that cause gelation are related with the action of various factors, such as heating and
treatments with acids or alkalis. This process is accelerated at high protein concentrations, due to higher
intermolecular interactions. Gel formation only occurs when a certain critical level of protein concentration
is present, originating the right balance of protein-protein and protein-solvent interactions. The critical protein
concentration required for gel formation depends on protein origin and properties [10], [11].
Protein denaturation, protein-protein and protein-solvent interactions are affected by pH and ionic
strength. Protein-protein interactions are generally favored under conditions which reduce the net charge of
the molecules, i.e., pH values near the isoelectric point. High ionic strength tends to reduce electrostatic
repulsion between proteins due to the shielding of ionizable groups by mobile ions [10], [11].
A protein gelation process widely used is the heat-induced gelation where the first step includes
denaturation of the native protein, which increases the interaction between molecules resulting in the three-
4
dimensional protein network, which forms the gel. Some examples of heat-induced protein gels are gelatin,
whey and soy protein. Another gelation process is the cold-set gelation, after heat treatment, which can
occur by acidification (e.g. yoghurt), enzyme induced (using, for example rennet protein that originates
cheese) or addition of salts (e.g. tofu) [10], [11].
1.2. Sources of Proteins
Proteins can be obtained from animal, vegetable and microbial sources. At industrial level, most of the
animal proteins obtained are destined for therapeutic use, such as insulin and blood factors, but they are
also employed as a rich source of balanced levels of amino acids. These proteins are obtained from
slaughterhouse facilities in which large numbers of animals are regularly processed facilitating the collection
of significant quantities of tissues required as protein source. The disadvantage regarding animal sources
of proteins relates to the potential presence of pathogens in the raw material, and so it is necessary to use
tissues from disease-free animals and validated downstream processes (that assure the elimination of
pathogens from the raw material) [2], [6].
Vegetable proteins are normally used for nutritional purposes and in the food area as functional proteins
(e.g. gelation agents and emulsifiers). The disadvantages of using plants for protein production are related
with the seasonality of their growth, not allowing a constant source of material, and the lower expression
levels of some proteins in relation with other sources [2], [6].
Microorganisms have always been used in basic food processing techniques in order to allow the long-
term preservation of foods through fermentation. Due to the growing population, several attempts were
made to develop and bring to practice the production of high-quality protein additives from microorganisms,
known as microbial protein or single cell protein (SCP). The advantages of this source of proteins is related
with the higher productivities, absence of seasonal fluctuations, lower nutritional requirements, like growth
in a wide range of substrates (including by-products of some industries, such as sugar industry) and the use
of natural or artificial light. Bacteria, fungi and microalgae proteins are used in several areas, such as animal
feed (e.g. aquaculture), food supplements and fermentation processes [12].
1.3. Microalgae Proteins
Microalgae are microscopic, photosynthetic organisms found in freshwater and marine habitats. The
term microalgae refers to prokaryotic cyanobacteria and eukaryotic photosynthetic microorganisms. The
genetic potential of this diverse group is still unexplored. It is believed that the number of known species
represents only 1% of what exists [3].
Microalgae have been studied for over 100 years and they are currently being cultivated in large scale
for the production of biomass that is used in the health food sector and in aquaculture applications. However,
microalgae can also be used in the production of biofuels, such as biodiesel and bioethanol, and in the
production of fine chemicals including chlorophylls, β-carotene and omega-3 fatty acids. The immense
5
interest in these organisms is related with their unconventional growth requirements, like being able to grow
in salt water, in the presence of CO2 and in infertile lands, allowing a sustainable cultivation [3], [4].
Microalgae proteins have a great potential to be an alternative protein source, since they contain all
essential amino acids. However, it is not the general intention to isolate and utilize only the protein fraction,
but to profit of the whole algal biomass. The principal reason for this is due to the fact that microalgae are
more than just protein, they contain other nutritional compounds (such as carbohydrates, lipids, vitamins
and pigments) that give a broad nutritional quality when compared to conventional plants in human diet [4],
[5]. Table 1.2 indicates the principal components of different microalgae.
Table 1.2: General composition of different microalgae (% of dry weight) [5].
Microalgae Protein Carbohydrates Lipids
Chlamydomonas rheinharrdii 48 17 21
Chlorella pyrenoidosa 57 26 2
Chlorella vulgaris 51-58 12-17 14-22
Dunaliella salina 57* 32 6
Arthrospira maxima 60-71 13-16 6-7
Spirulina plantesis 46-63 8-14 4-9
*The common protein content for Dunaliella is around 40%DW [13] and this is the value that will be used as reference in this work.
Besides the use of microalgae as source of high quality proteins for nutrition, they can also be used as
industrially important enzyme producers. Their advantages on industrial enzyme synthesis, compared with
other microbial cells, are related with their minimal nutritional requirements (light, CO2, water, nitrogen
source and some salts), which reduce costs, and their high protein content. Nevertheless, they also have
disadvantages, such as longer cultivation times (in autotrophic regime) compared to bacteria and fungi and,
since the majority of proteins are intracellular, they need additional downstream stages [3].
The microalgae protein isolates can also have techno functional potential such as being used as
emulsifiers and gelation agents. Nowadays, there are still no significant applications of purified proteins from
microalgae, since the presence of non-protein components generally leads to undesired changes in color,
taste and protein structure. However, efforts are being made to study the specific activities of microalgae
proteins [4], [13].
1.4. Dunaliella sp.
Dunaliella are eukaryotic, unicellular, halotolerant microalgae that belong to the phylum Chlorophyta,
order Volvocales and family Polyblepharidaceae [14]. This alga was first discovered in salt evaporation
ponds, in the south of France, by Michael Dunal in 1838 and it was named as such by Teodoresco in 1905
in respect to Dunal [15]. This alga is often found in aquatic marine habitats like sea and inland salt lakes.
6
1.4.1. Morphological Characteristics
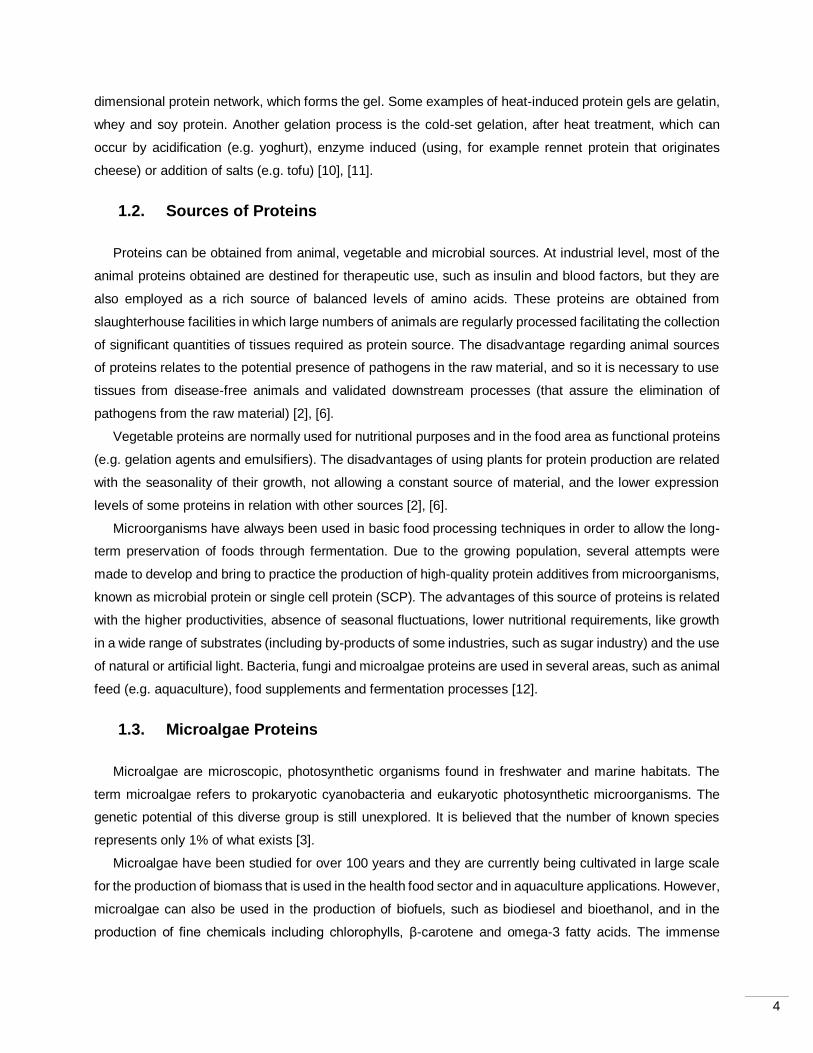
The microalgae Dunaliella are motile, biflagellated and lack a rigid cell wall, being enclosed by a thin
elastic plasma membrane. The cells are ovoid, ellipsoid or spherical and the size vary from 5 to 25 µm in
length and from 3 to 13 µm in width. Dunaliella cells have a single cup-shaped chloroplast containing starch
granules and they can grow in a wide range of salt concentrations, ranging from 0.05 M to saturation (5.0
M NaCl), due to the massive accumulation of glycerol. For this reason and the lack of a cell wall, Dunaliella
species have been considered as a model photosynthetic organism for the study of osmoregulatory
mechanisms [14], [15].
The cells of this genus mainly reproduce by longitudinal division of a motile cell, but sexual reproduction
may also occur (fusion of two motile cells to form a zygote) [16].
Figure 1.1: Schematic representation (left) and optical microscope image (right) of Dunaliella. A – plasma membrane; B – pyrenoid surrounded by starch granules; C – chloroplast; D – vacuoles; E – nucleus; F – flagellum [17].
1.4.2. Growth Requirements
Dunaliella is a photoautotroph, which means that the alga grows best with carbon dioxide as a source of
carbon and light as a source of energy for metabolic processes of growth and division. Microalgae also need
other elements for growth, like nitrogen and phosphorous. The best source of nitrogen for Dunaliella is
nitrate, which will promote growth and protein synthesis. Limiting the nitrate source is one of the most
common ways for the induction of carotenoids production [13],[18].
These microalgae are halotolerant, but their optimal growth occur at 2 M NaCl and in a temperature
range between 25 and 35°C [14], [17].
During growth, the algae consume carbon dioxide for photosynthesis and nitrate for protein synthesis,
and as a result, the pH of the growth medium rises. Besides having a wide range of pH tolerance, the
optimum pH range of Dunaliella species is between 7 and 8. When the pH of the culture medium increases,
7
the equilibrium among gaseous carbon dioxide, bicarbonate and carbonate ions shifts in favor of
bicarbonate and carbonate formation. The formation of bicarbonate provides a buffer to the pH rise, and
can supply Dunaliella with another utilizable source of carbon. This capacity is due to the overexpression of
the enzyme carbonic anhydrase. This enzyme will allow the assimilation of bicarbonate ions by the cells by
converting them to CO2 [18].
1.4.3. Adaptation to Osmotic Changes
The capability of Dunaliella cells to grow in a wide range of salt concentrations is due to their rapid
changes in cell volume and to the production of a compatible solute responsible for the protection of
enzymes against inactivation and inhibition.
When cells are exposed to an osmotic shock, the first reaction is the change in cell volume due to the
entrance or exit of water, in order to achieve the osmotic equilibrium with the medium. The presence of a
thin elastic plasma membrane, instead of a rigid cell wall, allows the rapidly changes in osmotic pressure
[17].
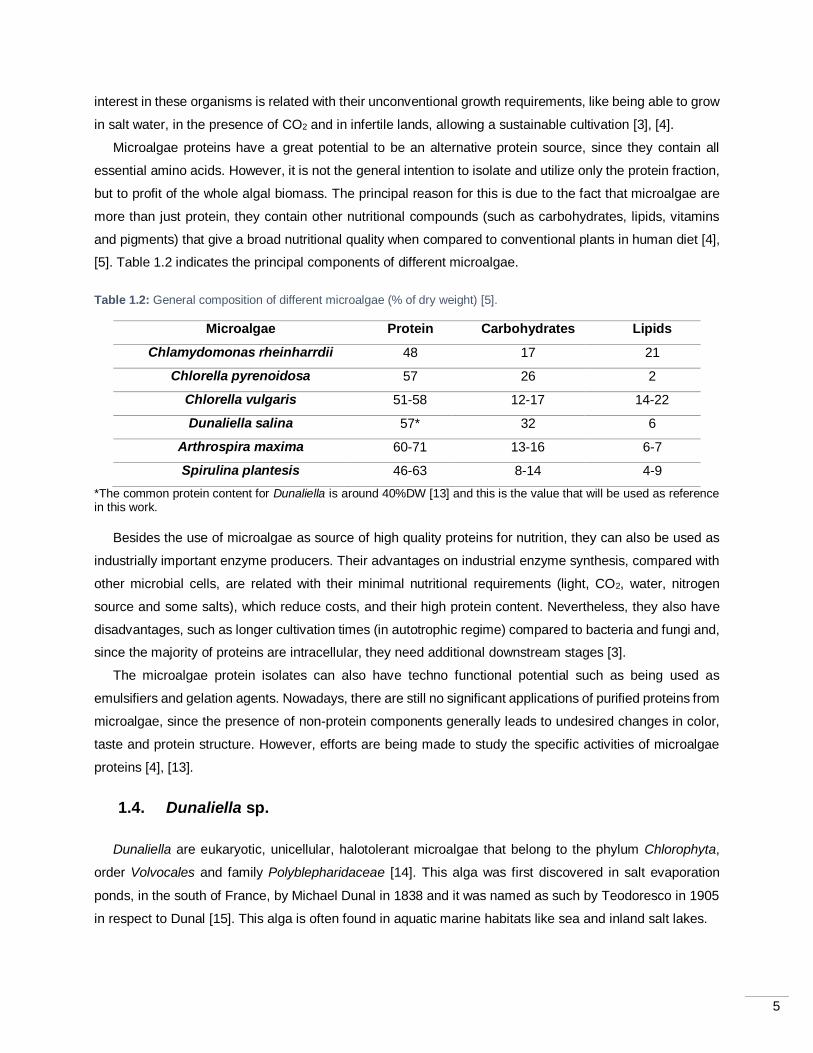
The second response is the synthesis or elimination of glycerol by enzymatic pathways. When cells are
exposed to hypersaline environments, intracellular glycerol is produced either by photosynthetic CO2 fixation
or by starch degradation. The metabolic pathway used by the cells depends on the availability of light, the
starch reserve pool and the intensity of the salt stress. The production of glycerol by degradation of starch
occurs exclusively in the absence of light, and in this case, the capacity of the cells to recover from the
hyperosmotic shock depends on their starch reserve pools [17]. Glycerol synthesis or degradation occurs
until the intracellular concentration becomes proportional to the extracellular salt concentration, replacing
the osmotic equilibrium (Figure 1.2).
Figure 1.2: Schematic representation of the adjustment of Dunaliella to osmotic shock [18].
8
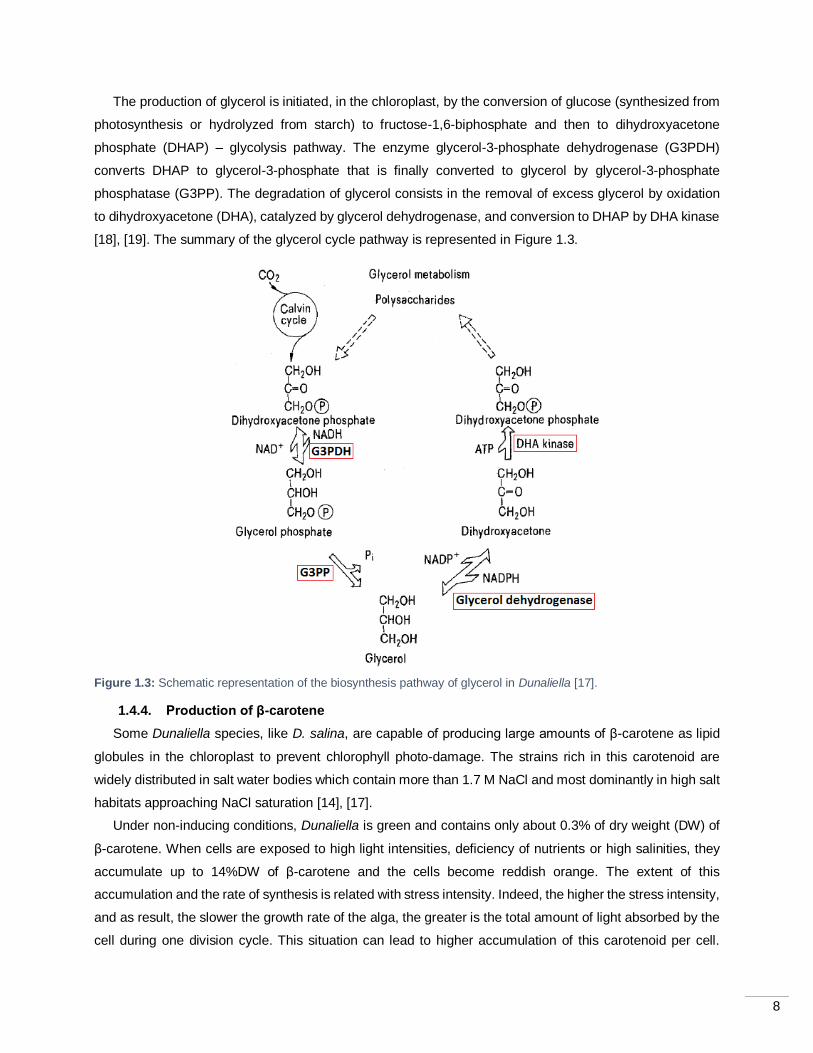
The production of glycerol is initiated, in the chloroplast, by the conversion of glucose (synthesized from
photosynthesis or hydrolyzed from starch) to fructose-1,6-biphosphate and then to dihydroxyacetone
phosphate (DHAP) – glycolysis pathway. The enzyme glycerol-3-phosphate dehydrogenase (G3PDH)
converts DHAP to glycerol-3-phosphate that is finally converted to glycerol by glycerol-3-phosphate
phosphatase (G3PP). The degradation of glycerol consists in the removal of excess glycerol by oxidation
to dihydroxyacetone (DHA), catalyzed by glycerol dehydrogenase, and conversion to DHAP by DHA kinase
[18], [19]. The summary of the glycerol cycle pathway is represented in Figure 1.3.
Figure 1.3: Schematic representation of the biosynthesis pathway of glycerol in Dunaliella [17].
1.4.4. Production of β-carotene
Some Dunaliella species, like D. salina, are capable of producing large amounts of β-carotene as lipid
globules in the chloroplast to prevent chlorophyll photo-damage. The strains rich in this carotenoid are
widely distributed in salt water bodies which contain more than 1.7 M NaCl and most dominantly in high salt
habitats approaching NaCl saturation [14], [17].
Under non-inducing conditions, Dunaliella is green and contains only about 0.3% of dry weight (DW) of
β-carotene. When cells are exposed to high light intensities, deficiency of nutrients or high salinities, they
accumulate up to 14%DW of β-carotene and the cells become reddish orange. The extent of this
accumulation and the rate of synthesis is related with stress intensity. Indeed, the higher the stress intensity,
and as result, the slower the growth rate of the alga, the greater is the total amount of light absorbed by the
cell during one division cycle. This situation can lead to higher accumulation of this carotenoid per cell.
9
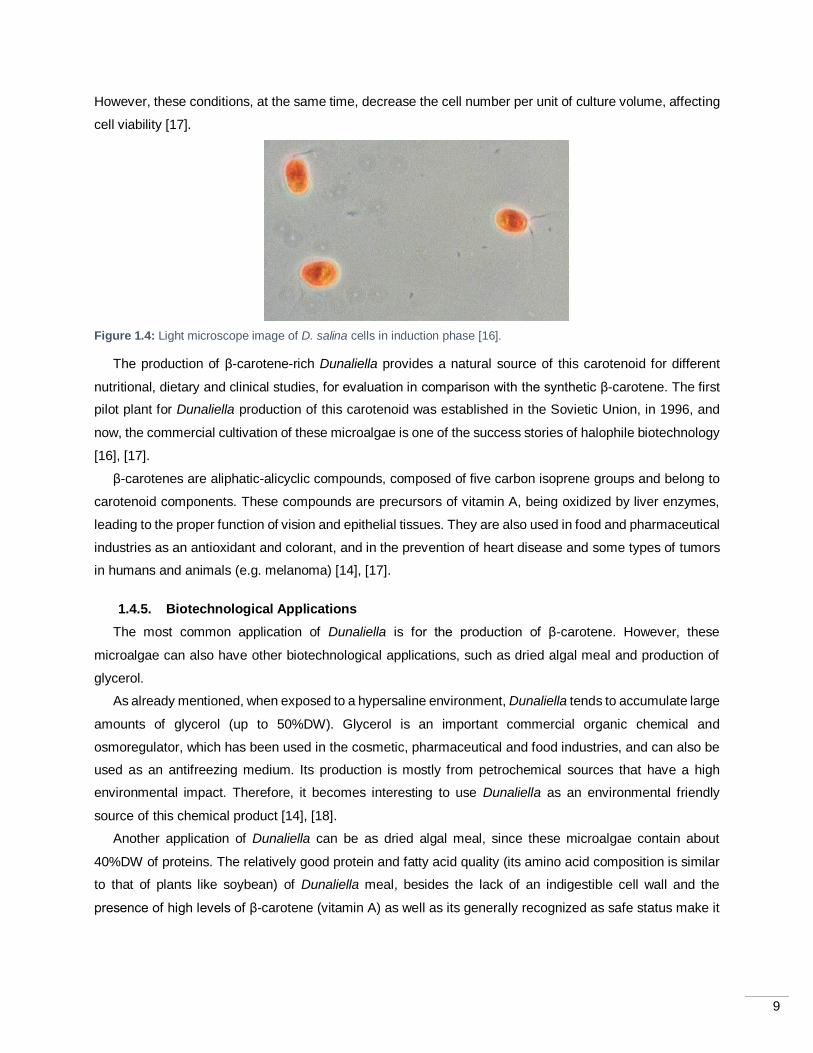
However, these conditions, at the same time, decrease the cell number per unit of culture volume, affecting
cell viability [17].
Figure 1.4: Light microscope image of D. salina cells in induction phase [16].
The production of β-carotene-rich Dunaliella provides a natural source of this carotenoid for different
nutritional, dietary and clinical studies, for evaluation in comparison with the synthetic β-carotene. The first
pilot plant for Dunaliella production of this carotenoid was established in the Sovietic Union, in 1996, and
now, the commercial cultivation of these microalgae is one of the success stories of halophile biotechnology
[16], [17].
β-carotenes are aliphatic-alicyclic compounds, composed of five carbon isoprene groups and belong to
carotenoid components. These compounds are precursors of vitamin A, being oxidized by liver enzymes,
leading to the proper function of vision and epithelial tissues. They are also used in food and pharmaceutical
industries as an antioxidant and colorant, and in the prevention of heart disease and some types of tumors
in humans and animals (e.g. melanoma) [14], [17].
1.4.5. Biotechnological Applications
The most common application of Dunaliella is for the production of β-carotene. However, these
microalgae can also have other biotechnological applications, such as dried algal meal and production of
glycerol.
As already mentioned, when exposed to a hypersaline environment, Dunaliella tends to accumulate large
amounts of glycerol (up to 50%DW). Glycerol is an important commercial organic chemical and
osmoregulator, which has been used in the cosmetic, pharmaceutical and food industries, and can also be
used as an antifreezing medium. Its production is mostly from petrochemical sources that have a high
environmental impact. Therefore, it becomes interesting to use Dunaliella as an environmental friendly
source of this chemical product [14], [18].
Another application of Dunaliella can be as dried algal meal, since these microalgae contain about
40%DW of proteins. The relatively good protein and fatty acid quality (its amino acid composition is similar
to that of plants like soybean) of Dunaliella meal, besides the lack of an indigestible cell wall and the
presence of high levels of β-carotene (vitamin A) as well as its generally recognized as safe status make it
10
an excellent poultry and aquaculture feed. An example of this application was the use of Dunaliella extracts
to feed shrimps, where they showed higher weight gain and survival compared with the control group [14].
The study of protein induction in Dunaliella proves to be interesting because the organism is extremophile
and, so, its proteins have a higher range of functionality and stability – which is a desirable characteristic
for industrial purposes – and also, their cultivation is facilitated by the lower probability of contamination by
other organisms; it only possesses a plasma membrane, which facilitates and lowers the operating costs of
the cell rupture and the recovery of intracellular compounds; and also due to the capability of accumulate
and produce several bioactive compounds (including valuable enzymes) when subjected to stress
conditions [6], [13].
1.5. Expression of Proteins under Stress
When exposed to abiotic stresses, cells tend to change their metabolic pathways and, as a consequence,
alteration of protein expression profile occurs. Some stresses that initiate cell responses are, for example,
extreme temperatures, pH, salt concentrations, exposure to intense light, heavy metals, UV radiation and
shortage of nutrients. From a biotechnological point of view, subject the cells to these type of stresses can
be advantageous, because it can lead to an increase in the expression of some important proteins/enzymes
that can be extracted and used in several bioprocesses. In the case of Dunaliella, some of these proteins
are, for example, antioxidant enzymes, carbonic anhydrase and glycerol cycle enzymes. The description
and application of these proteins will be presented in the following sections.
1.5.1. Antioxidant Enzymes
Antioxidant enzymes are a group of enzymes responsible for the scavenging of reactive oxygen species
(ROS) from cells. ROS molecules – superoxide radical (O2•), hydrogen peroxide (H2O2) and hydroxyl radical
(OH-) – are formed due to environmental conditions like intense light, high salt concentrations, extreme
temperatures and exposure to heavy metals. These conditions will cause oxidative stress and damage to
DNA, proteins, lipids, chlorophylls and almost every organic constituent of living cells. The reaction of
organisms to oxidative stress is by producing/increasing the expression of ROS scavenging antioxidant
enzymes, such as superoxide dismutase, catalase and ascorbate peroxidase [3], [20].
Superoxide dismutase (SOD, EC 1.15.1.1) are metalloenzymes that convert superoxide radicals into
oxygen and hydrogen peroxide. Due to their function, these enzymes can have several biotechnological
applications, such as, in the preservation of biological and perishable materials (organs for transplantation,
sperm, foodstuffs and vaccination agents). In the past, this enzyme was extracted from serum and liver of
animals and also from plants like seeds and vegetables. However, the low content and efficiency of
extraction became a bottleneck for commercial utilization. Hence, microbial sources began to be used to
obtain SOD by inducing oxidative stress in microbes [3], [21].
Catalase (CAT, EC 1.11.1.6) is a heme-containing enzyme found in all aerobic organisms that converts
hydrogen peroxide to oxygen and water. As a part of the antioxidant response system, this enzyme is also
11
responsible for maintaining redox homeostasis of the cells. Catalase are important enzymes in the global
enzyme market, being used in a wide range of industrial applications. Some examples of such applications
are oxidation of β-lactam antibiotics to their sulfoxides in chemical industry, peroxide removal during
pasteurization of milk in food industry, biomedical and clinical diagnosis and treatment and bleaching in
textile industry [22], [23].
1.5.2. Carbonic Anhydrase
Carbonic anhydrases (CA, EC 4.2.1.1) are zinc-dependent metalloenzymes that catalyze hydration of
CO2 to bicarbonate (HCO3-) and yields one proton, in a reversible manner. These enzymes are responsible
for inorganic carbon uptake and concentration in photosynthetic organisms [3], [24].
Carbonic anhydrases are being investigated for biofuel production in photosynthetic organisms, industrial
carbon sequestration and also for medical applications, such as drug delivery systems (e.g. antidote delivery
to treat analgesic overdose using CA as a biomarker that responds to high levels of CO2) and artificial lungs
[25].
The elevated CO2 emissions for the atmosphere due to industrial activities is an environmental problem.
Due to CA activity, there is an increasing interest in using them for CO2 sequestration and biofuel production
(e.g. using endogenous algal CA for uptake of CO2 originating lipids/hydrocarbons). However, the industrial
conditions are harsh (elevated temperatures and/or extreme pH) causing the destabilization of enzymes.
Carbonic anhydrases from halo- and thermotolerant microorganisms are being studied to overcome this
problem, since these enzymes seem to have much better temperature stability and, in some cases, salt
tolerance. Another way of overcome the problem is by immobilization of the enzyme, which increases its
stability, allowing its repeated use and facilitates enzyme recovery, reducing process costs [25].
1.5.3. Glycerol Cycle Enzymes
As mentioned before, glycerol is an important compound that is synthesized when cells are exposed to
osmotic stress. The glycerol enzymatic pathway contain two enzymes responsible for glycerol production –
glycerol-3-phosphate dehydrogenase and phosphatase – and two enzymes responsible for its degradation
– glycerol dehydrogenase and dihydroxyacetone kinase.
Glycerol dehydrogenase (EC 1.1.1.6) catalyzes the oxidation of glycerol to 1,3-dihydroxyacetone (DHA),
which is then converted to dihydroxyacetone phosphate by the enzyme dihydroxyacetone kinase. DHA is
an important building block in chemical industry and its market price is 100-fold higher than that of glycerol.
Since large amounts of glycerol are formed during the production of biodiesel, its conversion into other
value-added chemicals, such as DHA, becomes economically interesting. DHA can be used in cosmetics,
food and pharmaceutical industries and in chemical synthesis, where it can originate biodegradable
polymers. Another application of glycerol dehydrogenase is as a NADH regeneration system. NADH
cofactors are highly costly and since NADH-dependent oxidoreductases have great potential for various
chemical transformation processes, the use of enzymatic NADH regeneration systems using glycerol
dehydrogenase and glycerol as substrate has becoming interesting [26], [27].
12
The enzymes glycerol-3-phosphate dehydrogenase (G3PDH, EC 1.1.1.8) and glycerol-3-phosphate
phosphatase (G3PP, EC 3.1.3.21) are responsible for glycerol production. G3PDH catalyze the conversion
of dihydroxyacetone phosphate to glycerol-3-phosphate and G3PP dephosphorylates this compound to
glycerol.
G3PDH has been widely used in enzyme assays with diverse compounds of industrial interest, such as
glycerol/glycerol phosphate, as well as a number of important bioanalytical applications, like in the clinical
determination of blood triglyceride level together with lipase and glycerol kinase. The application of this
enzyme in winemaking industry is as a biosensor for glycerol determination. Since modern winemaking is
strongly focused on full-flavored wines that show varietal fruit character, it is therefore becoming common
practice to harvest fully-ripened grapes, which, as well as having increased fruit flavor, have also a high
sugar content. This high sugar content can lead to the production of wines that have excessive alcohol.
Depending on wine style, this level of alcohol can make the wine appears out of balance (at the palate level).
One strategy to decrease the amount of ethanol synthesized during wine fermentation is to divert the flow
carbon into glycerol (a secondary metabolic pathway), that is a relatively neutral compound from a sensory
perspective that can contribute to wine quality. Due to this, G3PDH can be used for glycerol monitoring
during the fermentation of wine [28], [29].
Besides the possible applications of G3PDH, in the last 15 years only few studies have been developed
with the objective of expressing and isolating this enzyme. Some of the studies developed will be
summarized in the next section.
1.5.3.1 Production systems of glycerol-3-phosphate dehydrogenase
G3PDH is an important branch point enzyme connecting lipid and carbohydrate metabolisms, which
exists in many organisms, and is also related with the osmotic stress response of several organisms. Due
to this, some G3PDH expression studies had been performed in organisms like the yeasts Saccharomyces
cerevisiae and Pichia pastoris, the microalgae Dunaliella tertiolecta and the hibernating squirrel Urocitellus
richardsonii.
The production and importance of glycerol in the halotolerant microalgae Dunaliella was already
described. The expression of G3PDH was achieved by growing the cells at 1 M NaCl during 5 days under
continuous shaking and a photoperiod of 16:8 h light:dark cycle. In these conditions the enzyme specific
activity obtained was 0.75 U/mg [30].
P. pastoris is a methylotrophic yeast, which means that it has the ability of utilize methanol as a sole
source of carbon and energy. For this reason, its use as a heterologous protein expression system has
become popular. The recombinant expression of G3PDH gene from S. cerevisiae in the host cells of P.
pastoris X-33 containing the AOX 1 promoter, which allows rapid growth using methanol as a source of
carbon and energy, was studied [31]. The enzyme was produced extracellularly in a complex medium
(BMGY) containing 0.35 M NaCl and 0.5% (v/v) methanol, during 4h at 30°C and 120 rpm. The enzyme
specific activity obtained under these conditions was 0.21 U/mg.
13
The yeast S. cerevisiae produces glycerol when exposed to osmotic stress, anaerobic conditions or in
conditions where the sugar uptake exceeds the capacity of the respiratory pathways. Baker’s yeast strains
were cultivated on YP-ethanol complex medium, with an initial pH of 4.5, at 30°C, 420 rpm during 48h.
These conditions allowed enzyme specific activities of 0.026 U/mg [28].
A more recent study, using the liver of the hibernating U. richardsonii, was developed with the objective
of understand the metabolic modifications that occur during hibernation. The activity of G3PDH increased
during hibernation which confirms their importance in the hydrolysis of triglycerides to form glycerol. The
maximum enzyme specific activity – 0.011 U/mg – was obtained when the organisms enter hibernation (4°C
and an autumn photoperiod 10:14 h light:dark) [32].
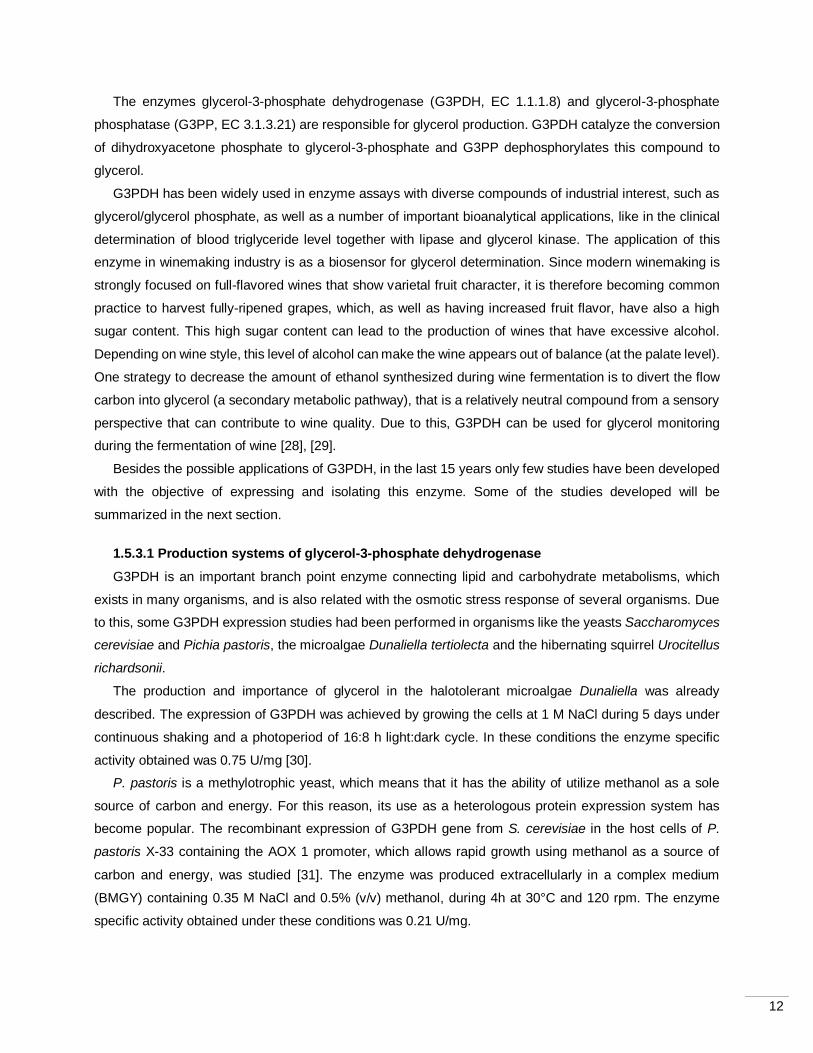
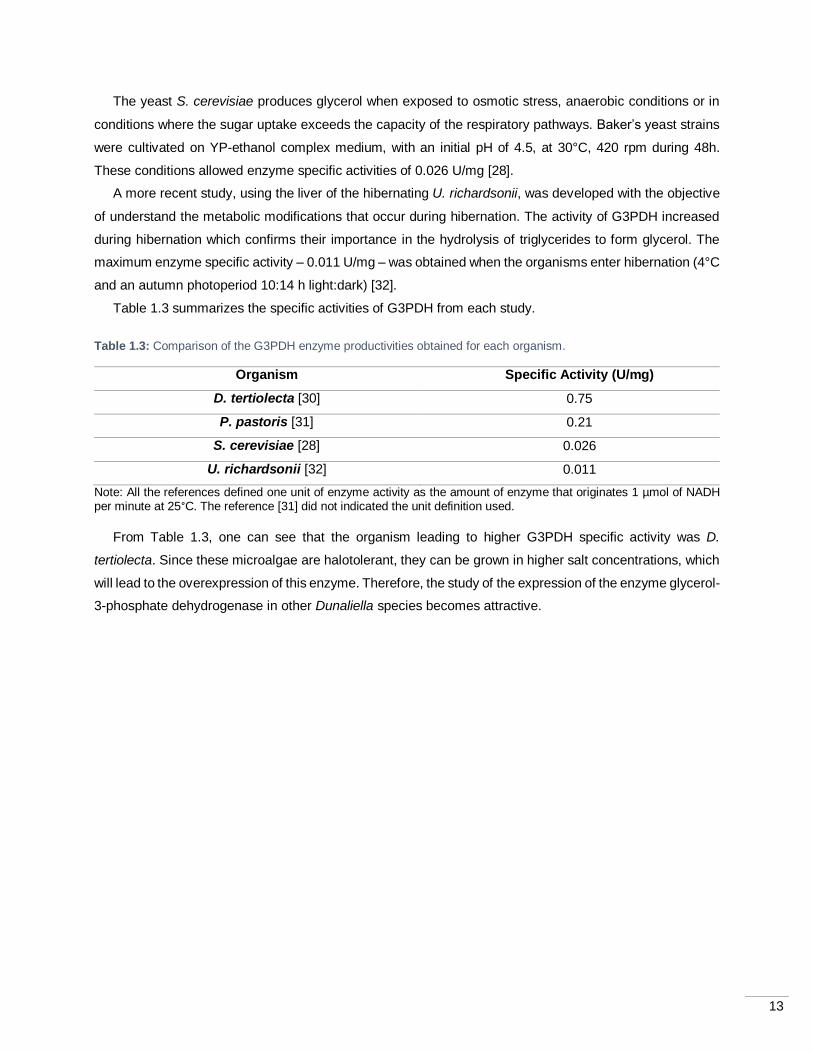
Table 1.3 summarizes the specific activities of G3PDH from each study.
Table 1.3: Comparison of the G3PDH enzyme productivities obtained for each organism.
Organism Specific Activity (U/mg)
D. tertiolecta [30] 0.75
P. pastoris [31] 0.21
S. cerevisiae [28] 0.026
U. richardsonii [32] 0.011
Note: All the references defined one unit of enzyme activity as the amount of enzyme that originates 1 µmol of NADH per minute at 25°C. The reference [31] did not indicated the unit definition used.
From Table 1.3, one can see that the organism leading to higher G3PDH specific activity was D.
tertiolecta. Since these microalgae are halotolerant, they can be grown in higher salt concentrations, which
will lead to the overexpression of this enzyme. Therefore, the study of the expression of the enzyme glycerol-
3-phosphate dehydrogenase in other Dunaliella species becomes attractive.
14
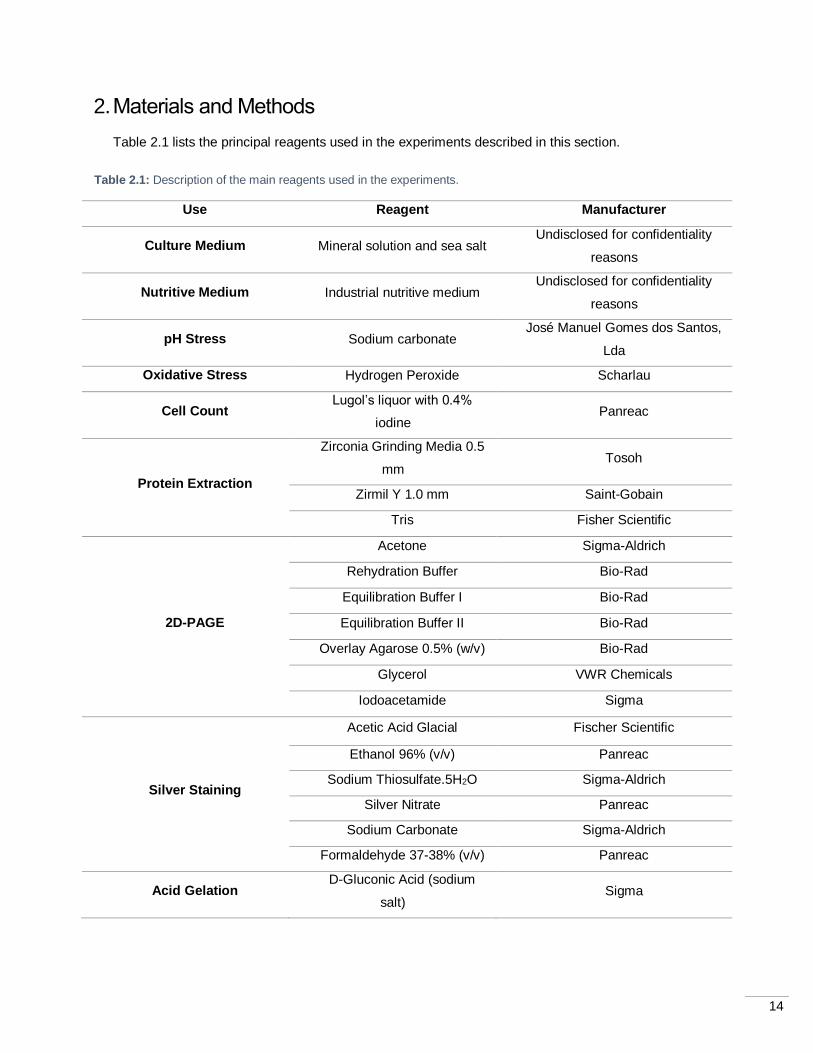
2. Materials and Methods
Table 2.1 lists the principal reagents used in the experiments described in this section.
Table 2.1: Description of the main reagents used in the experiments.
Use Reagent Manufacturer
Culture Medium Mineral solution and sea salt Undisclosed for confidentiality
reasons
Nutritive Medium Industrial nutritive medium Undisclosed for confidentiality
reasons
pH Stress Sodium carbonate José Manuel Gomes dos Santos,
Lda
Oxidative Stress Hydrogen Peroxide Scharlau
Cell Count Lugol’s liquor with 0.4%
iodine Panreac
Protein Extraction
Zirconia Grinding Media 0.5
mm Tosoh
Zirmil Y 1.0 mm Saint-Gobain
Tris Fisher Scientific
2D-PAGE
Acetone Sigma-Aldrich
Rehydration Buffer Bio-Rad
Equilibration Buffer I Bio-Rad
Equilibration Buffer II Bio-Rad
Overlay Agarose 0.5% (w/v) Bio-Rad
Glycerol VWR Chemicals
Iodoacetamide Sigma
Silver Staining
Acetic Acid Glacial Fischer Scientific
Ethanol 96% (v/v) Panreac
Sodium Thiosulfate.5H2O Sigma-Aldrich
Silver Nitrate Panreac
Sodium Carbonate Sigma-Aldrich
Formaldehyde 37-38% (v/v) Panreac
Acid Gelation D-Gluconic Acid (sodium
salt) Sigma
15
2.1. Cultivation of Dunaliella sp.
The microalgae strain Dunaliella sp. was obtained from the algae culture collection of A4F – Algafuel
S.A, in Lisbon. The culture medium which was used to cultivate Dunaliella sp. in A4F Laboratory is the result
of an optimization work for marine microalgae cultivation by A4F. It comprises artificial saltwater
accompanied with a very specific mineral solution and the nutritive medium with the desired nitrate
concentration. The mineral solution is a very rich source of minerals and nutrients such as magnesium – in
order to protect the intellectual property of A4F – Algafuel S.A, its composition is not presented in this work.
The nutritive medium which was used to supplement Dunaliella sp. cultures is an outsourced industrial
medium based on a recipe developed by A4F – Algafuel S.A. for laboratory-scale cultivation. In order to
protect the intellectual property of A4F-Algafuel S.A., the nutrients concentration in the recipe of the
industrial nutritive medium is not presented. The cultivation systems used at A4F Laboratory were 1L bubble
columns with a working volume of 700 mL. Each cultivation condition described below was performed three
times.
2.1.1. Control Culture and Inoculum
Cells of Dunaliella sp. were cultivated in a sterilized culture medium containing 120 g/L NaCl and 4 mM
of nutritive medium. The cellular growth occurred at 25°C and 135 µmol/(m2s) provided by fluorescents
lamps, under a photoperiod of 24h with continuous aeration (air supplemented with 0.5% CO2). Samples
for cell counting, microscopic observation (Olympus BX53 microscope) and protein extraction were taken
once a week, during three weeks. The inoculum concentration for the cultivations under stress was 7x10⁵
cell/mL.
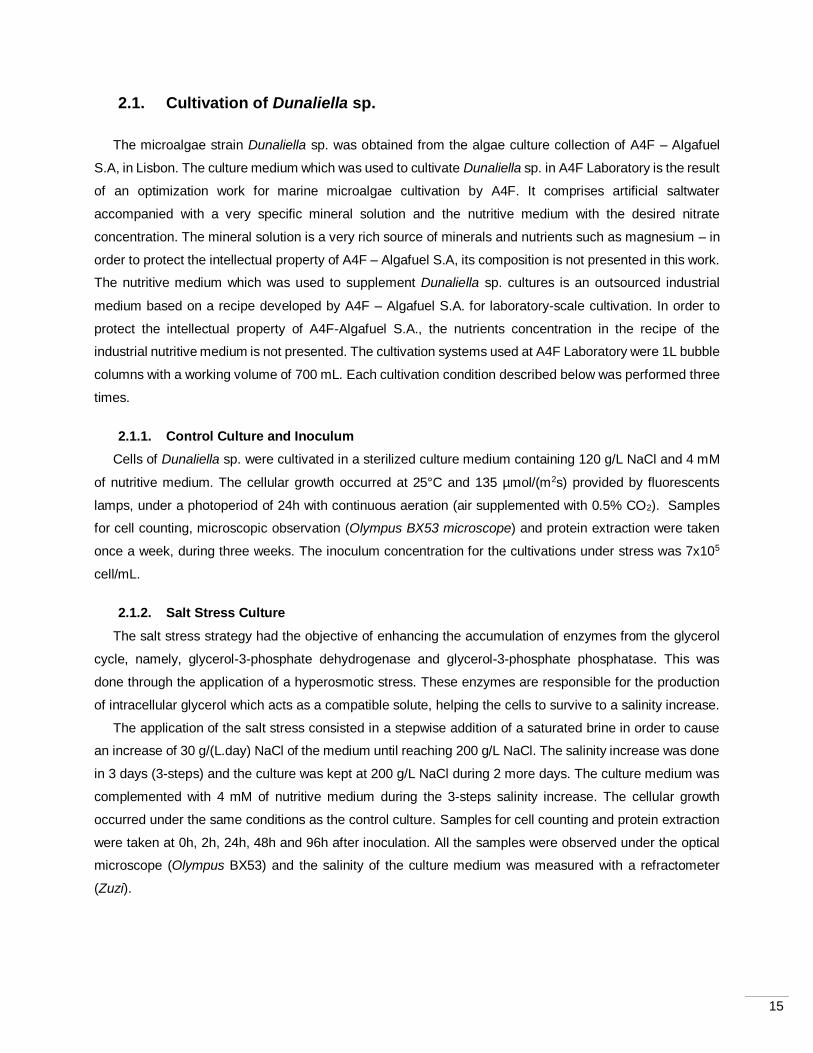
2.1.2. Salt Stress Culture
The salt stress strategy had the objective of enhancing the accumulation of enzymes from the glycerol
cycle, namely, glycerol-3-phosphate dehydrogenase and glycerol-3-phosphate phosphatase. This was
done through the application of a hyperosmotic stress. These enzymes are responsible for the production
of intracellular glycerol which acts as a compatible solute, helping the cells to survive to a salinity increase.
The application of the salt stress consisted in a stepwise addition of a saturated brine in order to cause
an increase of 30 g/(L.day) NaCl of the medium until reaching 200 g/L NaCl. The salinity increase was done
in 3 days (3-steps) and the culture was kept at 200 g/L NaCl during 2 more days. The culture medium was
complemented with 4 mM of nutritive medium during the 3-steps salinity increase. The cellular growth
occurred under the same conditions as the control culture. Samples for cell counting and protein extraction
were taken at 0h, 2h, 24h, 48h and 96h after inoculation. All the samples were observed under the optical
microscope (Olympus BX53) and the salinity of the culture medium was measured with a refractometer
(Zuzi).
16
2.1.3. pH Stress Culture
The pH stress strategy had the objective of enhancing the accumulation of the enzyme carbonic
anhydrase. This enzyme is related with the uptake of inorganic carbon, catalyzing the reversible conversion
of CO2 to bicarbonate (HCO32-). By increasing the pH of the medium, the predominant forms of inorganic
carbon are as bicarbonate and carbonate ions, which increase the expression of carbonic anhydrase in
order to facilitate the assimilation of carbon by the cells.
The application of pH stress consisted in the addition of 2.6 mM Na2CO3 to the culture medium in order
to keep a pH 9. After the first 24h, the pH was corrected by the addition of 1.0 mM Na2CO3. The culture
medium was complemented with 4 mM of nutritive medium at the beginning of the assay. The cellular growth
occurred under the same conditions as the control culture. The duration of the assay was 3 days, the pH
was measured daily by a pH meter (Mettler Toledo) and the culture was observed under an optical
microscope (Olympus BX53). Samples for cell counting and protein extraction were taken at 0h, 24h and
72h after inoculation.
2.1.4. Oxidative Stress Culture
The oxidative stress strategy had the objective of enhancing the accumulation of antioxidant enzymes,
like catalase, ascorbate peroxidase and superoxide dismutase. These enzymes are responsible for the
scavenging of reactive oxygen species (ROS) from the cells. Hydrogen peroxide is a well-known oxidative
stress inducer, capable of entering the cell and damaging its biological components. Since this compound
degrades when exposed to light, to keep the cells always under stress it is necessary to make continuous
additions.
The application of the oxidative stress consisted in keeping the culture subjected to, approximately, 343
µM H2O2. This concentration was not monitored throughout the experiment. A concentrated solution of
hydrogen peroxide (300 mM H2O2) was added to the culture medium in pulse additions (1min/h) by a
peristaltic pump (Seko) with a volumetric flow of 800 µL/min. The culture medium was complemented with
4 mM of nutritive medium at the beginning of the assay. The cellular growth occurred under the same
conditions as the control culture. The duration of the assay was 3 days, the pH was measured daily by a pH
meter (Mettler Toledo) and the culture was observed under an optical microscope (Olympus BX53).
Samples for cell counting and protein extraction were taken at 0h, 24h and 72h after inoculation.
2.1.5. Induction Culture
The induction culture consists in the exposure of cells to high light intensities and deprivation of nutrients,
in order to promote the production of β-carotene. These conditions had the objective of understand the
protein differences between green and orange Dunaliella cells.
Dunaliella sp. cells were cultivated in a sterilized culture medium containing 120 g/L NaCl and 0.3 mM
of nutritive medium. The cellular growth occurred under the same conditions as the control culture except
for the light intensity which was higher than 150 µmol/(m2s). The inoculum concentration was 3x10⁵ cell/mL,
17
in order to avoid the shadowing effect between cells. Samples for cell counting, microscopic observation
(Olympus BX53 microscope) and protein extraction were taken once a week, during three weeks.
2.2. Estimation of Cell Number
The culture samples taken during the time of the experiment were counted using a Neubauer
haemocytometer (Marienfeld) at A4F Laboratory. To immobilize the cells before counting, two drops of
concentrated Lugol’s liquor was added to 3 mL of each culture sample.
2.3. Protein Extraction
The protein extraction consisted in the cell rupture of the culture samples. The first extraction procedure
was a mechanical cell rupture using zirconia beads and the second procedure was an osmotic shock. Two
types of culture samples were used in the extraction, fresh culture samples and freeze-dried samples. These
protocols were developed at A4F Laboratory.
2.3.1. Mechanical Cell Rupture
The protein extracts were obtained according to the Protocol for Pigments quantification implemented at
A4F Laboratory.
2.3.1.1. Fresh Culture Samples
3 mL of the samples taken during the time of the experiments were centrifuged (Hermle Z 400 K) at
4250g for 15 min at 4°C. The algal pellets were ressuspended in 3 mL of deionized water and 4.6 g of
zirconia beads (mixture of 0.5 mm and 1.0 mm diameters) were added followed by vortex during 10 min.
Then, the extracts were centrifuged (Hermle Z 400 K) at 4250g for 15 min at 4°C. A sample of the protein
extracts was used for protein quantification and the remaining sample was frozen at -20°C until further
analysis. From each culture duplicated samples were analyzed.
2.3.1.2. Freeze-dried Biomass Samples
The freeze-dried biomass of Dunaliella sp. was ressuspended in 100 mM Tris-HCl buffer (pH 6.9) in
order to obtain a biomass concentration of 0.5 g/L. To this suspension, 1 g of zirconia beads (0.5+1.0 mm)
was added followed by vortex during 10 min. A sample of the protein extract was used for protein
quantification. From each culture duplicated samples were analyzed.
2.3.2. Osmotic Shock
2.3.2.1. Fresh Culture Samples
3 mL of culture samples taken during the time of the experiments were centrifuged (Hermle Z 400 K ) at
4250g for 15 min at 4°C. The algal pellets were ressuspended in 3 mL of 100 mM Tris-HCl buffer (pH 6.9).
18
A sample of the protein extracts was used for protein quantification and the remaining sample was frozen
at -20°C until further analysis. From each culture duplicated samples were analyzed.
2.3.2.2. Freeze-dried Biomass Samples
The freeze-dried biomass of Dunaliella sp. was ressuspended in 100 mM Tris-HCl buffer (pH 6.9) in
order to obtain a biomass concentration of 0.5 g/L. A sample of the protein extracts was used for protein
quantification. From each culture duplicated samples were analyzed. A freeze-dried sample of Spirulina
was also analyzed as a benchmark of a commercial microalgae species known to be rich in protein.
2.4. Microdialysis
Microdialysis was applied to fresh culture samples in order to remove the excess glycerol present in the
extracts, allowing a correct protein quantification. This technique consisted in the replacement of the
Eppendorf tubes stopper by a porous regenerated cellulose membrane with a cut-off of 3.5 kDa (OrDial
D35, Orange Scientific) held by a tight elastic rubber. The microtubes were then inverted, in order to keep
the protein extracts near the membrane, and placed in 1 L of dialysis buffer (100 mM Tris-HCl buffer pH
6.9), in a maximum of 10 microtubes. The procedure occurred overnight under gentle magnetic stirring at
4°C. This technique was developed at iBB laboratory at IST.
2.5. Quantification of Proteins
Protein quantification of the extracts was performed, after applying microdialysis, using Pierce™ BCA
Protein Assay Kit (Thermo Scientific), and the methodology protocol was implemented at A4F Laboratory.
The calibration curve and quantification assays were performed according to the manufacturer’s instructions
(with minor modifications). For the calibration curves, a 2 mg/mL of bovine serum albumin (BSA) solution
was prepared with the working buffers (deionized water, 100 mM Tris-HCl buffer and 100 mM Tris-HCl plus
2.5% (v/v) glycerol). The three BSA solutions were then diluted in order to obtain three series of standard
solutions of known concentrations. The concentrations of the standard solutions ranged from 0 (blank) to
500 µg/mL. In a 96-well microplate, 25 µL of each standard solution or unknown sample were mixed with
200 µL of BCA working reagent (prepared according to manufacturer’s instructions). The microplate was
shaken during 30s and then incubated for 30 min at 37°C on a microplate reader (SPECTROstar Nano,
BMG LABTECH). After the incubation period, the mixtures in the microplate were cooled for 5 min and their
absorbance measured at 562 nm (SPECTROstar Nano, BMG LABTECH). All unknown samples or standard
solutions were measured in quadruplicate. For the standard solutions, the average absorbance was plotted
as a function of BSA concentrations in order to obtain the calibration curves. For the unknown samples,
their protein concentrations ([𝑃𝑟𝑜𝑡]𝑚) were estimated using the average absorbance data and the
respective calibration curve. The determination of the protein content (%DW) of each samples was done
using Equation 1. The values of cell dry weight (𝐶𝑒𝑙𝑙 𝑊𝑒𝑖𝑔ℎ𝑡) used were previously determined by workers
of A4F Laboratory.
19
𝑃𝑟𝑜𝑡𝑒𝑖𝑛 𝐶𝑜𝑛𝑡𝑒𝑛𝑡 (%𝐷𝑊) =[𝑃𝑟𝑜𝑡]𝑚 × 106 × 100
[𝐶𝑒𝑙𝑙] × 𝐶𝑒𝑙𝑙 𝑊𝑒𝑖𝑔ℎ𝑡 𝑬𝒒𝒖𝒂𝒕𝒊𝒐𝒏 𝟏
where [𝑃𝑟𝑜𝑡]𝑚 represents the mean protein concentration in µg/mL, [𝐶𝑒𝑙𝑙] represents cell concentration
in cell/mL and 𝐶𝑒𝑙𝑙 𝑊𝑒𝑖𝑔ℎ𝑡 represents the dry weight of each cell in pg/cell (456 pg/cell for Dunaliella cells
in green phase and 510 pg/cell for Dunaliella cells in orange phase).
2.6. 2D Polyacrylamide Gel Electrophoresis (2D-PAGE)
The 2D-PAGE procedure was adopted from the instructions manual of the PROTEAN® IEF Cell from
Bio-Rad and performed at iBB laboratory at IST. This procedure consisted in three steps – precipitation of
proteins, isoelectric focusing and SDS-PAGE.
2.6.1. Precipitation of Proteins
The precipitation of the protein samples, to be separated by 2D-PAGE, was necessary in order to change
the buffers and to eliminate possible interfering substances. The proteins were precipitated according to
Acetone Precipitation of Proteins from Thermo Scientific. The solvent used to precipitate the proteins was
cold acetone (-20°C). To a volume of sample corresponding to 110 µg of protein, was added 4 times the
sample volume of cold acetone, the mixture was vortexed and then incubated overnight at -20°C. After the
incubation period, the tube containing the mixture was centrifuged (Centrifuge 5810R, Eppendorf) at
13000g, for 15 min at 4°C. The supernatant was discarded and the remaining acetone was allowed to
evaporate from the uncapped tube during 30 min. After this period, the pellet was ressuspended in 137.5
µL of rehydration buffer (RH buffer – 8 M urea, 2% CHAPS, 50 mM DTT, 0.2% Bio-Lyte®3/10 ampholyte,
0.001% bromophenol Blue). The protein samples were then separated by isoelectric focusing.
2.6.2. Isoelectric Focusing
The isoelectric focusing (IEF) of the protein samples allows the separation of the proteins by their
isoelectric point (pI). The equipment used was PROTEAN® IEF Cell from Bio-Rad. This technique was
performed on IPG strips with a linear 3-10 pH gradient (ReadyStrip IPG Strips, Bio-Rad). The rehydration
step consisted on the addition of 125 µL of RH buffer (containing 100 µg of proteins) to the focusing tray.
Then the IPG strip was placed, gel side down, on the focusing tray and the passive rehydration occurred
during 12h at 20°C. After this period, the isoelectric focusing started. The IEF was done at 250 V for 15 min,
followed by 4000 V for 1h, 4000 V in linear mode to reach a total of 15000 Vh and finally a holding period
at 500 V. After the IEF, the IPG strips were either moved to the SDS-PAGE step or stored at -70°C until
further analysis.
2.6.3. SDS-PAGE
The sodium dodecyl sulfate polyacrylamide gel electrophoresis (SDS-PAGE) was performed in order to
separate the proteins present in the IPG strips by their molecular weight. The first step was the equilibration
20
of the IPG strips in order to give a negative charge to all proteins (by SDS detergent – first equilibration
solution) and to reduce the thiol groups of the proteins (by iodoacetamide present in the second equilibration
solution). The equilibration step consisted in the incubation of the IPG strip in equilibration buffer I (EB-I
buffer – 6 M urea, 30% glycerol, 2% SDS, 375 mM Tris-HCl (pH 8.8), 2% DTT) during 10 min at 25°C
followed by 10 min incubation in equilibration buffer II (EB-II buffer – 6 M urea, 30% glycerol, 2% SDS, 375
mM Tris-HCl (pH 8.8), 2.5% iodoacetamide). After the equilibration step, the IPG strips were immersed in
Running buffer 1x (25 mM Tris-HCl buffer pH 8.3, 192 mM glycine, 1% SDS) and placed on the top of a
SDS-PAGE gel (Mini-Protean TGX Gel Any kD, Bio-Rad). 5 µL of molecular weight marker (Precision Plus
Protein Standards 250-10kDa, Bio-Rad) was placed in a piece of filter paper that then was placed on the
top of the SDS-PAGE gel. The IPG strip and the marker were sealed with a solution of 0.5% (w/v) agarose.
The separation of the proteins occurred at 200 V (Mini Protean tetra system, Bio-Rad) until the dye front
reached the end of the gel.
2.6.4. Gel Staining, Scanning and Analysis
The staining of the 2D electrophoresis gels was obtained according to the Silver Staining Protocol
implemented at iBB laboratory at IST.
The silver staining of the gels started with the fixation step with a solution containing 30% (v/v) ethanol
and 10% (v/v) acetic acid during 2h followed by 3 washing steps. The first washing step was done with 30%
(v/v) ethanol during 10 min followed by two washing steps of 10 min each with deionized water. The
sensibilization step was performed with 0.02% (w/v) sodium thiosulfate during 1 min followed by 3 washing
steps of 30 s each with deionized water. The next step was the staining with 0.15% (m/v) silver nitrate during
30 min followed by a washing step with deionized water during 1 min. The development step was done with
a solution containing 3% (m/v) sodium carbonate and 0.05% (v/v) formaldehyde. This solution was applied
until the appearance of brown bands in the gel. The stopping reaction occurred by the addition of 5% (v/v)
acetic acid during 15 min. At the end of the staining procedure, the gel was scanned in a densitometer (GS-
800 Calibrated Densitometer, Bio-Rad). The scanned gel images were analyzed by PDQuest Advanced
software (from Bio-Rad). The analysis consisted in the identification of protein spots that differed in density
between the control and the stress conditions. When the protein spots differed between the two conditions
in study in a 2.0 fold change, this was designated as a significant change. The estimation of the molecular
weight (MW) and isoelectric point (pI) of each spot was done with the help of ImageJ software.
2.7. Protein Fractionation
The chromatographic fractionation procedure was implemented based on published work, [30], and the
methodology was developed at iBB laboratory at IST. The protein samples for the fractionation assays were
concentrated until a final protein concentration around 0.5 g/L. This was necessary in order to use small
injection volumes and to obtain chromatograms with detectable peaks.
21
2.7.1. Concentration of Protein Samples
The first concentration step of the proteins samples occurred during the extraction procedure. 50 mL of
the samples from 96h of exposure to salt stress were centrifuged (Hermle Z 400 K) at 4250g for 15 min at
4°C. The algal pellets were ressuspended in 10 mL of 100 mM Tris-HCl buffer (pH 6.9), resulting in a
concentration factor (CF) of 5. A portion of the protein extracts were quantified by BCA protein quantification
and the remaining were concentrated, further, by ultrafiltration, as indicated below.
The second concentration step (with a CF of 2) was done using a 4 mL centrifugal filtration unit with 3
kDa membrane (Amicon® Ultra–4, from Millipore). 4 mL of protein sample were placed in the Amicon unit
and centrifuged (Centrifuge 5810R, Eppendorf) at 3220g during 7 min at 4°C. The process was repeated
until the desired volume of concentrated solution was reached. Then, the concentrated protein solution was
recovered from the Amicon unit and microdialyzed in a solution containing 100 mM Tris-HCl buffer (pH 6.9)
and 2.5% (v/v) glycerol (procedure described in section 2.4).
After the two concentration steps, the final concentration factor obtained was 10.
2.7.2. Anion Exchange Chromatography
The fractionation assays of the protein samples were made by anion exchange chromatography using a
prepacked 1 mL HiTrap DEAE FF column (HiTrap™ IEX Selection Kit, from GE Healthcare) and the system
ÄKTA Purifier 10 (GE Healthcare). The software used to define the chromatographic methods and record
the chromatograms was Unicorn 5.11 (GE Healthcare). For all the assays, the absorbance at 280 nm and
the conductivity of buffer solutions exiting the column were recorded.
Four fractionation assays were made using different amounts of protein sample and operational modes
of elution – linear and step elution. The loading/washing buffer was composed by 100 mM Tris-HCl buffer
(pH 6.9) and 2.5% (v/v) glycerol. The elution and regeneration buffers also contain NaCl (400 mM and 1 M,
respectively). The sequence of steps during each assay consisted in: equilibrium of the chromatographic
column with loading buffer, to facilitate the binding of the protein of interest; sample loading; wash of the
column with washing buffer to eliminate the non-binding proteins; elution and regeneration of the column,
to eliminate all the proteins that remained attached to the column after the elution step.
2.7.2.1. 2L Assay
For this chromatography, 2 mL of sample was injected into the column (the loop was loaded with 2.5
mLof sample). 10 CV (column volumes) were used to wash the column. Linear elution was done using 20
CV of elution buffer with different concentrations of NaCl ranging from 0 to 400 mM. After the elution step,
the column was regenerated with 10 CV of regeneration buffer in order to remove all the proteins that
remained attached to the column. All the fractions were collected and the ones that corresponded to peaks
were pooled and analyzed by BCA protein quantification (procedure described in section 2.5) and SDS-
PAGE.
22
2.7.2.2. 1L Assay
For this chromatography, 1 mL of sample was injected into the column (the loop was loaded with 1.5 mL
of sample). 5 CV were used to wash the column. Linear elution was done using 35 CV of elution buffer with
different concentrations of NaCl ranging from 0 to 400 mM. After the elution step, the column was
regenerated with 15 CV of regeneration buffer in order to remove all the proteins that remained attached to
the column. All the fractions were collected and the ones that corresponded to peaks were pooled and
analyzed by BCA protein quantification (procedure described in section 2.5) and SDS-PAGE.
2.7.2.3. 1S Assay
For this chromatography, 1 mL of sample was injected into the column (the loop was loaded with 1.5 mL
of sample). 5 CV were used to wash the column. Step elution was done using 10 CV of elution buffer with
different concentrations of NaCl. The first step was programmed to occur at 153 mM NaCl, the second at
196 mM and the last step at 378 mM NaCl, approximately. After the elution, the column was regenerated
with 10 CV of regeneration buffer. All the fractions were collected and the ones that corresponded to peaks
were pooled and analyzed by BCA protein quantification (procedure described in section 2.5) and SDS-
PAGE.
2.7.2.4. 5S Assay
For this chromatography, 5 mL of sample was injected into the column (the loop was loaded with 5.5 mL
of sample). 20 CV were used to wash the column. Step elution was done using 15 CV of elution buffer with
different concentrations of NaCl. The first step was programmed to occur at 153 mM NaCl and the second
step at 378 mM NaCl, approximately. After the elution, the column was regenerated with 15 CV of
regeneration buffer. All the fractions were collected and the ones that corresponded to peaks were pooled
and analyzed by BCA protein quantification (procedure described in section 2.5) and SDS-PAGE.
2.7.3. SDS-PAGE
The SDS-PAGE procedure used was the BERG procedure implemented in iBB laboratory at IST.
The electrophoresis was run in vertical 12% resolving and 4% stacking gels. The resolving gel was
composed by 11.68% acrylamide/bis-acrylamide 40% solution, 1x resolving buffer (0.375 M Tris-HCl (pH
8.8), 0.1% SDS), 0.05% TEMED and APS. The stacking gel was composed by 3.89% acrylamide/bis-
acrylamide 40% solution, 1x stacking buffer (0.125 M Tris-HCl (pH 6.9), 0.1% SDS), 0.10% TEMED and
0.05% APS.
The preparation of the samples to be analyzed consisted in the addition of 20 µL of protein sample with
25 µL of Laemmli sample buffer (Bio-Rad) and 5 µL of DTT. This mixture was heated at 100°C during 10
min and then cooled at room temperature.
For the electrophoresis run, each gel lane was loaded with 20 µL of the mixture containing the protein
samples or 3 µL of molecular weight marker (Precision Plus Protein Standards 250-10kDa, Bio-Rad). The
23
separation of the proteins occurred at 90 V (Mini Protean tetra system, Bio-Rad) until the dye front reached
the end of the gel. After the run, gels were silver stained and scanned as already described in section 2.6.4.
The estimation of the molecular weight of the proteins and the possible identification of the protein
G3PDH was done using ImageJ software.
2.8. Acid Gelation
The acid gelation procedure was based on [33], with some modifications, and was performed at iBB
laboratory at IST. This procedure had the objective of understanding the gelation capacity of the protein
fractions obtained by anion exchange chromatography.
Two types of gels were attempted prepared from native and heat denatured protein samples, and two
different concentrations of gluconic acid were tested – 0.5% and 1.0% (w/v), in order to see the effect of
different pH in the gelation capacity. The amount of gluconic acid added to each protein sample was in the
powder form in order to avoid the dilution of the protein samples.
For the heat denatured proteins, 750 µL of protein sample were heated at 96°C during 15 min in a water
bath, followed by cooling to room temperature in an ice bath. After that, the respective quantities of gluconic
acid powder were added and samples were homogenized.
For the native proteins, the respective quantities of gluconic acid powder were added to 750 µL of protein
sample and homogenized.
The control samples consisted only in native and heat denatured protein samples, 750 µL each (gluconic
acid powder was not added to these samples).
The acidified protein samples were kept at room temperature during 24h for gel formation. For each
condition duplicated samples were prepared. Then, the pH of the samples was measured with a pH meter
and the particles size (diameter) was measured by DLS (dynamic light scattering) using Zetasizer software
(Zetasizer Nano ZS, from Malvern). In the measurement of particles size, each sample was measured three
successive times. The results from this measurement were a particles size (Z-Average, nm) and the
respective polydispersity index (Pdl).
2.9. Statistical Analysis
The protein content data present herein resulted from calculated mean of three replicated assays. A
statistical analysis was performed to this data using one-way analysis of variance (ANOVA) using Microsoft
Excel software. This analysis was applied between the protein content value of each stress sample taken
during the time of the experiment and the 0h stress sample and also between the protein content value of
the induction culture and the control culture, for each replicated assay. Significance was determined at a p-
value inferior to 0.05.
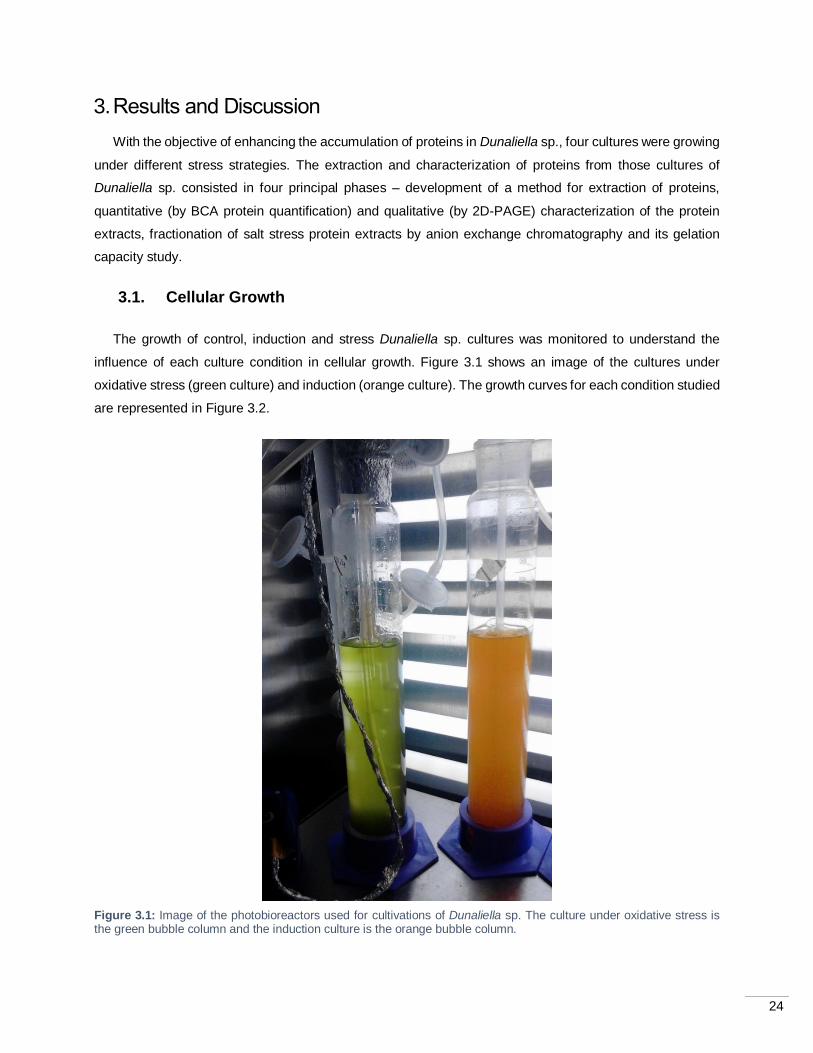
24
3. Results and Discussion
With the objective of enhancing the accumulation of proteins in Dunaliella sp., four cultures were growing
under different stress strategies. The extraction and characterization of proteins from those cultures of
Dunaliella sp. consisted in four principal phases – development of a method for extraction of proteins,
quantitative (by BCA protein quantification) and qualitative (by 2D-PAGE) characterization of the protein
extracts, fractionation of salt stress protein extracts by anion exchange chromatography and its gelation
capacity study.
3.1. Cellular Growth
The growth of control, induction and stress Dunaliella sp. cultures was monitored to understand the
influence of each culture condition in cellular growth. Figure 3.1 shows an image of the cultures under
oxidative stress (green culture) and induction (orange culture). The growth curves for each condition studied
are represented in Figure 3.2.
Figure 3.1: Image of the photobioreactors used for cultivations of Dunaliella sp. The culture under oxidative stress is the green bubble column and the induction culture is the orange bubble column.
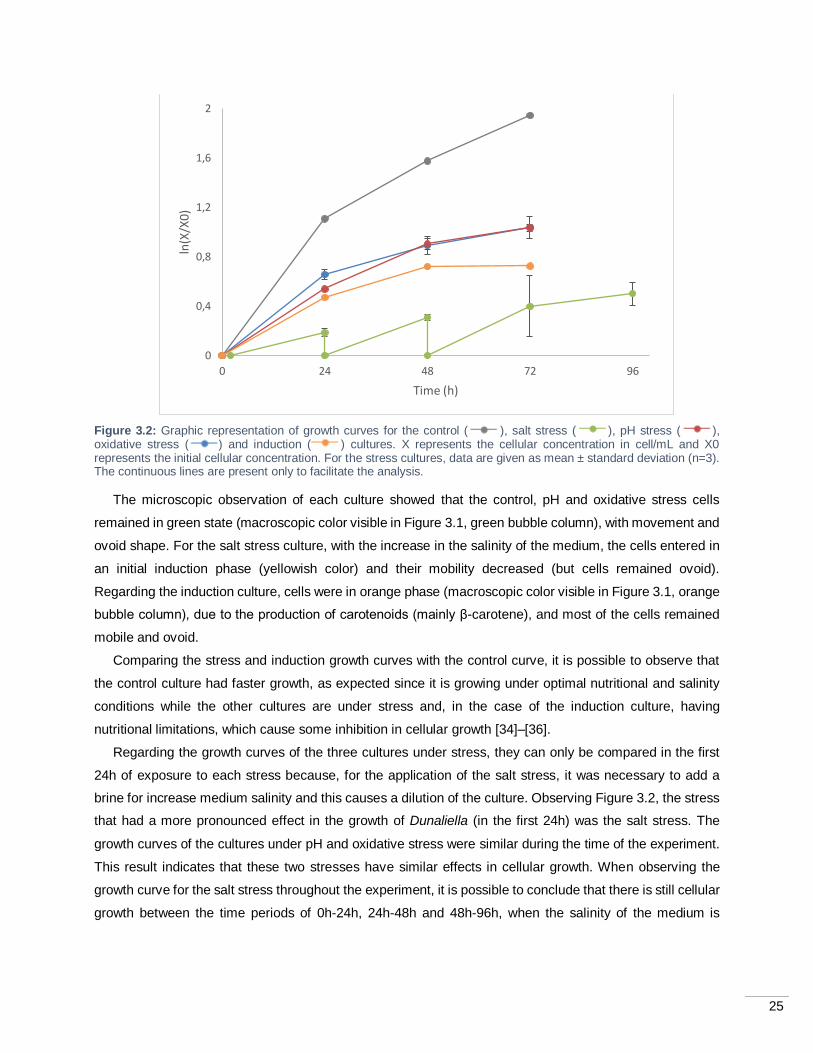
25
Figure 3.2: Graphic representation of growth curves for the control ( ), salt stress ( ), pH stress ( ), oxidative stress ( ) and induction ( ) cultures. X represents the cellular concentration in cell/mL and X0 represents the initial cellular concentration. For the stress cultures, data are given as mean ± standard deviation (n=3). The continuous lines are present only to facilitate the analysis.
The microscopic observation of each culture showed that the control, pH and oxidative stress cells
remained in green state (macroscopic color visible in Figure 3.1, green bubble column), with movement and
ovoid shape. For the salt stress culture, with the increase in the salinity of the medium, the cells entered in
an initial induction phase (yellowish color) and their mobility decreased (but cells remained ovoid).
Regarding the induction culture, cells were in orange phase (macroscopic color visible in Figure 3.1, orange
bubble column), due to the production of carotenoids (mainly β-carotene), and most of the cells remained
mobile and ovoid.
Comparing the stress and induction growth curves with the control curve, it is possible to observe that
the control culture had faster growth, as expected since it is growing under optimal nutritional and salinity
conditions while the other cultures are under stress and, in the case of the induction culture, having
nutritional limitations, which cause some inhibition in cellular growth [34]–[36].
Regarding the growth curves of the three cultures under stress, they can only be compared in the first
24h of exposure to each stress because, for the application of the salt stress, it was necessary to add a
brine for increase medium salinity and this causes a dilution of the culture. Observing Figure 3.2, the stress
that had a more pronounced effect in the growth of Dunaliella (in the first 24h) was the salt stress. The
growth curves of the cultures under pH and oxidative stress were similar during the time of the experiment.
This result indicates that these two stresses have similar effects in cellular growth. When observing the
growth curve for the salt stress throughout the experiment, it is possible to conclude that there is still cellular
growth between the time periods of 0h-24h, 24h-48h and 48h-96h, when the salinity of the medium is
0
0,4
0,8
1,2
1,6
2
0 24 48 72 96
ln(X
/X0)
Time (h)
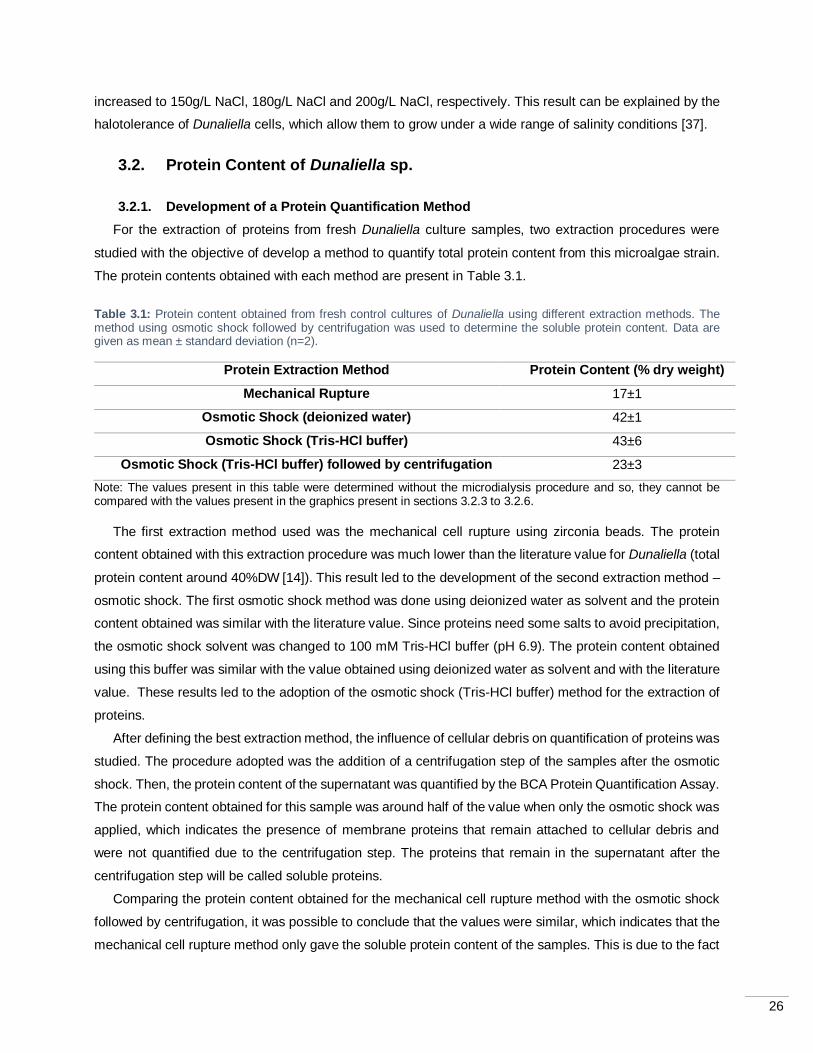
26
increased to 150g/L NaCl, 180g/L NaCl and 200g/L NaCl, respectively. This result can be explained by the
halotolerance of Dunaliella cells, which allow them to grow under a wide range of salinity conditions [37].
3.2. Protein Content of Dunaliella sp.
3.2.1. Development of a Protein Quantification Method
For the extraction of proteins from fresh Dunaliella culture samples, two extraction procedures were
studied with the objective of develop a method to quantify total protein content from this microalgae strain.
The protein contents obtained with each method are present in Table 3.1.
Table 3.1: Protein content obtained from fresh control cultures of Dunaliella using different extraction methods. The method using osmotic shock followed by centrifugation was used to determine the soluble protein content. Data are given as mean ± standard deviation (n=2).
Protein Extraction Method Protein Content (% dry weight)
Mechanical Rupture 17±1
Osmotic Shock (deionized water) 42±1
Osmotic Shock (Tris-HCl buffer) 43±6
Osmotic Shock (Tris-HCl buffer) followed by centrifugation 23±3
Note: The values present in this table were determined without the microdialysis procedure and so, they cannot be compared with the values present in the graphics present in sections 3.2.3 to 3.2.6.
The first extraction method used was the mechanical cell rupture using zirconia beads. The protein
content obtained with this extraction procedure was much lower than the literature value for Dunaliella (total
protein content around 40%DW [14]). This result led to the development of the second extraction method –
osmotic shock. The first osmotic shock method was done using deionized water as solvent and the protein
content obtained was similar with the literature value. Since proteins need some salts to avoid precipitation,
the osmotic shock solvent was changed to 100 mM Tris-HCl buffer (pH 6.9). The protein content obtained
using this buffer was similar with the value obtained using deionized water as solvent and with the literature
value. These results led to the adoption of the osmotic shock (Tris-HCl buffer) method for the extraction of
proteins.
After defining the best extraction method, the influence of cellular debris on quantification of proteins was
studied. The procedure adopted was the addition of a centrifugation step of the samples after the osmotic
shock. Then, the protein content of the supernatant was quantified by the BCA Protein Quantification Assay.
The protein content obtained for this sample was around half of the value when only the osmotic shock was
applied, which indicates the presence of membrane proteins that remain attached to cellular debris and
were not quantified due to the centrifugation step. The proteins that remain in the supernatant after the
centrifugation step will be called soluble proteins.
Comparing the protein content obtained for the mechanical cell rupture method with the osmotic shock
followed by centrifugation, it was possible to conclude that the values were similar, which indicates that the
mechanical cell rupture method only gave the soluble protein content of the samples. This is due to the fact
27
that this method has a centrifugation step after the homogenization with zirconia beads, from which the
membrane proteins linked to cell debris remain in the pellet.
According with the results obtained, the method adopted to extract the proteins from fresh Dunaliella
cultures was the osmotic shock with Tris-HCl buffer and all samples were quantified for total and soluble
protein.
3.2.2. Adequacy of the Protein Quantification Method
The osmotic shock method used to extract proteins from fresh cultures was applied to freeze-dried
samples in order to prove the adequacy of the method to different matrices. The samples used for this
analysis were: two commercial freeze-dried samples from Dunaliella sp. (β-carotene rich) with different
origins and processing conditions and a freeze-dried sample of Spirulina.
The protein contents of these three samples are present in Table 3.2.
Table 3.2: Total protein content of freeze-dried samples using the osmotic shock extraction method. 1The method used in this sample was mechanical rupture using Tris-HCl buffer as solvent (method described in chapter 2, section 2.3.1.2). Data are given as mean ± standard deviation (n=2).
Freeze-dried Sample Protein Content (% dry weight)
Dunaliella sp. (1) 31±5
Dunaliella sp. (2)1 37±2
Spirulina 64±1
Note: During the processing of Dunaliella sp. to obtain freeze-dried samples, a washing step of the cells is used to cause cell rupture in order to obtain β-carotene rich biomass. This step cause the loss of glycerol and soluble proteins.
Figure 3.3: Dunaliella sp. (2) samples before (A) and after (B) the application of zirconia beads.

28
The extracts of Dunaliella sp. (1) sample were obtained using the osmotic shock method, but, to obtain
the extracts from Dunaliella sp. (2) it was necessary to use zirconia beads after the osmotic shock, because
this sample formed powder aggregates (visible in Figure 3.3 (A)).
The protein content results of Dunaliella sp. (1) and (2) freeze-dried samples were 31±5%DW and
37±2%DW, respectively. These values are in agreement with values referred in literature (40%DW [14]),
showing the applicability of the method developed for samples with different matrices.
The sample of Spirulina was analyzed in order to prove the applicability of the total protein method
developed with a microalgae species known by its high protein content. The value obtained for this sample
(Table 3.2) was 64±1%DW. This value is in the range of values present in the literature (protein content for
Spirulina is approximately 60-70%DW [5], [38]) which prove that the protein method developed can be used
with other microalgae species.
3.2.3. Protein Content from Salt Stress Culture
The protein content of salt stress culture, taken during the time of the experiment are represented in
Figure 3.4.
Figure 3.4: Graphic representation of protein content during the time of exposure to the stress, for fresh culture
samples of salt stress. ( ) represents total protein content, ( ) represents total protein content after
microdialysis, ( ) represents soluble protein content after microdialysis and ( ) represents the salinity at each time. Significant differences from the 0h sample are indicated by an asterisk (*; p ≤ 0.05). Data are given as mean ± standard deviation (n=3).
Through analysis of the total protein content of the samples of Dunaliella culture under salt stress, it was
possible to conclude that the values obtained (higher than 50%DW) were very different from the values
referred in the literature (40%DW [14]) and with a great variability (minimum standard deviation obtained
was 21%DW), especially for the 96h sample (74±26%DW), which represents an approximate salinity of 200
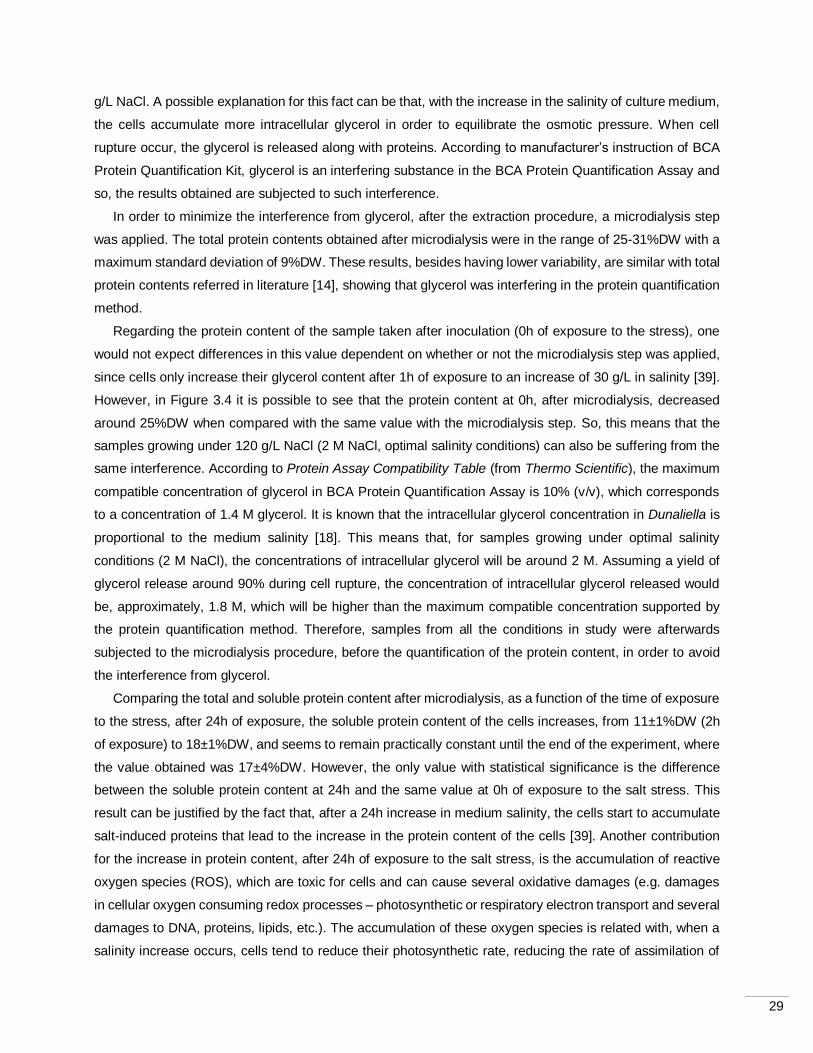
29
g/L NaCl. A possible explanation for this fact can be that, with the increase in the salinity of culture medium,
the cells accumulate more intracellular glycerol in order to equilibrate the osmotic pressure. When cell
rupture occur, the glycerol is released along with proteins. According to manufacturer’s instruction of BCA
Protein Quantification Kit, glycerol is an interfering substance in the BCA Protein Quantification Assay and
so, the results obtained are subjected to such interference.
In order to minimize the interference from glycerol, after the extraction procedure, a microdialysis step
was applied. The total protein contents obtained after microdialysis were in the range of 25-31%DW with a
maximum standard deviation of 9%DW. These results, besides having lower variability, are similar with total
protein contents referred in literature [14], showing that glycerol was interfering in the protein quantification
method.
Regarding the protein content of the sample taken after inoculation (0h of exposure to the stress), one
would not expect differences in this value dependent on whether or not the microdialysis step was applied,
since cells only increase their glycerol content after 1h of exposure to an increase of 30 g/L in salinity [39].
However, in Figure 3.4 it is possible to see that the protein content at 0h, after microdialysis, decreased
around 25%DW when compared with the same value with the microdialysis step. So, this means that the
samples growing under 120 g/L NaCl (2 M NaCl, optimal salinity conditions) can also be suffering from the
same interference. According to Protein Assay Compatibility Table (from Thermo Scientific), the maximum
compatible concentration of glycerol in BCA Protein Quantification Assay is 10% (v/v), which corresponds
to a concentration of 1.4 M glycerol. It is known that the intracellular glycerol concentration in Dunaliella is
proportional to the medium salinity [18]. This means that, for samples growing under optimal salinity
conditions (2 M NaCl), the concentrations of intracellular glycerol will be around 2 M. Assuming a yield of
glycerol release around 90% during cell rupture, the concentration of intracellular glycerol released would
be, approximately, 1.8 M, which will be higher than the maximum compatible concentration supported by
the protein quantification method. Therefore, samples from all the conditions in study were afterwards
subjected to the microdialysis procedure, before the quantification of the protein content, in order to avoid
the interference from glycerol.
Comparing the total and soluble protein content after microdialysis, as a function of the time of exposure
to the stress, after 24h of exposure, the soluble protein content of the cells increases, from 11±1%DW (2h
of exposure) to 18±1%DW, and seems to remain practically constant until the end of the experiment, where
the value obtained was 17±4%DW. However, the only value with statistical significance is the difference
between the soluble protein content at 24h and the same value at 0h of exposure to the salt stress. This
result can be justified by the fact that, after a 24h increase in medium salinity, the cells start to accumulate
salt-induced proteins that lead to the increase in the protein content of the cells [39]. Another contribution
for the increase in protein content, after 24h of exposure to the salt stress, is the accumulation of reactive
oxygen species (ROS), which are toxic for cells and can cause several oxidative damages (e.g. damages
in cellular oxygen consuming redox processes – photosynthetic or respiratory electron transport and several
damages to DNA, proteins, lipids, etc.). The accumulation of these oxygen species is related with, when a
salinity increase occurs, cells tend to reduce their photosynthetic rate, reducing the rate of assimilation of
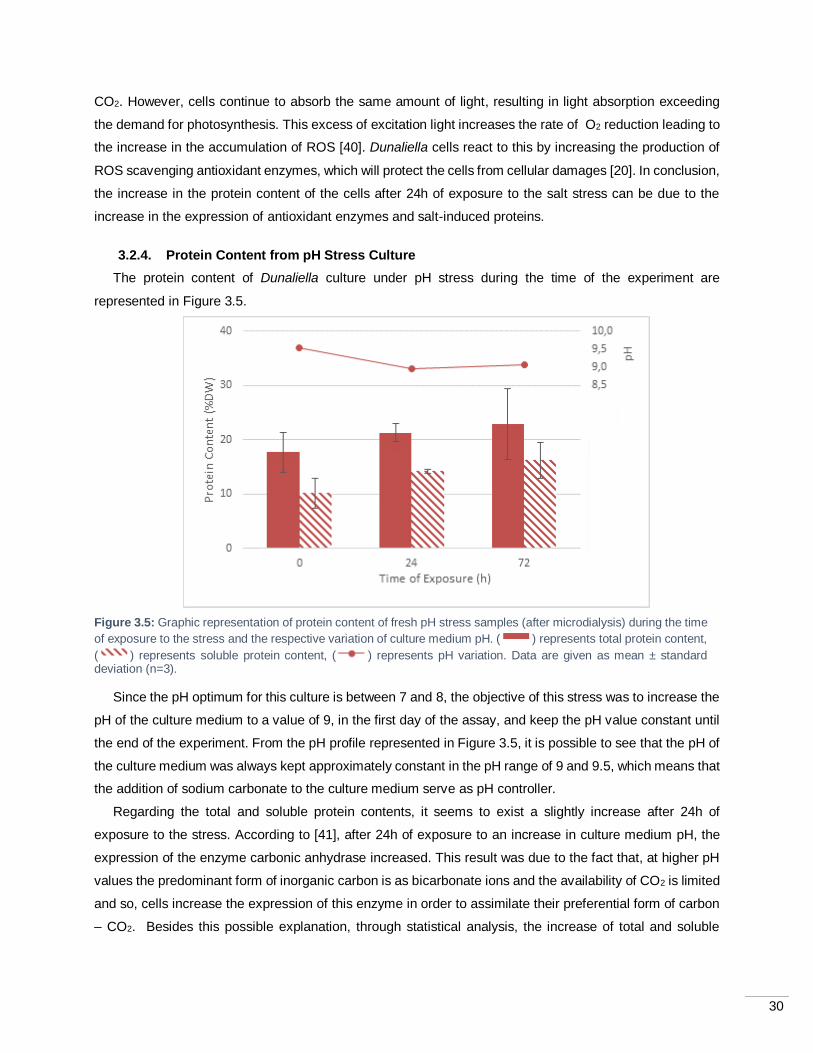
30
CO2. However, cells continue to absorb the same amount of light, resulting in light absorption exceeding
the demand for photosynthesis. This excess of excitation light increases the rate of O2 reduction leading to
the increase in the accumulation of ROS [40]. Dunaliella cells react to this by increasing the production of
ROS scavenging antioxidant enzymes, which will protect the cells from cellular damages [20]. In conclusion,
the increase in the protein content of the cells after 24h of exposure to the salt stress can be due to the
increase in the expression of antioxidant enzymes and salt-induced proteins.
3.2.4. Protein Content from pH Stress Culture
The protein content of Dunaliella culture under pH stress during the time of the experiment are
represented in Figure 3.5.
Figure 3.5: Graphic representation of protein content of fresh pH stress samples (after microdialysis) during the time
of exposure to the stress and the respective variation of culture medium pH. ( ) represents total protein content,
( ) represents soluble protein content, ( ) represents pH variation. Data are given as mean ± standard deviation (n=3).
Since the pH optimum for this culture is between 7 and 8, the objective of this stress was to increase the
pH of the culture medium to a value of 9, in the first day of the assay, and keep the pH value constant until
the end of the experiment. From the pH profile represented in Figure 3.5, it is possible to see that the pH of
the culture medium was always kept approximately constant in the pH range of 9 and 9.5, which means that
the addition of sodium carbonate to the culture medium serve as pH controller.
Regarding the total and soluble protein contents, it seems to exist a slightly increase after 24h of
exposure to the stress. According to [41], after 24h of exposure to an increase in culture medium pH, the
expression of the enzyme carbonic anhydrase increased. This result was due to the fact that, at higher pH
values the predominant form of inorganic carbon is as bicarbonate ions and the availability of CO2 is limited
and so, cells increase the expression of this enzyme in order to assimilate their preferential form of carbon
– CO2. Besides this possible explanation, through statistical analysis, the increase of total and soluble
4,0
4,5
5,0
5,5
6,0
6,5
7,0
7,5
8,0
8,5
9,0
9,5
10,0
0
10
20
30
40
0 24 72
pH
Pro
tein
Co
nte
nt
(%D
W)
Time of Exposure (h)
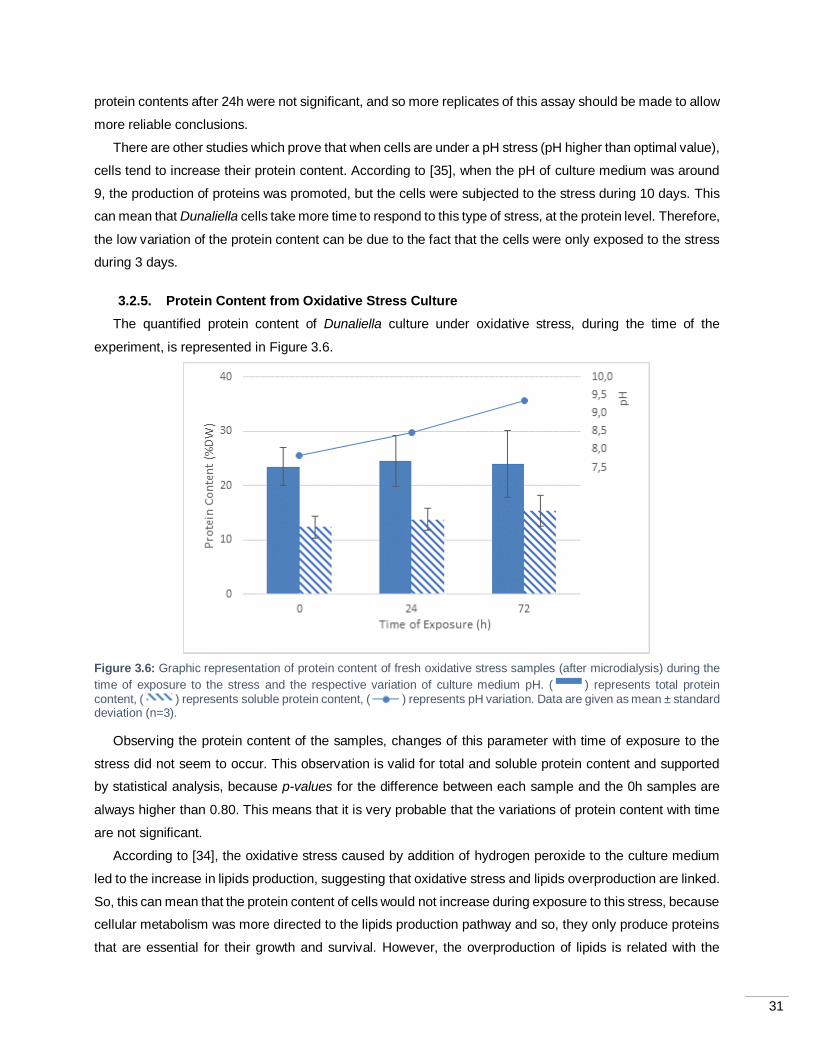
31
protein contents after 24h were not significant, and so more replicates of this assay should be made to allow
more reliable conclusions.
There are other studies which prove that when cells are under a pH stress (pH higher than optimal value),
cells tend to increase their protein content. According to [35], when the pH of culture medium was around
9, the production of proteins was promoted, but the cells were subjected to the stress during 10 days. This
can mean that Dunaliella cells take more time to respond to this type of stress, at the protein level. Therefore,
the low variation of the protein content can be due to the fact that the cells were only exposed to the stress
during 3 days.
3.2.5. Protein Content from Oxidative Stress Culture
The quantified protein content of Dunaliella culture under oxidative stress, during the time of the
experiment, is represented in Figure 3.6.
Figure 3.6: Graphic representation of protein content of fresh oxidative stress samples (after microdialysis) during the
time of exposure to the stress and the respective variation of culture medium pH. ( ) represents total protein
content, ( ) represents soluble protein content, ( ) represents pH variation. Data are given as mean ± standard deviation (n=3).
Observing the protein content of the samples, changes of this parameter with time of exposure to the
stress did not seem to occur. This observation is valid for total and soluble protein content and supported
by statistical analysis, because p-values for the difference between each sample and the 0h samples are
always higher than 0.80. This means that it is very probable that the variations of protein content with time
are not significant.
According to [34], the oxidative stress caused by addition of hydrogen peroxide to the culture medium
led to the increase in lipids production, suggesting that oxidative stress and lipids overproduction are linked.
So, this can mean that the protein content of cells would not increase during exposure to this stress, because
cellular metabolism was more directed to the lipids production pathway and so, they only produce proteins
that are essential for their growth and survival. However, the overproduction of lipids is related with the
4,0
4,5
5,0
5,5
6,0
6,5
7,0
7,5
8,0
8,5
9,0
9,5
10,0
0
10
20
30
40
0 24 72
pH
Pro
tein
Co
nte
nt
(%D
W)
Time of Exposure (h)
32
production of carotenoids, which would cause a change in the color of cells [42]. Since Dunaliella cells under
oxidative stress remained in green phase (Figure 3.1), the overproduction of lipids did not occur in this
culture. Therefore, a possible reason for the results obtained could be that the conditions used to cause
the stress – time of exposure and concentration of H2O2 – were not sufficient to induce a change in the
protein content. In order to prove this statement, two tests could be made – the increase in the time of the
experiment, higher than 72h, in order to study the response time of cells to oxidative stress and the increase
in hydrogen peroxide concentration, maintaining the same time of exposure, in order to find the right H2O2
concentration that causes oxidative stress in Dunaliella.
3.2.6. Protein Content from Control and Induction Cultures
The protein content of Dunaliella cells in the control and the induction cultures is represented in Figure
3.7.
Figure 3.7: Graphic representation of protein content from the fresh samples of control culture (grey colunms) and
induction culture (orange columns) after microdialysis. ( ; ) represents total protein content and ( ; ) represents soluble protein content. Significant differences from the control sample are indicated by an asterisk (*; p ≤ 0.05). Data are given as mean ± standard deviation (n=3).
The value obtained for the total protein content of the cells in the control culture was 29±5%DW and in
the induction culture the value obtained was 24±3%DW (Figure 3.7). These values are slightly lower than
the values referred in literature (40%DW [14]), however they are similar with the values obtained for the 0h
samples of the salt (26±3%DW), pH (18±4%DW) and oxidative (23±4%DW) stress cultures. Since these
three values represent the protein content of control culture it is possible to conclude that the production of
β-carotene did not seem to affect the total protein content of cells.
Regarding the soluble protein contents, the values obtained for the induced cells (2±1%DW) were
significantly lower than the ones for control culture (17±3%DW). The possible decrease in the protein
content of cells under induction can be due to the fact that this culture was subjected to high light intensities
and nutrient deprivation. When Dunaliella cells are subjected to these conditions, its response is the
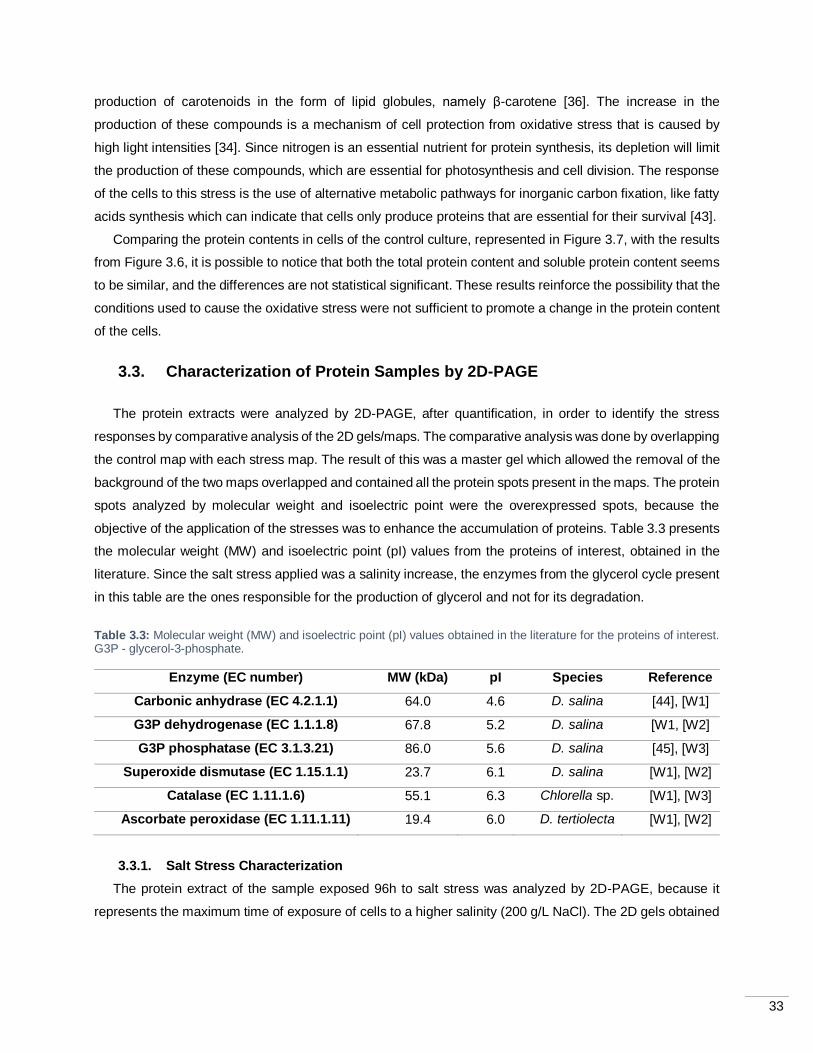
33
production of carotenoids in the form of lipid globules, namely β-carotene [36]. The increase in the
production of these compounds is a mechanism of cell protection from oxidative stress that is caused by
high light intensities [34]. Since nitrogen is an essential nutrient for protein synthesis, its depletion will limit
the production of these compounds, which are essential for photosynthesis and cell division. The response
of the cells to this stress is the use of alternative metabolic pathways for inorganic carbon fixation, like fatty
acids synthesis which can indicate that cells only produce proteins that are essential for their survival [43].
Comparing the protein contents in cells of the control culture, represented in Figure 3.7, with the results
from Figure 3.6, it is possible to notice that both the total protein content and soluble protein content seems
to be similar, and the differences are not statistical significant. These results reinforce the possibility that the
conditions used to cause the oxidative stress were not sufficient to promote a change in the protein content
of the cells.
3.3. Characterization of Protein Samples by 2D-PAGE
The protein extracts were analyzed by 2D-PAGE, after quantification, in order to identify the stress
responses by comparative analysis of the 2D gels/maps. The comparative analysis was done by overlapping
the control map with each stress map. The result of this was a master gel which allowed the removal of the
background of the two maps overlapped and contained all the protein spots present in the maps. The protein
spots analyzed by molecular weight and isoelectric point were the overexpressed spots, because the
objective of the application of the stresses was to enhance the accumulation of proteins. Table 3.3 presents
the molecular weight (MW) and isoelectric point (pI) values from the proteins of interest, obtained in the
literature. Since the salt stress applied was a salinity increase, the enzymes from the glycerol cycle present
in this table are the ones responsible for the production of glycerol and not for its degradation.
Table 3.3: Molecular weight (MW) and isoelectric point (pI) values obtained in the literature for the proteins of interest. G3P - glycerol-3-phosphate.
Enzyme (EC number) MW (kDa) pI Species Reference
Carbonic anhydrase (EC 4.2.1.1) 64.0 4.6 D. salina [44], [W1]
G3P dehydrogenase (EC 1.1.1.8) 67.8 5.2 D. salina [W1, [W2]
G3P phosphatase (EC 3.1.3.21) 86.0 5.6 D. salina [45], [W3]
Superoxide dismutase (EC 1.15.1.1) 23.7 6.1 D. salina [W1], [W2]
Catalase (EC 1.11.1.6) 55.1 6.3 Chlorella sp. [W1], [W3]
Ascorbate peroxidase (EC 1.11.1.11) 19.4 6.0 D. tertiolecta [W1], [W2]
3.3.1. Salt Stress Characterization
The protein extract of the sample exposed 96h to salt stress was analyzed by 2D-PAGE, because it
represents the maximum time of exposure of cells to a higher salinity (200 g/L NaCl). The 2D gels obtained
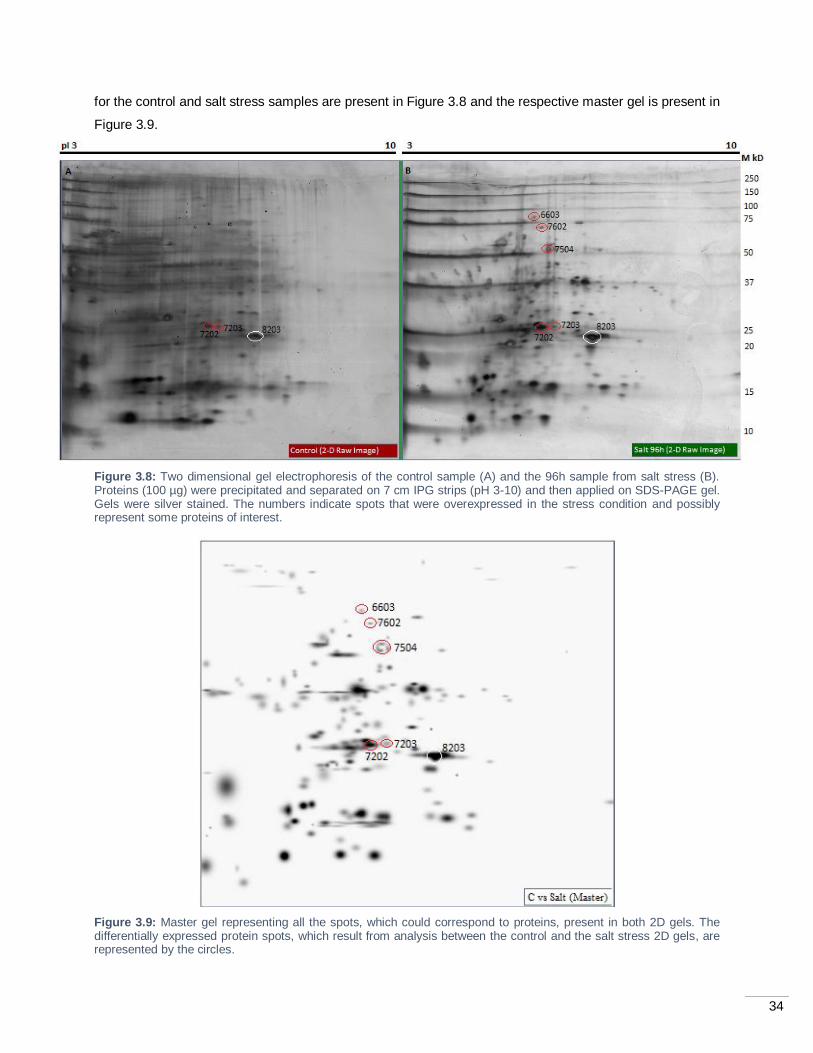
34
for the control and salt stress samples are present in Figure 3.8 and the respective master gel is present in
Figure 3.9.
Figure 3.8: Two dimensional gel electrophoresis of the control sample (A) and the 96h sample from salt stress (B). Proteins (100 µg) were precipitated and separated on 7 cm IPG strips (pH 3-10) and then applied on SDS-PAGE gel. Gels were silver stained. The numbers indicate spots that were overexpressed in the stress condition and possibly represent some proteins of interest.
Figure 3.9: Master gel representing all the spots, which could correspond to proteins, present in both 2D gels. The differentially expressed protein spots, which result from analysis between the control and the salt stress 2D gels, are represented by the circles.
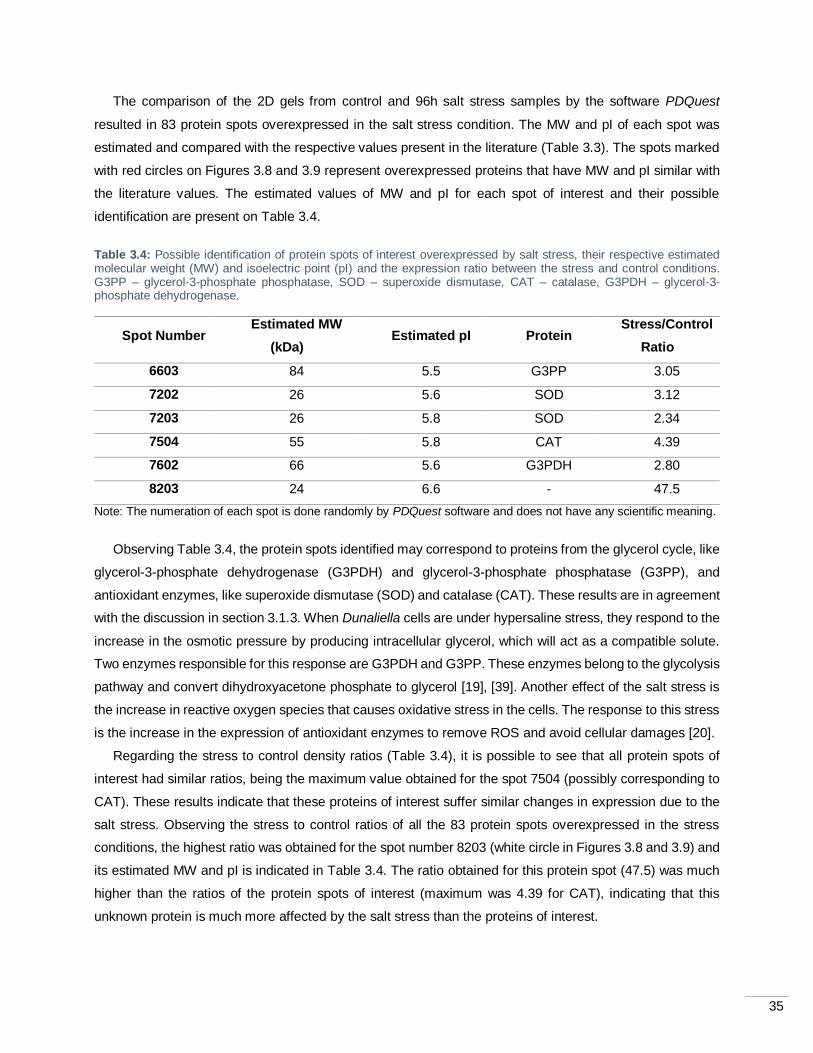
35
The comparison of the 2D gels from control and 96h salt stress samples by the software PDQuest
resulted in 83 protein spots overexpressed in the salt stress condition. The MW and pI of each spot was
estimated and compared with the respective values present in the literature (Table 3.3). The spots marked
with red circles on Figures 3.8 and 3.9 represent overexpressed proteins that have MW and pI similar with
the literature values. The estimated values of MW and pI for each spot of interest and their possible
identification are present on Table 3.4.
Table 3.4: Possible identification of protein spots of interest overexpressed by salt stress, their respective estimated molecular weight (MW) and isoelectric point (pI) and the expression ratio between the stress and control conditions. G3PP – glycerol-3-phosphate phosphatase, SOD – superoxide dismutase, CAT – catalase, G3PDH – glycerol-3-phosphate dehydrogenase.
Spot Number Estimated MW
(kDa) Estimated pI Protein
Stress/Control
Ratio
6603 84 5.5 G3PP 3.05
7202 26 5.6 SOD 3.12
7203 26 5.8 SOD 2.34
7504 55 5.8 CAT 4.39
7602 66 5.6 G3PDH 2.80
8203 24 6.6 - 47.5
Note: The numeration of each spot is done randomly by PDQuest software and does not have any scientific meaning.
Observing Table 3.4, the protein spots identified may correspond to proteins from the glycerol cycle, like
glycerol-3-phosphate dehydrogenase (G3PDH) and glycerol-3-phosphate phosphatase (G3PP), and
antioxidant enzymes, like superoxide dismutase (SOD) and catalase (CAT). These results are in agreement
with the discussion in section 3.1.3. When Dunaliella cells are under hypersaline stress, they respond to the
increase in the osmotic pressure by producing intracellular glycerol, which will act as a compatible solute.
Two enzymes responsible for this response are G3PDH and G3PP. These enzymes belong to the glycolysis
pathway and convert dihydroxyacetone phosphate to glycerol [19], [39]. Another effect of the salt stress is
the increase in reactive oxygen species that causes oxidative stress in the cells. The response to this stress
is the increase in the expression of antioxidant enzymes to remove ROS and avoid cellular damages [20].
Regarding the stress to control density ratios (Table 3.4), it is possible to see that all protein spots of
interest had similar ratios, being the maximum value obtained for the spot 7504 (possibly corresponding to
CAT). These results indicate that these proteins of interest suffer similar changes in expression due to the
salt stress. Observing the stress to control ratios of all the 83 protein spots overexpressed in the stress
conditions, the highest ratio was obtained for the spot number 8203 (white circle in Figures 3.8 and 3.9) and
its estimated MW and pI is indicated in Table 3.4. The ratio obtained for this protein spot (47.5) was much
higher than the ratios of the protein spots of interest (maximum was 4.39 for CAT), indicating that this
unknown protein is much more affected by the salt stress than the proteins of interest.
36
The results obtained were as expected (the salt stress promoted the expression of glycerol cycle
enzymes) and were in agreement with other studies. However, the amino acid sequence of the spots of
interest should be determined, to confirm their protein identity.
3.3.2. pH Stress Characterization
The protein extract of the sample exposed 24h to pH stress was analyzed by 2D-PAGE, because it
seems to represent an increase in the soluble protein content of the cells. The 2D gels obtained for the
control and pH stress samples are present in Figure 3.10 and the respective master gel is present in Figure
3.11.
Figure 3.10: Two dimensional gel electrophoresis of the control sample (A) and the 24h sample from pH stress (B). Proteins (100 µg) were precipitated and separated on 7 cm IPG strips (pH 3-10) and then applied on SDS-PAGE gel. Gels were silver stained. The number indicates a spot that was overexpressed in the stress condition and possibly represents a protein of interest.
The comparison of the 2D gels from control and 24h pH stress samples, by the software PDQuest
resulted in 22 protein spots overexpressed in the stress condition. The MW and pI of each spot was
estimated and compared with the respective values present in the literature (Table 3.3). The spot marked
with a red circle on Figures 3.10 and 3.11 represents an overexpressed protein that has a MW and pI similar
with the literature values for CAT. The estimated value of MW for that spot was 55 kDa and its pI was 6.0
(stress to control ration of 7.48). To confirm the identity of this spot an amino acid sequence analysis should
be done. According to [46], the overexpression of CAT is related with the pH increase due to the addition of
Na2CO3 to the culture medium. In this study, the addition of carbonate ions led to the increase in the
expression of antioxidant enzymes, namely CAT. A possible explanation for this result can be related with
the fact that, under various abiotic stresses, the extent of ROS production exceeds the antioxidant defense
capability of the cell, resulting in cellular damages. To mitigate this, cells increase the expression of
antioxidant enzymes.
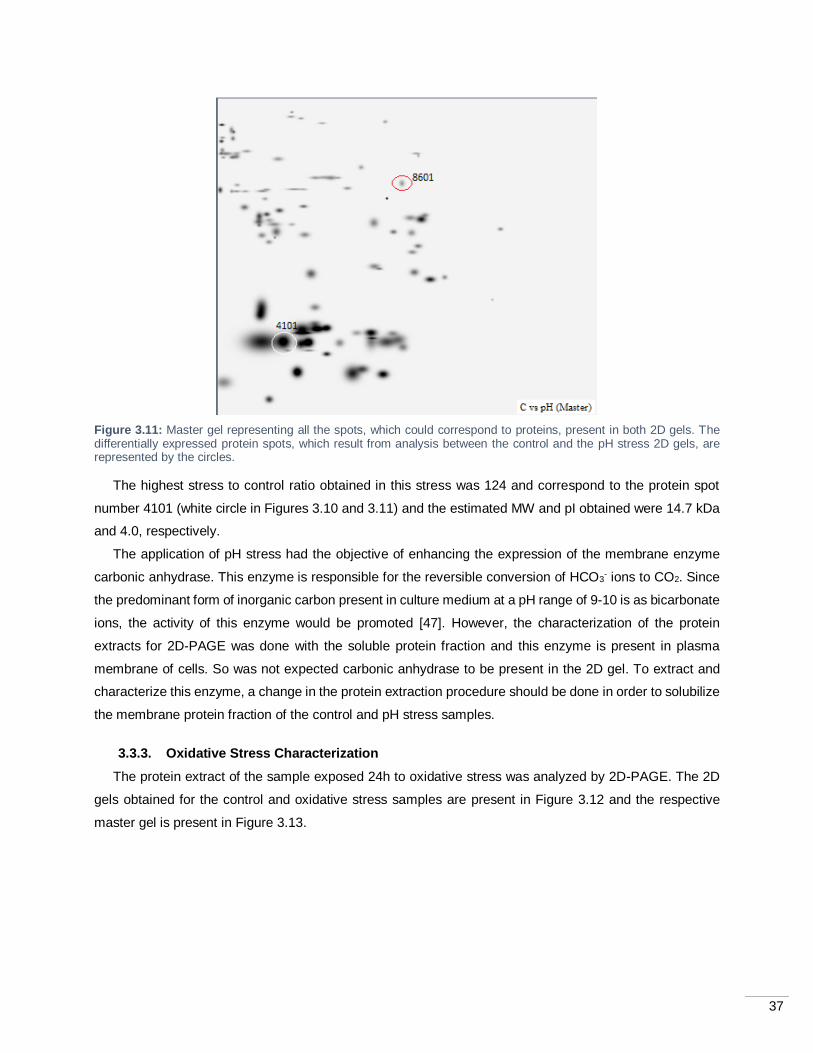
37
Figure 3.11: Master gel representing all the spots, which could correspond to proteins, present in both 2D gels. The differentially expressed protein spots, which result from analysis between the control and the pH stress 2D gels, are represented by the circles.
The highest stress to control ratio obtained in this stress was 124 and correspond to the protein spot
number 4101 (white circle in Figures 3.10 and 3.11) and the estimated MW and pI obtained were 14.7 kDa
and 4.0, respectively.
The application of pH stress had the objective of enhancing the expression of the membrane enzyme
carbonic anhydrase. This enzyme is responsible for the reversible conversion of HCO3- ions to CO2. Since
the predominant form of inorganic carbon present in culture medium at a pH range of 9-10 is as bicarbonate
ions, the activity of this enzyme would be promoted [47]. However, the characterization of the protein
extracts for 2D-PAGE was done with the soluble protein fraction and this enzyme is present in plasma
membrane of cells. So was not expected carbonic anhydrase to be present in the 2D gel. To extract and
characterize this enzyme, a change in the protein extraction procedure should be done in order to solubilize
the membrane protein fraction of the control and pH stress samples.
3.3.3. Oxidative Stress Characterization
The protein extract of the sample exposed 24h to oxidative stress was analyzed by 2D-PAGE. The 2D
gels obtained for the control and oxidative stress samples are present in Figure 3.12 and the respective
master gel is present in Figure 3.13.
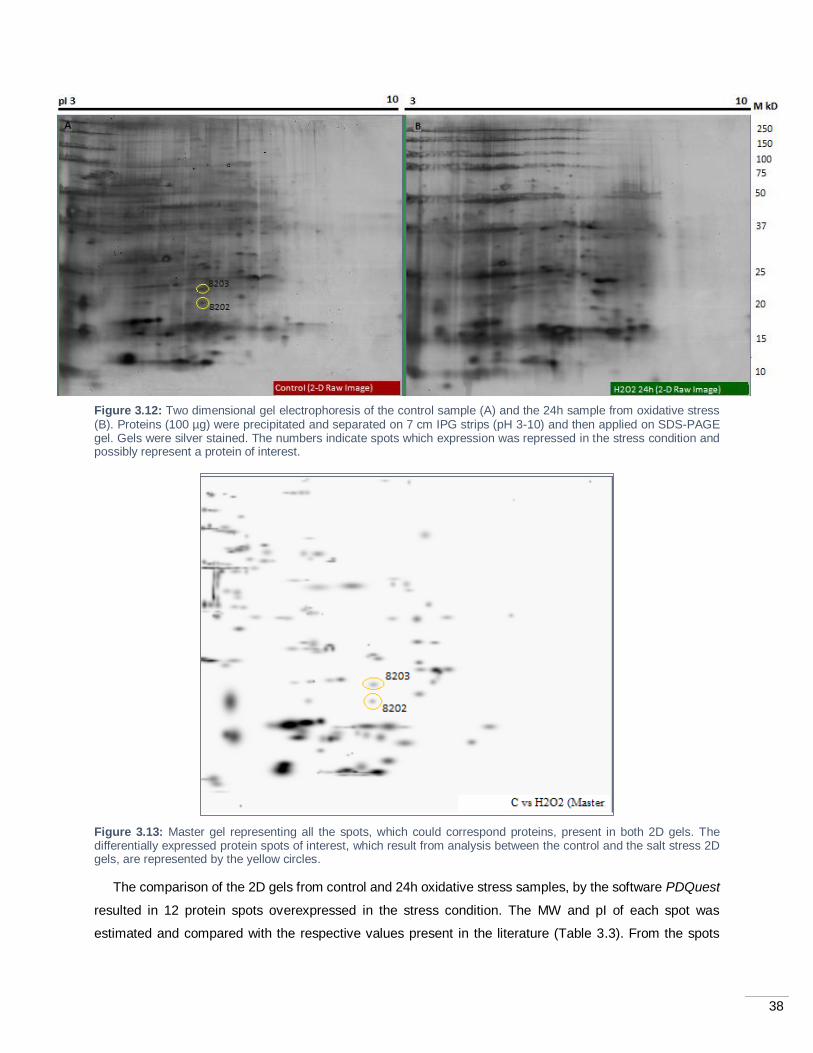
38
Figure 3.12: Two dimensional gel electrophoresis of the control sample (A) and the 24h sample from oxidative stress (B). Proteins (100 µg) were precipitated and separated on 7 cm IPG strips (pH 3-10) and then applied on SDS-PAGE gel. Gels were silver stained. The numbers indicate spots which expression was repressed in the stress condition and possibly represent a protein of interest.
Figure 3.13: Master gel representing all the spots, which could correspond proteins, present in both 2D gels. The differentially expressed protein spots of interest, which result from analysis between the control and the salt stress 2D gels, are represented by the yellow circles.
The comparison of the 2D gels from control and 24h oxidative stress samples, by the software PDQuest
resulted in 12 protein spots overexpressed in the stress condition. The MW and pI of each spot was
estimated and compared with the respective values present in the literature (Table 3.3). From the spots
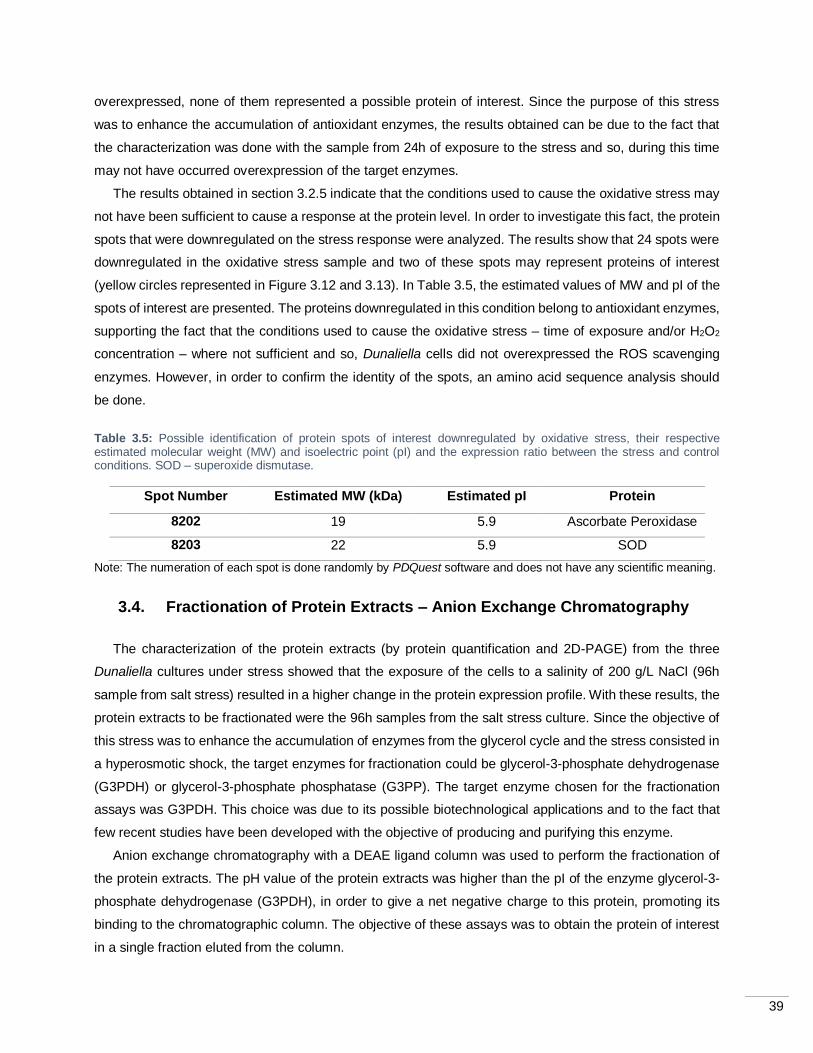
39
overexpressed, none of them represented a possible protein of interest. Since the purpose of this stress
was to enhance the accumulation of antioxidant enzymes, the results obtained can be due to the fact that
the characterization was done with the sample from 24h of exposure to the stress and so, during this time
may not have occurred overexpression of the target enzymes.
The results obtained in section 3.2.5 indicate that the conditions used to cause the oxidative stress may
not have been sufficient to cause a response at the protein level. In order to investigate this fact, the protein
spots that were downregulated on the stress response were analyzed. The results show that 24 spots were
downregulated in the oxidative stress sample and two of these spots may represent proteins of interest
(yellow circles represented in Figure 3.12 and 3.13). In Table 3.5, the estimated values of MW and pI of the
spots of interest are presented. The proteins downregulated in this condition belong to antioxidant enzymes,
supporting the fact that the conditions used to cause the oxidative stress – time of exposure and/or H2O2
concentration – where not sufficient and so, Dunaliella cells did not overexpressed the ROS scavenging
enzymes. However, in order to confirm the identity of the spots, an amino acid sequence analysis should
be done.
Table 3.5: Possible identification of protein spots of interest downregulated by oxidative stress, their respective estimated molecular weight (MW) and isoelectric point (pI) and the expression ratio between the stress and control conditions. SOD – superoxide dismutase.
Spot Number Estimated MW (kDa) Estimated pI Protein
8202 19 5.9 Ascorbate Peroxidase
8203 22 5.9 SOD
Note: The numeration of each spot is done randomly by PDQuest software and does not have any scientific meaning.
3.4. Fractionation of Protein Extracts – Anion Exchange Chromatography
The characterization of the protein extracts (by protein quantification and 2D-PAGE) from the three
Dunaliella cultures under stress showed that the exposure of the cells to a salinity of 200 g/L NaCl (96h
sample from salt stress) resulted in a higher change in the protein expression profile. With these results, the
protein extracts to be fractionated were the 96h samples from the salt stress culture. Since the objective of
this stress was to enhance the accumulation of enzymes from the glycerol cycle and the stress consisted in
a hyperosmotic shock, the target enzymes for fractionation could be glycerol-3-phosphate dehydrogenase
(G3PDH) or glycerol-3-phosphate phosphatase (G3PP). The target enzyme chosen for the fractionation
assays was G3PDH. This choice was due to its possible biotechnological applications and to the fact that
few recent studies have been developed with the objective of producing and purifying this enzyme.
Anion exchange chromatography with a DEAE ligand column was used to perform the fractionation of
the protein extracts. The pH value of the protein extracts was higher than the pI of the enzyme glycerol-3-
phosphate dehydrogenase (G3PDH), in order to give a net negative charge to this protein, promoting its
binding to the chromatographic column. The objective of these assays was to obtain the protein of interest
in a single fraction eluted from the column.
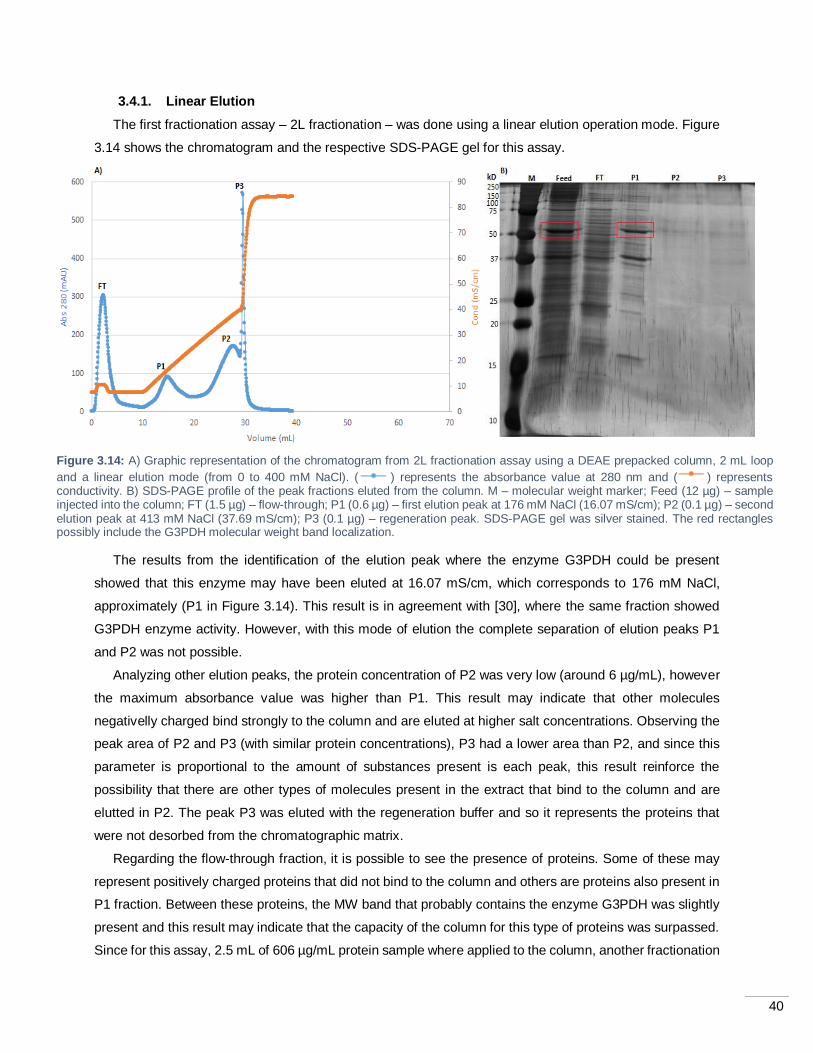
40
3.4.1. Linear Elution
The first fractionation assay – 2L fractionation – was done using a linear elution operation mode. Figure
3.14 shows the chromatogram and the respective SDS-PAGE gel for this assay.
Figure 3.14: A) Graphic representation of the chromatogram from 2L fractionation assay using a DEAE prepacked column, 2 mL loop
and a linear elution mode (from 0 to 400 mM NaCl). ( ) represents the absorbance value at 280 nm and ( ) represents conductivity. B) SDS-PAGE profile of the peak fractions eluted from the column. M – molecular weight marker; Feed (12 µg) – sample injected into the column; FT (1.5 µg) – flow-through; P1 (0.6 µg) – first elution peak at 176 mM NaCl (16.07 mS/cm); P2 (0.1 µg) – second elution peak at 413 mM NaCl (37.69 mS/cm); P3 (0.1 µg) – regeneration peak. SDS-PAGE gel was silver stained. The red rectangles possibly include the G3PDH molecular weight band localization.
The results from the identification of the elution peak where the enzyme G3PDH could be present
showed that this enzyme may have been eluted at 16.07 mS/cm, which corresponds to 176 mM NaCl,
approximately (P1 in Figure 3.14). This result is in agreement with [30], where the same fraction showed
G3PDH enzyme activity. However, with this mode of elution the complete separation of elution peaks P1
and P2 was not possible.
Analyzing other elution peaks, the protein concentration of P2 was very low (around 6 µg/mL), however
the maximum absorbance value was higher than P1. This result may indicate that other molecules
negativelly charged bind strongly to the column and are eluted at higher salt concentrations. Observing the
peak area of P2 and P3 (with similar protein concentrations), P3 had a lower area than P2, and since this
parameter is proportional to the amount of substances present is each peak, this result reinforce the
possibility that there are other types of molecules present in the extract that bind to the column and are
elutted in P2. The peak P3 was eluted with the regeneration buffer and so it represents the proteins that
were not desorbed from the chromatographic matrix.
Regarding the flow-through fraction, it is possible to see the presence of proteins. Some of these may
represent positively charged proteins that did not bind to the column and others are proteins also present in
P1 fraction. Between these proteins, the MW band that probably contains the enzyme G3PDH was slightly
present and this result may indicate that the capacity of the column for this type of proteins was surpassed.
Since for this assay, 2.5 mL of 606 µg/mL protein sample where applied to the column, another fractionation
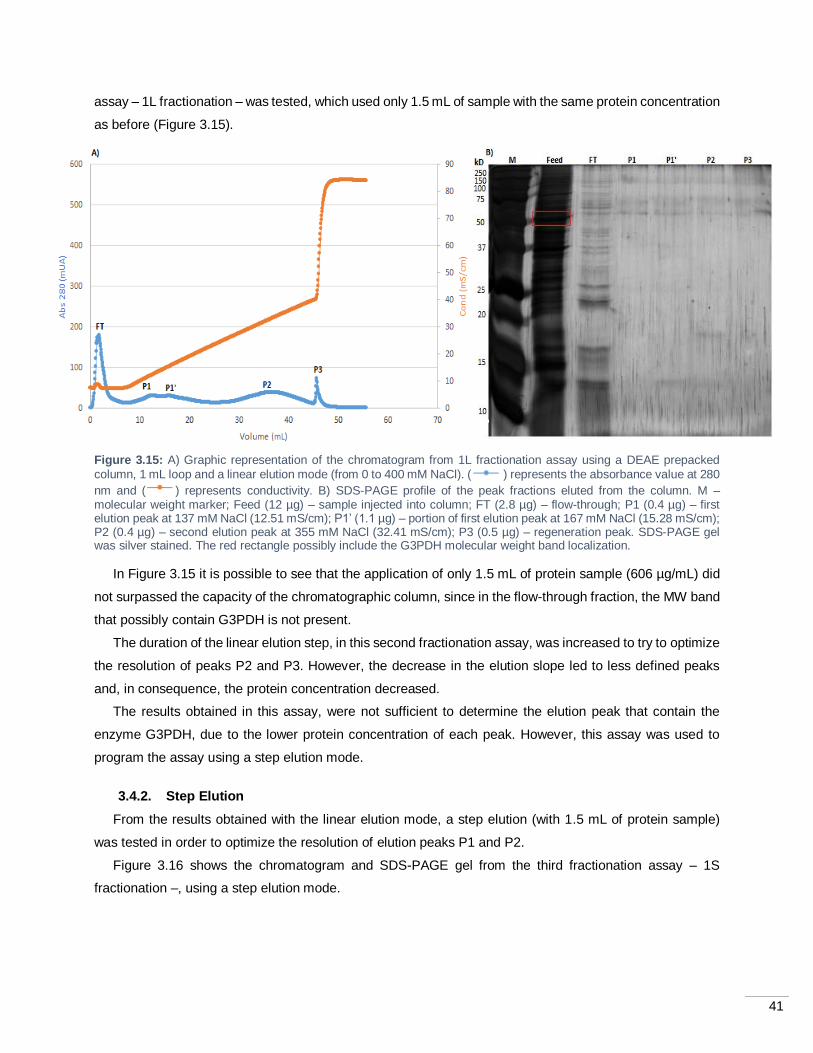
41
assay – 1L fractionation – was tested, which used only 1.5 mL of sample with the same protein concentration
as before (Figure 3.15).
Figure 3.15: A) Graphic representation of the chromatogram from 1L fractionation assay using a DEAE prepacked
column, 1 mL loop and a linear elution mode (from 0 to 400 mM NaCl). ( ) represents the absorbance value at 280
nm and ( ) represents conductivity. B) SDS-PAGE profile of the peak fractions eluted from the column. M – molecular weight marker; Feed (12 µg) – sample injected into column; FT (2.8 µg) – flow-through; P1 (0.4 µg) – first elution peak at 137 mM NaCl (12.51 mS/cm); P1’ (1.1 µg) – portion of first elution peak at 167 mM NaCl (15.28 mS/cm); P2 (0.4 µg) – second elution peak at 355 mM NaCl (32.41 mS/cm); P3 (0.5 µg) – regeneration peak. SDS-PAGE gel was silver stained. The red rectangle possibly include the G3PDH molecular weight band localization.
In Figure 3.15 it is possible to see that the application of only 1.5 mL of protein sample (606 µg/mL) did
not surpassed the capacity of the chromatographic column, since in the flow-through fraction, the MW band
that possibly contain G3PDH is not present.
The duration of the linear elution step, in this second fractionation assay, was increased to try to optimize
the resolution of peaks P2 and P3. However, the decrease in the elution slope led to less defined peaks
and, in consequence, the protein concentration decreased.
The results obtained in this assay, were not sufficient to determine the elution peak that contain the
enzyme G3PDH, due to the lower protein concentration of each peak. However, this assay was used to
program the assay using a step elution mode.
3.4.2. Step Elution
From the results obtained with the linear elution mode, a step elution (with 1.5 mL of protein sample)
was tested in order to optimize the resolution of elution peaks P1 and P2.
Figure 3.16 shows the chromatogram and SDS-PAGE gel from the third fractionation assay – 1S
fractionation –, using a step elution mode.
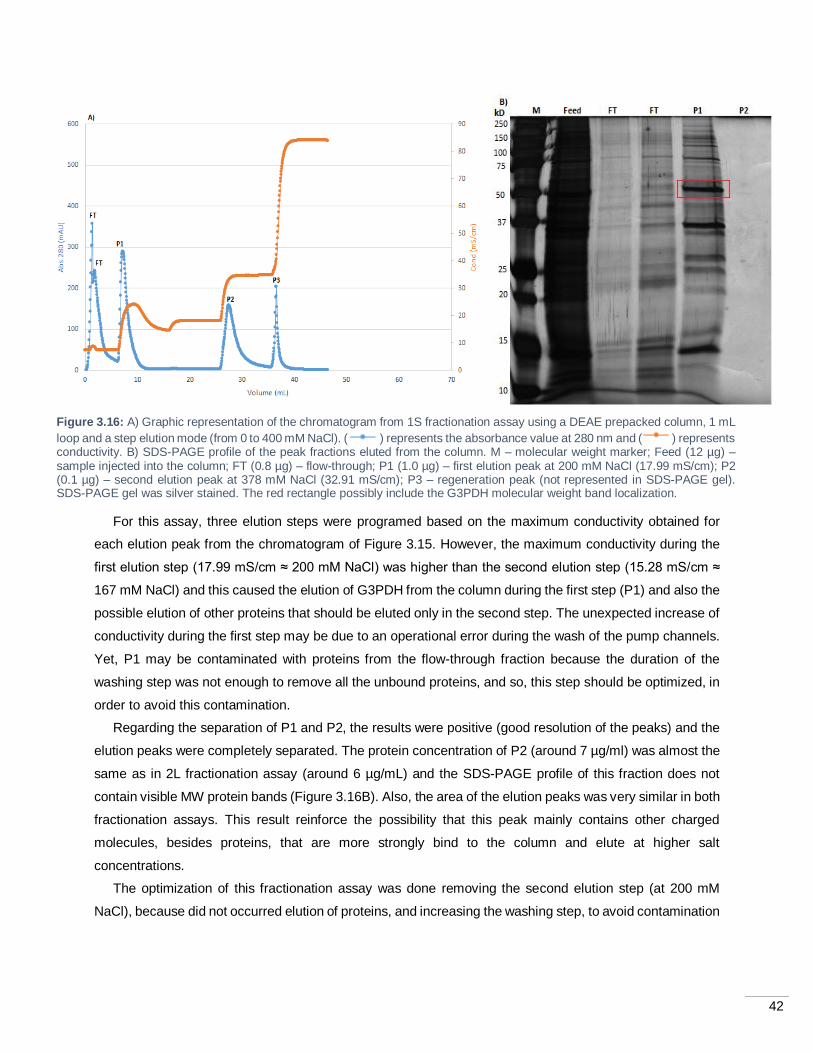
42
Figure 3.16: A) Graphic representation of the chromatogram from 1S fractionation assay using a DEAE prepacked column, 1 mL
loop and a step elution mode (from 0 to 400 mM NaCl). ( ) represents the absorbance value at 280 nm and ( ) represents conductivity. B) SDS-PAGE profile of the peak fractions eluted from the column. M – molecular weight marker; Feed (12 µg) – sample injected into the column; FT (0.8 µg) – flow-through; P1 (1.0 µg) – first elution peak at 200 mM NaCl (17.99 mS/cm); P2 (0.1 µg) – second elution peak at 378 mM NaCl (32.91 mS/cm); P3 – regeneration peak (not represented in SDS-PAGE gel). SDS-PAGE gel was silver stained. The red rectangle possibly include the G3PDH molecular weight band localization.
For this assay, three elution steps were programed based on the maximum conductivity obtained for
each elution peak from the chromatogram of Figure 3.15. However, the maximum conductivity during the
first elution step (17.99 mS/cm ≈ 200 mM NaCl) was higher than the second elution step (15.28 mS/cm ≈
167 mM NaCl) and this caused the elution of G3PDH from the column during the first step (P1) and also the
possible elution of other proteins that should be eluted only in the second step. The unexpected increase of
conductivity during the first step may be due to an operational error during the wash of the pump channels.
Yet, P1 may be contaminated with proteins from the flow-through fraction because the duration of the
washing step was not enough to remove all the unbound proteins, and so, this step should be optimized, in
order to avoid this contamination.
Regarding the separation of P1 and P2, the results were positive (good resolution of the peaks) and the
elution peaks were completely separated. The protein concentration of P2 (around 7 µg/ml) was almost the
same as in 2L fractionation assay (around 6 µg/mL) and the SDS-PAGE profile of this fraction does not
contain visible MW protein bands (Figure 3.16B). Also, the area of the elution peaks was very similar in both
fractionation assays. This result reinforce the possibility that this peak mainly contains other charged
molecules, besides proteins, that are more strongly bind to the column and elute at higher salt
concentrations.
The optimization of this fractionation assay was done removing the second elution step (at 200 mM
NaCl), because did not occurred elution of proteins, and increasing the washing step, to avoid contamination
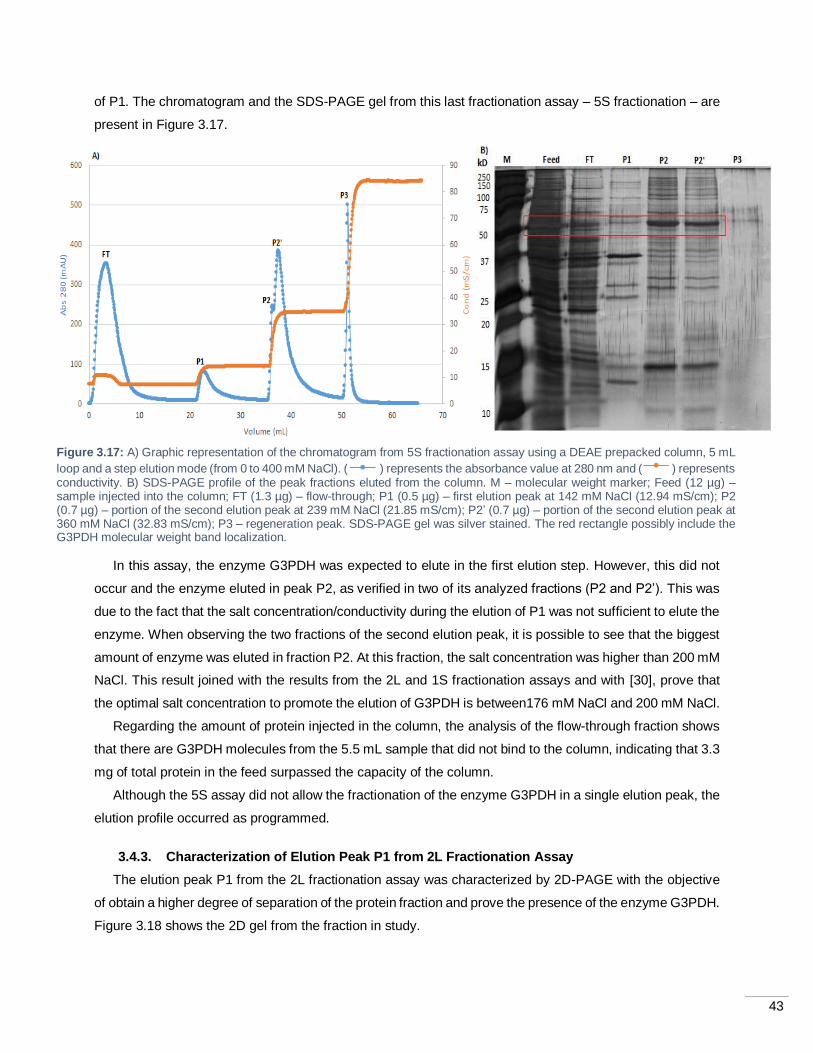
43
of P1. The chromatogram and the SDS-PAGE gel from this last fractionation assay – 5S fractionation – are
present in Figure 3.17.
Figure 3.17: A) Graphic representation of the chromatogram from 5S fractionation assay using a DEAE prepacked column, 5 mL
loop and a step elution mode (from 0 to 400 mM NaCl). ( ) represents the absorbance value at 280 nm and ( ) represents conductivity. B) SDS-PAGE profile of the peak fractions eluted from the column. M – molecular weight marker; Feed (12 µg) – sample injected into the column; FT (1.3 µg) – flow-through; P1 (0.5 µg) – first elution peak at 142 mM NaCl (12.94 mS/cm); P2 (0.7 µg) – portion of the second elution peak at 239 mM NaCl (21.85 mS/cm); P2’ (0.7 µg) – portion of the second elution peak at 360 mM NaCl (32.83 mS/cm); P3 – regeneration peak. SDS-PAGE gel was silver stained. The red rectangle possibly include the G3PDH molecular weight band localization.
In this assay, the enzyme G3PDH was expected to elute in the first elution step. However, this did not
occur and the enzyme eluted in peak P2, as verified in two of its analyzed fractions (P2 and P2’). This was
due to the fact that the salt concentration/conductivity during the elution of P1 was not sufficient to elute the
enzyme. When observing the two fractions of the second elution peak, it is possible to see that the biggest
amount of enzyme was eluted in fraction P2. At this fraction, the salt concentration was higher than 200 mM
NaCl. This result joined with the results from the 2L and 1S fractionation assays and with [30], prove that
the optimal salt concentration to promote the elution of G3PDH is between176 mM NaCl and 200 mM NaCl.
Regarding the amount of protein injected in the column, the analysis of the flow-through fraction shows
that there are G3PDH molecules from the 5.5 mL sample that did not bind to the column, indicating that 3.3
mg of total protein in the feed surpassed the capacity of the column.
Although the 5S assay did not allow the fractionation of the enzyme G3PDH in a single elution peak, the
elution profile occurred as programmed.
3.4.3. Characterization of Elution Peak P1 from 2L Fractionation Assay
The elution peak P1 from the 2L fractionation assay was characterized by 2D-PAGE with the objective
of obtain a higher degree of separation of the protein fraction and prove the presence of the enzyme G3PDH.
Figure 3.18 shows the 2D gel from the fraction in study.
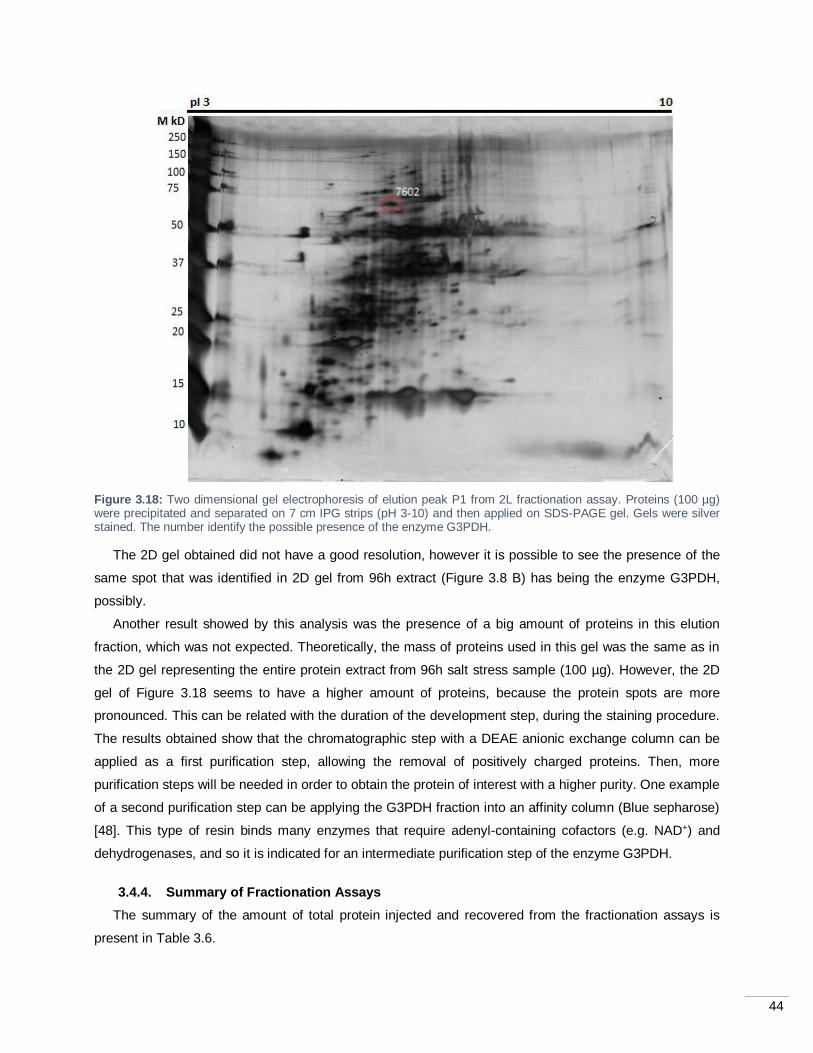
44
Figure 3.18: Two dimensional gel electrophoresis of elution peak P1 from 2L fractionation assay. Proteins (100 µg) were precipitated and separated on 7 cm IPG strips (pH 3-10) and then applied on SDS-PAGE gel. Gels were silver stained. The number identify the possible presence of the enzyme G3PDH.
The 2D gel obtained did not have a good resolution, however it is possible to see the presence of the
same spot that was identified in 2D gel from 96h extract (Figure 3.8 B) has being the enzyme G3PDH,
possibly.
Another result showed by this analysis was the presence of a big amount of proteins in this elution
fraction, which was not expected. Theoretically, the mass of proteins used in this gel was the same as in
the 2D gel representing the entire protein extract from 96h salt stress sample (100 µg). However, the 2D
gel of Figure 3.18 seems to have a higher amount of proteins, because the protein spots are more
pronounced. This can be related with the duration of the development step, during the staining procedure.
The results obtained show that the chromatographic step with a DEAE anionic exchange column can be
applied as a first purification step, allowing the removal of positively charged proteins. Then, more
purification steps will be needed in order to obtain the protein of interest with a higher purity. One example
of a second purification step can be applying the G3PDH fraction into an affinity column (Blue sepharose)
[48]. This type of resin binds many enzymes that require adenyl-containing cofactors (e.g. NAD+) and
dehydrogenases, and so it is indicated for an intermediate purification step of the enzyme G3PDH.
3.4.4. Summary of Fractionation Assays
The summary of the amount of total protein injected and recovered from the fractionation assays is
present in Table 3.6.
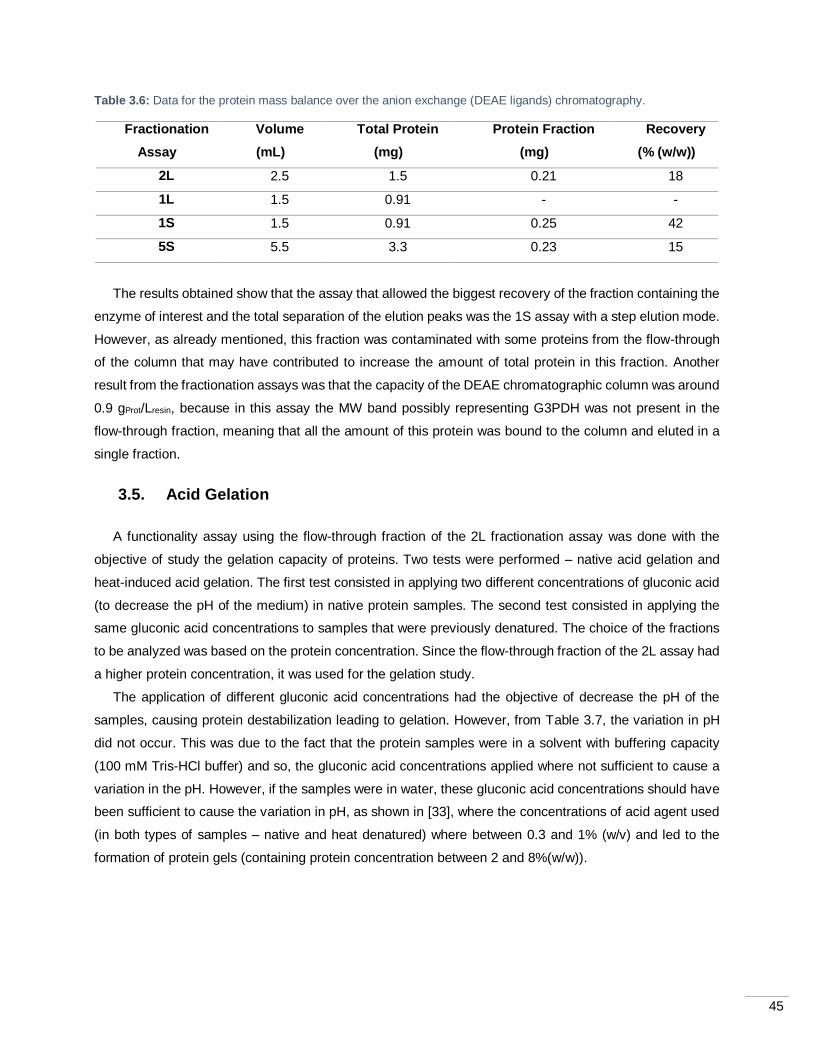
45
Table 3.6: Data for the protein mass balance over the anion exchange (DEAE ligands) chromatography.
Fractionation
Assay
Volume
(mL)
Total Protein
(mg)
Protein Fraction
(mg)
Recovery
(% (w/w))
2L 2.5 1.5 0.21 18
1L 1.5 0.91 - -
1S 1.5 0.91 0.25 42
5S 5.5 3.3 0.23 15
The results obtained show that the assay that allowed the biggest recovery of the fraction containing the
enzyme of interest and the total separation of the elution peaks was the 1S assay with a step elution mode.
However, as already mentioned, this fraction was contaminated with some proteins from the flow-through
of the column that may have contributed to increase the amount of total protein in this fraction. Another
result from the fractionation assays was that the capacity of the DEAE chromatographic column was around
0.9 gProt/Lresin, because in this assay the MW band possibly representing G3PDH was not present in the
flow-through fraction, meaning that all the amount of this protein was bound to the column and eluted in a
single fraction.
3.5. Acid Gelation
A functionality assay using the flow-through fraction of the 2L fractionation assay was done with the
objective of study the gelation capacity of proteins. Two tests were performed – native acid gelation and
heat-induced acid gelation. The first test consisted in applying two different concentrations of gluconic acid
(to decrease the pH of the medium) in native protein samples. The second test consisted in applying the
same gluconic acid concentrations to samples that were previously denatured. The choice of the fractions
to be analyzed was based on the protein concentration. Since the flow-through fraction of the 2L assay had
a higher protein concentration, it was used for the gelation study.
The application of different gluconic acid concentrations had the objective of decrease the pH of the
samples, causing protein destabilization leading to gelation. However, from Table 3.7, the variation in pH
did not occur. This was due to the fact that the protein samples were in a solvent with buffering capacity
(100 mM Tris-HCl buffer) and so, the gluconic acid concentrations applied where not sufficient to cause a
variation in the pH. However, if the samples were in water, these gluconic acid concentrations should have
been sufficient to cause the variation in pH, as shown in [33], where the concentrations of acid agent used
(in both types of samples – native and heat denatured) where between 0.3 and 1% (w/v) and led to the
formation of protein gels (containing protein concentration between 2 and 8%(w/w)).
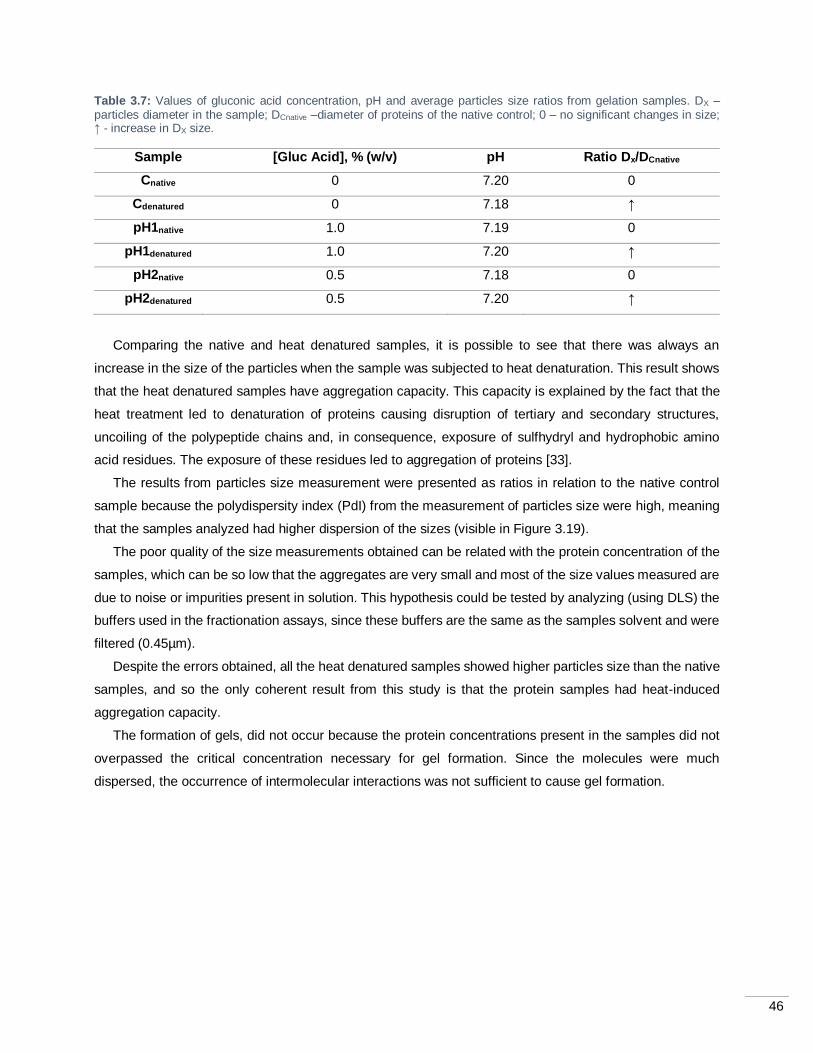
46
Table 3.7: Values of gluconic acid concentration, pH and average particles size ratios from gelation samples. DX – particles diameter in the sample; DCnative –diameter of proteins of the native control; 0 – no significant changes in size; ↑ - increase in DX size.
Sample [Gluc Acid], % (w/v) pH Ratio Dx/DCnative
Cnative 0 7.20 0
Cdenatured 0 7.18 ↑
pH1native 1.0 7.19 0
pH1denatured 1.0 7.20 ↑
pH2native 0.5 7.18 0
pH2denatured 0.5 7.20 ↑
Comparing the native and heat denatured samples, it is possible to see that there was always an
increase in the size of the particles when the sample was subjected to heat denaturation. This result shows
that the heat denatured samples have aggregation capacity. This capacity is explained by the fact that the
heat treatment led to denaturation of proteins causing disruption of tertiary and secondary structures,
uncoiling of the polypeptide chains and, in consequence, exposure of sulfhydryl and hydrophobic amino
acid residues. The exposure of these residues led to aggregation of proteins [33].
The results from particles size measurement were presented as ratios in relation to the native control
sample because the polydispersity index (PdI) from the measurement of particles size were high, meaning
that the samples analyzed had higher dispersion of the sizes (visible in Figure 3.19).
The poor quality of the size measurements obtained can be related with the protein concentration of the
samples, which can be so low that the aggregates are very small and most of the size values measured are
due to noise or impurities present in solution. This hypothesis could be tested by analyzing (using DLS) the
buffers used in the fractionation assays, since these buffers are the same as the samples solvent and were
filtered (0.45µm).
Despite the errors obtained, all the heat denatured samples showed higher particles size than the native
samples, and so the only coherent result from this study is that the protein samples had heat-induced
aggregation capacity.
The formation of gels, did not occur because the protein concentrations present in the samples did not
overpassed the critical concentration necessary for gel formation. Since the molecules were much
dispersed, the occurrence of intermolecular interactions was not sufficient to cause gel formation.
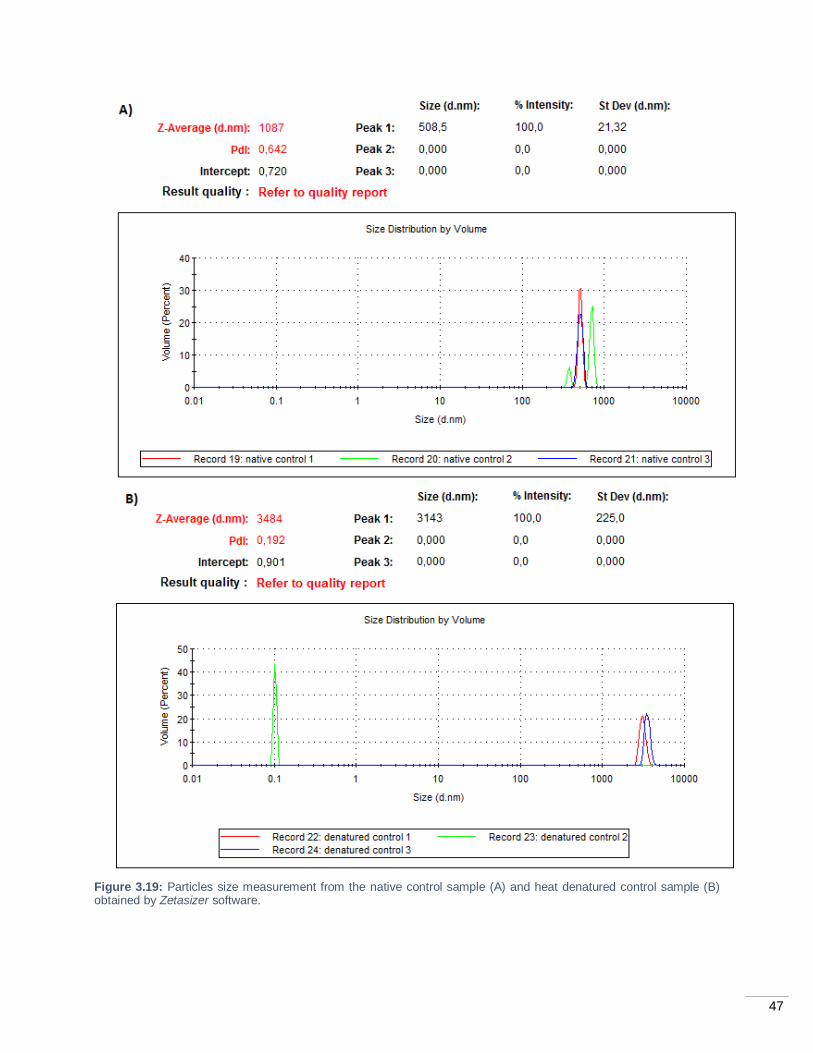
47
Figure 3.19: Particles size measurement from the native control sample (A) and heat denatured control sample (B) obtained by Zetasizer software.
48
4. Conclusions
The aim of this project was to enhance the accumulation of specific proteins – glycerol cycle enzymes,
carbonic anhydrase and antioxidant enzymes – in the microalgae Dunaliella sp. through the application of
three physicochemical stress strategies – salt, pH and oxidative stress, respectively – and further
characterize and fractionate the protein extracts.
To quantitatively characterize the protein extracts from Dunaliella cultures, a protein quantification
method was developed, where two types of cell rupture were studied – mechanical stress and osmotic
shock. The results showed that both methods are capable of extracting the proteins and can be applied to
fresh culture samples and also to freeze-dried samples.
The quantitative (BCA Protein Assay) and qualitative (2D-PAGE) characterization of the protein extracts
was applied to each stress culture. For the salt stress, after 24h of exposure, there was a significant increase
in the soluble protein content of the cells that seemed to remain until the end of the experiment (96h). The
96h of exposure to the salt stress led to a change in the protein expression profile, where enzymes
responsible for glycerol production and antioxidant enzymes where overexpressed. These results were due
to exposure of cells to a hyperosmotic stress, which led to the production of glycerol as an osmotic response
and to the increase in ROS causing an antioxidant enzymatic response.
The characterization of the pH stress culture showed that, after 24h of exposure to the stress, the soluble
protein content of cells seems to increase. At this time, catalase was overexpressed, which means that this
stress also cause an antioxidant response in Dunaliella cells. The objective of this stress was to overexpress
the enzyme carbonic anhydrase. However, it was not possible to characterize it, because the enzyme
belongs to the membrane protein fraction and the qualitative characterization was done using the soluble
protein fraction.
Regarding the characterization of the oxidative stress, the overexpression of antioxidant enzymes was
not achieved and the protein content of the cells did not suffer any significant changes. This result can mean
that the conditions used were not sufficient to cause a response in the cells at the protein level.
From the characterization studies it is possible to conclude that the general response of Dunaliella to an
abiotic stress is by increasing the expression of ROS scavenging system – antioxidant enzymes.
The 96h salt stress protein extract was used for fractionation assays, so that a single fraction containing
the enzyme glycerol-3-phosphate dehydrogenase would be obtained. The results showed that an anion
exchange chromatography with DEAE ligands can be used as the first purification step of the enzyme,
allowing the removal of positively charged proteins. The maximum recovery of G3PDH was obtained using
a step elution mode (fraction eluted at 200 mM NaCl, approximately) and a capacity of the resin around 0.9
gprot./Lresin.
The flow-through fraction eluted form the chromatographic column was subjected to an acid gelation
assay with the objective of studying functionality properties of proteins. The assay showed that the acid
destabilization of proteins was not possible due to the buffering capacity of the protein solutions and that
49
the gel formation did not occur due to low protein concentration. However, it was possible to prove that the
flow-through fraction proteins have heat-induced aggregation capacity.
Therefore, the salt stress strategy applied allowed a higher change in the protein expression response
of Dunaliella sp. that led to the achievement of a chromatographic fraction, possibly containing the enzyme
G3PDH. The protein extract from this stress was also capable of heat-induced aggregation through protein
denaturation.
The results obtained with this study reveal as good first steps for potential applications of microalgae
proteins. However, future work is still needed.
For the quantitative protein characterization, more replicated assays should be done in order to obtain
results with statistical significance, allowing more reliable conclusions. The time of exposure to oxidative
stress and the stressor concentration should also be increased with the objective of understand if the
conditions used are capable of cause a change in the protein profile of cells.
For the qualitative protein characterization, a membrane protein extraction procedure should be used
(e.g. solubilization of membranes with Triton X-100 [49]), in order to understand the effect of the pH stress
in the expression of the enzyme carbonic anhydrase and also the amino acid sequence of all the possible
protein spots of interest should be determined (by peptide mass fingerprinting technique, for example) with
the objective of confirming the identity of all spots of interest.
Since a first purification procedure was already defined in this study, the next step to obtain a more pure
fraction of G3PDH could be its application in a dye affinity chromatography with specificity for
dehydrogenases [48] (using, for example, a Blue Sepharose resin). Regarding the fraction where G3PDH
could be present, the enzymatic activity of the eluted fractions should be tested to confirm the presence of
the enzyme of interest and also to allow the determination of the degree of purification obtained by this
chromatographic step (through the specific activity of the fraction).
The next steps regarding the gelation capacity could be the dialysis or diafiltration of the protein samples
with water in order to eliminate the buffering capacity, allowing the acid gelation study with different pH
values (through the addition of different glucono-δ-lactone concentrations, allowing the slow release of
gluconic acid). Another test to be done could be the use of a more concentrated protein solution, so that gel
formation would occur. The amino acid composition of the protein samples with gelation capacity is also an
interesting study to be developed in order to understand which amino acid residues are more responsible
for gel formation. One example of such studies could be the determination of lysine content.
This project proves that an extremophile microalgae can be used to obtain functional proteins and to
isolate specific enzymes with several biotechnological applications.
50
5. References
[1] G. O. Phillips and P. A. Williams, Handbook of food proteins. Woodhead Publishing, 2011.
[2] J. Nehete, M. Narkhede, R. Bhambar, and S. Gawali, “Natural proteins: sources, isolation, characterization and applications,” Pharmacogn. Rev., vol. 7, no. 14, pp. 107–116, Jul. 2013.
[3] B. S. A. F. Brasil, F. G. de Siqueira, T. F. C. Salum, C. M. Zanette, and M. R. Spier, “Microalgae and cyanobacteria as enzyme biofactories,” Algal Res., vol. 25, pp. 76–89, Jul. 2017.
[4] A. G. Waghmare, M. K. Salve, J. G. LeBlanc, and S. S. Arya, “Concentration and characterization of microalgae proteins from Chlorella pyrenoidosa,” Bioresour. Bioprocess., vol. 3, no. 1, p. 16, Dec.
2016.
[5] E. W. Becker, “Micro-algae as a source of protein,” Biotechnol. Adv., vol. 25, no. 2, pp. 207–210,
Mar. 2007.
[6] G. Walsh, Proteins : Biochemistry and Biotechnology. J. Wiley, 2002.
[7] N. Gurung, S. Ray, S. Bose, and V. Rai, “A broader view: microbial enzymes and their relevance in industries, medicine, and beyond,” Biomed Res. Int., vol. 2013, pp. 1–18, 2013.
[8] X. Cheng, V. Poenitzsch, L. Cornell, C. Tsao, and T. Potter, “Electrochemical bioencapsulation of nanomaterials into collagen for biomedical applications,” J. Encapsulation Adsorpt. Sci., vol. 3, no.
1, pp. 16–23, 2013.
[9] G. R. Ziegler and E. A. Foegeding, “The Gelation Of Proteins,” in Advances in Food and Nutrition Reaserch, Elsevier, 1990, pp. 203–298.
[10] S. Kasapis, I. T. Norton, and J. B. Ubbink, Modern biopolymer science : bridging the divide between fundamental treatise and industrial application. Elsevier/Academic Press, 2009.
[11] J. F. Zayas, Functionality of Proteins in Food. Springer, 1997.
[12] S. Matassa, N. Boon, I. Pikaar, and W. Verstraete, “Microbial protein: future sustainable food supply route with low environmental footprint.,” Microb. Biotechnol., vol. 9, no. 5, pp. 568–75, Sep. 2016.
[13] O. Pignolet, S. Jubeau, C. Vaca-Garcia, and P. Michaud, “Highly valuable microalgae: biochemical and topological aspects,” J. Ind. Microbiol. Biotechnol., vol. 40, no. 8, pp. 781–796, Aug. 2013.
[14] A. Hosseini Tafreshi and M. Shariati, “Dunaliella biotechnology: methods and applications,” J. Appl. Microbiol., vol. 107, no. 1, pp. 14–35, Jul. 2009.
[15] A. Mishra, A. Mandoli, and B. Jha, “Physiological characterization and stress-induced metabolic responses of Dunaliella salina isolated from salt pan,” J. Ind. Microbiol. Biotechnol., vol. 35, no. 10,
pp. 1093–1101, Oct. 2008.
[16] A. Oren, “A hundred years of Dunaliella research: 1905-2005.,” Saline Systems, vol. 1, p. 2, Jul.
2005.
[17] M. Shariati and M. Reza, “Microalgal Biotechnology and Bioenergy in Dunaliella,” in Progress in Molecular and Environmental Bioengineering - From Analysis and Modeling to Technology Applications, InTech, 2011.
[18] A. Ben-Amotz, I. Sussman, and M. Avron, “Glycerol production by Dunaliella,” in New Trends in Research and Utilization of Solar Energy through Biological Systems, Basel: Birkhäuser Basel, 1982,
pp. 55–58.
[19] H. Chen, Y. Lu, and J.-G. Jiang, “Comparative analysis on the key enzymes of the glycerol cycle metabolic pathway in Dunaliella salina under osmotic stresses,” PLoS One, vol. 7, no. 6, p. e37578,
Jun. 2012.
[20] A. Mishra and B. Jha, “Antioxidant response of the microalga Dunaliella salina under salt stress,”
51
Bot. Mar., vol. 54, no. 2, Jan. 2011.
[21] A. Bafana, S. Dutt, S. Kumar, and P. S. Ahuja, “Superoxide dismutase: an industrial perspective,” Crit. Rev. Biotechnol., vol. 31, no. 1, pp. 65–76, Mar. 2011.
[22] B. S. Sooch, B. S. Kauldhar, and M. Puri, “Recent insights into microbial catalases: isolation, production and purification,” Biotechnol. Adv., vol. 32, no. 8, pp. 1429–1447, Dec. 2014.
[23] N. Mallick and F. H. Mohn, “Reactive oxygen species: response of algal cells,” J. Plant Physiol., vol.
157, no. 2, pp. 183–193, Aug. 2000.
[24] J. Hancheol, J. Jooyeon, B. Kwangryul, M.-K. Zaid, E. W. P. Jürgen, and J. EonSeon, “Identification of the carbonic anhydrases from the unicellular green alga Dunaliella salina strain CCAP 19/18,” Algal Res., vol. 19, pp. 12–20, Nov. 2016.
[25] J. M. González and S. Z. Fisher, “Carbonic anhydrases in industrial applications,” in Sub-cellular biochemistry, vol. 75, 2014, pp. 405–426.
[26] H. Ichinose, N. Kamiya, and M. Goto, “Enzymatic redox cofactor regeneration in organic media: functionalization and application of glycerol dehydrogenase and soluble transhydrogenase in reverse micelles,” Biotechnol. Prog., vol. 21, no. 4, pp. 1192–1197, Sep. 2008.
[27] J. Rocha-Martin, A. Acosta, J. Berenguer, J. M. Guisan, and F. Lopez-Gallego, “Selective oxidation of glycerol to 1,3-dihydroxyacetone by covalently immobilized glycerol dehydrogenases with higher stability and lower product inhibition,” Bioresour. Technol., vol. 170, pp. 445–453, Oct. 2014.
[28] E. A. L. Gattas and M. F. S. Peres, “Use of different carbon sources in cultivation of baker’s yeast for production of glycerol-3-phosphate dehydrogenase,” J. Food, Agric. Environ., vol. 11, no. 1, pp.
246–249, 2005.
[29] M. de B. Lopes, A. -ur-Rehman, H. Gockowiak, A. J. Heinrich, P. Langridge, and P. A. Henschke, “Fermentation properties of a wine yeast over-expressing the Saccharomyces cerevisiae glycerol 3-phosphate dehydrogenase gene (GPD2),” Aust. J. Grape Wine Res., vol. 6, no. 3, pp. 208–215, Oct.
2000.
[30] D. Ghoshal, D. Mach, M. Agarwal, A. Goyal, and A. Goyal, “Osmoregulatory isoform of dihydroxyacetone phosphate reductase from Dunaliella tertiolecta: purification and characterization,” Protein Expr. Purif., vol. 24, no. 3, pp. 404–411, Apr. 2002.
[31] M. de Freitas Sanches Peres, V. C. Silva, S. R. Valentini, and E. A. de Lucca Gattás, “Recombinant expression of glycerol-3-phosphate dehydrogenase using the Pichia pastoris system,” J. Mol. Catal. B Enzym., vol. 65, no. 1–4, pp. 128–132, Aug. 2010.
[32] A. A. Ruberto, C. L. Childers, and K. B. Storey, “Purification and properties of glycerol-3-phosphate dehydrogenase from the liver of the hibernating ground squirrel, Urocitellus richardsonii,” Comp. Biochem. Physiol. Part B Biochem. Mol. Biol., vol. 202, pp. 48–55, Dec. 2016.
[33] F. A. Perrechil, A. L. M. Braga, and R. L. Cunha, “Acid gelation of native and heat-denatured soy proteins and locust bean gum,” Int. J. Food Sci. Technol., vol. 48, no. 3, pp. 620–627, Mar. 2013.
[34] K. Yilancioglu, M. Cokol, I. Pastirmaci, B. Erman, and S. Cetiner, “Oxidative stress is a mediator for increased lipid accumulation in a newly isolated Dunaliella salina strain,” PLoS One, vol. 9, no. 3, p. e91957, Mar. 2014.
[35] Z. Khalil, M. Asker, S. El-Sayed, and I. Kobbia, “Responses of Dunaliella bardawil and Chlorella ellipsoidea to pH stress,” Acta Bot. Hung., vol. 52, no. 1–2, pp. 123–135, Mar. 2010.
[36] H. Lv, X. Cui, F. Wahid, F. Xia, C. Zhong, and S. Jia, “Analysis of the physiological and molecular responses of Dunaliella salina to macronutrient deprivation,” PLoS One, vol. 11, no. 3, p. e0152226,
Mar. 2016.
[37] H. Chen, J.-G. Jiang, and G.-H. Wu, “Effects of salinity changes on the growth of Dunaliella salina and its isozyme activities of glycerol-3-phosphate dehydrogenase,” J. Agric. Food Chem., vol. 57,
52
no. 14, pp. 6178–6182, Jul. 2009.
[38] H. Tietze, Spirulina. Harald W. Tietze Publishing, 1999.
[39] S. Mixson Byrd, J. M. Burkholder, and P. V. Zimba, “Environmental stressors and lipid production by Dunaliella spp. I. Salinity,” J. Exp. Mar. Bio. Ecol., vol. 487, pp. 18–32, Feb. 2017.
[40] J. Bose, A. Rodrigo-Moreno, and S. Shabala, “ROS homeostasis in halophytes in the context of salinity stress tolerance,” J. Exp. Bot., vol. 65, no. 5, pp. 1241–1257, Mar. 2014.
[41] J. P. Fett and J. R. Coleman, “Regulation of periplasmic carbonic anhydrase expression in Chlamydomonas reinhardtii by acetate and pH.,” Plant Physiol., vol. 106, no. 1, pp. 103–108, Sep.
1994.
[42] Z.-W. Ye, J.-G. Jiang, and G.-H. Wu, “Biosynthesis and regulation of carotenoids in Dunalliela: Progresses and prospects,” Biotechnol. Adv., vol. 26, no. 4, pp. 352–360, Jul. 2008.
[43] S. Mixson Byrd and J. M. Burkholder, “Environmental stressors and lipid production in Dunaliella spp. II. Nutrients, pH, and light under optimal or low salinity,” J. Exp. Mar. Bio. Ecol., vol. 487, pp.
33–44, Feb. 2017.
[44] M. Fisher, U. Pick, and A. Zamir, “A Salt-Induced 60-Kilodalton Plasma Membrane Protein Plays a Potential Role in the Extreme Halotolerance of the Alga Dunaliella’,” Plant Physiol, vol. 106, pp.
1359–1365, 1994.
[45] I. Sussman and M. Avron, “Characterization and partial purification of dl-glycerol-1-phosphatase from Dunaliella salina,” Biochim. Biophys. Acta - Enzymol., vol. 661, no. 2, pp. 199–204, Oct. 1981.
[46] Mustafa A. Fawzy, Dalia A. Abdel-Wahab, and Awatief F. Hifney, “Physiological and biochemical responses of the green alga Pachycladella chodatii (SAG 2087) to sodicity stress,” Egypt. J. Basic Appl. Sci., vol. 4, no. 1, pp. 30–36, Mar. 2017.
[47] U. Pick, “Dunaliella — A model extremophilic alga,” Isr. J. Plant Sci., vol. 46, no. 2, pp. 131–139,
Jan. 1998.
[48] J. Cai, M. Pietzsch, U. Theobald, and M. Rizzi, “Fast purification and kinetic studies of the glycerol-3-phosphate dehydrogenase from the yeast Saccharomyces cerevisiae.,” J. Biotechnol., vol. 49, no.
1–3, pp. 19–27, Aug. 1996.
[49] M. Fisher, I. Gokhman, U. Pick, and A. Zamir, “A salt-resistant plasma membrane carbonic anhydrase is induced by salt in Dunaliella salina.,” J. Biol. Chem., vol. 271, no. 30, pp. 17718–23,
Jul. 1996.
Web pages consulted:
[W1] UniProt [cited: 5 July 2017]; URL: http://www.uniprot.org/
[W2] Isoelectric point calculator [cited: 5 July 2017]; URL: http://isoelectric.ovh.org/
[W3] BRENDA [cited: 5 July 2017]; URL: https://www.brenda-enzymes.org/
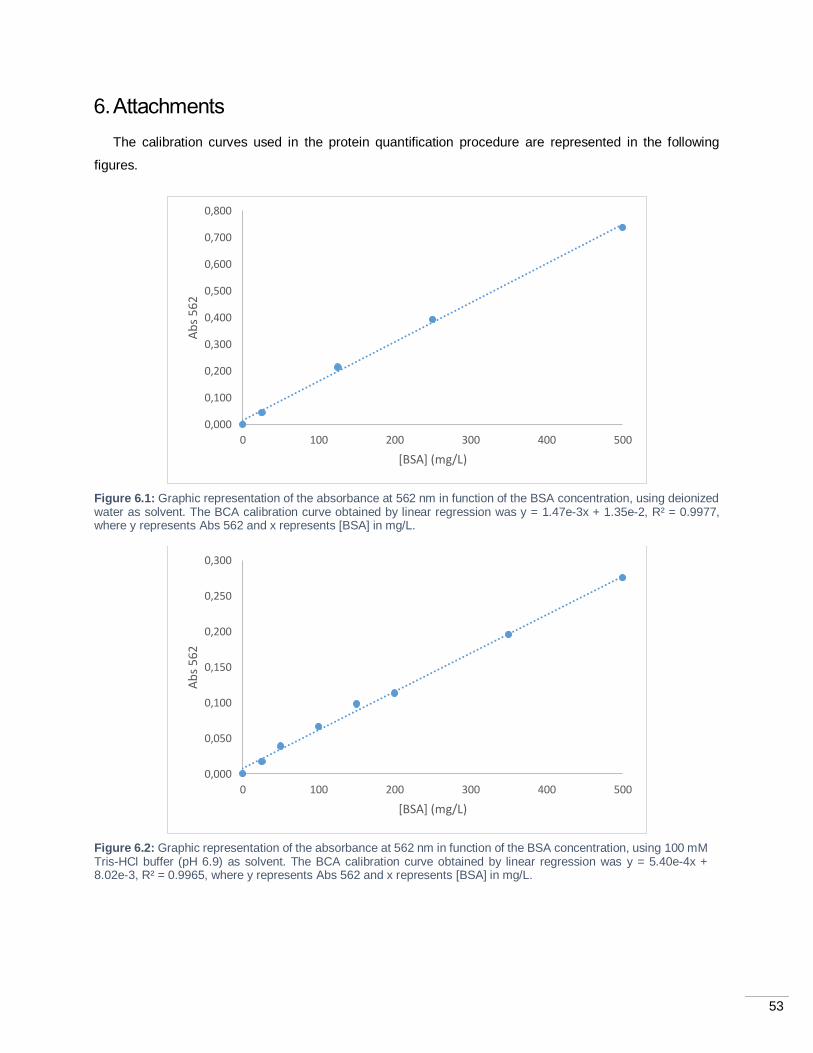
53
6. Attachments
The calibration curves used in the protein quantification procedure are represented in the following
figures.
Figure 6.1: Graphic representation of the absorbance at 562 nm in function of the BSA concentration, using deionized water as solvent. The BCA calibration curve obtained by linear regression was y = 1.47e-3x + 1.35e-2, R² = 0.9977, where y represents Abs 562 and x represents [BSA] in mg/L.
Figure 6.2: Graphic representation of the absorbance at 562 nm in function of the BSA concentration, using 100 mM Tris-HCl buffer (pH 6.9) as solvent. The BCA calibration curve obtained by linear regression was y = 5.40e-4x + 8.02e-3, R² = 0.9965, where y represents Abs 562 and x represents [BSA] in mg/L.
0,000
0,100
0,200
0,300
0,400
0,500
0,600
0,700
0,800
0 100 200 300 400 500
Ab
s 56
2
[BSA] (mg/L)
0,000
0,050
0,100
0,150
0,200
0,250
0,300
0 100 200 300 400 500
Ab
s 56
2
[BSA] (mg/L)
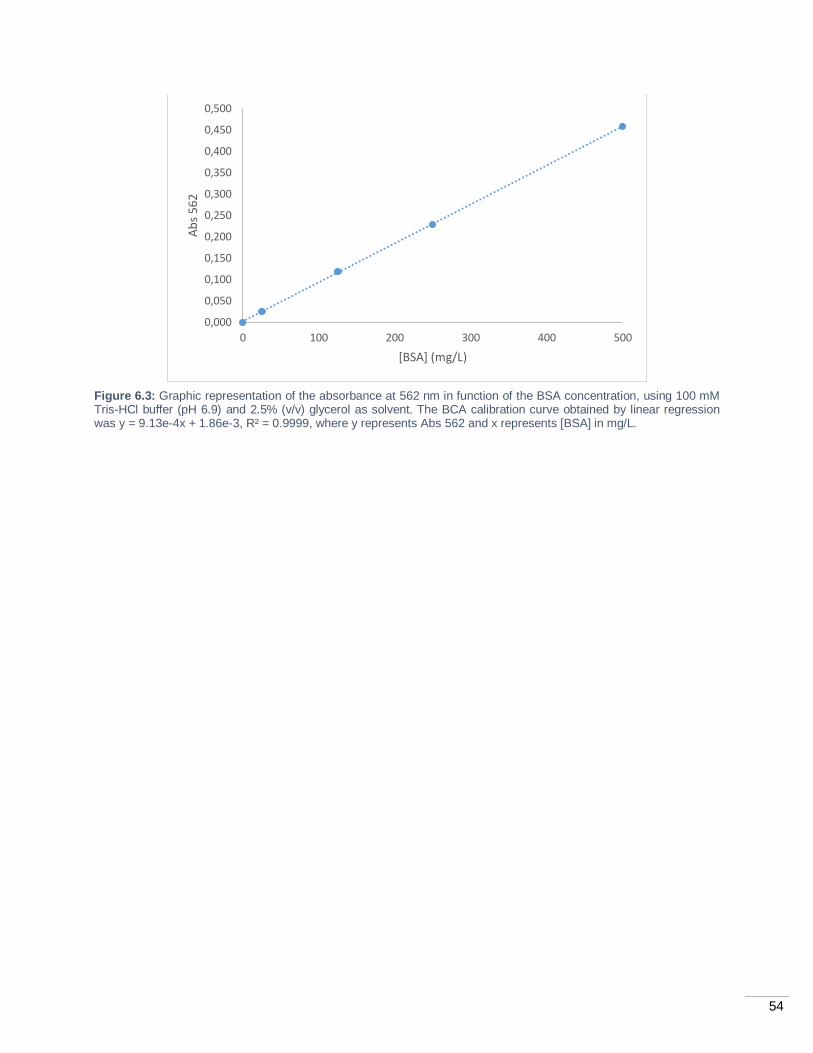
54
Figure 6.3: Graphic representation of the absorbance at 562 nm in function of the BSA concentration, using 100 mM Tris-HCl buffer (pH 6.9) and 2.5% (v/v) glycerol as solvent. The BCA calibration curve obtained by linear regression was y = 9.13e-4x + 1.86e-3, R² = 0.9999, where y represents Abs 562 and x represents [BSA] in mg/L.
0,000
0,050
0,100
0,150
0,200
0,250
0,300
0,350
0,400
0,450
0,500
0 100 200 300 400 500
Ab
s 56
2
[BSA] (mg/L)
Recommended