EVALUATING MOISTURE SUSCEPTIBILITY OF ASPHALT MIXES
Elizabeth Rae Hunter and Khaled Ksaibati Department Civil and Architectural Engineering
University of Wyoming P.O. Box 3295
Laramie, WY 82071-3295
November 2002
ii
Acknowledgement This report has been prepared with funds provided by the United States Department of
Transportation to the Mountain-Plains Consortium (MPC). The MPC member universities
include North Dakota State University, Colorado State University, University of Wyoming, and
Utah State University.
Disclaimer
The contents of the paper reflect the views of the authors, who are responsible for the
facts and the accuracy of the information presented. This document is disseminated under the
sponsorship of the Department of Transportation, University Transportation Centers Program, in
the interest of information exchange. The United States Government assumes no liability for the
contents or use thereof.
iii
Abstract
This research project utilized laboratory evaluations to study effects of freeze-thaw
cycling on the tensile strength of eight Hot Mix Asphalt mixtures and to determine if the Georgia
Loaded Wheel Tester could be utilized to measure moisture susceptibility of Hot Mix Asphalt
mixtures. The evaluation involved eight Hot Mix Asphalt Mixtures from combinations of two
aggregate types and four asphalt-additive-aging possibilities. Laboratory testing was
accomplished in the first phase with the production of 2.5 by 4 inch cores that were freeze-thaw
cycled and tested for their indirect tensile strength following Wyoming modified AASHTO
T283. The second phase was accomplished using 3 by 6 inch cores that were conditioned and
tested for rutting using the Georgia Loaded Wheel Tester. Finally, a statistical analysis was
performed to determine if performance of the various mixtures was significantly different in
groups of asphalt types and to determine if the Georgia Loaded Wheel Tester was a viable
measurement tool for moisture susceptibility.
Elizabeth R. Hunter and Dr. Khaled Ksaibati University of Wyoming
Laramie, Wyoming
iv
TABLE OF CONTENTS
CHAPTER 1 INTRODUCTION ..........................................................................................1
Background ..................................................................................................................1
Problem Statement .......................................................................................................1
Objective of Research ..................................................................................................2
Thesis Organization.....................................................................................................2
CHAPTER 2 LITERATURE REVIEW..............................................................................3
Introduction..................................................................................................................3
Moisture Susceptibility ................................................................................................4
Stripping .......................................................................................................................4
Techniques for Limiting Moisture Susceptibility .....................................................5
Anti-Stripping Agents .......................................................................................6
Liquid Anti-Stripping Agents................................................................6
Lime Additives.......................................................................................6
Aggregate Pre-Treatment..................................................................................7
Testing Methods for Moisture Susceptibility ............................................................8
Boiling Water Test ............................................................................................8
Texas Boiling Water Test..................................................................................9
Static Immersion Test .......................................................................................9
Lottman Test....................................................................................................10
Tunnicliff and Root Conditioning..................................................................10
Modified Lottman Test....................................................................................11
v
Immersion-Compression Test .........................................................................11
Hamburg Wheel Tracking Device..................................................................12
Texas-Freeze Thaw Pedestal Test ..................................................................15
Georgia Loaded Wheel Tester..................................................................................15
Chapter Summary .....................................................................................................17
CHAPTER 3 DESIGN OF EXPERIMENT AND TESTING PROCEDURES ..............19
Introduction................................................................................................................19
Evaluation of the Effects of Various Freeze -Thaw Cycles on HMA Strength.......................................................................................................19
Aggregate.........................................................................................................20
Asphalt Cement ...............................................................................................22
Specific Gravity Test Procedure (ASTM D70-82) .........................................25
Theoretical Maximum Specific Gravity (AASHTO T209-94).......................25
Production of Cores ........................................................................................26
Percent Air Voids ............................................................................................28
Saturation and Freeze-Thaw Cycling ............................................................29
Resilient Modulus Test....................................................................................30
Indirect Tensile Test........................................................................................30
Utilizing the Georgia Loaded Wheel Tester to Test for Moisture Susceptibility ..............................................................................................................32
Selection of Aggregate....................................................................................32
Selection of Asphalt ........................................................................................32
Mixing and Compaction of Specimens ..........................................................33
Freeze-Thaw Cycling......................................................................................33
vi
Saturation Procedure......................................................................................34
Georgia Loaded Wheel Tester ........................................................................35
Chapter Summary .....................................................................................................38
CHAPTER 4 DATA COLLECTION..................................................................................39
Introduction................................................................................................................39
Materials .....................................................................................................................39
Asphalt.............................................................................................................41
Mixtures...........................................................................................................42
Production of Cores ...................................................................................................43
Phase I Cores...................................................................................................43
Phase II Cores .................................................................................................44
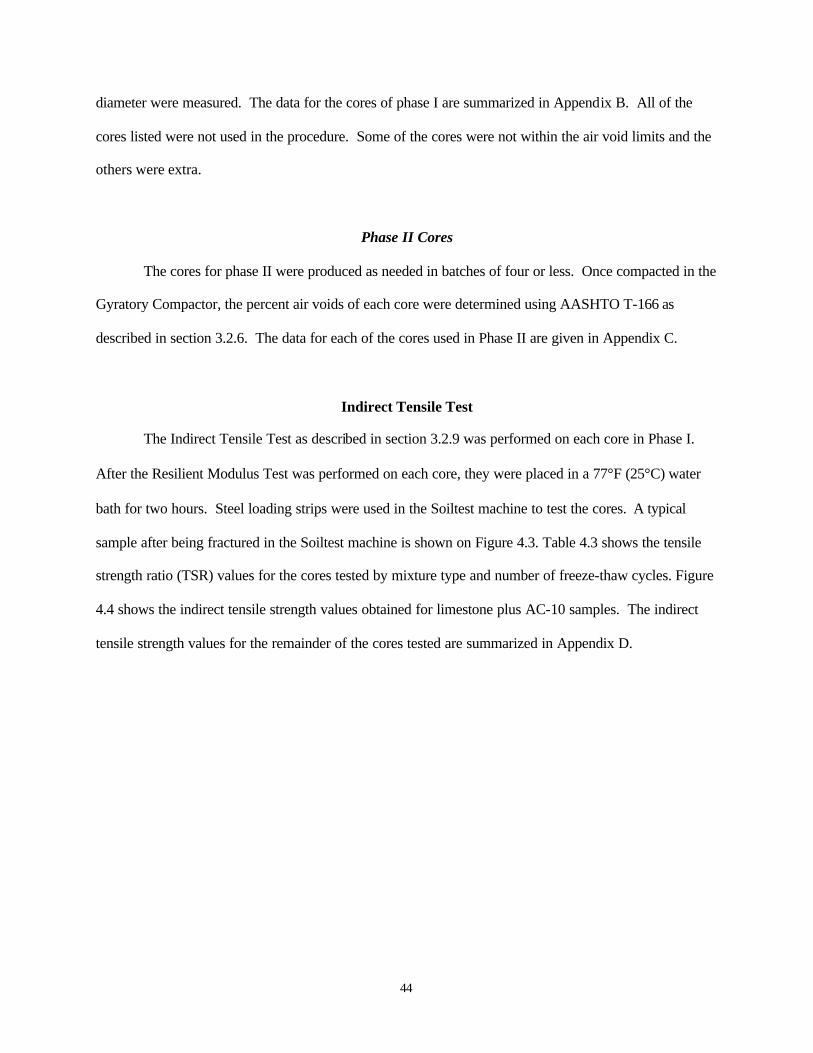
Indirect Tensile Test..................................................................................................44
Georgia Loaded Wheel Tester..................................................................................46
Chapter Summary .....................................................................................................49
CHAPTER 5 ANALYSIS OF DATA..................................................................................51
Introduction................................................................................................................51
Statistical Analysis of Tensile Strength Ratio Data ................................................51
Statistical Analysis of Georgia Loaded Wheel Tester Data ...................................54
Interaction Plots for Georgia Loaded Wheel Tester Data .....................................55
Chapter Summary .....................................................................................................59
CHAPTER 6 CONCLUSIONS AND RECOMMENDATIONS ......................................61
Summary.....................................................................................................................61
Conclusions .................................................................................................................61
vii
Recommendations ......................................................................................................62
REFERENCES.......................................................................................................................63
APPENDIX A Core Production Procedure .......................................................................67
APPENDIX B Phase I Core Data .......................................................................................69
APPENDIX C Phase II Core Data and GLWT Data .......................................................79
APPENDIX D Phase I Indirect Tensile Strength Graphs ..............................................129
APPENDIX E Phase I TSR Graphs ................................................................................135 APPENDIX F Phase I TSR Minitab Analysis I .............................................................141
APPENDIX G Phase I TSR Minitab Analysis II ...........................................................147
viii
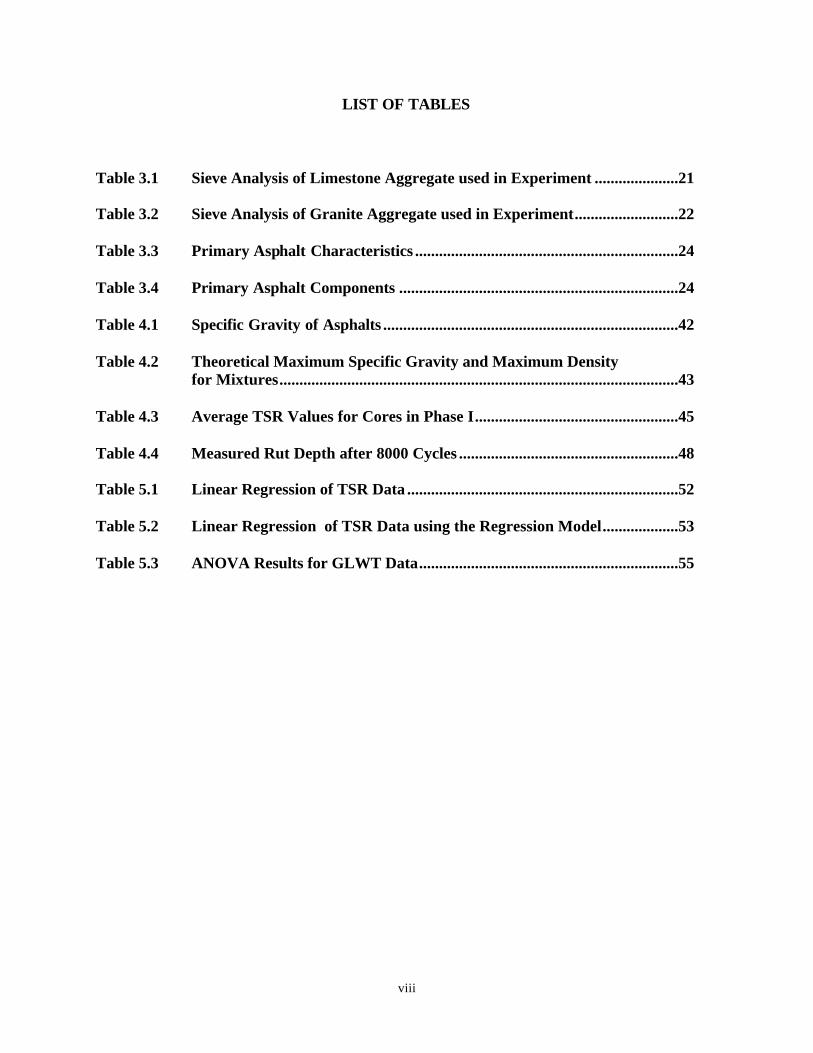
LIST OF TABLES
Table 3.1 Sieve Analysis of Limestone Aggregate used in Experiment .....................21 Table 3.2 Sieve Analysis of Granite Aggregate used in Experiment..........................22 Table 3.3 Primary Asphalt Characteristics ..................................................................24 Table 3.4 Primary Asphalt Components ......................................................................24 Table 4.1 Specific Gravity of Asphalts ..........................................................................42 Table 4.2 Theoretical Maximum Specific Gravity and Maximum Density for Mixtures....................................................................................................43 Table 4.3 Average TSR Values for Cores in Phase I...................................................45 Table 4.4 Measured Rut Depth after 8000 Cycles .......................................................48 Table 5.1 Linear Regression of TSR Data ....................................................................52 Table 5.2 Linear Regression of TSR Data using the Regression Model...................53 Table 5.3 ANOVA Results for GLWT Data.................................................................55

ix
LIST OF FIGURES
Figure 2.1 Hamburg Wheel Tracking Device ................................................................13 Figure 2.2 Results from Hamburg Wheel Tracking Device .........................................14 Figure 2.3 Georgia Loaded Wheel Tester Steel and Concrete Frame.........................16 Figure 3.1 Mixture Design Combinations for Phase I ..................................................23 Figure 3.2 Mixture Design Combinations for Phase II.................................................23 . Figure 3.3 Troxler Gyratory Compactor.......................................................................27 Figure 3.4 Soiltest Indirect Tensile Machine .................................................................31 Figure 3.5 Conditioning Design for Phase II Cores ......................................................34 Figure 3.6 Typical Core in a Swim Cap .........................................................................35 Figure 3.7 University of Wyoming Georgia Loaded Wheel Tester.............................36 Figure 3.8 Concrete Core Mold.......................................................................................36 Figure 3.9 Rut Depth Measuring Device ........................................................................37 Figure 4.1 Limestone Gradation with Respect to WYDOT Specifications .................40 Figure 4.2 Granite Gradation with Respect to WYDOT Specifications .....................41 Figure 4.3 A Fractured Soiltest Core ..............................................................................45 Figure 4.4 Indirect Tensile Strength for Limestone Plus AC-10 .................................46 Figure 4.5 A Typical Core After Testing in GLWT......................................................47 Figure 5.1 Interaction Plot of Rut Depth Means Versus Percent Air Voids and
Asphalt Type for the Different Conditionings.............................................56 Figure 5.2 Interaction Plot of Rut Depth Means Versus the Percent Air Voids for the Different Conditionings.....................................................................57 Figure 5.3 Interaction Plot of Rut Depth Means Versus Asphalt Type for the Different Conditionings.....................................................................58

x
1
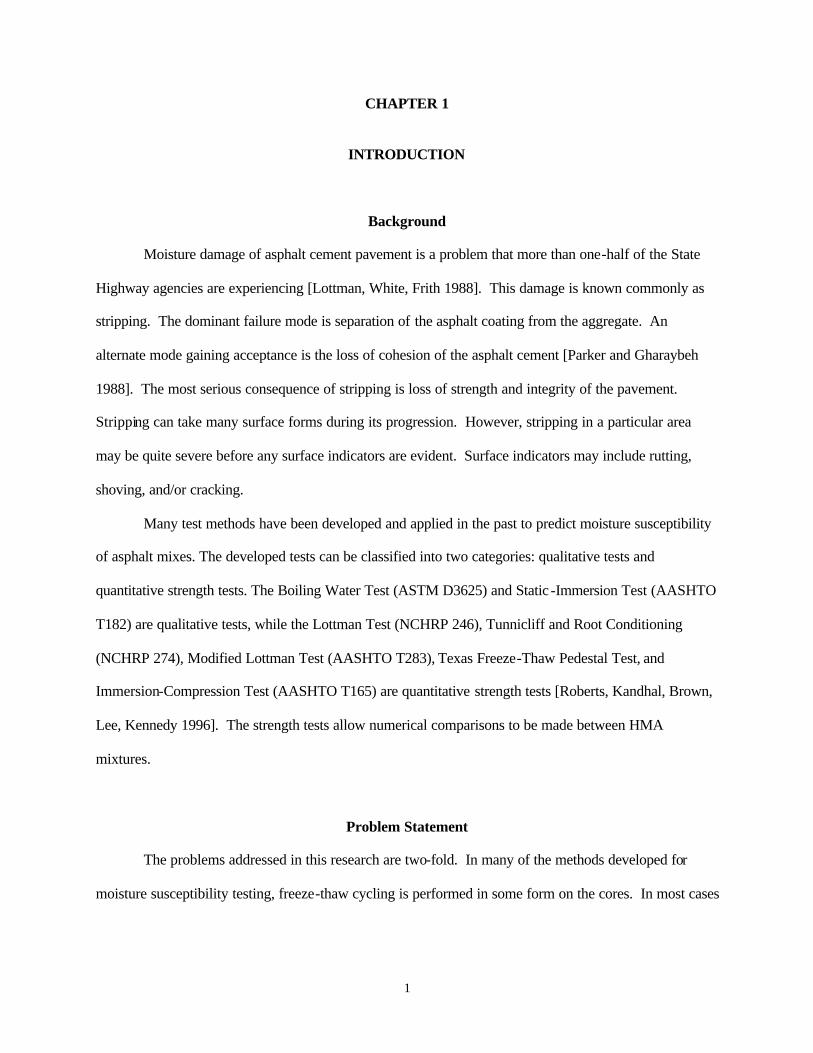
CHAPTER 1
INTRODUCTION
Background
Moisture damage of asphalt cement pavement is a problem that more than one-half of the State
Highway agencies are experiencing [Lottman, White, Frith 1988]. This damage is known commonly as
stripping. The dominant failure mode is separation of the asphalt coating from the aggregate. An
alternate mode gaining acceptance is the loss of cohesion of the asphalt cement [Parker and Gharaybeh
1988]. The most serious consequence of stripping is loss of strength and integrity of the pavement.
Stripping can take many surface forms during its progression. However, stripping in a particular area
may be quite severe before any surface indicators are evident. Surface indicators may include rutting,
shoving, and/or cracking.
Many test methods have been developed and applied in the past to predict moisture susceptibility
of asphalt mixes. The developed tests can be classified into two categories: qualitative tests and
quantitative strength tests. The Boiling Water Test (ASTM D3625) and Static -Immersion Test (AASHTO
T182) are qualitative tests, while the Lottman Test (NCHRP 246), Tunnicliff and Root Conditioning
(NCHRP 274), Modified Lottman Test (AASHTO T283), Texas Freeze-Thaw Pedestal Test, and
Immersion-Compression Test (AASHTO T165) are quantitative strength tests [Roberts, Kandhal, Brown,
Lee, Kennedy 1996]. The strength tests allow numerical comparisons to be made between HMA
mixtures.
Problem Statement
The problems addressed in this research are two-fold. In many of the methods developed for
moisture susceptibility testing, freeze-thaw cycling is performed in some form on the cores. In most cases
2
freeze-thaw cycling of the cores is limited to one cycle. The effects of many freeze-thaw cycles on
mechanical properties and strength of the Hot Mix Asphalt (HMA) mixtures are not well known.
The Georgia Loaded Wheel Tester (GLWT) was developed to predict rutting potential of HMA
mixtures. In comparison to other loaded wheel testers, such as the Hamburg Wheel Tracking Device, the
GLWT is inexpensive at $11,000. The Hamburg Wheel Tracking Device is capable of measuring the
rutting and moisture susceptibility of a HMA mix. The ability of the GLWT to predict moisture damage
has yet to be studied.
Objective of Research
The principle objectives of this research are to:
1. investigate moisture susceptibility of asphalt mixes,
2. evaluate the effect of various numbers of freeze-thaw cycles on the mechanical
properties of asphalt, and
3. determine if the Georgia Loaded Wheel Tester can be used to test for moisture
induced damage.
Thesis Organization
Chapter 2 of this report is a literature review of moisture susceptibility, stripping, existing
techniques for limiting moisture effects, testing methods for moisture susceptibility, and the GLWT.
Chapter 3 discusses the design of this experiment and explains the procedures used. The data collected
throughout this research project is discussed in chapter 4 and can be found in Appendix B through
Appendix E. Chapter 5 describes analysis of the laboratory test results. Chapter 6 presents conclusions
from this research and recommendations for further research.

3
CHAPTER 2
LITERATURE REVIEW
Introduction
The moisture effect on physical properties and mechanical behavior of asphalt paving mixtures
has been known for many years. Numerous empirical or semi-empirical test methods, such as the Lottman
Laboratory Test, Tunnicliff and Root Test, Boiling Water Test, and Hamburg Wheel Tracing Device,
have been developed to predict moisture damage on asphalt mixtures. These test methods attempted to
simulate the moisture damage that would occur in the field.
Parker and Gharaybeh [1988] evaluated testing procedures for their ability to asses stripping
potential. Tensile strength ratios (TSR) were used to measure the stripping potential of various Hot Mix
Asphalt (HMA) mixtures. Limiting Tensile Strength Ratio (TSR) values of 0.7 and 0.8 were used
simultaneously for comparison. The conclusion from Parker and Gharaybeh’s research was that Indirect
Tensile Test did not distinctly differentiate stripping and non-stripping aggregate combinations. The
supported reason for this was that the reported stripping performance of an aggregate might not be valid
for all mixture types. Parker and Gharaybeh felt that TSR values were perhaps a valid indicator of
stripping performance.
Coplantz and Newcomb [1988] conducted moisture sensitivity tests on field prepared mixtures.
Coplantz and Newcomb’s goal was to compare the methods used. The testing method varied
conditioning of the samples. The conditionings that were used include the following:
1. saturating the samples;
2. saturating, then performing one freeze-thaw cycle;
3. saturating, then performing multiple freeze-thaw cycles.
Resilient modulus and indirect tensile strength values were used to make a comparison. Coplantz and
Newcomb found that vacuum saturation without freeze-thaw cycling is not severe enough to damage the
4
mixtures. Also, as the number of freeze-thaw cycles was increased, the amount of water-induced damage
to the cores increased.
This chapter will discuss the effects moisture has on HMA mixtures and some of the methods
used to control the amount of moisture damage. Testing procedures commonly used in the past will be
discussed, as well as accepted uses for the Georgia Loaded Wheel Tester (GLWT).
Moisture Susceptibility
Moisture susceptibility is an HMA mixture’s tendency toward stripping [Construction of Hot Mix
Asphalt Pavements 1998, Roberts et al. 1996]. Stripping is the loss of bond between the asphalt and
aggregate. To combat moisture susceptibility, proper mix design is essential. However, if a mix is
properly designed, but not compacted correctly, it still may be susceptible to moisture damage.
Therefore, an HMA design should be tested in a situation where moisture does infiltrate air voids of the
mixture. For this reason many tests are performed at 7 percent air voids.[Roberts et al. 1996] The final
step in the Superpave mix design procedure is an evaluation of the moisture sensitivity of a mix.
AASHTO T-283 is used and will be discussed in more detail in chapter III. A TSR value of less than 80
percent is considered to be moisture susceptible. In other cases 70 percent is used [Parker and Gharaybeh
1987].
Stripping
Loss of the integrity of a HMA mix through weakening of the bond between the aggregate and
asphalt cement is known as stripping. When a weakening in the bond occurs, loss of strength of the HMA
can be sudden. Stripping usually begins in the bottom of the HMA layer, then travels upward. A typical
situation is a gradual loss of strength over a period of years, which causes rutting and shoving to develop
in the wheel path. Many times, stripping is difficult to identify because surface indicators may take years
to show. Also, many surface indicators are possible and may include: rutting, shoving, corrugations,
raveling, and cracking. It is necessary to look at the cross-section of the HMA mix to identify stripping.

5
In some cases of stripping, a HMA mix has lost so much adhesion between the aggregate and asphalt that
a core cannot be removed in one piece. [Kennedy, McGennis, and Roberts 1983; Roberts et al. 1996].
There are many possible causes of stripping and inadequate surface drainage or sub-surface
drainage is a primary contributor. There are many ways in which moisture can enter the HMA pavement
layers: capillary action from the water table, run off from the road surface, and seepage from surrounding
areas are a few examples. If adequate drainage is not present, air voids in the HMA may become saturated
with moisture, thereby increasing pressure and weakening the bond. [Roberts et al. 1996]
Most mix designs specify an air void content of 3 to 5 percent. When the air void content is
below 5 percent, HMA materials have been shown to be almost impervious to water. During
construction, compaction control is not always good and high air void contents are a result. If an air void
content is above 8 percent, water can readily seep into the material. Excessive dust coating on an
aggregate can inhibit coating by asphalt and provide channels for water to penetrate. Other contributing
factors to stripping may include the use of open-graded asphalt friction; coarse, inadequate drying of
aggregate; weak aggregate; overlays on deteriorated concrete pavements; waterproofing membranes; and
seal coats [Roberts et al. 1996].
Techniques for Limiting Moisture Susceptibility
When subject to moisture, water-sensitive pavements may suffer accelerated damage leading to a
reduced pavement life. If asphalt pavement does suffer from water sensitivity, serious distresses may
occur. As a result, the asphalt pavement reduces in performance and increases in maintenance costs. To
alleviate or control this problem, various liquid or solid anti-stripping additives have been developed,
which can be used to promote adhesion between asphalt and aggregate. Anderson and Dukatz [1982]
reviewed the effects of commercially available anti-stripping additives on the physical properties of
asphalt cement. Anderson and Dukatz’s experimental studies of the physical and compositional properties
of asphalt cement with anti-stripping additives demonstrated that anti-stripping additives tend to soften
6
asphalt, reduce temperature susceptibility, and improve the aging characteristics of asphalt cement. Also,
Anderson and Dukatz stated that the effect of an anti-stripping additive is asphalt specific.
Anti-Stripping Agents
Anti-stripping agents may be necessary if a particular mix design has been shown to be
susceptible to moisture-induced damage. Liquid anti-stripping agents and lime additives are among the
most commonly used types of anti-stripping agents. However, if an additive is used when it is not needed
or if it is used incorrectly, adverse affects may occur, including an increased economic cost and early
maintenance and/or rehabilitation [Tunnicliff and Root 1984].
Liquid Anti-Stripping Agents
Liquid anti-stripping agents are chemical compounds that contain amines. Most anti-stripping
agents reduce surface tension between the asphalt and aggregate in a mixture [Tunnicliff et al. 1984].
When surface tension is reduced, increased adhesion of the asphalt to the aggregate is promoted. Thus,
most liquid anti-stripping agents are surface-active agents [Roberts et al. 1996].
An economical method of mixing the liquid anti-stripping agent with the asphalt is by heating the
asphalt to a liquid state. However, a more successful method of adding the additive is to apply it directly
to the aggregate prior to the addition of the binder [Kennedy, Roberts, Lee 1983]. It is important that the
liquid anti-stripping agent is heat stable. The liquid asphalt commonly is mixed with the liquid anti-
stripping agent prior to adding aggregate to the mix [Roberts et al. 1996].
Lime Additives
The anti-stripping mechanism of lime additives is not well understood. However, lime additives
are an accepted method of minimizing moisture susceptibility of a mix. The general practice is to add 1 to
1.5 percent lime by dry weight of aggregate to the mix. If an aggregate has more fines present, it may be
necessary to use more lime additive due to the increased surface area of the aggregate. Three forms of
7
lime are used: hydrated lime (Ca(OH)2), quick lime (CaO), and Dolomitic limes (both types S and N)
[Roberts et al. 1996].
Several methods exist for adding lime to mixtures. Dry hydrated lime is added prior to the
asphalt cement. Georgia DOT adds the dry hydrated lime immediately before the asphalt cement is added
[Roberts et al. 1996]. However, there is a problem maintaining the coverage until the asphalt cement is
added. Using hydrated lime slurry will increase the amount of water needed and the fuel costs of
production. Adding dry hydrated lime to wet aggregate has the same results as hydrated lime slurry. Hot
(quicklime) slurry is equivalent in cost to hydrated lime, but when slaked, there is a 25 percent higher
hydrated lime yield. Also, the elevated temperature during slaking helps to evaporate some of the added
moisture [Roberts et. al 1996].
To evaluate the properties of bituminous mixtures containing hydrated lime, Mohammad, Abadie,
Gokmen and Puppala [2000] studied TSR values, rutting and resilient modulus. Mohammad, Abadie,
Gokmen and Puppala found that if the hydrated lime was added as a mineral fille r, the permanent
deformation and fatigue endurance improved. Also, test results illustrated that adding lime increased the
tensile strength of HMA mixtures. Field and laboratory testing conducted by Kennedy and Anagnos [A
Field Evaluation of Techniques for Treating Asphalt Mixtures with Lime 1984] found that dry lime and
lime slurry improved moisture resistance. However, lime slurry had a better performance than dry lime.
Adding the lime in a drum mix plant was ineffective because much of the lime was lost before mixing
with the asphalt. Washing the aggregate before it was used, reduced the moisture resistance of mixture.
Aggregate Pre-Treatment
Different pre-treatments have been shown to improve the adhesion between asphalt and
aggregate. Examples of pretreatment include: preheating to evaporate water vapor, weathering, washing
to remove surface coatings, and crushing. It also has been shown that aggregates pre-coated with asphalt
or recycled materials are better at resisting moisture damage than are virgin materials [Kennedy, Roberts,
8
Lee 1983]. However, an alternate solution that works well is to avoid using rhyolite and siliceous material
[Construction, 1998].
Testing Methods for Moisture Susceptibility
Existing methods that test for moisture susceptibility of asphalt mixes include: Boiling Water
Test, Texas Boiling Water Test, Static Immersion Test, Lottman Test, Tunnicliff and Root Conditioning,
Modified Lottman Test, Immersion Compression Test, Hamburg Wheel Tracking Device, and Texas
Freeze-Thaw Pedestal Test. The following section describes each of these methods in detail.
Boiling Water Test
The Boiling Water Test (ASTM D3625) is a subjective test for the effects that moisture has on a
particular HMA mix. It is used primarily as an initia l screening test of a HMA mix. However, some
agencies use the Boiling Water Test to identify the presence of the anti-stripping agent during production.
In this capacity, the boiling water test serves as a measurement of quality control. [Roberts et al. 1996]
For the Boiling Water Test, loose HMA mix is added to boiling water. The mix is allowed to
remain in the boiling water for 10 minutes. Moisture damage is measured by observing the loose HMA in
the water. The percentage of the total visible area of the aggregate that retained its original coating of
asphalt cement is rated as either above or below 95 percent. It is difficult to determine the amount of
stripping that occurs of fine aggregate because fine aggregates are difficult to see. This testing method
tends to work better when using liquid anti-stripping agents [Roberts et al. 1996].
Yoon and Tarrer [1988] investigated the measurable relationship of aggregate properties to the
stripping propensity of a mix of aggregate and asphalt cement. Yoon and Tarrer used the Boiling Water
Test in their experimental design. By conducting the Boiling Water Test using different pH levels, Yoon
and Tarrer determined that effectiveness of some additives is sensitive to the pH of water that has been in
contact with the aggregate surface. Yoon and Tarrer found that there was no relationship between
physical properties, such as pore volume and surface area, of an aggregate and the stripping propensity of

9
that aggregate. However, chemical and electrochemical propertie s affected stripping propensity of the
aggregate.
Texas Boiling Water Test
The Texas Boiling Water Test (TBWT) is a visual rating of the extent of stripping after the
mixture is boiled. Asphalt cement is heated at 325°F (103°C) for 24 hours to 26 hours. One hundred
grams or 300 grams of unwashed aggregate is heated at the same temperature for 1 to 1.5 hours. The
aggregate and asphalt are mixed and are allowed to cool for two hours. A 1,000 ml beaker is filled half-
way with distilled water and boiled. The mixture is placed in boiling water for 10 minutes. Asphalt
cement that is floating is skimmed off the top. The water is cooled to room temperature and then poured
off. The mixture is emptied onto a paper towel and graded. A three-person panel grades the mixture at
that time and again the next day, once the mixture has had the opportunity to dry. A mixture that retains
65 percent to 75 percent of the asphalt cement is favorable for use in the field [Kennedy , Roberts, Lee
1983].
Static Immersion Test
A second type of subjective test is the Static Immersion Test (AASHTO T-182). An HMA mix
sample is immersed in a distilled water bath at 77°F (25°C). The mix is left in the water bath for 16 to 18
hours. Similar to the Boiling Water Test, the percentage of total visible area that remains coated with
asphalt cement is estimated as above or below 95 percent [Standard Specifications for Transportation
Materials and Methods of Sampling and Testing 1995].
10
Lottman Test
The Lottman Laboratory Test predicts the susceptibility of asphalt concrete mixtures to moisture-
damage. The test was piloted by Lottman [1982] at the University of Idaho. The Lottman Test is well
known and is described in NCHRP Project 192. The laboratory procedure that was developed was field
tested in NCHRP 246. Results from the study concluded that the ranking of test sections due to visual
stripping moisture damage was similar to the rankings obtained from the strength ratios.
Nine specimens are used in the laboratory procedure. They are compacted to field air void
content. The nine cores are split into three groups. Group one is the control group in which there is no
conditioning done. In the second group the cores are vacuum saturated with water for 30 minutes at 660
mmHg. Group two reflects field performance of the HMA mix for the first four years of life. The third
group also is vacuum saturated, but then the cores are put through a freeze-thaw cycle. Group three cores
are frozen at 0°F (-18°C) for 15 hours. Then they are thawed at 140°F (60°C) for 24 hours. Group three is
designed to reflect field performance from the fourth to the twelfth year [Lottman 1982; Roberts et al.
1996].
The Resilient Modulus (MR) Test and/or the Indirect Tensile Strength Test (ITS) are performed
on each core after the prescribed conditioning has been completed. These tests can be performed at either
55°F (13°C) or 73°F (23°C). ITS is determined using a loading rate of 0.065 in/min. The retained tensile
strength (TSR) is calculated for the cores in groups two and three. The TSR is equivalent to the ITS of
the conditioned specimens divided by the ITS of the control specimens. The equations will be discussed
further in chapter III. It is recommended that a TSR be greater than 0.7. However, field cores have shown
visual stripping when the TSR was 0.8. [Lottman 1982, Roberts et al. 1996]
Tunnicliff and Root Conditioning
Tunnicliff and Root Conditioning (NCHRP 274) is a strength test that utilizes ITS. Six
specimens are produced with air voids between 6 and 8 percent. The six samples are split into two groups
11
of three. The first group is the control group without any conditioning. The second group is vacuum
saturated at 28.6 in. HG for five minutes. Saturation limits for the specimens are 55 to 80 percent. After
saturation, group two cores are placed in a 140°F (60°C) water bath for 24 hours. The ITS Test is
performed at 77°F (25°C) with a loading rate of 2 in/min. The minimum acceptable TSR used is 0.7 to
0.8 [Tunnicliff et al. 1984].
Modified Lottman Test
AASHTO accepted the Modified Lottman Test (AASHTO T-283) in 1985. It is a combination of
the Lottman Test, and the Tunnicliff and Root Test. Six specimens are produced with air voids between
six percent and eight percent. The higher percentage of air voids helps to accelerate moisture damage on
the cores. Two groups of three specimens are used. The first group is the control group. The second
group is saturated between 55 and 80 percent with water and is placed in the freezer (0°F or –18°C) for 16
to 18 hours. The frozen cores then are moved to a water bath at 140°F (60°C) for 24 hours. After
conditioning, the Resilient Modulus Test and/or ITS Test are performed. The ITS Test is performed at
77°F (25°C) with a loading rate of 2 in/min.[Standard Specifications 1995] The minimum acceptable
TSR used is 0.7 [Roberts et al. 1996].
Immersion-Compression Test
The Immersion-Compression Test (AASHTO T-165) utilizes six cores. Each core is four inches
in diameter and four inches in height. The cores are compacted with a double plunger at 3,000 psi for two
minutes. An air void content of 6 percent is attained. The six cores are split into two groups. The first
group is a control group. The second group is conditioned in a water bath at 120°F (49°C) for four days
or at 140°F (60°C) for one day.
12
After conditioning, the unconfined compressive strength of each core is found. A testing
temperature of 77°F (25°C) and a loading rate of 0.2 in/min are used. The retained compressive strength
is calculated. A retained strength of 70 percent is specified by many agencies [Roberts et al. 1996].
The Immersion-Compression Test has produced retained strengths close to 100 percent even
when stripping is visually evident in the cores. Thus, this test is not sensitive enough to measure damage
induced by moisture. This problem was attributed to the internal pore water pressure that develops
[Roberts et al. 1996].
Hamburg Wheel Tracking Device
The Hamburg Wheel Tracking Device (HWTD) was developed in the 1970s by Esso A.G. of
Hamburg, Germany [Romero and Stuart 1998]. A similar device was already developed in Britain, but it
utilized a rubber tire instead of a steel tire. The HWTD measures the combined effects of rutting and
moisture on HMA mixtures. A steel wheel rolls across the surface of an asphalt cement slab immersed in
hot water [Romero and Stuart 1998]. The HWTD is capable of testing two slabs at one time. The steel
wheels move concurrently through a crank connected to a flywheel. This type of movement produces a
varying velocity that is maximized at the center of the slab. [Izzo and Tahmoressi 1999]
The slabs are 320mm (12.6in.) long by 260 mm (10.2 in.) wide. The thickness of the slabs are 40
mm, 80 mm, or 120 mm (1.6, 3.2, 4.7 in.). During the test, the slabs are secured with plaster-of-paris in a
steel container and are rested on a steel platform. Figure 2.1 is an illustration of a HWTD. The steel
wheel has a diameter of 203.5 mm (8 in.) and a width of 47 mm (1.8 in.). A fixed load of 685 N is
applied at a rate of 53±2 wheel passes per minute. The contact area of the wheel increases as the rut depth
increases. Thus, the contact stress is variable. The average contact stress is 203.5 MPa. A slab undergoes
20,000 passes or until 20 mm of deformation occurs. The temperature of the hot water bath can vary from
25°C to 70°C (77-158°F). A linear variable differential transducer measures the depth of the rut
13
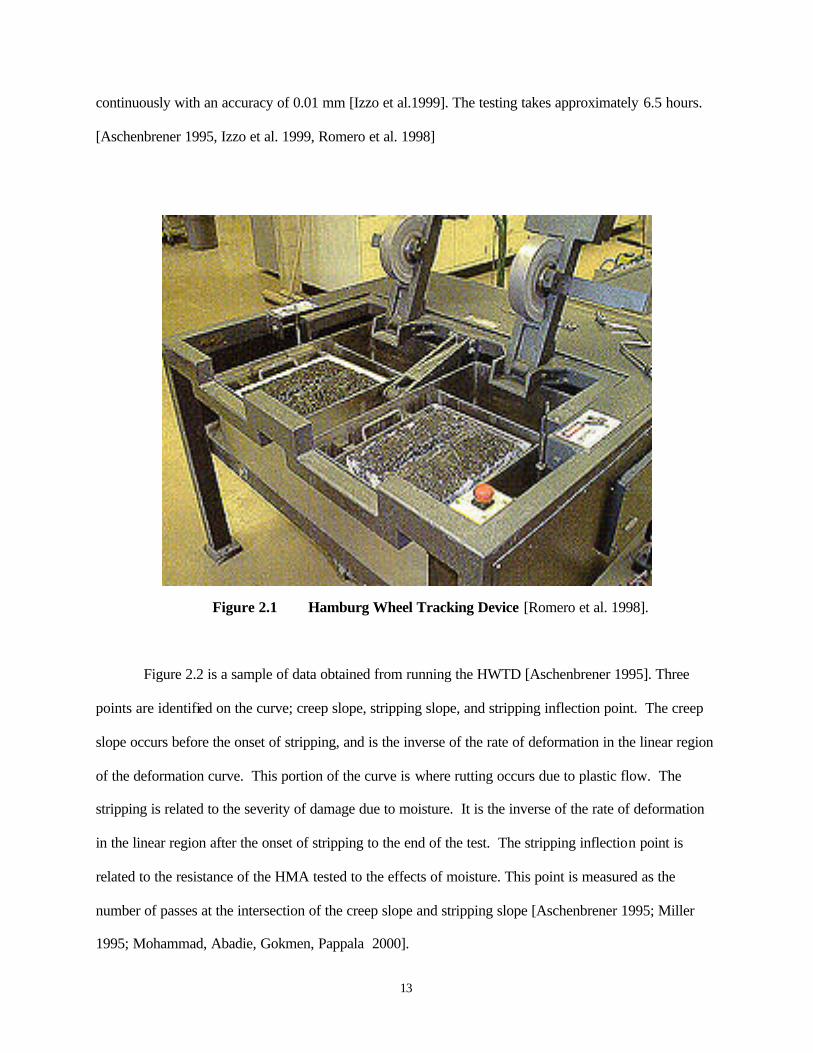
continuously with an accuracy of 0.01 mm [Izzo et al.1999]. The testing takes approximately 6.5 hours.
[Aschenbrener 1995, Izzo et al. 1999, Romero et al. 1998]
Figure 2.1 Hamburg Wheel Tracking Device [Romero et al. 1998].
Figure 2.2 is a sample of data obtained from running the HWTD [Aschenbrener 1995]. Three
points are identified on the curve; creep slope, stripping slope, and stripping inflection point. The creep
slope occurs before the onset of stripping, and is the inverse of the rate of deformation in the linear region
of the deformation curve. This portion of the curve is where rutting occurs due to plastic flow. The
stripping is related to the severity of damage due to moisture. It is the inverse of the rate of deformation
in the linear region after the onset of stripping to the end of the test. The stripping inflection point is
related to the resistance of the HMA tested to the effects of moisture. This point is measured as the
number of passes at the intersection of the creep slope and stripping slope [Aschenbrener 1995; Miller
1995; Mohammad, Abadie, Gokmen, Pappala 2000].
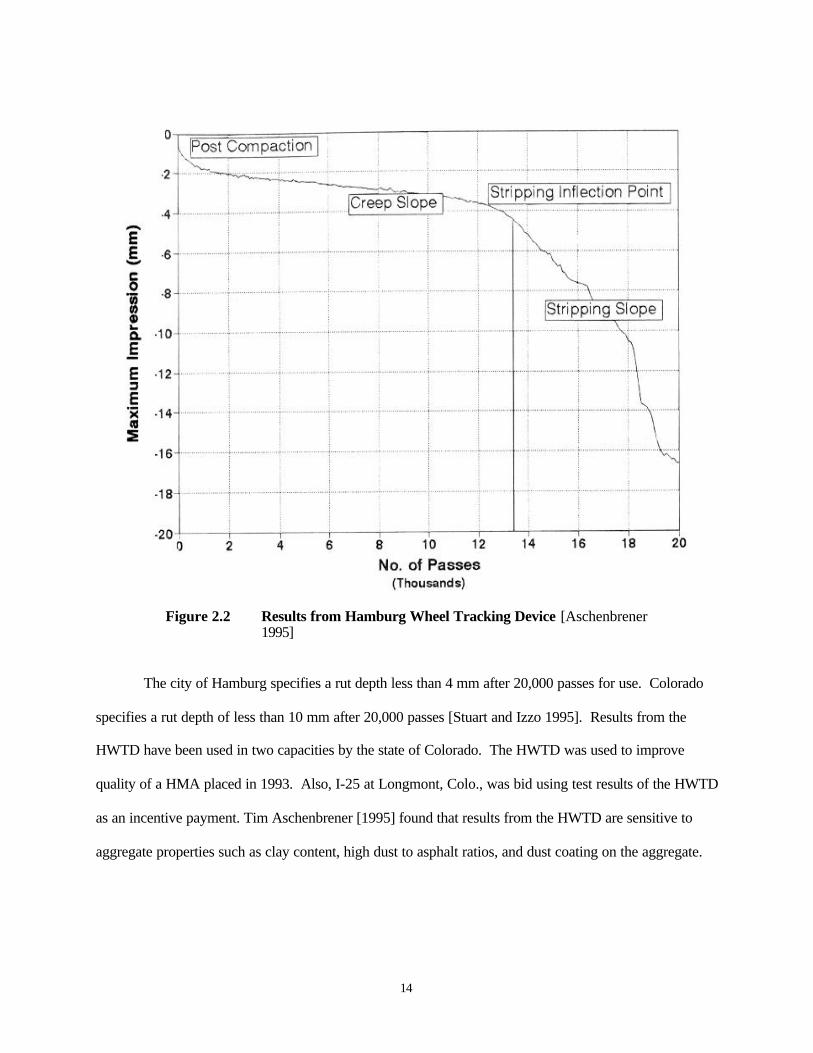
14
Figure 2.2 Results from Hamburg Wheel Tracking Device [Aschenbrener 1995]
The city of Hamburg specifies a rut depth less than 4 mm after 20,000 passes for use. Colorado
specifies a rut depth of less than 10 mm after 20,000 passes [Stuart and Izzo 1995]. Results from the
HWTD have been used in two capacities by the state of Colorado. The HWTD was used to improve
quality of a HMA placed in 1993. Also, I-25 at Longmont, Colo., was bid using test results of the HWTD
as an incentive payment. Tim Aschenbrener [1995] found that results from the HWTD are sensitive to
aggregate properties such as clay content, high dust to asphalt ratios, and dust coating on the aggregate.
15
Texas Freeze-Thaw Pedestal Test
The Texas Freeze-Thaw Pedestal Test (TFTPT) is conducted on a HMA mix with uniform
aggregate sizes. Since a uniform aggregate size is used, the effects of mechanical properties of the
aggregate are minimized in the test. Thus, effects of bonding are maximized. To perform the test, the
asphalt and aggregate are mixed using the Texas Mixture Design Procedure. After initial mixing, the
mixture is reheated and is mixed two additional times.
A cylindrical mold is used to form the specimen, which has a height of 19.05 mm (0.75 in.) and a
41.3 mm (1.6 in.) diameter. A constant load of 27.6 kN (6200 lbs) is applied for 20 minutes. The
specimen is cured at ambient temperature for three days. Thermal cycling is performed on the specimen.
The specimen is placed on a stress pedestal in a jar and covered with 12.7 mm (0.5 in.) of distilled water.
It is cycled through –12°C (-10°F) for 12 hours then 12 hours at 49°C (120°F). The number of freeze
thaw cycles to induce cracking indicates moisture susceptibility of the HMA. Kennedy, Roberts, and Lee
found that mixes susceptible to moisture survived less than 10 cycles. Mixtures that were not susceptible
to moisture survived more than 20 cycles [Kennedy, Roberts, Lee 1983; Kennedy and Anagnos Modified
Test 1984].
Georgia Loaded Wheel Tester
The Georgia Loaded Wheel Tester (GLWT) was developed by the Georgia Department of
Transportation. Development of the GLWT included comparisons of the creep tests and the repeated load
triaxial test with data obtained from GLWT testing. These comparisons were used to evaluate the GLWT
ability to produce results in line with rutting in the field [Collins, Watson, Campbel 1995]. The GLWT
measures the rutting susceptibility of a HMA mix by rolling a steel wheel across the top of a pressurized
hose placed on top of an asphalt beam. The hose is made of stiff 29 mm diameter rubber. The wheel
travels at a rate of 33 cycles or 67 passes per minute. Steel plates confine the beams that are used. The
machine has a temperature-controlled compartment.

16
Previous experimentation done at the University of Wyoming by Tyler Miller [1995] developed a
process of utilizing 6 in. (150 mm) diameter cores in the GLWT. The cores were placed in a concrete
frame and centered in the GLWT. Figure 2.3 shows an example of the concrete frame. Miller confirmed
a testing temperature of 115°F (46°C) for Wyoming. Also, Miller correlated rut depths produced in the
GLWT with field rutting in Wyoming.
Figure 2.3 Georgia Loaded Wheel Tester Concrete and Steel Frame.
In 1996 Collins, Shami, and Lai developed a gyratory sample mold that could be used in the
GLWT. The GLWT that was used had three wheel testers that ran simultaneously. The mold that was
developed was made of high density polyethylene. Their results indicated that the GLWT could be used
in conjunction with Superpave Level 1 mix design to develop mix designs with low susceptibility to
rutting.
The projected use of the GLWT was as an inexpensive proof tester. Watson, Johnson, and Jared
[1997] found that some HMA mixes that fell outside the Superpave restricted zone performed well in the

17
GLWT. Therefore, to prevent economical mixes from being rejected, mixes should be tested even if they
fall into the restricted zone. In 1997, Shami, Lai, D’Angelo, and Harmen developed a temperature effect
model to be used with the GLWT. With this model, rutting susceptibility can be tested at one temperature
for different environments.
Chapter Summary
Stripping is a serious and costly problem for many DOTs. Over the years many testing
procedures have been developed to predict moisture susceptibility of an HMA mixture. Two types of
testing have been developed: strength and subjective. Of the strength tests, those that use TSR data have
been widely tested and accepted. Since the GLWT is a less expensive piece of equipment than the
Hamburg Wheel Tracking Device, it would be beneficial if a testing procedure could be developed that
uses the GLWT to test for moisture susceptibility.

18
19
CHAPTER 3
DESIGN OF EXPERIMENT AND TESTING PROCEDURES
Introduction
The experiment was split into two phases. The goal of phase I was to evaluate effects of various
freeze-thaw cycles on the strength of Hot Mix Asphalt (HMA) mixtures. This was achieved by selecting
eight HMA mixtures and then developing a testing procedure to condition and test the tensile strength of
the cores. Wyoming modified AASHTO T-283 was followed in the production, cycling, and testing of
the cores.
The second phase of the experiment was to evaluate ability of the Georgia Loaded Wheel Tester
(GLWT) to predict the moisture susceptibility of HMA mixtures. Three of the eight mixtures from phase
one were used for this testing. Cores were produced at 4 percent and 7 percent air voids for each of the
mixtures. The cores were then conditioned and tested in the GLWT. This chapter details design of the
experimental procedures used to conduct phase I and phase II of this experiment.
Evaluation of the Effects of Various Freeze -Thaw Cycles on HMA Strength
This section describes in detail the experimental procedure, including sample preparation, the
freeze-thaw cycling, the Resilient Modulus testing, and the Indirect Tensile testing as used in phase I.
During the sample preparation for phase I, the density of each type of asphalt used was tested by standard
test method ASTM D70-82. The Rice Test was performed on each mixture using theoretical maximum
specific density method AASHTO T209-94. Finally, each group of samples was produced using the
Gyratory compactor. After the samples cool to ambient temperature, the bulk specific gravity of each core
was measured using AASHTO T-166. For each of the eight HMA mixtures, freeze-thaw cycling varying
from 0-1-2-4-6-8-10-15 cycles was attempted. Each cycle consists of freezing the sample for 16 to 18
hours and then thawing the samples in a 140°F (60°C) water bath for 24 hours. If a sample failed during
20
cycling, no additional testing was required. After a prescribed number of freeze-thaw cycles, the samples
were dried in an environmental chamber at 77°F (25°C) for 24 hours before performing the Resilient
Modulus Test. The Resilient Modulus Test is non-destructive and is performed using an Instron machine.
The samples then were fractured while performing the Indirect Tensile Test. Once fractured, samples
were given to Western Research Institute for chemical analysis.
A total of 128 cores were needed for phase I. Sixteen samples were produced for each of the
eight mixtures at 7 percent air voids. It took one week to produce a core and condition it through one
freeze-thaw cycle. For the samples from a mixture type to be conditioned for 15 freeze-thaw cycles and
tested, it took a little more than one month. That conditioning was timed such that a majority of the
testing occurred between seven in the morning and 11 at night. Due to the availability of equipment, six
months were needed to complete the conditioning and testing of the eight mixtures.
Aggregate
Classification of the aggregates normally is accomplished by the size of the aggregate. Three
common groups are coarse aggregate, fine aggregates, or mineral fillers. Generally aggregates for HMA
are required to be resistant to abrasion, sound, clean, and hydrophobic [Roberts et al. 1991]. In this study,
granite aggregate was taken from stockpiles at Granite Canyon Quarry in Wyoming, and limestone was
obtained from the North Rawlins Quarry in Wyoming. The corresponding physical characteristics of
each type of aggregate were obtained from WYDOT. Therefore, physical characteristic tests of the
aggregates were not performed at the University of Wyoming.
Gradation is one of the more important properties of an aggregate. It affects the stability and the
durability of the HMA mixes. Therefore, gradation is a primary consideration in asphalt mix design.
Gradation is usually determined by sieve analysis. Sieve analysis involves passing the material through a
series of sieves stacked with progressively smaller openings from top to bottom, and then weighing the
material retained on each sieve. The gradation normally is expressed as total percent passing various sieve
sizes.
21
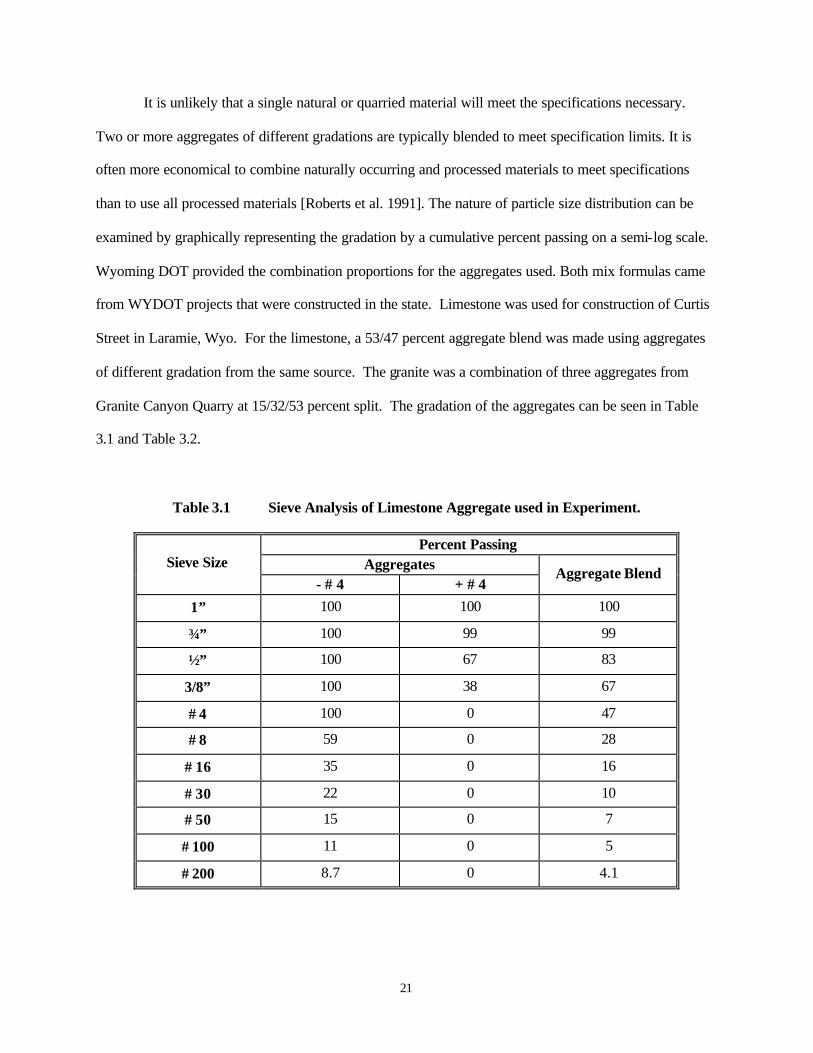
It is unlikely that a single natural or quarried material will meet the specifications necessary.
Two or more aggregates of different gradations are typically blended to meet specification limits. It is
often more economical to combine naturally occurring and processed materials to meet specifications
than to use all processed materials [Roberts et al. 1991]. The nature of particle size distribution can be
examined by graphically representing the gradation by a cumulative percent passing on a semi-log scale.
Wyoming DOT provided the combination proportions for the aggregates used. Both mix formulas came
from WYDOT projects that were constructed in the state. Limestone was used for construction of Curtis
Street in Laramie, Wyo. For the limestone, a 53/47 percent aggregate blend was made using aggregates
of different gradation from the same source. The granite was a combination of three aggregates from
Granite Canyon Quarry at 15/32/53 percent split. The gradation of the aggregates can be seen in Table
3.1 and Table 3.2.
Table 3.1 Sieve Analysis of Limestone Aggregate used in Experiment.
Percent Passing Aggregates Sieve Size
- # 4 + # 4 Aggregate Blend
1” 100 100 100
¾” 100 99 99
½” 100 67 83
3/8” 100 38 67
# 4 100 0 47
# 8 59 0 28
# 16 35 0 16
# 30 22 0 10
# 50 15 0 7
# 100 11 0 5
# 200 8.7 0 4.1
22
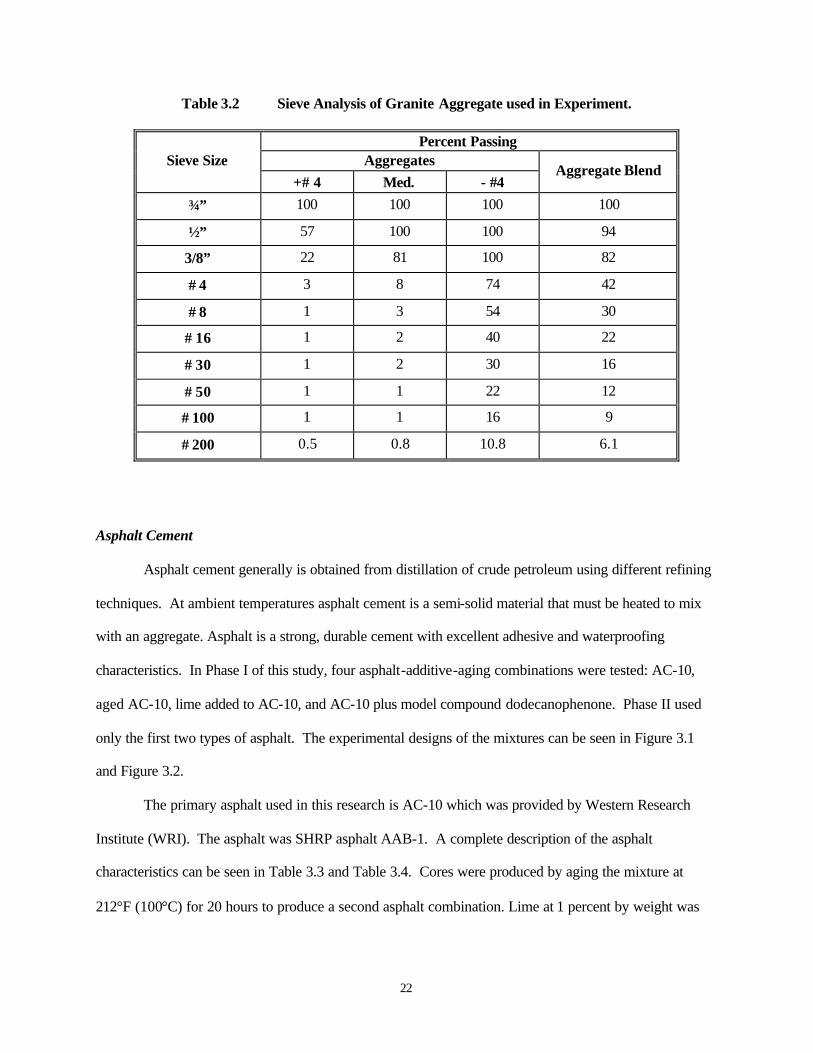
Table 3.2 Sieve Analysis of Granite Aggregate used in Experiment.
Percent Passing Aggregates Sieve Size
+# 4 Med. - #4 Aggregate Blend
¾” 100 100 100 100
½” 57 100 100 94
3/8” 22 81 100 82
# 4 3 8 74 42
# 8 1 3 54 30
# 16 1 2 40 22
# 30 1 2 30 16
# 50 1 1 22 12
# 100 1 1 16 9
# 200 0.5 0.8 10.8 6.1
Asphalt Cement
Asphalt cement generally is obtained from distillation of crude petroleum using different refining
techniques. At ambient temperatures asphalt cement is a semi-solid material that must be heated to mix
with an aggregate. Asphalt is a strong, durable cement with excellent adhesive and waterproofing
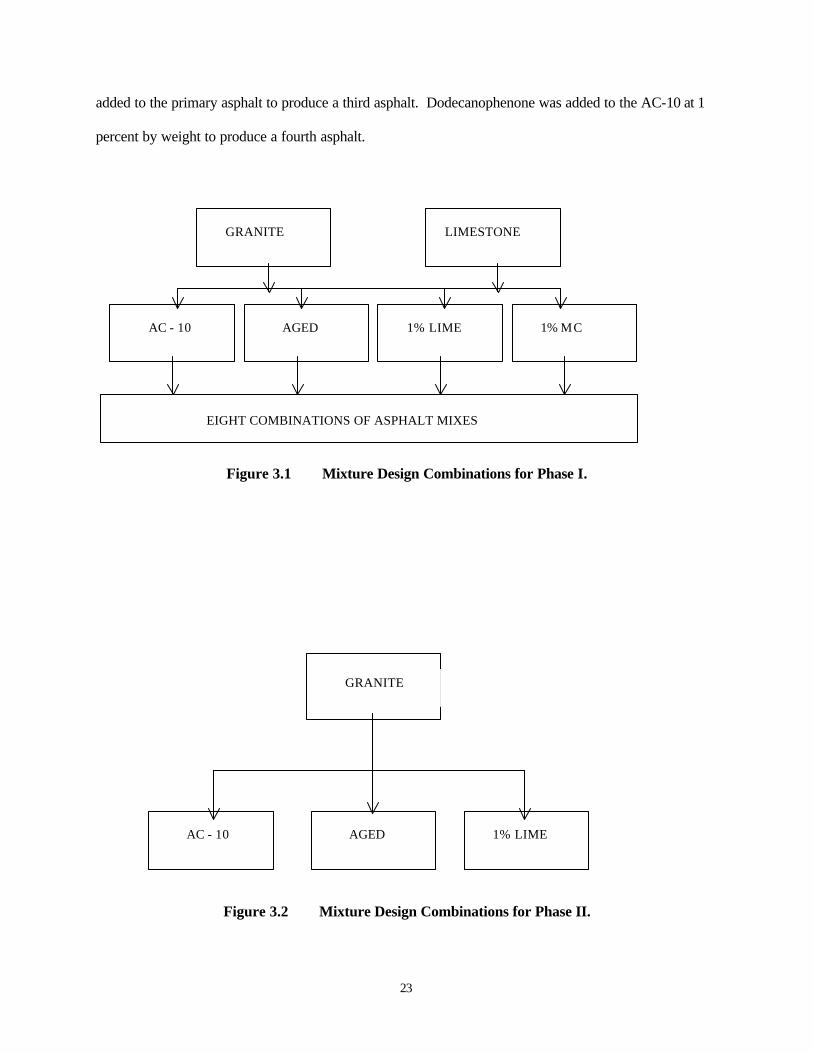
characteristics. In Phase I of this study, four asphalt-additive-aging combinations were tested: AC-10,
aged AC-10, lime added to AC-10, and AC-10 plus model compound dodecanophenone. Phase II used
only the first two types of asphalt. The experimental designs of the mixtures can be seen in Figure 3.1
and Figure 3.2.
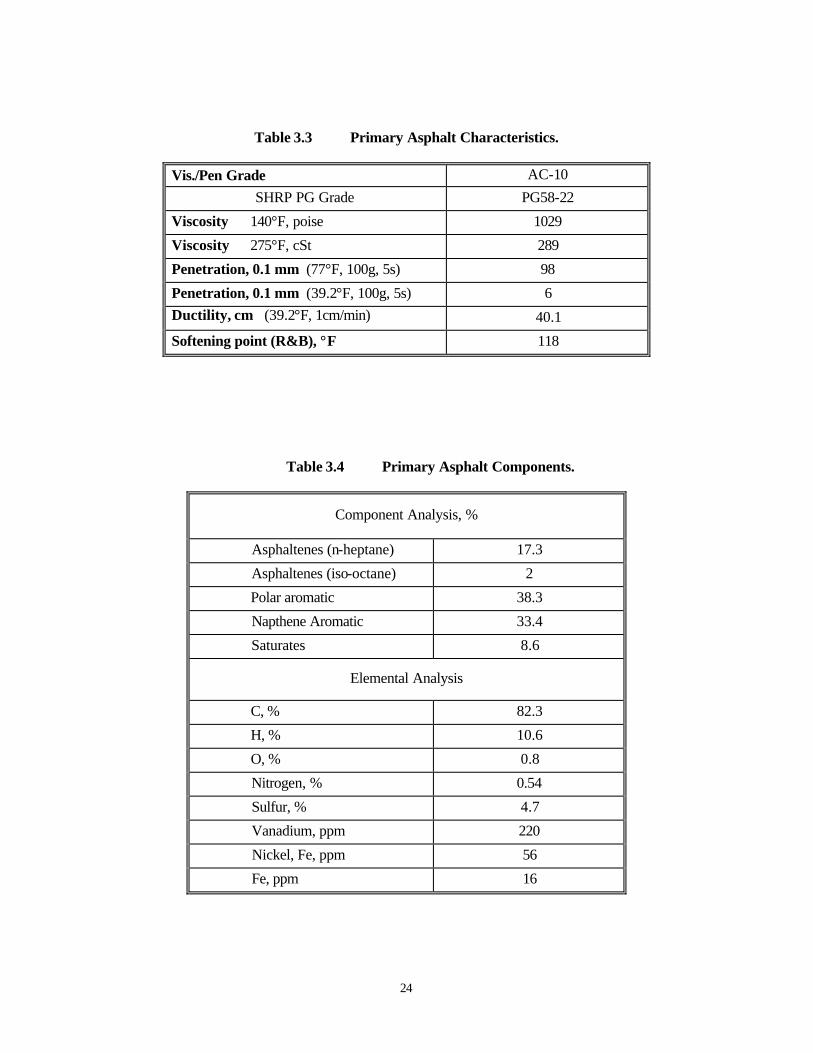
The primary asphalt used in this research is AC-10 which was provided by Western Research
Institute (WRI). The asphalt was SHRP asphalt AAB-1. A complete description of the asphalt
characteristics can be seen in Table 3.3 and Table 3.4. Cores were produced by aging the mixture at
212°F (100°C) for 20 hours to produce a second asphalt combination. Lime at 1 percent by weight was
23
added to the primary asphalt to produce a third asphalt. Dodecanophenone was added to the AC-10 at 1
percent by weight to produce a fourth asphalt.
Figure 3.1 Mixture Design Combinations for Phase I.
Figure 3.2 Mixture Design Combinations for Phase II.
GRANITE LIMESTONE
AC - 10 AGED 1% LIME 1% MC
AC - 10 AGED 1% LIME
GRANITE
EIGHT COMBINATIONS OF ASPHALT MIXES
24
Table 3.3 Primary Asphalt Characteristics.
Vis./Pen Grade AC-10
SHRP PG Grade PG58-22
Viscosity 140°F, poise 1029
Viscosity 275°F, cSt 289
Penetration, 0.1 mm (77°F, 100g, 5s) 98
Penetration, 0.1 mm (39.2°F, 100g, 5s) 6 Ductility, cm (39.2°F, 1cm/min) 40.1
Softening point (R&B), °F 118
Table 3.4 Primary Asphalt Components.
Component Analysis, %
Asphaltenes (n-heptane) 17.3
Asphaltenes (iso-octane) 2
Polar aromatic 38.3
Napthene Aromatic 33.4
Saturates 8.6
Elemental Analysis
C, % 82.3
H, % 10.6
O, % 0.8
Nitrogen, % 0.54
Sulfur, % 4.7
Vanadium, ppm 220
Nickel, Fe, ppm 56
Fe, ppm 16
25
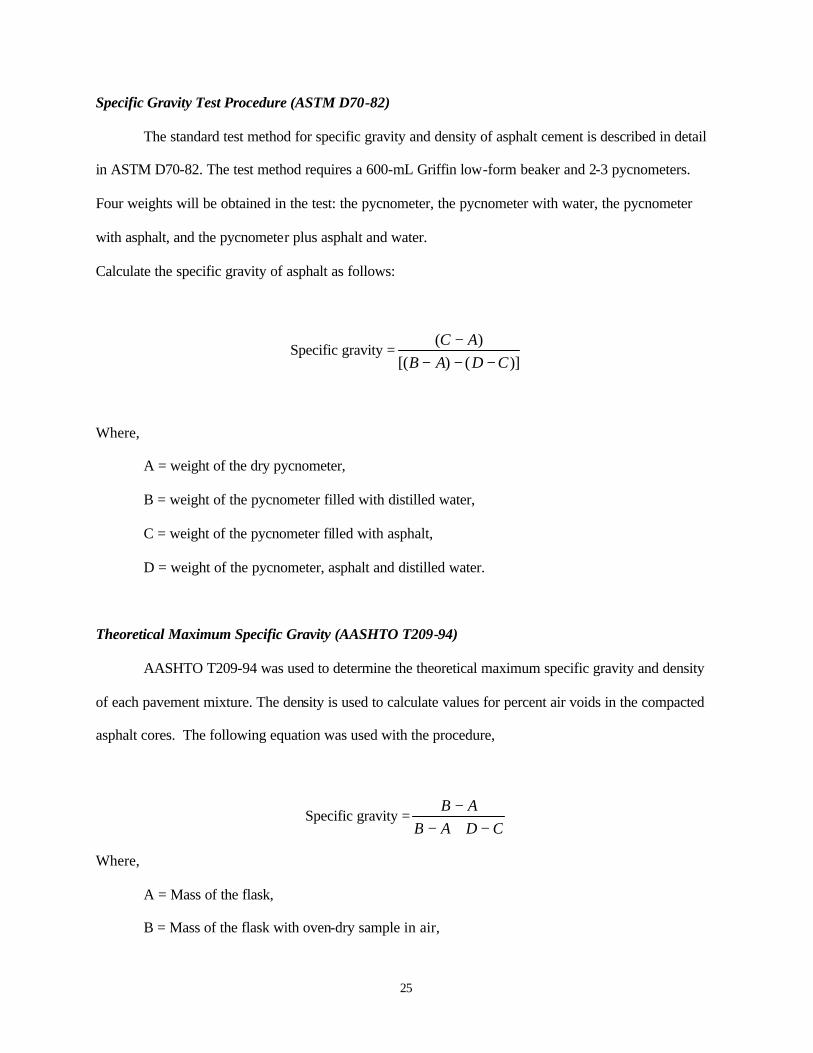
Specific Gravity Test Procedure (ASTM D70-82)
The standard test method for specific gravity and density of asphalt cement is described in detail
in ASTM D70-82. The test method requires a 600-mL Griffin low-form beaker and 2-3 pycnometers.
Four weights will be obtained in the test: the pycnometer, the pycnometer with water, the pycnometer
with asphalt, and the pycnometer plus asphalt and water.
Calculate the specific gravity of asphalt as follows:
Specific gravity =)]()[(
)(CDAB
AC−−−
−
Where,
A = weight of the dry pycnometer,
B = weight of the pycnometer filled with distilled water,
C = weight of the pycnometer filled with asphalt,
D = weight of the pycnometer, asphalt and distilled water.
Theoretical Maximum Specific Gravity (AASHTO T209-94)
AASHTO T209-94 was used to determine the theoretical maximum specific gravity and density
of each pavement mixture. The density is used to calculate values for percent air voids in the compacted
asphalt cores. The following equation was used with the procedure,
Specific gravity =CDAB
AB−+−
−
Where,
A = Mass of the flask,
B = Mass of the flask with oven-dry sample in air,
26
C = Mass of the flask filled with sample and water at 770F (250C),
D = Mass of the flask filled with water at 770F (250C),
and the theoretical maximum specific density is equivalent to the specific gravity multiplied by the unit
weight of water (62.4 lb/ft2).
Production of Cores
In this study, all cores were compacted using the gyratory compactor. The Troxler Gyratory
Compactor is an integral part of the mix design and testing phases of Superpave, as illustrated in Figure
3.3. The Gyratory Compactor compacts an asphalt specimen by applying a force of 600 kPa to the mix
while gyrating the mold at an angle of 1.25o. The height of the specimen is monitored continually. The
Gyratory Compactor operates by compacting the asphalt mixture with a fixed pressure while gyrating the
mold at a fixed angle, simulating the actions of a roller compactor in the field.
27
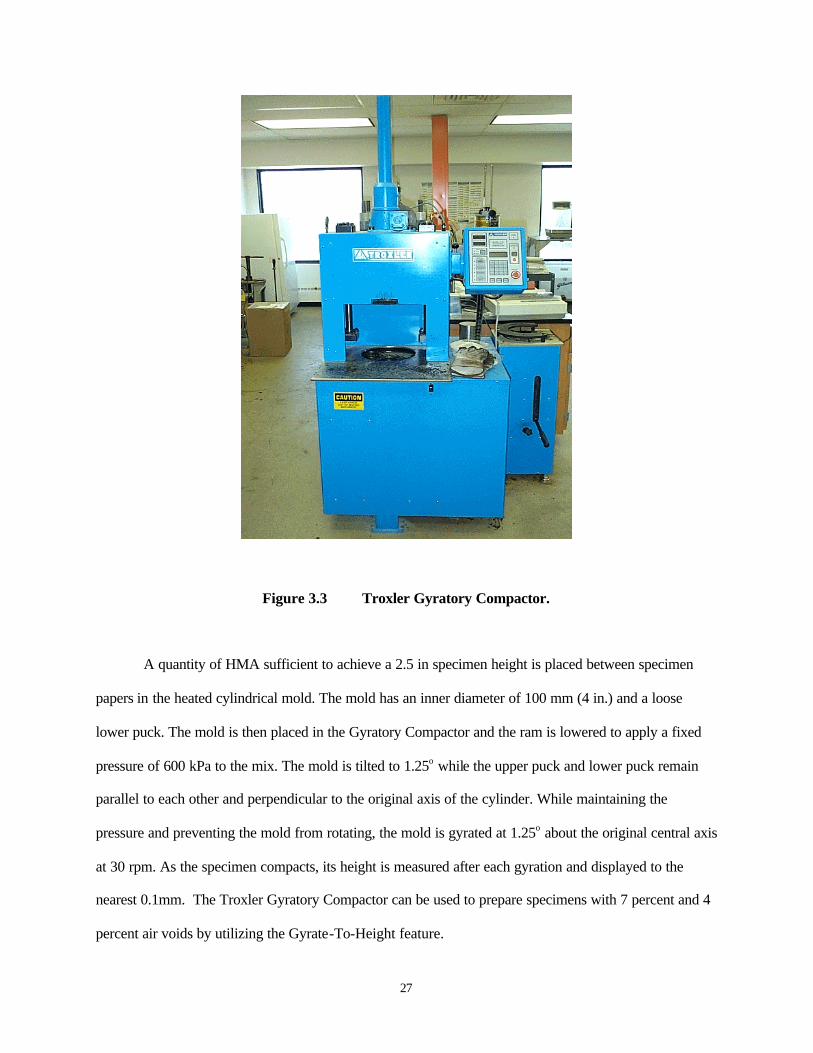
Figure 3.3 Troxler Gyratory Compactor.
A quantity of HMA sufficient to achieve a 2.5 in specimen height is placed between specimen
papers in the heated cylindrical mold. The mold has an inner diameter of 100 mm (4 in.) and a loose
lower puck. The mold is then placed in the Gyratory Compactor and the ram is lowered to apply a fixed
pressure of 600 kPa to the mix. The mold is tilted to 1.25o while the upper puck and lower puck remain
parallel to each other and perpendicular to the original axis of the cylinder. While maintaining the
pressure and preventing the mold from rotating, the mold is gyrated at 1.25o about the original central axis
at 30 rpm. As the specimen compacts, its height is measured after each gyration and displayed to the
nearest 0.1mm. The Troxler Gyratory Compactor can be used to prepare specimens with 7 percent and 4
percent air voids by utilizing the Gyrate-To-Height feature.
28
Each of the eight mixtures used in this experiment were heated to a mixing temperature before the
asphalt and aggregate were combined. The mixture was placed in an oven for two hours to reach the
compaction temperature. Once the compaction temperature was reached, enough mixture was placed in a
mold to produce a 2.5 in. by 4 in. core then compacted in the Gyratory compactor. The full procedure
followed to produce the cores can be found in Appendix A.
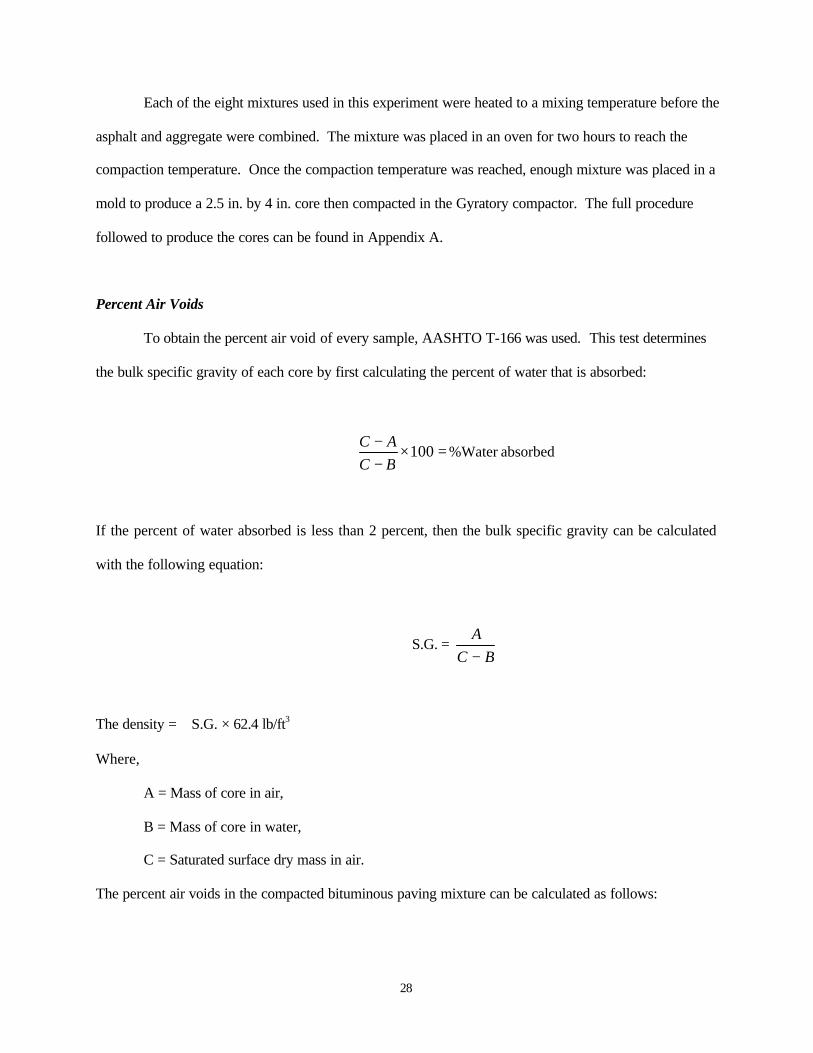
Percent Air Voids
To obtain the percent air void of every sample, AASHTO T-166 was used. This test determines
the bulk specific gravity of each core by first calculating the percent of water that is absorbed:
=×−−
100BCAC
%Water absorbed
If the percent of water absorbed is less than 2 percent, then the bulk specific gravity can be calculated
with the following equation:
S.G. = BC
A−
The density = S.G. × 62.4 lb/ft3
Where,
A = Mass of core in air,
B = Mass of core in water,
C = Saturated surface dry mass in air.
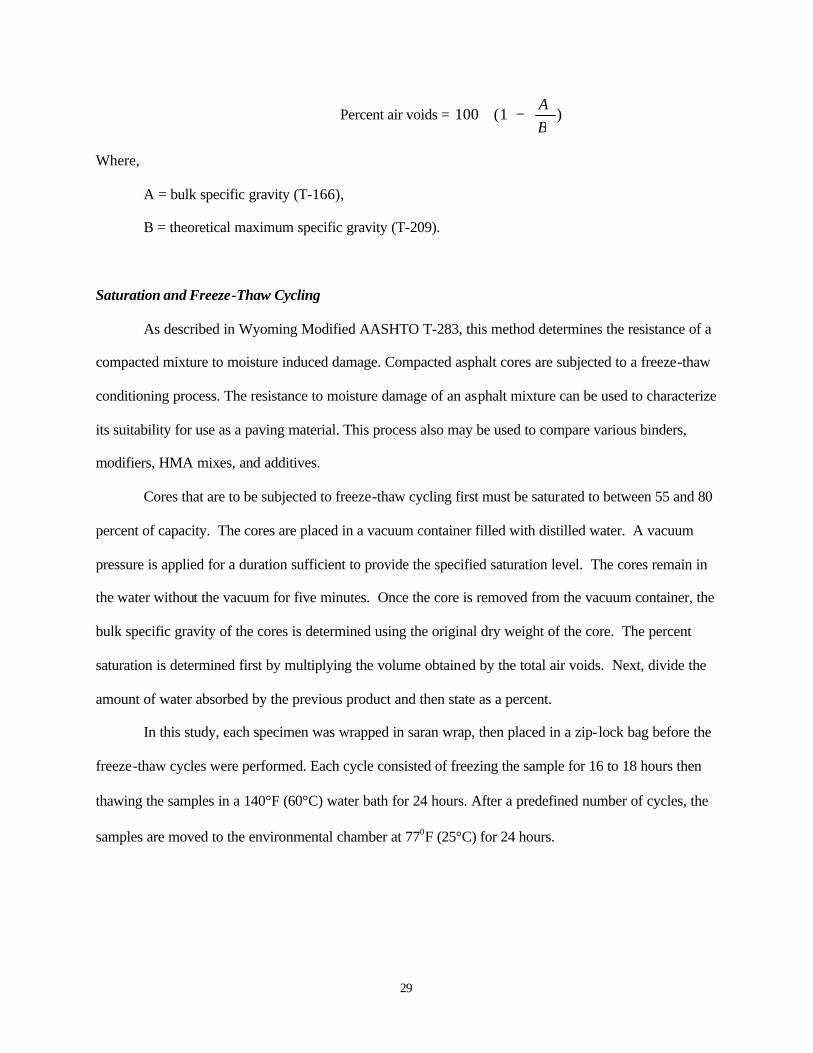
The percent air voids in the compacted bituminous paving mixture can be calculated as follows:
29
Percent air voids = )1(100BA
−
Where,
A = bulk specific gravity (T-166),
B = theoretical maximum specific gravity (T-209).
Saturation and Freeze-Thaw Cycling
As described in Wyoming Modified AASHTO T-283, this method determines the resistance of a
compacted mixture to moisture induced damage. Compacted asphalt cores are subjected to a freeze-thaw
conditioning process. The resistance to moisture damage of an asphalt mixture can be used to characterize
its suitability for use as a paving material. This process also may be used to compare various binders,
modifiers, HMA mixes, and additives.
Cores that are to be subjected to freeze-thaw cycling first must be saturated to between 55 and 80
percent of capacity. The cores are placed in a vacuum container filled with distilled water. A vacuum
pressure is applied for a duration sufficient to provide the specified saturation level. The cores remain in
the water without the vacuum for five minutes. Once the core is removed from the vacuum container, the
bulk specific gravity of the cores is determined using the original dry weight of the core. The percent
saturation is determined first by multiplying the volume obtained by the total air voids. Next, divide the
amount of water absorbed by the previous product and then state as a percent.
In this study, each specimen was wrapped in saran wrap, then placed in a zip-lock bag before the
freeze-thaw cycles were performed. Each cycle consisted of freezing the sample for 16 to 18 hours then
thawing the samples in a 140°F (60°C) water bath for 24 hours. After a predefined number of cycles, the
samples are moved to the environmental chamber at 770F (25°C) for 24 hours.
30
Resilient Modulus Test
The Resilient Modulus Test was performed using an Instron machine. The test uses repeated load
Indirect Tensile Test techniques to determine resilient modulus values (Mr). The Instron machine can
apply a repeated cyclic stress of fixed magnitude, duration (0.1s), and cycle duration (1.0s) to the test
specimen. During testing, the specimen was subjected to a dynamic cyclic stress (90 percent of total load)
and a constant stress (10 percent of total load). The instantaneous horizontal deformation response of the
specimen was measured and used to calculate an instantaneous resilient modulus (MRi). The analysis in
this report will not include this portion of the data collection and its analysis.
Indirect Tensile Test
The indirect tensile test measures change in tensile strength resulting from effects of saturation
and accelerated water conditioning of compacted HMA in the laboratory. The results may be used to
predict long-term stripping susceptibility of bituminous mixtures and to evaluate liquid anti-stripping
additives, which are added to the asphalt cement. The numerical indices of retained indirect tensile
properties are obtained by comparing the retained indirect properties of conditioned laboratory specimens
with the similar properties of dry specimens.
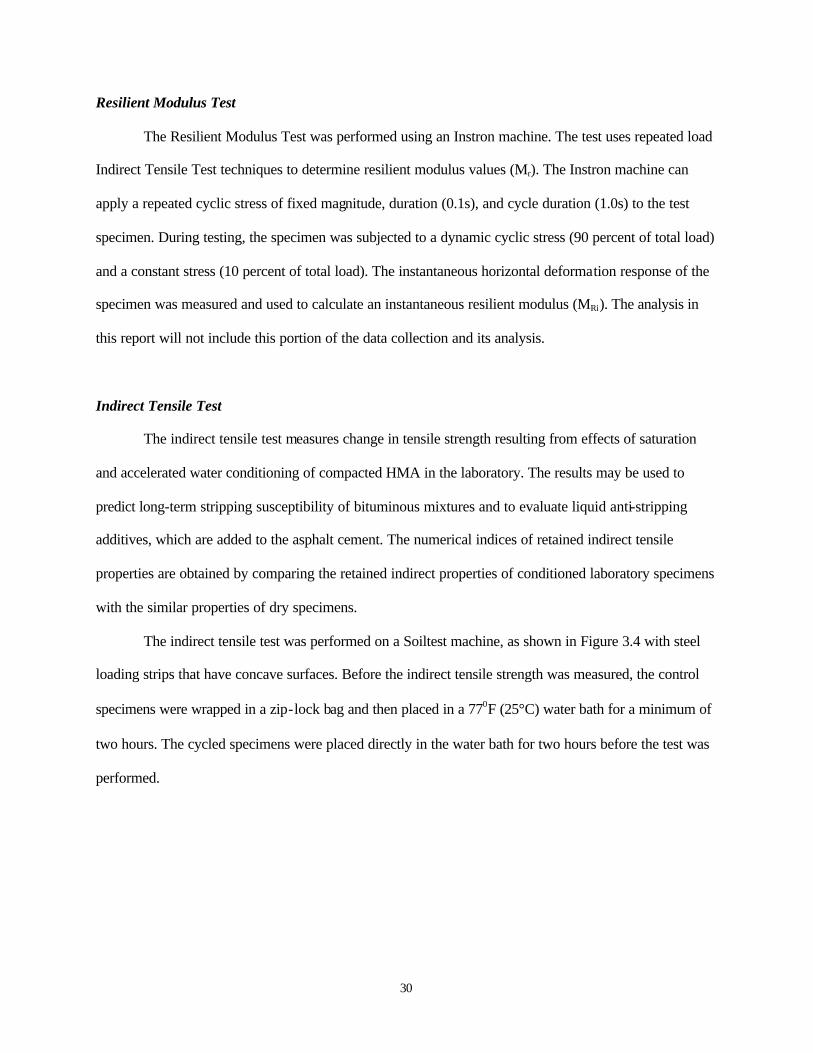
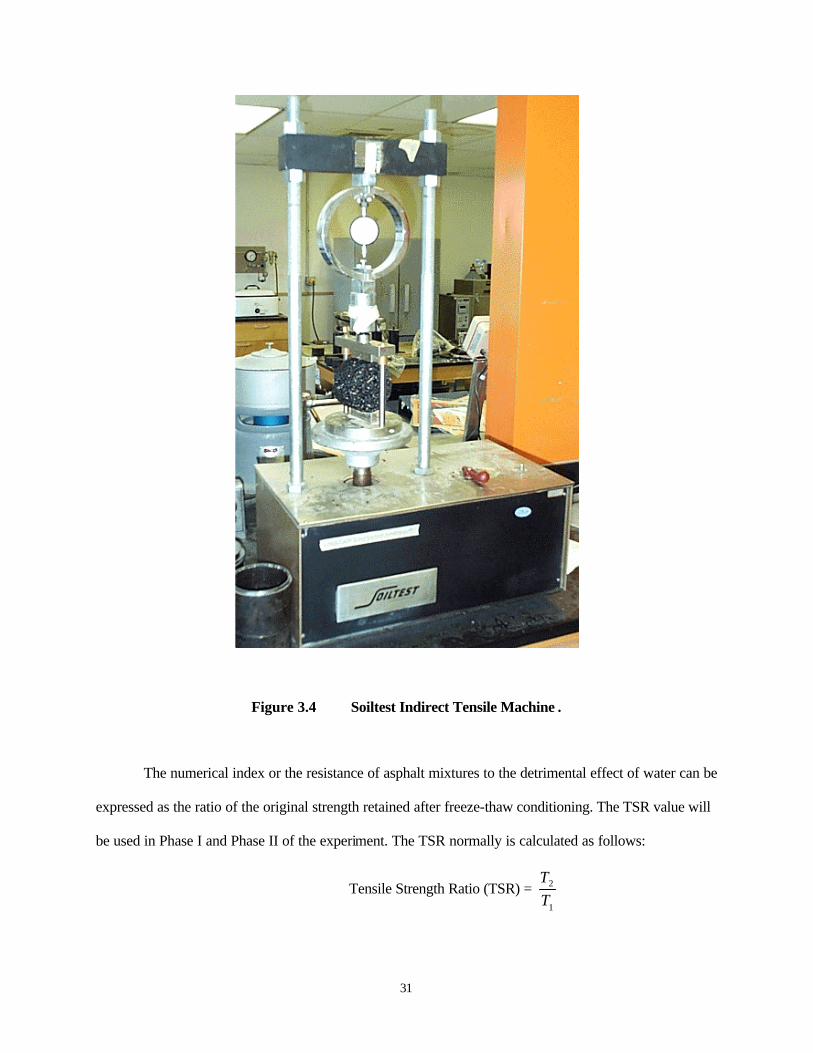
The indirect tensile test was performed on a Soiltest machine, as shown in Figure 3.4 with steel
loading strips that have concave surfaces. Before the indirect tensile strength was measured, the control
specimens were wrapped in a zip-lock bag and then placed in a 770F (25°C) water bath for a minimum of
two hours. The cycled specimens were placed directly in the water bath for two hours before the test was
performed.
31
Figure 3.4 Soiltest Indirect Tensile Machine .
The numerical index or the resistance of asphalt mixtures to the detrimental effect of water can be
expressed as the ratio of the original strength retained after freeze-thaw conditioning. The TSR value will
be used in Phase I and Phase II of the experiment. The TSR normally is calculated as follows:
Tensile Strength Ratio (TSR) = 1
2
TT
32
Where:
T1 = average tension of dry subset,
T2 = average tension of conditioned subset.
Utilizing the Georgia Loaded Wheel Tester to Test for Moisture Susceptibility
The second phase of this study involves the Georgia Loaded Wheel Tester. Cores were produced
utilizing the same mix designs from phase I and then were tested in the GLWT. The rutting that occurred
will be analyzed to determine if the GLWT can be used to test for moisture susceptibility. Thirty-six
cores were tested in phase II of this research. Testing for each core took approximately four hours in the
GLWT. The time needed for conditioning of the cores is in addition to the eight hours.
Selection of Aggregate
The Wyoming Department of Transportation Materials Testing Laboratory provided various
gradation summaries that have been used in the state. Two types of aggregate initially were chosen for
this research as described in section 3.2.1. For testing in the GLWT, the granite aggregate was chosen
because it is more moisture susceptible than limestone.
The aggregate was obtained from Granite Canyon Quarry. The final aggregate was a combination
of 15 percent three-fourths inch rock, 32 percent one-half inch rock, and 53 percent crushed fines.
Material particles are 5.3 percent flat and 2.9 percent elongated. The mix design specified 5.7 percent
asphalt content.
Selection of Asphalt
For phase II, only two of the additives were chosen for use. The AC-10 asphalt and the AC-10
plus lime asphalt at 4 percent and 7 percent air voids. At the time phase II was started the model
compound had not been tested through phase I. Therefore, it was eliminated from phase II. The AC-10
was used in aged and in un-aged cores.
33
Once the asphalt and aggregate were chosen for this experiment, it was necessary to identify the
theoretical maximum specific gravity for each mixture as well as the specific gravity for each asphalt.
AASHTO T209-94 was the test method used for the theoretical maximum specific gravity for each
mixture as detailed in section 3.2.4. The specific gravity for each asphalt was found using ASTM D70-82
as detailed in section 3.2.3.
Mixing and Compaction of Specimens
Cores were produced using granite aggregate and one of the three asphalt types provided by WRI.
Cores for this study were 15.2 cm (6 in.) in diameter and have a height of 7.6 cm (3 in.). Previous testing
at the University of Wyoming developed a procedure for using cores of this size in the GLWT (Miller,
1995). To achieve this sample size at the appropriate air voids, the mixing and the compaction procedure
described in section 3.2.5 was used.
Freeze-Thaw Cycling
Cycling for the samples follows Wyoming Modified AASHTO T-283 described in section 3.2.7.
Samples were to be exposed to 0, 1, or 2 cycles. Samples that were not cycled were used as the control
group for that set. Two cycles were chosen because from Phase I it was found that the granite aggregate
showed moisture damage/tensile failure after being cycled two times. After initial testing was conducted
it was found that three cycles would be difficult to achieve and still be able to run the cores through the
GLWT. Therefore, the test consisted of cores that went through 0 and 1 cycle. Group one cores are
used as control samples that are not conditioned. Group two cores are saturated prior to being placed in
the GLWT. Group three cores are saturated and then cycled one time. Figure 3.5 details the cycling used
in the experiment.

34
Figure 3.5 Conditioning Design for Phase II Cores.
Saturation Procedure
The cores in group two and group three were saturated from 55 percent to 80 percent with water.
Cores in group two were heated in the GLWT for four hours at 115°F (46°C) prior to being saturated.
They were then placed in a swim cap, as shown in Figure 3.6, to hold moisture in the core during testing
in the GLWT. Cores from group three were saturated and were conditioned as described in section 3.2.7.
When the cores from group three were removed from the 140°F (60°C) water bath, they were placed in a
swim cap. Prior to being placed in a swim cap, the level of saturation of each core was measured.
CONTROL (dry)
SATURATED ONE-CYCLE
MIXTURE
TWO CORES PRODUCED OF FOR EACH CONDITIONING
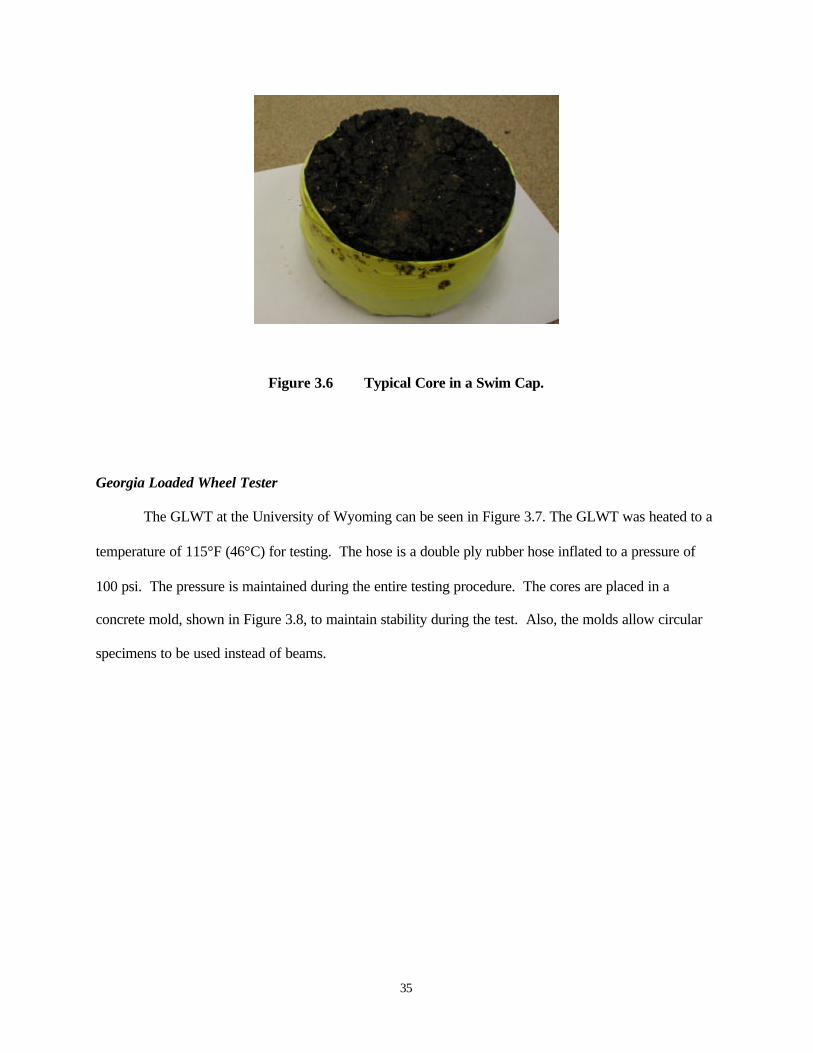
35
Figure 3.6 Typical Core in a Swim Cap.
Georgia Loaded Wheel Tester
The GLWT at the University of Wyoming can be seen in Figure 3.7. The GLWT was heated to a
temperature of 115°F (46°C) for testing. The hose is a double ply rubber hose inflated to a pressure of
100 psi. The pressure is maintained during the entire testing procedure. The cores are placed in a
concrete mold, shown in Figure 3.8, to maintain stability during the test. Also, the molds allow circular
specimens to be used instead of beams.
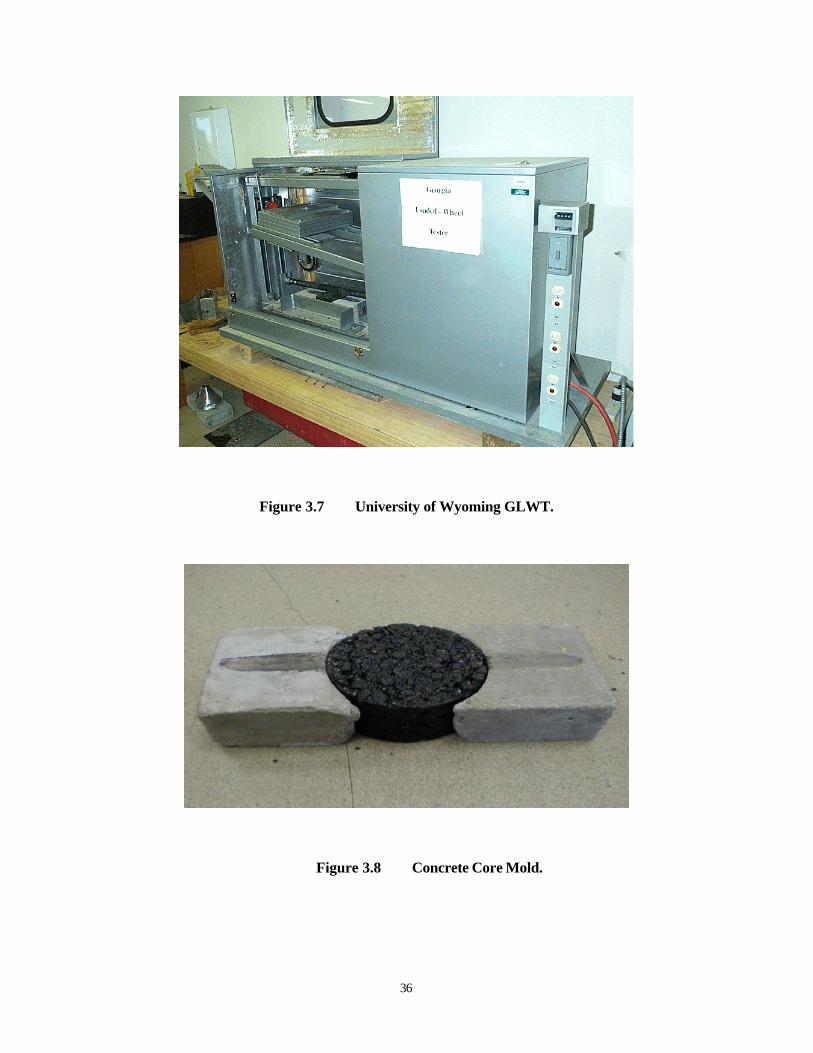
36
Figure 3.7 University of Wyoming GLWT.
Figure 3.8 Concrete Core Mold.
37
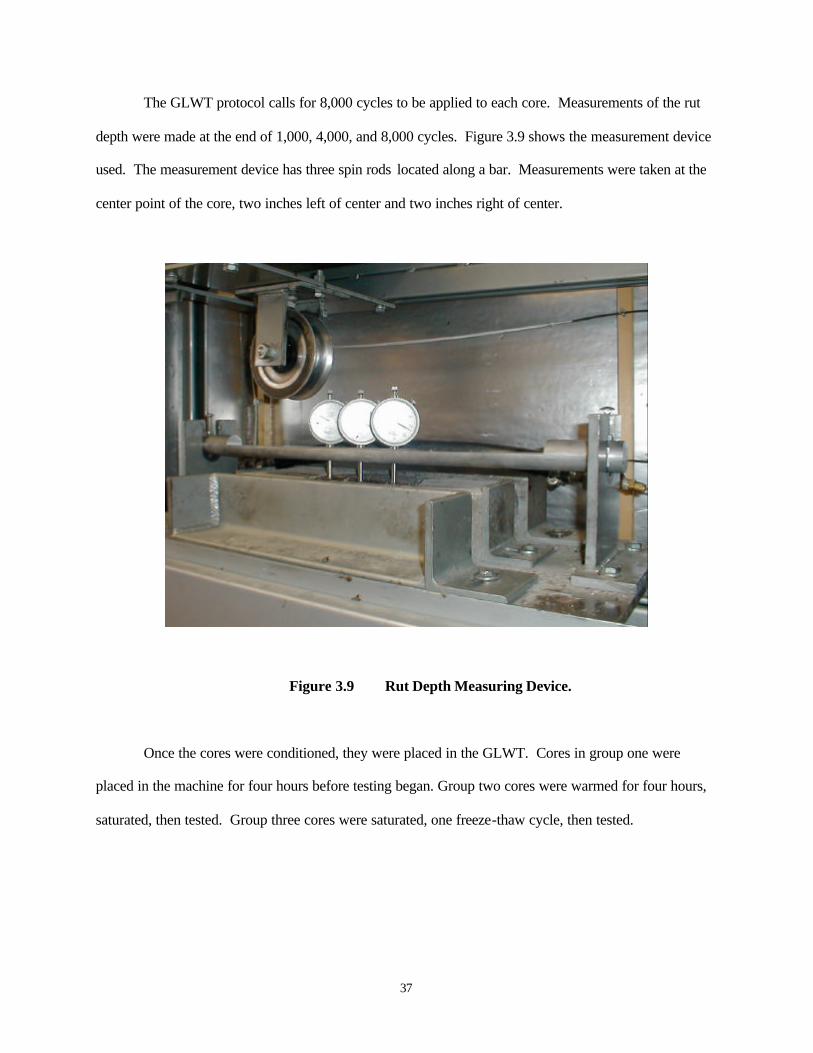
The GLWT protocol calls for 8,000 cycles to be applied to each core. Measurements of the rut
depth were made at the end of 1,000, 4,000, and 8,000 cycles. Figure 3.9 shows the measurement device
used. The measurement device has three spin rods located along a bar. Measurements were taken at the
center point of the core, two inches left of center and two inches right of center.
Figure 3.9 Rut Depth Measuring Device.
Once the cores were conditioned, they were placed in the GLWT. Cores in group one were
placed in the machine for four hours before testing began. Group two cores were warmed for four hours,
saturated, then tested. Group three cores were saturated, one freeze-thaw cycle, then tested.
38
Chapter Summary
This chapter explained testing procedures and the experimental design used for this study.
During evaluation of the freeze-thaw cycles on strength of the HMA mixtures, 16 cores were tested for
each mixture. Of those 16 cores for each group, only those cores that maintained integrity were tested for
their tensile strength. Evaluation of the GLWT utilized identical cycling and production procedures to
those used in the first phase of the study. Data were collected for both phases. The data collection will be
discussed in the following chapter.

39
CHAPTER 4
DATA COLLECTION
Introduction
Laboratory evaluations were used in this experiment. The laboratory evaluations for phase I and
phase II of the experiment were conducted at the University of Wyoming. Phase I involved the
production of samples from eight mixtures using the gyratory compactor, testing of those samples was
conducted using an Instron machine and a Soiltest machine. Phase II involved the production of samples
from three mixtures at two different air void contents. Testing of these samples was conducted in the
Georgia Loaded Wheel Tester (GLWT). The purpose of these tests was to compare the mechanical
properties of asphalt mixtures and to develop a method of measuring the amount of moisture damage to
expected using the GLWT.
Materials
The materials used in this procedure were acquired from various sources. The mix designs were
provided by WYDOT for both aggregate sources. The limestone aggregate was obtained from the North
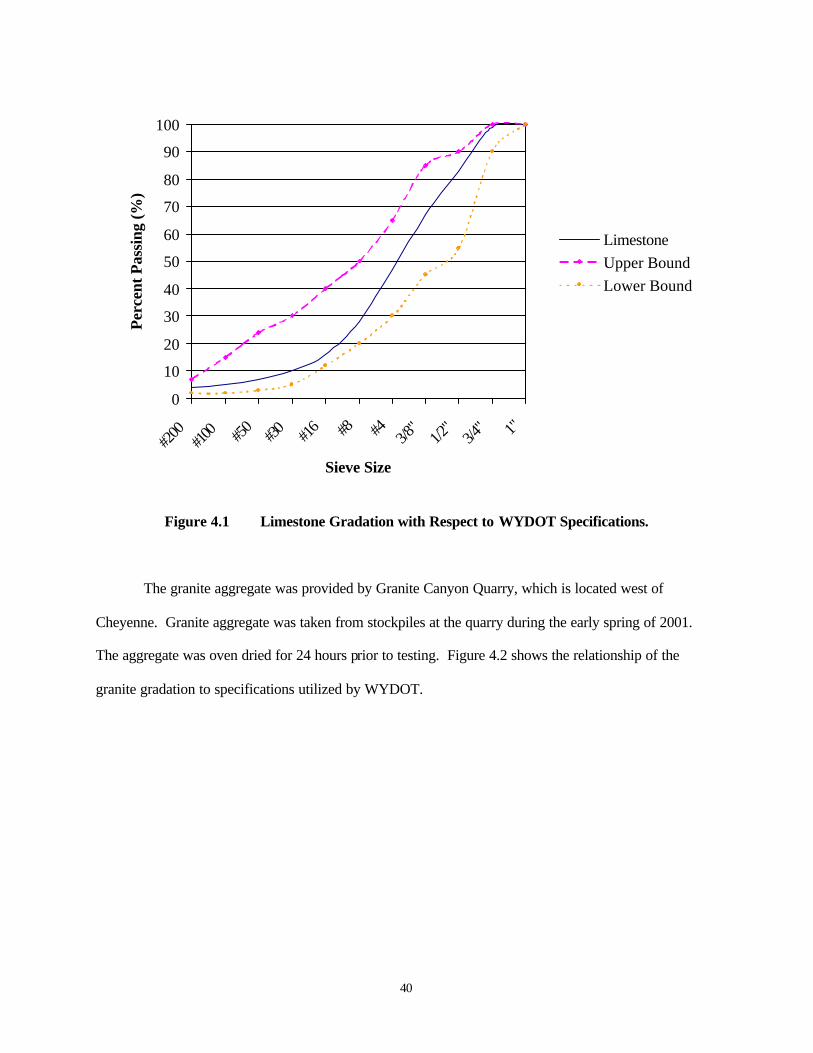
Rawlins Quarry in Wyoming. Figure 4.1 shows the gradation of the limestone used in comparison to the
QC/QA specification for WYDOT aggregates.
40
0
10
20
30
40
50
60
70
80
90
100
#200
#100 #5
0#30 #1
6 #8 #4 3/8"
1/2"
3/4" 1"
Sieve Size
Perc
ent P
assi
ng (%
)
LimestoneUpper BoundLower Bound
Figure 4.1 Limestone Gradation with Respect to WYDOT Specifications.
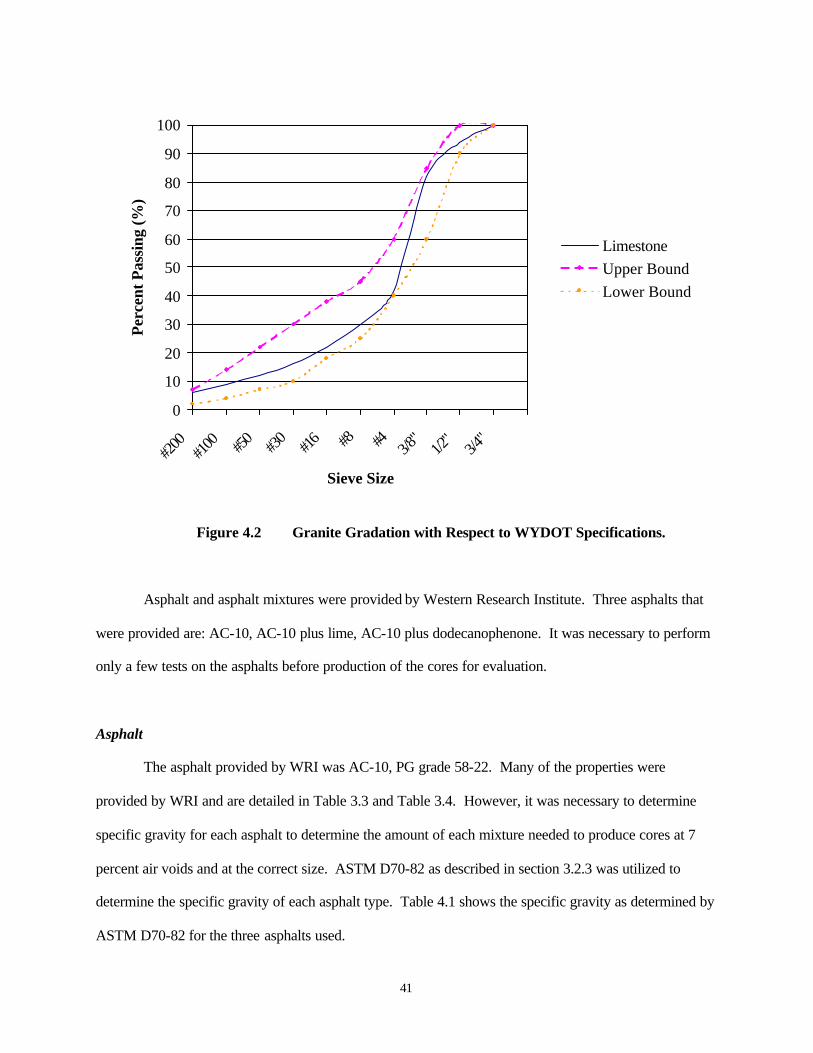
The granite aggregate was provided by Granite Canyon Quarry, which is located west of
Cheyenne. Granite aggregate was taken from stockpiles at the quarry during the early spring of 2001.
The aggregate was oven dried for 24 hours prior to testing. Figure 4.2 shows the relationship of the
granite gradation to specifications utilized by WYDOT.
41
0
10
20
30
40
50
60
70
80
90
100
#200
#100 #50 #3
0#16 #8 #4 3/8
"1/2
"3/4
"
Sieve Size
Perc
ent P
assi
ng (%
)
LimestoneUpper BoundLower Bound
Figure 4.2 Granite Gradation with Respect to WYDOT Specifications.
Asphalt and asphalt mixtures were provided by Western Research Institute. Three asphalts that
were provided are: AC-10, AC-10 plus lime, AC-10 plus dodecanophenone. It was necessary to perform
only a few tests on the asphalts before production of the cores for evaluation.
Asphalt
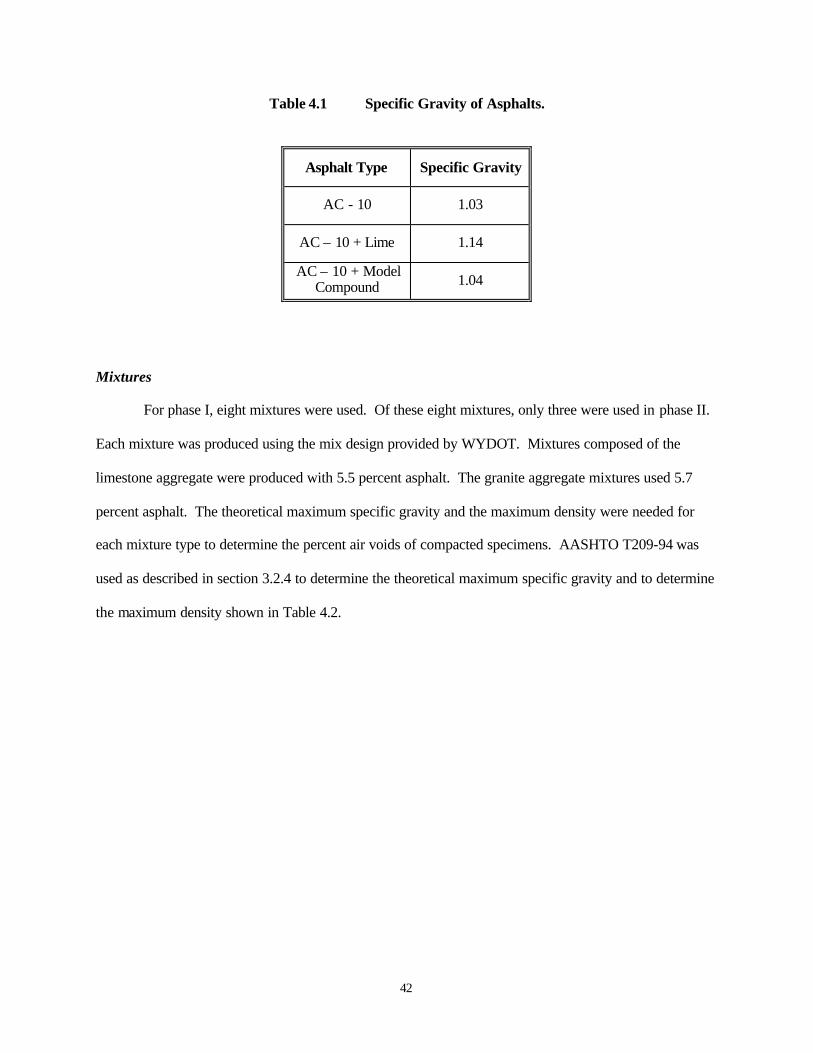
The asphalt provided by WRI was AC-10, PG grade 58-22. Many of the properties were
provided by WRI and are detailed in Table 3.3 and Table 3.4. However, it was necessary to determine
specific gravity for each asphalt to determine the amount of each mixture needed to produce cores at 7
percent air voids and at the correct size. ASTM D70-82 as described in section 3.2.3 was utilized to
determine the specific gravity of each asphalt type. Table 4.1 shows the specific gravity as determined by
ASTM D70-82 for the three asphalts used.
42
Table 4.1 Specific Gravity of Asphalts.
Asphalt Type Specific Gravity
AC - 10 1.03
AC – 10 + Lime 1.14
AC – 10 + Model Compound 1.04
Mixtures
For phase I, eight mixtures were used. Of these eight mixtures, only three were used in phase II.
Each mixture was produced using the mix design provided by WYDOT. Mixtures composed of the
limestone aggregate were produced with 5.5 percent asphalt. The granite aggregate mixtures used 5.7
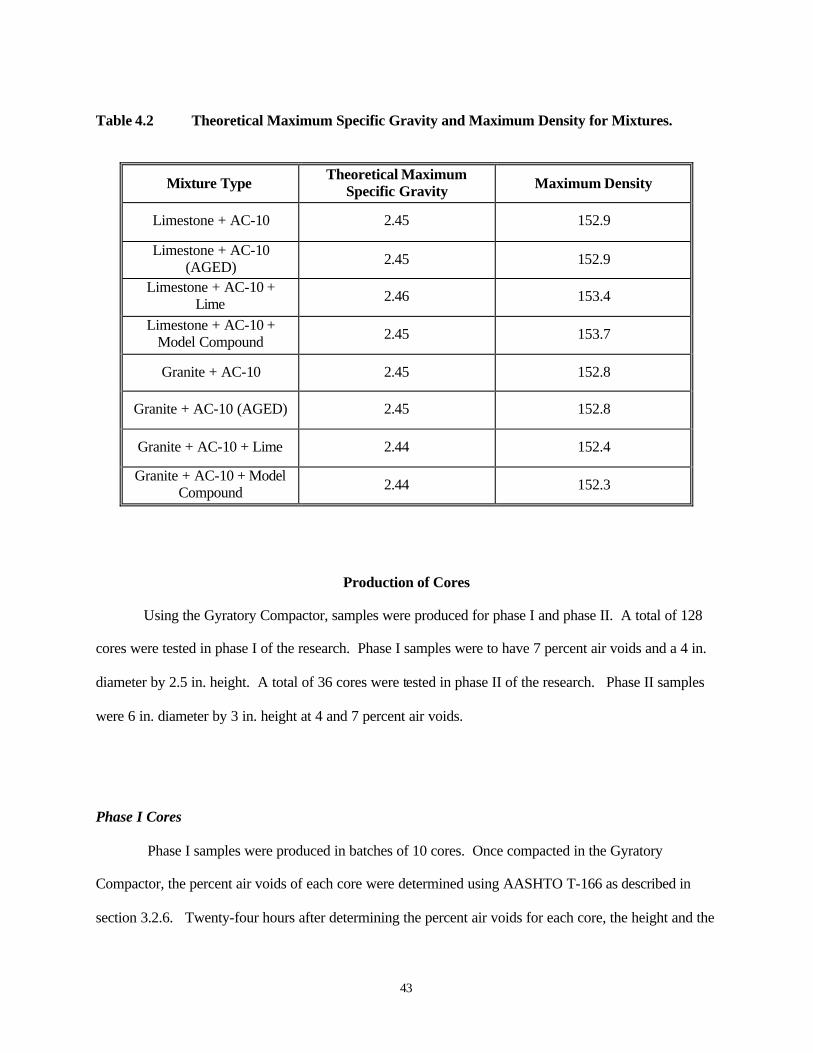
percent asphalt. The theoretical maximum specific gravity and the maximum density were needed for
each mixture type to determine the percent air voids of compacted specimens. AASHTO T209-94 was
used as described in section 3.2.4 to determine the theoretical maximum specific gravity and to determine
the maximum density shown in Table 4.2.
43
Table 4.2 Theoretical Maximum Specific Gravity and Maximum Density for Mixtures.
Mixture Type Theoretical Maximum Specific Gravity Maximum Density
Limestone + AC-10 2.45 152.9
Limestone + AC-10 (AGED) 2.45 152.9
Limestone + AC-10 + Lime 2.46 153.4
Limestone + AC-10 + Model Compound 2.45 153.7
Granite + AC-10 2.45 152.8
Granite + AC-10 (AGED) 2.45 152.8
Granite + AC-10 + Lime 2.44 152.4
Granite + AC-10 + Model Compound 2.44 152.3
Production of Cores
Using the Gyratory Compactor, samples were produced for phase I and phase II. A total of 128
cores were tested in phase I of the research. Phase I samples were to have 7 percent air voids and a 4 in.
diameter by 2.5 in. height. A total of 36 cores were tested in phase II of the research. Phase II samples
were 6 in. diameter by 3 in. height at 4 and 7 percent air voids.
Phase I Cores
Phase I samples were produced in batches of 10 cores. Once compacted in the Gyratory
Compactor, the percent air voids of each core were determined using AASHTO T-166 as described in
section 3.2.6. Twenty-four hours after determining the percent air voids for each core, the height and the
44
diameter were measured. The data for the cores of phase I are summarized in Appendix B. All of the
cores listed were not used in the procedure. Some of the cores were not within the air void limits and the
others were extra.
Phase II Cores
The cores for phase II were produced as needed in batches of four or less. Once compacted in the
Gyratory Compactor, the percent air voids of each core were determined using AASHTO T-166 as
described in section 3.2.6. The data for each of the cores used in Phase II are given in Appendix C.
Indirect Tensile Test
The Indirect Tensile Test as described in section 3.2.9 was performed on each core in Phase I.
After the Resilient Modulus Test was performed on each core, they were placed in a 77°F (25°C) water
bath for two hours. Steel loading strips were used in the Soiltest machine to test the cores. A typical
sample after being fractured in the Soiltest machine is shown on Figure 4.3. Table 4.3 shows the tensile
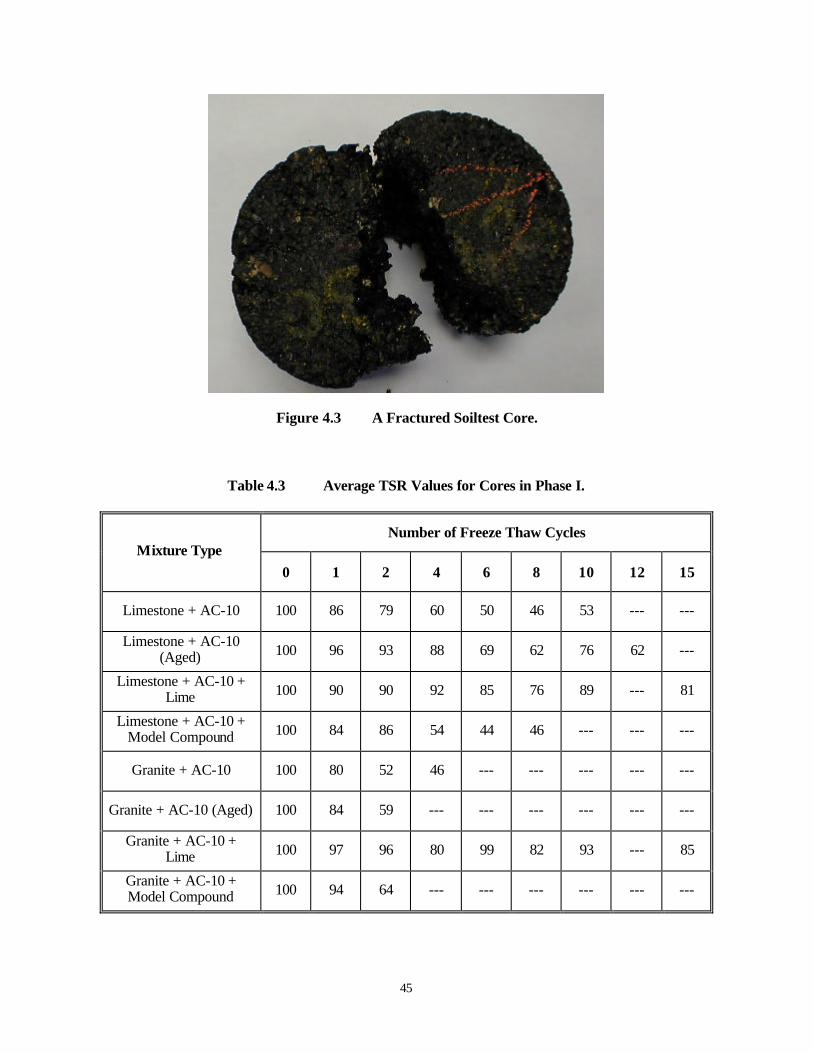
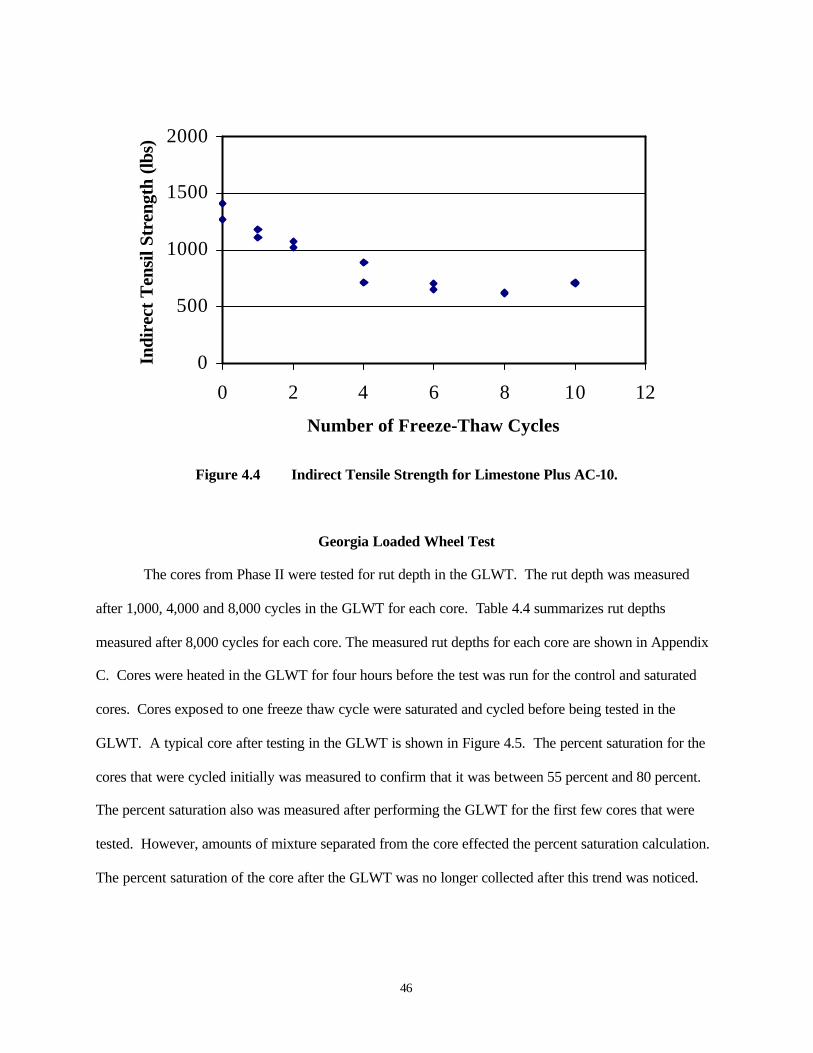
strength ratio (TSR) values for the cores tested by mixture type and number of freeze-thaw cycles. Figure
4.4 shows the indirect tensile strength values obtained for limestone plus AC-10 samples. The indirect
tensile strength values for the remainder of the cores tested are summarized in Appendix D.
45
Figure 4.3 A Fractured Soiltest Core.
Table 4.3 Average TSR Values for Cores in Phase I.
Number of Freeze Thaw Cycles Mixture Type
0 1 2 4 6 8 10 12 15
Limestone + AC-10 100 86 79 60 50 46 53 --- ---
Limestone + AC-10 (Aged) 100 96 93 88 69 62 76 62 ---
Limestone + AC-10 + Lime 100 90 90 92 85 76 89 --- 81
Limestone + AC-10 + Model Compound 100 84 86 54 44 46 --- --- ---
Granite + AC-10 100 80 52 46 --- --- --- --- ---
Granite + AC-10 (Aged) 100 84 59 --- --- --- --- --- ---
Granite + AC-10 + Lime 100 97 96 80 99 82 93 --- 85
Granite + AC-10 + Model Compound 100 94 64 --- --- --- --- --- ---
46
Figure 4.4 Indirect Tensile Strength for Limestone Plus AC-10.
Georgia Loaded Wheel Test
The cores from Phase II were tested for rut depth in the GLWT. The rut depth was measured
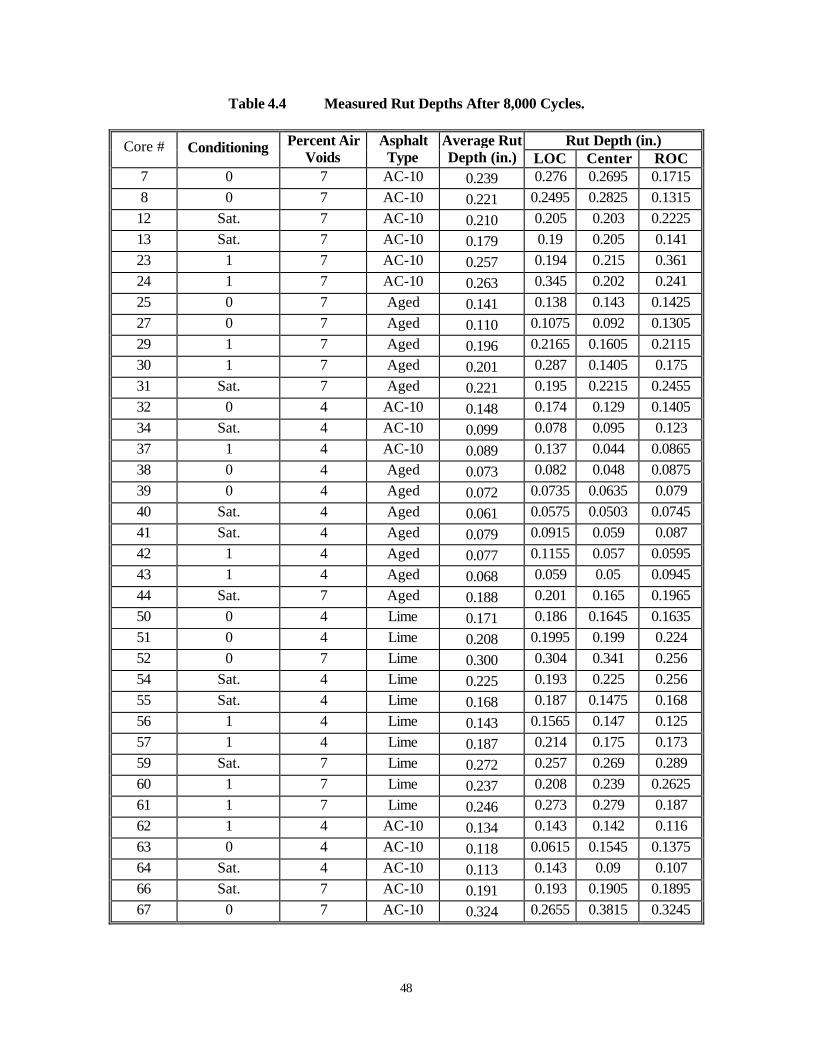
after 1,000, 4,000 and 8,000 cycles in the GLWT for each core. Table 4.4 summarizes rut depths
measured after 8,000 cycles for each core. The measured rut depths for each core are shown in Appendix
C. Cores were heated in the GLWT for four hours before the test was run for the control and saturated
cores. Cores exposed to one freeze thaw cycle were saturated and cycled before being tested in the
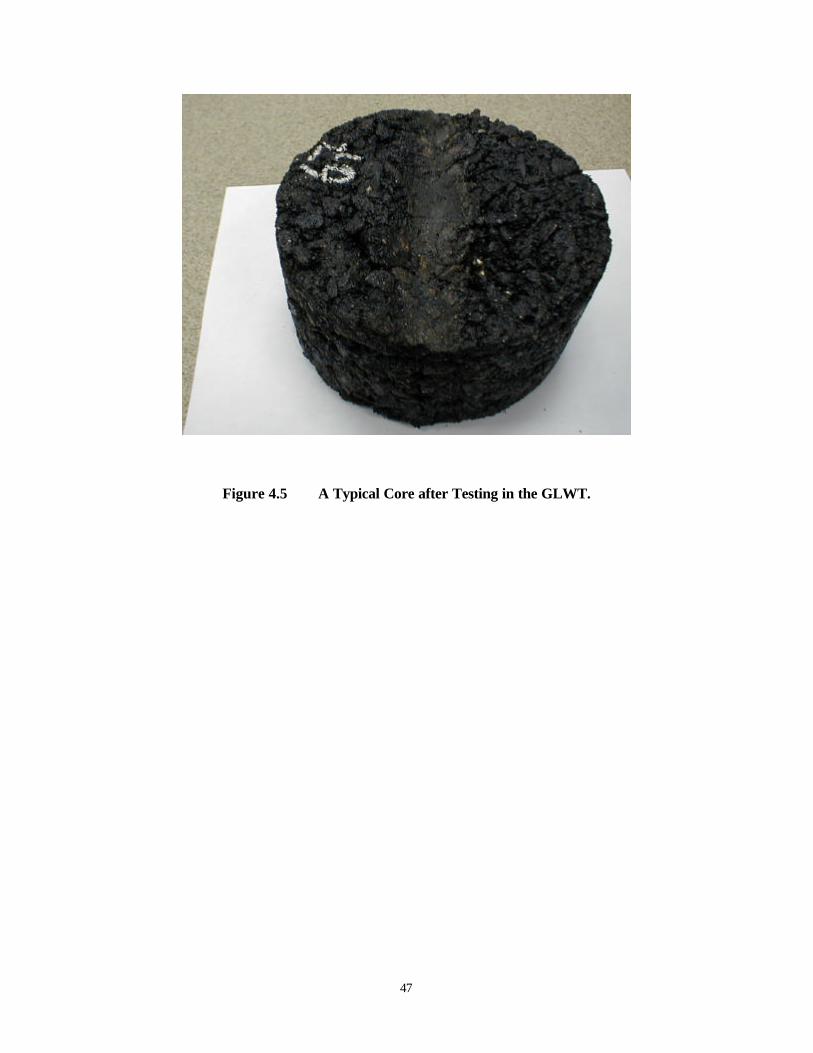
GLWT. A typical core after testing in the GLWT is shown in Figure 4.5. The percent saturation for the
cores that were cycled initially was measured to confirm that it was between 55 percent and 80 percent.
The percent saturation also was measured after performing the GLWT for the first few cores that were
tested. However, amounts of mixture separated from the core effected the percent saturation calculation.
The percent saturation of the core after the GLWT was no longer collected after this trend was noticed.
0
500
1000
1500
2000
0 2 4 6 8 10 12
Number of Freeze-Thaw Cycles
Indi
rect
Ten
sil S
tren
gth
(lbs)
47
Figure 4.5 A Typical Core after Testing in the GLWT.
48
Table 4.4 Measured Rut Depths After 8,000 Cycles.
Rut Depth (in.) Core # Conditioning Percent Air Voids
Asphalt Type
Average Rut Depth (in.) LOC Center ROC
7 0 7 AC-10 0.239 0.276 0.2695 0.1715 8 0 7 AC-10 0.221 0.2495 0.2825 0.1315
12 Sat. 7 AC-10 0.210 0.205 0.203 0.2225 13 Sat. 7 AC-10 0.179 0.19 0.205 0.141 23 1 7 AC-10 0.257 0.194 0.215 0.361 24 1 7 AC-10 0.263 0.345 0.202 0.241 25 0 7 Aged 0.141 0.138 0.143 0.1425 27 0 7 Aged 0.110 0.1075 0.092 0.1305 29 1 7 Aged 0.196 0.2165 0.1605 0.2115 30 1 7 Aged 0.201 0.287 0.1405 0.175 31 Sat. 7 Aged 0.221 0.195 0.2215 0.2455 32 0 4 AC-10 0.148 0.174 0.129 0.1405 34 Sat. 4 AC-10 0.099 0.078 0.095 0.123 37 1 4 AC-10 0.089 0.137 0.044 0.0865 38 0 4 Aged 0.073 0.082 0.048 0.0875 39 0 4 Aged 0.072 0.0735 0.0635 0.079 40 Sat. 4 Aged 0.061 0.0575 0.0503 0.0745 41 Sat. 4 Aged 0.079 0.0915 0.059 0.087 42 1 4 Aged 0.077 0.1155 0.057 0.0595 43 1 4 Aged 0.068 0.059 0.05 0.0945 44 Sat. 7 Aged 0.188 0.201 0.165 0.1965 50 0 4 Lime 0.171 0.186 0.1645 0.1635 51 0 4 Lime 0.208 0.1995 0.199 0.224 52 0 7 Lime 0.300 0.304 0.341 0.256 54 Sat. 4 Lime 0.225 0.193 0.225 0.256 55 Sat. 4 Lime 0.168 0.187 0.1475 0.168 56 1 4 Lime 0.143 0.1565 0.147 0.125 57 1 4 Lime 0.187 0.214 0.175 0.173 59 Sat. 7 Lime 0.272 0.257 0.269 0.289 60 1 7 Lime 0.237 0.208 0.239 0.2625 61 1 7 Lime 0.246 0.273 0.279 0.187 62 1 4 AC-10 0.134 0.143 0.142 0.116 63 0 4 AC-10 0.118 0.0615 0.1545 0.1375 64 Sat. 4 AC-10 0.113 0.143 0.09 0.107 66 Sat. 7 AC-10 0.191 0.193 0.1905 0.1895 67 0 7 AC-10 0.324 0.2655 0.3815 0.3245
49
Visual observations were made of the cores during the GLWT. Cores that were saturated would
lose material on the hose of the GLWT. Material would rub off or would crumble off depending on the
mixture type and the air void content. Cores that were at 7 percent air voids would tend to crumble under
these conditions. Also, they would have deeper ruts on the left of center reading and the right of center
reading than the center of the core reading.
Chapter Summary
In this chapter, data collection procedures and the results were presented. In Phase I the TSR
values were used to evaluate the performance of eight mixtures with respect to moisture damage. In
Phase II, the Georgia Loaded Wheel Tester was used to predict moisture resistance of three mixtures. In
the following chapter, a statistical analysis of the results is performed.

50

51
CHAPTER 5
ANALYSIS OF DATA
Introduction
Following the laboratory procedures and data collection described in the previous chapters, a
statistical analysis was performed on tensile strength ratio (TSR) results from phase I and the Georgia
Loaded Wheel Tester (GLWT) results from phase II. The analysis for phase I was performed using linear
regression. Phase II analysis was performed using an Analysis of Variance (ANOVA) assisted by
Interaction Plots.
This chapter describes the statistical analysis used to evaluate data from phase I and phase II of
this research. Complete sets of analysis can be found in Appendix D through Appendix G. Analyses
were performed using MINITAB release 13.
Statistical Analysis of Tensile Strength Ratio Data
Initial observation of the graphs in Appendix E of the TSR results indicates that the strength of
each of the mixtures decreases as the number of cycles is increased. A summary of the TSR values was
given in Table 4.3. The failure point for TSR used in this analysis was 70 percent. Limestone aggregate
mixtures with the AC-10 and the AC-10 with model compound reached failure between two and four
freeze-thaw cycles. The granite aggregate mixtures with the same asphalt and additive failed after one
freeze-thaw cycle. The aged mixture with limestone failed after four freeze-thaw cycles, while the granite
aggregate failed after only one cycle. Both mixtures utilizing the lime additive did not reach failure.
However, the mixtures with lime additive showed variability in strength, when referencing the indirect
tensile strength graphs. The granite aggregate reached failure quite quickly in comparison to the
limestone aggregate.
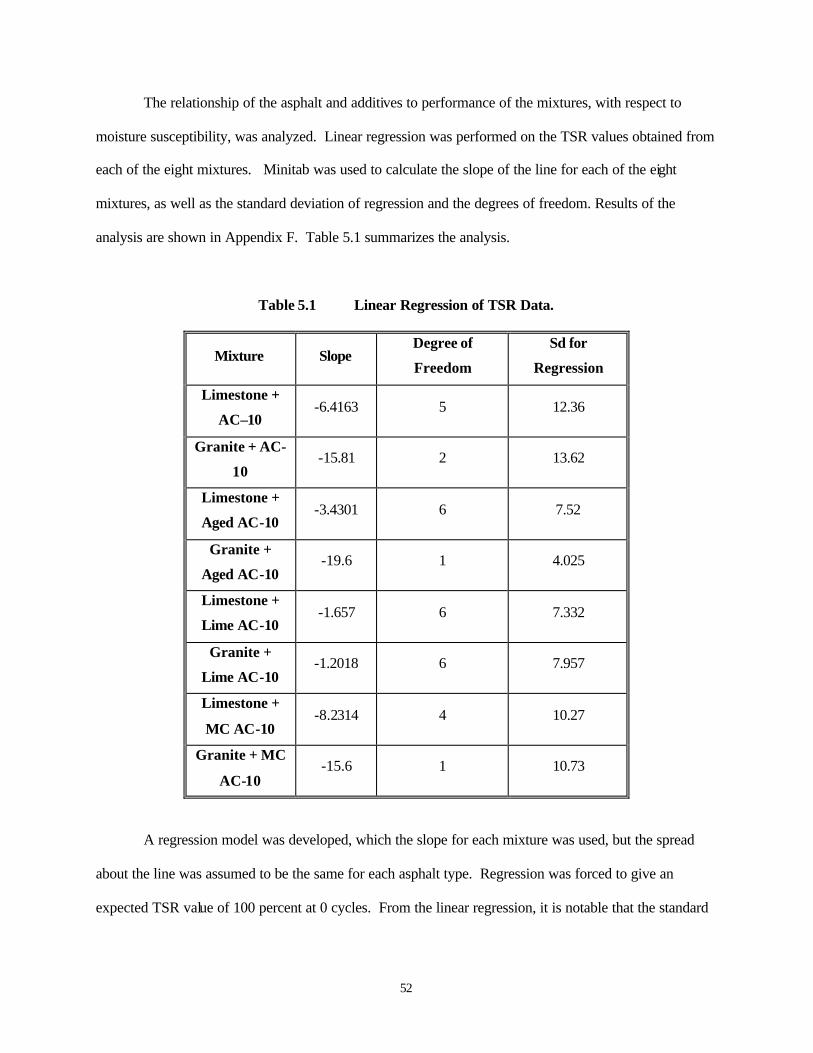
52
The relationship of the asphalt and additives to performance of the mixtures, with respect to
moisture susceptibility, was analyzed. Linear regression was performed on the TSR values obtained from
each of the eight mixtures. Minitab was used to calculate the slope of the line for each of the eight
mixtures, as well as the standard deviation of regression and the degrees of freedom. Results of the
analysis are shown in Appendix F. Table 5.1 summarizes the analysis.
Table 5.1 Linear Regression of TSR Data.
Mixture Slope Degree of
Freedom
Sd for
Regression
Limestone +
AC–10 -6.4163 5 12.36
Granite + AC-
10 -15.81 2 13.62
Limestone +
Aged AC-10 -3.4301 6 7.52
Granite +
Aged AC-10 -19.6 1 4.025
Limestone +
Lime AC-10 -1.657 6 7.332
Granite +
Lime AC-10 -1.2018 6 7.957
Limestone +
MC AC-10 -8.2314 4 10.27
Granite + MC
AC-10 -15.6 1 10.73
A regression model was developed, which the slope for each mixture was used, but the spread
about the line was assumed to be the same for each asphalt type. Regression was forced to give an
expected TSR value of 100 percent at 0 cycles. From the linear regression, it is notable that the standard

53
deviation for regression generally is similar for asphalt type pairs. Therefore, mixtures were grouped into
four pairs by asphalt type for use in the regression model. The model used is
Y = β1X + β2XW + error
where β1 and β2 are components of the slopes of the lines, X is the number of cycles the core endured,
and W is a dummy variable indicating the aggregate type. W was defined as either a 1 for limestone
aggregate or a 0 for granite aggregate. For limestone aggregate, the equation becomes
Y = (β1 + β2)X + error
and for granite aggregate the equation becomes
Y = β1X + error.
Thus, β2 is the difference measured between the slopes. To determine whether strength decreased at the
same rate for granite as for limestone, the null hypothesis is β2 = 0 (the slopes are the same), and the
alternative is that β2 ≠ 0. The level of significance used is 0.0125. This is the Bonferroni adjusted
significance level to give a simultaneous significance level of 0.05 for all tests. Results of the analysis are
shown in Appendix G. Table 5.2 summarizes results from this analysis.
Table 5.2 Linear Regression of TSR Data using the Regression Model.
Asphalt Type β1 β2 T for β2 Degrees of
Freedom P- value
AC-10 -15.81 9.393 3.23 7 0.0144
Aged AC-10 -19.6 16.17 5.04 7 0.0014
AC-10 + Lime -1.202 -0.406 -0.79 10 0.4475
AC-10 + MC -15.6 7.369 1.56 5 0.1796
Regression data for the AC-10 asphalt shows that at a significance level of 0.0125 there is no
difference in the slopes of lines for mixtures using this model. This criterion is quite conservative.
54
However, if the significance level of 0.05 were used it would be judged to be significantly different. The
value 3.23 is close to the rejection value of 3.335. Also, the observed difference in slopes (-15.81 versus -
6.42) is substantial.
The aged AC-10 has an observed difference in slopes for the limestone and granite aggregates of
16.17. Also, the significance level value of 3.335 is less than the T-value of 5.04. Therefore, these slopes
are definitely different.
The lime plus AC-10 pair produced a T-value of -0.79, which is less than 3.038. The difference
in slopes for the lime asphalt pair is quite small (-1.202 versus -1.608), indicating that the slopes are the
same for this pair.
The group with the model compound and the AC-10 also showed no significant difference in the
slopes (1.56 is less than 3.810). The actual size of the difference in slopes (-15.6 versus -8.231) is
substantial and failure to note difference may be due to the small sample pool.
From the analysis, it is evident that the aggregate and the asphalt type affect moisture
susceptibility of the mixture. The granite aggregate reached failure quickly in comparison to the
limestone aggregate. In the case where lime is added to the asphalt, the aggregate type is less of a factor in
moisture susceptibility of the mixture.
Statistical Analysis of Georgia Loaded Wheel Tester Data
Data from the GLWT were analyzed using an Analysis of Variance (ANOVA). Three factors,
without interacting, were analyzed for their significance. Those three factors are conditioning of the core,
air void content of the cores, and the asphalt type. Rut depth was measured in three locations across the
top of the core. These three measurements were averaged to give a single response variable for the
analysis. Averages were used because saturated cores and cores that were cycled once, developed deeper
rut depths on the sides of the core, while the center measurement was consistent with the control cores.
A summary of the results is displayed in Table 5.3. The results in Table 5.3 indicate that the amount of
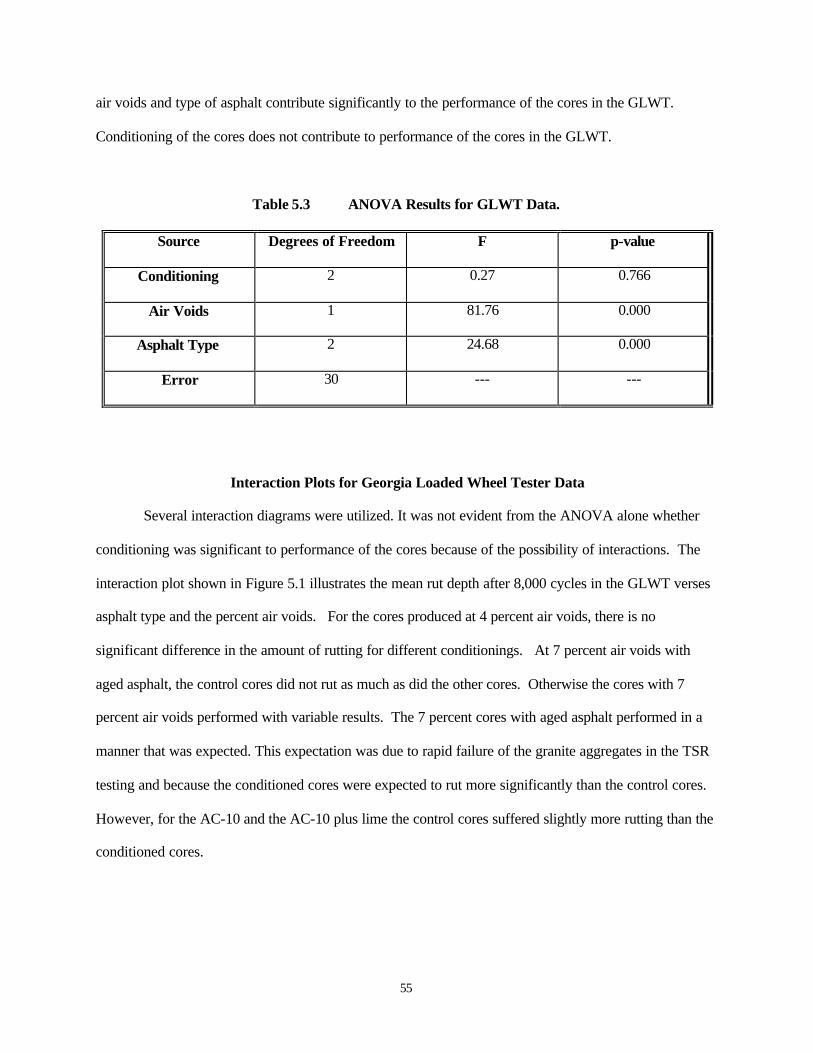
55
air voids and type of asphalt contribute significantly to the performance of the cores in the GLWT.
Conditioning of the cores does not contribute to performance of the cores in the GLWT.
Table 5.3 ANOVA Results for GLWT Data.
Source Degrees of Freedom F p-value
Conditioning 2 0.27 0.766
Air Voids 1 81.76 0.000
Asphalt Type 2 24.68 0.000
Error 30 --- ---
Interaction Plots for Georgia Loaded Wheel Tester Data
Several interaction diagrams were utilized. It was not evident from the ANOVA alone whether
conditioning was significant to performance of the cores because of the possibility of interactions. The
interaction plot shown in Figure 5.1 illustrates the mean rut depth after 8,000 cycles in the GLWT verses
asphalt type and the percent air voids. For the cores produced at 4 percent air voids, there is no
significant difference in the amount of rutting for different conditionings. At 7 percent air voids with
aged asphalt, the control cores did not rut as much as did the other cores. Otherwise the cores with 7
percent air voids performed with variable results. The 7 percent cores with aged asphalt performed in a
manner that was expected. This expectation was due to rapid failure of the granite aggregates in the TSR
testing and because the conditioned cores were expected to rut more significantly than the control cores.
However, for the AC-10 and the AC-10 plus lime the control cores suffered slightly more rutting than the
conditioned cores.
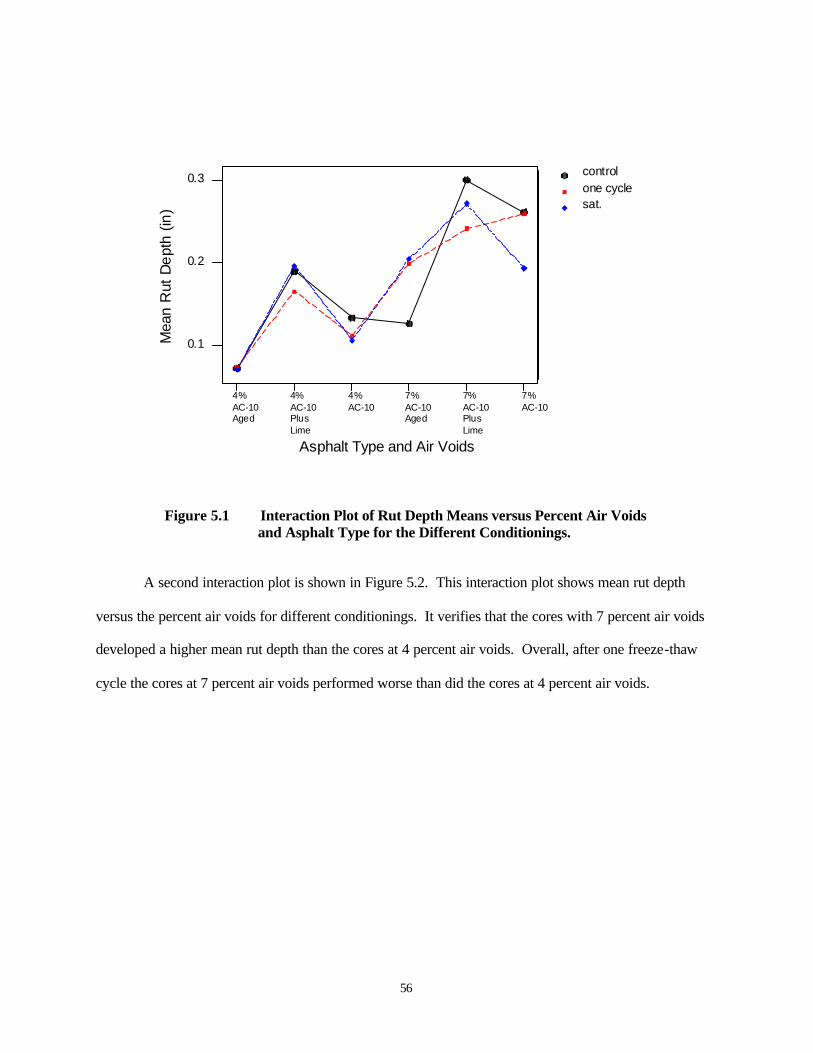
56
controlone cyclesat.
7%AC-10
7%AC-10PlusLime
7%AC-10Aged
4%AC-10
4%AC-10PlusLime
4%AC-10Aged
0.3
0.2
0.1
Asphalt Type and Air Voids
M
ean
Rut
Dep
th (i
n)
Figure 5.1 Interaction Plot of Rut Depth Means versus Percent Air Voids and Asphalt Type for the Different Conditionings.
A second interaction plot is shown in Figure 5.2. This interaction plot shows mean rut depth
versus the percent air voids for different conditionings. It verifies that the cores with 7 percent air voids
developed a higher mean rut depth than the cores at 4 percent air voids. Overall, after one freeze-thaw
cycle the cores at 7 percent air voids performed worse than did the cores at 4 percent air voids.

57
controlone cyclesat.
4 7
0.12
0.17
0.22
Percent Air Voids
M
ean
Rut
Dep
th (
in)
Figure 5.2 Interaction Plot of Rut Depth Means versus the Percent Air Voids for the Different Conditionings.
The interaction plot shown in Figure 5.3 was developed using data for the AC-10 cores and the
Aged AC-10 cores. Cores with lime were omitted because of problems with data quality and confusion in
interpretation. At 4 percent air voids conditioning of the core contributed less to the amount of rutting
experienced by the Aged cores than the AC-10 cores. The 7 percent data indicates that the control and
one-cycle cores reacted similarly to the 4 percent cores but with more variable results. While the
saturated core performance at 7 percent air voids was approximately the same for aged and un-aged types.
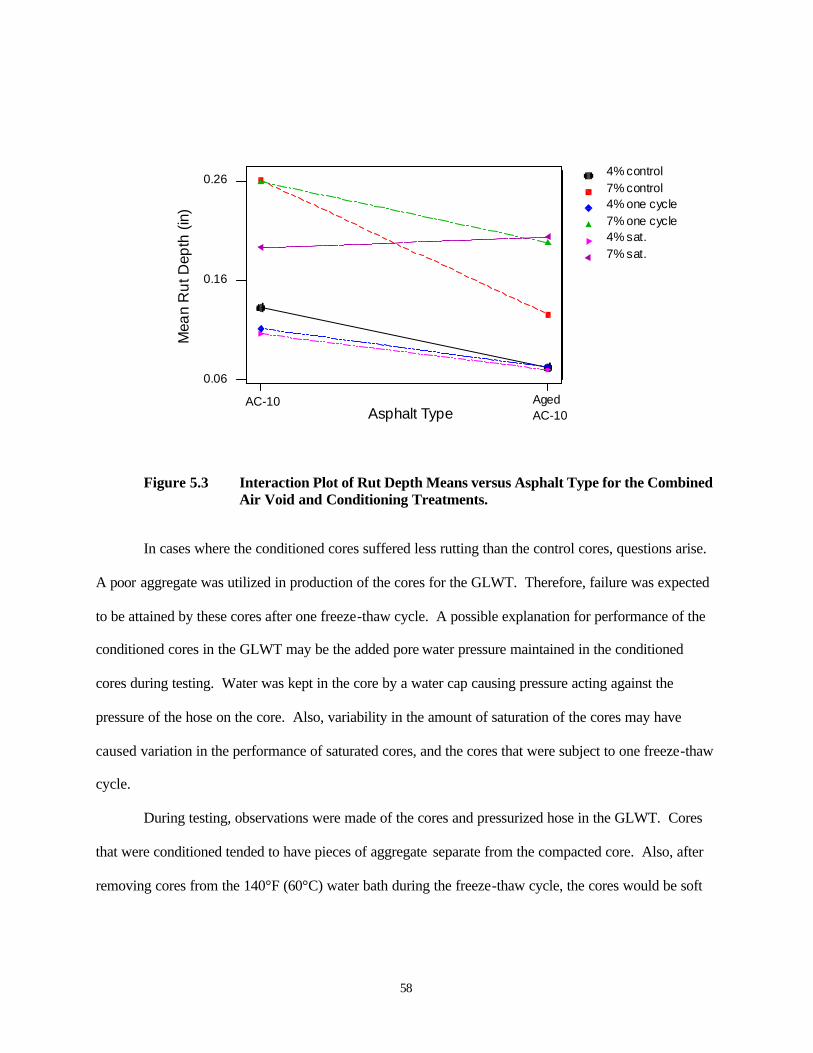
58
4% control7% control4% one cycle7% one cycle4% sat.7% sat.
AgedAC-10
AC-10
0.26
0.16
0.06
Asphalt Type
Mea
n R
ut D
epth
(in
)
Figure 5.3 Interaction Plot of Rut Depth Means versus Asphalt Type for the Combined Air Void and Conditioning Treatments.
In cases where the conditioned cores suffered less rutting than the control cores, questions arise.
A poor aggregate was utilized in production of the cores for the GLWT. Therefore, failure was expected
to be attained by these cores after one freeze-thaw cycle. A possible explanation for performance of the
conditioned cores in the GLWT may be the added pore water pressure maintained in the conditioned
cores during testing. Water was kept in the core by a water cap causing pressure acting against the
pressure of the hose on the core. Also, variability in the amount of saturation of the cores may have
caused variation in the performance of saturated cores, and the cores that were subject to one freeze-thaw
cycle.
During testing, observations were made of the cores and pressurized hose in the GLWT. Cores
that were conditioned tended to have pieces of aggregate separate from the compacted core. Also, after
removing cores from the 140°F (60°C) water bath during the freeze-thaw cycle, the cores would be soft
59
and would deform and/or lose pieces of aggregate from the edges. During the GLWT of the conditioned
cores, material from the cores would deposit on the pressurized hose.
Chapter Summary
A statistical analysis was performed on the TSR and GLWT test results. The analysis was to
determine how TSR values varied after freeze-thaw cycling and if the GLWT could be used to predict
moisture susceptibility of HMA.
The statistical analysis performed on the TSR data found that two of the four asphalt mixtures
displayed a significantly different slope variation between limestone and granite. The two asphalt
mixtures that displayed similar variations about the slope were the AC-10 plus lime and the AC-10 plus
model compound. Two that showed a difference were the AC-10 and the aged AC-10. Note, however,
that the AC-10 plus model compound data were fairly sparse, and actual differences could well exist.
Therefore, both the asphalt additive and the aggregate type affected moisture susceptibility of the
mixtures.
The analysis performed on the GLWT results found that the percent air voids and the asphalt type
affected performance of the mixture in the GLWT. The conditioning only affected the performance of the
7 percent aged AC-10 mixture. From the Analysis of Variance and the Interaction Plots, it is evident that
the 4 percent air void mixtures sustained less rutting than did the 7 percent air void mixtures. Also, the
aged AC-10 mixtures generally sustained less rutting than did the AC-10 mixtures. The type of
conditioning did not matter for the 4 percent air voids, and its effect, if any, was ambiguous, for 7 percent
air voids.

60
61
CHAPTER 6
CONCLUSIONS AND RECOMMENDATIONS
Summary
This research project utilized laboratory evaluations to study the effects of freeze-thaw cycling on
the tensile strength of eight Hot Mix Asphalt (HMA) mixtures and to determine if the Georgia Loaded
Wheel Tester (GLWT) could be used to measure moisture susceptibility of HMA mixtures. The
evaluation involved eight HMA mixtures from combinations of two aggregate types and four asphalt-
additive-aging possibilities. Laboratory testing was accomplished in the first phase with the production of
2.5 in. by 4 in. cores cycled and tested for their indirect tensile strength. The second phase was
accomplished using 3- by 6-inch cores that were conditioned and tested for rutting using the GLWT.
Finally, a statistical analysis was performed to determine if performance of the various mixtures was
significantly different in groups of asphalt types and to determine if the GLWT was a viable measurement
tool for moisture susceptibility.
Conclusions
Based on observations and testing performed in this study, the following conclusions were made:
1. The cores were conditioned using a freeze-thaw procedure. After the freeze–thaw conditioning
was performed, tensile strength of the eight HMA mixtures decreased.
2. The tensile strength of the cores produced using the granite aggregate reached failure within four
freeze-thaw cycles. Cores produced with the limestone aggregate took significantly more cycles
to reach failure. Thus, tensile strength of the granite aggregate reached failure more rapidly than
the limestone aggregate.

62
3. The asphalt and the aggregate type were shown to have an effect on the moisture susceptibility of
the HMA mixtures. Mixtures produced using the lime additive showed less of an effect due to
the aggregate type than did the other HMA mixtures.
4. The second phase of testing indicated that the 4 percent air void mixtures sustained less rutting
than did 7 percent air void mixtures. The percent air voids and the asphalt type affected
performance of the cores in the GLWT. Conditioning of the cores did not contribute significantly
to performance of the cores in the GLWT.
5. No evidence suggested that saturating and freeze-thaw conditionings affected performance of the
cores in the GLWT. Therefore, testing the cores in a saturated state confined in a swim cap was
not an effective method for measuring for moisture damage.
Recommendations
1. Cores with the lime additive should be produced and then tested again for their indirect tensile
strength. Testing should be performed to make sure the additive was distributed equally between
the cores. This is due to the lack of a consistent downward trend in the TSR data.
2. Further research should be performed to study effectiveness of the GLWT at measuring moisture
susceptibility. The testing procedure that was utilized was not effective. Therefore, a testing
procedure that addresses saturation of the cores should be designed.
3. Once a procedure is found that can evaluate the moisture susceptibility of HMA using the GLWT,
the experimental design should make a comparison between HMA mixtures in the field and the
laboratory produced cores to check effectiveness of the procedure.
63
REFERENCES
Anerson, D. and E. Dukatz (1982). The Effect of Antistrip Additives on the Properties of Asphalt Cement. Association of Asphalt Paving Technologists, Vol. 51, pp 298-317.
Aschenbrener, T. (1995). Evaluation of Hamburg Wheel Tracking Device to Predict
Moisture Damage in Hot-Mix Asphalt. Transportation Research Record 1492. Washington D.C.: National Academy Press.
Collins, R., D. Watson, and B. Campbell (1995). Development and Use of Georgia Loaded
Wheel Tester. Transportation Research Record 1492. Washington D.C.: National Academy Press.
Collins, R., H. Shami, and J. Lai (1996). Use of Georgia Loaded Wheel Tester to Evaluate
Rutting of Asphalt Samples Prepared by Superpave Gyratory Compactor. Transportation Research Record 1545. Washington D.C.: National Academy Press.
Construction of Hot Mix Asphalt Pavements.(1998) Manual Series No. 22, 2nd edition:
Asphalt Institute. Coplantz, J. and D. Newcomb (1988). Water Sensitivity Test Methods for Asphalt
Concrete Mixtures: A Laboratory Comparison. Transportation Research Record 1171. Washington D.C.: National Academy Press.
Izzo, R. and M. Tahmoressi (1999). Use of the Hamburg Wheel-Tracking Device for
Evaluating Moisture Susceptibility of Hot-Mix Asphalt. Transportation Research Record 1681. Washington D.C.: National Academy Press.
Kennedy, T., F. Roberts, and K. Lee (1983). Evaluation of Moisture Effects on Asphalt
Concrete Mixtures. Transportation Research Record 911. Washington D.C.: National Academy Press.
Kennedy, T. and J. Anagnos (1984). A Field Evaluation of techniques for treating
Asphalt Mixtures with Lime. Report No. FHWA-TX-85-47+253-6. Kennedy, T. and J. Anagnos (1984). Modified Test Procedure for Texas Freeze-Thaw
Pedestal Test. Report No. FHWA-TX-85-46+253-7. Kennedy, T., R. McGennis, and F. Roberts (1983). Investigation of Moisture Damage to
Asphalt Concrete and the Effect of Field Performance-A Case Study. Transportation Research Record 911. Washington D.C.: National Academy Press.
Lottman, R.P. (1982). Predicting Moisture-Induced Damage to Asphaltic Concrete. NCHRP
Report No. 246. Washington D.C.: Transportation Research Board, National Research Council.
Lottman, R.P., L. White, and D. Frith (1988). Methods of Predicting and Controlling
Moisture Damage in Asphalt Concrete. Transportation Research Record 1171. Washington D.C.: National Academy Press.
64
Miller, Tyler R. (1995). Laboratory Evaluation of Rutting in Asphalt Pavements. M.S. Laramie, Wyoming: University of Wyoming Department of Civil Engineering.
Mohammad, L., C. Abadie, R. Gokmen, and A. Puppala (2000). Mechanistic Evaluation
of Hydrated Lime in Hot-Mix Asphalt Mixtures. Transportation Research Record 1723. Washington D.C.: National Academy Press.
Parker, F. and F. Gharaybeh (1987). Evaluation of Indirect Tensile Tests for Assessing
Stripping of Alabama Asphalt Concrete Mixtures. Transportation Research Record 1115. Washington D.C.: National Academy Press.
Parker, F. and F. Gharaybeh (1988). Evaluation of Tests to Asses Stripping Potential of
Asphalt Concrete Mixtures. Transportation Research Record 1171. Washington D.C.: National Academy Press.
Roberts, F., P. Kandhal, E. Brown, D. Lee, and T. Kennedy (1996). Hot Mix Asphalt
Materials, Mixture Design, and Construction. 2nd edition. Lanham, Maryland: NAPA Education Foundation.
Romero, P. and K. Stuart (1998). Evaluating Accelerated Rut Testers. Public Roads, Vol.
62, No. 1. Shami, H., J. Lai, J. D’Angelo, and T. Harman (1997). Development of Temperature-
Effect Model for Predicting Rutting of Asphalt Mixtures Using Georgia Loaded Wheel Tester. Transportation Research Record 1590. Washington D.C.: National Academy Press.
Standard Specifications for Transportation Materials and Methods of Sampling and Testing.
American Association of State Highway and transportation Officials, 17th edition: Washington D.C..
Stuart, K. and R. Izzo (1995). Correlation of Superpave G*/Sinδ with Rutting Susceptibility from Laboratory Mixture Test. Transportation Research Record 1492. Washington D.C.: National Academy Press.
Tunnicliff, D. (1997). Performance of Antistripping Additives. Journal of the Association
of Asphalt Paving Technologists, Vol. 66, pp. 334-378. Tunnicliff, D. and R. Root (1984). Use of Antistripping Additives in Asphaltic Concrete
Mixtures. NCHRP Report No. 274. Washington D.C.: Transportation Research Board, National Research Council.
Watson, D., A. Johnson, and D. Jared (1997). The Superpave Gradation Restricted Zone
and Performance Testing with the Georgia Loaded Tester. Transportation Research Record 1583. Washington D.C.: National Academy Press.
Williams, R. and B. Prowell (1999). Comparison of Laboratory Wheel-Tracking Test
Results with WesTrack Performance. Transportation Research Record 1681. Washington D.C.: National Academy Press.

65
Yoon, H. and Tarrer A. (1988). Effect of Aggregate Properties on Stripping. Transportation Research Record 1171. Washington D.C.: National Academy Press.

66

67
APPENDIX A
Core Production Procedure

68
The following are detailed steps followed in the production of the cores.
1. Weigh out aggregate for 5-10 specimens,
2. Place aggregate and asphalt in 275oF (135°C) oven for 2 hours.
3. Remove the hot aggregate, place it on a scale, and add the proper weight of asphalt cement to
obtain the desired asphalt content.
4. Mix asphalt cement and aggregate until all the aggregate is evenly coated.
5. Place mixtures in separate containers to cure at ambient temperature for 2 hours.
6. Place in 140oF (60°C) oven for 16 hours.
7. Increase oven temperature to 275oF (135°C) for 2 hours; meanwhile preheat the mold and lower
puck.
8. Switch on the Gyrator Compactor and preheat it for five minutes.
9. Check the parameters of the Gyrator Compactor to comply with the desired specimen height.
10. Place a paper disc into an assembled, preheated Gyrator mold and pour in loose HMA. Spade the
mixture with a heated spatula to level. Place another paper disc on the top of the mixture in the
mold.
11. Place the mold filled with HMA into the Gyratory Compactor.
12. Compact the HMA into a core.
13. Remove the paper filters from the top and bottom of the specimens. Cool the specimens and
extrude from the mold using a jack. Place identification marks on each specimen with an
alphanumeric code using a grease pencil.
14. Allow specimens to sit at ambient temperature for 2 hours.
15. Determine the bulk specific gravity for each specimen.
16. Let specimens stand at ambient temperature for 24 hours.
17. Measure height in 4 difference places and diameter in 3 different places on each specimen.

69
APPENDIX B
Phase I Core Data
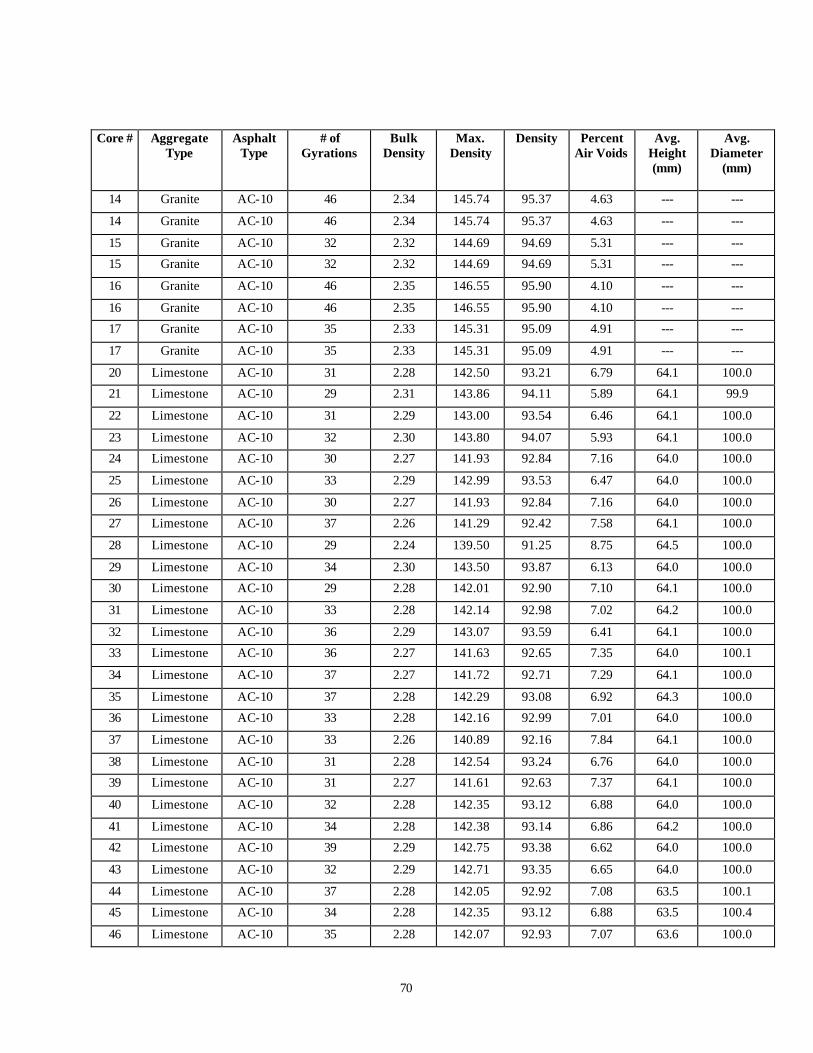
70
Core # Aggregate Type
Asphalt Type
# of Gyrations
Bulk Density
Max. Density
Density Percent Air Voids
Avg. Height (mm)
Avg. Diameter
(mm)
14 Granite AC-10 46 2.34 145.74 95.37 4.63 --- ---
14 Granite AC-10 46 2.34 145.74 95.37 4.63 --- ---
15 Granite AC-10 32 2.32 144.69 94.69 5.31 --- ---
15 Granite AC-10 32 2.32 144.69 94.69 5.31 --- ---
16 Granite AC-10 46 2.35 146.55 95.90 4.10 --- ---
16 Granite AC-10 46 2.35 146.55 95.90 4.10 --- ---
17 Granite AC-10 35 2.33 145.31 95.09 4.91 --- ---
17 Granite AC-10 35 2.33 145.31 95.09 4.91 --- ---
20 Limestone AC-10 31 2.28 142.50 93.21 6.79 64.1 100.0
21 Limestone AC-10 29 2.31 143.86 94.11 5.89 64.1 99.9
22 Limestone AC-10 31 2.29 143.00 93.54 6.46 64.1 100.0
23 Limestone AC-10 32 2.30 143.80 94.07 5.93 64.1 100.0
24 Limestone AC-10 30 2.27 141.93 92.84 7.16 64.0 100.0
25 Limestone AC-10 33 2.29 142.99 93.53 6.47 64.0 100.0
26 Limestone AC-10 30 2.27 141.93 92.84 7.16 64.0 100.0
27 Limestone AC-10 37 2.26 141.29 92.42 7.58 64.1 100.0
28 Limestone AC-10 29 2.24 139.50 91.25 8.75 64.5 100.0
29 Limestone AC-10 34 2.30 143.50 93.87 6.13 64.0 100.0
30 Limestone AC-10 29 2.28 142.01 92.90 7.10 64.1 100.0
31 Limestone AC-10 33 2.28 142.14 92.98 7.02 64.2 100.0
32 Limestone AC-10 36 2.29 143.07 93.59 6.41 64.1 100.0
33 Limestone AC-10 36 2.27 141.63 92.65 7.35 64.0 100.1
34 Limestone AC-10 37 2.27 141.72 92.71 7.29 64.1 100.0
35 Limestone AC-10 37 2.28 142.29 93.08 6.92 64.3 100.0
36 Limestone AC-10 33 2.28 142.16 92.99 7.01 64.0 100.0
37 Limestone AC-10 33 2.26 140.89 92.16 7.84 64.1 100.0
38 Limestone AC-10 31 2.28 142.54 93.24 6.76 64.0 100.0
39 Limestone AC-10 31 2.27 141.61 92.63 7.37 64.1 100.0
40 Limestone AC-10 32 2.28 142.35 93.12 6.88 64.0 100.0
41 Limestone AC-10 34 2.28 142.38 93.14 6.86 64.2 100.0
42 Limestone AC-10 39 2.29 142.75 93.38 6.62 64.0 100.0
43 Limestone AC-10 32 2.29 142.71 93.35 6.65 64.0 100.0
44 Limestone AC-10 37 2.28 142.05 92.92 7.08 63.5 100.1
45 Limestone AC-10 34 2.28 142.35 93.12 6.88 63.5 100.4
46 Limestone AC-10 35 2.28 142.07 92.93 7.07 63.6 100.0
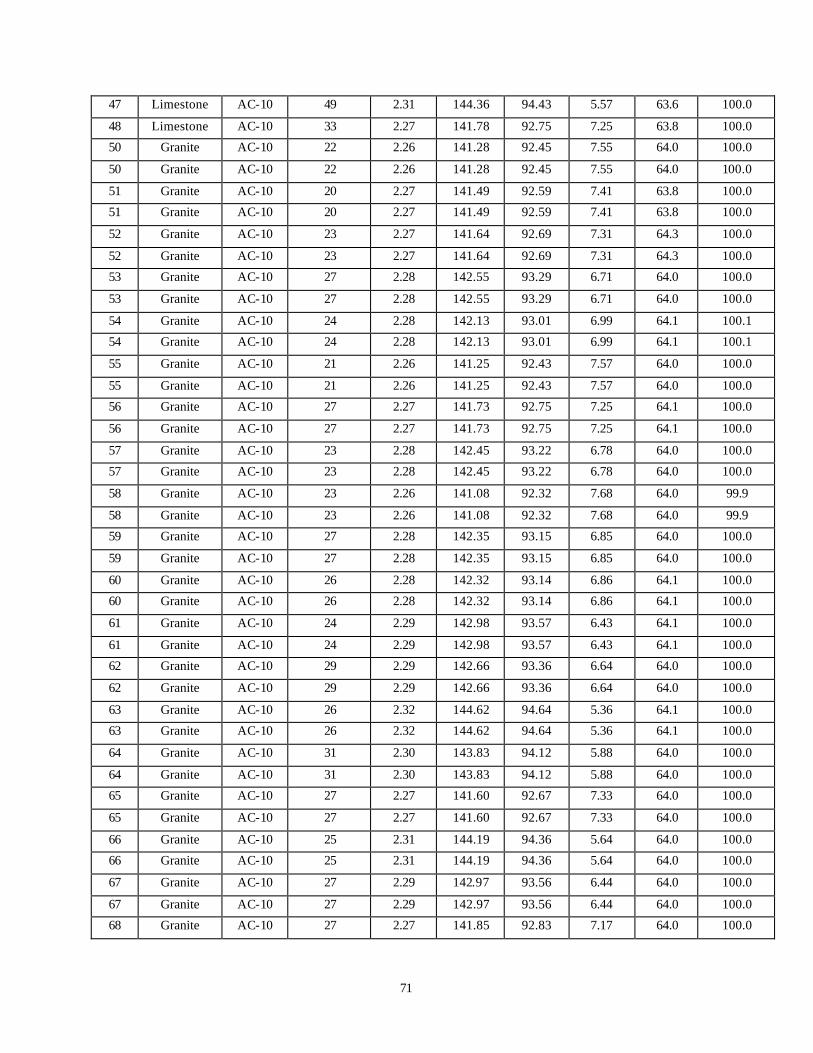
71
47 Limestone AC-10 49 2.31 144.36 94.43 5.57 63.6 100.0
48 Limestone AC-10 33 2.27 141.78 92.75 7.25 63.8 100.0
50 Granite AC-10 22 2.26 141.28 92.45 7.55 64.0 100.0
50 Granite AC-10 22 2.26 141.28 92.45 7.55 64.0 100.0
51 Granite AC-10 20 2.27 141.49 92.59 7.41 63.8 100.0
51 Granite AC-10 20 2.27 141.49 92.59 7.41 63.8 100.0
52 Granite AC-10 23 2.27 141.64 92.69 7.31 64.3 100.0
52 Granite AC-10 23 2.27 141.64 92.69 7.31 64.3 100.0
53 Granite AC-10 27 2.28 142.55 93.29 6.71 64.0 100.0
53 Granite AC-10 27 2.28 142.55 93.29 6.71 64.0 100.0
54 Granite AC-10 24 2.28 142.13 93.01 6.99 64.1 100.1
54 Granite AC-10 24 2.28 142.13 93.01 6.99 64.1 100.1
55 Granite AC-10 21 2.26 141.25 92.43 7.57 64.0 100.0
55 Granite AC-10 21 2.26 141.25 92.43 7.57 64.0 100.0
56 Granite AC-10 27 2.27 141.73 92.75 7.25 64.1 100.0
56 Granite AC-10 27 2.27 141.73 92.75 7.25 64.1 100.0
57 Granite AC-10 23 2.28 142.45 93.22 6.78 64.0 100.0
57 Granite AC-10 23 2.28 142.45 93.22 6.78 64.0 100.0
58 Granite AC-10 23 2.26 141.08 92.32 7.68 64.0 99.9
58 Granite AC-10 23 2.26 141.08 92.32 7.68 64.0 99.9
59 Granite AC-10 27 2.28 142.35 93.15 6.85 64.0 100.0
59 Granite AC-10 27 2.28 142.35 93.15 6.85 64.0 100.0
60 Granite AC-10 26 2.28 142.32 93.14 6.86 64.1 100.0
60 Granite AC-10 26 2.28 142.32 93.14 6.86 64.1 100.0
61 Granite AC-10 24 2.29 142.98 93.57 6.43 64.1 100.0
61 Granite AC-10 24 2.29 142.98 93.57 6.43 64.1 100.0
62 Granite AC-10 29 2.29 142.66 93.36 6.64 64.0 100.0
62 Granite AC-10 29 2.29 142.66 93.36 6.64 64.0 100.0
63 Granite AC-10 26 2.32 144.62 94.64 5.36 64.1 100.0
63 Granite AC-10 26 2.32 144.62 94.64 5.36 64.1 100.0
64 Granite AC-10 31 2.30 143.83 94.12 5.88 64.0 100.0
64 Granite AC-10 31 2.30 143.83 94.12 5.88 64.0 100.0
65 Granite AC-10 27 2.27 141.60 92.67 7.33 64.0 100.0
65 Granite AC-10 27 2.27 141.60 92.67 7.33 64.0 100.0
66 Granite AC-10 25 2.31 144.19 94.36 5.64 64.0 100.0
66 Granite AC-10 25 2.31 144.19 94.36 5.64 64.0 100.0
67 Granite AC-10 27 2.29 142.97 93.56 6.44 64.0 100.0
67 Granite AC-10 27 2.29 142.97 93.56 6.44 64.0 100.0
68 Granite AC-10 27 2.27 141.85 92.83 7.17 64.0 100.0
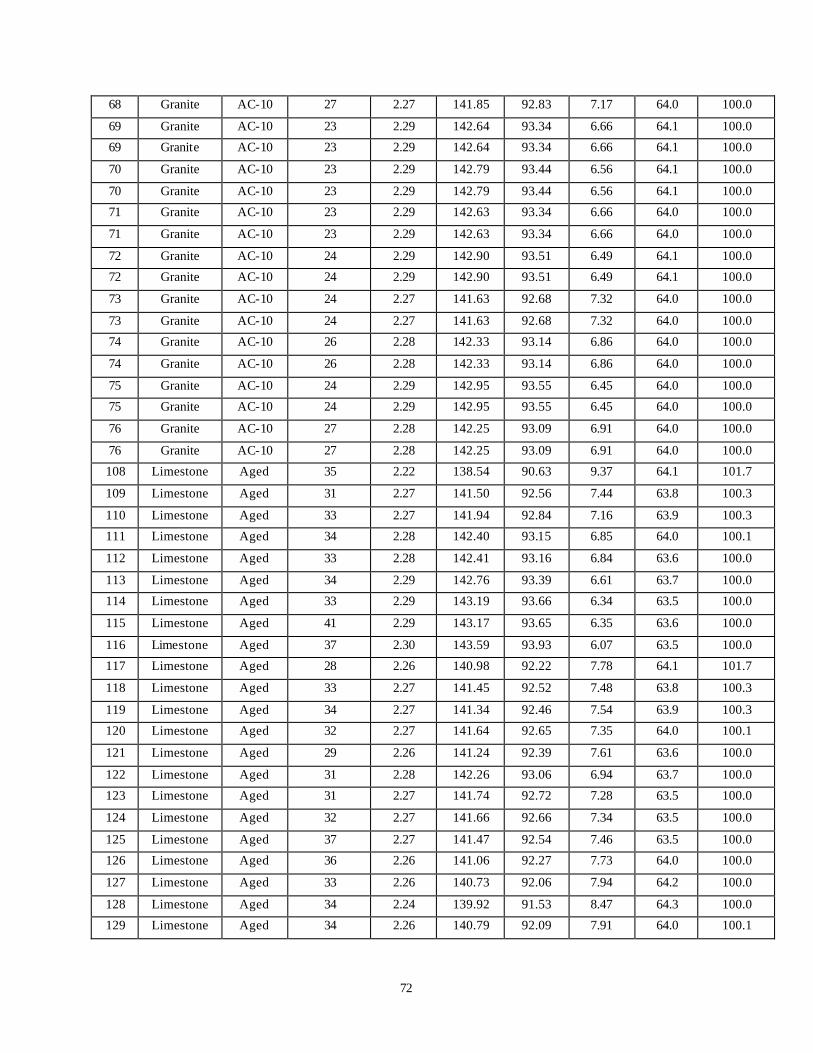
72
68 Granite AC-10 27 2.27 141.85 92.83 7.17 64.0 100.0
69 Granite AC-10 23 2.29 142.64 93.34 6.66 64.1 100.0
69 Granite AC-10 23 2.29 142.64 93.34 6.66 64.1 100.0
70 Granite AC-10 23 2.29 142.79 93.44 6.56 64.1 100.0
70 Granite AC-10 23 2.29 142.79 93.44 6.56 64.1 100.0
71 Granite AC-10 23 2.29 142.63 93.34 6.66 64.0 100.0
71 Granite AC-10 23 2.29 142.63 93.34 6.66 64.0 100.0
72 Granite AC-10 24 2.29 142.90 93.51 6.49 64.1 100.0
72 Granite AC-10 24 2.29 142.90 93.51 6.49 64.1 100.0
73 Granite AC-10 24 2.27 141.63 92.68 7.32 64.0 100.0
73 Granite AC-10 24 2.27 141.63 92.68 7.32 64.0 100.0
74 Granite AC-10 26 2.28 142.33 93.14 6.86 64.0 100.0
74 Granite AC-10 26 2.28 142.33 93.14 6.86 64.0 100.0
75 Granite AC-10 24 2.29 142.95 93.55 6.45 64.0 100.0
75 Granite AC-10 24 2.29 142.95 93.55 6.45 64.0 100.0
76 Granite AC-10 27 2.28 142.25 93.09 6.91 64.0 100.0
76 Granite AC-10 27 2.28 142.25 93.09 6.91 64.0 100.0
108 Limestone Aged 35 2.22 138.54 90.63 9.37 64.1 101.7
109 Limestone Aged 31 2.27 141.50 92.56 7.44 63.8 100.3
110 Limestone Aged 33 2.27 141.94 92.84 7.16 63.9 100.3
111 Limestone Aged 34 2.28 142.40 93.15 6.85 64.0 100.1
112 Limestone Aged 33 2.28 142.41 93.16 6.84 63.6 100.0
113 Limestone Aged 34 2.29 142.76 93.39 6.61 63.7 100.0
114 Limestone Aged 33 2.29 143.19 93.66 6.34 63.5 100.0
115 Limestone Aged 41 2.29 143.17 93.65 6.35 63.6 100.0
116 Limestone Aged 37 2.30 143.59 93.93 6.07 63.5 100.0
117 Limestone Aged 28 2.26 140.98 92.22 7.78 64.1 101.7
118 Limestone Aged 33 2.27 141.45 92.52 7.48 63.8 100.3
119 Limestone Aged 34 2.27 141.34 92.46 7.54 63.9 100.3
120 Limestone Aged 32 2.27 141.64 92.65 7.35 64.0 100.1
121 Limestone Aged 29 2.26 141.24 92.39 7.61 63.6 100.0
122 Limestone Aged 31 2.28 142.26 93.06 6.94 63.7 100.0
123 Limestone Aged 31 2.27 141.74 92.72 7.28 63.5 100.0
124 Limestone Aged 32 2.27 141.66 92.66 7.34 63.5 100.0
125 Limestone Aged 37 2.27 141.47 92.54 7.46 63.5 100.0
126 Limestone Aged 36 2.26 141.06 92.27 7.73 64.0 100.0
127 Limestone Aged 33 2.26 140.73 92.06 7.94 64.2 100.0
128 Limestone Aged 34 2.24 139.92 91.53 8.47 64.3 100.0
129 Limestone Aged 34 2.26 140.79 92.09 7.91 64.0 100.1
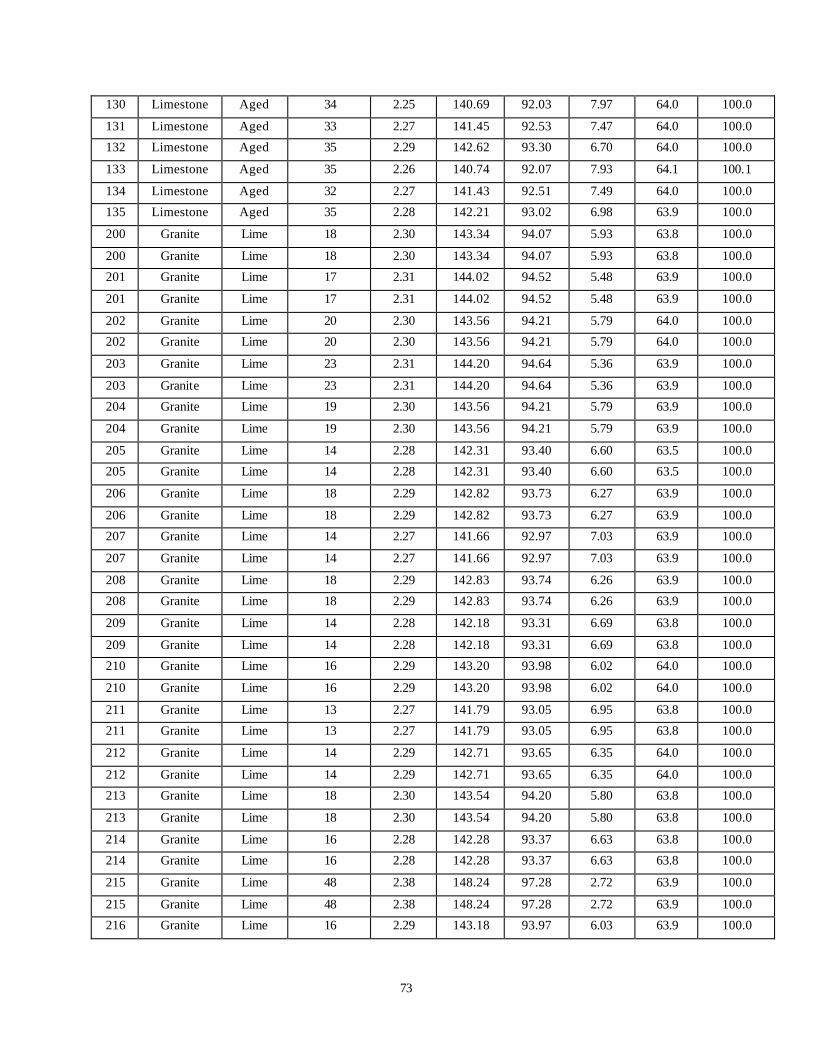
73
130 Limestone Aged 34 2.25 140.69 92.03 7.97 64.0 100.0
131 Limestone Aged 33 2.27 141.45 92.53 7.47 64.0 100.0
132 Limestone Aged 35 2.29 142.62 93.30 6.70 64.0 100.0
133 Limestone Aged 35 2.26 140.74 92.07 7.93 64.1 100.1
134 Limestone Aged 32 2.27 141.43 92.51 7.49 64.0 100.0
135 Limestone Aged 35 2.28 142.21 93.02 6.98 63.9 100.0
200 Granite Lime 18 2.30 143.34 94.07 5.93 63.8 100.0
200 Granite Lime 18 2.30 143.34 94.07 5.93 63.8 100.0
201 Granite Lime 17 2.31 144.02 94.52 5.48 63.9 100.0
201 Granite Lime 17 2.31 144.02 94.52 5.48 63.9 100.0
202 Granite Lime 20 2.30 143.56 94.21 5.79 64.0 100.0
202 Granite Lime 20 2.30 143.56 94.21 5.79 64.0 100.0
203 Granite Lime 23 2.31 144.20 94.64 5.36 63.9 100.0
203 Granite Lime 23 2.31 144.20 94.64 5.36 63.9 100.0
204 Granite Lime 19 2.30 143.56 94.21 5.79 63.9 100.0
204 Granite Lime 19 2.30 143.56 94.21 5.79 63.9 100.0
205 Granite Lime 14 2.28 142.31 93.40 6.60 63.5 100.0
205 Granite Lime 14 2.28 142.31 93.40 6.60 63.5 100.0
206 Granite Lime 18 2.29 142.82 93.73 6.27 63.9 100.0
206 Granite Lime 18 2.29 142.82 93.73 6.27 63.9 100.0
207 Granite Lime 14 2.27 141.66 92.97 7.03 63.9 100.0
207 Granite Lime 14 2.27 141.66 92.97 7.03 63.9 100.0
208 Granite Lime 18 2.29 142.83 93.74 6.26 63.9 100.0
208 Granite Lime 18 2.29 142.83 93.74 6.26 63.9 100.0
209 Granite Lime 14 2.28 142.18 93.31 6.69 63.8 100.0
209 Granite Lime 14 2.28 142.18 93.31 6.69 63.8 100.0
210 Granite Lime 16 2.29 143.20 93.98 6.02 64.0 100.0
210 Granite Lime 16 2.29 143.20 93.98 6.02 64.0 100.0
211 Granite Lime 13 2.27 141.79 93.05 6.95 63.8 100.0
211 Granite Lime 13 2.27 141.79 93.05 6.95 63.8 100.0
212 Granite Lime 14 2.29 142.71 93.65 6.35 64.0 100.0
212 Granite Lime 14 2.29 142.71 93.65 6.35 64.0 100.0
213 Granite Lime 18 2.30 143.54 94.20 5.80 63.8 100.0
213 Granite Lime 18 2.30 143.54 94.20 5.80 63.8 100.0
214 Granite Lime 16 2.28 142.28 93.37 6.63 63.8 100.0
214 Granite Lime 16 2.28 142.28 93.37 6.63 63.8 100.0
215 Granite Lime 48 2.38 148.24 97.28 2.72 63.9 100.0
215 Granite Lime 48 2.38 148.24 97.28 2.72 63.9 100.0
216 Granite Lime 16 2.29 143.18 93.97 6.03 63.9 100.0
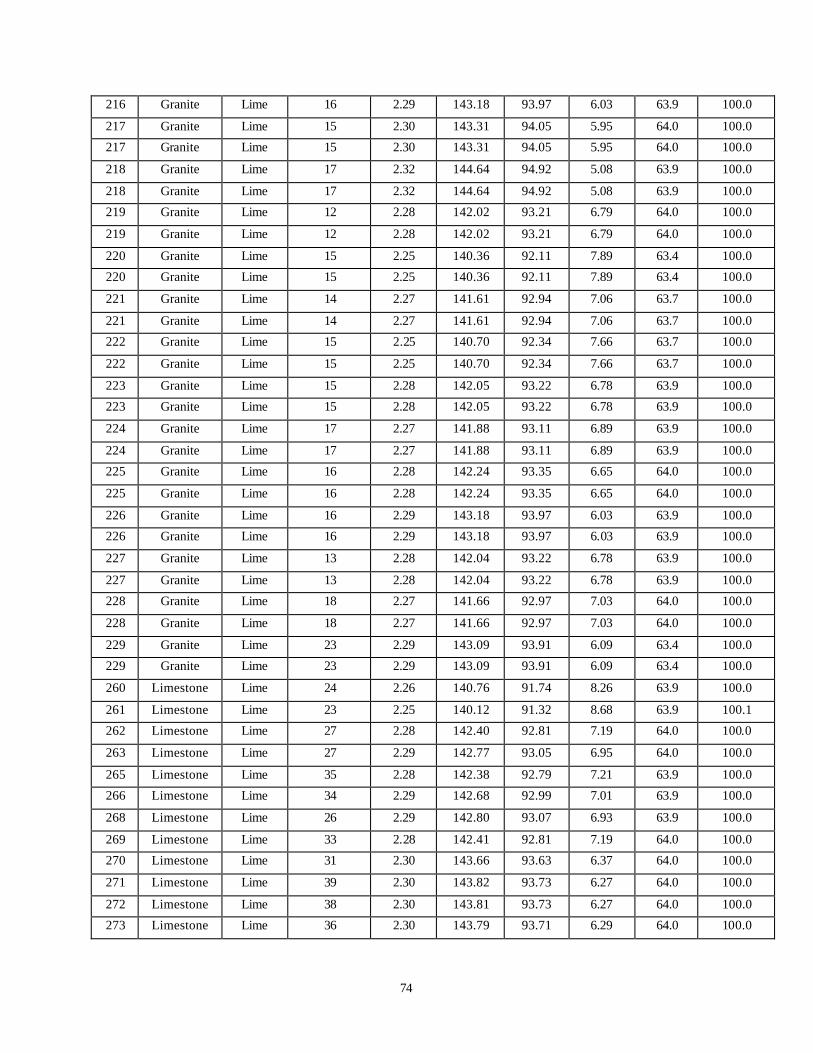
74
216 Granite Lime 16 2.29 143.18 93.97 6.03 63.9 100.0
217 Granite Lime 15 2.30 143.31 94.05 5.95 64.0 100.0
217 Granite Lime 15 2.30 143.31 94.05 5.95 64.0 100.0
218 Granite Lime 17 2.32 144.64 94.92 5.08 63.9 100.0
218 Granite Lime 17 2.32 144.64 94.92 5.08 63.9 100.0
219 Granite Lime 12 2.28 142.02 93.21 6.79 64.0 100.0
219 Granite Lime 12 2.28 142.02 93.21 6.79 64.0 100.0
220 Granite Lime 15 2.25 140.36 92.11 7.89 63.4 100.0
220 Granite Lime 15 2.25 140.36 92.11 7.89 63.4 100.0
221 Granite Lime 14 2.27 141.61 92.94 7.06 63.7 100.0
221 Granite Lime 14 2.27 141.61 92.94 7.06 63.7 100.0
222 Granite Lime 15 2.25 140.70 92.34 7.66 63.7 100.0
222 Granite Lime 15 2.25 140.70 92.34 7.66 63.7 100.0
223 Granite Lime 15 2.28 142.05 93.22 6.78 63.9 100.0
223 Granite Lime 15 2.28 142.05 93.22 6.78 63.9 100.0
224 Granite Lime 17 2.27 141.88 93.11 6.89 63.9 100.0
224 Granite Lime 17 2.27 141.88 93.11 6.89 63.9 100.0
225 Granite Lime 16 2.28 142.24 93.35 6.65 64.0 100.0
225 Granite Lime 16 2.28 142.24 93.35 6.65 64.0 100.0
226 Granite Lime 16 2.29 143.18 93.97 6.03 63.9 100.0
226 Granite Lime 16 2.29 143.18 93.97 6.03 63.9 100.0
227 Granite Lime 13 2.28 142.04 93.22 6.78 63.9 100.0
227 Granite Lime 13 2.28 142.04 93.22 6.78 63.9 100.0
228 Granite Lime 18 2.27 141.66 92.97 7.03 64.0 100.0
228 Granite Lime 18 2.27 141.66 92.97 7.03 64.0 100.0
229 Granite Lime 23 2.29 143.09 93.91 6.09 63.4 100.0
229 Granite Lime 23 2.29 143.09 93.91 6.09 63.4 100.0
260 Limestone Lime 24 2.26 140.76 91.74 8.26 63.9 100.0
261 Limestone Lime 23 2.25 140.12 91.32 8.68 63.9 100.1
262 Limestone Lime 27 2.28 142.40 92.81 7.19 64.0 100.0
263 Limestone Lime 27 2.29 142.77 93.05 6.95 64.0 100.0
265 Limestone Lime 35 2.28 142.38 92.79 7.21 63.9 100.0
266 Limestone Lime 34 2.29 142.68 92.99 7.01 63.9 100.0
268 Limestone Lime 26 2.29 142.80 93.07 6.93 63.9 100.0
269 Limestone Lime 33 2.28 142.41 92.81 7.19 64.0 100.0
270 Limestone Lime 31 2.30 143.66 93.63 6.37 64.0 100.0
271 Limestone Lime 39 2.30 143.82 93.73 6.27 64.0 100.0
272 Limestone Lime 38 2.30 143.81 93.73 6.27 64.0 100.0
273 Limestone Lime 36 2.30 143.79 93.71 6.29 64.0 100.0
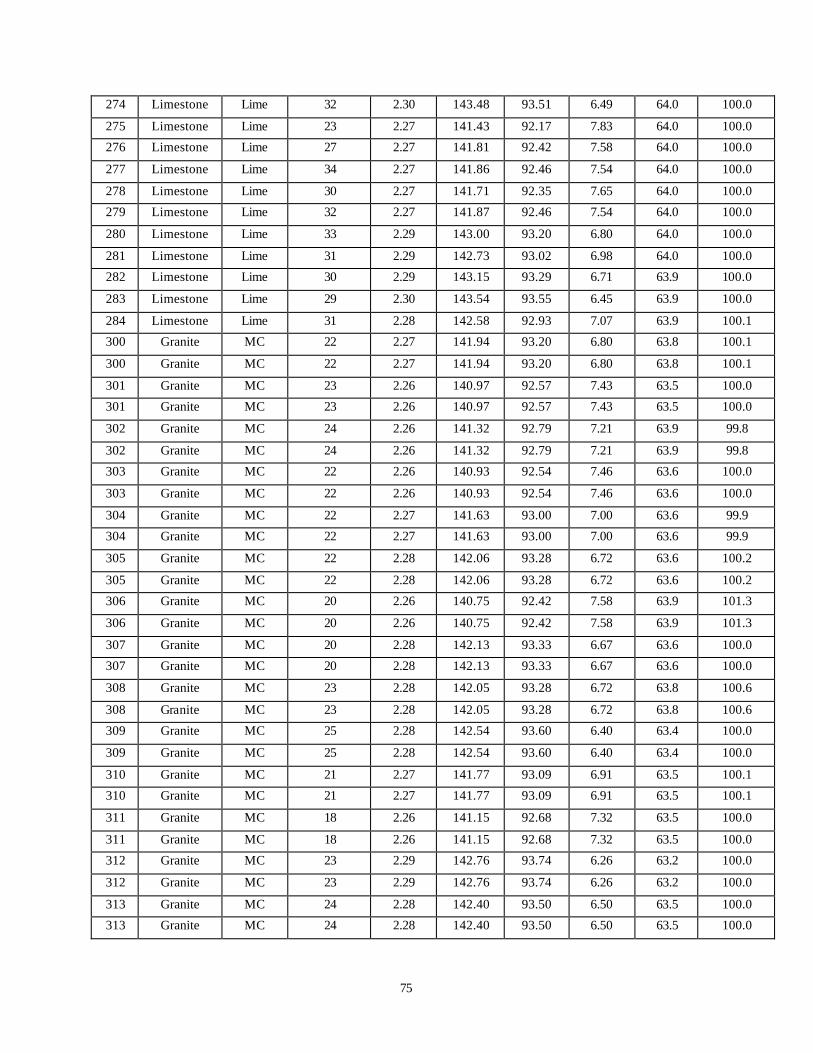
75
274 Limestone Lime 32 2.30 143.48 93.51 6.49 64.0 100.0
275 Limestone Lime 23 2.27 141.43 92.17 7.83 64.0 100.0
276 Limestone Lime 27 2.27 141.81 92.42 7.58 64.0 100.0
277 Limestone Lime 34 2.27 141.86 92.46 7.54 64.0 100.0
278 Limestone Lime 30 2.27 141.71 92.35 7.65 64.0 100.0
279 Limestone Lime 32 2.27 141.87 92.46 7.54 64.0 100.0
280 Limestone Lime 33 2.29 143.00 93.20 6.80 64.0 100.0
281 Limestone Lime 31 2.29 142.73 93.02 6.98 64.0 100.0
282 Limestone Lime 30 2.29 143.15 93.29 6.71 63.9 100.0
283 Limestone Lime 29 2.30 143.54 93.55 6.45 63.9 100.0
284 Limestone Lime 31 2.28 142.58 92.93 7.07 63.9 100.1
300 Granite MC 22 2.27 141.94 93.20 6.80 63.8 100.1
300 Granite MC 22 2.27 141.94 93.20 6.80 63.8 100.1
301 Granite MC 23 2.26 140.97 92.57 7.43 63.5 100.0
301 Granite MC 23 2.26 140.97 92.57 7.43 63.5 100.0
302 Granite MC 24 2.26 141.32 92.79 7.21 63.9 99.8
302 Granite MC 24 2.26 141.32 92.79 7.21 63.9 99.8
303 Granite MC 22 2.26 140.93 92.54 7.46 63.6 100.0
303 Granite MC 22 2.26 140.93 92.54 7.46 63.6 100.0
304 Granite MC 22 2.27 141.63 93.00 7.00 63.6 99.9
304 Granite MC 22 2.27 141.63 93.00 7.00 63.6 99.9
305 Granite MC 22 2.28 142.06 93.28 6.72 63.6 100.2
305 Granite MC 22 2.28 142.06 93.28 6.72 63.6 100.2
306 Granite MC 20 2.26 140.75 92.42 7.58 63.9 101.3
306 Granite MC 20 2.26 140.75 92.42 7.58 63.9 101.3
307 Granite MC 20 2.28 142.13 93.33 6.67 63.6 100.0
307 Granite MC 20 2.28 142.13 93.33 6.67 63.6 100.0
308 Granite MC 23 2.28 142.05 93.28 6.72 63.8 100.6
308 Granite MC 23 2.28 142.05 93.28 6.72 63.8 100.6
309 Granite MC 25 2.28 142.54 93.60 6.40 63.4 100.0
309 Granite MC 25 2.28 142.54 93.60 6.40 63.4 100.0
310 Granite MC 21 2.27 141.77 93.09 6.91 63.5 100.1
310 Granite MC 21 2.27 141.77 93.09 6.91 63.5 100.1
311 Granite MC 18 2.26 141.15 92.68 7.32 63.5 100.0
311 Granite MC 18 2.26 141.15 92.68 7.32 63.5 100.0
312 Granite MC 23 2.29 142.76 93.74 6.26 63.2 100.0
312 Granite MC 23 2.29 142.76 93.74 6.26 63.2 100.0
313 Granite MC 24 2.28 142.40 93.50 6.50 63.5 100.0
313 Granite MC 24 2.28 142.40 93.50 6.50 63.5 100.0
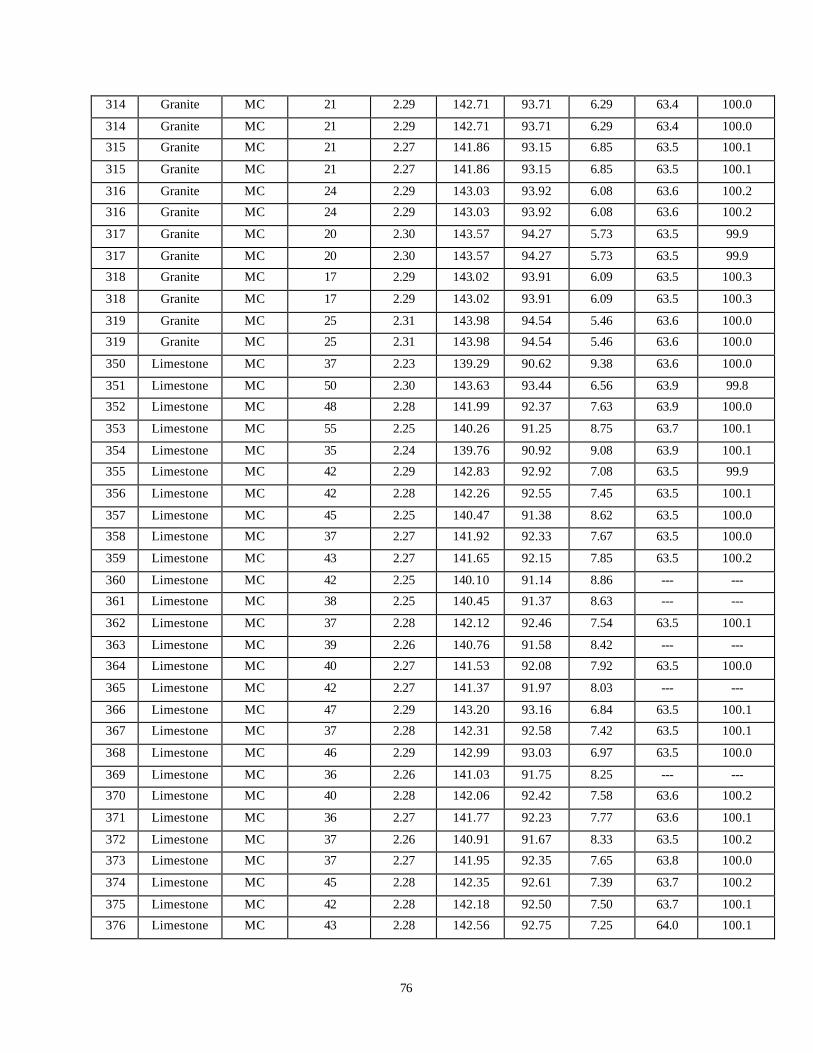
76
314 Granite MC 21 2.29 142.71 93.71 6.29 63.4 100.0
314 Granite MC 21 2.29 142.71 93.71 6.29 63.4 100.0
315 Granite MC 21 2.27 141.86 93.15 6.85 63.5 100.1
315 Granite MC 21 2.27 141.86 93.15 6.85 63.5 100.1
316 Granite MC 24 2.29 143.03 93.92 6.08 63.6 100.2
316 Granite MC 24 2.29 143.03 93.92 6.08 63.6 100.2
317 Granite MC 20 2.30 143.57 94.27 5.73 63.5 99.9
317 Granite MC 20 2.30 143.57 94.27 5.73 63.5 99.9
318 Granite MC 17 2.29 143.02 93.91 6.09 63.5 100.3
318 Granite MC 17 2.29 143.02 93.91 6.09 63.5 100.3
319 Granite MC 25 2.31 143.98 94.54 5.46 63.6 100.0
319 Granite MC 25 2.31 143.98 94.54 5.46 63.6 100.0
350 Limestone MC 37 2.23 139.29 90.62 9.38 63.6 100.0
351 Limestone MC 50 2.30 143.63 93.44 6.56 63.9 99.8
352 Limestone MC 48 2.28 141.99 92.37 7.63 63.9 100.0
353 Limestone MC 55 2.25 140.26 91.25 8.75 63.7 100.1
354 Limestone MC 35 2.24 139.76 90.92 9.08 63.9 100.1
355 Limestone MC 42 2.29 142.83 92.92 7.08 63.5 99.9
356 Limestone MC 42 2.28 142.26 92.55 7.45 63.5 100.1
357 Limestone MC 45 2.25 140.47 91.38 8.62 63.5 100.0
358 Limestone MC 37 2.27 141.92 92.33 7.67 63.5 100.0
359 Limestone MC 43 2.27 141.65 92.15 7.85 63.5 100.2
360 Limestone MC 42 2.25 140.10 91.14 8.86 --- ---
361 Limestone MC 38 2.25 140.45 91.37 8.63 --- ---
362 Limestone MC 37 2.28 142.12 92.46 7.54 63.5 100.1
363 Limestone MC 39 2.26 140.76 91.58 8.42 --- ---
364 Limestone MC 40 2.27 141.53 92.08 7.92 63.5 100.0
365 Limestone MC 42 2.27 141.37 91.97 8.03 --- ---
366 Limestone MC 47 2.29 143.20 93.16 6.84 63.5 100.1
367 Limestone MC 37 2.28 142.31 92.58 7.42 63.5 100.1
368 Limestone MC 46 2.29 142.99 93.03 6.97 63.5 100.0
369 Limestone MC 36 2.26 141.03 91.75 8.25 --- ---
370 Limestone MC 40 2.28 142.06 92.42 7.58 63.6 100.2
371 Limestone MC 36 2.27 141.77 92.23 7.77 63.6 100.1
372 Limestone MC 37 2.26 140.91 91.67 8.33 63.5 100.2
373 Limestone MC 37 2.27 141.95 92.35 7.65 63.8 100.0
374 Limestone MC 45 2.28 142.35 92.61 7.39 63.7 100.2
375 Limestone MC 42 2.28 142.18 92.50 7.50 63.7 100.1
376 Limestone MC 43 2.28 142.56 92.75 7.25 64.0 100.1

77
377 Limestone MC 39 2.27 141.56 92.09 7.91 64.0 100.0
379 Limestone MC 41 2.28 142.35 92.61 7.39 63.5 100.0

78

79
APPENDIX C
Phase II Core Data and GLWT Data
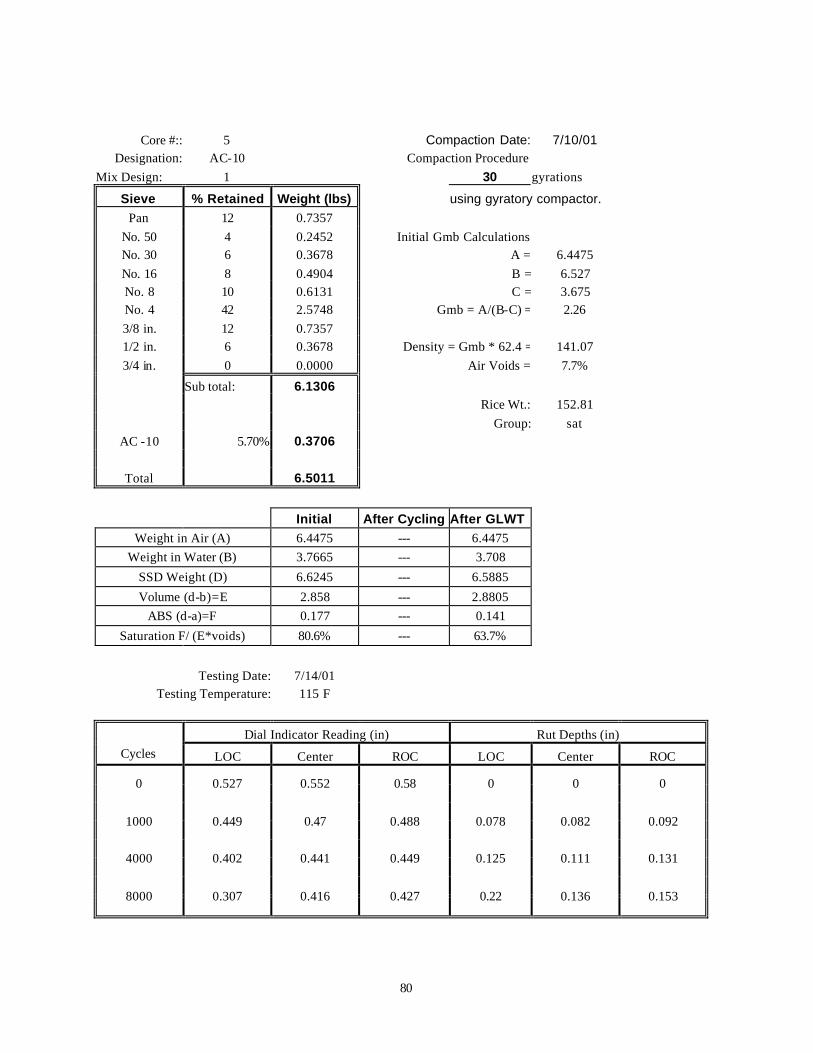
80
Core #:: 5 Compaction Date: 7/10/01 Designation: AC-10 Compaction Procedure:
Mix Design: 1 30 gyrations Sieve % Retained Weight (lbs) using gyratory compactor.
Pan 12 0.7357 No. 50 4 0.2452 Initial Gmb Calculations: No. 30 6 0.3678 A = 6.4475 No. 16 8 0.4904 B = 6.527 No. 8 10 0.6131 C = 3.675 No. 4 42 2.5748 Gmb = A/(B-C) = 2.26 3/8 in. 12 0.7357 1/2 in. 6 0.3678 Density = Gmb * 62.4 = 141.07 3/4 in. 0 0.0000 Air Voids = 7.7%
Sub total: 6.1306 Rice Wt.: 152.81 Group: sat
AC -10 5.70% 0.3706
Total 6.5011 Initial After Cycling After GLWT
Weight in Air (A) 6.4475 --- 6.4475 Weight in Water (B) 3.7665 --- 3.708
SSD Weight (D) 6.6245 --- 6.5885 Volume (d-b)=E 2.858 --- 2.8805
ABS (d-a)=F 0.177 --- 0.141 Saturation F/ (E*voids) 80.6% --- 63.7%
Testing Date: 7/14/01
Testing Temperature: 115 F
Dial Indicator Reading (in) Rut Depths (in) Cycles LOC Center ROC LOC Center ROC
0 0.527 0.552 0.58 0 0 0
1000 0.449 0.47 0.488 0.078 0.082 0.092
4000 0.402 0.441 0.449 0.125 0.111 0.131
8000 0.307 0.416 0.427 0.22 0.136 0.153

81
Core #:: 6 Compaction Date: 7/10/01 Designation: AC-10 Compaction Procedure:
Mix Design: 1 38 gyrations Sieve % Retained Weight (lbs) using gyratory compactor.
Pan 12 0.7357 No. 50 4 0.2452 Initial Gmb Calculations: No. 30 6 0.3678 A = 6.4575 No. 16 8 0.4904 B = 6.529 No. 8 10 0.6131 C = 3.6865 No. 4 42 2.5748 Gmb = A/(B-C) = 2.27 3/8 in. 12 0.7357 1/2 in. 6 0.3678 Density = Gmb * 62.4 = 141.76 3/4 in. 0 0.0000 Air Voids = 7.2%
Sub total: 6.1306 Rice Wt.: 152.81 Group: sat
AC -10 5.70% 0.3706
Total 6.5011 Initial After Cycling After GLWT
Weight in Air (A) 6.4575 --- 6.4575 Weight in Water (B) 3.7615 --- 3.697
SSD Weight (D) 6.6025 --- 6.581 Volume (d-b)=E 2.841 --- 2.884
ABS (d-a)=F 0.145 --- 0.1235 Saturation F/ (E*voids) 70.6% --- 59.2%
Testing Date: 7/14/01
Testing Temperature: 115 F
Dial Indicator Reading (in) Rut Depths (in) Cycles LOC Center ROC LOC Center ROC
0 0.515 0.562 0.571 0 0 0
1000 0.429 0.484 0.506 0.086 0.078 0.065
4000 0.376 0.438 0.474 0.139 0.124 0.097
8000 0.321 0.38 0.436 0.194 0.182 0.135
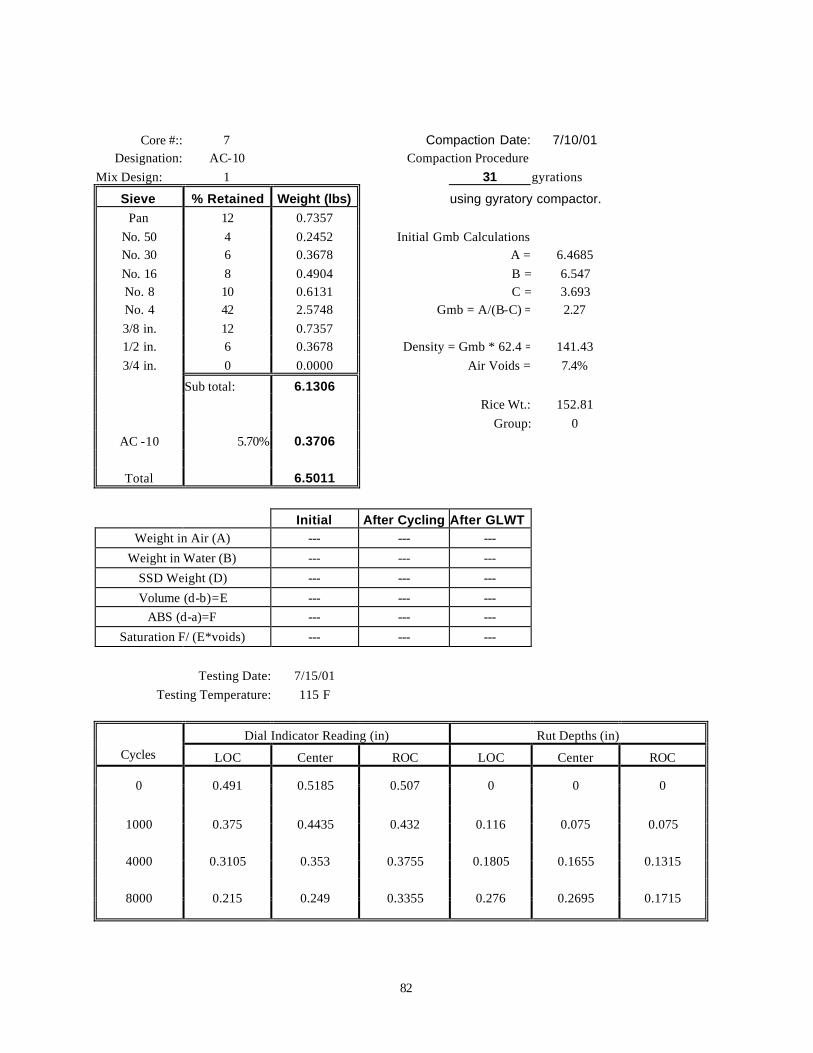
82
Core #:: 7 Compaction Date: 7/10/01 Designation: AC-10 Compaction Procedure:
Mix Design: 1 31 gyrations Sieve % Retained Weight (lbs) using gyratory compactor.
Pan 12 0.7357 No. 50 4 0.2452 Initial Gmb Calculations: No. 30 6 0.3678 A = 6.4685 No. 16 8 0.4904 B = 6.547 No. 8 10 0.6131 C = 3.693 No. 4 42 2.5748 Gmb = A/(B-C) = 2.27 3/8 in. 12 0.7357 1/2 in. 6 0.3678 Density = Gmb * 62.4 = 141.43 3/4 in. 0 0.0000 Air Voids = 7.4%
Sub total: 6.1306 Rice Wt.: 152.81 Group: 0
AC -10 5.70% 0.3706
Total 6.5011 Initial After Cycling After GLWT
Weight in Air (A) --- --- --- Weight in Water (B) --- --- ---
SSD Weight (D) --- --- --- Volume (d-b)=E --- --- ---
ABS (d-a)=F --- --- --- Saturation F/ (E*voids) --- --- ---
Testing Date: 7/15/01
Testing Temperature: 115 F
Dial Indicator Reading (in) Rut Depths (in) Cycles LOC Center ROC LOC Center ROC
0 0.491 0.5185 0.507 0 0 0
1000 0.375 0.4435 0.432 0.116 0.075 0.075
4000 0.3105 0.353 0.3755 0.1805 0.1655 0.1315
8000 0.215 0.249 0.3355 0.276 0.2695 0.1715

83
Core #:: 8 Compaction Date: 7/12/01 Designation: AC-10 Compaction Procedure:
Mix Design: 1 31 gyrations Sieve % Retained Weight (lbs) using gyratory compactor.
Pan 12 0.7357 No. 50 4 0.2452 Initial Gmb Calculations: No. 30 6 0.3678 A = 6.4595 No. 16 8 0.4904 B = 6.5255 No. 8 10 0.6131 C = 3.686 No. 4 42 2.5748 Gmb = A/(B-C) = 2.27 3/8 in. 12 0.7357 1/2 in. 6 0.3678 Density = Gmb * 62.4 = 141.95 3/4 in. 0 0.0000 Air Voids = 7.1%
Sub total: 6.1306 Rice Wt.: 152.81 Group: 0
AC -10 5.70% 0.3706
Total 6.5011 Initial After Cycling After GLWT
Weight in Air (A) --- --- --- Weight in Water (B) --- --- ---
SSD Weight (D) --- --- --- Volume (d-b)=E --- --- ---
ABS (d-a)=F --- --- --- Saturation F/ (E*voids) --- --- ---
Testing Date: 7/15/01
Testing Temperature: 115 F
Dial Indicator Reading (in) Rut Depths (in) Cycles LOC Center ROC LOC Center ROC
0 0.509 0.534 0.527 0 0 0
1000 0.383 0.427 0.462 0.126 0.107 0.065
4000 0.319 0.329 0.42 0.19 0.205 0.107
8000 0.2595 0.2515 0.3955 0.2495 0.2825 0.1315

84
Core #:: 9 Compaction Date: 7/12/01 Designation: AC-10 Compaction Procedure:
Mix Design: 1 28 gyrations Sieve % Retained Weight (lbs) using gyratory compactor.
Pan 12 0.7357 No. 50 4 0.2452 Initial Gmb Calculations: No. 30 6 0.3678 A = 6.4575 No. 16 8 0.4904 B = 6.532 No. 8 10 0.6131 C = 3.6885 No. 4 42 2.5748 Gmb = A/(B-C) = 2.27 3/8 in. 12 0.7357 1/2 in. 6 0.3678 Density = Gmb * 62.4 = 141.71 3/4 in. 0 0.0000 Air Voids = 7.3%
Sub total: 6.1306 Rice Wt.: 152.81 Group: sat
AC -10 5.70% 0.3706
Total 6.5011 Initial After Cycling After GLWT
Weight in Air (A) 6.4575 --- 6.4575 Weight in Water (B) 3.7835 --- 3.712
SSD Weight (D) 6.633 --- 6.5975 Volume (d-b)=E 2.8495 --- 2.8855
ABS (d-a)=F 0.1755 --- 0.14 Saturation F/ (E*voids) 84.8% --- 66.8%
Testing Date: 7/17/01
Testing Temperature: 115 F
Dial Indicator Reading (in) Rut Depths (in) Cycles LOC Center ROC LOC Center ROC
0 0.5305 0.57 0.571 0 0 0
1000 0.452 0.406 0.49 0.0785 0.164 0.081
4000 0.4 0.437 0.446 0.1305 0.133 0.125
8000 0.354 0.377 0.413 0.1765 0.193 0.158

85
Core #:: 10 Compaction Date: 7/12/01 Designation: AC-10 Compaction Procedure:
Mix Design: 1 33 gyrations Sieve % Retained Weight (lbs) using gyratory compactor.
Pan 12 0.7357 No. 50 4 0.2452 Initial Gmb Calculations: No. 30 6 0.3678 A = 6.465 No. 16 8 0.4904 B = 6.5345 No. 8 10 0.6131 C = 3.6985 No. 4 42 2.5748 Gmb = A/(B-C) = 2.28 3/8 in. 12 0.7357 1/2 in. 6 0.3678 Density = Gmb * 62.4 = 142.25 3/4 in. 0 0.0000 Air Voids = 6.9%
Sub total: 6.1306 Rice Wt.: 152.81 Group: sat
AC -10 5.70% 0.3706
Total 6.5011 Initial After Cycling After GLWT
Weight in Air (A) 6.465 --- 6.465 Weight in Water (B) 3.776 --- 3.708
SSD Weight (D) 6.625 --- 6.59 Volume (d-b)=E 2.849 --- 2.882
ABS (d-a)=F 0.16 --- 0.125 Saturation F/ (E*voids) 81.2% --- 62.7%
Testing Date: 7/17/01
Testing Temperature: 115 F
Dial Indicator Reading (in) Rut Depths (in) Cycles LOC Center ROC LOC Center ROC
0 0.527 0.563 0.568 0 0 0
1000 0.4565 0.469 0.514 0.0705 0.094 0.054
4000 0.401 0.415 0.459 0.126 0.148 0.109
8000 0.36 0.391 0.413 0.167 0.172 0.155

86
Core #:: 11 Compaction Date: 7/12/01 Designation: AC-10 Compaction Procedure:
Mix Design: 1 32 gyrations Sieve % Retained Weight (lbs) using gyratory compactor.
Pan 12 0.7357 No. 50 4 0.2452 Initial Gmb Calculations: No. 30 6 0.3678 A = 6.45 No. 16 8 0.4904 B = 6.531 No. 8 10 0.6131 C = 3.6905 No. 4 42 2.5748 Gmb = A/(B-C) = 2.27 3/8 in. 12 0.7357 1/2 in. 6 0.3678 Density = Gmb * 62.4 = 141.69 3/4 in. 0 0.0000 Air Voids = 7.3%
Sub total: 6.1306 Rice Wt.: 152.81 Group: *sat
AC -10 5.70% 0.3706
Total 6.5011 Initial After Cycling After GLWT
Weight in Air (A) 6.45 --- 6.45 Weight in Water (B) 3.7695 --- 3.698
SSD Weight (D) 6.629 --- 6.5955 Volume (d-b)=E 2.8595 --- 2.8975
ABS (d-a)=F 0.179 --- 0.1455 Saturation F/ (E*voids) 86.0% --- 69.0%
Testing Date: 7/18/01
Testing Temperature: 115 F
Dial Indicator Reading (in) Rut Depths (in) Cycles LOC Center ROC LOC Center ROC
0 0.5495 0.589 0.609 0 0 0
1000 0.446 0.482 0.5 0.1035 0.107 0.109
4000 0.398 0.424 0.448 0.1515 0.165 0.161
8000 0.351 0.342 0.396 0.1985 0.247 0.213

87
Core #:: 12 Compaction Date: 7/13/01 Designation: AC-10 Compaction Procedure:
Mix Design: 1 29 gyrations Sieve % Retained Weight (lbs) using gyratory compactor.
Pan 12 0.7357 No. 50 4 0.2452 Initial Gmb Calculations: No. 30 6 0.3678 A = 6.454 No. 16 8 0.4904 B = 6.5335 No. 8 10 0.6131 C = 3.686 No. 4 42 2.5748 Gmb = A/(B-C) = 2.27 3/8 in. 12 0.7357 1/2 in. 6 0.3678 Density = Gmb * 62.4 = 141.43 3/4 in. 0 0.0000 Air Voids = 7.4%
Sub total: 6.1306 Rice Wt.: 152.81 Group: *sat
AC -10 5.70% 0.3706
Total 6.5011 Initial After Cycling After GLWT
Weight in Air (A) 6.454 --- 6.454 Weight in Water (B) 3.736 --- 3.6845
SSD Weight (D) 6.5985 --- 6.5795 Volume (d-b)=E 2.8625 --- 2.895
ABS (d-a)=F 0.1445 --- 0.1255 Saturation F/ (E*voids) 67.8% --- 58.2%
Testing Date: 7/18/01
Testing Temperature: 115 F
Dial Indicator Reading (in) Rut Depths (in) Cycles LOC Center ROC LOC Center ROC
0 0.5105 0.577 0.5965 0 0 0
1000 0.424 0.4803 0.489 0.0865 0.0967 0.1075
4000 0.343 0.421 0.428 0.1675 0.156 0.1685
8000 0.3055 0.374 0.374 0.205 0.203 0.2225

88
Core #:: 13 Compaction Date: 7/13/01 Designation: AC-10 Compaction Procedure:
Mix Design: 1 28 gyrations Sieve % Retained Weight (lbs) using gyratory compactor.
Pan 12 0.7357 No. 50 4 0.2452 Initial Gmb Calculations: No. 30 6 0.3678 A = 6.4625 No. 16 8 0.4904 B = 6.53 No. 8 10 0.6131 C = 3.68 No. 4 42 2.5748 Gmb = A/(B-C) = 2.27 3/8 in. 12 0.7357 1/2 in. 6 0.3678 Density = Gmb * 62.4 = 141.49 3/4 in. 0 0.0000 Air Voids = 7.4%
Sub total: 6.1306 Rice Wt.: 152.81 Group: *sat
AC -10 5.70% 0.3706
Total 6.5011 Initial After Cycling After GLWT
Weight in Air (A) 6.4625 --- 6.4625 Weight in Water (B) 3.7365 --- 3.683
SSD Weight (D) 6.5965 --- 6.5795 Volume (d-b)=E 2.86 --- 2.8965
ABS (d-a)=F 0.134 --- 0.117 Saturation F/ (E*voids) 63.3% --- 54.5%
Testing Date: 7/19/01
Testing Temperature: 115 F
Dial Indicator Reading (in) Rut Depths (in) Cycles LOC Center ROC LOC Center ROC
0 0.538 0.571 0.574 0 0 0
1000 0.444 0.496 0.5115 0.094 0.075 0.0625
4000 0.389 0.419 0.4665 0.149 0.152 0.1075
8000 0.348 0.366 0.433 0.19 0.205 0.141

89
Core #:: 14 Compaction Date: 7/13/01 Designation: AC-10 Compaction Procedure:
Mix Design: 1 32 gyrations Sieve % Retained Weight (lbs) using gyratory compactor.
Pan 12 0.7357 No. 50 4 0.2452 Initial Gmb Calculations: No. 30 6 0.3678 A = 6.448 No. 16 8 0.4904 B = 6.531 No. 8 10 0.6131 C = 3.699 No. 4 42 2.5748 Gmb = A/(B-C) = 2.28 3/8 in. 12 0.7357 1/2 in. 6 0.3678 Density = Gmb * 62.4 = 142.07 3/4 in. 0 0.0000 Air Voids = 7.0%
Sub total: 6.1306 Rice Wt.: 152.81 Group: *sat
AC -10 5.70% 0.3706
Total 6.5011 Initial After Cycling After GLWT
Weight in Air (A) 6.448 --- 6.448 Weight in Water (B) 3.7415 --- 3.671
SSD Weight (D) 6.6035 --- 6.573 Volume (d-b)=E 2.862 --- 2.902
ABS (d-a)=F 0.1555 --- 0.125 Saturation F/ (E*voids) 77.3% --- 61.3%
Testing Date: 7/20/01
Testing Temperature: 115 F
Dial Indicator Reading (in) Rut Depths (in) Cycles LOC Center ROC LOC Center ROC
0 0.512 0.577 0.5905 0 0 0
1000 0.3775 0.466 0.5025 0.1345 0.111 0.088
4000 0.324 0.3875 0.4565 0.188 0.1895 0.134
8000 0.283 0.3295 0.408 0.229 0.2475 0.1825

90
Core #:: 16 Compaction Date: 7/20/01 Designation: AC-10 Compaction Procedure:
Mix Design: 2 52 gyrations Sieve % Retained Weight (lbs) using gyratory compactor.
Pan 12 0.7594 No. 50 4 0.2531 Initial Gmb Calculations: No. 30 6 0.3797 A = 6.6685 No. 16 8 0.5063 B = 6.7075 No. 8 10 0.6328 C = 3.834 No. 4 42 2.6579 Gmb = A/(B-C) = 2.32 3/8 in. 12 0.7594 1/2 in. 6 0.3797 Density = Gmb * 62.4 = 144.81 3/4 in. 0 0.0000 Air Voids = 5.2%
Sub total: 6.3283 Rice Wt.: 152.81 Group: 0
AC -10 5.70% 0.3825
Total 6.7108 Initial After Cycling After GLWT
Weight in Air (A) --- --- --- Weight in Water (B) --- --- ---
SSD Weight (D) --- --- --- Volume (d-b)=E --- --- ---
ABS (d-a)=F --- --- --- Saturation F/ (E*voids) --- --- ---
Testing Date: 7/25/01
Testing Temperature: 115 F
Dial Indicator Reading (in) Rut Depths (in) Cycles LOC Center ROC LOC Center ROC
0 0.548 0.55 0.535 0 0 0
1000 0.414 0.457 0.47 0.134 0.093 0.065
4000 0.359 0.412 0.439 0.189 0.138 0.096
8000 0.319 0.371 0.416 0.229 0.179 0.119

91
Core #:: 17 Compaction Date: 7/20/01 Designation: AC-10 Compaction Procedure:
Mix Design: 2 67 gyrations Sieve % Retained Weight (lbs) using gyratory compactor.
Pan 12 0.7594 No. 50 4 0.2531 Initial Gmb Calculations: No. 30 6 0.3797 A = 6.677 No. 16 8 0.5063 B = 6.723 No. 8 10 0.6328 C = 3.84 No. 4 42 2.6579 Gmb = A/(B-C) = 2.32 3/8 in. 12 0.7594 1/2 in. 6 0.3797 Density = Gmb * 62.4 = 144.52 3/4 in. 0 0.0000 Air Voids = 5.4%
Sub total: 6.3283 Rice Wt.: 152.81 Group: 0
AC -10 5.70% 0.3825
Total 6.7108 Initial After Cycling After GLWT
Weight in Air (A) --- --- --- Weight in Water (B) --- --- ---
SSD Weight (D) --- --- --- Volume (d-b)=E --- --- ---
ABS (d-a)=F --- --- --- Saturation F/ (E*voids) --- --- ---
Testing Date: 7/25/01
Testing Temperature: 115 F
Dial Indicator Reading (in) Rut Depths (in) Cycles LOC Center ROC LOC Center ROC
0 0.485 0.531 0.4805 0 0 0
1000 0.4285 0.492 0.435 0.0565 0.039 0.0455
4000 0.379 0.452 0.42 0.106 0.079 0.0605
8000 0.327 0.4 0.401 0.158 0.131 0.0795

92
Core #:: 23 Compaction Date: 8/28/01 Designation: AC-10 Compaction Procedure:
Mix Design: 1 24 gyrations Sieve % Retained Weight (lbs) using gyratory compactor.
Pan 12 0.7357 No. 50 4 0.2452 Initial Gmb Calculations: No. 30 6 0.3678 A = 6.476 No. 16 8 0.4904 B = 6.5595 No. 8 10 0.6131 C = 3.7215 No. 4 42 2.5748 Gmb = A/(B-C) = 2.28 3/8 in. 12 0.7357 1/2 in. 6 0.3678 Density = Gmb * 62.4 = 142.39 3/4 in. 0 0.0000 Air Voids = 6.8%
Sub total: 6.1306 Rice Wt.: 152.81 Group: 1
AC -10 5.70% 0.3706
Total 6.5011 Initial After Cycling After GLWT
Weight in Air (A) 6.476 6.476 6.476 Weight in Water (B) 3.7495 3.7465 3.709
SSD Weight (D) 6.5865 6.6075 6.5975 Volume (d-b)=E 2.837 2.861 2.8885
ABS (d-a)=F 0.1105 0.1315 0.1215 Saturation F/ (E*voids) 57.1% 67.4% 61.7%
Testing Date: 9/7/01
Testing Temperature: 115 F
Dial Indicator Reading (in) Rut Depths (in) Cycles LOC Center ROC LOC Center ROC
0 0.548 0.574 0.5725 0 0 0
1000 0.408 0.495 0.2945 0.14 0.079 0.278
4000 0.406 0.4565 0.261 0.142 0.1175 0.3115
8000 0.354 0.359 0.2115 0.194 0.215 0.361

93
Core #:: 24 Compaction Date: 8/28/01 Designation: AC-10 Compaction Procedure:
Mix Design: 1 21 gyrations Sieve % Retained Weight (lbs) using gyratory compactor.
Pan 12 0.7357 No. 50 4 0.2452 Initial Gmb Calculations: No. 30 6 0.3678 A = 6.471 No. 16 8 0.4904 B = 6.535 No. 8 10 0.6131 C = 3.714 No. 4 42 2.5748 Gmb = A/(B-C) = 2.29 3/8 in. 12 0.7357 1/2 in. 6 0.3678 Density = Gmb * 62.4 = 143.14 3/4 in. 0 0.0000 Air Voids = 6.3%
Sub total: 6.1306 Rice Wt.: 152.81 Group: 1
AC -10 5.70% 0.3706
Total 6.5011 Initial After Cycling After GLWT
Weight in Air (A) 6.471 6.471 6.471 Weight in Water (B) 3.752 3.745 3.7135
SSD Weight (D) 6.588 6.5945 6.5765 Volume (d-b)=E 2.836 2.8495 2.863
ABS (d-a)=F 0.117 0.1235 0.1055 Saturation F/ (E*voids) 65.2% 68.5% 58.2%
Testing Date: 9/7/01
Testing Temperature: 115 F
Dial Indicator Reading (in) Rut Depths (in) Cycles LOC Center ROC LOC Center ROC
0 0.535 0.579 0.582 0 0 0
1000 0.372 0.483 0.432 0.163 0.096 0.15
4000 0.221 0.433 0.372 0.314 0.146 0.21
8000 0.19 0.377 0.341 0.345 0.202 0.241

94
Core #:: 25 Compaction Date: 8/29/01 Designation: AC-10 Aged Compaction Procedure:
Mix Design: 1 22 gyrations Sieve % Retained Weight (lbs) using gyratory compactor.
Pan 12 0.7357 No. 50 4 0.2452 Initial Gmb Calculations: No. 30 6 0.3678 A = 6.47 No. 16 8 0.4904 B = 6.5445 No. 8 10 0.6131 C = 3.726 No. 4 42 2.5748 Gmb = A/(B-C) = 2.30 3/8 in. 12 0.7357 1/2 in. 6 0.3678 Density = Gmb * 62.4 = 143.24 3/4 in. 0 0.0000 Air Voids = 6.3%
Sub total: 6.1306 Rice Wt.: 152.81 Group: 0
AC -10 5.70% 0.3706
Total 6.5011 Initial After Cycling After GLWT
Weight in Air (A) --- --- --- Weight in Water (B) --- --- ---
SSD Weight (D) --- --- --- Volume (d-b)=E --- --- ---
ABS (d-a)=F --- --- --- Saturation F/ (E*voids) --- --- ---
Testing Date: 9/4/01
Testing Temperature: 115 F
Dial Indicator Reading (in) Rut Depths (in) Cycles LOC Center ROC LOC Center ROC
0 0.492 0.5 0.529 0 0 0
1000 0.445 0.432 0.484 0.047 0.068 0.045
4000 0.394 0.393 0.4415 0.098 0.107 0.0875
8000 0.354 0.357 0.3865 0.138 0.143 0.1425

95
Core #:: 27 Compaction Date: 8/29/01 Designation: AC-10 Aged Compaction Procedure:
Mix Design: 1 25 gyrations Sieve % Retained Weight (lbs) using gyratory compactor.
Pan 12 0.7357 No. 50 4 0.2452 Initial Gmb Calculations: No. 30 6 0.3678 A = 6.465 No. 16 8 0.4904 B = 6.5315 No. 8 10 0.6131 C = 3.716 No. 4 42 2.5748 Gmb = A/(B-C) = 2.30 3/8 in. 12 0.7357 1/2 in. 6 0.3678 Density = Gmb * 62.4 = 143.28 3/4 in. 0 0.0000 Air Voids = 6.2%
Sub total: 6.1306 Rice Wt.: 152.81 Group: 0
AC -10 5.70% 0.3706
Total 6.5011 Initial After Cycling After GLWT
Weight in Air (A) --- --- --- Weight in Water (B) --- --- ---
SSD Weight (D) --- --- --- Volume (d-b)=E --- --- ---
ABS (d-a)=F --- --- --- Saturation F/ (E*voids) --- --- ---
Testing Date: 9/5/01
Testing Temperature: 115 F
Dial Indicator Reading (in) Rut Depths (in) Cycles LOC Center ROC LOC Center ROC
0 0.487 0.518 0.5175 0 0 0
1000 0.452 0.48 0.462 0.035 0.038 0.0555
4000 0.423 0.4525 0.4255 0.064 0.0655 0.092
8000 0.3795 0.426 0.387 0.1075 0.092 0.1305

96
Core #:: 29 Compaction Date: 8/29/01 Designation: AC-10 Aged Compaction Procedure:
Mix Design: 1 29 gyrations Sieve % Retained Weight (lbs) using gyratory compactor.
Pan 12 0.7357 No. 50 4 0.2452 Initial Gmb Calculations: No. 30 6 0.3678 A = 6.487 No. 16 8 0.4904 B = 6.554 No. 8 10 0.6131 C = 3.725 No. 4 42 2.5748 Gmb = A/(B-C) = 2.29 3/8 in. 12 0.7357 1/2 in. 6 0.3678 Density = Gmb * 62.4 = 143.09 3/4 in. 0 0.0000 Air Voids = 6.4%
Sub total: 6.1306 Rice Wt.: 152.81 Group: 1
AC -10 5.70% 0.3706
Total 6.5011 Initial After Cycling After GLWT
Weight in Air (A) 6.487 6.487 6.487 Weight in Water (B) 3.79 3.76 3.7245
SSD Weight (D) 6.599 6.631 6.5895 Volume (d-b)=E 2.809 2.871 2.865
ABS (d-a)=F 0.112 0.144 0.1025 Saturation F/ (E*voids) 62.6% 78.8% 56.2%
Testing Date: 9/8/01
Testing Temperature: 115 F
Dial Indicator Reading (in) Rut Depths (in) Cycles LOC Center ROC LOC Center ROC
0 0.5545 0.574 0.562 0 0 0
1000 0.411 0.514 0.468 0.1435 0.06 0.094
4000 0.357 0.474 0.3975 0.1975 0.1 0.1645
8000 0.338 0.4135 0.3505 0.2165 0.1605 0.2115

97
Core #:: 30 Compaction Date: 8/29/01 Designation: AC-10 Aged Compaction Procedure:
Mix Design: 1 30 gyrations Sieve % Retained Weight (lbs) using gyratory compactor.
Pan 12 0.7357 No. 50 4 0.2452 Initial Gmb Calculations: No. 30 6 0.3678 A = 6.477 No. 16 8 0.4904 B = 6.5575 No. 8 10 0.6131 C = 3.731 No. 4 42 2.5748 Gmb = A/(B-C) = 2.29 3/8 in. 12 0.7357 1/2 in. 6 0.3678 Density = Gmb * 62.4 = 142.99 3/4 in. 0 0.0000 Air Voids = 6.4%
Sub total: 6.1306 Rice Wt.: 152.81 Group: 1
AC -10 5.70% 0.3706
Total 6.5011 Initial After Cycling After GLWT
Weight in Air (A) 6.477 6.477 6.477 Weight in Water (B) 3.781 3.754 3.716
SSD Weight (D) 6.6005 6.6105 6.5525 Volume (d-b)=E 2.8195 2.8565 2.8365
ABS (d-a)=F 0.1235 0.1335 0.0755 Saturation F/ (E*voids) 68.2% 72.7% 41.4%
Testing Date: 9/8/01
Testing Temperature: 115 F
Dial Indicator Reading (in) Rut Depths (in) Cycles LOC Center ROC LOC Center ROC
0 0.51 0.583 0.599 0 0 0
1000 0.413 0.504 0.511 0.097 0.079 0.088
4000 0.261 0.472 0.46 0.249 0.111 0.139
8000 0.223 0.4425 0.424 0.287 0.1405 0.175

98
Core #:: 31 Compaction Date: 9/11/01 Designation: AC-10 Aged Compaction Procedure:
Mix Design: 1 23 gyrations Sieve % Retained Weight (lbs) using gyratory compactor.
Pan 12 0.7357 No. 50 4 0.2452 Initial Gmb Calculations: No. 30 6 0.3678 A = 6.4345 No. 16 8 0.4904 B = 6.508 No. 8 10 0.6131 C = 3.704 No. 4 42 2.5748 Gmb = A/(B-C) = 2.29 3/8 in. 12 0.7357 1/2 in. 6 0.3678 Density = Gmb * 62.4 = 143.19 3/4 in. 0 0.0000 Air Voids = 6.3%
Sub total: 6.1306 Rice Wt.: 152.81 Group: sat*
AC -10 5.70% 0.3706
Total 6.5011 Initial After Cycling After GLWT
Weight in Air (A) 6.4345 --- --- Weight in Water (B) 3.741 --- ---
SSD Weight (D) 6.5525 --- --- Volume (d-b)=E 2.8115 --- ---
ABS (d-a)=F 0.118 --- --- Saturation F/ (E*voids) 66.7% --- ---
Testing Date: 9/12/01
Testing Temperature: 115 F
Dial Indicator Reading (in) Rut Depths (in) Cycles LOC Center ROC LOC Center ROC
0 0.535 0.5805 0.579 0 0 0
1000 0.4675 0.501 0.463 0.0675 0.0795 0.116
4000 0.4135 0.442 0.403 0.1215 0.1385 0.176
8000 0.34 0.359 0.3335 0.195 0.2215 0.2455

99
Core #:: 32 Compaction Date: 9/7/01 Designation: AC-10 Compaction Procedure:
Mix Design: 3 75 gyrations Sieve % Retained Weight (lbs) using gyratory compactor.
Pan 12 0.7762 No. 50 4 0.2587 Initial Gmb Calculations: No. 30 6 0.3881 A = 6.82 No. 16 8 0.5175 B = 6.835 No. 8 10 0.6469 C = 3.962 No. 4 42 2.7168 Gmb = A/(B-C) = 2.37 3/8 in. 12 0.7762 1/2 in. 6 0.3881 Density = Gmb * 62.4 = 148.13 3/4 in. 0 0.0000 Air Voids = 3.1%
Sub total: 6.4685 Rice Wt.: 152.81 Group: 0
AC -10 5.70% 0.3910
Total 6.8595 Initial After Cycling After GLWT
Weight in Air (A) --- --- --- Weight in Water (B) --- --- ---
SSD Weight (D) --- --- --- Volume (d-b)=E --- --- ---
ABS (d-a)=F --- --- --- Saturation F/ (E*voids) --- --- ---
Testing Date: 9/9/01
Testing Temperature: 115 F
Dial Indicator Reading (in) Rut Depths (in) Cycles LOC Center ROC LOC Center ROC
0 0.543 0.55 0.549 0 0 0
1000 0.4445 0.486 0.4785 0.0985 0.064 0.0705
4000 0.406 0.44 0.442 0.137 0.11 0.107
8000 0.369 0.421 0.4085 0.174 0.129 0.1405

100
Core #:: 33 Compaction Date: 9/7/01 Designation: AC-10 Compaction Procedure:
Mix Design: 3 83 gyrations Sieve % Retained Weight (lbs) using gyratory compactor.
Pan 12 0.7762 No. 50 4 0.2587 Initial Gmb Calculations: No. 30 6 0.3881 A = 6.819 No. 16 8 0.5175 B = 6.846 No. 8 10 0.6469 C = 3.9755 No. 4 42 2.7168 Gmb = A/(B-C) = 2.38 3/8 in. 12 0.7762 1/2 in. 6 0.3881 Density = Gmb * 62.4 = 148.23 3/4 in. 0 0.0000 Air Voids = 3.0%
Sub total: 6.4685 Rice Wt.: 152.81 Group: 0
AC -10 5.70% 0.3910
Total 6.8595 Initial After Cycling After GLWT
Weight in Air (A) --- --- --- Weight in Water (B) --- --- ---
SSD Weight (D) --- --- --- Volume (d-b)=E --- --- ---
ABS (d-a)=F --- --- --- Saturation F/ (E*voids) --- --- ---
Testing Date: 9/10/01
Testing Temperature: 115 F
Dial Indicator Reading (in) Rut Depths (in) Cycles LOC Center ROC LOC Center ROC
0 0.494 0.5345 0.534 0 0 0
1000 0.419 0.497 0.473 0.075 0.0375 0.061
4000 0.379 0.481 0.451 0.115 0.0535 0.083
8000 0.35 0.4715 0.427 0.144 0.063 0.107

101
Core #:: 34 Compaction Date: 9/7/01 Designation: AC-10 Compaction Procedure:
Mix Design: 3 81 gyrations Sieve % Retained Weight (lbs) using gyratory compactor.
Pan 12 0.7762 No. 50 4 0.2587 Initial Gmb Calculations: No. 30 6 0.3881 A = 6.818 No. 16 8 0.5175 B = 6.8455 No. 8 10 0.6469 C = 3.975 No. 4 42 2.7168 Gmb = A/(B-C) = 2.38 3/8 in. 12 0.7762 1/2 in. 6 0.3881 Density = Gmb * 62.4 = 148.21 3/4 in. 0 0.0000 Air Voids = 3.0%
Sub total: 6.4685 Rice Wt.: 152.81 Group: sat*
AC -10 5.70% 0.3910
Total 6.8595 Initial After Cycling After GLWT
Weight in Air (A) 6.818 --- --- Weight in Water (B) 4.018 --- ---
SSD Weight (D) 6.8795 --- --- Volume (d-b)=E 2.8615 --- ---
ABS (d-a)=F 0.0615 --- --- Saturation F/ (E*voids) 71.4% --- ---
Testing Date: 9/10/01
Testing Temperature: 115 F
Dial Indicator Reading (in) Rut Depths (in) Cycles LOC Center ROC LOC Center ROC
0 0.539 0.567 0.543 0 0 0
1000 0.49 0.51 0.4795 0.049 0.057 0.0635
4000 0.465 0.4852 0.434 0.074 0.0818 0.109
8000 0.461 0.472 0.42 0.078 0.095 0.123

102
Core #:: 37 Compaction Date: 9/7/01 Designation: AC-10 Compaction Procedure:
Mix Design: 3 --- gyrations Sieve % Retained Weight (lbs) using gyratory compactor.
Pan 12 0.7762 No. 50 4 0.2587 Initial Gmb Calculations: No. 30 6 0.3881 A = 6.8245 No. 16 8 0.5175 B = 6.857 No. 8 10 0.6469 C = 3.9705 No. 4 42 2.7168 Gmb = A/(B-C) = 2.36 3/8 in. 12 0.7762 1/2 in. 6 0.3881 Density = Gmb * 62.4 = 147.53 3/4 in. 0 0.0000 Air Voids = 3.5%
Sub total: 6.4685 Rice Wt.: 152.81 Group: 1
AC -10 5.70% 0.3910
Total 6.8595 Initial After Cycling After GLWT
Weight in Air (A) 6.8245 6.8245 --- Weight in Water (B) 4.011 4.002 ---
SSD Weight (D) 6.8855 6.902 --- Volume (d-b)=E 2.8745 2.9 ---
ABS (d-a)=F 0.061 0.0775 --- Saturation F/ (E*voids) 61.4% 77.3% ---
Testing Date: 9/11/01
Testing Temperature: 115 F
Dial Indicator Reading (in) Rut Depths (in) Cycles LOC Center ROC LOC Center ROC
0 0.505 0.548 0.556 0 0 0
1000 0.427 0.522 0.512 0.078 0.026 0.044
4000 0.392 0.51 0.4895 0.113 0.038 0.0665
8000 0.368 0.504 0.4695 0.137 0.044 0.0865

103
Core #:: 38 Compaction Date: 9/11/01 Designation: AC-10 Aged Compaction Procedure:
Mix Design: 3 88 gyrations Sieve % Retained Weight (lbs) using gyratory compactor.
Pan 12 0.7762 No. 50 4 0.2587 Initial Gmb Calculations: No. 30 6 0.3881 A = 6.8035 No. 16 8 0.5175 B = 6.8365 No. 8 10 0.6469 C = 3.965 No. 4 42 2.7168 Gmb = A/(B-C) = 2.37 3/8 in. 12 0.7762 1/2 in. 6 0.3881 Density = Gmb * 62.4 = 147.85 3/4 in. 0 0.0000 Air Voids = 3.2%
Sub total: 6.4685 Rice Wt.: 152.81 Group: 0
AC -10 5.70% 0.3910
Total 6.8595 Initial After Cycling After GLWT
Weight in Air (A) --- --- --- Weight in Water (B) --- --- ---
SSD Weight (D) --- --- --- Volume (d-b)=E --- --- ---
ABS (d-a)=F --- --- --- Saturation F/ (E*voids) --- --- ---
Testing Date: 9/14/01
Testing Temperature: 115 F
Dial Indicator Reading (in) Rut Depths (in) Cycles LOC Center ROC LOC Center ROC
0 0.484 0.537 0.545 0 0 0
1000 0.4295 0.509 0.491 0.0545 0.028 0.054
4000 0.4125 0.498 0.473 0.0715 0.039 0.072
8000 0.402 0.489 0.4575 0.082 0.048 0.0875

104
Core #:: 39 Compaction Date: 9/11/01 Designation: AC-10 Aged Compaction Procedure:
Mix Design: 3 92 gyrations Sieve % Retained Weight (lbs) using gyratory compactor.
Pan 12 0.7762 No. 50 4 0.2587 Initial Gmb Calculations: No. 30 6 0.3881 A = 6.798 No. 16 8 0.5175 B = 6.828 No. 8 10 0.6469 C = 3.961 No. 4 42 2.7168 Gmb = A/(B-C) = 2.37 3/8 in. 12 0.7762 1/2 in. 6 0.3881 Density = Gmb * 62.4 = 147.96 3/4 in. 0 0.0000 Air Voids = 3.2%
Sub total: 6.4685 Rice Wt.: 152.81 Group: 0
AC -10 5.70% 0.3910
Total 6.8595 Initial After Cycling After GLWT
Weight in Air (A) --- --- --- Weight in Water (B) --- --- ---
SSD Weight (D) --- --- --- Volume (d-b)=E --- --- ---
ABS (d-a)=F --- --- --- Saturation F/ (E*voids) --- --- ---
Testing Date: 9/15/01
Testing Temperature: 115 F
Dial Indicator Reading (in) Rut Depths (in) Cycles LOC Center ROC LOC Center ROC
0 0.486 0.525 0.524 0 0 0
1000 0.439 0.486 0.476 0.047 0.039 0.048
4000 0.4305 0.478 0.459 0.0555 0.047 0.065
8000 0.4125 0.4615 0.445 0.0735 0.0635 0.079

105
Core #:: 40 Compaction Date: 9/11/01 Designation: AC-10 Aged Compaction Procedure:
Mix Design: 3 76 gyrations Sieve % Retained Weight (lbs) using gyratory compactor.
Pan 12 0.7762 No. 50 4 0.2587 Initial Gmb Calculations: No. 30 6 0.3881 A = 6.7655 No. 16 8 0.5175 B = 6.796 No. 8 10 0.6469 C = 3.9325 No. 4 42 2.7168 Gmb = A/(B-C) = 2.36 3/8 in. 12 0.7762 1/2 in. 6 0.3881 Density = Gmb * 62.4 = 147.43 3/4 in. 0 0.0000 Air Voids = 3.5%
Sub total: 6.4685 Rice Wt.: 152.81 Group: sat*
AC -10 5.70% 0.3910
Total 6.8595 Initial After Cycling After GLWT
Weight in Air (A) 6.7655 --- --- Weight in Water (B) 3.989 --- ---
SSD Weight (D) 6.845 --- --- Volume (d-b)=E 2.856 --- ---
ABS (d-a)=F 0.0795 --- --- Saturation F/ (E*voids) 79.1% --- ---
Testing Date: 9/15/01
Testing Temperature: 115 F
Dial Indicator Reading (in) Rut Depths (in) Cycles LOC Center ROC LOC Center ROC
0 0.5065 0.5603 0.5785 0 0 0
1000 0.476 0.533 0.537 0.0305 0.0273 0.0415
4000 0.4585 0.514 0.515 0.048 0.0463 0.0635
8000 0.449 0.51 0.504 0.0575 0.0503 0.0745

106
Core #:: 41 Compaction Date: 9/11/01 Designation: AC-10 Aged Compaction Procedure:
Mix Design: 3 75 gyrations Sieve % Retained Weight (lbs) using gyratory compactor.
Pan 12 0.7762 No. 50 4 0.2587 Initial Gmb Calculations: No. 30 6 0.3881 A = 6.751 No. 16 8 0.5175 B = 6.791 No. 8 10 0.6469 C = 3.933 No. 4 42 2.7168 Gmb = A/(B-C) = 2.36 3/8 in. 12 0.7762 1/2 in. 6 0.3881 Density = Gmb * 62.4 = 147.40 3/4 in. 0 0.0000 Air Voids = 3.5%
Sub total: 6.4685 Rice Wt.: 152.81 Group: sat*
AC -10 5.70% 0.3910
Total 6.8595 Initial After Cycling After GLWT
Weight in Air (A) 6.751 --- --- Weight in Water (B) 3.967 --- ---
SSD Weight (D) 6.83 --- --- Volume (d-b)=E 2.863 --- ---
ABS (d-a)=F 0.079 --- --- Saturation F/ (E*voids) 77.9% --- ---
Testing Date: 9/17/01
Testing Temperature: 115 F
Dial Indicator Reading (in) Rut Depths (in) Cycles LOC Center ROC LOC Center ROC
0 0.538 0.567 0.5545 0 0 0
1000 0.495 0.541 0.513 0.043 0.026 0.0415
4000 0.457 0.522 0.481 0.081 0.045 0.0735
8000 0.4465 0.508 0.4675 0.0915 0.059 0.087

107
Core #:: 42 Compaction Date: 9/11/01 Designation: AC-10 Aged Compaction Procedure:
Mix Design: 3 90 gyrations Sieve % Retained Weight (lbs) using gyratory compactor.
Pan 12 0.7762 No. 50 4 0.2587 Initial Gmb Calculations: No. 30 6 0.3881 A = 6.7845 No. 16 8 0.5175 B = 6.8235 No. 8 10 0.6469 C = 3.9535 No. 4 42 2.7168 Gmb = A/(B-C) = 2.36 3/8 in. 12 0.7762 1/2 in. 6 0.3881 Density = Gmb * 62.4 = 147.51 3/4 in. 0 0.0000 Air Voids = 3.5%
Sub total: 6.4685 Rice Wt.: 152.81 Group: 1
AC -10 5.70% 0.3910
Total 6.8595 Initial After Cycling After GLWT
Weight in Air (A) 6.7845 6.7845 --- Weight in Water (B) 3.986 3.974 ---
SSD Weight (D) 6.855 6.855 --- Volume (d-b)=E 2.869 2.881 ---
ABS (d-a)=F 0.0705 0.0705 --- Saturation F/ (E*voids) 70.8% 70.5% ---
Testing Date: 9/16/01
Testing Temperature: 115 F
Dial Indicator Reading (in) Rut Depths (in) Cycles LOC Center ROC LOC Center ROC
0 0.545 0.569 0.5545 0 0 0
1000 0.465 0.533 0.512 0.08 0.036 0.0425
4000 0.43 0.512 0.503 0.115 0.057 0.0515
8000 0.4295 0.512 0.495 0.1155 0.057 0.0595

108
Core #:: 43 Compaction Date: 9/11/01 Designation: AC-10 Aged Compaction Procedure:
Mix Design: 3 114 gyrations Sieve % Retained Weight (lbs) using gyratory compactor.
Pan 12 0.7762 No. 50 4 0.2587 Initial Gmb Calculations: No. 30 6 0.3881 A = 6.7825 No. 16 8 0.5175 B = 6.818 No. 8 10 0.6469 C = 3.9535 No. 4 42 2.7168 Gmb = A/(B-C) = 2.37 3/8 in. 12 0.7762 1/2 in. 6 0.3881 Density = Gmb * 62.4 = 147.75 3/4 in. 0 0.0000 Air Voids = 3.3%
Sub total: 6.4685 Rice Wt.: 152.81 Group: 1
AC -10 5.70% 0.3910
Total 6.8595 Initial After Cycling After GLWT
Weight in Air (A) 6.7825 6.7825 --- Weight in Water (B) 3.989 3.984 ---
SSD Weight (D) 6.853 6.861 --- Volume (d-b)=E 2.864 2.877 ---
ABS (d-a)=F 0.0705 0.0785 --- Saturation F/ (E*voids) 74.3% 82.4% ---
Testing Date: 9/16/01
Testing Temperature: 115 F
Dial Indicator Reading (in) Rut Depths (in) Cycles LOC Center ROC LOC Center ROC
0 0.539 0.559 0.575 0 0 0
1000 0.5 0.518 0.512 0.039 0.041 0.063
4000 0.486 0.513 0.491 0.053 0.046 0.084
8000 0.48 0.509 0.4805 0.059 0.05 0.0945
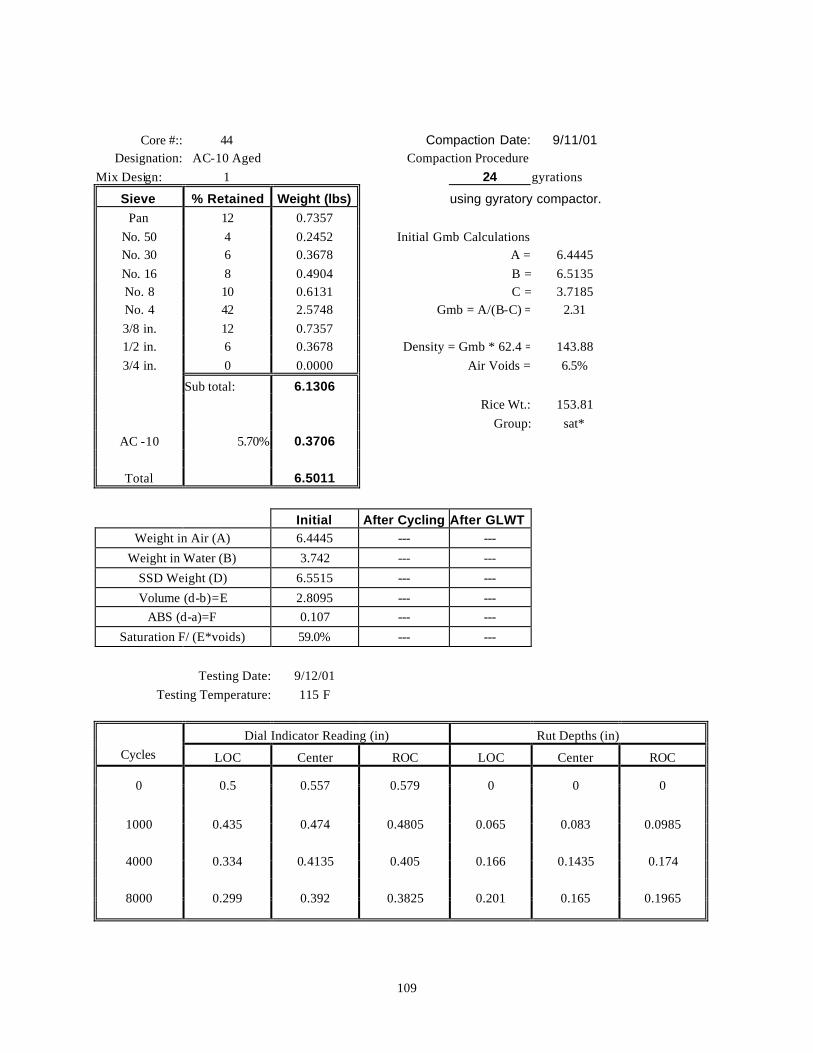
109
Core #:: 44 Compaction Date: 9/11/01 Designation: AC-10 Aged Compaction Procedure:
Mix Design: 1 24 gyrations Sieve % Retained Weight (lbs) using gyratory compactor.
Pan 12 0.7357 No. 50 4 0.2452 Initial Gmb Calculations: No. 30 6 0.3678 A = 6.4445 No. 16 8 0.4904 B = 6.5135 No. 8 10 0.6131 C = 3.7185 No. 4 42 2.5748 Gmb = A/(B-C) = 2.31 3/8 in. 12 0.7357 1/2 in. 6 0.3678 Density = Gmb * 62.4 = 143.88 3/4 in. 0 0.0000 Air Voids = 6.5%
Sub total: 6.1306 Rice Wt.: 153.81 Group: sat*
AC -10 5.70% 0.3706
Total 6.5011 Initial After Cycling After GLWT
Weight in Air (A) 6.4445 --- --- Weight in Water (B) 3.742 --- ---
SSD Weight (D) 6.5515 --- --- Volume (d-b)=E 2.8095 --- ---
ABS (d-a)=F 0.107 --- --- Saturation F/ (E*voids) 59.0% --- ---
Testing Date: 9/12/01
Testing Temperature: 115 F
Dial Indicator Reading (in) Rut Depths (in) Cycles LOC Center ROC LOC Center ROC
0 0.5 0.557 0.579 0 0 0
1000 0.435 0.474 0.4805 0.065 0.083 0.0985
4000 0.334 0.4135 0.405 0.166 0.1435 0.174
8000 0.299 0.392 0.3825 0.201 0.165 0.1965

110
Core #:: 50 Compaction Date: 9/18/01 Designation: AC-10 Lime Compaction Procedure:
Mix Design: 4 25 gyrations Sieve % Retained Weight (lbs) using gyratory compactor.
Pan 12 0.7447 No. 50 4 0.2482 Initial Gmb Calculations: No. 30 6 0.3724 A = 6.6515 No. 16 8 0.4965 B = 6.6775 No. 8 10 0.6206 C = 3.8215 No. 4 42 2.6066 Gmb = A/(B-C) = 2.33 3/8 in. 12 0.7447 1/2 in. 6 0.3724 Density = Gmb * 62.4 = 145.33 3/4 in. 0 0.0000 Air Voids = 4.6%
Sub total: 6.2062 Rice Wt.: 152.37 Group: 0
AC -10 5.70% 0.4761
Total 6.6823 Initial After Cycling After GLWT
Weight in Air (A) --- --- --- Weight in Water (B) --- --- ---
SSD Weight (D) --- --- --- Volume (d-b)=E --- --- ---
ABS (d-a)=F --- --- --- Saturation F/ (E*voids) --- --- ---
Testing Date: 10/1/01
Testing Temperature: 115 F
Dial Indicator Reading (in) Rut Depths (in) Cycles LOC Center ROC LOC Center ROC
0 0.465 0.5245 0.5275 0 0 0
1000 0.3775 0.456 0.474 0.0875 0.0685 0.0535
4000 0.322 0.419 0.415 0.143 0.1055 0.1125
8000 0.279 0.36 0.364 0.186 0.1645 0.1635

111
Core #:: 51 Compaction Date: 9/18/01 Designation: AC-10 Lime Compaction Procedure:
Mix Design: 4 27 gyrations Sieve % Retained Weight (lbs) using gyratory compactor.
Pan 12 0.7447 No. 50 4 0.2482 Initial Gmb Calculations: No. 30 6 0.3724 A = 6.6215 No. 16 8 0.4965 B = 6.653 No. 8 10 0.6206 C = 3.8015 No. 4 42 2.6066 Gmb = A/(B-C) = 2.32 3/8 in. 12 0.7447 1/2 in. 6 0.3724 Density = Gmb * 62.4 = 144.90 3/4 in. 0 0.0000 Air Voids = 4.9%
Sub total: 6.2062 Rice Wt.: 152.37 Group: 0
AC -10 5.70% 0.4761
Total 6.6823 Initial After Cycling After GLWT
Weight in Air (A) --- --- --- Weight in Water (B) --- --- ---
SSD Weight (D) --- --- --- Volume (d-b)=E --- --- ---
ABS (d-a)=F --- --- --- Saturation F/ (E*voids) --- --- ---
Testing Date: 10/1/01
Testing Temperature: 115 F
Dial Indicator Reading (in) Rut Depths (in) Cycles LOC Center ROC LOC Center ROC
0 0.4885 0.514 0.51 0 0 0
1000 0.382 0.4185 0.3875 0.1065 0.0955 0.1225
4000 0.311 0.3505 0.321 0.1775 0.1635 0.189
8000 0.289 0.315 0.286 0.1995 0.199 0.224

112
Core #:: 52 Compaction Date: 9/18/01 Designation: AC-10 Lime Compaction Procedure:
Mix Design: 5 15 gyrations Sieve % Retained Weight (lbs) using gyratory compactor.
Pan 12 0.7215 No. 50 4 0.2405 Initial Gmb Calculations: No. 30 6 0.3607 A = 6.439 No. 16 8 0.4810 B = 6.4855 No. 8 10 0.6012 C = 3.671 No. 4 42 2.5251 Gmb = A/(B-C) = 2.29 3/8 in. 12 0.7215 1/2 in. 6 0.3607 Density = Gmb * 62.4 = 142.76 3/4 in. 0 0.0000 Air Voids = 6.3%
Sub total: 6.0122 Rice Wt.: 152.37 Group: 0
AC -10 5.70% 0.4612
Total 6.4734 Initial After Cycling After GLWT
Weight in Air (A) --- --- --- Weight in Water (B) --- --- ---
SSD Weight (D) --- --- --- Volume (d-b)=E --- --- ---
ABS (d-a)=F --- --- --- Saturation F/ (E*voids) --- --- ---
Testing Date: 10/2/01
Testing Temperature: 115 F
Dial Indicator Reading (in) Rut Depths (in) Cycles LOC Center ROC LOC Center ROC
0 0.516 0.538 0.49 0 0 0
1000 0.342 0.412 0.3785 0.174 0.126 0.1115
4000 0.277 0.313 0.315 0.239 0.225 0.175
8000 0.212 0.197 0.234 0.304 0.341 0.256

113
Core #:: 53 Compaction Date: 9/18/01 Designation: AC-10 Lime Compaction Procedure:
Mix Design: 5 18 gyrations Sieve % Retained Weight (lbs) using gyratory compactor.
Pan 12 0.7215 No. 50 4 0.2405 Initial Gmb Calculations: No. 30 6 0.3607 A = 6.461 No. 16 8 0.4810 B = 6.508 No. 8 10 0.6012 C = 3.6835 No. 4 42 2.5251 Gmb = A/(B-C) = 2.29 3/8 in. 12 0.7215 1/2 in. 6 0.3607 Density = Gmb * 62.4 = 142.74 3/4 in. 0 0.0000 Air Voids = 6.3%
Sub total: 6.0122 Rice Wt.: 152.37 Group: 0
AC -10 5.70% 0.4612
Total 6.4734 Initial After Cycling After GLWT
Weight in Air (A) --- --- --- Weight in Water (B) --- --- ---
SSD Weight (D) --- --- --- Volume (d-b)=E --- --- ---
ABS (d-a)=F --- --- --- Saturation F/ (E*voids) --- --- ---
Testing Date: 10/2/01
Testing Temperature: 115 F
Dial Indicator Reading (in) Rut Depths (in) Cycles LOC Center ROC LOC Center ROC
0 0.486 0.518 0.515 0 0 0
1000 0.37 0.439 0.379 0.116 0.079 0.136
4000 0.306 0.377 0.312 0.18 0.141 0.203
8000 0.256 0.311 0.2865 0.23 0.207 0.2285
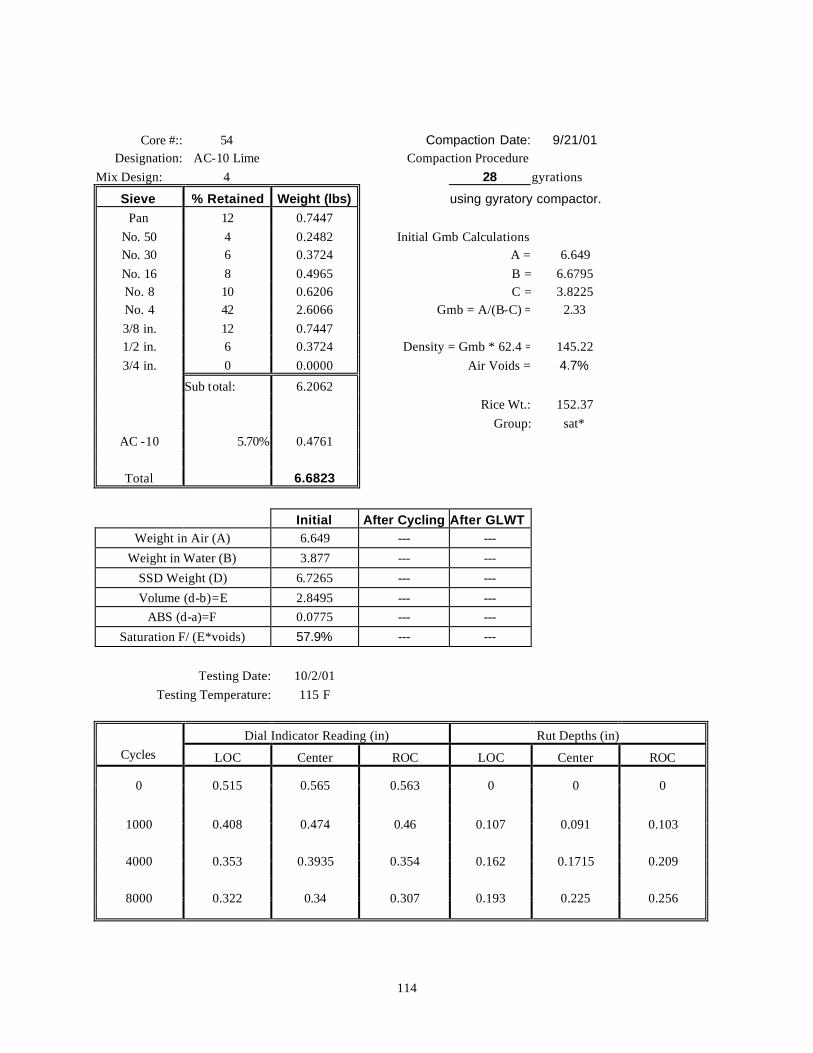
114
Core #:: 54 Compaction Date: 9/21/01 Designation: AC-10 Lime Compaction Procedure:
Mix Design: 4 28 gyrations Sieve % Retained Weight (lbs) using gyratory compactor.
Pan 12 0.7447 No. 50 4 0.2482 Initial Gmb Calculations: No. 30 6 0.3724 A = 6.649 No. 16 8 0.4965 B = 6.6795 No. 8 10 0.6206 C = 3.8225 No. 4 42 2.6066 Gmb = A/(B-C) = 2.33 3/8 in. 12 0.7447 1/2 in. 6 0.3724 Density = Gmb * 62.4 = 145.22 3/4 in. 0 0.0000 Air Voids = 4.7%
Sub total: 6.2062 Rice Wt.: 152.37 Group: sat*
AC -10 5.70% 0.4761
Total 6.6823 Initial After Cycling After GLWT
Weight in Air (A) 6.649 --- --- Weight in Water (B) 3.877 --- ---
SSD Weight (D) 6.7265 --- --- Volume (d-b)=E 2.8495 --- ---
ABS (d-a)=F 0.0775 --- --- Saturation F/ (E*voids) 57.9% --- ---
Testing Date: 10/2/01
Testing Temperature: 115 F
Dial Indicator Reading (in) Rut Depths (in) Cycles LOC Center ROC LOC Center ROC
0 0.515 0.565 0.563 0 0 0
1000 0.408 0.474 0.46 0.107 0.091 0.103
4000 0.353 0.3935 0.354 0.162 0.1715 0.209
8000 0.322 0.34 0.307 0.193 0.225 0.256

115
Core #:: 55 Compaction Date: 9/21/01 Designation: AC-10 Lime Compaction Procedure:
Mix Design: 4 27 gyrations Sieve % Retained Weight (lbs) using gyratory compactor.
Pan 12 0.7447 No. 50 4 0.2482 Initial Gmb Calculations: No. 30 6 0.3724 A = 6.6405 No. 16 8 0.4965 B = 6.6745 No. 8 10 0.6206 C = 3.8125 No. 4 42 2.6066 Gmb = A/(B-C) = 2.32 3/8 in. 12 0.7447 1/2 in. 6 0.3724 Density = Gmb * 62.4 = 144.78 3/4 in. 0 0.0000 Air Voids = 5.0%
Sub total: 6.2062 Rice Wt.: 152.37 Group: sat*
AC -10 5.70% 0.4761
Total 6.6823 Initial After Cycling After GLWT
Weight in Air (A) 6.6405 --- --- Weight in Water (B) 3.885 --- ---
SSD Weight (D) 6.7375 --- --- Volume (d-b)=E 2.8525 --- ---
ABS (d-a)=F 0.097 --- --- Saturation F/ (E*voids) 68.2% --- ---
Testing Date: 10/3/01
Testing Temperature: 115 F
Dial Indicator Reading (in) Rut Depths (in) Cycles LOC Center ROC LOC Center ROC
0 0.505 0.579 0.564 0 0 0
1000 0.41 0.513 0.4715 0.095 0.066 0.0925
4000 0.351 0.481 0.432 0.154 0.098 0.132
8000 0.318 0.4315 0.396 0.187 0.1475 0.168
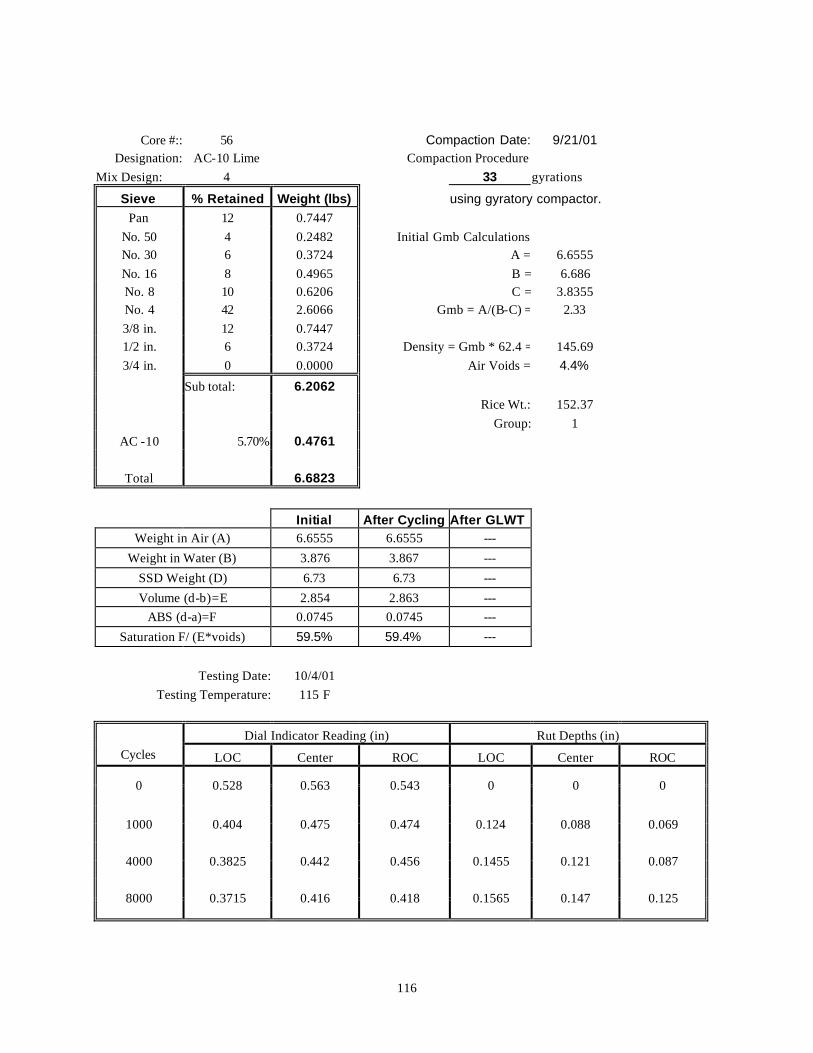
116
Core #:: 56 Compaction Date: 9/21/01 Designation: AC-10 Lime Compaction Procedure:
Mix Design: 4 33 gyrations Sieve % Retained Weight (lbs) using gyratory compactor.
Pan 12 0.7447 No. 50 4 0.2482 Initial Gmb Calculations: No. 30 6 0.3724 A = 6.6555 No. 16 8 0.4965 B = 6.686 No. 8 10 0.6206 C = 3.8355 No. 4 42 2.6066 Gmb = A/(B-C) = 2.33 3/8 in. 12 0.7447 1/2 in. 6 0.3724 Density = Gmb * 62.4 = 145.69 3/4 in. 0 0.0000 Air Voids = 4.4%
Sub total: 6.2062 Rice Wt.: 152.37 Group: 1
AC -10 5.70% 0.4761
Total 6.6823 Initial After Cycling After GLWT
Weight in Air (A) 6.6555 6.6555 --- Weight in Water (B) 3.876 3.867 ---
SSD Weight (D) 6.73 6.73 --- Volume (d-b)=E 2.854 2.863 ---
ABS (d-a)=F 0.0745 0.0745 --- Saturation F/ (E*voids) 59.5% 59.4% ---
Testing Date: 10/4/01
Testing Temperature: 115 F
Dial Indicator Reading (in) Rut Depths (in) Cycles LOC Center ROC LOC Center ROC
0 0.528 0.563 0.543 0 0 0
1000 0.404 0.475 0.474 0.124 0.088 0.069
4000 0.3825 0.442 0.456 0.1455 0.121 0.087
8000 0.3715 0.416 0.418 0.1565 0.147 0.125

117
Core #:: 57 Compaction Date: 9/21/01 Designation: AC-10 Lime Compaction Procedure:
Mix Design: 4 57 gyrations Sieve % Retained Weight (lbs) using gyratory compactor.
Pan 12 0.7447 No. 50 4 0.2482 Initial Gmb Calculations: No. 30 6 0.3724 A = 6.611 No. 16 8 0.4965 B = 6.6485 No. 8 10 0.6206 C = 3.799 No. 4 42 2.6066 Gmb = A/(B-C) = 2.32 3/8 in. 12 0.7447 1/2 in. 6 0.3724 Density = Gmb * 62.4 = 144.77 3/4 in. 0 0.0000 Air Voids = 5.0%
Sub total: 6.2062 Rice Wt.: 152.37 Group: 1
AC -10 5.70% 0.4761
Total 6.6823 Initial After Cycling After GLWT
Weight in Air (A) 6.611 6.611 --- Weight in Water (B) 3.8565 3.833 ---
SSD Weight (D) 6.6965 6.7085 --- Volume (d-b)=E 2.84 2.8755 ---
ABS (d-a)=F 0.0855 0.0975 --- Saturation F/ (E*voids) 60.3% 68.0% ---
Testing Date: 10/4/01
Testing Temperature: 115 F
Dial Indicator Reading (in) Rut Depths (in) Cycles LOC Center ROC LOC Center ROC
0 0.539 0.584 0.584 0 0 0
1000 0.415 0.488 0.489 0.124 0.096 0.095
4000 0.366 0.447 0.451 0.173 0.137 0.133
8000 0.325 0.409 0.411 0.214 0.175 0.173
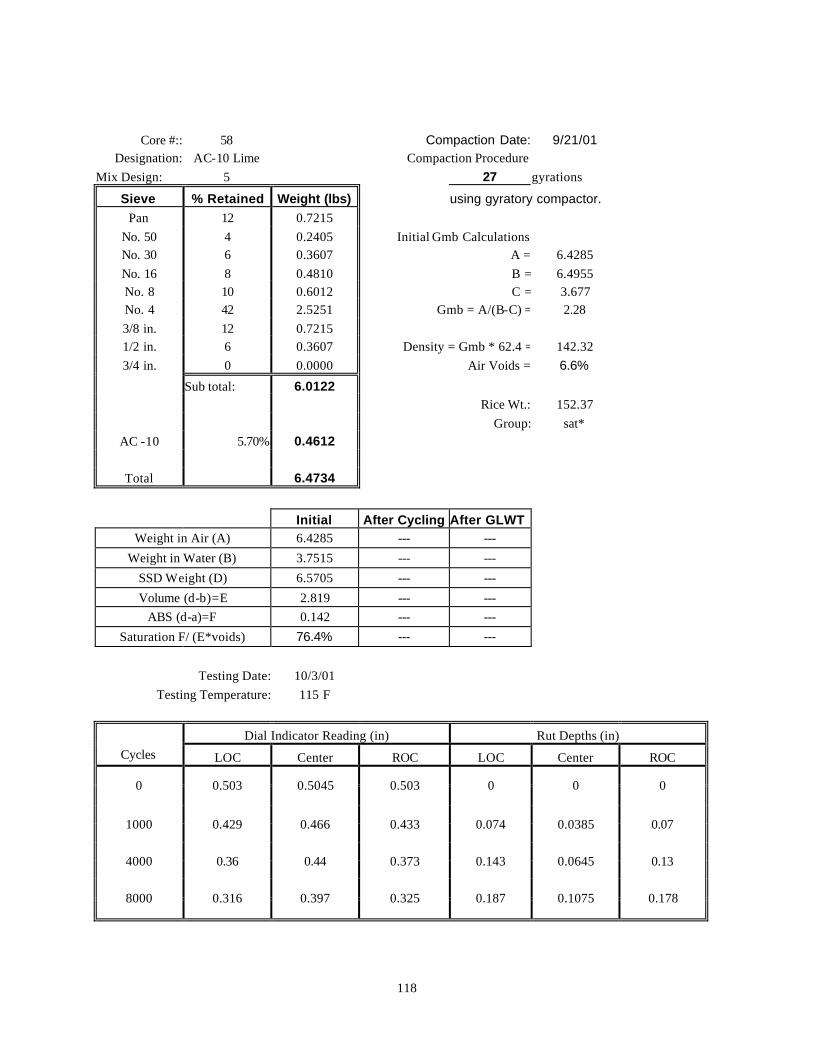
118
Core #:: 58 Compaction Date: 9/21/01 Designation: AC-10 Lime Compaction Procedure:
Mix Design: 5 27 gyrations Sieve % Retained Weight (lbs) using gyratory compactor.
Pan 12 0.7215 No. 50 4 0.2405 Initial Gmb Calculations: No. 30 6 0.3607 A = 6.4285 No. 16 8 0.4810 B = 6.4955 No. 8 10 0.6012 C = 3.677 No. 4 42 2.5251 Gmb = A/(B-C) = 2.28 3/8 in. 12 0.7215 1/2 in. 6 0.3607 Density = Gmb * 62.4 = 142.32 3/4 in. 0 0.0000 Air Voids = 6.6%
Sub total: 6.0122 Rice Wt.: 152.37 Group: sat*
AC -10 5.70% 0.4612
Total 6.4734 Initial After Cycling After GLWT
Weight in Air (A) 6.4285 --- --- Weight in Water (B) 3.7515 --- ---
SSD Weight (D) 6.5705 --- --- Volume (d-b)=E 2.819 --- ---
ABS (d-a)=F 0.142 --- --- Saturation F/ (E*voids) 76.4% --- ---
Testing Date: 10/3/01
Testing Temperature: 115 F
Dial Indicator Reading (in) Rut Depths (in) Cycles LOC Center ROC LOC Center ROC
0 0.503 0.5045 0.503 0 0 0
1000 0.429 0.466 0.433 0.074 0.0385 0.07
4000 0.36 0.44 0.373 0.143 0.0645 0.13
8000 0.316 0.397 0.325 0.187 0.1075 0.178

119
Core #:: 59 Compaction Date: 9/21/01 Designation: AC-10 Lime Compaction Procedure:
Mix Design: 5 23 gyrations Sieve % Retained Weight (lbs) using gyratory compactor.
Pan 12 0.7215 No. 50 4 0.2405 Initial Gmb Calculations: No. 30 6 0.3607 A = 6.4225 No. 16 8 0.4810 B = 6.4835 No. 8 10 0.6012 C = 3.667 No. 4 42 2.5251 Gmb = A/(B-C) = 2.28 3/8 in. 12 0.7215 1/2 in. 6 0.3607 Density = Gmb * 62.4 = 142.29 3/4 in. 0 0.0000 Air Voids = 6.6%
Sub total: 6.0122 Rice Wt.: 152.37 Group: sat*
AC -10 5.70% 0.4612
Total 6.4734 Initial After Cycling After GLWT
Weight in Air (A) 6.4225 --- --- Weight in Water (B) 3.7055 --- ---
SSD Weight (D) 6.5315 --- --- Volume (d-b)=E 2.826 --- ---
ABS (d-a)=F 0.109 --- --- Saturation F/ (E*voids) 58.3% --- ---
Testing Date: 10/8/01
Testing Temperature: 115 F
Dial Indicator Reading (in) Rut Depths (in) Cycles LOC Center ROC LOC Center ROC
0 0.549 0.578 0.586 0 0 0
1000 0.452 0.492 0.475 0.097 0.086 0.111
4000 0.373 0.411 0.376 0.176 0.167 0.21
8000 0.292 0.309 0.297 0.257 0.269 0.289

120
Core #:: 60 Compaction Date: 9/21/01 Designation: AC-10 Lime Compaction Procedure:
Mix Design: 5 28 gyrations Sieve % Retained Weight (lbs) using gyratory compactor.
Pan 12 0.7215 No. 50 4 0.2405 Initial Gmb Calculations: No. 30 6 0.3607 A = 6.4365 No. 16 8 0.4810 B = 6.4975 No. 8 10 0.6012 C = 3.6735 No. 4 42 2.5251 Gmb = A/(B-C) = 2.28 3/8 in. 12 0.7215 1/2 in. 6 0.3607 Density = Gmb * 62.4 = 142.22 3/4 in. 0 0.0000 Air Voids = 6.7%
Sub total: 6.0122 Rice Wt.: 152.37 Group: 1
AC -10 5.70% 0.4612
Total 6.4734 Initial After Cycling After GLWT
Weight in Air (A) 6.4365 6.4365 --- Weight in Water (B) 3.729 3.718 ---
SSD Weight (D) 6.559 6.564 --- Volume (d-b)=E 2.83 2.846 ---
ABS (d-a)=F 0.1225 0.1275 --- Saturation F/ (E*voids) 65.0% 67.2% ---
Testing Date: 10/5/01
Testing Temperature: 115 F
Dial Indicator Reading (in) Rut Depths (in) Cycles LOC Center ROC LOC Center ROC
0 0.521 0.58 0.5795 0 0 0
1000 0.391 0.469 0.421 0.13 0.111 0.1585
4000 0.35 0.419 0.366 0.171 0.161 0.2135
8000 0.313 0.341 0.317 0.208 0.239 0.2625

121
Core #:: 61 Compaction Date: 9/21/01 Designation: AC-10 Lime Compaction Procedure:
Mix Design: 5 23 gyrations Sieve % Retained Weight (lbs) using gyratory compactor.
Pan 12 0.7215 No. 50 4 0.2405 Initial Gmb Calculations: No. 30 6 0.3607 A = 6.4495 No. 16 8 0.4810 B = 6.51 No. 8 10 0.6012 C = 3.6885 No. 4 42 2.5251 Gmb = A/(B-C) = 2.29 3/8 in. 12 0.7215 1/2 in. 6 0.3607 Density = Gmb * 62.4 = 142.64 3/4 in. 0 0.0000 Air Voids = 6.4%
Sub total: 6.0122 Rice Wt.: 152.37 Group: 1
AC -10 5.70% 0.4612
Total 6.4734 Initial After Cycling After GLWT
Weight in Air (A) 6.4495 6.4495 --- Weight in Water (B) 3.7315 3.713 ---
SSD Weight (D) 6.5615 6.557 --- Volume (d-b)=E 2.83 2.844 ---
ABS (d-a)=F 0.112 0.1075 --- Saturation F/ (E*voids) 61.9% 59.1% ---
Testing Date: 10/5/01
Testing Temperature: 115 F
Dial Indicator Reading (in) Rut Depths (in) Cycles LOC Center ROC LOC Center ROC
0 0.521 0.567 0.557 0 0 0
1000 0.3825 0.449 0.459 0.1385 0.118 0.098
4000 0.299 0.369 0.403 0.222 0.198 0.154
8000 0.248 0.288 0.37 0.273 0.279 0.187

122
Core #:: 62 Compaction Date: 10/3/01 Designation: AC-10 Compaction Procedure:
Mix Design: 3 82 gyrations Sieve % Retained Weight (lbs) using gyratory compactor.
Pan 12 0.7762 No. 50 4 0.2587 Initial Gmb Calculations: No. 30 6 0.3881 A = 6.783 No. 16 8 0.5175 B = 6.8185 No. 8 10 0.6469 C = 3.946 No. 4 42 2.7168 Gmb = A/(B-C) = 2.36 3/8 in. 12 0.7762 1/2 in. 6 0.3881 Density = Gmb * 62.4 = 147.35 3/4 in. 0 0.0000 Air Voids = 3.6%
Sub total: 6.4685 Rice Wt.: 152.81 Group: 1
AC -10 5.70% 0.3910
Total 6.8595 Initial After Cycling After GLWT
Weight in Air (A) 6.783 6.783 --- Weight in Water (B) 3.9755 3.9685 ---
SSD Weight (D) 6.85 6.864 --- Volume (d-b)=E 2.8745 2.8955 ---
ABS (d-a)=F 0.067 0.081 --- Saturation F/ (E*voids) 65.2% 78.3% ---
Testing Date: 10/10/01
Testing Temperature: 115 F
Dial Indicator Reading (in) Rut Depths (in) Cycles LOC Center ROC LOC Center ROC
0 0.472 0.567 0.58 0 0 0
1000 0.361 0.489 0.51 0.111 0.078 0.07
4000 0.336 0.464 0.4945 0.136 0.103 0.0855
8000 0.329 0.425 0.464 0.143 0.142 0.116

123
Core #:: 63 Compaction Date: 10/3/01 Designation: AC-10 Compaction Procedure:
Mix Design: 3 62 gyrations Sieve % Retained Weight (lbs) using gyratory compactor.
Pan 12 0.7762 No. 50 4 0.2587 Initial Gmb Calculations: No. 30 6 0.3881 A = 6.722 No. 16 8 0.5175 B = 6.762 No. 8 10 0.6469 C = 3.894 No. 4 42 2.7168 Gmb = A/(B-C) = 2.34 3/8 in. 12 0.7762 1/2 in. 6 0.3881 Density = Gmb * 62.4 = 146.25 3/4 in. 0 0.0000 Air Voids = 4.3%
Sub total: 6.4685 Rice Wt.: 152.81 Group: 0
AC -10 5.70% 0.3910
Total 6.8595 Initial After Cycling After GLWT
Weight in Air (A) --- --- --- Weight in Water (B) --- --- ---
SSD Weight (D) --- --- --- Volume (d-b)=E --- --- ---
ABS (d-a)=F --- --- --- Saturation F/ (E*voids) --- --- ---
Testing Date: 10/9/01
Testing Temperature: 115 F
Dial Indicator Reading (in) Rut Depths (in) Cycles LOC Center ROC LOC Center ROC
0 0.4805 0.533 0.5365 0 0 0
1000 0.4005 0.476 0.466 0.08 0.057 0.0705
4000 0.426 0.441 0.432 0.0545 0.092 0.1045
8000 0.419 0.3785 0.399 0.0615 0.1545 0.1375
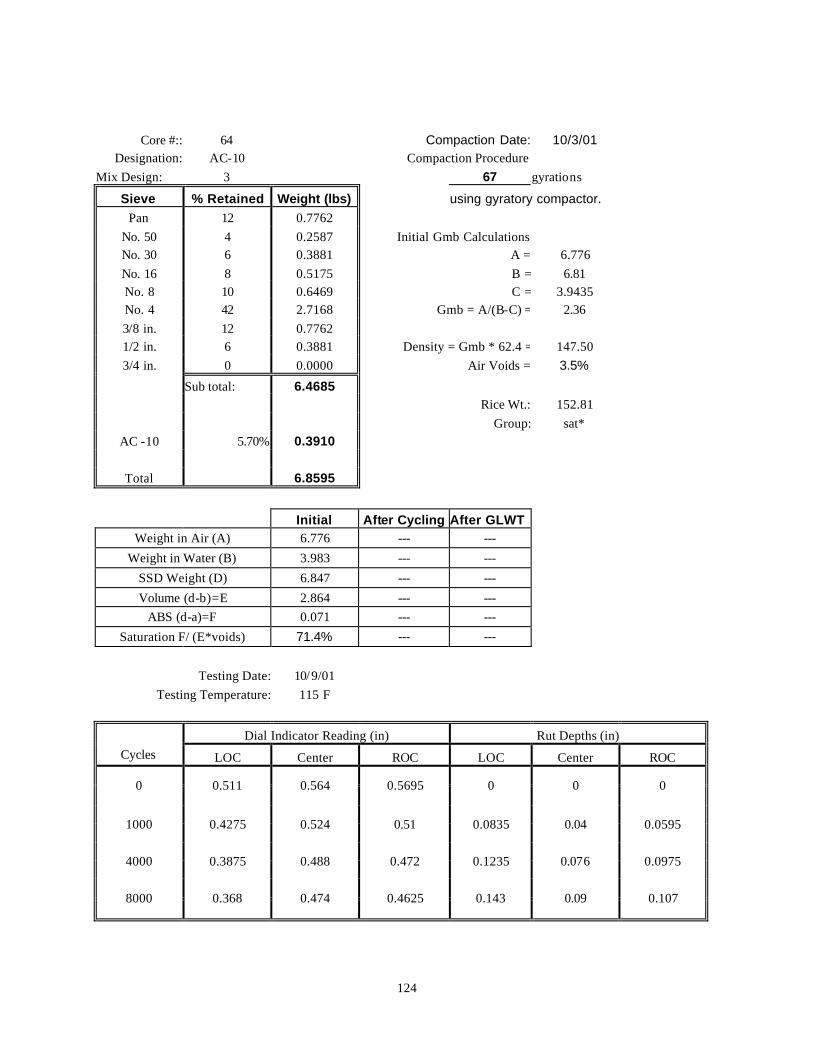
124
Core #:: 64 Compaction Date: 10/3/01 Designation: AC-10 Compaction Procedure:
Mix Design: 3 67 gyrations Sieve % Retained Weight (lbs) using gyratory compactor.
Pan 12 0.7762 No. 50 4 0.2587 Initial Gmb Calculations: No. 30 6 0.3881 A = 6.776 No. 16 8 0.5175 B = 6.81 No. 8 10 0.6469 C = 3.9435 No. 4 42 2.7168 Gmb = A/(B-C) = 2.36 3/8 in. 12 0.7762 1/2 in. 6 0.3881 Density = Gmb * 62.4 = 147.50 3/4 in. 0 0.0000 Air Voids = 3.5%
Sub total: 6.4685 Rice Wt.: 152.81 Group: sat*
AC -10 5.70% 0.3910
Total 6.8595 Initial After Cycling After GLWT
Weight in Air (A) 6.776 --- --- Weight in Water (B) 3.983 --- ---
SSD Weight (D) 6.847 --- --- Volume (d-b)=E 2.864 --- ---
ABS (d-a)=F 0.071 --- --- Saturation F/ (E*voids) 71.4% --- ---
Testing Date: 10/9/01
Testing Temperature: 115 F
Dial Indicator Reading (in) Rut Depths (in) Cycles LOC Center ROC LOC Center ROC
0 0.511 0.564 0.5695 0 0 0
1000 0.4275 0.524 0.51 0.0835 0.04 0.0595
4000 0.3875 0.488 0.472 0.1235 0.076 0.0975
8000 0.368 0.474 0.4625 0.143 0.09 0.107

125
Core #:: 66 Compaction Date: 10/19/01 Designation: AC-10 Lime Compaction Procedure:
Mix Design: 5 22 gyrations Sieve % Retained Weight (lbs) using gyratory compactor.
Pan 12 0.7215 No. 50 4 0.2405 Initial Gmb Calculations: No. 30 6 0.3607 A = 6.4335 No. 16 8 0.4810 B = 6.5035 No. 8 10 0.6012 C = 3.69 No. 4 42 2.5251 Gmb = A/(B-C) = 2.29 3/8 in. 12 0.7215 1/2 in. 6 0.3607 Density = Gmb * 62.4 = 142.69 3/4 in. 0 0.0000 Air Voids = 6.4%
Sub total: 6.0122 Rice Wt.: 152.37 Group: sat*
AC -10 5.70% 0.4612
Total 6.4734 Initial After Cycling After GLWT
Weight in Air (A) 6.4335 --- --- Weight in Water (B) 3.7495 --- ---
SSD Weight (D) 6.565 --- --- Volume (d-b)=E 2.8155 --- ---
ABS (d-a)=F 0.1315 --- --- Saturation F/ (E*voids) 73.5% --- ---
Testing Date: 10/21/01
Testing Temperature: 115 F
Dial Indicator Reading (in) Rut Depths (in) Cycles LOC Center ROC LOC Center ROC
0 0.5195 0.566 0.6095 0 0 0
1000 0.444 0.4845 0.519 0.0755 0.0815 0.0905
4000 0.376 0.4405 0.4765 0.1435 0.1255 0.133
8000 0.3265 0.3755 0.42 0.193 0.1905 0.1895

126
Core #:: 67 Compaction Date: 10/19/01 Designation: AC-10 Lime Compaction Procedure:
Mix Design: 5 15 gyrations Sieve % Retained Weight (lbs) using gyratory compactor.
Pan 12 0.7215 No. 50 4 0.2405 Initial Gmb Calculations: No. 30 6 0.3607 A = 6.3775 No. 16 8 0.4810 B = 6.46 No. 8 10 0.6012 C = 3.629 No. 4 42 2.5251 Gmb = A/(B-C) = 2.25 3/8 in. 12 0.7215 1/2 in. 6 0.3607 Density = Gmb * 62.4 = 140.57 3/4 in. 0 0.0000 Air Voids = 7.7%
Sub total: 6.0122 Rice Wt.: 152.37 Group: 0
AC -10 5.70% 0.4612
Total 6.4734 Initial After Cycling After GLWT
Weight in Air (A) --- --- --- Weight in Water (B) --- --- ---
SSD Weight (D) --- --- --- Volume (d-b)=E --- --- ---
ABS (d-a)=F --- --- --- Saturation F/ (E*voids) --- --- ---
Testing Date: 10/2/01
Testing Temperature: 115 F
Dial Indicator Reading (in) Rut Depths (in) Cycles LOC Center ROC LOC Center ROC
0 0.4895 0.5365 0.5445 0 0 0
1000 0.397 0.431 0.4315 0.0925 0.1055 0.113
4000 0.31 0.294 0.3255 0.1795 0.2425 0.219
8000 0.224 0.155 0.22 0.2655 0.3815 0.3245

127
Core #:: 68 Compaction Date: 10/19/01 Designation: AC-10 Compaction Procedure:
Mix Design: 1 21 gyrations Sieve % Retained Weight (lbs) using gyratory compactor.
Pan 12 0.7357 No. 50 4 0.2452 Initial Gmb Calculations: No. 30 6 0.3678 A = 6.41 No. 16 8 0.4904 B = 6.4895 No. 8 10 0.6131 C = 3.6765 No. 4 42 2.5748 Gmb = A/(B-C) = 2.28 3/8 in. 12 0.7357 1/2 in. 6 0.3678 Density = Gmb * 62.4 = 142.19 3/4 in. 0 0.0000 Air Voids = 6.9%
Sub total: 6.1306 Rice Wt.: 152.81 Group: 0
AC -10 5.70% 0.3706
Total 6.5011 Initial After Cycling After GLWT
Weight in Air (A) --- --- --- Weight in Water (B) --- --- ---
SSD Weight (D) --- --- --- Volume (d-b)=E --- --- ---
ABS (d-a)=F --- --- --- Saturation F/ (E*voids) --- --- ---
Testing Date: 10/20/01
Testing Temperature: 115 F
Dial Indicator Reading (in) Rut Depths (in) Cycles LOC Center ROC LOC Center ROC
0 0.484 0.541 0.546 0 0 0
1000 0.345 0.454 0.3915 0.139 0.087 0.1545
4000 0.2765 0.286 0.234 0.2075 0.255 0.312
8000 0.215 0.142 0.162 0.269 0.399 0.384

128

129
APPENDIX D
Phase I Indirect Tensile Strength Graphs
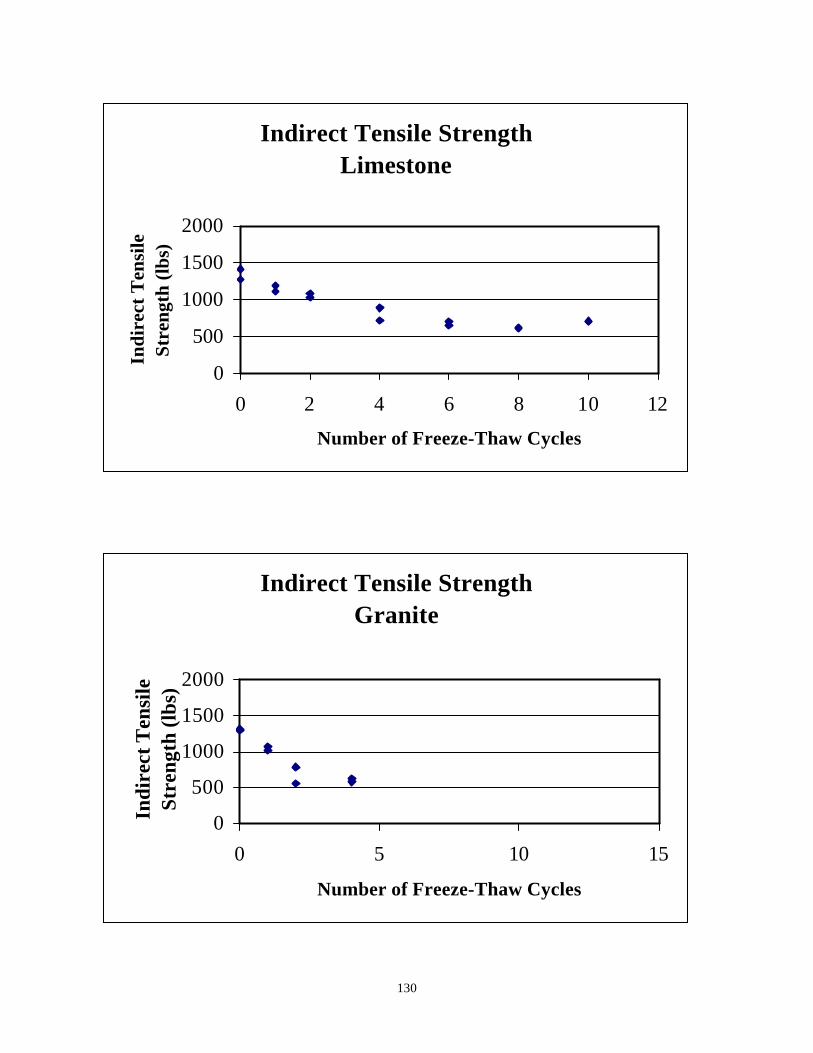
130
Indirect Tensile StrengthLimestone
0
500
1000
1500
2000
0 2 4 6 8 10 12
Number of Freeze-Thaw Cycles
Indi
rect
Ten
sile
St
reng
th (l
bs)
Indirect Tensile StrengthGranite
0
500
1000
1500
2000
0 5 10 15
Number of Freeze-Thaw Cycles
Indi
rect
Ten
sile
St
reng
th (l
bs)
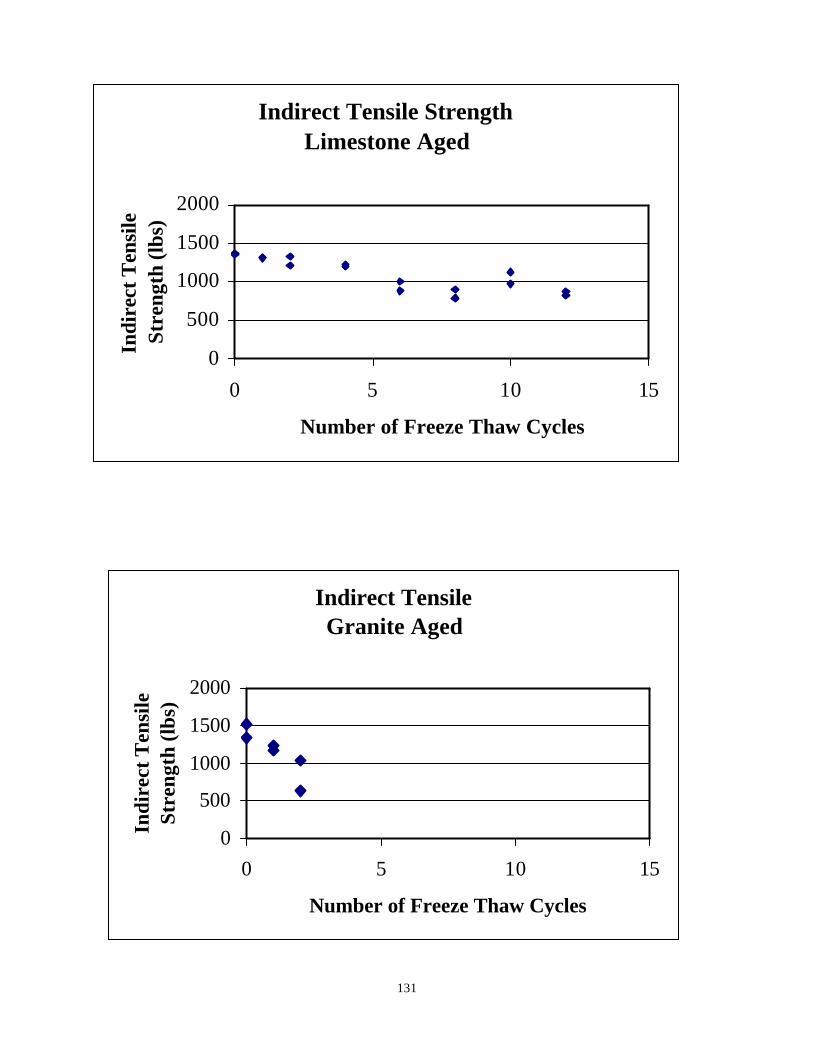
131
Indirect Tensile StrengthLimestone Aged
0
500
1000
1500
2000
0 5 10 15
Number of Freeze Thaw Cycles
Indi
rect
Ten
sile
St
reng
th (l
bs)
Indirect TensileGranite Aged
0
500
1000
1500
2000
0 5 10 15
Number of Freeze Thaw Cycles
Indi
rect
Ten
sile
St
reng
th (l
bs)
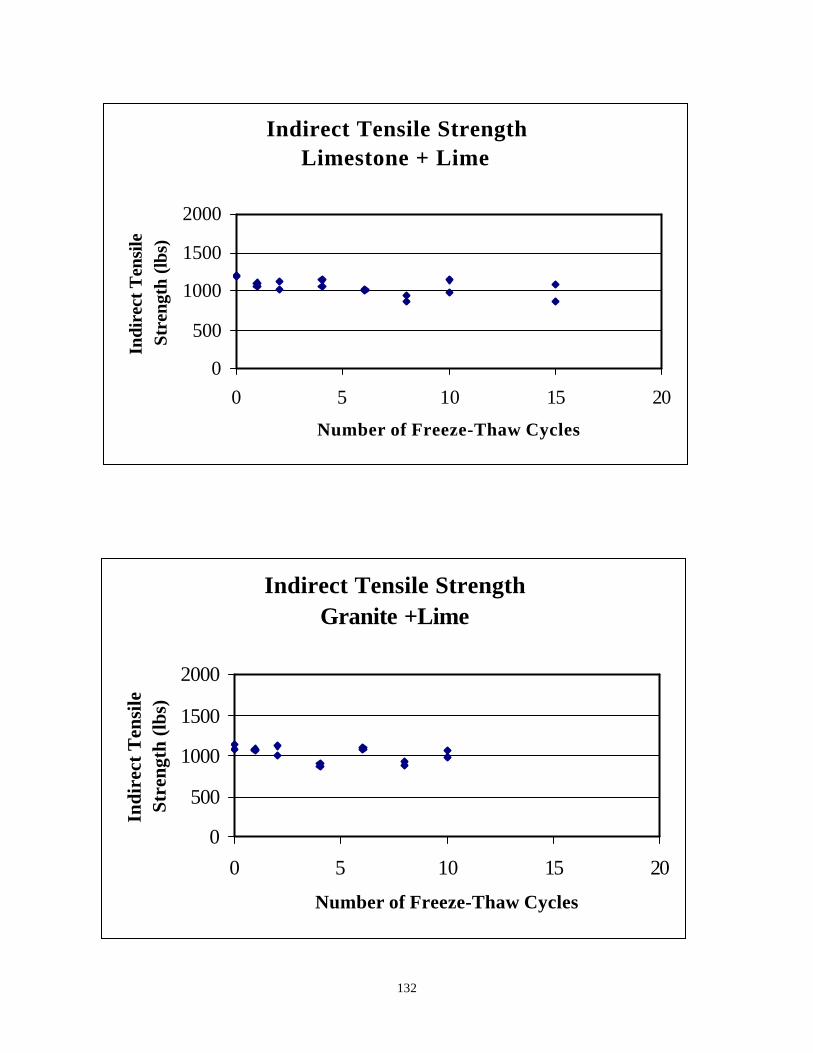
132
Indirect Tensile StrengthLimestone + Lime
0
500
1000
1500
2000
0 5 10 15 20
Number of Freeze-Thaw Cycles
Indi
rect
Ten
sile
St
reng
th (l
bs)
Indirect Tensile StrengthGranite +Lime
0
500
1000
1500
2000
0 5 10 15 20
Number of Freeze-Thaw Cycles
Indi
rect
Ten
sile
St
reng
th (l
bs)
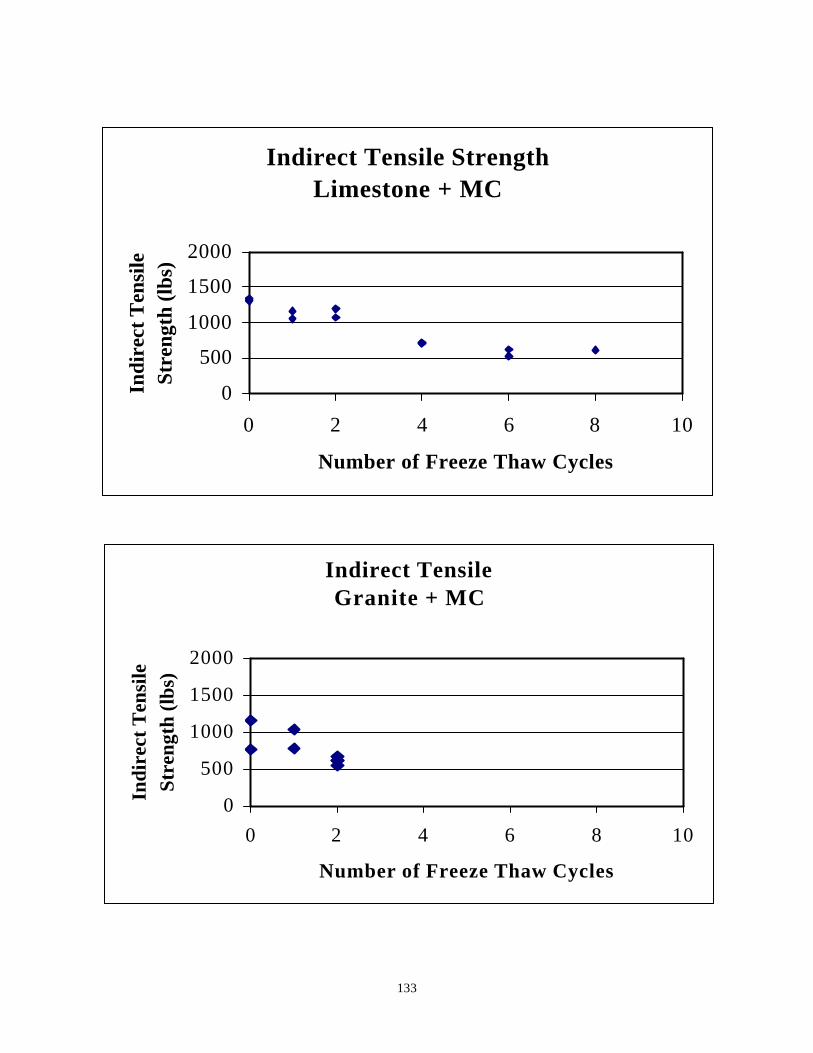
133
Indirect Tensile StrengthLimestone + MC
0
500
1000
1500
2000
0 2 4 6 8 10
Number of Freeze Thaw Cycles
Indi
rect
Ten
sile
St
reng
th (l
bs)
Indirect TensileGranite + MC
0
500
1000
1500
2000
0 2 4 6 8 10
Number of Freeze Thaw Cycles
Indi
rect
Ten
sile
St
reng
th (l
bs)

134

135
APPENDIX E
Phase I TSR Graphs
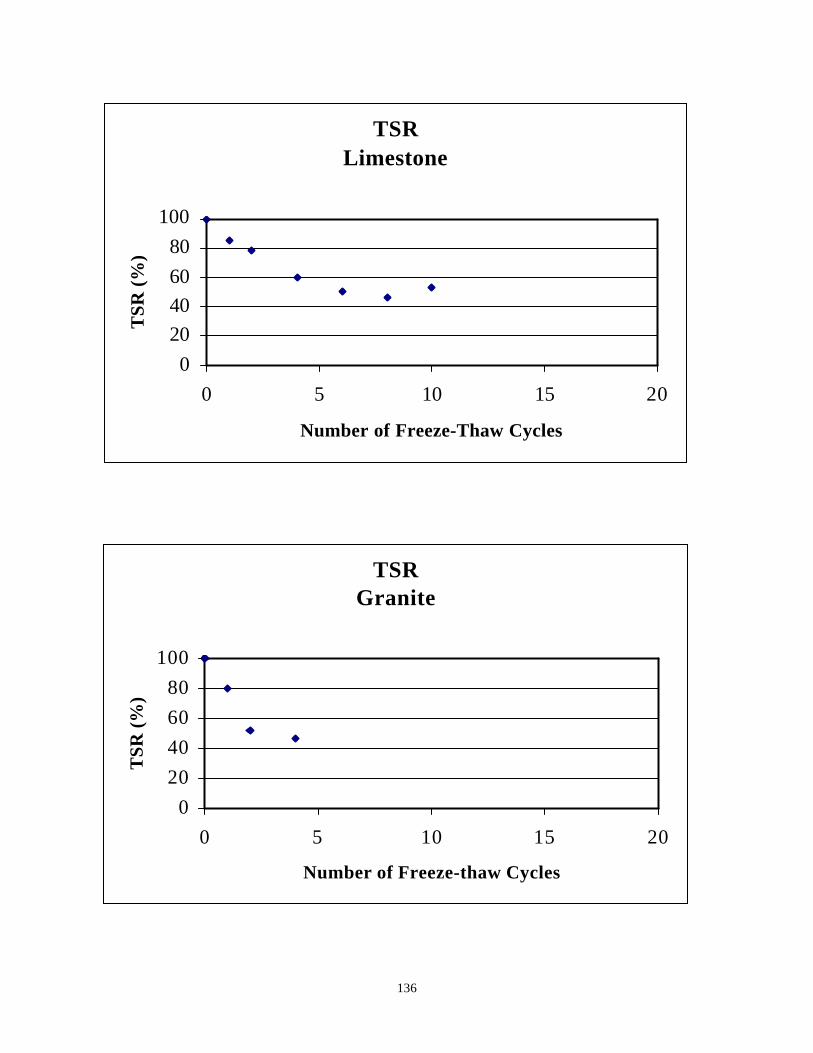
136
TSRLimestone
020406080
100
0 5 10 15 20
Number of Freeze-Thaw Cycles
TSR
(%)
TSRGranite
020406080
100
0 5 10 15 20
Number of Freeze-thaw Cycles
TSR
(%)
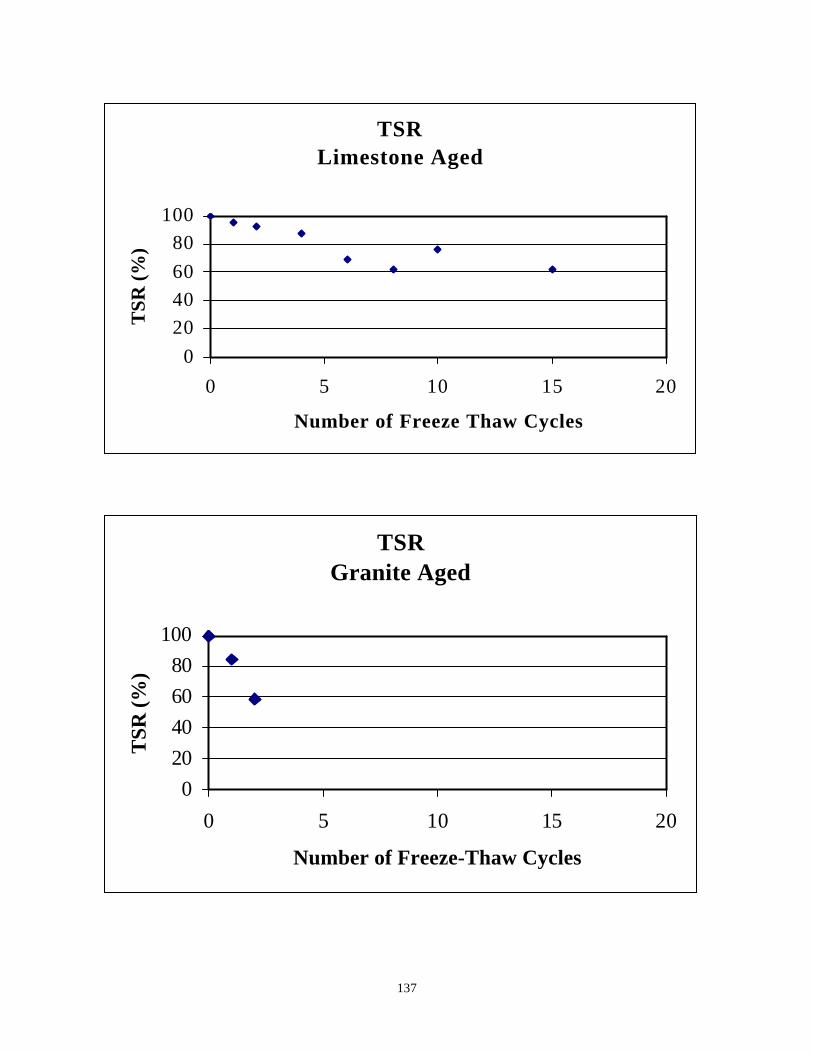
137
TSRLimestone Aged
020406080
100
0 5 10 15 20
Number of Freeze Thaw Cycles
TSR
(%)
TSRGranite Aged
020406080
100
0 5 10 15 20
Number of Freeze-Thaw Cycles
TSR
(%)
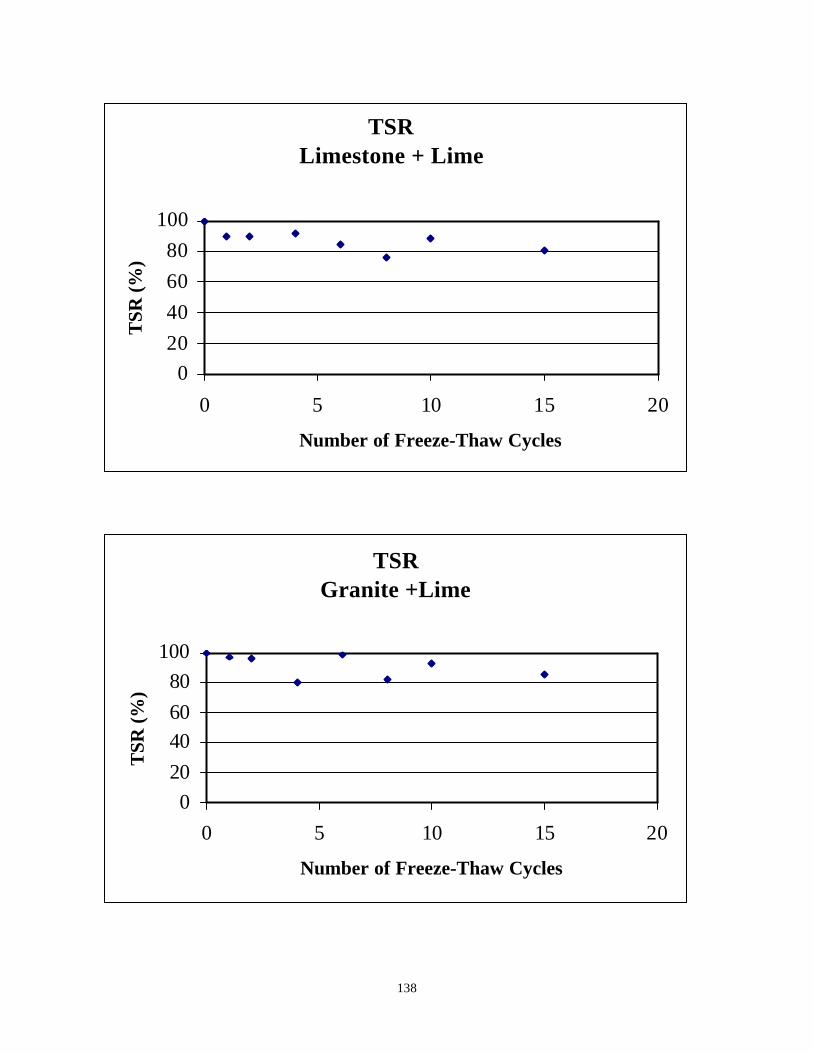
138
TSRLimestone + Lime
020406080
100
0 5 10 15 20
Number of Freeze-Thaw Cycles
TSR
(%)
TSRGranite +Lime
020406080
100
0 5 10 15 20
Number of Freeze-Thaw Cycles
TSR
(%)
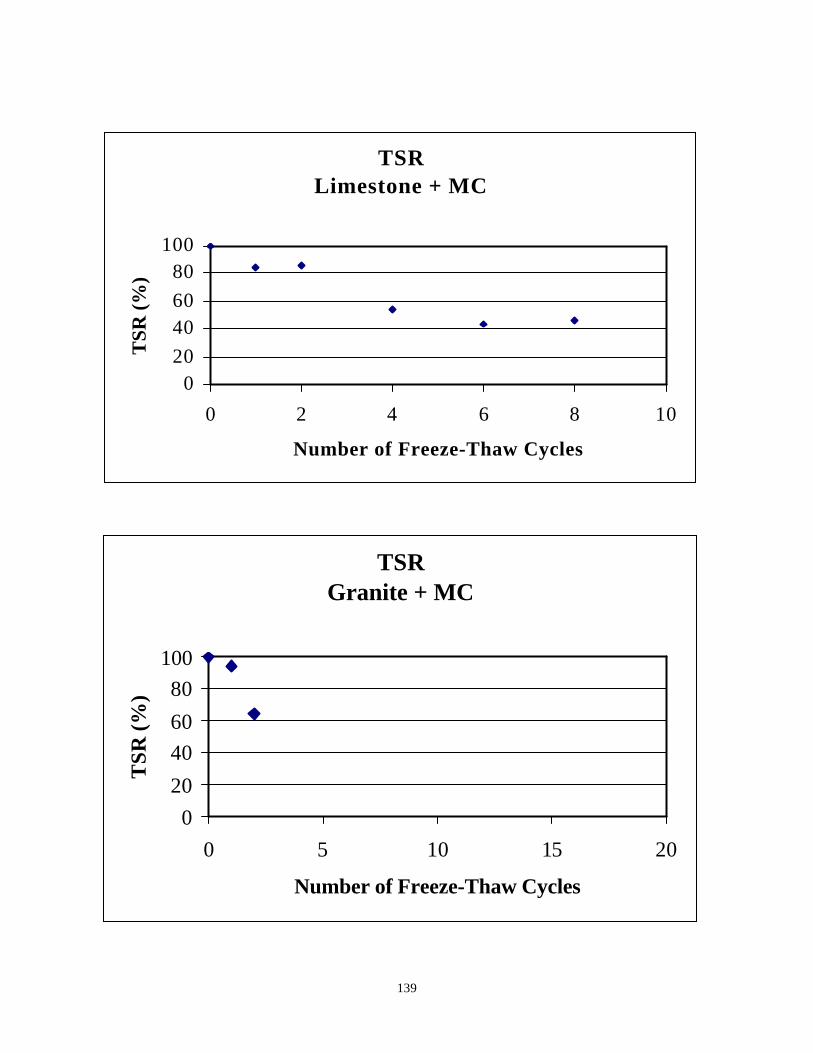
139
TSRLimestone + MC
020406080
100
0 2 4 6 8 10
Number of Freeze-Thaw Cycles
TSR
(%)
TSRGranite + MC
020
4060
80100
0 5 10 15 20
Number of Freeze-Thaw Cycles
TSR
(%)

140

141
APPENDIX F
Phase I TSR Minitab Analysis I
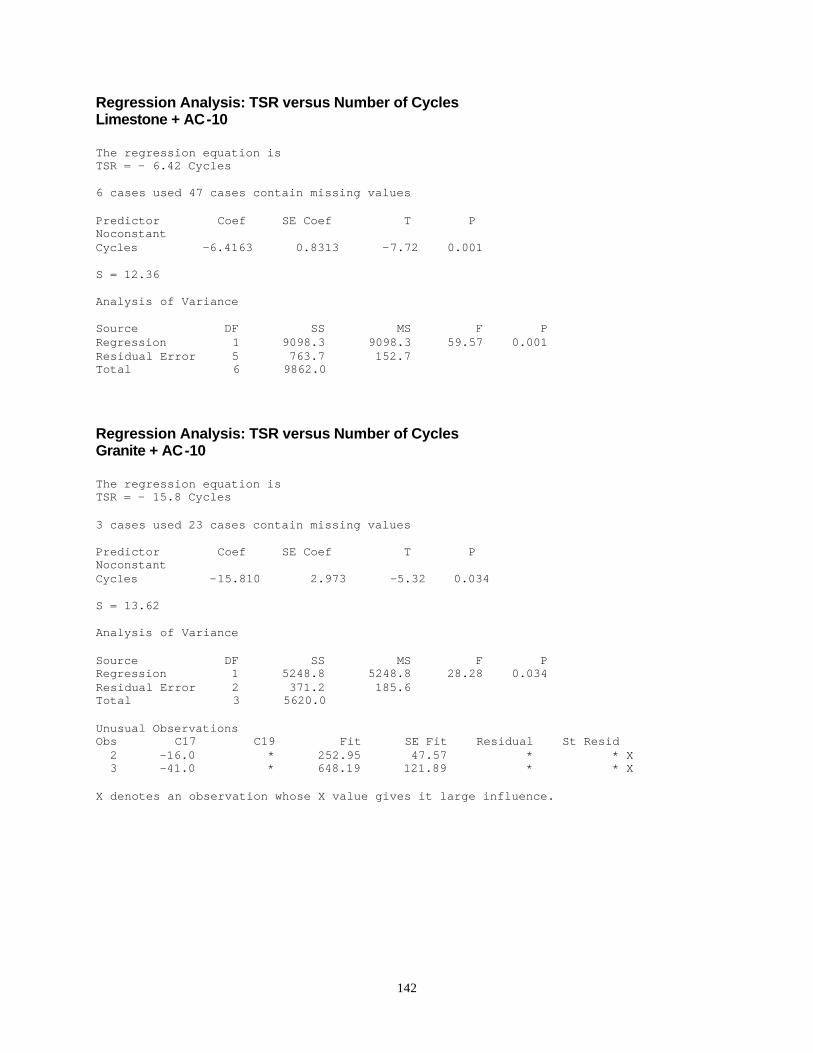
142
Regression Analysis: TSR versus Number of Cycles Limestone + AC-10 The regression equation is TSR = - 6.42 Cycles 6 cases used 47 cases contain missing values Predictor Coef SE Coef T P Noconstant Cycles -6.4163 0.8313 -7.72 0.001 S = 12.36 Analysis of Variance Source DF SS MS F P Regression 1 9098.3 9098.3 59.57 0.001 Residual Error 5 763.7 152.7 Total 6 9862.0 Regression Analysis: TSR versus Number of Cycles Granite + AC-10 The regression equation is TSR = - 15.8 Cycles 3 cases used 23 cases contain missing values Predictor Coef SE Coef T P Noconstant Cycles -15.810 2.973 -5.32 0.034 S = 13.62 Analysis of Variance Source DF SS MS F P Regression 1 5248.8 5248.8 28.28 0.034 Residual Error 2 371.2 185.6 Total 3 5620.0 Unusual Observations Obs C17 C19 Fit SE Fit Residual St Resid 2 -16.0 * 252.95 47.57 * * X 3 -41.0 * 648.19 121.89 * * X X denotes an observation whose X value gives it large influence.
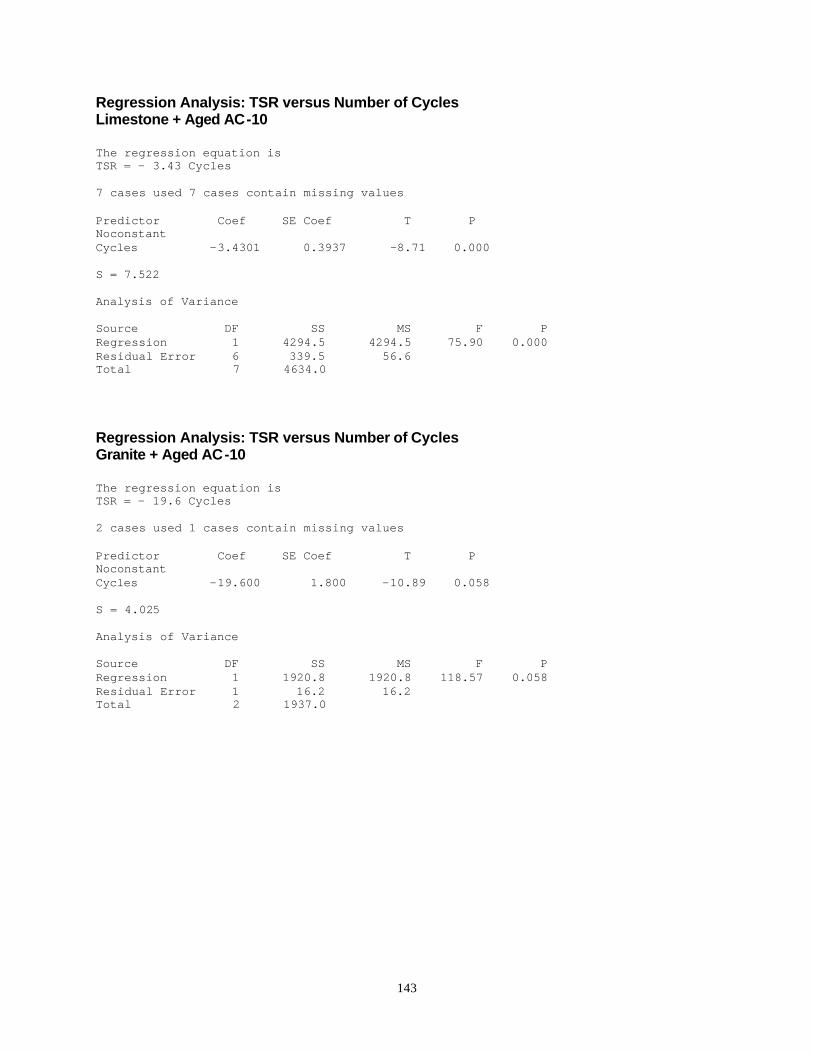
143
Regression Analysis: TSR versus Number of Cycles Limestone + Aged AC-10 The regression equation is TSR = - 3.43 Cycles 7 cases used 7 cases contain missing values Predictor Coef SE Coef T P Noconstant Cycles -3.4301 0.3937 -8.71 0.000 S = 7.522 Analysis of Variance Source DF SS MS F P Regression 1 4294.5 4294.5 75.90 0.000 Residual Error 6 339.5 56.6 Total 7 4634.0 Regression Analysis: TSR versus Number of Cycles Granite + Aged AC-10 The regression equation is TSR = - 19.6 Cycles 2 cases used 1 cases contain missing values Predictor Coef SE Coef T P Noconstant Cycles -19.600 1.800 -10.89 0.058 S = 4.025 Analysis of Variance Source DF SS MS F P Regression 1 1920.8 1920.8 118.57 0.058 Residual Error 1 16.2 16.2 Total 2 1937.0
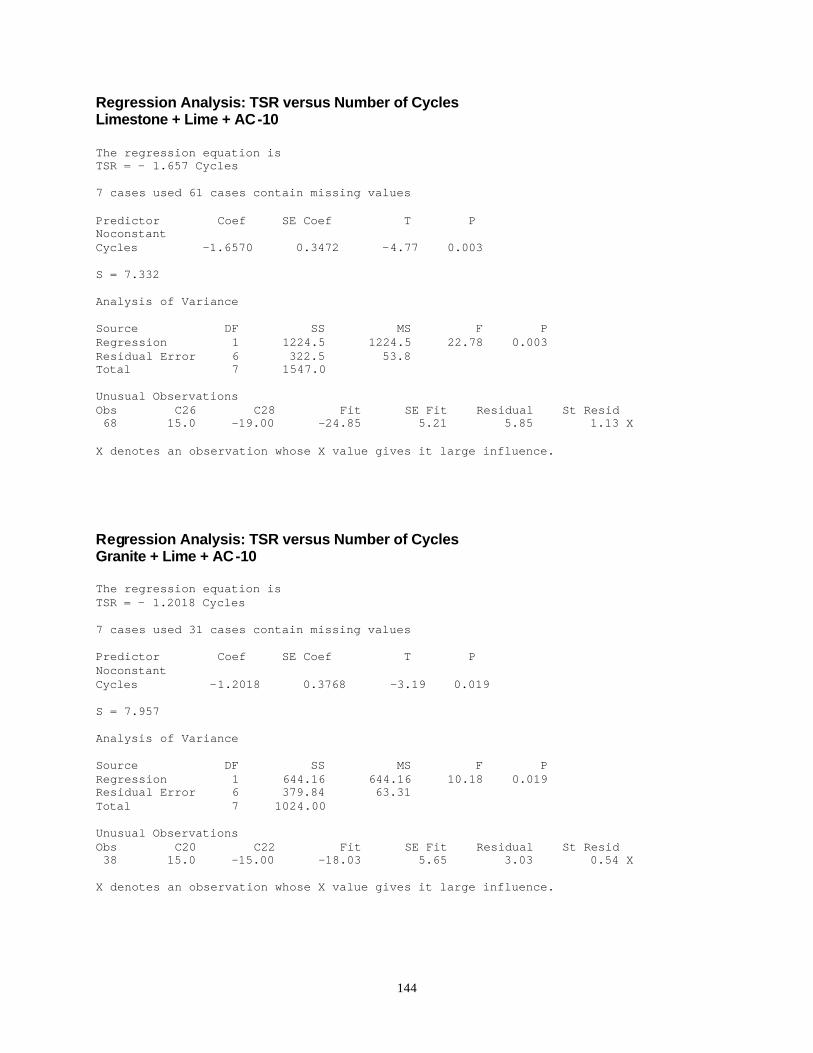
144
Regression Analysis: TSR versus Number of Cycles Limestone + Lime + AC-10 The regression equation is TSR = - 1.657 Cycles 7 cases used 61 cases contain missing values Predictor Coef SE Coef T P Noconstant Cycles -1.6570 0.3472 -4.77 0.003 S = 7.332 Analysis of Variance Source DF SS MS F P Regression 1 1224.5 1224.5 22.78 0.003 Residual Error 6 322.5 53.8 Total 7 1547.0 Unusual Observations Obs C26 C28 Fit SE Fit Residual St Resid 68 15.0 -19.00 -24.85 5.21 5.85 1.13 X X denotes an observation whose X value gives it large influence. Regression Analysis: TSR versus Number of Cycles Granite + Lime + AC-10 The regression equation is TSR = - 1.2018 Cycles 7 cases used 31 cases contain missing values Predictor Coef SE Coef T P Noconstant Cycles -1.2018 0.3768 -3.19 0.019 S = 7.957 Analysis of Variance Source DF SS MS F P Regression 1 644.16 644.16 10.18 0.019 Residual Error 6 379.84 63.31 Total 7 1024.00 Unusual Observations Obs C20 C22 Fit SE Fit Residual St Resid 38 15.0 -15.00 -18.03 5.65 3.03 0.54 X X denotes an observation whose X value gives it large influence.
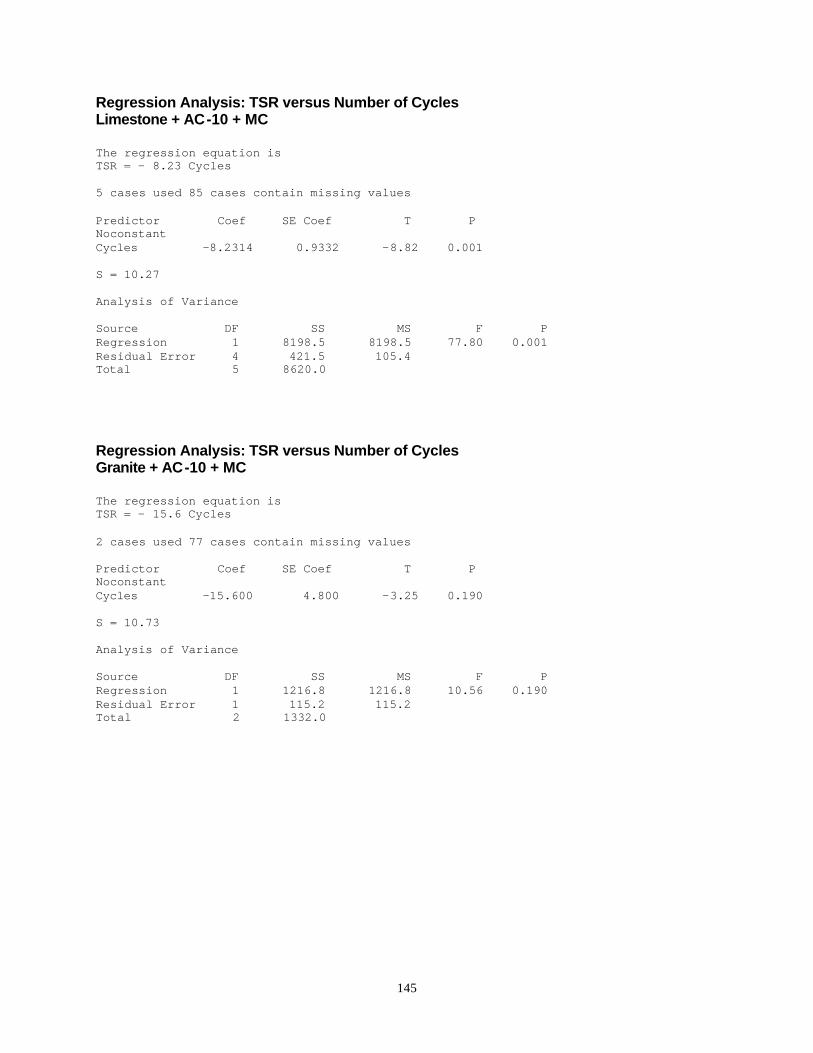
145
Regression Analysis: TSR versus Number of Cycles Limestone + AC-10 + MC The regression equation is TSR = - 8.23 Cycles 5 cases used 85 cases contain missing values Predictor Coef SE Coef T P Noconstant Cycles -8.2314 0.9332 -8.82 0.001 S = 10.27 Analysis of Variance Source DF SS MS F P Regression 1 8198.5 8198.5 77.80 0.001 Residual Error 4 421.5 105.4 Total 5 8620.0 Regression Analysis: TSR versus Number of Cycles Granite + AC-10 + MC The regression equation is TSR = - 15.6 Cycles 2 cases used 77 cases contain missing values Predictor Coef SE Coef T P Noconstant Cycles -15.600 4.800 -3.25 0.190 S = 10.73 Analysis of Variance Source DF SS MS F P Regression 1 1216.8 1216.8 10.56 0.190 Residual Error 1 115.2 115.2 Total 2 1332.0

146

147
APPENDIX G
Phase I TSR Minitab Analysis II
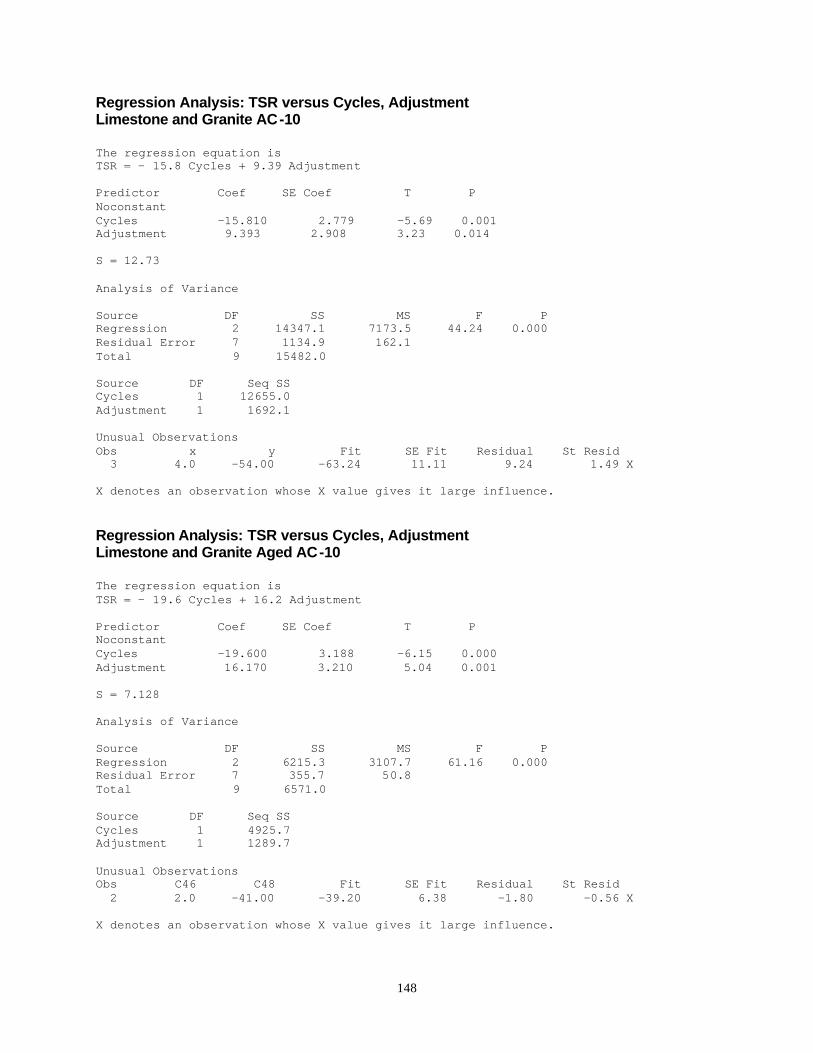
148
Regression Analysis: TSR versus Cycles, Adjustment Limestone and Granite AC-10 The regression equation is TSR = - 15.8 Cycles + 9.39 Adjustment Predictor Coef SE Coef T P Noconstant Cycles -15.810 2.779 -5.69 0.001 Adjustment 9.393 2.908 3.23 0.014 S = 12.73 Analysis of Variance Source DF SS MS F P Regression 2 14347.1 7173.5 44.24 0.000 Residual Error 7 1134.9 162.1 Total 9 15482.0 Source DF Seq SS Cycles 1 12655.0 Adjustment 1 1692.1 Unusual Observations Obs x y Fit SE Fit Residual St Resid 3 4.0 -54.00 -63.24 11.11 9.24 1.49 X X denotes an observation whose X value gives it large influence. Regression Analysis: TSR versus Cycles, Adjustment Limestone and Granite Aged AC-10 The regression equation is TSR = - 19.6 Cycles + 16.2 Adjustment Predictor Coef SE Coef T P Noconstant Cycles -19.600 3.188 -6.15 0.000 Adjustment 16.170 3.210 5.04 0.001 S = 7.128 Analysis of Variance Source DF SS MS F P Regression 2 6215.3 3107.7 61.16 0.000 Residual Error 7 355.7 50.8 Total 9 6571.0 Source DF Seq SS Cycles 1 4925.7 Adjustment 1 1289.7 Unusual Observations Obs C46 C48 Fit SE Fit Residual St Resid 2 2.0 -41.00 -39.20 6.38 -1.80 -0.56 X X denotes an observation whose X value gives it large influence.
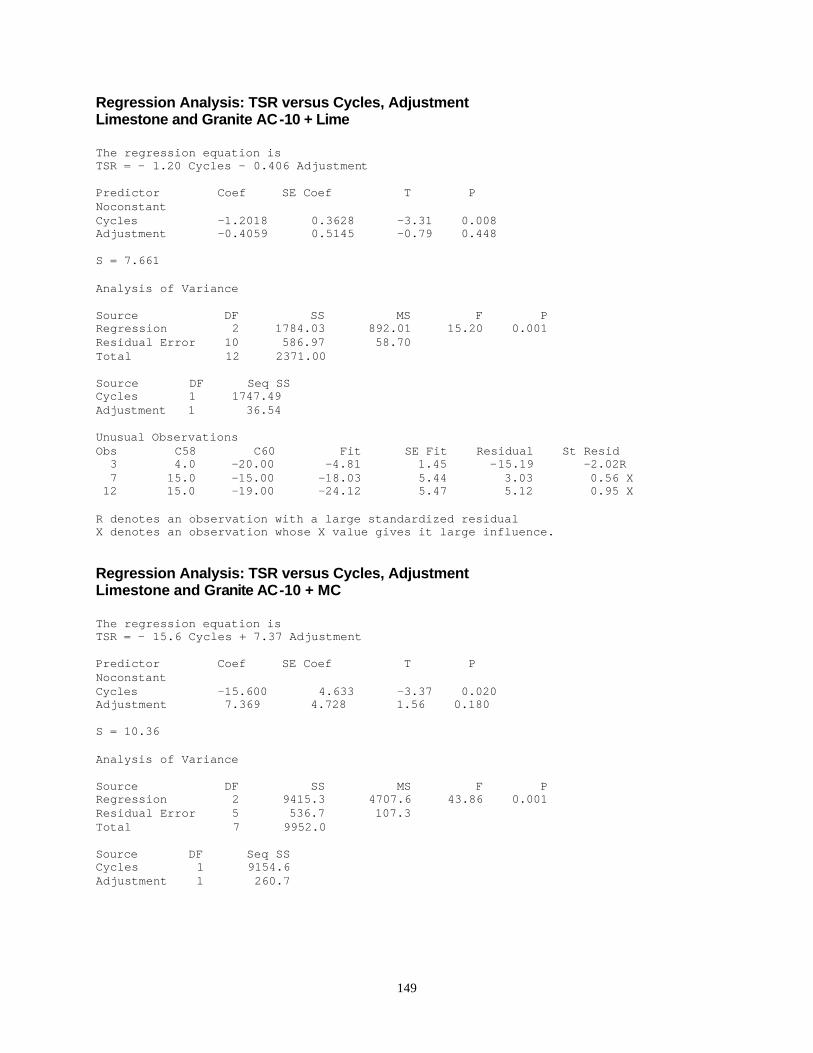
149
Regression Analysis: TSR versus Cycles, Adjustment Limestone and Granite AC-10 + Lime The regression equation is TSR = - 1.20 Cycles - 0.406 Adjustment Predictor Coef SE Coef T P Noconstant Cycles -1.2018 0.3628 -3.31 0.008 Adjustment -0.4059 0.5145 -0.79 0.448 S = 7.661 Analysis of Variance Source DF SS MS F P Regression 2 1784.03 892.01 15.20 0.001 Residual Error 10 586.97 58.70 Total 12 2371.00 Source DF Seq SS Cycles 1 1747.49 Adjustment 1 36.54 Unusual Observations Obs C58 C60 Fit SE Fit Residual St Resid 3 4.0 -20.00 -4.81 1.45 -15.19 -2.02R 7 15.0 -15.00 -18.03 5.44 3.03 0.56 X 12 15.0 -19.00 -24.12 5.47 5.12 0.95 X R denotes an observation with a large standardized residual X denotes an observation whose X value gives it large influence. Regression Analysis: TSR versus Cycles, Adjustment Limestone and Granite AC-10 + MC The regression equation is TSR = - 15.6 Cycles + 7.37 Adjustment Predictor Coef SE Coef T P Noconstant Cycles -15.600 4.633 -3.37 0.020 Adjustment 7.369 4.728 1.56 0.180 S = 10.36 Analysis of Variance Source DF SS MS F P Regression 2 9415.3 4707.6 43.86 0.001 Residual Error 5 536.7 107.3 Total 7 9952.0 Source DF Seq SS Cycles 1 9154.6 Adjustment 1 260.7

150
Recommended