
Ipswich Borough Council Local Plan
Topic Paper: Employment Evidence on the appropriate scale of employment growth for Ipswich Borough to 2031 January 2015
Development and Public Protection
Ipswich Borough Council Grafton House, Russell Road
Ipswich IP1 2DE (01473) 432019
email:
[email protected] website:
www.ipswich.gov.uk
2
Contents Page
Introduction 3
National Economic Context 5
Functional Economic Areas 6
Current Market for Economic Uses in Ipswich 7
Employment Forecasts 12
The Ipswich Labour Supply and Skills 16
Strategy for Delivery 17
Relationship to Housing Growth 22
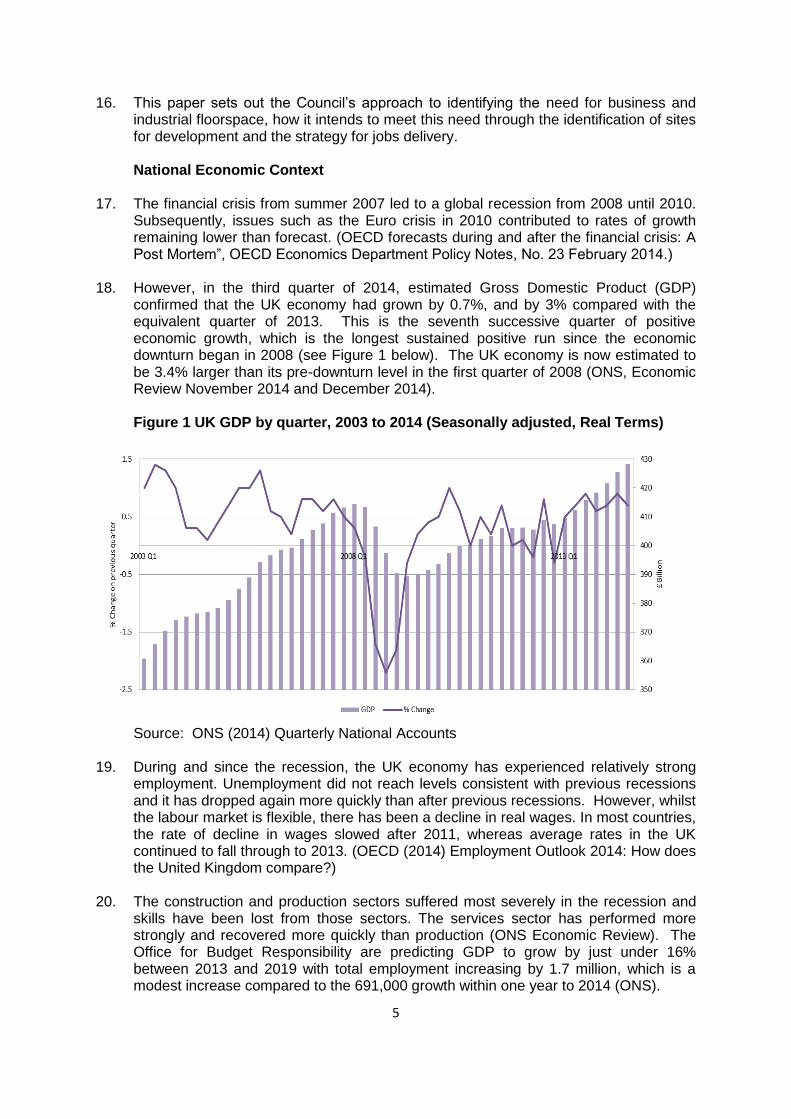
Conclusion 23
Appendix 1 Job Capacity Estimates 24

3
Introduction What the Council is doing
1. The Council is currently preparing a review of its adopted Core Strategy and Policies
development plan document (December 2011) and a Site Allocations and Policies (incorporating IP-One Area Action Plan) development plan document. These documents form the Council’s Local Plan, which guides future development in the Borough.
2. Proposed submission versions of the two plans were published for public consultation
on 12th December 2014, under regulation 19 of the Town and Country Planning (Local Planning) (England) Regulations 2012. This followed informal consultation (under regulation 18) between January and March 2014.
3. The Core Strategy and Policies development plan document review (hereinafter
referred to as the Core Strategy review) will replace the adopted Core Strategy and Policies development plan document when adopted (anticipated in late 2015).
4. The Site Allocations and Policies (incorporating IP-One Area Action Plan) development
plan document (DPD) (hereinafter referred to as the Site Allocations Plan) is a new plan. It will replace the remaining saved policies of the adopted Ipswich Local Plan (November 1997) when adopted (anticipated in late 2015).
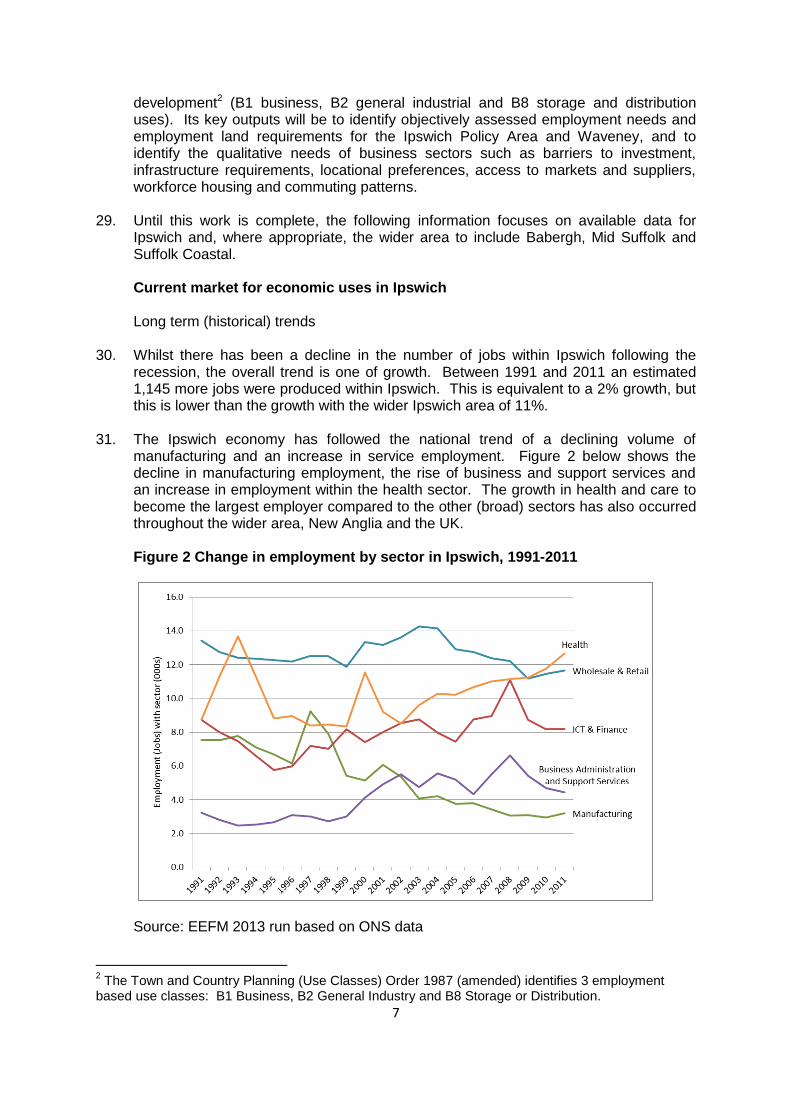
5. The Council is undertaking a public consultation on the Core Strategy review, the Site
Allocations Plan and their supporting sustainability appraisal and appropriate assessment reports. The consultation period will run from Friday 12th December 2014 to Thursday 5th March 2015 and further details can be found on the Council’s website, www.ipswich.gov.uk/consultations, at the Council’s offices at Grafton House and the Customer Services Centre at the Town Hall, or in Ipswich libraries.
National Planning Policy Framework – Plan Making
6. The National Planning Policy Framework (NPPF) was introduced in March 2012
following the introduction of the Localism Act in November 2011. The NPPF is national planning guidance and Local Plan documents such as the Core Strategy must refer to the principles established in the document.
7. The NPPF notes in paragraph 182 that the Local Plan will be assessed at the
Examination in Public on whether it has been prepared in accordance with the Duty to Co-operate, legal and procedural requirements, and whether it is sound.
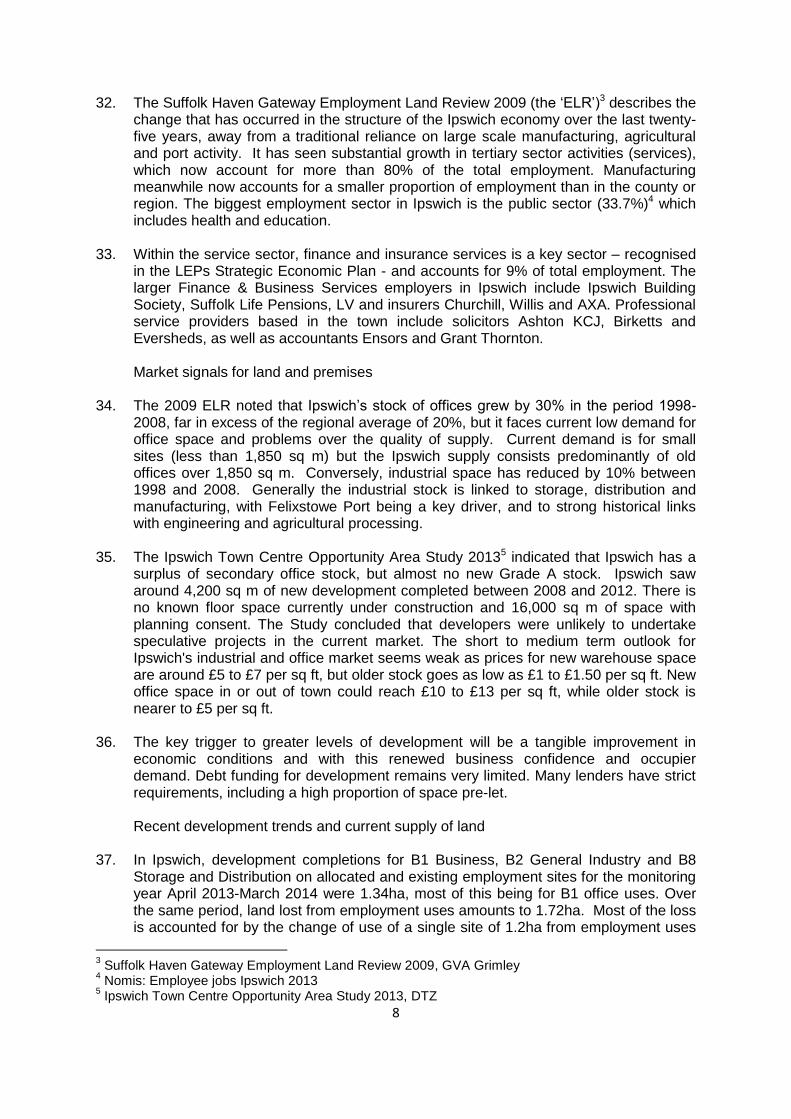
8. The Duty to Co-operate was introduced through Section 110 of the Localism Act 2011
in November 2011. It is a legal duty on local planning authorities to co-operate constructively, actively and on an ongoing basis with neighbouring authorities, county councils and other prescribed bodies in planning for strategic, cross boundary matters. The duty to co-operate came into force on 15th November 2011 and any plan submitted for examination on or after this date will be examined for compliance. Local planning authorities are expected to provide evidence of how they have complied with any requirements arising from the duty. Non-compliance with the duty to co-operate cannot be rectified after the submission of a plan.
9. The Inspector will first check that the plans meets the legal requirements under
s20(5)(a) of the Act before moving on to test for soundness. Legal requirements

4
include e.g. whether it is included in the Council’s Local Development Scheme; whether the Council’s Statement of Community Involvement has been followed; and whether documents have been published and made available for public inspection.
10. To be sound the plan must be:
‘Positively prepared – the plan should be prepared based on a strategy which seeks to meet objectively assessed development and infrastructure requirements, including unmet requirements from neighbouring authorities where it is reasonable to do so and consistent with achieving sustainable development;
Justified – the plan should be the most appropriate strategy, when considered against the reasonable alternatives, based on proportionate evidence;
Effective – the plan should be deliverable over its period and based on effective joint working on cross-boundary strategic priorities; and
Consistent with national policy – the plan should enable the delivery of sustainable development in accordance with the policies in the Framework.’ (Para 182, p. 43)
11. Paragraph 15 of the NPPF notes ‘a presumption in favour of sustainable development
so that it is clear that development which is sustainable can be approved without delay’ and plans include ‘clear policies that will guide how the presumption should be applied locally’ (p. 4).
National Policy Context
12. Through the NPPF, the Government requires planning to: ‘… proactively drive and
support sustainable economic development to deliver the homes, business and industrial units, infrastructure and thriving local places that the country needs. Every effort should be made objectively to identify and then meet the housing, business and other development needs of an area …’ (Core Planning Principles).
13. The Housing Topic Paper provides greater detail on how the Council has arrived at a
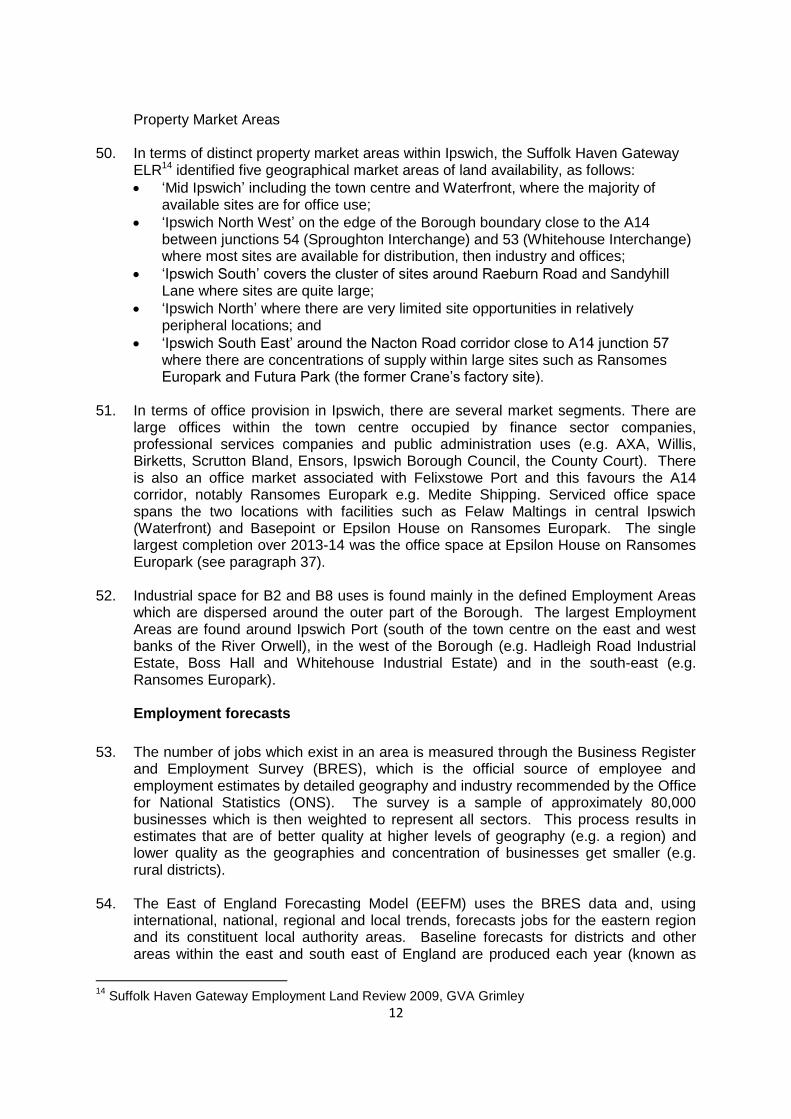
housing growth figure for the Borough from 2011 to 2031. This topic paper explains the background to the revised jobs target of in the region of 12,500 jobs to be provided to 2031 as set out in Policy CS13 of the Core Strategy Review. A separate topic paper on Retail and Town Centre sets out evidence on the scale of retail development for Ipswich Borough and the approach to retail and town centre policies.
14. The Government requires local planning authorities to place ‘significant weight’ on the
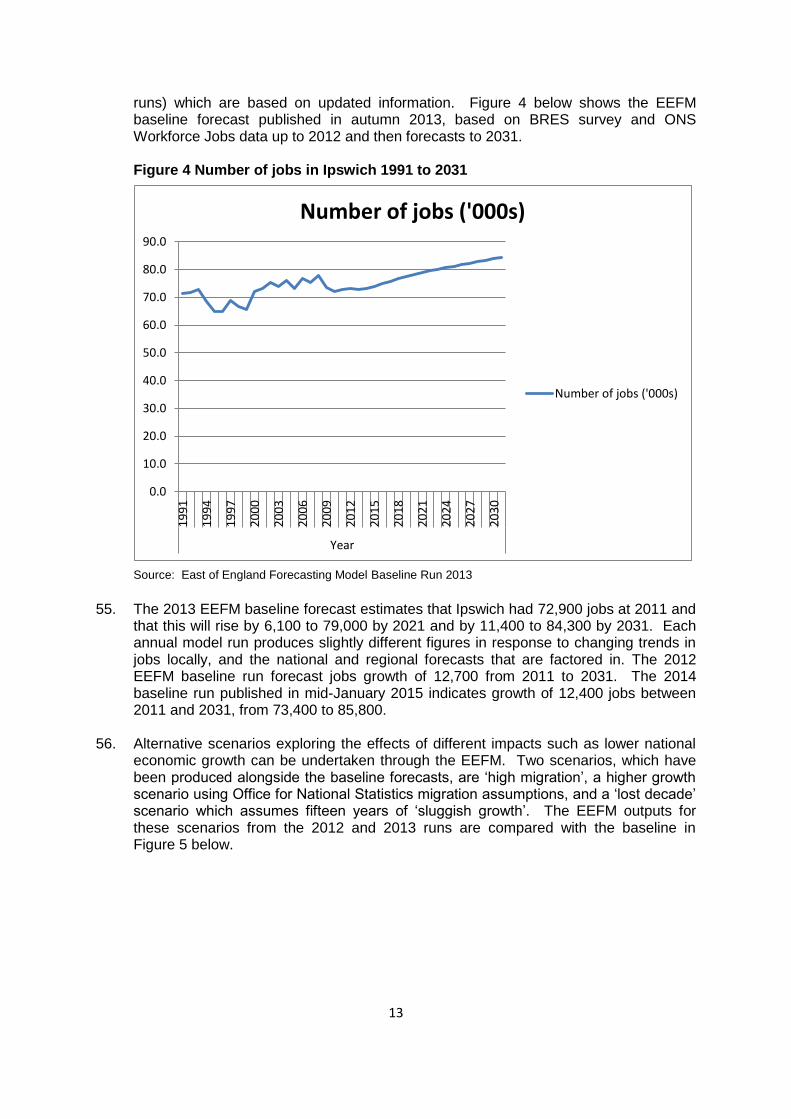
need to support economic growth through their Local Plans. In order to do this, local planning authorities need to ‘…plan proactively to meet the development needs of business and support an economy fit for the 21st century’ (NPPF paragraphs 19 & 20).
15. Local planning authorities should make plans on the basis of a clear understanding of
the needs of businesses and markets in their area (NPPF paragraph 160). Ways to achieve this include working with other authorities and the Local Enterprise Partnership (LEP) on the evidence base, and working with the business community to understand needs and barriers to investment.
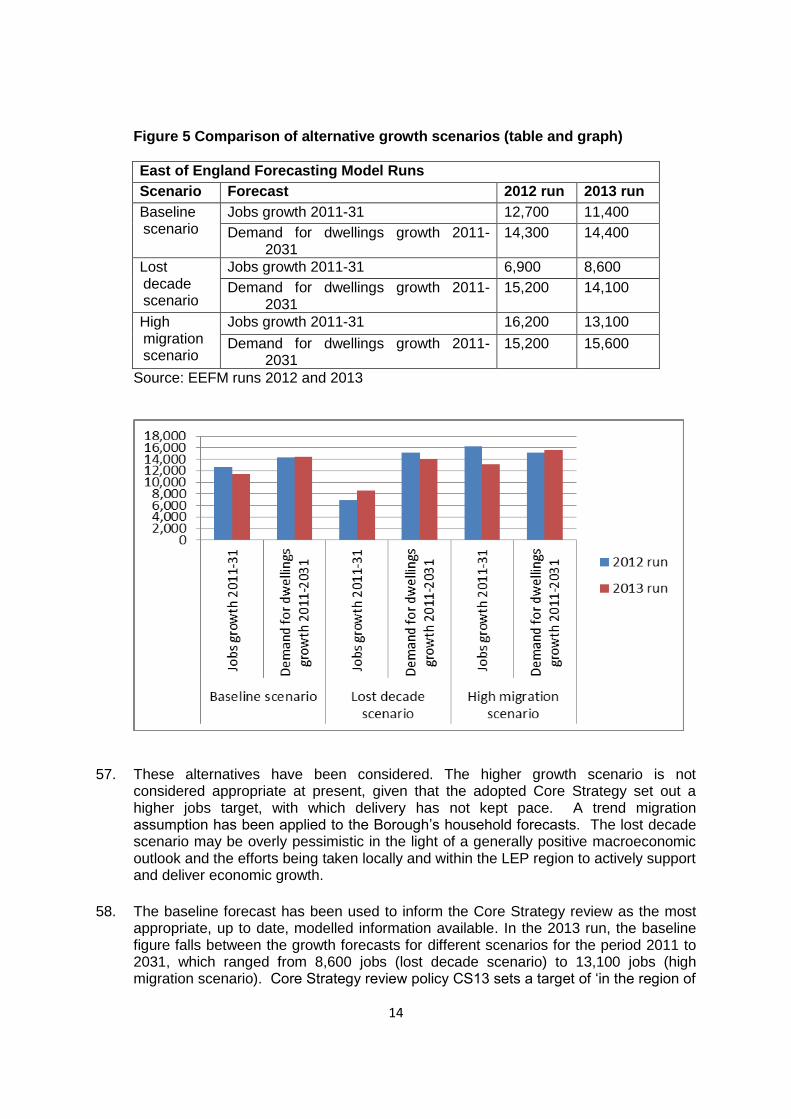
5
16. This paper sets out the Council’s approach to identifying the need for business and industrial floorspace, how it intends to meet this need through the identification of sites for development and the strategy for jobs delivery.
National Economic Context
17. The financial crisis from summer 2007 led to a global recession from 2008 until 2010.
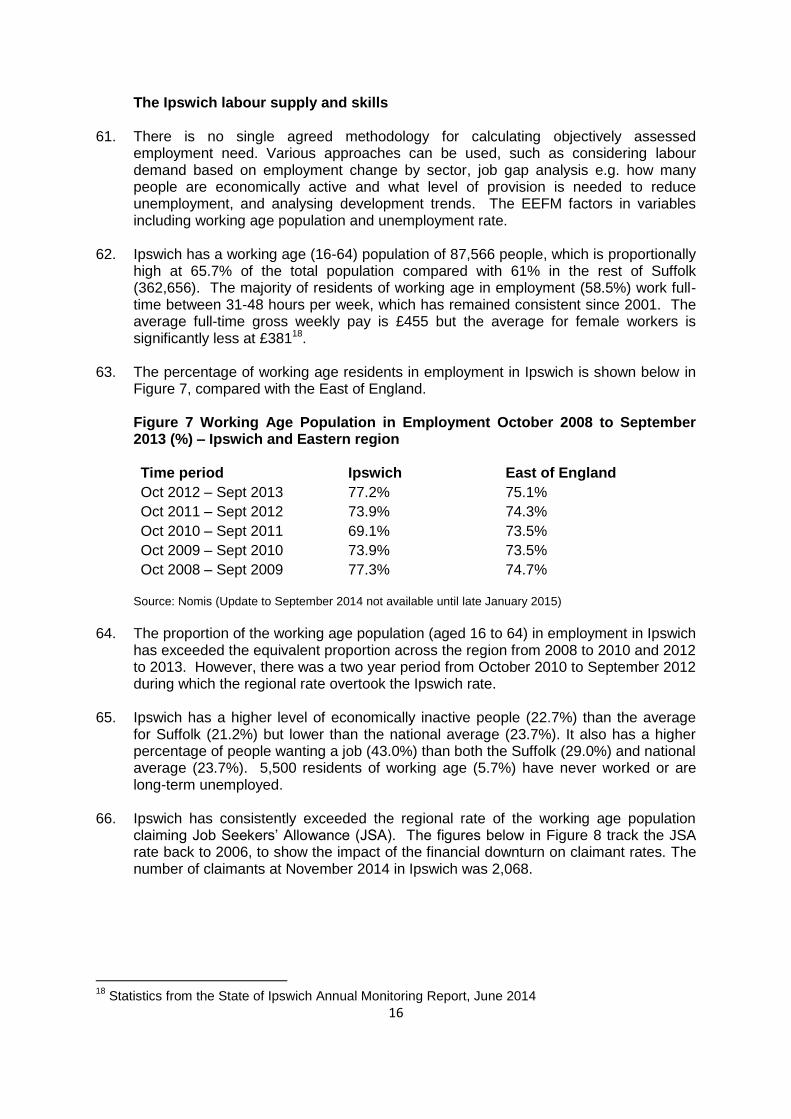
Subsequently, issues such as the Euro crisis in 2010 contributed to rates of growth remaining lower than forecast. (OECD forecasts during and after the financial crisis: A Post Mortem”, OECD Economics Department Policy Notes, No. 23 February 2014.)
18. However, in the third quarter of 2014, estimated Gross Domestic Product (GDP)
confirmed that the UK economy had grown by 0.7%, and by 3% compared with the equivalent quarter of 2013. This is the seventh successive quarter of positive economic growth, which is the longest sustained positive run since the economic downturn began in 2008 (see Figure 1 below). The UK economy is now estimated to be 3.4% larger than its pre-downturn level in the first quarter of 2008 (ONS, Economic Review November 2014 and December 2014).
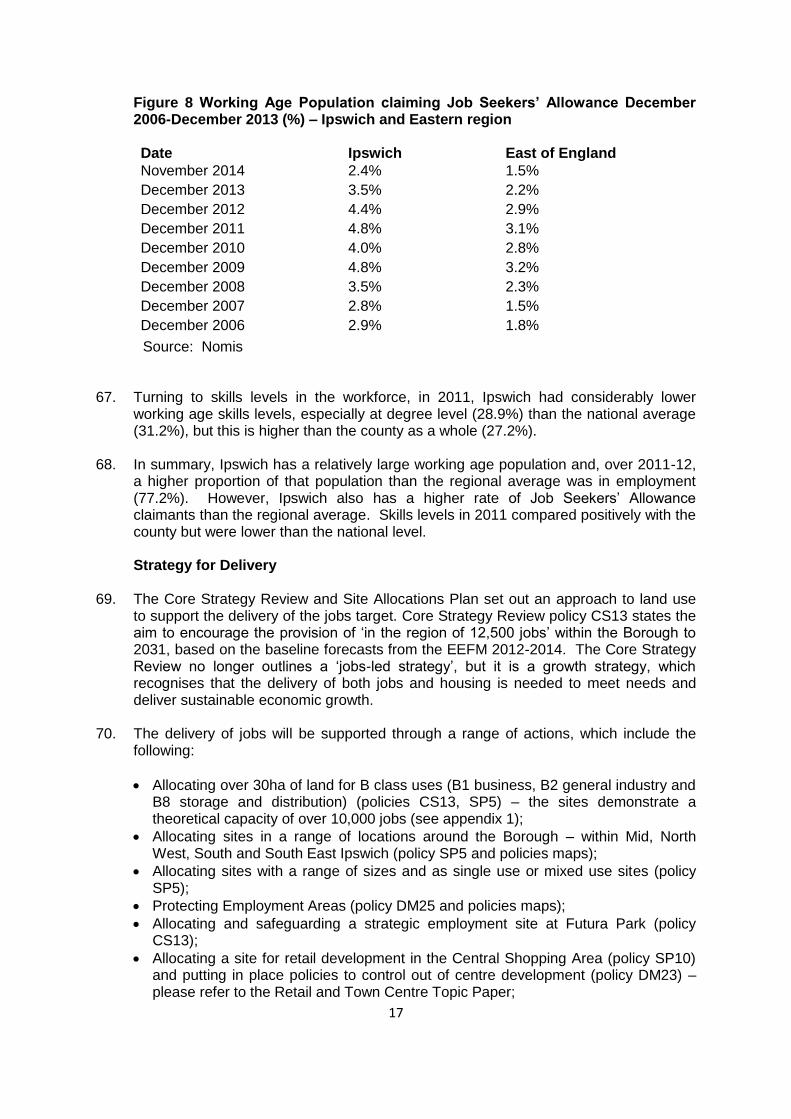
Figure 1 UK GDP by quarter, 2003 to 2014 (Seasonally adjusted, Real Terms)
Source: ONS (2014) Quarterly National Accounts
19. During and since the recession, the UK economy has experienced relatively strong
employment. Unemployment did not reach levels consistent with previous recessions and it has dropped again more quickly than after previous recessions. However, whilst the labour market is flexible, there has been a decline in real wages. In most countries, the rate of decline in wages slowed after 2011, whereas average rates in the UK continued to fall through to 2013. (OECD (2014) Employment Outlook 2014: How does the United Kingdom compare?)
20. The construction and production sectors suffered most severely in the recession and
skills have been lost from those sectors. The services sector has performed more strongly and recovered more quickly than production (ONS Economic Review). The Office for Budget Responsibility are predicting GDP to grow by just under 16% between 2013 and 2019 with total employment increasing by 1.7 million, which is a modest increase compared to the 691,000 growth within one year to 2014 (ONS).
6
21. While there are positive indications relating to GDP and unemployment, there are
signs that the global economy is now slowing and indicators of consumer and business confidence are consistent with continuing subdued growth. Growth has also slowed in some emerging economies and, in the United States, household consumption is also subdued. Within Europe, the United Kingdom’s largest trading partner, output grew only modestly in the first half of 2014. UK exports fell in the second quarter of 2014. (Bank of England (2014) Inflation Report, November 2014.)
22. Looking ahead, there are uncertainties which could affect the UK economy over
coming years, such as a future referendum on EU membership, possible deflation within the Eurozone, possible interest rate rises in UK and USA, volatility in emerging markets such as Eastern Europe, and whether growth within the housing market will be sustained.
23. There is also a structural issue affecting the UK and Europe, which is the ageing
population and how this affects the workforce. The ratio of people aged over 64 to those of working age will continue to increase.
24. Overall, the current macroeconomic context for the Ipswich economy is one of slow but
sustained growth in UK GDP; decreased unemployment but pressure on earnings and therefore household incomes; indications that the global economy is slowing and uncertainties lying ahead which could affect the UK economy.
Functional Economic Areas
25. The National Planning Practice Guidance (NPPG) advises that economic needs
should be assessed in relation to the relevant functional area. There is no standard approach to defining a functional economic market area but factors to consider include the extent of the Local Enterprise Partnership (LEP) area, travel to work areas, the housing market area, flows of goods and services, administrative areas and the transport network. Thus, the starting point for defining the Ipswich functional economic area is the extent of New Anglia LEP geography, which comprises Norfolk and Suffolk.
26. Babergh, Mid Suffolk and Suffolk Coastal District Councils, and Ipswich Borough
Council are using a working assumption that these administrative areas are a functional sub-area within the New Anglia LEP geography. This is based on the extent of the Ipswich Travel to Work area (as defined in 2007) and the degree of self-containment. Although there are some areas of overlap with adjacent Travel to Work Areas (Bury St Edmunds, Lowestoft & Beccles, and Norwich), most of the combined administrative area is covered by the Ipswich Travel to Work Area.
27. Based on the 2011 Census, some 84% of employed residents in the combined area
also work in the area. This is only 2.9 percentage points lower than the containment of the current Travel to Work Area and 9 points more than the 2007 criteria for defining Travel to Work Areas. Therefore, this forms a coherent sub area of the wider New Anglia Local Enterprise Partnership geography and also coincides with the currently defined Ipswich Housing Market Area (SHMA 20121).
28. An Employment Land Needs Assessment is being carried out for the Ipswich
functional economic area, looking at solely the needs for B-class economic
1 Ipswich Strategic Housing Market Assessment Update, Babergh, Mid-Suffolk and Suffolk Coastal
District Councils, 2012
7
development2 (B1 business, B2 general industrial and B8 storage and distribution uses). Its key outputs will be to identify objectively assessed employment needs and employment land requirements for the Ipswich Policy Area and Waveney, and to identify the qualitative needs of business sectors such as barriers to investment, infrastructure requirements, locational preferences, access to markets and suppliers, workforce housing and commuting patterns.
29. Until this work is complete, the following information focuses on available data for
Ipswich and, where appropriate, the wider area to include Babergh, Mid Suffolk and Suffolk Coastal.
Current market for economic uses in Ipswich
Long term (historical) trends
30. Whilst there has been a decline in the number of jobs within Ipswich following the recession, the overall trend is one of growth. Between 1991 and 2011 an estimated 1,145 more jobs were produced within Ipswich. This is equivalent to a 2% growth, but this is lower than the growth with the wider Ipswich area of 11%.
31. The Ipswich economy has followed the national trend of a declining volume of
manufacturing and an increase in service employment. Figure 2 below shows the decline in manufacturing employment, the rise of business and support services and an increase in employment within the health sector. The growth in health and care to become the largest employer compared to the other (broad) sectors has also occurred throughout the wider area, New Anglia and the UK.
Figure 2 Change in employment by sector in Ipswich, 1991-2011
Source: EEFM 2013 run based on ONS data
2 The Town and Country Planning (Use Classes) Order 1987 (amended) identifies 3 employment
based use classes: B1 Business, B2 General Industry and B8 Storage or Distribution.
8
32. The Suffolk Haven Gateway Employment Land Review 2009 (the ‘ELR’)3 describes the change that has occurred in the structure of the Ipswich economy over the last twenty-five years, away from a traditional reliance on large scale manufacturing, agricultural and port activity. It has seen substantial growth in tertiary sector activities (services), which now account for more than 80% of the total employment. Manufacturing meanwhile now accounts for a smaller proportion of employment than in the county or region. The biggest employment sector in Ipswich is the public sector (33.7%)4 which includes health and education.
33. Within the service sector, finance and insurance services is a key sector – recognised
in the LEPs Strategic Economic Plan - and accounts for 9% of total employment. The larger Finance & Business Services employers in Ipswich include Ipswich Building Society, Suffolk Life Pensions, LV and insurers Churchill, Willis and AXA. Professional service providers based in the town include solicitors Ashton KCJ, Birketts and Eversheds, as well as accountants Ensors and Grant Thornton.
Market signals for land and premises
34. The 2009 ELR noted that Ipswich’s stock of offices grew by 30% in the period 1998-2008, far in excess of the regional average of 20%, but it faces current low demand for office space and problems over the quality of supply. Current demand is for small sites (less than 1,850 sq m) but the Ipswich supply consists predominantly of old offices over 1,850 sq m. Conversely, industrial space has reduced by 10% between 1998 and 2008. Generally the industrial stock is linked to storage, distribution and manufacturing, with Felixstowe Port being a key driver, and to strong historical links with engineering and agricultural processing.
35. The Ipswich Town Centre Opportunity Area Study 20135 indicated that Ipswich has a
surplus of secondary office stock, but almost no new Grade A stock. Ipswich saw around 4,200 sq m of new development completed between 2008 and 2012. There is no known floor space currently under construction and 16,000 sq m of space with planning consent. The Study concluded that developers were unlikely to undertake speculative projects in the current market. The short to medium term outlook for Ipswich's industrial and office market seems weak as prices for new warehouse space are around £5 to £7 per sq ft, but older stock goes as low as £1 to £1.50 per sq ft. New office space in or out of town could reach £10 to £13 per sq ft, while older stock is nearer to £5 per sq ft.
36. The key trigger to greater levels of development will be a tangible improvement in
economic conditions and with this renewed business confidence and occupier demand. Debt funding for development remains very limited. Many lenders have strict requirements, including a high proportion of space pre-let. Recent development trends and current supply of land
37. In Ipswich, development completions for B1 Business, B2 General Industry and B8
Storage and Distribution on allocated and existing employment sites for the monitoring year April 2013-March 2014 were 1.34ha, most of this being for B1 office uses. Over the same period, land lost from employment uses amounts to 1.72ha. Most of the loss is accounted for by the change of use of a single site of 1.2ha from employment uses
3 Suffolk Haven Gateway Employment Land Review 2009, GVA Grimley
4 Nomis: Employee jobs Ipswich 2013
5 Ipswich Town Centre Opportunity Area Study 2013, DTZ
9
to residential uses, delivering 386 residential units at Great Whip Street on the west bank of the Waterfront, as part of the ongoing Waterfront regeneration. The other losses of employment land indicate a wide range of new uses, many of which also generate employment: gym, health treatment rooms, retail, residential, police station, café and yoga studio. Figure 3 below shows total employment land completions in Ipswich from 1991 to 2014 (source: IBC Employment Land Availability Report 2014).
Figure 3 Employment land completions in Ipswich mid-1991 to March 2014
0
2
4
6
8
10
12
14
19
91
- 1
99
2
19
92
- 1
99
3
19
93
- 1
99
4
19
94
- 1
99
5
19
95
- 1
99
6
19
96
- 1
99
7
19
97
- 1
99
8
19
98
- 1
99
9
19
99
- 2
00
0
20
00
- 2
00
1
20
01
- 2
00
2
20
02
- 2
00
3
20
03
- 2
00
4
20
04
- 2
00
5
20
05
- 2
00
6
20
06
- 2
00
7
20
07
- 2
00
8
20
08
- 2
00
9
20
09
- 2
01
0
20
10
- 2
01
1
20
11
- 2
01
2
20
12
- 2
01
3
20
13
- 2
01
4
He
cta
res
Year
Employment Land Completions 1991-2014
38. The total amount of employment land available at July 2014 has increased by 0.17
hectares (ha) to 71.94ha across the whole of Ipswich. It should be noted that the Employment Land Availability Report 2014 monitoring data relate to saved Local Plan 1997 land allocations and Employment Area designations. The total land supply consists of:
3.81ha with unimplemented planning permission (the majority of which is for B8 storage and distribution uses within a defined Employment Area),
18.73ha on allocated land (13.61ha of which is within the Ipswich Port area and allocated for Port related uses) and
49.4ha of vacant land within identified employment areas (including 15.53ha at Landseer Road / Sandyhill Lane; 10.83 ha at the Drift/Leslie Road; and 9.34ha at Ransomes Europark).
39. Planning permissions for employment sites (over 100 sq m) at April 2014 amount to
3.81ha. The permissions include extensions and changes of use. The largest permission in terms of site size is for B8 uses within a defined Employment Area - 1.88ha for an extension to a warehouse at Ransomes Europark. There are permissions for six new commercial units for B1, B2 and B8 use within the Dales Road Employment Area. There are no new outline planning permissions.
10
40. From mid-2001 to March 2014, average employment land completions were 1.8ha per annum. Figure 3 above shows completions over a longer period from 1991 and demonstrates the variable extent of employment development, which is affected by general economic conditions. A trend based estimate of employment land demand 2011-2031 would amount to 1.8 x 20 years or 36ha.
41. In terms of premises, the Council’s Employment Land Availability Reports survey
occupation in the Employment Areas annually. The 2014 report shows that vacancy within the Employment Areas (designated through the adopted Local Plan 1997) has reduced from 124 units in 2012-13 to 98 units in 2013-14, so that the occupancy rate at July 2014 was 89% (up from 86.1%). The two Employment Areas with the lowest occupancy rates (below 80%) are Riverside Industrial Park and West Bank Area, and Landseer Road / Greenwich Close / Cliff Quay / Sandyhill Lane.
42. Market intelligence also helps to build a picture of the Ipswich economy. Ipswich
Borough Council’s Economic Development Team monitor enquiries received about available land or premises within the Borough and have regular contact with agents. During 2014, 23 enquiries were received primarily via UK Trade and Investment. Of these, the majority (14) were for industrial or warehouse premises or land and 2 for office accommodation. Retail and leisure enquiries accounted for 5 of the 23. 2 enquiries did not specify the land use. The size of accommodation sought typically ranged from 1,000 to 10,000 square metres (industrial and warehouse) and 100 to 200 square metres (office).
Rental values in different uses
43. Land agent information on the Ipswich office floorspace market indicates that the first
half of 2013 saw a reduction in office floorspace transactions, after a relatively good year in 20126. More recently (first half of 2014) the market has shown an increase in the uptake of office floorspace in Ipswich. 59% of the demand for office floorspace in 2013 was for good quality second hand stock, but Ipswich still has a shortage of Grade A office stock. Rental values range from £6 per square foot for secondary, poor quality office stock to £14.50 for prime space (the latter unchanged in 2014). The rental value of prime office space in Ipswich is slightly lower than values in Colchester and Norwich (£15 and £16.50 per square foot respectively).
44. In contrast, the take up of industrial floorspace during the first half of 2013 was the
highest six-monthly level of activity since 2007. The focus of that activity was on poorer quality second hand industrial space (55%). In the industrial floorspace sector, the rental values in 2013 ranged from £2.50 per square foot for secondary, poor quality floorspace to £5 for prime space. In 2014, the take up of industrial floorspace has slowed (partly due to low levels of supply) and the prime rental rate has dropped to £4.75 per square foot.
45. Activity during 2014 suggests that the office market in Ipswich town centre and
specifically around the hub of Princes Street may be improving. In June 20147, the Ipswich Star announced that legal firm Birketts plan to relocate from their existing offices in Museum Street, which they have outgrown, to larger purpose built offices at 141-145 Princes Street, Ipswich.
6 Bidwells Business Space Data Books, Autumn 2013, Spring 2014, Autumn 2014
7 See press cutting 10
th June 2014
http://www.ipswichstar.co.uk/news/ipswich_law_firm_set_to_build_new_hq_in_heart_of_town_1_3636166
11
46. An Ipswich Borough Council press release in November 20148 announced the
intended sale by the Council of vacant office building Fison House on Princes Street to a private developer (see Executive report considered 2nd December9). The Council has also applied for planning permission for speculative new office accommodation on land it owns to the north-west of Princes Street. In contrast there have been no announcements during 2014 relating to new industrial investment in Ipswich.
47. Other published information about recent business growth in Ipswich includes the
following:
Willis’ announcement 10th September 2013 (Ipswich Star) of works to its listed office building to increase its capacity from 1,350 to 1,500 employees, following refurbishment of its Greyfriars offices, which together take its capacity up to 1,900 people10;
Flow Energy announcement 31st October 2014 (Ipswich Star) of their intention to create 700 jobs over coming years selling a new type of gas boiler11;
Crafted, a digital marketing agency, receives £60,000 grant from the LEP to support expansion plans (Ipswich Star 4th April 2014)12.
48. The indicators suggest that the market for employment land and premises in Ipswich
has improved, although the signals for industrial land are varied. There is reduced vacancy overall in the Employment Areas, but also reduced industrial rental values identified by Bidwells. The Borough is unable to secure some of the companies from whom enquiries are received for land or premises due to the lack of available grants. However, four wards within the Borough have Assisted Area Status – Priory Heath, Gipping, Alexandra and Holywells – which means that businesses in these areas can access a larger than otherwise share of national or European funding13.
49. There are employment (industrial) sites outside the town centre, which are within
Employment Areas but have not come forward for a number of years. The two largest, which have been allocated for employment use through the Site Allocations DPD, are the former Harris Bacon site at Hadleigh Road (now reference IP147) and the former Volvo site at Sandy Hill Lane (now reference IP058). The former is now available following completion of the rail chord through the site and the provision of a signalled access, and it is considered likely to come forward. The latter has benefited from improvements to the Cliff Quay sewage works to address odour issues and has been put forward through the Suffolk Growth Strategy for support in delivery. Constraints include slope, location, access and the particular sectors the site would be appropriate for. In the meantime it is being used for extensive storage.
8 See press release 25
th Nov 14 https://www.ipswich.gov.uk/content/office-block-refurbishment-
planned 9 https://democracy.ipswich.gov.uk/documents/g1352/Public%20reports%20pack%2002nd-Dec-
2014%2018.00%20Executive.pdf?T=10 Executive report re Fison House 2nd
Dec 2014 10
http://www.ipswichstar.co.uk/news/suffolk_jobs_boost_as_willis_unveils_10m_investment_1_2373626 11
http://www.ipswichstar.co.uk/news/energy_firm_set_to_create_700_new_jobs_in_ipswich_through_launch_of_game_changing_gas_boiler_1_3827399 12
http://www.ipswichstar.co.uk/news/ipswich_digital_agency_crafted_secures_60_000_growing_business_fund_grant_from_new_anglia_lep_1_3521314 13
http://www.bizeast.co.uk/index.php?option=com_content&view=article&id=1226:ipswich-town-centre-given-assisted-area-status&catid=81:general-business-news&Itemid=429
12
Property Market Areas
50. In terms of distinct property market areas within Ipswich, the Suffolk Haven Gateway
ELR14 identified five geographical market areas of land availability, as follows:
‘Mid Ipswich’ including the town centre and Waterfront, where the majority of available sites are for office use;
‘Ipswich North West’ on the edge of the Borough boundary close to the A14 between junctions 54 (Sproughton Interchange) and 53 (Whitehouse Interchange) where most sites are available for distribution, then industry and offices;
‘Ipswich South’ covers the cluster of sites around Raeburn Road and Sandyhill Lane where sites are quite large;
‘Ipswich North’ where there are very limited site opportunities in relatively peripheral locations; and
‘Ipswich South East’ around the Nacton Road corridor close to A14 junction 57 where there are concentrations of supply within large sites such as Ransomes Europark and Futura Park (the former Crane’s factory site).
51. In terms of office provision in Ipswich, there are several market segments. There are
large offices within the town centre occupied by finance sector companies, professional services companies and public administration uses (e.g. AXA, Willis, Birketts, Scrutton Bland, Ensors, Ipswich Borough Council, the County Court). There is also an office market associated with Felixstowe Port and this favours the A14 corridor, notably Ransomes Europark e.g. Medite Shipping. Serviced office space spans the two locations with facilities such as Felaw Maltings in central Ipswich (Waterfront) and Basepoint or Epsilon House on Ransomes Europark. The single largest completion over 2013-14 was the office space at Epsilon House on Ransomes Europark (see paragraph 37).
52. Industrial space for B2 and B8 uses is found mainly in the defined Employment Areas
which are dispersed around the outer part of the Borough. The largest Employment Areas are found around Ipswich Port (south of the town centre on the east and west banks of the River Orwell), in the west of the Borough (e.g. Hadleigh Road Industrial Estate, Boss Hall and Whitehouse Industrial Estate) and in the south-east (e.g. Ransomes Europark).
Employment forecasts
53. The number of jobs which exist in an area is measured through the Business Register and Employment Survey (BRES), which is the official source of employee and employment estimates by detailed geography and industry recommended by the Office for National Statistics (ONS). The survey is a sample of approximately 80,000 businesses which is then weighted to represent all sectors. This process results in estimates that are of better quality at higher levels of geography (e.g. a region) and lower quality as the geographies and concentration of businesses get smaller (e.g. rural districts).
54. The East of England Forecasting Model (EEFM) uses the BRES data and, using
international, national, regional and local trends, forecasts jobs for the eastern region and its constituent local authority areas. Baseline forecasts for districts and other areas within the east and south east of England are produced each year (known as
14
Suffolk Haven Gateway Employment Land Review 2009, GVA Grimley
13
runs) which are based on updated information. Figure 4 below shows the EEFM baseline forecast published in autumn 2013, based on BRES survey and ONS Workforce Jobs data up to 2012 and then forecasts to 2031.
Figure 4 Number of jobs in Ipswich 1991 to 2031
0.0
10.0
20.0
30.0
40.0
50.0
60.0
70.0
80.0
90.0
19
91
19
94
19
97
20
00
20
03
20
06
20
09
20
12
20
15
20
18
20
21
20
24
20
27
20
30
Year
Number of jobs ('000s)
Number of jobs ('000s)
Source: East of England Forecasting Model Baseline Run 2013
55. The 2013 EEFM baseline forecast estimates that Ipswich had 72,900 jobs at 2011 and
that this will rise by 6,100 to 79,000 by 2021 and by 11,400 to 84,300 by 2031. Each annual model run produces slightly different figures in response to changing trends in jobs locally, and the national and regional forecasts that are factored in. The 2012 EEFM baseline run forecast jobs growth of 12,700 from 2011 to 2031. The 2014 baseline run published in mid-January 2015 indicates growth of 12,400 jobs between 2011 and 2031, from 73,400 to 85,800.
56. Alternative scenarios exploring the effects of different impacts such as lower national
economic growth can be undertaken through the EEFM. Two scenarios, which have been produced alongside the baseline forecasts, are ‘high migration’, a higher growth scenario using Office for National Statistics migration assumptions, and a ‘lost decade’ scenario which assumes fifteen years of ‘sluggish growth’. The EEFM outputs for these scenarios from the 2012 and 2013 runs are compared with the baseline in Figure 5 below.
14
Figure 5 Comparison of alternative growth scenarios (table and graph)
East of England Forecasting Model Runs
Scenario Forecast 2012 run 2013 run
Baseline scenario
Jobs growth 2011-31 12,700 11,400
Demand for dwellings growth 2011-2031
14,300 14,400
Lost decade scenario
Jobs growth 2011-31 6,900 8,600
Demand for dwellings growth 2011-2031
15,200 14,100
High migration scenario
Jobs growth 2011-31 16,200 13,100
Demand for dwellings growth 2011-2031
15,200 15,600
Source: EEFM runs 2012 and 2013
57. These alternatives have been considered. The higher growth scenario is not
considered appropriate at present, given that the adopted Core Strategy set out a higher jobs target, with which delivery has not kept pace. A trend migration assumption has been applied to the Borough’s household forecasts. The lost decade scenario may be overly pessimistic in the light of a generally positive macroeconomic outlook and the efforts being taken locally and within the LEP region to actively support and deliver economic growth.
58. The baseline forecast has been used to inform the Core Strategy review as the most appropriate, up to date, modelled information available. In the 2013 run, the baseline figure falls between the growth forecasts for different scenarios for the period 2011 to 2031, which ranged from 8,600 jobs (lost decade scenario) to 13,100 jobs (high migration scenario). Core Strategy review policy CS13 sets a target of ‘in the region of
15
12,500 jobs’ to be created in Ipswich 2011-2031, reflecting the EEFM baseline runs 2012, 2013 and 2014, the Borough’s Economic Development Strategy, the Suffolk Growth Strategy and the New Anglia LEP Strategic Economic Plan.
59. The EEFM provides a more detailed breakdown of its jobs forecast for 2031 by sector. It is compared with the job figures for 2011 below (Figure 6), focusing on the sectors providing 500 or more jobs in either year. Significant sectors which are forecast to shrink over the period include public administration and manufacturing. The majority of the other sectors show continued forecast growth in employment.
Figure 6 Employment by sector in Ipswich (number of jobs), 2011 (actual) and 2031 (forecast)
Sector 2011 Jobs 2031 Jobs Change 2011-2031 (+ or -)
Health and care Retail Education Finance Public administration Transport – land, water & air Construction Hotels & restaurants Wholesale15 Professional services16 Business services Employment activities17 Arts & entertainment Other services General Manufacturing Utilities Real estate Computer related activity Transport Publishing & broadcasting Telecoms
12,200 7,800 6,900 6,300 4,700 4,300 3,900 3,800 3,800 2,800 2,500 2,300 2,300 1,900 1,500 1,300
900 900 800 500 500
13,400 11,400 6,600 6,800 4,100 5,100 4,600 4,800 4,000 4,700 4,000 2,900 3,100 1,800 1,100 1,000 1,200 1,300
600 500 500
+ + - + - + + + + + + + + - - - + + -
No change No change
Source: EEFM Baseline Run Autumn 2013
60. The sectors forecast to grow the most in absolute terms are retail, professional services, business services, health and care, and hotels and restaurants. In percentage terms, the sectors forecast to grow most are professional services, business services, retail, computer related activity and arts and entertainment. The growth sectors identified by the model correspond to a wide range of planning land use classes, including A1 retail, A2 financial and professional services, A3 restaurants, B1a office uses, B8 distribution, C1 hotels, C2 residential institutions e.g. hospitals and care homes, and D2 assembly and leisure. The B class uses only form one part of an overall jobs delivery strategy.
15
An example of wholesale activity is the sale of motor vehicles. 16
An example of professional services is legal services. 17
An example of employment activities is employment agencies.
16
The Ipswich labour supply and skills 61. There is no single agreed methodology for calculating objectively assessed
employment need. Various approaches can be used, such as considering labour demand based on employment change by sector, job gap analysis e.g. how many people are economically active and what level of provision is needed to reduce unemployment, and analysing development trends. The EEFM factors in variables including working age population and unemployment rate.
62. Ipswich has a working age (16-64) population of 87,566 people, which is proportionally
high at 65.7% of the total population compared with 61% in the rest of Suffolk (362,656). The majority of residents of working age in employment (58.5%) work full-time between 31-48 hours per week, which has remained consistent since 2001. The average full-time gross weekly pay is £455 but the average for female workers is significantly less at £38118.
63. The percentage of working age residents in employment in Ipswich is shown below in
Figure 7, compared with the East of England.
Figure 7 Working Age Population in Employment October 2008 to September 2013 (%) – Ipswich and Eastern region Time period Ipswich East of England
Oct 2012 – Sept 2013 77.2% 75.1%
Oct 2011 – Sept 2012 73.9% 74.3%
Oct 2010 – Sept 2011 69.1% 73.5%
Oct 2009 – Sept 2010 73.9% 73.5%
Oct 2008 – Sept 2009 77.3% 74.7% Source: Nomis (Update to September 2014 not available until late January 2015)
64. The proportion of the working age population (aged 16 to 64) in employment in Ipswich
has exceeded the equivalent proportion across the region from 2008 to 2010 and 2012 to 2013. However, there was a two year period from October 2010 to September 2012 during which the regional rate overtook the Ipswich rate.
65. Ipswich has a higher level of economically inactive people (22.7%) than the average
for Suffolk (21.2%) but lower than the national average (23.7%). It also has a higher percentage of people wanting a job (43.0%) than both the Suffolk (29.0%) and national average (23.7%). 5,500 residents of working age (5.7%) have never worked or are long-term unemployed.
66. Ipswich has consistently exceeded the regional rate of the working age population
claiming Job Seekers’ Allowance (JSA). The figures below in Figure 8 track the JSA rate back to 2006, to show the impact of the financial downturn on claimant rates. The number of claimants at November 2014 in Ipswich was 2,068.
18
Statistics from the State of Ipswich Annual Monitoring Report, June 2014
17
Figure 8 Working Age Population claiming Job Seekers’ Allowance December 2006-December 2013 (%) – Ipswich and Eastern region Date
Ipswich
East of England
November 2014 2.4% 1.5%
December 2013 3.5% 2.2%
December 2012 4.4% 2.9%
December 2011 4.8% 3.1%
December 2010 4.0% 2.8%
December 2009 4.8% 3.2%
December 2008 3.5% 2.3%
December 2007 2.8% 1.5%
December 2006 2.9% 1.8%
Source: Nomis 67. Turning to skills levels in the workforce, in 2011, Ipswich had considerably lower
working age skills levels, especially at degree level (28.9%) than the national average (31.2%), but this is higher than the county as a whole (27.2%).
68. In summary, Ipswich has a relatively large working age population and, over 2011-12,
a higher proportion of that population than the regional average was in employment (77.2%). However, Ipswich also has a higher rate of Job Seekers’ Allowance claimants than the regional average. Skills levels in 2011 compared positively with the county but were lower than the national level.
Strategy for Delivery
69. The Core Strategy Review and Site Allocations Plan set out an approach to land use
to support the delivery of the jobs target. Core Strategy Review policy CS13 states the aim to encourage the provision of ‘in the region of 12,500 jobs’ within the Borough to 2031, based on the baseline forecasts from the EEFM 2012-2014. The Core Strategy Review no longer outlines a ‘jobs-led strategy’, but it is a growth strategy, which recognises that the delivery of both jobs and housing is needed to meet needs and deliver sustainable economic growth.
70. The delivery of jobs will be supported through a range of actions, which include the
following:
Allocating over 30ha of land for B class uses (B1 business, B2 general industry and B8 storage and distribution) (policies CS13, SP5) – the sites demonstrate a theoretical capacity of over 10,000 jobs (see appendix 1);
Allocating sites in a range of locations around the Borough – within Mid, North West, South and South East Ipswich (policy SP5 and policies maps);
Allocating sites with a range of sizes and as single use or mixed use sites (policy SP5);
Protecting Employment Areas (policy DM25 and policies maps);
Allocating and safeguarding a strategic employment site at Futura Park (policy CS13);
Allocating a site for retail development in the Central Shopping Area (policy SP10) and putting in place policies to control out of centre development (policy DM23) – please refer to the Retail and Town Centre Topic Paper;
18
Allocating a town centre site for leisure development (policy SP7) – please see the Retail and Town Centre Topic Paper; and
Safeguarding land in the Education Quarter for education and ancillary uses, which could include spin-off businesses (policy SP12).
71. Policy SP5 of the Site Allocations Plan allocates 48.53ha of land for employment uses (in use classes B1 business, B2 general industry or B8 storage and distribution). Approximately 42ha of this is on sites earmarked for 100% employment use and mostly located outside IP-One, whilst 5.94ha is as part of mixed use developments within the IP-One area. It is estimated that this total area has a theoretical capacity to deliver over 10,000 new jobs (based on the Homes and Communities Agency’s Employment Densities Guide).
72. The 30ha figure in CS13 also takes account of the employment land capacity within the Borough. The allocations of land for B class employment through SP5 include sites allocated through the 1997 Local Plan which are still available; vacant and available sites within Employment Areas which are not specifically identified as expansion land for existing businesses; and two new greenfield sites in the far north-west and south-east of the Borough close to existing employment clusters at Whitehouse/Bury Road and Ransomes Europark/Nacton Road respectively.
73. Further jobs would be delivered through the Strategic Employment Site allocated
through clause d. of the Core Strategy policy CS13, and now known as ‘Futura Park’. Development in other sectors will also have a role in jobs growth, including new retail and leisure development on sites allocated through the Site Allocations Plan. These are referred to in clause c. of policy CS13: ‘allocating land for other employment-generating uses including education, leisure, tourism and hospitality, and retail, through the Site Allocations and Policies (incorporating IP-One Area Action Plan) development plan document.’
74. There are some jobs which have a less direct relationship with land, particularly land
specifically identified for employment uses. In particular, working from home is an example of where jobs are created from sources of land other than identified employment land. The Census shows that the number of people of working age working mainly from or at home in Ipswich in 2011 was 2,216.
75. In addition to delivery through land use, there are three key strategies currently being
implemented to promote and support economic growth in Ipswich, Suffolk and the New Anglia LEP area. They outline a whole range of measures, including bidding for Government funds such as Regional Growth Fund to improve infrastructure and remove barriers to growth, providing support for training and apprenticeships, identifying an inward investment strategy to attract businesses, and providing advice to businesses.
76. The New Anglia Local Enterprise Partnership (NALEP) promotes economic growth
across the area of Norfolk and Suffolk. It published a Strategic Economic Plan in 201419 following on from its document ‘Towards a Growth Plan’ in 2012. It identifies the key economic sectors in Norfolk and Suffolk as follows:
Advanced manufacturing
Energy
ICT
19
Releasing our Potential, NALEP Strategic Economic Plan 2014
19
Ports and logistics
Life sciences and biotechnology;
Digital and cultural creative industries;
Food, drink and agriculture;
Financial services;
Tourism
77. It identifies five of these as ‘high impact’ sectors which offer the opportunity for rapid growth. They are sectors in which the New Anglia region has national or international leadership or which link with the Government’s Industrial Strategy, and would benefit from focused support.
Advanced Manufacturing and Engineering employs over 24,500 people in more than 1,000 businesses and is worth £1.5bn pa in GVA (gross value added) to the New Anglia economy. Clusters include automotive, civil and military aviation and pharmaceuticals.
Agri-tech – using technology to add value to the agriculture, food and drink sector - was prioritised in the government’s Industrial Strategy. The sector offers huge commercial potential for New Anglia.
Energy employs 7,700 people directly in New Anglia, and thousands more indirectly, and is worth about £994m pa with a GVA per job of £129k. The long standing North Sea oil and gas industry is now expanding into offshore wind. There is a third nuclear plant proposed at Sizewell and several biomass plants are being developed across the New Anglia area.
ICT/Digital Culture. The ICT sector is worth £1.3bn to New Anglia, with over 1,400 companies employing 10,300 people and GVA of £131k per head pa. BT’s global research centre based at Martlesham has a cluster of other businesses around it, as do our universities.
Life Sciences is worth £132m pa and employs over 3,000 people in 200 businesses, with GVA of £122k per head. There is a world class research cluster at Norwich Research Park, with other research and business activity across the area covering everything from humans to horses, fish and plants.
78. The Strategic Economic Plan also identifies four ‘underpinning sectors’, which are the
largest employers in the new Anglia economy and which will continue to be supported in order to improve their productivity and competitiveness.
Agriculture and food and drink production employs over 10% of the workforce generating £2.2bn pa GVA. New Anglia farms produce 12% of all England’s cereal production and 20% of the UK’s vegetables.
Financial and insurance services contribute £3.1bn GVA or 13.4% of New Anglia’s total and employs almost 21,000 people (3.2% of employment). As well as regional businesses, Norwich and Ipswich host a concentration of national and international insurance companies.
Ports and logistics are worth £1.3bn to New Anglia and employ over 23,500 people. The Port of Felixstowe handles 40% of the country’s container traffic and its continued expansion needs good transport links. Ipswich is the country’s largest port for grain export; Great Yarmouth and Lowestoft and smaller ports serve the North Sea energy sector.
Tourism and culture employ about 74,000 people. Tourism is worth £1.3bn in GVA to New Anglia. The area has the Broads, the Norfolk and Suffolk coast, and special attractions like Newmarket, Centre Parcs and Dedham Vale. Norwich is ranked 6th in the UK for day visitors and many towns have strong tourism offers. Tourism is underpinned by a strong cultural offer including the Aldeburgh and Latitude festivals and, in Ipswich, examples such as Ip-art.
20
79. The current sector strengths in Ipswich stem from four key areas of activity which span both of the LEP’s categories above:
A relatively high volume of IT expertise, largely connected with BT’s research activity at Adastral Park within the Ipswich Policy Area;
The concentration of insurance expertise, which includes AXA and Willis as well as a range of other major insurance sector businesses;
Port and freight activity linked to Ipswich and Felixstowe Ports; and
Public sector activity, which includes Ipswich Hospital, the County and Borough Council headquarters, Suffolk New College, University Campus Suffolk and other public offices.
80. Further information on these sectors may be found in the Ipswich Economic Strategy
2013 (Chapter 5)20. They are also the most significant employers in Ipswich. The town exceeds the regional and national averages for employment in transport and communications, finance, business, IT, public administration, health and education. The sectors which have below the national average rate of representation in Ipswich include manufacturing, construction, distribution, hotels and restaurants, and other services. However, the Council considers that additional sectors have the potential to grow, including energy, ICT and creative and tourism.
81. The five ‘high impact’ sectors will be ‘…encouraged to develop synergy with emerging
sectors, such as looking at how the existing strong tourism offer can be supported by the information economy and creative industries’ (Strategic Economic Plan paragraph 2.60). The Strategy states that, in addition, continued support will be provided to the key sectors not prioritised. New Anglia LEP submitted its Strategic Economic Plan to Government in March 2014 and as a result secured funding from the Government for projects aimed at unlocking growth. This ‘Growth Deal’ amounts to around £300 million investment in the whole LEP area to 2021, comprising £60m of new Government funding, over £20m provisional allocation for future projects, confirmation of a previous award of £91.49m for transport schemes, additional investment from the private and public sector and a further £20 million low-cost borrowing facility (LEP press release July 2014)21. Ipswich will benefit from a share of the Growing Business Fund (£12m for SMEs to 2020), New Anglia Growth Hub, Growing Places Fund and, provisionally, measures to improve traffic flow in the town.
82. The Suffolk Growth Strategy, which is a joint project between the County Council and
Suffolk Districts and Boroughs including Ipswich Borough Council, identifies the same sectors as being key to future growth in Suffolk. A delivery plan is currently being developed to set investment priorities, the principal activities to be undertaken and the key targets to be achieved. As well as guiding the work of the local authorities, it is used as a lobbying document and a prospectus for the County. Groups such as the Suffolk Leaders’ Board and Suffolk Growth Group are taking it forward. The Suffolk Growth Group has identified five areas for future work including projects around skills and inward investment, with a focus on bringing sites forward.
20
Ipswich Economic Development Strategy 2012-2026 21
http://www.newanglia.co.uk/wp-content/uploads/2014/07/Growth-Deal-announcement-July-7-2014-V2.pdf
21
83. The draft implementation plan for the Ipswich Economic Strategy, September 201322, identifies actions the Council is taking or will take to support the Ipswich economy. Activities include setting up a Jobs and Skills fund which covers capital and revenue spending, implementing the City Deal to address skills shortages, and working to attract inward investment.
84. An inward investment strategy is currently being devised. It will involve the initiation,
design, delivery and management of projects and interventions to identify, attract and secure significant investment into Ipswich. There are two main fields of activity. The first is the account management of existing larger and also high growth businesses already in Ipswich. Projects to be considered with each larger existing client could include:
Opportunities within the Division to whom the Ipswich operation operates: winning extra manufacturing/corporate services responsible for existing Ipswich-made products (or Ipswich provided services, e.g. Financial and Insurance); winning increasingly deeper R&D responsibility, winning responsibility for a different range of products/services (some needing different technologies), securing regional, European or Global marketing responsibility.
Parent Group opportunities: Parent Group decision to co-locate/locate nearby another manufacturing or services division, to centralise regional or global corporate services functions at or nearby existing operations, to participate in collaborative research with Universities in Suffolk or to use local supply chain suppliers more globally.
Ipswich is particularly rich in foreign direct investment - 47 foreign companies employ around 6,500 staff. In addition, 45 businesses are owned by companies headquartered elsewhere in UK, employing over 4,800 in Ipswich. Also 20 UK owned and Ipswich headquartered companies, each employing over 100, in all employ around 4,300 in Ipswich. Many of these 112 existing ‘larger’ clients have the scale/track record to grow further, with driven account management.
85. Another area of work is new projects focused on markets outside Suffolk from clients
with no existing inward investment activities in Ipswich (including UK and foreign owned clients with local presence currently solely for the local market). This includes:
High impact sectors as a particular focus for targeted interventions, building on the ‘cluster’ effect of these existing strong sectors in Suffolk: Advanced Manufacturing and Engineering, Agri-tech, Energy, ICT & Digital Creative, Environmental, Freight & logistics.
Geographic focus: targeting growing companies in locations with significantly higher occupation costs and salary costs, e.g. London, Cambridge, and Oxford.
Supply chain focus: by increased relationship management with existing companies, to jointly market with them the opportunity for their supply chain vendors to establish in Suffolk or to add new technologies if already located in Suffolk.
22
https://democracy.ipswich.gov.uk/ieIssueDetails.aspx?IId=3164&PlanId=0&Opt=3#AI2024
22
86. The Borough is working very closely with the New Anglia Growth Hub to jointly develop growing Small and Medium Enterprises (SME’s), in certain cases to build on the supply chain requirements of the larger companies. The Borough is also progressing collaborative research between SME’s and University Campus Suffolk, actively seeking Innovate UK (formerly Technology Strategy Board) support. It is also supporting Annual Programmes at the Eastern Enterprise Hub to develop entrepreneurs and with the Papworth Trust to provide apprenticeships.
87. Another key area of activity is around skills. The sectors have specific needs, amongst
which a skilled labour force is the primary concern. Equipping the labour force with the necessary skills is a key focus of the Greater Ipswich City Deal. More than £18 million is being invested by the government, businesses and local authorities in equipping people with the skills local businesses need to grow as part of a local approach to skills. The investment will be used to fund projects including a new youth employment centre in Ipswich and an incentive scheme to encourage businesses to invest in training23.
88. The Council’s published Duty to Co-operate Statement24 also outlines how the
strategic issue of delivering employment growth is being progressed through joint work. In addition to the means outlined above, there is joint work with neighbouring authorities through the Ipswich Policy Area Board (e.g. to commission the Ipswich functional economic area Employment Land Needs Assessment) and there are regular meetings held between the economic development portfolio holders of Suffolk local authorities. Relationship to housing growth
89. The adopted Core Strategy 2011 pursued a ‘jobs-led’ approach to growth based on the (now abolished) Regional Spatial Strategy for the East of England. The ambitious scale of growth set out in the RSS and the Core Strategy has not been achieved to date, against a background of global recession and weakness in the Eurozone as one of the UK’s key markets (see National Economic Context). Over the same period, housing completions have continued to take place (but at a lower level than planned) whilst jobs numbers in Ipswich have fluctuated. This serves to demonstrate the complexity of the relationship between jobs and housing.
90. The NPPF places the emphasis on planning proactively to meet the development needs of business, which this paper addresses. However, the relationship between housing and jobs need and growth also needs to be considered.
91. The approach to estimating future growth needs in Ipswich is supported by the use of two models. For population and household projections, the Pop Group model has been used and a figure based on trend migration selected (see Housing Topic Paper). This is considered a sound basis for generating the estimate of the future housing requirement, 13,500 dwellings 2011-2031 (CS7), which underpins the Core Strategy review.
92. For jobs, the East of England Forecasting Model has been used (EEFM – see above). Although it is an economic model, it also has a demographic element and generates population figures. The jobs target included in the Core Strategy review is in the region
23
https://www.gov.uk/government/news/greater-ipswich-city-deal-multi-million-pound-investment-in-skills-secured 24
https://www.ipswich.gov.uk/sites/www.ipswich.gov.uk/files/duty_to_co-operate_statement_nov_14.pdf
23
of 12,500 jobs (CS13), and is supported by the evidence of the 2012-2013 baseline outputs of the model. It is also informed by interventions being made to support jobs delivery as outlined above.
93. The 2013 EEFM baseline autumn run indicates a jobs growth figure of 11,400 jobs between 2011 and 2031, a ‘demand for dwellings’ increase of 14,400 dwellings and a household increase of 13,900. These figures are close to those identified through the Core Strategy (in the region of 12,500 jobs and 13,550 homes 2011 to 2031) and serve as an indication that the relative scales of housing and employment growth set out in the Core Strategy review are reasonable and appropriate.
Conclusion
94. The Core Strategy review therefore identifies through policy CS13 a target to deliver ‘in the region of 12,500 jobs’ across Ipswich Borough 2011 to 2031. This is based on the baseline forecasts produced by the East of England Forecasting Model 2012 to 2013 and regional, county and local strategies to support economic growth and delivery.
95. The delivery of jobs will be supported through the land target set out within revised
policy CS13, which is for at least 30ha for business and industrial uses in Use Classes B1, B2 and B8 to be made available to 2031. In addition, the policy retains the Strategic Employment Site Allocation at Futura Park (the former Crane’s factory) and recognises the contribution to jobs provision that will be made through other employment-generating land uses such as education and retail uses.
96. Work has been commissioned through the Ipswich Policy Area Board to assess
employment land needs across the whole Ipswich functional economic area (i.e. Ipswich plus Suffolk Coastal, Babergh and Mid Suffolk areas). This is expected to report in May 2015. It will help to inform future joint approaches to growth.
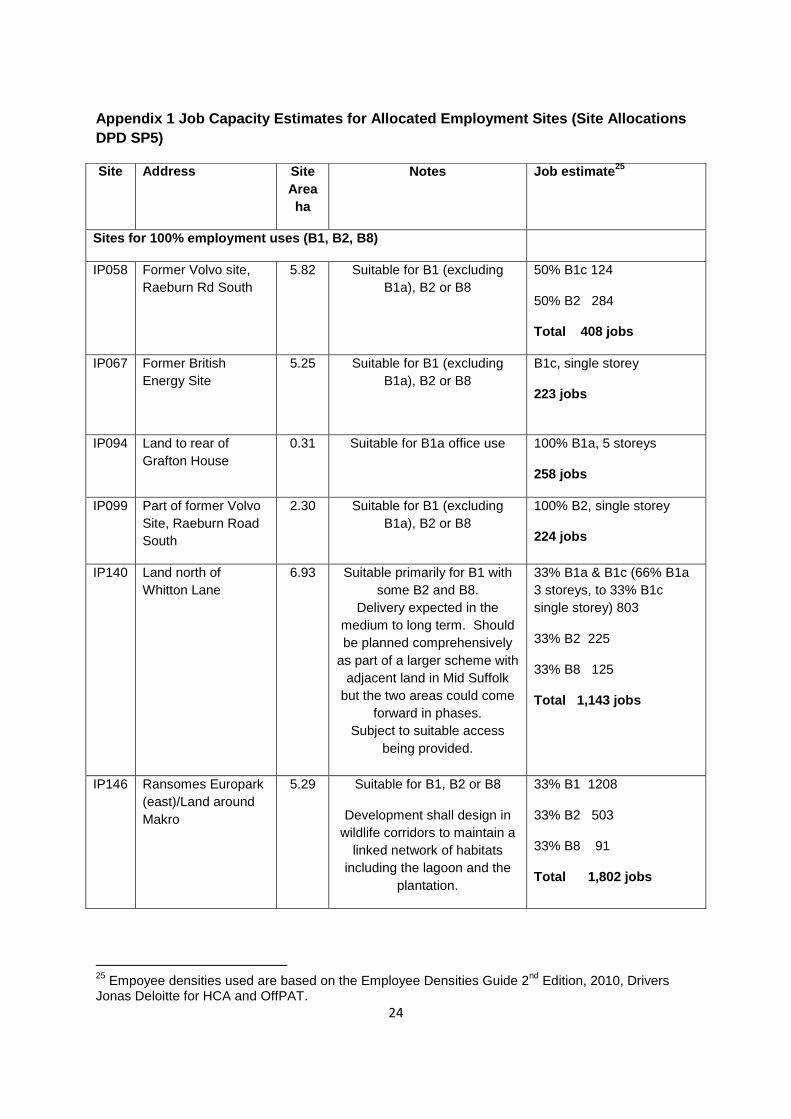
24
Appendix 1 Job Capacity Estimates for Allocated Employment Sites (Site Allocations
DPD SP5)
25
Empoyee densities used are based on the Employee Densities Guide 2nd
Edition, 2010, Drivers Jonas Deloitte for HCA and OffPAT.
Site Address Site
Area
ha
Notes Job estimate25
Sites for 100% employment uses (B1, B2, B8)
IP058 Former Volvo site,
Raeburn Rd South
5.82 Suitable for B1 (excluding
B1a), B2 or B8
50% B1c 124
50% B2 284
Total 408 jobs
IP067 Former British
Energy Site
5.25 Suitable for B1 (excluding
B1a), B2 or B8
B1c, single storey
223 jobs
IP094 Land to rear of
Grafton House
0.31 Suitable for B1a office use 100% B1a, 5 storeys
258 jobs
IP099 Part of former Volvo
Site, Raeburn Road
South
2.30 Suitable for B1 (excluding
B1a), B2 or B8
100% B2, single storey
224 jobs
IP140 Land north of
Whitton Lane
6.93 Suitable primarily for B1 with
some B2 and B8.
Delivery expected in the
medium to long term. Should
be planned comprehensively
as part of a larger scheme with
adjacent land in Mid Suffolk
but the two areas could come
forward in phases.
Subject to suitable access
being provided.
33% B1a & B1c (66% B1a
3 storeys, to 33% B1c
single storey) 803
33% B2 225
33% B8 125
Total 1,143 jobs
IP146 Ransomes Europark
(east)/Land around
Makro
5.29 Suitable for B1, B2 or B8
Development shall design in
wildlife corridors to maintain a
linked network of habitats
including the lagoon and the
plantation.
33% B1 1208
33% B2 503
33% B8 91
Total 1,802 jobs
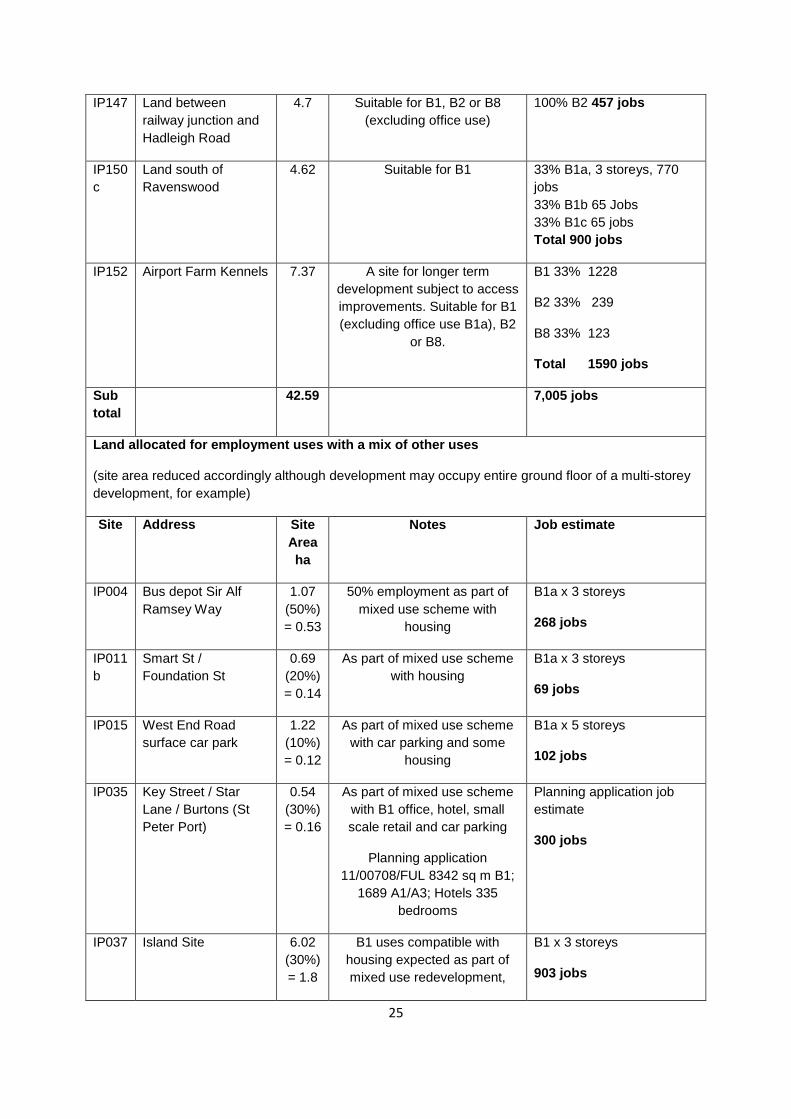
25
IP147 Land between
railway junction and
Hadleigh Road
4.7 Suitable for B1, B2 or B8
(excluding office use)
100% B2 457 jobs
IP150
c
Land south of
Ravenswood
4.62 Suitable for B1 33% B1a, 3 storeys, 770
jobs
33% B1b 65 Jobs
33% B1c 65 jobs
Total 900 jobs
IP152 Airport Farm Kennels 7.37 A site for longer term
development subject to access
improvements. Suitable for B1
(excluding office use B1a), B2
or B8.
B1 33% 1228
B2 33% 239
B8 33% 123
Total 1590 jobs
Sub
total
42.59 7,005 jobs
Land allocated for employment uses with a mix of other uses
(site area reduced accordingly although development may occupy entire ground floor of a multi-storey
development, for example)
Site Address Site
Area
ha
Notes Job estimate
IP004 Bus depot Sir Alf
Ramsey Way
1.07
(50%)
= 0.53
50% employment as part of
mixed use scheme with
housing
B1a x 3 storeys
268 jobs
IP011
b
Smart St /
Foundation St
0.69
(20%)
= 0.14
As part of mixed use scheme
with housing
B1a x 3 storeys
69 jobs
IP015 West End Road
surface car park
1.22
(10%)
= 0.12
As part of mixed use scheme
with car parking and some
housing
B1a x 5 storeys
102 jobs
IP035 Key Street / Star
Lane / Burtons (St
Peter Port)
0.54
(30%)
= 0.16
As part of mixed use scheme
with B1 office, hotel, small
scale retail and car parking
Planning application
11/00708/FUL 8342 sq m B1;
1689 A1/A3; Hotels 335
bedrooms
Planning application job
estimate
300 jobs
IP037 Island Site 6.02
(30%)
= 1.8
B1 uses compatible with
housing expected as part of
mixed use redevelopment,
B1 x 3 storeys
903 jobs
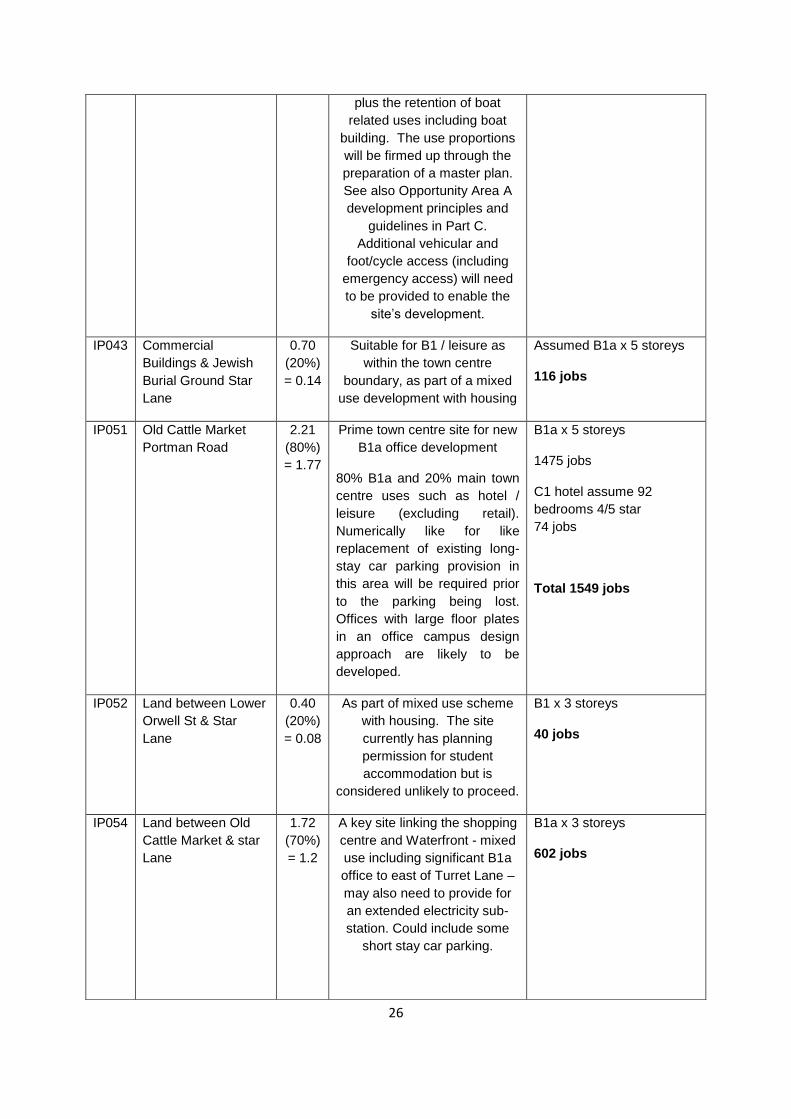
26
plus the retention of boat
related uses including boat
building. The use proportions
will be firmed up through the
preparation of a master plan.
See also Opportunity Area A
development principles and
guidelines in Part C.
Additional vehicular and
foot/cycle access (including
emergency access) will need
to be provided to enable the
site’s development.
IP043 Commercial
Buildings & Jewish
Burial Ground Star
Lane
0.70
(20%)
= 0.14
Suitable for B1 / leisure as
within the town centre
boundary, as part of a mixed
use development with housing
Assumed B1a x 5 storeys
116 jobs
IP051 Old Cattle Market
Portman Road
2.21
(80%)
= 1.77
Prime town centre site for new
B1a office development
80% B1a and 20% main town
centre uses such as hotel /
leisure (excluding retail).
Numerically like for like
replacement of existing long-
stay car parking provision in
this area will be required prior
to the parking being lost.
Offices with large floor plates
in an office campus design
approach are likely to be
developed.
B1a x 5 storeys
1475 jobs
C1 hotel assume 92
bedrooms 4/5 star
74 jobs
Total 1549 jobs
IP052 Land between Lower
Orwell St & Star
Lane
0.40
(20%)
= 0.08
As part of mixed use scheme
with housing. The site
currently has planning
permission for student
accommodation but is
considered unlikely to proceed.
B1 x 3 storeys
40 jobs
IP054 Land between Old
Cattle Market & star
Lane
1.72
(70%)
= 1.2
A key site linking the shopping
centre and Waterfront - mixed
use including significant B1a
office to east of Turret Lane –
may also need to provide for
an extended electricity sub-
station. Could include some
short stay car parking.
B1a x 3 storeys
602 jobs
27
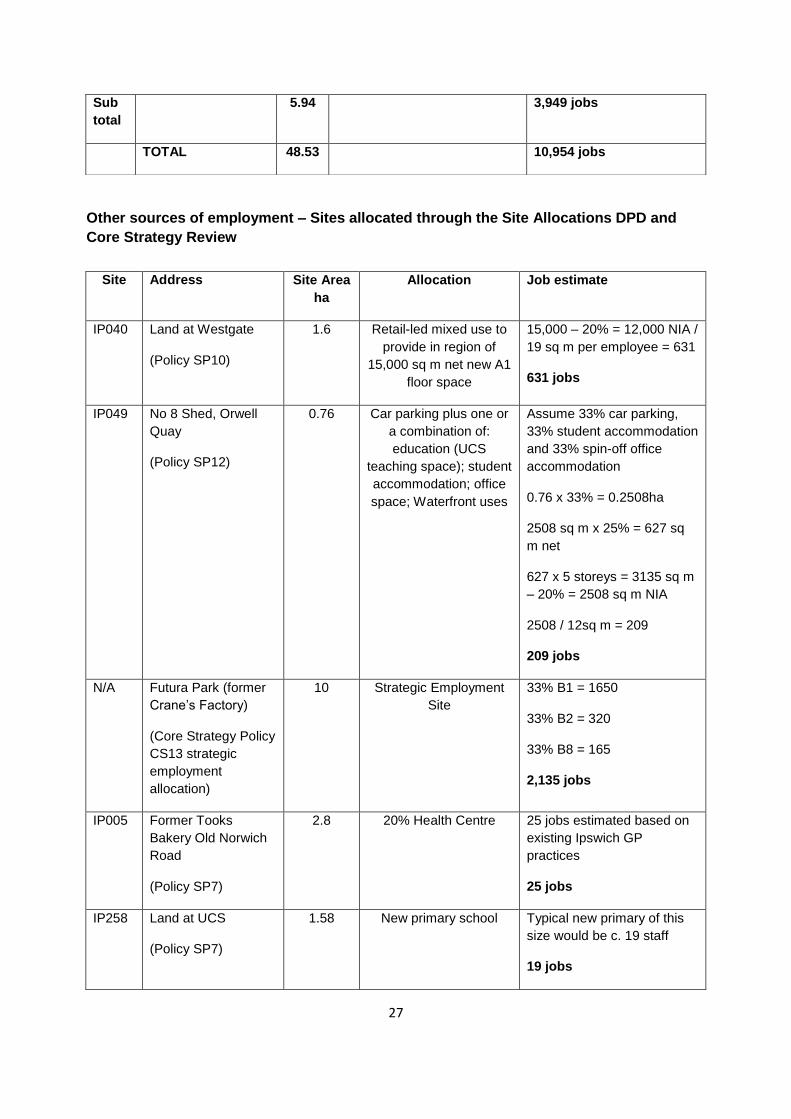
Other sources of employment – Sites allocated through the Site Allocations DPD and
Core Strategy Review
Sub
total
5.94 3,949 jobs
TOTAL 48.53 10,954 jobs
Site Address Site Area
ha
Allocation Job estimate
IP040 Land at Westgate
(Policy SP10)
1.6 Retail-led mixed use to
provide in region of
15,000 sq m net new A1
floor space
15,000 – 20% = 12,000 NIA /
19 sq m per employee = 631
631 jobs
IP049 No 8 Shed, Orwell
Quay
(Policy SP12)
0.76 Car parking plus one or
a combination of:
education (UCS
teaching space); student
accommodation; office
space; Waterfront uses
Assume 33% car parking,
33% student accommodation
and 33% spin-off office
accommodation
0.76 x 33% = 0.2508ha
2508 sq m x 25% = 627 sq
m net
627 x 5 storeys = 3135 sq m
– 20% = 2508 sq m NIA
2508 / 12sq m = 209
209 jobs
N/A Futura Park (former
Crane’s Factory)
(Core Strategy Policy
CS13 strategic
employment
allocation)
10 Strategic Employment
Site
33% B1 = 1650
33% B2 = 320
33% B8 = 165
2,135 jobs
IP005 Former Tooks
Bakery Old Norwich
Road
(Policy SP7)
2.8 20% Health Centre 25 jobs estimated based on
existing Ipswich GP
practices
25 jobs
IP258 Land at UCS
(Policy SP7)
1.58 New primary school Typical new primary of this
size would be c. 19 staff
19 jobs
28
26
No guidance on typical Net Internal Area for D2 use therefore -20% used as for B1a offices
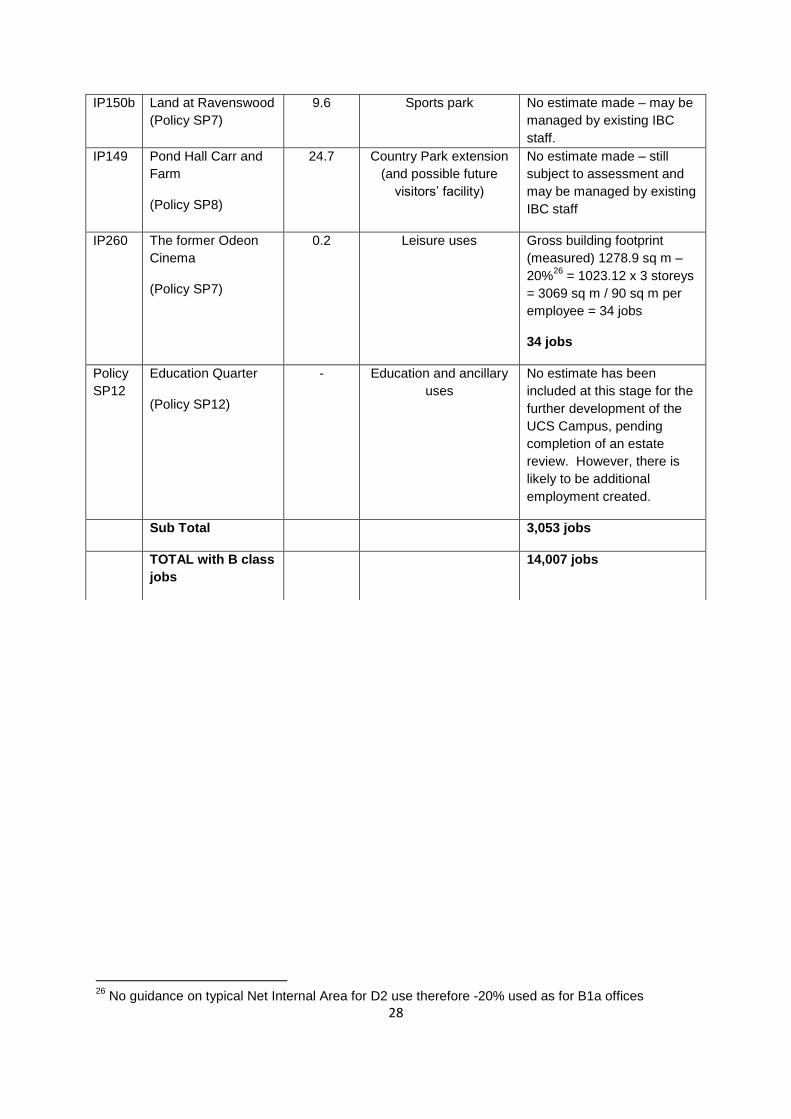
IP150b Land at Ravenswood
(Policy SP7)
9.6 Sports park No estimate made – may be
managed by existing IBC
staff.
IP149 Pond Hall Carr and
Farm
(Policy SP8)
24.7 Country Park extension
(and possible future
visitors’ facility)
No estimate made – still
subject to assessment and
may be managed by existing
IBC staff
IP260 The former Odeon
Cinema
(Policy SP7)
0.2 Leisure uses Gross building footprint
(measured) 1278.9 sq m –
20%26
= 1023.12 x 3 storeys
= 3069 sq m / 90 sq m per
employee = 34 jobs
34 jobs
Policy
SP12
Education Quarter
(Policy SP12)
- Education and ancillary
uses
No estimate has been
included at this stage for the
further development of the
UCS Campus, pending
completion of an estate
review. However, there is
likely to be additional
employment created.
Sub Total 3,053 jobs
TOTAL with B class
jobs
14,007 jobs
Recommended


![C1 Topic 3 [Un]Employment](https://img.dokumen.tips/doc/110x75/55a3728c1a28ab7d5d8b45b4/c1-topic-3-unemployment.jpg)

