Employee Financial Literacy and Retirement Plan Behavior:
A Case Study
Robert Clark, Annamaria Lusardi, and Olivia S. Mitchell
June 2016
PRC WP2016
Pension Research Council Working Paper
Pension Research Council
The Wharton School, University of Pennsylvania
3620 Locust Walk, 3000 SH-DH
Philadelphia, PA 19104-6302
Tel.: 215.898.7620 Fax: 215.573.3418
Email: [email protected]
http://www.pensionresearchcouncil.org
Research support for the work reported herein was provided by the Pension Research Council/Boettner Center at the
Wharton School of the University of Pennsylvania as well as the Office of Employee Benefits at the Federal Reserve
System that provided the data for the study. We are grateful for excellent programming assistance from Yong Yu,
and for helpful suggestions and guidance from the staff of the Federal Reserve’s Office of Employee Benefits and
Ryan Peters. We are also grateful to the editor and two anonymous referees. Opinions and conclusions expressed
herein are solely those of the authors and do not represent the opinions or policy of the funders or any other
institutions with which the authors are affiliated. ©2016 Clark, Lusardi, and Mitchell. All rights reserved.

Employee Financial Literacy and Retirement Plan Behavior:
A Case Study
Abstract
This paper uses administrative data on all active employees of the Federal Reserve System to
examine participation in and contributions to the Thrift Saving Plan, the System’s defined
contribution (DC) plan. We link to administrative records a unique employee survey of
economic/demographic factors including a set of financial literacy questions. Not surprisingly,
Federal Reserve employees are substantially more financially literate than the population at
large. Most importantly, financially savvy employees are also most likely to participate in their
DC plan. Sophisticated workers contribute three percentage points more of their earnings to the
DC plan than do the less knowledgeable, and they hold more equity in their pension accounts.
We examine changes in employee plan behavior one year after employees completed a Learning
Module about retirement planning, and we compare it to baseline patterns. We find that those
employees who completed the Learning Module were more likely to start contributing and less
likely to have stopped contributing to the DC plan post-survey. In sum, employer-provided
learning programs are shown to significantly impact employee retirement saving decisions and
consistent with a lot of other research, higher levels of financial literacy is found to have a
beneficial impact on retirement saving patterns.
Robert Clark
Poole College of Management, Box 7229
NC State University
Raleigh, NC 27696
e-mail: [email protected]
Olivia S. Mitchell
Wharton School, University of Pennsylvania
3620 Locust Walk, 3000 SH-DH
Philadelphia, PA 19104
e-mail: [email protected]
Annamaria Lusardi The George Washington University School
of Business
2201 G Street, Suite 450E, Duquès Hall
Washington, DC 20052
e-mail: [email protected]

1
Employee Financial Literacy and Retirement Plan Behavior:
A Case Study
Employers offer pension plans in the workplace to attract, retain, motivate, and ultimately
retire their employees. Nevertheless, many workers are quite uninformed about financial
matters, both in the United States and around the world (Lusardi and Mitchell, 2014). Unless
employees understand their plans and the incentives imbedded in them, they are unlikely to value
them, save, invest, and manage their retirement portfolios appropriately. For this reason,
employers have an interest in providing financial education to help workers better understand
and make better decisions about their retirement savings.
Previous evidence has shown that workplace-based financial education programs can be
beneficial. For instance Allen et al. (2016) assessed employer-provided retirement seminars and
showed that these seminars boosted financial literacy and influenced people’s ability to plan for
retirement.1 In our previous research (Clark, Lusardi and Mitchell, 2016; Lusardi, Michaud and
Mitchell, 2016 forthcoming), we examined whether financial literacy is linked to investment
returns and we found that more financially literate employees are better investors. Moreover the
higher returns earned by the more financially savvy are an important contributor to household
wealth inequality.
Nevertheless, few studies to date have focused on how employer-provided learning
modules can shape pension plan participation, contributions, and investment patterns. Below, we
use a unique dataset on employees of the US Federal Reserve (FR) System provided by the
1Other studies on workplace financial education programs include Bernheim and Garrett (2003); Bayer,
Bernheim, and Sholz (2009); Clark, d'Ambrosio, McDermed, and Sawant (2006); and Clark, Morrill, and
Allen (2012a, b; 2014). Clark and Lusardi (2012) examine the business case for such programs and
present best practices used in employer-provided programs. For recent reviews, see Lusardi and Mitchell
(2007, 2014, 2015).

2
Office of Employee Benefits of the Federal Reserve System (OEB). These data were collected in
connection with an on-line employer-provided educational module (hereafter, the Learning
Module), which included a survey inquiring about FR employees’ financial literacy. The linked
data allow us to study the saving and investment patterns of the more- versus less-financially
literate segments of employees who were offered the opportunity to save in a defined
contribution (DC) plan. Specifically, we combine administrative records with a survey
evaluating workers’ financial knowledge. With these data, we can examine whether financial
literacy is associated with higher participation and contribution rates in the employer plan. We
also evaluate, for those who participate in the program, whether financial literacy influences
saving responses after exposure to a learning module.
As one might expect, we find that FR employees perform better on the financial literacy
survey compared to average Americans, and they also save at substantially higher rates. As in
other studies, marital status, salary, tenure, and financial literacy are all associated with greater
plan participation, and DC contribution levels are influenced by workers’ age, salary, and
financial literacy. We also find that more financially knowledgeable employees are much more
likely to participate in their retirement saving plan, contribute a higher percentage of their
salaries, and hold more equity in their DC retirement accounts. While this correlation is not
definitively causal, we present some results suggesting that the relationships are real and not
merely associations.
An important contribution of this research is that we show that participation in the
Learning Module had large and significant effects on the retirement saving decisions of FR
employees. Of those not participating in the retirement savings plan at baseline, employees who
took the Learning Module had a 4.6 probability of starting to contribute post-Module, or 40

3
percent higher than their counterparts. Of those who stopped participation, those who took the
Module had a 3.8 percentage point change of stopping contributions, or half that of their
counterparts. We also find that those who took the Module contributed 1.0 percent more of their
salaries post-Module, for an improvement of 12 percent, and they boosted their equity share by
3.7 percentage points (compared to a baseline of 57.2 percent, or a 6.5 percent change). When
we attenuate potential sample selection issues using inverse propensity weighting, the increases
in contributions and equity shares are even larger. Those taking the Module contributed 11
percent of their salaries, more than doubling their pre-Module rates, and increased their equity
share by 6.3 percentage points, for an 11 percent change. To summarize, the employer did have a
positive impact on participation, contributions, and allocation to riskier assets as a result of
implementing the Learning Module.
Data and Methods
For this case study of FR employees, we focus on three measures of pension plan
behavior: participation in the DC plan, the percent of salary contributed by those making
contributions, and portfolio allocations by plan participants. All FR employees are covered by a
relatively generous defined benefit (DB) plan and Social Security. In addition, the FR System
offers its employees the opportunity to participate in a DC plan. The investment menu includes
stock and bond index funds, lifestyle funds (conservative, moderate, aggressive), international
and emerging market funds, and a real estate fund. Approximately 84 percent of the employees
studied contributed to the DC plan.2
Anonymized pension plan data were drawn from administrative records for over 21,000
FR employees across the U.S., as of September 2013. The items provided included each
2 See also Clark, Lusardi and Mitchell (2014, 2016).

4
employee’s contribution rates and investment allocations, as well as other items including sex,
age, marital status, job tenure, salary, and DC plan balance. In October 2013, we also fielded an
internet survey on financial knowledge, enabling us to link survey responses to the
administrative data. Subsequently the employer released to its workforce a Learning Module on
the DC plan benefit offerings.3 The goal for this Learning Module was to help workers assess
their retirement spending needs; learn how Social Security and personal savings as well as the
employer’s retirement offerings interacted; and evaluate their DC plan savings. Below, we use
the merged dataset to estimate empirical relationships between financial literacy, DC pension
contributions, and investment allocations. We were granted access to similar administrative
records in 2014, which allowed us to measure changes in retirement plan participation and
contribution rates for those who participated in the Learning Module compared to those who did
not. Thus, a distinguishing feature of this paper is our ability to use administrative records to
track actual behavioral changes before and after participation in the Learning Module,
conditioned on financial literacy levels for those taking the survey. We were not able to
randomize who was exposed to the Learning Module, yet our empirical work seeks to address
potential selection issues to the extent possible.
Measuring Financial Literacy
With our input, the OEB designed and fielded an online survey on employee financial
knowledge levels as part of a Learning Module provided to all employees via the FR’s internal
email system. In this section, we discuss the questions we have used to measure financial literacy
while in the following section, we describe the employer’s educational module. Of
3 For additional detail on implementation see Clark, Lusardi, and Mitchell (2014).

5
approximately 21,000 active workers, 16 percent responded to the invitation to take the survey.
This response rate is similar to those in other voluntary and non-incentivized internet surveys.4
To compare the respondent sample with non-respondents, we draw on information
provided in the administrative data. The first column of Table 1 presents summary statistics from
the administrative data for all employees. Over two-thirds of all employees contributed to the
pretax plan alone, and eight percent participated only in the Roth (after tax) plan. Interestingly,
about nine percent contributed to both types of plans.
[Table 1 here]
Columns 2 and 3 report means for individuals who did versus did not complete the
Learning Module. Module respondents contributed 2 percentage points more of their salaries to
the DC plan.5 They also had significantly larger plan balances, held 2.4 percentage points more
equity, were about four years older, and had worked for the institution about three years longer
than non-respondents. Accordingly, it appears that the employees who participated in the
Learning Module were likely to be more financially sophisticated than those who did not, a point
to which we return below.
Financial Literacy Questions. We measured respondent financial knowledge using questions
that have been tested in many other surveys (correct answers are provided in bold):
Interest Rate: Suppose you had $100 in a savings account and the interest rate was 2%
per year. After five years, how much do you think you would have in the account if you
left the money to grow? More than $110, Exactly $110, Less than $110, DK, RF6
4 This response rate is in line with what is found in many other online, non-mandatory, and non-
incentivized surveys (c.f., Clark, Maki, and Morrill (2014); Constant Contact
http://support2.constantcontact.com/articles/FAQ/2344; Benchmark
http://www.benchmarkemail.com/help-FAQ/answer/what-is-a-typical-survey-response-rate;
Surveygizmo, http://www.surveygizmo.com/survey-blog/survey-response-rates/ ). 5 Allen et al. (2016) also find that participation in retirement seminars significantly increased the financial
literacy and knowledge of retirement plans of older workers and that this greater knowledge affected
retirement planning. 6 DK refers to “Do not know” and RF to “refuse to answer.”

6
Inflation: Imagine that the interest rate on your savings account was 1% per year and
inflation was 2% per year. After one year, how much would you be able to buy with the
money in this account? More than today, Exactly the same, Less than today, DK, RF
Risk: Is this statement True or False? Buying a single company’s stock usually provides
a safer return than a stock mutual fund. True, False, DK, RF
Tax Offset: Assume you were in the 25-percent tax bracket (you pay $0.25 in tax for
each dollar earned) and you contributed $100 pretax to an employer’s 401(k) plan. Your
take-home pay (what’s in your paycheck after all taxes and other payments are taken out)
will then: Decline by $100, Decline by $75, Decline by $50, Remain the same, DK, RF
Match: Assume that an employer matched employee contributions dollar for dollar. If
the employee contributed $100 to the 401(k) plan, his account balance in the plan
including his contribution would: Increase by $50, Increase by $100, Increase by $200,
Remain the same, DK, RF
The first question measures people’s ability to do a simple interest rate calculation; the second
tests people’s understanding of inflation; and the third is a joint test of knowledge about “stocks”
and “stock mutual funds” as well as knowledge of risk diversification, since the correct response
requires the respondent to know both what a stock is and that a mutual fund is comprised of
many stocks. The first three questions were developed by Lusardi and Mitchell (2008; 2011a)
and used in the Health and Retirement Study and many other US national surveys including the
National Longitudinal Survey of Youth (Lusardi, Mitchell and Curto, 2010), the American Life
Panel (Lusardi and Mitchell, 2009), and the US National Financial Capability Study (Lusardi,
2011; Lusardi and Mitchell, 2011b). They have also been fielded in fourteen other countries.7.
Previous research has demonstrated that very few Americans can answer all of the first
three questions correctly (with similar results in other countries). Not many more know the
correct answers to two of the three questions (Lusardi and Mitchell, 2014). By contrast, the FR
workforce is substantially more financially knowledgeable (as measured by the first three
queries) than the general population, an unsurprising result given that the workforce consists of
financial sector employees. Specifically, 75 percent of the respondents answered the Interest
7 For the list of countries, see http://gflec.org/initiatives/flat-world/. See also the discussion in Lusardi and
Mitchell (2011c).
7
Rate question, 91 percent the Inflation question, and 85 percent the Risk question correctly. This
can be compared to substantially lower correct response rates in other surveys. For example,
Americans in the 2012 National Financial Capability Study (NFCS) averaged 75, 61, and 48
percent correct on the interest, inflation, and risk diversification questions.8
The last pair of financial knowledge questions, developed by Clark, Maki, and Morrill
(2014), proved more difficult, even for this relatively-sophisticated employee group. These
queries required respondents to understand how employer and employee contributions influence
pension accumulations, taking into account the tax implications of worker pre-tax contributions.
In the Tax Offset question, the employee needed to understand that the tax-deferred aspect of
own contributions reduces the net cost of payments into the plan. Here, only 43 percent of
respondents answered correctly. The Match question required the employee to know that a
dollar-for-dollar match means that $100 of own contributions would generate an equal employer
contribution. This last question was easier to answer, and 76 percent of FR employees scored
correctly.
As is conventional, we sum the correct answers to these questions to produce a Financial
Knowledge Index for each employee respondent. This Index ranges from 0 to 5, with a mean of
3.7 and a standard deviation of 1.2.9 One-third of the FR respondents answered all five questions
correctly, and just under two percent (46 respondents) cannot answer any question correctly.
The proportion answering each question correctly is shown in Table 2 along with the average
number of correct answers.
[Table 2 here]
8 The NFCS is also an online survey; see
http://www.usfinancialcapability.org/downloads/NFCS_2012_Report_Natl_Findings.pdf 9 Inasmuch as respondents to the Learning Module are more likely to be financially knowledgeable than
non-respondents, it is safe to infer that the average level of financial literacy for the entire FR labor force
is lower than the respondent average.

8
Financial Literacy Heterogeneity by Employee Characteristics. Prior research has shown that
the level of financial literacy is associated with a higher probability of planning for retirement,
participating in retirement saving plans, and contributing to these plans. Yet little attention has
been devoted to how financial literacy varies by employee characteristics and how this variation
might influence econometric results. Table 3 illustrates the distribution of financial literacy as
measured by our literacy index across economic and demographic variables. Interestingly, we
find little difference in financial literacy across age groups, as the mean of the literacy index is
3.8 for those younger than age 60, and it only rises to 3.9 for those age 60 and over. Similarly,
measures of literacy differ only modestly by years of tenure. Factors associated with larger
differences include sex, marital status, and annual salary. Three-quarters of the male FR
employees correctly answered 4 or 5 of the literacy questions correctly, compared to only 56
percent of the females. Some 70 percent of married employees scored 4 or 5 correct answers, but
only 60 percent of non-married individuals met this standard. By far, the largest differences are
observed across levels of salary. Only a little over one-third of workers earning under $50,000
per year scored 4 or 5 right answers, and the mean number of correct answers was 2.9 out of five.
By comparison, 96 percent of those with incomes over $250,000 correctly answered 4 or 5
questions with an average of 4.7 correct answers. This may be due to higher salary individuals
being economists, but the findings related to sex, marital status, and income are overall similar to
what is reported in many other papers (see Lusardi and Mitchell, 2014, for a review).
[Table 3 here]
The Learning Module

9
Our financial knowledge online survey was paired with a Learning Module developed by
OEB entitled “Your Retirement Plan.” The Module was available as a video which was
introduced by a high-ranking member of the Federal Reserve Bank who chaired the Committee
on Employee Benefits. It was sent to all employees as a video file via the company intranet, so
employees could view it at times convenient to them. Employees were told that the video
“shouldn’t take more than 30 minutes to complete.”
The video began with a discussion of income needs in retirement and noted that many
analysts suggest that retirees should save enough to replace about 80 percent of their final
earnings. The first section of the Learning Module discussed the importance of preparing for
retirement and the likely differences in consumption needs before and after retirement. The video
then went on to discuss the key components of retirement income including Social Security, the
FR DB plan, the FR thrift saving plan, and personal savings. Next the video described the DB
pension plan, including how retirement benefits were calculated as a function of salary and
service, along with providing information on how the DB plan protected retirees from inflation,
investment, and longevity risk. Slightly different presentations were provided to employees
closer to retirement versus those with a longer planning horizon. The video also discussed how to
think about whether the employee needed to undertake additional retirement savings. Finally, it
described distribution options and how these could be used to enhance retirement income
streams.10
Overall, the OEB’s goal in delivering the Learning Module was to boost employee
awareness of the need for retirement savings, so as to help its workforce build better retirement
incomes.
10
As with all videos and webinars, one cannot be certain whether the individual watch some or all of the
program or whether all individuals completing the financial literacy quiz also viewed the entire Module.

10
Baseline Analysis
To explore how financial literacy is linked to DC plan outcomes, we first use multivariate
analysis to examine plan contributions, percentage of salary saved in the DC plan, and equity
allocation – all behaviors measured prior to the Learning Module. The next section examines
changes post-intervention.
Table 4 reports the results of three regression models where the dependent variable is
equal to one if the employee contributed to the DC contribution plan (0 otherwise) in April 2013,
prior to the Module. The first two columns report results using all current employees, whereas
the third column uses only those individuals who completed the Learning Module. These
regressions allow us to explore the determinants of participation and contribution to the DC plan,
taking many factors simultaneously into account.
[Table 4 here]
Results in Column 1 show that 84 percent of the FR employees contributed to their plan,
with some differences by worker characteristics: men were 2.0 percentage points less likely to
contribute to a plan compared to women, and each year of job tenure decreased the probability of
contributing to a plan by 0.8 percentage points. Consistent with our prior research, we also find
that those with higher earnings and married individuals were more likely to participate in the DC
plan (Clark, Maki and Morrill, 2014).11
Column 2 presents estimated coefficients from a model
which adds an indicator variable taking the value of one for employees who participated in the
subsequent Learning Module (0 otherwise). Inclusion of this variable in the model has no
significant impact on the other estimated coefficients, but it does show that participants in the
Module were 6.3 percentage points more likely to contribute to the DC plan. Evidently those
11 The dataset does not include measures of employees’ defined benefit (DB) pension wealth, but since
the DB benefit formula depends on salary and years of service, our analysis controls on employee age,
salary, and tenure, to proxy for DB pension wealth.

11
who elected to take the survey and participate in the educational module differed from their
counterparts.
Column 3 reports results when we narrow the sample to only those employees who
completed the Learning Module. In addition to the variables included in Column 1, two variables
reflecting respondents’ financial literacy levels are now included. One is an indicator for high
financial knowledge (i.e., anyone who got 4-5 questions correct) versus medium (2-3 questions
correct) versus the reference category (0-1 question correct). Our estimates indicate that the more
financially knowledgeable employees were much more likely to contribute to the DC plan, and
the estimated coefficients are strongly positive and statistically significant. The magnitudes
imply that a worker scoring 4-5 correct answers was 13.4 percentage points more likely to be
contributing, while someone scoring 2-3 answers correct had a 6.8 percentage point higher
probability of contributing, compared to the least financially-savvy employee who had at most
one correct answer.12
We are aware these estimates do not necessarily establish a causal link
between financial literacy and contributions to a retirement plan. For example, unobservable
factors such as patience could be driving this finding. Nevertheless, our other work has explored
the casual links between financial literacy and retirement planning, and we showed that OLS
estimates (such as those reported here) tend to underestimate the true effect of financial literacy
on retirement planning (Lusardi and Mitchell, 2014). Moreover, in the next section we provide
some robustness analysis on this point.
12
Simon, Warner, and Pleeter (2015) extend the analysis of the choice of retirement plan distributions by
incorporating cognition, financial literacy, and personal discount rates in those decisions. They conclude
their analysis by stating that “More work is needed to examine the link between cognition, financial
literacy, and investment choices. Hopefully, too, subsequent surveys will contain questions to elicit
information about financial literacy.” Our survey of FR employees provides new evidence on financial
literacy and how it influences retirement saving decisions.

12
Next, we examine plan contribution rates expressed as a percentage of employees’ salary.
Across all plan participants, the contribution rate as a percent of salary averaged 8.7 percent (see
Table 5). Columns 1 and 2 again focus on all employees, while Column 3 limits the sample to
survey participants only. The first two columns indicate that each additional 10 years of age was
associated with 1.2 percentage points more pay being contributed to the DC plan. The more
highly-paid also contributed a larger share of their pay, and this effect was statistically
significant. Including a control for who took the Learning Module in Column 2 indicates those
who answered the survey contributed around one percentage point more of their pay, for an
improvement of 12 percent compared to their non-respondent counterparts (other coefficients are
unaffected by including this additional variable). Finally, in the subsample of survey
respondents, we see that being more financially literate is associated with higher contribution
rates: that is, people who correctly answered 4-5 of the financial questions contributed 2.6
percentage points more of their pay, and those who answered 2-3 questions correctly contributed
1.4 percentage points more, compared to employees with 0-1 correct answers.
[Table 5 here]
It is also of interest to evaluate whether financially knowledgeable DC plan participants
invested differently from their counterparts. To examine how employees invest in addition to
whether they contribute and how much, we have classified each fund in the DC plan menu
according to its equity share, after which we compute each person’s stock exposure as a function
of his allocation to each of the various funds. Table 6 shows, for the full sample, that men held
more of their retirement savings in equities, and an additional $10,000 in annual earnings
increased the equity share by 1.4 percentage points. Not surprisingly, older workers favored less
risky portfolios: an additional 10 years of age was associated with 5.7 percentage points less in

13
risky investments. Learning Module respondents held 3.7 percentage points more of their assets
in equities, and given the mean baseline of 57.2 percent, this is a 6.5 percent higher equity share.
In the final column of Table 6, we report estimates for the subset of respondents to the Learning
Module. Coefficient estimates here are very similar to those for the full sample. Additionally,
we learn that an employee measured to be highly financially knowledgeable had 14.6 percentage
points more of his retirement assets in equities compared to the least savvy.13
Even those with
intermediate knowledge held more in stocks than those who were less financially
knowledgeable.
[Table 6 here]
This analysis of plan contributions and holdings provides key insights about the
heterogeneity of employee behavior, which we summarize as follows. First, a relatively large
share of FR employees participated in the DC plan, and those who did contributed an average of
almost 9 percent of their pay. Married employees were more likely to participate and older
employees were more likely to contribute, while men participated and contributed less than
women. Overall, this employee group held about 57 percent of its retirement assets in equities,
with older workers holding slightly less, and men, married, and particularly the higher-paid
workers taking riskier positions.
Second, employees who responded to the Learning Module were 6 percentage points
more likely than non-respondents to participate in the plan. Also they contributed 1.0 percentage
point more of their pay and held somewhat more equity (4 percentage points). The fact that the
Learning Module respondents differed somewhat from the non-respondent workers suggests
13
A more detailed analysis of how financial literacy influences the investment behavior and portfolio
allocation of FR employees is available in Clark, Lusardi, and Mitchell (2016). This analysis shows that
individuals with higher levels for financial literacy tend to have less idiosyncratic risk and earn higher
expected risk-adjusted returns.
14
some degree of self-selection, about which we say more below. And finally, people scoring high
on the financial knowledge survey were even more likely to participate in the plan, contribute
even more of their salaries, and hold even more equity in their retirement accounts.
Behavioral Changes Post Learning Module
Several recent studies have examined how financial literacy influences retirement
savings, and our results from the FR case study are consistent. Nevertheless, we can also move
beyond simply correlating how financial literacy is associated with plan behaviors by estimating
the impact of the Learning Module on retirement plan behavior. Specifically, we evaluate
whether there were significant changes in retirement saving patterns after the module was
fielded, by drawing on additional administrative data on participation, contributions, and
investment allocations gathered one year after the initial information examined above.
Our pre/post sample includes 20,867 individuals for whom we have retirement saving
data for the pre-survey wave in 2013 as well as six months after the completion of the Learning
Module in 2014. To determine the impact of participating in the Module, we examine factors
associated with the probability that a participant contributed to the DC plan at baseline and then
stopped contributing one year later. Results appear in Table 7, where the first column in each
case shows results controlling only on the Learning Module dummy, and the second includes
other controls.
Prior to the fielding of the Module, 17,538 FR employees contributed to the DC plan
while 3,329 did not (in 2013). A year later, 7.1 percent of plan participants stopped contributing
and 11.6 started contributing. Taking the Learning Module deterred plan dropouts, with a 3.7
percentage point reduced plan dropout rate (Column 1) compared to those who did not take the

15
Module. In Column 2, we see that the learning Module dummy is not altered when we control
for other socio-demographics. Married employees and the more highly-paid were less likely,
while those with more tenure and older were more likely to stop contributing. In sum, taking the
Module likely encouraged employees to remain in the plan.
Table 7 here]
Columns 3 and 4 of Table 7 examine whether employees who were not contributing to
the DC plan in 2013 began contributing one year later. Of the employees who were not
contributing to the DC plan in 2013, 11.6 percent were contributing a year later, and
interestingly, people who completed the Learning Module were 2.9 percentage points more
likely to initiate DC contributions, relative to those who did not, in Column 3. The effect in
Column 4 is larger, with a 4.6 percentage point rise in contributors. By this measure, the Module
had a significant positive effect on employee retirement savings, as almost 40 percent more of
Module participants began contributing to a retirement saving plan. We also find that older
employees not enrolled in 2013 were less likely to start contributing, as were workers with more
years of service. By contrast, more highly-paid employees were more likely to have enrolled a
year later.
In summary, employees who completed the Learning Module were more likely to start
contributing and less likely to have stopped contributing to the DC plan, compared to their non-
respondents. This suggests that participating in the program had a positive effect on DC plan
behavior. Thus, from the standpoint of the employer, we have learned that providing employees
with access to financial education can alter their retirement saving behavior.14
14
Appendix Table C shows results testing for differences in characteristics of plan participants who took
the Learning Module versus those who did not, adopting the weighting based on each respondent’s
Inverse Propensity Weighting (IPW) score from Appendix Table B. Overall, several factors become
insignificant including tenure, male, and the probability of being in a pretax account only. Still significant

16
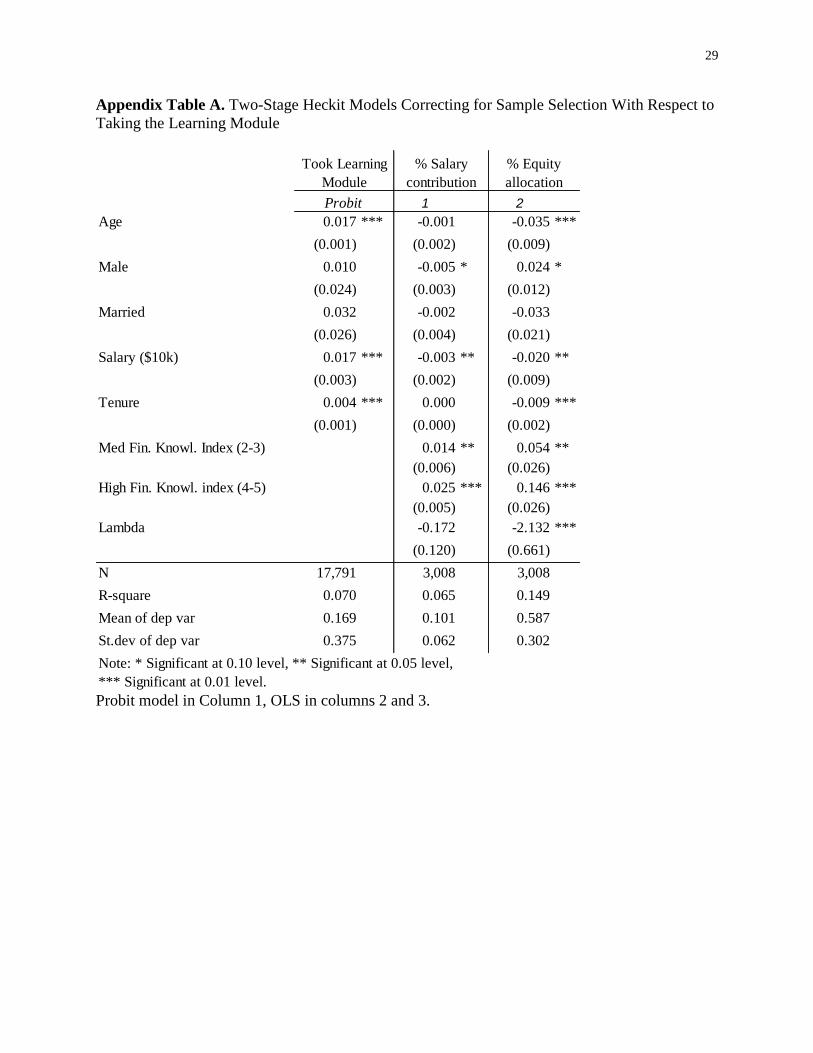
Robustness Checks
As noted above, we were unable to randomize treatments across different subsets of the
employee population, and we have shown that employees who elected to take the Learning
Module differed in observable ways from those who did not. In an effort to investigate whether
our results are sensitive to sample selection, we have undertaken two additional tests. One
technique uses a Heckman 2-step model to first estimate the probability that employees took the
Learning Module, followed by a second stage model indicating the estimated effects of financial
knowledge on changes in contributions and changes in equity allocation pre/post the Module.
Controlling on this selection correction confirms that the most financially knowledgeable (with
an index score of 4-5) boosted their contribution amounts and equity allocations substantially,
and the effects are statistically significant (see Appendix A for detail). In particular, and after
correcting for selection, those scoring highest on the knowledge index boosted their
contributions by 2.5 percent (or 25% above the baseline), and increased their equity percentage
by 14.6 percentage points (or 25% above the baseline). Evidently the employer’s intervention
was quite influential for those who took advantage of the Learning Module.15
A second way to model sample selection uses a propensity matching model with inverse
probability weights, a tactic more robust to misspecification bias (Todd 2014). Yet matching
models also maintain that there is no systematic unobserved difference between those who were
“treated” – i.e., took the Learning Module – and their counterparts.16
This is not directly testable
with our data, but when we use this framework to estimate the impact of the Learning Module on
but quantitatively smaller are the effects of contribution rates, total balance, age, and salary. Correcting
for the sample selection in this way raises the estimated effect on the equity share. 15
We acknowledge that this test for sample selection approach relies on functional form for identification. 16
See Cattaneo (2010) and Austin (2011).

17
changes in contribution and equity allocations, the estimated Average Treatment Effect (ATE) of
the Module proves to be strongly positive and significant for both changes in contributions and
equity share (see Appendix Table B). Specifically, those taking the Module contributed 11
percentages points more (compared to a baseline of 9 percentage points), and held 6 percentage
points more equity (compared to a baseline of 57 percent), after doing the Module. In other
words, even after controlling for sample selection, we find a strong positive association between
taking the Module and boosting contributions and equity allocations. Accordingly, the
employer’s effort to boost awareness of the FR retirement plan appears to have worked in the
anticipated direction.
Discussion and Implications
Our analysis of FR employee behavior is only a case study of a single employer, yet
several observations can be made. First, despite the fact that this workforce is covered by both a
DB plan and Social Security, a remarkably high proportion of employees participates in and
contributes to the DC retirement plan. Second, the surveyed employees’ level of financial
literacy is quite high compared to the general population. Third, we confirm, as in other studies,
that marital status, salary, tenure, and financial literacy are all predictors of participation and
contribution levels to DC plans. Fourth, the most financially knowledgeable employees are more
likely to participate in their pension plan, contribute a higher percent of their pay, and hold more
equity in their retirement accounts. In general, higher levels of financial literacy do appear to be
associated with greater retirement readiness.
We also examine the effects of a Learning Module offered to the employees. When we
compare behavioral changes among employees who took the Learning Module versus their

18
counterparts who did not, we show that a significantly higher proportion of non-contributors who
completed the Module subsequently enrolled in the retirement saving plan, compared to those
who did not. Very few of those who viewed the Module stopped contributing to their DC plan,
compared to those who did not view the Module. Moreover, the most financially knowledgeable
were significantly more likely to boost contributions and equity allocation after having taken the
employer’s Learning Module. In other words, employer-provided information about the need to
save for retirement increased workers’ willingness to participate in and contribute to the DC
vehicle. Accordingly, employers seeking reasons to develop such educational programs can be
more confident that these programs will boost employee awareness and enhance retirement
readiness.

19
References
Allen, Steven, Robert Clark, Jen Maki, and Melinda Morrill. 2016. Golden Years or Financial
Fears: How Plans Change After Retirement Seminars. Journal of Retirement 3(3): 96-
115.
Austin, Peter C. 2011. An Introduction to Propensity Score Methods for Reducing the Effects of
Confounding in Observational Studies. Multivariate Behavioral Research 46: 399–424.
Bayer, Patrick, Douglas Bernheim, and John Karl Scholz. 2009. The Effects of Financial
Education in the Workplace: Evidence from a Survey of Employers. Economic Inquiry
47(4): 605-624.
Bernheim, Douglas, and Daniel Garrett. 2003. The Effects of Financial Education in the
Workplace: Evidence from a Survey of Households. Journal of Public Economics 87:
1487–1519.
Cattaneo, Matias D. 2010. Efficient Semiparametric Estimation of Multi-Valued Treatment
Effects Under Ignorability. Journal of Econometrics 155: 138–154.
Clark, Robert, Madeleine d’Ambrosio, Ann McDermed, and Kshama Sawant. 2006. Retirement
Plans and Saving Decisions: The Role of Information and Education. Journal of Pension
Economics and Finance 5(1): 45-67.
Clark, Robert and Annamaria Lusardi. 2012. How Employers Can Help New Hires Save for
Retirement: Best Practices that Build Long-Term Financial Security. FINRA Investor
Education Foundation.
http://www.finrafoundation.org/web/groups/foundation/@foundation/documents/foundati
on/p188046.pdf
Clark, Robert, Annamaria Lusardi, and Olivia Mitchell. 2014. Financial Literacy and Retirement
Plan Saving and Investment among Federal Reserve System Employees. Final Report of
the OEB, Federal Reserve Bank. November.
Clark, Robert, Annamaria Lusardi, and Olivia Mitchell. 2016. Financial Knowledge and 401(k)
Investment Performance. Journal of Pension Economics and Finance Forthcoming. DOI:
http://dx.doi.org/10.1017/S1474747215000384
Clark, Robert, Jennifer A. Maki, and Melinda Sandler Morrill. 2014. Can Simple Informational
Nudges Increase Employee Participation in a 401(k) Plan? Southern Economics Journal
80(3): 677-701.

20
Clark, Robert, Melinda Morrill, and Steven Allen. 2012a. Effectiveness of Employer-Provided
Financial Information: Hiring to Retiring. American Economic Review 102(3): 314-18.
Clark, Robert, Melinda Morrill, and Steven Allen. 2012b. The Role of Financial Literacy in
Determining Retirement Plans. Economic Inquiry 50(4): 851-866.
Consumer Financial Protection Bureau. 2014. Financial Wellness at Work: A Review of
Promising Practices and Policies. August.
http://files.consumerfinance.gov/f/201408_cfpb_report_financial-wellness-at-work.pdf
Lusardi, Annamaria. 2011. Americans’ Financial Capability. NBER Working Paper 17103.
Lusardi, Annamaria, Pierre-Carl Michaud, and Olivia S, Mitchell, 2016. Optimal Financial
Knowledge and Wealth Inequality. Journal of Political Economy. Forthcoming.
Lusardi, Annamaria and Olivia S. Mitchell. 2007. Financial Literacy and Retirement
Preparedness. Evidence and Implications for Financial Education. Business Economics,
January: 35-44.
Lusardi, Annamaria and Olivia S. Mitchell. 2008. Planning and Financial Literacy: How Do
Women Fare? American Economic Review 98(2): 413–417.
Lusardi, Annamaria, and Olivia S. Mitchell. 2009. How Ordinary Consumers Make Complex
Economic Decisions: Financial Literacy and Retirement Readiness. NBER Working
Paper 15350.
Lusardi, Annamaria, and Olivia S. Mitchell. 2011a. Financial Literacy and Planning:
Implications for Retirement Wellbeing. In Financial Literacy: Implications for
Retirement Security and the Financial Marketplace. Eds. O. S. Mitchell and A. Lusardi.
Oxford, Oxford University Press: 17-39.
Lusardi, Annamaria and Olivia S. Mitchell. 2011b. Financial Literacy and Retirement Planning
in the United States. Journal of Pension Economics and Finance 10(4): 509-525.
Lusardi, Annamaria and Olivia S. Mitchell. 2011c. Financial Literacy around the World: An
Overview. Journal of Pension Economics and Finance 10(4): 497-508.
Lusardi, Annamaria, and Olivia S. Mitchell. 2014. The Economic Importance of Financial
Literacy: Theory and Evidence. Journal of Economic Literature 52(1): 5-44.
Lusardi, Annamaria, and Olivia S. Mitchell. 2015. Financial Literacy and Economic Outcomes.
Evidence and Policy Implications. Journal of Retirement Summer: 107-114.
21
Lusardi, Annamaria, Olivia S. Mitchell, and Vilsa Curto. 2010. Financial Literacy among the
Young. Journal of Consumer Affairs 44(2): 358-380.
Simon, Curtis John Warner, and Saul Pleeter. 2015. Discounting, Cognition, and Financial
Awareness: New Evidence from a Change in the Military Retirement System, Economic
Inquiry 53(1): 318-334.
Todd, Petra E. 2014. Advanced Microeconometric Techniques and Applications. Unpublished
manuscript, University of Pennsylvania.

22
Table 1. Comparison of Observables for Learning Module Respondents and Non-
respondents
Note: *** Significant at the 0.01 level; ** Significant at the 0.05 level; * Significant at the 0.10
level.
This table summarizes key variables for all 2013 Federal Reserve System 401(k) plan
participants who responded to the financial knowledge questions in the Learning Module as well
as for those who did not. All data are taken from the institution’s administrative records and refer
to active employees (i.e., not retired, vested terminated, or deceased).
Variable Total Nonrespondents Respondents
Diff.
(Nonpart.-
Part.)
T-test for
significance
% Participants in Pretax Only 66.86 66.39 69.41 -3.02 ***
% Participants in Roth Only 8.13 7.97 9.00 -1.03 *
% Participants in Both 8.96 8.53 11.20 -2.67 ***
% Salary Contribution 7.32 7.00 9.02 -2.02 ***
Total balance ($100k), Pretax Only 1.51 1.37 2.26 -0.89 ***
% Balance in equity, Pretax Only 52.54 52.16 54.56 -2.40 ***
% Contribution in equity 57.19 56.89 58.66 -1.77 **
Age 44.34 43.67 47.90 -4.22 ***
Male 0.57 0.57 0.57 0.00
Married 0.62 0.60 0.69 -0.08 ***
Salary ($10k) 9.82 9.68 10.55 -0.87 ***
Tenure (years) 12.26 11.78 14.83 -3.05 ***
N 21,192 17,835 3,357

23
Table 2. Results of Financial Literacy Assessment
Financial Literacy Questions:
% correct S.D
Suppose you had $100 in a savings account and the interest rate was 2% per
year. After 5 years, how much do you think you would have in the account if
you left the money to grow? More than $110, Exactly $110, Less than $110,
DK, RF
0.75 0.44
Imagine that the interest rate on your savings account was 1% per year and
inflation was 2% per year. After 1 year, how much would you be able to buy
with the money in this account? More than today, Exactly the same , Less than
today, DK, RF
0.91 0.29
True or False? Buying a single company’s stock usually provides a safer return
than a stock mutual fund. True, False, DK, RF 0.85 0.35
Assume you were in the 25% tax bracket (you pay $0.25 in tax for each dollar
earned) and you contributed $100 pretax to an employer’s 401(k) plan. Your
take-home pay (what’s in your paycheck after all taxes and other payments are
taken out) will then: Decline by $100, Decline by $75, Decline by $50, Remain
the same, DK, RF
0.43 0.50
Assume that an employer matched employee contributions dollar for dollar. If
the employee contributed $100 to the 401(k) plan, his account balance in the
plan including his contribution would: Increase by $50, Increase by $100,
Increase by $200, Remain the same , DK, RF
0.76 0.43
Financial Knowledge Index Score (number of questions answered correctly) 3.71 1.23
Note: DK refers to “do not know” and RF to “refuse to answer.”

24
Table 3. Heterogeneity in Financial Literacy Scores
Variable 0-1 2-3 4-5 Mean Std.Dev. N
Age
<30 4.5 28.1 67.3 3.8 1.1 199
30-39 5.0 27.2 67.8 3.8 1.2 519
40-49 5.4 27.7 66.9 3.8 1.2 795
50-59 4.6 30.4 65.0 3.8 1.2 1,115
>=60 2.9 27.9 69.2 3.9 1.1 380
Sex
Men 2.9 22.5 74.7 4.0 1.1 1,741
Women 7.1 37.2 55.7 3.5 1.2 1,267
Marital Status
Married 4.0 26.5 69.5 3.9 1.1 2,079
Non-married 6.1 33.5 60.4 3.6 1.2 929
Tenure
<10 years 4.8 27.7 67.5 3.8 1.2 1,348
10 to 14 years 3.1 28.0 68.9 3.9 1.1 354
15 to 19 years 5.3 31.3 63.4 3.7 1.2 374
>=20 years 4.7 29.3 66.0 3.8 1.2 932
Salary
<$50,000 15.6 48.3 36.1 2.9 1.3 263
$50,000 to $99,999 6.2 36.7 57.2 3.5 1.2 1,235
$100,000 to $149,999 1.7 21.0 77.4 4.1 1.0 1,007
$150,000 to $199,999 1.7 15.4 82.8 4.2 1.0 344
$200,000 to $249,999 0.0 14.7 85.3 4.3 0.8 109
>$250,000 0.0 4.0 96.0 4.7 0.6 50
Financial
Literacy Index
% Survey Respondents by
Financial Knowledge Index
(row percentages reported)

25
Table 4. Determinants of Pension Participation: All Employees, April 2013 Probit models, marginal effects reported.
Full
sample
Full
sample
Age 0.0004 0.0002 0.0004
(0.0003) (0.0003) (0.0006)
Male -0.0199 *** -0.0191 *** -0.0044
(0.0047) (0.0047) (0.0093)
Married 0.0094 * 0.0090 * 0.0037
(0.0051) (0.0051) (0.0101)
Salary ($10k) 0.0183 *** 0.0177 *** 0.0078 ***
(0.0007) (0.0007) (0.0015)
Tenure -0.0080 *** -0.0080 *** -0.0045 ***
(0.0003) (0.0003) (0.0005)
Learning Module 0.0627 ***
(0.0054)
Med. Fin. Knowl. Index (2-3) 0.0675 ***
(0.0122)
High Fin. Knowl. Index (4-5) 0.1343 ***
(0.0225)
N 21,192 21,192 3,357
R-square 0.142 0.147 0.133
Mean of dep var 0.840 0.840 0.896
St.dev of dep var 0.367 0.367 0.305
Note: * p<0.10, ** p<0.05, *** p<0.01
Surveyed in
2013

26
Table 5. Determinants of Employee Contributions in 2013 (as a % of salary)
OLS models.
Age 0.0012 *** 0.0012 *** 0.0012 ***
(0.0001) (0.0001) (0.0001)
Male -0.0020 ** -0.0021 ** -0.0033
(0.0009) (0.0009) (0.0024)
Married 0.0000 0.0000 0.0022
(0.0009) (0.0009) (0.0026)
Salary ($10k) 0.0004 *** 0.0004 *** -0.0008 ***
(0.0001) (0.0001) (0.0002)
Tenure 0.0001 0.0000 0.0002 *
(0.0001) (0.0001) (0.0001)
Learning Module 0.0104 ***
(0.0012)
Med Fin. Knowl. Index (2-3) 0.0143 **
(0.0057)
High Fin. Knowl. index (4-5) 0.0255 ***
(0.0055)
N 17,791 17,791 3,008
R-square 0.073 0.078 0.064
Mean of dep var 0.087 0.087 0.101
St.dev of dep var 0.057 0.057 0.062
Note: * p<0.10, ** p<0.05, *** p<0.01
Plan contribution rate
Plan
participants
Plan
participants
Surveyed & in
plan in 2013

27
Table 6. Determinants of Portfolio Share in Equities: Employees in 2013
OLS models.
Age -0.0057 *** -0.0058 *** -0.0065 ***
(0.0002) (0.0002) (0.0006)
Male 0.0498 *** 0.0497 *** 0.0393 ***
(0.0043) (0.0043) (0.0108)
Married 0.0160 *** 0.0159 *** 0.0230 **
(0.0047) (0.0047) (0.0117)
Salary ($10k) 0.0139 *** 0.0137 *** 0.0070 ***
(0.0005) (0.0005) (0.0014)
Tenure -0.0035 *** -0.0035 *** -0.0033 ***
(0.0003) (0.0003) (0.0006)
Learning Module 0.0369 ***
(0.0059)
Med Fin. Knowl. Index (2-3) 0.0559 **
(0.0264)
High Fin. Knowl. index (4-5) 0.1463 ***
(0.0260)
N 17,791 17,791 3,008
R-square 0.107 0.109 0.146
Mean of dep var 0.572 0.572 0.587
St.dev of dep var 0.298 0.298 0.302
Note: * p<0.10, ** p<0.05, *** p<0.01
Plan
participants
Plan
participants
Surveyed & in
plan in 2013

28
Table 7. Probability of Stopping or Starting Contributions in 2014, Relative to 2013, as a
Function of Taking the Learning Module and Other Variables
Probit models, marginal effects reported.
Learning Module -0.0370 *** -0.0377 *** 0.0289 * 0.0463 ***
(0.0042) (0.0041) (0.0175) (0.0177)
Age 0.0005 ** -0.0021 ***
(0.0002) (0.0005)
Male 0.0129 *** -0.0167 *
(0.0038) (0.0085)
Married -0.0189 *** -0.0002
(0.0042) (0.0087)
Salary ($10k) -0.0021 *** 0.0061 ***
(0.0005) (0.0010)
Tenure 0.0008 *** -0.0050 ***
(0.0002) (0.0005)
N 17,538 17,538 3,329 3,329
R-square 0.009 0.018 0.040 0.168
Mean of dep var 0.071 0.071 0.116 0.116
St.dev of dep var 0.257 0.257 0.320 0.320
Note: * p<0.10, ** p<0.05, *** p<0.01
Stop participating Start participanting
Plan participants in 2013 Non- participants in 2013
29
Appendix Table A. Two-Stage Heckit Models Correcting for Sample Selection With Respect to
Taking the Learning Module
Probit model in Column 1, OLS in columns 2 and 3.
1 2
Age 0.017 *** -0.001 -0.035 ***
(0.001) (0.002) (0.009)
Male 0.010 -0.005 * 0.024 *
(0.024) (0.003) (0.012)
Married 0.032 -0.002 -0.033
(0.026) (0.004) (0.021)
Salary ($10k) 0.017 *** -0.003 ** -0.020 **
(0.003) (0.002) (0.009)
Tenure 0.004 *** 0.000 -0.009 ***
(0.001) (0.000) (0.002)
Med Fin. Knowl. Index (2-3) 0.014 ** 0.054 **
(0.006) (0.026)
High Fin. Knowl. index (4-5) 0.025 *** 0.146 ***
(0.005) (0.026)
Lambda -0.172 -2.132 ***
(0.120) (0.661)
N 17,791 3,008 3,008
R-square 0.070 0.065 0.149
Mean of dep var 0.169 0.101 0.587
St.dev of dep var 0.375 0.062 0.302
Note: * Significant at 0.10 level, ** Significant at 0.05 level,
*** Significant at 0.01 level.
Probit
% Equity
allocation
Took Learning
Module
% Salary
contribution

30
Appendix Table B. Inverse Propensity Weighting Models: ATE refers to Average
Treatment Effect in the Population. (Treatment is Took Learning Module, ATE reported)
*ATE reported as a percentage
1 2
ATE 0.009 *** 0.036 ***
(0.001) (0.006)
P0mean 0.085 *** 0.566 ***
Learning Module (0) (0.000) (0.002)
ATE* 0.106 *** 0.063 ***
(0.015) (0.010)
17,791 17,791
% Salary
contribution
% Equity
allocation

31
Appendix Table C. Weighted Comparisons Using Inverse Propensity Scores
The first column restates results from Table 1, testing for differences in characteristics of plan
participants who took the Learning Module versus those who did not. The second column repeats
the exercise but now weighting observations based on each respondent’s Inverse Propensity
Weighting (IPW) score.
Variable
Diff.
(Nonpart -
Part) Signif.
Diff.
(Nonpart
-Part) Signif. Notes
% Participants in Pretax Only -3.02 *** 1.56
% Participants in Roth Only -1.03 * -3.01 ***
% Participants in Both -2.67 *** -5.64 ***
% Salary Contribution -2.02 *** -1.43 ***
Total balance ($100k), Pretax Only -0.89 *** -0.26 ***
% Balance in equity, Pretax Only -2.40 *** -4.41 ***
% Contribution in equity -1.77 ** -3.59 ***
Age -4.22 *** -2.90 ***
Male 0.00 0.02 Male excluded from IPW model
Married -0.08 *** -0.02 Married excluded from IPW model
Salary ($10k) -0.87 *** -0.79 *** Salary excluded from IPW model
Tenure (years) -3.05 *** 0.07 Tenure excluded from IPW model
Note: * p<0.10, ** p<0.05, *** p<0.01
Recommended