Emami Ltd.
BUY
- 1 of 17 - Monday 30th
December, 2013
This document is for private circulation, and must be read in conjunction with the disclaimer on the last page.
ST
OC
K P
OIN
TE
R
Target Price `539 CMP `475 FY15 PE 24.7x
Index Details Leadership presence in niche under-penetrated product categories, expansion of its distribution reach and strong focus on rural markets should help Emami Ltd (Emami) drive its top line going ahead. Moreover, despite the revenue concentration among the top four brands, no single brand accounts for more than 20-22% of revenues and hence provides stability to revenues. This coupled with the regular flow of 2-3 new product launches / extensions every year should help keep the company’s brand and product portfolio reinvigorated. Emami has a very aggressive marketing strategy in place. Its two-fold A&P strategy of using celebrity endorsements (one at the national level and another at regional level) should help improve their brand communication. This coupled with expansion of distribution network and rural focus should ensure growth momentum of company’s brands, going ahead. We expect Emami’s revenues to grow at 14.7% CAGR over FY13-15E to `2,237.2 crore by FY15E from `1,699.1 crore clocked in FY13. We initiate coverage on Emami as a BUY with a Price Objective of `539 representing an upside potential of ~14% over
the next 15 months. At the CMP of `475, the stock is trading at 29.1x and 24.7x its FY14E and FY15E earnings respectively. Emami’s revenues to grow at a healthy pace
We expect the company‟s power brands (Navratna, Boroplus, Zandu & Mentho Plus and Fair & Handsome) to drive the top line growth on the back of its eminent presence in niche under-penetrated product categories, expansion of its distribution reach and strong focus on rural markets. Despite the revenue concentration among the top four brands, no single brand accounts for more than 20-22% of revenues and hence provides stability to revenues. Moreover, regular flow of 2-3 new product launches / extensions every year should help keep the company‟s brand and product portfolio reinvigorated besides building on the brand equity further.
Sensex 21,143
Nifty 6,291
BSE 100 6,312
Industry Personal Products
Scrip Details
Mkt Cap (` cr) 10,796
BVPS (`) 38.2
O/s Shares (Cr) 22.7
Av Vol (Lacs) 0.1
52 Week H/L 539/368
Div Yield (%) 1.1
FVPS (`) 1.0
Shareholding Pattern
Shareholders %
Promoters 72.7
DIIs 2.2
FIIs 16.7
Public 8.4
Total 100.0
Emami vs. Sensex
Key Financials (` in Cr)
Y/E Mar Net
Revenue EBITDA PAT EPS
EPS Growth (%)
RONW (%)
ROCE (%)
P/E (x)
EV/EBITDA (x)
2012 1453.5 296.8 258.8 11.4 13.2 36.6 43.1 41.7 35.7
2013 1699.1 347.3 314.7 13.9 21.6 40.5 46.7 34.3 30.5
2014E 1937.0 403.6 370.6 16.3 17.8 39.3 45.5 29.1 26.2
2015E 2237.2 479.4 436.8 19.2 17.8 37.4 45.5 24.7 22.1
- 2 of 17 - Monday 30th
December, 2013
This document is for private circulation, and must be read in conjunction with the disclaimer on the last page.
Its international business (11% of sales) is also likely to witness strong traction (~15-20% CAGR) over the next couple of years on the back of demand pick up in key markets. On this backdrop, we expect Emami‟s revenues to grow at 14.7% CAGR over FY13-15E to `2,237.2 crore by FY15E from `1,699.1 crore clocked in FY13.
Presence in low penetrated categories, aggressive promotion
through celebrity endorsements and expansion in rural reach provides long term growth visibility
Given the fact that ~60% of company‟s revenues come from categories which are relatively under penetrated, we believe that this attribute presents significant growth opportunity for Emami in the long term. Secondly, Emami follows two-fold A&P strategy i.e. one at the national level and another at regional level which is highly skewed towards celebrity endorsements. This aggressive strategy makes Emami one of the most aggressive spenders in the industry (~16.4% of sales in FY13) which we believe should help the company maintain growth momentum, going ahead. Lastly, on the distribution front, the company has a strong network of 3,000+ distributors, ~5,600 sub-distributors and ~6 lakh direct retail outlets tapping huge mass segment (targeting to reach 8.0 lakh direct retail outlets by FY15) and 40 lakh indirect outlets which should help company penetrate further. This expansion of distribution network coupled with rural focus should ensure growth momentum of company‟s brands.
Valuation
We initiate coverage on Emami Ltd (Emami) as a BUY with a Price Objective of `539 representing an upside potential of ~14% over the next 15 months. At the CMP of `475, the stock is trading at 29.1x and 24.7x its FY14E and FY15E earnings
respectively. During past three years, Emami has broadly traded in 25-29x one-year forward PE band. We believe that the stock has the potential to trade in the upper range of this band on account of strong positioning in under-penetrated categories, thrust on rural market penetration, aggressive ad spends and rapid expansion in distribution network. Moreover, strong growth in International business should give push overall profitability and revenue growth. Accordingly, we have assigned a target multiple of 28x to its FY15E earnings translating into a target price of `539.
- 3 of 17 - Monday 30th
December, 2013
This document is for private circulation, and must be read in conjunction with the disclaimer on the last page.
Company Background
Emami Ltd (Emami), the flagship company of the Emami group, is one of the fastest
growing FMCG players in India. The company is a niche category player / innovator
in the relatively under penetrated therapeutic and ayurvedic categories, with
products such as antiseptic cream, fairness cream, talcum powder, cooling oil,
balms and pain relievers. Moreover, it has a large OTC portfolio constituting ~300
products based on ayurvedic formulations.
The company currently has 3,000+ distributors, 600,000+ retail outlets (direct
distribution reach) and a brand reach of 4 mn outlets. It plans to scale up its direct
distribution reach to 800,000 retail outlets over the next couple of years. Besides the
domestic market, the company has a presence in more than 60 countries, including
GCC, UK, Sri Lanka, Bangladesh, Nepal, Africa and CIS countries and overseas
geographies contribute a little over 10% of its net sales.
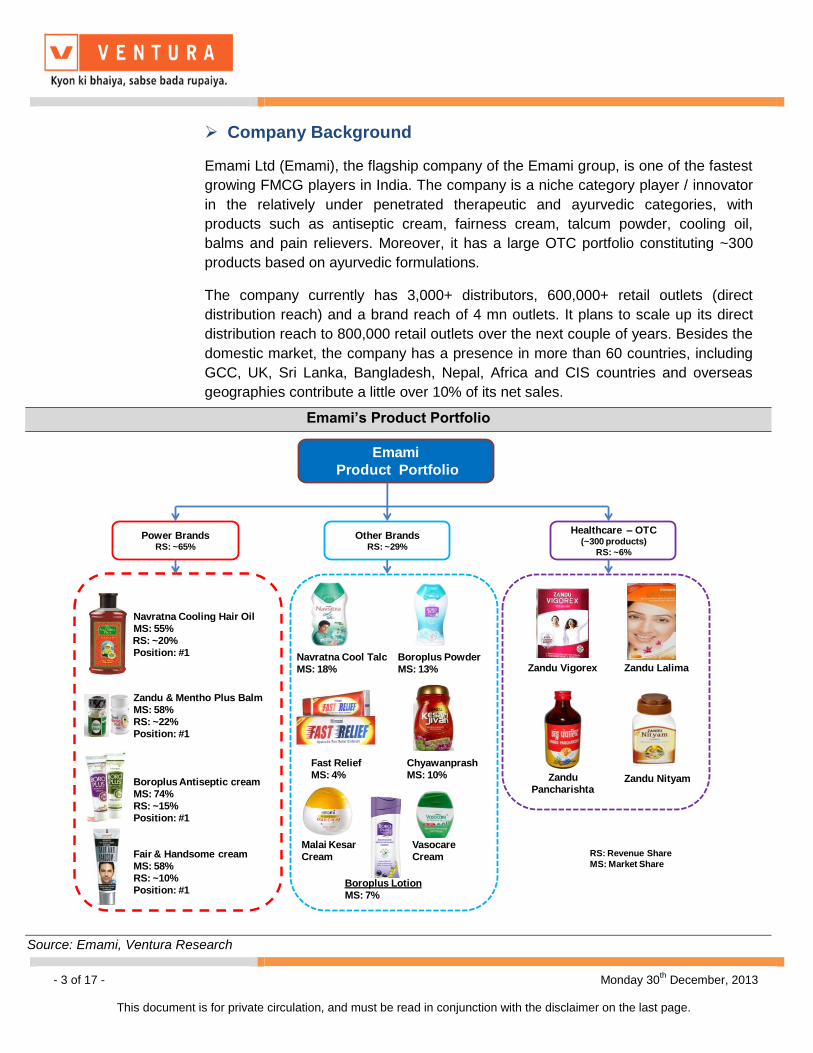
Emami’s Product Portfolio
Emami
Product Portfolio
Navratna Cooling Hair Oil
MS: 55%
RS: ~20%
Position: #1
Zandu & Mentho Plus Balm
MS: 58%
RS: ~22%
Position: #1
Boroplus Antiseptic cream
MS: 74%
RS: ~15%
Position: #1
Fair & Handsome cream
MS: 58%
RS: ~10%
Position: #1
Power BrandsRS: ~65%
Other BrandsRS: ~29%
Healthcare – OTC (~300 products)
RS: ~6%
Navratna Cool Talc
MS: 18%
Boroplus Powder
MS: 13%
Fast Relief
MS: 4%
Chyawanprash
MS: 10%
Malai Kesar
Cream
Vasocare
Cream
Boroplus Lotion
MS: 7%
Zandu Vigorex Zandu Lalima
Zandu
PancharishtaZandu Nityam
RS: Revenue Share
MS: Market Share
Source: Emami, Ventura Research
- 4 of 17 - Monday 30th
December, 2013
This document is for private circulation, and must be read in conjunction with the disclaimer on the last page.
Key Investment Highlights
Emami’s revenues to grow at a healthy pace
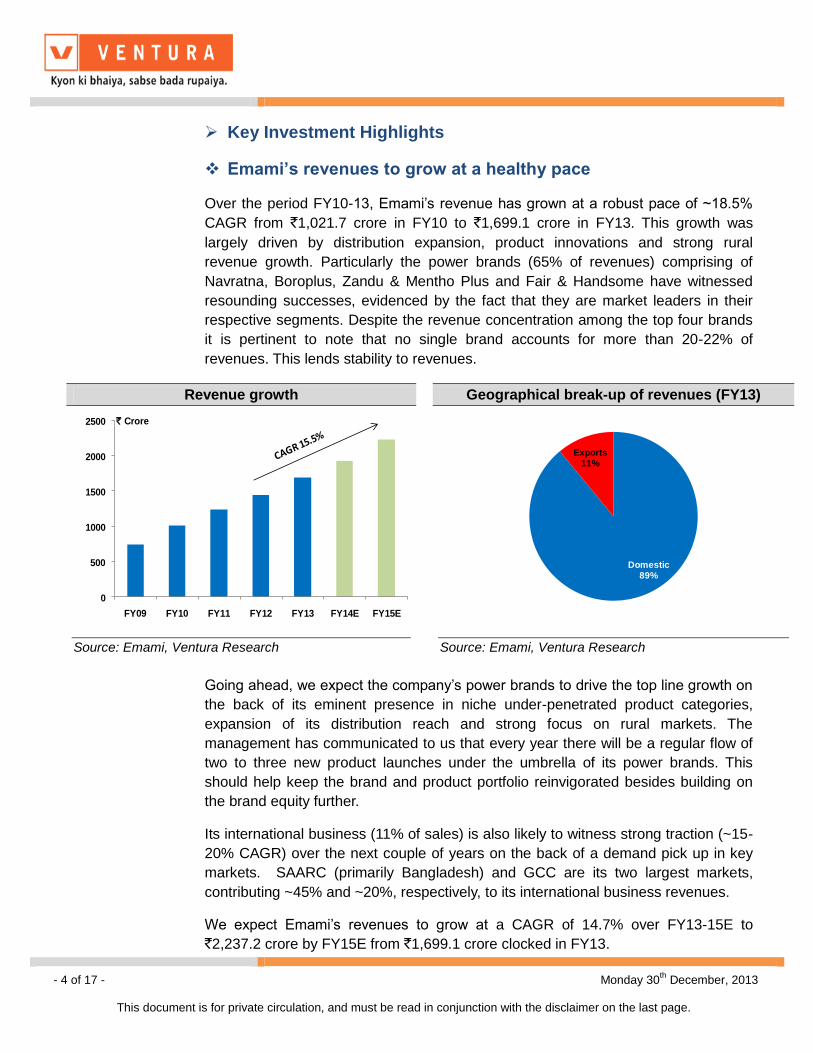
Over the period FY10-13, Emami‟s revenue has grown at a robust pace of ~18.5%
CAGR from `1,021.7 crore in FY10 to `1,699.1 crore in FY13. This growth was
largely driven by distribution expansion, product innovations and strong rural
revenue growth. Particularly the power brands (65% of revenues) comprising of
Navratna, Boroplus, Zandu & Mentho Plus and Fair & Handsome have witnessed
resounding successes, evidenced by the fact that they are market leaders in their
respective segments. Despite the revenue concentration among the top four brands
it is pertinent to note that no single brand accounts for more than 20-22% of
revenues. This lends stability to revenues.
Going ahead, we expect the company‟s power brands to drive the top line growth on
the back of its eminent presence in niche under-penetrated product categories,
expansion of its distribution reach and strong focus on rural markets. The
management has communicated to us that every year there will be a regular flow of
two to three new product launches under the umbrella of its power brands. This
should help keep the brand and product portfolio reinvigorated besides building on
the brand equity further.
Its international business (11% of sales) is also likely to witness strong traction (~15-
20% CAGR) over the next couple of years on the back of a demand pick up in key
markets. SAARC (primarily Bangladesh) and GCC are its two largest markets,
contributing ~45% and ~20%, respectively, to its international business revenues.
We expect Emami‟s revenues to grow at a CAGR of 14.7% over FY13-15E to
`2,237.2 crore by FY15E from `1,699.1 crore clocked in FY13.
Revenue growth Geographical break-up of revenues (FY13)
0
500
1000
1500
2000
2500
FY09 FY10 FY11 FY12 FY13 FY14E FY15E
` Crore
Domestic 89%
Exports 11%
Source: Emami, Ventura Research
Source: Emami, Ventura Research
- 5 of 17 - Monday 30th
December, 2013
This document is for private circulation, and must be read in conjunction with the disclaimer on the last page.
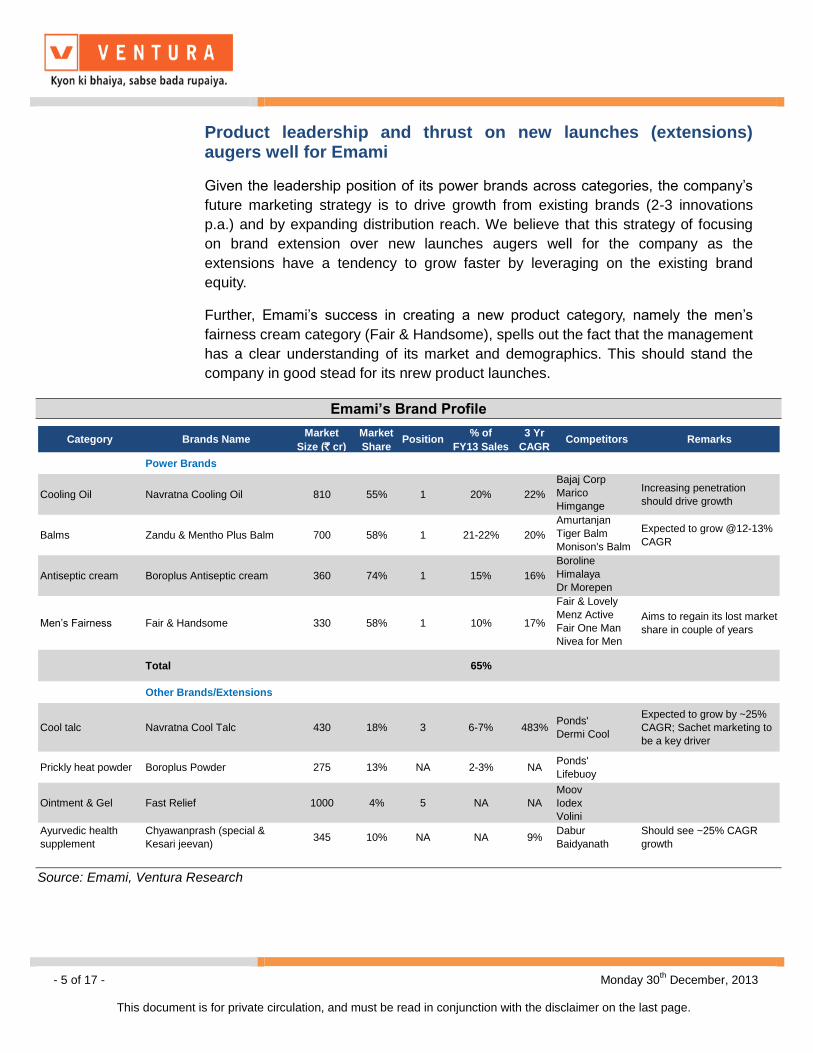
Product leadership and thrust on new launches (extensions) augers well for Emami
Given the leadership position of its power brands across categories, the company‟s
future marketing strategy is to drive growth from existing brands (2-3 innovations
p.a.) and by expanding distribution reach. We believe that this strategy of focusing
on brand extension over new launches augers well for the company as the
extensions have a tendency to grow faster by leveraging on the existing brand
equity.
Further, Emami‟s success in creating a new product category, namely the men‟s
fairness cream category (Fair & Handsome), spells out the fact that the management
has a clear understanding of its market and demographics. This should stand the
company in good stead for its nrew product launches.
Emami’s Brand Profile
Category Brands NameMarket
Size (` cr)
Market
SharePosition
% of
FY13 Sales
3 Yr
CAGRCompetitors Remarks
Power Brands
Cooling Oil Navratna Cooling Oil 810 55% 1 20% 22%
Bajaj Corp
Marico
Himgange
Increasing penetration
should drive growth
Balms Zandu & Mentho Plus Balm 700 58% 1 21-22% 20%
Amurtanjan
Tiger Balm
Monison's Balm
Expected to grow @12-13%
CAGR
Antiseptic cream Boroplus Antiseptic cream 360 74% 1 15% 16%
Boroline
Himalaya
Dr Morepen
Men‟s Fairness Fair & Handsome 330 58% 1 10% 17%
Fair & Lovely
Menz Active
Fair One Man
Nivea for Men
Aims to regain its lost market
share in couple of years
Total 65%
Other Brands/Extensions
Cool talc Navratna Cool Talc 430 18% 3 6-7% 483%Ponds'
Dermi Cool
Expected to grow by ~25%
CAGR; Sachet marketing to
be a key driver
Prickly heat powder Boroplus Powder 275 13% NA 2-3% NAPonds'
Lifebuoy
Ointment & Gel Fast Relief 1000 4% 5 NA NA
Moov
Iodex
Volini
Ayurvedic health
supplement
Chyawanprash (special &
Kesari jeevan)345 10% NA NA 9%
Dabur
Baidyanath
Should see ~25% CAGR
growth
Source: Emami, Ventura Research
- 6 of 17 - Monday 30th
December, 2013
This document is for private circulation, and must be read in conjunction with the disclaimer on the last page.
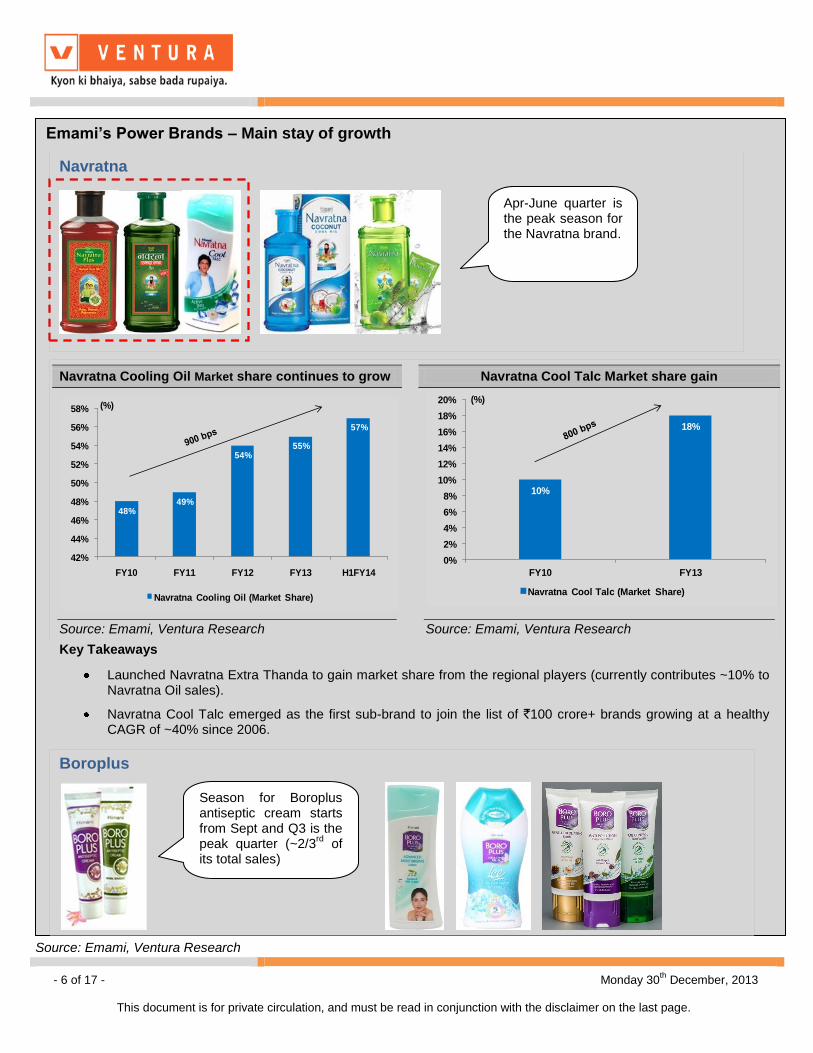
Emami’s Power Brands – Main stay of growth
Navratna
Navratna Cooling Oil Market share continues to grow Navratna Cool Talc Market share gain
48%49%
54%55%
57%
42%
44%
46%
48%
50%
52%
54%
56%
58%
FY10 FY11 FY12 FY13 H1FY14
(%)
Navratna Cooling Oil (Market Share)
10%
18%
0%
2%
4%
6%
8%
10%
12%
14%
16%
18%
20%
FY10 FY13
(%)
Navratna Cool Talc (Market Share)
Source: Emami, Ventura Research
Source: Emami, Ventura Research
Key Takeaways
Launched Navratna Extra Thanda to gain market share from the regional players (currently contributes ~10% to Navratna Oil sales).
Navratna Cool Talc emerged as the first sub-brand to join the list of `100 crore+ brands growing at a healthy CAGR of ~40% since 2006.
Boroplus
Apr-June quarter is the peak season for the Navratna brand.
Season for Boroplus antiseptic cream starts from Sept and Q3 is the peak quarter (~2/3
rd of
its total sales)
Source: Emami, Ventura Research
- 7 of 17 - Monday 30th
December, 2013
This document is for private circulation, and must be read in conjunction with the disclaimer on the last page.
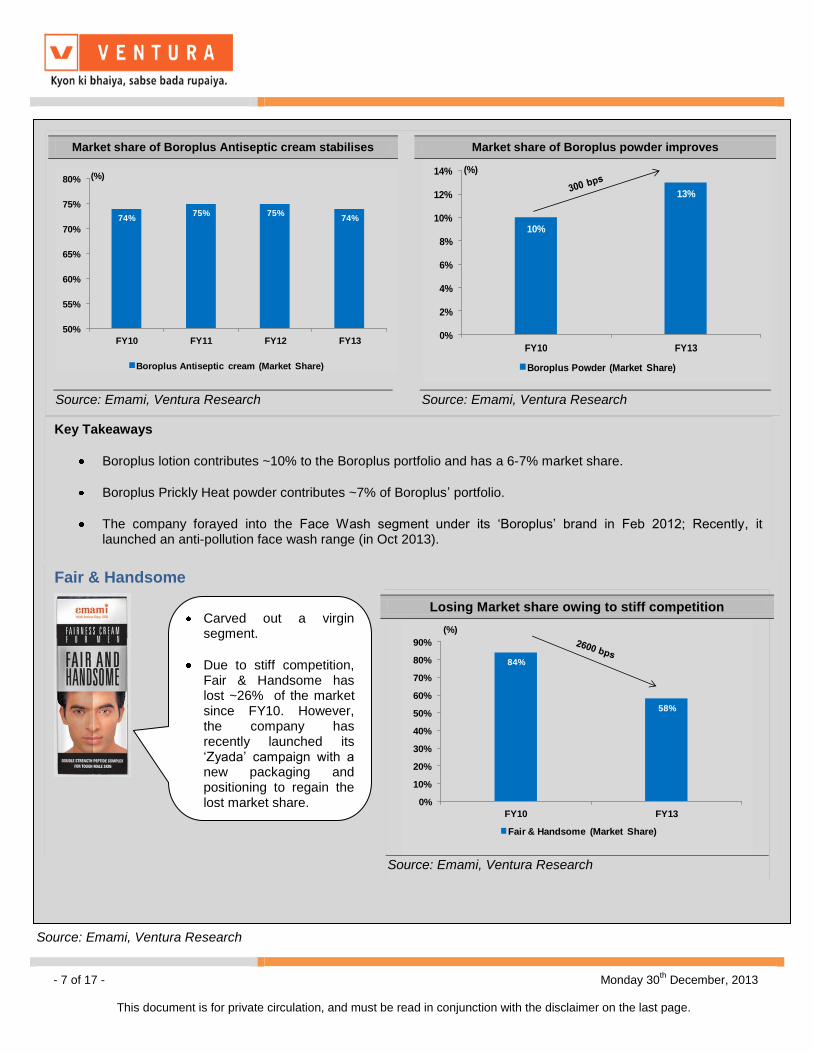
Market share of Boroplus Antiseptic cream stabilises Market share of Boroplus powder improves
74%75% 75%
74%
50%
55%
60%
65%
70%
75%
80%
FY10 FY11 FY12 FY13
(%)
Boroplus Antiseptic cream (Market Share)
10%
13%
0%
2%
4%
6%
8%
10%
12%
14%
FY10 FY13
(%)
Boroplus Powder (Market Share)
Source: Emami, Ventura Research
Source: Emami, Ventura Research
Key Takeaways
Boroplus lotion contributes ~10% to the Boroplus portfolio and has a 6-7% market share.
Boroplus Prickly Heat powder contributes ~7% of Boroplus‟ portfolio.
The company forayed into the Face Wash segment under its „Boroplus‟ brand in Feb 2012; Recently, it launched an anti-pollution face wash range (in Oct 2013).
Fair & Handsome
Losing Market share owing to stiff competition
84%
58%
0%
10%
20%
30%
40%
50%
60%
70%
80%
90%
FY10 FY13
(%)
Fair & Handsome (Market Share)
Source: Emami, Ventura Research
Carved out a virgin segment.
Due to stiff competition, Fair & Handsome has lost ~26% of the market since FY10. However, the company has recently launched its „Zyada‟ campaign with a new packaging and positioning to regain the lost market share.
Source: Emami, Ventura Research
- 8 of 17 - Monday 30th
December, 2013
This document is for private circulation, and must be read in conjunction with the disclaimer on the last page.
Demand pick up in the key export markets to boost exports going ahead
During FY11-13, exports were relatively flat (~0.5% CAGR) owing to the multiple headwinds in the international markets such as:
a) infiltration of counterfeits in Russia, b) political unrest in Egypt and GCC, c) discontinuation of low margin products EMTIA and BONITA range (in
Q3FY12) and d) increase in import duty of FMCG products in Bangladesh (~70-100%).
With a new manufacturing facility set up in Bangladesh (Q3FY13 onwards), we believe that the Bangladesh geography (~45% of exports) should witness traction as it will not only result in duty saving, but also help increase the demand (as it will increase the competitiveness of the company‟s products). This facility will cater to ~80-90% of Bangladesh‟s demand. Meanwhile, the GCC region continues to experience steady growth.
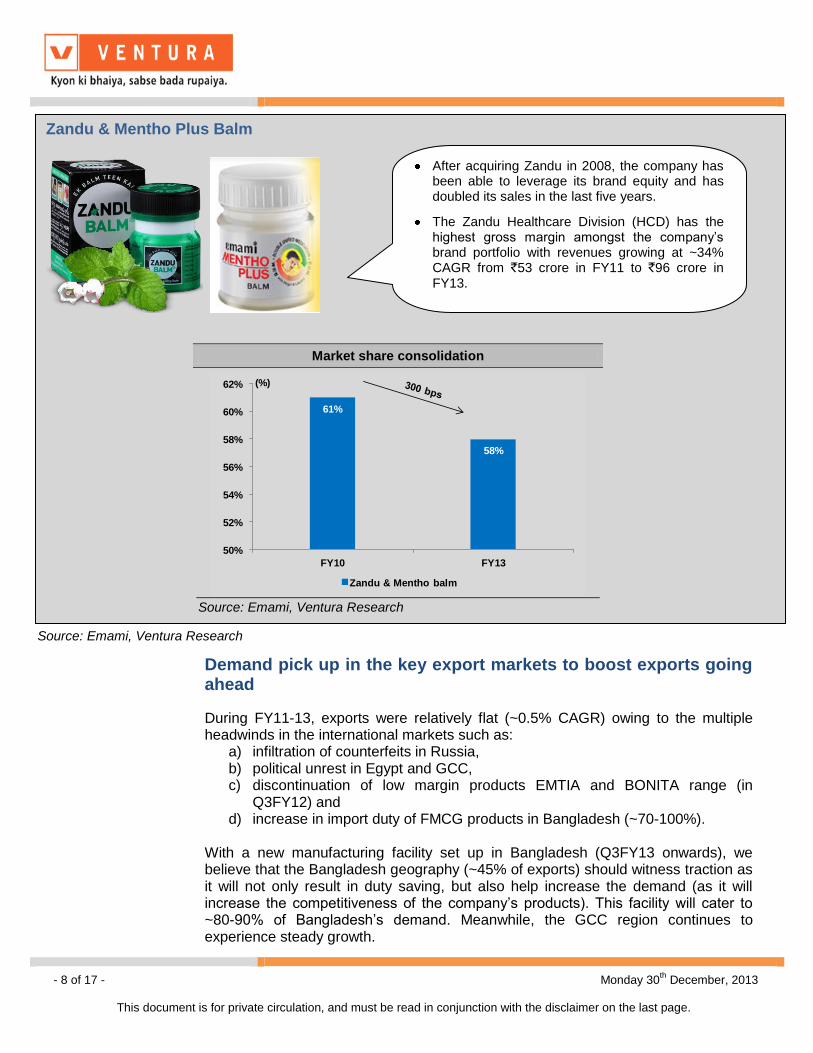
Zandu & Mentho Plus Balm
Market share consolidation
61%
58%
50%
52%
54%
56%
58%
60%
62%
FY10 FY13
(%)
Zandu & Mentho balm
Source: Emami, Ventura Research
After acquiring Zandu in 2008, the company has been able to leverage its brand equity and has doubled its sales in the last five years.
The Zandu Healthcare Division (HCD) has the highest gross margin amongst the company‟s brand portfolio with revenues growing at ~34% CAGR from `53 crore in FY11 to `96 crore in FY13.
Source: Emami, Ventura Research
- 9 of 17 - Monday 30th
December, 2013
This document is for private circulation, and must be read in conjunction with the disclaimer on the last page.
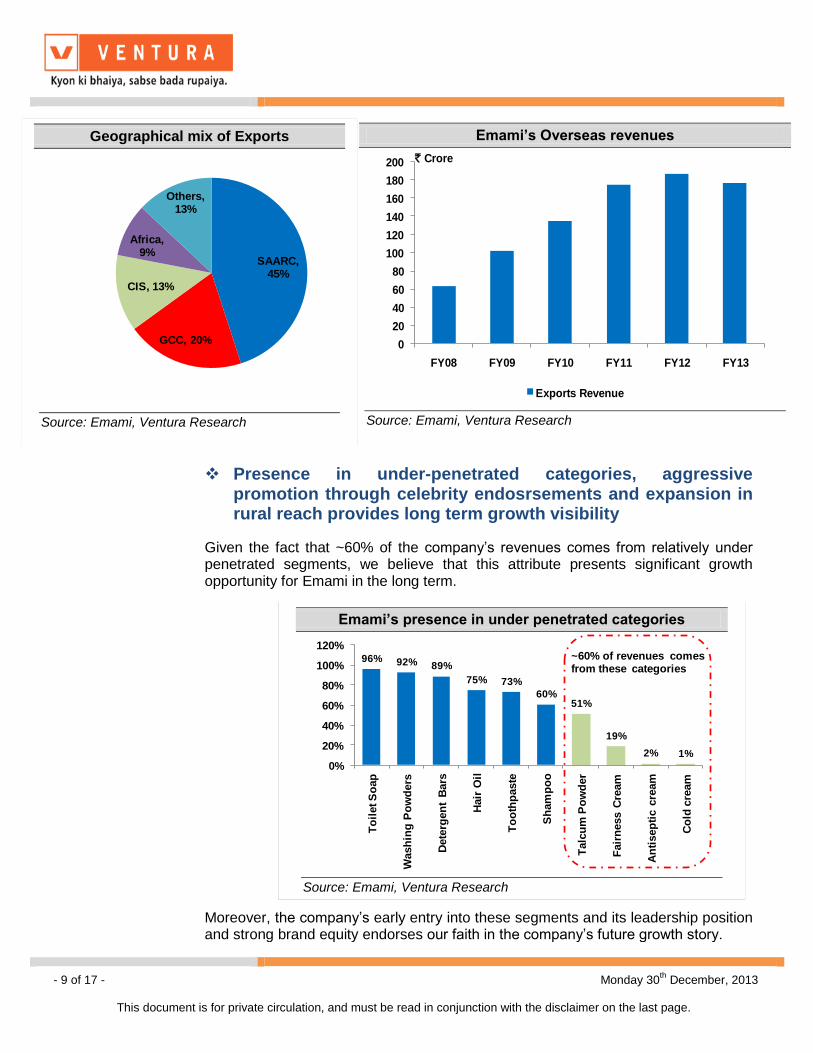
Presence in under-penetrated categories, aggressive promotion through celebrity endosrsements and expansion in rural reach provides long term growth visibility
Given the fact that ~60% of the company‟s revenues comes from relatively under penetrated segments, we believe that this attribute presents significant growth opportunity for Emami in the long term. Moreover, the company‟s early entry into these segments and its leadership position and strong brand equity endorses our faith in the company‟s future growth story.
Geographical mix of Exports
SAARC, 45%
GCC, 20%
CIS, 13%
Africa, 9%
Others, 13%
Source: Emami, Ventura Research
Emami’s Overseas revenues
0
20
40
60
80
100
120
140
160
180
200
FY08 FY09 FY10 FY11 FY12 FY13
` Crore
Exports Revenue
Source: Emami, Ventura Research
Emami’s presence in under penetrated categories
96% 92% 89%
75% 73%
60%51%
19%
2% 1%
0%
20%
40%
60%
80%
100%
120%
To
ilet S
oap
Wash
ing
Po
wd
ers
Dete
rgen
t B
ars
Hair
Oil
To
oth
paste
Sh
am
po
o
Talc
um
Po
wd
er
Fair
ness C
ream
An
tisep
tic c
ream
Co
ld c
ream
~60% of revenues comes from these categories
Source: Emami, Ventura Research
- 10 of 17 - Monday 30th December, 2013
This document is for private circulation, and must be read in conjunction with the disclaimer on the last page.
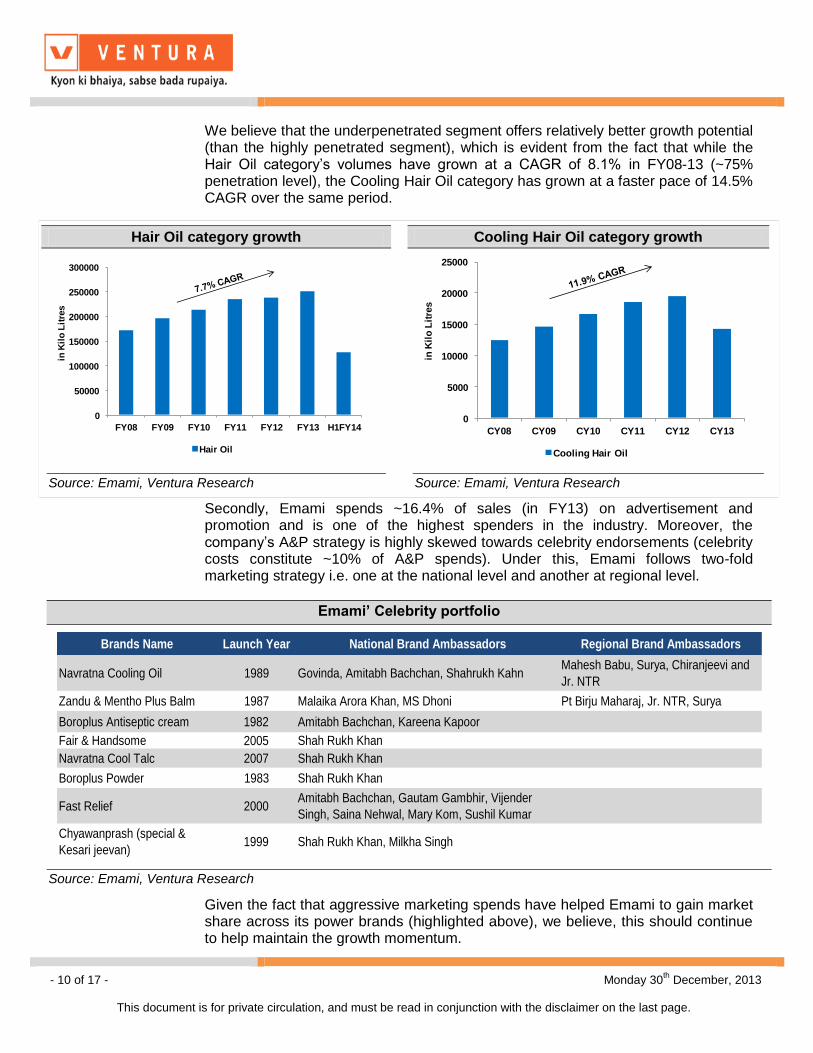
We believe that the underpenetrated segment offers relatively better growth potential (than the highly penetrated segment), which is evident from the fact that while the Hair Oil category‟s volumes have grown at a CAGR of 8.1% in FY08-13 (~75% penetration level), the Cooling Hair Oil category has grown at a faster pace of 14.5% CAGR over the same period.
Secondly, Emami spends ~16.4% of sales (in FY13) on advertisement and promotion and is one of the highest spenders in the industry. Moreover, the company‟s A&P strategy is highly skewed towards celebrity endorsements (celebrity costs constitute ~10% of A&P spends). Under this, Emami follows two-fold marketing strategy i.e. one at the national level and another at regional level.
Given the fact that aggressive marketing spends have helped Emami to gain market share across its power brands (highlighted above), we believe, this should continue to help maintain the growth momentum.
Emami’ Celebrity portfolio
Brands Name Launch Year National Brand Ambassadors Regional Brand Ambassadors
Navratna Cooling Oil 1989 Govinda, Amitabh Bachchan, Shahrukh KahnMahesh Babu, Surya, Chiranjeevi and
Jr. NTR
Zandu & Mentho Plus Balm 1987 Malaika Arora Khan, MS Dhoni Pt Birju Maharaj, Jr. NTR, Surya
Boroplus Antiseptic cream 1982 Amitabh Bachchan, Kareena Kapoor
Fair & Handsome 2005 Shah Rukh Khan
Navratna Cool Talc 2007 Shah Rukh Khan
Boroplus Powder 1983 Shah Rukh Khan
Fast Relief 2000Amitabh Bachchan, Gautam Gambhir, Vijender
Singh, Saina Nehwal, Mary Kom, Sushil Kumar
Chyawanprash (special &
Kesari jeevan)1999 Shah Rukh Khan, Milkha Singh
Source: Emami, Ventura Research
Hair Oil category growth Cooling Hair Oil category growth
0
50000
100000
150000
200000
250000
300000
FY08 FY09 FY10 FY11 FY12 FY13 H1FY14
in K
ilo
Lit
res
Hair Oil
0
5000
10000
15000
20000
25000
CY08 CY09 CY10 CY11 CY12 CY13in
Kil
o L
itre
s
Cooling Hair Oil
Source: Emami, Ventura Research
Source: Emami, Ventura Research
- 11 of 17 - Monday 30th December, 2013
This document is for private circulation, and must be read in conjunction with the disclaimer on the last page.
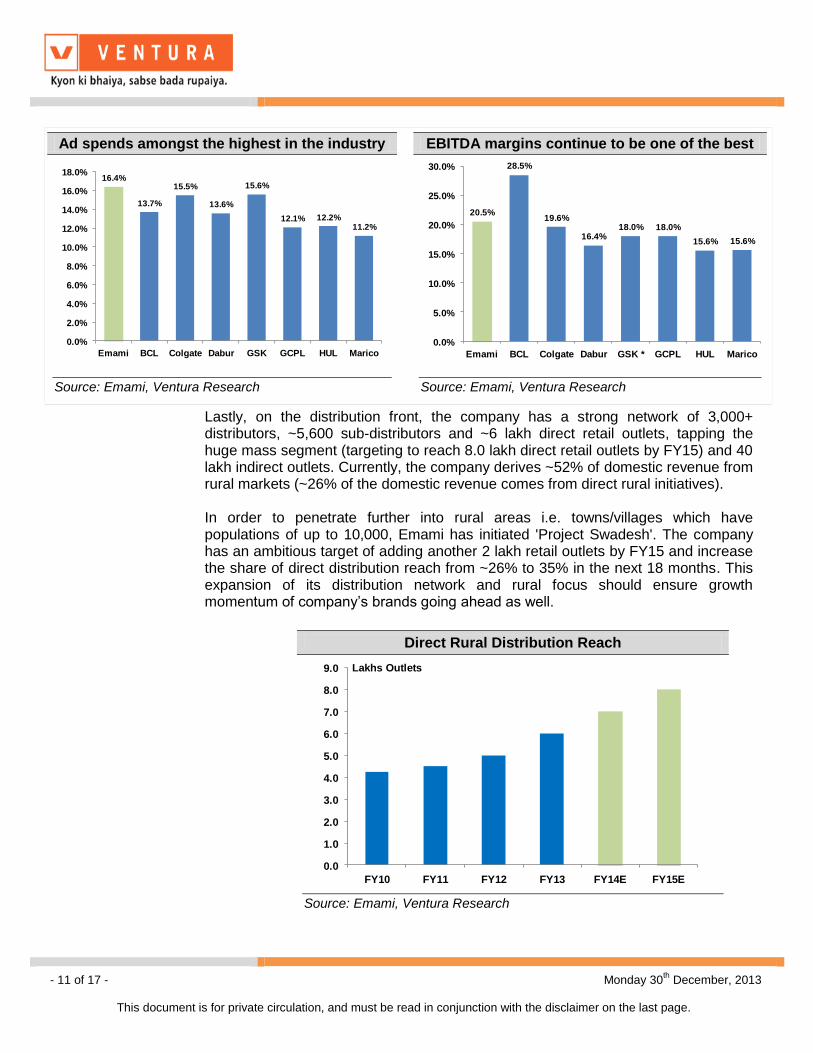
Lastly, on the distribution front, the company has a strong network of 3,000+ distributors, ~5,600 sub-distributors and ~6 lakh direct retail outlets, tapping the huge mass segment (targeting to reach 8.0 lakh direct retail outlets by FY15) and 40 lakh indirect outlets. Currently, the company derives ~52% of domestic revenue from rural markets (~26% of the domestic revenue comes from direct rural initiatives). In order to penetrate further into rural areas i.e. towns/villages which have populations of up to 10,000, Emami has initiated 'Project Swadesh'. The company has an ambitious target of adding another 2 lakh retail outlets by FY15 and increase the share of direct distribution reach from ~26% to 35% in the next 18 months. This expansion of its distribution network and rural focus should ensure growth momentum of company‟s brands going ahead as well.
Ad spends amongst the highest in the industry EBITDA margins continue to be one of the best
16.4%
13.7%
15.5%
13.6%
15.6%
12.1% 12.2%11.2%
0.0%
2.0%
4.0%
6.0%
8.0%
10.0%
12.0%
14.0%
16.0%
18.0%
Emami BCL Colgate Dabur GSK GCPL HUL Marico
20.5%
28.5%
19.6%
16.4%18.0% 18.0%
15.6% 15.6%
0.0%
5.0%
10.0%
15.0%
20.0%
25.0%
30.0%
Emami BCL Colgate Dabur GSK * GCPL HUL Marico
Source: Emami, Ventura Research
Source: Emami, Ventura Research
Direct Rural Distribution Reach
0.0
1.0
2.0
3.0
4.0
5.0
6.0
7.0
8.0
9.0
FY10 FY11 FY12 FY13 FY14E FY15E
Lakhs Outlets
Source: Emami, Ventura Research
- 12 of 17 - Monday 30th December, 2013
This document is for private circulation, and must be read in conjunction with the disclaimer on the last page.
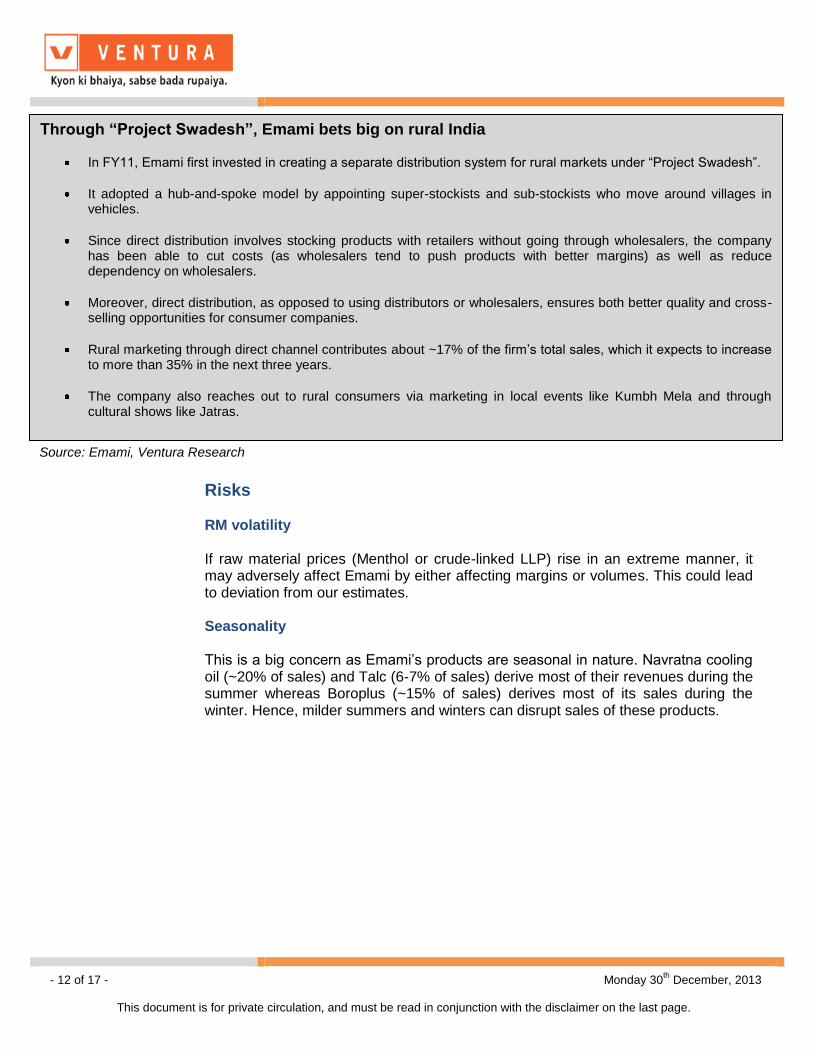
Risks RM volatility If raw material prices (Menthol or crude-linked LLP) rise in an extreme manner, it may adversely affect Emami by either affecting margins or volumes. This could lead to deviation from our estimates. Seasonality This is a big concern as Emami‟s products are seasonal in nature. Navratna cooling oil (~20% of sales) and Talc (6-7% of sales) derive most of their revenues during the summer whereas Boroplus (~15% of sales) derives most of its sales during the winter. Hence, milder summers and winters can disrupt sales of these products.
Through “Project Swadesh”, Emami bets big on rural India
In FY11, Emami first invested in creating a separate distribution system for rural markets under “Project Swadesh”.
It adopted a hub-and-spoke model by appointing super-stockists and sub-stockists who move around villages in vehicles.
Since direct distribution involves stocking products with retailers without going through wholesalers, the company has been able to cut costs (as wholesalers tend to push products with better margins) as well as reduce dependency on wholesalers.
Moreover, direct distribution, as opposed to using distributors or wholesalers, ensures both better quality and cross-selling opportunities for consumer companies.
Rural marketing through direct channel contributes about ~17% of the firm‟s total sales, which it expects to increase to more than 35% in the next three years.
The company also reaches out to rural consumers via marketing in local events like Kumbh Mela and through cultural shows like Jatras.
Source: Emami, Ventura Research
- 13 of 17 - Monday 30th December, 2013
This document is for private circulation, and must be read in conjunction with the disclaimer on the last page.
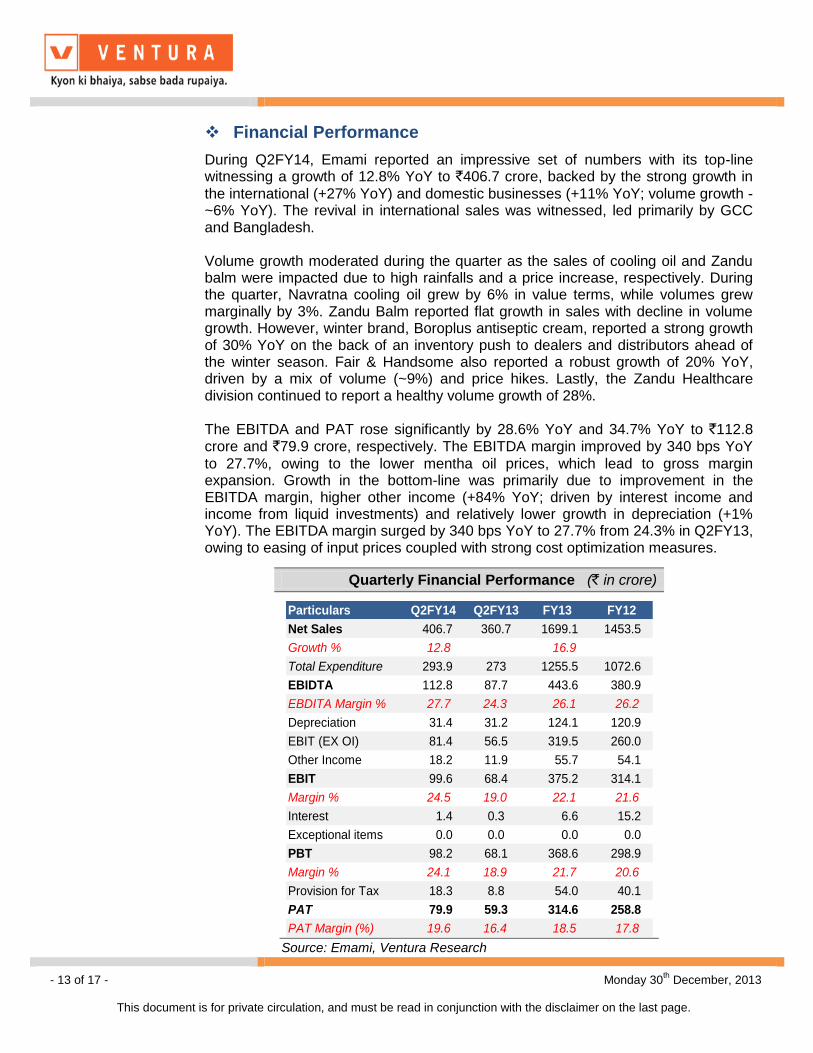
Financial Performance
During Q2FY14, Emami reported an impressive set of numbers with its top-line witnessing a growth of 12.8% YoY to `406.7 crore, backed by the strong growth in
the international (+27% YoY) and domestic businesses (+11% YoY; volume growth - ~6% YoY). The revival in international sales was witnessed, led primarily by GCC and Bangladesh. Volume growth moderated during the quarter as the sales of cooling oil and Zandu balm were impacted due to high rainfalls and a price increase, respectively. During the quarter, Navratna cooling oil grew by 6% in value terms, while volumes grew marginally by 3%. Zandu Balm reported flat growth in sales with decline in volume growth. However, winter brand, Boroplus antiseptic cream, reported a strong growth of 30% YoY on the back of an inventory push to dealers and distributors ahead of the winter season. Fair & Handsome also reported a robust growth of 20% YoY, driven by a mix of volume (~9%) and price hikes. Lastly, the Zandu Healthcare division continued to report a healthy volume growth of 28%. The EBITDA and PAT rose significantly by 28.6% YoY and 34.7% YoY to `112.8 crore and `79.9 crore, respectively. The EBITDA margin improved by 340 bps YoY
to 27.7%, owing to the lower mentha oil prices, which lead to gross margin expansion. Growth in the bottom-line was primarily due to improvement in the EBITDA margin, higher other income (+84% YoY; driven by interest income and income from liquid investments) and relatively lower growth in depreciation (+1% YoY). The EBITDA margin surged by 340 bps YoY to 27.7% from 24.3% in Q2FY13, owing to easing of input prices coupled with strong cost optimization measures.
Quarterly Financial Performance (` in crore)
Particulars Q2FY14 Q2FY13 FY13 FY12
Net Sales 406.7 360.7 1699.1 1453.5
Growth % 12.8 16.9
Total Expenditure 293.9 273 1255.5 1072.6
EBIDTA 112.8 87.7 443.6 380.9
EBDITA Margin % 27.7 24.3 26.1 26.2
Depreciation 31.4 31.2 124.1 120.9
EBIT (EX OI) 81.4 56.5 319.5 260.0
Other Income 18.2 11.9 55.7 54.1
EBIT 99.6 68.4 375.2 314.1
Margin % 24.5 19.0 22.1 21.6
Interest 1.4 0.3 6.6 15.2
Exceptional items 0.0 0.0 0.0 0.0
PBT 98.2 68.1 368.6 298.9
Margin % 24.1 18.9 21.7 20.6
Provision for Tax 18.3 8.8 54.0 40.1
PAT 79.9 59.3 314.6 258.8
PAT Margin (%) 19.6 16.4 18.5 17.8
Source: Emami, Ventura Research
- 14 of 17 - Monday 30th December, 2013
This document is for private circulation, and must be read in conjunction with the disclaimer on the last page.
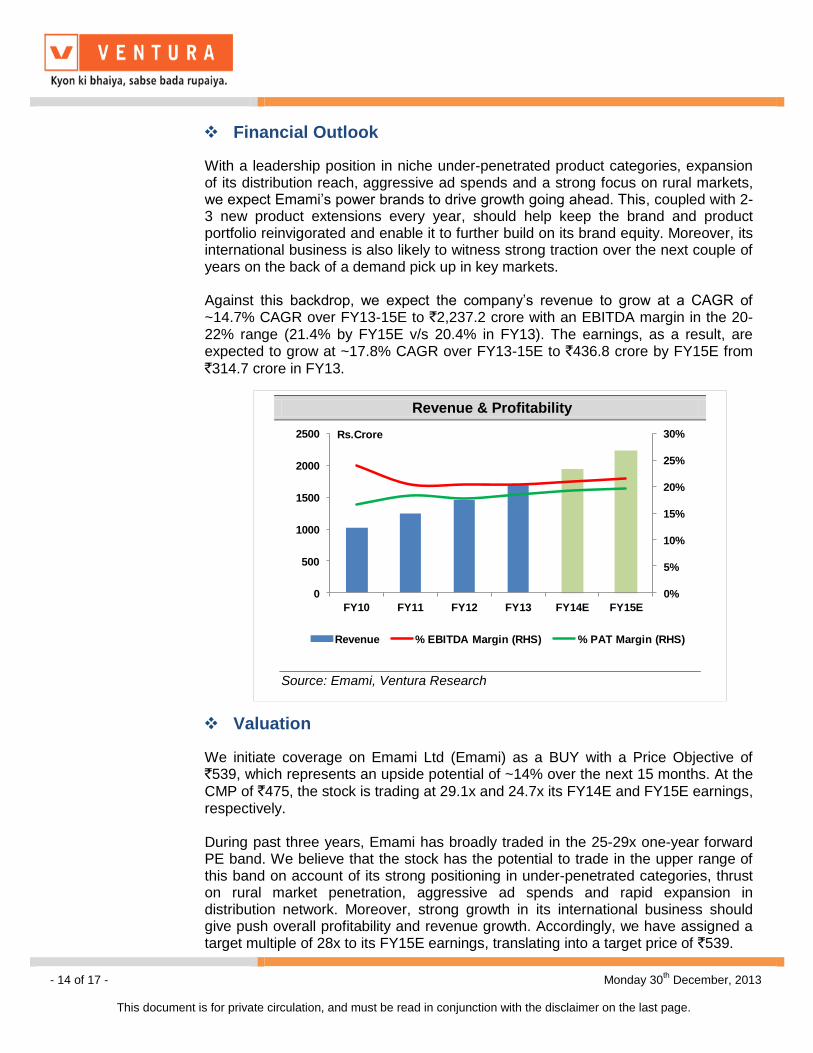
Financial Outlook
With a leadership position in niche under-penetrated product categories, expansion of its distribution reach, aggressive ad spends and a strong focus on rural markets, we expect Emami‟s power brands to drive growth going ahead. This, coupled with 2-3 new product extensions every year, should help keep the brand and product portfolio reinvigorated and enable it to further build on its brand equity. Moreover, its international business is also likely to witness strong traction over the next couple of years on the back of a demand pick up in key markets. Against this backdrop, we expect the company‟s revenue to grow at a CAGR of ~14.7% CAGR over FY13-15E to `2,237.2 crore with an EBITDA margin in the 20-22% range (21.4% by FY15E v/s 20.4% in FY13). The earnings, as a result, are expected to grow at ~17.8% CAGR over FY13-15E to `436.8 crore by FY15E from
`314.7 crore in FY13.
Valuation
We initiate coverage on Emami Ltd (Emami) as a BUY with a Price Objective of `539, which represents an upside potential of ~14% over the next 15 months. At the
CMP of `475, the stock is trading at 29.1x and 24.7x its FY14E and FY15E earnings, respectively. During past three years, Emami has broadly traded in the 25-29x one-year forward PE band. We believe that the stock has the potential to trade in the upper range of this band on account of its strong positioning in under-penetrated categories, thrust on rural market penetration, aggressive ad spends and rapid expansion in distribution network. Moreover, strong growth in its international business should give push overall profitability and revenue growth. Accordingly, we have assigned a target multiple of 28x to its FY15E earnings, translating into a target price of `539.
Revenue & Profitability
0%
5%
10%
15%
20%
25%
30%
0
500
1000
1500
2000
2500
FY10 FY11 FY12 FY13 FY14E FY15E
Rs.Crore
Revenue % EBITDA Margin (RHS) % PAT Margin (RHS)
Source: Emami, Ventura Research
- 15 of 17 - Monday 30th December, 2013
This document is for private circulation, and must be read in conjunction with the disclaimer on the last page.
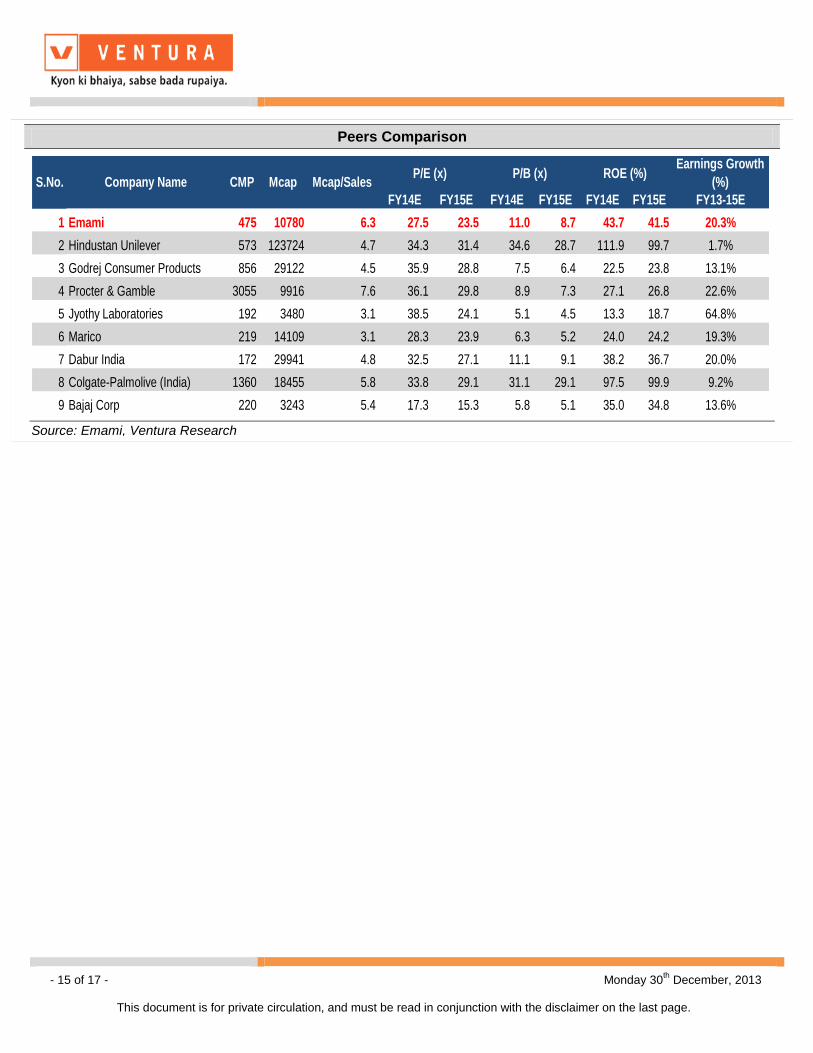
Peers Comparison
Earnings Growth
(%)
FY14E FY15E FY14E FY15E FY14E FY15E FY13-15E
1 Emami 475 10780 6.3 27.5 23.5 11.0 8.7 43.7 41.5 20.3%
2 Hindustan Unilever 573 123724 4.7 34.3 31.4 34.6 28.7 111.9 99.7 1.7%
3 Godrej Consumer Products 856 29122 4.5 35.9 28.8 7.5 6.4 22.5 23.8 13.1%
4 Procter & Gamble 3055 9916 7.6 36.1 29.8 8.9 7.3 27.1 26.8 22.6%
5 Jyothy Laboratories 192 3480 3.1 38.5 24.1 5.1 4.5 13.3 18.7 64.8%
6 Marico 219 14109 3.1 28.3 23.9 6.3 5.2 24.0 24.2 19.3%
7 Dabur India 172 29941 4.8 32.5 27.1 11.1 9.1 38.2 36.7 20.0%
8 Colgate-Palmolive (India) 1360 18455 5.8 33.8 29.1 31.1 29.1 97.5 99.9 9.2%
9 Bajaj Corp 220 3243 5.4 17.3 15.3 5.8 5.1 35.0 34.8 13.6%
P/E (x) P/B (x) ROE (%)S.No. Company Name CMP Mcap Mcap/Sales
Source: Emami, Ventura Research
- 16 of 17 - Monday 30th December, 2013
This document is for private circulation, and must be read in conjunction with the disclaimer on the last page.
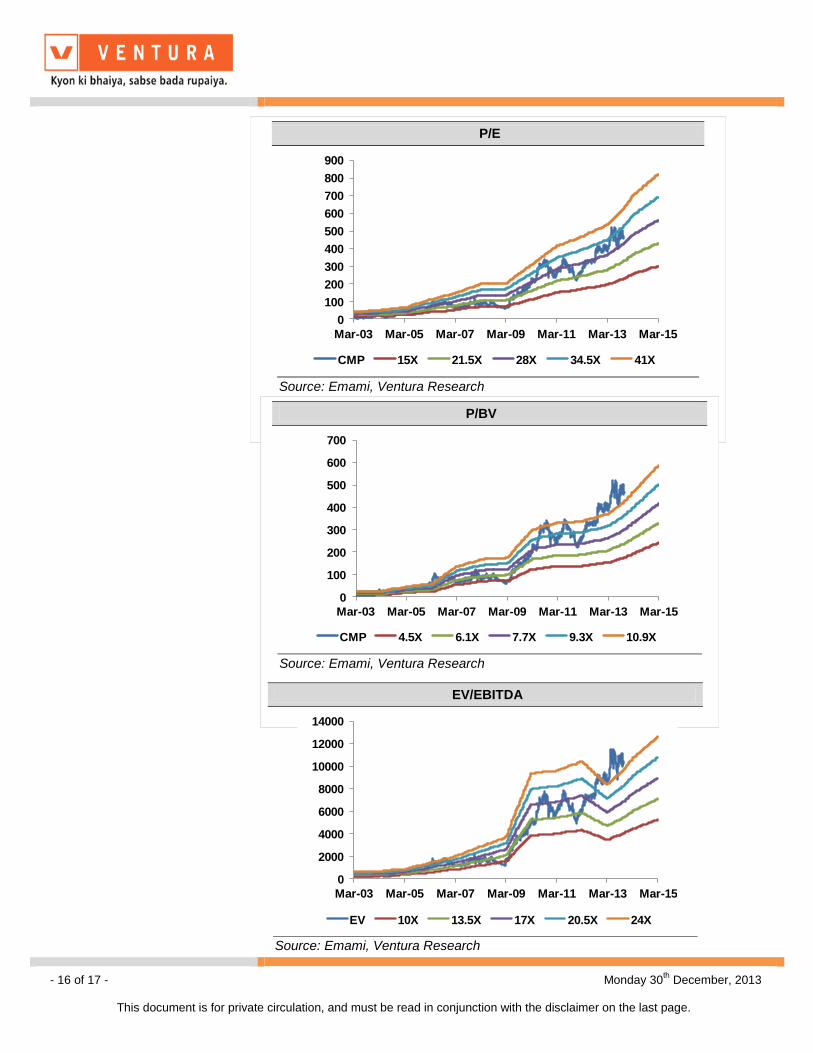
P/E
0
100
200
300
400
500
600
700
800
900
Mar-03 Mar-05 Mar-07 Mar-09 Mar-11 Mar-13 Mar-15
CMP 15X 21.5X 28X 34.5X 41X
Source: Emami, Ventura Research
P/BV
0
100
200
300
400
500
600
700
Mar-03 Mar-05 Mar-07 Mar-09 Mar-11 Mar-13 Mar-15
CMP 4.5X 6.1X 7.7X 9.3X 10.9X
Source: Emami, Ventura Research
EV/EBITDA
0
2000
4000
6000
8000
10000
12000
14000
Mar-03 Mar-05 Mar-07 Mar-09 Mar-11 Mar-13 Mar-15
EV 10X 13.5X 17X 20.5X 24X
Source: Emami, Ventura Research
- 17 of 17 - Monday 30th December, 2013
This document is for private circulation, and must be read in conjunction with the disclaimer on the last page.
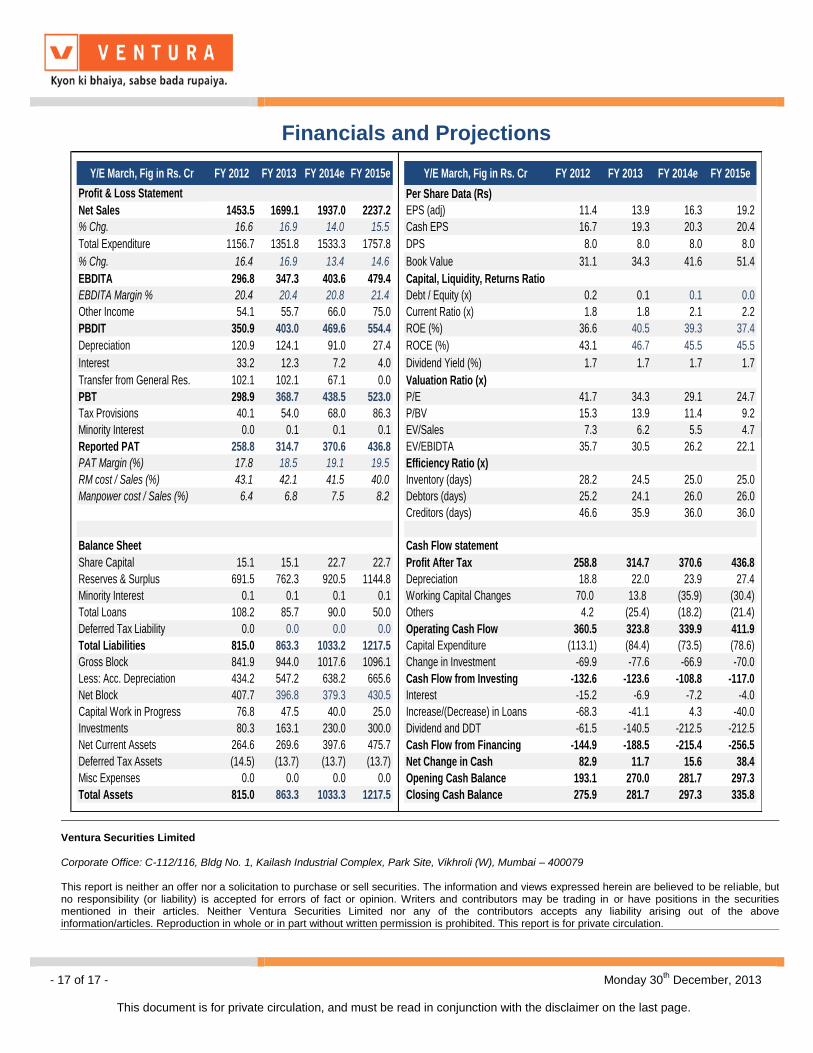
Financials and Projections
Y/E March, Fig in Rs. Cr FY 2012 FY 2013 FY 2014e FY 2015e Y/E March, Fig in Rs. Cr FY 2012 FY 2013 FY 2014e FY 2015e
Profit & Loss Statement Per Share Data (Rs)
Net Sales 1453.5 1699.1 1937.0 2237.2 EPS (adj) 11.4 13.9 16.3 19.2
% Chg. 16.6 16.9 14.0 15.5 Cash EPS 16.7 19.3 20.3 20.4
Total Expenditure 1156.7 1351.8 1533.3 1757.8 DPS 8.0 8.0 8.0 8.0
% Chg. 16.4 16.9 13.4 14.6 Book Value 31.1 34.3 41.6 51.4
EBDITA 296.8 347.3 403.6 479.4 Capital, Liquidity, Returns Ratio
EBDITA Margin % 20.4 20.4 20.8 21.4 Debt / Equity (x) 0.2 0.1 0.1 0.0
Other Income 54.1 55.7 66.0 75.0 Current Ratio (x) 1.8 1.8 2.1 2.2
PBDIT 350.9 403.0 469.6 554.4 ROE (%) 36.6 40.5 39.3 37.4
Depreciation 120.9 124.1 91.0 27.4 ROCE (%) 43.1 46.7 45.5 45.5
Interest 33.2 12.3 7.2 4.0 Dividend Yield (%) 1.7 1.7 1.7 1.7
Transfer from General Res. 102.1 102.1 67.1 0.0 Valuation Ratio (x)
PBT 298.9 368.7 438.5 523.0 P/E 41.7 34.3 29.1 24.7
Tax Provisions 40.1 54.0 68.0 86.3 P/BV 15.3 13.9 11.4 9.2
Minority Interest 0.0 0.1 0.1 0.1 EV/Sales 7.3 6.2 5.5 4.7
Reported PAT 258.8 314.7 370.6 436.8 EV/EBIDTA 35.7 30.5 26.2 22.1
PAT Margin (%) 17.8 18.5 19.1 19.5 Efficiency Ratio (x)
RM cost / Sales (%) 43.1 42.1 41.5 40.0 Inventory (days) 28.2 24.5 25.0 25.0
Manpower cost / Sales (%) 6.4 6.8 7.5 8.2 Debtors (days) 25.2 24.1 26.0 26.0
Creditors (days) 46.6 35.9 36.0 36.0
Balance Sheet Cash Flow statement
Share Capital 15.1 15.1 22.7 22.7 Profit After Tax 258.8 314.7 370.6 436.8
Reserves & Surplus 691.5 762.3 920.5 1144.8 Depreciation 18.8 22.0 23.9 27.4
Minority Interest 0.1 0.1 0.1 0.1 Working Capital Changes 70.0 13.8 (35.9) (30.4)
Total Loans 108.2 85.7 90.0 50.0 Others 4.2 (25.4) (18.2) (21.4)
Deferred Tax Liability 0.0 0.0 0.0 0.0 Operating Cash Flow 360.5 323.8 339.9 411.9
Total Liabilities 815.0 863.3 1033.2 1217.5 Capital Expenditure (113.1) (84.4) (73.5) (78.6)
Gross Block 841.9 944.0 1017.6 1096.1 Change in Investment -69.9 -77.6 -66.9 -70.0
Less: Acc. Depreciation 434.2 547.2 638.2 665.6 Cash Flow from Investing -132.6 -123.6 -108.8 -117.0
Net Block 407.7 396.8 379.3 430.5 Interest -15.2 -6.9 -7.2 -4.0
Capital Work in Progress 76.8 47.5 40.0 25.0 Increase/(Decrease) in Loans -68.3 -41.1 4.3 -40.0
Investments 80.3 163.1 230.0 300.0 Dividend and DDT -61.5 -140.5 -212.5 -212.5
Net Current Assets 264.6 269.6 397.6 475.7 Cash Flow from Financing -144.9 -188.5 -215.4 -256.5
Deferred Tax Assets (14.5) (13.7) (13.7) (13.7) Net Change in Cash 82.9 11.7 15.6 38.4
Misc Expenses 0.0 0.0 0.0 0.0 Opening Cash Balance 193.1 270.0 281.7 297.3
Total Assets 815.0 863.3 1033.3 1217.5 Closing Cash Balance 275.9 281.7 297.3 335.8
Ventura Securities Limited Corporate Office: C-112/116, Bldg No. 1, Kailash Industrial Complex, Park Site, Vikhroli (W), Mumbai – 400079 This report is neither an offer nor a solicitation to purchase or sell securities. The information and views expressed herein are believed to be reliable, but no responsibility (or liability) is accepted for errors of fact or opinion. Writers and contributors may be trading in or have positions in the securities mentioned in their articles. Neither Ventura Securities Limited nor any of the contributors accepts any liability arising out of the above information/articles. Reproduction in whole or in part without written permission is prohibited. This report is for private circulation.
Recommended