University of Kentucky University of Kentucky
UKnowledge UKnowledge
University of Kentucky Master's Theses Graduate School
2010
EFFECTS OF LIVESTOCK ANTIBIOTICS ON NITRIFICATION, EFFECTS OF LIVESTOCK ANTIBIOTICS ON NITRIFICATION,
DENITRIFICATION, AND MICROBIAL COMMUNITY COMPOSITON DENITRIFICATION, AND MICROBIAL COMMUNITY COMPOSITON
IN SOILS ALONG A TOPOGRAPHIC GRADIENT IN SOILS ALONG A TOPOGRAPHIC GRADIENT
Sagarika Banerjee University of Kentucky, [email protected]
Right click to open a feedback form in a new tab to let us know how this document benefits you. Right click to open a feedback form in a new tab to let us know how this document benefits you.
Recommended Citation Recommended Citation Banerjee, Sagarika, "EFFECTS OF LIVESTOCK ANTIBIOTICS ON NITRIFICATION, DENITRIFICATION, AND MICROBIAL COMMUNITY COMPOSITON IN SOILS ALONG A TOPOGRAPHIC GRADIENT" (2010). University of Kentucky Master's Theses. 43. https://uknowledge.uky.edu/gradschool_theses/43
This Thesis is brought to you for free and open access by the Graduate School at UKnowledge. It has been accepted for inclusion in University of Kentucky Master's Theses by an authorized administrator of UKnowledge. For more information, please contact [email protected].
ABSTRACT OF THESIS
EFFECTS OF LIVESTOCK ANTIBIOTICS ON NITRIFICATION, DENITRIFICATION, AND MICROBIAL COMMUNITY COMPOSITON IN SOILS
ALONG A TOPOGRAPHIC GRADIENT
Several types of antibiotics (roxarsone, virginiamycin, and bacitracin) are widely
included in poultry feed to improve animal growth yields. Most of the antibiotics are
excreted in manure which is subsequently applied to soils. One concern with this practice
is that antibiotics may affect several microbially-mediated nutrient cycling reactions in
soils that influence crop productivity and water quality. The main objectives of this study
were to determine the effects of livestock antibiotics on nitrification, denitrification, and
microbial community composition in soils along a topographic gradient. These objectives
were addressed in a series of lab experiments by monitoring changes in inorganic N
species and ester-linked fatty acid methyl ester profiles after exposing soil
microorganisms collected from different topographic positions to increasing levels of
antibiotics. It was discovered that roxarsone and virginiamycin inhibited nitrification and
soil microbial growth and also influenced microbial community composition, but only at
levels that were much higher than expected in poultry litter-applied soils. Bacitracin did
not affect nitrification, microbial growth, or microbial community composition at any
concentration tested. None of the antibiotics had a strong affect on denitrification. Thus, it is unlikely that soil, water, or air quality would be significantly impacted by the
antibiotics contained in poultry litter.
KEYWORDS: Bacitracin, Roxarsone, Virginiamycin, Ester-Linked Fatty Acid Methyl Ester, Sorption.
SAGARIKA BANERJEE
07/06/2010
EFFECTS OF LIVESTOCK ANTIBIOTICS ON NITRIFICATION,
DENITRIFICATION, AND MICROBIAL COMMUNITY COMPOSITON IN SOILS
ALONG A TOPOGRAPHIC GRADIENT
By
Sagarika Banerjee
DR. ELISA M. D’ANGELO
Director of Thesis
DR. CHARLES T. DOUGHERTY
Director of Graduate Studies
07/06/2010
Date
RULES FOR THE USE OF THESES
Unpublished theses submitted for the Master’s degree and deposited in the University of
Kentucky Library are as a rule open for inspection, but are to be used only with due
regard to the rights of the authors. Bibliographical references may be noted, but
quotations or summaries of parts may be published only with permission of the author
and with the usual scholarly acknowledgements.
Extensive copying and publication of the thesis in whole or in part also requires the
consent of the Dean of the Graduate School of the University of Kentucky.
A library that borrows this thesis for use by its patrons is expected to secure the signature
of each user.
Name Date
__________________________________________________________________
__________________________________________________________________
__________________________________________________________________
__________________________________________________________________
__________________________________________________________________
__________________________________________________________________
__________________________________________________________________
__________________________________________________________________
__________________________________________________________________
__________________________________________________________________
THESIS
Sagarika Banerjee
The Graduate School
University of Kentucky
2010
EFFECTS OF LIVESTOCK ANTIBIOTICS ON NITRIFICATION,
DENITRIFICATION, AND MICROBIAL COMMUNITY COMPOSITON IN SOILS
ALONG A TOPOGRAPHIC GRADIENT
______________________________________
THESIS
______________________________________
A thesis submitted in partial fulfillment of the
requirements for the degree of Master of Science in the
College of Agriculture
at the University of Kentucky
By
Sagarika Banerjee
Lexington, Kentucky
Director: Dr. Elisa M. D’Angelo, Associate Professor of Plant and Soil Sciences
Lexington, Kentucky
2010
Copyright© Sagarika Banerjee 2010
ACKNOWLEDGEMENTS
First and foremost I offer my sincerest gratitude to my advisor Dr Elisa D’Angelo, who
has supported me throughout my thesis with her patience and knowledge in my research
work at University of Kentucky. I attribute the level of my Masters degree to her
encouragement and effort and without her this thesis, too, would not have been
completed or written. I would like to thank Dr. Larry Grabau and Dr. Dave McNear, who
has served on my graduate committee. They were the sources of encouragement during
my study and my stay in the US.
It was my honor to be associated with and helped by technician and graduate
student. In particular I want to thank Georgia Zeigler for her consistent support and
encouragement during my research. I am grateful to Shawn Lucas for his help in fatty
acid part. I also want to thank College of Agriculture, Division of Regulatory Services at
University of Kentucky. They helped me in analyzing the soil chemical properties.
My deepest gratitude goes to my parents and my husband for their unconditional
love and support throughout my life; this thesis is simply impossible without them. Last
but not the least, thanks to the whole Department of Plant and Soil Sciences at University
of Kentucky.
iii
TABLE OF CONTENTS
Acknowledgements…………………………………………………………………. iii
List of Tables……………………………………………………………………….. vi
List of Figures……………………………………………………………………... vii
Chapter 1: Introduction
Overview of the Problem ………………………………….............................. 1
Antibiotic Use in the Broiler Production Industry …………………………… 1
Poultry and Manure Production in the US …………………………………… 9
Levels of Antibiotics in Manure and Amounts Dispersed to the Environment... 11
Fate of Antibiotics in the Environment ………………………………………. 12
Effects of Antibiotic Dispersal in the Environment ………………………….. 19
Nitrification …………………………………………………………………… 24
Denitrification ………………………………………………………………… 24
Chapter 2: Effects of Livestock Antibiotics on Nitrification, Denitrification, and
Microbial Community Composition in Soils Along a Topographic
Gradient
Introduction ………………………………………………………………….. 27
Methods and Materials
Study Area and Soil Collection ………………………. …………… 29
Effects of Antibiotics on Nitrification …………………………….. 29
Effects of Antibiotics on Denitrification ……………………......... 32
Effects of Antibiotics on Microbial Community Composition …… 33
EL-FAME Nomenclature …………………………………………. 34
Effect of Sorption on Antibiotic Bioavailability and Microbial
Growth ………………………………………………………………
35
Soil Property Characterization ……………………………………. 38
Statistical Analysis ………………………………………………… 39
Results
Effects of Antibiotics on Nitrification and Denitrification…………. 40
Effects of Antibiotics on Microbial Community Composition………
40
iv
Effect of Sorption on Antibiotic Bioavailability and Microbial
Growth………………………………………………………………
53
Chemical Properties of Soils at the Different Topographic Position... 53
Discussion …………………………………………………………………. 60
Conclusions ………………………………………………………………….. 65
References……………………………………………………………………. 67
Vita …………………………………………………………………………. 80
v
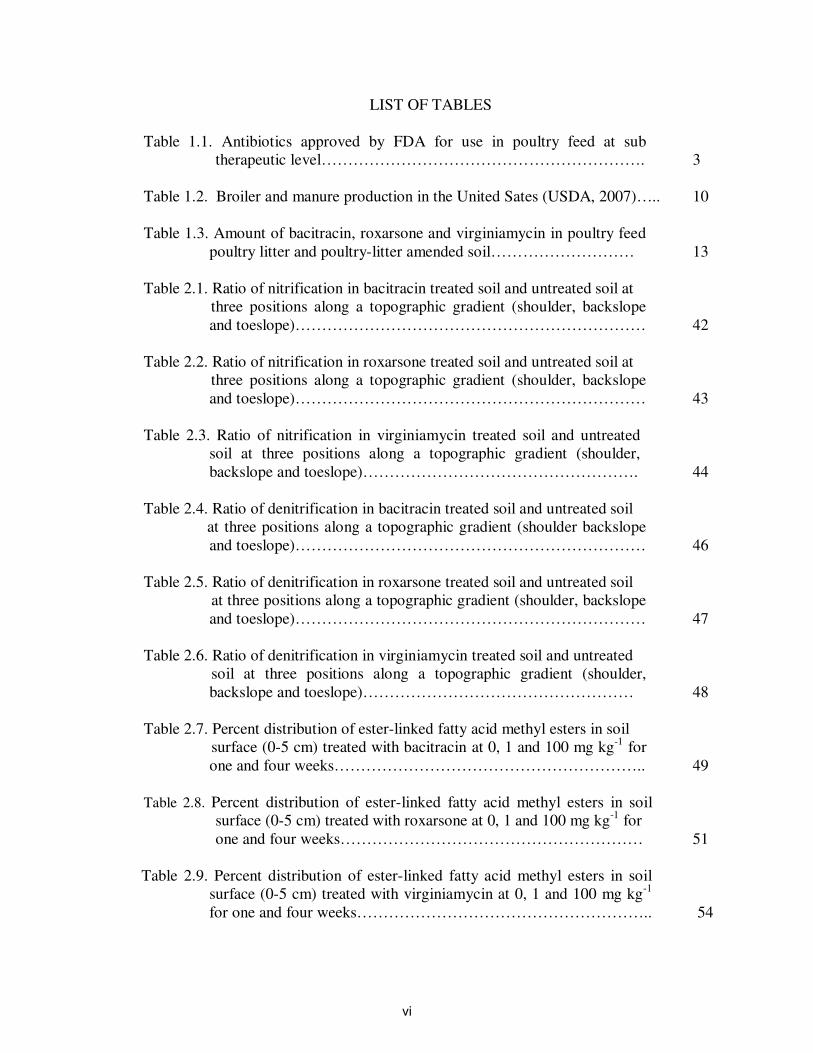
LIST OF TABLES
Table 1.1. Antibiotics approved by FDA for use in poultry feed at sub
therapeutic level…………………………………………………….
3
Table 1.2. Broiler and manure production in the United Sates (USDA, 2007)….. 10
Table 1.3. Amount of bacitracin, roxarsone and virginiamycin in poultry feed
poultry litter and poultry-litter amended soil………………………
13
Table 2.1. Ratio of nitrification in bacitracin treated soil and untreated soil at
three positions along a topographic gradient (shoulder, backslope
and toeslope)…………………………………………………………
42
Table 2.2. Ratio of nitrification in roxarsone treated soil and untreated soil at
three positions along a topographic gradient (shoulder, backslope
and toeslope)…………………………………………………………
43
Table 2.3. Ratio of nitrification in virginiamycin treated soil and untreated
soil at three positions along a topographic gradient (shoulder,
backslope and toeslope)…………………………………………….
44
Table 2.4. Ratio of denitrification in bacitracin treated soil and untreated soil
at three positions along a topographic gradient (shoulder backslope
and toeslope)…………………………………………………………
46
Table 2.5. Ratio of denitrification in roxarsone treated soil and untreated soil
at three positions along a topographic gradient (shoulder, backslope
and toeslope)…………………………………………………………
47
Table 2.6. Ratio of denitrification in virginiamycin treated soil and untreated
soil at three positions along a topographic gradient (shoulder,
backslope and toeslope)……………………………………………
48
Table 2.7. Percent distribution of ester-linked fatty acid methyl esters in soil
surface (0-5 cm) treated with bacitracin at 0, 1 and 100 mg kg-1
for
one and four weeks…………………………………………………..
49
Table 2.8. Percent distribution of ester-linked fatty acid methyl esters in soil
surface (0-5 cm) treated with roxarsone at 0, 1 and 100 mg kg-1
for
one and four weeks…………………………………………………
51
Table 2.9. Percent distribution of ester-linked fatty acid methyl esters in soil
surface (0-5 cm) treated with virginiamycin at 0, 1 and 100 mg kg-1
for one and four weeks………………………………………………..
54
vi
Table 2.10. Ratio of microbial growth in soil treated antibiotics (AT) and
untreated antibiotics (BT)…………………………………………….
58
Table 2.11. Chemical properties of soils at the shoulder, backslope and
toeslope along a gradient……………………………………………..
59
vii
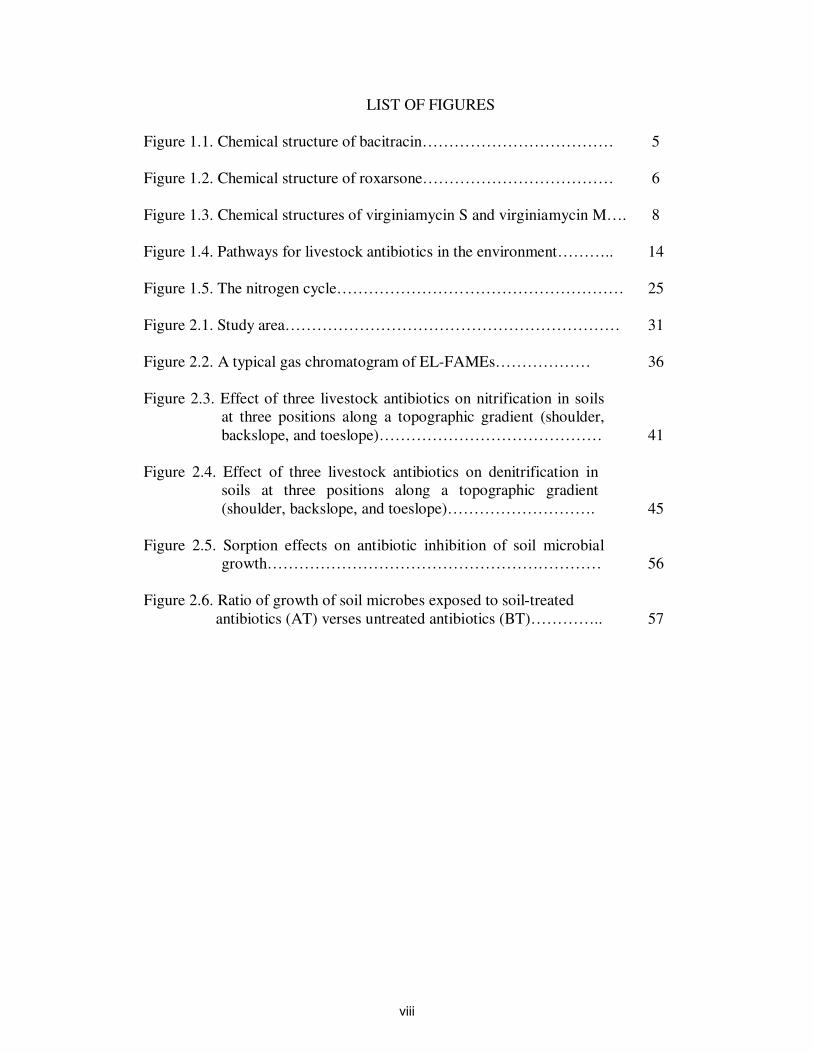
LIST OF FIGURES
Figure 1.1. Chemical structure of bacitracin………………………………
5
Figure 1.2. Chemical structure of roxarsone………………………………
6
Figure 1.3. Chemical structures of virginiamycin S and virginiamycin M….
8
Figure 1.4. Pathways for livestock antibiotics in the environment………..
14
Figure 1.5. The nitrogen cycle………………………………………………
25
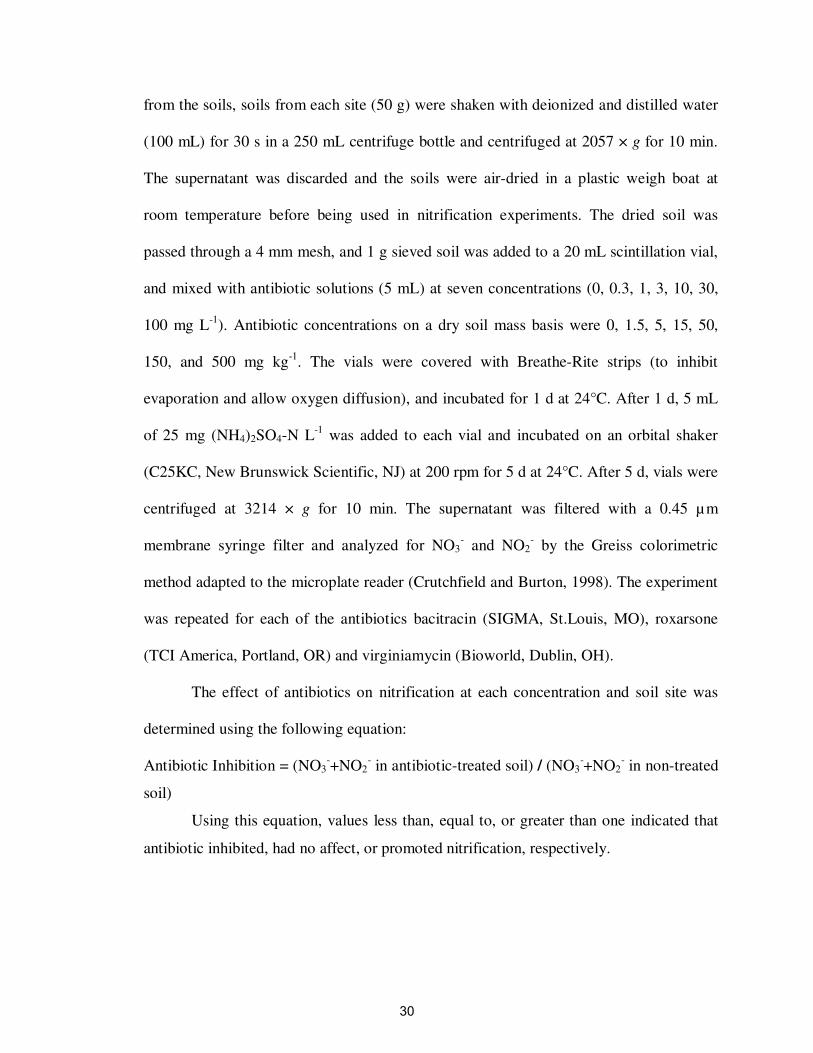
Figure 2.1. Study area………………………………………………………
31
Figure 2.2. A typical gas chromatogram of EL-FAMEs………………
36
Figure 2.3. Effect of three livestock antibiotics on nitrification in soils
at three positions along a topographic gradient (shoulder,
backslope, and toeslope)……………………………………
41
Figure 2.4. Effect of three livestock antibiotics on denitrification in
soils at three positions along a topographic gradient
(shoulder, backslope, and toeslope)……………………….
45
Figure 2.5. Sorption effects on antibiotic inhibition of soil microbial
growth………………………………………………………
56
Figure 2.6. Ratio of growth of soil microbes exposed to soil-treated
antibiotics (AT) verses untreated antibiotics (BT)…………..
57
viii
Chapter 1
Introduction
Overview of the Problem
Antibiotics are compounds produced at low concentrations by one microorganism
to inhibit the growth of other organisms (Thomashow et al., 2002). Several types of
antibiotics, such as bacitracin, virginiamycin, and roxarsone, are commonly included in
poultry feed at commercial broiler operations to improve the growth and to reduce
disease outbreaks of the birds. Most of the antibiotics fed to birds are excreted in manure,
which is subsequently amended to soils to improve soil fertility and dispose of the waste
product. As a consequence, considerable amounts of antibiotics are dispersed in the
environment where they can undergo a variety of fate processes and potentially affect
microbial community composition and processes in soils. The purpose of this study is to
evaluate the effects of antibiotics on microbial community structure and selected
biogeochemical reactions in soils.
Antibiotic Use in the Broiler Production Industry
Antibiotics were first discovered in the early 1900’s, and since then, have been
used to treat a variety of human and animal diseases (Kumar et al., 2005b). One of the
earliest discovered antibiotics, penicillin, was widely used to treat infections in World
War II casualties. Penicillin was later found to be effective at treating animal infections,
including bovine mastitis (Gustafson and Bowen, 1997).
Worldwide use of antibiotics is estimated to be between 101 × 106 kg to 203 × 10
6
kg (Kőmmerer, 2003). In the U.S.A., 9 to 16 × 106 kg of antibiotics per year are used by
1
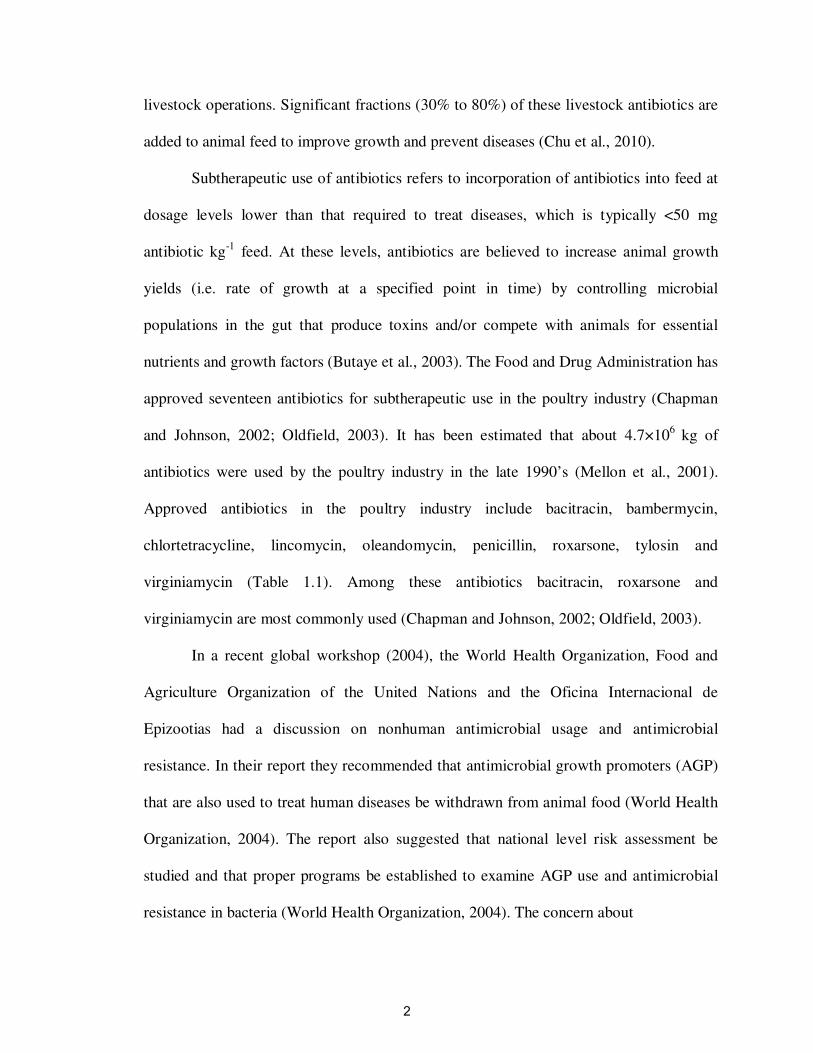
livestock operations. Significant fractions (30% to 80%) of these livestock antibiotics are
added to animal feed to improve growth and prevent diseases (Chu et al., 2010).
Subtherapeutic use of antibiotics refers to incorporation of antibiotics into feed at
dosage levels lower than that required to treat diseases, which is typically <50 mg
antibiotic kg-1
feed. At these levels, antibiotics are believed to increase animal growth
yields (i.e. rate of growth at a specified point in time) by controlling microbial
populations in the gut that produce toxins and/or compete with animals for essential
nutrients and growth factors (Butaye et al., 2003). The Food and Drug Administration has
approved seventeen antibiotics for subtherapeutic use in the poultry industry (Chapman
and Johnson, 2002; Oldfield, 2003). It has been estimated that about 4.7×10⁶
kg of
antibiotics were used by the poultry industry in the late 1990’s (Mellon et al., 2001).
Approved antibiotics in the poultry industry include bacitracin, bambermycin,
chlortetracycline, lincomycin, oleandomycin, penicillin, roxarsone, tylosin and
virginiamycin (Table 1.1). Among these antibiotics bacitracin, roxarsone and
virginiamycin are most commonly used (Chapman and Johnson, 2002; Oldfield, 2003).
In a recent global workshop (2004), the World Health Organization, Food and
Agriculture Organization of the United Nations and the Oficina Internacional de
Epizootias had a discussion on nonhuman antimicrobial usage and antimicrobial
resistance. In their report they recommended that antimicrobial growth promoters (AGP)
that are also used to treat human diseases be withdrawn from animal food (World Health
Organization, 2004). The report also suggested that national level risk assessment be
studied and that proper programs be established to examine AGP use and antimicrobial
resistance in bacteria (World Health Organization, 2004). The concern about
2
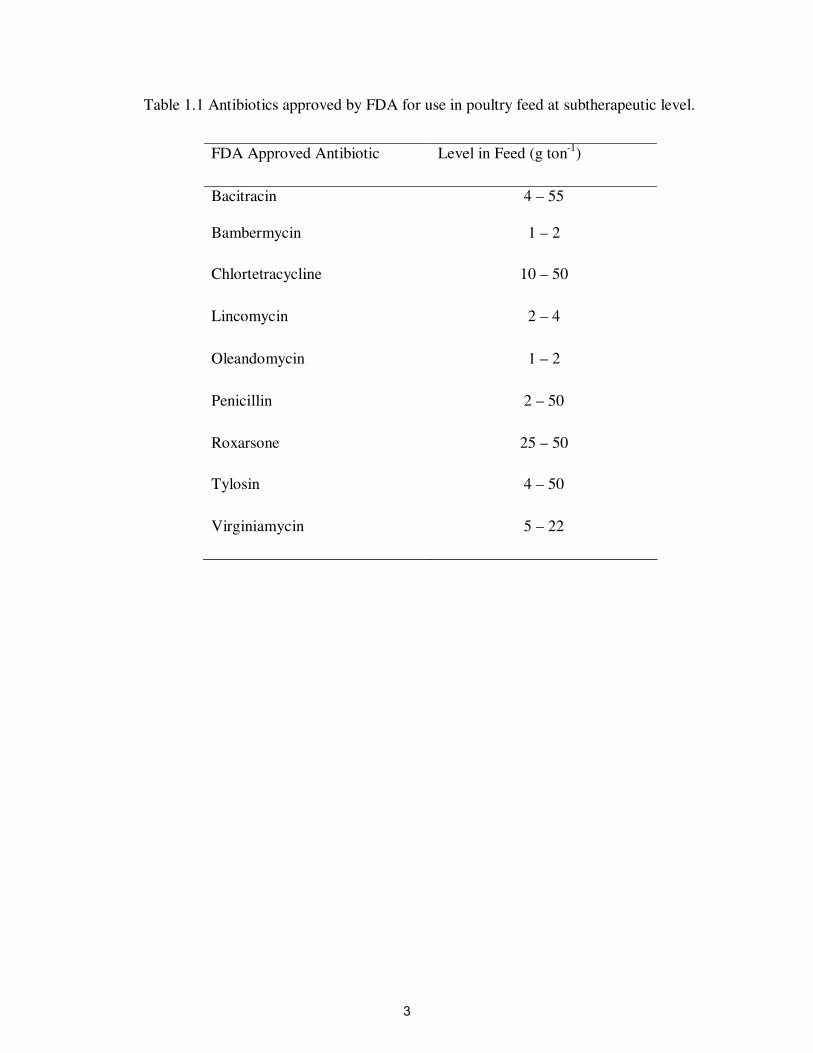
Table 1.1 Antibiotics approved by FDA for use in poultry feed at subtherapeutic level.
FDA Approved Antibiotic
Level in Feed (g ton-1
)
Bacitracin
4 – 55
Bambermycin
1 – 2
Chlortetracycline
10 – 50
Lincomycin
2 – 4
Oleandomycin
1 – 2
Penicillin
2 – 50
Roxarsone
25 – 50
Tylosin
4 – 50
Virginiamycin
5 – 22
3
antimicrobial additives in animal feed has stimulated attention on potential alternatives.
According to Dibner and Richards (2005), organic acids are gaining importance at this
time. Other alternatives include probiotics, aspartate biopolymers and
mannanoligosaccharides derived from yeast (Harper and Estienne, 2002).
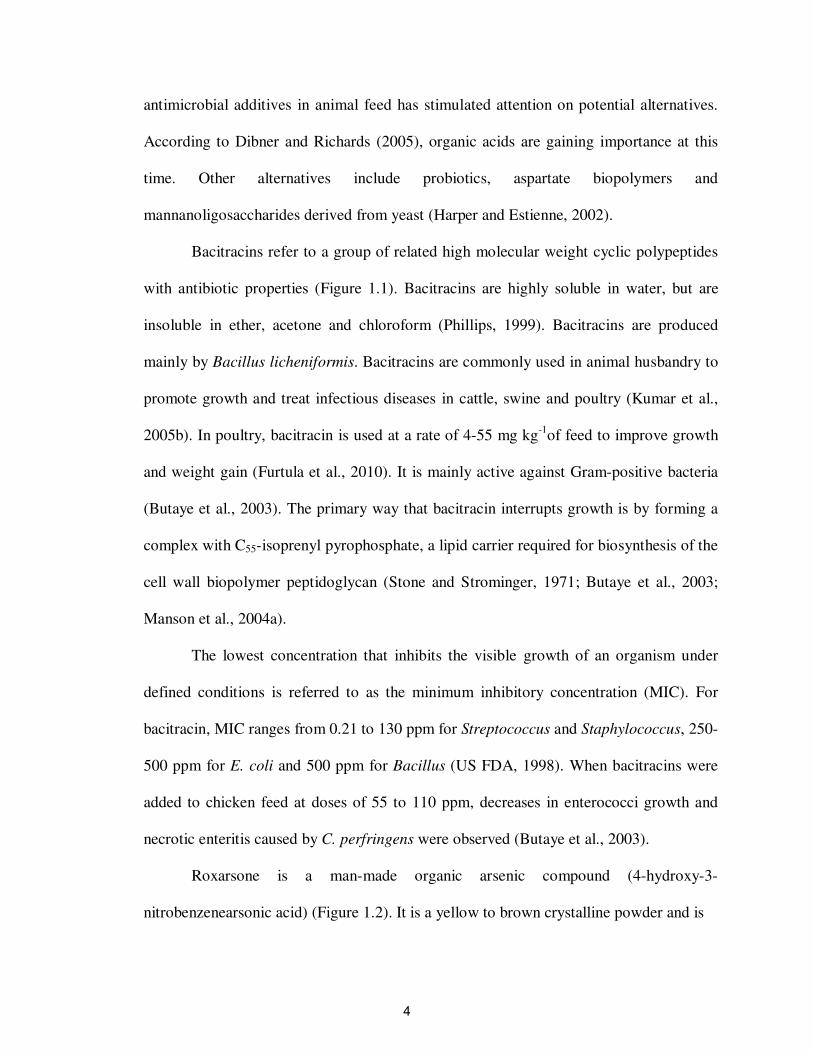
Bacitracins refer to a group of related high molecular weight cyclic polypeptides
with antibiotic properties (Figure 1.1). Bacitracins are highly soluble in water, but are
insoluble in ether, acetone and chloroform (Phillips, 1999). Bacitracins are produced
mainly by Bacillus licheniformis. Bacitracins are commonly used in animal husbandry to
promote growth and treat infectious diseases in cattle, swine and poultry (Kumar et al.,
2005b). In poultry, bacitracin is used at a rate of 4-55 mg kg-1
of feed to improve growth
and weight gain (Furtula et al., 2010). It is mainly active against Gram-positive bacteria
(Butaye et al., 2003). The primary way that bacitracin interrupts growth is by forming a
complex with C55-isoprenyl pyrophosphate, a lipid carrier required for biosynthesis of the
cell wall biopolymer peptidoglycan (Stone and Strominger, 1971; Butaye et al., 2003;
Manson et al., 2004a).
The lowest concentration that inhibits the visible growth of an organism under
defined conditions is referred to as the minimum inhibitory concentration (MIC). For
bacitracin, MIC ranges from 0.21 to 130 ppm for Streptococcus and Staphylococcus, 250-
500 ppm for E. coli and 500 ppm for Bacillus (US FDA, 1998). When bacitracins were
added to chicken feed at doses of 55 to 110 ppm, decreases in enterococci growth and
necrotic enteritis caused by C. perfringens were observed (Butaye et al., 2003).
Roxarsone is a man-made organic arsenic compound (4-hydroxy-3-
nitrobenzenearsonic acid) (Figure 1.2). It is a yellow to brown crystalline powder and is
4
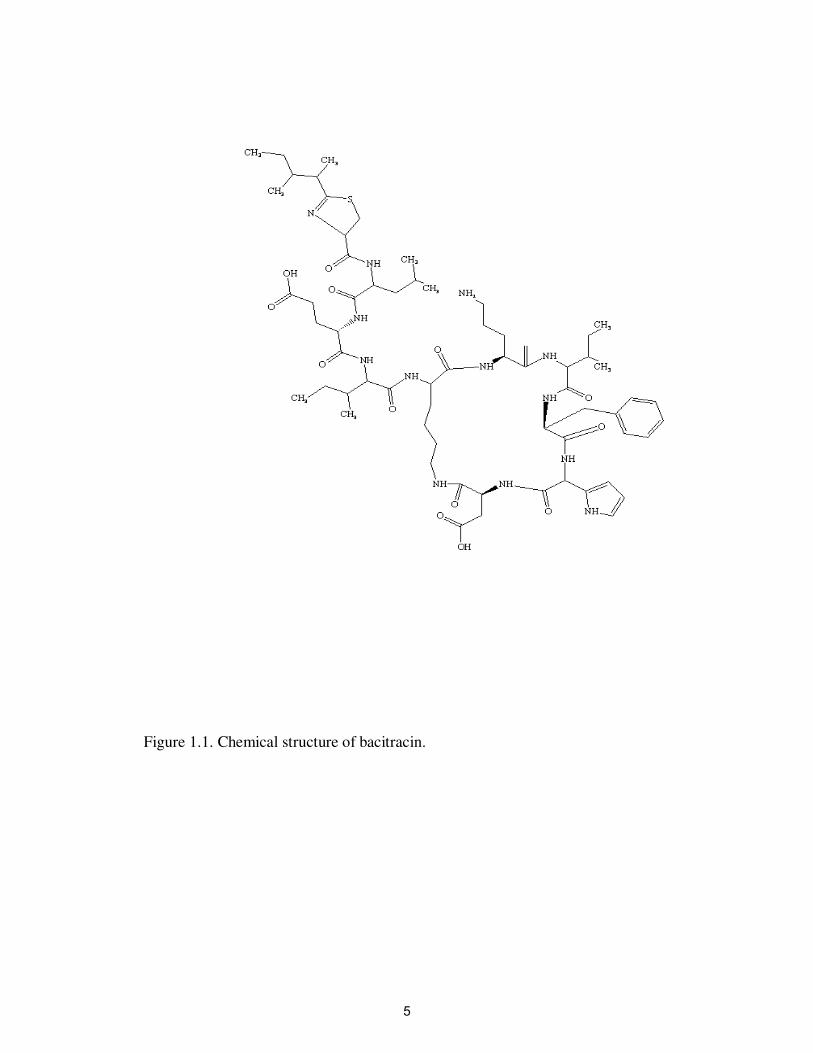
Figure 1.1. Chemical structure of bacitracin.
5
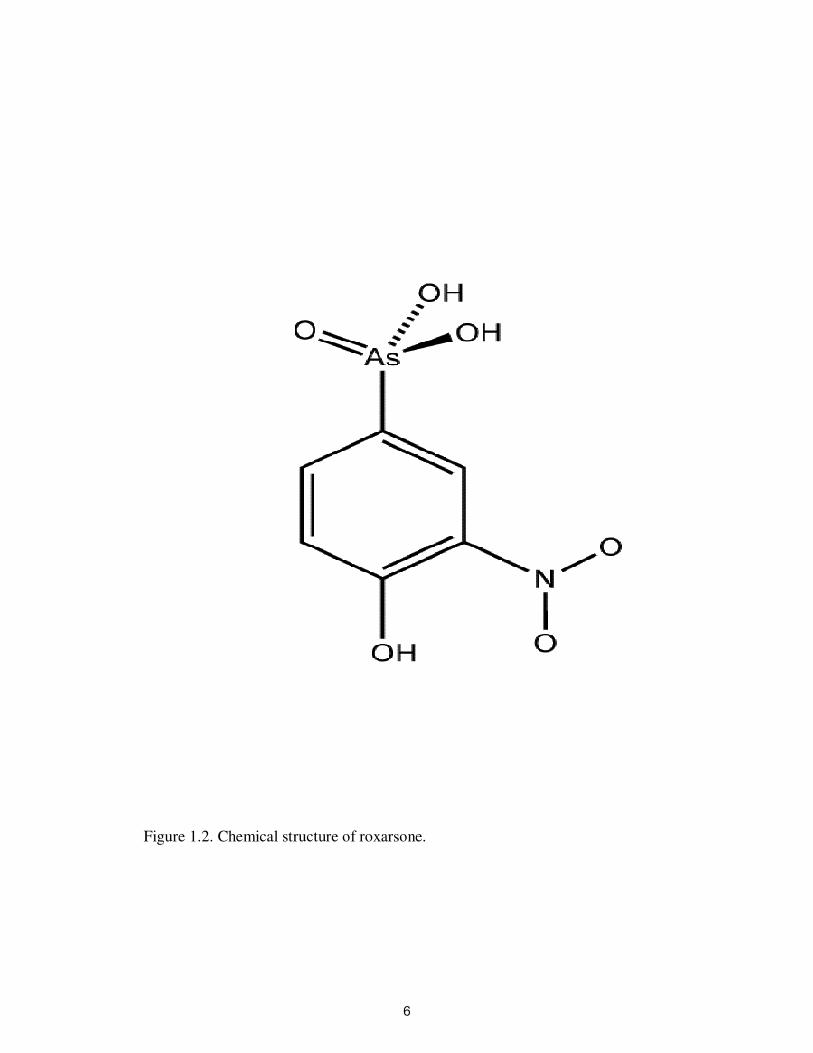
Figure 1.2. Chemical structure of roxarsone.
6
soluble in alcohol. It is extensively used in animal feed to promote growth and control
diseases. In poultry, roxarsone is used at a level of 25-50 mg kg-1
of feed to improve
growth, better feathering, increase egg production, pigmentation and prevent diseases
caused by coccidial intestinal parasites (Garbarino et al., 2001; Chapman and Johnson,
2002). The minimum inhibitory concentration of roxarsone ranges from 8 to 256 µg mL-1
for Campylobacter jejuni (Wang et al., 2009). Not much is known about how roxarsone
and related compounds affect microrganisms, however it is speculated that they may
catalyze energy transfer reactions in the cells by a direct metabolic effect (Clark et al.,
2003). Another mechanism is the replacement of phosphate by arsenate, which may lead
to the rapid hydrolysis of high-energy bonds in ATP that impairs gluconeogenesis and
oxidative phosphorylation (Vahidnia et al., 2007).
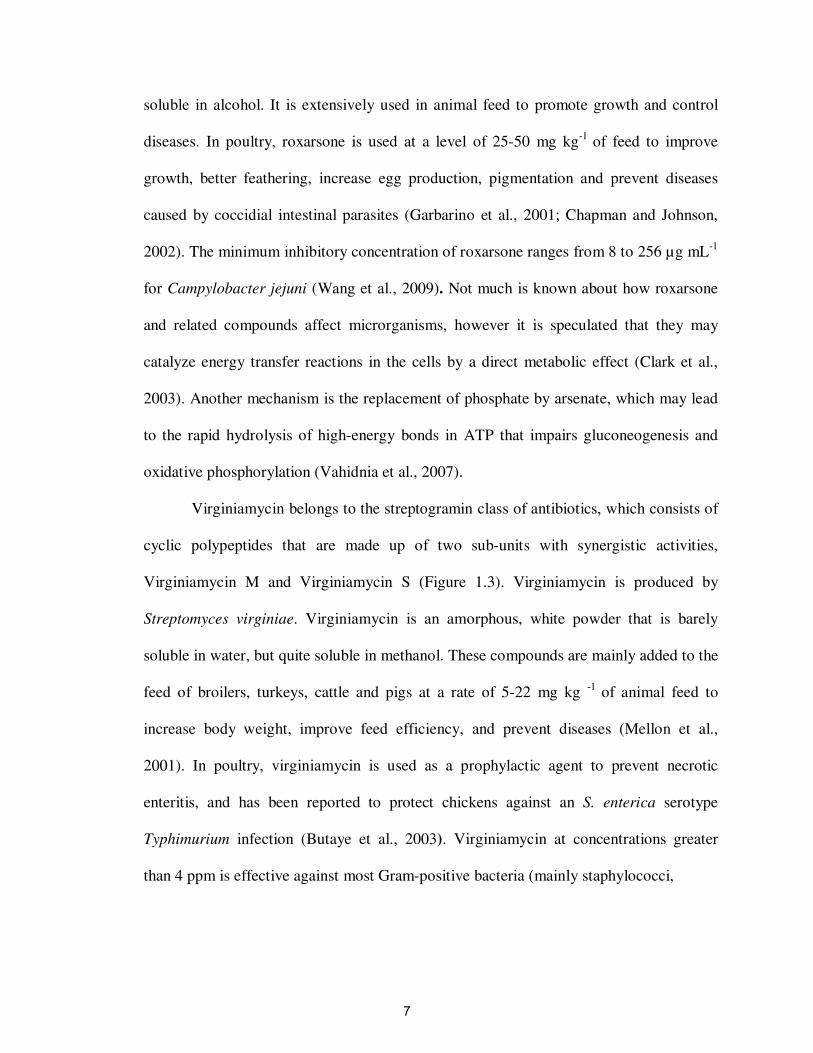
Virginiamycin belongs to the streptogramin class of antibiotics, which consists of
cyclic polypeptides that are made up of two sub-units with synergistic activities,
Virginiamycin M and Virginiamycin S (Figure 1.3). Virginiamycin is produced by
Streptomyces virginiae. Virginiamycin is an amorphous, white powder that is barely
soluble in water, but quite soluble in methanol. These compounds are mainly added to the
feed of broilers, turkeys, cattle and pigs at a rate of 5-22 mg kg -1
of animal feed to
increase body weight, improve feed efficiency, and prevent diseases (Mellon et al.,
2001). In poultry, virginiamycin is used as a prophylactic agent to prevent necrotic
enteritis, and has been reported to protect chickens against an S. enterica serotype
Typhimurium infection (Butaye et al., 2003). Virginiamycin at concentrations greater
than 4 ppm is effective against most Gram-positive bacteria (mainly staphylococci,
7
Figure 1.3. Chemical structures of virginiamycin S and virginiamycin M.
8
streptococci and enterococci) and some Gram-negative cocci. The primary mode of
action is binding of virginiamycin components to the bacterial 23S rRNA of the 50S-
ribosomal subunit, which inhibits protein synthesis and bacterial growth (Cocito et al.,
1997). Most Gram Negative bacteria are resistant to antibiotics because of their
impermeable cell-wall (Butaye et al., 2003). Virginiamycin is active against
Enterococcus faecium at 4 ppm but not against Enterococcus faeclis at > 32 ppm, which
is considered to be intrinsically resistant (Aarestrup et al., 1998; Eliopoulos, 2003). When
virginiamycin is added to feed at rate of 55 ppm, it reduces the number of C. perfringens
in the intestine of chicken (van den Bogaard et al., 1997).
Poultry and Manure Production in the US
In 2007, the most important poultry and manure producing states in the US were
Georgia, Arkansas, Alabama, Mississippi, North Carolina, Texas, Kentucky, and
Maryland (Table 1.2) (USDA, 2007). At the present time, poultry production is the
second largest agricultural commodity in KY. There are 850 poultry farms and 2800
poultry houses in 42 Kentucky counties, which produce about 305 ×106
birds each year
(USDA, 2007; Kentucky Poultry Federation, 2010).
Over 13 billion kg of manure are produced annually in the US, and 0.5 billion kg
of manure are produced each year in KY (Table 1.2) (USDA, 1997). This material
contains high concentrations of essential nutrients required for plant growth (e.g.
nitrogen, phosphorus, and potassium) (van-Faassen and Dijk H, 1987; Kumar et al.,
2005a). Therefore, animal manure is commonly used as a soil amendment to improve soil
fertility, maintain soil moisture, and control erosion. The main factors that determine the
amount of manure to apply to a field are crop N requirement, manure
9
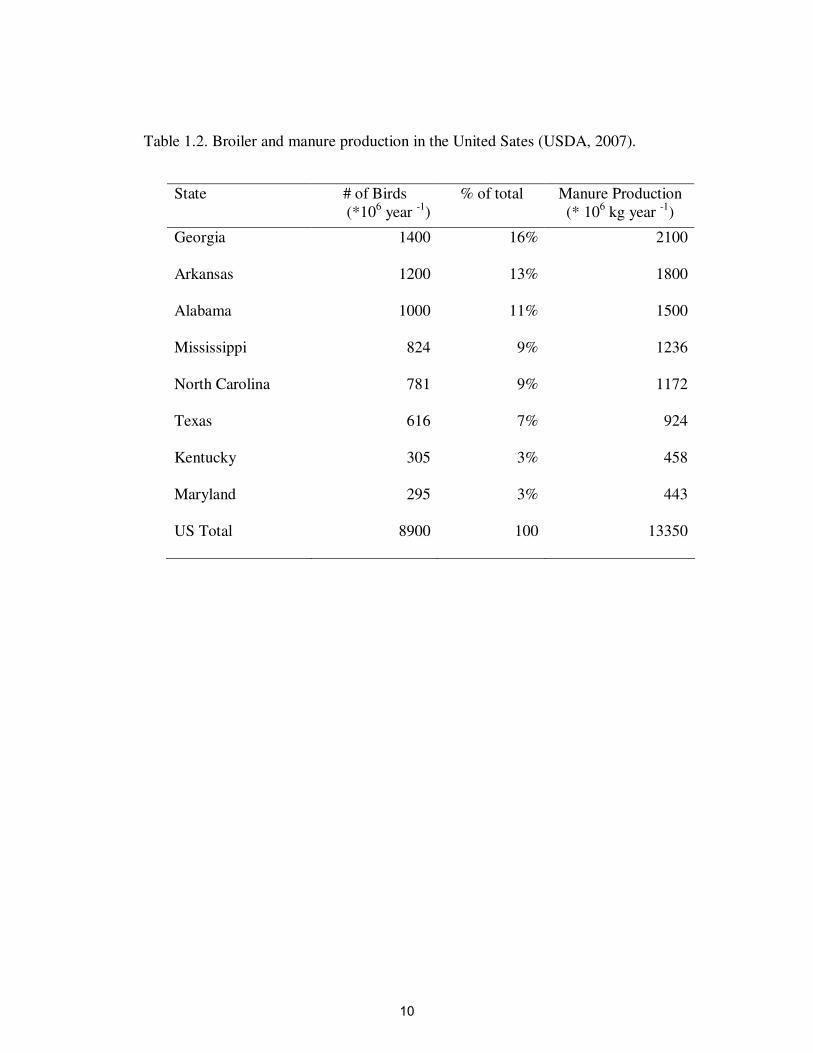
Table 1.2. Broiler and manure production in the United Sates (USDA, 2007).
State # of Birds
(*106 year
-1)
% of total Manure Production
(* 106 kg year
-1)
Georgia 1400 16% 2100
Arkansas 1200 13% 1800
Alabama 1000 11% 1500
Mississippi 824 9% 1236
North Carolina 781 9% 1172
Texas 616 7% 924
Kentucky 305 3% 458
Maryland 295 3% 443
US Total 8900 100 13350
10
history of the field, and the nutrient content of the manure (Beegle, 1997). Poultry litter is
typically applied to the field at a rate of 5000 kg ha-1
(Garbarino et al., 2003).
Levels of Antibiotics in Manure and Amounts Dispersed to the Environment
In addition to containing essential plant nutrients, manure from many commercial
poultry producers contains antibiotics that were included in feed to improve growth
and/or treat diseases in the flock. Most antibiotics fed to animals are excreted in the urine
and feces of the animal rather than being absorbed or metabolized by the animal. Thus,
confined areas where antibiotic-fed animals live and where manure has been dispersed
into the environment can contain elevated levels of antibiotics. For example, the manure
of swine fed chlortetracycline and tylosin contained 7.73 mg L-1
and 4.03 mg L-1
of these
antibiotics, respectively (Kumar et al., 2005b). The manure of swine fed sulfonamides
contained about 3.5 mg antibiotics kg-1
manure (Thiele-Bruhn, 2003). According to
Furtula et al. (2010), poultry litter contains bacitracin at a rate of 1.91 mg kg-1
. Roxarsone
added to poultry feed contains arsenic (As) at a range of 10-50 mg kg-1
in poultry litter
(Brown et al., 2005). According to Furtula et al. (2010), poultry litter contains
virginiamycin at a range of 0.22 to 0.33 mg kg1.
Since manure contains antibiotics, and since large amounts of manure are widely
dispersed to soils, considerable amounts of antibiotics are also dispersed to the
environment. For example, Kumar et al. (2005b) estimated that 387 g of chlortetracyline
and 202 g of tylosin are added per ha when soils are amended with 50,000 L manure ha-1
.
The amounts of other antibiotics added to soils can be calculated from the
concentration of antibiotics in manure and the amount of manure applied to soils.
According to Garbarino et al. (2003), poultry litter is applied at a rate of 5000 kg ha-1
to
11
agricultural land. Assuming that 5000 kg litter containing 10-50 mg roxarsone kg-1
is
broadcast-applied to soils, then the roxarsone concentration to the top 5 cm of soil would
be expected to be in a range of 0.08 to 0.4 mg kg-1
. Cumulatively, it has been estimated
that approximately 1×10⁶
kg of roxarsone and its degradation products are added to soils
each year (Wershaw et al., 1999; Brown, 2003). The various concentrations of three
different livestock antibiotics in litter and expected in soil are shown in the Table 1.3.
Fate of Antibiotics in the Environment
Once antibiotics are deposited to soils, they may undergo a variety of processes
that determine their fate and transport in the environment (Figure 1.4). One of the most
important processes in soils is sorption, in which antibiotics interact with soil surfaces by
a variety of processes (e.g. hydrogen bonding, van der Waals forces, hydrophobic
bonding, ion exchange, etc) (Thiele Bruhn et al., 2004). The extent of these processes
depends on the characteristics of (i) the soil solid phase (e.g. organic matter and types of
clay minerals) (Thiele-Bruhn, 2003), (ii) the solution phase (e.g. pH and ion composition)
(Boxall et al., 2003), and (iii) the antibiotic (water solubility and functional groups)
(Boxall et al., 2003). Sorption is an essential process because it controls the amount of
chemical that can be mobilized to surface water and groundwater, and the amount that
can be degraded by a variety of chemical and biological processes. The extent of sorption
is commonly described by the distribution coefficient Kd of a compound, which is
commonly determined in sorption isotherm experiments. Distribution coefficients for
many antibiotics range between 0.2 L kg-1
to 6,000 L kg-1
(Tolls, 2001). Antibiotics with
low distribution coefficients tend to be highly mobile and bioavailable compared to
antibiotics with high coefficients.
12
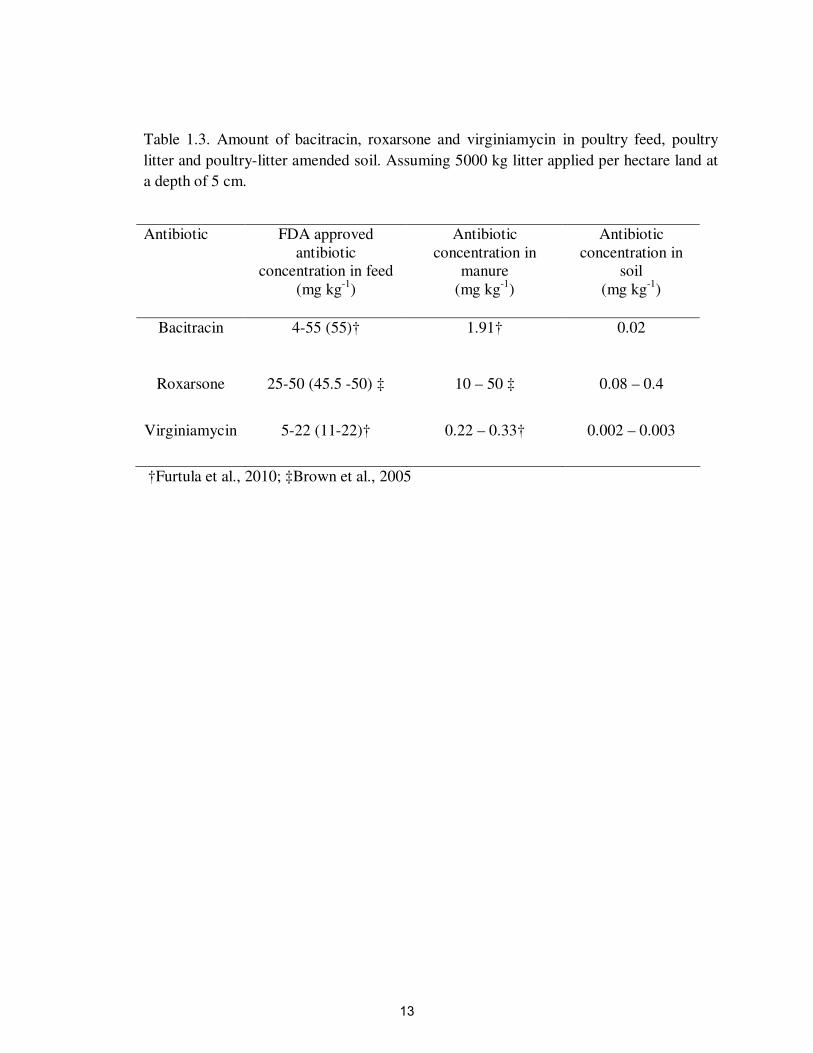
Table 1.3. Amount of bacitracin, roxarsone and virginiamycin in poultry feed, poultry
litter and poultry-litter amended soil. Assuming 5000 kg litter applied per hectare land at
a depth of 5 cm.
†Furtula et al., 2010; ‡Brown et al., 2005
Antibiotic FDA approved
antibiotic
concentration in feed
(mg kg-1
)
Antibiotic
concentration in
manure
(mg kg-1
)
Antibiotic
concentration in
soil
(mg kg-1
)
Bacitracin 4-55 (55)†
1.91† 0.02
Roxarsone 25-50 (45.5 -50) ‡
10 – 50 ‡ 0.08 – 0.4
Virginiamycin 5-22 (11-22)†
0.22 – 0.33† 0.002 – 0.003
13
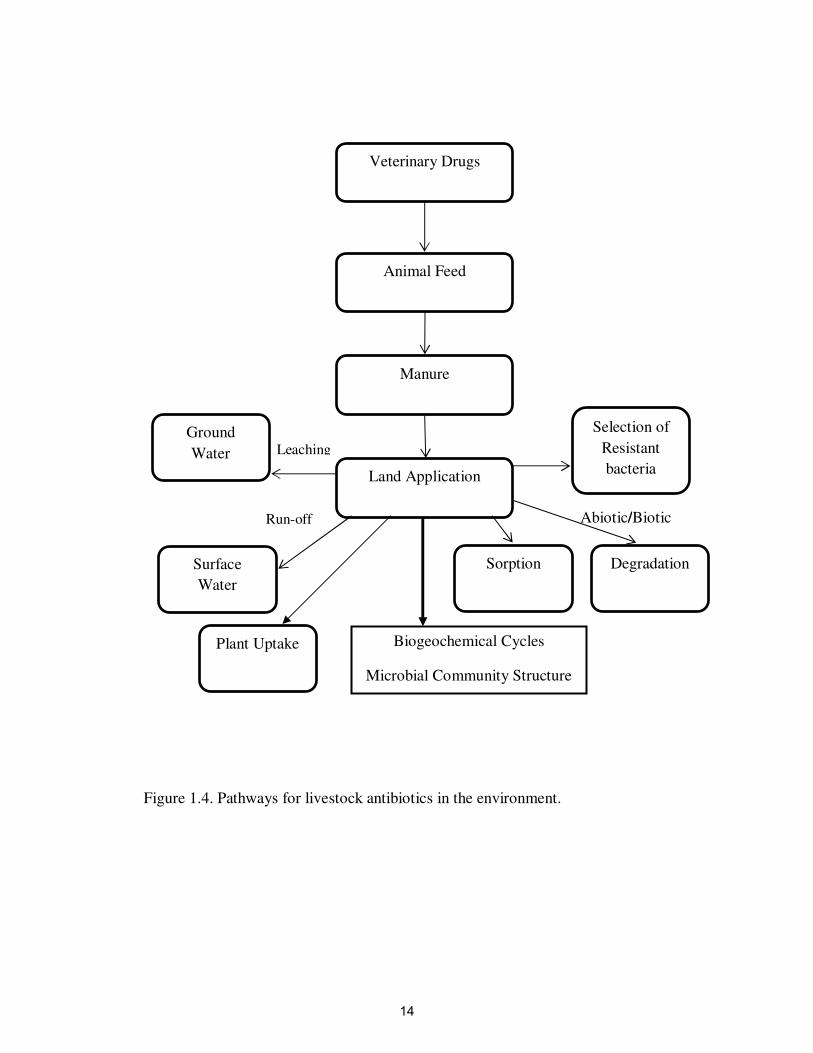
Figure 1.4. Pathways for livestock antibiotics in the environment.
Veterinary Drugs
Run-off
Leaching
Selection of
Resistant
bacteria
Animal Feed
Manure
Sorption Degradation
Plant Uptake
Land Application
Ground
Water
Abiotic/Biotic
Biogeochemical Cycles
Microbial Community Structure
Surface
Water
14
For example, the aqueous concentration of an antibiotic with a distribution coefficient of
100 L kg-1
, a total antibiotic concentration of 5 mg kg-1
soil, and a water content of 250 g
kg-1
would be only about 0.05 mg L-1
. At this concentration, antibiotics may not have an
adverse effect. However, even antibiotics with high distribution coefficients can be
transported to other environments in the form of aerosols and dusts and eventually return
to the bioavailable pool (Hamscher et al., 2003; Gibbs et al., 2006).
Bacitracin is highly water soluble and loses its antimicrobial activity at room
temperature (Sarmah et al., 2006). The Kd value for this group of antibiotics is not
available in the literature. Bacitracin, being a polypeptide and amphoteric compound
(isoelectric point 8.8), exists as a cation in acidic solution and as an anion in basic
solution (Johnson et al. 1945; Robinson, 1952; Pinck et al., 1961). Since the pH of soils
are usually lower than the isoelectric point, bacitracin exists mostly as a cation in most
soils (Pramer, 1958; Kang et al., 2001). As a result, bacitracin is expected to be sorbed to
cation exchange sites of clay minerals and organic matter in soils.
The extent of roxarsone sorption depends strongly on soil properties such as
organic matter content, amounts and types of clay minerals, and pH (Brown, 2003).
Roxarsone sorption to soil organic matter is relatively weak, so it can rapidly leach from
soil surface to lower depths (Brown, 2003). Once roxarsone reaches the Bt horizon, it is
strongly retained by sorption to Fe oxides and clays. It has been found that organic matter
blocks the sorption sites of mineral surfaces, which can decrease roxarsone sorption.
Furthermore, roxarsone sorption is pH dependent, with greater sorption occurring at
lower pH values (Brown 2003). According to Brown (2003), roxarsone sorption
15
coefficients range between 0.001 and 0.005 L g 1
, depending on the organic matter
content and types and amounts of clay in soil in the Ap layer.
The Kd value for virginiamycin is not available in literature. However, the
precursor ions of virginiamycin carry positive charges and therefore behave as a cations
in solution (Alwis and Heller, 2010). In addition, the low water solubility of
virginiamycin suggests that it is a hydrophobic compound. As a result, virginiamycin is
expected to be sorbed to negatively charged clay mineral surfaces and organic matter by
cation exchange and also to soil organic matter by hydrophobic bonding.
In addition to sorption, antibiotics may be degraded to simpler compounds by
abiotic processes (e.g. hydrolysis, photodegradation) or by biotic processes (e.g.
enzymatic degradation). Degradation of antibiotics is important because once broken
down they often pose less of an adverse affect on microorganisms (Gavalchin and Katz.,
1994). The rate of degradation of an antibiotic is mainly described by its half-life, which
is defined as the amount of time it takes to reduce the concentration of the compound by
one half of its original amount. For many antibiotics, half lives can range from less than a
day (e.g. penicillin) to more than a year (e.g. tetracycline) (Zuccato et al., 2001). For
antibiotics with long half lives, adverse affects on soil microbes and other organisms may
persist for long periods after soil amendments (Halling-Sørensen et al., 2005; Furtula et
al., 2010).
Abiotic hydrolysis refers to the disruption of chemical bonds in the presence of
water. The most important factor that determines hydrolysis rates is pH. For example, ß-
lactam hydrolysis is rapid under mildly acidic and basic conditions (Hou and Poole,
16
1969; Huang et al., 2001). Macrolide and sulfonamide hydrolysis is slow under
circumneutral pH conditions (Volmer and Hui, 1998).
Some types of antibiotics can be photodegraded when exposed to light
(Kümmerer, 2008). According to Bednar et al (2003), light reactions with roxarsone
result in arsenite cleavage, which increases with pH from 4 to 8. When arsenite is
exposed to light, it is rapidly oxidized to arsenate (Budinoff and Hollibaugh, 2008). Other
light sensitive antibiotics include quinolones and sulfonamides. Phototransformations are
expected to be greatest in light-exposed environments such as surface waters and soils.
Many antibiotics can be degraded to simpler compounds by microbial enzymes.
For example, Halling-Sørensen et al. (2003) found that oxytetracycline, sulfadiazine and
tylosin, but not streptomycin or ciprofloxacin, lost their antimicrobial activity under
aerobic conditions. They also found that olaquindox and tylosin, but not oxytetracycline,
lost their activity under anaerobic conditions. From these experiments it was concluded
that the degradation products were less inhibitory than the parent compounds.
Bacitracin is a simple polypeptide compound that lacks halogens and unbreakable
chemical bonds, so it is easily biodegraded by deamination or dealkylation reactions by
many types of soil bacteria and fungi (US-FDA, 1998). The half-life of bacitracin under
normal moisture, temperature and pH conditions is about 10 days in soil (US-FDA,
1998). The half-life of bacitracin in poultry litter is about 4 to 6 days (US-FDA, 1979).
A considerable amount of roxarsone in poultry litter and soils may be transformed
to other As species (Garbarino et al., 2003). The most likely transformation pathways are
oxidation and methylation/demethylation (Brown, 2003). Under anaerobic and high
temperature conditions, roxarsone transformation rates increase (Garbarino et al., 2001).
17
The rate also increased in the presence of nitrate and natural organic matter (Brown,
2003), which suggests that denitrifiers may play a role in the transformation process.
According to Wershaw et al. (1999), the aromatic portion undergoes microbial
biodegradation. Some bacteria can demethylate methanearsonic acid to arsenate and
carbon dioxide (Brown, 2003). There is not much information about the half-life of
roxarsone, but some studies suggested that arsenic concentration was reduced to half in
water treatment residual-amended poultry litter samples within 13 days (Makris et al.,
2008).
According to Weerasinghe and Towner (1997), the half-life of virginiamycin in
sandy silt and silty sand soils under aerobic conditions is 83 to 173 days. However,
degradation rates of virginiamycin and other antibiotics will likely vary depending on soil
type, climate, and chemical nature of the antibiotic compounds (Chander et al., 2005).
Antibiotics that are not sorbed or degraded can remain in the dissolved pool and
be taken up by plants. Kumar et al. (2005a) evaluated chlortetracycline and tylosin uptake
by cabbage, corn, and green onion from manure-amended soil. They found
chlortetracycline in the range 0.002 to 0.017 mg kg-1
in the plants, but tylosin was not
taken up by these crops, presumably due to its larger molecular size. The major concern
about plant uptake of antibiotics is health risk, including allergic reactions, chronic toxic
effects, development of antibiotic resistant bacteria, and improper functioning of the
digestive system. The acceptable intake value for most of the antibiotics is less than 50
µg kg-1
body weights per day (JECFA, 2006).
A large number of different types of antibiotics have been detected in
groundwater and surface water by leaching and runoff. For example, the U.S. Geological
18
Survey (USGS) detected 21 antibiotics in 139 streams across the U.S. (Sarmah et al.,
2006). Some studies have suggested that antibiotic transport could be reduced by planting
vegetative buffers like trees, shrubs, grasses, combination of trees and grasses along the
fields or within the fields, and the riparian zones helps to trap harmful agrichemicals. The
mechanisms by which vegetative buffer strips remove pollutants are as follows: (i)
decreasing the flow of surface water thereby, facilitating the deposition of sediments and
sediments bound pollutants, (ii) enhanced infiltration rate and greater solute-soil
interaction, (iii) plant uptake of agrichemicals or pollutants, (iv) microbial degradation of
pollutants, and (v) increased pollutant sorption and retention capacity (Krutz et al., 2005).
Effects of Antibiotic Dispersal in the Environment
Wide dispersal of antibiotics in the environment can have deleterious effects on
non-target organisms and environmental quality. For example, increased levels of
antibiotics in soils can increase the number of antibiotic resistant bacteria in the
environment, including many pathogens (Mazel and Davies, 1999). This is of concern
because human and animal diseases caused by antibiotic resistant bacteria are difficult to
treat with existing drugs. Bacteria can develop antibiotic resistance by various
mechanisms including (i) active efflux of the antibiotics out of the microbial cell, (ii)
target site alteration of the antibitotics, and (iii) enzymatic inactivation of the antibiotic
(Mazel and Davies, 1999).
An organism is considered resistant to bacitracin when its growth is not inhibited
at concentrations up to 256 µg mL-1
(Manson et al., 2004b). Bacitracin resistance has
mostly been observed in Gram-positive bacteria. In E.coli, resistance is conferred by the
chromosomal bacA gene, which codes for a kinase that phosphorylates undecaprenol,
19
thus raising the level of C55-isoprenyl pyrophosphate required for peptidoglycan synthesis
(Butaye et al., 2003). A second mode of bacitracin resistance occurs upon expression of
bcrABC genes, which encode the ATP-binding cassette (ABC) transporter involved in
antibiotic efflux out of the cell. A third bacitracin resistance mechanism is due to a
membrane-associated phospholipid phosphatase in B. subtilis (Manson et al., 2004a).
Several genes in the ars operon may confer resistance to arsenic (Carlin et al.,
1995; Cai et al., 1998). These genes are located in the chromosome or in the plasmid of
many Gram-positive and Gram-negative organisms (Branco et al., 2008). The operon
consists of three to five genes that code for different detoxification enzymes/processes.
The set of genes that confer arsenic resistance include ars-RBC, which codes for a
transcriptional regulator (ars R), a trans-membrane pump (ars B) and, As (V) reductase
(ars C). Some other genes of ars operons are arsT, arsO and ars H (Baker-Austin et al.,
2007). A newly identified arsenic resistance gene arsM in non-sulfur phototrophic
bacteria has been found that methylates arsenite to volatile trimethylarsine (Wang et al.,
2009). According to Yang et al. (2005), Sinorhizobium meliloti (a nitrogen fixing
bacterium) lacks ArsB but uses an aquaglyceroporin channel to efflux As (III) generated
internally by As (V) reduction. Arsenic resistance is also given by a small number of ‘F.
acidarmanus’ Fer1 genes from an arsenic tolerant acidophilic archeon found in the Iron
Mountain Mine, California (Baker-Austin et al., 2007).
Resistance to virginiamycin is commonly due to (i) target site alteration mediated
by erm genes that affect binding of the streptogramin B component (i.e. Virginiamycin S)
to the bacterial ribosome (Leclercq and Courvalin, 1991; Roberts et al., 1999), (ii)
inactivation of the streptogramin A component (Virginiamycin M) mediated by an
20
acetyltransferase encoded by the vat(D) (previously known as satA) gene (Rende-
Fournier et al., 1993) or vat(E) (Werner and White, 1999), and (iii) the active efflux of
the antibiotic via ATP-binding cassette proteins encoded by the vga(A) and vga(B) genes
( Allignet et al., 1992; Allignet et al., 1993; Allignet and Sohl, 1997).
Importantly, bacteria with antibiotic resistance can transfer this phenotype to
other bacteria by horizontal gene transfer processes, in which genetic material that codes
for resistance is transferred by conjugation, transformation or transduction (Davison,
1999). This may be more prevalent in environments where antibiotic concentrations are
below levels that kill bacteria, such as areas where soils are amended with manure
containing antibiotics (Kőmmerer, 2003). Onan and LaPara (2003), for example, found
that the number of antibiotic resistant bacteria was 5-10 times higher in soils amended
with manure than those without manure. Increased numbers of antibiotic resistant
Pseudomonas and Bacillus have been isolated from pig manure applied to the fields
(Jensen et al., 2001). According to Wegener et al. (1999), the use of avoparcin, which is
closely related to vancomycin, caused an increased number of vanomycin–resistant
Enterococcus faecium in hospitals. Exposure to antibiotic resistant bacteria greatly
increases the chances of infection by these bacteria. For example, many E. coli O157:H7
infections are associated with crops and water located near fields where cattle manure is
being used as fertilizer (Gansheroff and O’Brien, 2000). Ghosh and La Para (2007)
observed that antibiotics used for subtherapeutic purposes can lead to the propagation of
antibiotic resistance bacteria in soil if excessive animal manure is applied to land and
resistance among soil bacteria is mainly developed by lateral gene exchange mechanism.
21
In addition to affecting human and animal health, antibiotics in soil and water can
affect invertebrates, algae, plants, microbial populations, as well as key biochemical
processes that the microorganisms conduct in the environment. For example, Boxall et al.
(2003) found that macrocyclic lactones at very low concentrations (0.036 mg kg-1
)
reduced feeding, decreased growth rate, interfered with moulting, inhibited pupation
stage, prevented coming out of adults, and interrupted mating of dung invertebrates.
Researchers found 10% inhibition in reproductive parameters of collembola, springtails
and enchytraeidae by antibiotics (tylosin, oxytetracycline, tiamulin, olaquindox and
metronidazole) at concentrations between 61 and 149 mg kg-1
(Baguer et al., 2000;
Jensen et al., 2003). Kőmmerer (2003) found that antibiotics (amoxicillin, furazolidone,
flumequine, oxolinic acid, oxytetracycline hydrochloride, sulfadiazine and trimethoprim)
at concentrations between 5 – 100 µg L-1
inhibited daphnids and algae. Holten et al.
(1999) and Boxall et al. (2003) found that amoxicillin, benzyl penicillin, tetracycline and
spiramycin at less than 100 µg L-1
inhibited blue green algae.
Several studies have shown that antibiotics have an adverse affect on plant
growth. In a multispecies test system, antibiotics like the sulfonamide
sulfachloropyridazine exerted plant toxicity at concentrations of 100 mg kg-1
due to its
structural similarity with sulfonylurea herbicides ( Boleas et al., 2005). According to
Norman (1955), root growth of several crops was inhibited by oxytetracylcine (5 – 10 mg
L-1
) in solution but not in soil due to its strong adsorption onto soil components.
Batchelder (1982) observed that tetracycline increased radish yields, but reduced pinto
beans yield, which was related to differences in soil characteristics and plant sensitivities.
22
Westergaard et al. (2001) found that tylosin amended to agricultural soils at a rate
of 3000 ppm influenced the abundance of bacteria, fungi, and protozoa. By affecting
microbial populations, antibiotics in the environment can influence the sustainability and
capacity of an ecosystem to protect water quality and to produce agricultural products.
Bewick (1978) for example, reported that microbial respiration and organic nitrogen
mineralization were depressed in soils amended with tylosin at 37 ppm. Patten et al.
(1980) found that carbon mineralization was increased in soils amended with cattle
manure containing chlortetracycline or oxytetracycline at 0.02 to 0.04 ppm. Costanzo et
al. (2005) observed that denitrification was inhibited in aquatic environments containing
erythromycin, clarithromycin and amoxicillin at 1 mg L-1
. Thiele-Bruhn (2005) found
that Fe (III) reduction was inhibited in soil when chlortetracycline was 27 µg g-1
. In that
study, inhibition was strongly governed by sorption of the antibiotic to soil surfaces.
Hammesfahr et al. (2008) showed that sulfonamide inhibits dihydropteroate synthesis
involved in the folic acid pathway, thus affecting bacterial growth, composition and
enzyme activity. On the other hand, Thiele-Bruhn and Beck (2005) observed that
sulfonamide and oxytetracycline at concentrations of 1000 µg g-1
did not affect microbial
activity, as determined by basal respiration and dehydrogenase activity. Possible reasons
for discrepancies between studies are different shifts in the microbial community
structure (bacteria to fungi), lack of short-term toxicity effects on soil microorganisms,
sorption to clay minerals and organic matter, and the presence of resistant bacteria.
To our knowledge, the effects of antibiotics commonly used in the poultry
industry and applied to soils (i.e. bacitracin, roxarsone and virginiamycin) on microbial
23
community composition and activities such as nitrification and denitrification have not
been evaluated.
Nitrification
Nitrification is the process carried out mostly by nitrifying bacteria (Gram-
negative) Nitrosomonas and Nitrobacter (Maliszewska-Kordybach et al., 2007) (Figure
1.5). The autotrophic nitrifying bacteria oxidize ammonia to nitrite then to nitrate in two
steps (Maliszewska-Kordybach et al., 2007). The optimal pH for nitrification is between
7.3 to 8 and the optimal temperature ranges between 20°C to 30°C (Alleman and Preston,
1991). Nitrification is an important process because it converts ammonium to nitrite and
nitrate, which are the most bioavailable forms of N for plants and denitrifiers in soils.
Pramer (1958) showed that streptomycin inhibited nitrification in soil, but only at a very
high concentration of 10,000 ppm. One possible reason is that streptomycin was strongly
adsorbed by clay minerals and organic matter in the soil. However, for antibiotics that are
not as strongly sorbed, nitrification could be inhibited, which would be expected to
decrease denitrification and nitrate and nitrite leaching to groundwater and surface water,
and also decrease short-term N availability to plants (Hallberg and Keeney, 1993; Britto
and Kronzucker, 2002). The opposite would be true if antibiotics promoted nitrification
in soils.
Denitrification
Denitrification involves the conversion of nitrite and nitrate to dinitrogen gas (N2)
through several intermediate gaseous products (Figure 1.5). This is an anaerobic process
carried out by denitrifiers (facultative anaerobes) such as Pseudomonas, Bacillus,
Thiobacillus, Propionibacterium and others (Firestone, 1982). They use NO3- as an
24
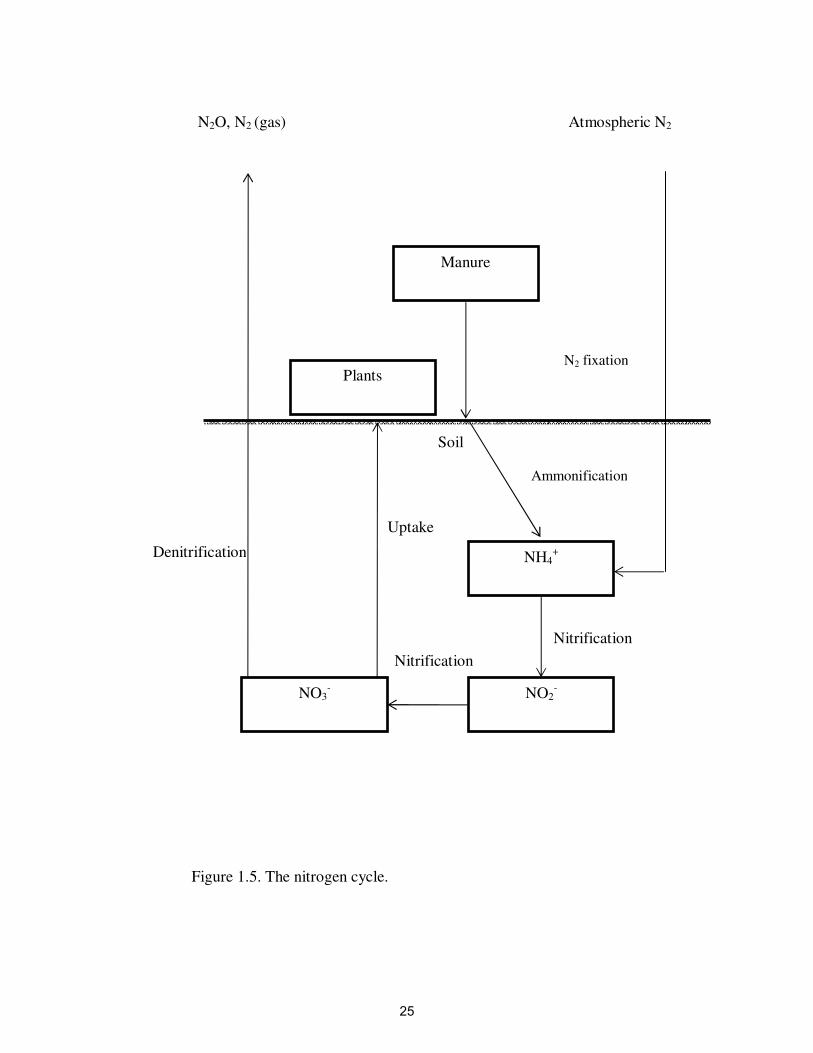
Figure 1.5. The nitrogen cycle.
Atmospheric N2
Manure
Soil
NH4+
NO2- NO3
-
N2O, N2 (gas)
Plants
Nitrification
Nitrification
Denitrification
Uptake
Ammonification
N2 fixation
25
electron acceptor instead of oxygen for respiration (Wrage et al., 2001). The optimum pH
for denitrification is 7.0 to 8.0 (Knowles, 1982; Hiscock et al., 1991; Thomas et al., 1994;
Almeida et al., 1995). The optimum temperature ranges between 20°C and 30°C
(Jianping
et al., 2003). Denitrification is an important process because it removes excess nitrite and
nitrate from fertilizers, sewage system and municipal waste water. In addition, one of the
intermediates in the denitrification process is N2O, which is considered to be a
greenhouse gas. Costanzo et al. (2005) found that denitrification in aquatic environments
was inhibited by erythromycin, clarithromycin and amoxicillin at 1 mg L-1
. Under these
conditions, NO3-
would tend to build up, thereby increasing losses by leaching and
affecting groundwater and surface water quality (Hallberg and Keeney, 1993). On the
other hand, if antibiotics promote denitrification, then NO3- removal would increase,
possibly affecting soil fertility by the loss of nutrients from the soil (Vellidis et al., 2003;
Bierman and Rosen, 2005).
26
Chapter 2
Effects of Livestock Antibiotics on Nitrification, Denitrification, and Microbial
Community Composition in Soils Along a Topographic Gradient
Introduction
Millions pounds of antibiotics are used in animal husbandry for therapeutic and
sub-therapeutic uses (Kőmmerer, 2003). At sub-therapeutic levels, antibiotics are
believed to increase animal growth yields by controlling microbial populations in the gut
that produce toxins or that compete with animals for essential nutrients and growth
factors (Butaye et al., 2003). The most commonly used antibiotics in poultry feed are
bacitracin, roxarsone, and virginiamycin (Chapman and Johnson, 2002; Oldfield, 2003).
As much as 30%-90% of antibiotics fed to animals are excreted in animal feces
and urine (Costanzo et al., 2005). When manure is applied to land, antibiotics can
undergo numerous fate processes that affect water quality (Kőmmerer, 2003), promote
the development of antibiotic-resistant bacteria (Onan and LaPara, 2003), alter soil
microbial communities (Colinas et al., 1994; Westergaard et al., 2001), and influence
nutrient cycles (Patten et al., 1980; Costanzo et al., 2005). According to Kőmmerer
(2003), for example, several antibiotics (ciprofloxacin, sulphonamides, roxythromycin,
erythromycin) were detected in municipal sewage, sewage treatment plant effluent, and
in surface water and groundwater. Onan and LaPara (2003) found that the number of
antibiotic resistant bacteria was 5-10 times higher in soils amended with manure than
those without manure. Westergaard et al. (2001) found that tylosin amended to
agricultural soils at a rate of 3000 ppm influenced the abundance of bacteria, fungi, and
protozoa. Colinas et al. (1994) found that the antibiotics oxytetracycline and penicillin at
27
concentrations of 10 mg kg-1
forest soil decreased the total and active microbial cell
counts by approximately 80%.
Most nutrient cycles are also microbial mediated processes and thus have a
chance to be affected by antibiotics. Costanzo et al. (2005) observed that denitrification
was inhibited in aquatic environments containing erythromycin, clarithromycin and
amoxicillin at 1 mg L-1
. Patten et al. (1980) found that carbon mineralization was
increased in soils amended with cattle manure containing chlortetracycline or
oxytetracycline at 0.02 to 0.04 ppm. Other studies have shown that sulfonamide and
oxytetracycline at a concentration of 1000 µg g-1
did not affect microbial activity, which
was measured as basal respiration and dehydrogenase activity. Possible reasons for this
could be different shifts in the microbial community structure, lack of biotoxic effects on
soil microorganisms, sorption of antibiotics to soil particles, and resistance to antibiotics
by native soil bacteria (Thiele-Bruhn and Beck, 2005).
The effects of antibiotics in the environment depend largely on their interactions
with soil constituents, such as clay mineralogy and organic matter content, and
environmental factors such as soil pH, redox conditions, and ionic strength. Since many
of these factors can vary along a topographic gradient, it is anticipated that livestock
antibiotics will affect biogeochemical cycles (e.g. N-cycles) and the soil microbial profile
to different degrees along the topographic gradient. The objectives of this project were to
(i) determine the levels at which three livestock antibiotics have an adverse effect on
nitrification and denitrification potential in soils along a topographic gradient, and (ii)
determine the effect of three antibiotics on the soil microbial community structure and
28
(iii) determine the importance of sorption in protecting soil microorganisms from high
antibiotic concentrations.
Materials and Methods
Study Area and Soil Collection
The sampling area was located at the University of Kentucky Spindletop Farm in
Fayette County, Kentucky (Figure 2.1). Samples were collected in triplicate at three
topographic positions that represented the shoulder, backslope and toeslope. Each of the
nine sites were spaced 10 meters apart, which gave a square grid pattern at the location.
Soil samples from the nine sites were collected from the surface 0-5 cm with a hand
trowel in March, 2009. Samples were placed in sealed labeled plastic bags and
transported to the laboratory in an ice chest and stored at 4°C until used in experiments.
The soil series at the location was well-drained McAfee silty clay loam (Fine,
mixed, active, mesic, Mollic Hapludalfs) (Web-soil survey, 2010). For the last two
decades, the dominant vegetation at the location was tall fescue. The elevations at the
toeslope, backslope and shoulder positions were 270, 271 and 272 meters above sea level
respectively (GPS, Nextar). The area was chosen because the soils were expected to
contain gradients in soil moisture, pH, and other characteristics that influence microbial
growth and activity.
Effects of Antibiotics on Nitrification
The effect of antibiotics on nitrification at the nine soil sites (three topographic
zones and three replications per zone) was determined by monitoring increases in nitrate
and nitrite levels in aerobic soils amended with (NH4)2SO4 and increasing levels of
antibiotics in laboratory microcosms. To remove background levels of nitrate and nitrite
29
from the soils, soils from each site (50 g) were shaken with deionized and distilled water
(100 mL) for 30 s in a 250 mL centrifuge bottle and centrifuged at 2057 × g for 10 min.
The supernatant was discarded and the soils were air-dried in a plastic weigh boat at
room temperature before being used in nitrification experiments. The dried soil was
passed through a 4 mm mesh, and 1 g sieved soil was added to a 20 mL scintillation vial,
and mixed with antibiotic solutions (5 mL) at seven concentrations (0, 0.3, 1, 3, 10, 30,
100 mg L-1
). Antibiotic concentrations on a dry soil mass basis were 0, 1.5, 5, 15, 50,
150, and 500 mg kg-1
. The vials were covered with Breathe-Rite strips (to inhibit
evaporation and allow oxygen diffusion), and incubated for 1 d at 24°C. After 1 d, 5 mL
of 25 mg (NH4)2SO4-N L-1
was added to each vial and incubated on an orbital shaker
(C25KC, New Brunswick Scientific, NJ) at 200 rpm for 5 d at 24°C. After 5 d, vials were
centrifuged at 3214 × g for 10 min. The supernatant was filtered with a 0.45 µm
membrane syringe filter and analyzed for NO3- and NO2
- by the Greiss colorimetric
method adapted to the microplate reader (Crutchfield and Burton, 1998). The experiment
was repeated for each of the antibiotics bacitracin (SIGMA, St.Louis, MO), roxarsone
(TCI America, Portland, OR) and virginiamycin (Bioworld, Dublin, OH).
The effect of antibiotics on nitrification at each concentration and soil site was
determined using the following equation:
Antibiotic Inhibition = (NO3-+NO2
- in antibiotic-treated soil) / (NO3
-+NO2
- in non-treated
soil)
Using this equation, values less than, equal to, or greater than one indicated that
antibiotic inhibited, had no affect, or promoted nitrification, respectively.
30
31
Effects of Antibiotics on Denitrification
The effect of antibiotics on denitrification at the nine soil sites was determined by
monitoring increases in N2O gas in anaerobic soils amended with KNO3 and increasing
levels of antibiotics using the acetylene blockage technique in laboratory microcosms
(White and Reddy, 1999). Soil (3 g) was added to 30 mL serum bottles, and bottles were
sealed with serum stoppers and purged with N2 gas to remove O2. Deoxygenated
antibiotic solutions (3 mL) at seven concentrations (0, 1.5, 5, 15, 50, 150, and 500 mg L-
1) were mixed with soils in the bottles and incubated for 5 d at 24°C. Antibiotic
concentrations on a dry soil mass basis were 0, 1.5, 5, 15, 50, 150, and 500 mg kg-1
. After
5 d, 1 mL of a 25 mM KNO3 (deoxygenated) solution and 3 mL acetylene gas (prepared
with CaC2 and water) were mixed with the soils. The bottles were incubated on an orbital
shaker at 140 rpm for 1 d at 24°C. After 1 d, gas samples from the bottles were analyzed
for N2O gas on a Shimadzu 14 A gas chromatograph (Kyoto, Japan) equipped with an
63Ni electron capture detector (340°C), Porapak Q column (1.82 m and 3.175 mm)
(35°C), and injector (45°C) with nitrogen carrier gas. Calibrations were made using a
Scotty Specialty 448 N2O gas standard (Plumsteadville, PA). The experiment was
repeated for each of the antibiotics (bacitracin, roxarsone and virginiamycin).
The effect of antibiotics on denitrification at each concentration and soil site was
determined using the following equation:
Antibiotic Inhibition = (N2O in antibiotic-treated soil) / (N2O in non-treated soil)
Using this equation, values less than, equal to, or greater than one indicated that
antibiotic inhibited, had no affect, or promoted denitrification, respectively.
32
Effects of Antibiotics on Microbial Community Composition
The effect of antibiotics on microbial community composition at the nine soil
sites was determined by analyzing changes in ester-linked fatty acid methyl esters (EL-
FAMEs) in soils exposed to increasing levels of antibiotics in lab microcosms. Soil (25 g)
was passed through a 4 mm mesh and mixed with antibiotic solution (2 mL) at various
antibiotic concentrations (0, 10, and 100 mg antibiotic kg-1
soil) in a 50 mL beaker. The
beakers were covered with parafilm to reduce evaporation, and were incubated in the
dark for up to 4 weeks. After 1 and 4 weeks, 5 g of sample was removed from the beakers
and stored at –80°C in plastic bags until EL-FAME analysis. The experiment was
repeated for each of the antibiotics (bacitracin, roxarsone and virginiamycin).
Ester-linked fatty acid methyl esters were extracted using the alkaline
methanolysis ester-linked extraction method (Sasser, 1990; Schutter and Dick, 2000).
Soil (3 g) was vortexed with 15 mL of freshly prepared 0.2 M KOH in methanol for 20 s
in a 35 mL glass centrifuge tube. The tubes were placed in a water bath for one h set at
37°C, and vortexed every 10 minutes for 10 seconds during this period. After 1 hour, 2.5
mL of 1 M acetic acid was added to each tube to neutralize the pH. Ten mL hexane was
mixed with tube contents by vortexing. The tubes were centrifuged for 20 minutes at 329
× g. Five mL of the top organic phase containing EL-FAMEs was transferred to a 16 mL
tube and gently evaporated to almost dryness with N2 gas. The EL-FAMEs were
dissolved in 0.2 mL of 1:1 hexane:methyl-tert butyl ether and transferred to an auto-
sampler gas chromatography vial with teflon lined cap. The EL-FAMEs were analyzed
using a Shimadzu 14 A gas chromatograph (Kyoto, Japan) fitted with a flame ionization
33
detector (260°C), splitless injector (250°C) and Rtx®-1 fused silica column (100%
dimethyl polysiloxane, 30 m length by 0.32 m id and 0.25µm thickness). Helium (He)
was used as the carrier gas. The oven temperature program was 80°C held for 0.5 min,
ramped up to 250°C at 3°C min-1
, and then held at 250°C for 10 min. The identity and
concentrations of individual EL-FAMES was determined using FAME standards
obtained from Supelco (Belleforte, PA).
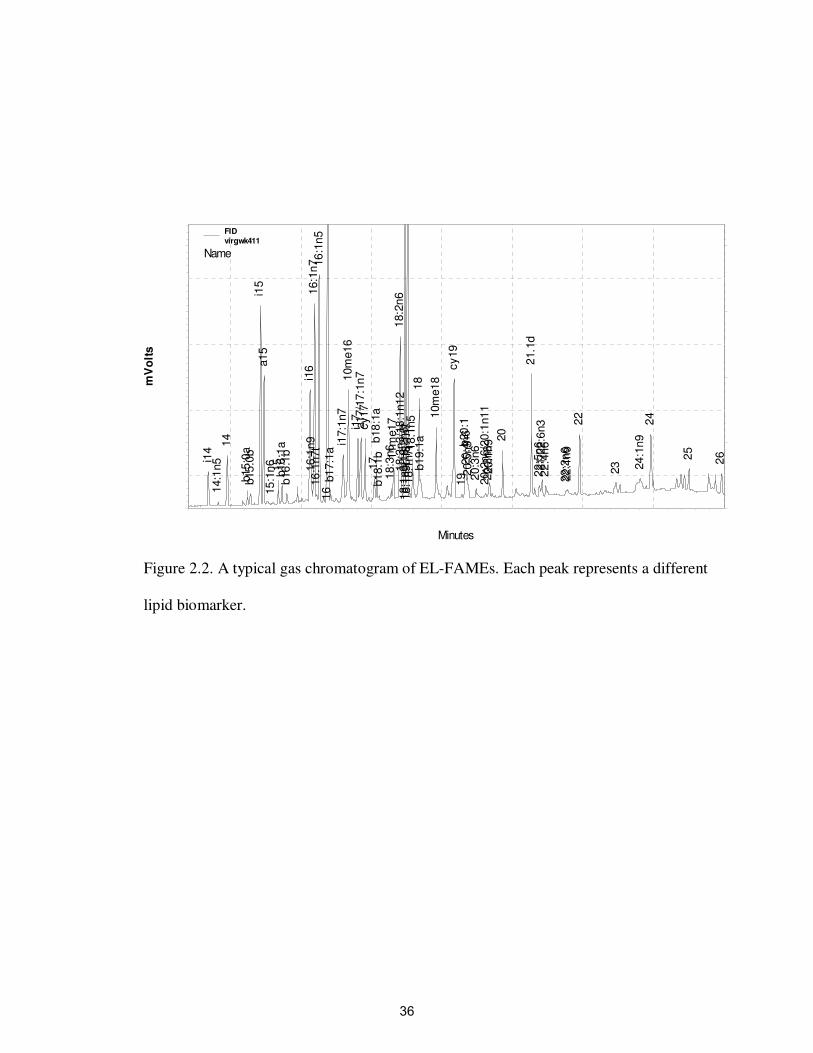
EL-FAME Nomenclature
Certain types of EL-FAMEs are associated with different microbial groups, thus
making EL-FAME profile analysis a useful method for evaluating changes in microbial
community structure in environmental samples. The standard fatty acid nomenclature
was used in this study. For example, 18:1ω5 describes a fatty acid with 18 carbon chain
length with 1 double bond located on the fifth carbon from the methyl end of the chain. In
this paper, all double bonds are in the “cis” conformation, unless indicated otherwise
indicated by a “t” suffix that denotes a “trans” conformation. Branching positions are
represented by prefixes “a” (anteiso), “b” (branched), “i” (iso), “Me” (methyl group),
“cy” (cyclopropane) and “OH” (hydroxy group) (Schutter and Dick, 2000; D’Angelo et
al., 2005).
Different EL-FAMEs represented various microbial groups as follows: (i)
terminally branched FAMEs represent Gram-positive bacteria (Parkes and Taylor, 1983;
O’Leary and Wilkinson, 1988; Kaneda, 1991), (ii) monounsaturated FAMEs represent
aerobic eukaryotes and Gram-negative bacteria (Ratledge and Wilkinson, 1988; Vestal
and White, 1989; Findlay et al., 1990), (iii) mid-chain branched, saturated and branched
and monounsaturated represent sulfate-reducing and other anaerobic bacteria, as well as
34
actinomycetes (Boon et al., 1977; Boe and Gjerda, 1980; Guckert et al., 1985; Federle,
1986), (iv) polyunsaturated FAMEs and FAMEs with larger than 20 C chain long are
indicators of fungi and some micro-eukaryotes (Federle 1986; Vestal and White, 1989;
Findlay et al., 1990). A typical gas chromatogram of EL-FAMEs obtained in this study is
shown in Figure 2.2.
Effect of Sorption on Antibiotic Bioavailability and Microbial Growth
The role of sorption in protecting microbes from antibiotic effects was determined
by comparing the growth of soil microorganisms in cultures exposed to (i) antibiotic
solutions before treatment with soil (BT) and (ii) antibiotic solutions after treatment with
soil (AT).
Microbes for the bioassay test were extracted from a bulk soil by combining soil
(1 g) from each of the nine sites (total 9 g) with 90 mL LB broth nutrient solution (Fisher
Scientific, Fairlawn, NJ) in a 250 mL centrifuge bottle. The bottle was shaken on a
horizontal shaker for 2 h and centrifuged at 100 × g for 15 min. The supernatant
containing the microorganisms was passed through 20 micron pore filter paper (Fisher
brand, PT) to remove silt particles, and was stored in the refrigerator until used in
bioassays.
As indicated before, two types of antibiotic solutions were used to evaluate the
effects of sorption on antibiotic bioavailability to the extracted microorganisms. The
before treatment (BT) antibiotic solutions consisted of antibiotics prepared at 0, 1.5, 5,
15, 50, 150, and 500 mg L-1
. The after treatment (AT) solutions were the same as the BT
solutions, except that antibiotics were first equilibrated with soil to allow sorption to take
place before exposing organisms to the antibiotics. To prepare
35
Minutes
25 30 35 40 45 50 55 60
mV
olt
s
0
10
20
30
mV
olt
s
0
10
20
30
i1
4 1
4:1
n5
14
b15:0
a b15:0
b
i15
a15
15:1
n6
15
b16:1
ab16:1
b
i16
16:1
n9
16:1
n7
16:1
n7t
16:1
n5
16
b17:1
a
i17:1
n7
10m
e16
i1
7a17/1
7:1
n7
cy17
17
b18:1
ab18:1
b
18:3
n6
11m
e17
18:2
n6
18:3
n3/1
8:1
n12
18:1
n9/1
8:2
n6t
18:1
n9t/
18:1
n7
18:1
n7t 18:1
n5
18
b19:1
a
10m
e18
cy19
19
b20:1
20:4
n6
20:5
n3
20:3
n6
20:2
n6/2
0:1
n11
20:3
n3
20:1
n9
20
21.1
d 2
2:5
n6
21/2
2:6
n3
22:4
n6
22:2
n6
22:1
n9
22
2
3
2
4:1
n9
24
25
26
FID
virgwk411
Name
Figure 2.2. A typical gas chromatogram of EL-FAMEs. Each peak represents a different
lipid biomarker.
36
the AT antibiotic solutions, oven dried (37°C) and sieved (2 mm) soil (0.5 g) was added
to each of 21, 2-mL microtubes. The tubes with soil were amended with antibiotic
solutions (1.5 mL) prepared at seven levels (0, 1.5, 5, 15, 50, 150, and 500 mg L-1
) and
equilibrated on horizontal shaker at low speed for 4 h. Each antibiotic type and level was
evaluated in triplicate. The 4 h equilibration time was selected to allow sorption to take
place, but not allow significant amounts of antibiotic degradation to occur. After this
period, microtubes were centrifuged at 9300 × g for 5 min. A subsample of the
supernatant (0.75 mL) containing the non-sorbed (bioavailable) antibiotics was
transferred to an empty microtube for use in the bioassay tests. This process was repeated
for each of the three antibiotics (bacitracin, roxarsone, and virginiamycin).
The microbial growth bioassay was conducted using the BT and AT antibiotic
solutions as follows. Antibiotic solution (0.75 mL) in 2 mL microtubes were amended
with 0.25 mL of LB broth and 0.25 mL of bacterial stock solution. The final antibiotic
concentrations in the BT microtubes were 0, 0.9, 3.0, 9, 30, 90, 300 mg L-1
, but
concentrations were probably lower in the AT microtubes due to sorption by the soil. The
mixture was incubated overnight on an orbital shaker at 250 rpm for at 28°C. After 1 d,
the tubes were vortexed, and 200 µL of solution were pipetted into the wells of a
microplate. The cell density in the wells was measured at 600 nm using a microplate
reader (BioTek, Horshman, PA) (Park et al., 2005). The cell density was checked for
three consecutive days.
It was hypothesized that antibiotics would inhibit microbial cell growth relative to
the zero level control, and that inhibition would be greater in the BT solutions than the
AT solutions. An index to show inhibition by the antibiotics was calculated as follows:
37
Growth Inhibition = cell growth with antibiotic/cell growth without antibiotic, where
values less than one indicate growth inhibition by the BT or AT antibiotic solutions.
The effect of sorption on the reduction in antibiotic bioavailability was calculated
by the equation:
Reduction in antibiotic bioavailability = cell growth in AT solution/cell growth in BT
solution, where values greater than one indicate that antibiotic bioavailability was
reduced by sorption.
Soil Property Characterization
Soil pH was determined in a soil-water paste prepared by adding 10 mL water to
10 cm3 soil (oven-dried at 38°C and ground to pass a 2 mm screen). The paste was stirred
and allowed to stand for 15 minutes. Soil pH was determined using a calibrated glass
electrode and meter.
The amount of bioavailable P, K, Ca, Mg, Zn in soils was estimated using the
Mehlich III extraction test (Mehlich, 1984). Briefly, soil (2 cm3) was mixed with 20 mL
Mehlich III extract (0.2 N acetic acid, 0.25 N NH4NO3, 0.015 N NH4F, 0.013 N HNO3,
and 0.001 N EDTA), shaken for 5 minutes, and passed through a Whatman #2 filter
paper. The elements in the filtrate were measured by Inductively Coupled Plasma
Spectroscopy (ICP) Varion Vista Pro (Palo Alto, California).
Soil organic carbon was determined by an Elemental Vario Max CNS analyzer
(Mt. Laurel, New Jersey). Organic matter was calculated from the amount of organic
carbon (%) in the sample using the equation % organic carbon = % organic matter/1.72.
The cation exchange capacity (CEC) was determined by equilibrating oven-dried
(38°C) sieved soil (10 g) overnight with 25 mL of 1 N ammonium acetate solution (pH =
38
7). The mixture was vacuum-filtered through Whatman #42 filter paper and washed with
additional ammonium acetate solution. The filtrate was analyzed for cations Ca, Mg, K,
and Na by ICP which provides the quantification of bases in soil. The residual soil was
leached with 200 mL of 10% NaCl at pH 3. The leachate was brought to volume 250 mL
by adding 10% NaCl. The ammonium was converted to ammonia by adding 1 mL of
concentrated NaOH and was measured by an electrode. The CEC was calculated from the
sum of cations in the soil and expressed in units of meq/100 g soil (equals to cmol kg-1
).
Percent base saturation was determined as total bases/CEC × 100.
The percentage of sand, silt, clay in the soils was determined by treating oven
dried sieved (38°C, 2 mm screen) soil (4 g) with 10 mL water and 10 mL Na-
hexametaphosphate in a 50 mL centrifuge tube. The tube was shaken for 2 h and an
additional 20 mL water was added to the tube. The sand and silt particles in the mixture
were allowed to settle for 1 h and 50 min, after which time 5 mL of supernatant
containing clay particles was removed, dried, and weighed to determine clay content. The
remaining mixture in the tube was passed through # 270 sieve and the particles on the
sieve were oven-dried to determine the sand content. The silt content was determined by
the difference between the total clay and sand content in the sample.
Statistical Analysis
The effects of antibiotic levels on nitrification, denitrification, microbial
community composition, and microbial growth were determined by ANOVA and
Tukey’s Honestly Significant Difference test (HSD), at a significance level of p = 0.05,
after testing for normal distribution of the data. All the statistical analyzes were
39
performed using STAGRAPHICS Plus Version 5.0 software (Manugistics, Rockville,
MD).
Results
Effects of Antibiotics on Nitrification and Denitrification
Bacitracin did not have a significant impact on nitrification at any topographic
positions or antibiotic concentrations up to 500 mg kg-1
(Figure 2.3A and Table 2.1).
Roxarsone significantly inhibited nitrification at >150 mg kg-1
at all topographic positions
compared to the zero level treatment (Figure 2.3B and Table 2.2). Virginiamycin
significantly inhibited nitrification at >15 mg kg-1
in the shoulder and backslope, and at
>150 mg kg-1
in the toeslope compared to the zero level treatment (Figure 2.3C and Table
2.3). Bacitracin inhibited denitrification at 500 mg kg-1
however roxarsone and
virginiamycin did not significantly affect denitrification at any concentration tested
(Figure 2.4 and Tables 2.4-2.6).
Effects of Antibiotics on Microbial Community Composition
Bacitracin exposure of 1 and 100 mg kg-1
for one and four weeks did not
significantly affect the abundance of any EL-FAME in the soil (Table 2.7). One week
exposure of soils to roxarsone at 100 mg kg-1
caused a significant increase in two
monounsaturated EL-FAMEs (16:1ω7 and 18:1ω7), and a significant decrease in 16: 1ω9
(Table 2.8). There was also a significant increase in lipid 18:1ω7 in week four but not in
any other lipids.
One and four weeks exposure of soils to virginiamycin at 100 mg kg-1
caused a
significant increase in two monounsaturated EL-FAMEs (16:1ω7 and 18:1ω7), a
40
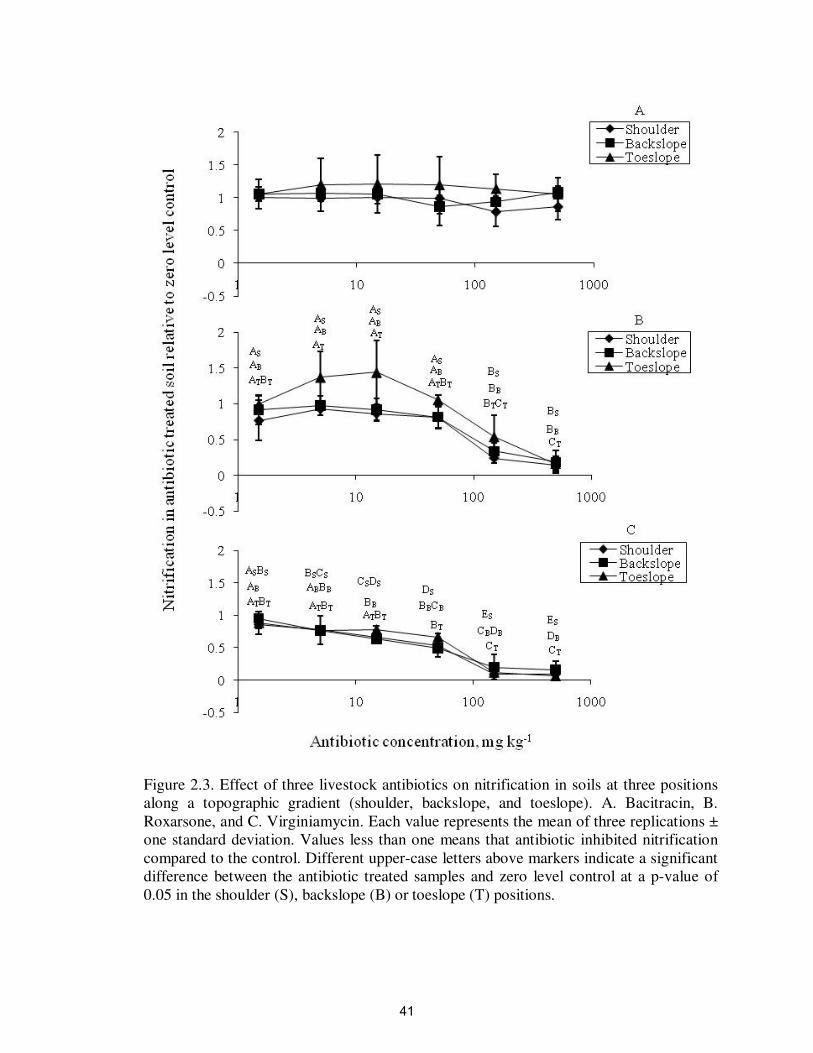
Figure 2.3. Effect of three livestock antibiotics on nitrification in soils at three positions
along a topographic gradient (shoulder, backslope, and toeslope). A. Bacitracin, B.
Roxarsone, and C. Virginiamycin. Each value represents the mean of three replications ±
one standard deviation. Values less than one means that antibiotic inhibited nitrification
compared to the control. Different upper-case letters above markers indicate a significant
difference between the antibiotic treated samples and zero level control at a p-value of
0.05 in the shoulder (S), backslope (B) or toeslope (T) positions.
41
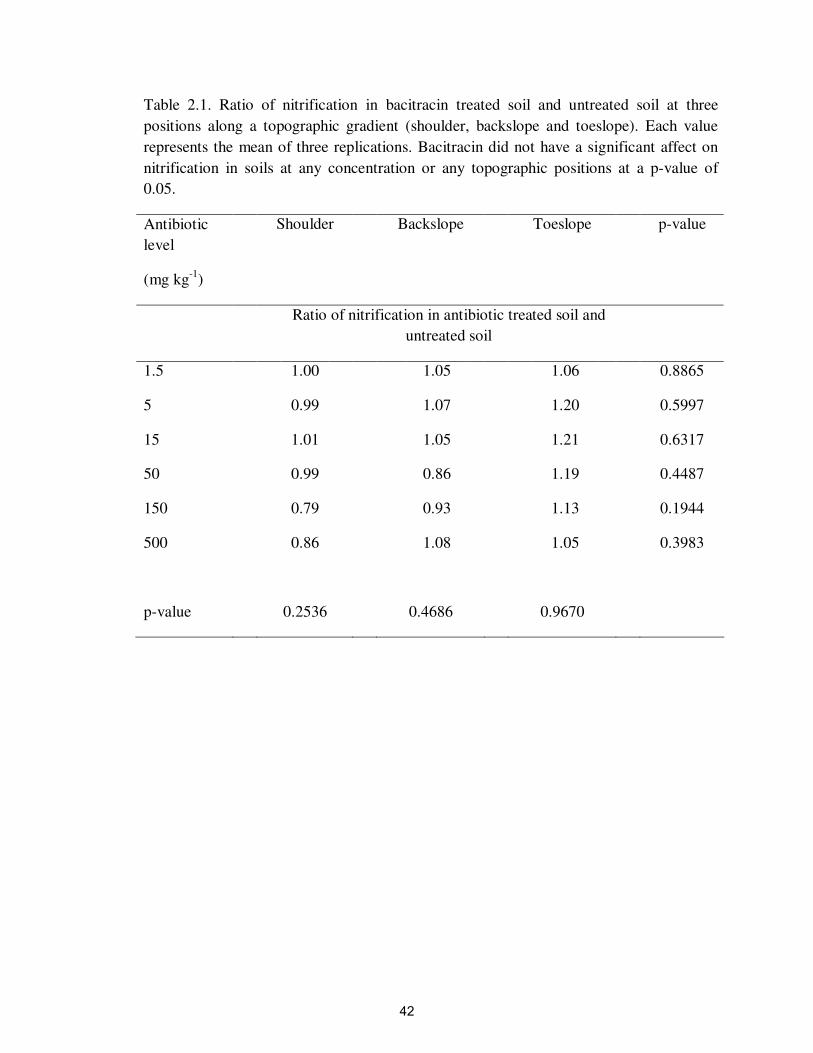
Table 2.1. Ratio of nitrification in bacitracin treated soil and untreated soil at three
positions along a topographic gradient (shoulder, backslope and toeslope). Each value
represents the mean of three replications. Bacitracin did not have a significant affect on
nitrification in soils at any concentration or any topographic positions at a p-value of
0.05.
Antibiotic
level
(mg kg-1
)
Shoulder Backslope Toeslope p-value
Ratio of nitrification in antibiotic treated soil and
untreated soil
1.5 1.00 1.05 1.06 0.8865
5 0.99 1.07 1.20 0.5997
15 1.01 1.05 1.21 0.6317
50 0.99 0.86 1.19 0.4487
150 0.79 0.93 1.13 0.1944
500 0.86 1.08 1.05 0.3983
p-value 0.2536 0.4686 0.9670
42
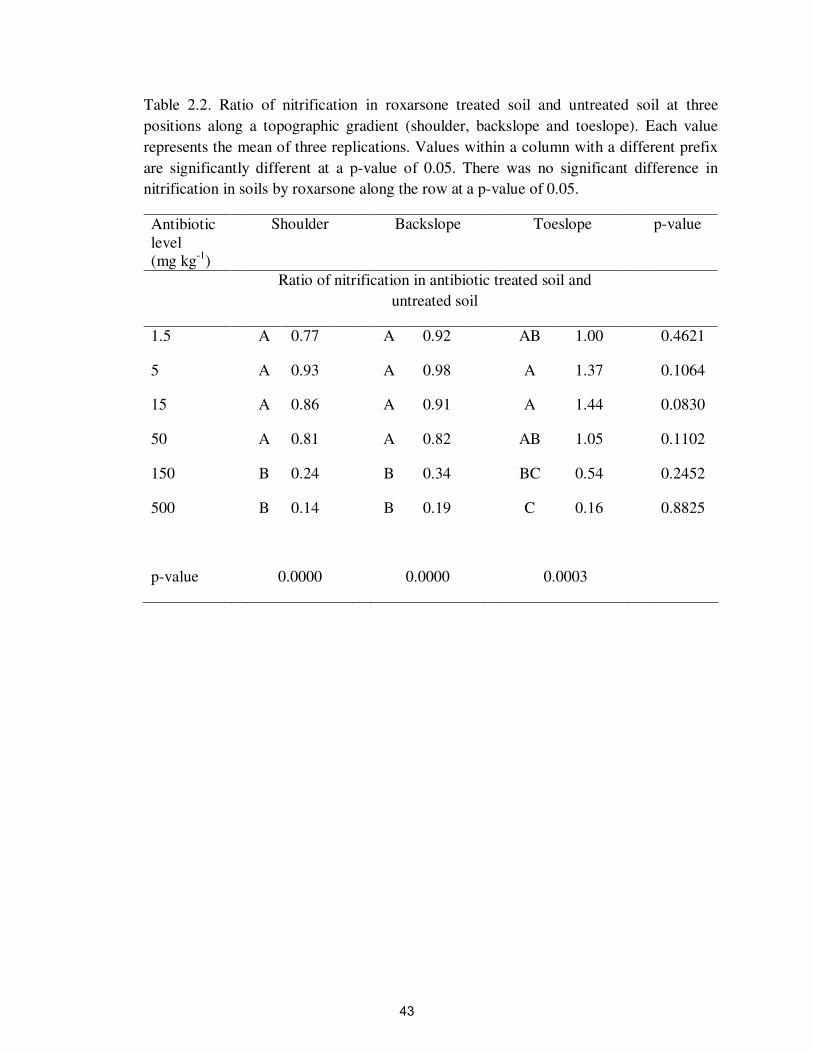
Table 2.2. Ratio of nitrification in roxarsone treated soil and untreated soil at three
positions along a topographic gradient (shoulder, backslope and toeslope). Each value
represents the mean of three replications. Values within a column with a different prefix
are significantly different at a p-value of 0.05. There was no significant difference in
nitrification in soils by roxarsone along the row at a p-value of 0.05.
Antibiotic
level
(mg kg-1
)
Shoulder Backslope Toeslope p-value
Ratio of nitrification in antibiotic treated soil and
untreated soil
1.5 A 0.77 A 0.92 AB 1.00 0.4621
5 A 0.93 A 0.98 A 1.37 0.1064
15 A 0.86 A 0.91 A 1.44 0.0830
50 A 0.81 A 0.82 AB 1.05 0.1102
150 B 0.24 B 0.34 BC 0.54 0.2452
500 B 0.14 B 0.19 C 0.16 0.8825
p-value 0.0000 0.0000 0.0003
43
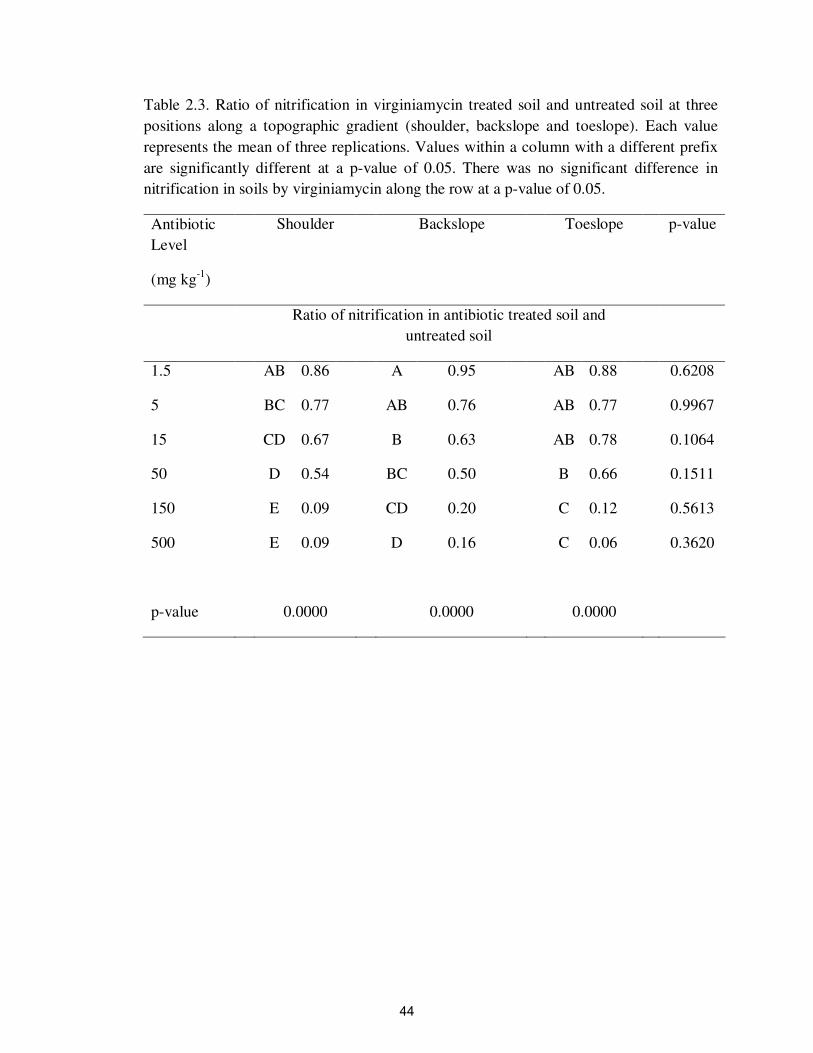
Table 2.3. Ratio of nitrification in virginiamycin treated soil and untreated soil at three
positions along a topographic gradient (shoulder, backslope and toeslope). Each value
represents the mean of three replications. Values within a column with a different prefix
are significantly different at a p-value of 0.05. There was no significant difference in
nitrification in soils by virginiamycin along the row at a p-value of 0.05.
Antibiotic
Level
(mg kg-1
)
Shoulder Backslope Toeslope p-value
Ratio of nitrification in antibiotic treated soil and
untreated soil
1.5 AB 0.86 A 0.95 AB 0.88 0.6208
5 BC 0.77 AB 0.76 AB 0.77 0.9967
15 CD 0.67 B 0.63 AB 0.78 0.1064
50 D 0.54 BC 0.50 B 0.66 0.1511
150 E 0.09 CD 0.20 C 0.12 0.5613
500 E 0.09 D 0.16 C 0.06 0.3620
p-value 0.0000 0.0000 0.0000
44
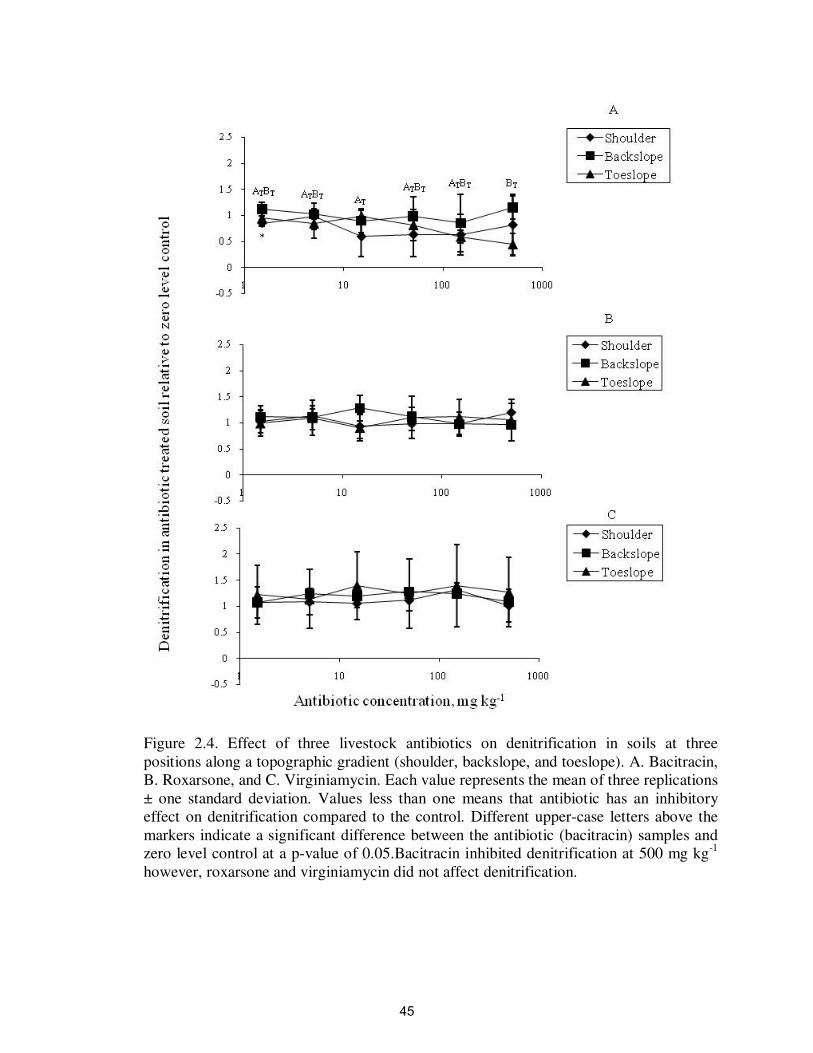
Figure 2.4. Effect of three livestock antibiotics on denitrification in soils at three
positions along a topographic gradient (shoulder, backslope, and toeslope). A. Bacitracin,
B. Roxarsone, and C. Virginiamycin. Each value represents the mean of three replications
± one standard deviation. Values less than one means that antibiotic has an inhibitory
effect on denitrification compared to the control. Different upper-case letters above the
markers indicate a significant difference between the antibiotic (bacitracin) samples and
zero level control at a p-value of 0.05.Bacitracin inhibited denitrification at 500 mg kg-1
however, roxarsone and virginiamycin did not affect denitrification.
45
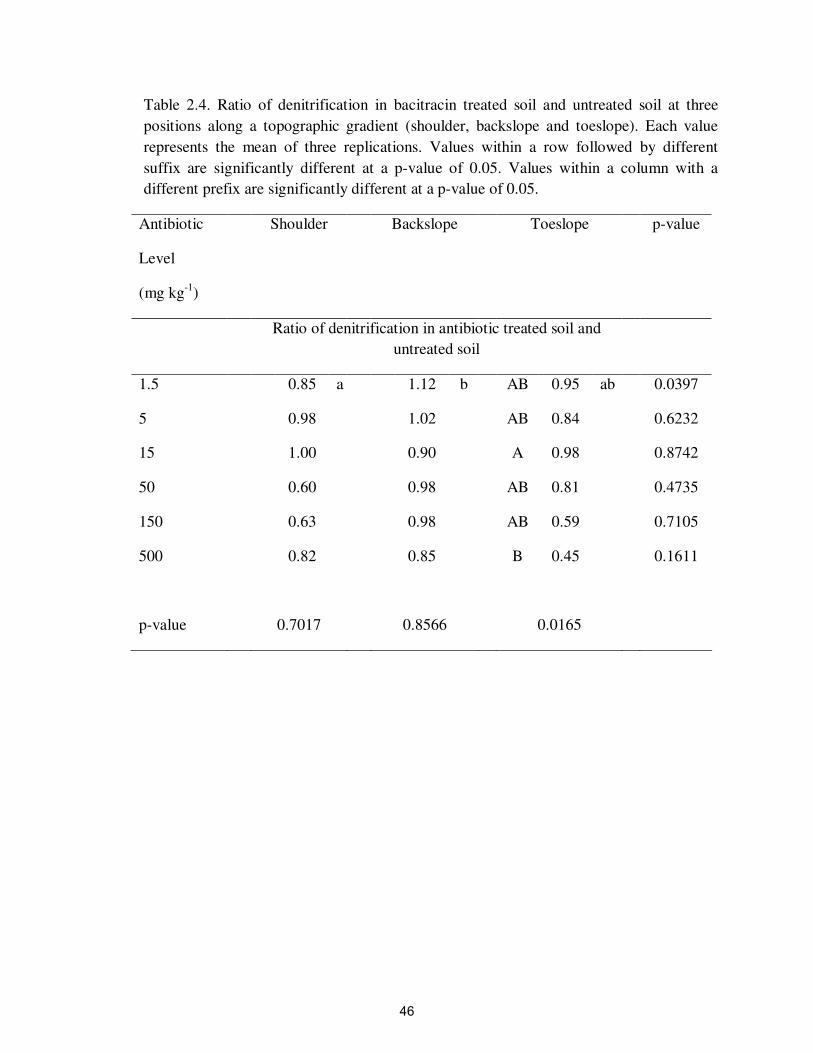
Table 2.4. Ratio of denitrification in bacitracin treated soil and untreated soil at three
positions along a topographic gradient (shoulder, backslope and toeslope). Each value
represents the mean of three replications. Values within a row followed by different
suffix are significantly different at a p-value of 0.05. Values within a column with a
different prefix are significantly different at a p-value of 0.05.
Antibiotic
Level
(mg kg-1
)
Shoulder Backslope Toeslope p-value
Ratio of denitrification in antibiotic treated soil and
untreated soil
1.5 0.85 a 1.12 b AB 0.95 ab 0.0397
5 0.98 1.02 AB 0.84 0.6232
15 1.00 0.90 A 0.98 0.8742
50 0.60 0.98 AB 0.81 0.4735
150 0.63 0.98 AB 0.59 0.7105
500 0.82 0.85 B 0.45 0.1611
p-value 0.7017 0.8566 0.0165
46
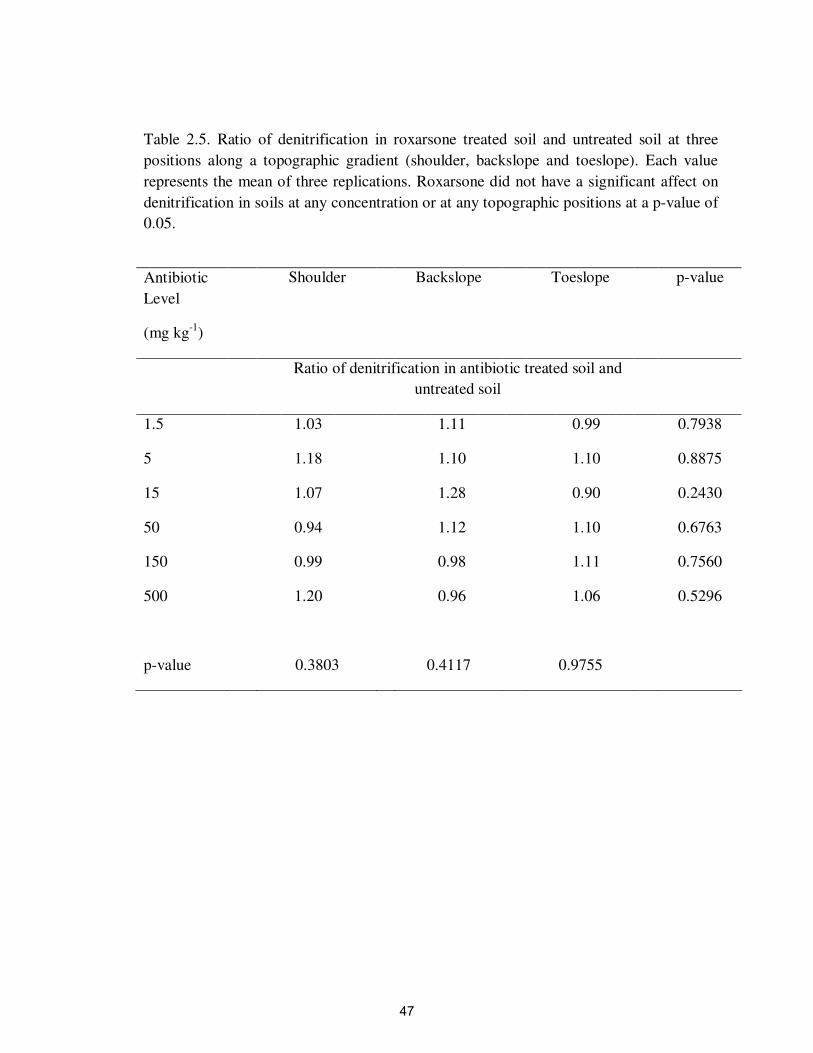
Table 2.5. Ratio of denitrification in roxarsone treated soil and untreated soil at three
positions along a topographic gradient (shoulder, backslope and toeslope). Each value
represents the mean of three replications. Roxarsone did not have a significant affect on
denitrification in soils at any concentration or at any topographic positions at a p-value of
0.05.
Antibiotic
Level
(mg kg-1
)
Shoulder Backslope Toeslope p-value
Ratio of denitrification in antibiotic treated soil and
untreated soil
1.5 1.03 1.11 0.99 0.7938
5 1.18 1.10 1.10 0.8875
15 1.07 1.28 0.90 0.2430
50 0.94 1.12 1.10 0.6763
150 0.99 0.98 1.11 0.7560
500 1.20 0.96 1.06 0.5296
p-value 0.3803 0.4117 0.9755
47
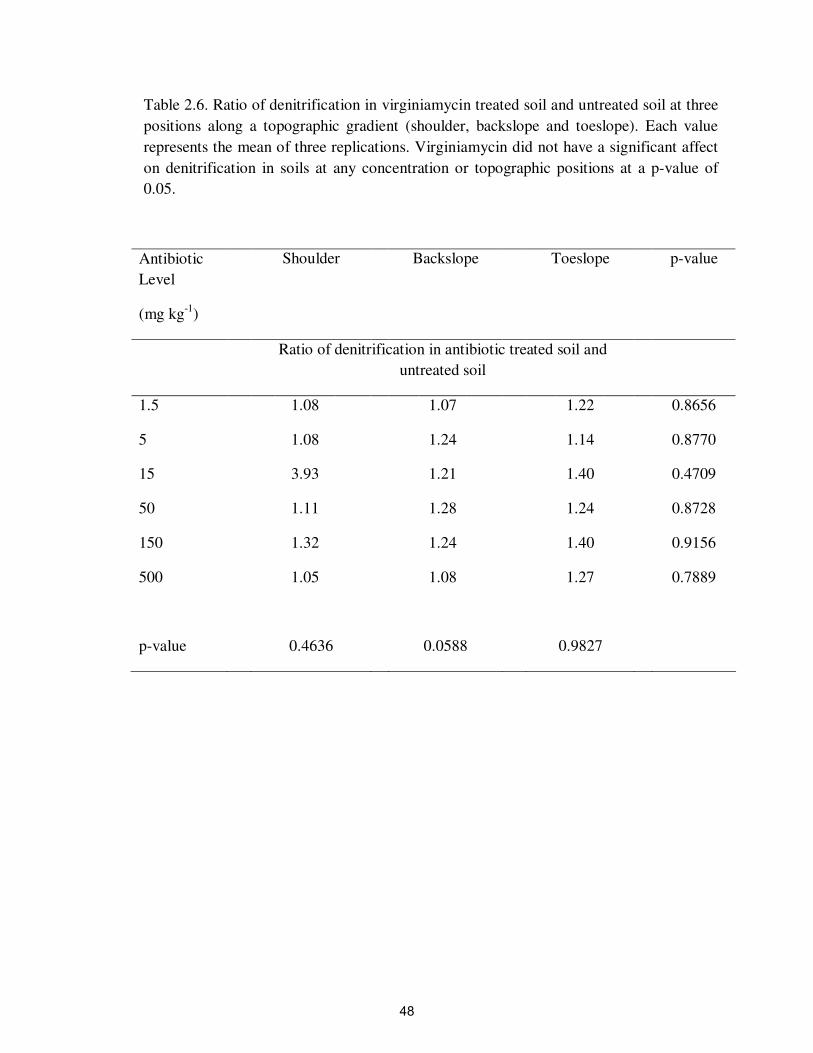
Table 2.6. Ratio of denitrification in virginiamycin treated soil and untreated soil at three
positions along a topographic gradient (shoulder, backslope and toeslope). Each value
represents the mean of three replications. Virginiamycin did not have a significant affect
on denitrification in soils at any concentration or topographic positions at a p-value of
0.05.
Antibiotic
Level
(mg kg-1
)
Shoulder Backslope Toeslope p-value
Ratio of denitrification in antibiotic treated soil and
untreated soil
1.5 1.08 1.07 1.22 0.8656
5 1.08 1.24 1.14 0.8770
15 3.93 1.21 1.40 0.4709
50 1.11 1.28 1.24 0.8728
150 1.32 1.24 1.40 0.9156
500 1.05 1.08 1.27 0.7889
p-value 0.4636 0.0588 0.9827
48
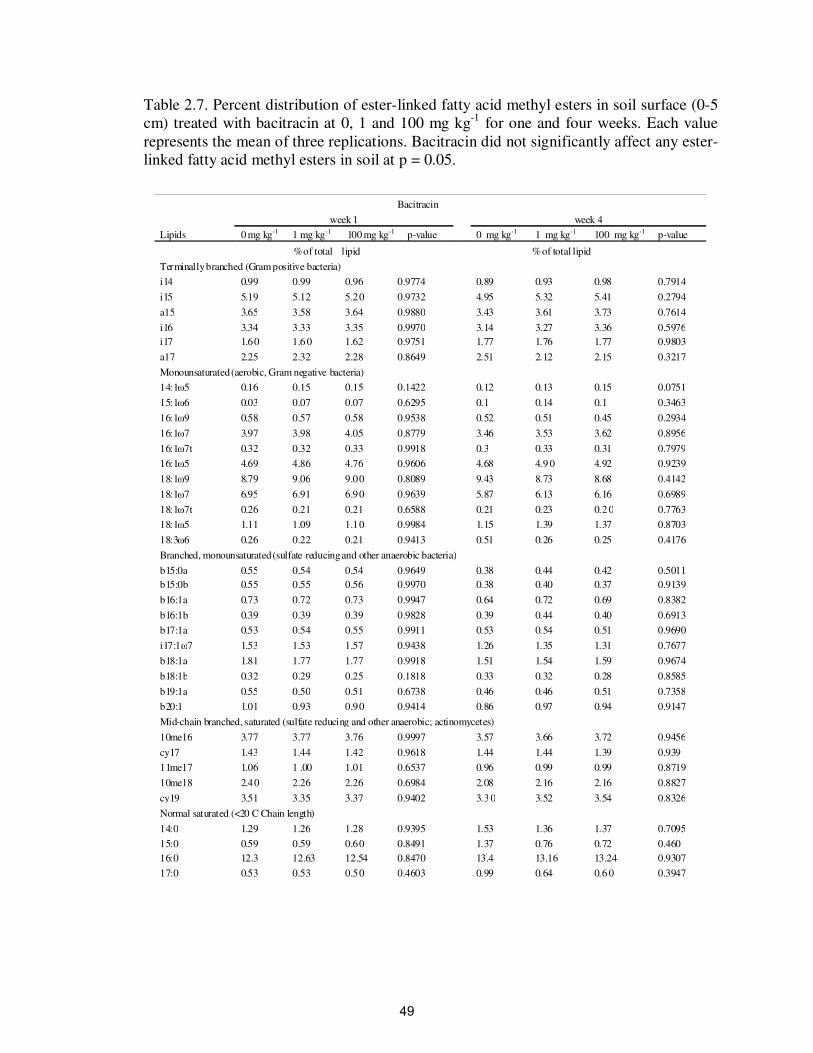
Table 2.7. Percent distribution of ester-linked fatty acid methyl esters in soil surface (0-5
cm) treated with bacitracin at 0, 1 and 100 mg kg-1
for one and four weeks. Each value
represents the mean of three replications. Bacitracin did not significantly affect any ester-
linked fatty acid methyl esters in soil at p = 0.05.
Bacitracin
week 1 week 4
Lipids 0 mg kg-1 1 mg kg-1 100 mg kg-1 p-value 0 mg kg-1 1 mg kg-1 100 mg kg-1 p-value
% of total lipid % of total lipid
Terminally branched (Gram positive bacteria)
i14 0.99 0.99 0.96 0.9774 0.89 0.93 0.98 0.7914
i15 5.19 5.12 5.2 0 0.9732 4.95 5.32 5.41 0.2794
a15 3.65 3.58
3.64
0.9880 3.43
3.61
3.73
0.7614
i16 3.34 3.33
3.35
0.9970 3.14
3.27
3.36
0.5976
i17 1.6 0 1.6 0 1.62 0.9751 1.77 1.76 1.77 0.9803
a17 2.25 2.32
2.28
0.8649 2.51
2.12
2.15
0.3217
Monounsaturated (aerobic, Gram negative bacteria)
14:1ω5 0.16 0.15 0.15 0.1422 0.12 0.13 0.15 0.0751
15:1ω6 0.03 0.07
0.07
0.6295 0.1
0.14
0.1
0.3463
16:1ω9 0.58 0.57
0.58
0.9538 0.52
0.51
0.45
0.2934
16:1ω7 3.97 3.98
4.05
0.8779 3.46
3.53
3.62
0.8956
16:1ω7t 0.32 0.32
0.33
0.9918 0.3
0.33
0.31
0.7979
16:1ω5 4.69 4.86 4.76 0.9606 4.68 4.9 0 4.92 0.9239
18:1ω9 8.79 9.06
9.0
0 0.8089 9.43
8.73
8.68
0.4142
18:1ω7 6.95 6.91 6.9
0 0.9639 5.87
6.13
6.16
0.6989
18:1ω7t 0.26 0.21
0.21
0.6588 0.21
0.23
0.2
0 0.7763
18:1ω5 1.11 1.09 1.1 0 0.9984 1.15 1.39 1.37 0.8703
18:3ω6 0.26 0.22 0.21 0.9413 0.51 0.26 0.25 0.4176
Branched, monounsaturated (sulfate reducing and other anaerobic bacteria)
b15:0a 0.55 0.54
0.54
0.9649 0.38
0.44
0.42
0.5011
b15:0b 0.55 0.55
0.56
0.9970 0.38
0.40
0.37
0.9139
b16:1a 0.73 0.72
0.73
0.9947 0.64
0.72
0.69
0.8382
b16:1b 0.39 0.39
0.39
0.9828 0.39
0.44
0.40
0.6913
b17:1a 0.53 0.54 0.55 0.9911 0.53 0.54 0.51 0.9690
i17:1ω7 1.53 1.53
1.57
0.9438 1.26
1.35
1.31
0.7677
b18:1a 1.81 1.77
1.77
0.9918 1.51
1.54
1.59
0.9674
b18:1b 0.32 0.29
0.25
0.1818 0.33
0.32
0.28 0.8585
b19:1a 0.55 0.50
0.51
0.6738 0.46
0.46
0.51
0.7358
b20:1 1.01 0.93 0.9 0 0.9414 0.86 0.97 0.94 0.9147
Mid-chain branched, saturated (sulfate reducing and other anaerobic; actinomycetes)
10me16 3.77 3.77
3.76
0.9997 3.57
3.66
3.72
0.9456
cy17 1.43 1.44
1.42
0.9618 1.44
1.44
1.39
0.939
11me17 1.06 1 .00 1.01 0.6537 0.96 0.99 0.99 0.8719
10me18 2.4 0 2.26 2.26 0.6984 2.08 2.16 2.16 0.8827
cy19 3.51 3.35
3.37
0.9402 3.3
0 3.52
3.54
0.8326
Normal saturated (<20 C Chain length)
14:0 1.29 1.26
1.28
0.9395 1.53
1.36
1.37
0.7095
15:0 0.59 0.59 0.6 0 0.8491 1.37 0.76 0.72 0.460
16:0 12.3 12.63 12.54 0.8470 13.4 13.16 13.24 0.9307
17:0 0.53 0.53 0.5 0 0.4603 0.99 0.64 0.6 0 0.3947
49
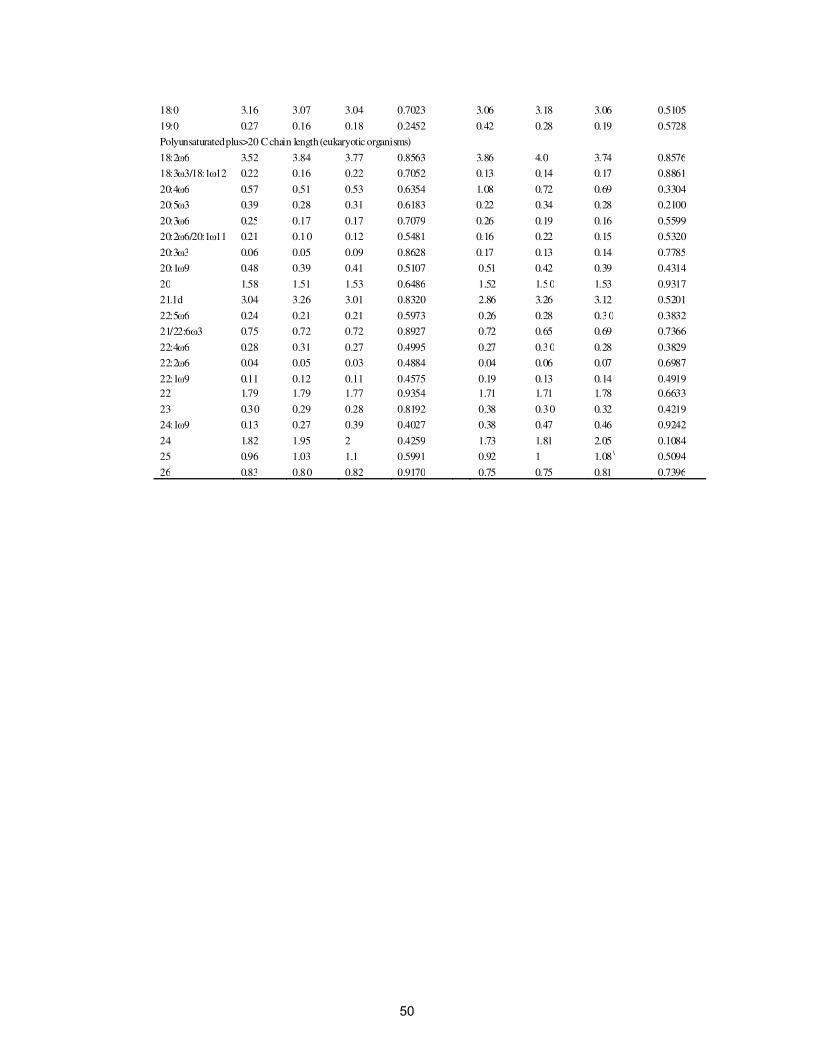
18:0 3.16 3.07 3.04 0.7023 3.06 3.18 3.06 0.5105
19:0 0.27 0.16 0.18 0.2452 0.42 0.28 0.19 0.5728
Polyunsaturated plus>20 C chain length (eukaryotic organisms)
18:2ω6 3.52 3.84 3.77 0.8563 3.86 4.0 3.74 0.8576
18:3ω3/18:1ω12 0.22 0.16 0.22 0.7052 0.13 0.14 0.17 0.8861
20:4ω6 0.57 0.51 0.53 0.6354 1.08 0.72 0.69 0.3304
20:5ω3 0.39 0.28 0.31 0.6183 0.22 0.34 0.28 0.2100
20:3ω6 0.25 0.17 0.17 0.7079 0.26 0.19 0.16 0.5599
20:2ω6/20:1ω11 0.21 0.1 0 0.12 0.5481 0.16 0.22 0.15 0.5320
20:3ω3 0.06 0.05 0.09 0.8628 0.17 0.13 0.14 0.7785
20:1ω9 0.48 0.39 0.41 0.5107 0.51 0.42 0.39 0.4314
20 1.58 1.51
1.53
0.6486 1.52
1.5
0 1.53
0.9317
21.1d 3.04 3.26 3.01 0.8320 2.86 3.26 3.12 0.5201
22:5ω6 0.24 0.21
0.21
0.5973 0.26
0.28
0.3
0 0.3832
21/22:6ω3 0.75 0.72 0.72 0.8927 0.72 0.65 0.69 0.7366
22:4ω6 0.28 0.31
0.27
0.4995 0.27
0.3
0 0.28
0.3829
22:2ω6 0.04 0.05 0.03 0.4884 0.04 0.06 0.07 0.6987
22:1ω9 0.11 0.12
0.11
0.4575 0.19
0.13
0.14
0.4919
22 1.79 1.79 1.77 0.9354 1.71 1.71 1.78 0.6633
23 0.3 0 0.29
0.28
0.8192 0.38
0.3
0 0.32
0.4219
24:1ω9 0.13 0.27 0.39 0.4027 0.38 0.47 0.46 0.9242
24 1.82 1.95
2
0.4259 1.73
1.81
2.05
0.1084
25 0.96 1.03 1.1 0.5991 0.92 1 1.08 \ 0.5094
26 0.83 0.8
0 0.82
0.9170 0.75
0.75
0.81
0.7396
50
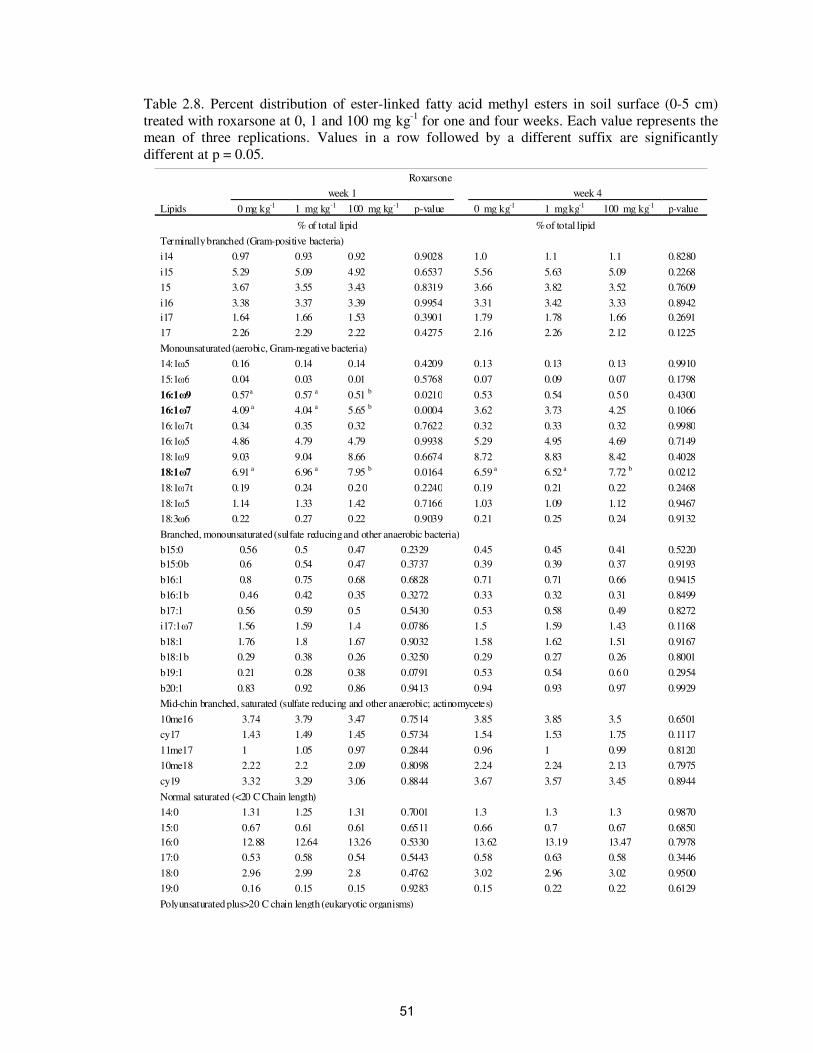
Table 2.8. Percent distribution of ester-linked fatty acid methyl esters in soil surface (0-5 cm)
treated with roxarsone at 0, 1 and 100 mg kg-1
for one and four weeks. Each value represents the mean of three replications. Values in a row followed by a different suffix are significantly
different at p = 0.05.
Roxarsone
Lipids
week 1 week 4
0 mg kg-1 1 mg kg-1 100 mg kg-1 p-value 0 mg kg-1 1 mg kg-1 100 mg kg-1 p-value
% of total lipid % of total lipid
Terminally branched (Gram-positive bacteria)
i14 0.97 0.93 0.92 0.9028 1.0 1.1 1.1 0.8280
i15 5.29 5.09 4.92 0.6537 5.56 5.63 5.09 0.2268
15 3.67 3.55 3.43 0.8319 3.66 3.82 3.52 0.7609
i16 3.38 3.37 3.39 0.9954 3.31 3.42 3.33 0.8942
i17 1.64 1.66 1.53 0.3901 1.79 1.78 1.66 0.2691
17 2.26 2.29 2.22 0.4275 2.16 2.26 2.12 0.1225
Monounsaturated (aerobic, Gram-negative bacteria)
14:1ω5 0.16 0.14 0.14 0.4209 0.13 0.13 0.13 0.9910
15:1ω6 0.04 0.03 0.01 0.5768 0.07 0.09 0.07 0.1798
16:1ω9 0.57a 0.57 a 0.51 b 0.0210 0.53 0.54 0.5 0 0.4300
16:1ω7 4.09 a 4.04 a 5.65 b 0.0004 3.62 3.73 4.25 0.1066
16:1ω7t 0.34 0.35 0.32 0.7622 0.32 0.33 0.32 0.9980
16:1ω5 4.86 4.79 4.79 0.9938 5.29 4.95 4.69 0.7149
18:1ω9 9.03 9.04 8.66 0.6674 8.72 8.83 8.42 0.4028
18:1ω7 6.91 a 6.96 a 7.95 b 0.0164 6.59 a 6.52 a 7.72 b 0.0212
18:1ω7t 0.19 0.24 0.2 0 0.2240 0.19 0.21 0.22 0.2468
18:1ω5 1.14 1.33 1.42 0.7166 1.03 1.09 1.12 0.9467
18:3ω6 0.22 0.27 0.22 0.9039 0.21 0.25 0.24 0.9132
Branched, monounsaturated (sulfate reducing and other anaerobic bacteria)
b15:0 0.56 0.5 0.47 0.2329 0.45 0.45 0.41 0.5220
b15:0b 0.6 0.54 0.47 0.3737 0.39 0.39 0.37 0.9193
b16:1 0.8 0.75 0.68 0.6828 0.71 0.71 0.66 0.9415
b16:1b 0.46 0.42 0.35 0.3272 0.33 0.32 0.31 0.8499
b17:1 0.56 0.59 0.5 0.5430 0.53 0.58 0.49 0.8272
i17:1ω7 1.56 1.59 1.4 0.0786 1.5 1.59 1.43 0.1168
b18:1 1.76 1.8 1.67 0.9032 1.58 1.62 1.51 0.9167
b18:1b 0.29 0.38 0.26 0.3250 0.29 0.27 0.26 0.8001
b19:1 0.21 0.28 0.38 0.0791 0.53 0.54 0.6 0 0.2954
b20:1 0.83 0.92 0.86 0.9413 0.94 0.93 0.97 0.9929
Mid-chin branched, saturated (sulfate reducing and other anaerobic; actinomycetes)
10me16 3.74 3.79 3.47 0.7514 3.85 3.85 3.5 0.6501
cy17 1.43 1.49 1.45 0.5734 1.54 1.53 1.75 0.1117
11me17 1 1.05 0.97 0.2844 0.96 1 0.99 0.8120
10me18 2.22 2.2 2.09 0.8098 2.24 2.24 2.13 0.7975
cy19 3.32 3.29 3.06 0.8844 3.67 3.57 3.45 0.8944
Normal saturated (<20 C Chain length)
14:0 1.31 1.25 1.31 0.7001 1.3 1.3 1.3 0.9870
15:0 0.67 0.61 0.61 0.6511 0.66 0.7 0.67 0.6850
16:0 12.88 12.64 13.26 0.5330 13.62 13.19 13.47 0.7978
17:0 0.53 0.58 0.54 0.5443 0.58 0.63 0.58 0.3446
18:0 2.96 2.99 2.8 0.4762 3.02 2.96 3.02 0.9500
19:0 0.16 0.15 0.15 0.9283 0.15 0.22 0.22 0.6129
Polyunsaturated plus>20 C chain length (eukaryotic organisms)
51
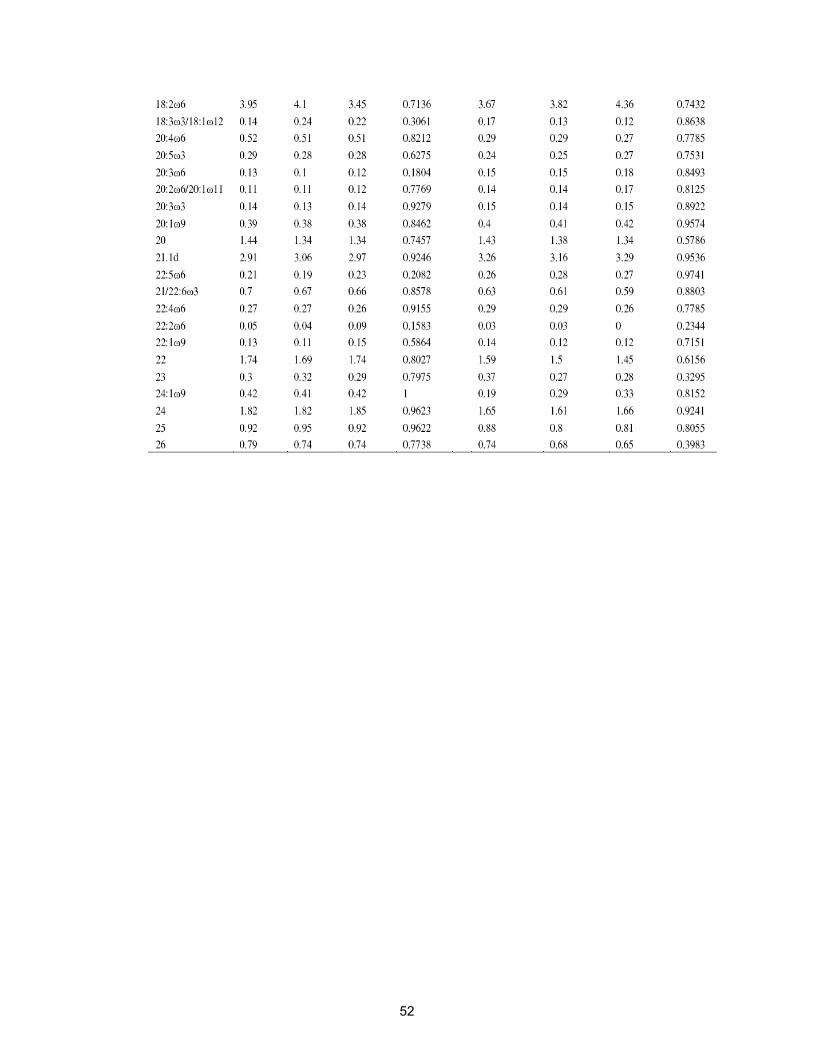
52
significant decrease in branched, monounsaturated EL-FAME (i17:1ω7) and a >20
carbon length EL-FAME (26:0) in week four (Table 2.9). None of the other EL-FAMEs
were significantly affected by virginiamycin.
Effect of Sorption on Antibiotic Bioavailability and Microbial Growth
Bacitracin had a negligible impact on microbial growth in either the BT and AT
antibiotic solutions at any concentration up to of 300 mg L-1
(Figures 2.5A and 2.6A and
Table 2.10). Roxarsone and virginiamycin significantly inhibited microbial growth at 300
mg L-1
in the BT solutions, but did not inhibit growth at any concentration in the AT
solutions (Figures 2.5B, C and 2.6B, C and Table 2.10).
Chemical Properties of Soils at the Different Topographic Positions
Soil pH ranged between 5.85 and 6.68, and was significantly higher in the
toeslope soils than in the shoulder and backslope soils (p = 0.001) (Table 2.11). Mehlich
III phosphorus ranged between 194 mg kg-1
to 257 mg kg-1
, and was not significantly
different at the three landscape positions (p = 0.5998). The amount of Mehlich III
potassium ranged between 139 mg kg-1
and 376 mg kg-1
, and was significantly higher in
the backslope soils than in the shoulder and toeslope soils (p = 0.0028). Mehlich III
calcium ranged between 1650 mg kg-1
to 2940 mg kg-1
, and was significantly higher in
the toeslope soils than in the shoulder and backslope soils (p = 0.0023). The amount of
Mehlich III magnesium ranged between 129 mg kg-1
to 196 mg kg-1
, and was not
significantly different at the landscape three positions (p = 0.0652). The amount of
Mehlich III zinc ranged between 2 mg kg-1
to 4 mg kg-1
, and was not significantly
different at the three landscape positions (p = 0.1998). The amount of Mehlich III
53
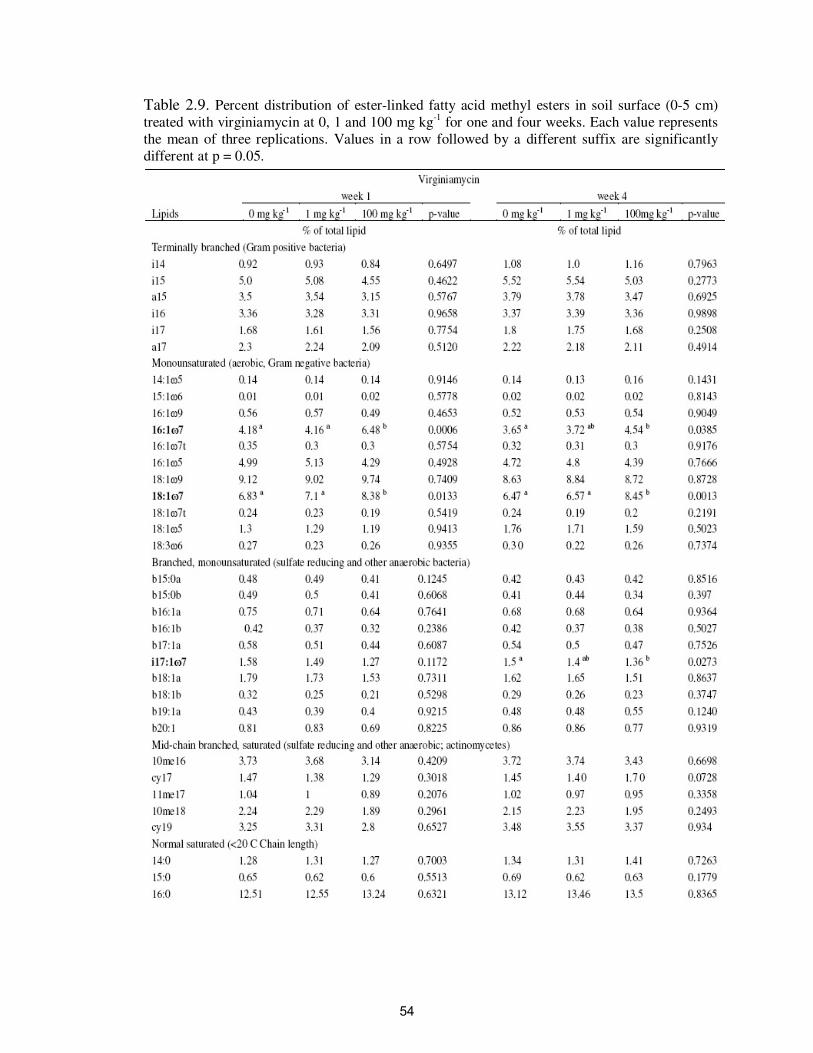
Table 2.9. Percent distribution of ester-linked fatty acid methyl esters in soil surface (0-5 cm)
treated with virginiamycin at 0, 1 and 100 mg kg-1 for one and four weeks. Each value represents
the mean of three replications. Values in a row followed by a different suffix are significantly
different at p = 0.05.
54
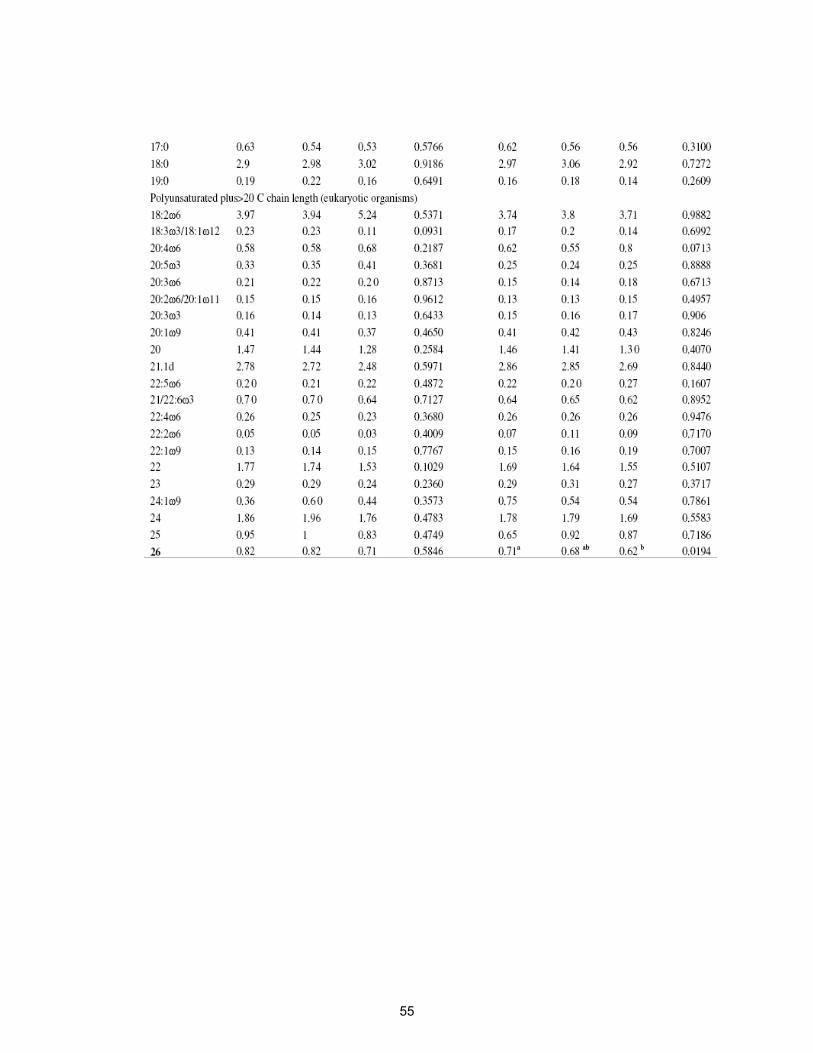
55
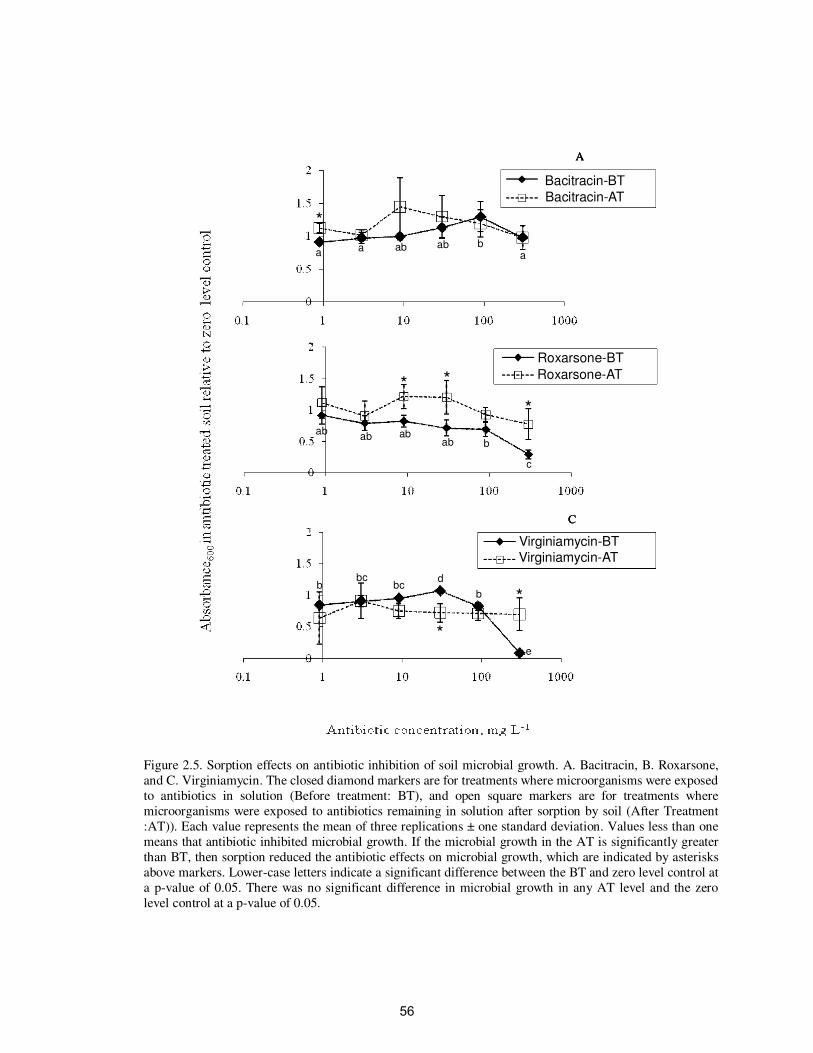
Figure 2.5. Sorption effects on antibiotic inhibition of soil microbial growth. A. Bacitracin, B. Roxarsone,
and C. Virginiamycin. The closed diamond markers are for treatments where microorganisms were exposed
to antibiotics in solution (Before treatment: BT), and open square markers are for treatments where
microorganisms were exposed to antibiotics remaining in solution after sorption by soil (After Treatment
:AT)). Each value represents the mean of three replications ± one standard deviation. Values less than one
means that antibiotic inhibited microbial growth. If the microbial growth in the AT is significantly greater
than BT, then sorption reduced the antibiotic effects on microbial growth, which are indicated by asterisks
above markers. Lower-case letters indicate a significant difference between the BT and zero level control at
a p-value of 0.05. There was no significant difference in microbial growth in any AT level and the zero
level control at a p-value of 0.05.
Antibiotic concentration, mg L-1
B
A
*
a a ab ba
ab
* *
*
c
b
abab ab
ab
C
*
*
e
bcb bc
d
b
Antibiotic concentration, mg L-1
B
A
*
a a ab ba
ab
A
*
a a ab ba
ab
* *
*
c
b
abab ab
ab
C
*
*
e
bcb bc
d
b
C
*
*
e
bcb bc
d
b
Bacitracin-BT
Bacitracin-AT
Roxarsone-BT
Roxarsone-AT
Virginiamycin-BT
Virginiamycin-AT
*
* *
*
*
*
ab ab
abab ab
ab
a aa
b
b
c
bbc
bcd
b
e
56
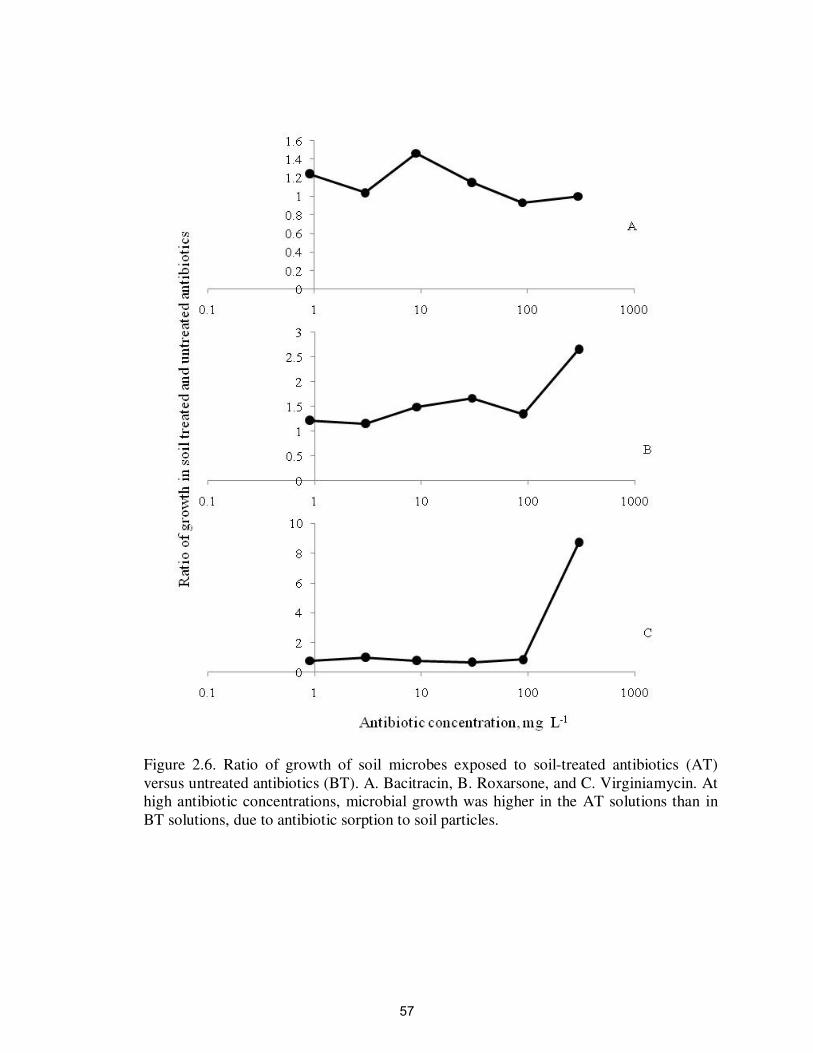
Figure 2.6. Ratio of growth of soil microbes exposed to soil-treated antibiotics (AT)
versus untreated antibiotics (BT). A. Bacitracin, B. Roxarsone, and C. Virginiamycin. At
high antibiotic concentrations, microbial growth was higher in the AT solutions than in
BT solutions, due to antibiotic sorption to soil particles.
57
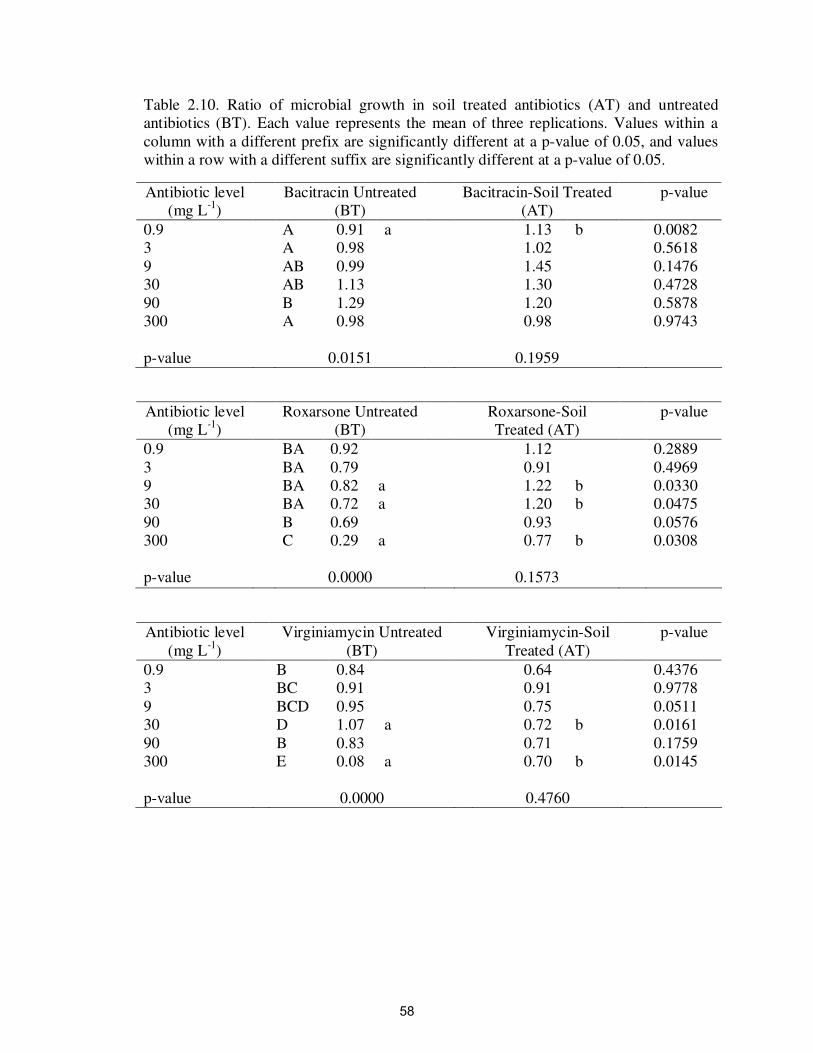
Table 2.10. Ratio of microbial growth in soil treated antibiotics (AT) and untreated
antibiotics (BT). Each value represents the mean of three replications. Values within a
column with a different prefix are significantly different at a p-value of 0.05, and values
within a row with a different suffix are significantly different at a p-value of 0.05.
Antibiotic level
(mg L-1
)
Bacitracin Untreated
(BT)
Bacitracin-Soil Treated
(AT)
p-value
0.9 A 0.91 a 1.13 b 0.0082
3 A 0.98 1.02 0.5618
9 AB 0.99 1.45 0.1476
30 AB 1.13 1.30 0.4728
90 B 1.29 1.20 0.5878
300 A 0.98 0.98 0.9743
p-value 0.0151 0.1959
Antibiotic level
(mg L-1
)
Roxarsone Untreated
(BT)
Roxarsone-Soil
Treated (AT)
p-value
0.9 BA 0.92 1.12 0.2889
3 BA 0.79 0.91 0.4969
9 BA 0.82 a 1.22 b 0.0330
30 BA 0.72 a 1.20 b 0.0475
90 B 0.69 0.93 0.0576
300 C 0.29 a 0.77 b 0.0308
p-value 0.0000 0.1573
Antibiotic level
(mg L-1
)
Virginiamycin Untreated
(BT)
Virginiamycin-Soil
Treated (AT)
p-value
0.9 B 0.84 0.64 0.4376
3 BC 0.91 0.91 0.9778
9 BCD 0.95 0.75 0.0511
30 D 1.07 a 0.72 b 0.0161
90 B 0.83 0.71 0.1759
300 E 0.08 a 0.70 b 0.0145
p-value 0.0000 0.4760
58
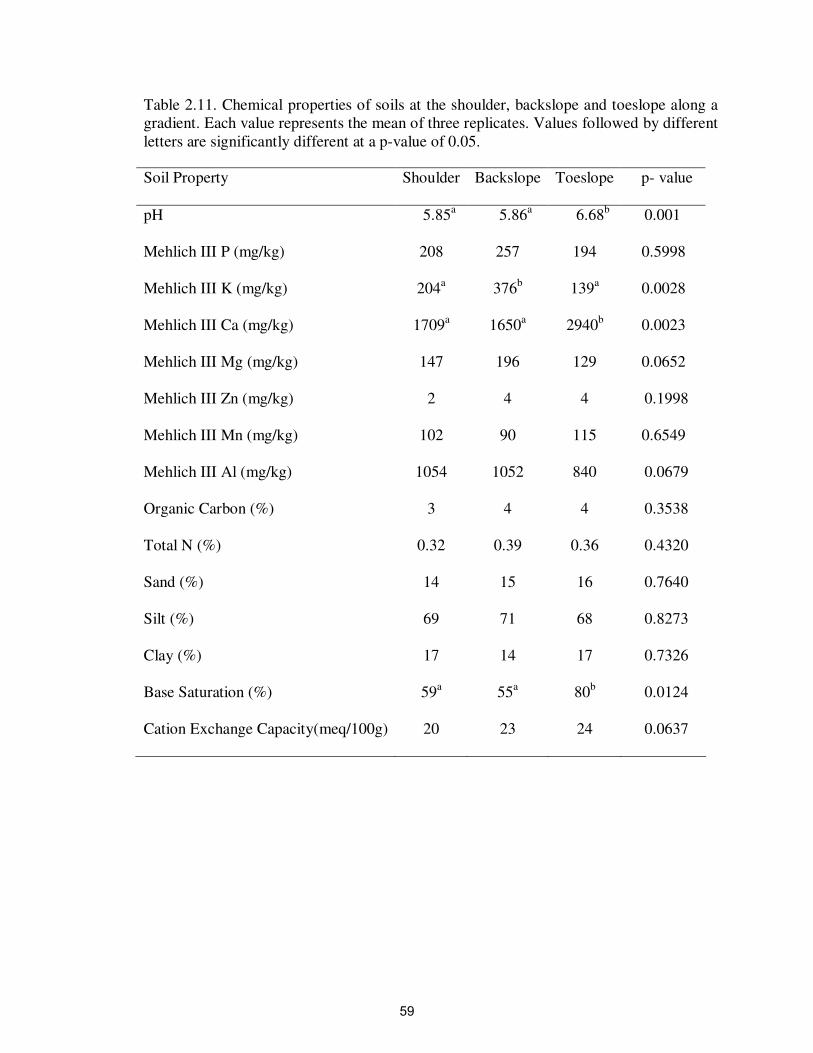
Table 2.11. Chemical properties of soils at the shoulder, backslope and toeslope along a
gradient. Each value represents the mean of three replicates. Values followed by different
letters are significantly different at a p-value of 0.05.
Soil Property Shoulder Backslope Toeslope p- value
pH 5.85a 5.86
a 6.68
b 0.001
Mehlich III P (mg/kg) 208 257 194 0.5998
Mehlich III K (mg/kg) 204a 376
b 139
a 0.0028
Mehlich III Ca (mg/kg) 1709a 1650
a 2940
b 0.0023
Mehlich III Mg (mg/kg) 147 196 129 0.0652
Mehlich III Zn (mg/kg) 2 4 4 0.1998
Mehlich III Mn (mg/kg) 102 90 115 0.6549
Mehlich III Al (mg/kg) 1054 1052 840 0.0679
Organic Carbon (%) 3 4 4 0.3538
Total N (%) 0.32 0.39 0.36 0.4320
Sand (%) 14 15 16 0.7640
Silt (%) 69 71 68 0.8273
Clay (%) 17 14 17 0.7326
Base Saturation (%) 59a 55
a 80
b 0.0124
Cation Exchange Capacity(meq/100g) 20 23 24 0.0637
59
manganese ranged between 90 mg kg-1
to 115 mg kg-1
, and was not significantly different
at the three landscape positions (p = 0.6549). The amount of Mehlich III aluminum
ranged between 840 mg kg-1
to 1052 mg kg-1
, and was not significantly different at the
three landscape positions (p = 0.0679). Soil carbon ranged between 3% to 4% and was
not significantly different in the three landscape positions (p = 0.3538). Soil total nitrogen
ranged between 0.32% to 0.39% and was not significantly different at the three positions
(p = 0.4320). The amounts of sand, silt and clay ranged between 14%-16%, 68%-71%,
and 14%-17%, respectively, and were not significantly different at the three positions (p
> 0.73). The cation exchange capacity ranged between 20 meq 100g-1
to 24 meq 100g-1
,
and was not significantly different at the three landscape positions (p = 0.0637). The base
saturation ranged between 55% to 80% and was significantly higher in the toeslope soils
than in the backslope and shoulder soils (p = 0.0124).
Discussion
The poultry industry routinely uses large amounts of bacitracin, roxarsone and
virginiamycin in poultry feed, which is largely excreted in manure and widely used as a
soil amendment. Since antibiotics inhibit many types of bacterial groups, it was
hypothesized that they would affect soil microbial community composition, and aerobic,
autotrophic and anaerobic, heterotrophic biochemical processes of nitrification and
denitrification, respectively. It was also hypothesized that antibiotic effects would be
different at various landscape topographic positions, due to differences in soil properties
that affect the interactions between antibiotics and soil particles and microbial
communities. If these hypotheses are true, then application of antibiotics to soils could
have major implications on the concentrations of several N species (i.e. NH4+, NO3
- and
60
NO2-, N2O), and therefore impact soil, water, and air quality (Hallberg and Keeney, 1993;
Britto and Kronzucker, 2002; Vellidis et al., 2003; Bierman and Rosen, 2005). To test
these hypotheses, a series of lab experiments were conducted in which antibiotics were
added to soils at concentrations that covered and exceeded the range expected in poultry
litter applied soils, and the resulting affects on nitrification, denitrification and microbial
community composition (EL-FAMEs) were determined.
As expected, roxarsone and virginiamycin significantly altered microbial
community composition of soils, as indicated by significant differences in EL-FAME
abundances compared to the zero level control. For example, after one and four week
exposure of soils to 100 mg kg-1
roxarsone or virginiamycin, there were significant
increases in 16:1ω7 and 18:1ω7, and decreases in 16:1ω9 (in roxarsone treatment in week
one only), i17:1ω7 and 26:0 (in virginiamycin treatment in week four only). These
results indicated that aerobic, Gram-negative bacteria were enriched and Gram-positive
bacteria and fungi were depleted in the presence of these antibiotics. These results are
consistent with the fact that these antibiotics primarily target Gram-positive bacteria.
Although roxarsone and virginiamycin influenced microbial community composition at
100 mg kg-1
, they did not influence microbial community composition at 1 mg kg-1
.
Moreover, bacitracin did not affect microbial community composition at 1 or 100 mg kg-
1. Since these levels are much higher than expected in litter-amended soils (see Table
1.3), it is unlikely that antibiotics associated poultry litter would significantly impact
microbial community composition in these soils, even if they were amended more
frequently and with greater amounts of litter than typically applied. The same results
were found at all three topographic positions, even though soils at these positions varied
61
significantly in pH, bioavailable Ca, and base saturation, which was most likely due to
increased weathering of exposed limestone parent material, decomposition of vegetation,
and surface runoff and deposition of calcium ions from the high to low areas of the
topographic gradient (Brady and Weil, 2002).
Results from the nitrification and denitrification experiments were generally
consistent with those of the microbial community composition experiment. Specifically,
roxarsone and virginiamycin significantly inhibited nitrification in the soils. The
concentrations that inhibited nitrification, however, were much higher than would be
expected in litter-amended soils. For example, roxarsone inhibited nitrification at >150
mg kg-1
, which is 375-1,875 times higher than expected in poultry litter-amended soil
(Table 1.3). Similarly, virginiamycin inhibited nitrification at >15 to >150 mg kg-1
(depending on topographic position), which is 7,500-60,000 times higher than expected
in poultry litter-amended soil (Table 1.3). Bacitracin did not affect nitrification at any
concentration up to 500 mg kg-1
. Bacitracin inhibited denitrification at 500 mg kg-1
,
however roxarsone and virginiamycin did not had a strong affect on denitrification at up
to 500 mg kg-1
.
No other studies have determined the effects of bacitracin, virginiamycin, or
roxarsone on microbial community composition, nitrification, or denitrification in soils;
other studies, however, have evaluated the effects of other antibiotics in other
environments with varying results. For example, Pedroso et al. (2006) found that
bacitracin methylene disalicylate altered the microbiota composition in the small intestine
of broilers at a concentration of 27.5 mg kg-1
. Dumonceaux et al. (2006) and Wise and
Seragusa (2007) found that virginiamycin influenced bacterial groups in broiler
62
gastrointestinal tract (Gram-positive organisms). Quastel and Scholefield (1951), Pramer
and Starkey (1952) and Hervey (1955) found that high levels of chloramphenicol,
streptomycin, thiolutin and oxytetracycline were required to hindered nitrification in
soils. Patten et al. (1980) and Warman (1980) found that amprolium, auromycin
chlortetracycine, and oxytetracycline at various concentrations did not affect nitrification
in soil, manure, or sewage sludge. Gomez et al. (1996) found that chloramphenicol,
ampicillin, penicillin, and oxytetracycline had no significant affect on nitrification in a
nitrifying sludge at up to 250 mg L-1
. Halling-Sørensen (2001), on the other hand,
reported that low concentrations of chlortetracycline (0.4 mg L-1
), oxytetracyline (1.2 mg
L-1
), tiamulin (14.3 mg L-1
) and streptomycin (0.47 mg L-1
) inhibited nitrification in
sewage sludge. Costanzo et al. (2005) found that erythromycin, clarithromycin and
amoxicillin at 1 mg L-1
inhibited denitrification in the aquatic environment, but that
ciprofloxacin had no significant effect due to complexation with magnesium and sodium
cations in the water.
Few studies have evaluated the mechanisms that could explain the differences in
results between studies. Possible reasons could include different (i) sources/types of
microorganisms (Muir, 1985; Swick, 1996), (ii) exposures and resistances of
microorganisms to antibiotics (Pramer, 1958; Boon, 1992; Fujita et al., 1993; Halling-
Sørensen et al., 1998; Huys et al., 2000; Esiobu et al., 2002; Chelossi et al., 2003;
Costanzo et al., 2005; Branco et al., 2008), (iii) degradation of antibiotics (Jagnow, 1977;
Gavalchin and Katz, 1994; Weerasinghe and Towner, 1997; US-FDA, 1998; Ingerslev
and Halling-Sørensen, 2001; Bednar et al., 2003; Thiele-Bruhn., 2003), and (iv)
sorption/complexation of antibiotics to the soil, sludge, biofilm matrices used in various
63
studies (Urbain et al., 1993; da Gloria Britto de Oliveira et al., 1995; Gomez et al., 1996;
Herron et al., 1998; Froehner et al., 2000; Brown 2003; Thiele-Bruhn., 2003). One or
more of these factors could explain why bacitracin, virginiamycin, and roxarsone did not
have large effects on microbial community composition, nitrification or denitrification in
the soils of this study.
To explore the possible role of sorption in reducing antibiotic bioavailability and
in protecting organisms against antibiotic effects, additional experiments were conducted
in which soil microbial growth was compared in two cultures: one that was exposed to
antibiotic solutions after being reacted with soil (AT), and the other that was exposed to
antibiotic solutions that was not first exposed to soil (BT). It was hypothesized that
microbial growth would be higher in the AT solutions, due to lower antibiotic
concentrations in the solution.
Results from the experiment showed that bacitracin had negligible affects on soil
microbial growth at approximately 300 mg L-1
compared to the zero level control in
either the AT or BT solutions. Roxarsone and virginiamycin were toxic to soil
microorganisms at 300 mg L-1
in the BT solutions, but not at lower concentrations
(assuming there were very less degradation during one day incubation). As expected, the
toxicity effects of roxarsone and virginiamycin in the BT solutions were lost when
antibiotics were first treated with soil in the AT solutions. Therefore, it appears that
sorption played a role in protecting organisms against high antibiotic levels in these soils.
Probably more importantly, however, was that soil microbial growth was not
inhibited at high antibiotic concentrations, which clearly showed that the native microbial
populations were highly resistant to these antibiotics. This probably explains why the
64
antibiotics did not strongly affect the microbial community composition, nitrification, or
denitrification in these soils. These results were somewhat surprising considering that
soils were not previously exposed to antibiotics.
Although not evaluated in this study, possible mechanisms of antibiotic resistance
held by the native microbial populations could include (i) low permeability of cell
membrane to antibiotics (prevalent in Gram-negative bacteria) (Mazel and Davies, 1999),
(ii) active efflux of the antibiotics out of the cell (Butaye et al., 2003), (iii) site alteration
of antibitotic target sites (Butaye et al., 2003), and (iv) enzymatic inactivation of the
antibiotic (Mazel and Davies, 1999). In most cases, resistance by these mechanisms is
due to proteins that are coded by genes located on chromosomes or plasmids (Rosander et
al., 2008). Importantly, it is possible that these genes could be transferred between native
soil bacteria and pathogens in poultry litter by various horizontal gene transfer processes,
including conjugation, transforamation and transduction. To my knowledge, this
possibility has not been explored, and is an area for future research.
Conclusions
Results from this study clearly showed that bacitracin, roxarsone, and
virginiamycin had very limited effects on microbial community composition,
nitrification, and denitrification at concentrations expected in poultry litter-amended soils
in the short term (< one month) time period. Therefore, it is unlikely that soil, water, or
air quality would be significantly impacted by the antibiotics contained in this
amendment material. It was found that sorption played a role in reducing antibiotic
bioavailability; the limited affects of antibiotics on microbial processes, however,
appeared to be mostly due to natural resistance of the native soil community to these
65
antibiotics. These results could have important health implications. For example, it is
possible that pathogens in poultry litter aggregate microbial “hot spot” could acquire
antibiotic resistance from the native soil microorganisms by horizontal gene transfer
processes. Future studies should be conducted to evaluate the longer term importance of
antibiotic amendments on biogeochemical processes and antibiotic resistant bacteria in
soils.
66
References
Aarestrup, F. M., F. Bager, N. E. Jensen, M. Madsen, A. Meyling, and H. C. Wegener.
1998. Surveillance of antimicrobial resistance in bacteria isolated from food
animals to antimicrobial growth promoters and related therapeutic agents in
Denmark. APMIS 106:606–622.
Alleman, J. E. and K. Preston. 1991 "Behavior and Physiology of Nitrifying Bacteria,"
Proceedings of the Second Annual Conference on Commercial Aquaculture, CES
240/IL-IN-SG-E-91-8, 1-13, Illinois-Indiana Sea Grant Program, Bloomington,
IL.
Allignet, J., V. Loncle, and N. El Sohl. 1992. Sequence of a staphylococcal plasmid gene,
vga, encoding a putative ATP-binding protein involved in resistance to
virginiamycin A-like antibiotics. Gene 117:45–51.
Allignet, J., V. Loncle, C. Simenel, M. Delepierre, and N. El Sohl. 1993. Sequence of a
staphylococcal gene vat, encoding an acetyl transferaseinactivating the A-type
components of virginiamycin-like antibiotics. Gene 130:91–98.
Allignet, J., and N. El Sohl. 1997. Characterization of a new staphylococcal gene, vgaB,
encoding a putative ABC transporter conferring resistance to streptogramin A and
related compounds. Gene 202:133–138.
Almeida, J.S., M. A. M. Reis and M. J. T. Carrondo. 1995. Competition between nitrate
and nitrite reduction by denitrification by Pseudomonas fluorescens. Biotechnol
Bioeng 46:476–484.
Alwis, H. D. and D. N. Heller. 2010. Multiclass, multiresidue method for the detection of
antibiotic residues in distillers grains by liquid chromatography and ion trap
tandem mass spectrometry. Journal of Chromatography A 1217(18):3076-3084.
Baguer, A. J., J. Jensen, and P. H. Krogh. 2000. Effects of the antibiotics oxytetracycline
and tylosin on soil fauna. Chemosphere 40:751–757.
Baker-Austin, C., M. Dopson , M. Wexler, R. G. Sawers, A. Stemmler, B. P. Rosen and
P. L. Bond. 2007. Extreme arsenic resistance by the acidophilic archaeon
‘Ferroplasma acidarmanus’ Fer1. Extremophiles 11:425–434.
Batchelder, R. 1982. Chlortetracycline and oxytetracycline effects on plant growth and
development in soil systems, J. Environ. Qual. 11:675–678.
Bednar, A. J., J. R. Garbarino, I. Ferrer, D.W. Rutherford, R. L. Wershaw, J.F. Ranville,
and T. R. Wildeman. 2003. Photodegradation of roxarsone in poultry litter
leachates. The Science of the Total Environment 302:237–245.
67
Beegle, D.1997. Estimating Manure Application Rates. Agronomy facts 55. College of
Agricultural Sciences. Penn State University.
Bewick, M. and W. M. 1978. The effects of pure tylosin and tylosin fermentation waste
on the microbial activity of soil. Soil Biol. Biochem 10:403-407.
Bierman, P. M., and C. J. Rosen. 2005. Nutrient Cycling & Maintaining Soil Fertility.
Department of Soil, Water, and Climate. University of Minnesota.
Boe, B. and J. Gjerde. 1980. Fatty acid patterns in the classification of some
representatives of the families Enterobacteriaceae and Vibrionaceae. Journal of
General Microbiology 116:41-49.
Boleas, S., C. Alonso, J. Pro, M. M. Babin, C. Fernandez, G. Carbonell, and J.V.
Tarazona. 2005. Effects of sulfachlorpyridazine in MS.3-arable land: a
multispecies soil system for assessing the environmental fate and effects of
veterinary medicines. Environ Toxicol Chem 24:811–819.
Boon, P.I., 1992. Antibiotic resistance of aquatic bacteria and its implications for
limnological research. Australian Journal of Marine and Freshwater Research
43:847–859.
Boon, J. J., J. W. De Leeuw, G. J. Van der Hoek, and J. H. Vosjan. 1977. Significance
and taxonomic value of iso and anteiso monoenoic fatty acids and branched β-
hydroxy acids in Desulfovibrio desulfuricans. Journal of bacteriology 129:1183-
1191.
Boxall, A. B. A., D. W. Kolpin, B. Halling-Sørenson and J. Tolls. 2003. Are Veterinary
Medicines Causing Environmental Risks? Environmental Science and
Technology 287-294.
Brady, N. C., and R. R. Weil. 2002. Chapter 1: The soils around us; Chapter 4: Soil
architecture. In The Nature and Properties of Soils (13th Edition). Upper Saddle
River, NJ: Prentice-Hall, Inc.
Branco, R., Chung, A., and Morais, P. V. 2008. Sequencing and expression of two
arsenic resistance operons with different functions in the highly arsenic-resistant
strain Ochrobactrum tritici SCII24T. BMC Microbiology 8:95.
Britto, D. T., and H. J. Kronzucker. 2002. NH4+ toxicity in higher plants: a critical
review. J. Plant Physiol 159:567–584.
Brown, B. L. 2003. The sorption of roxarsone, an organoarsenical animal feed additive.
Blacksburg, Virginia Tech.
68
Brown, B.L., A. D. Slaughter and M.E. Schreiber. 2005. Controls on roxarsone transport
in agricultural watersheds. Applied Geochemistry 20:123-133.
Budinoff, C. R. and J. T. Hollibaugh. 2008. Arsenite-dependent photoautotrophy by an
Ectothiorhodospira-dominated consortium. The ISME Journal 2:340–343.
Butaye, P., L A. Deviese and F. Haesebrouck. 2003. Antimicrobial growth promoters
used in animal feed; effects of less well known antibiotics on Gram-positive
bacteria. American Society of Microbiology 175-188.
Carlin A., W. Shi, S. Dey, and B. P. Rosen. 1995. The ars operon of Escherichia coli
confers arsenical and antimonial resistance. J. Bacterio 177:981-986.
Cai J., K. Salmon, and M.S. DuBow. 1998. A chromosomal ars operon homologue of
Pseudomonas aeruginosa confers increased resistance to arsenic and antimony in
Escherichia coli. Microbiology 144:2705-2713.
Chander, Y., K. Kumar, S. M. Goyal, and S. C. Gupta. 2005. Antimicrobial activity of
soil-bound antibiotics. J. Environ. Qual 34:1952–1957.
Chapman, H.D. and Z. B. Johnson. 2002. Use of antibiotics and roxarsone in broiler
chickens in the USA: Analysis for the Years 1995 to 2000. Poultry Science 356-
364.
Chelossi, E., L. Vezzulli, A. Milano, M. Branzoni, M. Fabiano, Riccardi, I. M. Banat.
2003. Antibiotic resistance of benthic bacteria in fish-farm and control sediments
of the Western Mediterranean. Aquaculture 219:83–97.
Chu, B., K. W. Goyne, S. H. Anderson, C. H. Lin, and R. P. Udawatta.
2010. Veterinary antibiotic sorption to agroforestry buffer, grass buffer, and
cropland soils. Agroforest Syst 79:67–80
Clark, S., K. De-Gussem, and J. Barnes. 2003. Flagellated protozoan infections in
turkeys. World Poultry 5:20-24.
Cocito C., M. Di Giambattista, E. Nyssen, and P. Vannuffel. 1997. Inhibition of protein
synthesis by streptogamins and related antibiotics. J. Antimicrob. Chemother
39(suppl. A):7-13.
Colinas, C., E. Ingham and R. Molina. 1994. Population responses of target and non-
target forest soil organisms to selected biocides. Soil Biology and Biochemistry
26:41–47.
Costanzo, D. S., J. Murby, and J. Bates. 2005. Ecosystem response to antibiotics entering
the aquatic environment. Marine Pollution Bulletin 51:218-223.
69
Crutchfield, J. D. and H.R. Burton. 1998. Improved methods for the quantification of
nitrate in plant materials. Anal. Lett 22: 555-571.
da Gloria Britto de Oliveira, R., A. C. Wolters and J. D. van Elsas. 1995. Effects of
antibiotics in soil on the population dynamics of transposon Tn5 carrying
Pseudomonas fluorescens. Plant and Soil 175: 323-333.
Davison, J. 1999. Genetic exchange between bacteria in the environment. Plasmid 42: 73-
91.
D’Angelo, E. M., A. D. Karathanasis, E. J. Sparks, S. A. Ritchey, and S. A Wehr-
McChesney. 2005. Soil carbon and microbial communities at mitigated and late
successional bottomland forest wetlands. Wetlands 25:162–175.
Dibner, J. J. and J. D. Richards. 2005. Antibiotic Growth Promoters in Agriculture:
History and Mode of Action. Poultry Science 84:634-643.
Dumonceaux, T. J., J. E. Hill, S. M. Hemmingsen, and A. G. Van Kessel. 2006.
Characterization of intestinal microbiota and response to dietary virginiamycin
supplementation in the broiler chicken. Appl. Environ. Microbiol 72:2815–2823.
Eliopoulos, G. M. 2003. Quinupristin-Dalfopristin and Linezolid: Evidence and Opinion.
The Infectious Diseases Society of America 36:473-481.
Esiobu, N., L. Armenta, and J. Ike. 2002. Antibiotic resistance in soil and water
environments. Int. J. Environ. Health Res 12:133–144.
Federle, T. W. 1986. Microbial distribution in soil-new techniques. In F. megusar and M.
Bantar (eds.) perspectives in Microbial Ecology. Slovene Society for
Microbiology, Ljubljana, Slovenia 493-498.
Findlay, R. H., M. B. Trexler, J. B. Guckert, and D. C. White. 1990. Laboratory study of
disturbance in marine sediments: response of microbial community. Marine
Ecology Progress Series 62:121-133.
Firestone, M. K. 1982. Biological denitrification. In: Stevenson, F. J. (Ed.), Nitrogen in
agricultural soils. Agronomy 22:289-326.
Froehner, K., T. Backhaus and L. H. Grimme. 2000. Bioassays with Vibrio fischeri for
the assessment of delayed toxicity. Chemosphere 40:821–828.
Fujita, M., M. Ike, and H. Suzuki. 1993. Screening of plasmids from wastewater bacteria.
Water Research 27:949–953.
70
Furtula, V., E. G. Farrell, F. Diarrassouba, H. Rempel, J. Pritchard, and M. S. Diarra.
2010. Veterinary pharmaceuticals and antibiotic resistance of Escherichia coli
isolates in poultry litter from commercial farms and controlled feeding trials.
Poultry Science 89(1) :180-188. DOI: 10.3382/ps.2009-00198
Gansheroff, L.J. and A.D. O’Brien. 2000. Escherichia coli O157:H7 in beef cattle
presented for slaughter in the US. Higher prevalence rates than previously
estimated. PNAS 97: 2959-2961.
Garbarino , J.R., D.W. Rutherford, and R.L. Wershaw. 2001. Degradation of roxarsone in
poultry litter: In the processing of arsenic in the environment workshop. Denver,
Colorado; U.S. Geological Survey (In Press).
Garbarino J. R., A. J. Bednar, D. W. Rutherford, R. S. Beyer, and R. L. Wershaw. 2003.
Environmental Fate of Roxarsone in Poultry Litter. I. Degradation of Roxarsone
during Composting environmental Science Technology 37: 1509–1514
Gavalchin, J. and S. E. Kartz. 1994. The persistence of fecal-borne antibiotics in soil. J.
Assoc. Off Anal. Chem. Int 77:481-485.
Ghosh, S., and T. LaPara. 2007. The effects of subtherapeutic antibiotic use in farm
animals on the proliferation and persistence of antibiotic resistance among soil
bacteria. ISME J 1:191–203.
Gibbs, S. G., C. F. Green, P. M. Tarwater, L. C. Moto, K. D. Mena, and P. V. Scarpino.
2006. Isolation of antibiotic –resistance bacteria from the air plume downwind of a
swine confined or concentrated animal feeding operation. Environmental Health
Perspect 114:1032-1037.
Gomez, J., R. Mendez, and J. M. Lema. 1996. The effect of antibiotics on nitrification
processes—batch assays. Applied Biochemistry and Biotechnology 57 (8):869–
876.
Guckert, J. B., C. P. Antworth, P. D. Nochols, and D. C. White. 1985. Phospholipid,
ester-linked fatty acid profiles as reproducible assays for changes in prokaryotic
community structure of estuarine sediments. FEMS Microbiology Ecology
31:147-158.
Gustafson, R.H. and R.E. Bowen. 1997. Antibiotic use in animal agriculture. Journal of
Applied Microbiology 83: 531-541.
Hallberg, G.R. and D.R. Keeney. 1993. Nitrate. Alley, William A., ed., Regional
Ground-water Quality, Van Nostrand Reinhold, New York 297-322.
71
Halling-Sørensen, B. 2001. Inhibition of aerobic growth and nitrification of bacteria in
sewage sludge by antibacterial agents. Arch. Environ. Contam. Toxicol 40: 451–
460.
Halling-Sørensen, B., S. N. Nielsen, P. F. Lanzky, F. Ingerslev, H. C. H. Lutzhoft, S. E.
Jorgensen. 1998. Occurrence, fate and effects of pharmaceutical substances in the
environment—a review. Chemosphere 36:357–394.
Halling-Sørensen, B., G. Sengeløv, F. Ingerslev, and L. B. Jensen. 2003. Reduced
antimicrobial potentials of oxytetracycline, tylosin, sulfadiazine, streptomycin,
ciprofloxacin, and olaquindox due to environmental processes. Archives of
Environmental Contamination and Toxicology 44:7-16.
Halling-Sørensen, B., A.-M. Jacobsen, J. Jensen, G. Sengeløv, E. Vaclavik, and F.
Ingerslev. 2005. Dissipation and effects of chlortetracycline and tylosin in two
agricultural soils: a field-scale study in southern Denmark. Environ. Toxicol.
Chem 24:802–810.
Hamscher, G., H. T. Pawelzick, S. Sczesny, H. Nau, and J. Harttung. 2003. Antibiotics in
dust originating from pig fattening farm: a new source of health hazard for
farmers? Journal of the National Institute of Environmental Health Sciences.
Hammesfahr U, Heuer H, Manzke B, Smalla K, Thiele-Bruhn S. 2008. Impact of the
antibiotic sulfadiazine and pig manure on the microbial community structure in
agricultural soils. Soil Biol Biochem 40:1583–1591.
Harper, A. F., and M. J. Estienne. 2002. Efficacy of three potential alternatives to
antimicrobial feed additives for weanling pigs. Prof. Animal Scientist 18: 343-
350.
Herron, P. R., I. K. Toth, G. H. J. Heilig, A. D. L. Akkermans, A. Karagouni, and E.M.H.
Wellington. 1998. Selective effect of antibiotics on survival and gene transfer of
Streptomycetes in soil. Soil Biol. Biochem 30:673–677.
Hervey, R. J. 1955. Stimulation of soil microorganisms by antibiotics. Antibiotics &
Chemotherapy 5:96-100.
Hiscock, K.M., J. W. Lloyd and D. N. Lerner. 1991. Review of natural and artificial
denitrification of groundwater. Water Res 25:1099–1111.
Holten Lőtzhøft, H. C., B. Halling-Sørenson and S.E. Jørgensen. 1999. Algal toxicity of
antibacterial agents applied in Danish fish farming. Arch. Environ. Contam.
Toxicol 36:1-6.
Hou, J. P. and J. W. Poole. 1969. The amino acid nature of ampicillin and related
penicillins. J. Pharm. Sci 58:1510–1515.
72
Huang, C. H., J. E Renew , K. L. Smeby, K. Pinkston, and D. L. Sedlak. 2001.
Assessment of potential antibiotic contaminants in water and preliminary
occurance analysis. Water Resources Update 120:30-40.
Huys, G., G. Rhodes, P. McGann, R. Denys, R. Pickup, M. Hiney, P. Smith, J. Swings.
2000. Characterization of oxytetracycline - resistant heterotrophic bacteria
originating from hospital and freshwater fishfarm environments in England and
Ireland. Systematic and Applied Microbiology 23:599–606.
Ingerslev, F. and B. Halling-Sørrensen. 2001. Biodegradability of metronidazole,
olaquindox, and tylosin and formation of tylosin degradation products in aerobic
soil-manure slurries. Ecotoxical. Environ. Sat 48:311-320.
Jagnow G. 1977. Mikrobieller Abbau der Futtermittelantibiotica Zink-Bactracin,
Flavophospholipol, Spiramycin und von Tetracyclin in feucht gelagerten und in
mit Boden vermischten Hühnerkot. Landwirtsch Forsch 1:227-234.
Jensen, L. B, S. Baloda, M. Boye, and F. M. Aarestrup. 2001. Antimicrobial resistance
among Pseudomonas spp. and the Bacillus cereus group isolated from Danish
agricultural soil. Environment International 26:581-587.
Jensen, J., P. H. Krogh, and L. E. Sverdrup. 2003. Effects of the antibacterial agents
tiamulin, olanquindox and metronidazole and the anthelmintic ivermectin on the
soil invertebrate species Folsomia fimetaria (Collembola) and Enchytraeus
crypticus (Enchytraeidae). Chemosphere 50:437–443.
JEFCA. 2006. Summary of evaluations performed by the JEFCA (1956–2005) (1st
through 65th meetings). Joint Food and Agriculture Organization of the United
Nations and World Health Organization Expert Committee on Food Additives.
FAO, Rome; WHO, Geneva, Switzerland. Available at
http://jecfa.ilsi.org/index.htm (verified 2 Apr. 2007).
Jianping, W., P. L. H. Wei, D. Liping and M. Guozhu. 2003. The denitrification of nitrate
contained wastewater in a gas–liquid–solid three-phase flow airlift loop
bioreactor. Biochemical Engineering Journal 15:153–157.
Johnson, B.A., H. Anker and F. L. Meleney. 1945. Bacitracin: a new antibiotic produced
by a member of B. subtilis group. Science 102:376–377
Kaneda, T. 1991. Iso-fatty acid and anteiso-fatty acids in bacteria: biosynthesis, function,
and taxonomic significance. Microbiological Reviews 55:288-302.
Kang, J., G. D. Reymaeker, A. V. Schepdael, E. Roets, and J. Hoogmartens. 2001.
Analysis ofbacitracin by micellar electrokinetic capillary chromatography with
mixed micelle in acidic solution. Electrophoresis 22:1356–1362.
73
Kentucky Poultry Federation. 2010. http://www.kypoultry.org/pfacts/
Knowles, R. 1982. Denitrification. Microbiol Rev 46:43–70.
Kumar, K., S.C. Gupta, S.K. Baidoo, Y. Chander, and C.J. Rosen. 2005(a). Antibiotic
uptake by plants from soil fertilized with animal manure. J. Environ. Qual
34:2082–2085.
Kumar, K., Gupta, S.C., Chander, Y, and A.K. Singh. 2005(b). Antibiotic use in
agriculture and its impact on the terrestrial environment. Advances in Agronomy
87:1-54.
Kőmmerer, K. 2003. Significance of antibiotics in the environment. Journal of
Antimicrobial Chemotherapy 52: 5-7.
Kümmerer, K. 2008. Pharmaceuticals in the Environment – A Brief Summary.
Krutz L.J., S. A. Senseman, R. M. Zablotowicz, and M. A. Matocha. 2005. Reducing
herbicide runoff from agricultural fields with vegetative filter strips: a review.
Weed Sci 53:353–367.
Leclercq, R., and P. Courvalin. 1991. Bacterial resistance to macrolide, lincosamide, and
streptogramin antibiotics by target modification. Antimicrobial. Agents
Chemotherapy 35:1267–1272.
Maliszewska-Kordybach, B., A. Klimkowicz-Pawlas, and B. Smreczak. 2007. Ecotoxic
effect of phenanthrene on nitrifying bacteria in soils of different properties. J.
Environmental Quality 36:1635–1645
Manson, J. M., S. Keis, J. M. B. Smith, and G. M. Cook. 2004 (a). Acquired bacitracin
resistance in Enterococcus faecalis is mediated by an ABC transporter and a
novel regulatory protein, BcrR. American Society for Microbiology 48:3743-
3748.
Manson, J. M., J. M . B . Smith, and G. M . Cook. 2004 (b). Persistence of Vancomycin-
Resistant Enterococci in New Zealand Broilers after Discontinuation of
Avoparcin Use. Applied and Environmental Microbiology 70:5764-5768.
Makris, K.C., J. Salazar, S. Quazi, S. Andra, D. Sarkar, S.B.H. Bach, and R. Datta. 2008.
Controlling the fate of roxarsone and inorganic arsenic in poultry litter. J.
Environ. Qual 37:963–971.
Mazel, D. and J. Davies. 1999. Antibiotic resistance in microbes. Journal of Cellular and
Molecular Life. Sciences 56:742-754.
74
Mehlich, A. 1984. Mehlich 3 soil test extractant: A modification of Mehlich 2 extractant.
Comm. Soil Sci. Plant An 15: 1409-1416.
Mellon, M., C. Benbrook, and K. L. Benbrook. 2001. Hogging It: Estimates of
antimicrobial abuse in livestock. Union of concerned scientists, Cambridge, MA.
(www.ucsusa.org).
Muir, L. A. 1985. Mode of action of exogenous substances on animal growth-an
overview. Journal of Animal Sciences Vol. 61.
Norman, A.G., 1955. Terramycin and plant growth. Agronomy Journal 47:585–587.
Oldfield, E.C. 2003. The road to resistance: antibiotics as growth promoters for animals.
World Literature Review 499.
O’Leary, W. M. and S. G. Wilkinson. 1988. Gram-positive bacteria.. In C. Ratledge and
S. G. Wilkinson (eds.) Microbial Lipids. Academic press, New York, NY, USA
1:117-201.
Onan L, and T . LaPara. 2003. Tylosin-resistant bacteria cultivated from agricultural soil.
FEMS Toxicology Lettet 220:15-20.
Park, K. S., C. B. Khan, P. Rettberg, G. Horneck, E. Rabbow, M. B. Gu. 2005.
Immobilization as a technical possibility for long-term storage of bacterial
biosensors Radiat Environ Biophys 44: 69–71.
Parkes, R. J. and J. Taylor. 1983. The relationship between fatty acid distribution and
bacterial respiratory types in contemporary marine sediments. Estuarine, Coastal
and Shelf Science 16:173-189.
Patten, D. K., D. C. Wolf, W. E. Kunkle and L.W. Douglas. 1980. Effect of antibiotics in
beef cattle feces on nitrogen and carbon mineralization in soil and on plant growth
and composition. J. Environ. Qual 9:167–172.
Pedroso, A. A., J. F. Menten, M. R. Lambais, A. M. Racanicci, F. A. Longo, and J. O.
Sorbara. 2006. Intestinal bacterial community and growth performance of
chickens fed diets containing antibiotics. Poult. Sci 85:747–752.
Phillips, I. 1999. The use of bacitracin as a growth promoter in animals produces no risk
to human health. Journal of Antimicrobial Chemotherapy 44: 725-728.
Pinck, L.A., W. F. Holton and F. E. Allison. 1961. Antibiotics in soils: 1. Physico-
chemical studies of antibiotic-clay complexes, Soil Science 91:22–28.
75
Pramer, D. and R. L. Starkey. 1952. Influence of streptomycin on microbial development
in soil. Bacteriol. Proc. Boston, Massachusetts p. 15.
Pramer, D. 1958. The persistence and biological effects of antibiotics in soil. Appl.
Microbiol 6:221-224.
Quastel, J. H. and, P. G. Scholefield. 1951. Biochemistry of nitrification in soil.
Bacteriol. Revs 15:1-53.
Ratledge, C. and S. G. Wilkinson. 1988. Microbial Lipids. Academic press, London,
England.
Rende-Fournier, R., R. Leclercq, M. Galimard, J. Duval, and P. Courvalin. 1993.
Identification of the satA gene encoding a streptogramin A acetyltransferase in
Enterococcus faecium BM4145. Journal of Antimicrobial Agents Chemotherapy
37:2119–2125.
Roberts, M. C., J. Sutcliffe, P. Courvalin, L. B. Jensen, J. Rood, and H. Seppala. 1999.
Nomenclature for macrolide and macrolide-lincosamidestreptogramin B
resistance determinants. Journal of Antimicrobial Agents Chemotherapy 43:2823–
2830.
Robinson, H.J. 1952. General pharmacology of antibiotics, Annals of New York
Academy of Sciences 55 (6):970–982.
Rosander, A., E. Conolly, and S. Roos. 2008. Removal of antibiotic resistance gene-
carrying plasmids from Lactobacillus reuteri ATCC 55730 and characterization of
the resulting daughter strain, L. reuteri DSM 17938. Appl Environ Microbiol 74:
6032-6040.
Sarmah A. K., M. T. Meyer, and A. B.A. Boxall. 2006. A global perspective on the use,
sales, exposure pathways, occurrence, fate and effects of veterinary antibiotics
(VAs) in the environment. Chemosphere 65:725-759.
Sasser, M. 1990. Identification of bacteria by gas chromatography of cellular fatty acids.
Tech. Note #101. Microbial ID, Newark, DE.
Schutter, M. E., and R. P. Dick. 2000. Comparison of fatty acid methyl ester (FAME)
methods for characterizing microbial communities. Soil Sci. Soc. Am. J 64:1659–
1668.
Swick, R. A. 1996. Role of growth promotants in poultry and swine feed. ASA technical
Bulletin Vol. AN04.
76
Stone, K. J., and J. L. Strominger. 1971. Mechanism of action of bacitracin:
complexation with metal ion and C55-isoprenyl pyrophosphate. Proceedings of
Natural Academy of Sciences USA 68:3223-3227.
Thiele-Bruhn, S. 2003. Pharmaceutical antibiotic compounds in soils—a review. Journal
Plant Nutrition 166:145–16.
Thiele-Bruhn, S., T. Seibicke, H.-R. Schulten, and P. Leinweber. 2004. Sorption of
sulfonamide pharmaceutical antibiotics at whole soils and particle-size fractions, J.
Environ. Qual 33:1331–1342.
Thiele-Bruhn, S. 2005. Microbial inhibition by pharmaceutical antibiotics in different
soils-Dose-response relations determined with the iron (III) reduction test,
Environmental Toxicology and Chemistry 4:869–876.
Thiele-Bruhn, S., and I.-C. Beck. 2005. Effects of sulfonamide and tetracycline
antibiotics on soil microbial activity and microbial biomass. Chemosphere
59:457–465.
Thomas, K. L. D. Lloyd and L. Boddy. 1994. Effects of oxygen, pH and nitrate
concentration on denitrification by Pseudomonas species. FEMS Microbiology
Letters 118: 181–186.
Thomashow, L. S., R.F. Bonsall and D.M. Weller. 2002. Antibiotic production by soil
and rhizosphere microbes In Situ. Manual of Environmental Microbiology (2nd
Edition) Washington, DC: ASM press.
Tolls, J. 2001. Sorption of veterinary pharmaceuticals in soil:A review. Environ. Sci.
Technol 35:3397-3406.
United States Department of Agriculture (USDA). 1997. The data on manure production
in the US (www.ers.usda.gov/data/manure).
Urbain, V., J. Block, and C. J. Manem.1993. Bioflocculation in activated sludge: an
analytic approach. Water Res 27:829–838.
USDA Economic Research Service. 2007. Data on poultry production in the US.
US Food and Drug Administration (US-FDA). 1998. BMD®, type A medicated article
for chicken, turkey, swine, cattle, pheasant and quail (Bacitracin Methylene
Disalicylate). NADA 046-592.
US Food and Drug Administration (US-FDA). 1979. Soluble Fortracin Concentrate for
Chicken and Turkey Bacitracin Methylene Disalicylate. NADA 065-280.
77
Vahidnia, A., G. B. van der Voet, and F. A. de Wolff. 2007. Arsenic neurotoxicity-A
review. SAGE Publication.
van den Bogaard, A. E., P. Mertens, N. H. London, and E. E. Stobberingh. 1997. High
prevalence of colonization with vanomycin- and pristinamycin-resistant
enterococci in healthy humans and pigs in The Netherlands: is the addition of
antibiotics to animal feeds to blame? Journal of Antimicrobial Chemotherapy
40:454-456.
Van-Faassen, H.G., and H. Van Dijk. 1987. Manure as a source of nitrogen and
phosphorus in soils. In: Van der Meer HG, Unwin RJ, Van Dijk TA, Ennik GC
(eds) Animal manure on grassland and fodder crops. Fertiliser or waste. Nijhoff,
Dordrecht. pp 27–45.
Vellidis, G., R. Lowrance, P. Gay, and R. K. Hubbard. 2003. Nutrient transport in a
restored riparian wetland. Journal of Environmental Quality 32:711–26.
Vestal, J. R. and D. C. White. 1989. Lipid analysis in microbial ecology: Quantitative
approaches to the study of microbial communities. Bioscience 39:535-541.
Volmer, D. A. and J. P. M. Hui. 1998. Study of Erythromycin A Decomposition Products
in Aqueous Solution by Solid-Phase Microextraction/Liquid
Chromatography/Tandem Mass Spectrometry. Rapid Communications in Mass
Spectrometry 12:123-129.
Wang, L., J. Byeonghwa, O. Sahin and Q. Zhang. 2009. Identification of an Arsenic
Resistance and Arsenic-Sensing System in Campylobacter jejuni. Applied and
Environmental Microbiology 75(15):5064-5073.
Warman, P.R., 1980. The effect of amprolium and auromycin antibiotics on the
nitrification of poultry manure-amended soil. J. Soil Sci. Soc. Am 44:1333–1334.
Web-soil survey. 2010. Soil Data.
http://websoilsurvey.nrcs.usda.gov/app/WebSoilSurvey.aspx
Weerasinghe, C. A. and D. Towner. 1997. Aerobic biodegradation of virginiamycin in
soil. Environmental Toxicology and Chemistry 16(9):1873-1876.
Wegener, H. C., F. M. Aarestrup, L. B. Jensen, A. M. Hammerum and F. Bager. 1999.
Use of antimicrobial growth promoters in food animals and Enterococcus faecium
resistance to therapeutic antimicrobial drugs in Europe. Emergence Infectious
Diseases 5:329-35.
Wershaw, R.L., J. R. Garbarino, and M. R. Burkhardt. 1999. Roxarsone in Natural Water
Systems, p. 95. In F.D. Wilde, L.J. Britton, C.V. Miller, and D.W. Kolpin (comps.
Effects of animal feeding operations on water resources and the environment —
78
proceedings of the technical meeting, Fort Collins, Colorado, August 30-
Septembe 1, 1999: U.S. Geological Survey Open-File Report 00-204.
Werner, G., and W. Witte. 1999. Characterization of a new enterococcal gene, satG,
encoding a putative acetyltransferase conferring resistance to streptogramin A
compounds. Antimicrobial Agents Chemotherapy 43:1813–1814.
Westergaard, K., A. K. Muller, S. Christensen, J, Bloem and S. J. Sorensen. 2001. Effects
of tylosin as a disturbance on the soil microbial community. Journal of Soil Biology
& Biochemistry 33:2061-2071.
White, J. R. and K. R. Reddy. 1999. Influence of nitrate and phosphorous loading on
denitrifying enzyme activity in everglades wetland soils. Soil Sci. Soc. Am. J
63:1945-1954.
Wise, M. G., and G. R. Siragusa. 2007. Quantitative analysis of the intestinal bacterial
community in one- to three-week-old commercially reared broiler chickens fed
conventional or antibiotic- free vegetable-based diets. J. Appl. Microbiol
102:1138–1149.
World Health Organization. 2004. Proceedings of the Joint FAO/OIE/WHO expert
workshop on non-human antimicrobial usage and antimicrobial resistance:
Scientific assessment. Pages 1–71 in Document WHO/CDS/DIP/ZFK/04.20.
World Health Organization, Geneva, Switzerland.
Wrage, N., G. L. Velthof, M. L. van Beusichem, and O. Oenema. 2001. Role of nitrifier
denitrification in the production of nitrous oxide. Soil Biology &
Biogeochemistry 33:1723-1732.
Yang H-C, J. Cheng, T. M. Finan, B. P. Rosen, and H. Bhattacharjee. 2005. Novel
pathway for arsenic detoxification in the legume symbiont Sinorhizobium meliloti.
J Bacteriol 187:6991–6997.
Zuccato, E., R. Bagnati, F. Fioretti, M. Natangelo, D. Calamari, and R. Fanelli. 2001.
Environmental loads and detection of pharmaceuticals in Italy. In: Kummerer, K.
(Ed.), Pharmaceuticals in the environment. Springer-Verlag, Berlin, Heidelberg,
Germany pp 19-27.
79
Vita
Sagarika Banerjee
Date and place of birth
August 15, 1980; Burdwan, West Bengal, India.
Education
Bachelor of Science in Genetics, Garden City College, Bangalore University,
India, 2000-2003
Master of Science in Biotechnology, Capital College, Bangalore University,
India, 2003-2005
Professional Positions
Part-time Lecturer, Department of Biotechnology, Cyber Research and Training
Institute, India – 05/2005-04/2006
Gradauate Research Assistant at the University of Kentucky, Department of Plant
and Soil Sciences, 2008-2009
Graduate Teaching Assistant at the University of Kentucky, Department of Plant
and Soil Sciences, Spring-2010 (PLS-366)
Professional publication
Banerjee, S. and D’Angelo, E., 2009. Effects of Livestock Antibiotics on
Nitrification and Denitrification in Soils along a Topographic Gradient. Abstract.
Southern Association of Agricultural Scientists, Atlanta, GA
80
Recommended