Dow
nloa
ded
from
asc
elib
rary
.org
by
Cur
tin U
niv
of T
echn
olog
y 20
09 o
n 10
/06/
12. F
or p
erso
nal u
se o
nly.
No
othe
r us
es w
ithou
t per
mis
sion
. Cop
yrig
ht (
c) 2
012.
Am
eric
an S
ocie
ty o
f C
ivil
Eng
inee
rs. A
ll ri
ghts
res
erve
d.
Effects of Groundwater Table Position and Soil Propertieson Stability of Slope during Rainfall
Harianto Rahardjo1; Alfrendo Satyanaga Nio2; Eng Choon Leong3; and Ng Yew Song4
Abstract: Rainfall, hydrological condition, and geological formation of slope are important contributing factors to slope failures.Parametric studies were carried out to study the effect of groundwater table position, rainfall intensities, and soil properties in affectingslope stability. Three different groundwater table positions corresponding to the wettest, typical, and driest periods in Singapore and fourdifferent rainfall intensities �9, 22, 36, and 80 mm/h� were used in the numerical analyses. Typical soil properties of two main residualsoils from the Bukit Timah Granite and the sedimentary Jurong Formation in Singapore were incorporated into the numerical analyses.The changes in factor of safety during rainfall were not affected significantly by the groundwater table near the ground surface due to therelatively small changes in matric suction during rainfall. A delay in response of the minimum factor of safety due to rainfall and a slowerrecovery rate after rainfall were observed in slopes from the sedimentary Jurong Formation as compared to those slopes from the BukitTimah Granite. Numerical analyses of an actual residual soil slope from the Bukit Timah Granite at Marsiling Road and a residual soilslope from the sedimentary Jurong Formation at Jalan Kukoh show good agreement with the trends observed in the parametric studies.
DOI: 10.1061/�ASCE�GT.1943-5606.0000385
CE Database subject headings: Rainfall intensity; Groundwater; Water table; Residual soils; Permeability; Shear strength; Slopestability; Soil properties.
Author keywords: Rainfall intensity; Groundwater table; Residual soils; Matric suction; Permeability; Shear strength; Slope stability.
Introduction
Many slope failures around the world, particularly in regions withresidual soils, occurred due to changes in unsaturated soil condi-tion as a result of frequent heavy rainfalls. Matric suction or nega-tive pore-water pressure plays an important role in the stability ofthese slopes �Fredlund and Rahardjo 1993�. A deep groundwatertable and a significant thickness of unsaturated zone above thegroundwater table are general characteristics of steep residual soilslopes. In tropical and subtropical areas, rainfall-induced slopefailures are closely related to the properties of the soil, the geom-etry of the slope, the position of groundwater table, and certainenvironmental factors �vegetation and weathering effects�.
Previous research works have shown that rainfall is the maincontributing factor of slope failures in Singapore �Brand 1984;
1Professor and Head of Div., School of Civil and EnvironmentalEngineering, Nanyang Technological Univ., Blk N1, No. 1B-36, NanyangAve., Singapore 639798, Singapore �corresponding author�. E-mail:[email protected].
2Project Officer, School of Civil and Environmental Engineering,Nanyang Technological Univ., Singapore 639798, Singapore. E-mail:[email protected]
3Associate Professor, School of Civil and Environmental Engineering,Nanyang Technological Univ., Blk N1, No. 1C-80, Nanyang Ave.,Singapore 639798, Singapore. E-mail: [email protected]
4Deputy Director and Professional Engineer, Dept. of Building Tech-nology, Housing and Development Board, HDB Hub 480, Lorong 6, ToaPayoh, Singapore 310480, Singapore. E-mail: [email protected]
Note. This manuscript was submitted on April 29, 2009; approved onFebruary 19, 2010; published online on May 11, 2010. Discussion periodopen until April 1, 2011; separate discussions must be submitted forindividual papers. This paper is part of the Journal of Geotechnical andGeoenvironmental Engineering, Vol. 136, No. 11, November 1, 2010.
©ASCE, ISSN 1090-0241/2010/11-1555–1564/$25.00.JOURNAL OF GEOTECHNICAL AND GEOE
J. Geotech. Geoenviron. Eng.
Tan et al. 1987; Chatterjea 1989; Lim et al. 1996; Toll et al. 1999;Rahardjo et al. 2007a,b�. The last heavy rainfall between Decem-ber 2006 and January 2007 caused a number of slope failures inSingapore. Almost all of the slope failures occurred in residualsoils from the Bukit Timah Granite �BT� and the sedimentaryJurong Formation �JF� �Rahardjo et al. 2007a�.
Numerical analyses of rainfall-induced slope failures havebeen carried out to study the controlling parameters �Gasmo et al.2000; Tsaparas et al. 2002; Rahardjo et al. 2005, 2007a,b� andthe effects of antecedent rainfall on rainfall-induced slope failures�Rahardjo et al. 2001, 2008�. Cho and Lee �2002� indicated thatmost shallow slope failures were caused by the advancement ofa wetting front into the slope. Ng et al. �2001� conducted three-dimensional numerical analyses of groundwater response to rain-fall and found that rainfall pattern, duration, and its return periodhave major influences on the changes in pore-water pressuresin unsaturated cut slopes. Tohari et al. �2007� conducted a labo-ratory study of slopes under rainfalls and observed that shallownoncircular slip was the dominant mode for rainfall-induced slopefailures.
In this paper, parametric studies were performed to study theeffect of position of groundwater table, rainfall intensity, and soilproperties on the stability of slope. The observation was focusedon the residual soils from the BT and the sedimentary JF in Sin-gapore. Numerical analyses of existing slopes were comparedwith the results from the parametric studies.
Slope Observation
Two-thirds of Singapore consist of two major formations, the BTand the sedimentary JF �PWD 1976�. BT underlies the Bukit
Timah nature reserve and the central catchment area in the centerNVIRONMENTAL ENGINEERING © ASCE / NOVEMBER 2010 / 1555
2010.136:1555-1564.
Dow
nloa
ded
from
asc
elib
rary
.org
by
Cur
tin U
niv
of T
echn
olog
y 20
09 o
n 10
/06/
12. F
or p
erso
nal u
se o
nly.
No
othe
r us
es w
ithou
t per
mis
sion
. Cop
yrig
ht (
c) 2
012.
Am
eric
an S
ocie
ty o
f C
ivil
Eng
inee
rs. A
ll ri
ghts
res
erve
d.
of the island. Sedimentary rocks of the JF, which contain varia-tions of conglomerate, shale, and sandstone, are located in thesouthern, southwestern, and western parts of Singapore. Climaticconditions in Singapore are characterized by uniform tempera-ture, high humidity, and particularly, abundant rainfalls. The rainyseason can be divided into two main seasons, the wetter NortheastMonsoon season from December to March and the drier South-west Monsoon season from June to September �National Environ-ment Agency 2007�. During the Northeast Monsoon season,moderate to heavy rainfalls usually occur between December andJanuary. Maximum rainfall usually occurs between December andJanuary, whereas July is noted as the driest month �National En-vironment Agency 2007�.
Several slopes located at the residual soil slopes from the BTand the sedimentary JF were investigated to obtain information ontypical soil properties, slope geometry, and position of ground-water table for both formations. The investigated slopes had aslope angle and a slope height varying from 15° to 40° and from5 to 42 m, respectively.
Location and Geometry of Slopes
Six slopes were selected from two different geological formationsin Singapore. Ang Mo Kio St. Twenty-one �AMK�, ThomsonRoad �TR�, and Marsiling Road �MR� slopes are located inthe BT, while Bukit Merah View �BM�, Jalan Kukoh �JK�, andHavelock Road �HR� slopes are located in the JF �Fig. 1�. Soilsampling was performed using continuous foam drilling with aMazier sampler to obtain good quality samples. Laboratory testswere then carried out to obtain saturated and unsaturated hydrau-lic properties and shear strength of the investigated soils. Soilprofiles of the observed slopes could then be constructed. Theunsaturated laboratory tests included soil-water characteristiccurve �SWCC� tests and unsaturated triaxial tests for obtainingunsaturated shear-strength parameters.
Positions of Groundwater Table
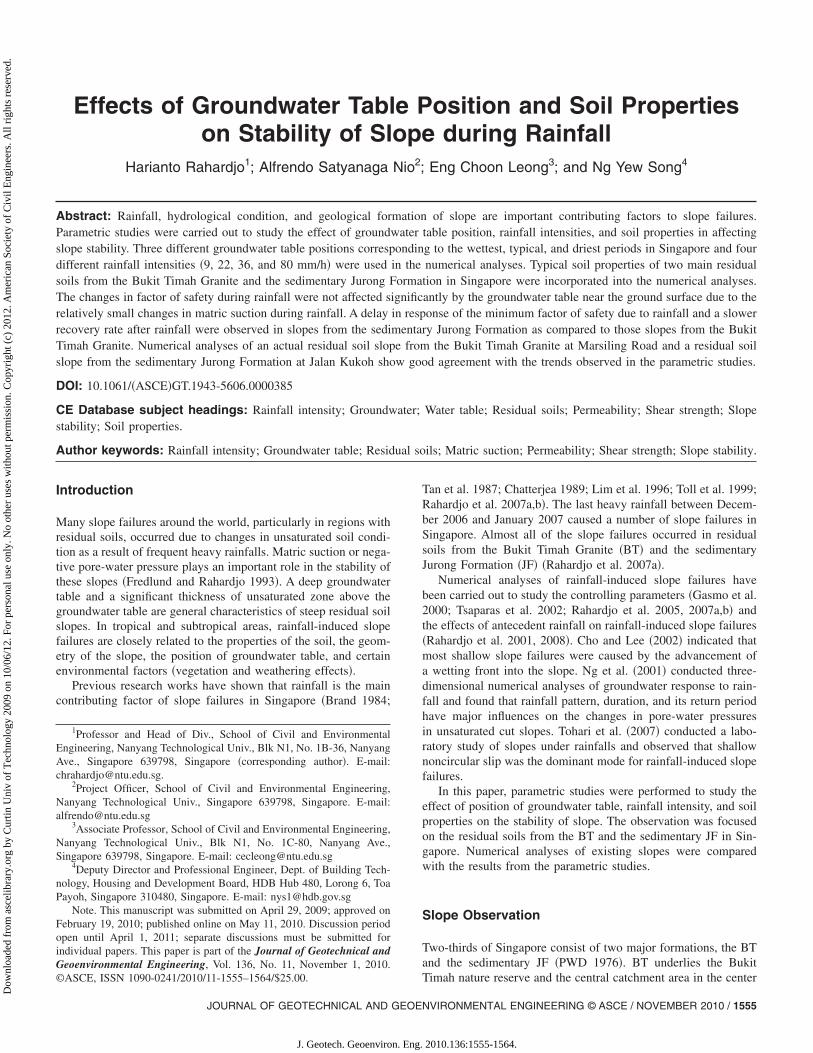
The investigated slopes were instrumented with at least two pi-ezometers to monitor the position of groundwater table. Manualmonitoring of the Casagrande piezometers for all slopes was car-ried out over a 2-year period �June 2006 until September 2008�.Variations of groundwater table positions for the driest and wet-test periods are shown in Figs. 2 and 3 in the residual soil slopesfrom BT and JF, respectively. The average positions of ground-water table, representing its typical position in residual soil slopesin Singapore, were calculated based on the minimum position of
Fig. 1. Location of instrumented slopes in Singapore
1556 / JOURNAL OF GEOTECHNICAL AND GEOENVIRONMENTAL ENGIN
J. Geotech. Geoenviron. Eng.
groundwater table during the dry period and the maximum posi-tion of groundwater table during the wet period �Figs. 2 and 3�.The symbol � in Figs. 2 and 3 represents the distance of thepiezometers �P1 and P2� measured from the crest of slope, whilethe symbol h corresponds to the depth of groundwater table fromthe slope surfaces. Slope vertical heights and slope horizontallengths were denoted as H and L, respectively.
Figs. 2 and 3 show that the groundwater table of the JF slopewas generally deeper than that of the BT slope during dry and wetperiods. However, the groundwater table of the JF slope indicateda larger difference between dry and wet periods as compared tothat of the BT slope. This condition may be attributed to the largevariability of soil types in the JF residual soil that was derivedfrom the sedimentary rocks of different variations from conglom-erate to shale, siltstone, and sandstone. On the other hand, the BTresidual soil was derived mainly from the same granitic rock ofBukit Timah formation.
Soil Properties of Investigated Slopes
SWCCs
SWCC tests were performed using Tempe cell and pressure plate.Matric suction up to 500 kPa was applied to several specimens of
Fig. 2. Variation of groundwater table position for the residual soilslopes from BT
Fig. 3. Variation of groundwater table position for the residual soilslopes from JF
EERING © ASCE / NOVEMBER 2010
2010.136:1555-1564.
Dow
nloa
ded
from
asc
elib
rary
.org
by
Cur
tin U
niv
of T
echn
olog
y 20
09 o
n 10
/06/
12. F
or p
erso
nal u
se o
nly.
No
othe
r us
es w
ithou
t per
mis
sion
. Cop
yrig
ht (
c) 2
012.
Am
eric
an S
ocie
ty o
f C
ivil
Eng
inee
rs. A
ll ri
ghts
res
erve
d.
the BT and the JF residual soils taken from various depths. TheSWCCs of the investigated soils were plotted in terms of normal-ized volumetric water content �w versus matric suction ua−uw.The normalized volumetric water content can be defined withrespect to the residual water content of the soil as follows:
�w =�w − �r
�s − �r�1�
where �w=normalized volumetric water content; �w=volumetricwater content at particular matric suction; �r=residual volumetricwater content; and �s=saturated volumetric water content.
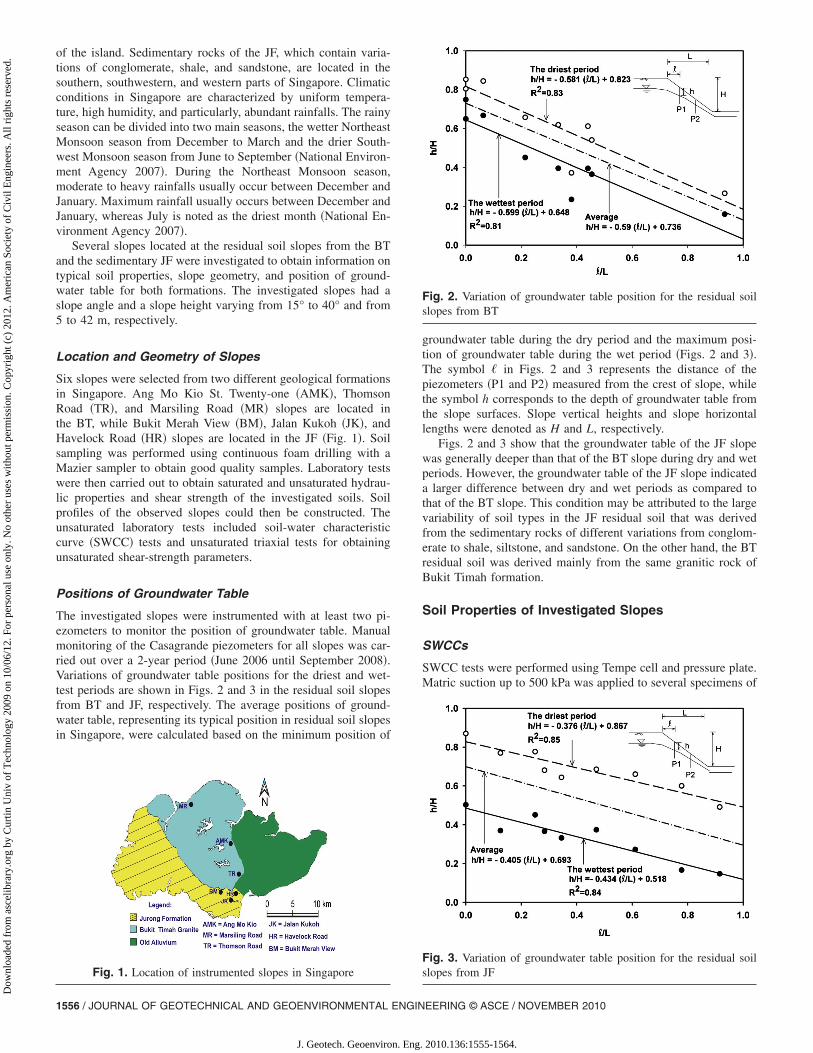
The SWCCs from two soil layers of Ang Mo Kio �AMK1and AMK2�, two soil layers of Thomson Road �TR1 and TR2�,and one soil layer of Marsiling Road �MR1� slopes were collatedwith the SWCC data of the BT residual soils of Agus et al.�2001�. The normalized SWCC data of the BT residual soils areshown in Fig. 4.
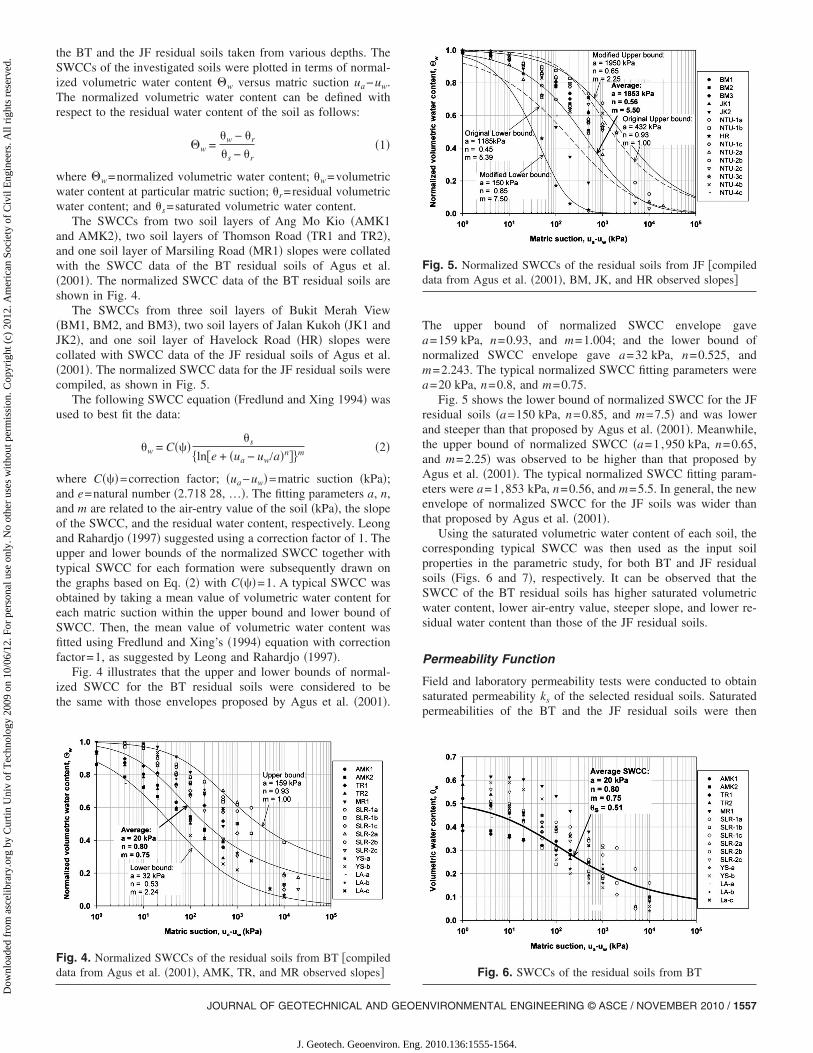
The SWCCs from three soil layers of Bukit Merah View�BM1, BM2, and BM3�, two soil layers of Jalan Kukoh �JK1 andJK2�, and one soil layer of Havelock Road �HR� slopes werecollated with SWCC data of the JF residual soils of Agus et al.�2001�. The normalized SWCC data for the JF residual soils werecompiled, as shown in Fig. 5.
The following SWCC equation �Fredlund and Xing 1994� wasused to best fit the data:
�w = C����s
�ln�e + �ua − uw/a�n��m �2�
where C���=correction factor; �ua−uw�=matric suction �kPa�;and e=natural number �2.718 28, …�. The fitting parameters a, n,and m are related to the air-entry value of the soil �kPa�, the slopeof the SWCC, and the residual water content, respectively. Leongand Rahardjo �1997� suggested using a correction factor of 1. Theupper and lower bounds of the normalized SWCC together withtypical SWCC for each formation were subsequently drawn onthe graphs based on Eq. �2� with C���=1. A typical SWCC wasobtained by taking a mean value of volumetric water content foreach matric suction within the upper bound and lower bound ofSWCC. Then, the mean value of volumetric water content wasfitted using Fredlund and Xing’s �1994� equation with correctionfactor=1, as suggested by Leong and Rahardjo �1997�.
Fig. 4 illustrates that the upper and lower bounds of normal-ized SWCC for the BT residual soils were considered to bethe same with those envelopes proposed by Agus et al. �2001�.
Fig. 4. Normalized SWCCs of the residual soils from BT �compileddata from Agus et al. �2001�, AMK, TR, and MR observed slopes�
JOURNAL OF GEOTECHNICAL AND GEOE
J. Geotech. Geoenviron. Eng.
The upper bound of normalized SWCC envelope gavea=159 kPa, n=0.93, and m=1.004; and the lower bound ofnormalized SWCC envelope gave a=32 kPa, n=0.525, andm=2.243. The typical normalized SWCC fitting parameters werea=20 kPa, n=0.8, and m=0.75.
Fig. 5 shows the lower bound of normalized SWCC for the JFresidual soils �a=150 kPa, n=0.85, and m=7.5� and was lowerand steeper than that proposed by Agus et al. �2001�. Meanwhile,the upper bound of normalized SWCC �a=1,950 kPa, n=0.65,and m=2.25� was observed to be higher than that proposed byAgus et al. �2001�. The typical normalized SWCC fitting param-eters were a=1,853 kPa, n=0.56, and m=5.5. In general, the newenvelope of normalized SWCC for the JF soils was wider thanthat proposed by Agus et al. �2001�.
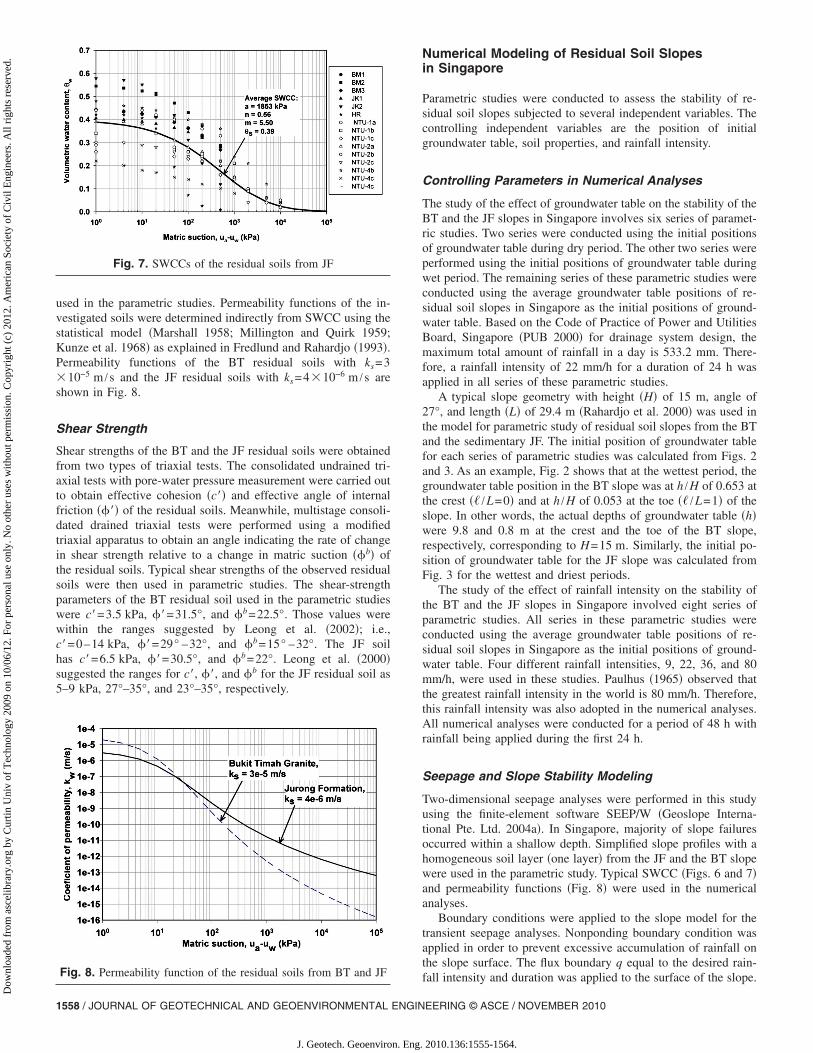
Using the saturated volumetric water content of each soil, thecorresponding typical SWCC was then used as the input soilproperties in the parametric study, for both BT and JF residualsoils �Figs. 6 and 7�, respectively. It can be observed that theSWCC of the BT residual soils has higher saturated volumetricwater content, lower air-entry value, steeper slope, and lower re-sidual water content than those of the JF residual soils.
Permeability Function
Field and laboratory permeability tests were conducted to obtainsaturated permeability ks of the selected residual soils. Saturatedpermeabilities of the BT and the JF residual soils were then
Fig. 5. Normalized SWCCs of the residual soils from JF �compileddata from Agus et al. �2001�, BM, JK, and HR observed slopes�
Fig. 6. SWCCs of the residual soils from BT
NVIRONMENTAL ENGINEERING © ASCE / NOVEMBER 2010 / 1557
2010.136:1555-1564.
Dow
nloa
ded
from
asc
elib
rary
.org
by
Cur
tin U
niv
of T
echn
olog
y 20
09 o
n 10
/06/
12. F
or p
erso
nal u
se o
nly.
No
othe
r us
es w
ithou
t per
mis
sion
. Cop
yrig
ht (
c) 2
012.
Am
eric
an S
ocie
ty o
f C
ivil
Eng
inee
rs. A
ll ri
ghts
res
erve
d.
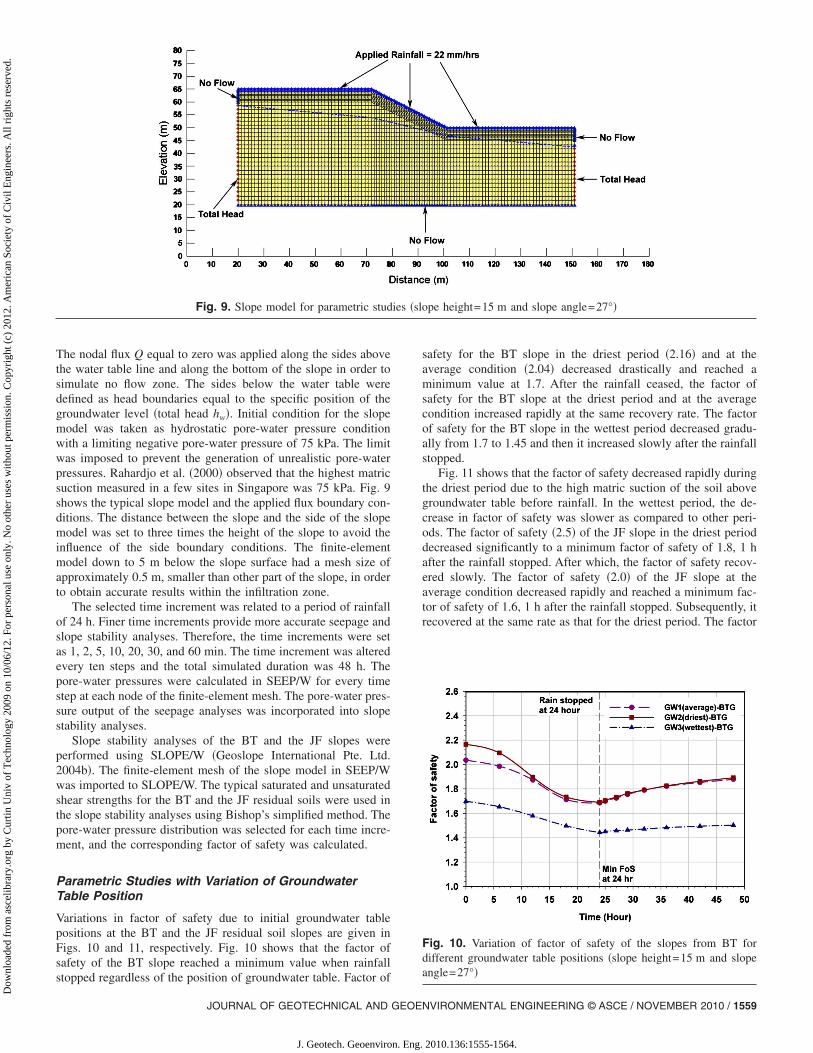
used in the parametric studies. Permeability functions of the in-vestigated soils were determined indirectly from SWCC using thestatistical model �Marshall 1958; Millington and Quirk 1959;Kunze et al. 1968� as explained in Fredlund and Rahardjo �1993�.Permeability functions of the BT residual soils with ks=3�10−5 m /s and the JF residual soils with ks=4�10−6 m /s areshown in Fig. 8.
Shear Strength
Shear strengths of the BT and the JF residual soils were obtainedfrom two types of triaxial tests. The consolidated undrained tri-axial tests with pore-water pressure measurement were carried outto obtain effective cohesion �c�� and effective angle of internalfriction ���� of the residual soils. Meanwhile, multistage consoli-dated drained triaxial tests were performed using a modifiedtriaxial apparatus to obtain an angle indicating the rate of changein shear strength relative to a change in matric suction ��b� ofthe residual soils. Typical shear strengths of the observed residualsoils were then used in parametric studies. The shear-strengthparameters of the BT residual soil used in the parametric studieswere c�=3.5 kPa, ��=31.5°, and �b=22.5°. Those values werewithin the ranges suggested by Leong et al. �2002�; i.e.,c�=0–14 kPa, ��=29° –32°, and �b=15° –32°. The JF soilhas c�=6.5 kPa, ��=30.5°, and �b=22°. Leong et al. �2000�suggested the ranges for c�, ��, and �b for the JF residual soil as5–9 kPa, 27°–35°, and 23°–35°, respectively.
Fig. 7. SWCCs of the residual soils from JF
Fig. 8. Permeability function of the residual soils from BT and JF
1558 / JOURNAL OF GEOTECHNICAL AND GEOENVIRONMENTAL ENGIN
J. Geotech. Geoenviron. Eng.
Numerical Modeling of Residual Soil Slopesin Singapore
Parametric studies were conducted to assess the stability of re-sidual soil slopes subjected to several independent variables. Thecontrolling independent variables are the position of initialgroundwater table, soil properties, and rainfall intensity.
Controlling Parameters in Numerical Analyses
The study of the effect of groundwater table on the stability of theBT and the JF slopes in Singapore involves six series of paramet-ric studies. Two series were conducted using the initial positionsof groundwater table during dry period. The other two series wereperformed using the initial positions of groundwater table duringwet period. The remaining series of these parametric studies wereconducted using the average groundwater table positions of re-sidual soil slopes in Singapore as the initial positions of ground-water table. Based on the Code of Practice of Power and UtilitiesBoard, Singapore �PUB 2000� for drainage system design, themaximum total amount of rainfall in a day is 533.2 mm. There-fore, a rainfall intensity of 22 mm/h for a duration of 24 h wasapplied in all series of these parametric studies.
A typical slope geometry with height �H� of 15 m, angle of27°, and length �L� of 29.4 m �Rahardjo et al. 2000� was used inthe model for parametric study of residual soil slopes from the BTand the sedimentary JF. The initial position of groundwater tablefor each series of parametric studies was calculated from Figs. 2and 3. As an example, Fig. 2 shows that at the wettest period, thegroundwater table position in the BT slope was at h /H of 0.653 atthe crest �� /L=0� and at h /H of 0.053 at the toe �� /L=1� of theslope. In other words, the actual depths of groundwater table �h�were 9.8 and 0.8 m at the crest and the toe of the BT slope,respectively, corresponding to H=15 m. Similarly, the initial po-sition of groundwater table for the JF slope was calculated fromFig. 3 for the wettest and driest periods.
The study of the effect of rainfall intensity on the stability ofthe BT and the JF slopes in Singapore involved eight series ofparametric studies. All series in these parametric studies wereconducted using the average groundwater table positions of re-sidual soil slopes in Singapore as the initial positions of ground-water table. Four different rainfall intensities, 9, 22, 36, and 80mm/h, were used in these studies. Paulhus �1965� observed thatthe greatest rainfall intensity in the world is 80 mm/h. Therefore,this rainfall intensity was also adopted in the numerical analyses.All numerical analyses were conducted for a period of 48 h withrainfall being applied during the first 24 h.
Seepage and Slope Stability Modeling
Two-dimensional seepage analyses were performed in this studyusing the finite-element software SEEP/W �Geoslope Interna-tional Pte. Ltd. 2004a�. In Singapore, majority of slope failuresoccurred within a shallow depth. Simplified slope profiles with ahomogeneous soil layer �one layer� from the JF and the BT slopewere used in the parametric study. Typical SWCC �Figs. 6 and 7�and permeability functions �Fig. 8� were used in the numericalanalyses.
Boundary conditions were applied to the slope model for thetransient seepage analyses. Nonponding boundary condition wasapplied in order to prevent excessive accumulation of rainfall onthe slope surface. The flux boundary q equal to the desired rain-
fall intensity and duration was applied to the surface of the slope.EERING © ASCE / NOVEMBER 2010
2010.136:1555-1564.
Dow
nloa
ded
from
asc
elib
rary
.org
by
Cur
tin U
niv
of T
echn
olog
y 20
09 o
n 10
/06/
12. F
or p
erso
nal u
se o
nly.
No
othe
r us
es w
ithou
t per
mis
sion
. Cop
yrig
ht (
c) 2
012.
Am
eric
an S
ocie
ty o
f C
ivil
Eng
inee
rs. A
ll ri
ghts
res
erve
d.
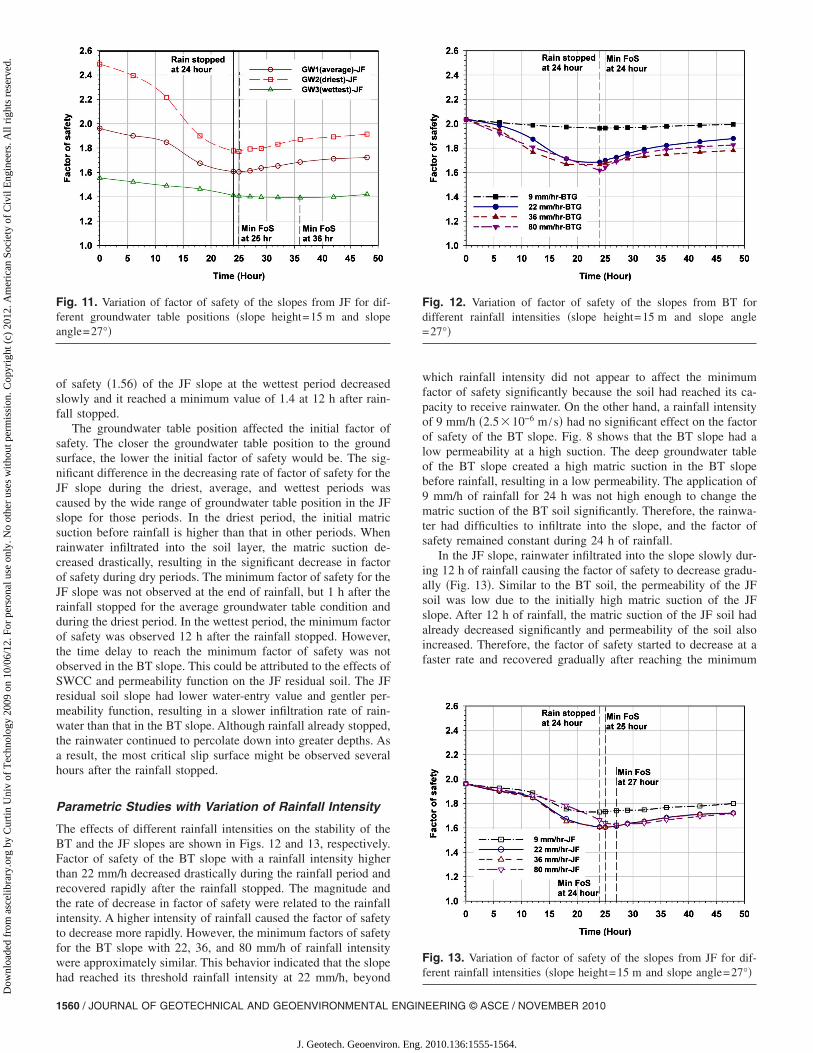
The nodal flux Q equal to zero was applied along the sides abovethe water table line and along the bottom of the slope in order tosimulate no flow zone. The sides below the water table weredefined as head boundaries equal to the specific position of thegroundwater level �total head hw�. Initial condition for the slopemodel was taken as hydrostatic pore-water pressure conditionwith a limiting negative pore-water pressure of 75 kPa. The limitwas imposed to prevent the generation of unrealistic pore-waterpressures. Rahardjo et al. �2000� observed that the highest matricsuction measured in a few sites in Singapore was 75 kPa. Fig. 9shows the typical slope model and the applied flux boundary con-ditions. The distance between the slope and the side of the slopemodel was set to three times the height of the slope to avoid theinfluence of the side boundary conditions. The finite-elementmodel down to 5 m below the slope surface had a mesh size ofapproximately 0.5 m, smaller than other part of the slope, in orderto obtain accurate results within the infiltration zone.
The selected time increment was related to a period of rainfallof 24 h. Finer time increments provide more accurate seepage andslope stability analyses. Therefore, the time increments were setas 1, 2, 5, 10, 20, 30, and 60 min. The time increment was alteredevery ten steps and the total simulated duration was 48 h. Thepore-water pressures were calculated in SEEP/W for every timestep at each node of the finite-element mesh. The pore-water pres-sure output of the seepage analyses was incorporated into slopestability analyses.
Slope stability analyses of the BT and the JF slopes wereperformed using SLOPE/W �Geoslope International Pte. Ltd.2004b�. The finite-element mesh of the slope model in SEEP/Wwas imported to SLOPE/W. The typical saturated and unsaturatedshear strengths for the BT and the JF residual soils were used inthe slope stability analyses using Bishop’s simplified method. Thepore-water pressure distribution was selected for each time incre-ment, and the corresponding factor of safety was calculated.
Parametric Studies with Variation of GroundwaterTable Position
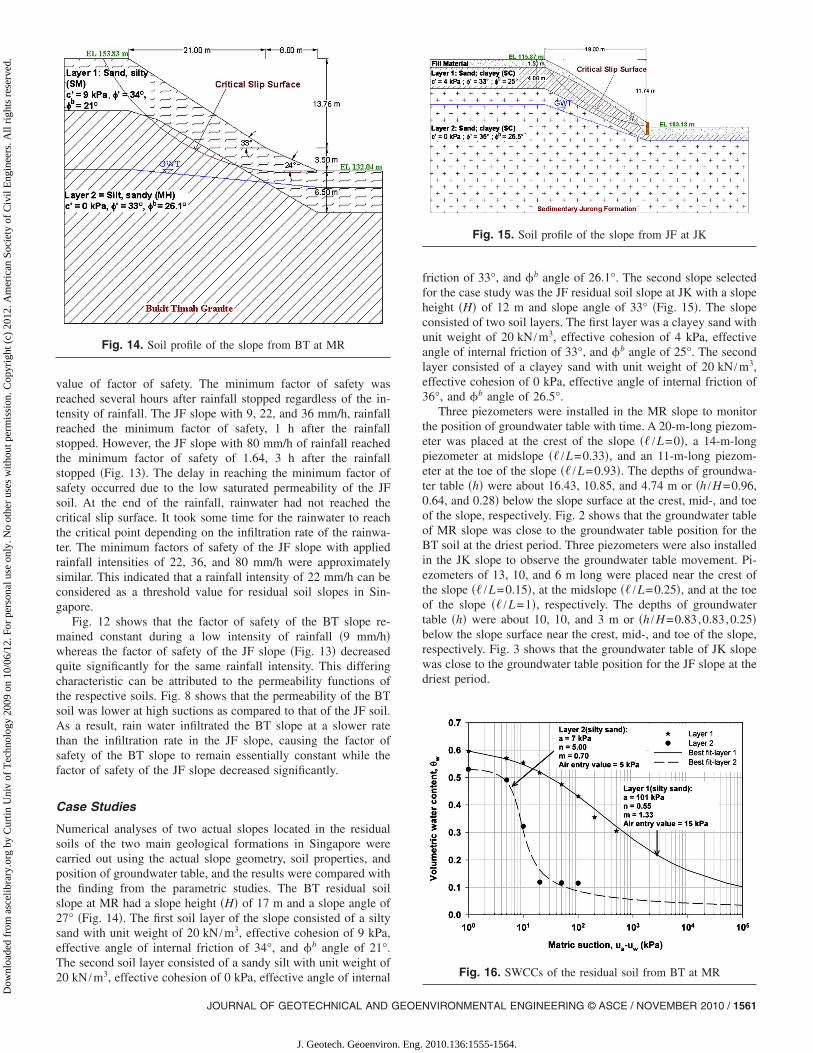
Variations in factor of safety due to initial groundwater tablepositions at the BT and the JF residual soil slopes are given inFigs. 10 and 11, respectively. Fig. 10 shows that the factor ofsafety of the BT slope reached a minimum value when rainfall
Fig. 9. Slope model for parametric stud
stopped regardless of the position of groundwater table. Factor of
JOURNAL OF GEOTECHNICAL AND GEOE
J. Geotech. Geoenviron. Eng.
safety for the BT slope in the driest period �2.16� and at theaverage condition �2.04� decreased drastically and reached aminimum value at 1.7. After the rainfall ceased, the factor ofsafety for the BT slope at the driest period and at the averagecondition increased rapidly at the same recovery rate. The factorof safety for the BT slope in the wettest period decreased gradu-ally from 1.7 to 1.45 and then it increased slowly after the rainfallstopped.
Fig. 11 shows that the factor of safety decreased rapidly duringthe driest period due to the high matric suction of the soil abovegroundwater table before rainfall. In the wettest period, the de-crease in factor of safety was slower as compared to other peri-ods. The factor of safety �2.5� of the JF slope in the driest perioddecreased significantly to a minimum factor of safety of 1.8, 1 hafter the rainfall stopped. After which, the factor of safety recov-ered slowly. The factor of safety �2.0� of the JF slope at theaverage condition decreased rapidly and reached a minimum fac-tor of safety of 1.6, 1 h after the rainfall stopped. Subsequently, itrecovered at the same rate as that for the driest period. The factor
ope height=15 m and slope angle=27°�
Fig. 10. Variation of factor of safety of the slopes from BT fordifferent groundwater table positions �slope height=15 m and slopeangle=27°�
ies �sl
NVIRONMENTAL ENGINEERING © ASCE / NOVEMBER 2010 / 1559
2010.136:1555-1564.
Dow
nloa
ded
from
asc
elib
rary
.org
by
Cur
tin U
niv
of T
echn
olog
y 20
09 o
n 10
/06/
12. F
or p
erso
nal u
se o
nly.
No
othe
r us
es w
ithou
t per
mis
sion
. Cop
yrig
ht (
c) 2
012.
Am
eric
an S
ocie
ty o
f C
ivil
Eng
inee
rs. A
ll ri
ghts
res
erve
d.
of safety �1.56� of the JF slope at the wettest period decreasedslowly and it reached a minimum value of 1.4 at 12 h after rain-fall stopped.
The groundwater table position affected the initial factor ofsafety. The closer the groundwater table position to the groundsurface, the lower the initial factor of safety would be. The sig-nificant difference in the decreasing rate of factor of safety for theJF slope during the driest, average, and wettest periods wascaused by the wide range of groundwater table position in the JFslope for those periods. In the driest period, the initial matricsuction before rainfall is higher than that in other periods. Whenrainwater infiltrated into the soil layer, the matric suction de-creased drastically, resulting in the significant decrease in factorof safety during dry periods. The minimum factor of safety for theJF slope was not observed at the end of rainfall, but 1 h after therainfall stopped for the average groundwater table condition andduring the driest period. In the wettest period, the minimum factorof safety was observed 12 h after the rainfall stopped. However,the time delay to reach the minimum factor of safety was notobserved in the BT slope. This could be attributed to the effects ofSWCC and permeability function on the JF residual soil. The JFresidual soil slope had lower water-entry value and gentler per-meability function, resulting in a slower infiltration rate of rain-water than that in the BT slope. Although rainfall already stopped,the rainwater continued to percolate down into greater depths. Asa result, the most critical slip surface might be observed severalhours after the rainfall stopped.
Parametric Studies with Variation of Rainfall Intensity
The effects of different rainfall intensities on the stability of theBT and the JF slopes are shown in Figs. 12 and 13, respectively.Factor of safety of the BT slope with a rainfall intensity higherthan 22 mm/h decreased drastically during the rainfall period andrecovered rapidly after the rainfall stopped. The magnitude andthe rate of decrease in factor of safety were related to the rainfallintensity. A higher intensity of rainfall caused the factor of safetyto decrease more rapidly. However, the minimum factors of safetyfor the BT slope with 22, 36, and 80 mm/h of rainfall intensitywere approximately similar. This behavior indicated that the slope
Fig. 11. Variation of factor of safety of the slopes from JF for dif-ferent groundwater table positions �slope height=15 m and slopeangle=27°�
had reached its threshold rainfall intensity at 22 mm/h, beyond
1560 / JOURNAL OF GEOTECHNICAL AND GEOENVIRONMENTAL ENGIN
J. Geotech. Geoenviron. Eng.
which rainfall intensity did not appear to affect the minimumfactor of safety significantly because the soil had reached its ca-pacity to receive rainwater. On the other hand, a rainfall intensityof 9 mm/h �2.5�10−6 m /s� had no significant effect on the factorof safety of the BT slope. Fig. 8 shows that the BT slope had alow permeability at a high suction. The deep groundwater tableof the BT slope created a high matric suction in the BT slopebefore rainfall, resulting in a low permeability. The application of9 mm/h of rainfall for 24 h was not high enough to change thematric suction of the BT soil significantly. Therefore, the rainwa-ter had difficulties to infiltrate into the slope, and the factor ofsafety remained constant during 24 h of rainfall.
In the JF slope, rainwater infiltrated into the slope slowly dur-ing 12 h of rainfall causing the factor of safety to decrease gradu-ally �Fig. 13�. Similar to the BT soil, the permeability of the JFsoil was low due to the initially high matric suction of the JFslope. After 12 h of rainfall, the matric suction of the JF soil hadalready decreased significantly and permeability of the soil alsoincreased. Therefore, the factor of safety started to decrease at afaster rate and recovered gradually after reaching the minimum
Fig. 12. Variation of factor of safety of the slopes from BT fordifferent rainfall intensities �slope height=15 m and slope angle=27°�
Fig. 13. Variation of factor of safety of the slopes from JF for dif-ferent rainfall intensities �slope height=15 m and slope angle=27°�
EERING © ASCE / NOVEMBER 2010
2010.136:1555-1564.
Dow
nloa
ded
from
asc
elib
rary
.org
by
Cur
tin U
niv
of T
echn
olog
y 20
09 o
n 10
/06/
12. F
or p
erso
nal u
se o
nly.
No
othe
r us
es w
ithou
t per
mis
sion
. Cop
yrig
ht (
c) 2
012.
Am
eric
an S
ocie
ty o
f C
ivil
Eng
inee
rs. A
ll ri
ghts
res
erve
d.
value of factor of safety. The minimum factor of safety wasreached several hours after rainfall stopped regardless of the in-tensity of rainfall. The JF slope with 9, 22, and 36 mm/h, rainfallreached the minimum factor of safety, 1 h after the rainfallstopped. However, the JF slope with 80 mm/h of rainfall reachedthe minimum factor of safety of 1.64, 3 h after the rainfallstopped �Fig. 13�. The delay in reaching the minimum factor ofsafety occurred due to the low saturated permeability of the JFsoil. At the end of the rainfall, rainwater had not reached thecritical slip surface. It took some time for the rainwater to reachthe critical point depending on the infiltration rate of the rainwa-ter. The minimum factors of safety of the JF slope with appliedrainfall intensities of 22, 36, and 80 mm/h were approximatelysimilar. This indicated that a rainfall intensity of 22 mm/h can beconsidered as a threshold value for residual soil slopes in Sin-gapore.
Fig. 12 shows that the factor of safety of the BT slope re-mained constant during a low intensity of rainfall �9 mm/h�whereas the factor of safety of the JF slope �Fig. 13� decreasedquite significantly for the same rainfall intensity. This differingcharacteristic can be attributed to the permeability functions ofthe respective soils. Fig. 8 shows that the permeability of the BTsoil was lower at high suctions as compared to that of the JF soil.As a result, rain water infiltrated the BT slope at a slower ratethan the infiltration rate in the JF slope, causing the factor ofsafety of the BT slope to remain essentially constant while thefactor of safety of the JF slope decreased significantly.
Case Studies
Numerical analyses of two actual slopes located in the residualsoils of the two main geological formations in Singapore werecarried out using the actual slope geometry, soil properties, andposition of groundwater table, and the results were compared withthe finding from the parametric studies. The BT residual soilslope at MR had a slope height �H� of 17 m and a slope angle of27° �Fig. 14�. The first soil layer of the slope consisted of a siltysand with unit weight of 20 kN /m3, effective cohesion of 9 kPa,effective angle of internal friction of 34°, and �b angle of 21°.The second soil layer consisted of a sandy silt with unit weight of
3
Fig. 14. Soil profile of the slope from BT at MR
20 kN /m , effective cohesion of 0 kPa, effective angle of internal
JOURNAL OF GEOTECHNICAL AND GEOE
J. Geotech. Geoenviron. Eng.
friction of 33°, and �b angle of 26.1°. The second slope selectedfor the case study was the JF residual soil slope at JK with a slopeheight �H� of 12 m and slope angle of 33° �Fig. 15�. The slopeconsisted of two soil layers. The first layer was a clayey sand withunit weight of 20 kN /m3, effective cohesion of 4 kPa, effectiveangle of internal friction of 33°, and �b angle of 25°. The secondlayer consisted of a clayey sand with unit weight of 20 kN /m3,effective cohesion of 0 kPa, effective angle of internal friction of36°, and �b angle of 26.5°.
Three piezometers were installed in the MR slope to monitorthe position of groundwater table with time. A 20-m-long piezom-eter was placed at the crest of the slope �� /L=0�, a 14-m-longpiezometer at midslope �� /L=0.33�, and an 11-m-long piezom-eter at the toe of the slope �� /L=0.93�. The depths of groundwa-ter table �h� were about 16.43, 10.85, and 4.74 m or �h /H=0.96,0.64, and 0.28� below the slope surface at the crest, mid-, and toeof the slope, respectively. Fig. 2 shows that the groundwater tableof MR slope was close to the groundwater table position for theBT soil at the driest period. Three piezometers were also installedin the JK slope to observe the groundwater table movement. Pi-ezometers of 13, 10, and 6 m long were placed near the crest ofthe slope �� /L=0.15�, at the midslope �� /L=0.25�, and at the toeof the slope �� /L=1�, respectively. The depths of groundwatertable �h� were about 10, 10, and 3 m or �h /H=0.83,0.83,0.25�below the slope surface near the crest, mid-, and toe of the slope,respectively. Fig. 3 shows that the groundwater table of JK slopewas close to the groundwater table position for the JF slope at thedriest period.
Fig. 15. Soil profile of the slope from JF at JK
Fig. 16. SWCCs of the residual soil from BT at MR
NVIRONMENTAL ENGINEERING © ASCE / NOVEMBER 2010 / 1561
2010.136:1555-1564.
Dow
nloa
ded
from
asc
elib
rary
.org
by
Cur
tin U
niv
of T
echn
olog
y 20
09 o
n 10
/06/
12. F
or p
erso
nal u
se o
nly.
No
othe
r us
es w
ithou
t per
mis
sion
. Cop
yrig
ht (
c) 2
012.
Am
eric
an S
ocie
ty o
f C
ivil
Eng
inee
rs. A
ll ri
ghts
res
erve
d.
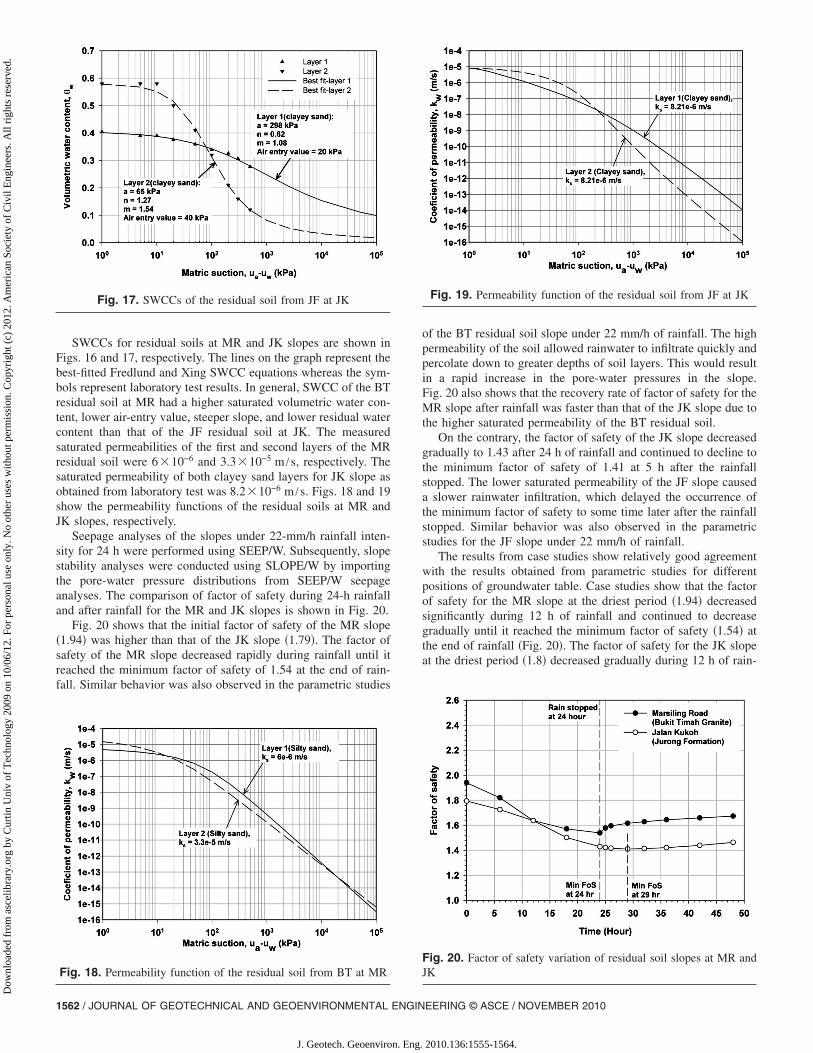
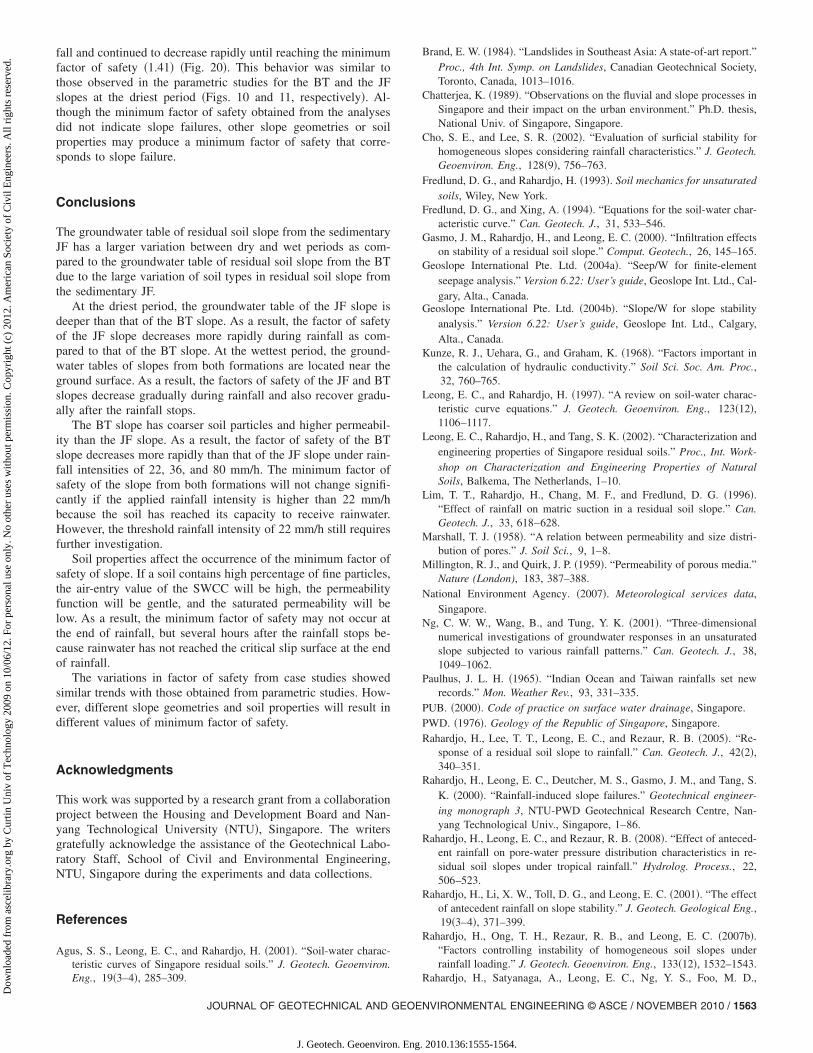
SWCCs for residual soils at MR and JK slopes are shown inFigs. 16 and 17, respectively. The lines on the graph represent thebest-fitted Fredlund and Xing SWCC equations whereas the sym-bols represent laboratory test results. In general, SWCC of the BTresidual soil at MR had a higher saturated volumetric water con-tent, lower air-entry value, steeper slope, and lower residual watercontent than that of the JF residual soil at JK. The measuredsaturated permeabilities of the first and second layers of the MRresidual soil were 6�10−6 and 3.3�10−5 m /s, respectively. Thesaturated permeability of both clayey sand layers for JK slope asobtained from laboratory test was 8.2�10−6 m /s. Figs. 18 and 19show the permeability functions of the residual soils at MR andJK slopes, respectively.
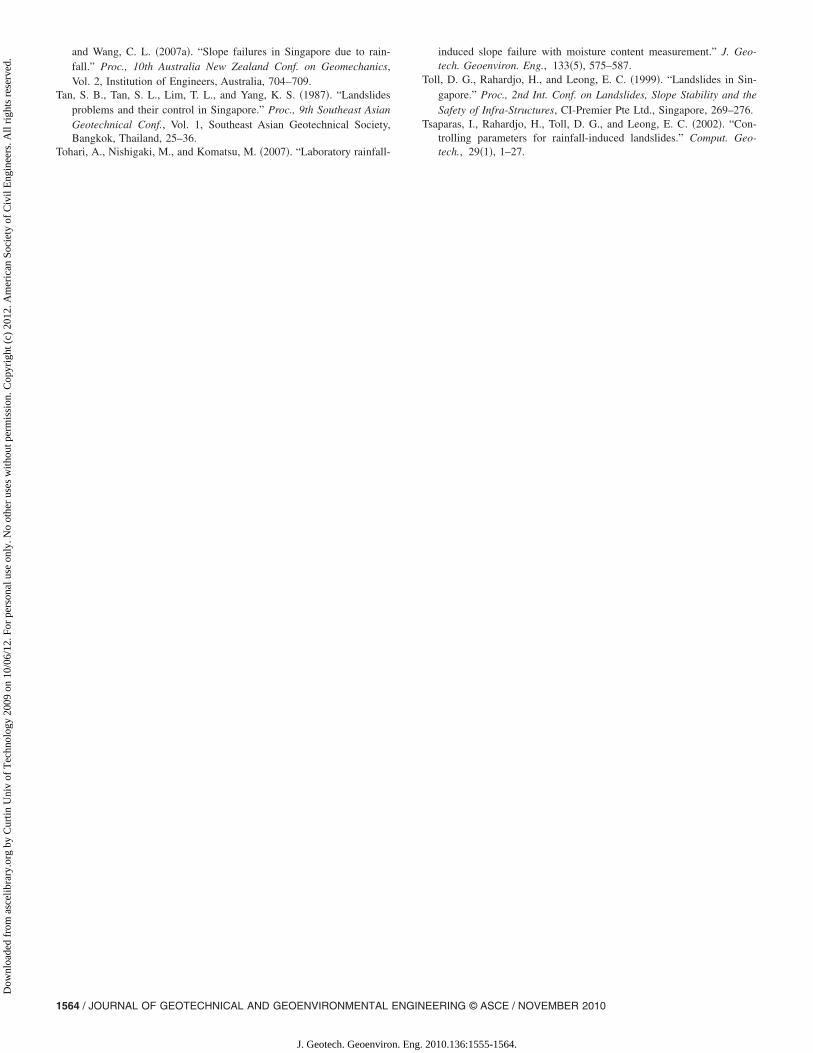
Seepage analyses of the slopes under 22-mm/h rainfall inten-sity for 24 h were performed using SEEP/W. Subsequently, slopestability analyses were conducted using SLOPE/W by importingthe pore-water pressure distributions from SEEP/W seepageanalyses. The comparison of factor of safety during 24-h rainfalland after rainfall for the MR and JK slopes is shown in Fig. 20.
Fig. 20 shows that the initial factor of safety of the MR slope�1.94� was higher than that of the JK slope �1.79�. The factor ofsafety of the MR slope decreased rapidly during rainfall until itreached the minimum factor of safety of 1.54 at the end of rain-fall. Similar behavior was also observed in the parametric studies
Fig. 17. SWCCs of the residual soil from JF at JK
Fig. 18. Permeability function of the residual soil from BT at MR
1562 / JOURNAL OF GEOTECHNICAL AND GEOENVIRONMENTAL ENGIN
J. Geotech. Geoenviron. Eng.
of the BT residual soil slope under 22 mm/h of rainfall. The highpermeability of the soil allowed rainwater to infiltrate quickly andpercolate down to greater depths of soil layers. This would resultin a rapid increase in the pore-water pressures in the slope.Fig. 20 also shows that the recovery rate of factor of safety for theMR slope after rainfall was faster than that of the JK slope due tothe higher saturated permeability of the BT residual soil.
On the contrary, the factor of safety of the JK slope decreasedgradually to 1.43 after 24 h of rainfall and continued to decline tothe minimum factor of safety of 1.41 at 5 h after the rainfallstopped. The lower saturated permeability of the JF slope causeda slower rainwater infiltration, which delayed the occurrence ofthe minimum factor of safety to some time later after the rainfallstopped. Similar behavior was also observed in the parametricstudies for the JF slope under 22 mm/h of rainfall.
The results from case studies show relatively good agreementwith the results obtained from parametric studies for differentpositions of groundwater table. Case studies show that the factorof safety for the MR slope at the driest period �1.94� decreasedsignificantly during 12 h of rainfall and continued to decreasegradually until it reached the minimum factor of safety �1.54� atthe end of rainfall �Fig. 20�. The factor of safety for the JK slopeat the driest period �1.8� decreased gradually during 12 h of rain-
Fig. 19. Permeability function of the residual soil from JF at JK
Fig. 20. Factor of safety variation of residual soil slopes at MR andJK
EERING © ASCE / NOVEMBER 2010
2010.136:1555-1564.
Dow
nloa
ded
from
asc
elib
rary
.org
by
Cur
tin U
niv
of T
echn
olog
y 20
09 o
n 10
/06/
12. F
or p
erso
nal u
se o
nly.
No
othe
r us
es w
ithou
t per
mis
sion
. Cop
yrig
ht (
c) 2
012.
Am
eric
an S
ocie
ty o
f C
ivil
Eng
inee
rs. A
ll ri
ghts
res
erve
d.
fall and continued to decrease rapidly until reaching the minimumfactor of safety �1.41� �Fig. 20�. This behavior was similar tothose observed in the parametric studies for the BT and the JFslopes at the driest period �Figs. 10 and 11, respectively�. Al-though the minimum factor of safety obtained from the analysesdid not indicate slope failures, other slope geometries or soilproperties may produce a minimum factor of safety that corre-sponds to slope failure.
Conclusions
The groundwater table of residual soil slope from the sedimentaryJF has a larger variation between dry and wet periods as com-pared to the groundwater table of residual soil slope from the BTdue to the large variation of soil types in residual soil slope fromthe sedimentary JF.
At the driest period, the groundwater table of the JF slope isdeeper than that of the BT slope. As a result, the factor of safetyof the JF slope decreases more rapidly during rainfall as com-pared to that of the BT slope. At the wettest period, the ground-water tables of slopes from both formations are located near theground surface. As a result, the factors of safety of the JF and BTslopes decrease gradually during rainfall and also recover gradu-ally after the rainfall stops.
The BT slope has coarser soil particles and higher permeabil-ity than the JF slope. As a result, the factor of safety of the BTslope decreases more rapidly than that of the JF slope under rain-fall intensities of 22, 36, and 80 mm/h. The minimum factor ofsafety of the slope from both formations will not change signifi-cantly if the applied rainfall intensity is higher than 22 mm/hbecause the soil has reached its capacity to receive rainwater.However, the threshold rainfall intensity of 22 mm/h still requiresfurther investigation.
Soil properties affect the occurrence of the minimum factor ofsafety of slope. If a soil contains high percentage of fine particles,the air-entry value of the SWCC will be high, the permeabilityfunction will be gentle, and the saturated permeability will below. As a result, the minimum factor of safety may not occur atthe end of rainfall, but several hours after the rainfall stops be-cause rainwater has not reached the critical slip surface at the endof rainfall.
The variations in factor of safety from case studies showedsimilar trends with those obtained from parametric studies. How-ever, different slope geometries and soil properties will result indifferent values of minimum factor of safety.
Acknowledgments
This work was supported by a research grant from a collaborationproject between the Housing and Development Board and Nan-yang Technological University �NTU�, Singapore. The writersgratefully acknowledge the assistance of the Geotechnical Labo-ratory Staff, School of Civil and Environmental Engineering,NTU, Singapore during the experiments and data collections.
References
Agus, S. S., Leong, E. C., and Rahardjo, H. �2001�. “Soil-water charac-teristic curves of Singapore residual soils.” J. Geotech. Geoenviron.
Eng., 19�3–4�, 285–309.JOURNAL OF GEOTECHNICAL AND GEOE
J. Geotech. Geoenviron. Eng.
Brand, E. W. �1984�. “Landslides in Southeast Asia: A state-of-art report.”Proc., 4th Int. Symp. on Landslides, Canadian Geotechnical Society,Toronto, Canada, 1013–1016.
Chatterjea, K. �1989�. “Observations on the fluvial and slope processes inSingapore and their impact on the urban environment.” Ph.D. thesis,National Univ. of Singapore, Singapore.
Cho, S. E., and Lee, S. R. �2002�. “Evaluation of surficial stability forhomogeneous slopes considering rainfall characteristics.” J. Geotech.Geoenviron. Eng., 128�9�, 756–763.
Fredlund, D. G., and Rahardjo, H. �1993�. Soil mechanics for unsaturatedsoils, Wiley, New York.
Fredlund, D. G., and Xing, A. �1994�. “Equations for the soil-water char-acteristic curve.” Can. Geotech. J., 31, 533–546.
Gasmo, J. M., Rahardjo, H., and Leong, E. C. �2000�. “Infiltration effectson stability of a residual soil slope.” Comput. Geotech., 26, 145–165.
Geoslope International Pte. Ltd. �2004a�. “Seep/W for finite-elementseepage analysis.” Version 6.22: User’s guide, Geoslope Int. Ltd., Cal-gary, Alta., Canada.
Geoslope International Pte. Ltd. �2004b�. “Slope/W for slope stabilityanalysis.” Version 6.22: User’s guide, Geoslope Int. Ltd., Calgary,Alta., Canada.
Kunze, R. J., Uehara, G., and Graham, K. �1968�. “Factors important inthe calculation of hydraulic conductivity.” Soil Sci. Soc. Am. Proc.,32, 760–765.
Leong, E. C., and Rahardjo, H. �1997�. “A review on soil-water charac-teristic curve equations.” J. Geotech. Geoenviron. Eng., 123�12�,1106–1117.
Leong, E. C., Rahardjo, H., and Tang, S. K. �2002�. “Characterization andengineering properties of Singapore residual soils.” Proc., Int. Work-shop on Characterization and Engineering Properties of NaturalSoils, Balkema, The Netherlands, 1–10.
Lim, T. T., Rahardjo, H., Chang, M. F., and Fredlund, D. G. �1996�.“Effect of rainfall on matric suction in a residual soil slope.” Can.Geotech. J., 33, 618–628.
Marshall, T. J. �1958�. “A relation between permeability and size distri-bution of pores.” J. Soil Sci., 9, 1–8.
Millington, R. J., and Quirk, J. P. �1959�. “Permeability of porous media.”Nature (London), 183, 387–388.
National Environment Agency. �2007�. Meteorological services data,Singapore.
Ng, C. W. W., Wang, B., and Tung, Y. K. �2001�. “Three-dimensionalnumerical investigations of groundwater responses in an unsaturatedslope subjected to various rainfall patterns.” Can. Geotech. J., 38,1049–1062.
Paulhus, J. L. H. �1965�. “Indian Ocean and Taiwan rainfalls set newrecords.” Mon. Weather Rev., 93, 331–335.
PUB. �2000�. Code of practice on surface water drainage, Singapore.PWD. �1976�. Geology of the Republic of Singapore, Singapore.Rahardjo, H., Lee, T. T., Leong, E. C., and Rezaur, R. B. �2005�. “Re-
sponse of a residual soil slope to rainfall.” Can. Geotech. J., 42�2�,340–351.
Rahardjo, H., Leong, E. C., Deutcher, M. S., Gasmo, J. M., and Tang, S.K. �2000�. “Rainfall-induced slope failures.” Geotechnical engineer-ing monograph 3, NTU-PWD Geotechnical Research Centre, Nan-yang Technological Univ., Singapore, 1–86.
Rahardjo, H., Leong, E. C., and Rezaur, R. B. �2008�. “Effect of anteced-ent rainfall on pore-water pressure distribution characteristics in re-sidual soil slopes under tropical rainfall.” Hydrolog. Process., 22,506–523.
Rahardjo, H., Li, X. W., Toll, D. G., and Leong, E. C. �2001�. “The effectof antecedent rainfall on slope stability.” J. Geotech. Geological Eng.,19�3–4�, 371–399.
Rahardjo, H., Ong, T. H., Rezaur, R. B., and Leong, E. C. �2007b�.“Factors controlling instability of homogeneous soil slopes underrainfall loading.” J. Geotech. Geoenviron. Eng., 133�12�, 1532–1543.
Rahardjo, H., Satyanaga, A., Leong, E. C., Ng, Y. S., Foo, M. D.,
NVIRONMENTAL ENGINEERING © ASCE / NOVEMBER 2010 / 1563
2010.136:1555-1564.
Dow
nloa
ded
from
asc
elib
rary
.org
by
Cur
tin U
niv
of T
echn
olog
y 20
09 o
n 10
/06/
12. F
or p
erso
nal u
se o
nly.
No
othe
r us
es w
ithou
t per
mis
sion
. Cop
yrig
ht (
c) 2
012.
Am
eric
an S
ocie
ty o
f C
ivil
Eng
inee
rs. A
ll ri
ghts
res
erve
d.
and Wang, C. L. �2007a�. “Slope failures in Singapore due to rain-fall.” Proc., 10th Australia New Zealand Conf. on Geomechanics,Vol. 2, Institution of Engineers, Australia, 704–709.
Tan, S. B., Tan, S. L., Lim, T. L., and Yang, K. S. �1987�. “Landslidesproblems and their control in Singapore.” Proc., 9th Southeast AsianGeotechnical Conf., Vol. 1, Southeast Asian Geotechnical Society,Bangkok, Thailand, 25–36.
Tohari, A., Nishigaki, M., and Komatsu, M. �2007�. “Laboratory rainfall-
1564 / JOURNAL OF GEOTECHNICAL AND GEOENVIRONMENTAL ENGIN
J. Geotech. Geoenviron. Eng.
induced slope failure with moisture content measurement.” J. Geo-tech. Geoenviron. Eng., 133�5�, 575–587.
Toll, D. G., Rahardjo, H., and Leong, E. C. �1999�. “Landslides in Sin-gapore.” Proc., 2nd Int. Conf. on Landslides, Slope Stability and theSafety of Infra-Structures, CI-Premier Pte Ltd., Singapore, 269–276.
Tsaparas, I., Rahardjo, H., Toll, D. G., and Leong, E. C. �2002�. “Con-trolling parameters for rainfall-induced landslides.” Comput. Geo-tech., 29�1�, 1–27.
EERING © ASCE / NOVEMBER 2010
2010.136:1555-1564.
Recommended