20 TRANSPORTATION RESEARCH RECORD 1217
Effect of Compaction on Asphalt Concrete Performance
ROBERT N. LINDEN, }OE P. MAHONEY, AND NEWTON c. JACKSON
This paper presents information on how compnction (specifically, air voids) influences the performance of dense asphalt concrete pavement surfaces. The information is based on three separate sources: the exiting literature on the subject, a questionnaire survey or 48 state highway agencies on compaction practice, and per for mance data from the Washington State Pavement Management System. All three information sources show some correlation between the degree or compaction and the performance of asphalt concrete pavement. Overall, a 1 percent increase in air voids (over the base air-void level of 7 percent) tends to produce about a 10 percent loss in pavement life.
This paper is the result of research on how compactionspecifically, air voids-affects the performance of dense asphalt concrete pavement. Three information sources support the findings: a literature review; a survey of state highway agencies (SHAs); and data from the Washington State Pavement Management System (WSPMS).
PREVIOUS RESEARCH
Other researchers have found that asphalt concrete performance is in part a function of compaction, and hence air voids, in dense mixtures . Two frequently used terms indicative of performance are fatigue cracking and aging.
Fatigue Cracking
Fatigue cracking (or "alligator cracking") usually describes cracked pavement that has been repeatedly bent by heavy traffic. Researchers might reasonably ask how air voids affect asphalt concrete fuLiguc life.
Several authors (J- 3) have shown that the fatigue life (time from original construction to substantial fatigue cracking) of asphalt concrete is reduced from 10 to 30 percent for each 1 percent increase over normal in air voids. For example, if 7 percent air voids are achievable for a mix yet 11 percent air voids resulted from construction, one could expect about a 40 percent reduction in pavement surfacing life (11 percent minus 7 percent equals 4, times 10 percent).
R . N. Linden , Consulting Engineer, 51 W. Dayton , Edmonds, Wash. 98020. J.P. Mahoney, Department of Civil Engineering, University of Washington, Seattle, Wash. 98195. N. C. Jackson , Washington State Department of Transportation , Olympia , Wash. 98504 .
Another way to approach air voids is to ask how they affect the thickness of asphalt concrete . As demonstrated by Finn and Epps (J), the effective thickness of asphalt concrete layers decreases as air voids increase . Finn and Epps evaluated two thicknesses of asphalt concrete, 4 and 6 in. , at a starting point of 7 percent air voids (7 percent is generally considered achievable in normal paving construction) . The following tabulation summarizes their findings.
Percent Air Voids in A sphalt Concrete
7 8 9
. 10 12
Effective Thickness of Asphalt Concrete (in .)
Example 1
4.0 3.5 3.0 2.5 2.0
Example 2
6.0 5.0 4.5 4.0 4.0
Thus, if the air voids are increased from a desirable level of 7 percent to a very poor compaction level of 12 percent, a 4-in.-thick asphalt concrete layer effectively lasts only as long as a 2-in. layer; a 6-in. layer is reduced to the effectiveness of a 4-in.-thick layer.
Aging
Aging of asphalt concrete can be evaluated in many ways. One way pertinent to this research is to judge aging by considering asphalt penetration and determining how air voids affect that property.
Goode and Owings ( 4) showed that, for asphalt concrete mixtures 4 years after construction , asphalt penetration is reduced about 6 percent for each 1 percent increase in air voids. They demonstrated, for example , that mixes retain about 75 percent of their original (immediately after construction) asphalt penetration at an air void level of 6 percent. If the air voids immediately after construction are 12 percent, however, the asphalt penetration is only 30 percent of its original level. The lower the asphalt penetration, the more susceptible the mixture is to cracking, as established by Hubbard and Gollomb (5), who showed that asphalt penetration of 30 or less (at 77°F) generally leads to distressed asphalt concrete . High-air-void pavements, as Goode and Owings ( 4) conclude , can be expected to result in low penetration levels for asphalt cement whose penetration level before mixing was at 85-100.

Linden et al.
Air Void Levels
The work of the authors discussed above corroborates the findings of Finn et al. (6) concerning the maximum air void levels desirable for asphalt concrete construction. Those levels are summarized below.
Asphalt Concrete Layer
Upper 1 Yi--2 in. of asphalt concrete pavement Asphalt concre te pavement deeper than 2 in.
Maximum Air Voids (%)
Light Traffic
8
7
Moderate to Heavy Traffic
7
6
Results of the SHA survey also support the levels established by Finn et al.
QUESTIONNAIRE
A questionnaire (7) was prepared and sent in 1987 to the materials engineer in each of the 50 SHAs. The questionnaire's purpose was to review practice and gather opinions of the SHAs on the control of air voids in asphalt concrete pavements. Each agency was asked to respond to eight questions on methods of mix design, construction compaction control and tests, field density limits and average asphalt content, pavement air voids, primary mode of pavement failure, and, finally, the effect of increasing air voids on pavement life. Forty-eight agencies responded to the questionnaire .
It should be noted that some questions are subjective; answers may be based on the respondent's opinion rather than on data.
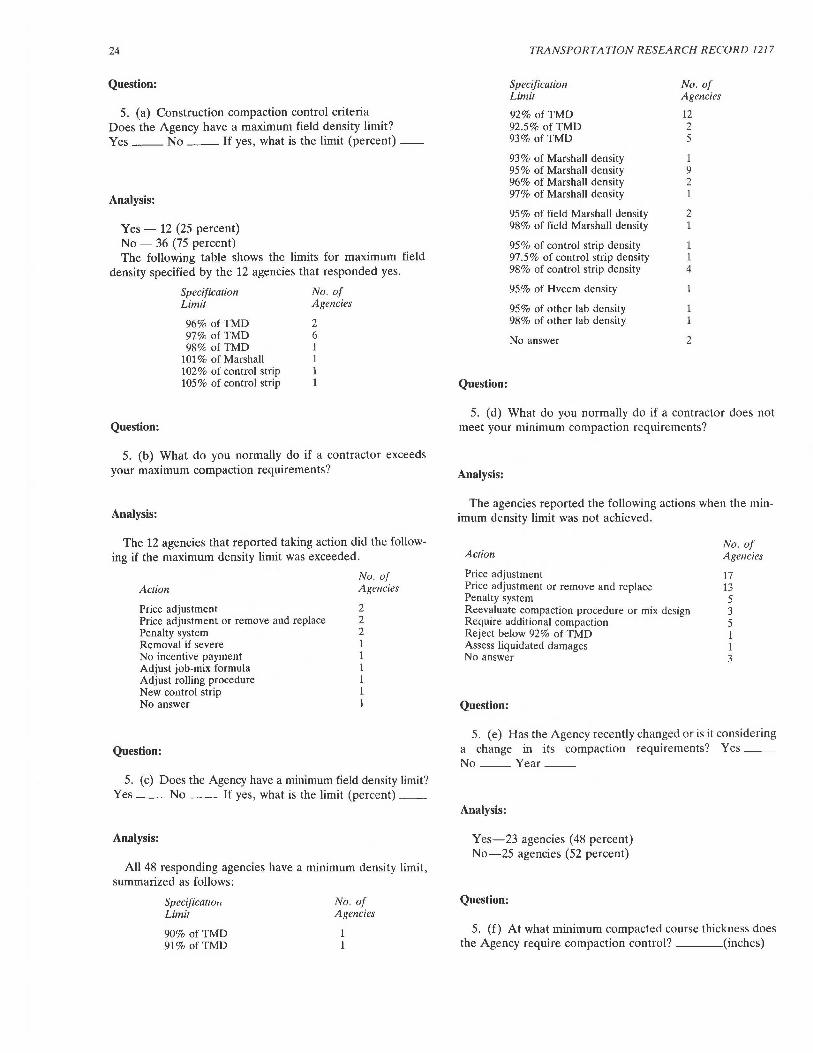
A sample completed questionnaire is shown in Figure 1. Each question and a summary of agency responses follow. (Percentage figures for number of agencies responding have been rounded to the nearest whole percentage point.)
Question:
1. Asphalt concrete mix design procedure (a) Marshall method (b) Hveem method (c) Other (please specify)
Analysis:
Responses are summarized in the following table . Two agencies use both Marshall and Hveem methods . Other methods used are aggregate gradation and AASHTO T-167 .
No. of A gencies Percent of 48 Method Using Method Respondents
Marshall 34 71 Hveem 10 21 Both 2 4 Other 2 4
21
Question:
2. Are field results used to verify the adequacy of asphalt concrete mix designs? Yes __ No __ . If yes, what types of field data are considered?
Analysis:
Yes-39 agencies (81 percent) No-9 agencies (19 percent) Agencies that responded yes typically use field results to
verify air voids, aggregate gradation , asphalt content, and so on.
Question:
3. Construction compaction requirement (i) Percent of laboratory-compacted density
(ii) Percent of theoretical maximum density (i.e., zero air voids)
(iii) Percent of control strip density (e .g., target = 95 % of control strip)
(iv) Other (please specify)
Analysis:
(i) Percent of laboratory compacted density-18 agencies (38 percent)
(ii) Percent of theore tical maximum den ity (TMD) (AASHTO 1'209-82)- 21 agencies (44 percent)
(iii) Percent of control strip density-6 agencie (12 percent)
(iv) Other-3 agencies (6 percent), which reported percent of field Marshall density
Question:
4. Construction compaction control tests (a) Nuclear densimeter (b) Core samples (c) Other (please specify)
Analysis:
Eighteen agencies indicated use of both nuclear gauge and core samples. The core samples are most likely used to calibrate the nuclear gauge when both methods are specified.
(a) Nuclear gauge - 18 agencies (38 percent) (b) Core samples - 12 agencies (25 percent) (c) Other - 18 agencies (38 percent), which reported
using both methods

QUESTIONNAIRE ON EFFECT OF AIR VOIDS ON ASPHALT CONCRETE PERFORMANCE
Please answer the following questions with respect to your agency's procedures or requirements for construction control of a sphalt concrete pavement . In this questionnaire •air voids • are defined as the air spaces that occur between the coated aggregate particles in the final compacted asphalt concrete mixture.
l. Asphalt concrete mix desfgn procedure (a) Marshall method (b) Hveem method x (c) Other (pleas_e_s_p-ec-1~f~y~).-------~~--~--------
2. Are field results used to ver1fy the adequacy of asphalt
3
concrete mix designs? Yes x No If yes, what types of field data are cons1dered7
(a)
( b)
Construction compaction requirement (i) Percent of laboratory compacted density (ii) Percent of theoretical maxi~um density __ __;x;.:_ ____ _
(1.e., zero air voids) (ii1) Percent of control strip density
(e.g. target • 95% of control strip) (1v) Other (please specify) X-Roller passes for peak dens ity Compaction spec1f1cations - Please 1nclude a copy of ( no~ .mafn your standard specification for asphalt concrete ine compaction with the questionnaire.
4. Construction compaction control tests (a) Nuclear densimeter ___ _ ~x~------------------(b) Core suples (c) Other (pleas-e--sp_e_c_f_f_y~)------------
5. Construction compaction control criteria (a) Does the Agency have 1 Maximum field density li•it?
Yu No x If yes, what is the limit (percent) I
(b) What do you normally do 1f 1 contr&ctor exceeds your •axi~um compaction requtre~ents7
(c)
(d)
Does the Agency have a mfnfmum ffeld density 11m1t7 Yes X No ____ ___ If yes, what 1s the l1mft7 (percent} 92 S of Rice What do you nor~ally do if a contractor does not •eet Density your mfnimum compaction requirements?
Price Adjustment
(e) Has the Agency recently changed or is it considering a change in its compaction requirements? Yes No x Year -----
FIGURE I Sample completed questionnaire.

(f) At what minimum compacted course thickTiess does the agency require compaction control? 1-1/4 (inches)
6. What is the average asphalt cement content you use fn your normal asphalt concrete surfacing mixes (S by weight of total 111x)7 5 . 5
7.
8.
What fs the range and average of field constructed fn the past five years?
afr vofds fn pavements
Maximum 10 Minfmum~~--"~s~~~-
Average 7
(I )
( b)
( c)
What is the typical •11fe" of an asphalt concrete surfacing fn your state? 12-1/2 years. ("Life" fs defined as the time between construction and the t1me when the next overlay or rehabilitation fs needed.) What fs the prfncfpal 11ode of failure at the end of an asphalt concrete surfacing lffe (f.e. fatigue cracking, rutting, etc.) f~tigue What is your experience o-r~o-p~i~n~i ~o~n""""o~f......,..t~h-e~eTfTf_e_c~t~o~f~ field air vofds on asphalt pavement life?
Directly affects rutting, raveling and fatigue cracking
(d) In your opinion, what 1s the effect of fncreas1ng a1r voids on asphalt pavement lffe, expressed as a percentage of desfgn lffe, for the following ffeld (as constructed) afr void contents: 0 100% SS 100% U 100% H 100% 8S 90% 9S 80% 10s 70% lU 60% IB soi
(Normally, 4 to 6i afr voids would constitute lOOS of desfgn 1 f fe)
9. Please 11ake any addftfonal comments you wfsh to add on thfs subject.~~~~~~~~~~~~~~~~~~~~~~~~
The results of thfs questfonnafre wfll be summarized •• Please 1ndfcate ff you wf sh to receive a copy of thf s summary.
Yes x No
Person answering thfs questfonnafre:
Name Tit le
Agency~~~~~~~~~~~~~~~~~~~
Address~~~~~~~~~~~~~~~~~~-Telephone
FIGURE 1 continued
24
Question:
5. (a) Construction compaction control criteria Does the Agency have a maximum field density limit? Yes __ No __ If yes, what is the limit (percent) __
Analysis:
Yes - 12 (25 percent) No - 36 (75 percent) The following table shows the limits for maximum field
density specified by the 12 agencies that responded yes.
Question:
Specification Limit
96% of TMD 97% ofTMD 98% ofTMD
101 % of Marshall 102% of control strip 105% of control strip
No. of Agencies
2 6 1 1 1 1
5. (b) What do you normally do if a contractor exceeds your maximum compaction requirements?
Analysis:
The 12 agencies that reported taking action did the following if the maximum density limit was exceeded.
Action
Price adjustment Price adjustment or remove and replace Penalty system R.emoval if severe No incentive payment Adjust job-mix formula Adjust rolling procedure New control strip No answer
Question:
No. of Agencies
2 2 2 1 1 1 1 1 1
5. (c) Does the Agency have a minimum field density limit? Yes __ No __ If yes, what is the limit (percent) __
Analysis:
All 48 responding agencies have a minimum density limit, summarized as follows:
Specijicatw11 Limit
90% ofTMD 91% ofTMD
No. of Agencies
TRANSPORTATION RESEARCH RECORD 1217
Question:
Specification Limit
92% ofTMD 92.5% ofTMD 93% of TMD
93% of Marshall density 95% of Marshall density 96% of Marshall density 97% of Marshall density
95% of field Marshall density 98% of field Marshall density
95% of control strip density 97.5% of control strip density 98% of control strip density
95% of Hveem density
95% of other lab density 98% of other lab density
No answer
No. of Agencies
12 2 5
1 9 2 1
2 1
1 1 4
2
5. (d) What do you normally do if a contractor does not meet your minimum compaction requirements?
Analysis:
The agencies reported the following actions when the minimum density limit was not achieved.
Action
Price adjustment Price adjustment or remove and replace Penalty system R.eevaluate compaction procedure or mix design R.equire additional compaction R.eject below 92% of TMD Assess liquidated damages No answer
Question:
No. of Agencies
17 13 5 3 5 1 1 3
5. (e) Has the Agency recently changed or is it considering a change in its compaction requirements? Yes __ No __ Year __
Analysis:
Yes-23 agencies (48 percent) No-25 agencies (52 percent)
Question:
5. (f) At what minimum compacted course thickness does the Agency require compaction control? (inches)

Linden et al.
Analysis:
The 48 responses are summarized as follows:
Minimum Thickness (in.)
3/4
1 11/s 1 '14 l '12 2 No minimum No answer
Question:
No. of Agencies
5 13 1 5
10 2 8 4
6. What is the average asphalt cement content you use in your normal asphalt concrete surfacing mixes (percent by weight of total mix)?
Analysis:
The range of asphalt content was 4.6 to 6. 7 percent, with an average of 5. 7 percent. While the spread of asphalt content is 2.1 percent, it is noteworthy that 25 agencies (52 percent) reported an average asphalt content between 5.5 percent and 6.0 percent. Within this band, about as many of the SHAs use the Marshall method as use the Hveem method to determine optimum asphalt content.
Question:
Percent by Weight of Total Mix
4.6 5.0 5.1 5.2 5.3 5.4 5.5 5.6 5.7 5.8 6.0 6.1 6.2 6.3 6.4 6.5 6.7
No. of Agencies
1 4 2 1 3 1 6 4 3 3 9 2 2 1 3 2 1
7. What is the range and average of field air voids in pavements constructed in the past 5 years? Maximum __ Minimum __ Average __
Analysis:
This question is somewhat subjective, and it was not uniformly interpreted . Some agencies listed the range of field air
25
voids and others listed only the average. Seven agencies did not answer the question at all for a variety of reasons: "Data unknown"; "Don't know without a Jot of analysis"; "Do not test for air void content in the field"; and "Figures are not available."
The averages and ranges that were reported are shown below.
Pavement Air Void Content(%)
Average Range
Maximum 9.9 5-15 Minimum 3.5 1-6 Average 6.5 2.8-10
Question:
8. (a) What is the typical "life" of an asphalt concrete surfacing in your state? __ years. ("Life" is defined as the time between construction and the time when the next overlay or rehabilitation is needed.)
Analysis:
Of the 46 responding agencies, 34 (74 percent) reported an average pavement life of 10 to 15 years. Six agencies reported longer life and six reported shorter life. The overall average for all responding agencies was 12.5 years. Naturally, this question is a difficult one in that most SHAs have only an approximate idea of the "typical" life of asphalt concrete.
Question:
Average Pavement Life (years)
7 8 9
10 10.5 11 12 12.5 13 13.5 15 17.5 20 21
No. of Agencies
1 2 3
10 1 1 6 5 1 3 7 3 2 1
8. (b) What is the principal mode of failure at the end of an asphalt concrete surfacing life (i.e., fatigue cracking, rutting, etc.)?
Analysis:
In responding to this question, some agencies reported more than just the principal mode of failure . The several causes of

26
failure mentioned are summarized below, along with the number of agencies reporting them.
Mode No. of Agencies
Fatigue cracking 20 Rutting 14 Cracking (non-specific) 12 Thermal cracking 6 Stripping 5 Weathering 4 Raveling 3 Reflective cracking 2 Base failure 2 Shrinkage cracking 1 Wear 1 Variable modes 5 No response 1
Question:
8. (c) What is your experience or opinion of the effect of field air voids on asphalt pavement life?
Analysis:
Forty-six agencies responded to this question. Comments are grouped in three categories.
Air Void Significance
All 46 respondents said that air voids play a significant role in the performance and life of asphalt concrete pavement. Fourteen (30 percent) described the role as
• Critical [to have an acceptable range] • Significantly influencing life of asphalt pavement • Playing a tremendous part in performance • Very critical (four agencies used this description) • All-important • Very important • Having a dramatic effect • The most important item relative to life • The single most important property affecting durability • One of the most important criteria • Extremely important
Minimum Air Voids
Twenty of the respondents (44 percent) commented that too few air voids cause a reduction in pavement life due to rutting, shoving, and bleeding. Eight of the 20 respondents indicated a minimum field-air-void content to avoid this distress. The specified minimum air-void level and the number of agencies reporting that level are listed below.
1-2 percent-1 agency 2 percent-2 agencies 3 percent-3 agencies 4 percent-2 agencies
TRANSPORTATION RESEARCH RECORD 1217
One agency commented that low air voids in the surface mix are more likely than raveling to cause pavements to fail.
Maximum Air Voids
Of the 46 respondents, 44 indicated that increasing or excessive air voids adversely affect pavement performance and life. Opinions ranged widely, however, on the level of air voids at which performance and life begin to be affected. Fourteen agencies (30 percent) reported the following levels.
3 percent-1 agency 4 percent-1 agency 5 percent-1 agency 6 percent-5 agencies 7 percent-1 agency 8 percent-3 agencies
10 percent-1 agency 11 percent- I agency
Question:
8. (d) In your opinion, what is the effect of increasing air voids on asphalt pavement life, expressed as a percentage of design life, for the following field (as constructed) air void contents: 4% __ 5% __ 6% __ 7% __ 8% __ 9% __ 1Q% __ ll% __ l2% __ (Normally, 4 to 6 percent air voids would constitute 100 percent of design life.)
Analysis:
Twenty-eight respondents (only 58 percent of the whole sample) addressed this question, the most subjective one in the questionnaire. The opinions of those agencies that did respond varied widely, but suggest that air void levels above about 6 percent will decrease asphalt concrete life by about 7 percent for each 1 percent increase in air voids.
Percent of Design Life
Air Void Content(%) Range Average
4 20-120 97 5 30-120 97 6 70-120 98 7 50-100 93 8 40-100 87 9 30-100 79
10 20-100 73 11 10-95 62 12 0-90 54
AIR VOID EFFECTS ON PAVEMENTS IN WASHINGTON STATE
In Washington State, data from WSPMS support the results of the questionnaire survey. The Washington State Department of Transportation (WSDOT) has conducted visual condition surveys of the entire state system every 2 years since
Linden et al. 27
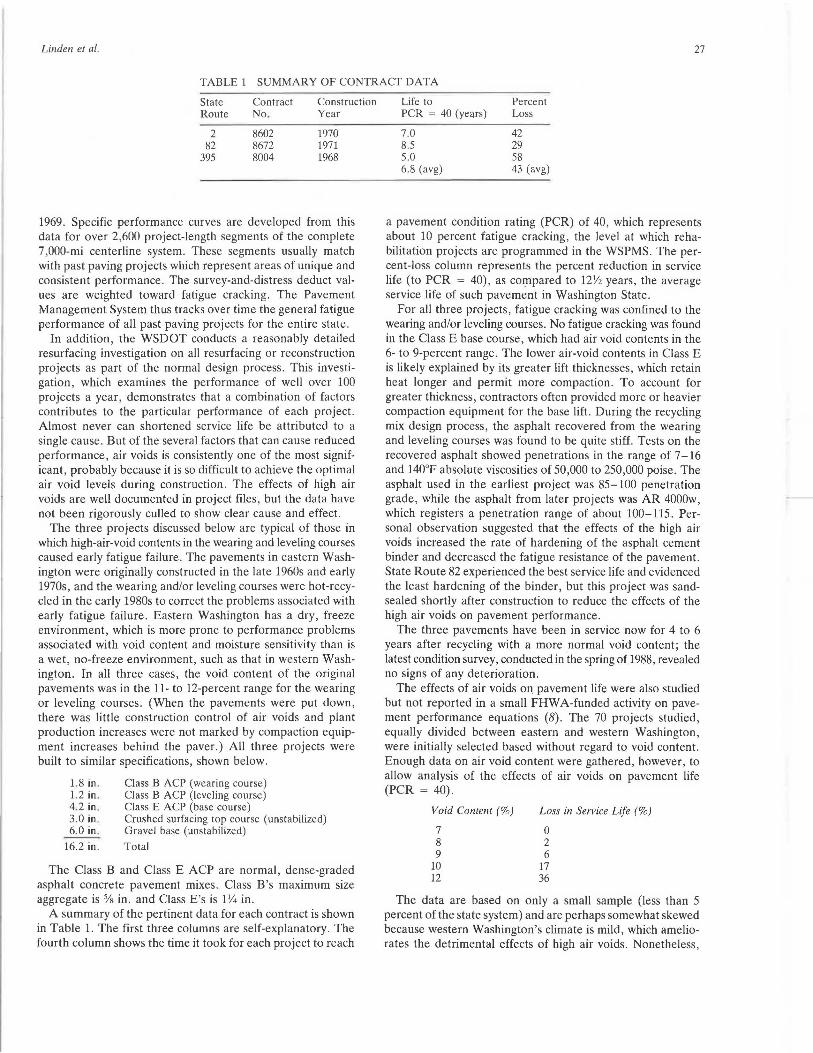
TABLE 1 SUMMARY OF CONTRACT DATA
State Contract Construction Route No. Year
2 8602 1970 82 8672 1971
395 8004 1968
1969. Specific performance curves are developed from this data for over 2,600 project-length segments of the complete 7 ,000-mi centerline system. These segments usually match with past paving projects which represent areas of unique and consistent performance. The survey-and-distress deduct values are weighted toward fatigue cracking. The Pavement Management System thus tracks over time the general fatigue performance of all past paving projects for the entire state.
In addition, the WSDOT conducts a reasonably detailed resurfacing investigation on all resurfacing or reconstruction projects as part of the normal design process. This investigation, which examines the performance of well over 100 projects a year, demonstrates that a combination of factors contributes to the particular performance of each project. Almost never can shortened service life be attributed to a single cause. But of the several factors that can cause reduced performance, air voids is consistently one of the most significant, probably because it is so difficult to achieve the optimal air void levels during construction. The effects of high air voids are well documented in project files, but the data have not been rigorously culled to show clear cause and effect.
The three projects discussed below are typical of those in which high-air-void contents in the wearing and leveling courses caused early fatigue failure. The pavements in eastern Washington were originally constructed in the late 1960s and early 1970s, and the wearing and/or leveling courses were hot-recycled in the early 1980s to correct the problems associated with early fatigue failure. Eastern Washington has a dry, freeze environment, which is more prone to performance problems associated with void content and moisture sensitivity than is a wet, no-freeze environment, such as that in western Washington. In all three cases, the void content of the original pavements was in the 11- to 12-percent range for the wearing or leveling courses. (When the pavements were put down, there was little construction control of air voids and plant production increases were not marked by compaction equipment increases behind the paver.) All three projects were built to similar specifications, shown below.
1.8 in. 1.2 in . 4.2 in. 3.0 in. 6.0 in .
16.2 in.
Class B ACP (wearing course) Class B ACP (leveling course) Class E ACP (base course) Crushed surfacing top course (unstabilized) Gravel base (unstabilized)
Total
The Class B and Class E ACP are normal, dense-graded asphalt concrete pavement mixes. Class B's maximum size aggregate is % in. and Class E's is 1114 in.
A summary of the pertinent data for each contract is shown in Table 1. The first three columns are self-explanatory. The fourth column shows the time it took for each project to reach
Life to Percent PCR = 40 (years) Loss
7.0 42 8.5 29 5.0 58 6.8 (avg) 43 (avg)
a pavement condition rating (PCR) of 40, which represents about 10 percent fatigue cracking, the level at which rehabilitation projects are programmed in the WSPMS. The percent-loss column represents the percent reduction in service life (to PCR = 40), as cm_n.pared to 12Y2 years, the average service life of such pavement in Washington State.
For all three projects, fatigue cracking was confined to the wearing and/or leveling courses. No fatigue cracking was found in the Class E base course, which had air void contents in the 6- to 9-percent range. The lower air-void contents in Class E is likely explained by its greater lift thicknesses, which retain heat longer and permit more compaction. To account for greater thickness, contractors often provided more or heavier compaction equipment for the base lift. During the recycling mix design process, the asphalt recovered from the wearing and leveling courses was found to be quite stiff. Tests on the recovered asphalt showed penetrations in the range of 7-16 and 140°F absolute viscosities of 50,000 to 250,000 poise. The asphalt used in the earliest project was 85-100 penetration grade, while the asphalt from later projects was AR 4000w, which registers a penetration range of about 100-115. Personal observation suggested that the effects of the high air voids increased the rate of hardening of the asphalt cement binder and decreased the fatigue resistance of the pavement. State Route 82 experienced the best service life and evidenced the least hardening of the binder, but this project was sandsealed shortly after construction to reduce the effects of the high air voids on pavement performance.
The three pavements have been in service now for 4 to 6 years after recycling with a more normal void content; the latest condition survey, conducted in the spring of 1988, revealed no signs of any deterioration.
The effects of air voids on pavement life were also studied but not reported in a small FHWA-funded activity on pavement performance equations (8). The 70 projects studied, equally divided between eastern and western Washington, were initially selected based without regard to void content. Enough data on air void content were gathered, however, to allow analysis of the effects of air voids on pavement life (PCR = 40).
Void Content (%)
7 8 9
10 12
Loss in Service Life (%)
0 2 6
17 36
The data are based on only a small sample (less than 5 percent of the state system) and are perhaps somewhat skewed because western Washington's climate is mild, which ameliorates the detrimental effects of high air voids. Nonetheless,

28
TABLE 2 EFFECT OF COMPACTION ON PAVEMENT PERFORMANCE
Pavement Life Reduction ( % )
Air Voids(%) Literature"
7 8 9
10 11 12
0 10 20 30 40 50
"Lower bound of range . bAverage.
SHA Survey"
7 13 21 27 38 46
WSPMS
0 2 6
17
36
the data confirm the findings of the previously described SHA survey.
FINDINGS
Table 2 summarizes the findings on the effect of compaction (specifically, air voids) on asphalt concrete pavement performance.
All three sources of information confirm that air void content affects pavement performance. The rule-of-thumb that emerges is that each 1 percent increase in air voids (over a base air void level of 7 percent) results in about a 10 percent loss in pavement life (or about 1 year less).
Of course, the performance of asphalt concrete is affected by more than just air void content. Although the primary goal of the SHA survey was to estimate the effects of air voids, the summary of the responses necessarily addresses current mix design procedures, compaction specifications, and field practice, all of which play a part in performance outcome.
CONCLUSIONS
Results of an examination of the literature, a survey on compaction practice, and performance data from WSPMS lead to the following conclusions.
1. An analysis of the available literature and WSPMS data suggest that both fatigue cracking and age-hardening of dense asphalt concrete mixtures is exacerbated by poor compaction
TRANSPORTATION RESEARCH RECORD 1217
(high air voids). Further, pavement life is reduced about 10 percent for each 1 percent increase in air voids over a base level of 7 percent. The SHA survey on compaction practice tended to confirm this finding.
2. The survey of the SHAs reveals that compaction specifications, field practice, and asphalt concrete performance vary widely from state to state. Although some questions in the survey were subjective, the responses still tend to show a definite correlation between compaction and pavement life.
ACKNOWLEDGMENT
The authors greatly appreciate the response to the survey from the state departments of transportation.
REFERENCES
1. F. N. Finn and J. A. Epps. Compaction of Hot Mix Asphalt Concrete. Research Report 214-21. Texas Transportation Institute, Texas A&M University, College Station, Aug. 1980.
2. J. A. Epps and C. L. Monismith. Fatigue of Asphalt Concrete Mixtures-Summary of Existing Information. Special Technical Publication 508. ASTM, Philadelphia, Pa., 1971.
3. P. Puangchit, R. G. Hicks, J.E. Wilson, and C. A. Bell. Impact of Variation in Material Properties on Asphalt Pavement Life, Report FHWA-OR-82-3. Oregon Department of Transportation, Salem, May 1982.
4. J. F. Goode and E. P. Owings. A Laboratory-Field Study of Hot Asphaltic Concrete Wearing Course Mixtures. Public Roads, Vol. 31, No. 11, Dec. 1961.
5. P. Hubbard and H. Gollomb. The Hardening of Asphalt with Relation to Development of Cracks in Asphalt Pavements. In Proceedings of the Association of Asphalt Paving Technologists, Vol. 9, Dec. 1937.
6. F. N. Finn, K. Nair, and J. M. Hilliard. NCHRP Report 195: Minimizing Premature Cracking in Asphaltic Concrete Pavement. TRB, National Research Council, Washington, D.C., 1978.
7. R. N. Linden. The Effect of Air Voids on Asphalt Concrete Pavement Performance. M.S. research report. University of Washington, Seattle, Aug. 1987.
8. J. P. Mahoney, R. K. Kay, and N. C. Jackson. Pavement Performance Equations. Research Report WA-RD-143.1. Washington State Department of Transportation, Olympia, Mar. 1988.
Publication of this paper sponsored by Committee on Flexible Pavement Construction and Rehabilitation.
Recommended