Edexcel AS and A level Geography
Topic Booklet for Area of Study 3: Physical Systems and Sustainability, Topic 5: The
Water Cycle and Water Insecurity
Practical support to help you deliver this Edexcel
specification
The issues-based approach to studying this topic enables students to explore and evaluate contemporary examples of how water insecurity and climate change is impacting on both the human and physical worlds. This complexity is examined and
developed through issues and questions with the aim that students become more critical, reflective and independent learners.
Through learning about the physical environment and how both the hydrological cycle and river systems work, the aim is for students to be able to apply this
knowledge in real-world environments that are both familiar and unfamiliar to them. There are areas of the previous specification that can be brought over, especially
still-relevant and up-to-date case study examples that can come from both the UK and abroad. The recent floods caused by Storm Desmond within the Lake District National Park, the ongoing issues of California’s water supply, and that of the Ganges
and Nile Basin as the Grand Renaissance Dam is near completion will offer students a clear understanding of the issues associated with trans-boundary sources. Whilst
these studies offer good insights, students and teachers should not be limited by them. There are 276 trans-boundary rivers globally and 200 trans-boundary aquifers, many of which have agreements (www.un.org/waterforlifedecade/
transboundary_waters.shtml) and it is important that students realise that conflict is often the last resort.
The guided learning hours are 180 for an AS level and 360, over two years, for an A
level. This document provides a topic guide for teaching Topic 5: The Water Cycle and Water Insecurity, and can be adapted by centres to fit their own contexts and teaching styles. It has been produced as an example approach and is not intended to
be prescriptive. The topic guides indicate resources that you can use to support your teaching. These are only suggestions and you are encouraged to use a wide range of
resources to suit the needs of your own students. The advised teaching time for Topic 5 is approximately 18 guided learning hours; i.e.
roughly 6 hours per enquiry question (EQ). This requires some blending together of the detailed content. In the guidance below, suggestions are made about
contextualisation or stretch challenges that may be suitable for more able students, as well as expected lesson outcomes for those less able. Please note that these are suggestions only and not specific syllabus requirements.

2 © Pearson Education Ltd 2016. Copying permitted for purchasing institution only. This material is not copyright free.
Each enquiry question is broken down into different sections, each beginning with a quick overview of the breadth of the enquiry question followed by a more detailed
explanation of the key concepts and processes, examples of teaching strategies, guidance on integrating geographical skills, and a summary of the key terminology
required. The structure is suggestive, not prescriptive.
Synoptic linkages
Our synoptic themes help students see ‘the bigger picture’, by encouraging them
to make geographical links between topics and issues. To enable this, and support exam preparations, we’ve continued to signpost ‘Players’ (P), ‘Attitudes and Actions’ (A) and ‘Futures and Uncertainties’ (F) throughout the specification
content.
Synoptic links can be made with development and changes in demand such as deforestation, as well as land use changes. The topic can also be linked to energy supply in regards to HEP, whilst it is also important with regards to glaciation and
coastal geography in terms of climate and precipitation.
© Pearson Education Ltd 2016. Copying permitted for purchasing institution only. This material is not copyright free. 3
Introduction Overview
The constant human and physical changes to our environment present challenges within the hydrological system. This topic aims to develop students’ awareness of these and help them understand more deeply the processes that work within the hydrological cycle.
EQ1: What are the processes operating within the hydrological cycle from global to local scale?
EQ2: What factors influence the hydrological system over short- and long-term timescales?
EQ3: How does water insecurity occur, and why is it becoming such a global issue for the 21st century?
EQ1: What are the processes operating within the
hydrological cycle from global to local scale?
Teaching approach over 4–5 hours
Lesson 1 (1hr) The global hydrological cycle
Lesson 2 (1hr) The drainage basin is an open system
Lesson 3 (1hr) Water budgets and river systems
Lesson 4 (1hr) Storm hydrographs and physical features of drainage basins
Lessons 1 and 2: The global hydrological cycle and the drainage basin
Overview
These lessons review Key ideas 5.1a, b and c, and 5.2a, b and c. The global hydrological cycle is of enormous importance to life on Earth. The drainage basin is
an open system within the global hydrological cycle.
There are several ways to introduce this topic. Students need to be aware of the importance of the physical geography before they progress. For less able students, resources such as missing words diagrams where they have to fill in spaces, or
missing word text tasks with the words listed at the bottom of the worksheet, will help in aiding them to understand the system and cycle that occurs, and how water
passes through it. More able students could try to explain relevant terms to each other to help gain an understanding of how the system works.
4 © Pearson Education Ltd 2016. Copying permitted for purchasing institution only. This material is not copyright free.
Key concepts and processes
The hydrological cycle:
o A clear understanding of how water passes through the system; in terms of inputs, outputs, stores and flows.
o The relative importance and size of the water stores and the annual fluxes between the atmosphere and the land.
The key terms associated with the cycle
The key processes within a drainage basin and the factors that impact upon it: 1. Basin size and shape
2. Relief 3. Type of precipitation 4. Temperature/Climate
5. Land use 6. Rock type
7. Soil type 8. Drainage density 9. Tides and storm surges.
Humans disrupt the drainage basin cycle, by accelerating processes such as: o deforestation
o land use change o new water storage reservoirs
o abstraction.
Guidance on teaching
Students often struggle with the concept of systems diagrams. However,
understanding them will help with Key skill 1 (Use of diagrams showing proportional flows within systems). Students can work on empty drawn systems diagrams where
some of the stages are left blank for them to fill in. This helps develop a clearer understanding of the system. For proportional flows within the system, examples like
this might help. This site also has a helpful diagram (under hydrological cycle). Another good exercise for students to appreciate the work of solar energy and
gravitational potential energy can be found here: http://serc.carleton.edu/eslabs/weather/2a.html. This includes a video and an
exercise that could be completed in class to help students appreciate how it works; this would be especially suitable for less able students. Less able students may also benefit from drawing the hydrological cycle on a blank diagram such as this, while
commenting on each individual part.
Different drainage basins can be looked at via photographs or images. You could ask students to label the relevant factors that influence drainage basins.
The understanding of size, relief, geology, precipitation type and land use is paramount for students to appreciate the nature of how the system works and how
specific factors can impact upon it. There is an excellent question on the previous specification (Unit 3, 6GE03 – 2014
resource booklet, page 3, with the 10-mark question on page 2), which can be used to help students understand how physical factors influence water availability.
© Pearson Education Ltd 2016. Copying permitted for purchasing institution only. This material is not copyright free. 5
More able students could investigate different basins within different areas of the world and begin to develop an understanding of how the movement of clouds and
precipitation is affected by the land, such as orographic rainfall.
Lesson 3: Water budgets and river systems
Overview
Lesson 3 develops Key idea 5.3: The hydrological cycle influences water budgets and
river systems at a local scale. The lesson should include what water budgets and river systems are, and the importance of understanding river regimes. The global
water budget is a specification of inflows, outflows and changes of stored volume of water for a defined water system during a specified period; some of this may be available to humans to use. Students should also look at how water stores have
different residence times in terms of how long they remain within the system before returning to the sea. Key skill 2 (Comparative analysis of river regime annual
discharges) should be covered. For more able students there is plenty of scope to develop ideas surrounding the
ideas of water stores and their importance, whilst synoptic links can be made with development and climate change as this could have a major impact on long-term
sources such as glaciers, ice caps and permafrost, which could also create links with energy security.
For less able students, give exemplification from several different regimes with several different climates. This site offers an excellent study with lots of links to the
River Colorado: www.geocoops.com/the-water-balance.html; it also has good lower ability tasks that can be carried out.
Key concepts and processes
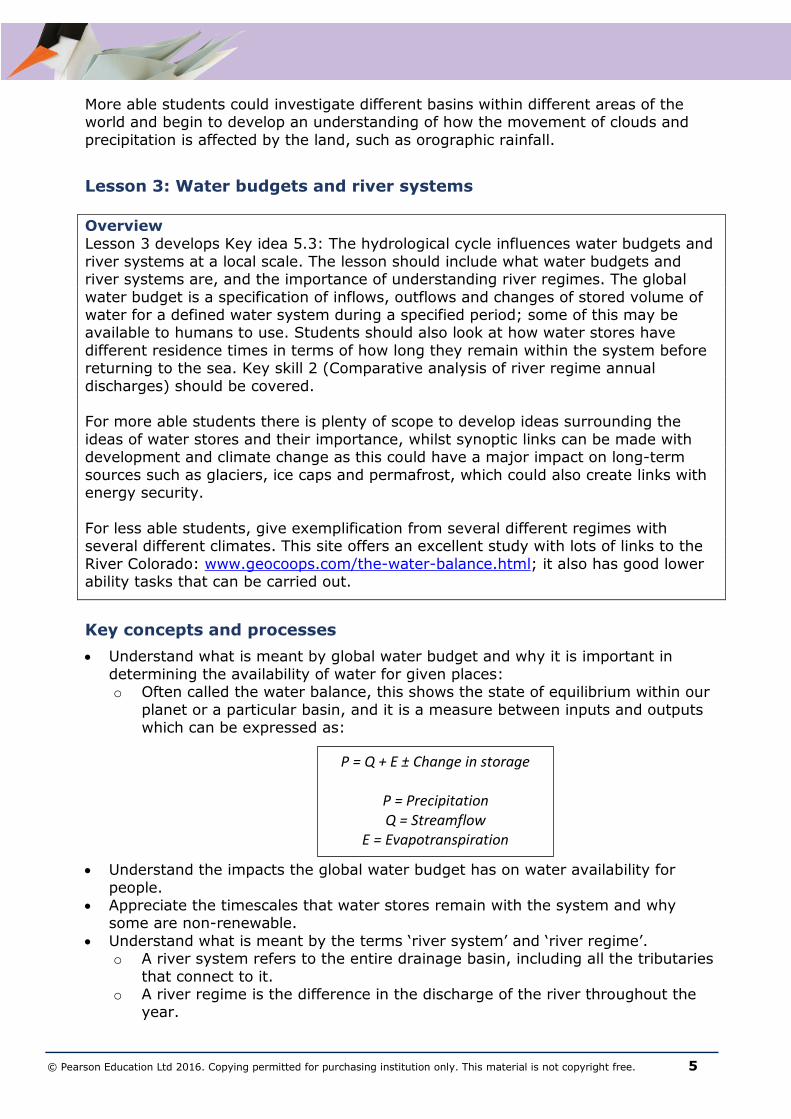
Understand what is meant by global water budget and why it is important in
determining the availability of water for given places: o Often called the water balance, this shows the state of equilibrium within our
planet or a particular basin, and it is a measure between inputs and outputs which can be expressed as:
Understand the impacts the global water budget has on water availability for
people. Appreciate the timescales that water stores remain with the system and why
some are non-renewable.
Understand what is meant by the terms ‘river system’ and ‘river regime’. o A river system refers to the entire drainage basin, including all the tributaries
that connect to it. o A river regime is the difference in the discharge of the river throughout the
year.
P = Q + E ± Change in storage
P = Precipitation Q = Streamflow
E = Evapotranspiration
6 © Pearson Education Ltd 2016. Copying permitted for purchasing institution only. This material is not copyright free.
Guidance on teaching
There is some interesting information online on water budgets such as this link from Michigan State, USA (www.michigan.gov/documents/deq/lwm-waterbudget_202791_7.pdf).
Furthermore, the UNEP have some great information on residence times; these begin
the length of time water remains as part of an individual store, including the image here. More information on this is in the Further reading list.
Students should understand that as a finite resource there is only so much water available to use at any given time. The water budget can be used to help people
manage water supply and to predict whether or not there will be water shortage or catchment issues, such as falls in the water table. This is done with the aid of river regimes, which will be part of Lesson 4; however, these could potentially be taught
at the same time.
Water budgets generally take the form of graphs and students should be able to understand how these work and plot them. This is important for Key skill 3 (Analysis and construction of water budget graphs). Example water budgets can be found for
here: www.geocoops.com/uploads/2/4/5/3/24532387/3604193_orig.png.
A water budget chart building programme can be found on the USGS website, which may help in the building of resources though may only benefit the computer literate: http://water.usgs.gov/nrp/gwsoftware/GW_Chart/GW_Chart.html
More able students may wish to try this and develop GIS skills early on within this topic. They may also like to look in more depth at the water table and the impact
this can have on the water budget.
Lesson 4: Storm hydrographs and physical features of drainage
basins
Overview
This lesson looks at Key idea 5.3c (Storm hydrographs depend on physical features within a drainage basin), with the aim of developing students’ understanding of how the system is linked in terms of key precipitation patterns and how the physical
factors within the drainage basin can impact on the drainage basin cycle.
Students need to be able to use comparative data, labelling features of storm hydrographs (Key skill 4). Being able to read, plot and ascertain information from different storm hydrographs will help them develop their understanding of the
processes of interception, runoff, saturated overland flow, evaporation, transpiration and channel flow.
Many examples can be found online and from previous Edexcel legacy specifications (2000) if you still have copies. One example is www.availeducation.com/hydrology-
water-management/, whilst Education Scotland have a task sheet that students may find useful: see www.educationscotland.gov.uk/Images/Hydrographs_tcm4-
302099.doc. There are several ways to teach these; however, much of it will depend on students’ prior learning from the previous lessons.
© Pearson Education Ltd 2016. Copying permitted for purchasing institution only. This material is not copyright free. 7
Understanding of the controlling factors (geology, vegetation, soil type, the type of precipitation, temperature, land use, and basin size and shape) will aid students in
appreciating the impacts that they have on the basin and this is very important when it comes to looking at flood risks within catchment areas.
It is important that less able students develop an awareness of the relative importance of the inputs, flows and outputs, and that they can appreciate the variety
of basin types and the importance of the factors within them.
For more able students, diagrammatic representations of different basins from photographs or Google Earth may present discussion points in terms of size, shape and vegetation cover, whilst soils and geology can be looked at via drainage
patterns.
Key concepts and processes
Different types of precipitation patterns: students should appreciate that
orographic, frontal and convectional rainfall types exist and should be aware of the different settings these occur in.
Precipitation is an input into the system whilst interception, infiltration, direct
runoff, overland flow, throughflow, groundwater flow and percolation are all flows within the system.
Evaporation, transpiration and channel flow represents outputs from the system. There are many factors that influence how drainage basins react to precipitation
and the following should be understood:
o climate o soil type
o geology o vegetation cover
o relief o size and shape of the basin.
Guidance on teaching
An understanding of the different types of rainfall and how they occur can be found here with a video from the Met Office. More information on the climate of the British
Isles and the rainfall types is also available here.
Less able students should have a good working knowledge of the hydrological cycle; they will need to begin to appreciate the relative importance of the differing factors that influence the inputs, outputs and flows, and how these can be linked to specific
problems such as flooding or reduction in flows.
The factors that influence how a basin reacts to precipitation can be studied by looking at a variety of basins (this may have been done at GCSE). For example, see
www.physicalgeography.net/fundamentals/10aa.html and also look at the links below. More able students may wish to consider geological maps and review the rock type and its porosity, try to find areas that represent different drainage systems and
review or research issues within them. For instance, Boscastle has steep sides, impermeable rock and clay-based soils, all of which impacted on the flooding of
2004. This can be clearly drawn out by the storm hydrograph of the basin, which can
8 © Pearson Education Ltd 2016. Copying permitted for purchasing institution only. This material is not copyright free.
be compared with one which has different factors affecting it. Hydrographs illustrate the discharge of a river over a given period of time. They are useful when
considering the impacts of rainfall and flooding events, and for students this can be looked at via land use and certain areas where known floods have occurred.
Students could investigate the importance of drainage basins, size and shape, geology, relief and vegetation, as well as the importance of human factors. Examples include Boscastle (2004), Keswick (2015) and Southeast London (2016), all of which
can be investigated to look at the relative importance of each factor.
It is also important that students begin to think of the synoptic themes, and assess the impacts and the role that planners have had on these environments and how well the land has been used. Students should consider the different types of planning
from land use to urbanisation and how the allowance of deforestation in some areas has been costly in terms of increasing the impacts. A long article from the World
Meteorological Organization is here: www.apfm.info/publications/tools/ Tool_07_The_Role_of_Land_Use_Planning_in_FM.pdf. Other useful articles can be found at:
http://planningguidance.communities.gov.uk/blog/guidance/flood-risk-and-coastal-change/planning-and-flood-risk/, www.bbc.co.uk/news/uk-35246752 and
www.bbc.co.uk/news/uk-25929644.
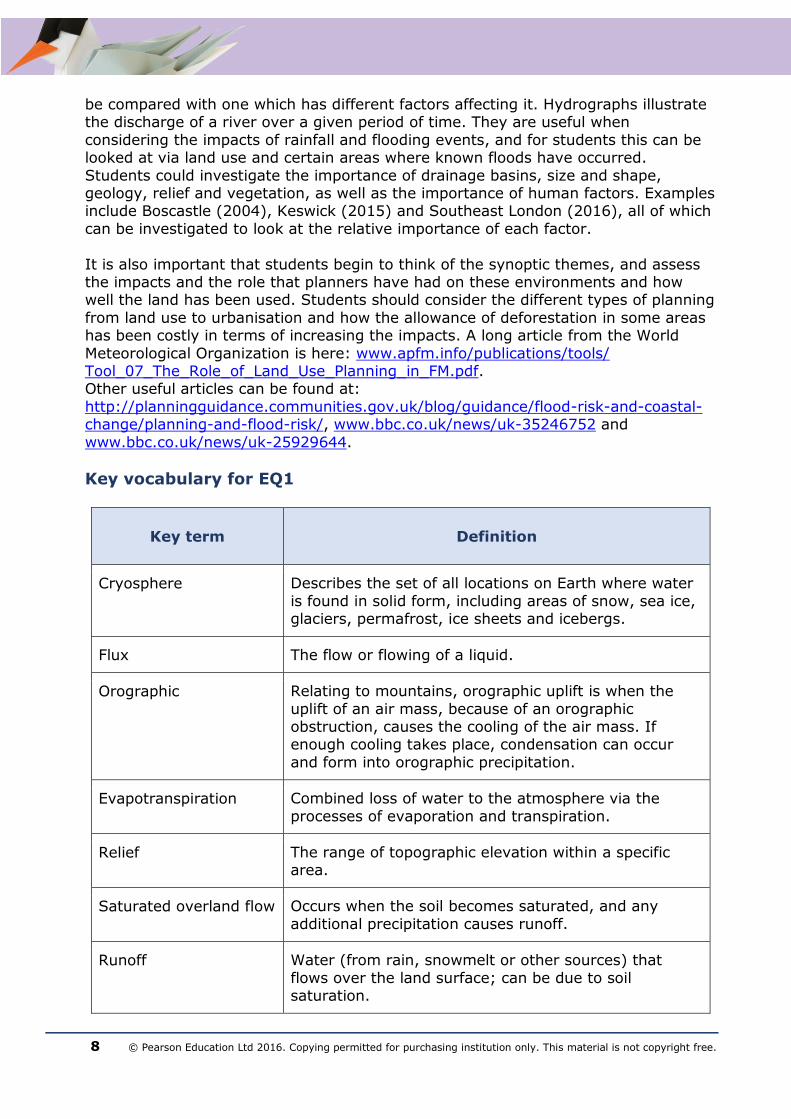
Key vocabulary for EQ1
Key term Definition
Cryosphere Describes the set of all locations on Earth where water
is found in solid form, including areas of snow, sea ice, glaciers, permafrost, ice sheets and icebergs.
Flux The flow or flowing of a liquid.
Orographic Relating to mountains, orographic uplift is when the
uplift of an air mass, because of an orographic obstruction, causes the cooling of the air mass. If enough cooling takes place, condensation can occur
and form into orographic precipitation.
Evapotranspiration Combined loss of water to the atmosphere via the
processes of evaporation and transpiration.
Relief The range of topographic elevation within a specific area.
Saturated overland flow Occurs when the soil becomes saturated, and any
additional precipitation causes runoff.
Runoff Water (from rain, snowmelt or other sources) that
flows over the land surface; can be due to soil saturation.
© Pearson Education Ltd 2016. Copying permitted for purchasing institution only. This material is not copyright free. 9
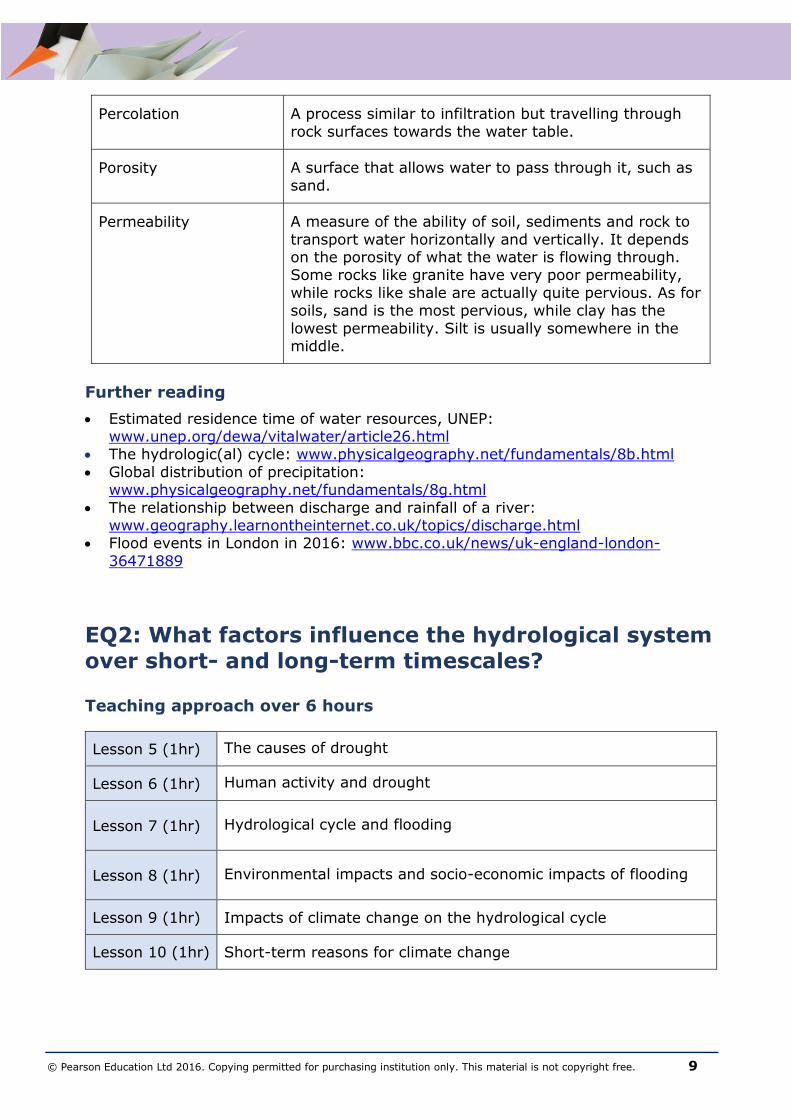
Percolation A process similar to infiltration but travelling through
rock surfaces towards the water table.
Porosity A surface that allows water to pass through it, such as
sand.
Permeability A measure of the ability of soil, sediments and rock to
transport water horizontally and vertically. It depends on the porosity of what the water is flowing through. Some rocks like granite have very poor permeability,
while rocks like shale are actually quite pervious. As for soils, sand is the most pervious, while clay has the
lowest permeability. Silt is usually somewhere in the middle.
Further reading
Estimated residence time of water resources, UNEP: www.unep.org/dewa/vitalwater/article26.html
The hydrologic(al) cycle: www.physicalgeography.net/fundamentals/8b.html
Global distribution of precipitation: www.physicalgeography.net/fundamentals/8g.html
The relationship between discharge and rainfall of a river: www.geography.learnontheinternet.co.uk/topics/discharge.html
Flood events in London in 2016: www.bbc.co.uk/news/uk-england-london-
36471889
EQ2: What factors influence the hydrological system
over short- and long-term timescales? Teaching approach over 6 hours
Lesson 5 (1hr) The causes of drought
Lesson 6 (1hr) Human activity and drought
Lesson 7 (1hr) Hydrological cycle and flooding
Lesson 8 (1hr) Environmental impacts and socio-economic impacts of flooding
Lesson 9 (1hr) Impacts of climate change on the hydrological cycle
Lesson 10 (1hr) Short-term reasons for climate change
10 © Pearson Education Ltd 2016. Copying permitted for purchasing institution only. This material is not copyright free.
Lessons 5 and 6: Causes and consequences of drought
Overview
These lessons look at Key ideas 5.4a, b and c. Deficits within the hydrological cycle result from physical processes but can have significant impacts such as ENSO cycles.
Humans can also increase the risk of drought and these lessons look at how this can impact ecosystems. Students develop a key understanding of how the physical
processes impact on the human world and how humans can also bring about some of the issues for themselves.
For more able students, there is the chance to develop clear links between the human and physical elements, as well as making synoptic links with poverty and aid.
Less able students will need guiding through this in terms of cause and effect. Good use of case studies such as California and Israel, as well as some closer to home
such as Spain and southern England, can highlight these problems and help students get a clearer understanding of both causes and impacts.
Key concepts and processes
The key causes of drought: o changes in weather patterns such as El Nino o short-term precipitation deficits, as well as longer-term trends brought about
by changes to climate. Human activity and how this can lead to drought:
o over-abstraction, both above and below ground o pollution.
The impact on ecosystems and how they cope with water changes: o wetlands o forests.
Guidance on teaching
This topic lends itself to exemplification of issues associated with drought. Changes
in rainfall patterns can be observed by looking at data such as www.bytemuse.com/post/drought-historical-rainfall-california/ (there are links here
to other sites where data can be ascertained). This type of task lends itself to Key skill 5 (Use of large databases to study the patterns and trends in floods and droughts worldwide). For the UK, data can be found on the Met Office website:
www.metoffice.gov.uk/public/weather/climate-historic/#?tab=climateHistoric. Clicking on any of the spots gives you an option to view historic station data, which
will give students significant amounts of data to work with. For working on Key skill 6 (Interpretation of synoptic charts and weather patterns,
leading to droughts and floods), the Met Office again has useful information: www.metoffice.gov.uk/public/weather/surface-
pressure/#?tab=surfacePressureColour&fcTime=1471262400. You may also like to look at this site, which offers more information and questions:
www.crsol.com/weather_routing_toolkit/idtoolkit/resources/content/analyze_synoptic_weather_how.pdf. MetLink has teachers’ notes and worksheets for this area of study: www.metlink.org/secondary/a-level/weather-charts/.
© Pearson Education Ltd 2016. Copying permitted for purchasing institution only. This material is not copyright free. 11
Other areas students need to consider include the ENSO cycle and its impacts around the globe, and how this can cause changes to the hydrological and meteorological
systems. This is often best achieved by looking at the origins and how this can impact globally through various examples. Again, California can be used as well as
Southern America and Australia. A good website that helps explain the impacts to precipitation is the State Climate Office of North Carolina: http://climate.ncsu.edu/climate/patterns/ENSO.html.
The impacts that droughts have on ecosystems can be looked at through student
research. More able students might want to look at forests in California and Spain and investigate how the impacts on wetlands generally can be seen through impacts of pollution on the Everglades. See, for example:
www.nytimes.com/1989/09/17/us/pollution-poses-growing-threat-to-everglades.html. The WWF also have a large amount of information on the
importance of wetlands: http://wwf.panda.org/about_our_earth/about_freshwater/intro/. Ramsar have a vast array of photographs and free publications that help both students and teachers
appreciate the importance of wetlands, why they should be protected and the problems they face: www.ramsar.org/.
Lessons 7 and 8: Causes of and consequences of flooding
Overview
These lessons look at Key ideas 5.5a, b and c and the causes, as well as consequences, of flooding. The problems with flooding can be viewed in a similar
way to droughts in that they can both have drastic impacts on both the human and physical environments. The basic physical causes are intense storms, unusually heavy or prolonged rainfall, extreme monsoonal rainfall and snowmelt.
This could easily be broken down via small case studies of individual events to
highlight the physical issues and the human consequences, for instance the intense rainfall at Boscastle 2004. The Keswick and Cumbrian floods due to Storm Desmond in 2015/16 can be used for prolonged rainfall, whilst students may wish to look at
the impacts of Pakistan’s monsoonal floods in 2016 in terms of snowmelt. This method can usually benefit less able students who will benefit from having these
events put into context. More able students may wish to research the areas in more depth, with many of the
different elements of impacts drawn on and the three main causes reviewed and examined in detail. Flood events such as those mentioned in previous lessons may
be looked at for small-scale events but for larger-scale events, students may want to look at Pakistan’s monsoonal floods, the 2014 SE Europe floods, as well as those associated with events such as hurricane Katrina 2005.
Key concepts and processes
Meteorological causes of flooding, including: o intense storms leading to flash flooding, where a low pressure system
develops and includes extreme rainfall over a short period of time
12 © Pearson Education Ltd 2016. Copying permitted for purchasing institution only. This material is not copyright free.
o unusually heavy or prolonged rainfall (rainfall above and beyond what an area normally receives at a specified time of year)
o extreme monsoonal rainfall (where extreme rainfall occurs due to winds blowing in from the sea to land on a seasonal basis bringing large-scale rainfall
at a specific time of year) o snowmelt (increased snowmelt that increases discharge of rivers further
downstream).
Human activity, to include: o land use changes within a river catchment
o mismanagement of rivers using hard engineering. Environmental damage caused by flooding:
o damage to soils
o impact on ecosystems. Socio-economic impacts:
o economic activity o infrastructure o settlement.
Guidance on teaching
Using case studies for each type of precipitation will help students put ideas into
perspective and allow them to develop an understanding of not only the differences but also what each of them share in common.
A good place to start for the causes of intense storms and the subsequent human socio-economic impacts is the summer of floods in 2007 and http://news.bbc.co.uk/1/hi/uk/7446721.stm, which shows what the causes and the
impacts were, with lots of links to other sites. The Centre for Ecology & Hydrology has an excellent report called ‘The summer 2007 floods in England & Wales – a
hydrological appraisal’, which can be searched and used by teachers for data and diagrams of the issues: see
www.ceh.ac.uk/sites/default/files/ceh_floodingappraisal.pdf. Also look at the Met Office report called ‘The recent storms and floods in the UK’ (February 2014): www.metoffice.gov.uk/media/pdf/n/i/Recent_Storms_Briefing_Final_07023.pdf.
Again, this provides excellent exemplar material for teachers and more able students.
There are several ways to consolidate Key skills 5 and 6 (discussed in the guidance on teaching for lessons 5 and 6) in these lessons. The monsoonal floods of India and
Pakistan offer an excellent case study for development: see www.bbc.co.uk/news/world-asia-india-29171823. Good information on the creation
of monsoons can be found at http://climate.ncsu.edu/edu/k12/.monsoons. The Royal Meteorological Society also has a lot of information that can be used: www.rmets.org/weather-and-climate/climate/indian-monsoon-changing-climate. The
seasonal changes in monsoonal weather patterns for Africa are shown here.
The principal ideas of all of these systems can be understood through lessons and research, as well as homework. Work on their impacts can be done via group work split into social, economic and environmental, with homework based on this from
personal research, or guided personal research for less able students. In these situations, it is often best to give less able students a list of websites and textbooks,
whilst stronger students should write a bibliography of resources.
© Pearson Education Ltd 2016. Copying permitted for purchasing institution only. This material is not copyright free. 13
Flash flooding can be dealt with in much the same way. The Met office has some good information on causes and also presents information on Boscastle in 2004 (see
Resources list at the end of this section).
Flash flooding occurs in various places and they can be deadly. Good examples to use could include the flash floods in southern France, near Montpellier, in October 2014: www.bbc.co.uk/news/world-europe-29529414.
Students who struggle with the factors that cause these types of events may wish to have them drawn up on summary sheets. Storm hydrographs can be drawn and
interpreted for events in the UK like Boscastle. There are ample examples of snowmelt within Europe and around the globe. It is
important for students to understand the seasonality of snowmelt (it is usually a springtime phenomenon); they need to be able to cite examples and know why it
occurs. Switzerland is a good example of snowmelt and its effects. The USGS have a great page called ‘Snowmelt – the water cycle’: http://water.usgs.gov/edu/watercyclesnowmelt.html.
Lessons 9 and 10: Climate change may have significant impacts on the hydrological cycle, globally and locally
Overview
These lessons look at Key ideas 5.6a, b and c; at how climate affects the inputs and
outputs within the hydrological cycle and the importance it might have on precipitation and evaporation rates.
As climate change affects stores and flows such as ice and river regimes, this can have an enormous impact on plans and projections for future demand. Students will
need to review all the different areas that climate change impacts upon and why. For less able students, point back to earlier lessons such as 1 and 2 to think about the
impacts of lower rainfall and higher temperatures, especially for areas such as California and Southern Spain.
For more able students, a development of synoptic links with globalisation, poverty, growing of cash crops and aid can be brought in, while less able students can devote
time to where and how rainfall will decrease and increase, and which areas of the world will be most affected. NASA has an excellent page that helps develop these ideas: http://earthobservatory.nasa.gov/Features/Water/page3.php. The maps on
this page can first be viewed individually, then paired and seen altogether, so that students can begin to build an impression of the future impacts.
Key concepts and processes
How climate change affects inputs and outputs:
o changes to trends in precipitation and evaporation o the reasons for and the impacts of these.
How climate change impacts on the stores and flows of the hydrological cycle:
o the impacts it will have on the different stores and the further issues this creates for the hydrological cycle.
14 © Pearson Education Ltd 2016. Copying permitted for purchasing institution only. This material is not copyright free.
The short-term changes in climate change: o ENSO oscillations and the uncertainty this presents
o the uncertainty over future global supplies and security.
Guidance on teaching
Prediction maps are models generated from past and future knowledge. More able students might point to their validity (if they have been taught Topic 2: Glaciation)
and the idea of feedback mechanisms. They are a good starting point for students to begin to appreciate that not all places will be hotter and dryer as a result of climate change. There is a good article from the Manchester Evening News:
www.manchestereveningnews.co.uk/news/greater-manchester-news/climate-change-vision-2040-manchester-10250908. For New York State, the possible
impacts can be found here: www.dec.ny.gov/energy/94702.html. Students may wish to research their own towns to consider and understand that not all places will be affected by climate change in the same way.
The diagram here (under ‘Projected precipitation changes’) shows one example of
global maps with rainfall prediction changes for the future. There are many other distribution maps on rainfall, population growth and
development that can be reviewed, as well as the IPCC projections that are shown here. Students can analyse these to consider the potential impacts of climate
change.
These projections could be used as a talking point for further issues associated with different countries in terms of water budgets, agriculture, population and water
security. One good way of doing this is to get students to give talks representing specific countries, about why and how climate change may lead to major problems
within their country.
Basins that rely on snowmelt, such as the Colorado, can be reviewed and the impacts that this may have in future for areas of California and water availability (see links below). More able students may wish to look at the impacts this might
have on the ecosystems of rivers.
Key vocabulary for EQ2
Key term Definition
Resilience Ability to recover from or adjust easily to an event or
change.
Deficit Where a resource is less than the necessary amount.
Permafrost Zone of permanently frozen water found in high latitude
soils and sediments.
Hard engineering Often hi-tech and high-cost engineering schemes such as
dams or the Thames Barrier.
© Pearson Education Ltd 2016. Copying permitted for purchasing institution only. This material is not copyright free. 15
Monsoon A seasonal prevailing wind.
ENSO An irregularly periodical variation in winds and sea surface temperatures over the tropical eastern Pacific
Ocean, affecting much of the tropics and subtropics; may also have impacts elsewhere around the world.
Meteorological The science that deals with the phenomena of the
atmosphere, weather and weather conditions.
Aquifer An underground layer of water-bearing rock or void.
Further reading
Drought and historical rainfall in California: www.bytemuse.com/post/drought-
historical-rainfall-california/ NOAA U.S. monthly climate normals (1981–2010):
https://gis.ncdc.noaa.gov/geoportal/catalog/search/resource/details.page?id=gov.noaa.ncdc:C00822
State climate office of North Carolina:
http://climate.ncsu.edu/climate/patterns/ENSO.html Met Office flash floods (link to Boscastle on this page):
www.metoffice.gov.uk/learning/rain/flash-floods Flash floods in France: www.bbc.co.uk/news/10337433 Rainfall figures about the Boscastle flood from Weather Online:
www.weatheronline.co.uk/reports/philip-eden/Some-facts-and-figures.htm Floods and soil erosion academic paper from Moscow Department of Physical
Geography and Land Use: www.eolss.net/sample-chapters/c01/e4-06-02-06.pdf The importance of soil to habitats: www.worldwildlife.org/threats/soil-erosion-
and-degradation
Excellent article on how soil erosion can create flooding in some areas due to development and deforestation: http://news.trust.org//item/20130423154348-
k239i/ Global warming – impact of climate change on global agriculture (Iowa State
University): www.extension.iastate.edu/agdm/articles/others/TakOct08.html Effects of global warming on snowpack in the Colorado River Basin:
www.wpi.edu/Pubs/E-project/Available/E-project-043009-125733/unrestricted/EffectsOfGlobalWarmingOnSnowpackInTheColoradoRiverBasin.pdf
Impacts of early snowmelt on river ecosystems (Colorado River):
www.southwestclimatechange.org/feature-articles/river-ecosystems ENSO from climate.gov: www.climate.gov/news-features/blogs/enso/what-el-
ni%C3%B1o%E2%80%93southern-oscillation-enso-nutshell
16 © Pearson Education Ltd 2016. Copying permitted for purchasing institution only. This material is not copyright free.
EQ3: How does water insecurity occur, and why is it
becoming such a global issue for the 21st century?
Teaching approach over 6–7 hours
Lesson 11 (1hr) The growing mismatch between water supply and
demand has led to a global pattern of water stress
Lesson 12 (1hr) The impacts that human development has on water
demand and the environment
Lesson 13 (1hr) Why some locations are at serious risk of water
insecurity due to rising demand
Lesson 14 (1hr)
The global pattern of water scarcity and its importance
for development, and the economic and environmental
problems that result from inadequate supplies
Lesson 15 (1hr) The management of water
Lessons 16 and 17 (2hrs) The different approaches to managing water supply
Lessons 11 and 12: The physical causes and human causes of water
insecurity
Overview
These lessons cover Key ideas 5.7a and b. By now students should be aware that for some countries there is a water security problem and that these countries can be at
different levels of development. The supply of water involves many aspects such as climate and precipitation, whilst demand is due to the level of development of a country and their population, as well as other factors. Insecurity has come about
when there is a mismatch between supply and demand, which can lead to problems within and between countries as well as continents. Students should be aware that
climate change can significantly affect water security.
Students should use global maps to analyse world water stress and scarcity. More and less able students should be able to identify the issues that are occurring within countries and the potential approaches to help alleviate them. The changes to
climate and salt water encroachment are two key concepts that students can review, with both California and Israel offering an understanding of these concepts.
Key concepts and processes
The growing mismatch between water supply and demand is leading to a global pattern of water stress and scarcity:
o Water stress refers to people who have access to less than 1700 m3 per person.
o Water scarcity refers to people with access to water below 1000 m3 per person.
© Pearson Education Ltd 2016. Copying permitted for purchasing institution only. This material is not copyright free. 17
The causes of water insecurity are physical: o climate variability
o salt water encroachment at the coast. The causes of water insecurity can also be human:
o over-abstraction from rivers, lakes and groundwater aquifers o water contamination from agriculture o industrial pollution.
Rising demand from a growing population, industry and agriculture is leading to serious implications in some areas.
Guidance on teaching
Much of this area was covered in the legacy specification. Water graphs can be found
on the UNEP website (as well as a discussion on water poverty indexes, which is useful for Lesson 14): www.unep.org/dewa/vitalwater/article77.html. There are maps here of countries struggling from water stress and also those countries
excessively withdrawing and with dependency issues, as well as issues in Africa relating to water supply via basins. The site also has excellent information on water
and conflicts, pollution and use. The causes have mostly been covered in previous lessons through the use of case
studies, but can be reviewed here if necessary. The movement of climatic belts may be introduced to help students appreciate the issues for marginal countries, e.g. the
idea that some countries will benefit from increased rainfall while others will lose out and the complexity of this happening within countries.
Since most people live on the coast, it is these areas that often suffer from the highest amount of withdrawals and over-abstraction of coastal aquifers, e.g. Israel
and California. California and Israel offer good case studies of areas where supply and demand are growing apart. The causes and consequences can be debated, and
students should then be able to apply these to other areas of the world such as the Nile Basin or China.
Lessons 13 and 14: The human causes and consequences of water
insecurity and the global pattern of physical water scarcity
Overview
These lessons cover Key ideas 5.7c, 5.8a and b. Many of the ideas should already have been touched on in previous lessons. The concentration for teachers here
should be on factors such as price, development, wellbeing, and the environmental as well as economic implications of water insecurity and how these impact on water
availability, scarcity and security. This could be achieved by looking at price, level of development and water poverty index (WPI) maps.
There are some excellent examples for students to look into. Whilst China’s pollution of rivers like the Yangtze and India’s of the Ganges is well-documented as they go
through industrialisation, often within MEDCs the real costs of water (cost of extraction, cleaning, impacts on the environment, etc.) and the heavy subsidies that are causing issues within these countries are not considered. Within Denmark, for
instance, the pricing structure has begun to take these factors into account. Students
18 © Pearson Education Ltd 2016. Copying permitted for purchasing institution only. This material is not copyright free.
could look at this and at countries that still heavily subsidise, like the USA and UK, to look at the implications it has both financially and environmentally.
Students should also be looking at tables of water poverty indexes (WPIs) and be
able to analyse and interpret these diamond graphs.
Key concepts and processes
There are finite water resources that face pressure from rising demand due to: o an increasing population
o improving living standards o industrialisation and agriculture.
The impacts that this has are increasingly serious in some locations and are
leading to an increasing risk of water insecurity. All of these are causing increased risks for planners in the future.
There are ways of measuring water poverty, which include the WPI. This takes into account:
o level of access to water o water quantity, quality and variability o water used for domestic, food and productive purposes
o capacity for water management (how well a country manages the water it has)
o environmental aspects such as damage and pollution.
Guidance on teaching
In an attempt to reduce unnecessary water consumption, the government in Denmark decided to raise water prices (between 1989 and 2012 the price rose from
€2 to €7 per metre cubed). The increased price is aimed at covering the supply of water (22% of cost), sewage and wastewater treatment (47% of cost), and taxes (31% of cost). Articles on Denmark’s water pricing are relatively abundant on the
internet and in books as well as academic papers – some are listed in the Resources section below. Other countries such as the USA (e.g. in California) struggle with the
price of water; again, links are listed in Resources. These two case studies can be used to compare how two different developed areas have approached the pricing structure of water and how they differ. For all OECD countries, water prices as of
2009 can be found here. This gives students an opportunity to discuss the issues and consequences for each country.
Further information on the WPI can be sourced from excellent documents such as http://portals.wi.wur.nl/files/docs/ppme/Water_poverty_index.pdf, a Centre for
Ecology & Hydrology leaflet. There is also an excellent PDF called ‘The Water Poverty Index: An International Comparison’ (http://econwpa.repec.org/eps/dev/papers/
0211/0211003.pdf). In Appendix 1, there are lots of datasets that teachers could use to help students draw comparisons between countries. Less able students will benefit from this approach as learning to draw, interpret and analyse different WPIs for
countries with different issues will help them to visualise these problems. More able students may benefit from interpreting and analysing different countries of a similar
type with similar issues.
The importance of water supply for economic development can be looked at in several ways by more able students, for instance by looking at the level of
© Pearson Education Ltd 2016. Copying permitted for purchasing institution only. This material is not copyright free. 19
development, health and other indices and matching these to water supply. Some students may understand the importance that water has in leading to social and
economic development. Less able students could be shown the Millennium Development Goals (MDGs), especially number 7c, the aim of which was to halve, by
2015, the proportion of the population without sustainable access to safe drinking water and basic sanitation. The importance of access to clean water and sanitation can be looked at through the WHO and the impacts that poor health has on
populations and their ability to develop. Less able students may benefit from looking at two extreme examples of this and the link that lack of access to water has on the
poverty cycle. A map of countries facing extreme water shortages by 2040 can be found in this link: www.telegraph.co.uk/news/earth/environment/11830276/Mapped-The-countries-
that-will-face-the-biggest-water-shortages-by-2040.html.
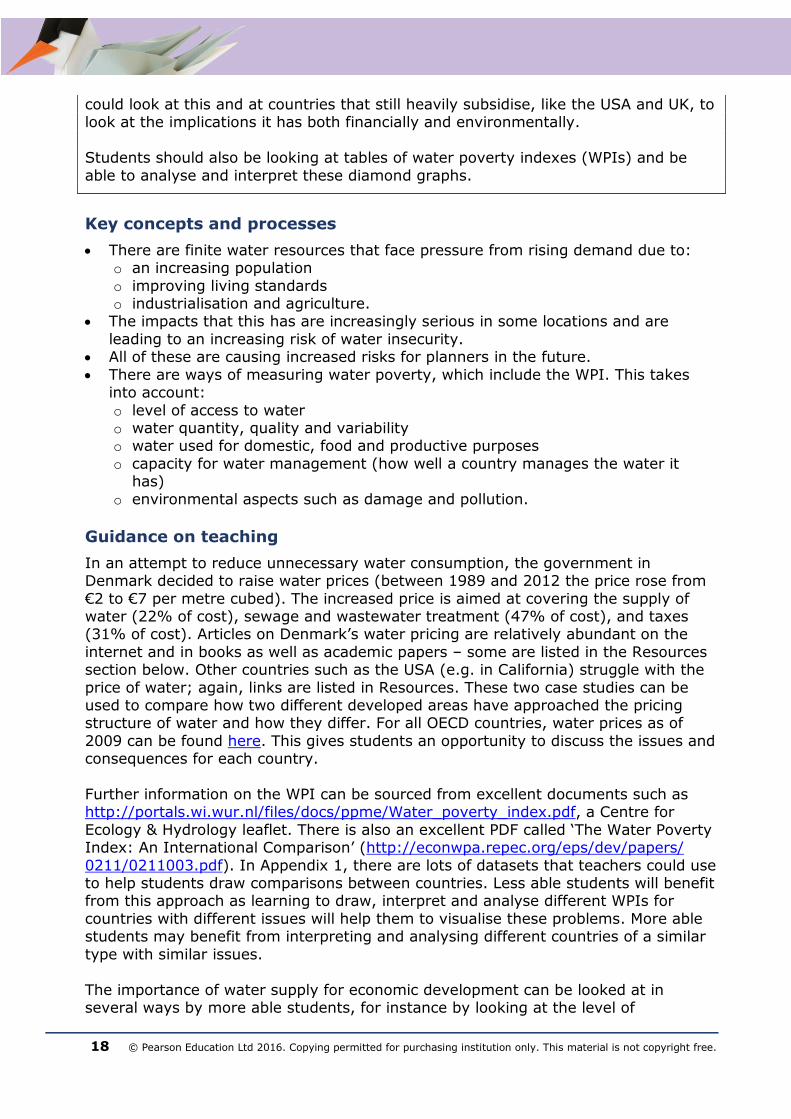
Figure 1 shows the importance of a clean water supply and how it can impact on development and health. Many parts of Africa (e.g. Botswana, Algeria and Namibia) struggle with these issues and can be investigated. More able students will be able to
differentiate between development levels in terms of access to water and access to food grown by water.
Figure 1 – The importance of a clean water supply
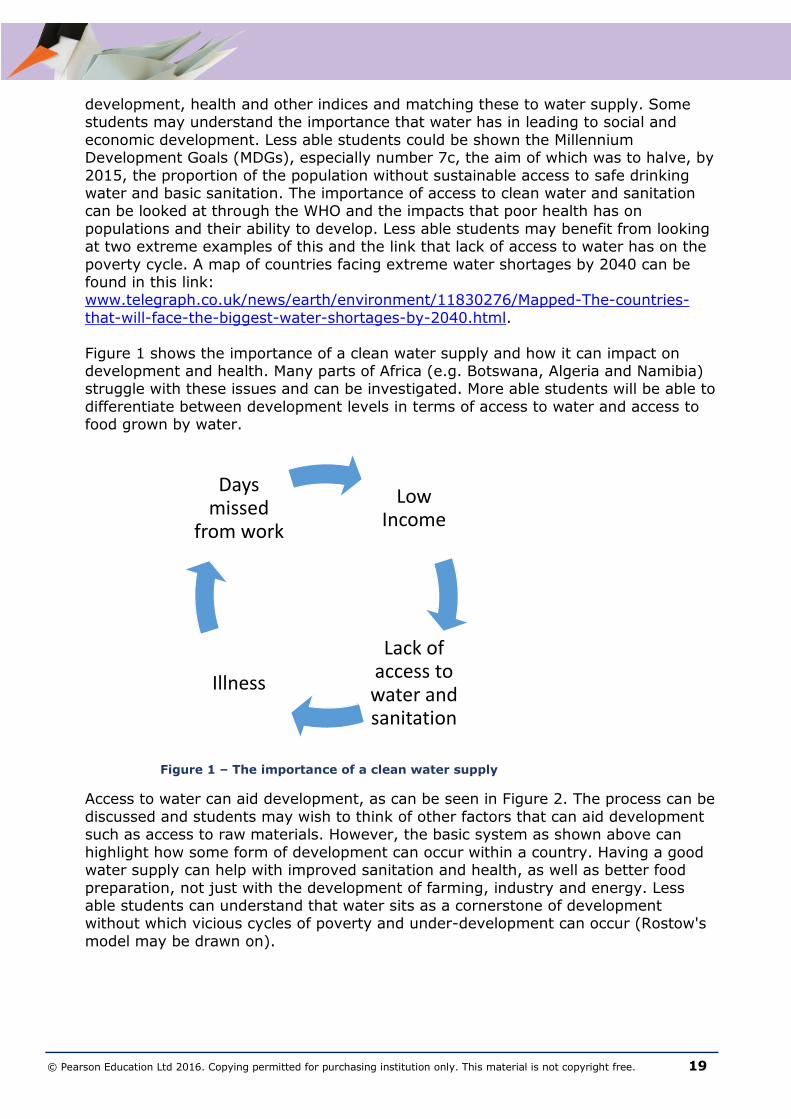
Access to water can aid development, as can be seen in Figure 2. The process can be
discussed and students may wish to think of other factors that can aid development such as access to raw materials. However, the basic system as shown above can
highlight how some form of development can occur within a country. Having a good water supply can help with improved sanitation and health, as well as better food
preparation, not just with the development of farming, industry and energy. Less able students can understand that water sits as a cornerstone of development without which vicious cycles of poverty and under-development can occur (Rostow's
model may be drawn on).
Low Income
Lack of access to water and sanitation
Illness
Days missed
from work
20 © Pearson Education Ltd 2016. Copying permitted for purchasing institution only. This material is not copyright free.
Figure 2 – How access to water can help development
Lessons 15, 16 and 17: Water conflict and management
Overview
These lessons cover the final areas of the topic: Key ideas 5.8c and 5.9a, b and c.
This topic is often best based on case study analysis, many of which can be used from the legacy specification, such as Colorado River Basin, Israel, Nile, Mekong and China. This approach may help less able students – by putting issues into context,
some students find it easier to ascertain the issues.
For examples of more sustainable schemes and restoration of water supplies, and smart irrigation as recycling, students could look at Singapore. Closer to home, the River Restoration Centre has a list of case studies that could be drawn on:
www.therrc.co.uk/case-studies-project#RRC, whilst in Florida the River Kissimmee could be looked at (see Resource section below).
More able students can build on the case study approach with personal research and development. Other techniques that may be helpful include SWOT (to look at each of
the schemes), cost benefit analysis (good for developing evaluative ideas on huge tech fixes like mega dams and trans-boundary water schemes), role-playing (as
different players within case studies) and student presentations.
Key concepts and processes
The potential for water conflicts to occur between users within a country, such as
farmers conflicting with urban areas and industry. The potential for water supply to be a source of conflict between trans-boundary
resources; good examples of this include Israel, The Nile Basin, The Colorado
River System and The Ganges and Brahmaputra Basins. The people who decide who uses what are increasingly becoming important
players, such as: o TNCs o governments
o intergovernmental organisations.
Access to waterAbility to grow
cropsAbility to sell and
make money
Re-invest into further agricultural
practices
Development of water supply
© Pearson Education Ltd 2016. Copying permitted for purchasing institution only. This material is not copyright free. 21
The development of technological fixes such as water transfer, mega dams and desalination plants have both positives and negatives in their use.
Often, simpler, intermediate and low-tech solutions such as water restoration, conservation and recycling schemes can be just as good (e.g. in Singapore since
2002 they have looked at different ways to create greater water efficiency). There has been development in laws to help maintain the fair use of water and
understand and appreciate that many players are involved in trying to reduce
water conflict, including: o The Helsinki Rules
o United Nations Economic Commission for Europe Water Convention o The Water Framework Directive and Hydropower, Berlin.
Guidance on teaching
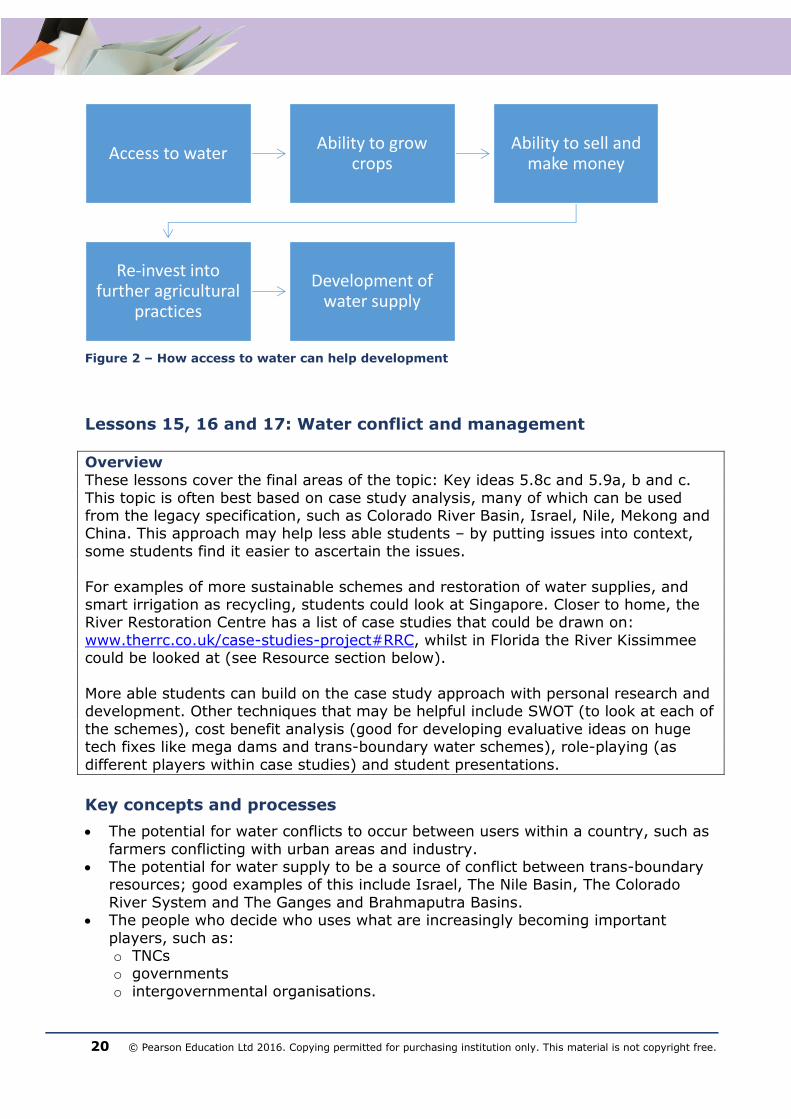
As countries develop, it is important that students appreciate that a shared basin can cause issues if everyone wants access to water to help develop, since there is only a finite supply. Good use of exemplification can help here. For instance, diagrams
where the boundary is split up, such as in Figure 3, can be used to help students understand the issues at stake, and students could take on the roles of the
development of their countries. A mock basin (as seen in Figure 3) can be drawn with different countries being given
different economic roles, such as industry, farming, a large population, tourism, and others. Students must then decide what they must do to secure their water (such as
the building of dams). Then the issues that this can produce for other countries further downstream can be discussed. Student groups representing different countries should try to come up with a system that suits everybody and then
consider the reasons why in reality this may not always happen (e.g. development levels, aid, and other reasons). By applying these examples, students should be able
to see the issues that many trans-boundary countries face.
Figure 3 – Mock basin (J. Foster)
22 © Pearson Education Ltd 2016. Copying permitted for purchasing institution only. This material is not copyright free.
The lessons students learn from this exercise can be applied to other basins such as the Nile, the Mekong and The Colorado. Students can then begin to apply laws to
their own basin as to fair use. These laws can be compared to The Helsinki Rules and others in forthcoming lessons.
Much of this topic lends itself to students comparing case studies, though this is not compulsory. Many comparisons and assessments can be used to look at the positives
and negatives of schemes today. For instance, the Colorado River Basin can be studied and compared with The Nile or the Mekong, and the rules of these rivers
such as the Mekong River Commission and the Colorado River Compact can be assessed in terms of their effectiveness.
The impacts of water treaties and laws can also be looked at via an assessment of their benefits; for instance, see ‘The Helsinki Rules on the Uses of the Waters of
International Rivers’: www.internationalwaterlaw.org/documents/intldocs/helsinki_rules.html. A great report that might benefit more able students is ‘International water law from
Helsinki Rules to the United Nations Convention on the Law of the Non-Navigational Uses of International Watercourses’:
www.researchgate.net/publication/282798343_International_Water_Law_from_Helsinki_Rules_to_the_United_Nations_Convention_on_the_Law_of_the_Non-
Navigational_Uses_of_International_Watercourses. High-tech river management techniques can also be looked at in terms of mega
dams like the Three Gorges and the South–North Water Transfer project, as well as the use of desalination plants. Students could try to assess these in terms of
economic, social and environmental costs and benefits. Key skill 9 (Identify seasonal variations in the regime of international rivers, such as the Nile and the Mekong, and assess impact of existing and potential dams) can be developed whilst looking at
case studies. Another case study example might be the GAP Scheme in Turkey.
For more intermediate techniques, students could research and develop ideas around hippo rollers (www.hipporoller.org/), smart irrigation (www.smartwaterirrigationsolutions.com/pdf/what_is_smart_irrigation.pdf), water
recycling (www.pub.gov.sg/watersupply/singaporewaterstory) and bicycle pumps (www.mayapedal.org/waterpump.pdf). Information on these techniques can be
resourced from the links above, as well as many others.
Key vocabulary for EQ3
Key term Definition
Water stress When the demand for water exceeds the available
amount during a certain period.
Salt water encroachment
Where saline water begins to find its way into freshwater aquifers, especially near coastal aquifers which run low,
allowing salt water to seep back in and cause contamination.
© Pearson Education Ltd 2016. Copying permitted for purchasing institution only. This material is not copyright free. 23
Physical water
scarcity
Where water availability does not meet water demand in
a particular area. Arid regions often face this, such as southern Spain.
Economic scarcity Occurs due to lack of investment in infrastructure so
people cannot get access to water, or the price of it is at a
point where the population cannot afford the amount they need.
Hydropolitics Politics that surrounds the use of water between nations
who share the same supply.
Trans-boundary water
source
A water source that passes through more than one
country, such as the Nile.
Territorial sovereignty In terms of water supply it is where a country claims ownership and rights over the water when the source of it
begins in their country, such as Ethiopia and the Nile.
Territorial integrity Where a country claims that they should continue to get
the same amount of water as they always have from a shared water source that doesn’t begin in their country.
Further reading
Hydropolitic Academy, ‘Why water price is so high in Denmark’: www.hidropolitikakademi.org/en/why-water-price-is-so-high-in-denmark.html
Danish Ministry of the Environment, ‘Water supply in Denmark’: www.geus.dk/program-areas/water/denmark/vandforsyning_artikel.pdf
‘Water pricing for a dry future: pricing policies from abroad and their relevance to
California’: http://s.giannini.ucop.edu/uploads/giannini_public/46/92/46923c7b-36e8-4eff-bec1-0ed75f7f2eb1/v19n5.pdf
The Economist, ‘The price is wrong’: www.economist.com/news/united-states/21647994-why-golden-state-so-bad-managing-water-price-wrong
South Florida Water Management District, ‘Kissimmee Basin’:
http://my.sfwmd.gov/portal/page/portal/xweb%20protecting%20and%20restoring/kissimmee%20river
Florida Center for Environmental Studies, ‘The Kissimmee River restoration history’: www.ces.fau.edu/riverwoods/kissimmee.php
US Army Corps of Engineers, ‘Kissimmee River restoration project’:
www.saj.usace.army.mil/Missions/Environmental/Ecosystem-Restoration/Kissimmee-River-Restoration/
Water Framework Directive UK TAG, access to lots of relevant publications: www.wfduk.org/
‘Water management, Water Framework Directive & Hydropower’:
www.ecologic-events.eu/hydropower2/documents/IssuePaper_final.pdf BIS Group, ‘Advanced Hydropower Generation and Pumped Storage Forum’:
www.bisgrp.com/portfolio/conferences/energy/4th-annual-advanced-hydropower-generation-and-pumped-storage-forum
UNECE, ‘Water Convention’: www.unece.org/env/water.html
Recommended