E2F1 regulates OGT and OGA expression
1
E2F1 Transcription Factor Regulates O-GlcNAc Transferase and O-GlcNAcase Expression*
Senthilkumar Muthusamy, Kyung U. Hong, Sujith Dassanayaka, Tariq Hamid, and Steven P. Jones
From the Institute of Molecular Cardiology, and, Diabetes and Obesity Center, University of Louisville, Louisville, KY, USA
*Running title: E2F1 regulates OGT and OGA expression
To whom correspondence should be addressed: Steven P. Jones, PhD, 580 South Preston Street – 321F, Delia Baxter Building – 321F, Louisville, KY, 40202, USA. Email: [email protected]
Key words: O-GlcNAcylation, O-linked N-acetylglucosamine (O-GlcNAc) transferase, O-GlcNAcase, gene transcription, E2F transcription factor, retinoblastoma protein
ABSTRACT Protein O-GlcNAcylation, which is controlled by O-GlcNAc transferase (OGT) and O-GlcNAcase (OGA), has emerged as an important posttranslational modification that may factor in multiple diseases. Until recently, it was assumed that OGT/OGA protein expression was relatively constant. Several groups, including ours, have shown that OGT and/or OGA expression changes in several pathologic contexts. Yet, the cis and trans elements that regulate the expression of these enzymes remain essentially unexplored. Here, we used a reporter-based assay to analyze minimal promoters, and leveraged in silico modeling to nominate several candidate transcription factor binding sites in both Ogt and Oga. We noted multiple E2F1 binding site consensus sequences in both promoters. We performed chromatin immunoprecipitation in both human and mouse cells, and found that E2F1 bound to candidate E2F1 binding sites in both promoters. In HEK293 cells, we overexpressed E2F1, which significantly reduced OGT and OGA expression. Conversely, E2F1 deficient mouse fibroblasts had increased levels of Ogt and Oga promoters. Of the known binding partners for E2F1, we queried whether Retinoblastoma 1 (Rb1) might be involved. Rb1 deficient mouse embryonic fibroblasts showed
increased levels of Ogt and Oga expression. Yet, overexpression of E2F1 in the Rb1 deficient cells did not alter Ogt and Oga expression, suggesting that Rb1 is required for E2F1-mediated suppression. In conclusion, this work identifies and validates some of the promoter elements for mouse Ogt and Oga genes. Specifically, E2F1 negatively regulates both Ogt and Oga expression in an Rb1 protein-dependent manner.
The posttranslational O-linked N-acetylglucosamine (O-GlcNAc) modification occurs in a variety of cellular proteins and is known to be an important metabolic sensor in all metazoans. Alterations in O-GlcNAc levels occur in several diseases including heart failure, diabetes, cancer, and neurodegenerative disorders (1-5). Evidence suggests that changes in O-GlcNAc levels play a critical role in protein activity, stability and localization (6-9). Using the substrate uridine diphosphate N-acetylglucosamine (UDP-GlcNAc), the enzyme O-GlcNAc transferase (OGT) adds the GlcNAc moiety to serine and threonine residues while O-GlcNAcase (OGA) removes it. Embryonic lethality and developmental delay observed by genetic deletion of Ogt or Oga demonstrates the critical role of these enzymes in O-GlcNAc
http://www.jbc.org/cgi/doi/10.1074/jbc.M115.677534The latest version is at JBC Papers in Press. Published on November 2, 2015 as Manuscript M115.677534
Copyright 2015 by The American Society for Biochemistry and Molecular Biology, Inc.
by guest on March 15, 2018
http://ww
w.jbc.org/
Dow
nloaded from
E2F1 regulates OGT and OGA expression
2
cycling (10,11). We have, along with others, observed alterations in the expression level of OGT and OGA protein along with concomitant protein O-GlcNAc modification in various pathological conditions (1,12-14). We recently reported that the up-regulation of miR-539 could be a mechanism for decreased OGA level in the infarcted mouse heart (15). Another study showed that increases in O-GlcNAc levels by pharmacological inhibition of OGA increased OGA expression through the O-GlcNAc modification of RNA polymerase II whereas OGT levels decreased (13). Thus, changes in OGT/OGA protein expression occur; however, molecular mechanisms that regulate the expression of these enzymes remain to be elucidated. To characterize the promoter region of Ogt and Oga (Mgea5), we used a luciferase reporter system and identified the minimal promoter region based on the reporter activity. The transcription factors that bind to the delineated promoter regions were identified using the MatInspector program (http://www.genomatix.de/) (16). Among the list of transcription factors, the E2F transcription factor binding sites were observed in both Ogt and Oga promoter regions. The E2F family members (E2F1 to E2F8) form heterodimers with dimerization partner members and regulate gene transcription. Among the E2Fs, E2Fs 1-3 are often referred to as activators and E2Fs 4 and 5 are often referred to as repressors (17). The tumor suppressor retinoblastoma (Rb) pocket proteins (pRb/Rb1, p107 and p130) are also known to bind to E2F transcription factors in a phosphorylation-dependent manner and control its function (18-20). E2F1, in particular, is known to play an important role in activating the expression of a wide spectrum of genes that are involved in the cell cycle, nucleotide biosynthesis, and apoptosis (21-24). E2F1 directly represses several genes including human telomerase reverse transcriptase (TERT) and the anti-apoptotic protein myeloid cell leukemia sequence 1 (Mcl-1) (25,26). Interestingly, E2F1 is involved in the repression of key genes that regulate energy homeostasis and mitochondrial function (27). These results suggest that E2F1 can activate or repress various target genes. Here, we identified the minimal promoter sequences of mouse Ogt and Oga that confer transcriptional activity. Taken together, our results
demonstrate the basal promoter element of Ogt and Oga and identified E2F1 transcription factor in their regulation.
EXPERIMENTAL PROCEDURE Cell culture. HEK293, H9c2 and 3T3 L1 cells were grown in DMEM containing 10% fetal bovine serum and penicillin/streptomycin. The HEK293 and H9c2 cells were plated overnight at 70% confluence then used for transient transfection and reporter assays. Dr. Douglas C. Dean (University of Louisville) provided wild type and E2F1 deficient (E2F1-/-) mouse adult fibroblast cells (MAFs), and Dr. Brian F. Clem (University of Louisville) supplied wild type and Rb1 deficient (Rb1-/-) mouse embryonic fibroblast cells (MEFs). Both MAF and MEF cells were maintained in DMEM containing 10% fetal bovine serum. Promoters and plasmids. To characterize the core promoter region of mouse Ogt and Oga, we used a luciferase reporter system to analyze about 1000 bp sequence upstream of the putative transcriptional start site (TSS). A series of 5’ truncations were made to further narrow down the promoter activity. These included the 5’ flanking regions of full length Ogt having SacI and XhoI restriction enzyme sites: -1419 to +233 bp; -698 to +233 bp; -294 to +233 bp; -178 to +233 bp; -105 to +233 bp and -66 to +233 bp. The 5’flanking regions of Oga having KpnI and HindIII restriction enzyme sites: (-1034 to +181 bp; -502 to +181 bp; -407 to +181 bp and -48 to +181 bp. These 5' flanking regions were PCR-amplified with specific primers (Table 1) using mouse genomic DNA and then cloned into a pGL3-basic luciferase reporter vector (Promega). E2F binding sites in the pGL3-Ogt (-178 to +233 bp) and pGL3-Oga (-407 to +181 bp) promoter constructs were mutated using specific primers with base substitution at the conserved core sites (Table 2). The PureYieldTM plasmid miniprep system (Promega) was used for small-scale plasmid extraction and the sequence was verified. Large-scale plasmid purification for downstream transfection experiments was carried out using QIAfilterTM plasmid midi kit (Qiagen). The pCMVHA E2F1 was obtained from Addgene
by guest on March 15, 2018
http://ww
w.jbc.org/
Dow
nloaded from
E2F1 regulates OGT and OGA expression
3
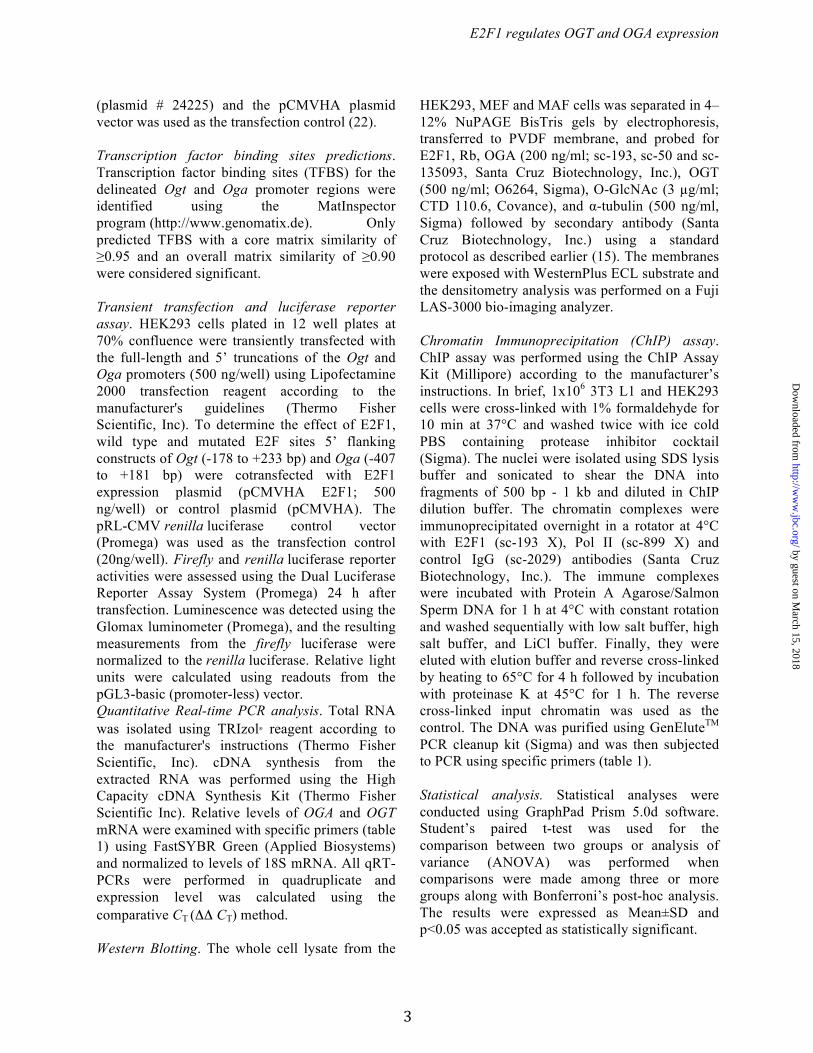
(plasmid # 24225) and the pCMVHA plasmid vector was used as the transfection control (22). Transcription factor binding sites predictions. Transcription factor binding sites (TFBS) for the delineated Ogt and Oga promoter regions were identified using the MatInspector program (http://www.genomatix.de). Only predicted TFBS with a core matrix similarity of ≥0.95 and an overall matrix similarity of ≥0.90 were considered significant. Transient transfection and luciferase reporter assay. HEK293 cells plated in 12 well plates at 70% confluence were transiently transfected with the full-length and 5’ truncations of the Ogt and Oga promoters (500 ng/well) using Lipofectamine 2000 transfection reagent according to the manufacturer's guidelines (Thermo Fisher Scientific, Inc). To determine the effect of E2F1, wild type and mutated E2F sites 5’ flanking constructs of Ogt (-178 to +233 bp) and Oga (-407 to +181 bp) were cotransfected with E2F1 expression plasmid (pCMVHA E2F1; 500 ng/well) or control plasmid (pCMVHA). The pRL-CMV renilla luciferase control vector (Promega) was used as the transfection control (20ng/well). Firefly and renilla luciferase reporter activities were assessed using the Dual Luciferase Reporter Assay System (Promega) 24 h after transfection. Luminescence was detected using the Glomax luminometer (Promega), and the resulting measurements from the firefly luciferase were normalized to the renilla luciferase. Relative light units were calculated using readouts from the pGL3-basic (promoter-less) vector. Quantitative Real-time PCR analysis. Total RNA was isolated using TRIzol® reagent according to the manufacturer's instructions (Thermo Fisher Scientific, Inc). cDNA synthesis from the extracted RNA was performed using the High Capacity cDNA Synthesis Kit (Thermo Fisher Scientific Inc). Relative levels of OGA and OGT mRNA were examined with specific primers (table 1) using FastSYBR Green (Applied Biosystems) and normalized to levels of 18S mRNA. All qRT-PCRs were performed in quadruplicate and expression level was calculated using the comparative CT (ΔΔ CT) method. Western Blotting. The whole cell lysate from the
HEK293, MEF and MAF cells was separated in 4–12% NuPAGE BisTris gels by electrophoresis, transferred to PVDF membrane, and probed for E2F1, Rb, OGA (200 ng/ml; sc-193, sc-50 and sc-135093, Santa Cruz Biotechnology, Inc.), OGT (500 ng/ml; O6264, Sigma), O-GlcNAc (3 µg/ml; CTD 110.6, Covance), and α-tubulin (500 ng/ml, Sigma) followed by secondary antibody (Santa Cruz Biotechnology, Inc.) using a standard protocol as described earlier (15). The membranes were exposed with WesternPlus ECL substrate and the densitometry analysis was performed on a Fuji LAS-3000 bio-imaging analyzer. Chromatin Immunoprecipitation (ChIP) assay. ChIP assay was performed using the ChIP Assay Kit (Millipore) according to the manufacturer’s instructions. In brief, 1x10⁶ 3T3 L1 and HEK293 cells were cross-linked with 1% formaldehyde for 10 min at 37°C and washed twice with ice cold PBS containing protease inhibitor cocktail (Sigma). The nuclei were isolated using SDS lysis buffer and sonicated to shear the DNA into fragments of 500 bp - 1 kb and diluted in ChIP dilution buffer. The chromatin complexes were immunoprecipitated overnight in a rotator at 4°C with E2F1 (sc-193 X), Pol II (sc-899 X) and control IgG (sc-2029) antibodies (Santa Cruz Biotechnology, Inc.). The immune complexes were incubated with Protein A Agarose/Salmon Sperm DNA for 1 h at 4°C with constant rotation and washed sequentially with low salt buffer, high salt buffer, and LiCl buffer. Finally, they were eluted with elution buffer and reverse cross-linked by heating to 65°C for 4 h followed by incubation with proteinase K at 45°C for 1 h. The reverse cross-linked input chromatin was used as the control. The DNA was purified using GenEluteTM PCR cleanup kit (Sigma) and was then subjected to PCR using specific primers (table 1). Statistical analysis. Statistical analyses were conducted using GraphPad Prism 5.0d software. Student’s paired t-test was used for the comparison between two groups or analysis of variance (ANOVA) was performed when comparisons were made among three or more groups along with Bonferroni’s post-hoc analysis. The results were expressed as Mean±SD and p<0.05 was accepted as statistically significant.
by guest on March 15, 2018
http://ww
w.jbc.org/
Dow
nloaded from
E2F1 regulates OGT and OGA expression
4
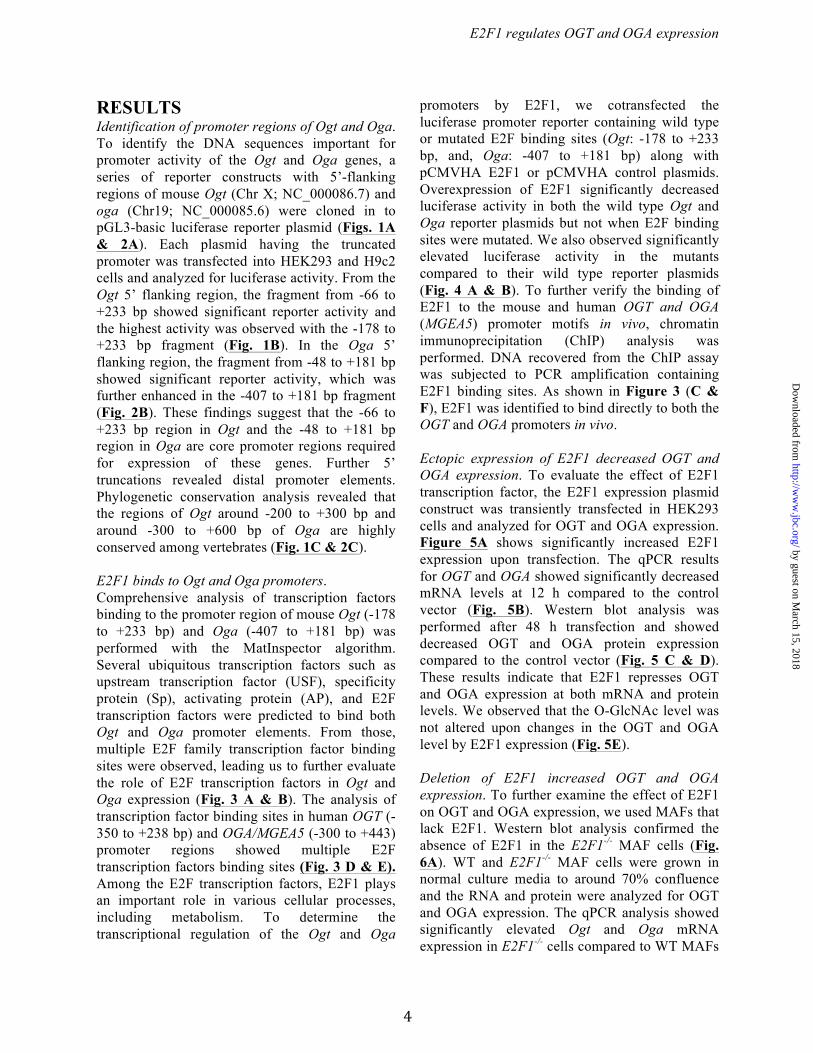
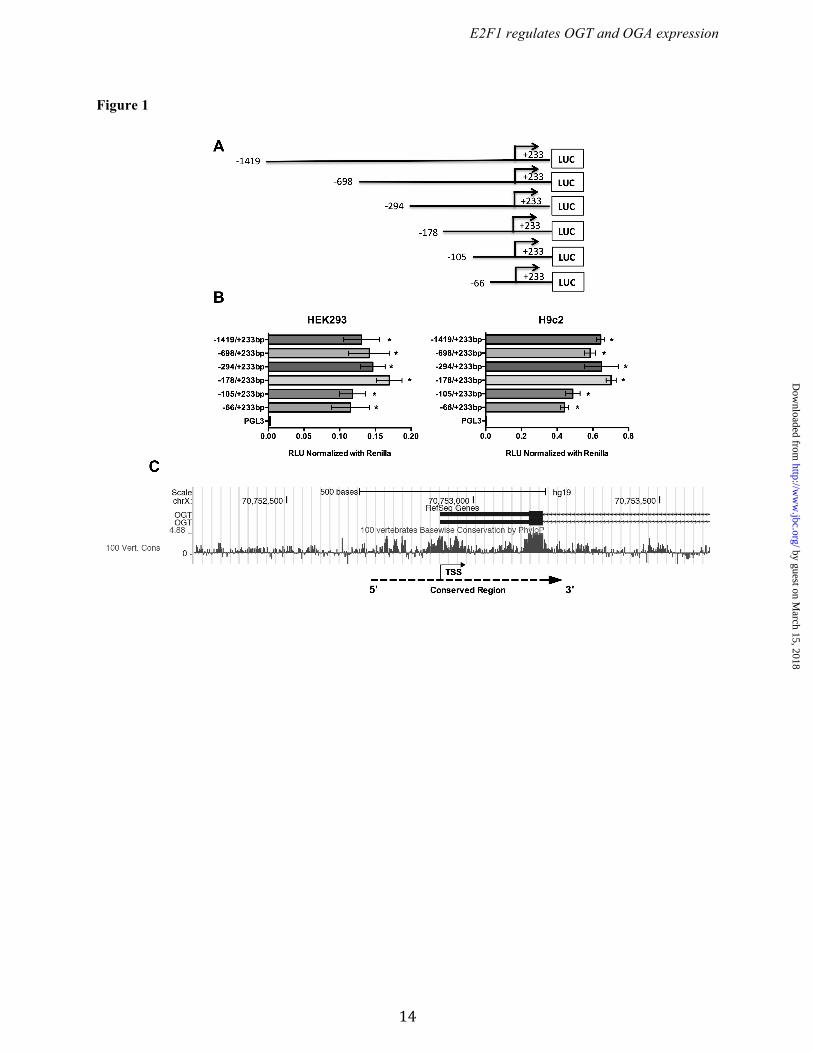
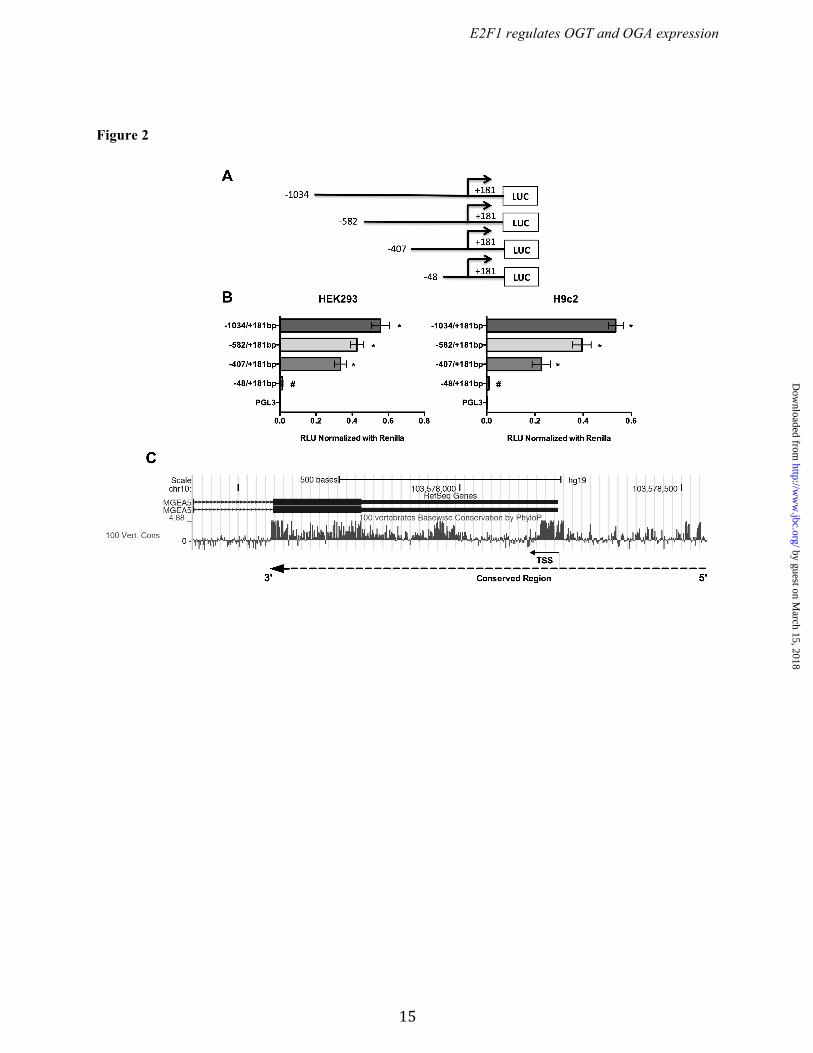
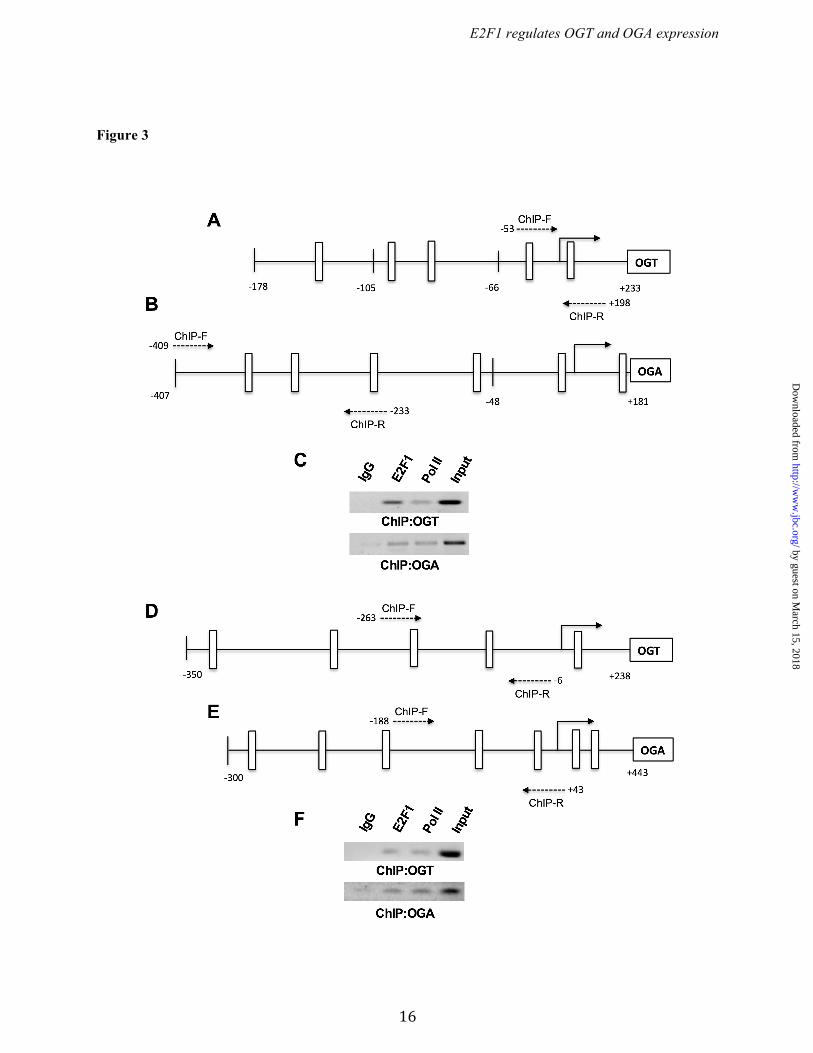
RESULTS Identification of promoter regions of Ogt and Oga. To identify the DNA sequences important for promoter activity of the Ogt and Oga genes, a series of reporter constructs with 5’-flanking regions of mouse Ogt (Chr X; NC_000086.7) and oga (Chr19; NC_000085.6) were cloned in to pGL3-basic luciferase reporter plasmid (Figs. 1A & 2A). Each plasmid having the truncated promoter was transfected into HEK293 and H9c2 cells and analyzed for luciferase activity. From the Ogt 5’ flanking region, the fragment from -66 to +233 bp showed significant reporter activity and the highest activity was observed with the -178 to +233 bp fragment (Fig. 1B). In the Oga 5’ flanking region, the fragment from -48 to +181 bp showed significant reporter activity, which was further enhanced in the -407 to +181 bp fragment (Fig. 2B). These findings suggest that the -66 to +233 bp region in Ogt and the -48 to +181 bp region in Oga are core promoter regions required for expression of these genes. Further 5’ truncations revealed distal promoter elements. Phylogenetic conservation analysis revealed that the regions of Ogt around -200 to +300 bp and around -300 to +600 bp of Oga are highly conserved among vertebrates (Fig. 1C & 2C). E2F1 binds to Ogt and Oga promoters. Comprehensive analysis of transcription factors binding to the promoter region of mouse Ogt (-178 to +233 bp) and Oga (-407 to +181 bp) was performed with the MatInspector algorithm. Several ubiquitous transcription factors such as upstream transcription factor (USF), specificity protein (Sp), activating protein (AP), and E2F transcription factors were predicted to bind both Ogt and Oga promoter elements. From those, multiple E2F family transcription factor binding sites were observed, leading us to further evaluate the role of E2F transcription factors in Ogt and Oga expression (Fig. 3 A & B). The analysis of transcription factor binding sites in human OGT (-350 to +238 bp) and OGA/MGEA5 (-300 to +443) promoter regions showed multiple E2F transcription factors binding sites (Fig. 3 D & E). Among the E2F transcription factors, E2F1 plays an important role in various cellular processes, including metabolism. To determine the transcriptional regulation of the Ogt and Oga
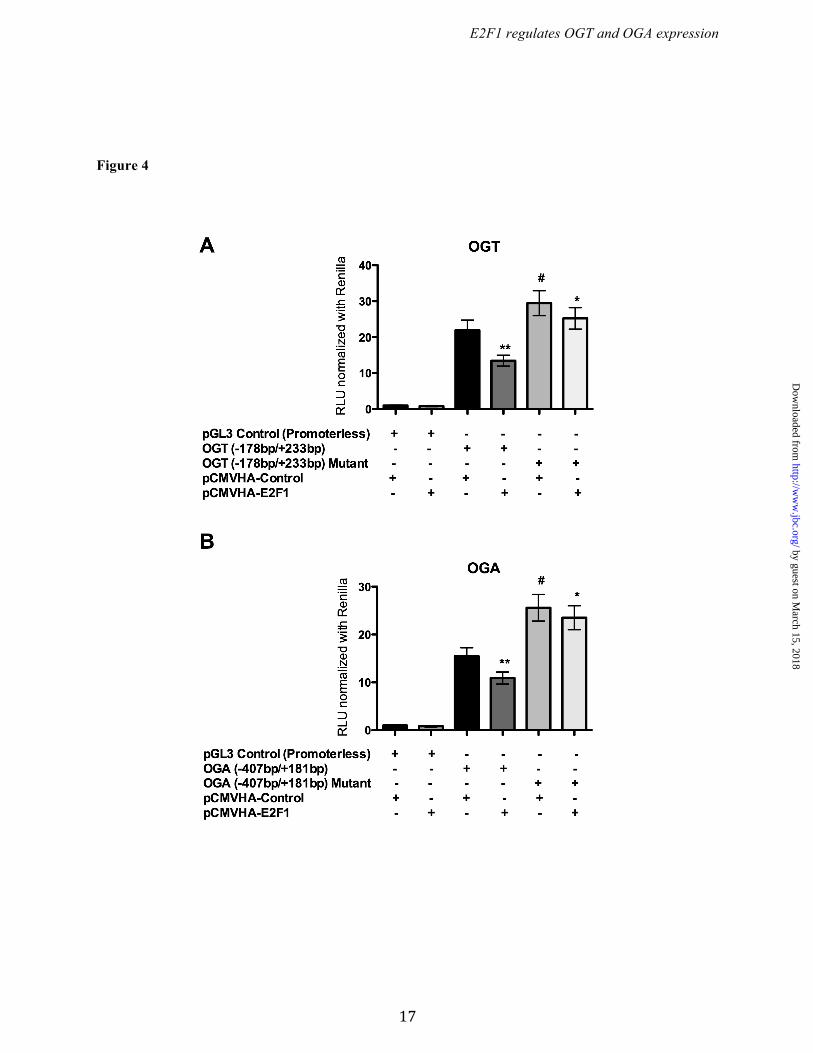
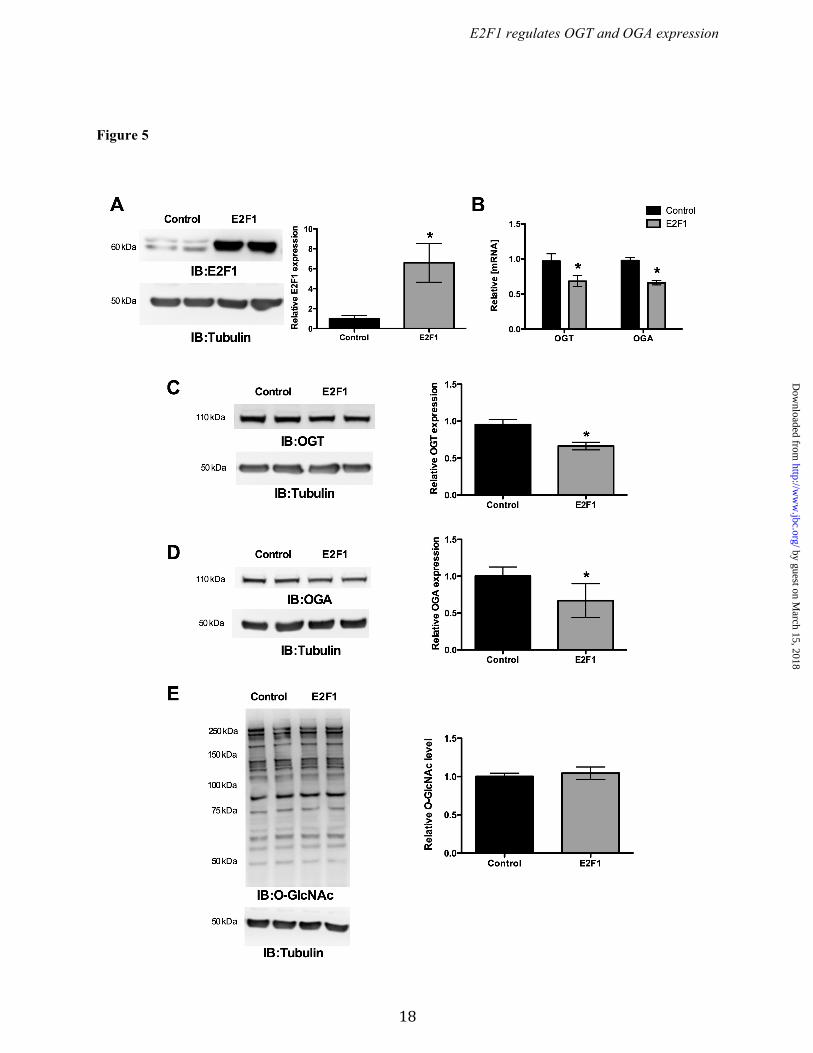
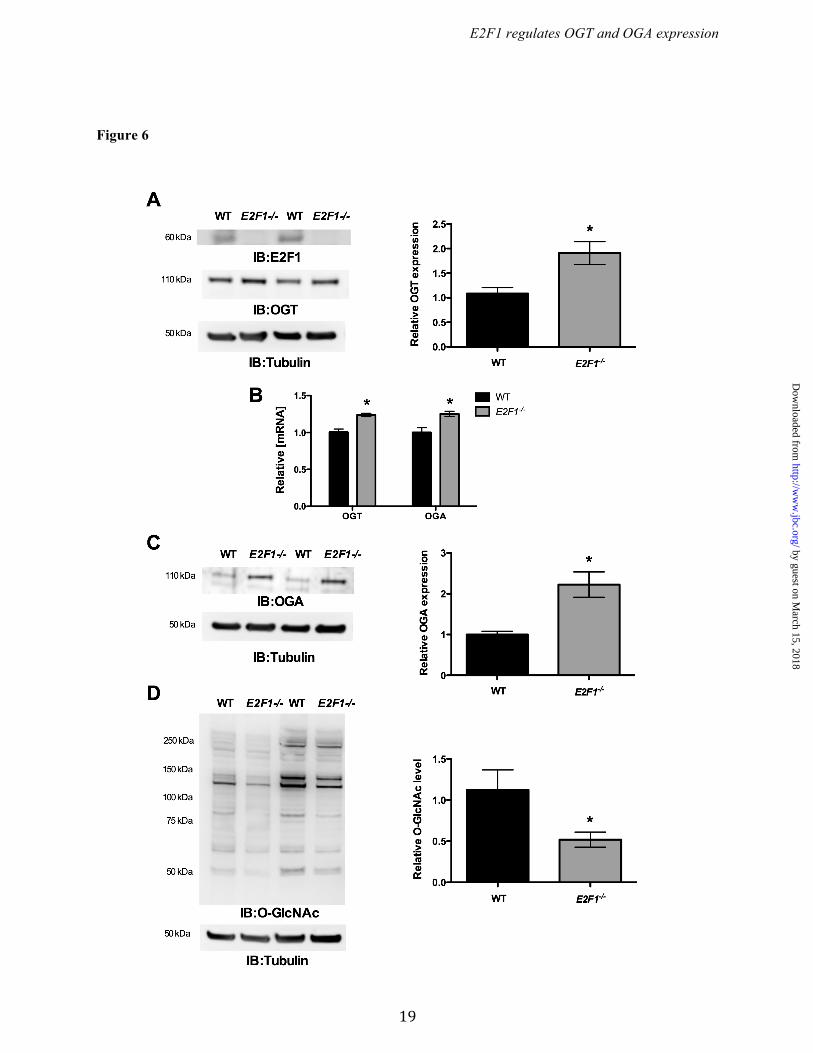
promoters by E2F1, we cotransfected the luciferase promoter reporter containing wild type or mutated E2F binding sites (Ogt: -178 to +233 bp, and, Oga: -407 to +181 bp) along with pCMVHA E2F1 or pCMVHA control plasmids. Overexpression of E2F1 significantly decreased luciferase activity in both the wild type Ogt and Oga reporter plasmids but not when E2F binding sites were mutated. We also observed significantly elevated luciferase activity in the mutants compared to their wild type reporter plasmids (Fig. 4 A & B). To further verify the binding of E2F1 to the mouse and human OGT and OGA (MGEA5) promoter motifs in vivo, chromatin immunoprecipitation (ChIP) analysis was performed. DNA recovered from the ChIP assay was subjected to PCR amplification containing E2F1 binding sites. As shown in Figure 3 (C & F), E2F1 was identified to bind directly to both the OGT and OGA promoters in vivo. Ectopic expression of E2F1 decreased OGT and OGA expression. To evaluate the effect of E2F1 transcription factor, the E2F1 expression plasmid construct was transiently transfected in HEK293 cells and analyzed for OGT and OGA expression. Figure 5A shows significantly increased E2F1 expression upon transfection. The qPCR results for OGT and OGA showed significantly decreased mRNA levels at 12 h compared to the control vector (Fig. 5B). Western blot analysis was performed after 48 h transfection and showed decreased OGT and OGA protein expression compared to the control vector (Fig. 5 C & D). These results indicate that E2F1 represses OGT and OGA expression at both mRNA and protein levels. We observed that the O-GlcNAc level was not altered upon changes in the OGT and OGA level by E2F1 expression (Fig. 5E). Deletion of E2F1 increased OGT and OGA expression. To further examine the effect of E2F1 on OGT and OGA expression, we used MAFs that lack E2F1. Western blot analysis confirmed the absence of E2F1 in the E2F1-/- MAF cells (Fig. 6A). WT and E2F1-/- MAF cells were grown in normal culture media to around 70% confluence and the RNA and protein were analyzed for OGT and OGA expression. The qPCR analysis showed significantly elevated Ogt and Oga mRNA expression in E2F1-/- cells compared to WT MAFs
by guest on March 15, 2018
http://ww
w.jbc.org/
Dow
nloaded from
E2F1 regulates OGT and OGA expression
5
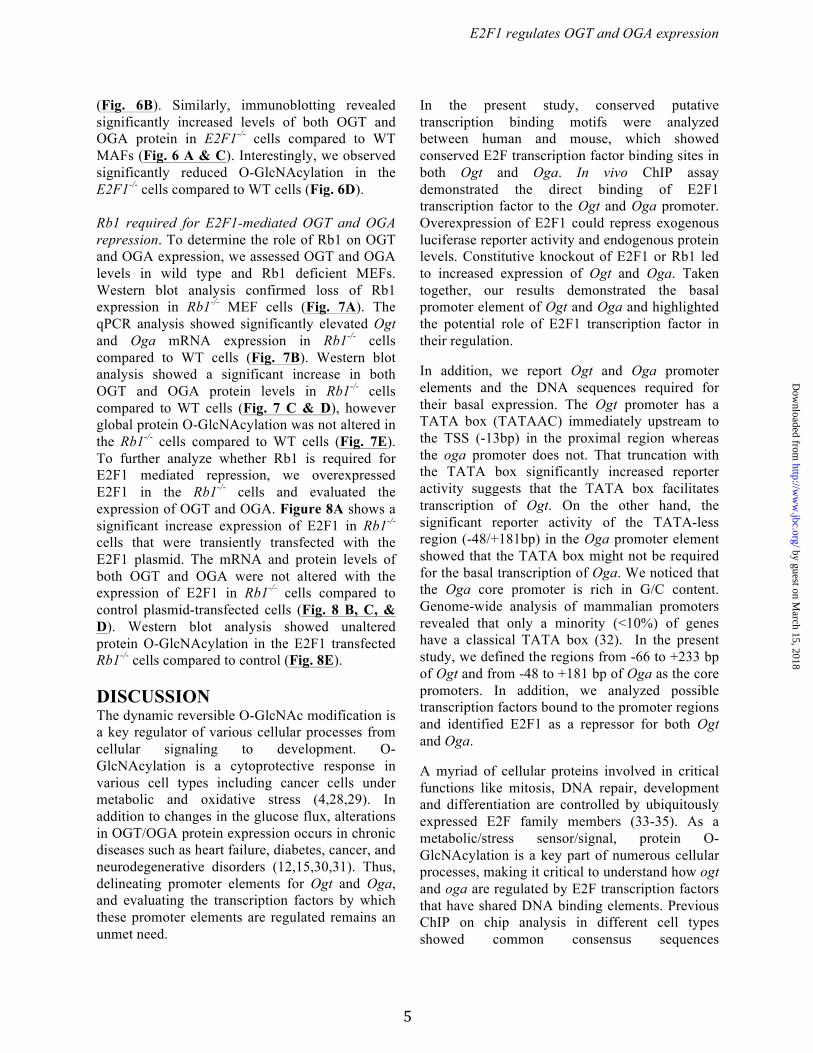
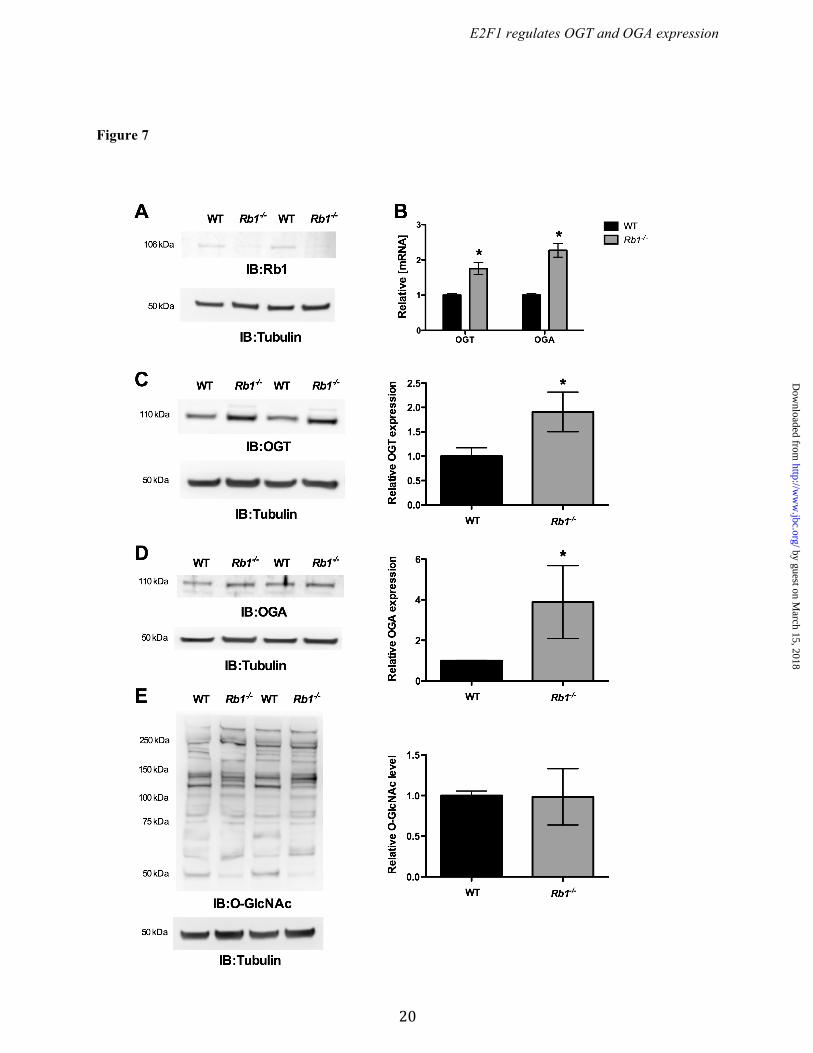
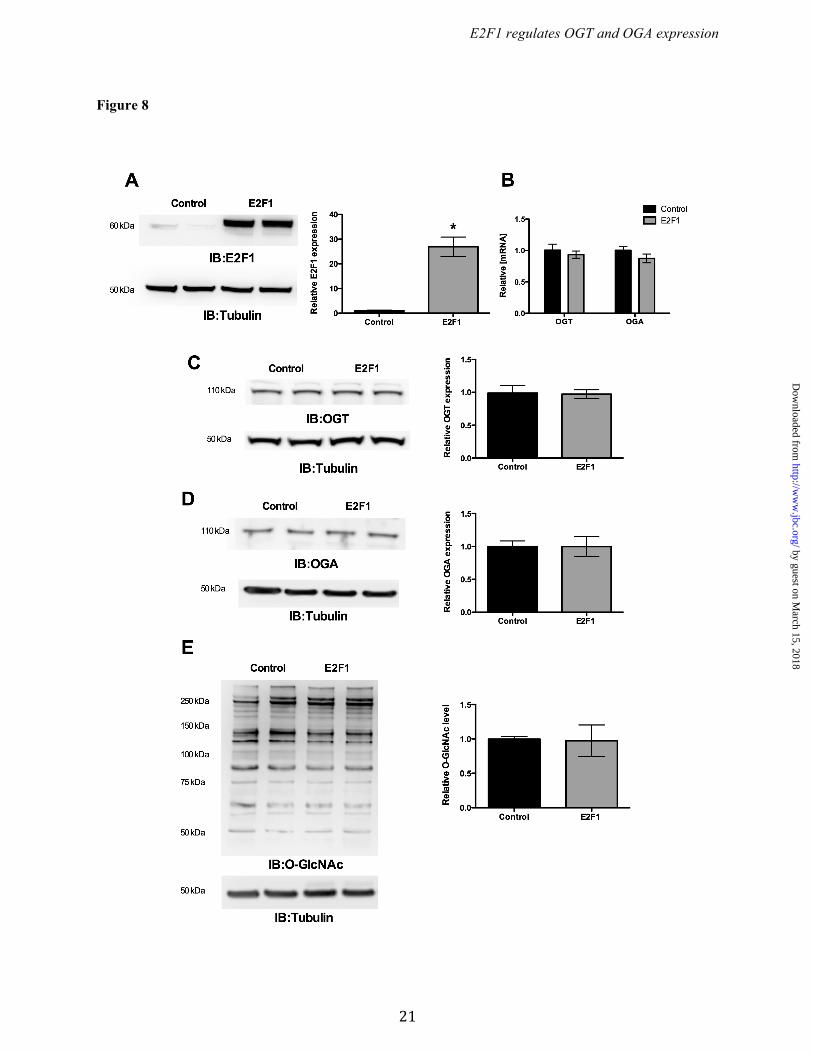
(Fig. 6B). Similarly, immunoblotting revealed significantly increased levels of both OGT and OGA protein in E2F1-/- cells compared to WT MAFs (Fig. 6 A & C). Interestingly, we observed significantly reduced O-GlcNAcylation in the E2F1-/- cells compared to WT cells (Fig. 6D). Rb1 required for E2F1-mediated OGT and OGA repression. To determine the role of Rb1 on OGT and OGA expression, we assessed OGT and OGA levels in wild type and Rb1 deficient MEFs. Western blot analysis confirmed loss of Rb1 expression in Rb1-/- MEF cells (Fig. 7A). The qPCR analysis showed significantly elevated Ogt and Oga mRNA expression in Rb1-/- cells compared to WT cells (Fig. 7B). Western blot analysis showed a significant increase in both OGT and OGA protein levels in Rb1-/- cells compared to WT cells (Fig. 7 C & D), however global protein O-GlcNAcylation was not altered in the Rb1-/- cells compared to WT cells (Fig. 7E). To further analyze whether Rb1 is required for E2F1 mediated repression, we overexpressed E2F1 in the Rb1-/- cells and evaluated the expression of OGT and OGA. Figure 8A shows a significant increase expression of E2F1 in Rb1-/- cells that were transiently transfected with the E2F1 plasmid. The mRNA and protein levels of both OGT and OGA were not altered with the expression of E2F1 in Rb1-/- cells compared to control plasmid-transfected cells (Fig. 8 B, C, & D). Western blot analysis showed unaltered protein O-GlcNAcylation in the E2F1 transfected Rb1-/- cells compared to control (Fig. 8E). DISCUSSION The dynamic reversible O-GlcNAc modification is a key regulator of various cellular processes from cellular signaling to development. O-GlcNAcylation is a cytoprotective response in various cell types including cancer cells under metabolic and oxidative stress (4,28,29). In addition to changes in the glucose flux, alterations in OGT/OGA protein expression occurs in chronic diseases such as heart failure, diabetes, cancer, and neurodegenerative disorders (12,15,30,31). Thus, delineating promoter elements for Ogt and Oga, and evaluating the transcription factors by which these promoter elements are regulated remains an unmet need.
In the present study, conserved putative transcription binding motifs were analyzed between human and mouse, which showed conserved E2F transcription factor binding sites in both Ogt and Oga. In vivo ChIP assay demonstrated the direct binding of E2F1 transcription factor to the Ogt and Oga promoter. Overexpression of E2F1 could repress exogenous luciferase reporter activity and endogenous protein levels. Constitutive knockout of E2F1 or Rb1 led to increased expression of Ogt and Oga. Taken together, our results demonstrated the basal promoter element of Ogt and Oga and highlighted the potential role of E2F1 transcription factor in their regulation.
In addition, we report Ogt and Oga promoter elements and the DNA sequences required for their basal expression. The Ogt promoter has a TATA box (TATAAC) immediately upstream to the TSS (-13bp) in the proximal region whereas the oga promoter does not. That truncation with the TATA box significantly increased reporter activity suggests that the TATA box facilitates transcription of Ogt. On the other hand, the significant reporter activity of the TATA-less region (-48/+181bp) in the Oga promoter element showed that the TATA box might not be required for the basal transcription of Oga. We noticed that the Oga core promoter is rich in G/C content. Genome-wide analysis of mammalian promoters revealed that only a minority (<10%) of genes have a classical TATA box (32). In the present study, we defined the regions from -66 to +233 bp of Ogt and from -48 to +181 bp of Oga as the core promoters. In addition, we analyzed possible transcription factors bound to the promoter regions and identified E2F1 as a repressor for both Ogt and Oga.
A myriad of cellular proteins involved in critical functions like mitosis, DNA repair, development and differentiation are controlled by ubiquitously expressed E2F family members (33-35). As a metabolic/stress sensor/signal, protein O-GlcNAcylation is a key part of numerous cellular processes, making it critical to understand how ogt and oga are regulated by E2F transcription factors that have shared DNA binding elements. Previous ChIP on chip analysis in different cell types showed common consensus sequences
by guest on March 15, 2018
http://ww
w.jbc.org/
Dow
nloaded from
E2F1 regulates OGT and OGA expression
6
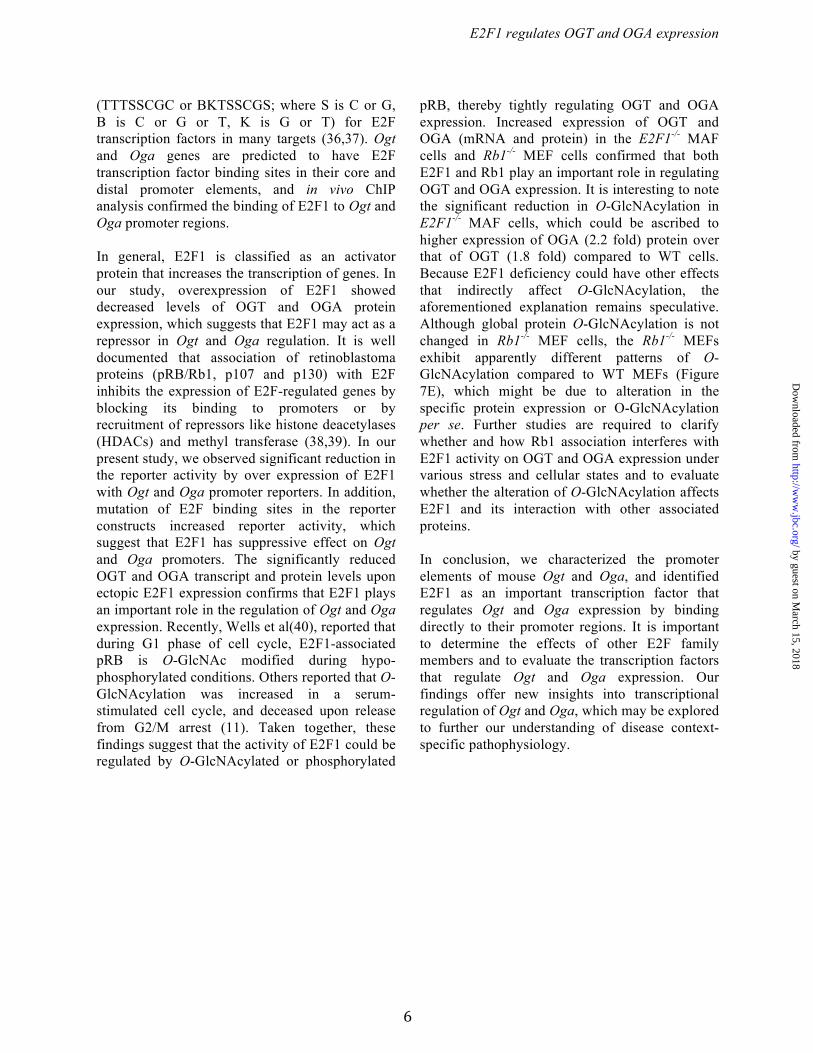
(TTTSSCGC or BKTSSCGS; where S is C or G, B is C or G or T, K is G or T) for E2F transcription factors in many targets (36,37). Ogt and Oga genes are predicted to have E2F transcription factor binding sites in their core and distal promoter elements, and in vivo ChIP analysis confirmed the binding of E2F1 to Ogt and Oga promoter regions. In general, E2F1 is classified as an activator protein that increases the transcription of genes. In our study, overexpression of E2F1 showed decreased levels of OGT and OGA protein expression, which suggests that E2F1 may act as a repressor in Ogt and Oga regulation. It is well documented that association of retinoblastoma proteins (pRB/Rb1, p107 and p130) with E2F inhibits the expression of E2F-regulated genes by blocking its binding to promoters or by recruitment of repressors like histone deacetylases (HDACs) and methyl transferase (38,39). In our present study, we observed significant reduction in the reporter activity by over expression of E2F1 with Ogt and Oga promoter reporters. In addition, mutation of E2F binding sites in the reporter constructs increased reporter activity, which suggest that E2F1 has suppressive effect on Ogt and Oga promoters. The significantly reduced OGT and OGA transcript and protein levels upon ectopic E2F1 expression confirms that E2F1 plays an important role in the regulation of Ogt and Oga expression. Recently, Wells et al(40), reported that during G1 phase of cell cycle, E2F1-associated pRB is O-GlcNAc modified during hypo-phosphorylated conditions. Others reported that O-GlcNAcylation was increased in a serum-stimulated cell cycle, and deceased upon release from G2/M arrest (11). Taken together, these findings suggest that the activity of E2F1 could be regulated by O-GlcNAcylated or phosphorylated
pRB, thereby tightly regulating OGT and OGA expression. Increased expression of OGT and OGA (mRNA and protein) in the E2F1-/- MAF cells and Rb1-/- MEF cells confirmed that both E2F1 and Rb1 play an important role in regulating OGT and OGA expression. It is interesting to note the significant reduction in O-GlcNAcylation in E2F1-/- MAF cells, which could be ascribed to higher expression of OGA (2.2 fold) protein over that of OGT (1.8 fold) compared to WT cells. Because E2F1 deficiency could have other effects that indirectly affect O-GlcNAcylation, the aforementioned explanation remains speculative. Although global protein O-GlcNAcylation is not changed in Rb1-/- MEF cells, the Rb1-/- MEFs exhibit apparently different patterns of O-GlcNAcylation compared to WT MEFs (Figure 7E), which might be due to alteration in the specific protein expression or O-GlcNAcylation per se. Further studies are required to clarify whether and how Rb1 association interferes with E2F1 activity on OGT and OGA expression under various stress and cellular states and to evaluate whether the alteration of O-GlcNAcylation affects E2F1 and its interaction with other associated proteins. In conclusion, we characterized the promoter elements of mouse Ogt and Oga, and identified E2F1 as an important transcription factor that regulates Ogt and Oga expression by binding directly to their promoter regions. It is important to determine the effects of other E2F family members and to evaluate the transcription factors that regulate Ogt and Oga expression. Our findings offer new insights into transcriptional regulation of Ogt and Oga, which may be explored to further our understanding of disease context-specific pathophysiology.
by guest on March 15, 2018
http://ww
w.jbc.org/
Dow
nloaded from
E2F1 regulates OGT and OGA expression
7
CONFLICT OF INTEREST The authors declare that they have no conflicts of interest with the contents of this article. AUTHOR CONTRIBUTIONS SPJ conceived the concept of the paper. SPJ, TH, KUH and SM designed the study. SPJ and SM designed experiments and wrote the paper. SM carried out the majority of the experiments and analyzed the data. SD provided technical assistance in western blot and qPCR experiments. All authors had access to the results and approved the final version of the manuscript. REFERENCES
1. Watson, L. J., Facundo, H. T., Ngoh, G. A., Ameen, M., Brainard, R. E., Lemma, K. M., Long, B. W., Prabhu, S. D., Xuan, Y. T., and Jones, S. P. (2010) O-linked beta-N-acetylglucosamine transferase is indispensable in the failing heart. Proc Natl Acad Sci U S A 107, 17797-17802
2. Slawson, C., Copeland, R. J., and Hart, G. W. (2010) O-GlcNAc signaling: a metabolic link between diabetes and cancer? Trends Biochem Sci 35, 547-555
3. Yuzwa, S. A., and Vocadlo, D. J. (2014) O-GlcNAc and neurodegeneration: biochemical mechanisms and potential roles in Alzheimer's disease and beyond. Chem Soc Rev 43, 6839-6858
4. Ma, Z., and Vosseller, K. (2014) Cancer metabolism and elevated O-GlcNAc in oncogenic signaling. J Biol Chem 289, 34457-34465
5. Hart, G. W. (2014) Minireview series on the thirtieth anniversary of research on O-GlcNAcylation of nuclear and cytoplasmic proteins: Nutrient regulation of cellular metabolism and physiology by O-GlcNAcylation. J Biol Chem 289, 34422-34423
6. Hu, P., Shimoji, S., and Hart, G. W. (2010) Site-specific interplay between O-GlcNAcylation and phosphorylation in cellular regulation. FEBS letters 584, 2526-2538
7. Facundo, H. T., Brainard, R. E., Watson, L. J., Ngoh, G. A., Hamid, T., Prabhu, S. D., and Jones, S. P. (2012) O-GlcNAc signaling is essential for NFAT-mediated transcriptional reprogramming during cardiomyocyte hypertrophy. American journal of physiology. Heart and circulatory physiology 302, H2122-2130
8. Zachara, N. E., and Hart, G. W. (2006) Cell signaling, the essential role of O-GlcNAc! Biochim Biophys Acta 1761, 599-617
9. Srikanth, B., Vaidya, M. M., and Kalraiya, R. D. (2010) O-GlcNAcylation determines the solubility, filament organization, and stability of keratins 8 and 18. J Biol Chem 285, 34062-34071
10. Shafi, R., Iyer, S. P., Ellies, L. G., O'Donnell, N., Marek, K. W., Chui, D., Hart, G. W., and Marth, J. D. (2000) The O-GlcNAc transferase gene resides on the X chromosome and is essential for embryonic stem cell viability and mouse ontogeny. Proc Natl Acad Sci U S A 97, 5735-5739
11. Yang, Y. R., Song, M., Lee, H., Jeon, Y., Choi, E. J., Jang, H. J., Moon, H. Y., Byun, H. Y., Kim, E. K., Kim, D. H., Lee, M. N., Koh, A., Ghim, J., Choi, J. H., Lee-Kwon, W., Kim, K. T., Ryu, S. H., and Suh, P. G. (2012) O-GlcNAcase is essential for embryonic development and maintenance of genomic stability. Aging Cell 11, 439-448
12. Perez-Cervera, Y., Dehennaut, V., Aquino Gil, M., Guedri, K., Solorzano Mata, C. J., Olivier-Van Stichelen, S., Michalski, J. C., Foulquier, F., and Lefebvre, T. (2013) Insulin signaling controls the expression of O-GlcNAc transferase and its interaction with lipid microdomains. Faseb J 27, 3478-3486
by guest on March 15, 2018
http://ww
w.jbc.org/
Dow
nloaded from
E2F1 regulates OGT and OGA expression
8
13. Zhang, Z., Tan, E. P., VandenHull, N. J., Peterson, K. R., and Slawson, C. (2014) O-GlcNAcase Expression is Sensitive to Changes in O-GlcNAc Homeostasis. Front Endocrinol (Lausanne) 5, 206
14. Park, K., Saudek, C. D., and Hart, G. W. (2010) Increased expression of beta-N-acetylglucosaminidase in erythrocytes from individuals with pre-diabetes and diabetes. Diabetes 59, 1845-1850
15. Muthusamy, S., DeMartino, A. M., Watson, L. J., Brittian, K. R., Zafir, A., Dassanayaka, S., Hong, K. U., and Jones, S. P. (2014) MicroRNA-539 is up-regulated in failing heart, and suppresses O-GlcNAcase expression. J Biol Chem 289, 29665-29676
16. Cartharius, K., Frech, K., Grote, K., Klocke, B., Haltmeier, M., Klingenhoff, A., Frisch, M., Bayerlein, M., and Werner, T. (2005) MatInspector and beyond: promoter analysis based on transcription factor binding sites. Bioinformatics 21, 2933-2942
17. Attwooll, C., Lazzerini Denchi, E., and Helin, K. (2004) The E2F family: specific functions and overlapping interests. The EMBO journal 23, 4709-4716
18. Du, W., and Pogoriler, J. (2006) Retinoblastoma family genes. Oncogene 25, 5190-5200 19. Cobrinik, D. (2005) Pocket proteins and cell cycle control. Oncogene 24, 2796-2809 20. Kong, L. J., Chang, J. T., Bild, A. H., and Nevins, J. R. (2007) Compensation and specificity of
function within the E2F family. Oncogene 26, 321-327 21. Fajas, L., Landsberg, R. L., Huss-Garcia, Y., Sardet, C., Lees, J. A., and Auwerx, J. (2002) E2Fs
regulate adipocyte differentiation. Developmental cell 3, 39-49 22. Lukas, J., Petersen, B. O., Holm, K., Bartek, J., and Helin, K. (1996) Deregulated expression of
E2F family members induces S-phase entry and overcomes p16INK4A-mediated growth suppression. Molecular and cellular biology 16, 1047-1057
23. Stevens, C., and La Thangue, N. B. (2003) E2F and cell cycle control: a double-edged sword. Archives of Biochemistry and Biophysics 412, 157-169
24. Wu, Z., Zheng, S., and Yu, Q. (2009) The E2F family and the role of E2F1 in apoptosis. The international journal of biochemistry & cell biology 41, 2389-2397
25. Crowe, D. L., Nguyen, D. C., Tsang, K. J., and Kyo, S. (2001) E2F-1 represses transcription of the human telomerase reverse transcriptase gene. Nucleic acids research 29, 2789-2794
26. Croxton, R., Ma, Y., Song, L., Haura, E. B., and Cress, W. D. (2002) Direct repression of the Mcl-1 promoter by E2F1. Oncogene 21, 1359-1369
27. Blanchet, E., Annicotte, J. S., Lagarrigue, S., Aguilar, V., Clape, C., Chavey, C., Fritz, V., Casas, F., Apparailly, F., Auwerx, J., and Fajas, L. (2011) E2F transcription factor-1 regulates oxidative metabolism. Nat Cell Biol 13, 1146-1152
28. Zafir, A., Readnower, R., Long, B. W., McCracken, J., Aird, A., Alvarez, A., Cummins, T. D., Li, Q., Hill, B. G., Bhatnagar, A., Prabhu, S. D., Bolli, R., and Jones, S. P. (2013) Protein O-GlcNAcylation is a novel cytoprotective signal in cardiac stem cells. Stem cells 31, 765-775
29. Hardiville, S., and Hart, G. W. (2014) Nutrient regulation of signaling, transcription, and cell physiology by O-GlcNAcylation. Cell Metab 20, 208-213
30. Taylor, R. P., Parker, G. J., Hazel, M. W., Soesanto, Y., Fuller, W., Yazzie, M. J., and McClain, D. A. (2008) Glucose deprivation stimulates O-GlcNAc modification of proteins through up-regulation of O-linked N-acetylglucosaminyltransferase. J Biol Chem 283, 6050-6057
31. Forster, S., Welleford, A. S., Triplett, J. C., Sultana, R., Schmitz, B., and Butterfield, D. A. (2014) Increased O-GlcNAc levels correlate with decreased O-GlcNAcase levels in Alzheimer disease brain. Biochim Biophys Acta 1842, 1333-1339
32. Carninci, P., Sandelin, A., Lenhard, B., Katayama, S., Shimokawa, K., Ponjavic, J., Semple, C. A., Taylor, M. S., Engstrom, P. G., Frith, M. C., Forrest, A. R., Alkema, W. B., Tan, S. L., Plessy, C., Kodzius, R., Ravasi, T., Kasukawa, T., Fukuda, S., Kanamori-Katayama, M., Kitazume, Y., Kawaji, H., Kai, C., Nakamura, M., Konno, H., Nakano, K., Mottagui-Tabar, S., Arner, P., Chesi, A., Gustincich, S., Persichetti, F., Suzuki, H., Grimmond, S. M., Wells, C. A., Orlando, V., Wahlestedt, C., Liu, E. T., Harbers, M., Kawai, J., Bajic, V. B., Hume, D. A., and
by guest on March 15, 2018
http://ww
w.jbc.org/
Dow
nloaded from
E2F1 regulates OGT and OGA expression
9
Hayashizaki, Y. (2006) Genome-wide analysis of mammalian promoter architecture and evolution. Nature genetics 38, 626-635
33. Stevaux, O., and Dyson, N. J. (2002) A revised picture of the E2F transcriptional network and RB function. Current opinion in cell biology 14, 684-691
34. Ouseph, M. M., Li, J., Chen, H. Z., Pecot, T., Wenzel, P., Thompson, J. C., Comstock, G., Chokshi, V., Byrne, M., Forde, B., Chong, J. L., Huang, K., Machiraju, R., de Bruin, A., and Leone, G. (2012) Atypical E2F repressors and activators coordinate placental development. Developmental cell 22, 849-862
35. Guo, R., Chen, J., Zhu, F., Biswas, A. K., Berton, T. R., Mitchell, D. L., and Johnson, D. G. (2010) E2F1 localizes to sites of UV-induced DNA damage to enhance nucleotide excision repair. J Biol Chem 285, 19308-19315
36. Rabinovich, A., Jin, V. X., Rabinovich, R., Xu, X., and Farnham, P. J. (2008) E2F in vivo binding specificity: comparison of consensus versus nonconsensus binding sites. Genome research 18, 1763-1777
37. Wingender, E., Chen, X., Hehl, R., Karas, H., Liebich, I., Matys, V., Meinhardt, T., Pruss, M., Reuter, I., and Schacherer, F. (2000) TRANSFAC: an integrated system for gene expression regulation. Nucleic acids research 28, 316-319
38. Lu, Z., Luo, R. Z., Peng, H., Huang, M., Nishmoto, A., Hunt, K. K., Helin, K., Liao, W. S., and Yu, Y. (2006) E2F-HDAC complexes negatively regulate the tumor suppressor gene ARHI in breast cancer. Oncogene 25, 230-239
39. Valdez, C. D., Davis, J. N., Odeh, H. M., Layfield, T. L., Cousineau, C. S., Berton, T. R., Johnson, D. G., Wojno, K. J., and Day, M. L. (2011) Repression of androgen receptor transcription through the E2F1/DNMT1 axis. PLoS One 6, e25187
40. Wells, L., Slawson, C., and Hart, G. W. (2011) The E2F-1 associated retinoblastoma-susceptibility gene product is modified by O-GlcNAc. Amino Acids 40, 877-883
by guest on March 15, 2018
http://ww
w.jbc.org/
Dow
nloaded from
E2F1 regulates OGT and OGA expression
10
FOOTNOTES This work was supported by grants from the NIH (R01 HL083320, R01 HL094419, P20 GM103492 and P01 HL078825 to S.P.J.) and AHA Predoctoral Fellowship (Great Rivers Affiliate) 14PRE19710015 (to S.D.). The authors are thankful to Dr. Douglas C. Dean (University of Louisville) for providing wild type and E2F1-/- mouse adult fibroblast cells (MAFs), and Dr. Brian F. Clem (University of Louisville) supplied wild type and Rb1-/- mouse embryonic fibroblast cells (MEFs). The authors are grateful for the expert technical assistance of Bethany W. Long and Linda T. Harrison. The abbreviations used are: O-GlcNAc, O-linked N-acetylglucosamine; OGT, O-GlcNAc transferase; OGA, O-GlcNAcase; E2F, E2 transcription factor; HEK, human embryonic kidney; TERT, telomerase reverse transcriptase; myeloid cell leukemia sequence 1, Mcl-1; MAF, mouse adult fibroblast; MEF, mouse embryonic fibroblast; Rb1, Retinoblastoma 1; TSS, transcriptional start site; TFBS, Transcription factor binding sites; ChIP, Chromatin Immunoprecipitation. FIGURE LEGENDS Figure 1. Schematic diagram for the OGT promoter fragments spanning from -1419 to +233bp. (A) The 5' truncated DNA fragments were cloned upstream of the firefly luciferase reporter gene in the pGL3-basic vector. (B) The truncated fragments were transfected into HEK293 and H9c2 cells and the luciferase activity was measured 24 h post –transfection. The results are presented as relative luciferase units (RLU) (firefly luciferase/renilla luciferase). Significant promoter activity was observed from -66 to +233bp. All data are presented as the mean ± SD from triplicate measurements (p<0.001). (C) Phylogenetic conservation analysis of the human OGT promoter (around 1000bp) using UCSC genome browser (version hg19) showed that the region around -200 to +300bp is highly conserved among vertebrate species. Positive peaks indicate conserved bases and the height of the peak denotes level of conservation. Dotted line and arrow indicates conserved region and gene orientation, respectively. TSS-Transcription start site.
Figure 2. Schematic diagram for the OGA promoter fragments spanning from -1034 to +181bp. (A) The 5' truncated DNA fragments were cloned upstream of the firefly luciferase reporter gene in the pGL3-basic vector. (B) The truncated fragments were transfected in HEK293 and H9c2 cells and the luciferase activity was measured 24 h post –transfection. The results are presented as relative luciferase units (RLU) (firefly luciferase / renilla luciferase). Significant promoter activity was observed from -48 to +181bp. All data are presented as the mean ± SD from triplicate measurements (p<0.005). (C) Phylogenetic conservation analysis of the human OGA (MGEA5) promoter (around 1000bp) using UCSC genome browser (version hg19) showed that the region around -300 to +600bp of OGA is highly conserved among vertebrate species. Positive peaks indicate conserved bases and the height of the peak denotes level of conservation. Dotted line and arrow indicates conserved region and gene orientation, respectively. TSS-Transcription start site.
Figure 3. E2F binds to OGT and OGA promoter. (A and B) Transcription factor binding sites (TFBS) for the delineated mouse OGT (-178/+233bp) and OGA promoter region (-407/+181bp); human OGT (-350/+238bp) and OGA promoter region (-300/+443bp) were identified using the MatInspector program (http://www.genomatix.de) and the schematic diagram shows possible E2F transcription factor binding sites (white bar). (C and F) Chromatin immunoprecipitation (ChIP) analysis was done by incubating 3T3 L1 and HEK293 chromatin complex with E2F1 antibody and the PCR analysis for OGT and OGA promoter region showed direct binding of E2F1.
Figure 4. E2F1 reduced reporter activity in truncated OGT and OGA plasmids. The wild type and mutated E2F binding sites pGL3 reporter plasmids of OGT (-178/+233bp) and OGA (-407/+181bp) were cotransfected with E2F1 expression plasmid in HEK293 cells and analyzed for reporter activity. Luciferase assay showed a
by guest on March 15, 2018
http://ww
w.jbc.org/
Dow
nloaded from
E2F1 regulates OGT and OGA expression
11
significant decrease in the reporter activity of wild type OGT (n=4; p<0.01) and OGA (n=4; p<0.01) with E2F1 overexpression. The mutation in the E2F binding sites showed significantly increased reporter activity in both OGT (n=4; p<0.05) and OGA (n=4; p<0.01) whereas the E2F1 overexpression did not significantly alter luciferase activity of mutant reporter plasmids.
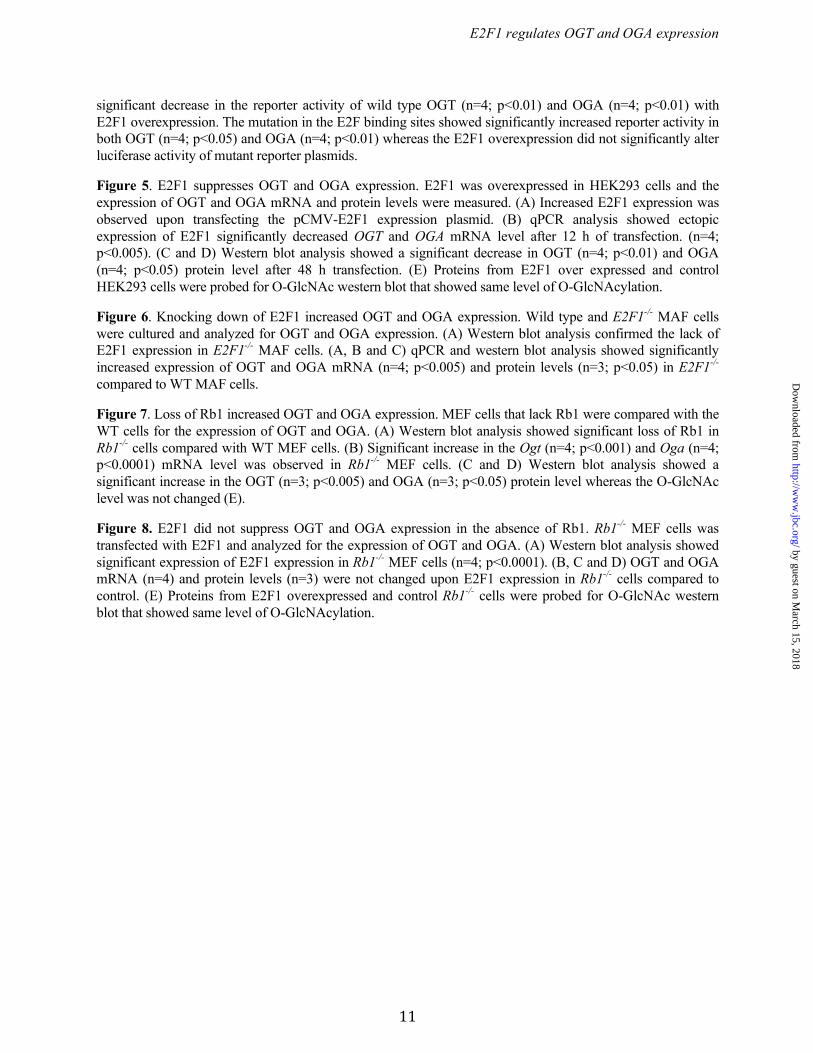
Figure 5. E2F1 suppresses OGT and OGA expression. E2F1 was overexpressed in HEK293 cells and the expression of OGT and OGA mRNA and protein levels were measured. (A) Increased E2F1 expression was observed upon transfecting the pCMV-E2F1 expression plasmid. (B) qPCR analysis showed ectopic expression of E2F1 significantly decreased OGT and OGA mRNA level after 12 h of transfection. (n=4; p<0.005). (C and D) Western blot analysis showed a significant decrease in OGT (n=4; p<0.01) and OGA (n=4; p<0.05) protein level after 48 h transfection. (E) Proteins from E2F1 over expressed and control HEK293 cells were probed for O-GlcNAc western blot that showed same level of O-GlcNAcylation.
Figure 6. Knocking down of E2F1 increased OGT and OGA expression. Wild type and E2F1-/- MAF cells were cultured and analyzed for OGT and OGA expression. (A) Western blot analysis confirmed the lack of E2F1 expression in E2F1-/- MAF cells. (A, B and C) qPCR and western blot analysis showed significantly increased expression of OGT and OGA mRNA (n=4; p<0.005) and protein levels (n=3; p<0.05) in E2F1-/- compared to WT MAF cells.
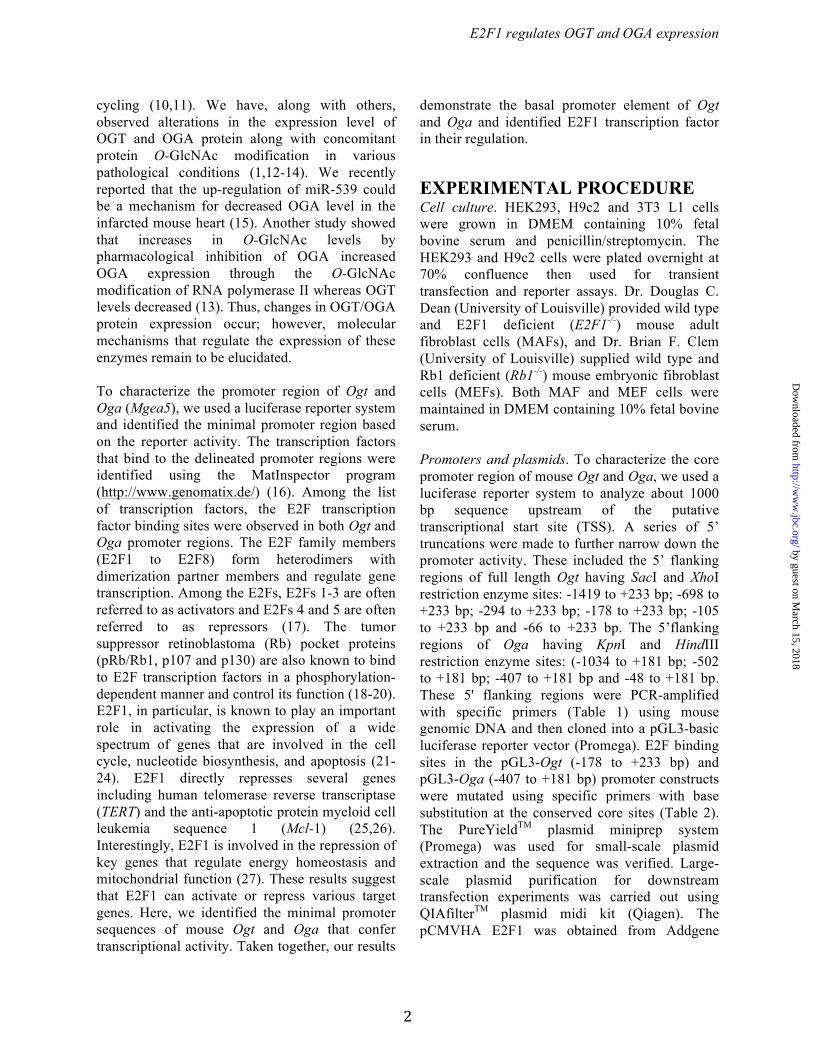
Figure 7. Loss of Rb1 increased OGT and OGA expression. MEF cells that lack Rb1 were compared with the WT cells for the expression of OGT and OGA. (A) Western blot analysis showed significant loss of Rb1 in Rb1-/- cells compared with WT MEF cells. (B) Significant increase in the Ogt (n=4; p<0.001) and Oga (n=4; p<0.0001) mRNA level was observed in Rb1-/- MEF cells. (C and D) Western blot analysis showed a significant increase in the OGT (n=3; p<0.005) and OGA (n=3; p<0.05) protein level whereas the O-GlcNAc level was not changed (E).
Figure 8. E2F1 did not suppress OGT and OGA expression in the absence of Rb1. Rb1-/- MEF cells was transfected with E2F1 and analyzed for the expression of OGT and OGA. (A) Western blot analysis showed significant expression of E2F1 expression in Rb1-/- MEF cells (n=4; p<0.0001). (B, C and D) OGT and OGA mRNA (n=4) and protein levels (n=3) were not changed upon E2F1 expression in Rb1-/- cells compared to control. (E) Proteins from E2F1 overexpressed and control Rb1-/- cells were probed for O-GlcNAc western blot that showed same level of O-GlcNAcylation.
by guest on March 15, 2018
http://ww
w.jbc.org/
Dow
nloaded from
E2F1 regulates OGT and OGA expression
12
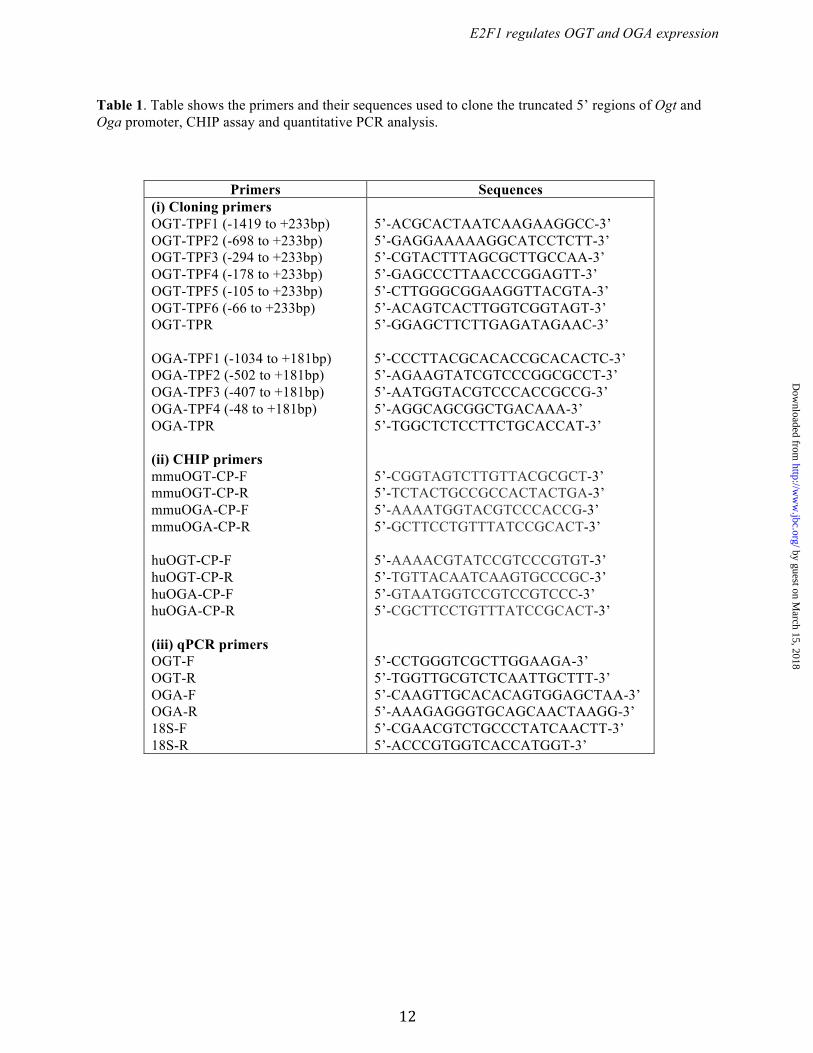
Table 1. Table shows the primers and their sequences used to clone the truncated 5’ regions of Ogt and Oga promoter, CHIP assay and quantitative PCR analysis.
Primers Sequences (i) Cloning primers OGT-TPF1 (-1419 to +233bp) OGT-TPF2 (-698 to +233bp) OGT-TPF3 (-294 to +233bp) OGT-TPF4 (-178 to +233bp) OGT-TPF5 (-105 to +233bp) OGT-TPF6 (-66 to +233bp) OGT-TPR OGA-TPF1 (-1034 to +181bp) OGA-TPF2 (-502 to +181bp) OGA-TPF3 (-407 to +181bp) OGA-TPF4 (-48 to +181bp) OGA-TPR (ii) CHIP primers mmuOGT-CP-F mmuOGT-CP-R mmuOGA-CP-F mmuOGA-CP-R huOGT-CP-F huOGT-CP-R huOGA-CP-F huOGA-CP-R (iii) qPCR primers OGT-F OGT-R OGA-F OGA-R 18S-F 18S-R
5’-ACGCACTAATCAAGAAGGCC-3’ 5’-GAGGAAAAAGGCATCCTCTT-3’ 5’-CGTACTTTAGCGCTTGCCAA-3’ 5’-GAGCCCTTAACCCGGAGTT-3’ 5’-CTTGGGCGGAAGGTTACGTA-3’ 5’-ACAGTCACTTGGTCGGTAGT-3’ 5’-GGAGCTTCTTGAGATAGAAC-3’ 5’-CCCTTACGCACACCGCACACTC-3’ 5’-AGAAGTATCGTCCCGGCGCCT-3’ 5’-AATGGTACGTCCCACCGCCG-3’ 5’-AGGCAGCGGCTGACAAA-3’ 5’-TGGCTCTCCTTCTGCACCAT-3’ 5’-CGGTAGTCTTGTTACGCGCT-3’ 5’-TCTACTGCCGCCACTACTGA-3’ 5’-AAAATGGTACGTCCCACCG-3’ 5’-GCTTCCTGTTTATCCGCACT-3’ 5’-AAAACGTATCCGTCCCGTGT-3’ 5’-TGTTACAATCAAGTGCCCGC-3’ 5’-GTAATGGTCCGTCCGTCCC-3’ 5’-CGCTTCCTGTTTATCCGCACT-3’ 5’-CCTGGGTCGCTTGGAAGA-3’ 5’-TGGTTGCGTCTCAATTGCTTT-3’ 5’-CAAGTTGCACACAGTGGAGCTAA-3’ 5’-AAAGAGGGTGCAGCAACTAAGG-3’ 5’-CGAACGTCTGCCCTATCAACTT-3’ 5’-ACCCGTGGTCACCATGGT-3’
by guest on March 15, 2018
http://ww
w.jbc.org/
Dow
nloaded from
E2F1 regulates OGT and OGA expression
13
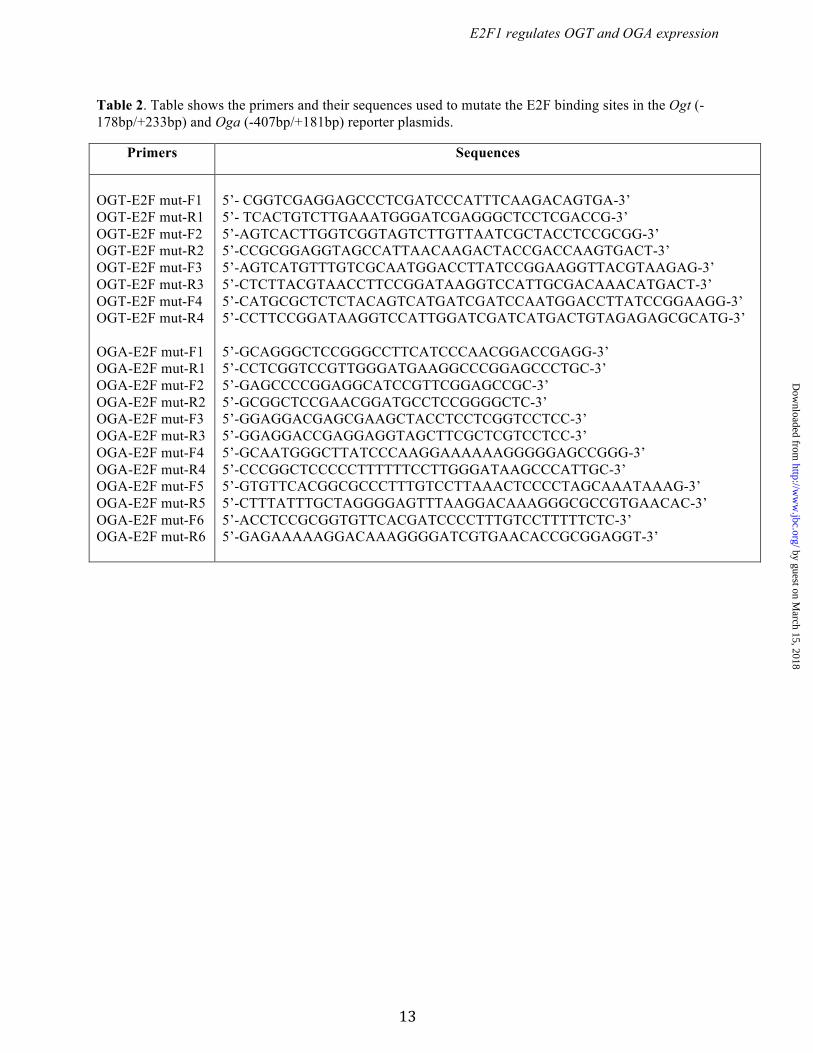
Table 2. Table shows the primers and their sequences used to mutate the E2F binding sites in the Ogt (-178bp/+233bp) and Oga (-407bp/+181bp) reporter plasmids.
Primers Sequences
OGT-E2F mut-F1 OGT-E2F mut-R1 OGT-E2F mut-F2 OGT-E2F mut-R2 OGT-E2F mut-F3 OGT-E2F mut-R3 OGT-E2F mut-F4 OGT-E2F mut-R4 OGA-E2F mut-F1 OGA-E2F mut-R1 OGA-E2F mut-F2 OGA-E2F mut-R2 OGA-E2F mut-F3 OGA-E2F mut-R3 OGA-E2F mut-F4 OGA-E2F mut-R4 OGA-E2F mut-F5 OGA-E2F mut-R5 OGA-E2F mut-F6 OGA-E2F mut-R6
5’- CGGTCGAGGAGCCCTCGATCCCATTTCAAGACAGTGA-3’ 5’- TCACTGTCTTGAAATGGGATCGAGGGCTCCTCGACCG-3’ 5’-AGTCACTTGGTCGGTAGTCTTGTTAATCGCTACCTCCGCGG-3’ 5’-CCGCGGAGGTAGCCATTAACAAGACTACCGACCAAGTGACT-3’ 5’-AGTCATGTTTGTCGCAATGGACCTTATCCGGAAGGTTACGTAAGAG-3’ 5’-CTCTTACGTAACCTTCCGGATAAGGTCCATTGCGACAAACATGACT-3’ 5’-CATGCGCTCTCTACAGTCATGATCGATCCAATGGACCTTATCCGGAAGG-3’ 5’-CCTTCCGGATAAGGTCCATTGGATCGATCATGACTGTAGAGAGCGCATG-3’ 5’-GCAGGGCTCCGGGCCTTCATCCCAACGGACCGAGG-3’ 5’-CCTCGGTCCGTTGGGATGAAGGCCCGGAGCCCTGC-3’ 5’-GAGCCCCGGAGGCATCCGTTCGGAGCCGC-3’ 5’-GCGGCTCCGAACGGATGCCTCCGGGGCTC-3’ 5’-GGAGGACGAGCGAAGCTACCTCCTCGGTCCTCC-3’ 5’-GGAGGACCGAGGAGGTAGCTTCGCTCGTCCTCC-3’ 5’-GCAATGGGCTTATCCCAAGGAAAAAAGGGGGAGCCGGG-3’ 5’-CCCGGCTCCCCCTTTTTTCCTTGGGATAAGCCCATTGC-3’ 5’-GTGTTCACGGCGCCCTTTGTCCTTAAACTCCCCTAGCAAATAAAG-3’ 5’-CTTTATTTGCTAGGGGAGTTTAAGGACAAAGGGCGCCGTGAACAC-3’ 5’-ACCTCCGCGGTGTTCACGATCCCCTTTGTCCTTTTTCTC-3’ 5’-GAGAAAAAGGACAAAGGGGATCGTGAACACCGCGGAGGT-3’
by guest on March 15, 2018
http://ww
w.jbc.org/
Dow
nloaded from
E2F1 regulates OGT and OGA expression
14
Figure 1
by guest on March 15, 2018
http://ww
w.jbc.org/
Dow
nloaded from
E2F1 regulates OGT and OGA expression
15
Figure 2
by guest on March 15, 2018
http://ww
w.jbc.org/
Dow
nloaded from
E2F1 regulates OGT and OGA expression
16
Figure 3
by guest on March 15, 2018
http://ww
w.jbc.org/
Dow
nloaded from
E2F1 regulates OGT and OGA expression
17
Figure 4
by guest on March 15, 2018
http://ww
w.jbc.org/
Dow
nloaded from
E2F1 regulates OGT and OGA expression
18
Figure 5
by guest on March 15, 2018
http://ww
w.jbc.org/
Dow
nloaded from
E2F1 regulates OGT and OGA expression
19
Figure 6
by guest on March 15, 2018
http://ww
w.jbc.org/
Dow
nloaded from
E2F1 regulates OGT and OGA expression
20
Figure 7
by guest on March 15, 2018
http://ww
w.jbc.org/
Dow
nloaded from
E2F1 regulates OGT and OGA expression
21
Figure 8
by guest on March 15, 2018
http://ww
w.jbc.org/
Dow
nloaded from
P. JonesSenthilkumar Muthusamy, Kyung U. Hong, Sujith Dassanayaka, Tariq Hamid and Steven
expressionE2F1 transcription factor regulates O-GlcNAc transferase and O-GlcNAcase
published online November 2, 2015J. Biol. Chem.
10.1074/jbc.M115.677534Access the most updated version of this article at doi:
Alerts:
When a correction for this article is posted•
When this article is cited•
to choose from all of JBC's e-mail alertsClick here
by guest on March 15, 2018
http://ww
w.jbc.org/
Dow
nloaded from
Recommended