
IFI TECHNICAL REPORTS
Institute of Computer Science,
Clausthal University of Technology
IfI-05-12
Clausthal-Zellerfeld 2005
2
Dynamic functional EIT Imaging (df-EIT) – A New Concept for Monitoring
Effects on regional Lung Function induced by Respiratory Therapy
Taras Dudykevych1, Günter Hahn1, Harald Richter2, José Hinz1, Inéz Frerichs1, Onnen Moerer1,
Gerhard Hellige1
1Department of Anaesthesiological Research, Centre of Anaesthesiology, Emergency and
Intensive Care Medicine, University of Göttingen,
Robert-Koch-Str. 40, TL195, D-37075 Göttingen, Germany;
2Institute for Informatics, Clausthal University of Technology,
Julius-Albert-Str. 4, D-38678 Clausthal, Germany
Short title:
Dynamic functional EIT imaging for monitoring regional lung function
Address for correspondence:
Dr. Taras Dudykevych, Centre of Anaesthesiology, Emergency and Intensive Care Medicine,
TL 195, University of Göttingen, Robert-Koch-Str. 40, D-37075 Göttingen, FRG
(e-mail: [email protected])
Abstract
EIT can potentially offer useful information for monitoring regional lung function directly at the
bedside. However it is not evident which presentation of this information is most suitable for
monitoring and how this can be efficiently achieved. Using a conventional EIT movie
interpretation is inherently difficult due to the continuously changing image. We propose a novel
monitoring method of dynamic functional EIT image generation. This method is a modification of
methods used for offline generation of functional EIT images for quantification of different
ventilatory conditions. In the current work it has been extended to work online on the last acquired
images in such a way that the functional image is continuously updated during data acquisition.
The advantage is that for steady state physiological condition the dynamic functional EIT image
does not alter thus facilitating visual interpretation. Different dynamic functional EIT images
acquired under laboratory and clinical conditions in healthy volunteers and mechanically
ventilated patient with the Goe-MF II system will be presented and compared with the information
obtained from a sequence of single EIT images.
Keywords
Electrical Impedance Tomography, EIT, ventilation monitoring
1 Introduction
Mechanical ventilation is a standard therapy in patients suffering from acute lung injury (ALI) or adult respiratory
distress syndrome (ARDS). However, mechanical ventilation also can induce lung damage (Bernard et al 1994).
Furthermore, the development of non-ventilated regions (atelectasis) during mechanical ventilation is a major
3
problem which can occur within seconds (Neumann at al 1998). Therefore, some ventilatory strategies (e.g. special
recruitment manoeuvre) have been proposed to open up atelectasis and keep the lung open (Lachmann et al 1992).
Unfortunately, after a recruitment manoeuvre, which opens up the lung, the effect of recruitment can disappear in
15-20 minutes (Villagra et al 2002). In consequence ventilation distribution and regional lung volume are spatially
and temporally heterogeneous. Reliable recognition of this heterogeneity may offer a rational basis for respiratory
therapy and may enable the optimisation of ventilatory support. Therefore continuous monitoring at the bed-side of
regional ventilation, regional lung volume and, thus, alveolar recruitment or de-recruitment is necessary to follow
short- and long-term changes in regional lung function induced by respiratory therapy.
Detection of changes in regional ventilation and lung volume in mechanical ventilated patients as guides in the
treatment of the patient and setting of the ventilator is not common on the intensive care unit (ICU). The reason for
this is that until now measurements are complicated and the benefit may not warrant the efforts (Hinz 2003). X-ray
computed tomography delivers information about ventilation distribution and regional lung volume. This method is
associated with marked radiation exposure and cannot be used continuously at the bedside. From this, electrical
impedance tomography (EIT) may be considered as an imaging technique capable of monitoring of different
regional pulmonary parameters directly at the bedside with an excellent temporal resolution without exposure to
radiation (Brown 2002, Hinz 2003). However, to our knowledge, this monitoring approach has not been
implemented yet in any commercially available EIT device or research instrument. Until now the physiologically
relevant information can only be extracted after time-consuming offline evaluation steps. Furthermore, the kind of
information which is most suitable for monitoring of ventilation distribution and regional lung volume has not been
investigated.
To get information about regional lung ventilation and volume self-adhesive electrodes are placed equidistant around
a cylindrical-like object such as a human thorax. Between any two adjacent electrode pairs, a constant electric
current is injected into the body under inspection while all other electrodes measure pair wise the resulting voltages
at their location (Brown 2003). A modified filtered back-projection algorithm (Barber and Seager 1987) is used to
reconstruct individual EIT images from these surface voltages. These individual EIT images represent the spatial
distribution of relative impedance changes in one thoracic cross-section compared to a reference physiological state.
In general, in healthy volunteers this reference state is collected during normal tidal breathing and in artificially
ventilated patients during mechanical ventilation set by the attending physician.
During respiration, from the physiological point of view, this spatial distribution of relative impedance changes
represent instantaneous air content changes. It has by itself only limited diagnostic value. However, the derived
information allows concise characterization of the lung function. For example, the variation of these impedance
changes with time gives information about regional lung ventilation, whereas the mean relative impedance changes
correlate with shift in local lung volume compared to the physiological reference state (Hahn et al 1995). In this
paper we propose a novel online monitoring approach based on this procedure and exemplary results will be
presented in spontaneously breathing healthy volunteers performing specific ventilatory manoeuvres and in
mechanically ventilated ICU patients during different ventilatory settings.
2 Methodology
The work being presented here uses the Goe-MF II EIT system (Hahn et al 2002), which incorporates a 16 electrode
adjacent drive strategy with the ventilation monitoring software running with frame rates of 13, 25 and 44 Hz
(Dudykevych et al 2002). Series of single EIT images (EIT Movie) as well as two types of derived images called
dynamic functional EIT images (df-EIT) representing regional lung-ventilation (lung ventilation df-EIT images) and
shift in lung volume (shift in lung volume df-EIT images) will be evaluated for monitoring. The procedure for
generation of these images is described below.
Due to the fact that future EIT images cannot be taken into account for proper scaling of the past and current images
and that the scaling range is not known a priori, before measurement starts a scaling problem arises in on-line
monitoring. This is in contrast to off-line evaluation, where each EIT image can be scaled retrospectively using a
series' global minimum and maximum values. Furthermore, the reference choice obviously influences the resulting
tomographic data. On the other hand, in general, quantitative interpretation is difficult or impossible when each
image is scaled automatically. The scaling problem is approached individually for the three different image types.
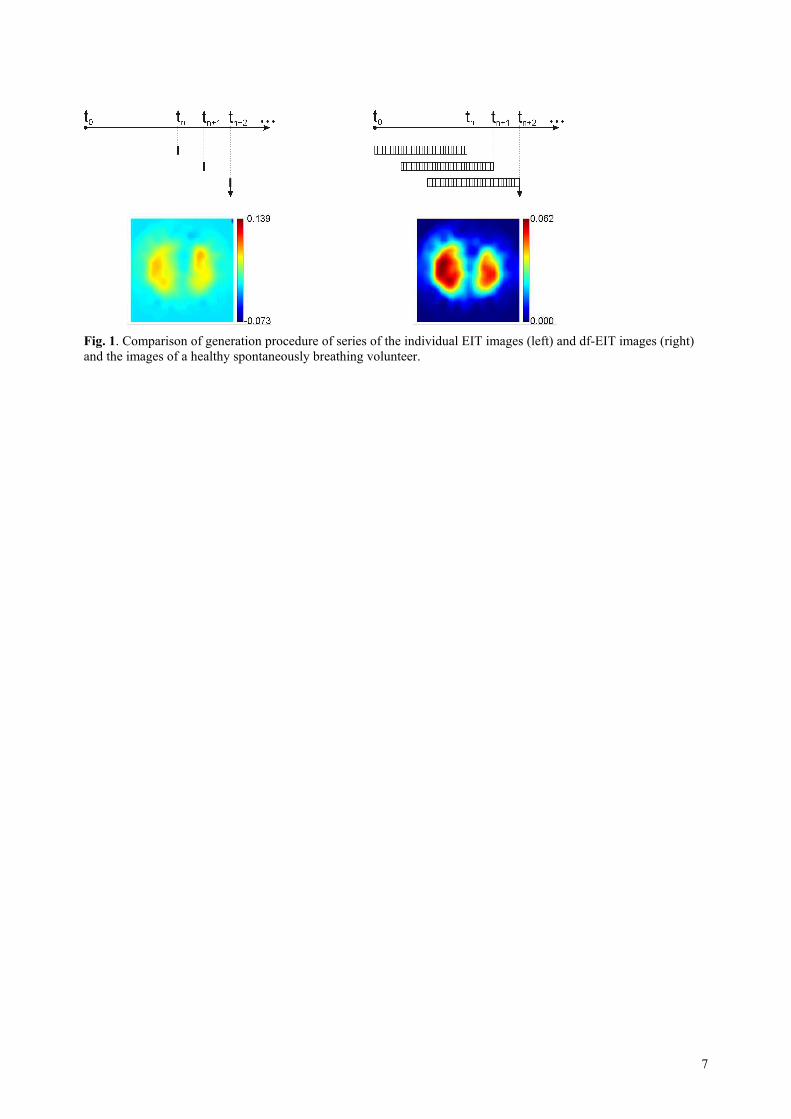
EIT Movie. The ventilation monitoring software generates the online conventional EIT movie from consecutive
single EIT images as depicted in fig. 1, left. The image orientation in this work is the following: ventral is at the
bottom and the right side of the body is on the left of the image. Depending on the state of respirations and the
chosen reference the image values range results in either positive or negative value. The scaling problem is
approached by starting with initial low range and adjusting the images' scale range by 10 % each time a new image
falls below or above current scale. So the free room of maximally 10 % must be taken into account e.g. in the
ventilatory steady-state condition.
4
Lung ventilation df-EIT images. There are two types of derived functional EIT images to be considered for
monitoring. The method of off-line generation of functional EIT images was initially introduced by Hahn et al in
1995 for quantification of different ventilatory conditions. This approach is now the state-of-the-art in the evaluation
of EIT data and has been used in a number of EIT reports (Hahn et al 1995, Frerichs et al 2001). Briefly, for lung
ventilation functional EIT image the standard deviation of each local time course from the series of single EIT
images, representing a steady state physiological condition, is calculated as a variability measure of the impedance
change and the underlying physiological process. Since this is performed on all pixels' time courses, a series of
tomograms will be reduced to a single synthetic image. In the current work this method has been extended to work
online on the last acquired images using a concept of sliding window, that is the functional image is updated during
data acquisition each time a new frame is sampled (fig. 1, right). Obviously, the image values range is always
positive, high impedance variation within a thoracic plane physiologically is related to ventilation, low variation is
registered in the thorax wall itself. Statistically, physiological processes such as mechanical ventilation with fix
ventilator setting or spontaneous breathing can be assumed to be stationary processes as both statistical properties
and power density spectrum are time-invariant. Therefore each image can be scaled automatically to provide the
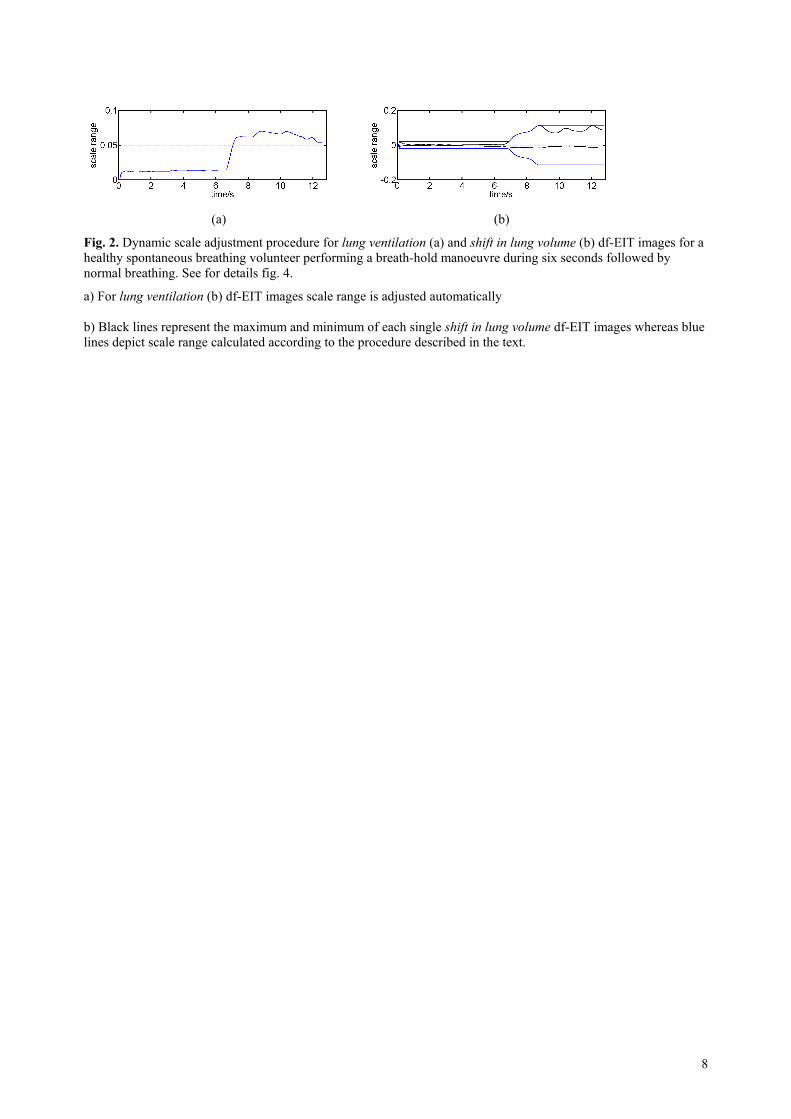
maximal colour dynamic range. The scale range will not essentially change over the entire duration of the stationary
physiological process as confirmed for the breath-hold manoeuvre and spontaneous breathing in fig. 2(a) for the
human volunteer EIT data from fig. 4 described later. The colour bar on the image's right is used to provide the
quantitative information which represents the instantaneous physiological variation in the cross-section. Obviously, a
stable df-EIT image is obtained when the sliding window length at least matches or exceeds a periodicity of the
physiological process to be monitored.
Shift-in-lung-volume df-EIT images. For the shift in lung volume df-EIT image generation, the mean value for each
time course within a moving window is calculated as a functional parameter instead of variation as in the previous
case. The image values range can be either positive or negative as in the case of single EIT images. Therefore
unambiguous colour assignment to the distinct shift in lung volume is not possible during automatic scaling, making
quantitative interpretation impossible. The problem is approached by these three steps 1) starting with initial low
range and adjusting the series' scale range to the current image maximum or minimum each time a new image falls
above or below current scale; 2) the image scale is always centred by equalizing the absolute values for maximal
negative and positive scale values; 3) the colour bar on the image's right is used to provide the quantitative
information about the instantaneous shift in lung volume in the cross-section with respect to the reference state. This
dynamic scale adjustment procedure is shown in fig. 2(b) for the human volunteer EIT data from fig. 4 described
later. This results in regions with no shift in lung volume always appearing in the same colour regardless of the
reference state choice. Furthermore, distinct colours can be associated with the higher and lower lung air content
compared to the reference state.
3 Results
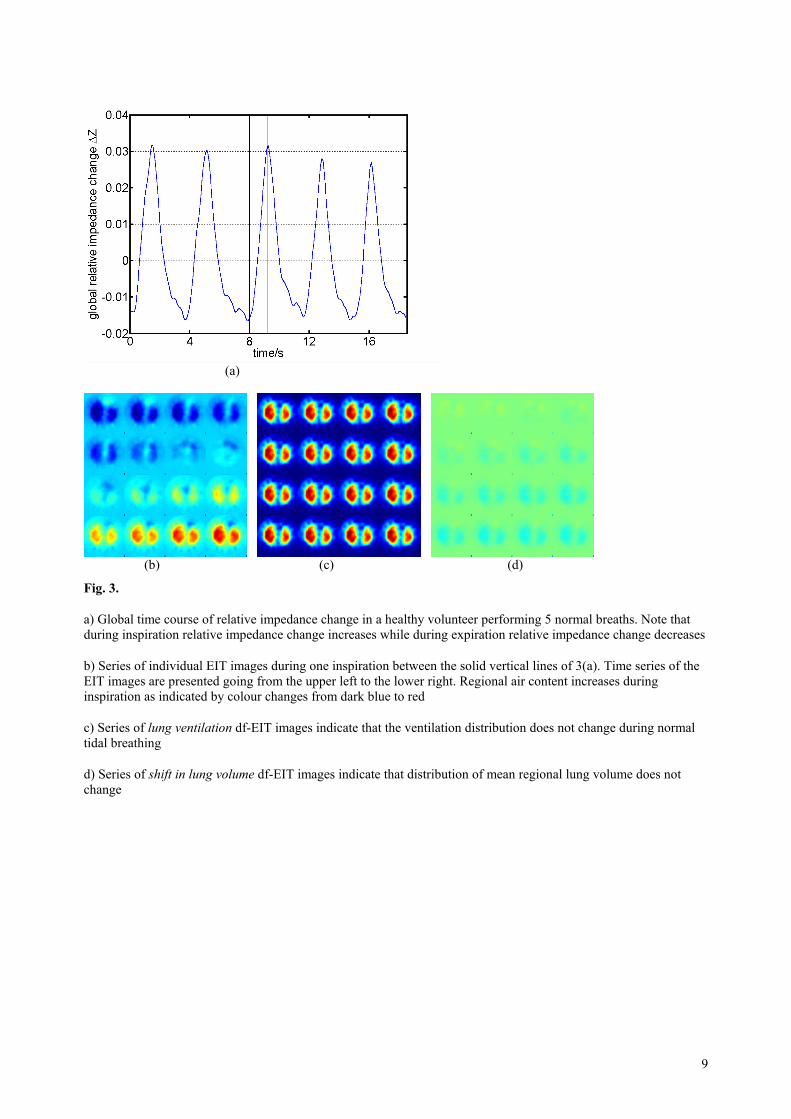
Figure 3(a) depicts the global time course of relative impedance change for a healthy spontaneously breathing
volunteer. EIT scanning was performed at an acquisition rate of 13 frames/s. The series of individual EIT images,
lung ventilation and shift in lung volume df-EIT images have been generated online. For the time period of about
1.2 seconds, depicted by two vertical solid lines, corresponding to the one half of the breathing cycle from the
expiration to the inspiration three series are plotted in a 4x4 arrangement in the figures 3(b), 3(c) and 3(d). Time
series of the EIT images are presented in this work going from the upper left to the lower right. The EIT movie runs
from dark blue at expiration through green at the mean lung volume to red shades at inspiration. The transition from
expiration to inspiration is comparitively smooth since the limits of physiologically induced relative impedance
change do not vary in this steady state. In contrast, the lung ventilation df-EIT images remain almost unaltered from
frame to frame, because the physiological state – ventilation and fluid distribution in the thoracic cross-section –
does not change. The nearly homogeneous green shades of the shift in lung volume df-EIT images reflect the fact
that no change of local lung volume occurs during spontaneous breathing.
Figure 4(a) represents the global time course of relative impedance change for the same volunteer performing an
end-expiratory breath-hold manoeuvre followed by spontaneous breathing. As in figure 3, the series of individual
EIT images, lung ventilation and shift in lung volume df-EIT images have been generated online and are shown in
figures 4(b), 4(c) and 4(d) for the time period of about 1.2 seconds depicted by two vertical solid lines. The reference
for the back-projection reconstruction algorithm is calculated as the mean value from the breath-hold phase. The
colours vary synchronously with cardiac-related actions during the first half and changes abruptly as the volunteer
starts to breath due to the rescaling process described above. On the other hand lung ventilation df-EIT images only
emphasize the cardiac-related variations of the relative impedance change during the breath-hold phase (images 1-6),
the display alters during transition from breath-hold steady state to the tidal breathing (images 6-9) and "freezes" in
this state (images 9-16) emphasizing primarily the pulmonary function. The shift in lung volume df-EIT images show
5
simultaneously the corresponding increase of the mean local lung volume (images 11-16) whereas the first part
indicates no significant lung volume changes during breath-hold steady state (images 1-9).
The noticeable effect of the different referencing approaches on the EIT movie is demonstrated in figure 5. The same
data as in figure 4 have been reconstructed using an averaged tidal breathing part as a reference. Now, the end-
expiratory breath-hold is identified as expiration in the EIT movie and the cardiac-related oscillations have only
negligible influence on the EIT movie display. This does not occur in the lung ventilation df-EIT image and by
comparing the figures 4(c) and 5(c) it becomes obvious that, fortunately, the reference choice has no effect on lung
ventilation df-EIT image. On the other hand shift in lung volume df-EIT image clearly indicates the decreased mean
regional lung volume during end-expiratory apnoea, compared to the normal breathing reference state (images 1-8).
These changes are cancelled as the volunteer returns to the spontaneous breathing, which is identical to the reference
(images 10-16).
Figure 6(a) and 6(b) shows the exemplary changes in the local relative impedance change tracings resulting from an
increase in positive end expiratory pressure (PEEP) level from 5 to 15 mbar in one ventral and dorsal lung region for
a mechanically ventilated ARDS patient. This series has been referenced on the PEEP level of 5 mbar. In the dorsal
region a time-dependent recruitment occurs during PEEP step indicated by an increase of local relative impedance
change amplitude after PEEP level has been increased to 15 mbar. In contrast to in the ventral regions after PEEP
has increased to 15 mbar a decrease of local relative impedance change amplitude can be observed showing an over-
distension.
The corresponding lung-ventilation df-EIT images as displayed online on the running ventilation monitoring
software are shown in figures 6(c) und 6(d) and the corresponding shift in lung volume df-EIT images are shown in
figures 6(e) und 6(f) respectively for two sliding windows depicted in 6(a) and (b). Both, the lung ventilation df-EIT
images and the local time courses clearly show the ventilation redistribution from ventral to dorsal lung regions
resulting from the PEEP step indicating dorsal alveolar recruitment. The shift in lung volume df-EIT images (fig.
6(e) and 6(f)) indicate the corresponding increase in mean regional lung volume, compared to the mechanical
respirator PEEP level of 5 mbar.
4 Discussion and Conclusion
The results demonstrate that EIT movie is not the most convenient approach for monitoring of regional lung
ventilation and shift in regional lung volume in the clinical settings as unambiguous colour scale assignment is not
possible online. This is due to the facts that 1) the colour varies periodically through the whole dynamic range even
in physiological or clinical steady state conditions (e.g. during normal tidal breathing in fig. 3(b)); 2) during
transition from one state to another physiological information is superimposed by artefacts dependent on the selected
reference state and the induced rescaling process as depicted in fig. 4(b) and 5(b). In contrast, df-EIT images produce
only marginal visible changes under steady-state physiological condition (fig. 3(c), 4(c), 5(c)) facilitating visual
interpretation. Marked rapid changes will only occur in an unsteady-state transition phase as e.g. in transition from
respiratory apnoea to tidal breathing or as a result of changing mechanical ventilator settings (fig. 6(c), (d) and 6(e),
(f)). Furthermore distinct colour shades can be associated with particular physiological conditions. By using the well
known pseudo-colour shading (fig. 1), in the lung ventilation df-EIT images, yellow and red shades are related to
ventilation whereas blue are registered in the regions with low physiological variation as in the thorax wall. In the
shift in lung volume df-EIT images, the regions with no regional mean lung volume change are presented by green
shades, yellow and red are related to regions with increased volume values whereas blue corresponds to the regions
with decreased lung volume compared to the reference physiological state.
The technique of dynamic functional EIT imaging presented here will expand the capability of EIT for monitoring
and imaging. From the technical and operational point of view, overall measurement plausibility checks will be
possible for the first time during a data collection. From the medical point of view, the regional lung ventilation and
shift in lung volume can be continuously monitored by EIT similarly to conventional heart rate or blood pressure
monitoring. Df-EIT offers an immediate visual impression of effects of clinical or experimental interventions. In
particular, dynamical functional EIT seems to be a helpful tool to detect alveolar recruitment during mechanical
ventilation and to set the respirator parameters for each individual patient optimally.
6
References
[1] Barber D C and Seager A D 1987 Fast reconstruction of resistance images Clin. Phys. Physiol. Meas. 8
A47-A54
[2] Bernard G R, Artigas A, Brigham K L et al 1994 Report of the American-European Consensus conference
on acute respiratory distress syndrome: definitions, mechanisms, relevant outcomes, and clinical trial
coordination. Consensus Committee J. Crit. Care 9 72-81
[3] Brown B H 2003 Electrical impedance tomography (EIT): a review J. Med. Eng. Tech. 27 97-108
[4] Dudykevych T, Hahn G, Frerichs I, Hinz J and Hellige G 2002 A concept for evaluation of clinically
relevant pulmonary parameters by high performance electrical impedance tomography (EIT) Proc. of the
2nd European Med. and Biol. Eng. Conf. pp 108-109
[5] Frerichs I, Dudykevych T, Hinz J, Bodenstein M, Hahn G and Hellige G 2001 Gravity effects on regional
lung function determined by functional EIT during parabolic flights J. Appl. Physiol. 91 39-50
[6] Frerichs I, Hinz J, Herrmann P, Weisser G, Hahn G, Dudykevych T, Quintel M and Hellige G 2002
Detection of local lung air content by electrical impedance tomography in comparison with electron beam
CT J. Appl. Physiol. 93 660-666
[7] Hinz J 2003 Clinical measurement of end-expiratory lung volume on the intensive care unit Int. J. Intensive
Care Summer 2003, 57-62
[8] Hahn G, Sipinkova I, Baisch F and Hellige G 1995 Changes in the thoracic impedance distribution under
different ventilatory conditions Physiol Meas. 16 A161-A173
[9] Hahn G, Dudykevych T, Frerichs I and Hellige G 2002 EIT System for clinical and space applications Proc.
of the 2nd European Med. and Biol. Eng. Conf. pp 110-111
[10] Lachmann B 1992 Open up the lung and keep the lung open Intensive Care Med. 18 319-321
[11] Neumann P, Berglund J E, Mondejar E F, Magnusson A and Hedenstierna G 1998 Dynamics of lung
collapse and recruitment during prolonged breathing in porcine lung injury J. Appl. Physiol. 85 1533-1543
[12] Villagra A, Ochagavia A, Vatua S. et al 2002 Recruitment maneuvers during lung protective ventilation in
acute respiratory distress syndrome Am. J. Respir. Crit. Care Med. 165 165-170
7
Fig. 1. Comparison of generation procedure of series of the individual EIT images (left) and df-EIT images (right)
and the images of a healthy spontaneously breathing volunteer.
8
(a) (b)
Fig. 2. Dynamic scale adjustment procedure for lung ventilation (a) and shift in lung volume (b) df-EIT images for a
healthy spontaneous breathing volunteer performing a breath-hold manoeuvre during six seconds followed by
normal breathing. See for details fig. 4.
a) For lung ventilation (b) df-EIT images scale range is adjusted automatically
b) Black lines represent the maximum and minimum of each single shift in lung volume df-EIT images whereas blue
lines depict scale range calculated according to the procedure described in the text.
9
(a)
(b) (c) (d)
Fig. 3.
a) Global time course of relative impedance change in a healthy volunteer performing 5 normal breaths. Note that
during inspiration relative impedance change increases while during expiration relative impedance change decreases
b) Series of individual EIT images during one inspiration between the solid vertical lines of 3(a). Time series of the
EIT images are presented going from the upper left to the lower right. Regional air content increases during
inspiration as indicated by colour changes from dark blue to red
c) Series of lung ventilation df-EIT images indicate that the ventilation distribution does not change during normal
tidal breathing
d) Series of shift in lung volume df-EIT images indicate that distribution of mean regional lung volume does not
change
10
(a)
(b) (c) (d)
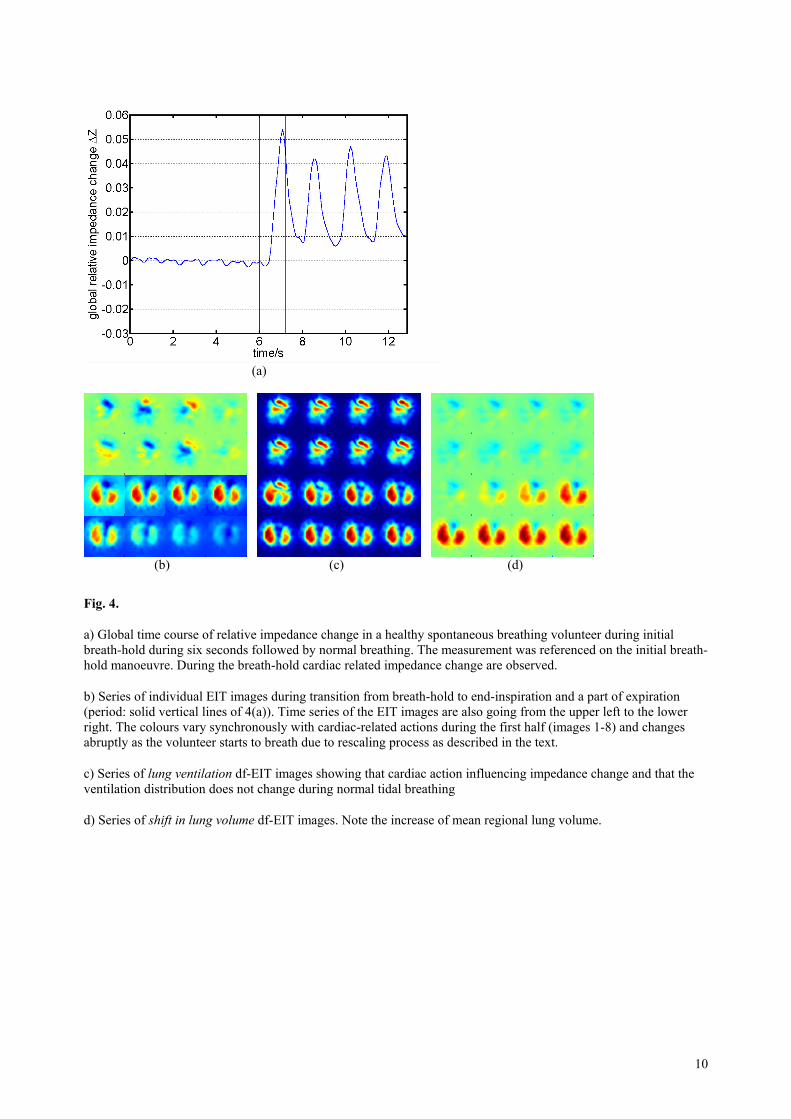
Fig. 4.
a) Global time course of relative impedance change in a healthy spontaneous breathing volunteer during initial
breath-hold during six seconds followed by normal breathing. The measurement was referenced on the initial breath-
hold manoeuvre. During the breath-hold cardiac related impedance change are observed.
b) Series of individual EIT images during transition from breath-hold to end-inspiration and a part of expiration
(period: solid vertical lines of 4(a)). Time series of the EIT images are also going from the upper left to the lower
right. The colours vary synchronously with cardiac-related actions during the first half (images 1-8) and changes
abruptly as the volunteer starts to breath due to rescaling process as described in the text.
c) Series of lung ventilation df-EIT images showing that cardiac action influencing impedance change and that the
ventilation distribution does not change during normal tidal breathing
d) Series of shift in lung volume df-EIT images. Note the increase of mean regional lung volume.
11
(a)
(b) (c)
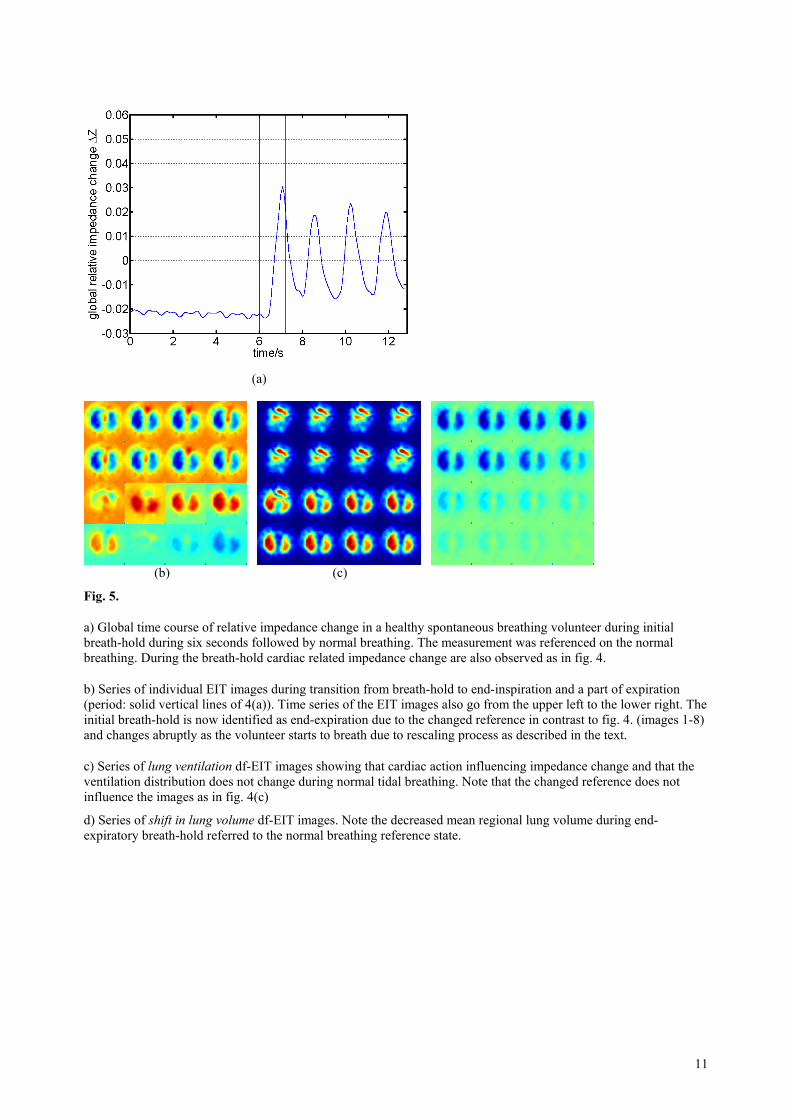
Fig. 5.
a) Global time course of relative impedance change in a healthy spontaneous breathing volunteer during initial
breath-hold during six seconds followed by normal breathing. The measurement was referenced on the normal
breathing. During the breath-hold cardiac related impedance change are also observed as in fig. 4.
b) Series of individual EIT images during transition from breath-hold to end-inspiration and a part of expiration
(period: solid vertical lines of 4(a)). Time series of the EIT images also go from the upper left to the lower right. The
initial breath-hold is now identified as end-expiration due to the changed reference in contrast to fig. 4. (images 1-8)
and changes abruptly as the volunteer starts to breath due to rescaling process as described in the text.
c) Series of lung ventilation df-EIT images showing that cardiac action influencing impedance change and that the
ventilation distribution does not change during normal tidal breathing. Note that the changed reference does not
influence the images as in fig. 4(c)
d) Series of shift in lung volume df-EIT images. Note the decreased mean regional lung volume during end-
expiratory breath-hold referred to the normal breathing reference state.
12
(a) ventral region (b) dorsal region
(c) PEEP 5mbar (d) PEEP 15mbar
(e) PEEP 5mbar (f) PEEP 15mbar
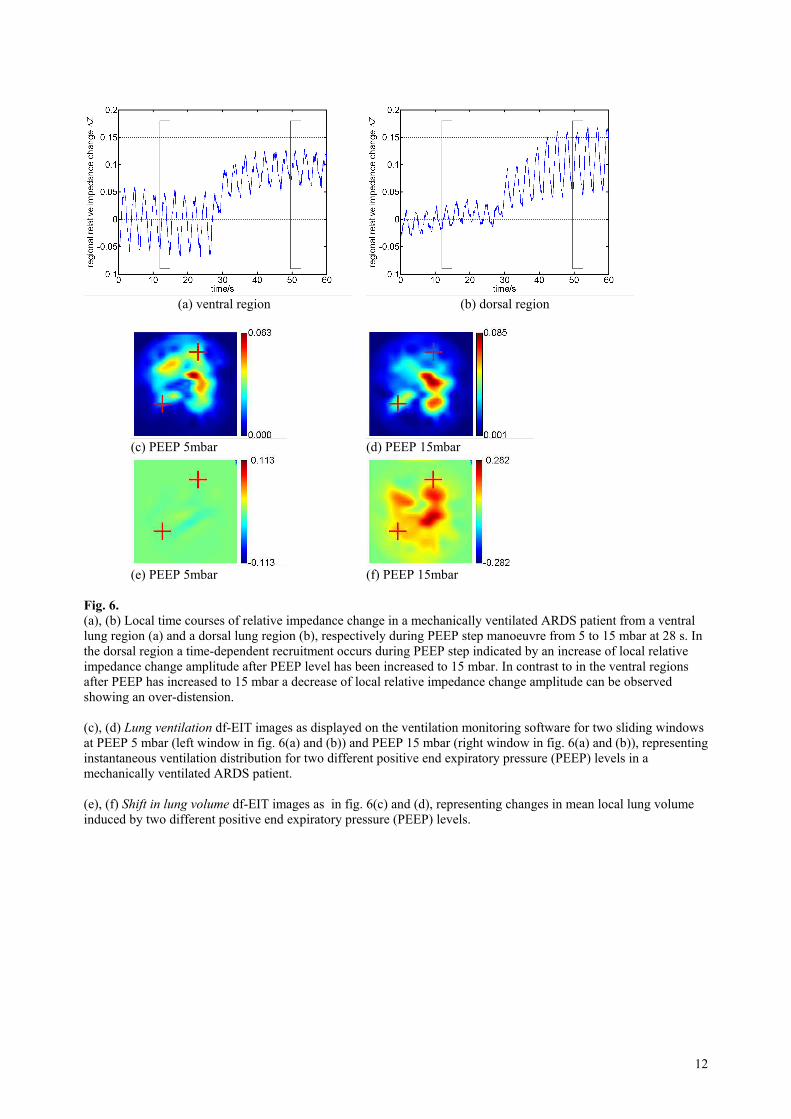
Fig. 6.
(a), (b) Local time courses of relative impedance change in a mechanically ventilated ARDS patient from a ventral
lung region (a) and a dorsal lung region (b), respectively during PEEP step manoeuvre from 5 to 15 mbar at 28 s. In
the dorsal region a time-dependent recruitment occurs during PEEP step indicated by an increase of local relative
impedance change amplitude after PEEP level has been increased to 15 mbar. In contrast to in the ventral regions
after PEEP has increased to 15 mbar a decrease of local relative impedance change amplitude can be observed
showing an over-distension.
(c), (d) Lung ventilation df-EIT images as displayed on the ventilation monitoring software for two sliding windows
at PEEP 5 mbar (left window in fig. 6(a) and (b)) and PEEP 15 mbar (right window in fig. 6(a) and (b)), representing
instantaneous ventilation distribution for two different positive end expiratory pressure (PEEP) levels in a
mechanically ventilated ARDS patient.
(e), (f) Shift in lung volume df-EIT images as in fig. 6(c) and (d), representing changes in mean local lung volume
induced by two different positive end expiratory pressure (PEEP) levels.

13
Impressum
Publisher: Institut für Informatik, Technische Universität Clausthal Julius-
Albert Str. 4, 38678 Clausthal-Zellerfeld, Germany
Editor of the series: Jürgen Dix Technical
editor: Wojciech Jamroga
Contact: [email protected]
URL: http://www.in.tu-clausthal.de/_wjamroga/techreports/
ISSN: 1860-8477
The IfI Review Board
Prof. Dr. Jürgen Dix (Theoretical Computer Science/Computational Intelligence)
Prof. Dr. Klaus Ecker (Applied Computer Science)
Prof. Dr. habil. Torsten Grust (Databases)
Prof. Dr. Barbara Hammer (Theoretical Foundations of Computer Science)
Prof. Dr. Kai Hormann (Computer Graphics)
Dr. Michaela Huhn (Economical Computer Science)
Prof. Dr. Gerhard R. Joubert (Practical Computer Science)
Prof. Dr. Ingbert Kupka (Theoretical Computer Science)
Prof. Dr. Wilfried Lex (Mathematical Foundations of Computer Science)
Prof. Dr. Jörg Müller (Agent Systems)
Dr. Frank Padberg (Software Engineering)
Prof. Dr.-Ing. Dr. rer. nat. habil. Harald Richter (Technical Computer Science)
Prof. Dr. Gabriel Zachmann (Computer Graphics)
Recommended