Comprehensive Diver Data Management Software
User’s Manual
Diver-VisiONE

Copyright Information
© 2009 Schlumberger Water Services. All rights reserved.No portion of the contents of this publication may be reproduced or transmitted in any form or by any means without the express written permission of Schlumberger Water Services.
Printed in Canada2009
Table of Contents ii
Table of Contents
1. Introduction to Diver-VisiONE ................................................... 1Diver-VisiONE Features .................................................................................................. 1
Diver-VisiONE Installation.............................................................................................. 3Hardware Requirements ............................................................................................... 3Supported Devices ........................................................................................................ 3
Reading Units ................................................................................................................................... 3Divers ............................................................................................................................................... 3Interface Cables ................................................................................................................................ 4Field Devices .................................................................................................................................... 4
Installing Diver-VisiONE ............................................................................................. 4Uninstalling Diver-VisiONE ........................................................................................ 5Starting Diver-VisiONE ............................................................................................... 5Starting DTC Service.................................................................................................... 6Licensing....................................................................................................................... 6
Diver-VisiONE SQL Database ........................................................................................ 6
Diver-VisiONE Workflow................................................................................................ 7
User Account Permissions................................................................................................ 8
About Diver-VisiONE....................................................................................................... 9Main Window ............................................................................................................... 9Diver-VisiONE Modules ............................................................................................ 10
Diver Data ...................................................................................................................................... 10Location Management .................................................................................................................... 10Time Series Plotting ....................................................................................................................... 11Mapping.......................................................................................................................................... 11
Diver-VisiONE Important Concepts............................................................................. 11
Using the Online Help..................................................................................................... 13
2. Project Management................................................................... 15Configuring Database Server Settings .......................................................................... 15
Creating a New Project .................................................................................................. 16
Opening a Project ........................................................................................................... 18
Deleting a Project............................................................................................................ 18
iii Table of Contents
Backing Up a Database................................................................................................... 19
Restoring a Database ...................................................................................................... 20
Modifying Project Settings............................................................................................. 20
3. Diver Data Management ............................................................ 21Diver Data Interface ....................................................................................................... 22
Navigating Diver Data using Monitoring Point Tree .................................................. 23Project Settings ........................................................................................................... 24Monitoring Point Settings........................................................................................... 26Precipitation, Evaporation, Discharge and Production Data ...................................... 28Manual Measurements................................................................................................ 28Diver Settings ............................................................................................................. 30Time Series Data......................................................................................................... 30
Programming and Reading Divers................................................................................ 32
Connecting to a Diver ..................................................................................................... 33
Reading Diver Settings and Data .................................................................................. 34
Programming Diver Settings ......................................................................................... 36Monitoring Point......................................................................................................... 36Sample Method and Sample Interval.......................................................................... 36
Fixed ............................................................................................................................................... 36Event Based .................................................................................................................................... 36Predefined Pumping Tests .............................................................................................................. 37User Defined Pumping Test (Cera-Diver and Micro-Diver only) .................................................. 38Averaging Sample Method (Cera-Diver and Micro-Diver only) ................................................... 38
Altitude ....................................................................................................................... 38Conductivity Rage ...................................................................................................... 38
Starting a Diver............................................................................................................... 39Immediate Start ............................................................................................................................... 39Future Start...................................................................................................................................... 39Smart Future Start (SFS)................................................................................................................. 39
Stopping a Diver.............................................................................................................. 40
Downloading Diver Data ................................................................................................ 40
Viewing Actual Data....................................................................................................... 41
Calibrating CTD-Divers................................................................................................. 41User Calibration .............................................................................................................................. 42Restore Factory Settings ................................................................................................................. 42
Table of Contents iv
Viewing the Calibration History ................................................................................... 43
Importing Diver Data ..................................................................................................... 43From from MON/DAT files ....................................................................................... 44From LDM 5.x Databases........................................................................................... 44From Standalone Versions of Diver-Office................................................................ 44From Diver-Pocket & Diver Mate Field Devices ....................................................... 46
Diver Data Preferences................................................................................................... 47Units............................................................................................................................ 47Communication........................................................................................................... 47Creating User-Defined Pumping Tests ....................................................................... 47
Filtering Time Series Data ............................................................................................. 48Filtering Time Series Data.............................................................................................................. 49Exporting Time Series Data ........................................................................................................... 49Barometric Compensation .............................................................................................................. 50
Compensating Diver Data .............................................................................................. 50What is Barometric Compensation? ........................................................................... 50
Using a Baro-Diver......................................................................................................................... 51Setting Up your Project............................................................................................... 51Compensating the Data ............................................................................................... 51Barometric Compensation Results.............................................................................. 53
4. Location Management ................................................................ 55Location Management User Interface .......................................................................... 56
Location Toolbar ............................................................................................................................ 56Monitoring Point List ..................................................................................................................... 57Location Table................................................................................................................................ 57Location Profile .............................................................................................................................. 58
Creating a Monitoring Network.................................................................................... 58
Creating a New Location................................................................................................ 59
Location Data Entry ....................................................................................................... 60Location Tab................................................................................................................................... 61Drilling & Filling Tab .................................................................................................................... 62Casing & Screen Tab...................................................................................................................... 63Lithology Tab ................................................................................................................................. 65Notes Tab........................................................................................................................................ 65
Assigning Monitoring Points to Locations.................................................................... 65
Editing a Location........................................................................................................... 66
v Table of Contents
Importing Location Data................................................................................................ 66
Updating Location Profiles ............................................................................................ 69
Exporting Location Profile to Image file ...................................................................... 69
Modifying Lists ............................................................................................................... 70Manually Modifying Lists .............................................................................................................. 70Importing List Items ....................................................................................................................... 71
Creating Location Reports............................................................................................. 72
5. Time Series Plotting.................................................................... 75Time Series Interface...................................................................................................... 76
Time Series Toolbar........................................................................................................................ 76Plot Page ......................................................................................................................................... 77Time Series Plots ............................................................................................................................ 78
Creating a New Plot Page............................................................................................... 78
Adding a New Plot .......................................................................................................... 79
Exporting Plot Page to Image ........................................................................................ 81
Exporting Data Series to File......................................................................................... 81
Editing Plot Settings ....................................................................................................... 82
Editing Plot Series........................................................................................................... 84
6. Mapping....................................................................................... 87Mapping Interface .......................................................................................................... 88
Mapping Toolbar ............................................................................................................................ 88Active View .................................................................................................................................... 90Layer Manager ................................................................................................................................ 90Map Window .................................................................................................................................. 90
Creating a New Map Document .................................................................................... 91
Adding a Location Layer ............................................................................................... 91
Adding a Map Layer....................................................................................................... 92
Exporting Layers to KML/KMZ format ...................................................................... 93
Changing Symbol Properties ......................................................................................... 94Polygon Symbol Properties............................................................................................................. 94Polyline Symbol Properties............................................................................................................. 94Point Symbol Properties ................................................................................................................. 95
Table of Contents vi
Showing Map Layer Labels ........................................................................................... 95
Opening a Map Document ............................................................................................. 95
Exporting a Map to Image ............................................................................................. 96
Layout View..................................................................................................................... 96Adding Map Elements ................................................................................................ 97
Adding a North Arrow.................................................................................................................... 97Adding a Scale Bar......................................................................................................................... 97Adding a Legend ............................................................................................................................ 97Adding a Picture ............................................................................................................................. 97
Printing Map Documents ............................................................................................ 98Page Setup options ......................................................................................................................... 98Print Preview .................................................................................................................................. 98Print ................................................................................................................................................ 99
7. Index........................................................................................... 101

vii Table of Contents
PrefaceSchlumberger Water Services (SWS) is a recognized leader in the development and application of innovative groundwater technologies in addition to offering expert services and professional training to meet the advancing technological requirements of today’s groundwater and environmental professionals.
Schlumberger Water Services software consists of a complete suite of environmental software applications engineered for data management and analysis, modeling and simulation, visualization, and reporting. Schlumberger Water Services software is currently developed by SWS and sold globally as a suite of desktop solutions.
For over 18 years, our products and services have been used by firms, regulatory agencies, and educational institutions around the world. We develop each product to maximize productivity and minimize the complexities associated with groundwater and environmental projects. To date, we have over 14,000 registered software installations in more than 85 countries!
Need more information?If you would like to contact us with comments or suggestions, you can reach us at:
Schlumberger Water Services460 Phillip Street - Suite 101
Waterloo, Ontario, CANADA, N2L 5J2
Phone: +1 (519) 746-1798Fax: +1 (519) 885-5262
General Inquiries: [email protected]
Web: www.swstechnology.com, www.water.slb.com
Obtaining Technical SupportTo help us handle your technical support questions as quickly as possible, please have the following information ready before you call, or include it in a detailed technical support e-mail:
• A complete description of the problem including a summary of key strokes and program event (or a screen capture showing the error message, where applicable)
• Product name and version number
• Product serial number
• Computer make and model number
• Operating system and version number
• Total free RAM
i
• Number of free bytes on your hard disk
• Software installation directory
• Directory location for your current project files
You may send us your questions via e-mail, fax, or call one of our technical support specialists. Please allow up to two business days for a response. Technical support is available 8:00 am to 5:00 pm EST Monday to Friday (excluding Canadian holidays).
Phone: +1 (519) 746-1798Fax: +1 (519) 885-5262
E-mail: [email protected]
Training and Consulting ServicesSchlumberger Water Services offers numerous, high quality training courses globally. Our courses are designed to provide a rapid introduction to essential knowledge and skills, and create a basis for further professional development and real-world practice. Open enrollment courses are offered worldwide each year. For the current schedule of courses, visit: www.swstechnology.com/training or e-mail us at: [email protected].
Schlumberger Water Services also offers expert consulting and peer reviewing services for data management, groundwater modeling, aqueous geochemical analysis, and pumping test analysis. For further information, please contact [email protected].
Schlumberger Water Services Software We also develop and distribute a number of other useful software products for the groundwater professionals, all designed to increase your efficiency and enhance your technical capability, including:
• Visual MODFLOW Premium*
• Visual MODFLOW 3D-Builder*
• Hydro GeoAnalyst*
• Aquifer Test Pro*
• AquaChem*
• GW Contour*
• UnSat Suite Plus*
• Visual HELP*
• Visual PEST-ASP
• Visual Groundwater*
ii
Visual MODFLOW PremiumVisual MODFLOW Premium is a three-dimensional groundwater flow and contaminant transport modeling application that integrates MODFLOW-2000, SEAWAT, MODPATH, MT3DMS, MT3D99, RT3D, VMOD 3D-Explorer, WinPEST, Stream Routing Package, Zone Budget, MGO, SAMG, and PHT3D. Applications include well head capture zone delineation, pumping well optimization, aquifer storage and recovery, groundwater remediation design, simulating natural attenuation, and saltwater intrusion.
Visual MODFLOW 3D-BuilderVisual MODFLOW 3D-Builder is the new generation in dynamic conceptual model building. Featuring a powerful multi-format object/data import tool and tested to work within the latest version of the Visual MODFLOW modeling environment, Visual MODFLOW 3D-Builder enables you to build impressive representations of your groundwater system within a single modeling environment. This means you save hours when building your numerical model
Hydro GeoAnalystHydro GeoAnalyst is an information management system for managing groundwater and environmental data. Hydro GeoAnalyst combines numerous pre and post processing components into a single program. Components include, Project Wizard, Universal Data Transfer System, Template Manager, Materials Specification Editor, Query Builder, QA/QC Reporter, Map Manager, Cross-Section Editor, HGA 3D-Explorer, Borehole Log Plotter, and Report Editor. The seamless integration of these tools provide the means for compiling and normalizing field data, analyzing and reporting subsurface data, mapping and assessing spatial information, and reporting site data.
AquiferTest ProAquiferTest Pro, designed for graphical analysis and reporting of pumping test and slug test data, offers the tools necessary to calculate an aquifer's hydraulic properties such as hydraulic conductivity, transmissivity, and storativity. AquiferTest Pro is versatile enough to consider confined aquifers, unconfined aquifers, leaky aquifers, and fractured rock aquifers conditions. Analysis results are displayed in report format, or may be exported into graphical formats for use in presentations. AquiferTest Pro also provides the tools for trends corrections, and graphical contouring water table drawdown around the pumping well.
AquaChemAquaChem is designed for the management, analysis, and reporting of water quality data. AquaChem’s analysis capabilities cover a wide range of functions and calculations frequently used for analyzing, interpreting and comparing water quality data. AquaChem includes a comprehensive selection of commonly used plotting techniques to represent the chemical characteristics of aqueous geochemical and water quality data, as well includes PHREEQC - a powerful geochemical reaction model.
iii
GW ContourThe GW Contour data interpolation and contouring program incorporates techniques for mapping velocity vectors and particle tracks. GW Contour incorporates the most commonly used 2D data interpolation techniques for the groundwater and environmental industry including Natural Neighbor, Inverse Distance, Kriging, and Bilinear. GW Contour is designed for contouring surface or water levels, contaminant concentrations, or other spatial data.
UnSat Suite PlusUnSat Suite Plus seamlessly integrates multiple one-dimensional unsaturated zone flow and solute transport models into a single, intuitive working environment. Models include SESOIL, VS2DT, VLEACH, PESTAN, Visual HELP and the International Weather Generator. The combination of models offers users the ability for simulating the downward vertical flow of water and the migration of dissolved contaminants through the vadose zone. UnSat Suite Plus includes tools for project management, generating synthetic weather data, modeling flow and contaminants through the unsaturated zone, estimating groundwater recharge and contaminant loading rates, and preparing compliance reports.
Visual HELPVisual HELP is a one-dimensional, unsaturated zone flow modeling application built for optimizing the hydrologic design of municipal landfills. Visual HELP is based on the US E.P.A . HELP model (Hydrologic Evaluation of Landfill Performance) and has been integrated into a 32-Bit Windows application. It combines the International Weather Generator, Landfill Profile Designer, and Report Editor. Applications include designing landfill profiles, predicting leachate mounding, and evaluating potential leachate seepage to the groundwater.
Visual PEST-ASPVisual PEST-ASP combines the powerful parameter estimation capabilities of PEST-ASP, with the graphical processing and display features of WinPEST. Visual PEST-ASP can be used to assist in data interpretation, model calibration and predictive analysis by optimizing model parameters to fit a set of observations. This popular estimation package achieves model independence through its capacity to communicate with a model through its input and output files.
Visual GroundwaterVisual Groundwater is a visualization software package that delivers high-quality, three-dimensional representations of subsurface characterization data and groundwater modeling results. Combining graphical tools for three-dimensional visualization and animation, Visual Groundwater also features a data management system specifically designed for borehole investigation data. The graphical display features allow the user to display site maps, discrete data contours, isosurfaces and cross sectional views of the data.
iv
Groundwater InstrumentationDiver-NETZDiver-NETZ is an all-inclusive groundwater monitoring network system that integrates high-quality field instrumentation with the industries latest communications and data management technologies. All of the Diver-NETZ components are designed to optimize your project workflow from collecting and recording groundwater data in the field - to project delivery in the office.
*Mark of Schlumberger
v

vi
1Introduction to Diver-VisiONE
Diver-VisiONE is an easy-to-use groundwater monitoring data management system, delivering secure Diver data storage, advanced time series plotting, GIS mapping and complete reporting. Based on the scalable Microsoft SQL Server database technology, Diver-VisiONE guides you through your entire groundwater monitoring data management workflow from programming Divers and downloading data, to data visualization and reporting.
The following introductory topics are discussed in this chapter:
• Diver-VisiONE Features• Diver-VisiONE Installation• Diver-VisiONE SQL Database• Diver-VisiONE Workflow• User Account Permissions• Diver-VisiONE Important Concepts
1.1 Diver-VisiONE Features
General Features
• Diver-VisiONE is designed with an intuitive, easy-to-use graphical user interface with a built-in navigator tool that guides you through the Diver-VisiONE workflow.
• Based on the scalable Microsoft SQL Server database technology, with backup and restore capabilities, Diver-VisiONE provides a flexible, safe and secure solution for storing Diver monitoring data.
Communicate with SWS Diver dataloggers
• Display Diver settings and download Diver data directly to the SQL database • Start Divers using one of several start methods, including Immediate, Future
Start and Smart Future Start • Program Divers using various sampling methods including Fixed, Event Based,
Diver-VisiONE Features 1
Averaging, Predefined Pumping Test or User Defined Pumping Test• Display date, time and readings of connected Divers in real time • Calibrate CTD-Divers and view calibration history
Time Series Visualization
• Create time series plots for Diver data and associated production, meteorological and field data
• Customize the appearance of time series plots using various style settings • Export time series plots to various image file types, including .BMP, .JPG,
.EMF • Export data series for a selected plot to various file types, including .XML,
.TXT, .HTML and .XLS
Mapping
• Display monitoring location points on a map • Import point, polygon and polyline layers from shapefiles • Import base map images from various image file types, including .BMP, .GIF,
.JPG • Display attribute data on the map at each location point using the label renderer• Specify the symbology and style settings for point, polygon and polyline map
layers• View and print map documents in layout view
Location Data Management
• Create well records and manually enter or import well construction details, including drilling and annular filling information, casing and screen data, location lithology and field notes
• Easily combine and organize related locations into logical monitoring networks, i.e., station groups
• Assign Diver monitoring points to individual well casings • Generate well summary reports that display location data in tabular form,
location profiles, a company logo and contact information • Manually customize look-up lists using the List Editor or import list items from
various file types, including Microsoft Excel, Microsoft Access and text files • Create detailed location reports, a generic project overview or use your own
Crystal Report template
Location Profile Visualization
• Automatically generate detailed location profiles from entered well construction and lithology data
2 Chapter 1: Introduction to Diver-VisiONE
1.2 Diver-VisiONE InstallationThis section provides information on the following topics:
• Hardware Requirements• Supported Devices• Uninstalling Diver-VisiONE• Starting Diver-VisiONE• Starting DTC Service• Licensing
1.2.1 Hardware RequirementsDiver-VisiONE requires the following minimum system configuration:
• Pentium 4+ 600MHz (1GHz recommended)• 512 MB RAM (1GB or more recommended)• 32-bit or 64-bit computer• DVD ROM drive• 1 GB of free hard drive space (2GB recommended)• Windows XP Pro (SP2 or later); Windows Vista Business, Ultimate or
Enterprise. Note: Windows XP Home, Windows Vista Home Premium, Home Basic or Starter Versions, are not supported.
• Microsoft .NET Framework v.3.0 installed (provided with installation)
1.2.2 Supported Devices
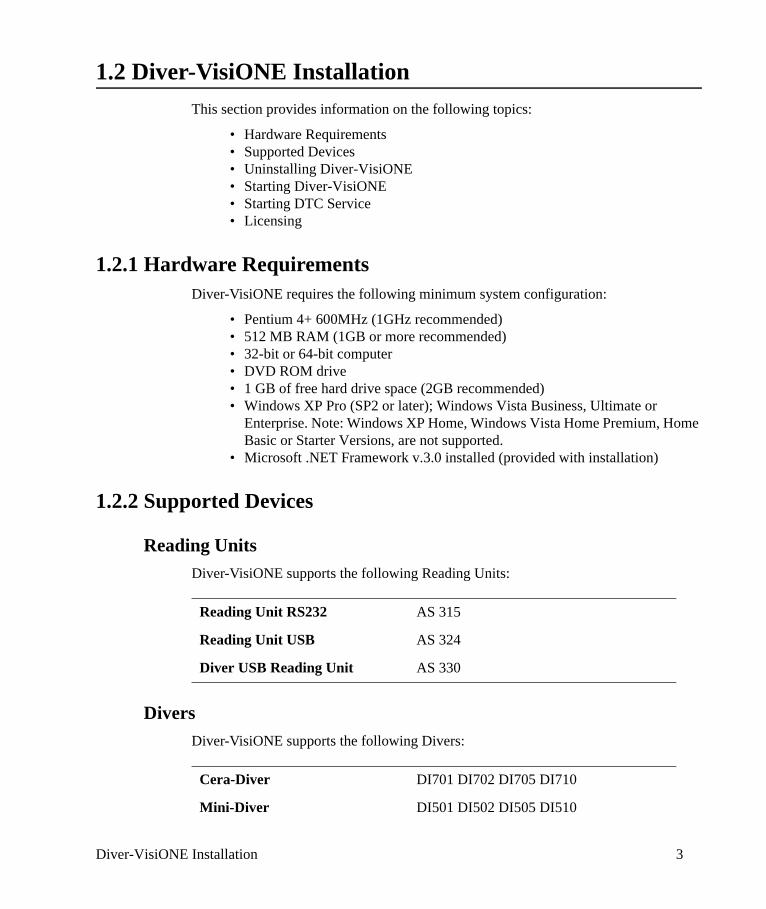
Reading UnitsDiver-VisiONE supports the following Reading Units:
DiversDiver-VisiONE supports the following Divers:
Reading Unit RS232 AS 315
Reading Unit USB AS 324
Diver USB Reading Unit AS 330
Cera-Diver DI701 DI702 DI705 DI710
Mini-Diver DI501 DI502 DI505 DI510
Diver-VisiONE Installation 3
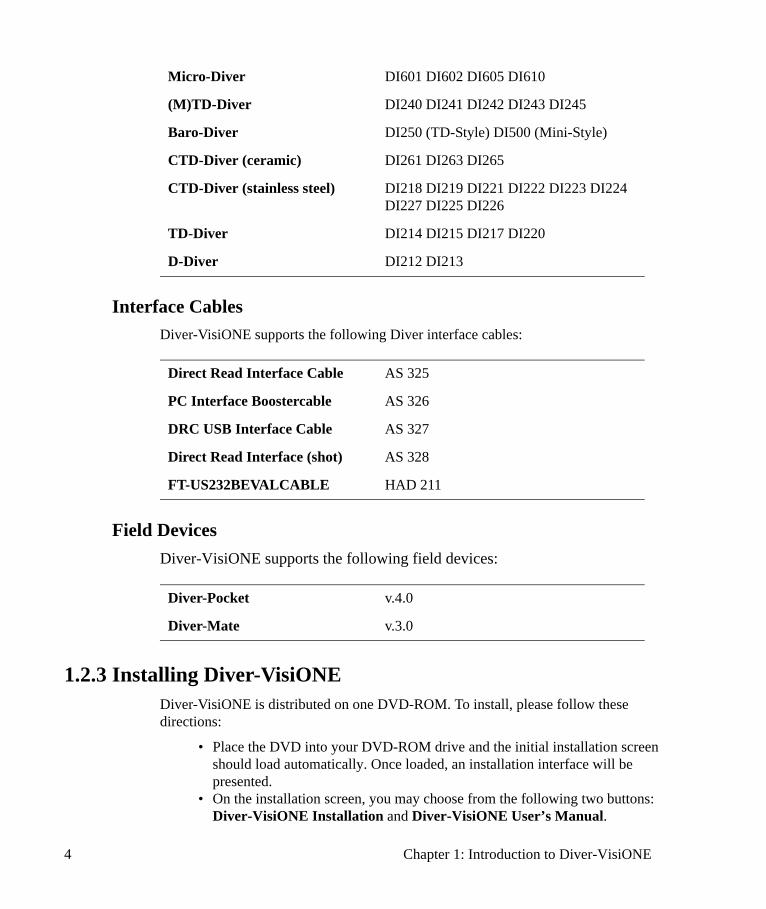
Interface CablesDiver-VisiONE supports the following Diver interface cables:
Field DevicesDiver-VisiONE supports the following field devices:
1.2.3 Installing Diver-VisiONEDiver-VisiONE is distributed on one DVD-ROM. To install, please follow these directions:
• Place the DVD into your DVD-ROM drive and the initial installation screen should load automatically. Once loaded, an installation interface will be presented.
• On the installation screen, you may choose from the following two buttons: Diver-VisiONE Installation and Diver-VisiONE User’s Manual.
Micro-Diver DI601 DI602 DI605 DI610
(M)TD-Diver DI240 DI241 DI242 DI243 DI245
Baro-Diver DI250 (TD-Style) DI500 (Mini-Style)
CTD-Diver (ceramic) DI261 DI263 DI265
CTD-Diver (stainless steel) DI218 DI219 DI221 DI222 DI223 DI224 DI227 DI225 DI226
TD-Diver DI214 DI215 DI217 DI220
D-Diver DI212 DI213
Direct Read Interface Cable AS 325
PC Interface Boostercable AS 326
DRC USB Interface Cable AS 327
Direct Read Interface (shot) AS 328
FT-US232BEVALCABLE HAD 211
Diver-Pocket v.4.0
Diver-Mate v.3.0
4 Chapter 1: Introduction to Diver-VisiONE
• The User’s Manual button will display a PDF document of the manual, which requires the Adobe Reader to view. If you do not have the Adobe Reader, a link has been created in the interface to download the appropriate software.
• The Installation button will initiate the installation of Diver-VisiONE on your computer. Diver-VisiONE must be installed on your local hard disk in order to run. follow the installation instructions, and read the on-screen directions carefully. You will be prompted to enter your name, company name and serial number. Please ensure that you enter your serial number exactly as it appears on your CD case or invoice. Be sure to use capital letters and hyphens in the correct locations.
• Once the installation is complete, you should see the Diver-VisiONE icon on your Desktop labeled Diver-VisiONE. To starting working with Diver-VisiONE, double-click this icon.
The Diver-VisiONE installation package installs the following software on your computer, if not detected on your computer:
• Microsoft .NET Framework 2.0 Service Pack 2• Microsoft .NET Framework 3.5 Service Pack 1• Crystal Reports Basic Runtime for Visual Studio v.10.5.0.0
1.2.4 Uninstalling Diver-VisiONE To uninstall Diver-VisiONE, follow the steps below:
• Make sure that the Diver-VisiONE program is closed.• For Windows XP users, go to Start > Settings > Control Panel. for Windows
Vista users, go to Start > Control Panel. • Click Add or Remove Programs (for Windows XP) or Programs (for Vista).• Select Diver-VisiONE from the list of installed programs. • Click Uninstall.
1.2.5 Starting Diver-VisiONE Once Diver-VisiONE has been installed on your computer, simply double-click on the Diver-VisiONE shortcut icon (shown below), located on your computer’s desktop.
Alternatively, you can access the software via the start menu by clicking on Start > Programs > SWS Software > Diver-VisiONE 2009.1.
Diver-VisiONE Installation 5
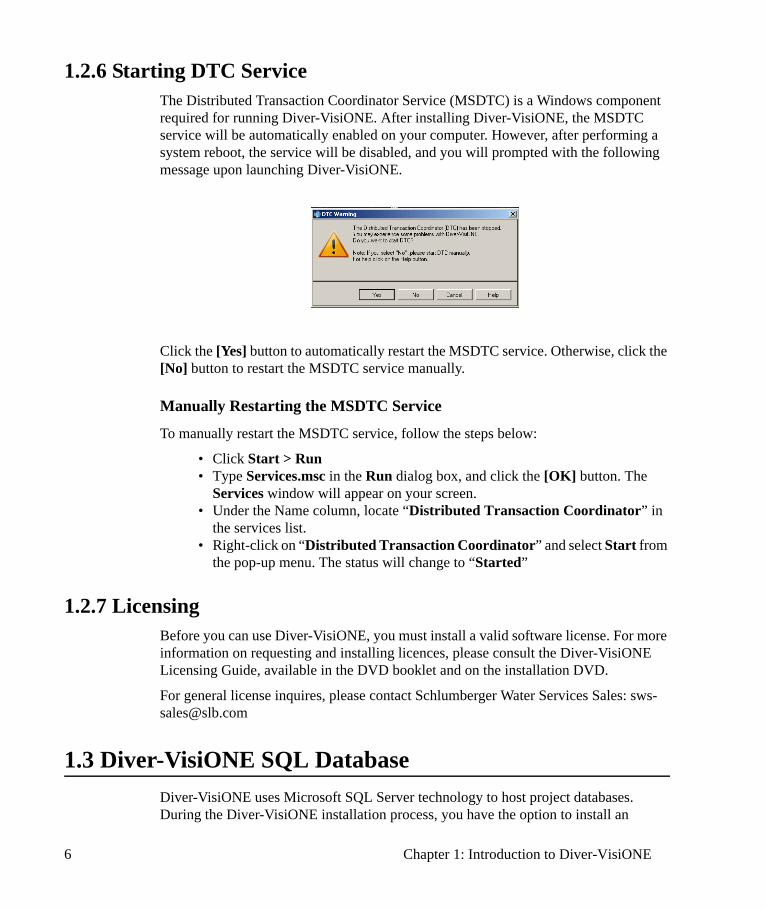
1.2.6 Starting DTC ServiceThe Distributed Transaction Coordinator Service (MSDTC) is a Windows component required for running Diver-VisiONE. After installing Diver-VisiONE, the MSDTC service will be automatically enabled on your computer. However, after performing a system reboot, the service will be disabled, and you will prompted with the following message upon launching Diver-VisiONE.
Click the [Yes] button to automatically restart the MSDTC service. Otherwise, click the [No] button to restart the MSDTC service manually.
Manually Restarting the MSDTC Service
To manually restart the MSDTC service, follow the steps below:
• Click Start > Run • Type Services.msc in the Run dialog box, and click the [OK] button. The
Services window will appear on your screen.• Under the Name column, locate “Distributed Transaction Coordinator” in
the services list.• Right-click on “Distributed Transaction Coordinator” and select Start from
the pop-up menu. The status will change to “Started”
1.2.7 Licensing Before you can use Diver-VisiONE, you must install a valid software license. For more information on requesting and installing licences, please consult the Diver-VisiONE Licensing Guide, available in the DVD booklet and on the installation DVD.
For general license inquires, please contact Schlumberger Water Services Sales: [email protected]
1.3 Diver-VisiONE SQL DatabaseDiver-VisiONE uses Microsoft SQL Server technology to host project databases. During the Diver-VisiONE installation process, you have the option to install an
6 Chapter 1: Introduction to Diver-VisiONE
instance of Microsoft SQL Server Express 2005 on your local machine using a user-defined instance name. Alternatively, the SQL Server can be installed on a central server in a network environment using the standalone installation (provided on the Diver-VisiONE installation DVD). For more information on installing SQL Server Express 2005, please refer to the Diver-VisiONE installation guide.
Microsoft SQL Server 2005 Express edition represents a free, light-weight version of Microsoft SQL Server 2005, and only supports databases up to 4 GB in size. For medium to large sized projects, it is recommended that you use the standard version of Microsoft SQL Server 2005 to host your Diver-VisiONE databases. This edition does require a license which can be obtained from Microsoft. For more information on Microsoft SQL Server 2005, including system requirements and a comparison between editions, please visit the following link:
http://www.microsoft.com/sqlserver/2005/en/us/default.aspx
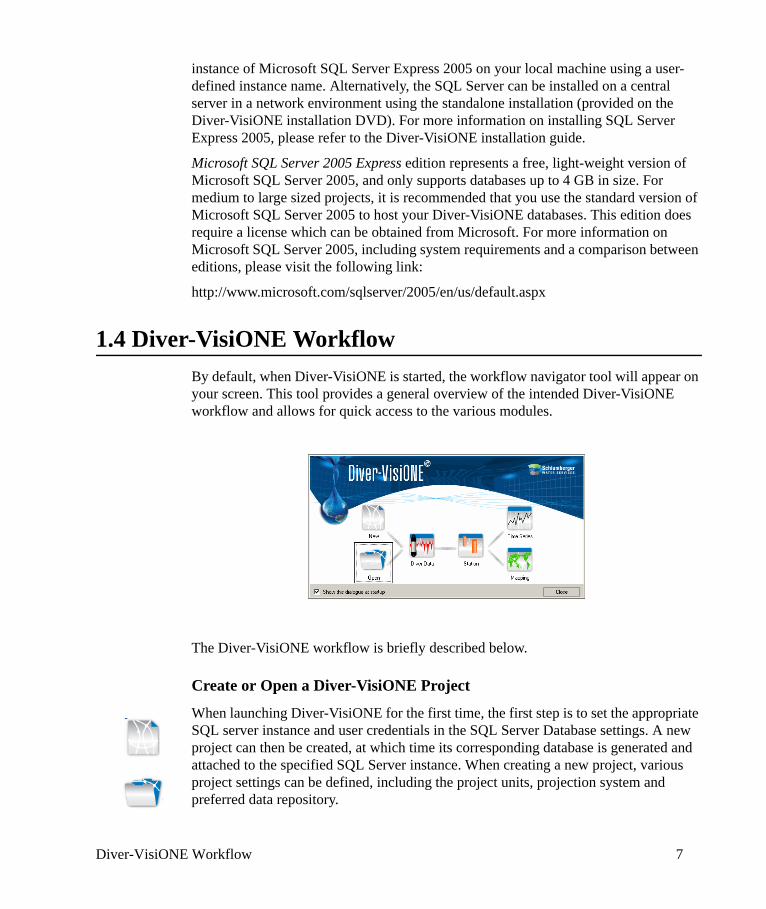
1.4 Diver-VisiONE WorkflowBy default, when Diver-VisiONE is started, the workflow navigator tool will appear on your screen. This tool provides a general overview of the intended Diver-VisiONE workflow and allows for quick access to the various modules.
The Diver-VisiONE workflow is briefly described below.
Create or Open a Diver-VisiONE Project
When launching Diver-VisiONE for the first time, the first step is to set the appropriate SQL server instance and user credentials in the SQL Server Database settings. A new project can then be created, at which time its corresponding database is generated and attached to the specified SQL Server instance. When creating a new project, various project settings can be defined, including the project units, projection system and preferred data repository.
Diver-VisiONE Workflow 7
Download Diver Data
Once the project and database have been created, use the Diver Data module to connect to SWS Diver dataloggers, and download and save recorded monitoring data to the database. Downloaded Diver data can then be compensated against barometric pressure using stored manual measurements or cable lengths. The Diver Data module can also be used to program, start and calibrate Divers before redeploying them in the field.
Create Location Records and Assign Monitoring Points
Using the Location module, create well records for each location in your project and group locations into logical monitoring networks. Using data entry tabs the following data can be entered for each location record: name, address, surveyed ground surface and top of casing elevations, well construction details (drilling, casing, annular filling and screens), lithology data and field notes. For each location, you can then assign one or more monitoring points that have been downloaded using the Diver Data module.
Visualize Diver Data and Create Reports
Once you have created location records, use the Time Series and Mapping modules to visualize your data. Detailed time series plots can be created and customized using various style settings. Locations can be added to a map project and combined with imported site maps and shapefiles to create detailed map reports.
1.5 User Account PermissionsRestricted Windows users, i.e., power users and guests, require access to certain folders, in order to run and operate Diver-VisiONE. Administrators must grant restricted users full access to the following folders:
• The installation folder (default is C:\Program Files\Diver-VisiONE• The specified data repository folder (default is
C:\Users\[username]\Documents\Diver-VisiONE Projects)
Restricted users may also need proper SQL Server permissions to access the SQL Server database. Please contact your SQL server administrator for information on obtaining permissions for the database.
Window’s Vista users, including those with administrator permissions, must also disable User Account Control (UAC) in the Control Panel, in order to run and operate Diver-VisiONE.
8 Chapter 1: Introduction to Diver-VisiONE
1.6 About Diver-VisiONE
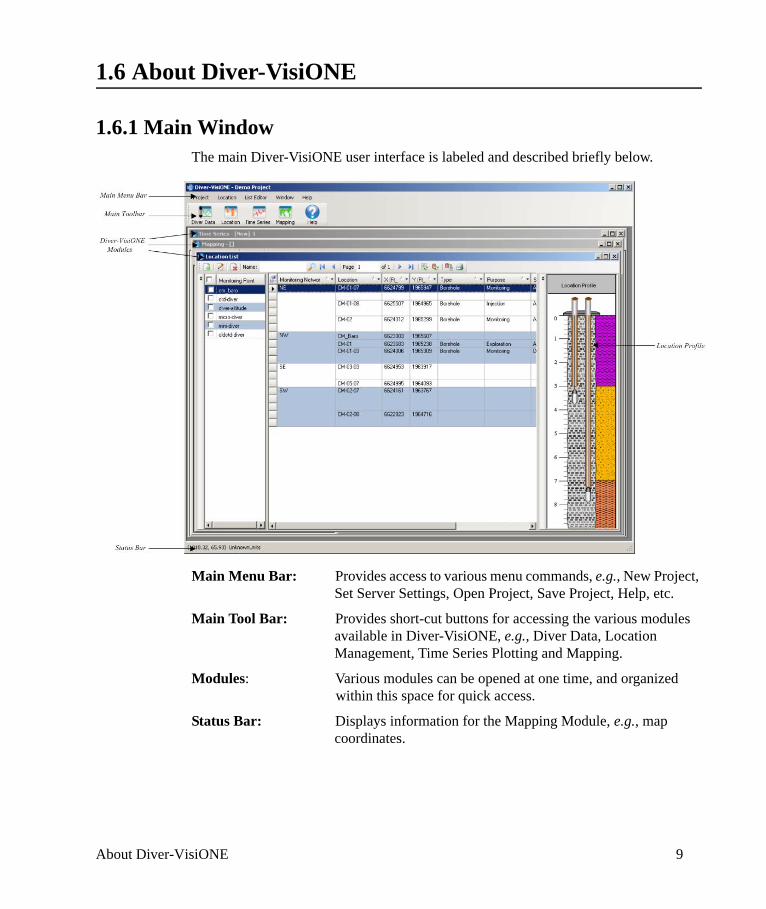
1.6.1 Main WindowThe main Diver-VisiONE user interface is labeled and described briefly below.
Main Menu Bar: Provides access to various menu commands, e.g., New Project, Set Server Settings, Open Project, Save Project, Help, etc.
Main Tool Bar: Provides short-cut buttons for accessing the various modules available in Diver-VisiONE, e.g., Diver Data, Location Management, Time Series Plotting and Mapping.
Modules: Various modules can be opened at one time, and organized within this space for quick access.
Status Bar: Displays information for the Mapping Module, e.g., map coordinates.
About Diver-VisiONE 9
1.6.2 Diver-VisiONE ModulesDiver-VisiONE is comprised of a series of integrated modules. Each module can be launched from the Diver-VisiONE toolbar. The Diver-VisiONE modules are described briefly below.
Diver Data The Diver Data module can be launched by selecting the Diver Data button from the Diver-VisiONE toolbar.
The Diver Data module provides an interface for communicating with SWS Diver dataloggers and managing downloaded Diver data and associated field data. Some of the main tasks that can be performed using the Diver Data module:
• Connecting to a Diver• Reading Diver Settings and Data• Starting a Diver• Stopping a Diver• Downloading Diver Data• Calibrating CTD-Divers• Compensating Diver Data
For more information on the Diver Data module, please refer to Chapter 3: Diver Data Management on page 21.
Location Management The Location Management module can be launched by selecting the Location button from the Diver-VisiONE toolbar.
The Location module provides an interface for creating locations and grouping locations into monitoring networks. Associated location data, including well construction details, lithology data and field notes can be entered manually using data entry fields and tables, or by importing data from formatted files. Monitoring Points created using the Diver Data module can be linked to specific well casings. Some of the main tasks that can performed using the Location module include:
• Creating a Monitoring Network• Creating a New Location• Location Data Entry• Editing a Location• Importing Location Data• Exporting Location Profile to Image file• Modifying Lists
For more information on the Location module, please refer to Chapter 4: Location Management on page 55.
10 Chapter 1: Introduction to Diver-VisiONE
Time Series Plotting The Time Series Plotting module can be launched by selecting the Time Series button from the Diver-VisiONE toolbar.
The time series plotting module provides an interface for creating time series plots from monitoring point data. Multiple parameters and monitoring points can be plotted on the same plot, and multiple plots can be displayed on a single plot page. The appearance of each time series plot can be customized using various style settings. Some of the tasks that can be performed in the time series plotting module include:
• Creating a New Plot Page• Adding a New Plot• Exporting Plot Page to Image• Exporting Data Series to File
For more information on the Time Series Plotting module, please refer to Chapter 5: Time Series Plotting on page 75.
Mapping The Mapping module can be launched by selecting the Mapping button from the Diver-VisiONE toolbar.
The mapping module, built on ESRITM ArcObjects technology, allows you to create map documents using imported map layers, e.g., shapefiles, basemaps etc., and location data stored in the Diver-VisiONE database. Some of the tasks that can be performed in the mapping module include:
• Creating a New Map Document• Adding a Location Layer• Exporting Layers to KML/KMZ format• Showing Map Layer Labels• Exporting a Map to Image
For more information on the Mapping Module, please refer to Chapter 6: Mapping on page 87.
1.7 Diver-VisiONE Important ConceptsThe following image illustrates some of the key terms used in Diver-VisiONE and in this User’s Manual.
Diver-VisiONE Important Concepts 11
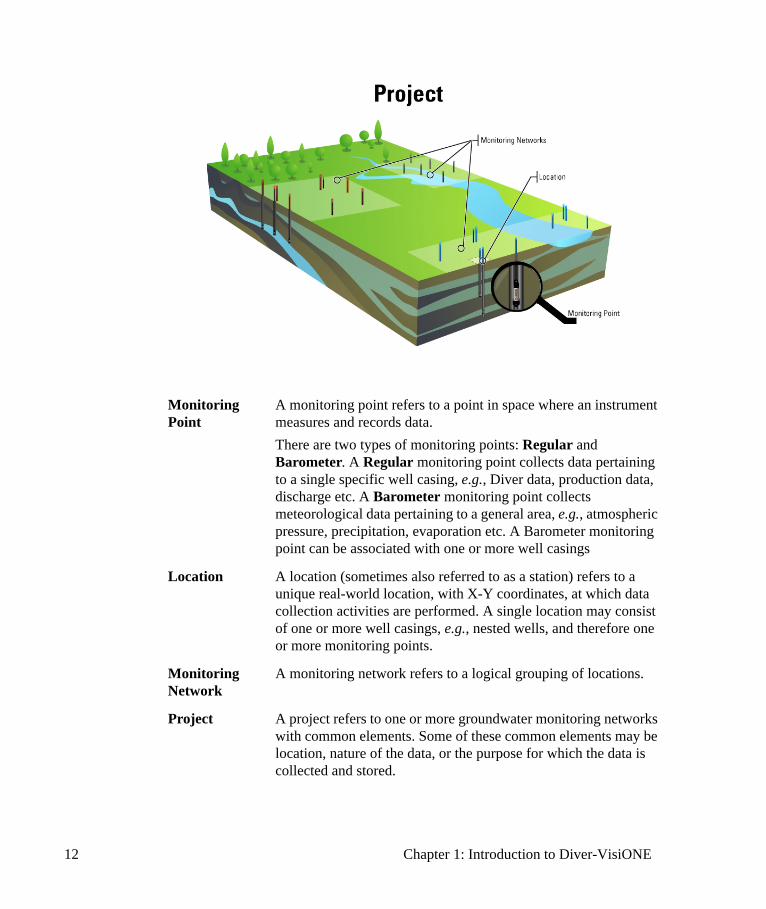
Monitoring Point
A monitoring point refers to a point in space where an instrument measures and records data. There are two types of monitoring points: Regular and Barometer. A Regular monitoring point collects data pertaining to a single specific well casing, e.g., Diver data, production data, discharge etc. A Barometer monitoring point collects meteorological data pertaining to a general area, e.g., atmospheric pressure, precipitation, evaporation etc. A Barometer monitoring point can be associated with one or more well casings
Location A location (sometimes also referred to as a station) refers to a unique real-world location, with X-Y coordinates, at which data collection activities are performed. A single location may consist of one or more well casings, e.g., nested wells, and therefore one or more monitoring points.
Monitoring Network
A monitoring network refers to a logical grouping of locations.
Project A project refers to one or more groundwater monitoring networks with common elements. Some of these common elements may be location, nature of the data, or the purpose for which the data is collected and stored.
12 Chapter 1: Introduction to Diver-VisiONE
1.8 Using the Online HelpThe Diver-VisiONE online help includes full color screen captures and illustrations which are black and white in this User’s Manual . The information of interest can be viewed in all modules.
The online help can be access by selecting Help/Help Topics from the top menu bar, or by clicking the button from the top tool bar. Moreover, most dialog boxes and windows contain a [Help] button that when clicked, will open the relevant section of the online help.
The On-line help window (shown below) is divided into three main areas:
• A Navigation Frame on the left display the Contents, Index, Search, and Favorites tabs.
• A Toolbar across the top displays a set of buttons to help navigate through the online help.
• A Topic Frame on the right displays the actual Help topics included in the Online Help.
The tabs in the Navigation Frame provide the core navigational features as described below.
Contents
The Contents tab displays the headings in the “Table of Contents” in the form of an expandable/collapsible tree. Closed book icons represent Table of Contents headings that have sub-headings.
Index
The Index tab displays the list of Help topics. You can scroll to find the index entry you want, or you can type in the first few letters of the keyword in the text box, and the index will scroll automatically as you type. Double-click an index entry to display the corresponding Help topic. Alternatively, you may select an index entry and then click Display button to open the Help topic.
Search
The Search tab is used to search the On-Line Help documents for a word or phrase of interest. Simply type the search word(s) or phrase(s), then press <Enter> or click the Display button.
Favorites
You can add frequently accessed Help topics to a personal list of favorites, which is displayed in the Favorites tab. Once you have added a topic to your list of favorites, you
Using the Online Help 13
can access the topic by double-clicking it. Click Add to add the currently displayed topic to your favorites list. Select a favorite and then click Remove to delete a topic from your favorites list.
14 Chapter 1: Introduction to Diver-VisiONE
2Project Management
This chapter contains information on setting up a Diver-VisiONE project, and configuring the SQL Server database settings. The following topics are discussed in this chapter:
• Configuring Database Server Settings• Creating a New Project• Opening a Project• Deleting a Project• Backing Up a Database• Restoring a Database
2.1 Configuring Database Server SettingsA Diver-VisiONE database may be hosted locally on your computer, or remotely on a server. Before you can create a project, you must specify the desired database environment, including the SQL Server instance name. Any SQL Server that is currently installed on any computer on your network could be used as long as you have the appropriate access rights to it. If you are working on a stand-alone computer, then the “server” would be the local computer.
Please note, if the database is to be hosted on a remote server, please ensure that the host computer has been configured to allow remote connections. Please refer to “Diver-VisiONE Network Setup.PDF”, located on the installation DVD, for more information on configuring the host server to allow remote database connections.
To configure the database server settings,
• Select Project > Set Server Settings, from the main menu bar.
The following dialog will appear on your screen:
Configuring Database Server Settings 15
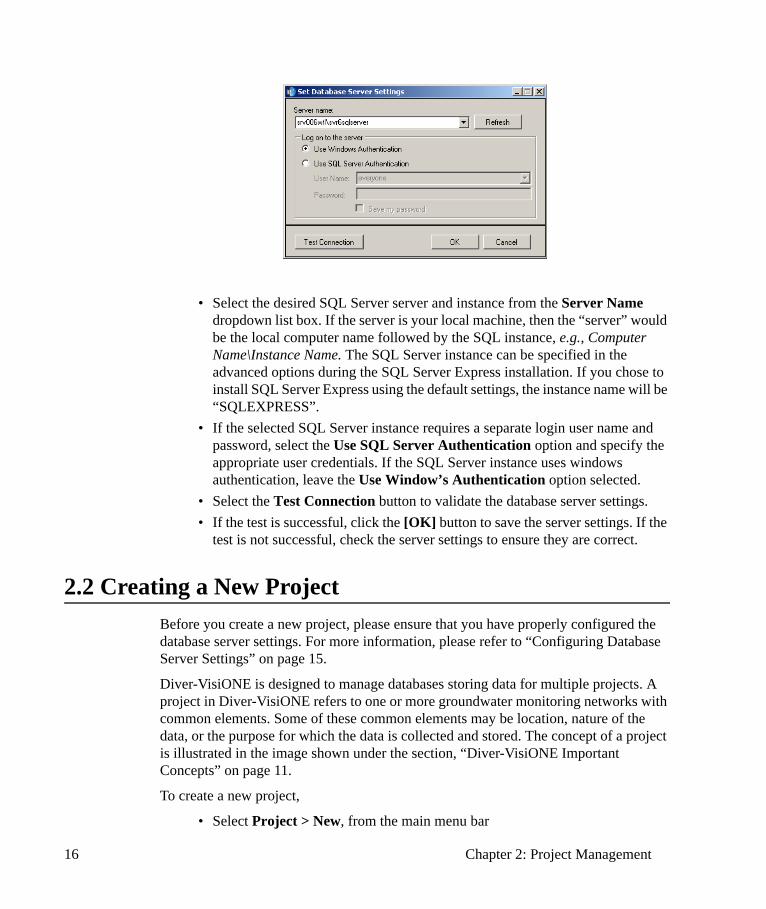
• Select the desired SQL Server server and instance from the Server Name dropdown list box. If the server is your local machine, then the “server” would be the local computer name followed by the SQL instance, e.g., Computer Name\Instance Name. The SQL Server instance can be specified in the advanced options during the SQL Server Express installation. If you chose to install SQL Server Express using the default settings, the instance name will be “SQLEXPRESS”.
• If the selected SQL Server instance requires a separate login user name and password, select the Use SQL Server Authentication option and specify the appropriate user credentials. If the SQL Server instance uses windows authentication, leave the Use Window’s Authentication option selected.
• Select the Test Connection button to validate the database server settings. • If the test is successful, click the [OK] button to save the server settings. If the
test is not successful, check the server settings to ensure they are correct.
2.2 Creating a New ProjectBefore you create a new project, please ensure that you have properly configured the database server settings. For more information, please refer to “Configuring Database Server Settings” on page 15.
Diver-VisiONE is designed to manage databases storing data for multiple projects. A project in Diver-VisiONE refers to one or more groundwater monitoring networks with common elements. Some of these common elements may be location, nature of the data, or the purpose for which the data is collected and stored. The concept of a project is illustrated in the image shown under the section, “Diver-VisiONE Important Concepts” on page 11.
To create a new project,
• Select Project > New, from the main menu bar
16 Chapter 2: Project Management
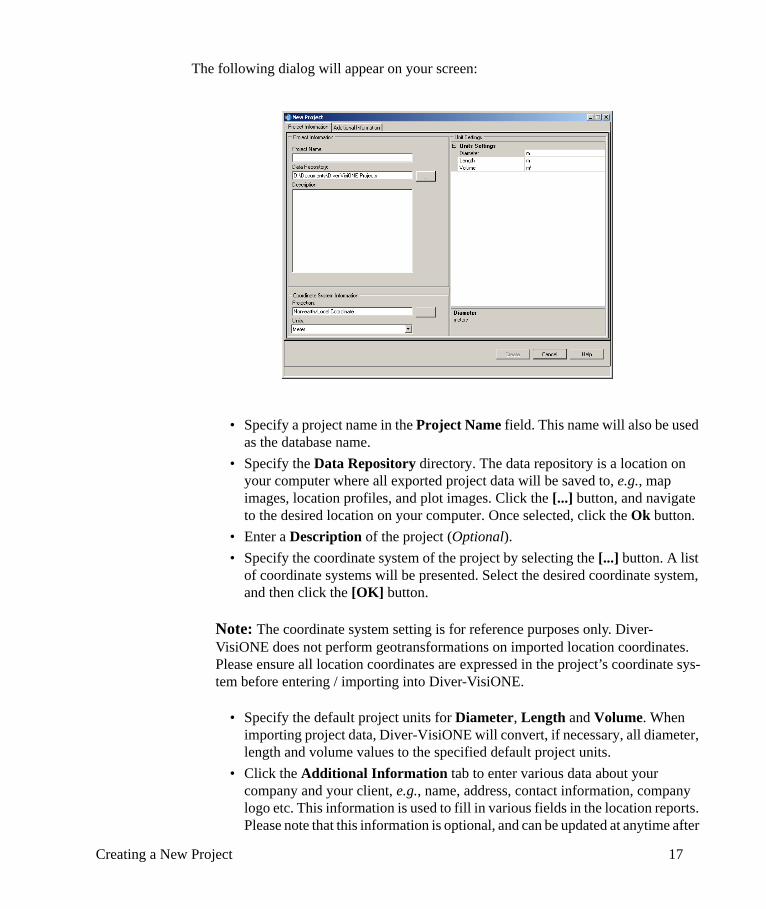
The following dialog will appear on your screen:
• Specify a project name in the Project Name field. This name will also be used as the database name.
• Specify the Data Repository directory. The data repository is a location on your computer where all exported project data will be saved to, e.g., map images, location profiles, and plot images. Click the [...] button, and navigate to the desired location on your computer. Once selected, click the Ok button.
• Enter a Description of the project (Optional). • Specify the coordinate system of the project by selecting the [...] button. A list
of coordinate systems will be presented. Select the desired coordinate system, and then click the [OK] button.
Note: The coordinate system setting is for reference purposes only. Diver-VisiONE does not perform geotransformations on imported location coordinates. Please ensure all location coordinates are expressed in the project’s coordinate sys-tem before entering / importing into Diver-VisiONE.
• Specify the default project units for Diameter, Length and Volume. When importing project data, Diver-VisiONE will convert, if necessary, all diameter, length and volume values to the specified default project units.
• Click the Additional Information tab to enter various data about your company and your client, e.g., name, address, contact information, company logo etc. This information is used to fill in various fields in the location reports. Please note that this information is optional, and can be updated at anytime after
Creating a New Project 17
the project is created by selecting Project > Project Settings. • Click the [Create] button to create the project database.
2.3 Opening a ProjectBefore you attempt to open an existing project, please ensure that you have properly configured the database server settings. For more information, please refer to “Configuring Database Server Settings” on page 15.
To open an existing project,
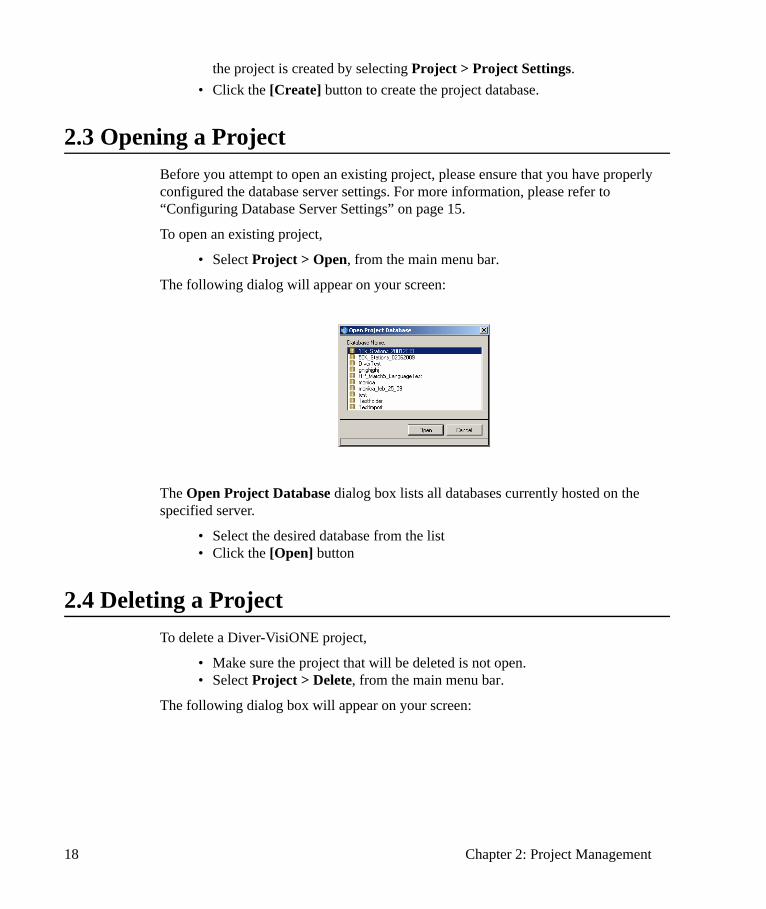
• Select Project > Open, from the main menu bar.
The following dialog will appear on your screen:
The Open Project Database dialog box lists all databases currently hosted on the specified server.
• Select the desired database from the list• Click the [Open] button
2.4 Deleting a ProjectTo delete a Diver-VisiONE project,
• Make sure the project that will be deleted is not open.• Select Project > Delete, from the main menu bar.
The following dialog box will appear on your screen:
18 Chapter 2: Project Management
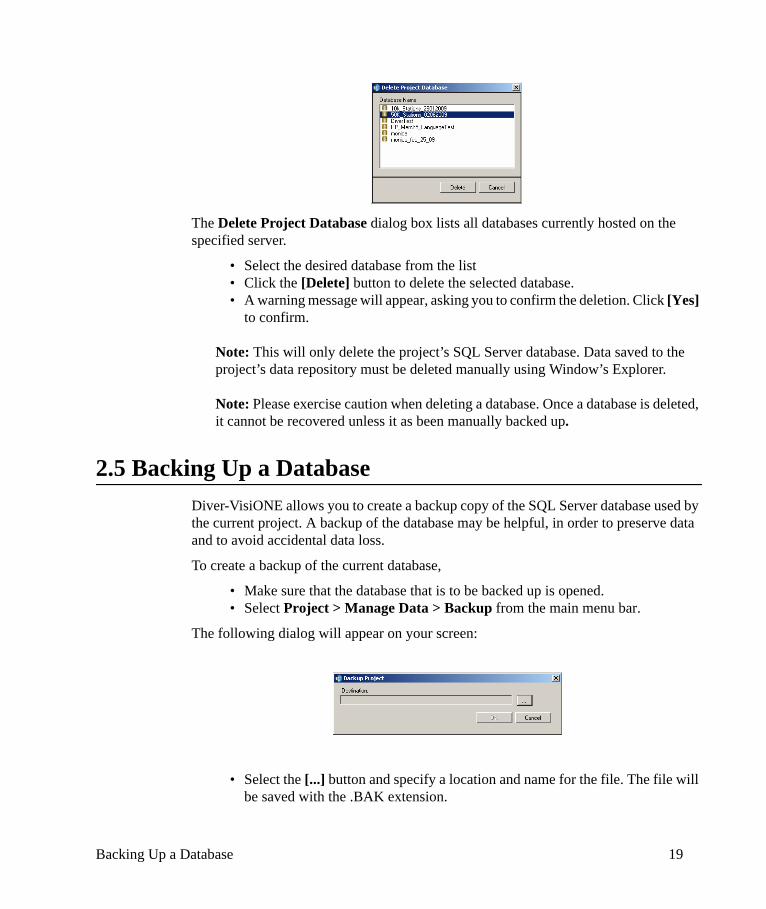
The Delete Project Database dialog box lists all databases currently hosted on the specified server.
• Select the desired database from the list• Click the [Delete] button to delete the selected database.• A warning message will appear, asking you to confirm the deletion. Click [Yes]
to confirm.
Note: This will only delete the project’s SQL Server database. Data saved to the project’s data repository must be deleted manually using Window’s Explorer.
Note: Please exercise caution when deleting a database. Once a database is deleted, it cannot be recovered unless it as been manually backed up.
2.5 Backing Up a DatabaseDiver-VisiONE allows you to create a backup copy of the SQL Server database used by the current project. A backup of the database may be helpful, in order to preserve data and to avoid accidental data loss.
To create a backup of the current database,
• Make sure that the database that is to be backed up is opened. • Select Project > Manage Data > Backup from the main menu bar.
The following dialog will appear on your screen:
• Select the [...] button and specify a location and name for the file. The file will be saved with the .BAK extension.
Backing Up a Database 19
Note: This only performs a back up on the data stored in the Diver-VisiONE database. To backup exported data contained in the data repository, simply make a copy of the folder using Windows Explorer.
Note: SQL Server does not permit saving the backup copy of the database to a server or a mapped network drive; it can be saved only to a local drive. In addition, depending on your user account security settings, you may not be able to save a backup of the database to your Desktop or the root of a hard drive, e.g., C:\.
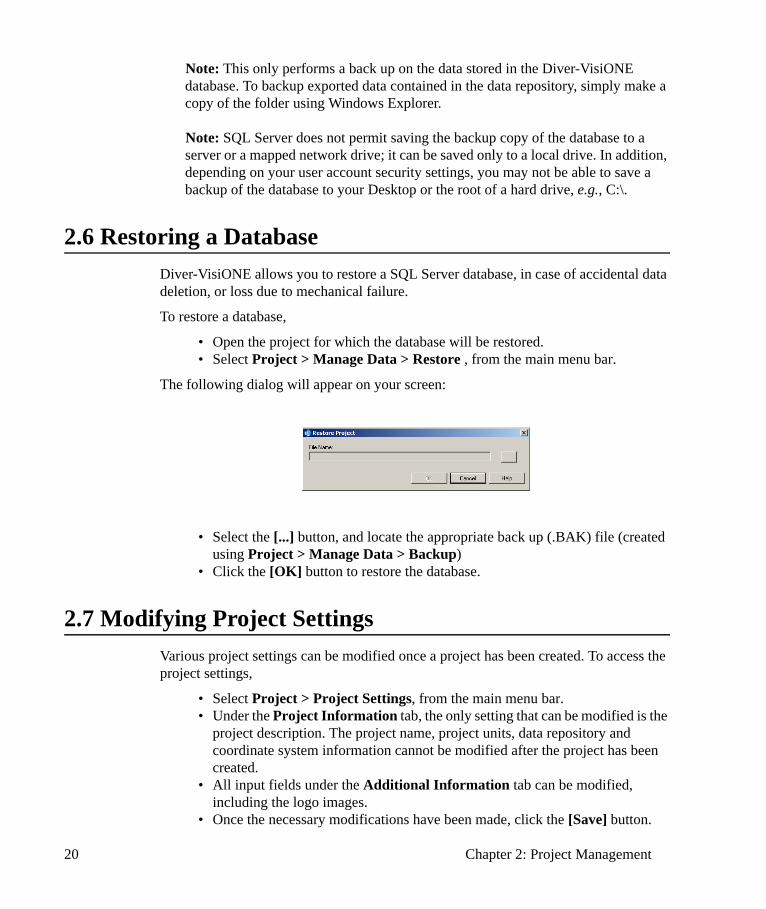
2.6 Restoring a DatabaseDiver-VisiONE allows you to restore a SQL Server database, in case of accidental data deletion, or loss due to mechanical failure.
To restore a database,
• Open the project for which the database will be restored.• Select Project > Manage Data > Restore , from the main menu bar.
The following dialog will appear on your screen:
• Select the [...] button, and locate the appropriate back up (.BAK) file (created using Project > Manage Data > Backup)
• Click the [OK] button to restore the database.
2.7 Modifying Project SettingsVarious project settings can be modified once a project has been created. To access the project settings,
• Select Project > Project Settings, from the main menu bar.• Under the Project Information tab, the only setting that can be modified is the
project description. The project name, project units, data repository and coordinate system information cannot be modified after the project has been created.
• All input fields under the Additional Information tab can be modified, including the logo images.
• Once the necessary modifications have been made, click the [Save] button.
20 Chapter 2: Project Management
3Diver Data Management
The Diver Data module allows you to read and program Diver groundwater dataloggers, download Diver monitoring data , and process and display Diver data. The Diver Data module can be launched from the main Diver-VisiONE toolbar by selecting the Diver Data button.
For a full list of supported hardware devices, including Divers, Reading Units and Field Devices, please see “Supported Devices” on page 3.
The following topics are covered in this chapter:
• Diver Data Interface• Connecting to a Diver• Downloading Diver Data• Programming Diver Settings• Starting a Diver• Stopping a Diver• Importing Diver Data• Calibrating CTD-Divers• Compensating Diver Data
21
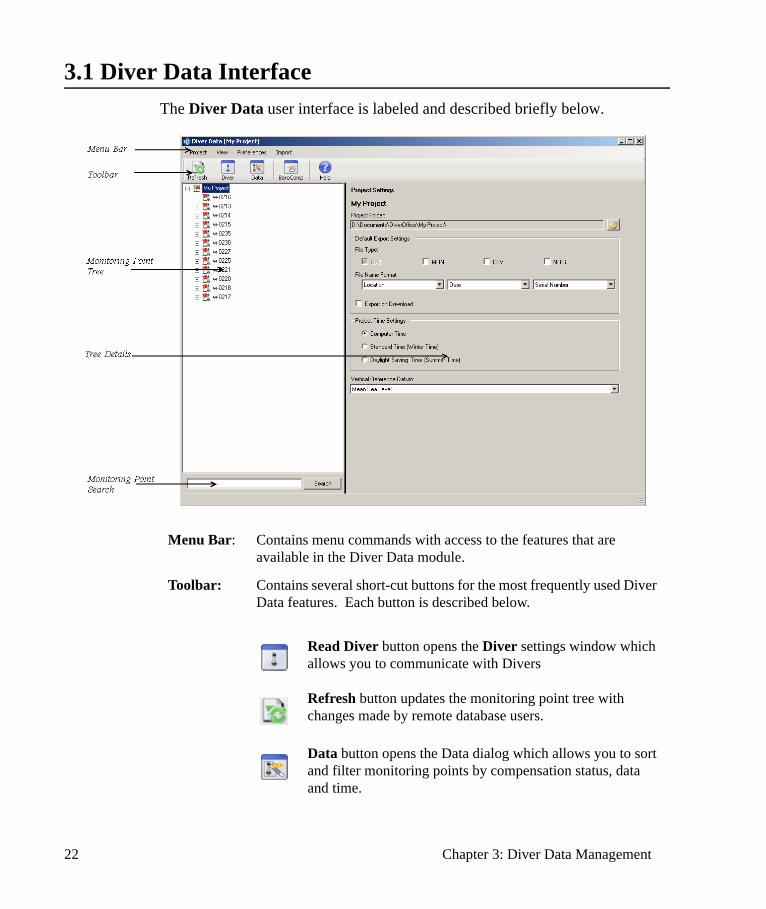
3.1 Diver Data Interface The Diver Data user interface is labeled and described briefly below.
Menu Bar: Contains menu commands with access to the features that are available in the Diver Data module.
Toolbar: Contains several short-cut buttons for the most frequently used Diver Data features. Each button is described below.
Read Diver button opens the Diver settings window which allows you to communicate with Divers
Refresh button updates the monitoring point tree with changes made by remote database users.
Data button opens the Data dialog which allows you to sort and filter monitoring points by compensation status, data and time.
22 Chapter 3: Diver Data Management
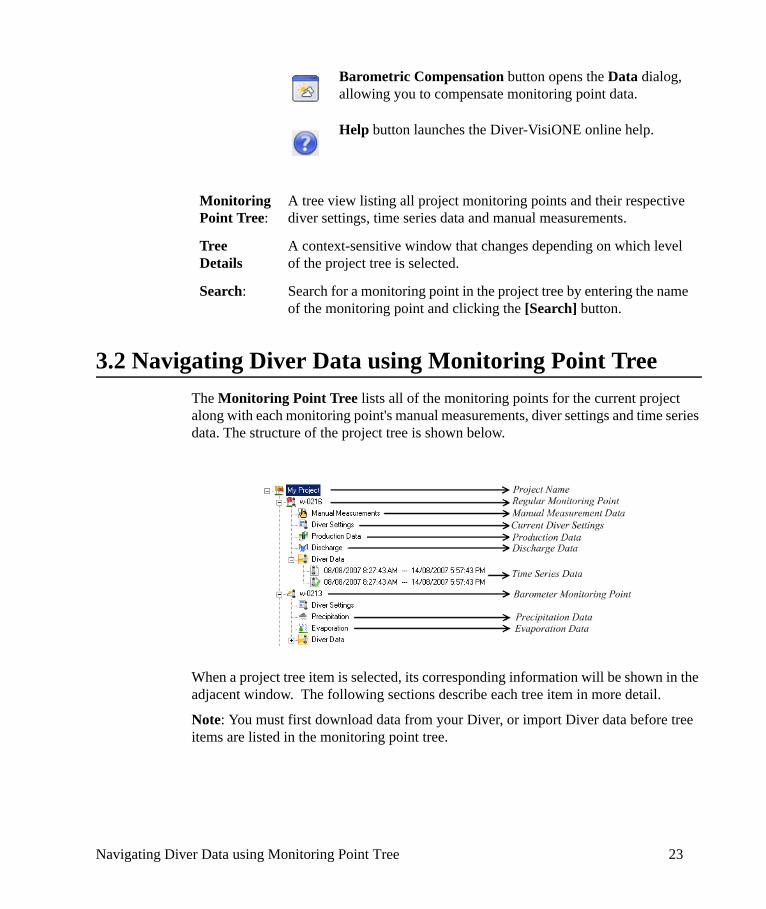
3.2 Navigating Diver Data using Monitoring Point TreeThe Monitoring Point Tree lists all of the monitoring points for the current project along with each monitoring point's manual measurements, diver settings and time series data. The structure of the project tree is shown below.
When a project tree item is selected, its corresponding information will be shown in the adjacent window. The following sections describe each tree item in more detail.
Note: You must first download data from your Diver, or import Diver data before tree items are listed in the monitoring point tree.
Barometric Compensation button opens the Data dialog, allowing you to compensate monitoring point data.
Help button launches the Diver-VisiONE online help.
Monitoring Point Tree:
A tree view listing all project monitoring points and their respective diver settings, time series data and manual measurements.
Tree Details
A context-sensitive window that changes depending on which level of the project tree is selected.
Search: Search for a monitoring point in the project tree by entering the name of the monitoring point and clicking the [Search] button.
Navigating Diver Data using Monitoring Point Tree 23
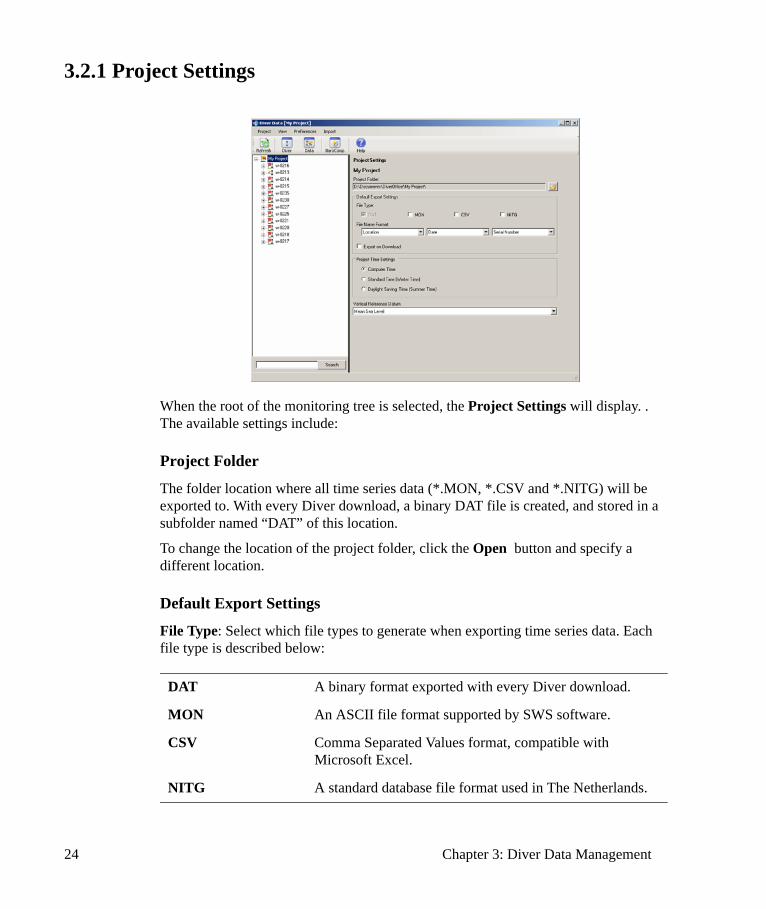
3.2.1 Project Settings
When the root of the monitoring tree is selected, the Project Settings will display. . The available settings include:
Project Folder
The folder location where all time series data (*.MON, *.CSV and *.NITG) will be exported to. With every Diver download, a binary DAT file is created, and stored in a subfolder named “DAT” of this location.
To change the location of the project folder, click the Open button and specify a different location.
Default Export Settings
File Type: Select which file types to generate when exporting time series data. Each file type is described below:
DAT A binary format exported with every Diver download.
MON An ASCII file format supported by SWS software.
CSV Comma Separated Values format, compatible with Microsoft Excel.
NITG A standard database file format used in The Netherlands.
24 Chapter 3: Diver Data Management
File Name Format: Specify the naming convention for exported time series files. This allows you to associate a filename with three strings (serial number of Diver, location of Diver and timestamp of download). If the timestamp is not included as part of the filename, e.g., only serial number plus location name are included in name format, then a _1, _2 etc. extension will be added to each file in order to make the filename unique.
NOTE: It is good practice to always include the timestamp in the filename.
Export on Download
Select this option to automatically export data whenever data is downloaded from a Diver.
Project Time Settings
For long term monitoring projects, the time of all the measurements must be aligned to a standard time to ensure that the sampling frequency is consistent when the time changes due to day light savings time. Specifying the project time in Diver-VisiONE ensures that your Diver is always synchronized with the original Diver time and that no gaps or overlap occur in your data series. You can choose from the following options:
Most monitoring projects use standard time, ignoring day light savings time. In some rare cases, long-term monitoring is done using day-light savings time. Either time is acceptable, as long as it is maintained throughout the full duration of the monitoring project.
For short term projects or pumping tests, you will most likely use the computer time, as shifts in time due to day light savings are irrelevant.
Please note that in order for this feature to work, you must have the appropriate time zone selected in your computer’s Date and Time Settings.
Computer Time The project time will always be the same as your computer time. This is how project time worked in previous versions of Diver-Office.
Winter Time (Standard Time)
The project time will always be synchronized with standard time, e.g., UTC + x, where x depends on the time zones in your region; day light savings will be ignored.
Summer Time(Day light
The project time will always be synchronized with summer time, e.g., UTC + x – 1, where x depends on the time zone of your region; winter time will be ignored.
Navigating Diver Data using Monitoring Point Tree 25
Vertical Reference Datum
The vertical reference datum used at monitoring locations. Please note that this setting does not have any affect on barometric compensation calculations. If you do not know the name of your vertical reference datum please do not change the default (Mean Sea Level) setting.
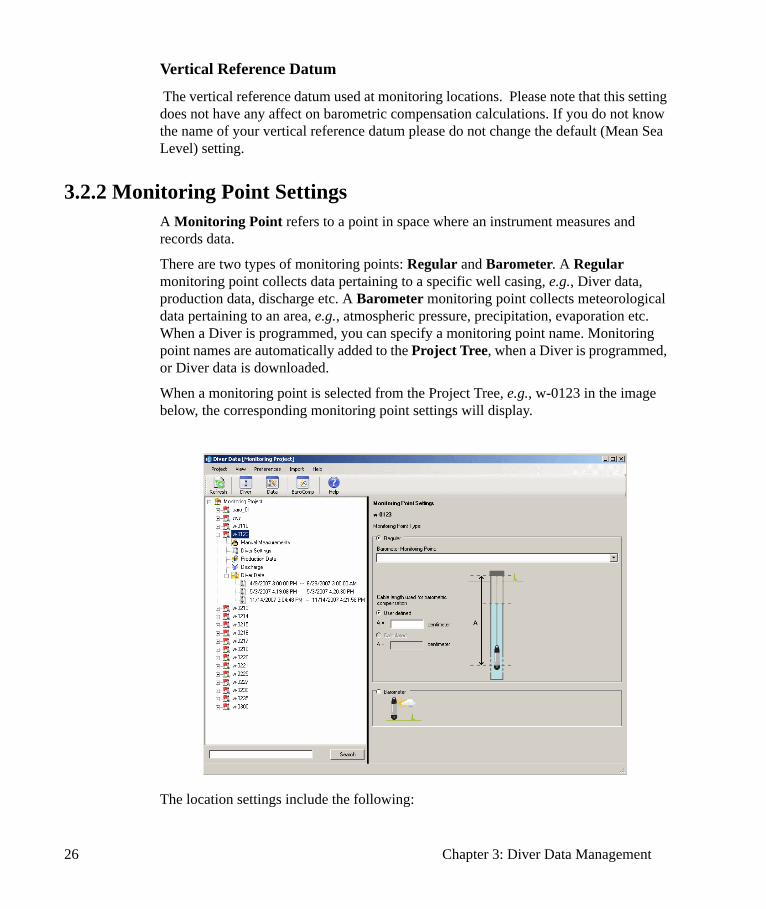
3.2.2 Monitoring Point SettingsA Monitoring Point refers to a point in space where an instrument measures and records data.
There are two types of monitoring points: Regular and Barometer. A Regular monitoring point collects data pertaining to a specific well casing, e.g., Diver data, production data, discharge etc. A Barometer monitoring point collects meteorological data pertaining to an area, e.g., atmospheric pressure, precipitation, evaporation etc. When a Diver is programmed, you can specify a monitoring point name. Monitoring point names are automatically added to the Project Tree, when a Diver is programmed, or Diver data is downloaded.
When a monitoring point is selected from the Project Tree, e.g., w-0123 in the image below, the corresponding monitoring point settings will display.
The location settings include the following:
26 Chapter 3: Diver Data Management
Location Type: Select between Barometer and Regular. A barometer monitoring point type contains sampled barometric time series data, whereas a regular monitoring point type contains groundwater time series data, e.g., pressure, temperature and conductivity. The type is represented by an icon in the Monitoring Point Tree, as shown below:
Barometer Monitoring Point
Regular Monitoring Point
For all regular monitoring points, you must specify a corresponding barometer monitoring point before you can compensate its time series data. The combo box will contain all the monitoring points in the current project that have been set as a Barometer type.
Depending on which barometric compensation method you wish to use, you may also need to specify a cable length.
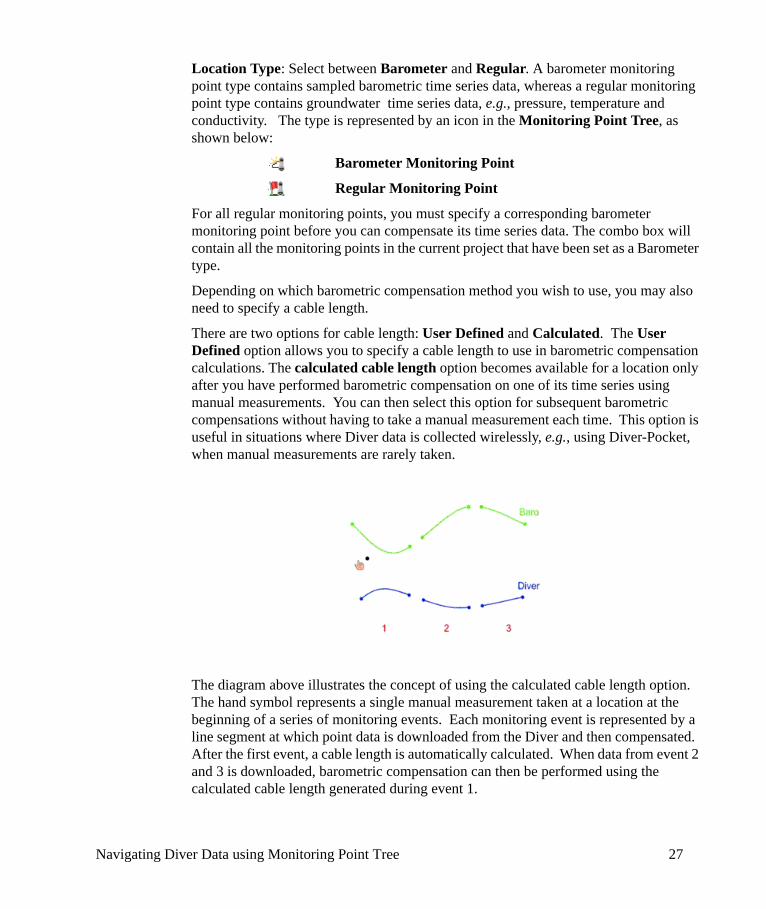
There are two options for cable length: User Defined and Calculated. The User Defined option allows you to specify a cable length to use in barometric compensation calculations. The calculated cable length option becomes available for a location only after you have performed barometric compensation on one of its time series using manual measurements. You can then select this option for subsequent barometric compensations without having to take a manual measurement each time. This option is useful in situations where Diver data is collected wirelessly, e.g., using Diver-Pocket, when manual measurements are rarely taken.
The diagram above illustrates the concept of using the calculated cable length option. The hand symbol represents a single manual measurement taken at a location at the beginning of a series of monitoring events. Each monitoring event is represented by a line segment at which point data is downloaded from the Diver and then compensated. After the first event, a cable length is automatically calculated. When data from event 2 and 3 is downloaded, barometric compensation can then be performed using the calculated cable length generated during event 1.
Navigating Diver Data using Monitoring Point Tree 27
3.2.3 Precipitation, Evaporation, Discharge and Production DataSometimes it may be desirable to plot meteorological data or production data against measured water levels over time. To accommodate this, evaporation and precipitation measurements can be entered and stored in the Diver-VisiONE database for barometer monitoring points. These values can then be plotted over time in the Time Series module.
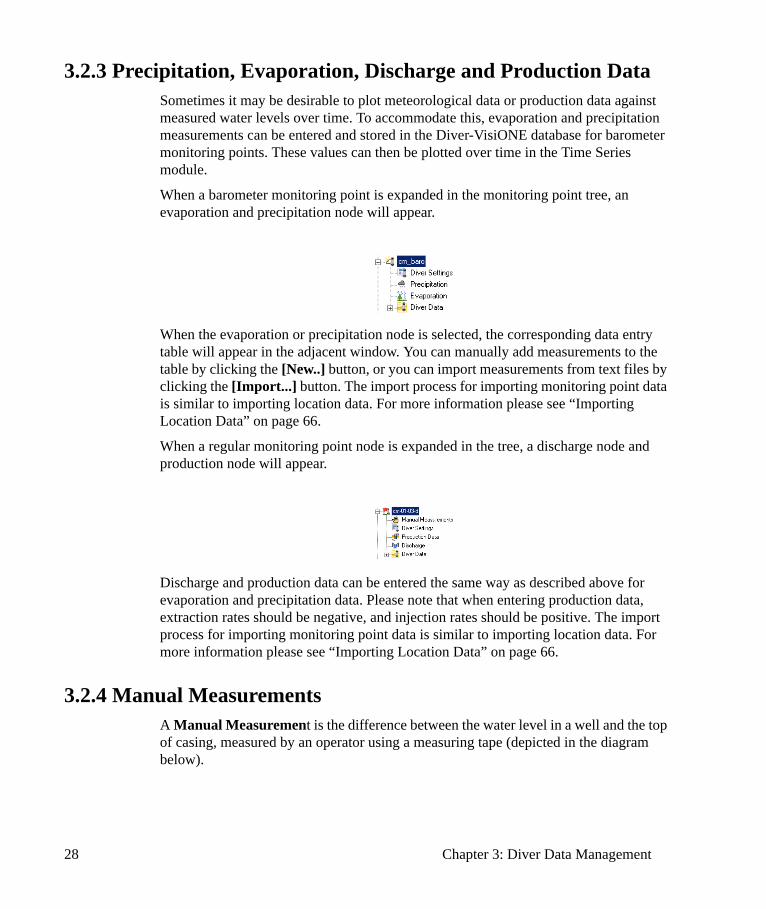
When a barometer monitoring point is expanded in the monitoring point tree, an evaporation and precipitation node will appear.
When the evaporation or precipitation node is selected, the corresponding data entry table will appear in the adjacent window. You can manually add measurements to the table by clicking the [New..] button, or you can import measurements from text files by clicking the [Import...] button. The import process for importing monitoring point data is similar to importing location data. For more information please see “Importing Location Data” on page 66.
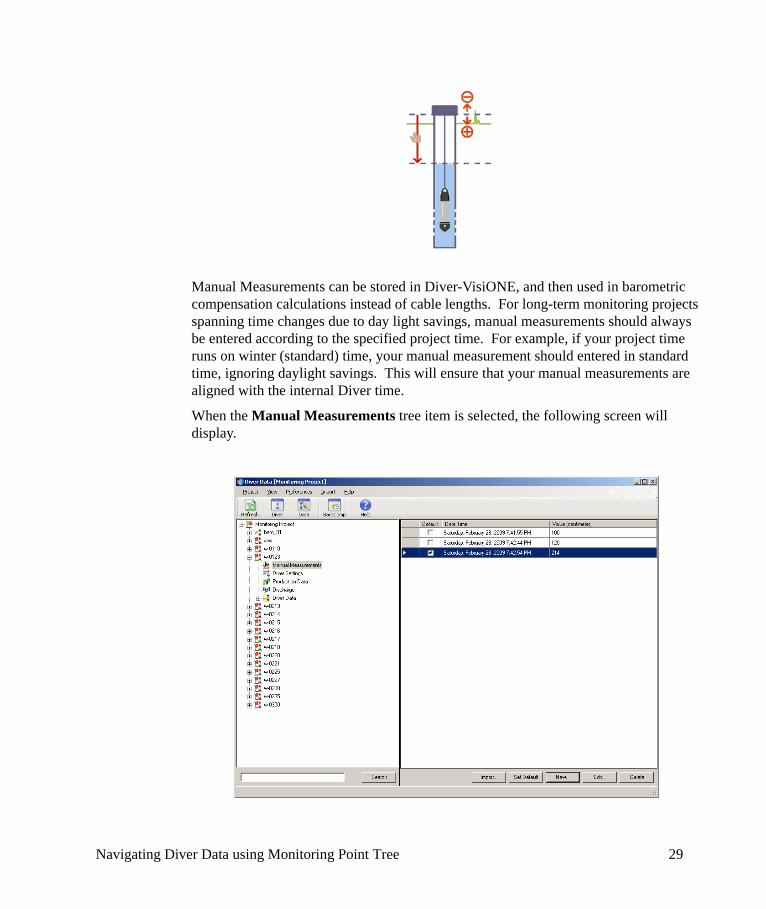
When a regular monitoring point node is expanded in the tree, a discharge node and production node will appear.
Discharge and production data can be entered the same way as described above for evaporation and precipitation data. Please note that when entering production data, extraction rates should be negative, and injection rates should be positive. The import process for importing monitoring point data is similar to importing location data. For more information please see “Importing Location Data” on page 66.
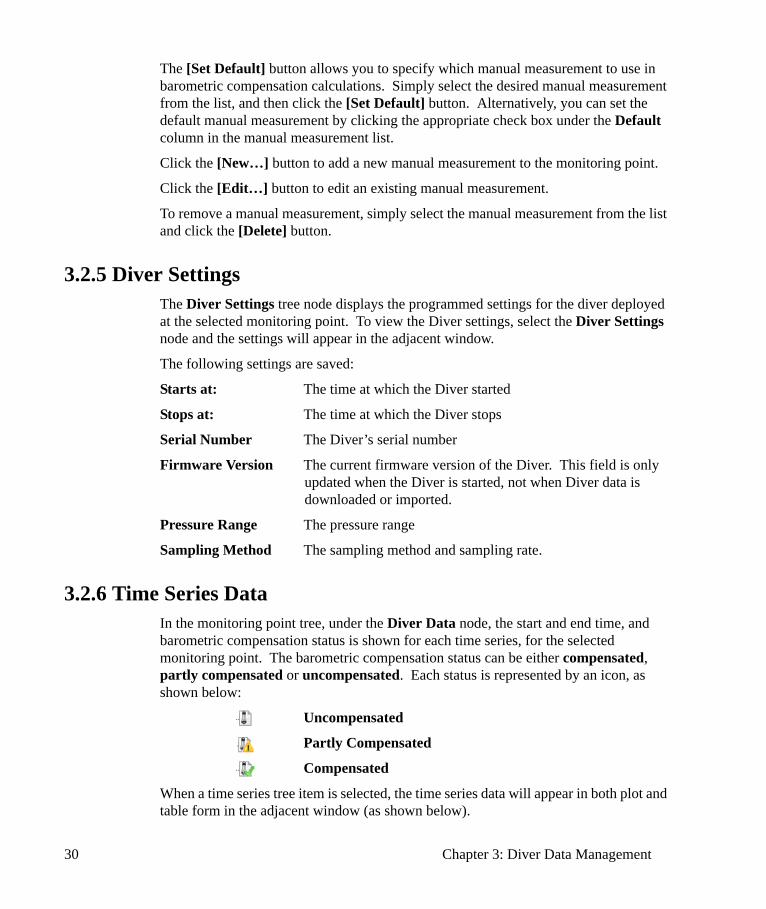
3.2.4 Manual MeasurementsA Manual Measurement is the difference between the water level in a well and the top of casing, measured by an operator using a measuring tape (depicted in the diagram below).
28 Chapter 3: Diver Data Management
Manual Measurements can be stored in Diver-VisiONE, and then used in barometric compensation calculations instead of cable lengths. For long-term monitoring projects spanning time changes due to day light savings, manual measurements should always be entered according to the specified project time. For example, if your project time runs on winter (standard) time, your manual measurement should entered in standard time, ignoring daylight savings. This will ensure that your manual measurements are aligned with the internal Diver time.
When the Manual Measurements tree item is selected, the following screen will display.
Navigating Diver Data using Monitoring Point Tree 29
The [Set Default] button allows you to specify which manual measurement to use in barometric compensation calculations. Simply select the desired manual measurement from the list, and then click the [Set Default] button. Alternatively, you can set the default manual measurement by clicking the appropriate check box under the Default column in the manual measurement list.
Click the [New…] button to add a new manual measurement to the monitoring point.
Click the [Edit…] button to edit an existing manual measurement.
To remove a manual measurement, simply select the manual measurement from the list and click the [Delete] button.
3.2.5 Diver SettingsThe Diver Settings tree node displays the programmed settings for the diver deployed at the selected monitoring point. To view the Diver settings, select the Diver Settings node and the settings will appear in the adjacent window.
The following settings are saved:
Starts at: The time at which the Diver started
Stops at: The time at which the Diver stops
Serial Number The Diver’s serial number
Firmware Version The current firmware version of the Diver. This field is only updated when the Diver is started, not when Diver data is downloaded or imported.
Pressure Range The pressure range
Sampling Method The sampling method and sampling rate.
3.2.6 Time Series DataIn the monitoring point tree, under the Diver Data node, the start and end time, and barometric compensation status is shown for each time series, for the selected monitoring point. The barometric compensation status can be either compensated, partly compensated or uncompensated. Each status is represented by an icon, as shown below:
Uncompensated
Partly Compensated
Compensated
When a time series tree item is selected, the time series data will appear in both plot and table form in the adjacent window (as shown below).
30 Chapter 3: Diver Data Management
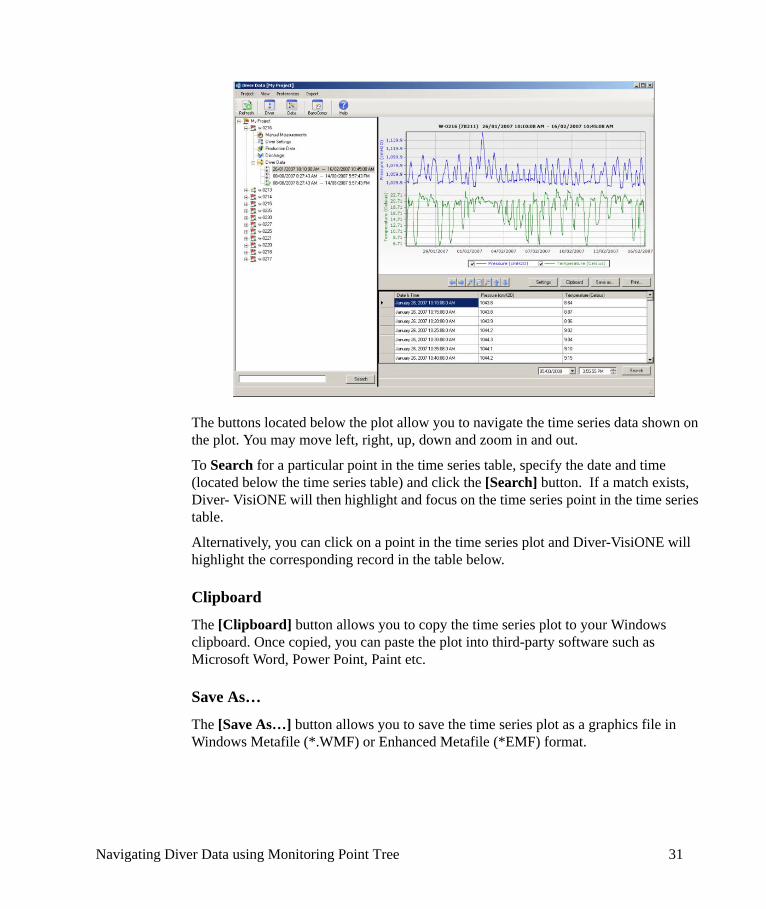
The buttons located below the plot allow you to navigate the time series data shown on the plot. You may move left, right, up, down and zoom in and out.
To Search for a particular point in the time series table, specify the date and time (located below the time series table) and click the [Search] button. If a match exists, Diver- VisiONE will then highlight and focus on the time series point in the time series table.
Alternatively, you can click on a point in the time series plot and Diver-VisiONE will highlight the corresponding record in the table below.
Clipboard
The [Clipboard] button allows you to copy the time series plot to your Windows clipboard. Once copied, you can paste the plot into third-party software such as Microsoft Word, Power Point, Paint etc.
Save As…
The [Save As…] button allows you to save the time series plot as a graphics file in Windows Metafile (*.WMF) or Enhanced Metafile (*EMF) format.
Navigating Diver Data using Monitoring Point Tree 31
Plot Settings
By default, the plot will show all the available parameters recorded for that particular Diver type. To show/hide parameters, simply click on the corresponding checkbox in the plot legend.
You can further modify the appearance of the plot by clicking on the [Settings] button. For each parameter, choose between line and bar. You may show/hide the plot legend or show the plot in 3-Dimensions by clicking on the appropriate checkbox.
The Maximum and Minimum fields are editable allowing you to modify the data range of the y-axis.
Click [Apply] to make the changes to the plot. The changes will apply to the graphs of all time series.
Printing Time Series Plots
To print a time series plot, simply click the [Print] button. The windows print dialog will open where you can specify the desired print settings.
3.3 Programming and Reading DiversThe Diver dialog can be accessed by selecting the Diver button from the toolbar, or by clicking View from the main menu and then selecting Diver. Alternatively, you can press CTRL + R on your keyboard. Upon clicking, Diver-VisiONE will attempt to read and display the settings of the connected Diver. The following dialog will appear on your screen.
32 Chapter 3: Diver Data Management

The Diver dialog (shown above) is the main interface in which you can communicate with Divers. From this dialog you can:
• Read Diver settings.• Program Diver settings • Start\Stop Divers• Download Diver data into Diver-VisiONE.• Read actual data from connected Divers.• Calibrate CTD-Diver
Each of these procedures is described in the following sections.
Please note that in order to communicate with Divers you have to select the appropriate communication method from Preferences/Communication dialog, and the Diver must be connected to the computer (see below).
3.4 Connecting to a DiverThe method used to connect Divers depends on the manner in which the Diver is installed in the borehole:
• Divers suspended in the borehole on a steel cable will need to be removed from the borehole prior to connection. The Diver is then connected to the computer using a USB reading unit.
• Divers suspended on a DDC (Diver Data Cable) do not need to be removed from the borehole. Simply use an interface cable to connect the Diver to your
Connecting to a Diver 33
laptop computer.
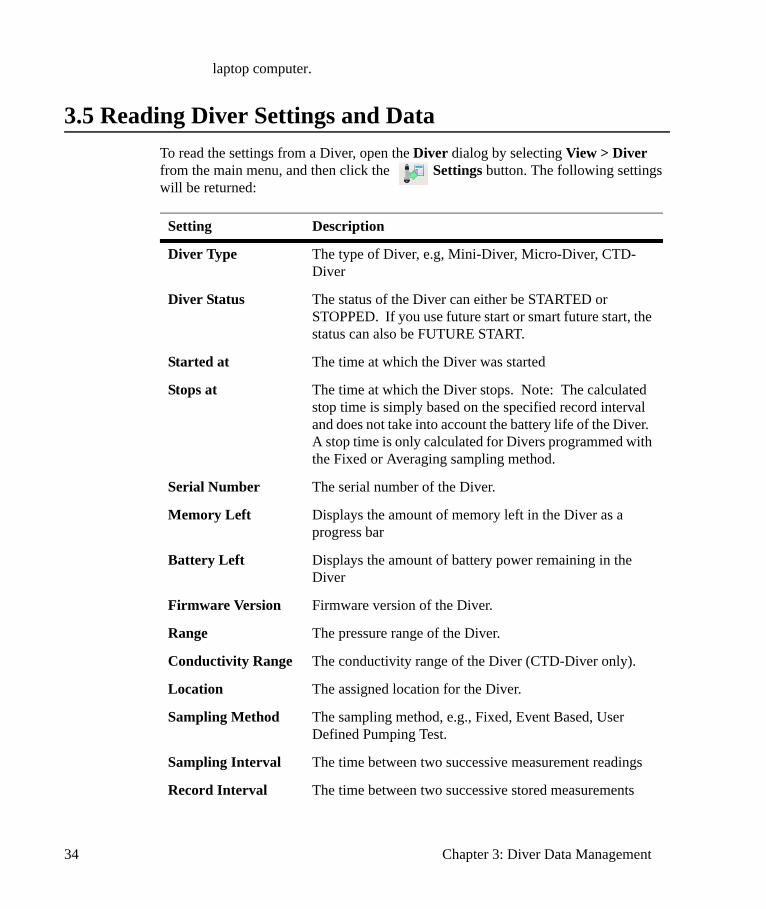
3.5 Reading Diver Settings and DataTo read the settings from a Diver, open the Diver dialog by selecting View > Diver from the main menu, and then click the Settings button. The following settings will be returned:
Setting Description
Diver Type The type of Diver, e.g, Mini-Diver, Micro-Diver, CTD-Diver
Diver Status The status of the Diver can either be STARTED or STOPPED. If you use future start or smart future start, the status can also be FUTURE START.
Started at The time at which the Diver was started
Stops at The time at which the Diver stops. Note: The calculated stop time is simply based on the specified record interval and does not take into account the battery life of the Diver. A stop time is only calculated for Divers programmed with the Fixed or Averaging sampling method.
Serial Number The serial number of the Diver.
Memory Left Displays the amount of memory left in the Diver as a progress bar
Battery Left Displays the amount of battery power remaining in the Diver
Firmware Version Firmware version of the Diver.
Range The pressure range of the Diver.
Conductivity Range The conductivity range of the Diver (CTD-Diver only).
Location The assigned location for the Diver.
Sampling Method The sampling method, e.g., Fixed, Event Based, User Defined Pumping Test.
Sampling Interval The time between two successive measurement readings
Record Interval The time between two successive stored measurements
34 Chapter 3: Diver Data Management
Invalid Diver Information
Other datalogger management software applications, such as Enviromon, allow you to modify the stored pressure range of certain Divers. However, it is important that the correct pressure range is read by Diver-VisiONE because pressure calculations are based on this value. In other words, if an invalid pressure range is read, Diver-VisiONE will not calculate the pressure values correctly. As such, each time Diver settings are read, Diver-VisiONE automatically validates the pressure range to ensure that it matches the expected value for that Diver type.
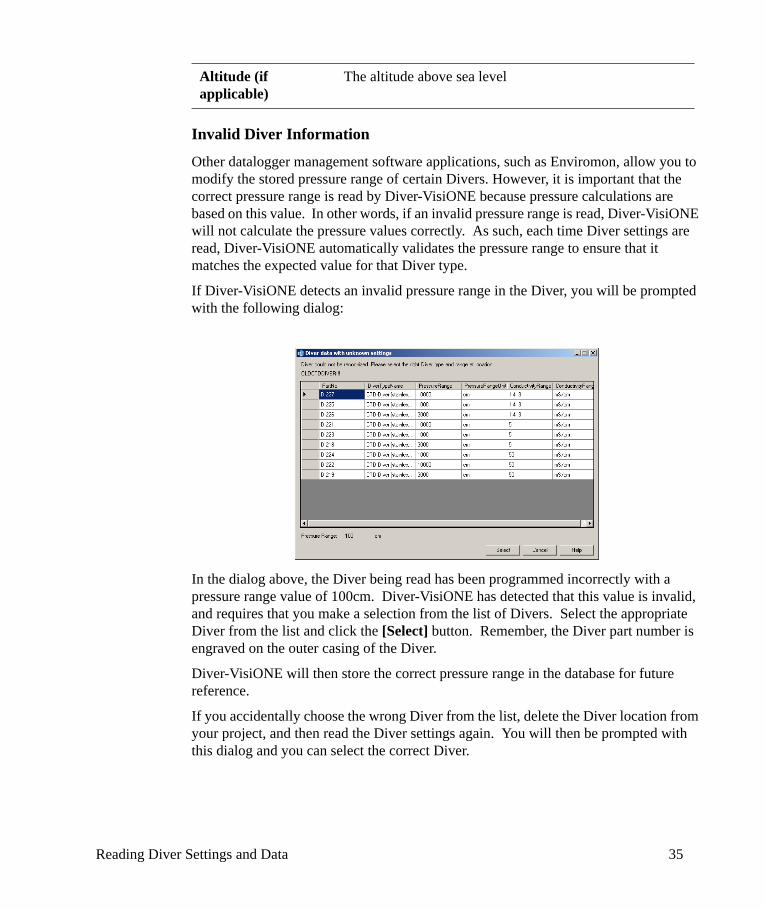
If Diver-VisiONE detects an invalid pressure range in the Diver, you will be prompted with the following dialog:
In the dialog above, the Diver being read has been programmed incorrectly with a pressure range value of 100cm. Diver-VisiONE has detected that this value is invalid, and requires that you make a selection from the list of Divers. Select the appropriate Diver from the list and click the [Select] button. Remember, the Diver part number is engraved on the outer casing of the Diver.
Diver-VisiONE will then store the correct pressure range in the database for future reference.
If you accidentally choose the wrong Diver from the list, delete the Diver location from your project, and then read the Diver settings again. You will then be prompted with this dialog and you can select the correct Diver.
Altitude (if applicable)
The altitude above sea level
Reading Diver Settings and Data 35
3.6 Programming Diver SettingsOnce the settings have been read (see “Reading Diver Settings and Data” on page 34), you can modify and program the following Diver settings: Monitoring Point, Sample Method, Sample Interval, Altitude (if applicable) and Conductivity Range (if applicable). Each setting is described in more detail below.
Once you have defined the settings for the Diver, click the [Program] button to save the settings to the Diver.
3.6.1 Monitoring Point The Monitoring Point name is a unique name given to a Diver and is usually associated with the physical location in which the Diver is deployed, i.e., a specific well casing and a specific well screen. Since the monitoring point name will be used as part of the filename for exporting data, the name does not accept special characters that would lead to an invalid filename.
When programming a Diver you may select an existing monitoring point name from the Location combo box, or specify a new monitoring point name by typing the desired name.
3.6.2 Sample Method and Sample IntervalThe Sample Method may be Fixed, Event Based, Averaging (for the Micro-Diver and Cera-Diver only) one of the predefined pumping test settings (Setup A, B or C), or User Defined (for the Micro-Diver and Cera-Diver only). Each sampling method is described below:
FixedWhen this method is selected, the Diver will take and store samples in regular time intervals. The time interval must be specified in the Record Interval field.
For example, with a 10-second fixed record interval, the Diver will take a measurement every 10 seconds on all channel settings and then store these values in internal memory, with the date and time.
Event BasedWhen you select this method, the Diver compares each sample to the last stored sample and calculates a difference. A new sample is only stored when:
• the difference exceeds a specified percentage from the last stored sample on the leading parameter. Generally, the leading parameter is pressure. For the CTD-Diver the leading parameter is conductivity.
36 Chapter 3: Diver Data Management
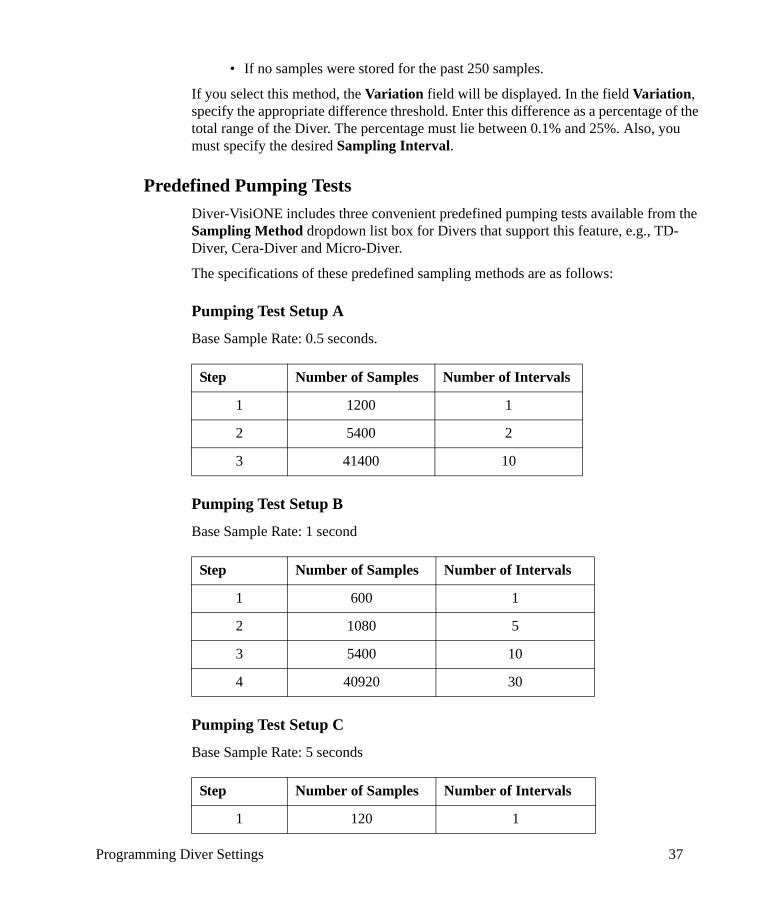
• If no samples were stored for the past 250 samples.
If you select this method, the Variation field will be displayed. In the field Variation, specify the appropriate difference threshold. Enter this difference as a percentage of the total range of the Diver. The percentage must lie between 0.1% and 25%. Also, you must specify the desired Sampling Interval.
Predefined Pumping TestsDiver-VisiONE includes three convenient predefined pumping tests available from the Sampling Method dropdown list box for Divers that support this feature, e.g., TD-Diver, Cera-Diver and Micro-Diver.
The specifications of these predefined sampling methods are as follows:
Pumping Test Setup A
Base Sample Rate: 0.5 seconds.
Pumping Test Setup B
Base Sample Rate: 1 second
Pumping Test Setup C
Base Sample Rate: 5 seconds
Step Number of Samples Number of Intervals
1 1200 1
2 5400 2
3 41400 10
Step Number of Samples Number of Intervals
1 600 1
2 1080 5
3 5400 10
4 40920 30
Step Number of Samples Number of Intervals
1 120 1
Programming Diver Settings 37
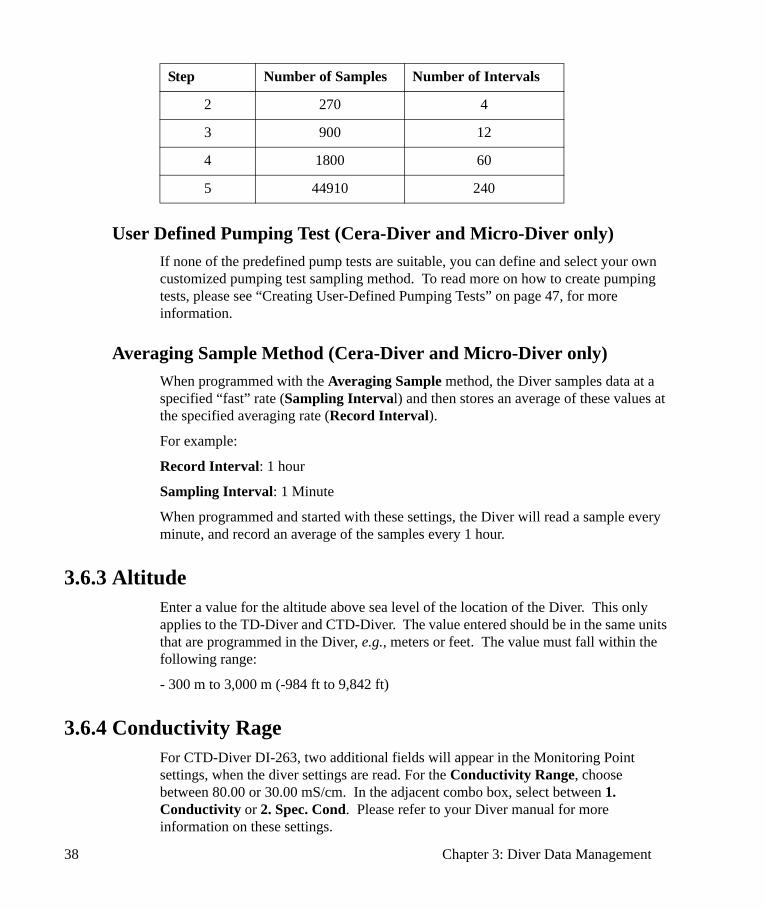
User Defined Pumping Test (Cera-Diver and Micro-Diver only)If none of the predefined pump tests are suitable, you can define and select your own customized pumping test sampling method. To read more on how to create pumping tests, please see “Creating User-Defined Pumping Tests” on page 47, for more information.
Averaging Sample Method (Cera-Diver and Micro-Diver only)When programmed with the Averaging Sample method, the Diver samples data at a specified “fast” rate (Sampling Interval) and then stores an average of these values at the specified averaging rate (Record Interval).
For example:
Record Interval: 1 hour
Sampling Interval: 1 Minute
When programmed and started with these settings, the Diver will read a sample every minute, and record an average of the samples every 1 hour.
3.6.3 AltitudeEnter a value for the altitude above sea level of the location of the Diver. This only applies to the TD-Diver and CTD-Diver. The value entered should be in the same units that are programmed in the Diver, e.g., meters or feet. The value must fall within the following range:
- 300 m to 3,000 m (-984 ft to 9,842 ft)
3.6.4 Conductivity RageFor CTD-Diver DI-263, two additional fields will appear in the Monitoring Point settings, when the diver settings are read. For the Conductivity Range, choose between 80.00 or 30.00 mS/cm. In the adjacent combo box, select between 1. Conductivity or 2. Spec. Cond. Please refer to your Diver manual for more information on these settings.
2 270 4
3 900 12
4 1800 60
5 44910 240
Step Number of Samples Number of Intervals
38 Chapter 3: Diver Data Management
3.7 Starting a DiverBefore you can start a Diver, the settings must have been read and the Diver status must be STOPPED (see “Reading Diver Settings and Data” on page 34).
To start the Diver, click the Start button from the Diver toolbar.
Upon clicking, you may be prompted with a warning message indicating the estimated operating time until the Diver memory is full, at the chosen sample rate. If the given time estimate is suitable, click [Yes] to continue. Otherwise, click [No] to return to the Diver dialog where you can modify the sample interval.
Upon clicking [Yes], the Start Diver dialog will appear on your screen.
Here you can select from three start methods: Immediate Start, Future Start and Smart Future Start (SFS).
After selecting the desired start method, click the [Start] button to save the start settings to the Diver.
Note: Starting a Diver will erase all data on the Diver. Please be sure to download your data before starting the Diver.
Immediate StartSelect this option to start the Diver immediately. Upon clicking [Start], the Diver will begin to take and record samples, as defined in the Diver settings.
Future StartSelect this option to start the Diver at a specified time in the future. Use the date and time boxes to enter the desired future start time.
Smart Future Start (SFS)This option is useful in situations where you want to stop the Diver, download its data and then continue collecting data at the specified sample interval. In other words, this option allows you to download data in contiguous segments, while maintaining a consistent sample interval. SFS can be explained best through the diagram shown below.
Starting a Diver 39
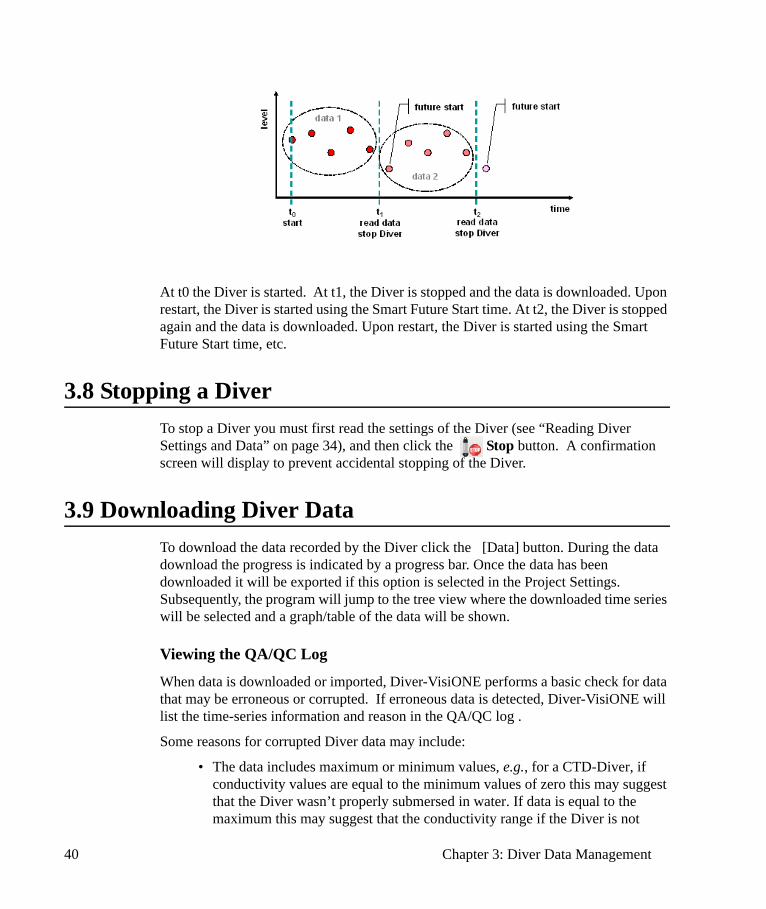
At t0 the Diver is started. At t1, the Diver is stopped and the data is downloaded. Upon restart, the Diver is started using the Smart Future Start time. At t2, the Diver is stopped again and the data is downloaded. Upon restart, the Diver is started using the Smart Future Start time, etc.
3.8 Stopping a DiverTo stop a Diver you must first read the settings of the Diver (see “Reading Diver Settings and Data” on page 34), and then click the Stop button. A confirmation screen will display to prevent accidental stopping of the Diver.
3.9 Downloading Diver DataTo download the data recorded by the Diver click the [Data] button. During the data download the progress is indicated by a progress bar. Once the data has been downloaded it will be exported if this option is selected in the Project Settings. Subsequently, the program will jump to the tree view where the downloaded time series will be selected and a graph/table of the data will be shown.
Viewing the QA/QC Log
When data is downloaded or imported, Diver-VisiONE performs a basic check for data that may be erroneous or corrupted. If erroneous data is detected, Diver-VisiONE will list the time-series information and reason in the QA/QC log .
Some reasons for corrupted Diver data may include:
• The data includes maximum or minimum values, e.g., for a CTD-Diver, if conductivity values are equal to the minimum values of zero this may suggest that the Diver wasn’t properly submersed in water. If data is equal to the maximum this may suggest that the conductivity range if the Diver is not
40 Chapter 3: Diver Data Management
suitable.• The data is corrupted due to a low battery in the Diver.
Click the [Clipboard] button to copy the contents of the QA/QC log to the Windows Clipboard for pasting into a text editor.
If you are experiencing difficulties with your Diver, please contact SWS technical support.
3.10 Viewing Actual DataThe Actual Data frame allows you to view the time and measurements of connected Divers in real time.
If the Diver is connected to Diver-VisiONE, e.g., through an interface cable or optical USB reading unit, click the [Refresh] button and Diver will take a sample and display the real time measurements in the table.
Note: Real time reading of Diver parameters is only supported for the following Divers: CTD-Diver, Micro-Diver, Mini-Diver and Cera-Diver. For all other Divers, Diver-VisiONE will display the last measurement stored in the Diver’s memory and not the real time values.
3.11 Calibrating CTD-DiversDiver-VisiONE allows you to calibrate the ceramic CTD-Diver as well as retrieve the calibration history from the CTD-Diver. It is recommended that you regularly calibrate the CTD-Diver to ensure that it accurately measures conductivity. You can read more about the calibration in the product manual of the CTD-Diver.
It is easy to calibrate a CTD-Diver with Diver-VisiONE. You only need to place the CTD-Diver in a calibration solution with a standard conductivity. These solutions can be obtained from suppliers of laboratory equipment.
The ceramic CTD-Diver can be calibrated at a maximum of four points. The solutions should have a temperature between 5 °C(41 °F) and 30 °C(86 °F). It is advisable to place the fluid(s) in the room where the calibration is to take place long before actual calibration starts to allow the fluid temperature to stabilize.
To calibrate a CTD-Diver you must first read the settings of the Diver (see “Reading Diver Settings and Data” on page 34), and then click the Calibrate button. Note: This button will only become available if the Diver is recognized as a CTD-Diver.
Upon clicking, the following dialog will display:
Viewing Actual Data 41
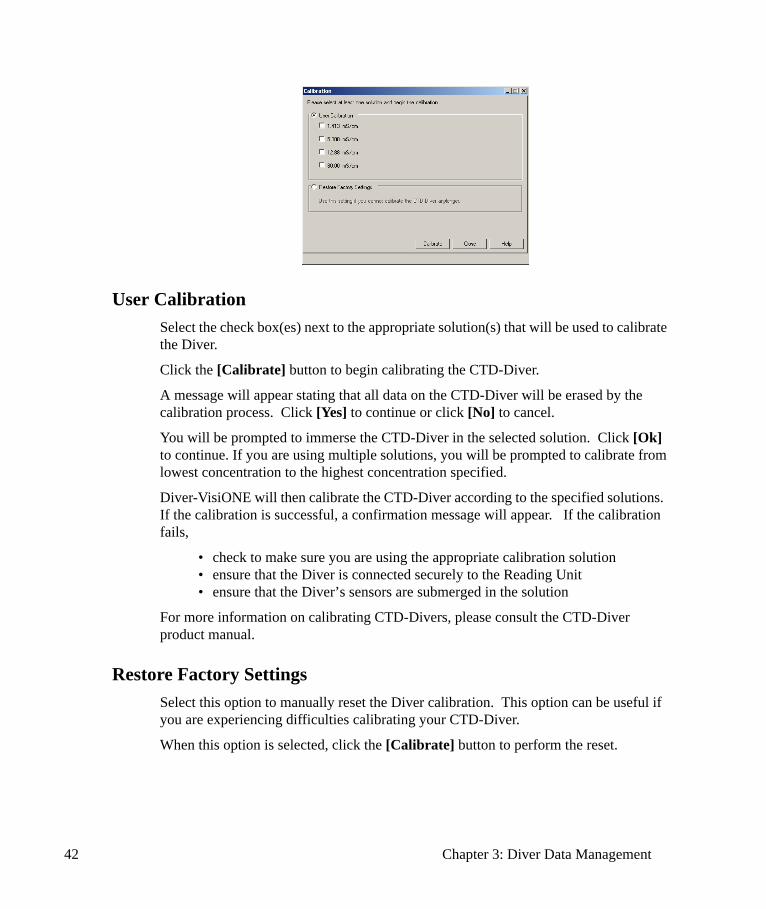
User CalibrationSelect the check box(es) next to the appropriate solution(s) that will be used to calibrate the Diver.
Click the [Calibrate] button to begin calibrating the CTD-Diver.
A message will appear stating that all data on the CTD-Diver will be erased by the calibration process. Click [Yes] to continue or click [No] to cancel.
You will be prompted to immerse the CTD-Diver in the selected solution. Click [Ok] to continue. If you are using multiple solutions, you will be prompted to calibrate from lowest concentration to the highest concentration specified.
Diver-VisiONE will then calibrate the CTD-Diver according to the specified solutions. If the calibration is successful, a confirmation message will appear. If the calibration fails,
• check to make sure you are using the appropriate calibration solution• ensure that the Diver is connected securely to the Reading Unit• ensure that the Diver’s sensors are submerged in the solution
For more information on calibrating CTD-Divers, please consult the CTD-Diver product manual.
Restore Factory SettingsSelect this option to manually reset the Diver calibration. This option can be useful if you are experiencing difficulties calibrating your CTD-Diver.
When this option is selected, click the [Calibrate] button to perform the reset.
42 Chapter 3: Diver Data Management
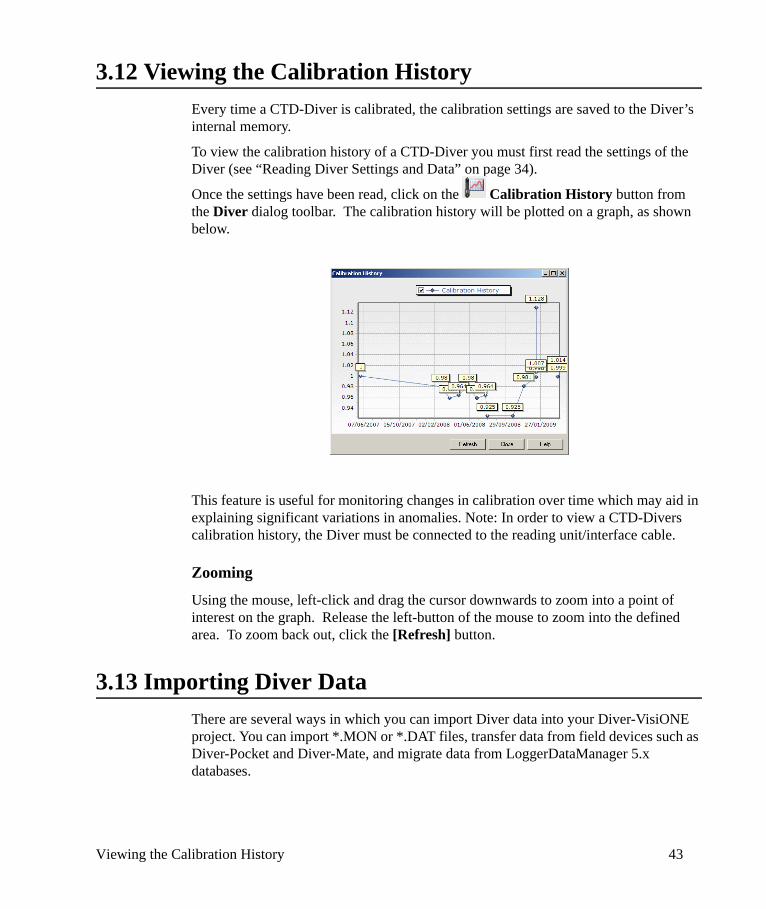
3.12 Viewing the Calibration HistoryEvery time a CTD-Diver is calibrated, the calibration settings are saved to the Diver’s internal memory.
To view the calibration history of a CTD-Diver you must first read the settings of the Diver (see “Reading Diver Settings and Data” on page 34).
Once the settings have been read, click on the Calibration History button from the Diver dialog toolbar. The calibration history will be plotted on a graph, as shown below.
This feature is useful for monitoring changes in calibration over time which may aid in explaining significant variations in anomalies. Note: In order to view a CTD-Divers calibration history, the Diver must be connected to the reading unit/interface cable.
Zooming
Using the mouse, left-click and drag the cursor downwards to zoom into a point of interest on the graph. Release the left-button of the mouse to zoom into the defined area. To zoom back out, click the [Refresh] button.
3.13 Importing Diver DataThere are several ways in which you can import Diver data into your Diver-VisiONE project. You can import *.MON or *.DAT files, transfer data from field devices such as Diver-Pocket and Diver-Mate, and migrate data from LoggerDataManager 5.x databases.
Viewing the Calibration History 43
Whenever data is imported, it is passed through Diver-VisiONE's QA/QC filter which checks for erroneous data and maximum/minimum values in the data. For more information on the QA/QC filter, please see “Viewing the QA/QC Log” on page 40.
3.13.1 From from MON/DAT filesTo import Diver data from MON (*.MON) and DAT (*.DAT) files,
• Select Import > Diver Data..., from the Diver Data main menu.• An Open dialog box will appear on your screen where you can locate and select
the files to be imported. You can make multiple selections by holding the CTRL key on your keyboard and clicking each file.
• Click the [Open] button to import the selected files.
NOTE: Diver-VisiONE supports MON files generated in LoggerDataManager version 4.0 and higher, Diver-Pocket, Diver-Office and DiverMate.
If the monitoring point name in the data file already exists in the Diver-VisiONE, the data set will be added to that monitoring point. If the monitoring point in the data file does not exist in the Diver-VisiONE project, a new node will be created in the monitoring point tree.
3.13.2 From LDM 5.x DatabasesTo import Diver data from Logger Data Manager (LDM) 5.x databases,
• Select Import > Diver Data..., from the Diver Data main menu.• The Import LDM Database dialog box will appear on your screen. Click the
Open button and browse to the folder that contains the LDM database. By default, the LDM database is stored in the following path: C:\Program Files\LDM\EXE\DB.
• Select the DB folder, and then click the [OK] button
After validating the LDM database, Diver-VisiONE will transfer the data and import it into the current project. Please note that it is possible that some data in your LDM database may not be imported into Diver-VisiONE. In this case, it is likely that these time series data were originally downloaded to LDM from Divers currently not supported by Diver-VisiONE. To view the list of supported Divers, please see “Supported Devices” on page 3.
3.13.3 From Standalone Versions of Diver-OfficeTo import Diver data from standalone versions of Diver-Office,
• Select Import > Diver-Office Data..., from the Diver Data main menu.• The Import Diver-Office Data dialog box will appear on your screen. Diver-
44 Chapter 3: Diver Data Management
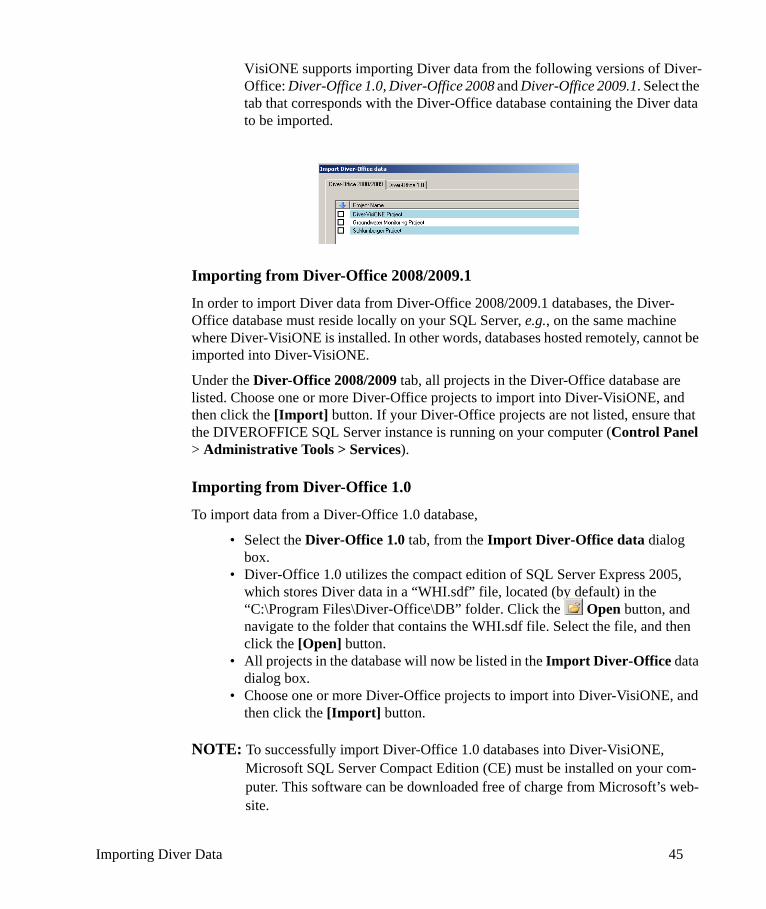
VisiONE supports importing Diver data from the following versions of Diver-Office: Diver-Office 1.0, Diver-Office 2008 and Diver-Office 2009.1. Select the tab that corresponds with the Diver-Office database containing the Diver data to be imported.
Importing from Diver-Office 2008/2009.1
In order to import Diver data from Diver-Office 2008/2009.1 databases, the Diver-Office database must reside locally on your SQL Server, e.g., on the same machine where Diver-VisiONE is installed. In other words, databases hosted remotely, cannot be imported into Diver-VisiONE.
Under the Diver-Office 2008/2009 tab, all projects in the Diver-Office database are listed. Choose one or more Diver-Office projects to import into Diver-VisiONE, and then click the [Import] button. If your Diver-Office projects are not listed, ensure that the DIVEROFFICE SQL Server instance is running on your computer (Control Panel > Administrative Tools > Services).
Importing from Diver-Office 1.0
To import data from a Diver-Office 1.0 database,
• Select the Diver-Office 1.0 tab, from the Import Diver-Office data dialog box.
• Diver-Office 1.0 utilizes the compact edition of SQL Server Express 2005, which stores Diver data in a “WHI.sdf” file, located (by default) in the “C:\Program Files\Diver-Office\DB” folder. Click the Open button, and navigate to the folder that contains the WHI.sdf file. Select the file, and then click the [Open] button.
• All projects in the database will now be listed in the Import Diver-Office data dialog box.
• Choose one or more Diver-Office projects to import into Diver-VisiONE, and then click the [Import] button.
NOTE: To successfully import Diver-Office 1.0 databases into Diver-VisiONE, Microsoft SQL Server Compact Edition (CE) must be installed on your com-puter. This software can be downloaded free of charge from Microsoft’s web-site.
Importing Diver Data 45
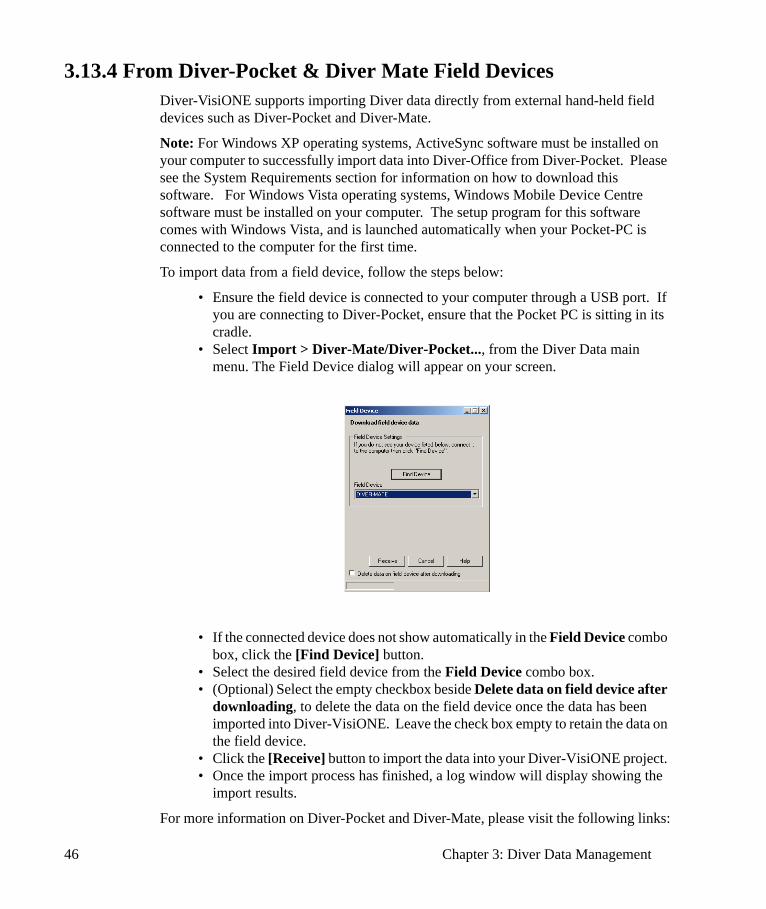
3.13.4 From Diver-Pocket & Diver Mate Field DevicesDiver-VisiONE supports importing Diver data directly from external hand-held field devices such as Diver-Pocket and Diver-Mate.
Note: For Windows XP operating systems, ActiveSync software must be installed on your computer to successfully import data into Diver-Office from Diver-Pocket. Please see the System Requirements section for information on how to download this software. For Windows Vista operating systems, Windows Mobile Device Centre software must be installed on your computer. The setup program for this software comes with Windows Vista, and is launched automatically when your Pocket-PC is connected to the computer for the first time.
To import data from a field device, follow the steps below:
• Ensure the field device is connected to your computer through a USB port. If you are connecting to Diver-Pocket, ensure that the Pocket PC is sitting in its cradle.
• Select Import > Diver-Mate/Diver-Pocket..., from the Diver Data main menu. The Field Device dialog will appear on your screen.
• If the connected device does not show automatically in the Field Device combo box, click the [Find Device] button.
• Select the desired field device from the Field Device combo box. • (Optional) Select the empty checkbox beside Delete data on field device after
downloading, to delete the data on the field device once the data has been imported into Diver-VisiONE. Leave the check box empty to retain the data on the field device.
• Click the [Receive] button to import the data into your Diver-VisiONE project. • Once the import process has finished, a log window will display showing the
import results.
For more information on Diver-Pocket and Diver-Mate, please visit the following links:
46 Chapter 3: Diver Data Management
Diver-Pocket http://www.swstechnology.com/software_product.php?ID=49
Diver-Mate http://www.swstechnology.com/equipment_product.php?ID=15
3.14 Diver Data Preferences
3.14.1 Units To change the units displayed in the Diver Data interface, select Preferences > Units from the Diver Data main menu.
To change the units, simply select the desired units from the combo boxes and click the [Save] button.
Note: The Length unit always appears grayed-out and is dependent on the Pressure unit. For example, if the pressure unit is mH2O, the length unit will automatically change to meters.
3.14.2 Communication To access the communication preferences, select Preferences > Communication from the Diver Data main menu. Here you can specify the communication port used by Diver-VisiONE to communicate with Divers.
If you are using a USB Reading Unit/Interface Cable to communicate with Diver dataloggers, you must select USB as the reading unit port. If you are using a Diver that requires a serial port connection, i.e., Flowman Diver, then you must select the appropriate COM port from the combo box.
Once selected, click [Ok] to apply the changes.
3.14.3 Creating User-Defined Pumping TestsThe Micro-Diver and Cera-Diver can be programmed with a user-defined pumping test sample method. The basic principle of a pumping test is that the sample interval increases over time. To access the pumping test settings,
• Select Preferences > Pumping Tests from the Diver Data main menu
The Pumping Test window will appear on your screen.
Diver Data Preferences 47
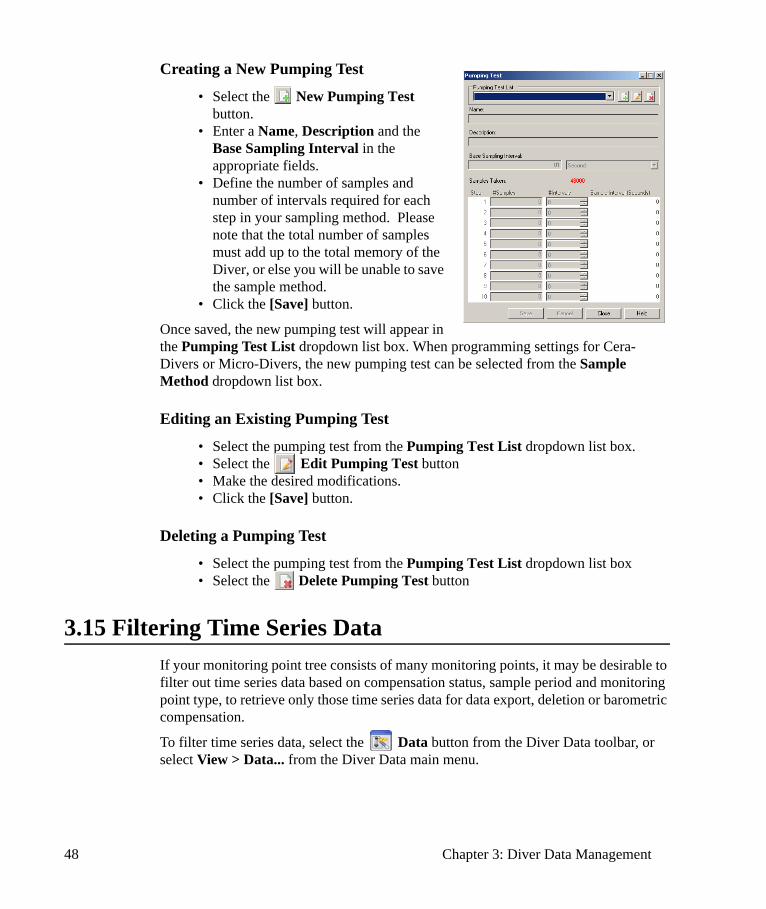
Creating a New Pumping Test
• Select the New Pumping Test button.
• Enter a Name, Description and the Base Sampling Interval in the appropriate fields.
• Define the number of samples and number of intervals required for each step in your sampling method. Please note that the total number of samples must add up to the total memory of the Diver, or else you will be unable to save the sample method.
• Click the [Save] button.
Once saved, the new pumping test will appear in the Pumping Test List dropdown list box. When programming settings for Cera-Divers or Micro-Divers, the new pumping test can be selected from the Sample Method dropdown list box.
Editing an Existing Pumping Test
• Select the pumping test from the Pumping Test List dropdown list box.• Select the Edit Pumping Test button• Make the desired modifications. • Click the [Save] button.
Deleting a Pumping Test
• Select the pumping test from the Pumping Test List dropdown list box• Select the Delete Pumping Test button
3.15 Filtering Time Series DataIf your monitoring point tree consists of many monitoring points, it may be desirable to filter out time series data based on compensation status, sample period and monitoring point type, to retrieve only those time series data for data export, deletion or barometric compensation.
To filter time series data, select the Data button from the Diver Data toolbar, or select View > Data... from the Diver Data main menu.
48 Chapter 3: Diver Data Management
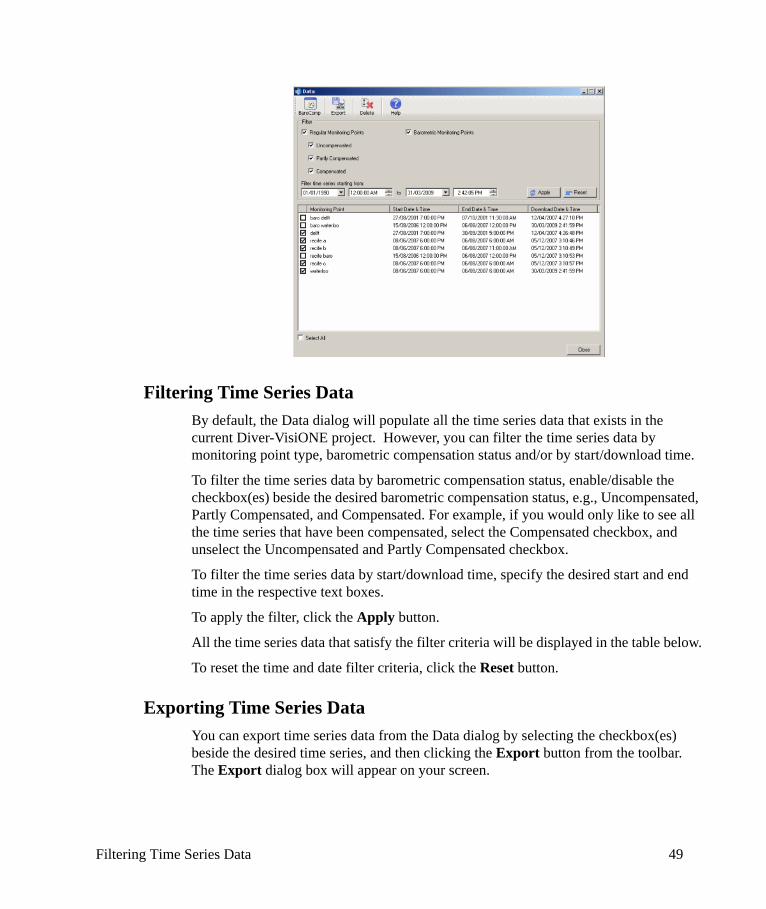
Filtering Time Series DataBy default, the Data dialog will populate all the time series data that exists in the current Diver-VisiONE project. However, you can filter the time series data by monitoring point type, barometric compensation status and/or by start/download time.
To filter the time series data by barometric compensation status, enable/disable the checkbox(es) beside the desired barometric compensation status, e.g., Uncompensated, Partly Compensated, and Compensated. For example, if you would only like to see all the time series that have been compensated, select the Compensated checkbox, and unselect the Uncompensated and Partly Compensated checkbox.
To filter the time series data by start/download time, specify the desired start and end time in the respective text boxes.
To apply the filter, click the Apply button.
All the time series data that satisfy the filter criteria will be displayed in the table below.
To reset the time and date filter criteria, click the Reset button.
Exporting Time Series DataYou can export time series data from the Data dialog by selecting the checkbox(es) beside the desired time series, and then clicking the Export button from the toolbar. The Export dialog box will appear on your screen.
Filtering Time Series Data 49
The Export Folder is the destination folder in which all exported data is stored on your computer. By default, the folder is set to the Diver Data project folder. You can change the export folder by clicking on the Open button and selecting a new destination folder. When data is exported, it is always saved in a corresponding subfolder, e.g., MON, CSV and DAT, based on the exported file types.
You can export the time series data in either uncompensated form or compensated form, by selecting the appropriate option.
Click the [Ok] button to export the data. The data will be exported in the file formats specified in the Project Settings. Please see section “Project Settings” on page 24 for more information on setting the Default Export Settings.
Barometric CompensationYou can perform barometric compensation on selected time series data in the Data dialog. Simply select the checkbox(es) for the desired time series data and click the BaroComp button from the toolbar.
This will open the Barometric Compensation dialog. Please refer to “Compensating Diver Data” on page 50 for more information in compensating time series data.
3.16 Compensating Diver Data
3.16.1 What is Barometric Compensation?A Diver measures the groundwater level with a highly accurate pressure sensor that measures an absolute pressure. This pressure is equal to the ‘weight’ of the water column above the measuring instrument plus the prevailing air pressure. Subtracting air pressure measurements from the absolute pressure measurement ‘compensates’ for air pressure variations. This can be done quickly and easily using Diver-VisiONE.
The barometric compensation process uses linear interpolation for air pressure values if they are not measured at the same time as the water level. The sampling interval of the barometer does not have to be the same as the Diver measurements it compensates. It only has to register the variations in the atmospheric pressure; a measurement with a fixed sampling speed of 1 per 30 minutes is usually good enough.
Divers measure the groundwater level with respect to the Diver itself, i.e., the water column height above the Diver. However, using the appropriate reference measurements (cable lengths or manual measurements), Diver-VisiONE allows you to express water levels with respect to an external reference, e.g. top of well casing. The following section describes barometric compensation in more detail.
50 Chapter 3: Diver Data Management
Using a Baro-DiverSWS manufactures a Baro-Diver that samples and records atmospheric pressure. This Diver can be located at various positions, for instance: in an Office, in the well (in the part where there is no water) or on a floating device such that the distance between the air-water interface and the Baro-Diver is always constant. The latter configuration will avoid large temperature variations in the Baro-Diver.
Usually only one Baro-Diver suffices for more than one Diver. The area where the Divers are deployed must have the same barometric pressure. This depends on the terrain (mountains and lakes can affect barometric pressure) and how large the deployment area is. Sometimes more than one Baro-Diver is used for one iso-barometric data, where one functions as a backup incase the other Baro-Diver fails.
Baro-Diver data can be downloaded, and assigned to any regular monitoring point for barometric compensation. Please refer to “Location Settings” on page 14 for information on how to assign a Baro-Diver location to a regular location.
3.16.2 Setting Up your Project
Requirements for Barometric Compensation
• The Diver data must be associated with a barometer monitoring point. For more information on assigning barometric data to regular monitoring points, please see “Monitoring Point Settings” on page 26.
• The barometer time series and Diver time series must (partly) overlap. • If you choose to reference water levels using manual measurements, at least one
manual measurement must exist for the monitoring point, and it must fall within the barometer time series and the Diver time series. For more information on entering manual measurement data, please see “Manual Measurements” on page 28.
• If you choose to reference water levels using cable length measurements, a cable length measurement must exist for the monitoring point.For more information on entering cable length measurements, “Monitoring Point Settings” on page 26.
3.16.3 Compensating the DataBarometric Compensation can be performed in one of two ways: from the time series node in the monitoring point tree or from the data dialog.
From the Data Dialog
To compensate multiple time series simultaneously,
Compensating Diver Data 51
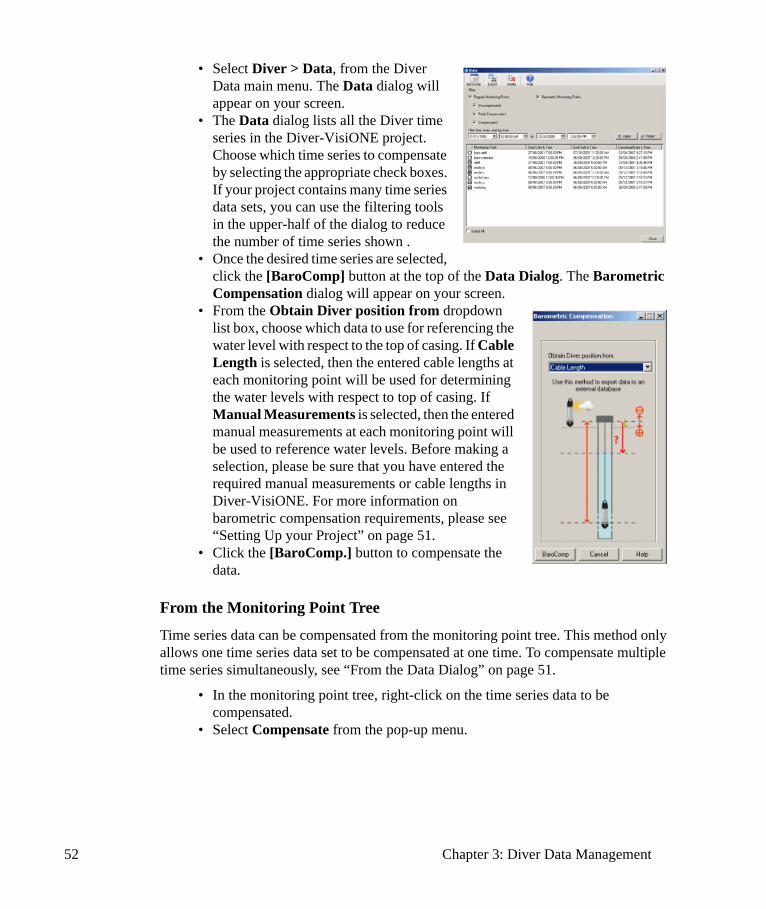
• Select Diver > Data, from the Diver Data main menu. The Data dialog will appear on your screen.
• The Data dialog lists all the Diver time series in the Diver-VisiONE project. Choose which time series to compensate by selecting the appropriate check boxes. If your project contains many time series data sets, you can use the filtering tools in the upper-half of the dialog to reduce the number of time series shown .
• Once the desired time series are selected, click the [BaroComp] button at the top of the Data Dialog. The Barometric Compensation dialog will appear on your screen.
• From the Obtain Diver position from dropdown list box, choose which data to use for referencing the water level with respect to the top of casing. If Cable Length is selected, then the entered cable lengths at each monitoring point will be used for determining the water levels with respect to top of casing. If Manual Measurements is selected, then the entered manual measurements at each monitoring point will be used to reference water levels. Before making a selection, please be sure that you have entered the required manual measurements or cable lengths in Diver-VisiONE. For more information on barometric compensation requirements, please see “Setting Up your Project” on page 51.
• Click the [BaroComp.] button to compensate the data.
From the Monitoring Point Tree
Time series data can be compensated from the monitoring point tree. This method only allows one time series data set to be compensated at one time. To compensate multiple time series simultaneously, see “From the Data Dialog” on page 51.
• In the monitoring point tree, right-click on the time series data to be compensated.
• Select Compensate from the pop-up menu.
52 Chapter 3: Diver Data Management
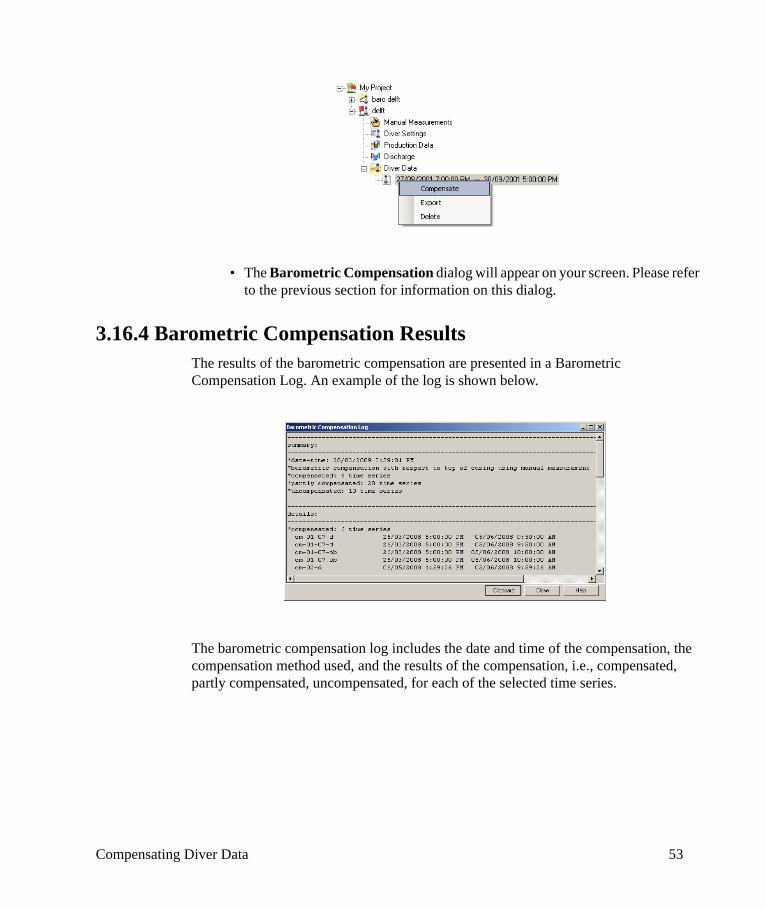
• The Barometric Compensation dialog will appear on your screen. Please refer to the previous section for information on this dialog.
3.16.4 Barometric Compensation ResultsThe results of the barometric compensation are presented in a Barometric Compensation Log. An example of the log is shown below.
The barometric compensation log includes the date and time of the compensation, the compensation method used, and the results of the compensation, i.e., compensated, partly compensated, uncompensated, for each of the selected time series.
Compensating Diver Data 53

54 Chapter 3: Diver Data Management
4Location Management
The Location Managment module allows you to enter data pertaining to project locations. In Diver-VisiONE, a location refers to a unique real-world location, with X-Y coordinates, at which data collection activities are performed. A single location may consist of one or more well casings, e.g., nested wells, and therefore one or more monitoring points. As such, the location module allows you to associate monitoring points (created in the Diver Data module) to individual location casings.
The Location module can be launched by clicking the Location button from the Diver-VisiONE toolbar.
The following topics are discussed in this chapter:
• Creating a Monitoring Network• Creating a New Location• Location Data Entry• Assigning Monitoring Points to Locations• Importing Location Data
55
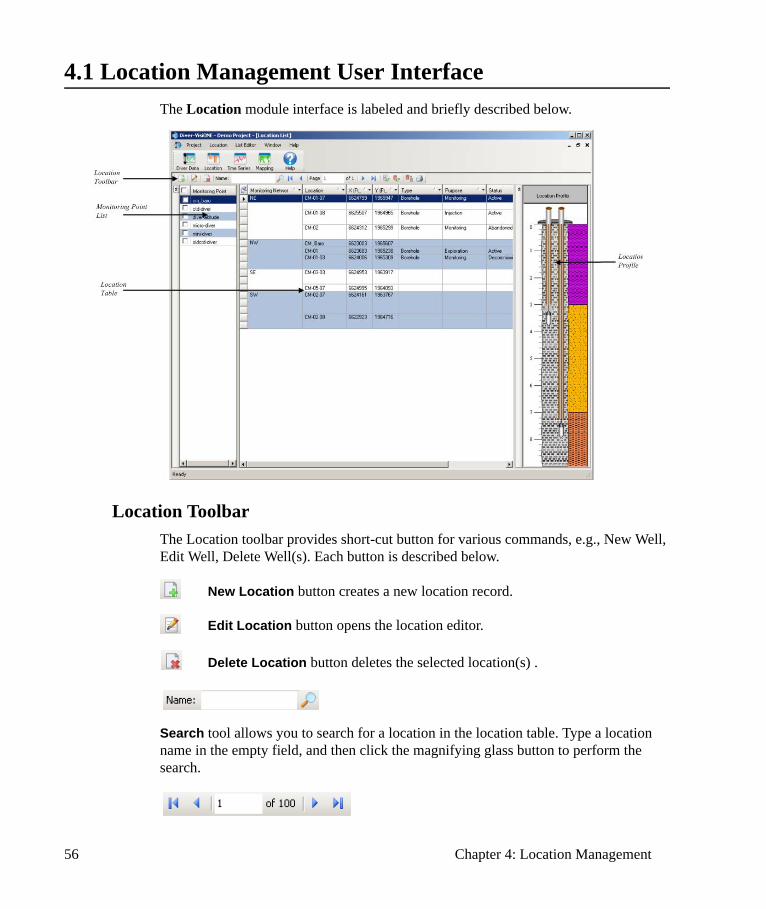
4.1 Location Management User InterfaceThe Location module interface is labeled and briefly described below.
Location ToolbarThe Location toolbar provides short-cut button for various commands, e.g., New Well, Edit Well, Delete Well(s). Each button is described below.
New Location button creates a new location record.
Edit Location button opens the location editor.
Delete Location button deletes the selected location(s) .
Search tool allows you to search for a location in the location table. Type a location name in the empty field, and then click the magnifying glass button to perform the search.
56 Chapter 4: Location Management
Page Controls allow you to select which page in the location table to view. Each page displays 100 location records. Use the arrow buttons to move to the next or previous page, or type in the page number in the field and press [Enter] to move immediately to the desired page.
Refresh Location List button updates the location table.
Refresh Location Profile button refreshes the location profiles for selected locations.
Export button allows you to export the location profile to a graphics file. For more information on this feature, please see “Exporting Location Profile to Image file” on page 69.
Print button opens the Select Report dialog, which allows you to print a summary or detailed location report.
Monitoring Point ListThe Monitoring Point List lists all the monitoring points from the Diver Data module that are not assigned to a location’s casing. When a monitoring point is assigned to a casing, it is removed from the monitoring point list. If the location is deleted, or the monitoring point is unassigned, the monitoring point is added back to the list. For more information on assigning monitoring points to location casings, please see“Assigning Monitoring Points to Locations” on page 65.
Location TableThe station table hosts a grid displaying a list of locations in the project. The purpose of this list is to provide an overview of multiple locations and to perform general operations based on one or more selected locations, e.g., send to report. For a more detailed view of an individual location, double click on a location row.
By default, the location table displays eight columns, including Monitoring Network, Monitoring Point, X and Y coordinate, station Type, Purpose, Status and Locations. You can remove columns from the table using the Field Chooser. To load the field choose, select the button, located in the upper-left corner of the table. When selected, the following window will appear on your screen:
Location Management User Interface 57
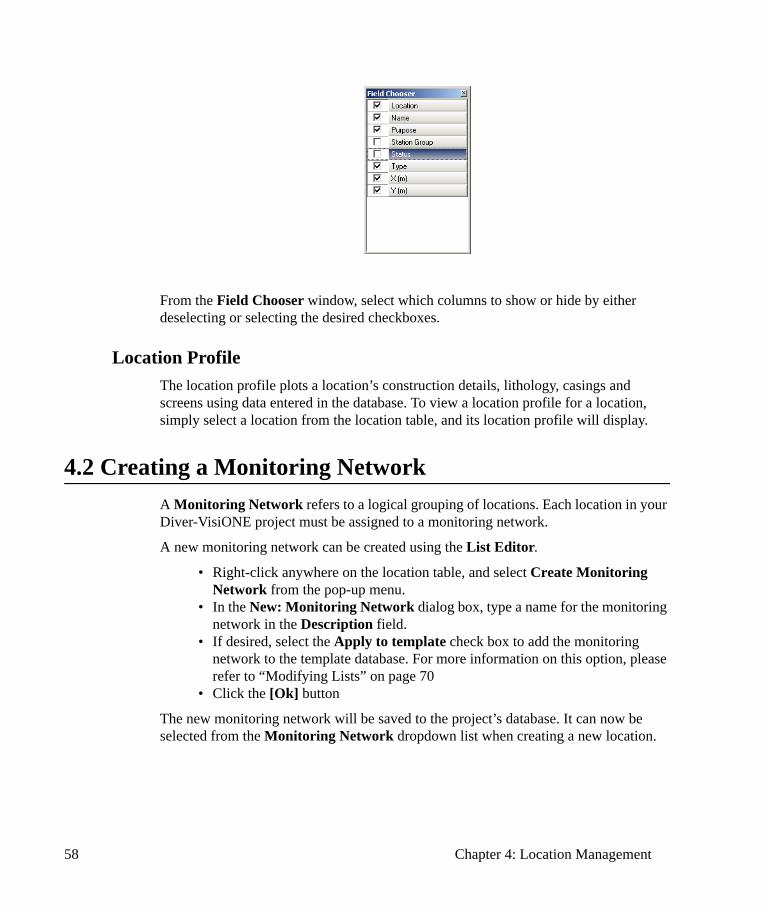
From the Field Chooser window, select which columns to show or hide by either deselecting or selecting the desired checkboxes.
Location ProfileThe location profile plots a location’s construction details, lithology, casings and screens using data entered in the database. To view a location profile for a location, simply select a location from the location table, and its location profile will display.
4.2 Creating a Monitoring NetworkA Monitoring Network refers to a logical grouping of locations. Each location in your Diver-VisiONE project must be assigned to a monitoring network.
A new monitoring network can be created using the List Editor.
• Right-click anywhere on the location table, and select Create Monitoring Network from the pop-up menu.
• In the New: Monitoring Network dialog box, type a name for the monitoring network in the Description field.
• If desired, select the Apply to template check box to add the monitoring network to the template database. For more information on this option, please refer to “Modifying Lists” on page 70
• Click the [Ok] button
The new monitoring network will be saved to the project’s database. It can now be selected from the Monitoring Network dropdown list when creating a new location.
58 Chapter 4: Location Management
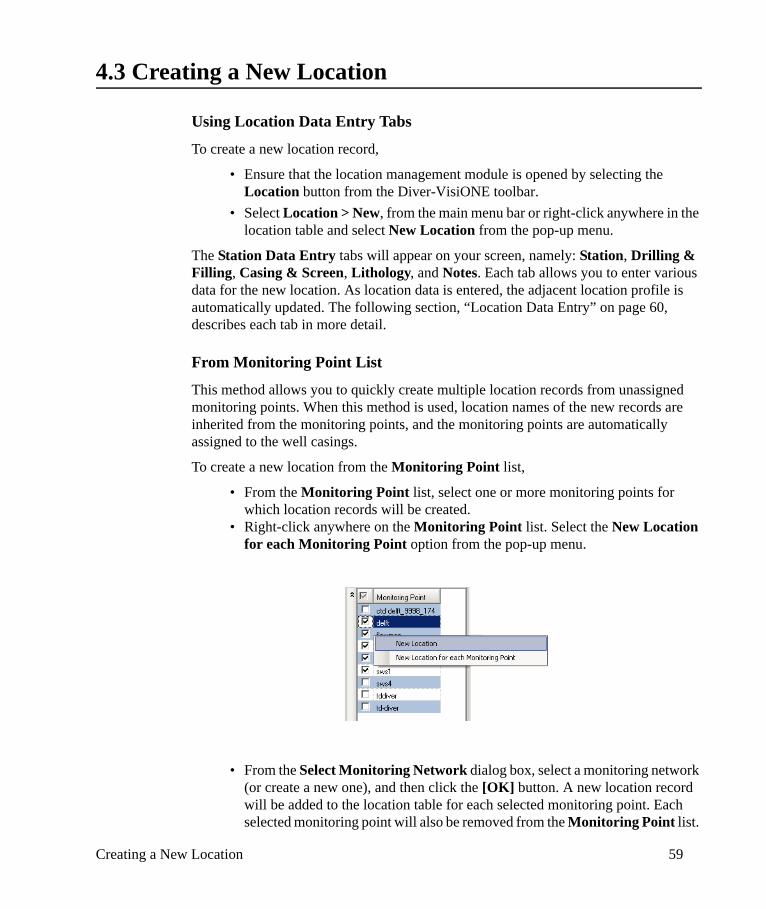
4.3 Creating a New Location
Using Location Data Entry Tabs
To create a new location record,
• Ensure that the location management module is opened by selecting the Location button from the Diver-VisiONE toolbar.
• Select Location > New, from the main menu bar or right-click anywhere in the location table and select New Location from the pop-up menu.
The Station Data Entry tabs will appear on your screen, namely: Station, Drilling & Filling, Casing & Screen, Lithology, and Notes. Each tab allows you to enter various data for the new location. As location data is entered, the adjacent location profile is automatically updated. The following section, “Location Data Entry” on page 60, describes each tab in more detail.
From Monitoring Point List
This method allows you to quickly create multiple location records from unassigned monitoring points. When this method is used, location names of the new records are inherited from the monitoring points, and the monitoring points are automatically assigned to the well casings.
To create a new location from the Monitoring Point list,
• From the Monitoring Point list, select one or more monitoring points for which location records will be created.
• Right-click anywhere on the Monitoring Point list. Select the New Location for each Monitoring Point option from the pop-up menu.
• From the Select Monitoring Network dialog box, select a monitoring network (or create a new one), and then click the [OK] button. A new location record will be added to the location table for each selected monitoring point. Each selected monitoring point will also be removed from the Monitoring Point list.
Creating a New Location 59
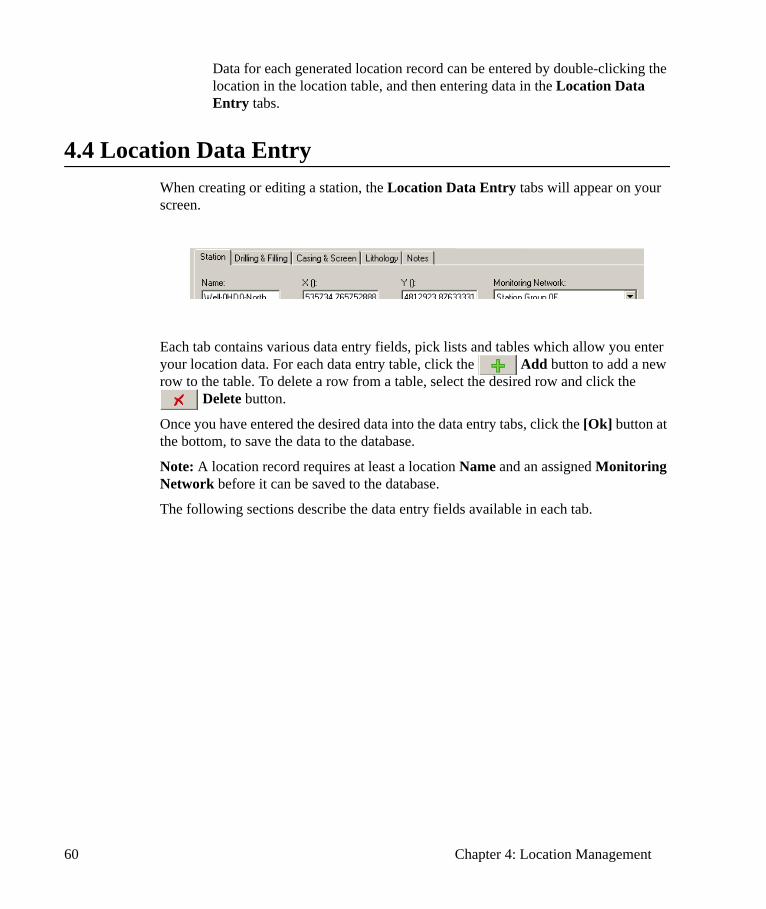
Data for each generated location record can be entered by double-clicking the location in the location table, and then entering data in the Location Data Entry tabs.
4.4 Location Data EntryWhen creating or editing a station, the Location Data Entry tabs will appear on your screen.
Each tab contains various data entry fields, pick lists and tables which allow you enter your location data. For each data entry table, click the Add button to add a new row to the table. To delete a row from a table, select the desired row and click the
Delete button.
Once you have entered the desired data into the data entry tabs, click the [Ok] button at the bottom, to save the data to the database.
Note: A location record requires at least a location Name and an assigned Monitoring Network before it can be saved to the database.
The following sections describe the data entry fields available in each tab.
60 Chapter 4: Location Management
Location Tab
General Information
Ground Surface
The ground surface table allows you to enter the surveyed ground surface elevation at the location over time.
Installation Details
The Installation Details tab contains various fields for entering installation details
Name Name of the location
X The X coordinate of the location
Y The Y coordinate of the location
Monitoring Network
Assign a monitoring network to the station. If a monitoring network has not been created yet, select the <Add New> button to launch the list editor where you can create a new monitoring network. For more information on creating a monitoring network, please see “Creating a Monitoring Network” on page 58.
Date Enter the date when the ground surface elevation was surveyed, e.g., DD/MM/YYYY.
Elevation The surveyed elevation of the ground surface
Comments Enter any additional information pertaining to the ground surface elevation recorded at the specified date.
Installation Date
The date the location was installed
Total Depth (m)
The total depth of the borehole
Type Select the type of location from the combo box
Purpose Select the purpose of the location from the combo box.
Status Select the status of the location from the combo box
Owner The location’s owner
Location Data Entry 61
The Type, Purpose and Status drop down list boxes provide various predefined list items. However, if none of the provided lists are suitable, you can add a new item to the list by selecting the <Add New> option, located at the bottom of the drop down lists. Selecting this option will load the list editor, where you can add a new item. For more information on the list editor, please refer to “Modifying Lists” on page 70.
Address
The address tab contains various fields for entering the address of the location. This information will be presented on the detailed station report..
Drilling & Filling Tab
Drilling
The Drilling table allows you to specify drilling data for the station.
Filling
The Filling table allows you to specify filling data for the station.
Station Photo An image of the location can be saved in the database and displayed in the location tab and in location reports. To add an image, click on the [Upload] button. An Open dialog box will appear on your screen allowing you to choose the desired image file from a location on your computer. Supported Image file types:
• *.BMP• *.JPEG• *.GIF
Note: For optimal performance, it is recommended that you only upload images that are 2MB or less in size.
From (m) Depth to top of drilling interval
To (m) Depth to bottom of drilling interval
Diameter Diameter of the borehole
Drilling Method
The drilling method used
From (m) Depth to top of filling interval
62 Chapter 4: Location Management
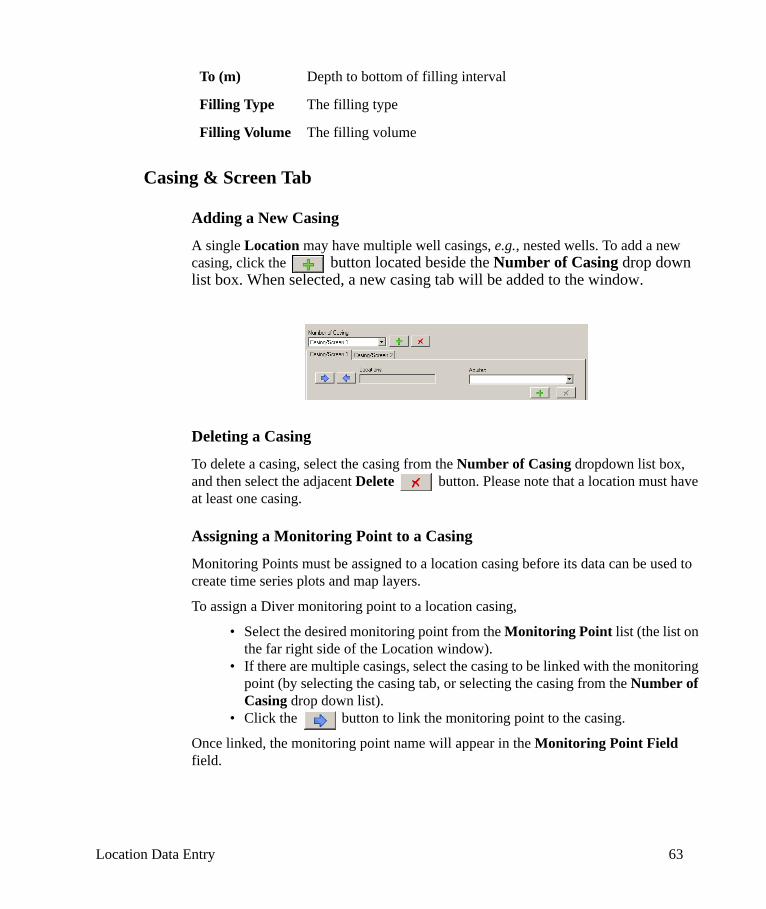
Casing & Screen Tab
Adding a New Casing
A single Location may have multiple well casings, e.g., nested wells. To add a new casing, click the button located beside the Number of Casing drop down list box. When selected, a new casing tab will be added to the window.
Deleting a Casing
To delete a casing, select the casing from the Number of Casing dropdown list box, and then select the adjacent Delete button. Please note that a location must have at least one casing.
Assigning a Monitoring Point to a Casing
Monitoring Points must be assigned to a location casing before its data can be used to create time series plots and map layers.
To assign a Diver monitoring point to a location casing,
• Select the desired monitoring point from the Monitoring Point list (the list on the far right side of the Location window).
• If there are multiple casings, select the casing to be linked with the monitoring point (by selecting the casing tab, or selecting the casing from the Number of Casing drop down list).
• Click the button to link the monitoring point to the casing.
Once linked, the monitoring point name will appear in the Monitoring Point Field field.
To (m) Depth to bottom of filling interval
Filling Type The filling type
Filling Volume The filling volume
Location Data Entry 63
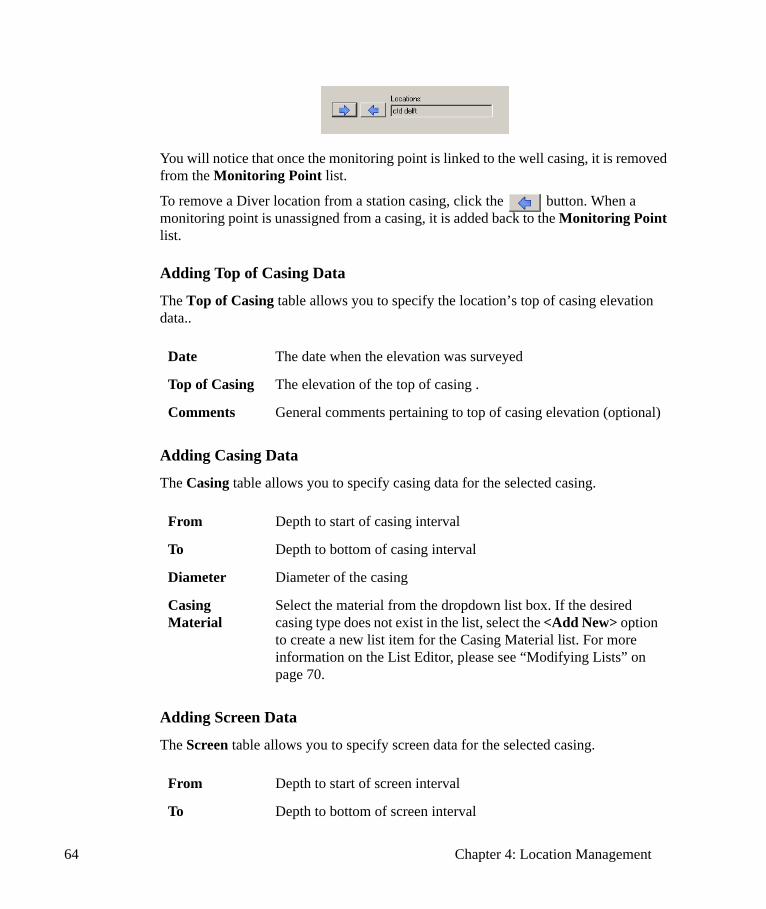
You will notice that once the monitoring point is linked to the well casing, it is removed from the Monitoring Point list.
To remove a Diver location from a station casing, click the button. When a monitoring point is unassigned from a casing, it is added back to the Monitoring Point list.
Adding Top of Casing Data
The Top of Casing table allows you to specify the location’s top of casing elevation data..
Adding Casing Data
The Casing table allows you to specify casing data for the selected casing.
Adding Screen Data
The Screen table allows you to specify screen data for the selected casing.
Date The date when the elevation was surveyed
Top of Casing The elevation of the top of casing .
Comments General comments pertaining to top of casing elevation (optional)
From Depth to start of casing interval
To Depth to bottom of casing interval
Diameter Diameter of the casing
Casing Material
Select the material from the dropdown list box. If the desired casing type does not exist in the list, select the <Add New> option to create a new list item for the Casing Material list. For more information on the List Editor, please see “Modifying Lists” on page 70.
From Depth to start of screen interval
To Depth to bottom of screen interval
64 Chapter 4: Location Management
Lithology TabThe Lithology table allows you to enter lithology data at the location.
Notes TabThe Note tab provides a table for saving field notes pertaining to the selected location, to the project’s database.
4.5 Assigning Monitoring Points to LocationsBefore Monitoring Point data (Diver data) can be plotted using the Time Series module or displayed on a map document in the Mapping module, it must first be assigned to a Location. More specifically, each monitoring point must be assigned to a location’s casing. There are several ways to assign monitoring points to location casings.
• If the associated location record already exists in the location table, then you can assign a monitoring point using the data entry tabs. From the location table, double-click on the desired location, and then select the Casing tab. The steps
Diameter Diameter of the screen
Slot Number Screen slot number
Screen Type Screen material, e.g., Plastic (PVC), Steel or user defined.
From Depth to start of formation interval
To Depth to bottom of formation interval
Soil Type The soil type
Soil Description
A description of the soil
Formation Name
The formation name
Consistency The consistency of the soil
Structure The structure of the soil
Color The color of the soil
Moisture A measure of soil moisture content
Comment Comments pertaining to the lithology layer
Assigning Monitoring Points to Locations 65
for assigning a monitoring point to the casing is described in “Assigning a Monitoring Point to a Casing” on page 63.
• If the associated location record does not exist in the location table, you can quickly generate the location records from the Monitoring Point list. With this method, location names are inherited from the monitoring point names, and the monitoring points are automatically assigned to the location’s casing. Select the desired monitoring points from the Montiroing Point list, right-click and select either New Location or New Location for Each Monitoring Point.
4.6 Editing a Location To edit an existing station,
• Select the desired location from the station table.
• From the main toolbar, select the Edit Location data button from the toolbar.
The Location Data Entry tabs will appear where you can modify the location data. For more information on location data entry, please see “Location Data Entry” on page 60.
4.7 Importing Location DataLocation data, e.g., locations, well construction data, lithology, field note etc, can be imported from various file types into the Diver-VisiONE database. Diver-VisiONE supports importing data from the following file types: Text (.TXT, .CSV), Microsoft Excel (.XLS).
To import station data, follow the steps below:
• From the main menu, select Station > Import Station Data...
The import process consists of the follow 4 steps:
• Step 1: Select Table and Data Source• Step 2: Specify Format and Data Preview• Step 3: Column Mapping• Step 4: Data Validation
66 Chapter 4: Location Management
Step 1: Select Table and Data Source
Step 2: Specify Format and Data Preview
The options that appear in this step will depend on the file type selected in Step 1.
Data Object Select the table to which data will be imported. Data can be imported to the following database tables:
• Location • Drilling• Annular Filling• Lithology• Station Ground Surface• Station Notes• Casing Details • Screen
Source File Select the source file from a location on your computer. Data may be imported from the following file types:
• Microsoft Excel, .XLS• Microsoft Access, .MDB• Text, .CSV, .ASC, .TXT
Delimiters TXT When importing data from text files, specify the delimiter used to separate columns in the source data, e.g., comma, space, semi-colon etc.
From Row TXT XLS MDB
Specify the row in the source file for where to start importing data from.
Header Row TXT XLS Select the checkbox and specify the row in the source file that contains the column headers. By specifying the header row, you will be able to easily identify the source columns in the Step 3 (field mapping). If you do not specify a header row, columns in the source data will be referred to as F1, F2, F3 etc.
Select Worksheet
XLS When importing data from excel files, specify the worksheet in the excel file that contains the data to be imported.
Select Table or Query
MDB When importing data from Access database files, specify whether to import data from a database table or from a query.
Importing Location Data 67
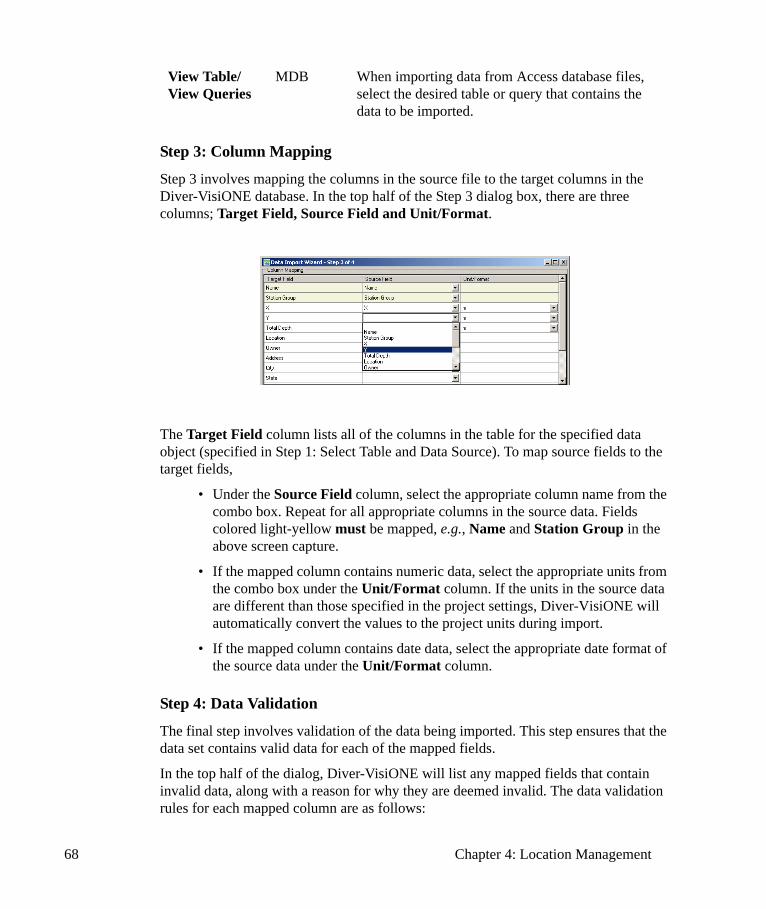
Step 3: Column Mapping
Step 3 involves mapping the columns in the source file to the target columns in the Diver-VisiONE database. In the top half of the Step 3 dialog box, there are three columns; Target Field, Source Field and Unit/Format.
The Target Field column lists all of the columns in the table for the specified data object (specified in Step 1: Select Table and Data Source). To map source fields to the target fields,
• Under the Source Field column, select the appropriate column name from the combo box. Repeat for all appropriate columns in the source data. Fields colored light-yellow must be mapped, e.g., Name and Station Group in the above screen capture.
• If the mapped column contains numeric data, select the appropriate units from the combo box under the Unit/Format column. If the units in the source data are different than those specified in the project settings, Diver-VisiONE will automatically convert the values to the project units during import.
• If the mapped column contains date data, select the appropriate date format of the source data under the Unit/Format column.
Step 4: Data Validation
The final step involves validation of the data being imported. This step ensures that the data set contains valid data for each of the mapped fields.
In the top half of the dialog, Diver-VisiONE will list any mapped fields that contain invalid data, along with a reason for why they are deemed invalid. The data validation rules for each mapped column are as follows:
View Table/View Queries
MDB When importing data from Access database files, select the desired table or query that contains the data to be imported.
68 Chapter 4: Location Management
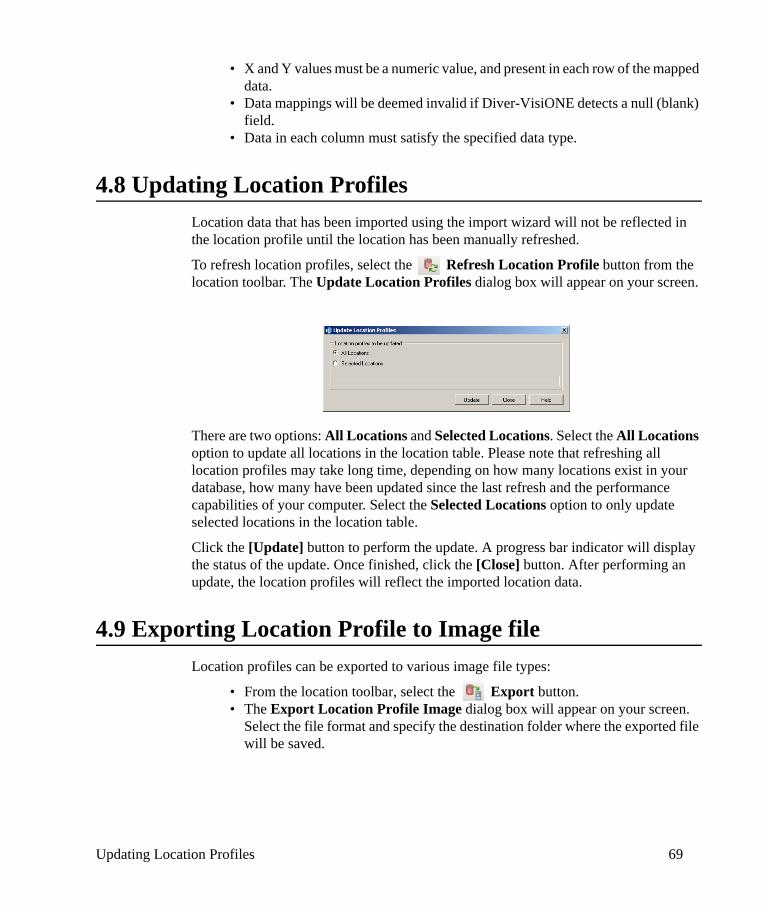
• X and Y values must be a numeric value, and present in each row of the mapped data.
• Data mappings will be deemed invalid if Diver-VisiONE detects a null (blank) field.
• Data in each column must satisfy the specified data type.
4.8 Updating Location ProfilesLocation data that has been imported using the import wizard will not be reflected in the location profile until the location has been manually refreshed.
To refresh location profiles, select the Refresh Location Profile button from the location toolbar. The Update Location Profiles dialog box will appear on your screen.
There are two options: All Locations and Selected Locations. Select the All Locations option to update all locations in the location table. Please note that refreshing all location profiles may take long time, depending on how many locations exist in your database, how many have been updated since the last refresh and the performance capabilities of your computer. Select the Selected Locations option to only update selected locations in the location table.
Click the [Update] button to perform the update. A progress bar indicator will display the status of the update. Once finished, click the [Close] button. After performing an update, the location profiles will reflect the imported location data.
4.9 Exporting Location Profile to Image fileLocation profiles can be exported to various image file types:
• From the location toolbar, select the Export button.• The Export Location Profile Image dialog box will appear on your screen.
Select the file format and specify the destination folder where the exported file will be saved.
Updating Location Profiles 69
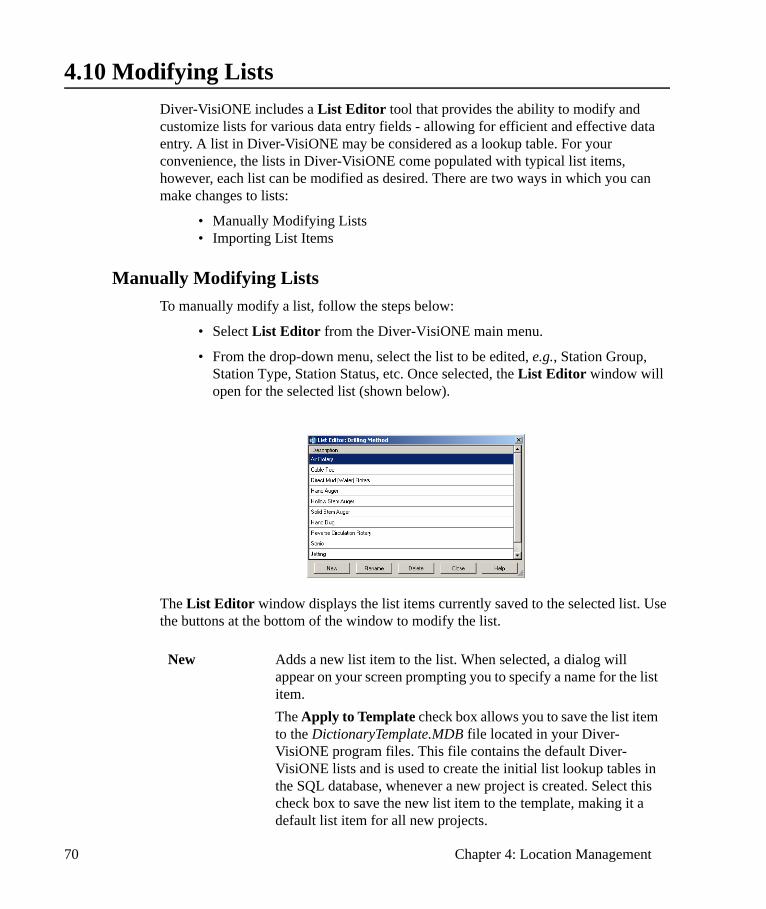
4.10 Modifying ListsDiver-VisiONE includes a List Editor tool that provides the ability to modify and customize lists for various data entry fields - allowing for efficient and effective data entry. A list in Diver-VisiONE may be considered as a lookup table. For your convenience, the lists in Diver-VisiONE come populated with typical list items, however, each list can be modified as desired. There are two ways in which you can make changes to lists:
• Manually Modifying Lists• Importing List Items
Manually Modifying ListsTo manually modify a list, follow the steps below:
• Select List Editor from the Diver-VisiONE main menu.
• From the drop-down menu, select the list to be edited, e.g., Station Group, Station Type, Station Status, etc. Once selected, the List Editor window will open for the selected list (shown below).
The List Editor window displays the list items currently saved to the selected list. Use the buttons at the bottom of the window to modify the list.
New Adds a new list item to the list. When selected, a dialog will appear on your screen prompting you to specify a name for the list item. The Apply to Template check box allows you to save the list item to the DictionaryTemplate.MDB file located in your Diver-VisiONE program files. This file contains the default Diver-VisiONE lists and is used to create the initial list lookup tables in the SQL database, whenever a new project is created. Select this check box to save the new list item to the template, making it a default list item for all new projects.
70 Chapter 4: Location Management
Importing List ItemsTo import list items from a file,
• Select List Editor > Import List Item... from the Diver-VisiONE main menu.
The Data Import Wizard will appear on your screen. The import process for importing list items consists of four steps:
• Step 1: Select List and Data Source• Step 2: Specify Format and Data Preview• Step 3: Column Mapping• Step 4: Data Validation
Rename Allows you to change the description of the selected list item. See above for Apply to Template option.
Delete Deletes the selected list item from the list.
Close Closes the List Editor window.
Modifying Lists 71
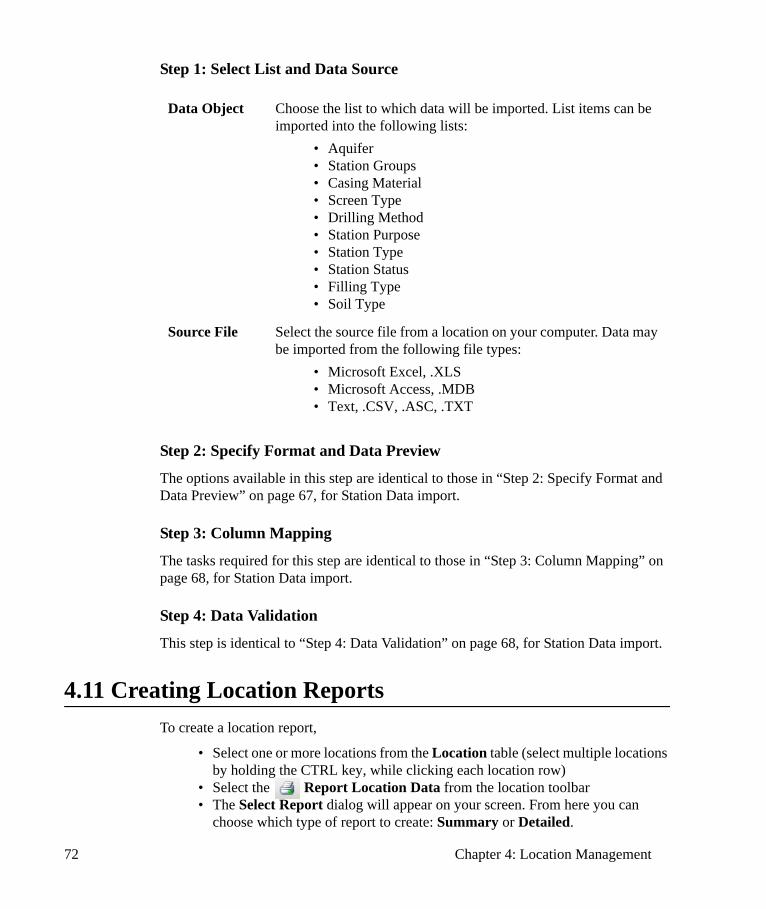
Step 1: Select List and Data Source
Step 2: Specify Format and Data Preview
The options available in this step are identical to those in “Step 2: Specify Format and Data Preview” on page 67, for Station Data import.
Step 3: Column Mapping
The tasks required for this step are identical to those in “Step 3: Column Mapping” on page 68, for Station Data import.
Step 4: Data Validation
This step is identical to “Step 4: Data Validation” on page 68, for Station Data import.
4.11 Creating Location ReportsTo create a location report,
• Select one or more locations from the Location table (select multiple locations by holding the CTRL key, while clicking each location row)
• Select the Report Location Data from the location toolbar• The Select Report dialog will appear on your screen. From here you can
choose which type of report to create: Summary or Detailed.
Data Object Choose the list to which data will be imported. List items can be imported into the following lists:
• Aquifer • Station Groups• Casing Material• Screen Type• Drilling Method• Station Purpose• Station Type• Station Status• Filling Type• Soil Type
Source File Select the source file from a location on your computer. Data may be imported from the following file types:
• Microsoft Excel, .XLS• Microsoft Access, .MDB• Text, .CSV, .ASC, .TXT
72 Chapter 4: Location Management
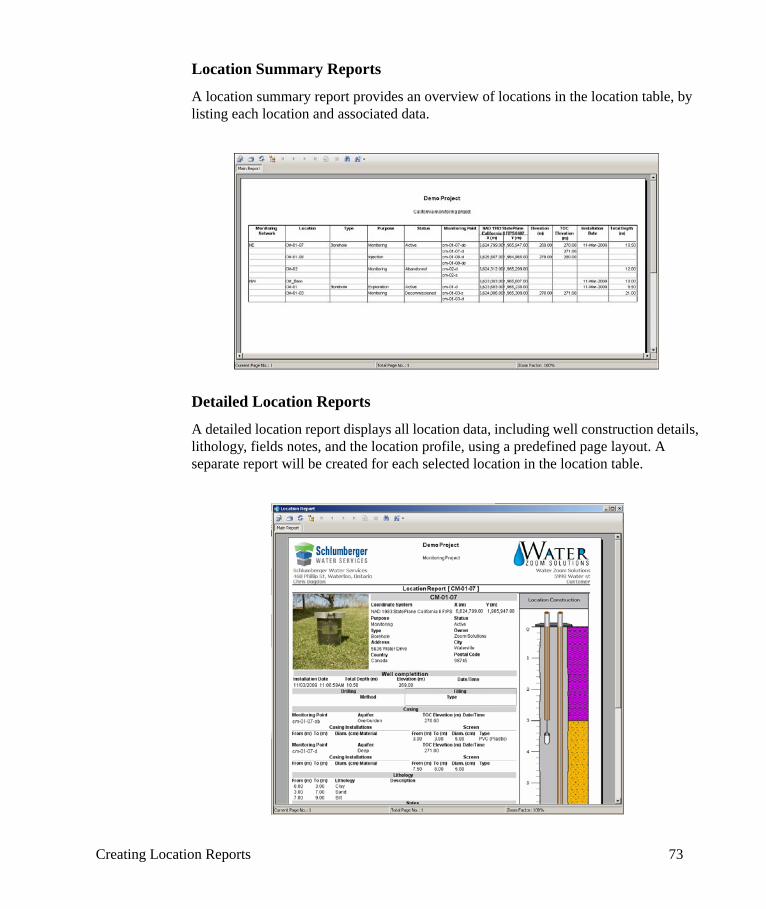
Location Summary Reports
A location summary report provides an overview of locations in the location table, by listing each location and associated data.
Detailed Location Reports
A detailed location report displays all location data, including well construction details, lithology, fields notes, and the location profile, using a predefined page layout. A separate report will be created for each selected location in the location table.
Creating Location Reports 73

74 Chapter 4: Location Management
5Time Series Plotting
The Time Series Plotting module provides various options for creating and customizing detailed time series plots from monitoring data. The Time Series Plotting module can be launched by selecting the Time Series button from the Diver-VisiONE main toolbar. This chapter provides information on the following topics:
• Time Series Interface• Creating a New Plot Page• Adding a New Plot• Exporting Plot Page to Image• Exporting Data Series to File• Editing Plot Settings• Editing Plot Series
Note: Before attempting to create time series plots, please ensure that you have assigned your monitoring points to location casings in the Location module . For more information, please see “Assigning Monitoring Points to Locations” on page 65.
75
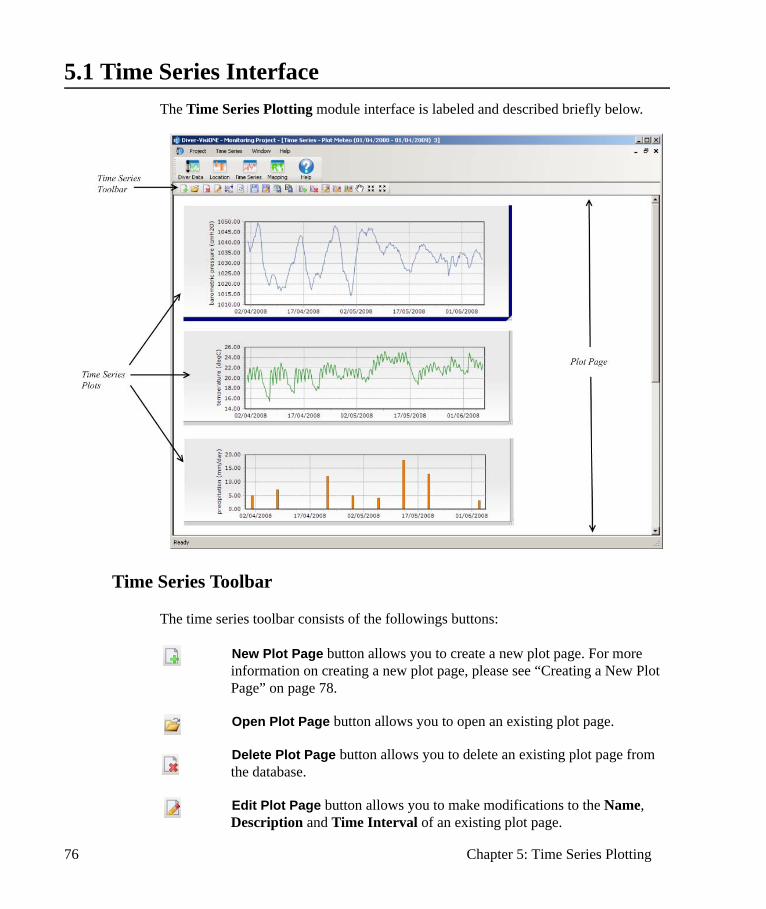
5.1 Time Series InterfaceThe Time Series Plotting module interface is labeled and described briefly below.
Time Series Toolbar
The time series toolbar consists of the followings buttons:
New Plot Page button allows you to create a new plot page. For more information on creating a new plot page, please see “Creating a New Plot Page” on page 78.
Open Plot Page button allows you to open an existing plot page.
Delete Plot Page button allows you to delete an existing plot page from the database.
Edit Plot Page button allows you to make modifications to the Name, Description and Time Interval of an existing plot page.
76 Chapter 5: Time Series Plotting
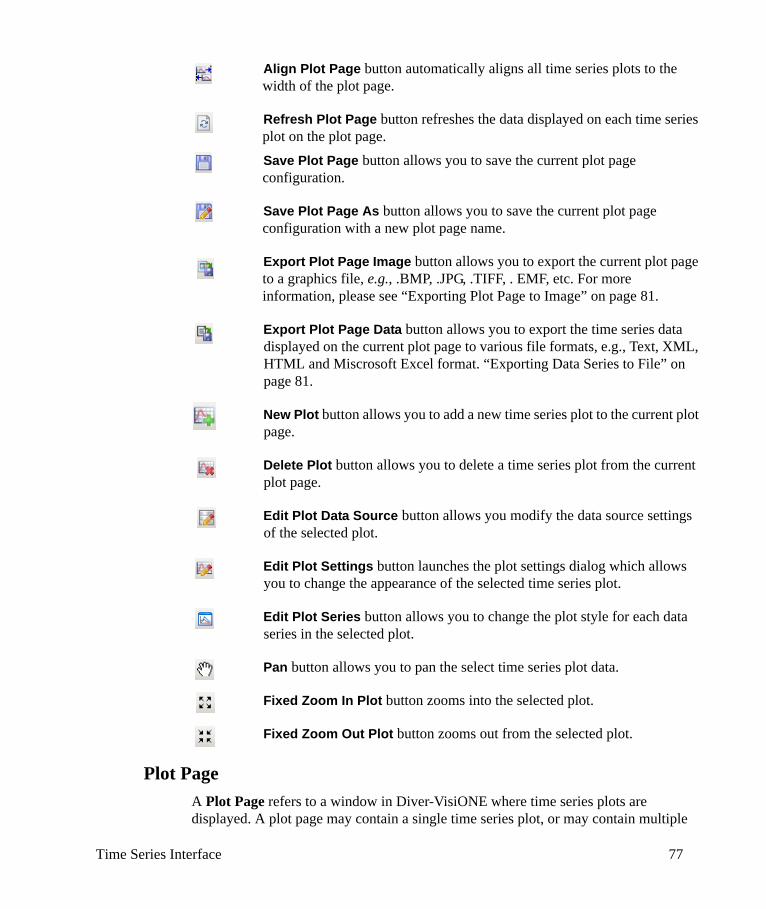
Align Plot Page button automatically aligns all time series plots to the width of the plot page.
Refresh Plot Page button refreshes the data displayed on each time series plot on the plot page.Save Plot Page button allows you to save the current plot page configuration.
Save Plot Page As button allows you to save the current plot page configuration with a new plot page name.
Export Plot Page Image button allows you to export the current plot page to a graphics file, e.g., .BMP, .JPG, .TIFF, . EMF, etc. For more information, please see “Exporting Plot Page to Image” on page 81.
Export Plot Page Data button allows you to export the time series data displayed on the current plot page to various file formats, e.g., Text, XML, HTML and Miscrosoft Excel format. “Exporting Data Series to File” on page 81.
New Plot button allows you to add a new time series plot to the current plot page.
Delete Plot button allows you to delete a time series plot from the current plot page.
Edit Plot Data Source button allows you modify the data source settings of the selected plot.
Edit Plot Settings button launches the plot settings dialog which allows you to change the appearance of the selected time series plot.
Edit Plot Series button allows you to change the plot style for each data series in the selected plot.
Pan button allows you to pan the select time series plot data.
Fixed Zoom In Plot button zooms into the selected plot.
Fixed Zoom Out Plot button zooms out from the selected plot.
Plot PageA Plot Page refers to a window in Diver-VisiONE where time series plots are displayed. A plot page may contain a single time series plot, or may contain multiple
Time Series Interface 77
related time series plots. Plot pages can be saved and stored in the Diver-VisiONE database or exported to various graphics file types for reporting purposes. For information on how to create a new plot page, please refer to “Creating a New Plot Page” on page 78.
Time Series PlotsMonitoring data can be analyzed graphically by adding time series plots to plot pages. Time series plots can consist of data series for one or more monitoring point parameters, e.g., water level, temperature, meteorological data, production data etc., for one or more monitoring points. The appearance and style of time series plots can be fully customized to the your liking. For information on adding a time series plot to a plot page, please see “Adding a New Plot” on page 79.
5.2 Creating a New Plot PageBefore you can create a new plot page, make sure the Time Series module is open (select the Time Series button in the Diver-VisiONE main toolbar). To create a new Plot Page, follow the steps below:
• Select Time Series > New, from the main menu or select the New Plot Page button from the Time Series toolbar. The New Plot Page dialog box will appear on screen.
• Enter the following data in the New Plot Page dialog box, and then click the [OK] button.
After creating a plot page, you will be immediately prompted with the New Plot dialog box to create a new time series plot. This dialog and the steps for creating a new plot are described in the following section.
Name Specify a unique name for the plot page.
Description Enter a description of the plot page. This field is optional.
Time Interval Specify the Start Time and End Time of the desired time interval. All data series displayed in time series plots added to the plot page will only include data points within this specified time interval.
78 Chapter 5: Time Series Plotting
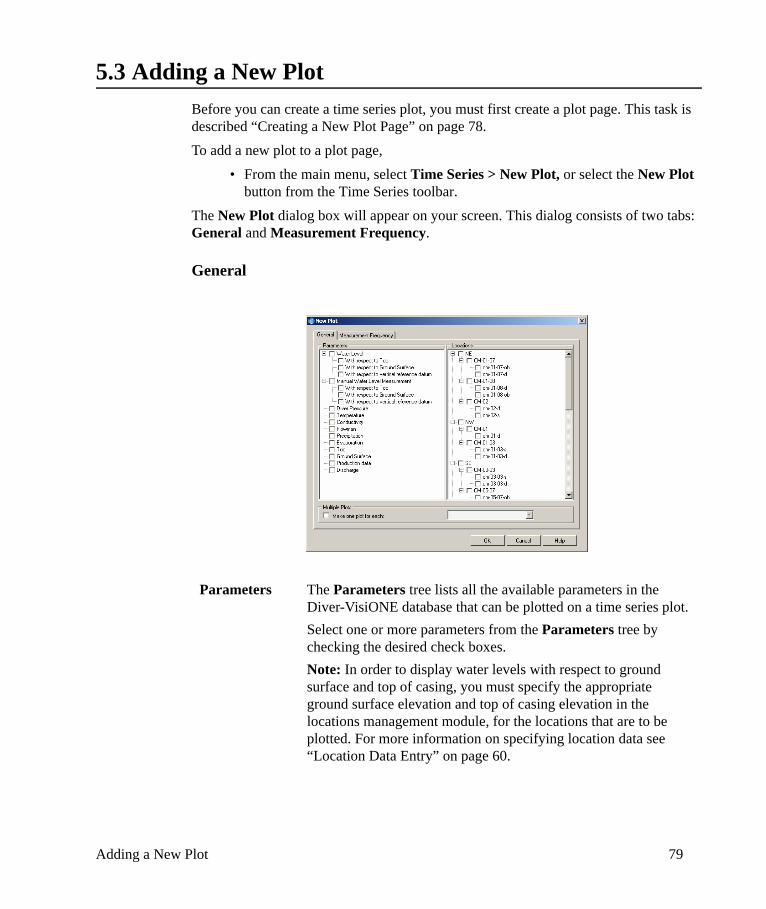
5.3 Adding a New Plot Before you can create a time series plot, you must first create a plot page. This task is described “Creating a New Plot Page” on page 78.To add a new plot to a plot page,
• From the main menu, select Time Series > New Plot, or select the New Plot button from the Time Series toolbar.
The New Plot dialog box will appear on your screen. This dialog consists of two tabs: General and Measurement Frequency.
General
Parameters The Parameters tree lists all the available parameters in the Diver-VisiONE database that can be plotted on a time series plot. Select one or more parameters from the Parameters tree by checking the desired check boxes.Note: In order to display water levels with respect to ground surface and top of casing, you must specify the appropriate ground surface elevation and top of casing elevation in the locations management module, for the locations that are to be plotted. For more information on specifying location data see “Location Data Entry” on page 60.
Adding a New Plot 79
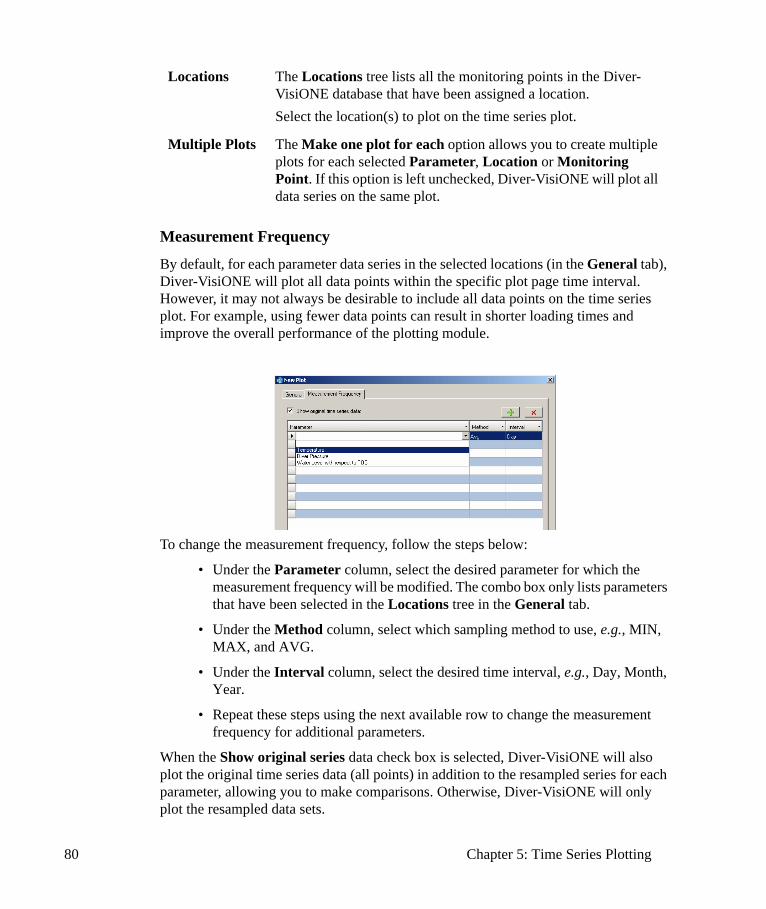
Measurement Frequency
By default, for each parameter data series in the selected locations (in the General tab), Diver-VisiONE will plot all data points within the specific plot page time interval. However, it may not always be desirable to include all data points on the time series plot. For example, using fewer data points can result in shorter loading times and improve the overall performance of the plotting module.
To change the measurement frequency, follow the steps below:
• Under the Parameter column, select the desired parameter for which the measurement frequency will be modified. The combo box only lists parameters that have been selected in the Locations tree in the General tab.
• Under the Method column, select which sampling method to use, e.g., MIN, MAX, and AVG.
• Under the Interval column, select the desired time interval, e.g., Day, Month, Year.
• Repeat these steps using the next available row to change the measurement frequency for additional parameters.
When the Show original series data check box is selected, Diver-VisiONE will also plot the original time series data (all points) in addition to the resampled series for each parameter, allowing you to make comparisons. Otherwise, Diver-VisiONE will only plot the resampled data sets.
Locations The Locations tree lists all the monitoring points in the Diver-VisiONE database that have been assigned a location.Select the location(s) to plot on the time series plot.
Multiple Plots The Make one plot for each option allows you to create multiple plots for each selected Parameter, Location or Monitoring Point. If this option is left unchecked, Diver-VisiONE will plot all data series on the same plot.
80 Chapter 5: Time Series Plotting
5.4 Exporting Plot Page to ImageTime series plots can be exported to common graphics files in various formats, including Bitmap, JPEG and GIF.To export a plot page to a graphics file,
• Select Time Series > Export Plot Page Image, from the Diver-VisiONE main menu, or select the Export Plot Page Image button from the time series toolbar.
• Define the file type Format and the Folder path
• Click the [OK] button to create the image file.
5.5 Exporting Data Series to FileData series displayed on time series plots can be exported to common files formats, including Text, XML and Excel. To export plot data series to a file,
• Select the plot that contains the data to be exported.
• Select the Export Plot Data button from the toolbar.
• In the Export Plot Page Data dialog, select from the following options
Format Select the desired export file format. The following file formats are currently supported:
• Bitmap• JPEG• EMF• TIFF• GIF• PNG
Folder Specify the desired destination folder.
Exporting Plot Page to Image 81
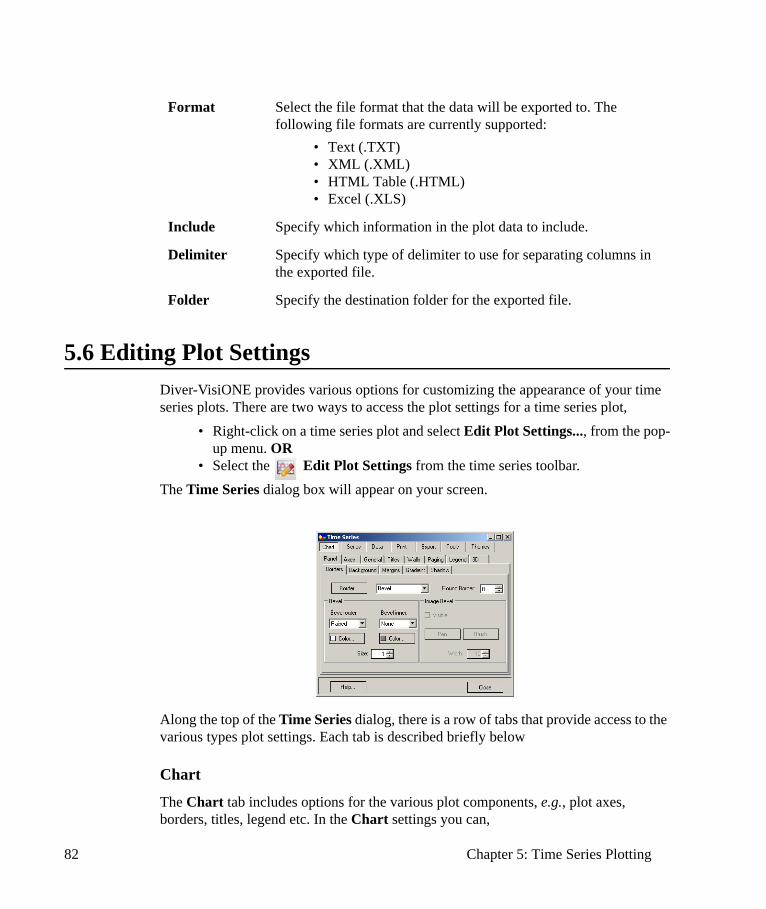
5.6 Editing Plot SettingsDiver-VisiONE provides various options for customizing the appearance of your time series plots. There are two ways to access the plot settings for a time series plot,
• Right-click on a time series plot and select Edit Plot Settings..., from the pop-up menu. OR
• Select the Edit Plot Settings from the time series toolbar.The Time Series dialog box will appear on your screen.
Along the top of the Time Series dialog, there is a row of tabs that provide access to the various types plot settings. Each tab is described briefly below
Chart
The Chart tab includes options for the various plot components, e.g., plot axes, borders, titles, legend etc. In the Chart settings you can,
Format Select the file format that the data will be exported to. The following file formats are currently supported:
• Text (.TXT)• XML (.XML)• HTML Table (.HTML)• Excel (.XLS)
Include Specify which information in the plot data to include.
Delimiter Specify which type of delimiter to use for separating columns in the exported file.
Folder Specify the destination folder for the exported file.
82 Chapter 5: Time Series Plotting
• Adjust the plot margins• Specify a background image using a graphics file• Modify the X and Y axis style settings• Specify text and style settings for various plot titles, e.g., Header, Sub Header,
Sub Footer and Footer• Customize the plot legend style and appearance• Give the plot a 3D-dimensional look
Series
The Series settings allow you to modify the style and appearance of each data series shown on the time series plot. In the series settings, you can
• Change the color, width, style of each data series • Show/hide point labels, and add shadow, gradient and color effects• Specify the numeric format of point values shown in labels• Show/hide data series in the plot legend
Data
The Data button allows you to view the raw data of a data series in a spreadsheet table. The data displayed in the table corresponds with the data series selected in the Series settings.
Printing
The Printing tab provides a print preview of the selected plot, and various options for configuring the page layout. From this tab, you can
• Modify the page orientation • Set the page margins• View a preview of the page layout• Select the desired printer• Configure the selected printer’s print settings• Send the plot to a printer
Export
The Export tab allows you to export time series data to a file. The plot image can be exported to various graphics files, including BMP, JPEG and GIF. You can also export a data series in the plot to a delimited text, html, Excel or XML file.
Tools
the Tools tab provides additional options for customizing your time series plots. When selected, click the [ + ] button to load the Chart Tools Gallery. The Chart Tools Gallery lists various tools for enhancing your time series plot and adding advanced
Editing Plot Settings 83
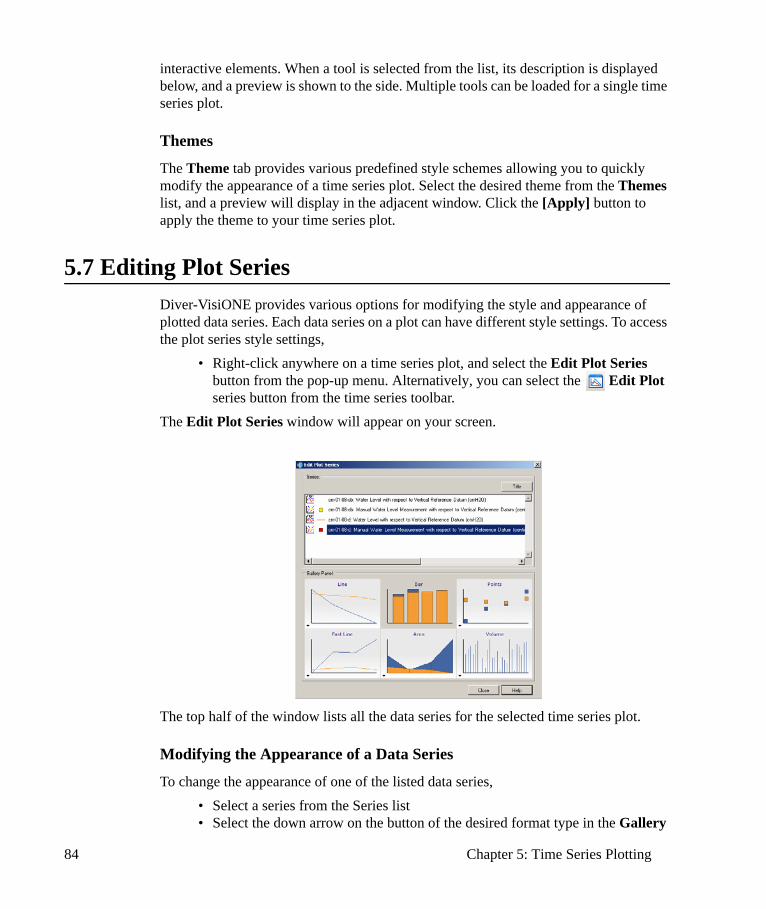
interactive elements. When a tool is selected from the list, its description is displayed below, and a preview is shown to the side. Multiple tools can be loaded for a single time series plot.
Themes
The Theme tab provides various predefined style schemes allowing you to quickly modify the appearance of a time series plot. Select the desired theme from the Themes list, and a preview will display in the adjacent window. Click the [Apply] button to apply the theme to your time series plot.
5.7 Editing Plot SeriesDiver-VisiONE provides various options for modifying the style and appearance of plotted data series. Each data series on a plot can have different style settings. To access the plot series style settings,
• Right-click anywhere on a time series plot, and select the Edit Plot Series button from the pop-up menu. Alternatively, you can select the Edit Plot series button from the time series toolbar.
The Edit Plot Series window will appear on your screen.
The top half of the window lists all the data series for the selected time series plot.
Modifying the Appearance of a Data Series
To change the appearance of one of the listed data series,• Select a series from the Series list• Select the down arrow on the button of the desired format type in the Gallery
84 Chapter 5: Time Series Plotting
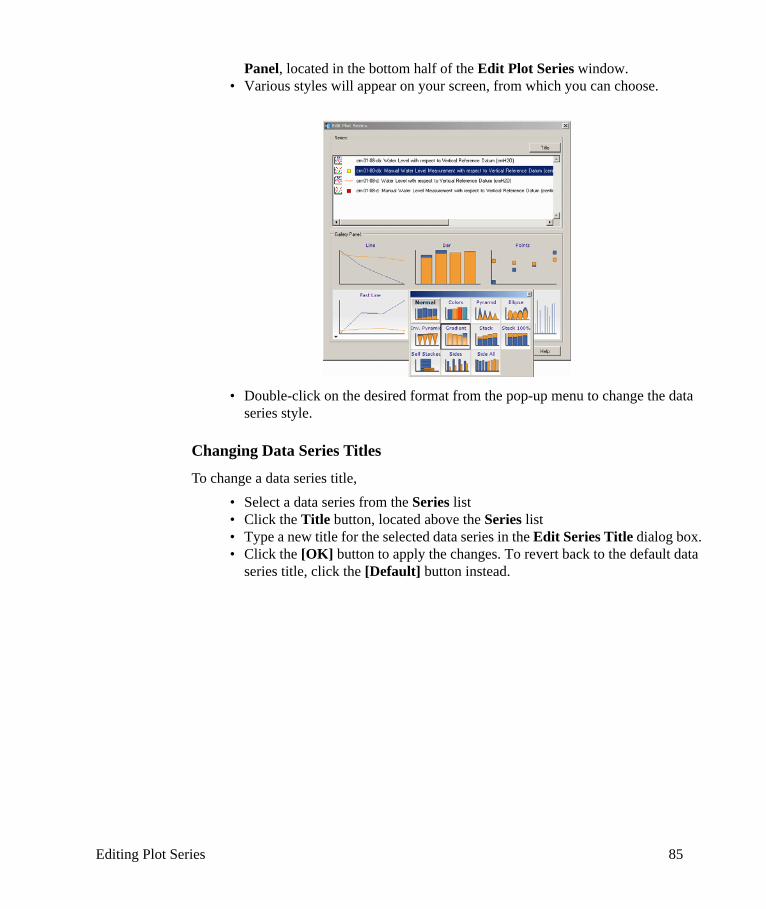
Panel, located in the bottom half of the Edit Plot Series window. • Various styles will appear on your screen, from which you can choose.
• Double-click on the desired format from the pop-up menu to change the data series style.
Changing Data Series Titles
To change a data series title, • Select a data series from the Series list• Click the Title button, located above the Series list• Type a new title for the selected data series in the Edit Series Title dialog box.• Click the [OK] button to apply the changes. To revert back to the default data
series title, click the [Default] button instead.
Editing Plot Series 85

86 Chapter 5: Time Series Plotting
6Mapping
The Diver-VisiONE mapping module, powered by ESRI ArcObjects technology, provides various tools for creating detailed maps displaying project data and imported GIS map layers.
The Mapping module can be launched by selecting the Mapping button from the Diver-VisiONE toolbar.
This chapter covers the following topics:
• Creating a New Map Document• Adding a Location Layer• Exporting Layers to KML/KMZ format• Changing Symbol Properties• Showing Map Layer Labels• Exporting a Map to Image• Layout View
87
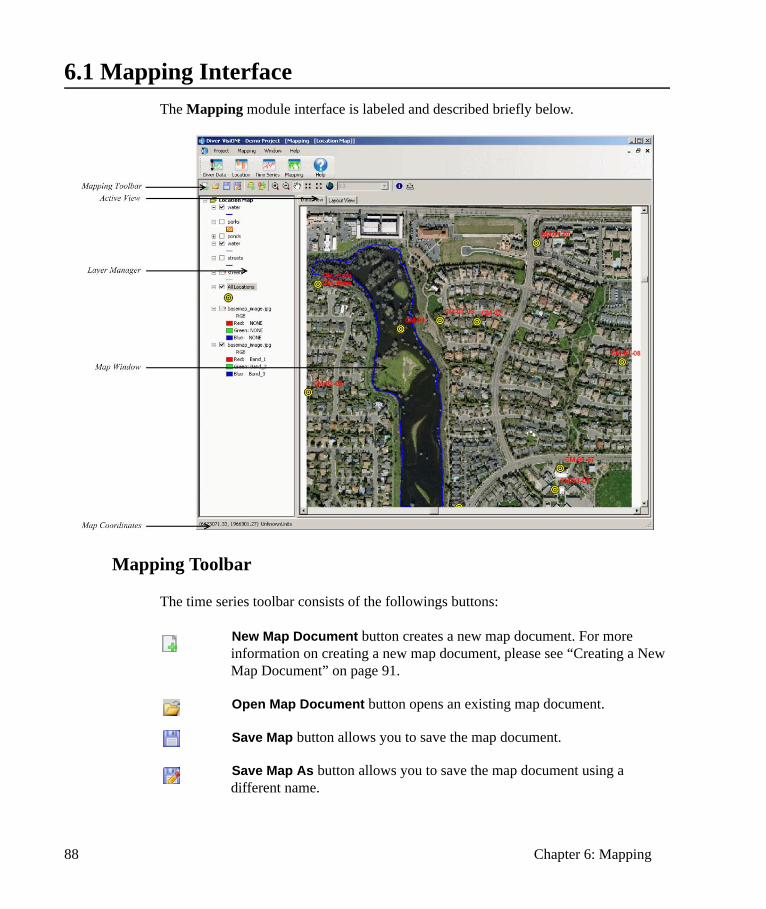
6.1 Mapping InterfaceThe Mapping module interface is labeled and described briefly below.
Mapping Toolbar
The time series toolbar consists of the followings buttons:
New Map Document button creates a new map document. For more information on creating a new map document, please see “Creating a New Map Document” on page 91.
Open Map Document button opens an existing map document.
Save Map button allows you to save the map document.
Save Map As button allows you to save the map document using a different name.
88 Chapter 6: Mapping
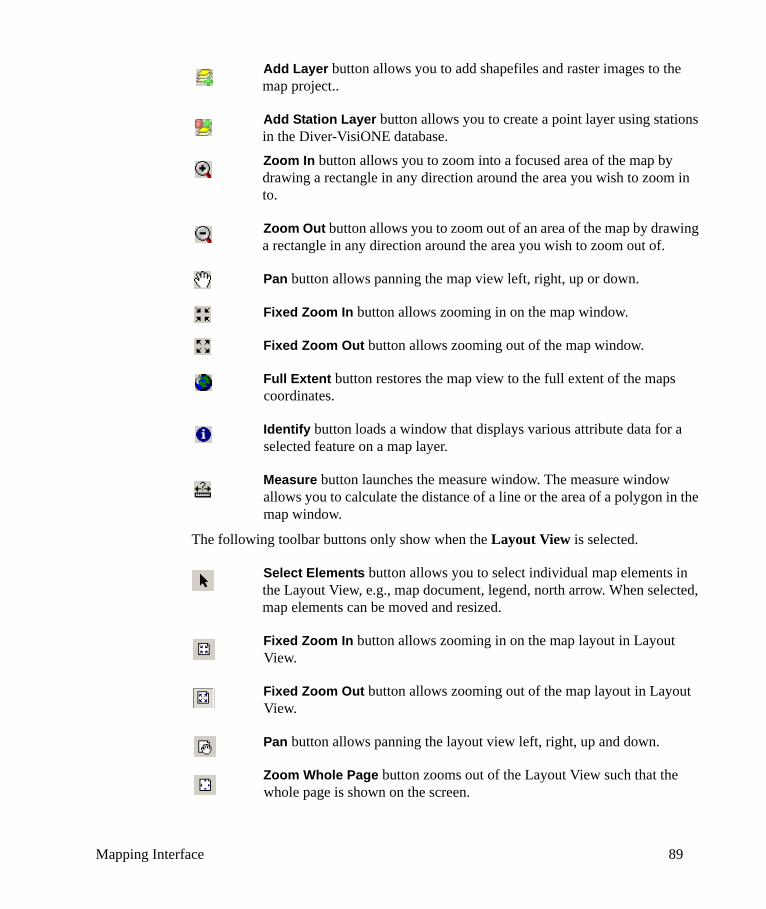
Add Layer button allows you to add shapefiles and raster images to the map project..
Add Station Layer button allows you to create a point layer using stations in the Diver-VisiONE database.Zoom In button allows you to zoom into a focused area of the map by drawing a rectangle in any direction around the area you wish to zoom in to.
Zoom Out button allows you to zoom out of an area of the map by drawing a rectangle in any direction around the area you wish to zoom out of.
Pan button allows panning the map view left, right, up or down.
Fixed Zoom In button allows zooming in on the map window.
Fixed Zoom Out button allows zooming out of the map window.
Full Extent button restores the map view to the full extent of the maps coordinates.
Identify button loads a window that displays various attribute data for a selected feature on a map layer.
Measure button launches the measure window. The measure window allows you to calculate the distance of a line or the area of a polygon in the map window.
The following toolbar buttons only show when the Layout View is selected.
Select Elements button allows you to select individual map elements in the Layout View, e.g., map document, legend, north arrow. When selected, map elements can be moved and resized.
Fixed Zoom In button allows zooming in on the map layout in Layout View.
Fixed Zoom Out button allows zooming out of the map layout in Layout View.
Pan button allows panning the layout view left, right, up and down.
Zoom Whole Page button zooms out of the Layout View such that the whole page is shown on the screen.
Mapping Interface 89
Add Elements button allows you to add various map elements to the Layout View, e.g., map legend, picture, scale bar and north arrow. For more information on adding map elements please see “Adding Map Elements” on page 97.
Active View There are two types of views in the Mapping module: Data View and Layout View. The Data View is an interactive view that allows you to zoom in, zoom out, pan and view attribute data for active map layers in the map document. The Layout View allows you to prepare your map document for reporting and printing. The layout view provides additional tools for adding various map elements, including a north arrow, scale bar, legend and images.
Layer ManagerThe Layer Manager lists all map layers in the current map document, and provides layer visibility and layer ordering controls.
Layer Visibility
To show or hide a layer in the map window, select/unselect the check box adjacent to the layer name.
Layer Ordering
All visible map layers in the map window appear according to the order in which they are listed in the Layer Manager, i.e., a layer will appear on top of the layer listed below it, in the map window. To rearrange the layers in the Layer Manager, click and drag the layer to the desired location using the mouse.
Renaming a Layer
To rename a layer, click once on the layer name and wait momentarily. A box will appear around the layer name, and the text will become editable. Once the changes have been made, click anywhere outside of the box to save the changes.
Map WindowThe Map Window is an interactive window that displays all active map layers in the current map document.
90 Chapter 6: Mapping
6.2 Creating a New Map DocumentTo create a new map document,
• Select Mapping > New... from the main menu (or select the New Map Document button from the toolbar).
• In the Map Document dialog, specify a unique name for the map document. • Click the [Ok] button.
When a new map document is created, a new folder is created in the data repository where the map document project file is located (.all map related files are saved, e.g., location map layer shapefiles.
Setting the Map Document Projection System
The projection system of the first map layer loaded into a map document is used to define the map document’s projection system. All subsequent map layers loaded into the map document will be automatically geotransformed into the map document’s projection system, if the map layer projection system is different and if the geotransformation exists in Diver-VisiONE. As such, it is important that you give consideration to the first map layer loaded into the map document, as it’s projection system will be used to define the projection system of the map document. Once the map document’s projection system has been defined by loading the first layer, it cannot be modified.
Note: In order for Diver-VisiONE to perform a geotransformation on a map layer, the appropriate projection system information must exist with the source data. For example, when importing a raster image, the associated world file must exist in the same folder as the raster image. When importing a shapefile, the corresponding .PRJ file must exist in the same location as the .SHP file. When loading location layers (from the Diver-VisiONE database), ensure that the appropriate projection system is defined in the Diver-VisiONE project settings.
6.3 Adding a Location LayerA Location Layer is a map layer containing points at X-Y locations of selected locations in the database. When a location layer is added to the map document, a points shapefile is created and saved to the map document folder in the Diver-VisiONE data repository and then added to the layer manager in the map document. Monitoring data for each location can be saved to the point shapefile as attribute and then displayed on the map at each location using the label renderer.
To add a new location layer to the map document,
• Select Mapping > Add Layer from the main menu (or select the Add Layer
Creating a New Map Document 91
button from the toolbar).• Specify the desired options for each setting in the Load Station Layer dialog
box.
6.4 Adding a Map LayerMap layers can be imported into the map document from ESRI Shapefiles, e.g., points, polygons and polylines, and raster files such as .BMP, .JPG and .TIFF. Once the map layer is opened, it will appear in the Layer Manager, and is automatically displayed in the Map Window.
To add a map layer to the map document,
Name of Layer
Enter a unique name for the layer. This name will be used to identify the layer in the Layer Manager.
Filter The filter combo box allows you to only include monitoring points assigned to a specified aquifer when saving attribute data to the map layer. This option is only used when the Parameters check box is selected (see below).
Select Locations
From the location tree, select the locations to include in the map layer.
Parameters Select the Parameters check box to save attribute data to the map layer. When this option is selected, select the method for determining the attribute values at each location. You can choose from two options:
• Single Point: Save attributes measured at a specific date and time. If the specified date and time does not exist in the location time series data set, no data will be saved to the map layer.
• Interval: Specify a time interval and an aggregate function. The aggregate function is used to calculate a single attribute value from the data series in the specified time interval. For example, if the averaging aggregate function is selected, Diver-VisiONE will calculate the average value of the data series in the specified time interval, and save this value to the map layer, for each selected parameter.
92 Chapter 6: Mapping
• From the main menu, select Mapping > Add Layer... (or select the Add Layer button from the Mapping toolbar)
• In Add Layer dialog box, navigate to the folder and select the desired file. Diver-VisiONE currently supports importing map layers from the following file types:
• Shapefiles (.SHP)• AutoCAD (.DXF)• TIFF (.TIFF)• Bitmap (.BMP)• JPEG (.JPEG)• GIF (.GIF)• MrSID (.SID)
• Once the file is selected, click the [Open] button to load the file into the map document.
A note about importing raster images
Since raster images do not contain information on the site’s projection system or length units, these details must be manually added using georeferencing. Georeferencing assigns points with known coordinates to the image; the image is then scaled and the map extents are calculated. This information is saved in a corresponding georeference tag file and is read by Diver-VisiONE when the image is imported. In order for Diver-VisiONE to read this information, the georeference tag file must be located in the same folder as the raster image.
6.5 Exporting Layers to KML/KMZ formatLocation layers, and map layers that have been loaded into the map document (e.g., point, polygon and polyline layers) can be exported to Keyhole Markup Language (.KML) file format for use in other GIS applications, e.g., Google Earth, Google Maps. Map layers can also be exported to KML-zipped (.KMZ) format, a compressed version of a KML file. The file size of a KMZ file will generally be smaller than the equivalent KML file. To export a map layer to .KML/.KMZ format,
• In the Layer Manager, right-click on the desired map layer and select Export to KML... from the pop-up menu.
• In the Export to Keyhole Markup Language dialog box, navigate to the desired destination folder and specify a file name.
• Select the desired file format from the Save As Type: combo box, and then select the [Save] button.
Exporting Layers to KML/KMZ format 93
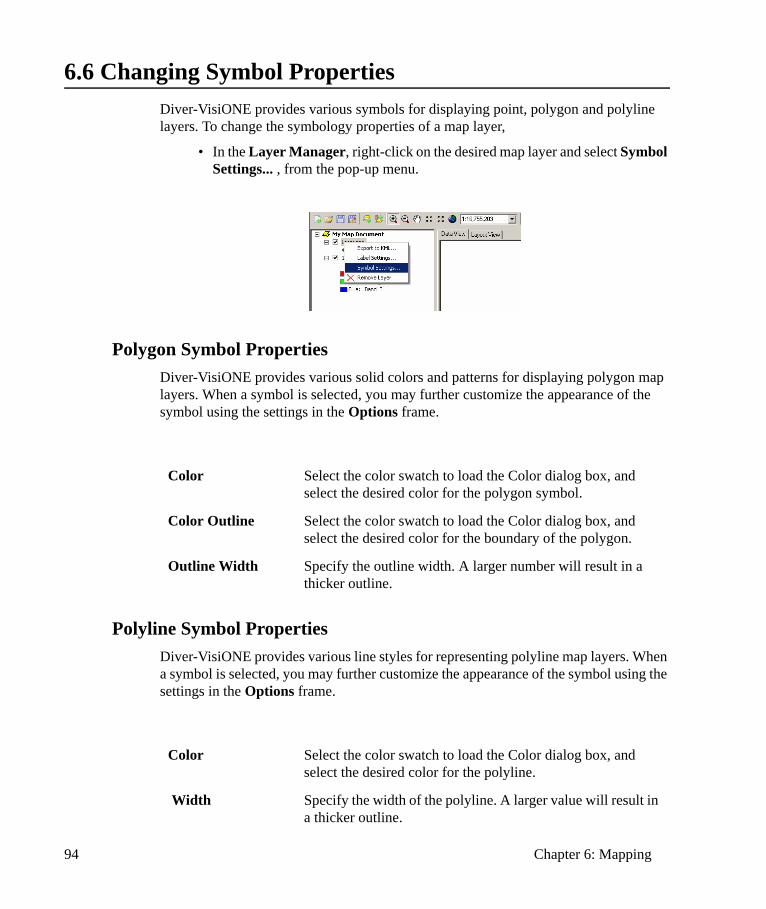
6.6 Changing Symbol PropertiesDiver-VisiONE provides various symbols for displaying point, polygon and polyline layers. To change the symbology properties of a map layer,
• In the Layer Manager, right-click on the desired map layer and select Symbol Settings... , from the pop-up menu.
Polygon Symbol PropertiesDiver-VisiONE provides various solid colors and patterns for displaying polygon map layers. When a symbol is selected, you may further customize the appearance of the symbol using the settings in the Options frame.
Polyline Symbol PropertiesDiver-VisiONE provides various line styles for representing polyline map layers. When a symbol is selected, you may further customize the appearance of the symbol using the settings in the Options frame.
Color Select the color swatch to load the Color dialog box, and select the desired color for the polygon symbol.
Color Outline Select the color swatch to load the Color dialog box, and select the desired color for the boundary of the polygon.
Outline Width Specify the outline width. A larger number will result in a thicker outline.
Color Select the color swatch to load the Color dialog box, and select the desired color for the polyline.
Width Specify the width of the polyline. A larger value will result in a thicker outline.
94 Chapter 6: Mapping
Point Symbol PropertiesDiver-VisiONE provides various symbols for representing point map layers. When a symbol is selected, you may further customize the appearance of the symbol using the settings in the Options frame.
6.7 Showing Map Layer LabelsMap layer attribute data can be displayed in the map window using text labels. To enable labels for a map layer,
• In the Layer Manager, right-click on the desired map layer and select Layer Properties... from the pop-up menu.
• From the Label Settings dialog box, select the Label Layer check box to show enable labels.
• Select the desired attribute field from the Label Field combo box. This combo box lists all the attributes contained in the map layer.
• Specify the desired Label Font options, e.g., the font, size, style and color. • Click the [OK] button to save the label properties.
6.8 Opening a Map DocumentTo open an existing map document,
• Select Mapping > Open..., from the main menu• The Open a Map Document dialog box will appear on your screen. Navigate
to the folder where the map document’s *.MXD file is located. By default, this file should be located in the map project folder, in the Diver-VisiONE data repository.
• Once the file is selected, click the [Open] button. Diver-VisiONE will attempt to load all map layers in the map document. If any of the source files belonging to the map layers have been moved or deleted from their original locations on your computer, Diver-VisiONE will not be able to display the layers. In this case, you will need to reload the map layers into your map document (see “Adding a Map Layer” on page 92).
Color Select the color swatch to load the Color dialog box, and select the desired color for the point symbol.
Size Set the size of the point symbols. A larger value will result in a larger point symbol.
Angle Rotate the symbol by specifying an angle (0 - 360).
Showing Map Layer Labels 95
6.9 Exporting a Map to ImageThe current view of a map document can be exported to various Raster image files, including:
• TIFF (.TIFF)• Bitmap (.BMP)• JPEG (.JPG)• GIF (.GIF)
To export the current view of a map document to a Raster image file,
• From the main menu, select Mapping > Export Map to Image... • In the Export Map to Image dialog box, specify the desired Export Settings, and
then click the [Export] button.
6.10 Layout ViewPrinting options can be accessed in the Map Window by selecting the Layout View tab. The Layout View provides a formatted view of the map document and a preview of how the map document will appear when printed. Various map elements, e.g., north arrow, map legend, etc., can be added to the map document in the Layout View.
To access the Layout View, click on the Layout View tab at the top of the Map Window.
World File Select this option to create a world file for the exported Raster image. A world file contains georeferencing information and allows you to import the image into other GIS applications.
Dpi The Dots Per Inch of the exported Raster image. A higher Dpi value will result in a higher resolution image and a larger file. When this value is modified, the Image Height and Image width values are automatically calculated to reflect the new Dpi value.
Output File Specify the destination folder for the exported Raster image. By default this location is set to the project’s data repository. Click the [...] button to specify a different export location.
96 Chapter 6: Mapping
6.10.1 Adding Map Elements
Adding a North ArrowTo add a north arrow to the map document,
• Select the North Arrow button from the mapping toolbar. • In the map window, specify the size and location of the north arrow by drawing
a rectangle using the mouse.• The North Arrow Selector window will appear on your screen. Diver-
VisiONE provides various styles of North Arrows to chose from. Select the desired North Arrow style.
• You may also further customize the appearance of the North Arrow by setting the Color, Size and Angle (rotation) of the North Arrow.
• Click the [OK] button to show the north arrow on the map layout. Use the selector tool from the mapping toolbar to move and resize the north arrow as desired.
Adding a Scale Bar To add a scale bar to the map document,
• Select the Scale Bar button from the mapping toolbar. • In the map window, specify the size and location of the scale by drawing a
rectangle using the mouse.• The Scale Bar Selector window will appear on your screen. Diver-VisiONE
provides various styles of Scale Bars to chose from. Select the desired Scale Bar style.
• Click the [OK] button to show the north arrow on the map layout. Use the Select Elements tool from the mapping toolbar to move and resize the north arrow as desired.
Adding a LegendTo add a legend to the map document,
• Select the Add Legend button from the mapping toolbar. • In the map window, specify the size and location of the legend by drawing a
rectangle using the mouse. The legend will automatically generate displaying all layers currently in the Layer Manager.
• Use the Select Elements tool from the mapping toolbar to move and resize the north arrow as desired.
Adding a PictureTo add a picture to the map document,
Layout View 97
• Select the Add Picture button from the mapping toolbar. • In the map window, specify the size and location of the picture by drawing a
rectangle using the mouse. • An Open dialog box will appear on your screen where you can select the
desired graphics file to add to the map document. The following file types can be imported: .TIFF, .BMP, .GIF, .JPEG
• Once the picture is added to the map document, use the Select Elements tool from the mapping toolbar to move and resize the picture as desired.
6.10.2 Printing Map Documents
Page Setup optionsTo access the page setup options,
• In the Layout View, right-click anywhere within the Map Window, and select Page Setup... from the pop-up menu.
• In the Page Setup dialog, various options are available including the page size and source, orientation and margins.
• Click the [Ok] button to apply the page settings.
Print PreviewTo access the print preview window
• In the Layout View, right-click anywhere within the Map Window, and select Print Preview ... from the pop-up menu.
• The Print Preview window will appear on your screen, displaying a preview of the map document using the page settings specified in the Page Setup options (see above).
The Print Preview window contains a toolbar that allows you to modify the view settings. The following buttons are available:
• Use the button to print directly from the Print Preview window.• Use the button to zoom in and zoom out of the Print Preview window. • Use the button to view just one page • Use the button to view two pages at once• Use the button to view three pages at once• Use the button to view four pages at once• Use the button to view six pages at once• You can scroll through the pages, using the Page vertical scroll bars, located in
the top-right corner of the print preview window.
98 Chapter 6: Mapping
PrintTo print the map document layout,
• In the Layout View, right-click anywhere within the Map Window, and select Print ... from the pop-up menu.
• The Window’s Print dialog will appear on your screen, where you can modify various print setting before sending to the printer.
Layout View 99

100 Chapter 6: Mapping
Index 101
IndexAActual Data 41Additional Information 17Address 62Apply to Template 70Assign Monitoring Points to Locations 65
BBaro-Diver 51Barometer Monitoring Point 27Barometric Compensation 50
Results 53
CCable Length
User Defined 27Casing 63, 64Casing Material 64Clipboard 31Column Mapping 68Communication 47Compensated 30Computer Time 25CTD-Diver
Calibration 41Restore Factory Settings 42View Calibration History 43
DData Entry Tabs 59Data Object 67Data Repository 17Data Validation 68Database Backup 19Database Server Settings 15Default Export Settings 24Delete Project 18Delimiters 67Discharge 28Distributed Transaction Coordinator Service (MSDTC) 6Diver
Downloading Data 40Programming 32Reading 32Stopping 40
Diver Data 10Interface 22Project Settings 24
Diver Data ImportDiver-Office 44Field Devices 46LDM Database 44MON/DAT files 43
Diver Settings 30
Divers 3Dpi 96Drilling 62Drilling Method 62
EEdit Plot Series 84Edit Project Settings 20Elevation 61Evaporation 28Export
Data Series 81Diver Data 49Map Document 96Plot Page 81
Export on Download 25
FFeatures 1Field Devices 4File Name Format 25Filling 62Filling Type 63Filling Volume 63Future Start 39
GGround Surface 61
HHardware Requirements 3
IImmediate Start 39Import
Location Data 66Installation 3Installation Details 61Interface Cables 4
KKML 93KMZ 93
LLayer Manager 90Layer Ordering 90Layer Visibility 90Licensing 6List Editor 70Lithology 65Location 12, 59Location Data Entry 60
102 Index
Location LayerCreate 91
Location Management 10Toolbar 56User Interface 56
Location Profile 58Update 69
Location Reports 72Detailed 73Summary 73
Location Table 57Location Type 27
MMain Window 9Manual Measurements 28Map Document
New 91Open 95Print 98Print Preview 98Projection System 91
Map Elements 97Map Labels 95Map Window 90Mapping 11Mapping Module
Interface 88Toolbar 88
Measurement Frequency 80Modules 10Monitoring Network 12, 58, 61Monitoring Point 12, 26Monitoring Point List 57Monitoring Point Tree 23Multiple Plots 80
NNew Project 16North Arrow 97Notes 65
OOnline Help 13Open Project 18Output File 96
PPartly Compensated 30Plot Page 77
New 78Plot Settings 32, 82Precipitation 28
Production Data 28Project 12Project Folder 24Project Time Settings 25
QQA/QC Log 40
RReading Units 3Regular Monitoring Point 27Restore Database 20
SScale Bar 97Screen 64Shapefiles
Import 92Smart Future Start (SFS) 39SQL Server 6Station Photo 62Summer Time 25Supported Devices 3Symbol Properties 94
TTarget Field 68Time Series Data 30Time Series Module
Interface 76Toolbar 76
Time Series Plot 79Time Series Plotting 11Top of Casing 64
UUncompensated 30Uninstalling 5Units 47User Calibration 42User Defined
Calculated 27User Permissions 8User-Defined Pumping Tests 47
VVertical Reference Datum 26
WWinter Time 25Workflow 7
Recommended