Science Journal of Analytical Chemistry 2018; 6(2): 12-20
http://www.sciencepublishinggroup.com/j/sjac
doi: 10.11648/j.sjac.20180602.11
ISSN: 2376-8045 (Print); ISSN: 2376-8053 (Online)
Determination the Effective of Grain Size on Gold Recovery by Integral of Sieve Analysis and Atomic Absorption Spectroscopy Methods
Amar Osman Ali Salih1, *
, Badawi Ahmed Zakria1, Ibrahim Mohammed Salah
1,
MohamedIdris Taha1, Bashir Algili Bashir Mohammed
2
1Ministry of Higher Education and Scientific Research, Chemistry Department, Central Lab, Khartoum, Sudan 2Geology Department, Faculty of Petroleum and Minerals, Alneelain University, Al Khurtum, Sudan
Email address:
*Corresponding author
To cite this article: Amar Osman Ali Salih, Badawi Ahmed Zakria, Ibrahim Mohammed Salah, Mohamed Idris Taha, Bashir Algili Bashir Mohammed.
Determination the Effective of Grain Size on Gold Recovery by Integral of Sieve Analysis and Atomic Absorption Spectroscopy Methods.
Science Journal of Analytical Chemistry. Vol. 6, No. 2, 2018, pp. 12-20. doi: 10.11648/j.sjac.20180602.11
Received: June 3, 2018; Accepted: June 22, 2018; Published: July 31, 2018
Abstract: The sieve analysis and atomic Absorption methods were applied for 21collected samples around Atbara region -
River Nile State- Sudan. Three types of grinder were used in this study they are (1) A grinder (2) B grinder and (3) mill size to
given us the general trend of gold concentrate with preferable grain size in area of case study. The gold assay result for
different grain size within same sample reflect direct relationship between gold concentrate and grain size which gold
increasing with finer grain size. he grain size equal or less than 0.075mm is the preferable size to recovery most gold from
original material, and there is a difference in types of mills and efficiency, For each mill grinding time for each sample varies
from the mill to another and it is reliable Depending on the test rate of the sieves in the sieves and definitely affects the reading
of the concentrations of samples and therefore control the rate of raw inside is known and the percentage of milling as well as
all depends on the quality control of the mining plants and reduces errors. From this study we conclude the sieve analysis
isgood method to evaluate quality of various grinders.
Keywords: Sieve Analysis, Grinding, Grain Size, Quantities, Sediments, Concentrations, Flame (AAS)
1. Introduction
The sieve analysis, commonly known as the gradation test,
is a basic essential test for all aggregate technicians. The
sieve analysis determines the gradation (the distribution of
aggregate particles, by size within a given sample) in order to
determine compliance with design, production control
requirements, and verification specifications. The gradation
data may be used to calculate relationships between various
aggregate or aggregate blends, to check compliance with
such blends, and to predict trends during production by
plotting gradation curves graphically, to name just a few
uses. Used in conjunction with other tests, the sieve analysis
is a very good quality control and quality acceptance tool [1].
Size is a fundamental property of sediment particles. It
affects their entrainment, transport and deposition, and
therefore provides important clues to the sediment
provenance, transport history and depositional conditions [2].
Heavy metal pollution, owing to its permanent existence and
biological enrichment, has long been an important subject in
the field of international environmental science. As a result of
complex physical, chemical and biological processes, a major
fraction of trace metals is found to be associated with water
body sediments. Sediments are multi-phase solids containing
silicates, carbonates, hydroxides/oxides, sulfates and organic
substances as major components [3]. The essential factors
influencing the heavy metal contents in sediments include the
physical and chemical properties (grain size, surface to
volume ratio, heavy metal contents of the main geochemistry
phase), in which grain size is a main control parameters.
There is a theory that finer sediments contain more metals
13 Amar Osman Ali Salih et al.: Determination the Effective of Grain Size on Gold Recovery by
Integral of Sieve Analysis and Atomic Absorption Spectroscopy Methods
than coarser ones. The main reason is that smaller grain size
particles have a larger surface-to-volume ratio [4]. However,
some studies have indicated that coarser particles show
similar or even higher heavy metal concentrations than finer
ones and the presence of coarser particles are possibly
responsible for higher metal content in the coarser size
fractions [5].
2. Literature Review
Atomic Absorption Spectrometry (AAS) is a technique for
measuring quantities of chemical elements present in
environmental samples by measuring the absorbed radiation
by the chemical element of interest. This is done by reading
the spectra produced when the sample is excited by radiation.
The atoms absorb ultraviolet or visible light and make
transitions to higher energy levels. Atomic absorption
methods measure the amount of energy in the form of
photons of light that are absorbed by the sample, the
concentration is calculated based on the Beer-Lambert law.
In analytical chemistry, AAS is a technique used mostly for
determining the concentration of a particular metal element
within a sample. AAS can be used to analyze the
concentration of over 62 different metals in a solution.
2.1. Flame (AAS)
Flame atomic absorption methods are referred to as direct
aspiration determinations. They are normally completed as
single element analyses and are relatively free of
interelement spectral interferences. For some elements, the
temperature or type of flame used is critical. If flame and
analytical conditions are not properly used, chemical and
ionization interferences can occur. Different flames can be
achieved using different mixtures of gases, depending on the
desired temperature and burning velocity. Some elements can
only be converted to atoms at high temperatures. Even at
high temperatures, if excess oxygen is present, some metals
form oxides that do not redissociate into atoms. To inhibit
their formation, conditions of the flame may be modified to
achieve a reducing, no oxidizing flame[6].
2.2. GrainSize
Particle or grain size is a fundamental attribute or physical
property of particulate samples or sediments and sedimentary
rocks7.
Much can be said from analyzing not only the size of
clastic or detrital (inorganic), bioclastic (organic), or
chemical particles but also from the overall size distribution,
size fraction percentages, textural maturity of the sediment or
sorting, surface texture attributes of a particle, and
sphericity/angularity and shape of a particle[7]. Several
sediment, soil, or material properties are directly influenced
by the size of its particles, as well as their shape (form,
roundness and surface texture or the grains) and fabric
(grain-to-grain interrelation and grain orientation), such as
texture and appearance, density, porosity, and permeability,
The size of particles is directly dependent on the type of
environmental setting, transporting agent, length and time
during transport, and depositional conditions, and hence it
possesses significant utility as an environmental proxy[9], as
well as grinding degree on production process and for
laboratory analytical technique.
3. Materials and Methods
3.1. Sample Collection and Size Fractionation
Analyzed samples were collected from Sudan _River Nile
state (Atbara region) from different depths, Transferred to the
laboratory where they were dried at oven temperature
(110±5) Co, the samples were grinded by different types of
grinder machine and fractionated by nest of sieves then the
atomic absorption methods applied for various samples with
different grain sizeto determining the relationship between
grain size and gold contents.
3.2. Method
Preparation of standard solutions:
3.2.1. Stock Solutions
100 ppm purity metallic goldprepare standard gold (purity:
99.999%) in 100ml volumetric flask.
3.2.2. Standard Gold Solutions
Prepare standard gold solutions by serial dilution of the
stock solution (100 ppm) in 100ml volumetric flask,
preparation ofworking standard solutioninDibkfor calibration
prepare emibksolution for making instrument for zero
reading.
3.2.3. Procedure
1. Weigh 5gm of powdered sediment/soil samples in a
graduated 500 ml Pyrex or Borosilicate glass beaker.
2. Add 40 ml aqua regia to the above weighed sample in a
fume cupboard.
3. Leave the beaker for about 45 minutes to 60 minutes.
4. Place the beaker on a low to medium heat hot plate and
boil gently for about 1hour with frequent gentle stirring
for every half an hour.
5. Reduce volume to about 4-5ml, remove from the hot
plate and cool it.
6. Transfer the entire mixture into 100 ml volumetric
flask with water and makeup the volume to the half.
7. Add 5ml MIBK into it and shake gently for about 50 to
60 minutes.
8. Remove the stopper full the flask to mark with water,
separate the organic layer and reading in AAS.
9. Similarly process at least two numbers of CRMs/
inhouse standards in each of 20 samples.
10. In very batch of 20 samples, repeat at least one sample,
following all the steps from 1 to 10.
3.2.4. Calibration & Measurement
Transfer the mixedCalibration standard solutions into the
vials and arrange them in their respective positionsof the
Science Journal of Analytical Chemistry 2018; 6(2): 12-20 14
standards. Transfer sample solutions also into vials and
arrange them frompositions, Start the calibration by clicking
call Zero and if calibration graph islinear then continue
analysis of the measurement of processed samples[10].
3.3. Method of Sieve
This test of sieve is performed to determine the percentage
of different grain sizes contained within a sample. The
mechanical or sieve analysis was performed to determine the
distribution of the coarser, larger-sized particles.
3.3.1. Equipment
Balance, Set of sieves, Cleaning brush, Sieve shaker
3.3.2. Test Procedure
Sieve Analysis:
(1) Write down the weight of each sieve as well as the
bottom pan to be used in the analysis.
(2) Record the weight of the given dry soil sample.
(3) Make sure that all the sieves are clean, and assemble
them in the ascending order of sieve numbers (#4
sieves at top and #200 sieves at bottom). Place the pan
below #200 sieves. Carefully pour the soil sample into
the top sieve and place the cap over it.
(4) Place the sieve stack in the mechanical shaker and
shake for 10 minutes.
(5) Remove the stack from the shaker and carefully weigh
and record the weight of each sieve with its retained
soil. In addition, remember to weigh and record the
weight of the bottom pan with its retained fine soil.
4. Instrumentation
The different grain-size fractions analyzed for gold metal
contents. For determination of metal total concentrations in
different grain-size fractions, sediments were digested in
glass open cups with a mixture of aqua regia. The
determination of metals was carried out by AAS (NOVA 350
Analytic Jena).
5. Interferences
The interferences caused due to non specific absorbance’s
can be corrected using deuterium background corrector [12].
6. Data Analysis
Sieve Analysis:
(1) Obtain the mass of soil retained on each sieve by
subtracting the weight of the empty sieve from the
mass of the sieve + retained soil, and record this mass
as the weight retained on the data sheet. The sum of
these retained masses should be approximately equals
the initial mass of the soil sample. A loss of more than
two percent is unsatisfactory.
(2) Calculate the percent retained on each sieve by
dividing the weight retained on each sieve by the
original sample mass.
(3) Calculate the percent passing (or percent finer) by
starting with 100 percent and subtracting the percent
retained on each sieve as a cumulative procedure.
Table 1. Example for Sieve Analysis Chart.
Date Tested Tested By
Project Name Sample Number:
Visual Classification of Soil Weight of Containergm
Wt. Container+Dry Soilgm Wt. of Dry Samplegm
Sieve No(MIC) Diameter(mm) Soil retained(g) Cumulative Mass
Retained(g)
Cumulative Percent
Retained(g)
Percent
Passing(g)
Percent
Passing%
210 0.212 _ _ _ _ _
150 0.15 _ _ _ _ _
75 0.075 _ _ _ _ _
63 0.063 _ _ _ _ _
pan <0.063 _ _ _ _ _
7. Results and Discussion
The sieve analysis test presented a direct relationship
between grain size and gold concentrate which slightly
increase with finer grains, and also proved there is
differences between samples which analyzed directly with
plant mill size and samples after grinded in the preparation
side by using AandB finer grinder, for all the assay of the
mill size is less than assay after grindingdue to degree of
grinding which are high on grinder A and B than plant mill
size.
15 Amar Osman Ali Salih et al.: Determination the Effective of Grain Size on Gold Recovery by
Integral of Sieve Analysis and Atomic Absorption Spectroscopy Methods
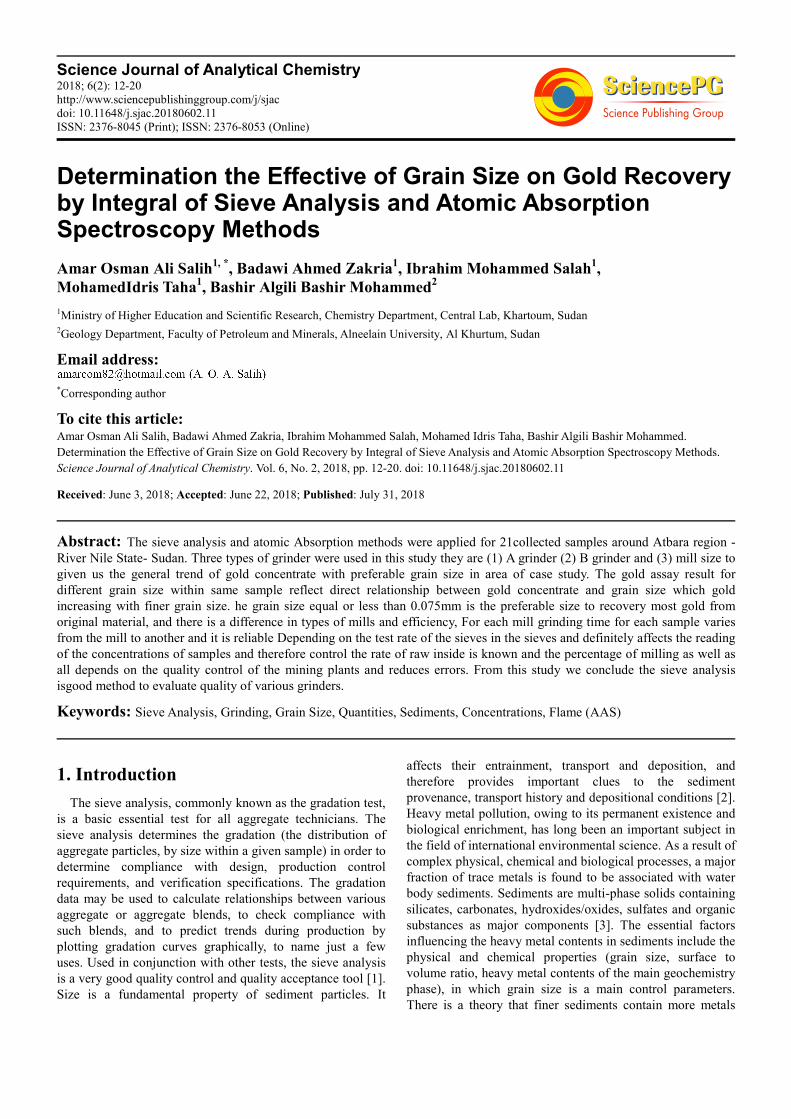
Figure 1. Chart Reflects the Increasing of Gold Concentration with Finer Grains.
The strong relationship between grain size and gold concentration appear in the above figure 1 where fineaggregates showed
high gold contents when compare with gold amount of coarse aggregates for same sample.
For example: the sample A1 have gold contents decrease with grain size diameter which have more than 6 g/t in size less
than 0.075 mm and 3 g/t for size 0.212 mm.
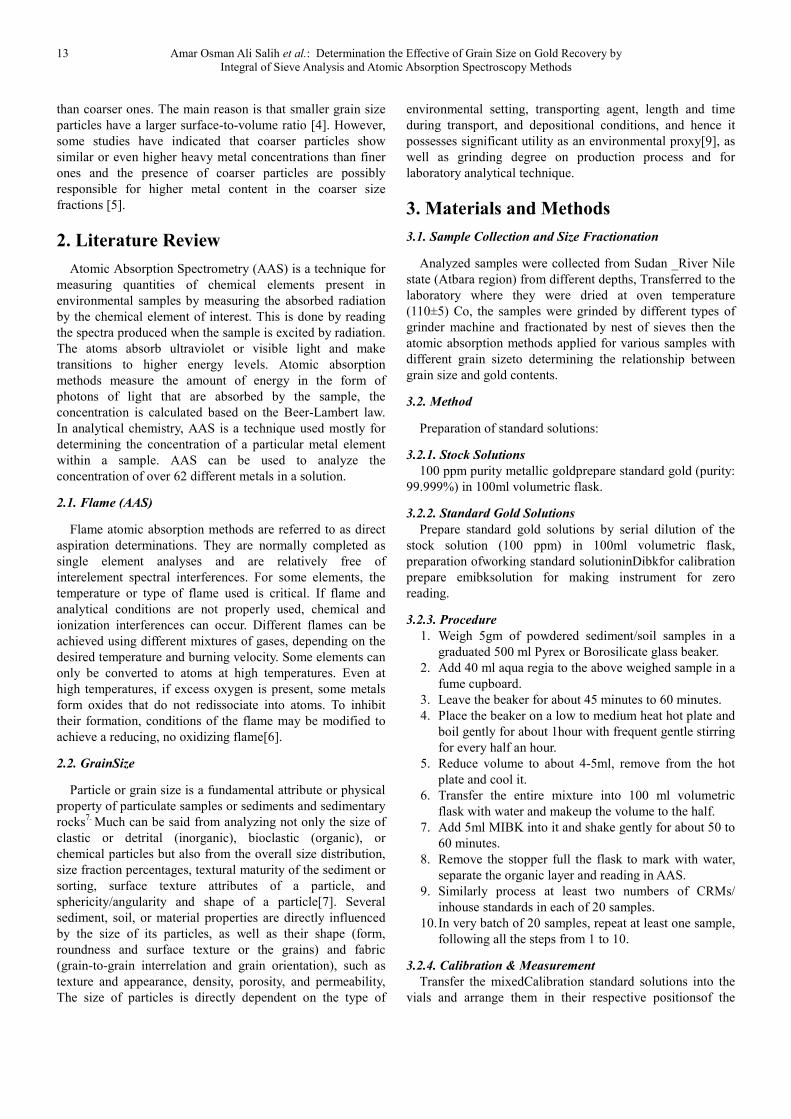
Figure 2. The Differences Between Assay Result of one Sample Through Mill and A Grinder.
All experiences applied in this paper reflected direct proportion relationship between grain size and gold amount, in the chart
above the blue color represent the gold assay results Vs grain size for Sample A3 when it grinding by Plant mill where the gold
content is very big with size equal to < 0.075 mm compared with size equal to 0.212 mm. And the orange color represents the
Science Journal of Analytical Chemistry 2018; 6(2): 12-20 16
assay result of Sample A3 when grinding by A grinder and the gold increasing with fine aggregates. The pass of sample
through fine mesh is very low when compare with pass percentage through fine mesh in A grinder.
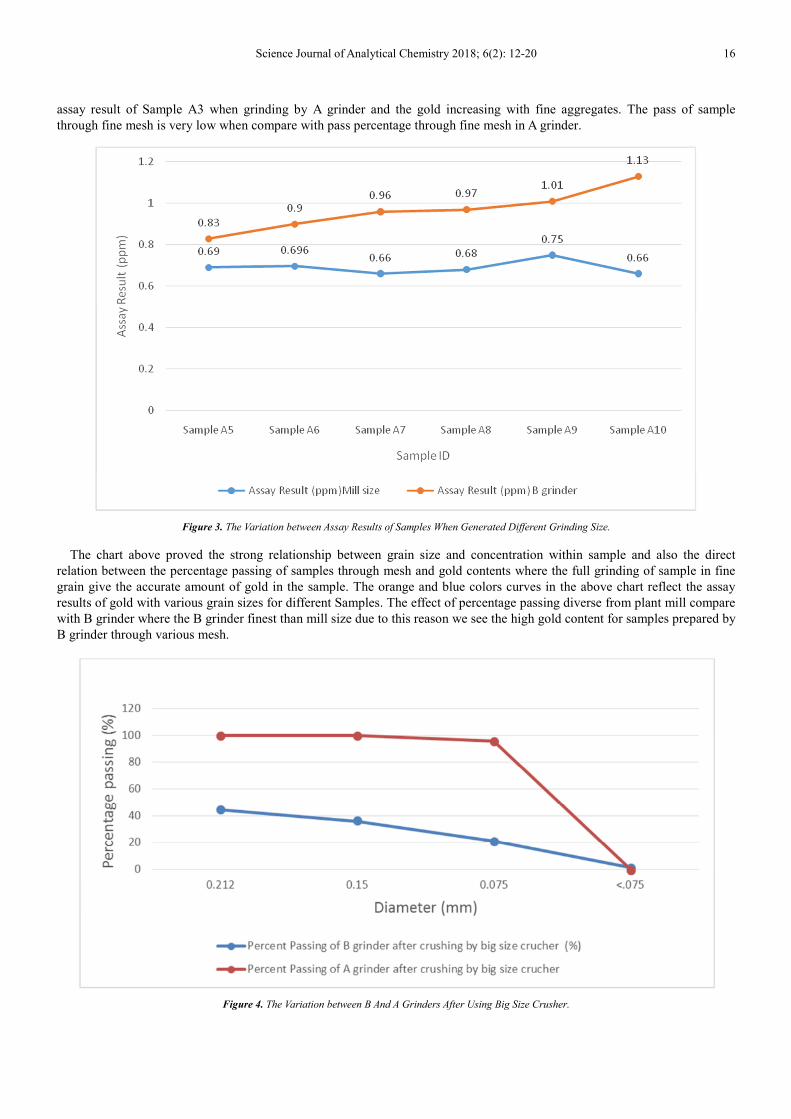
Figure 3. The Variation between Assay Results of Samples When Generated Different Grinding Size.
The chart above proved the strong relationship between grain size and concentration within sample and also the direct
relation between the percentage passing of samples through mesh and gold contents where the full grinding of sample in fine
grain give the accurate amount of gold in the sample. The orange and blue colors curves in the above chart reflect the assay
results of gold with various grain sizes for different Samples. The effect of percentage passing diverse from plant mill compare
with B grinder where the B grinder finest than mill size due to this reason we see the high gold content for samples prepared by
B grinder through various mesh.
Figure 4. The Variation between B And A Grinders After Using Big Size Crusher.
17 Amar Osman Ali Salih et al.: Determination the Effective of Grain Size on Gold Recovery by
Integral of Sieve Analysis and Atomic Absorption Spectroscopy Methods
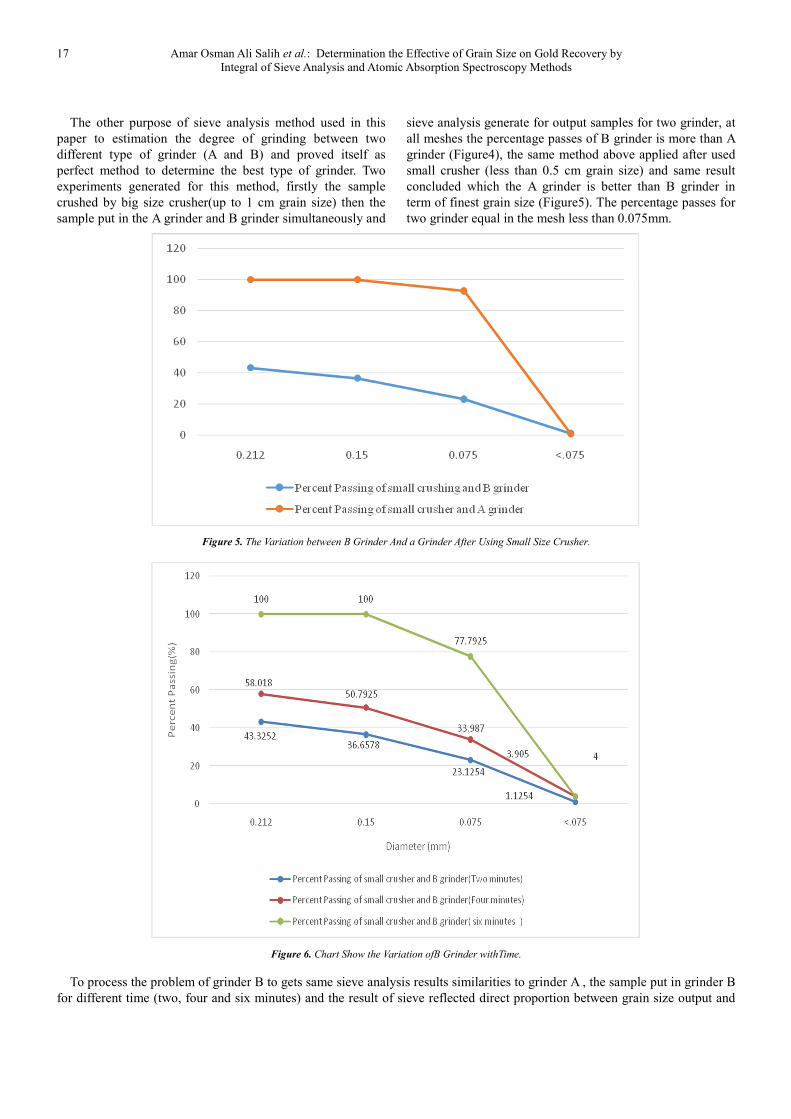
The other purpose of sieve analysis method used in this
paper to estimation the degree of grinding between two
different type of grinder (A and B) and proved itself as
perfect method to determine the best type of grinder. Two
experiments generated for this method, firstly the sample
crushed by big size crusher(up to 1 cm grain size) then the
sample put in the A grinder and B grinder simultaneously and
sieve analysis generate for output samples for two grinder, at
all meshes the percentage passes of B grinder is more than A
grinder (Figure4), the same method above applied after used
small crusher (less than 0.5 cm grain size) and same result
concluded which the A grinder is better than B grinder in
term of finest grain size (Figure5). The percentage passes for
two grinder equal in the mesh less than 0.075mm.
Figure 5. The Variation between B Grinder And a Grinder After Using Small Size Crusher.
Figure 6. Chart Show the Variation ofB Grinder withTime.
To process the problem of grinder B to gets same sieve analysis results similarities to grinder A , the sample put in grinder B
for different time (two, four and six minutes) and the result of sieve reflected direct proportion between grain size output and
Science Journal of Analytical Chemistry 2018; 6(2): 12-20 18
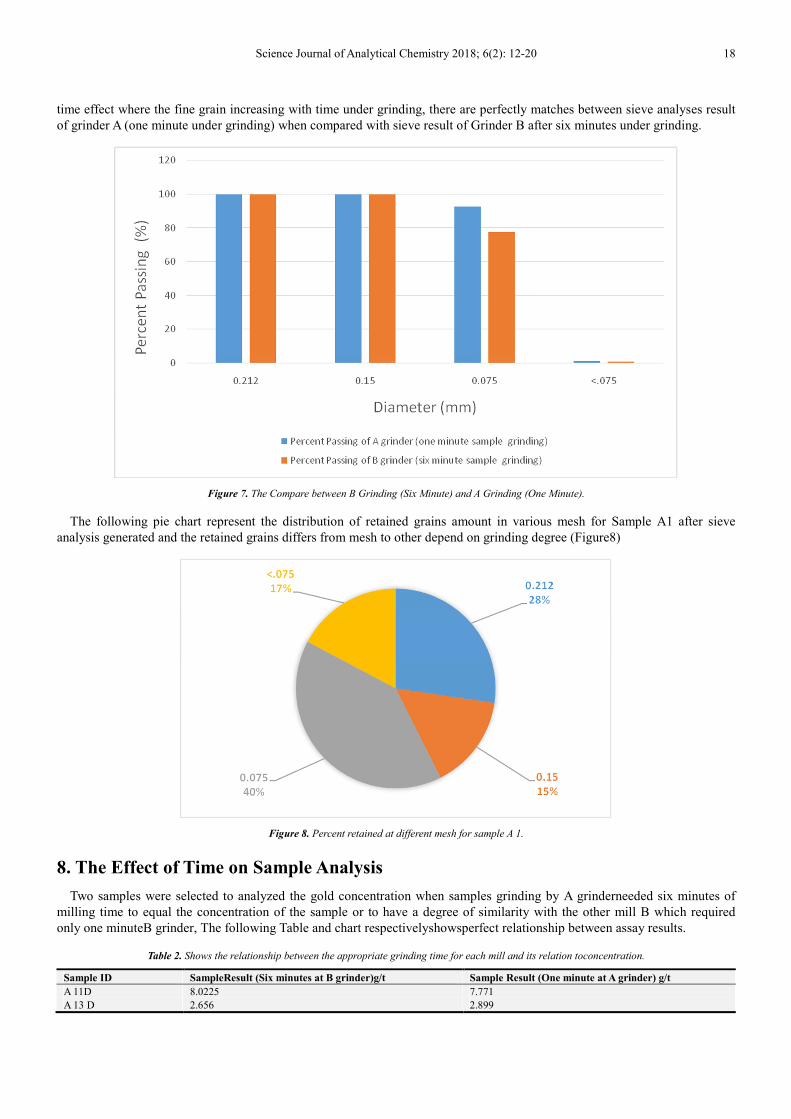
time effect where the fine grain increasing with time under grinding, there are perfectly matches between sieve analyses result
of grinder A (one minute under grinding) when compared with sieve result of Grinder B after six minutes under grinding.
Figure 7. The Compare between B Grinding (Six Minute) and A Grinding (One Minute).
The following pie chart represent the distribution of retained grains amount in various mesh for Sample A1 after sieve
analysis generated and the retained grains differs from mesh to other depend on grinding degree (Figure8)
Figure 8. Percent retained at different mesh for sample A 1.
8. The Effect of Time on Sample Analysis
Two samples were selected to analyzed the gold concentration when samples grinding by A grinderneeded six minutes of
milling time to equal the concentration of the sample or to have a degree of similarity with the other mill B which required
only one minuteB grinder, The following Table and chart respectivelyshowsperfect relationship between assay results.
Table 2. Shows the relationship between the appropriate grinding time for each mill and its relation toconcentration.
Sample ID SampleResult (Six minutes at B grinder)g/t Sample Result (One minute at A grinder) g/t
A 11D 8.0225 7.771
A 13 D 2.656 2.899
19 Amar Osman Ali Salih et al.: Determination the Effective of Grain Size on Gold Recovery by
Integral of Sieve Analysis and Atomic Absorption Spectroscopy Methods
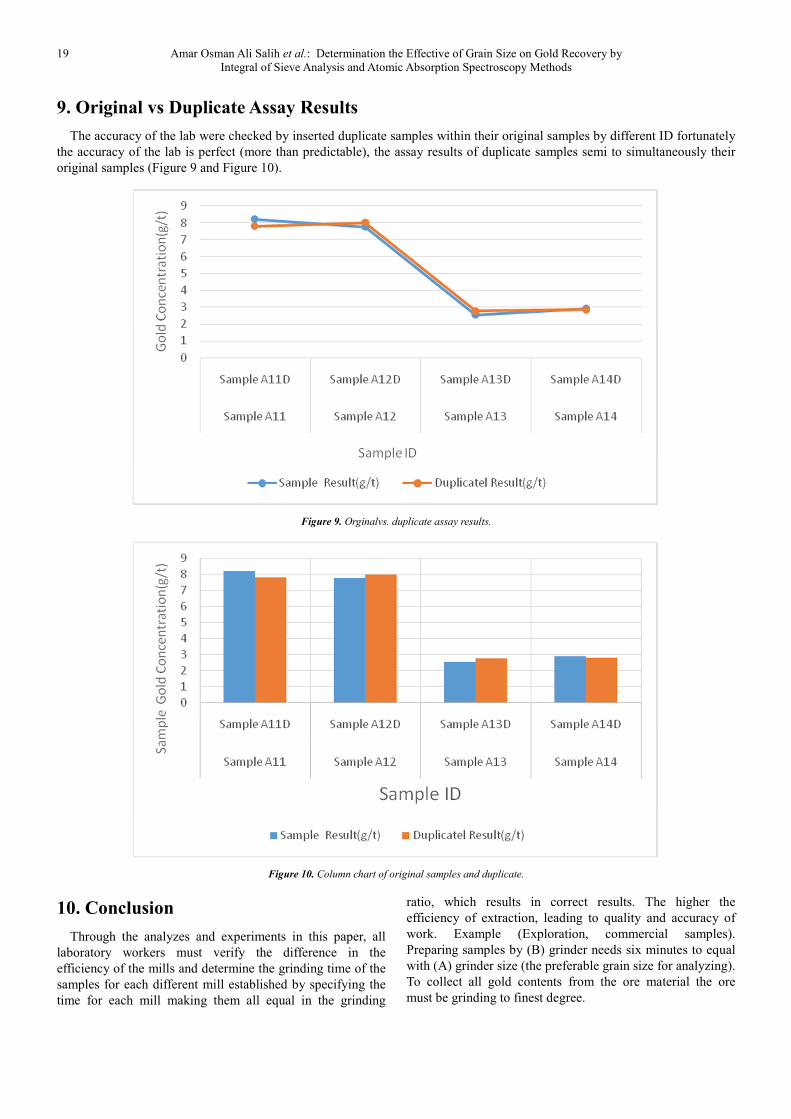
9. Original vs Duplicate Assay Results
The accuracy of the lab were checked by inserted duplicate samples within their original samples by different ID fortunately
the accuracy of the lab is perfect (more than predictable), the assay results of duplicate samples semi to simultaneously their
original samples (Figure 9 and Figure 10).
Figure 9. Orginalvs. duplicate assay results.
Figure 10. Column chart of original samples and duplicate.
10. Conclusion
Through the analyzes and experiments in this paper, all
laboratory workers must verify the difference in the
efficiency of the mills and determine the grinding time of the
samples for each different mill established by specifying the
time for each mill making them all equal in the grinding
ratio, which results in correct results. The higher the
efficiency of extraction, leading to quality and accuracy of
work. Example (Exploration, commercial samples).
Preparing samples by (B) grinder needs six minutes to equal
with (A) grinder size (the preferable grain size for analyzing).
To collect all gold contents from the ore material the ore
must be grinding to finest degree.
Science Journal of Analytical Chemistry 2018; 6(2): 12-20 20
References
[1] Kenneth Pye, Simon J. Blott (2004) Particle size analysis of sediments, soilsand related particulate materials for forensic purposes using lasergranulometry. Forensic Science International: 19-27.
[2] Ying Zhu, XiaodongZou, SupingFeng, Houquan Tang (2006) the effect ofgrain size on the Cu, Pb, Ni, Cd speciation and distribution in sediments:a case study of Dongping Lake, China. Environ Geol 50: 753-759.
[3] According to AASHTO27, standard method of test for sieve analysis of fine and coarse aggregates.
[4] Martincic D, Kwokal Z, Branica M (1990) Distribution of zinc, lead, cadmium and copper between different size fractions of sediments I. The LimskiKanal (North Adriatic Sea). Sci Total Environ 95: 201–215Salomons W, Forstner U (1984) Metals in hydrocycle. Springer, BerlinHeidelberg New York, pp 349.
[5] Singh AK, Hasnain SI, Banerjee DK (1999) Grain size geochemical partitioning of heavy metals in sediments of the Damodar River-a tributary of the lower Ganga, India. Environ Geo 39(1): 90–98 Tessier A, Campbell PGC, Bisson M (1982) Particulate trace metalspeciation in stream sediments and relationships with grain size: implications for geochemical exploration. J GeochemExplor 16: 77–104.
[6] R. García and A. P. Báez Centro de Ciencias de la Atmósfera, Universidad NacionalAutónoma de México, Ciudad Universitaria, Mexico City Mexico.
[7] Folk, R. L., 1980. Petrology of Sedimentary Rocks. Austin: Hemphill Publishing. Friedman, G. M., and Sanders, J. E., 1978. Principles of Sedimentology. New York: Wiley.
[8] Krumbein, W. C., and Sloss, L. L., 1963. Stratigraphy and Sedimentation, 2nd edition. San Francisco: W. H. Freeman.
[9] McManus, J., 1988. Grain size determination and interpretation. In Tucker, M. E. (ed.), Techniques in Sedimentology. Oxford: Blackwell Scientific, pp. 63–85.
[10] Geological survey of india, standard operating procedure, document: sop/tmsection: chemical division, issue no: 01, with some modification.
[11] According to (Qatar University Geotechnical Engineering (CVEN 230) College of Engineering Department of Civil & Arch. Engineering).
[12] Geological survey of india, standard operating procedure, document: sop/tmsection: chemical division, issue no: 01.
Recommended


![The question of determination of grain size in …...In standards GOST 5639-82 [1], ISO 643:2012 [2] for determination of grain size, grains of metals are separate crystals of polycrystalline](https://img.dokumen.tips/doc/110x75/5f08ecf27e708231d4246406/the-question-of-determination-of-grain-size-in-in-standards-gost-5639-82-1.jpg)


