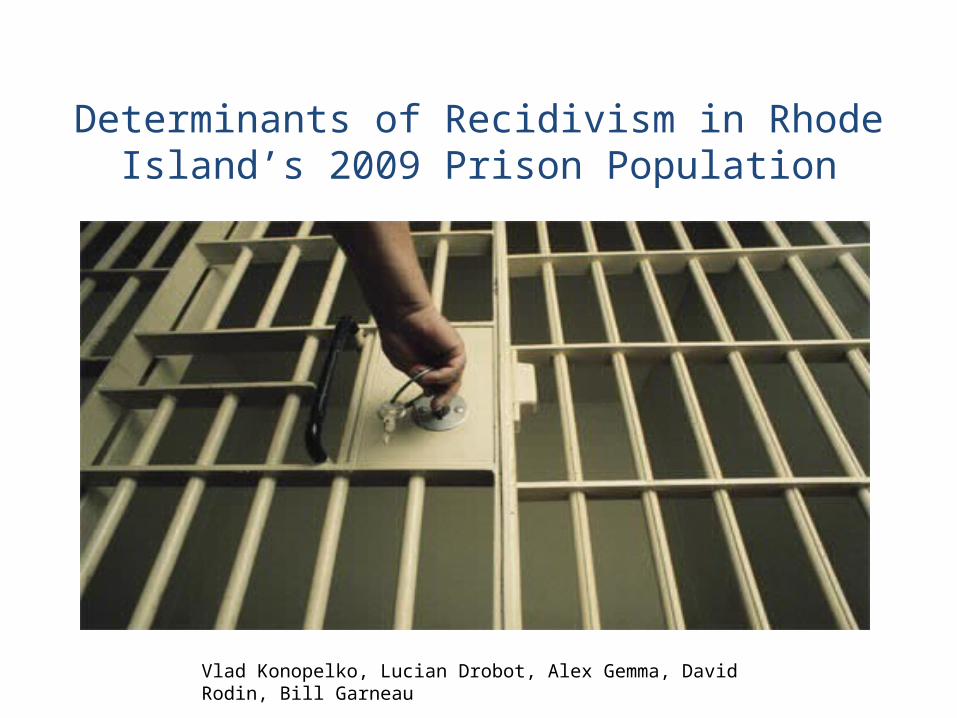
Determinants of Recidivism in Rhode Island’s 2009 Prison Population
Vlad Konopelko, Lucian Drobot, Alex Gemma, David Rodin, Bill Garneau
Topic
• RI Recidivism study
• Recidivist = Repeat offender– 28% returned with new sentence – 34% were awaiting trial– 47% are for new crime rest for probation and parole violation
• Important to everyone
• Data availability

Objective
• Determine which factors impacts repeat offenders
• Identify factors that can be influenced through policies
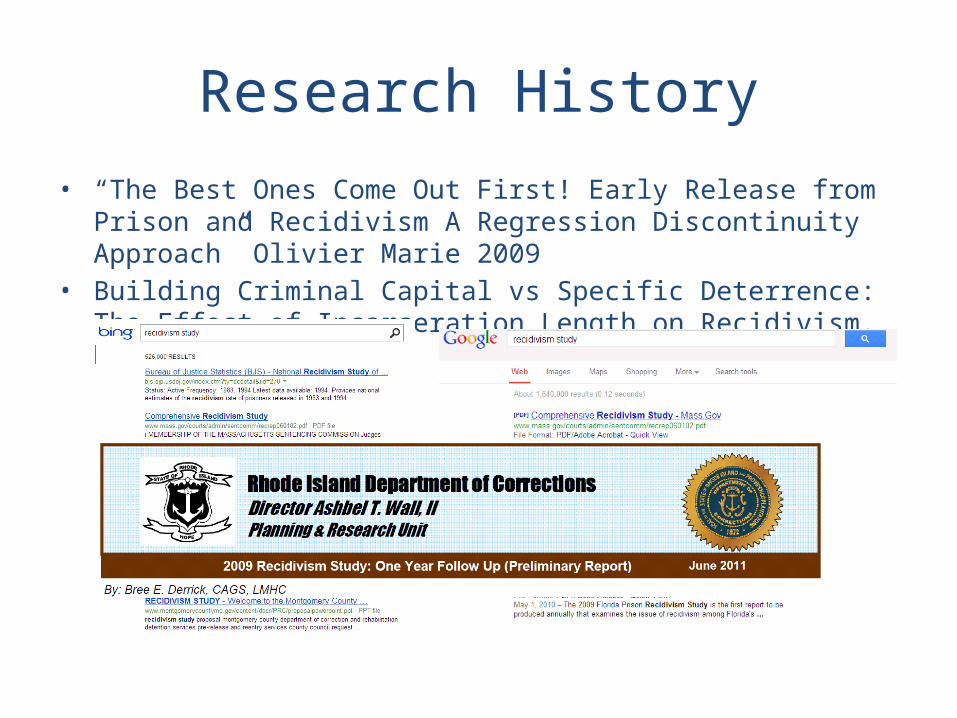
Research History• “The Best Ones Come Out First! Early Release from Prison and Recidivism
A Regression Discontinuity Approach” Olivier Marie 2009• Building Criminal Capital vs Specific Deterrence: The Effect of Incarceration
Length on Recidivism. David S. Abrams 2010
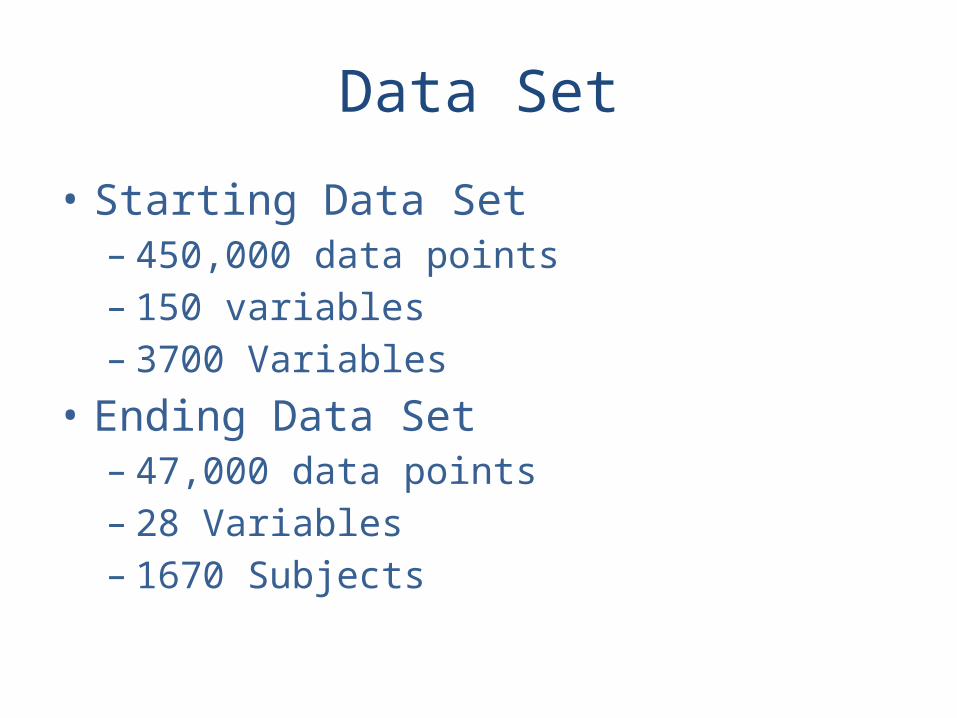
Data Set
• Starting Data Set– 450,000 data points– 150 variables– 3700 Variables
• Ending Data Set– 47,000 data points– 28 Variables– 1670 Subjects
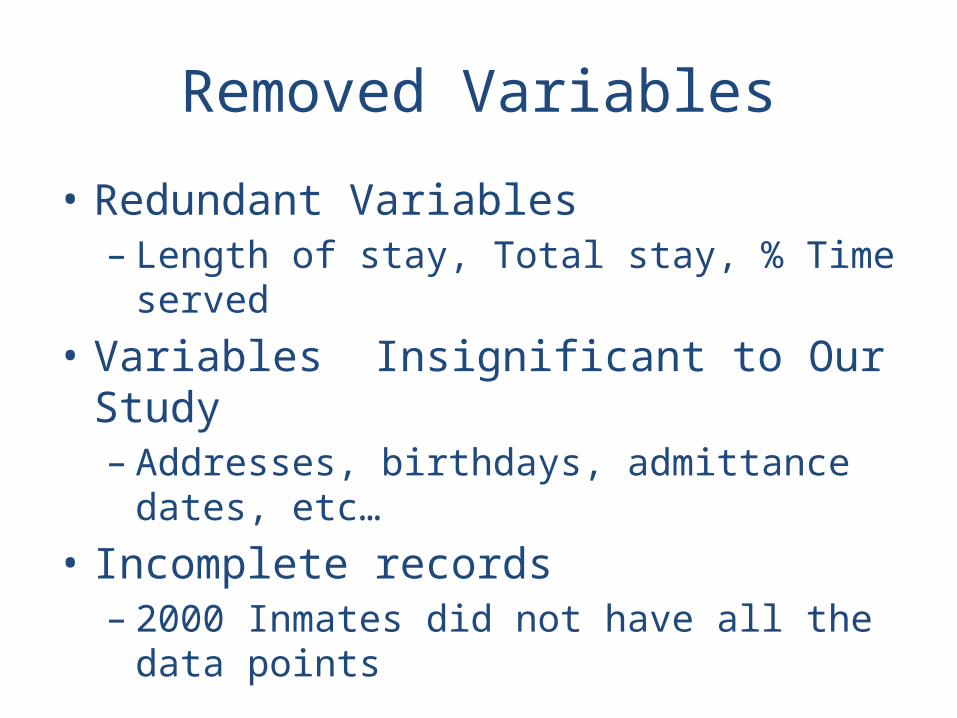
Removed Variables
• Redundant Variables– Length of stay, Total stay, % Time served
• Variables Insignificant to Our Study– Addresses, birthdays, admittance dates, etc…
• Incomplete records– 2000 Inmates did not have all the data points
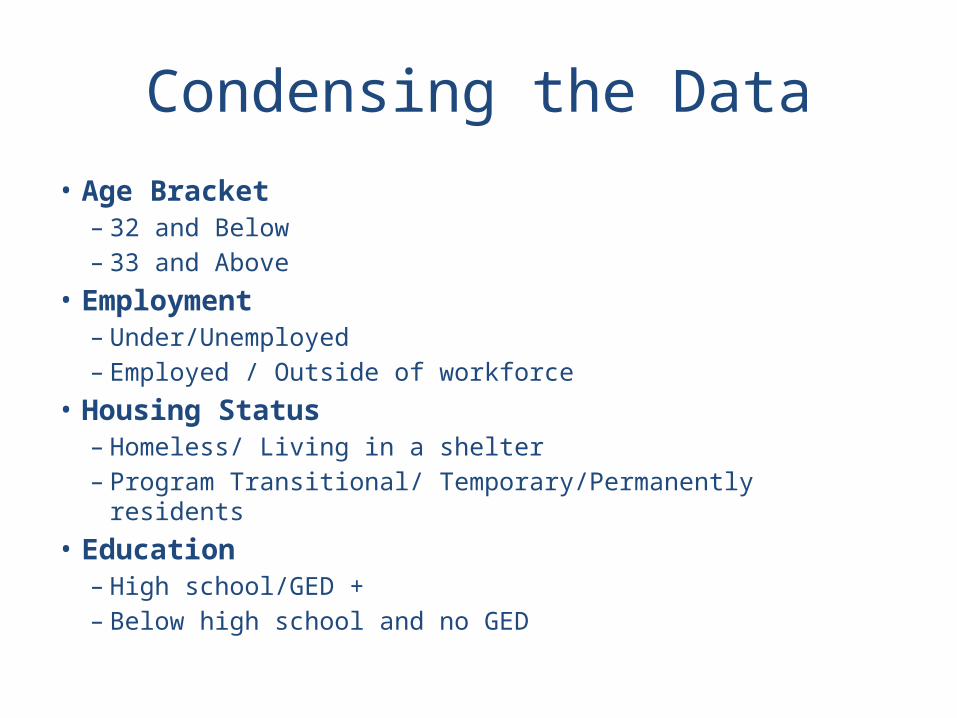
Condensing the Data• Age Bracket
– 32 and Below– 33 and Above
• Employment – Under/Unemployed– Employed / Outside of workforce
• Housing Status– Homeless/ Living in a shelter– Program Transitional/ Temporary/Permanently residents
• Education– High school/GED +– Below high school and no GED

Logistic Regression Model Depending variable 0 – 1
The dependent variable is categorical with two possible values
It is based on the odds ratio:
odds ratio =
Example: odds ratio (for a 0.75 probability of interest)=0.75/(1-0.75)=3 (or 3 to 1)
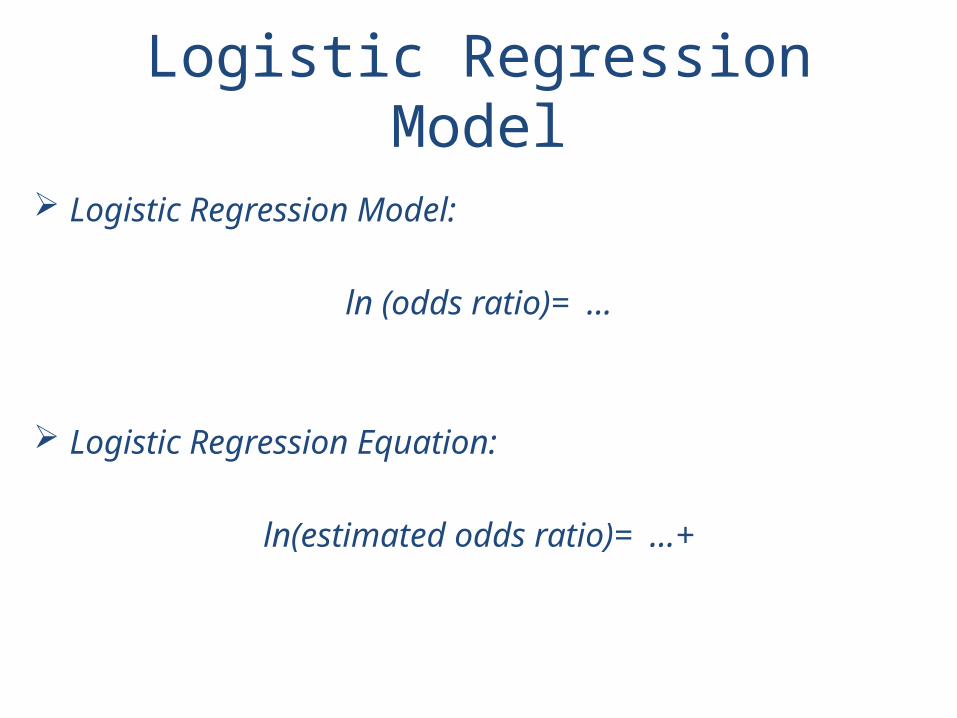
Logistic Regression Model
Logistic Regression Model:
ln (odds ratio)= …
Logistic Regression Equation:
ln(estimated odds ratio)= …+

Logistic Regression Model
Determine
Determine estimated odds ratio
Determine estimated probability of an event of interest

Model Results Variable B S.E. Wald df Sig. Exp(B)
Step 1Total Sentence -.001 .000 23.950 1 .000 .999
Constant -.622 .072 75.434 1 .000 .537
Step 2
Age -.022 .006 16.050 1 .000 .978
Total Sentence -.001 .000 22.206 1 .000 .999
Constant .092 .190 .233 1 .629 1.096
Step 3
Age -.025 .006 19.942 1 .000 .975
Total Sentence -.001 .000 22.181 1 .000 .999
Citizenship .806 .205 15.458 1 .000 2.240
Constant -.534 .253 4.449 1 .035 .586
Step 4
Age -.028 .006 22.949 1 .000 .973
Total Sentence -.001 .000 22.901 1 .000 .999
Housing Status .336 .159 4.470 1 .035 1.399
Citizenship .811 .206 15.566 1 .000 2.250
Constant -.500 .254 3.875 1 .049 .607
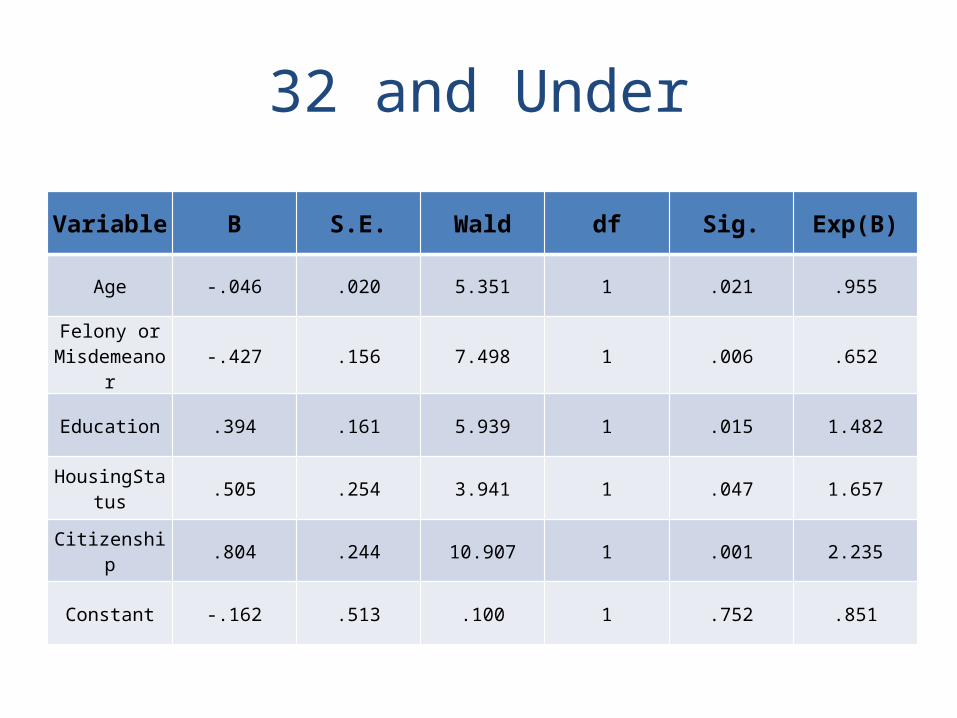
32 and Under
Variable B S.E. Wald df Sig. Exp(B)
Age -.046 .020 5.351 1 .021 .955
Felony or Misdemeanor -.427 .156 7.498 1 .006 .652
Education .394 .161 5.939 1 .015 1.482
HousingStatus .505 .254 3.941 1 .047 1.657
Citizenship .804 .244 10.907 1 .001 2.235
Constant -.162 .513 .100 1 .752 .851
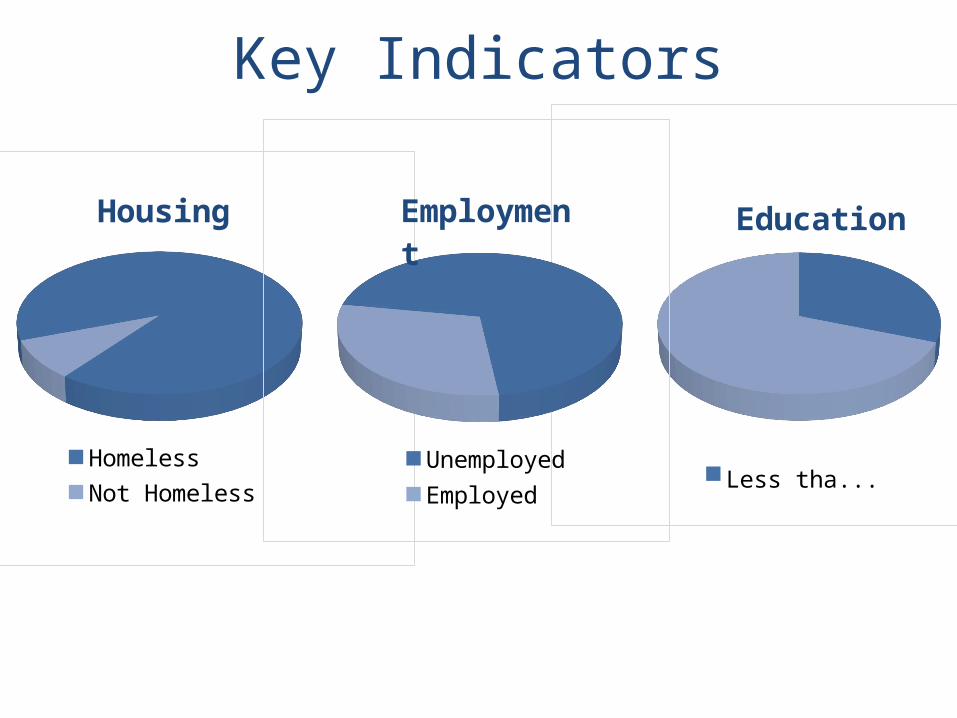
Less than GEDGED or Higher
Education
HomelessNot Homeless
Housing
UnemployedEmployed
Employment
Key Indicators
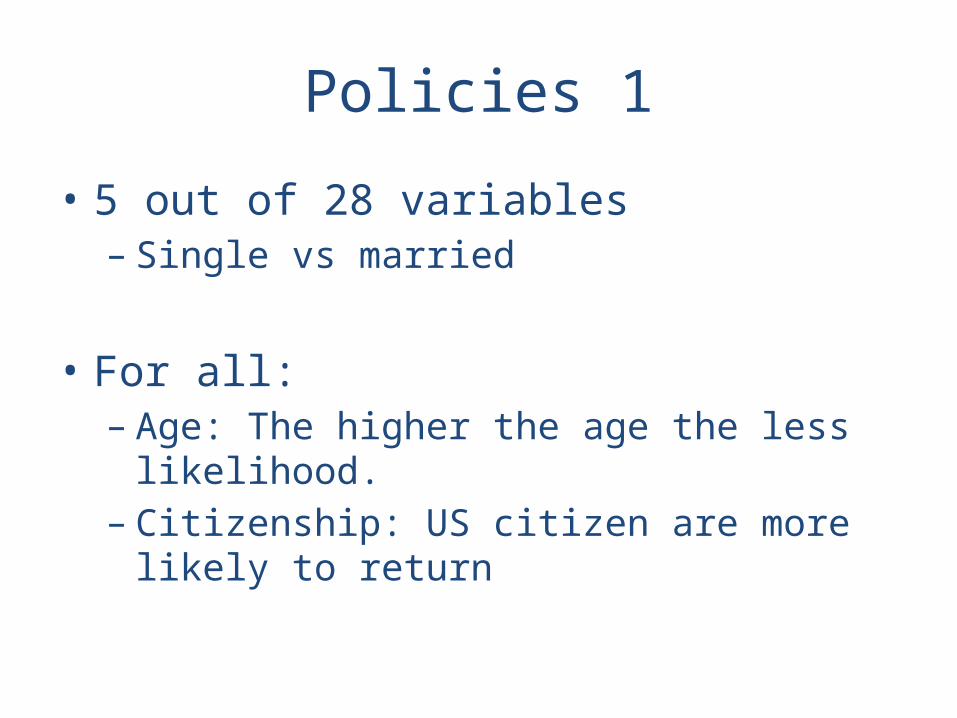
Policies 1
• 5 out of 28 variables– Single vs married
• For all: – Age: The higher the age the less likelihood.– Citizenship: US citizen are more likely to return
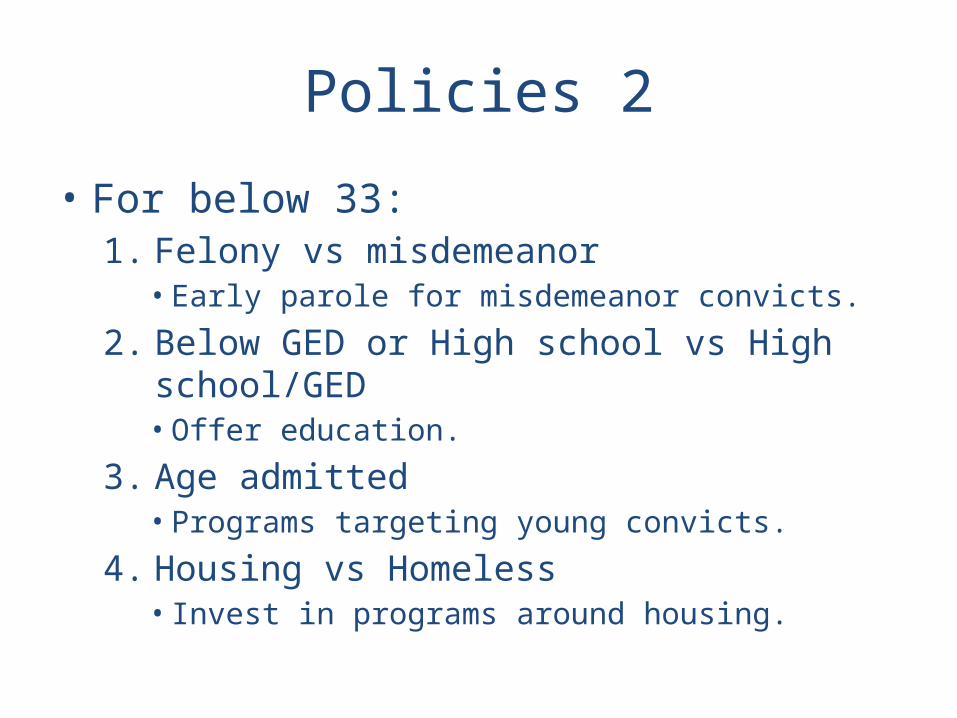
Policies 2
• For below 33:1. Felony vs misdemeanor
• Early parole for misdemeanor convicts.
2. Below GED or High school vs High school/GED• Offer education.
3. Age admitted• Programs targeting young convicts.
4. Housing vs Homeless• Invest in programs around housing.
Recommended