A Framework to Support Policymakers in Selecting Public Instruments to Promote Private Investment in Solar PV-Battery Mini-Grids in Developing Countries
Derisking Renewable Energy Investment: Off-Grid Electrification
Derisking Renewable Energy Investment: Off-Grid ElectrificationB
UNDP partners with people at all levels of society to help build nations that can withstand crisis, and drive and sustain the kind of growth that improves the quality of life for everyone. On the ground in nearly 170 countries and territories, we offer global perspective and local insight to help empower lives and build resilient nations.
United Nations Development Programme 304 East 45th Street New York, NY 10017 USA www.undp.org
Founded in 1855, today ETH Zürich is one of the world’s leading research universities. ETH Zürich has more than 20,000 students from over 120 countries, including 4,000 doctoral students. About 500 professors currently teach and conduct research in engineering, architecture, mathematics, natural sciences, system-oriented sciences, as well as management and social sciences. The Energy Politics Group (EPG) forms part of ETH Zürich’s Department of Humanities, Social and Political Sciences and in its research centres on questions related to the governance of technological change in the energy sector.
ETH Zürich, Energy Politics Group Haldeneggsteig 4 CH-8092 Zurich, Switzerland www.epg.ethz.ch
Authors (UNDP): Oliver Waissbein, Hande Bayraktar and Christoph Henrich.
Authors (ETH Zürich): Tobias S. Schmidt and Abhishek Malhotra.
Contributors: Marcel Alers (UNDP), Léonore Haelg (ETH), Claire Jin (UNDP, intern) and Usha Rao (UNDP).
External reviewers: Subhes Bhattacharyya, Courtney Blodgett, Sagar Gubbi and Hisham Zerriffi.
Acknowledgments: UNDP and ETH Zürich would like to thank the mini-grid developers and investors, and other stakeholders, in Uttar Pradesh, India and Kenya who participated in structured and informational interviews for the illustrative case studies. The authors would also like to thank the external reviewers for their valuable comments and inputs.
This publication builds on the original Derisking Renewable Energy Investment (UNDP, 2013) report, which established the methodology which has been tailored to solar PV-battery mini-grids in this publication. For further information, please visit undp.org/DREI
Disclaimer: The views expressed in this publication are those of the authors and do not necessarily represent those of the UN, including UNDP, or UN Member States.
This report should be referenced as: UNDP & ETH Zürich (2018). Derisking Renewable Energy Investment: Off-Grid Electrification. United Nations Development Programme, New York, NY and ETH Zürich, Energy Politics Group, Zurich, Switzerland.
Design: Camilo J. Salomon ([email protected], www.cjsalomon.com)
December 2018, New York & Zurich
Derisking Renewable Energy Investment: Off-Grid Electrification 11
Figures, Tables and Boxes 3
Acronyms 7
Forewords 10
Executive Summary 14
1. Introduction 24
2. Overview of the DREI Methodology 28
2.1 Electricity Access: Current Status and Trends 29
2.2 The Drivers of Change 30
2.3 The Role of Financing 32
3. Derisking Solar Mini-Grid Investments through Public Instruments 34
3.1 High Financing Costs for Solar Mini-Grids 35
3.2 Public and Private Strategies to Address Investment Risks 37
3.3 Designing Cost-Effective Instrument Packages 39
3.4 Overview of the Derisking Methodology 40
4. Derisking Table for Solar Mini-Grids 42
5. Illustrative Solar Mini-Grid Case Studies 54
5.1 Approach to the Modelling Exercise 55
5.2 Case Study: Uttar Pradesh, India 59
5.3 Case Study: Kenya 79
6. Conclusion 100
Annexes: 104
A. Methodology and data for the illustrative modelling exercise 105
B. References 119
Table of Contents
Derisking Renewable Energy Investment: Off-Grid Electrification
Chapter 1
Derisking Renewable Energy Investment: Off-Grid Electrification2
This Full Report is accompanied by an Executive Summary only version.
2 Derisking Renewable Energy Investment: Off-Grid Electrification
Contents
Copy content
Derisking Renewable Energy Investment: Off-Grid Electrification
Book Title
3
1
Derisking Renewable Energy Investment: Off-Grid Electrification 3
Figures, Tables and Boxes
Figures, Tables and Boxes
FiguresEXECUTIVE SUMMARY
Figure E.1: Impact of financing costs on solar PV-battery and diesel-powered mini-grids’ generation cost in low and high-risk investment environments
Figure E.2: Pre-derisking financing cost waterfalls for solar mini-grids in Uttar Pradesh, India and in Kenya
Figure E.3: Post-derisking financing cost waterfalls for solar mini-grids in Uttar Pradesh, India and in Kenya
Figure E.4: LCOEs for diesel and solar mini-grids in Uttar Pradesh, India and Kenya (USD/kWh)
Figure E.5: Investment leverage performance metrics for the selected instrument packages in promoting solar mini-grid investment in Uttar Pradesh, India (2023 target: 323 MW) and in Kenya (2023 target: 77 MW)
CHAPTER 2Figure 2.1: The MTF’s five tiers of electricity access
Figure 2.2: Annual financing for PAYG solar home system companies (million USD)
CHAPTER 3Figure 3.1: The different capital intensity of electricity generation from solar-PV
battery mini-grids and diesel-powered mini-grids
Figure 3.2: Impact of financing costs on solar PV-battery and diesel-powered mini-grids’ generation costs in low and high-risk investment environments
Figure 3.3: Drivers and components of investor risk for off-grid renewable energy investments
Figure 3.4: Public instrument selection for off-grid renewable energy investments
Figure 3.5: Overview of the DREI framework to support policymakers to promote off-grid renewable energy investments
CHAPTER 5Uttar Pradesh, India Case Study
Figure 5.1: India: Electricity generation by fuel (1971 to 2014)
Figure 5.2: Uttar Pradesh, India: Pre-derisking financing cost waterfall for solar mini-grids
Figure 5.3: Uttar Pradesh, India: Post-derisking financing cost waterfall for solar mini-grids
Figure 5.4: Uttar Pradesh, India: LCOE for the diesel and solar mini-grids
Figure 5.5: Uttar Pradesh, India: Investment leverage ratio
Chapter 1
Derisking Renewable Energy Investment: Off-Grid Electrification4 4 Derisking Renewable Energy Investment: Off-Grid Electrification
Figures, Tables and Boxes
Figure 5.6: Uttar Pradesh, India: End-user affordability
Figure 5.7: Uttar Pradesh, India: Carbon abatement
Kenya Case Study
Figure 5.8: Kenya: Electricity generation by fuel in Kenya (1972 to 2014)
Figure 5.9: Kenya: Evolution of mini-grid policy and regulatory framework
Figure 5.10: Kenya: Pre-derisking financing cost waterfall for solar mini-grids
Figure 5.11: Kenya: Post-derisking financing cost waterfall for solar mini-grids
Figure 5.12: Kenya: LCOE for diesel and solar mini-grids
Figure 5.13: Kenya: Investment leverage ratio
Figure 5.14: Kenya: End-user affordability
Figure 5.15: Kenya: Carbon abatement
CHAPTER 6Figure 6.1: Derisking’s integral role in electrification strategies
ANNEX
Figure A.1: Solar mini-grid investment targets for Kenya and Uttar Pradesh, India
Figure A.2: Interview questions to quantify the impact of risk categories on the cost of equity and debt
Figure A.3: Illustrative simplified application of the methodology to determine the impact of risk categories on increasing financing costs
Figure A.4: Typical mini-grid set-up
TABLES EXECUTIVE SUMMARYTable E.1: Summary table of public instruments to promote investment in solar
mini-grids in Kenya.
CHAPTER 2Table 2.1: Examples of mini-grid business models
CHAPTER 4Table 4.1: Derisking table for solar PV-battery mini-grids
CHAPTER 5Uttar Pradesh, India
Table 5.1: Uttar Pradesh, India: Interviewee feedback on risk categories for solar mini-grid investments
Table 5.2: Uttar Pradesh, India: Summary table of public instruments to promote investment in solar mini-grids
Table 5.3: Uttar Pradesh, India: Summary of LCOE outputs for sensitivity analysis on key input assumptions (USD/kWh)
Table 5.4: Uttar Pradesh, India: Summary of key outputs for different electrification scenarios.
Contents
Copy content
Derisking Renewable Energy Investment: Off-Grid Electrification 5
1
Derisking Renewable Energy Investment: Off-Grid Electrification 5
Table 5.5: Uttar Pradesh, India: Summary of key outputs for sensitivity analysis on light-touch vs comprehensive regulatory track breakdown
Table 5.6: Uttar Pradesh, India: Effect of upfront capital subsidies for solar mini-grids on post-derisking LCOE (USD/kWh)
Table 5.7: Uttar Pradesh, India: Summary of load profile changes on system size and post-derisking LCOE (USD/kWh)
Table 5.8: Uttar Pradesh, India: Summary of load profile changes on system size and post-derisking LCOE (USD/kWh)
Table 5.9: Uttar Pradesh, India: Summary of public cost outputs for sensitivity analysis varying costing approach for financial derisking instruments.
Table 5.10: Uttar Pradesh, India: Summary modelling assumptions for solar mini-grids
Kenya
Table 5.11: Kenya: Interview feedback on risk categories for solar mini-grids
Table 5.12: Kenya: Summary table of public instruments to promote investment in solar mini-grids
Table 5.13: Kenya: Summary of LCOE outputs for sensitivity analysis on key input assumptions (USD/kWh)
Table 5.14: Kenya: Summary of key outputs for different electrification scenarios.
Table 5.15: Kenya: Summary of key outputs for sensitivity analysis on light-touch vs comprehensive regulatory track breakdown
Table 5.16: Kenya: Effect of upfront capital subsidies for solar mini-grids on post- derisking LCOE (USD/kWh)
Table 5.17: Kenya: Summary of load profile changes on system size and post- derisking LCOE (USD/kWh)
Table 5.18: Kenya: Summary of load profile changes on system size and post- derisking LCOE (USD/kWh)
Table 5.19: Kenya: Summary of public cost outputs for sensitivity analysis varying costing approach for financial derisking instruments
Table 5.20: Kenya: Summary modelling assumptions for solar mini-grids
ANNEXTable A.1: The modelling assumptions for policy derisking instruments’ effectiveness
Table A.2: The modelling assumptions on costing of financial derisking instruments
Table A.3: The modelling assumptions for financial derisking instruments’ effectiveness
Table A.4: Demand profile for generic village
Table A.5: The modelling assumptions for diesel mini-grids, generation costs
Table A.6: The modelling assumptions for solar mini-grids, generation costs
Table A.7: The modelling assumptions for diesel and solar mini-grids, distribution costs
Table A.8: Intermediate modelling results for diesel and solar mini-grids
Table A.9: Modelling assumptions for sensitivity analyses
Figures, Tables and Boxes

Chapter 1
Derisking Renewable Energy Investment: Off-Grid Electrification6 6 Derisking Renewable Energy Investment: Off-Grid Electrification
Figures, Tables and Boxes
BOXEsCHAPTER 1Box 1.1: Electricity access and productive use
Box 1.2: UNDP’s Derisking Renewable Energy Investment (DREI) framework
CHAPTER 2Box 2.1: Tiered approach to electricity access
Box 2.2: Geospatial modelling of least-cost electrification options
Box 2.3: Energy efficient appliances for electricity access
Box 2.4: Aggregation and modular approaches in private sector solar mini-grid business models
Box 2.5: Financing for off-grid renewable energy
CHAPTER 3Box 3.1: Risk and risk perception
Box 3.2: Drivers and components of investor risk for off-grid renewable energy investments
CHAPTER 4
Box 4.1: Regulation as a barrier for mini-grid enterprises
Box 4.2: Subsides and solar mini-grids
CHAPTER 5Uttar Pradesh, India
Box 5.1: Generic village demand estimation and system sizing
Box 5.2: Electricity and environment in India
Box 5.3: Solar home kits in India
Box 5.4: International support to solar mini-grids in India
Box 5.5: Examples of mini-grid developers in India
Kenya
Box 5.6: Solar home sytems in Kenya
Box 5.7: International support for mini-grids in Kenya
Box 5.8: Powerhive: A mini-grid developer case study
ANNEXBox A.1: Case study country selection criteria
Box A.2: Methodology for quantifying the impact of risk categories on higher financing costs
Box A.3: The technology and business model assumptions for the two country case studies
Box A.4: The modelling exercise’s LCOE formula
Contents
Copy content
Derisking Renewable Energy Investment: Off-Grid Electrification
Book Title
7
1
7Derisking Renewable Energy Investment: Off-Grid Electrification
Acronyms
GENERAL ACRONYMSARPU Average revenue per user
BAU Business-as-usual
BDA Business development advisor
BNEF Bloomberg New Energy Finance
BOO Build-own-operate
CAPEX Capital expenditure
CO2 Carbon dioxide
DC Direct current
DFI Development finance institution
DREI Derisking Renewable Energy Investment
ECN Energy Research Centre of the Netherlands
EPC Engineering, procurement and construction
ESMAP Energy Sector Management Assistance Program
F/X Foreign exchange
FDI Foreign direct investment
FiT Feed-in tariff
FY Financial year
GDP Gross domestic product
GCF Green Climate Fund
GEF Global Environment Facility
GIS Geographic Information System
GHG Greenhouse gas
GTF Global Tracking Framework
GW Gigawatt
HDI Human Development Index
ICT Information and communication technology
IEA International Energy Agency
INDC Intended Nationally Determined Contribution
IPP Independent power producer
IRENA International Renewable Energy Agency
kW Kilowatt
kWh Kilowatt-hour
Acronyms
Chapter 1
Derisking Renewable Energy Investment: Off-Grid Electrification8 8 Derisking Renewable Energy Investment: Off-Grid Electrification
Acronyms
LCOE Levelised cost of electricity
LCD Liquid crystal display
LED Light-emitting diode
LIC Low-income country
MG Mini-grid
MIGA Multilateral Investment Guarantee Agency (World Bank)
MTF Multi Tier Framework (on electricity access)
MW Megawatt
NAMA Nationally Appropriate Mitigation Action
NREL National Renewable Energy Laboratory
O&M Operations and maintenance
ONSSET Open Source Spatial Electrification Toolkit
OM Operating margin
OPEX Operational expenditure
PAYG Pay-as-you-go
PPA Power purchase agreement
PPP Purchasing power parity
PRI Political risk insurance
PV Photovoltaic
RE Renewable energy
SDG Sustainable Development Goal
SEforAll Sustainable Energy for All
SHS Solar home system
TPO Third party ownership
UN United Nations
UNDP United Nations Development Programme
UNEP United Nations Environment Programme
UNFCCC United Nations Framework Convention on Climate Change
UP Uttar Pradesh
USD United States Dollar
VAT Value-Added Tax
Contents
Copy content
Derisking Renewable Energy Investment: Off-Grid Electrification
Book Title
9
1
9Derisking Renewable Energy Investment: Off-Grid Electrification
Acronyms
Uttar Pradesh, India Case Study Acronyms
CEA Central Electricity Authority
CLEAN Clean Energy Access Network
DDG Decentralized distribution-cum-generation
DDUGJY Deen Dayal Upadhyaya Gram Jyoti Yojana
DISCOM Distribution company
INR Indian Rupee
JNNSM Jawaharlal Nehru National Solar Mission
MNRE Ministry of New and Renewable Energy
MoP Ministry of Power
PGCIL Power Grid Corporation of India Limited
SREDA State Renewable Energy Development Agencies
UPNEDA Uttar Pradesh New and Renewable Energy Development Agency
Kenya Case Study Acronyms
ERC Energy Regulatory Commission
GoK Government of Kenya
KETRACO Kenya Electricity Transmission Company
KPLC Kenya Power and Lighting Company
KSh Kenyan Shilling
LCMP Last-Mile Connectivity Program
SREP Scaling-up Renewable Energy Programme
Derisking Renewable Energy Investment: Off-Grid Electrification10
Forewords
Derisking Renewable Energy Investment: Off-Grid Electrification 11
Forewords
Forewords
Sustainable energy – connecting economic growth, an inclusive society and environmental well-being - is at the heart of the sustainable development agenda. The seventh Sustainable Development Goal on energy (SDG 7) aims to ensure access to affordable, reliable and modern energy for all by 2030. Energy’s central role is seen in clear linkages to nearly every other SDG, from poverty, to health and gender, to name but three. Simply put, progress on sustainable energy will go hand in hand with progress on sustainable development.
Access to electricity – one of SDG 7’s three objectives – is the focus of this report. It is clear we must re-double our efforts if we are to electrify the remaining 1 billion people who still, today, lack access to electrical power, hindering their human development. Fortunately, recent progress in off-grid, renewable energy technologies – with lower-cost and more efficient hardware, the advent of digital and cellular technologies, and new, innovative private sector business models – indicates that we may be at a tipping point, where deployment of these technologies can now move to scale. Private finance, and a shift to commercial debt financing, will be key to achieving this transformation. The opportunity is for governments, assisted by the development community, to now play a critical role in addressing investment risks, paving the way for private sector investment.
To this end, this report introduces an innovative, data-rich framework – accompanied by a set of financial modelling tools – to support policy makers to select cost-effective derisking measures to promote private investment in off-grid, renewable energy technologies. UNDP is pleased to have collaborated with ETH Zürich in developing this report.
UNDP, with close to three decades of experience in sustainable energy, will continue to be fully committed to assist developing countries to advance SDG 7. Sustainable energy is prioritized as a signature solution in UNDP’s new Strategic Plan for 2018 to 2022. Achieving these objectives for SDG 7 will require us all – public and private sector, and civil society – to come together in partnership.
Collectively, we have a great opportunity to advance SDG 7. I am hopeful that this report can make an important contribution to this goal.
Achim Steiner UNDP Administrator
Derisking Renewable Energy Investment: Off-Grid Electrification12
Forewords
Addressing the many challenges related to environmental, social, and economic sustainability requires answers to complex questions. ETH Zürich is convinced that research universities have a crucial role in supporting society in finding solutions that not only serve society, but also preserve the planet that we share. Sustainability is one of the five strategic focus areas of ETH Zürich’s research. The university actively contributes to the Agenda 2030, an agenda supported and signed by the Swiss government.
With a strong tradition of innovation, ETH Zürich’s research on energy forms a key pillar of our contributions to the Agenda 2030. The Energy Science Center at ETH Zürich contributes to a collective aim of building a sustainable energy system that serves the needs of humankind, while minimizing their
environmental footprint. The center connects more than 60 faculty active in diverse fields of energy-related research, covering fundamental sciences, engineering sciences, economics, behavioral studies, as well as finance, policy and politics. To disseminate the results of our research and maximize its societal impact, ETH Zürich not only engages in teaching and outreach activities, but also works with partners from the private and public sectors, including members within the United Nations’ system.
ETH Zürich is pleased to co-publish this report with the United Development Programme. It addresses the Agenda 2030 Sustainable Development Goal 7 (SDG7) – to “Ensure access to affordable, reliable, sustainable and modern energy for all” – from a finance and policy perspective. There has been significant progress in technologies that enable off-grid access to clean, affordable and reliable energy, such as solar photovoltaics, batteries, and mobile communication. However, for these technologies to succeed there seems to be a missing link. A more favorable regulatory and institutional environment as well as greater access to private capital is necessary in order for such technologies to tap their full potential. The de-risking framework for mini-grids developed in this report presents a strategy to overcome bottlenecks and enable large-scale investment in off-grid energy access. It, thereby, represents an important piece in the puzzle for creating a sustainable global energy system.
I am proud that ETH Zürich together with the UNDP has produced the data used to create this report and hope that it furthers the significant progress made towards meeting SDG7. ETH Zürich will continue to collaborate with academia, industry, and the public sector to contribute to all of the Sustainable Development Goals.
Lino Guzzella President of ETH Zürich

1
13Derisking Renewable Energy Investment: Off-Grid Electrification

Derisking Renewable Energy Investment: Off-Grid Electrification14
Executive Summary
Derisking Renewable Energy Investment: Off-Grid Electrification 15
Executive Summary
Executive Summary
The objective of this report is to support policymakers in identifying cost-effective public instruments to promote private investment in solar photovoltaic (PV)-battery mini-grids (solar mini-grids) in developing countries.
This report expands UNDP’s existing Derisking Renewable Energy Investment (DREI) framework (UNDP, 2013) to solar mini-grids. The report introduces methodological concepts and tools, including an open source Excel-based LCOE tool, and then sets out the results of two illustrative case studies in Uttar Pradesh, India and in Kenya. This report has been prepared by UNDP in collaboration with ETH Zürich.
Opportunity for off-grid renewable energy Worldwide, around 1 billion people currently lack access to electricity as of 2016 (WB, 2018; IEA, 2017), of which 87% live in rural areas (WB, 2018). Electrifying this population can pay huge dividends in terms of human development.
A real opportunity exists in the coming years to meet this challenge with private sector solutions for off-grid renewable energy, either via solar mini-grids or solar home systems (SHS). Three key trends are converging behind this opportunity: first, continued reductions in hardware costs – in solar modules, batteries and energy efficient appliances; second, a digital revolution, with mobile communication technology facilitating payments and monitoring, as well as new fintech solutions (for example, end-user credit assessment); and third, innovation in business models, such as pay-as-you go (PAYG) and third-party ownership for solar home systems, which offer energy as a service, and can remove previously prohibitive up-front costs for households.
A remaining challenge is to increase investment from current levels. If universal electrification is to be achieved by 2030, it is estimated that USD 52 billion in annual investment will need to be made (IEA, 2017). In solar mini-grids, nearly all current investment is financed through grants and non-commercial, patient equity. In PAYG solar home systems, financing is further advanced, and tier 1 companies are now beginning to access debt, albeit often at favourable, not fully commercial terms. If off-grid electrification is to truly scale, there is a need to access commercial debt financing at large volumes. In the longer term, developing domestic, local-currency sources of financing – to avoid foreign exchange risk – will also be key.
In a private-sector led, fast-moving context, government efforts to support such off-grid renewable energy solutions have often, to date, been lagging. Private sector actors often express indifference with current regulations, and point to burdensome or poorly-formulated public measures. This report seeks to specifically address this policy gap for solar mini-grids, providing policymakers with guidance on implementing systematic, well-designed public instruments – seeking to intelligently support and grow the sector as it evolves into a mature market.
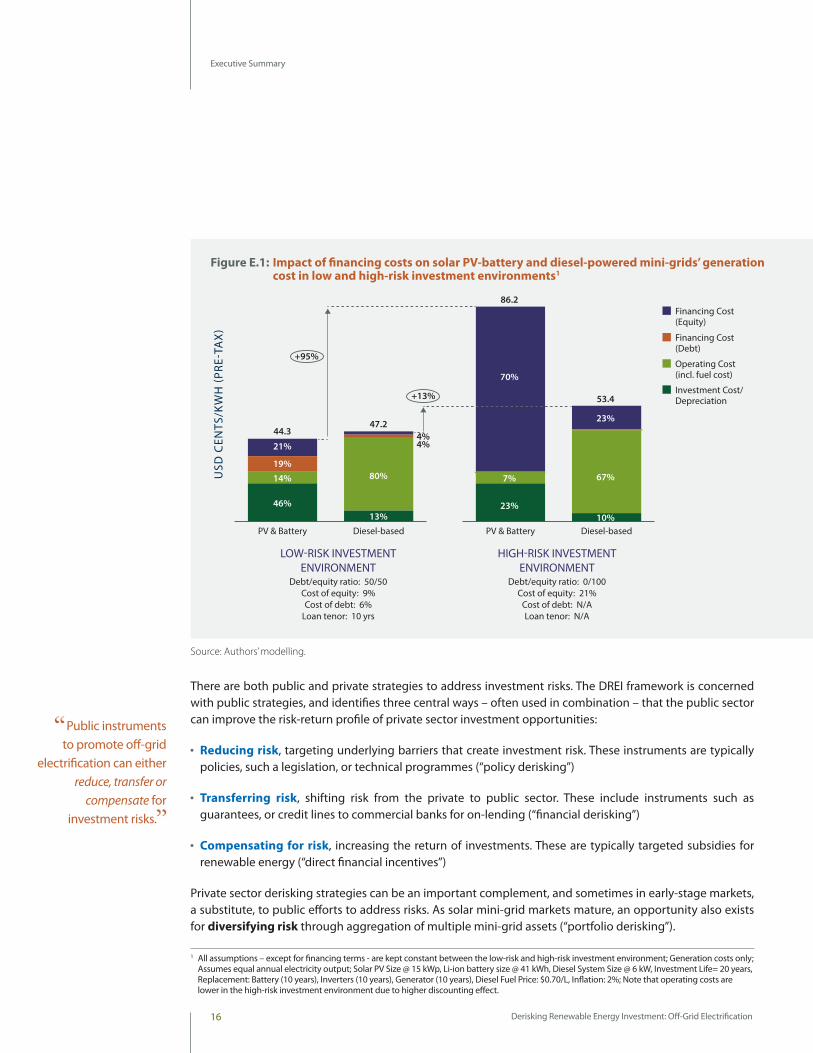
DREI framework for solar mini-grids A central focus of the DREI framework described in this report is on private sector financing costs – an investment’s capital structure, and investors’ required return on equity and debt. As illustrated in Figure E.1, due to their capital intensity, solar mini-grids are penalized in high financing cost environments. Developing countries often exhibit high financing costs for renewable energy due to investment risks that can exist in early-stage markets. An opportunity is for policymakers to systematically address these investment risks, lowering financing costs and leading to competitive investment.
If universal electrification is to be achieved by 2030, it is estimated that USD 52 billion in annual investment will need to be made.
Due to their capital intensity, solar mini-grids are penalized in high financing cost environments.
Derisking Renewable Energy Investment: Off-Grid Electrification16
Executive Summary
LOW-RISK INVESTMENTENVIRONMENT
Debt/equity ratio: 50/50Cost of equity: 9%Cost of debt: 6%
Loan tenor: 10 yrs
Debt/equity ratio: 0/100Cost of equity: 21%
Cost of debt: N/ALoan tenor: N/A
HIGH-RISK INVESTMENTENVIRONMENT
USD
CEN
TS/K
WH
(PRE
-TA
X)
Diesel-basedPV & Battery Diesel-basedPV & Battery
Financing Cost (Equity)
Financing Cost (Debt)
Operating Cost (incl. fuel cost)
Investment Cost/Depreciation
46%
14%19%
21%
44.3
+95%
13%
80%
4%4%
47.2
23%
7%
70%
86.2
10%
67%
23%
53.4+13%
There are both public and private strategies to address investment risks. The DREI framework is concerned with public strategies, and identifies three central ways – often used in combination – that the public sector can improve the risk-return profile of private sector investment opportunities:
●● Reducing risk, targeting underlying barriers that create investment risk. These instruments are typically policies, such a legislation, or technical programmes (“policy derisking”)
●● Transferring risk, shifting risk from the private to public sector. These include instruments such as guarantees, or credit lines to commercial banks for on-lending (“financial derisking”)
●● Compensating for risk, increasing the return of investments. These are typically targeted subsidies for renewable energy (“direct financial incentives”)
Private sector derisking strategies can be an important complement, and sometimes in early-stage markets, a substitute, to public efforts to address risks. As solar mini-grid markets mature, an opportunity also exists for diversifying risk through aggregation of multiple mini-grid assets (“portfolio derisking”).
Figure E.1: Impact of financing costs on solar PV-battery and diesel-powered mini-grids’ generation cost in low and high-risk investment environments1
Source: Authors’ modelling.
1 All assumptions – except for financing terms - are kept constant between the low-risk and high-risk investment environment; Generation costs only; Assumes equal annual electricity output; Solar PV Size @ 15 kWp, Li-ion battery size @ 41 kWh, Diesel System Size @ 6 kW, Investment Life= 20 years, Replacement: Battery (10 years), Inverters (10 years), Generator (10 years), Diesel Fuel Price: $0.70/L, Inflation: 2%; Note that operating costs are lower in the high-risk investment environment due to higher discounting effect.
Public instruments to promote off-grid
electrification can either reduce, transfer or
compensate for investment risks.
Derisking Renewable Energy Investment: Off-Grid Electrification 17
Executive Summary
This report introduces a new version of a DREI tool, a “derisking table” for solar mini-grids (see Chapter 4), with the aim of providing some structure for policymakers in understanding investment risks and selecting public instruments to promote solar mini-grid investment. The derisking table introduces a taxonomy of nine independent investment risks, 21 underlying barriers, and associated stakeholder groups. It then sets out matching policy and financial derisking instruments.
A key theme in the report is that public measures for solar mini-grids can be phased, targeting different stages as solar mini-grid markets mature. In this regard, one of the report’s recommendations is that policymakers consider implementing a dual regulatory regime for solar mini-grids, establishing two parallel regimes at the same time.
●● A light-touch regime with minimal regulatory burden for private sector actors – with no concessions, and simple self-registration by mini-grid operators – can allow operators to move fast and can promote experimentation in business models, but will likely be limited to equity financing.
●● A comprehensive regime – offering exclusive concessions, the possibility of subsidies to operators, with related regulated tariffs, and compensation in case of grid expansion - can provide a favourable regulatory environment, in turn attracting debt financing.
Importantly, mini-grid operators active under the light-touch regime can graduate to the comprehensive regime via a right-of-first-refusal. Overall, by implementing both tracks simultaneously, governments can provide flexibility to build their own administrative capacity, and can best facilitate innovation and evolution as the mini-grid sector grows, in particular as it moves to scale with eventual commercial debt financing.
Case studies – overview and business modelIn order to demonstrate the new DREI framework for solar mini-grids, the report applies the methodology to two case studies, in the state of Uttar Pradesh, India and in Kenya.
Each of the case studies assumes a government deployment target for solar mini-grids, to be achieved in the period from 2018 to 2023. This is a private sector investment target, which is assumed will be met with commercial financing. The report’s 2023 target for Uttar Pradesh, India amounts to 25,000 mini-grids (323 MW total), serving 15 million people; in Kenya the target is 8,000 mini-grids (77 MW total), serving 3.52 million people. In both cases, this equates to 10% of the unelectrified population by 2023.
Uttar Pradesh, India and Kenya have been selected for the case studies as they are both currently promising centres for solar mini-grids, with initial government policies in place, and active private sector developers. They can also act as an interesting comparison: Uttar Pradesh, India has lower irradiation, subsidised grid-connected tariffs, and the modelling assumes local currency financing; Kenya has higher irradiation, a digital finance culture, and assumed hard currency financing. Both cases studies have no diesel subsidies.
The private sector today is experimenting with a wide variety of solar mini-grid models. For modelling purposes, the case studies assume generic 13 kW (Uttar Pradesh) and10 kW (Kenya) system sizes, with a
A key theme in the report is that public measures for solar mini-grids can be phased, targeting different stages of maturity of the underlying sector.
Derisking Renewable Energy Investment: Off-Grid Electrification18
Executive Summary
40 kWh battery (lithium-ion)2. This assumes systems sized to serve 100 households, at 95% reliability, for a MTF Tier 2-3 service level (lighting and mobile phone charging and small, energy efficient appliances), together with limited productive and community use.
Both case studies assume a private sector build-own-operate (BOO) model, and that the private sector takes an aggregative approach to solar mini-grids, improving financial viability by creating economies of scale and lowering the transaction costs related to individual solar mini-grids. A modular design approach is also taken, bringing down design costs, and facilitating future adjustments to system sizing, as demand evolves to incorporate further productive use.
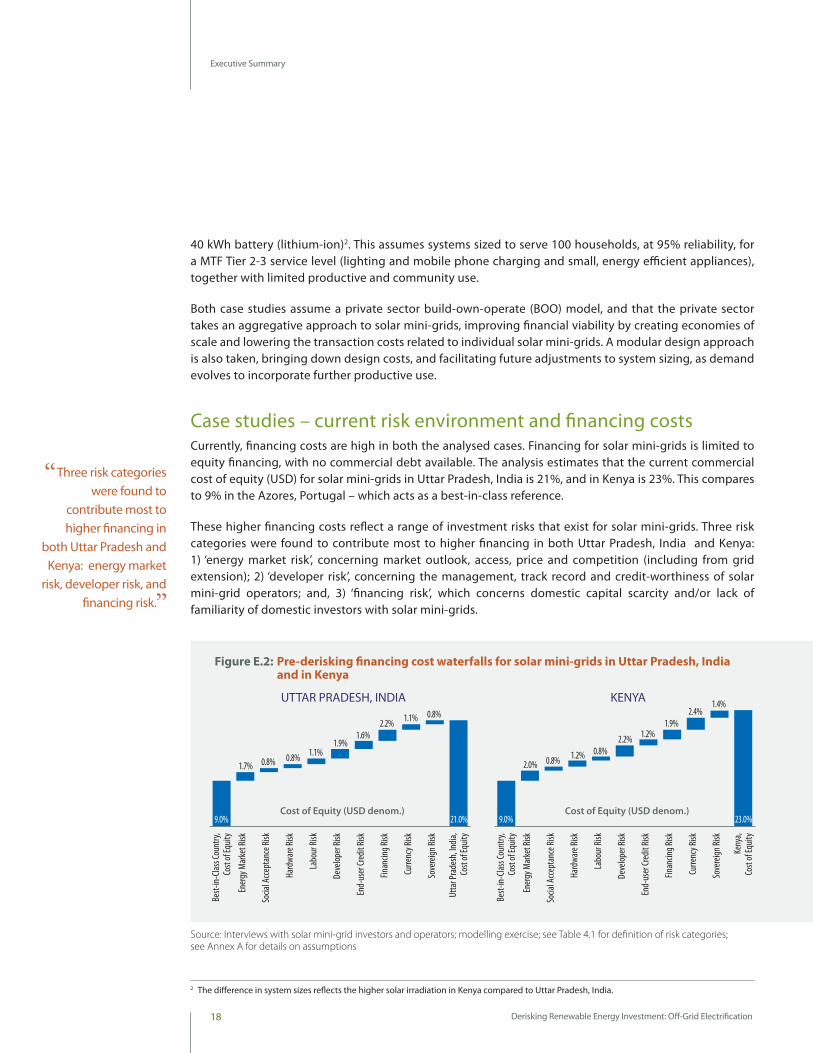
Case studies – current risk environment and financing costs Currently, financing costs are high in both the analysed cases. Financing for solar mini-grids is limited to equity financing, with no commercial debt available. The analysis estimates that the current commercial cost of equity (USD) for solar mini-grids in Uttar Pradesh, India is 21%, and in Kenya is 23%. This compares to 9% in the Azores, Portugal – which acts as a best-in-class reference.
These higher financing costs reflect a range of investment risks that exist for solar mini-grids. Three risk categories were found to contribute most to higher financing in both Uttar Pradesh, India and Kenya: 1) ‘energy market risk’, concerning market outlook, access, price and competition (including from grid extension); 2) ‘developer risk’, concerning the management, track record and credit-worthiness of solar mini-grid operators; and, 3) ‘financing risk’, which concerns domestic capital scarcity and/or lack of familiarity of domestic investors with solar mini-grids.
Cost of Equity (USD denom.)
UTTAR PRADESH, INDIA
Utta
r Pra
desh
, India
,Co
st of
Equit
y
Sove
reign
Risk
Curre
ncy R
isk
Finan
cing R
isk
End-
user
Cred
it Ri
sk
Deve
loper
Risk
Labo
ur Ri
sk
Hard
ware
Risk
Socia
l Acc
epta
nce R
isk
Ener
gy M
arke
t Risk
Best-
in-C
lass C
ount
ry,Co
st of
Equit
y
9.0% 21.0%
1.7%
0.8%
0.8% 0.8% 1.1% 1.9%
1.6% 2.2% 1.1%
Cost of Equity (USD denom.)
KENYA
Keny
a,Co
st of
Equit
y
Sove
reign
Risk
Curre
ncy R
isk
Finan
cing R
isk
End-
user
Cred
it Ri
sk
Deve
loper
Risk
Labo
ur Ri
sk
Hard
ware
Risk
Socia
l Acc
epta
nce R
isk
Ener
gy M
arke
t Risk
Best-
in-C
lass C
ount
ry,Co
st of
Equit
y
9.0% 23.0%
2.0%
1.4%
0.8% 1.2% 0.8% 2.2% 1.2%
1.9% 2.4%
Figure E.2: Pre-derisking financing cost waterfalls for solar mini-grids in Uttar Pradesh, India and in Kenya
Source: Interviews with solar mini-grid investors and operators; modelling exercise; see Table 4.1 for definition of risk categories; see Annex A for details on assumptions
Three risk categories were found to
contribute most to higher financing in
both Uttar Pradesh and Kenya: energy market
risk, developer risk, and financing risk.
2 The difference in system sizes reflects the higher solar irradiation in Kenya compared to Uttar Pradesh, India.
Derisking Renewable Energy Investment: Off-Grid Electrification 19
Executive Summary
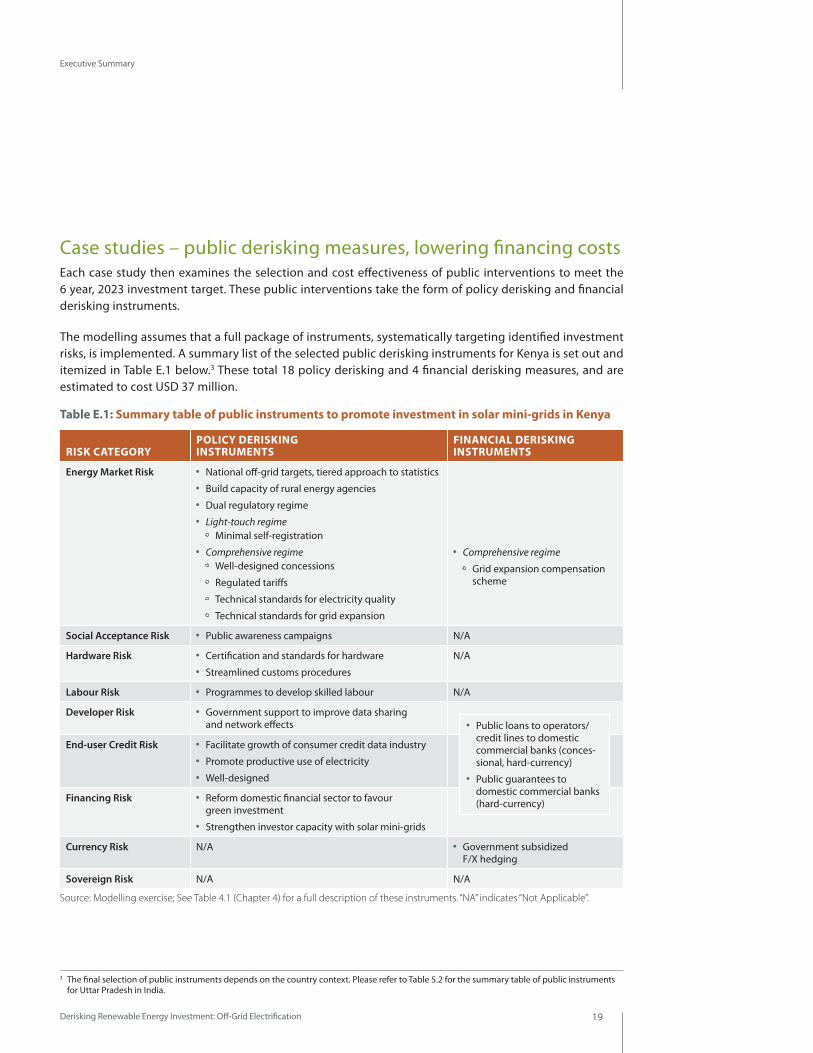
Case studies – public derisking measures, lowering financing costs Each case study then examines the selection and cost effectiveness of public interventions to meet the 6 year, 2023 investment target. These public interventions take the form of policy derisking and financial derisking instruments.
The modelling assumes that a full package of instruments, systematically targeting identified investment risks, is implemented. A summary list of the selected public derisking instruments for Kenya is set out and itemized in Table E.1 below.3 These total 18 policy derisking and 4 financial derisking measures, and are estimated to cost USD 37 million.
Table E.1: Summary table of public instruments to promote investment in solar mini-grids in Kenya
3 The final selection of public instruments depends on the country context. Please refer to Table 5.2 for the summary table of public instruments for Uttar Pradesh in India.
RISK CATEGORYPOLICY DERISKING INSTRUMENTS
FINANCIAL DERISKING INSTRUMENTS
Energy Market Risk ●● National off-grid targets, tiered approach to statistics●● Build capacity of rural energy agencies●● Dual regulatory regime ●● Light-touch regime
Minimal self-registration●● Comprehensive regime
Well-designed concessions
Regulated tariffs
Technical standards for electricity quality
Technical standards for grid expansion
●● Comprehensive regime
Grid expansion compensation scheme
Social Acceptance Risk ●● Public awareness campaigns N/A
Hardware Risk ●● Certification and standards for hardware●● Streamlined customs procedures
N/A
Labour Risk ●● Programmes to develop skilled labour N/A
Developer Risk ●● Government support to improve data sharing and network effects
End-user Credit Risk ●● Facilitate growth of consumer credit data industry ●● Promote productive use of electricity ●● Well-designed
Financing Risk ●● Reform domestic financial sector to favour green investment
●● Strengthen investor capacity with solar mini-grids
Currency Risk N/A ●● Government subsidized F/X hedging
Sovereign Risk N/A N/A
Source: Modelling exercise; See Table 4.1 (Chapter 4) for a full description of these instruments. “NA” indicates “Not Applicable”.
●● Public loans to operators/credit lines to domestic commercial banks (conces-sional, hard-currency)
●● Public guarantees to domestic commercial banks (hard-currency)
Derisking Renewable Energy Investment: Off-Grid Electrification20
Executive Summary
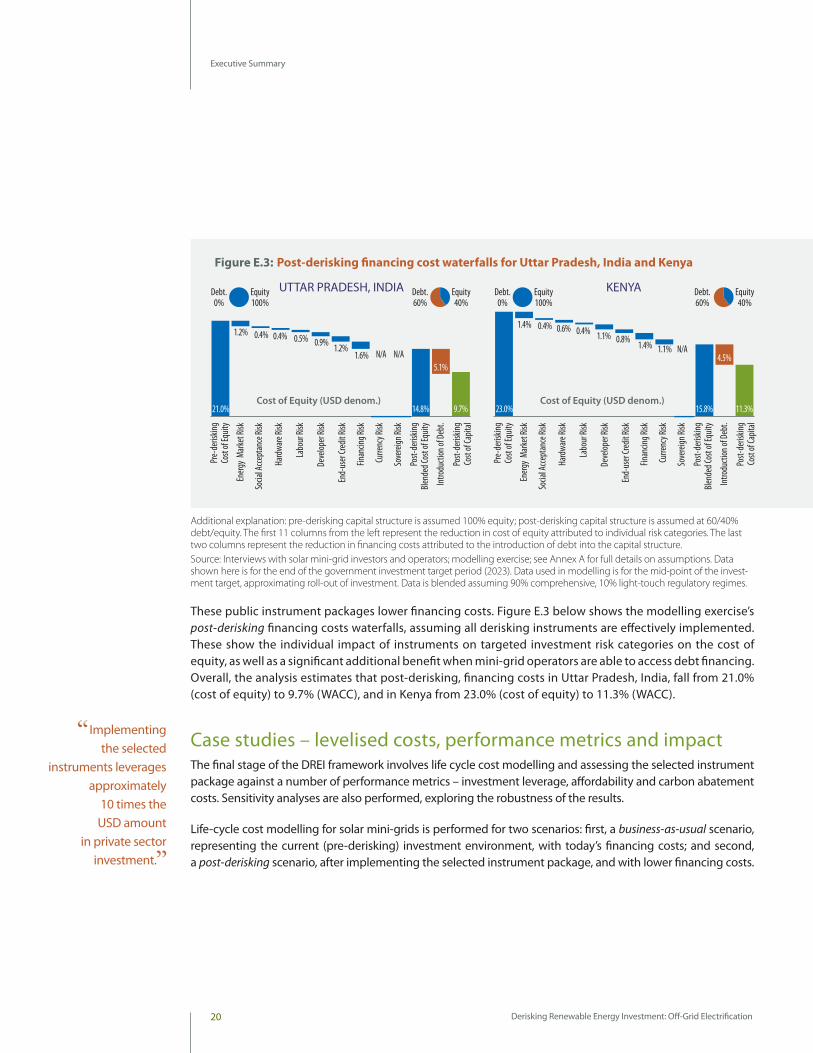
These public instrument packages lower financing costs. Figure E.3 below shows the modelling exercise’s post-derisking financing costs waterfalls, assuming all derisking instruments are effectively implemented. These show the individual impact of instruments on targeted investment risk categories on the cost of equity, as well as a significant additional benefit when mini-grid operators are able to access debt financing. Overall, the analysis estimates that post-derisking, financing costs in Uttar Pradesh, India, fall from 21.0% (cost of equity) to 9.7% (WACC), and in Kenya from 23.0% (cost of equity) to 11.3% (WACC).
Case studies – levelised costs, performance metrics and impact The final stage of the DREI framework involves life cycle cost modelling and assessing the selected instrument package against a number of performance metrics – investment leverage, affordability and carbon abatement costs. Sensitivity analyses are also performed, exploring the robustness of the results.
Life-cycle cost modelling for solar mini-grids is performed for two scenarios: first, a business-as-usual scenario, representing the current (pre-derisking) investment environment, with today’s financing costs; and second, a post-derisking scenario, after implementing the selected instrument package, and with lower financing costs.
Cost of Equity (USD denom.)
UTTAR PRADESH, INDIA
Post-
deris
king
Blend
ed Co
st of
Equit
y
Introd
uctio
n of D
ebt.
Post-
deris
king
Cost
of Ca
pital
Sove
reign
Risk
Curre
ncy R
isk
Finan
cing R
isk
End-
user
Credit
Risk
Deve
loper
Risk
Labo
ur Ri
sk
Hard
ware
Risk
Socia
l Acce
ptan
ce Ri
sk
Energ
y Ma
rket R
isk
Pre-
deris
king
Cost
of Eq
uity
21.0% 9.7%
5.1%
14.8%
1.2%
N/A
0.4% 0.4% 0.5% 0.9% 1.2% 1.6% N/A
Equity40%
Debt.60%
Equity100%
Debt.0%
Cost of Equity (USD denom.)
KENYA
Post-
deris
king
Blend
ed Co
st of
Equit
y
Introd
uctio
n of D
ebt.
Post-
deris
king
Cost
of Ca
pital
Sove
reign
Risk
Curre
ncy R
isk
Finan
cing R
isk
End-
user
Credit
Risk
Deve
loper
Risk
Labo
ur Ri
sk
Hard
ware
Risk
Socia
l Acce
ptan
ce Ri
sk
Energ
y Ma
rket R
isk
Pre-
deris
king
Cost
of Eq
uity
23.0% 11.3%
4.5%
15.8%
1.4%
N/A
0.4% 0.6% 0.4% 1.1% 0.8% 1.4% 1.1%
Equity40%
Debt.60%
Equity100%
Debt.0%
Figure E.3: Post-derisking financing cost waterfalls for Uttar Pradesh, India and Kenya
Additional explanation: pre-derisking capital structure is assumed 100% equity; post-derisking capital structure is assumed at 60/40% debt/equity. The first 11 columns from the left represent the reduction in cost of equity attributed to individual risk categories. The last two columns represent the reduction in financing costs attributed to the introduction of debt into the capital structure. Source: Interviews with solar mini-grid investors and operators; modelling exercise; see Annex A for full details on assumptions. Data shown here is for the end of the government investment target period (2023). Data used in modelling is for the mid-point of the invest-ment target, approximating roll-out of investment. Data is blended assuming 90% comprehensive, 10% light-touch regulatory regimes.
Implementing the selected
instruments leverages approximately
10 times the USD amount
in private sector investment.
Derisking Renewable Energy Investment: Off-Grid Electrification 21
Executive Summary
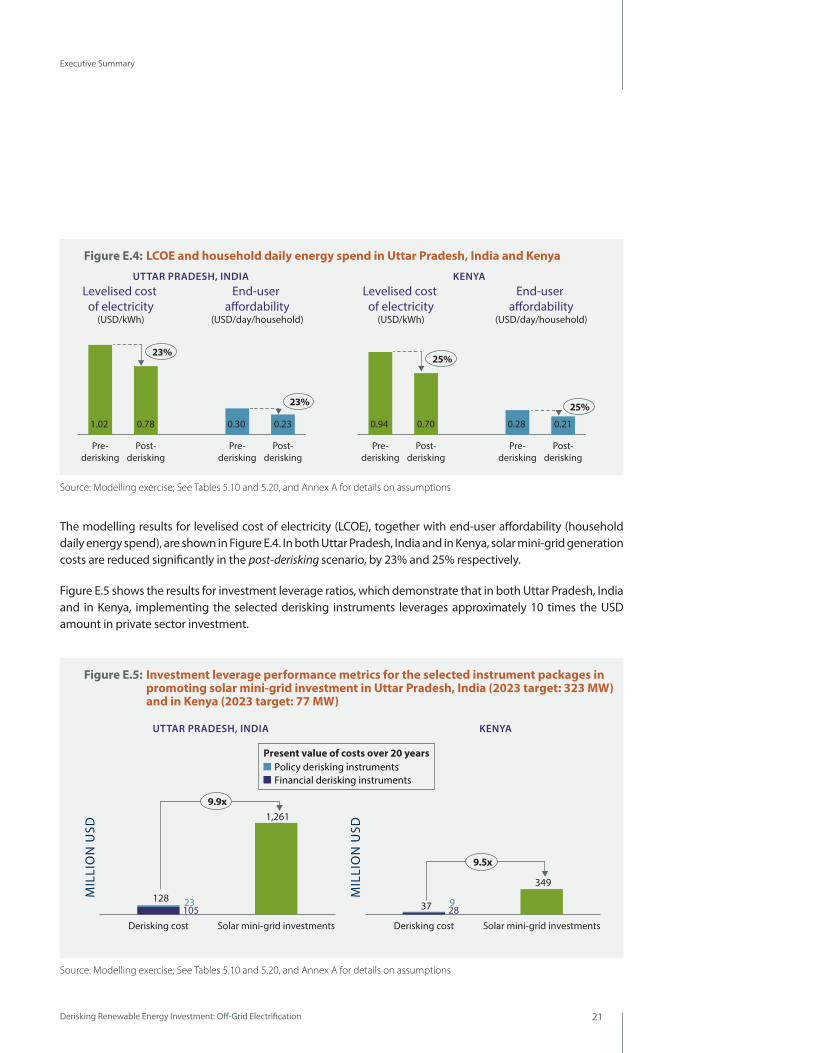
The modelling results for levelised cost of electricity (LCOE), together with end-user affordability (household daily energy spend), are shown in Figure E.4. In both Uttar Pradesh, India and in Kenya, solar mini-grid generation costs are reduced significantly in the post-derisking scenario, by 23% and 25% respectively.
Figure E.5 shows the results for investment leverage ratios, which demonstrate that in both Uttar Pradesh, India and in Kenya, implementing the selected derisking instruments leverages approximately 10 times the USD amount in private sector investment.
Figure E.4: LCOE and household daily energy spend in Uttar Pradesh, India and Kenya
Figure E.5: Investment leverage performance metrics for the selected instrument packages in promoting solar mini-grid investment in Uttar Pradesh, India (2023 target: 323 MW) and in Kenya (2023 target: 77 MW)
Source: Modelling exercise; See Tables 5.10 and 5.20, and Annex A for details on assumptions
Source: Modelling exercise; See Tables 5.10 and 5.20, and Annex A for details on assumptions
Post-derisking
Pre-derisking
Post-derisking
Pre-derisking
23%
1.02 0.30 0.230.78
23%
Levelised cost of electricity
(USD/kWh)
End-user a�ordability
(USD/day/household)
Post-derisking
Pre-derisking
Post-derisking
Pre-derisking
25%
0.94 0.28 0.210.70
25%
Levelised cost of electricity
(USD/kWh)
End-user a�ordability
(USD/day/household)
Solar mini-grid investmentsDerisking cost
9.9x
MIL
LIO
N U
SD 1,261
128
10523
Solar mini-grid investmentsDerisking cost
9.5x
MIL
LIO
N U
SD
349
37
289
Policy derisking instruments Present value of costs over 20 years
Financial derisking instruments
UTTAR PRADESH, INDIA
UTTAR PRADESH, INDIA
KENYA
KENYA
Derisking Renewable Energy Investment: Off-Grid Electrification22
Executive Summary
Overall, the case studies demonstrate the following impact:
●● For Uttar Pradesh, India the modelling identifies a package of derisking measures with an estimated cost of USD 128 million until 2023. These derisking measures result in the following benefits:
Proving electricity access to 15,000,000 people
Catalysing USD 1,261 million of private sector investment in solar mini-grids
Increasing affordability and lowering household daily spend on electricity by 23%, resulting in economic savings over 20 years of USD 878 million
Reducing carbon emissions by 10.8 million tonnes of CO2, relative to a diesel mini-grid alternative
●● For Kenya, the modelling identifies a package of derisking measures with an estimated cost of USD 37 million until 2023. These derisking measures result in the following benefits:
Proving electricity access to 3,520,000 people
Catalysing USD 349 million of private sector investment in solar mini-grids
Increasing affordability and lowering household daily spend on electricity by 25% resulting in economic savings over 20 years of USD 226 million.
Reducing carbon emissions by 3.5 million tonnes of CO2, relative to a diesel mini-grid alternative.
Sensitivity analyses are also performed, exploring the robustness of the results and alternative scenarios. Of note, these identify the possibility of including additional targeted direct financial incentives (subsidies) to mini-grid operators, in order to increase affordability of solar mini-grid power. Over time these financial incentives can likely be phased out, taking a ‘sunset clause’ approach, as economics further improve in the next generation of solar-mini grids (better software, lower battery costs, higher demand and ARPUs, and aggregation of assets).
Case studies – conclusionsToday’s investment environment for solar mini-grids in Uttar Pradesh, India and Kenya is made up of a number of investment risk that result in higher financing costs. The DREI framework seeks to facilitate the task of systematically identifying and then targeting these investment risks.
Through implementing the public derisking measures identified in these case studies, taking a phased approach, the opportunity is to unlock far greater investment, particularly commercial debt financing. The modelling also clearly shows that investing in public derisking measures should be cost effective, generating economic savings in the form of more affordable electricity. In addition to public derisking measures, targeted direct subsidies to mini-grid operators can also be considered, which can further increase affordability.

1
23Derisking Renewable Energy Investment: Off-Grid Electrification
Derisking Renewable Energy Investment: Off-Grid Electrification24
Introduction Chapter 1
●● The opportunity for small-scale, off-grid renewable energy
●● Supporting policymakers to promote investment
Derisking Renewable Energy Investment: Off-Grid Electrification 25
Introduction
Introduction
Worldwide, about 1 billion people currently lack access to electricity as of 2016 (WB, 2018; IEA, 2017). At the same time, technological innovation in off-grid renewable energy technologies – in particular, solar home systems (SHS) and solar photovoltaic (PV) mini-grids (solar mini-grids) - has progressed rapidly in recent years, providing new opportunities to address this situation.
Access to electricity strongly correlates with human and economic development (IEA, 2017; Riva et al., 2018). Electricity can be put to productive use (Box 1.1), providing valuable energy services for many sectors, such as health, agriculture and education. Indeed, access to electricity is closely related to the achievement of virtually every other sustainable development goal (UNDP, 2016). Electricity access also has important linkages to gender equality (Glemarec, 2016).
Recognising this key role, SDG 7 focuses on energy and aims to “ensure access to affordable, reliable, sustainable and modern energy for all”, including a specific sub-target on universal access to electricity by 2030. SDG 7 itself builds on former UN Secretary General Ban Ki Moon’s Sustainable Energy for All (SEforAll) initiative, and the 2014-2024 Decade of Sustainable Energy for All.
However, the funding needs are great. To achieve universal electrification by 2030, investments in energy access assets of an estimated USD 52 billion per year are needed (IEA, 2017). Currently, investment levels are less than half this, estimated at USD 19.4 billion per year in 2013-2014 in the 20 top access-deficit countries (SEforAll, 2017).
1
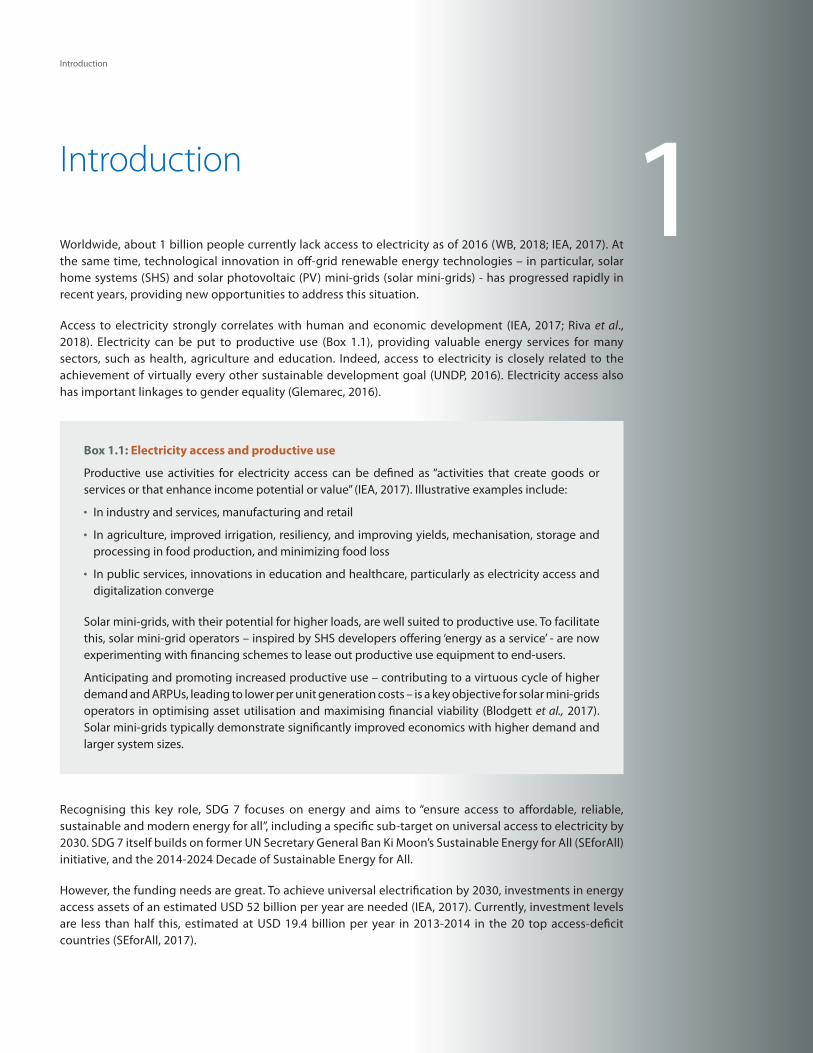
Box 1.1: Electricity access and productive use
Productive use activities for electricity access can be defined as “activities that create goods or services or that enhance income potential or value” (IEA, 2017). Illustrative examples include:
●● In industry and services, manufacturing and retail
●● In agriculture, improved irrigation, resiliency, and improving yields, mechanisation, storage and processing in food production, and minimizing food loss
●● In public services, innovations in education and healthcare, particularly as electricity access and digitalization converge
Solar mini-grids, with their potential for higher loads, are well suited to productive use. To facilitate this, solar mini-grid operators – inspired by SHS developers offering ‘energy as a service’ - are now experimenting with financing schemes to lease out productive use equipment to end-users.
Anticipating and promoting increased productive use – contributing to a virtuous cycle of higher demand and ARPUs, leading to lower per unit generation costs – is a key objective for solar mini-grids operators in optimising asset utilisation and maximising financial viability (Blodgett et al., 2017). Solar mini-grids typically demonstrate significantly improved economics with higher demand and larger system sizes.
Derisking Renewable Energy Investment: Off-Grid Electrification26
Introduction
The opportunity for small-scale, off-grid renewable energyOff-grid renewable energy – solar home systems and solar mini-grids - now present an important opportunity to meet the electricity access challenge. For the first time in history, a number of key drivers are converging: rapid cost reductions in decentralised low-carbon energy technologies (for example, solar modules, batteries and appliances), the take-up of new digital technologies (for example, mobile communications and data networks); and the emergence of innovative private sector business models for off-grid renewable energy, often using digital solutions for remote technology monitoring, operations and customer billing, are emerging. Solar mini-grids – the focus of this report - are particularly interesting as they have the potential to supply electricity at levels that enable productive use, driving local development and creating economic growth.
A key challenge remains to scale-up these promising technologies and enable large scale diffusion of off-grid renewable energy solutions. While most financing currently comes from non-commercial sources, global capital markets in principle have the size and depth to step up to this investment challenge. However, small investment sizes, as well as investment risks in early-stage markets, are currently holding back abundant and low-cost private capital flows (Schmidt, 2015).
Supporting policymakers to promote investment The objective of this report is to support policymakers in identifying cost-effective public instruments to promote private investment in solar mini-grids in developing countries. The report introduces methodological concepts and tools, including an open source Excel-based LCOE tool.
In a private-sector led, fast-moving context, government efforts to support off-grid renewable energy solutions have often, to date, been lagging. Private sector actors often express indifference with current regulations, and point to burdensome or poorly-formulated public measures. This report seeks to specifically address this policy gap for solar mini-grids, providing policymakers with guidance on implementing systematic, well-designed public instruments – seeking to intelligently support and grow the sector as it evolves into a mature market.
This report builds on the original Derisking Renewable Energy Investment (DREI) report (Box 1.2), which UNDP published in 2013 (UNDP, 2013) and which focused on utility-scale renewable energy. This report now expands the framework and methodology to solar mini-grids. This report has been prepared by UNDP in collaboration with ETH Zürich.
The remainder of this report is structured in five additional chapters. Chapter 2 provides background information on electricity access. Chapter 3 introduces the theory of change and the potential of public instrument packages to derisk solar mini-grid investments. In Chapter 4 a derisking table for solar mini-grids is introduced. Chapter 5 presents two case studies: in Uttar Pradesh, India and Kenya, before conclusions are provided in Chapter 6.
Derisking Renewable Energy Investment: Off-Grid Electrification 27
Introduction
Box 1.2: UNDP’s Derisking Renewable Energy Investment (DREI) framework
Derisking Renewable Energy Investment (DREI) is an innovative, data-rich framework to assist policymakers in developing countries to cost-effectively promote investment in renewable energy. It consists of a suite of publicly-available methodologies, financial tools/models and resources.
The DREI framework’s approach involves systematically identifying the barriers and associated risks which can hold back private sector investment in renewable energy. It then assists policymakers to put in place packages of targeted public interventions to address these risks. Each public intervention acts in one of three ways: either reducing, transferring or compensating for risk. The overall aim is to cost-effectively achieve a risk-return profile that catalyses private sector investment at scale.
Launched in 2013, the DREI framework originally focused on utility-scale renewable energy. More recently in 2018 - including via this report - the framework has been expanded to on-grid rooftop PV, off-grid solar mini-grids, and off-grid solar home systems.
For more information, please visit www.undp.org/DREI, including
●● The original DREI report, outlining the framework and methodology
●● Country applications, in which the DREI framework has been used in practice for policymaking
●● Resources and tools (derisking tables, LCOE Excel models)
Derisking Renewable Energy Investment: Off-Grid Electrification28
The Opportunity for Off-grid Renewable Energy
●● 2.1 Electricity access: current status and trends
●● 2.2 The drivers of change
●● 2.3 The role of financing
Chapter 2
Derisking Renewable Energy Investment: Off-Grid Electrification 29
The Opportunity for Off-grid Renewable Energy
The Opportunity for Off-grid Renewable Energy
Today off-grid renewable energy solutions - in the form of solar home systems and solar mini-grids - offer promise as a new, scalable, private sector approach to achieve universal electrification, alongside the existing approach of grid extension. This chapter provides brief highlights on key, emerging themes. For more comprehensive information, readers are invited to review the substantial body of recent, high-quality literature in this area (for example: IEA, 2017; WB, 2018).
This chapter begins with an overview of the scale and status of electrification, and innovations in public policies to measure and plan for it. The chapter then identifies key trends supporting private sector solutions for off-grid renewable energy. Finally, the chapter identifies lack of commercial financing at scale as a critical barrier, an issue which forms a core theme of this report.
2.1 Electricity access: current status and trendsAs of 2016, about 1 billion people in developing countries, or 13% of the world’s population, lack access to electricity (WB, 2018; IEA, 2017). The vast majority of people lacking electricity access are located in countries in sub-Saharan Africa and developing Asia, with a large concentration in the top 20 access-deficit countries, who collectively represent 79% of the global total (WB, 2018). Reflecting an urban-rural divide, 87% of the world’s unelectrified population live in rural areas (WB, 2018).
Recognising limitations in binary assessments of electrification (electrified vs. non-electrified), policymakers are increasingly seeking to use more nuanced analyses, incorporating a number of factors, such as quality of service (Box 2.1).
2
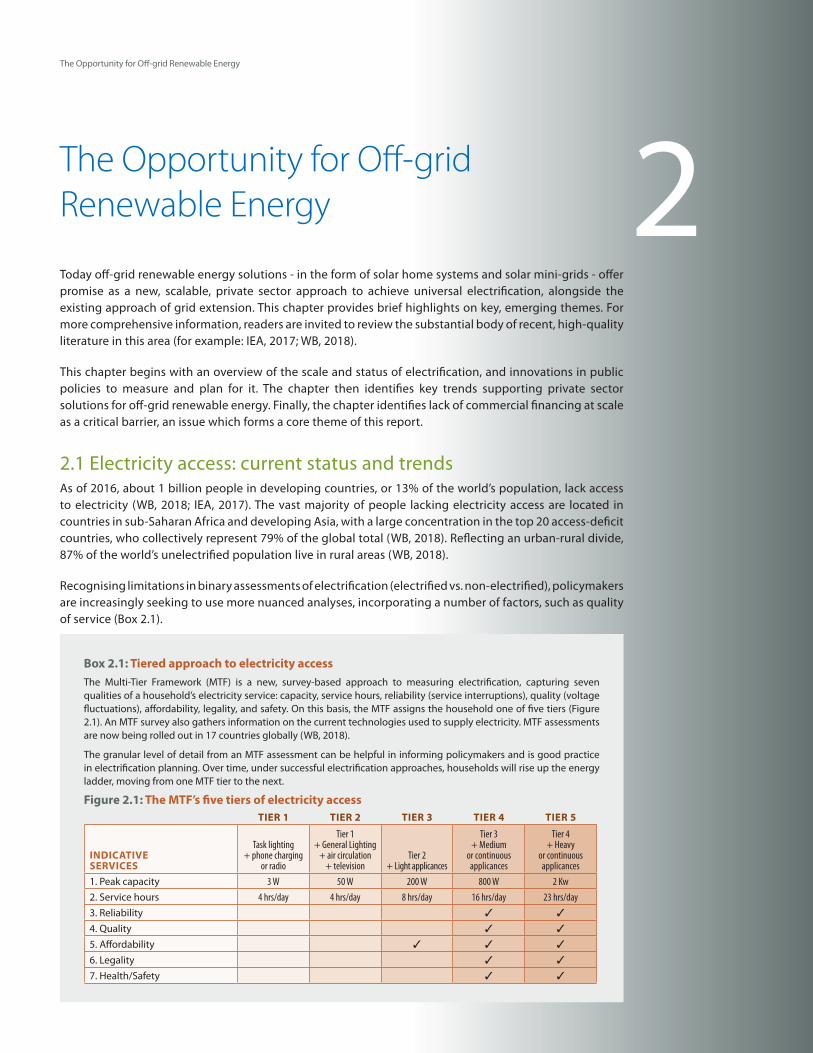
Box 2.1: Tiered approach to electricity access The Multi-Tier Framework (MTF) is a new, survey-based approach to measuring electrification, capturing seven qualities of a household’s electricity service: capacity, service hours, reliability (service interruptions), quality (voltage fluctuations), affordability, legality, and safety. On this basis, the MTF assigns the household one of five tiers (Figure 2.1). An MTF survey also gathers information on the current technologies used to supply electricity. MTF assessments are now being rolled out in 17 countries globally (WB, 2018).
The granular level of detail from an MTF assessment can be helpful in informing policymakers and is good practice in electrification planning. Over time, under successful electrification approaches, households will rise up the energy ladder, moving from one MTF tier to the next.
Figure 2.1: The MTF’s five tiers of electricity accessTIER 1 TIER 2 TIER 3 TIER 4 TIER 5
INDICATIVE SERVICES
Task lighting + phone charging
or radio
Tier 1 + General Lighting
+ air circulation + television
Tier 2 + Light applicances
Tier 3 + Medium
or continuous applicances
Tier 4 + Heavy
or continuous applicances
1. Peak capacity 3 W 50 W 200 W 800 W 2 Kw2. Service hours 4 hrs/day 4 hrs/day 8 hrs/day 16 hrs/day 23 hrs/day3. Reliability ✓ ✓
4. Quality ✓ ✓
5. Affordability ✓ ✓ ✓
6. Legality ✓ ✓
7. Health/Safety ✓ ✓
Derisking Renewable Energy Investment: Off-Grid Electrification30
The Opportunity for Off-grid Renewable Energy
Significant progress in extending electrification has been made in recent decades, with close to 1.2 billion people having gained access since 2000, nearly entirely through grid extension. Of note, in India, 500 million people have been electrified since 2000, doubling India’s electrification rate (IEA, 2017). However, particularly given population growth, the rate of provision of electricity needs to meet global targets. On current trends, an estimated 674 million people, nearly all in sub-Saharan Africa, will be without electricity in 2030 (IEA, 2017).
If universal access to electricity is indeed to be achieved by 2030, off-grid renewable energy is likely to be a key technology solution. Using the latest geospatial modelling approaches (Box 2.2), the IEA’s Energy For All scenario - which achieves universal electrification at lowest cost - estimates that 60% of people will be electrified by solar home systems and solar mini-grids (split equally) (IEA, 2017).
2.2 The drivers of changeIn recent decades, electricity access has largely relied on a model of constructing large, centralized power plants and extending publicly-funded grid connections to previously un-electrified households. In certain countries this has proved successful; in other countries, the existing poor financial health of grid-connected power systems has held back progress.
Today, private sector solutions for off-grid renewable energy – namely solar home systems and solar mini-grids – offer great potential for electricity access. Three disruptive trends are converging behind this opportunity.
Box 2.2: Geospatial modelling of least-cost electrification options
A valuable new tool for electrification planning is geospatial modelling. This can compare the relative cost of different technology options – on-grid (grid expansion), solar mini-grids, or solar home systems – based on a host of data and modelling inputs,including: population density; local renewable energy resources; household budgets; target level/tiers of electricity access; pre-existing and planned transmission and generation infrastructure; technology learning curves; and, fuel costs (IEA, 2017; Van Ruijven et al., 2012; Nerini et al. 2016). Recently, digital companies such as Google and Facebook are also feeding in new data sets, for example smartphone use and charging.
Until a few years ago, geospatial modelling was prohibitively expensive due to resource-intensive data gathering. However, new low-cost modelling options, such as KTH-dESA’s OpeN Source Spatial Electrification Toolkit (ONSSET), have now become available, marrying geographic information systems (GIS) and open-access geospatial data. Open-access data is generally of good quality. Where available, high-quality national data sets can substitute for open-access data.
Geospatial analyses were used by the IEA (2017) in its World Economic Outlook, modeling technology options to achieve universal electricity access by 2030 in sub-Saharan Africa to a resolution of 1km squared. Latest applications are now achieving resolutions of 100 meters, and even 30 meters, squared.
Derisking Renewable Energy Investment: Off-Grid Electrification 31
The Opportunity for Off-grid Renewable Energy
First, the cost of hardware for clean energy technologies have fallen dramatically. On the generation side, solar PV module costs have decreased by more than 99% in the last 40 years (IRENA, 2012). Battery technologies are evolving and similarly becoming more efficient, moving from lead-acid to lithium-ion, and lithium-ion battery cell costs have fallen by 79% since 2010 (BNEF, 2017). On the demand side, an important development has been recent improvements in energy efficient appliances (Box 2.3), closely relating to new business models around ‘energy as a service’, and offering households an entire hardware package, including appliances (IRENA, 2015; Kavlak et al., 2016; Kittner et al., 2017).
Second, digitalisation has revolutionised operational models for off-grid energy services. Mobile communications have facilitated new payment models (mobile money, allowed for remote shut-off in case of non-payments, and real-time monitoring of hardware performance). New software allows for smart meters, and differentiated tariffs. Fintech solutions, often related to mobile money, have transformed approaches to end-user credit assessment (SDFA, 2018). The end results has been to allow private electrification entrepreneurs to provide better service while managing their customers at lower cost (Alstone et al., 2015).
Box 2.3: Energy-efficient appliances for electricity access
In recent years, there have been dramatic gains in the efficiency of appliances relevant to electricity access (Global LEAP, 2016). Previously, many common appliances consumed too much power to be cost-effectively supported by off-grid renewable energy. However innovation in designs, combined with lower hardware costs, have opened the door to new, super-efficient appliances. Similar to the recent emergence of LED lighting, progress is now being made in other areas: for televisions, there has been a shift to LCD technologies, backlit with LEDs; other appliances, including fans and refrigerators are now manufactured in more energy-efficient, direct current (DC) versions.
As an illustration, for a typical household appliance package - four lightbulbs, a TV, a fan, a mobile phone charger and a refrigerator – standard efficiency appliances can consume 1,250 kWh per year. Highly efficient appliances reduce can this greatly, consuming approximately a third of the power. Higher cost of efficient appliances is more than offset by the cost savings in supply of electricity, in this scenario generating overall net savings per household of USD 150 per year (IEA, 2017)
The use of efficient appliances is closely related to ‘energy as a service’ business models. Third party ownership models involving innovative lease and financing arrangements, where off-grid developers spread the upfront cost of appliance hardware over time, can facilitate end-user uptake.
Derisking Renewable Energy Investment: Off-Grid Electrification32
The Opportunity for Off-grid Renewable Energy
Third, there has been tremendous innovation in terms of private sector business models. The solar home system sector has seen significant innovation, with third party ownership models where SHS companies offer rent-to-own or perpetual lease services. These service offerings combine technology and financing, and have the advantage of eliminating up-front costs for households. In solar mini-grids, there are a variety of different ownership models, market strategies and approaches. An important area for solar mini-grids are opportunities around aggregation and modular approaches (Box 2.4).
2.3 The role of financing Several studies have shown that the level of investments into infrastructure for electricity access needs to be scaled up significantly to achieve the goal of universal electrification by 2030. The IEA estimates that USD 52 billion annual investment is required to achieve this target (IEA, 2017). Currently, total investment levels are less than half this, estimated at USD 19.4 billion per year in 2013-2014 in the 20 top access-deficit countries (SEforAll, 2017), and nearly entirely spent on traditional grid-extension. It is further clear that private finance will be key to meeting SDG 7 (UNCTAD, 2014).
Box 2.4: Geospatial modelling of least-cost electrification options
If private sector approaches to solar mini-grids (Zerriffi, 2011) are to be financially viable, it will be key to reduce costs across the board. A challenge with an individual solar mini-grid is its relatively small investment size, which can be challenging to finance. To this end, two complementary approaches – aggregation and modular approaches - are helpful:
Aggregation involves the bundling of multiple mini-grid sites under a particular operator. This can have various benefits (Gershenson et al., 2015), including:
●● Increasing total financing requirements, thereby reducing transaction costs relative to each mini-grid, and accessing new asset classes with higher USD thresholds
●● Benefiting from risk diversification across a portfolio of mini-grid sites. Financing may be structured at the corporate level, or as an SPV. Non-correlated risks at multiple sites can offset each-other. Initial research has shown this may reduce financing costs by up to 4%-points (Malhotra et al., 2017).
●● Operationally, clustering of sites in close proximity can reduce – via lower transport and staff costs - initial investment costs and on-going maintenance costs
Modular approaches to system design involve standardized approaches to initial sizing of the electricity generation, storage, distribution, and control components, while already planning for step-by-step system enlargements. This can reduce initial investment costs particularly across a portfolio of mini-grid sites, and also permit easily enlarging system size over time as demand grows (productive use), which is key to a virtuous cycle of achieving financial viability (Agenbroad et al., 2017; Blodgett et al., 2017).
Derisking Renewable Energy Investment: Off-Grid Electrification 33
The Opportunity for Off-grid Renewable Energy
With off-grid renewable energy likely to be instrumental in achieving targets for universal electricity access (IEA, 2017; IEA and World Bank, 2015), there is a need to expressly focus on how policymakers can facilitate private investment into these emerging off-grid renewable energy solutions.
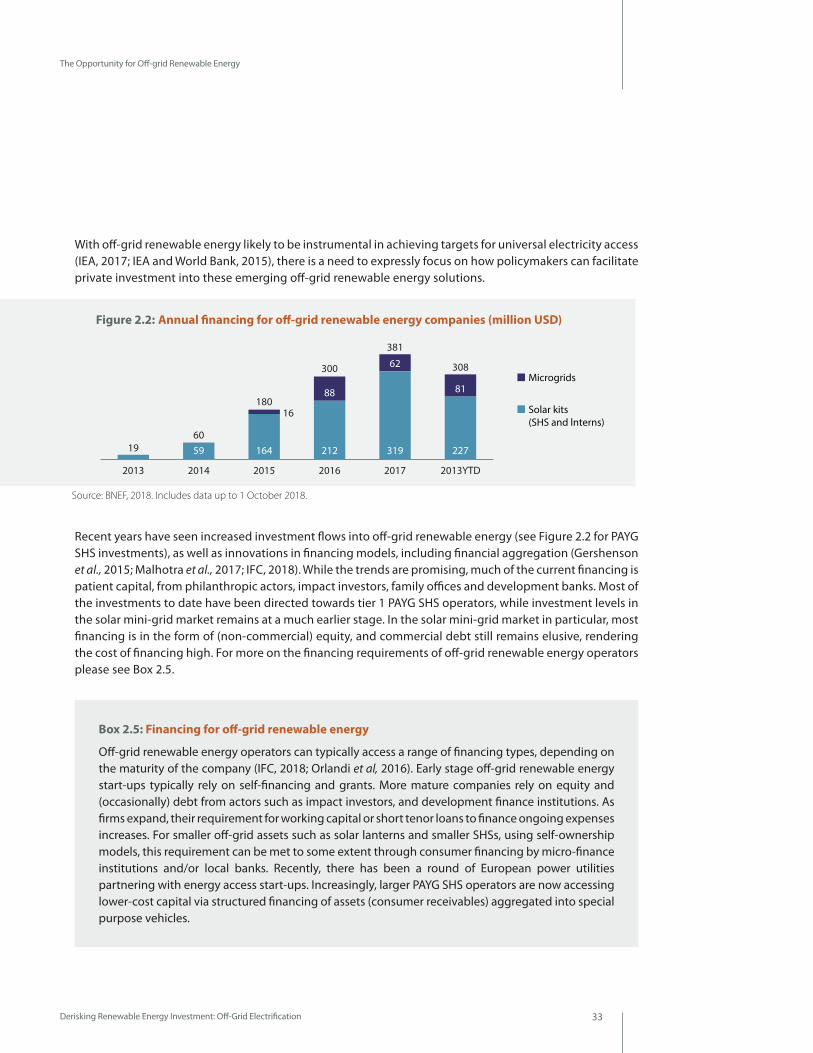
Recent years have seen increased investment flows into off-grid renewable energy (see Figure 2.2 for PAYG SHS investments), as well as innovations in financing models, including financial aggregation (Gershenson et al., 2015; Malhotra et al., 2017; IFC, 2018). While the trends are promising, much of the current financing is patient capital, from philanthropic actors, impact investors, family offices and development banks. Most of the investments to date have been directed towards tier 1 PAYG SHS operators, while investment levels in the solar mini-grid market remains at a much earlier stage. In the solar mini-grid market in particular, most financing is in the form of (non-commercial) equity, and commercial debt still remains elusive, rendering the cost of financing high. For more on the financing requirements of off-grid renewable energy operators please see Box 2.5.
Box 2.5: Financing for off-grid renewable energy
Off-grid renewable energy operators can typically access a range of financing types, depending on the maturity of the company (IFC, 2018; Orlandi et al, 2016). Early stage off-grid renewable energy start-ups typically rely on self-financing and grants. More mature companies rely on equity and (occasionally) debt from actors such as impact investors, and development finance institutions. As firms expand, their requirement for working capital or short tenor loans to finance ongoing expenses increases. For smaller off-grid assets such as solar lanterns and smaller SHSs, using self-ownership models, this requirement can be met to some extent through consumer financing by micro-finance institutions and/or local banks. Recently, there has been a round of European power utilities partnering with energy access start-ups. Increasingly, larger PAYG SHS operators are now accessing lower-cost capital via structured financing of assets (consumer receivables) aggregated into special purpose vehicles.
Figure 2.2: Annual financing for off-grid renewable energy companies (million USD)
Source: BNEF, 2018. Includes data up to 1 October 2018.
2013YTD20172016201520142013
23
Microgrids
Solar kits (SHS and lnterns)
227319212
81
62
88
1645919
308
381
300
180
60
16
Derisking Renewable Energy Investment: Off-Grid Electrification34
Derisking Solar Mini-Grid Investments Through Public Instruments Chapter 3
●● 3.1 High financing costs for solar mini-grids
●● 3.2 Public and private strategies to address investment risks
●● 3.3 Designing cost-effective instrument packages
●● 3.4 Overview of the derisking framework
Derisking Renewable Energy Investment: Off-Grid Electrification 35
Derisking Solar Mini-Grid Investments Through Public Instruments
Derisking Solar Mini-Grid Investments Through Public Instruments
While there has been significant technological and business innovation in solar mini-grids, their high up-front investment cost remains a major impediment to their large scale diffusion. The availability and cost of commercial finance to meet these up-front investment costs strongly depends on the risk environment for these investments. This chapter describes the impact of high financing costs in developing countries on the financial viability of solar mini-grids. It then discusses how public instruments can improve the risk-return profile of solar mini-grid investments. It concludes with a discussion on identifying an appropriate instrument mix to cost-effectively promote investment.
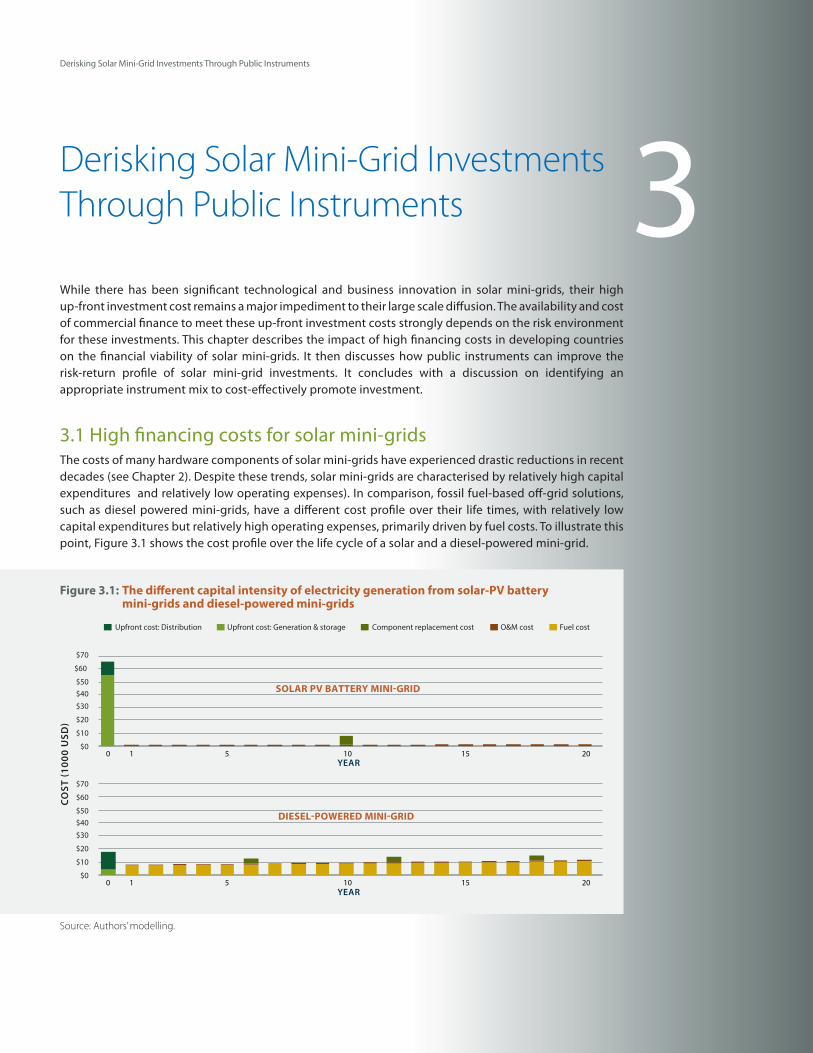
3.1 High financing costs for solar mini-gridsThe costs of many hardware components of solar mini-grids have experienced drastic reductions in recent decades (see Chapter 2). Despite these trends, solar mini-grids are characterised by relatively high capital expenditures and relatively low operating expenses). In comparison, fossil fuel-based off-grid solutions, such as diesel powered mini-grids, have a different cost profile over their life times, with relatively low capital expenditures but relatively high operating expenses, primarily driven by fuel costs. To illustrate this point, Figure 3.1 shows the cost profile over the life cycle of a solar and a diesel-powered mini-grid.
3
Figure 3.1: The different capital intensity of electricity generation from solar-PV battery mini-grids and diesel-powered mini-grids
Source: Authors’ modelling.
$70
$60
$50$40
$30
$20
$10
$0
SOLAR PV BATTERY MINI-GRID
YEAR
YEAR0 1 5 10 15 20
DIESEL-POWERED MINI-GRID
Upfront cost: Distribution
Upfront cost: Generation & storage Component replacement cost
O&M cost Fuel cost
CO
ST (1
000
USD
)
$70
$60
$50$40
$30
$20
$10
$0
0 1 5 10 15 20
Derisking Renewable Energy Investment: Off-Grid Electrification36
Derisking Solar Mini-Grid Investments Through Public Instruments
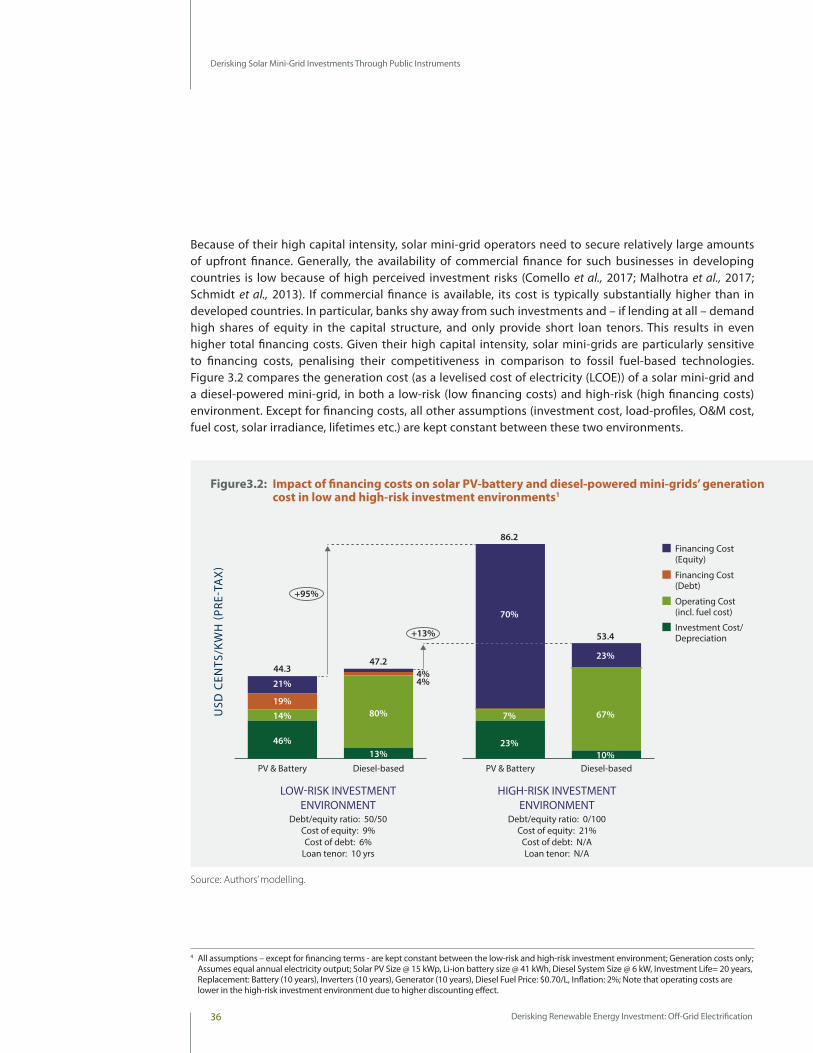
Because of their high capital intensity, solar mini-grid operators need to secure relatively large amounts of upfront finance. Generally, the availability of commercial finance for such businesses in developing countries is low because of high perceived investment risks (Comello et al., 2017; Malhotra et al., 2017; Schmidt et al., 2013). If commercial finance is available, its cost is typically substantially higher than in developed countries. In particular, banks shy away from such investments and – if lending at all – demand high shares of equity in the capital structure, and only provide short loan tenors. This results in even higher total financing costs. Given their high capital intensity, solar mini-grids are particularly sensitive to financing costs, penalising their competitiveness in comparison to fossil fuel-based technologies. Figure 3.2 compares the generation cost (as a levelised cost of electricity (LCOE)) of a solar mini-grid and a diesel-powered mini-grid, in both a low-risk (low financing costs) and high-risk (high financing costs) environment. Except for financing costs, all other assumptions (investment cost, load-profiles, O&M cost, fuel cost, solar irradiance, lifetimes etc.) are kept constant between these two environments.
LOW-RISK INVESTMENTENVIRONMENT
Debt/equity ratio: 50/50Cost of equity: 9%Cost of debt: 6%
Loan tenor: 10 yrs
Debt/equity ratio: 0/100Cost of equity: 21%
Cost of debt: N/ALoan tenor: N/A
HIGH-RISK INVESTMENTENVIRONMENT
USD
CEN
TS/K
WH
(PRE
-TA
X)
Diesel-basedPV & Battery Diesel-basedPV & Battery
Financing Cost (Equity)
Financing Cost (Debt)
Operating Cost (incl. fuel cost)
Investment Cost/Depreciation
46%
14%19%
21%
44.3
+95%
13%
80%
4%4%
47.2
23%
7%
70%
86.2
10%
67%
23%
53.4+13%
Figure3.2: Impact of financing costs on solar PV-battery and diesel-powered mini-grids’ generation cost in low and high-risk investment environments1
Source: Authors’ modelling.
4 All assumptions – except for financing terms - are kept constant between the low-risk and high-risk investment environment; Generation costs only; Assumes equal annual electricity output; Solar PV Size @ 15 kWp, Li-ion battery size @ 41 kWh, Diesel System Size @ 6 kW, Investment Life= 20 years, Replacement: Battery (10 years), Inverters (10 years), Generator (10 years), Diesel Fuel Price: $0.70/L, Inflation: 2%; Note that operating costs are lower in the high-risk investment environment due to higher discounting effect.
Derisking Renewable Energy Investment: Off-Grid Electrification 37
Derisking Solar Mini-Grid Investments Through Public Instruments
3.2 Public and private strategies to address investment risksHigher financing costs for solar mini-grids in developing countries reflect a number of perceived and actual investment risks (Malhotra et al., 2017) (Box 3.1). Some risks relate to renewable energy in general, some specifically to off-grid applications. Other risks reflect the broader investment environment in a specific country, such as currency-related and macro-economic issues. Private investors seek to be compensated for higher risks with higher returns. Higher risks result in higher financing costs or – if the risks are too high – in investors completely refraining from investing. This can explain the absence of typically conservative commercial debt financing in many current off-grid renewable energy investments.
Addressing investment risks through “derisking”, and thereby reducing financing costs, can therefore be a key lever in scaling-up solar mini-grid investments (Box 3.3). While many of these risks can partly be addressed by the private sector (see below), many risks can only be effectively addressed by the public sector. This is the focus of this report. The public sector can address risks in three ways (Figure 3.3).
Reduce risk through policy derisking instruments: These instruments address the barriers that are the root cause of an investment risk, reducing the probability of a negative event occurring. These types of instruments are typically policy and programmatic interventions. For example, solar mini-grid operators face the risk of grid expansion, which should it occur, could cause significant revenue losses. A policy derisking instrument is to establish good and transparent grid planning, including off-grid service areas, in which mini-grid operators are unlikely to be affected by grid extension.
Transfer risk through financial derisking instruments: These instruments do not directly address the underlying barriers but instead work by transferring financial losses, should a negative event occur, to a third party, such as a development bank. These instruments are typically public loans, credit lines or guarantees of some sort. A financial derisking instrument to address the risk of grid-extension described above is the establishment of a compensation scheme, which can reimburse mini-grid operators for their losses in case the grid is extended to their service area.
Box 3.1: Risk and risk perception
There is a large body of research on risk perception in behavioural finance (Ricciardi, 2008). Perceived risk can be understood to incorporate the subjectivity of an investor’s decision-making process in assessing risk. It may differ from actual risk due to bounded rationality resulting from limited information, cognitive biases, and affective factors. Bounded rationality can play a particularly important role during periods of transition and in new markets such renewable energy finance (Geddes et al., 2018; Hall et al., 2017).
The DREI methodology takes an investor’s perspective on investment risks, and therefore use the terms “risk” and “perceived risk” interchangeably.
Derisking Renewable Energy Investment: Off-Grid Electrification38
Derisking Solar Mini-Grid Investments Through Public Instruments
Compensate for risk through direct financial incentives: Recognizing that all risks cannot be reduced through policy derisking or transferred through financial derisking, a third group of public instruments compensates investors for continued exposure to risks with higher returns. These direct financial incentives can take a number of different forms including capital subsidies, tax breaks and proceeds from carbon offsets.
In addition to public instruments, the private sector can also act to address risks. This typically takes the form of business model design, good management practices and contractual arrangements. Through business model decisions (for example, the use of smart meters) and management practices (for example, training of staff ), mini-grid operators can reduce the probability of investment risks materialising. Contractual arrangements (for example, warranties) can similarly transfer the financial impacts of investment risks to third parties Especially in early-stage markets, when many initial barriers can exist, private sector derisking measures can play a crucial role (Agenbroad et al., 2017; Blodgett et al., 2017). Public and private derisking measures can also be interrelated, for example in building staff skills, through both public training and a company’s in-house.
In addition to reducing, transferring or compensating for risk, small-scale renewable energy assets present an additional mechanism to address the risk-return profile of investments:
Diversify risk through portfolio derisking: This can occur by aggregating solar mini-grid assets under one mini-grid operator, creating an investment portfolio (Gershenson et al. (2015); Malhotra et al. (2017). Or similarly through aggregating SHS in a special purpose vehicle, in an asset-backed security. By bundling multiple assets together, risks can offset each other, thereby reducing the overall risk of the entire portfolio. Public instruments can affect the ability and impact of private sector portfolio derisking. For instance, a tendering policy for solar mini-grids can expressly bundle multiple concessions, and determine the geographical portfolio composition of developers.5
5 Gershenson et al. (2015) argue that different geographical diversification strategies can have a derisking effect. Malhotra et al. (2017) analyze the underlying mechanisms by which risks correlate and quantitatively estimate the effects of different diversification strategies.
Box 3.2: Drivers and components of investor risk for off-grid renewable energy investments
Investment risk is commonly defined as the combination of the probability of a negative event occurring and the potential financial impacts to the investor of such negative event, should it occur (ISO, 2009). Barriers in the investment environment act as drivers (or root causes) of investment risk. Reducing these barriers through policy derisking reduces the probability of negative events affecting an off-grid renewable energy investment. Financial derisking instrument transfer the financial impact should a negative event occur. Both the public and private sector can address these components of risk.
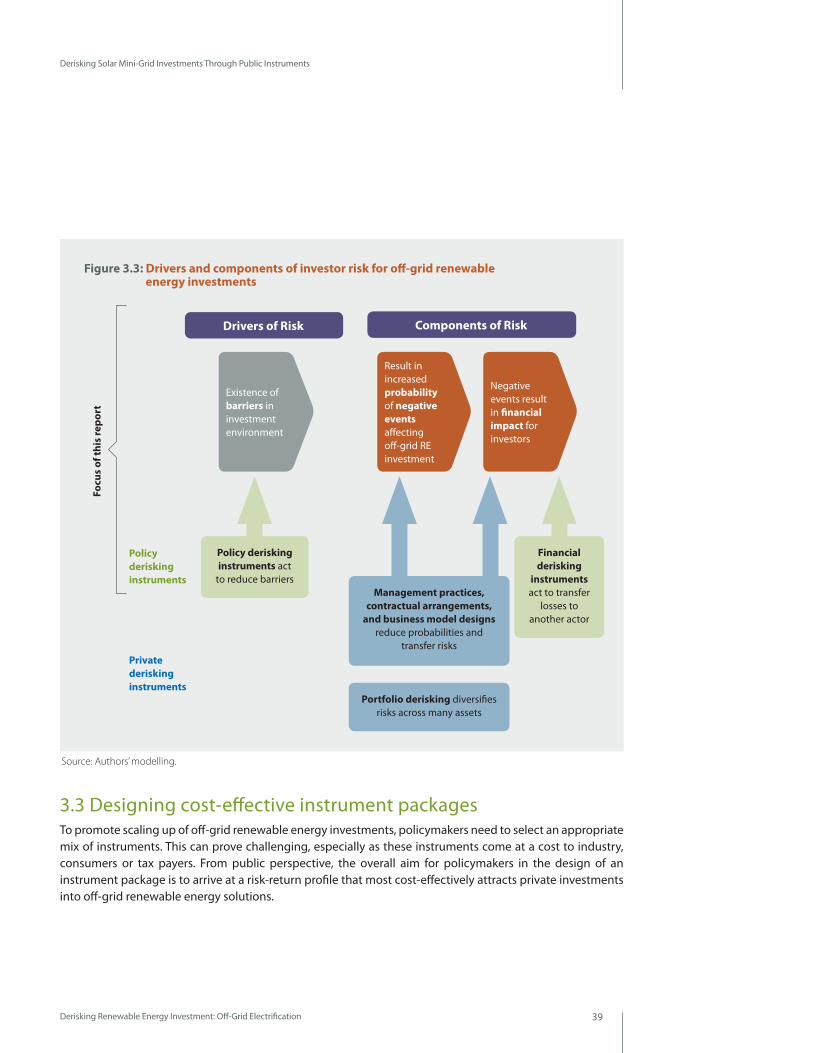
Derisking Renewable Energy Investment: Off-Grid Electrification 39
Derisking Solar Mini-Grid Investments Through Public Instruments
3.3 Designing cost-effective instrument packages To promote scaling up of off-grid renewable energy investments, policymakers need to select an appropriate mix of instruments. This can prove challenging, especially as these instruments come at a cost to industry, consumers or tax payers. From public perspective, the overall aim for policymakers in the design of an instrument package is to arrive at a risk-return profile that most cost-effectively attracts private investments into off-grid renewable energy solutions.
Figure 3.3: Drivers and components of investor risk for off-grid renewable energy investments
Policy derisking instruments act
to reduce barriers
Financial derisking
instruments act to transfer
losses to another actor
Management practices, contractual arrangements,
and business model designs reduce probabilities and
transfer risks
Portfolio derisking diversifies risks across many assets
Drivers of Risk
Existence of barriers in investment environment
Result in increased probability of negative events affecting off-grid RE investment
Negative events result in financial impact for investors
Components of Risk
Policy derisking instruments
Private derisking instruments
Focu
s of
this
repo
rt
Source: Authors’ modelling.
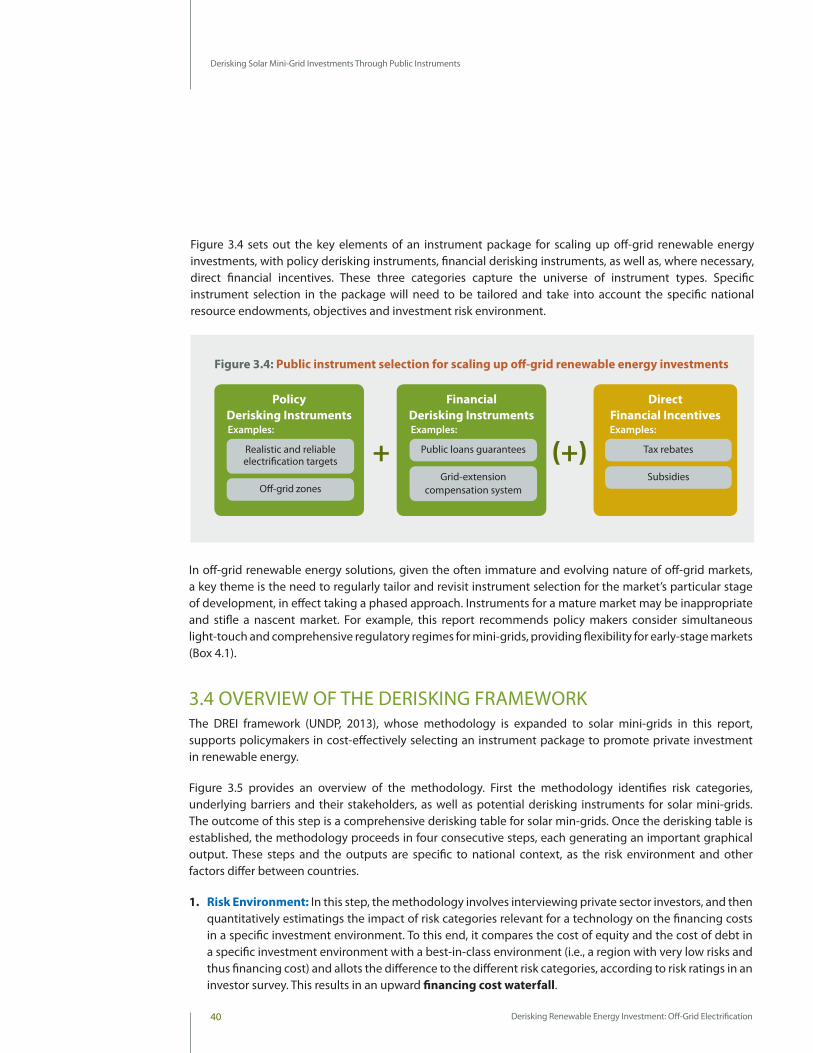
Derisking Renewable Energy Investment: Off-Grid Electrification40
Derisking Solar Mini-Grid Investments Through Public Instruments
Figure 3.4 sets out the key elements of an instrument package for scaling up off-grid renewable energy investments, with policy derisking instruments, financial derisking instruments, as well as, where necessary, direct financial incentives. These three categories capture the universe of instrument types. Specific instrument selection in the package will need to be tailored and take into account the specific national resource endowments, objectives and investment risk environment.
In off-grid renewable energy solutions, given the often immature and evolving nature of off-grid markets, a key theme is the need to regularly tailor and revisit instrument selection for the market’s particular stage of development, in effect taking a phased approach. Instruments for a mature market may be inappropriate and stifle a nascent market. For example, this report recommends policy makers consider simultaneous light-touch and comprehensive regulatory regimes for mini-grids, providing flexibility for early-stage markets (Box 4.1).
3.4 OVERVIEW OF THE DERISKING FRAMEWORK The DREI framework (UNDP, 2013), whose methodology is expanded to solar mini-grids in this report, supports policymakers in cost-effectively selecting an instrument package to promote private investment in renewable energy.
Figure 3.5 provides an overview of the methodology. First the methodology identifies risk categories, underlying barriers and their stakeholders, as well as potential derisking instruments for solar mini-grids. The outcome of this step is a comprehensive derisking table for solar min-grids. Once the derisking table is established, the methodology proceeds in four consecutive steps, each generating an important graphical output. These steps and the outputs are specific to national context, as the risk environment and other factors differ between countries.
1. Risk Environment: In this step, the methodology involves interviewing private sector investors, and then quantitatively estimatings the impact of risk categories relevant for a technology on the financing costs in a specific investment environment. To this end, it compares the cost of equity and the cost of debt in a specific investment environment with a best-in-class environment (i.e., a region with very low risks and thus financing cost) and allots the difference to the different risk categories, according to risk ratings in an investor survey. This results in an upward financing cost waterfall.
Figure 3.4: Public instrument selection for scaling up off-grid renewable energy investments
(+)+
Direct Financial Incentives Examples:
Tax rebates
Policy Derisking InstrumentsExamples:
Realistic and reliable electrification targets
Off-grid zones
Financial Derisking InstrumentsExamples:
Public loans guarantees
Grid-extension compensation system
Subsidies
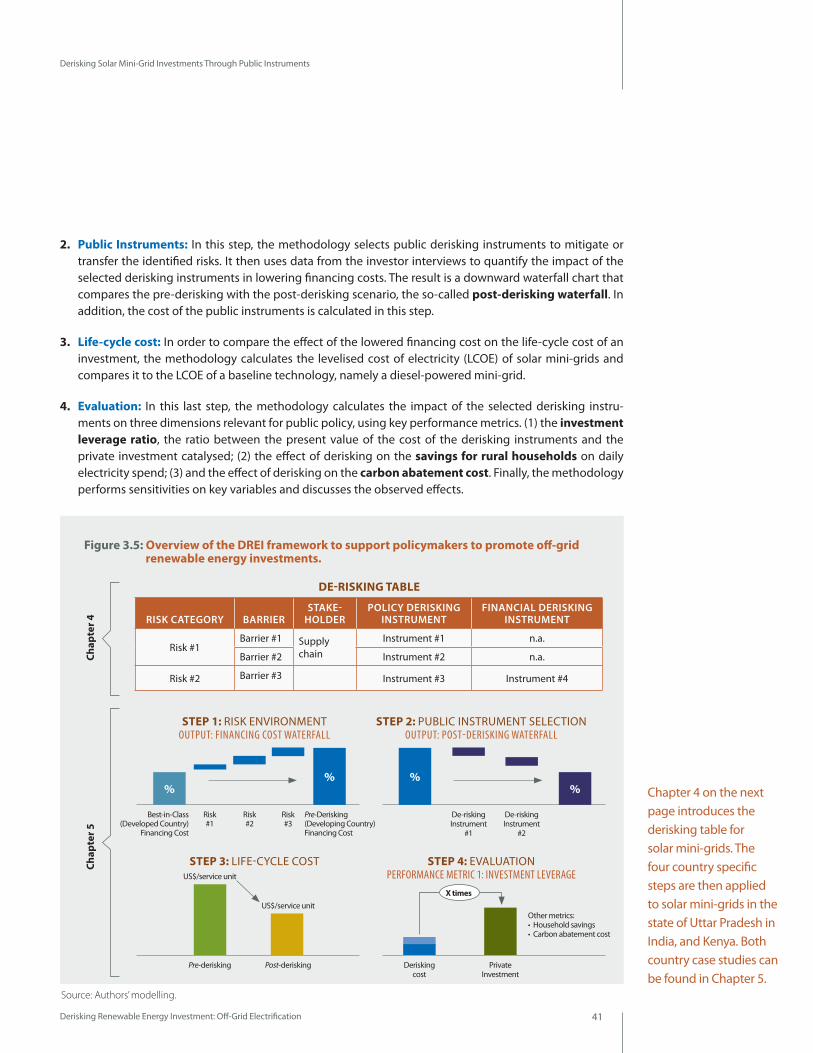
Derisking Renewable Energy Investment: Off-Grid Electrification 41
Derisking Solar Mini-Grid Investments Through Public Instruments
2. Public Instruments: In this step, the methodology selects public derisking instruments to mitigate or transfer the identified risks. It then uses data from the investor interviews to quantify the impact of the selected derisking instruments in lowering financing costs. The result is a downward waterfall chart that compares the pre-derisking with the post-derisking scenario, the so-called post-derisking waterfall. In addition, the cost of the public instruments is calculated in this step.
3. Life-cycle cost: In order to compare the effect of the lowered financing cost on the life-cycle cost of an investment, the methodology calculates the levelised cost of electricity (LCOE) of solar mini-grids and compares it to the LCOE of a baseline technology, namely a diesel-powered mini-grid.
4. Evaluation: In this last step, the methodology calculates the impact of the selected derisking instru-ments on three dimensions relevant for public policy, using key performance metrics. (1) the investment leverage ratio, the ratio between the present value of the cost of the derisking instruments and the private investment catalysed; (2) the effect of derisking on the savings for rural households on daily electricity spend; (3) and the effect of derisking on the carbon abatement cost. Finally, the methodology performs sensitivities on key variables and discusses the observed effects.
Figure 3.5: Overview of the DREI framework to support policymakers to promote off-grid renewable energy investments.
Chap
ter 4
Chap
ter 5
Source: Authors’ modelling.
DE-RISKING TABLE
RISK CATEGORY BARRIERSTAKE-
HOLDERPOLICY DERISKING
INSTRUMENTFINANCIAL DERISKING
INSTRUMENT
Risk #1Barrier #1 Supply
chainInstrument #1 n.a.
Barrier #2 Instrument #2 n.a.
Risk #2 Barrier #3 Instrument #3 Instrument #4
%%
Best-in-Class(Developed Country)
Financing Cost
Risk #2
Risk #3
Risk #1
Pre-Derisking(Developing Country)Financing Cost
Post-derisking Pre-derisking
%%
De-risking Instrument
#2
De-risking Instrument
#1
Private Investment
Derisking cost
STEP 1: RISK ENVIRONMENT OUTPUT: FINANCING COST WATERFALL
STEP 3: LIFE-CYCLE COST
STEP 2: PUBLIC INSTRUMENT SELECTION OUTPUT: POST-DERISKING WATERFALL
STEP 4: EVALUATION PERFORMANCE METRIC 1: INVESTMENT LEVERAGE
US$/service unit
US$/service unit
X times
Other metrics: • Household savings • Carbon abatement cost
Chapter 4 on the next page introduces the derisking table for solar mini-grids. The four country specific steps are then applied to solar mini-grids in the state of Uttar Pradesh in India, and Kenya. Both country case studies can be found in Chapter 5.
Derisking Renewable Energy Investment: Off-Grid Electrification42
Derisking Table for Solar Mini-Grids Chapter 4
Derisking Renewable Energy Investment: Off-Grid Electrification 43
Derisking Table for Solar Mini-Grids
Derisking Table for Solar Mini-Grids
The derisking table is a central tool when applying the DREI methodology. These tables can bring a systematic framework to the task of selecting public instruments. They serve two key purposes: identifying the barriers and risks in the local investment environment, and matching public instruments to these barriers and risks. The DREI framework has developed derisking tables for a variety of technology sectors. More detailed information on the concepts behind a derisking table be found in the original DREI report (UNDP, 2013).
This report introduces a derisking table for solar mini-grids (Table 4.1). The table specifically assumes a private-sector, build-own-operate business model.
Please note that certain barriers and investment risks might not be relevant in specific contexts (e.g., in more advanced markets) or for some business models6.
4
Figure 4.1: Dual regulatory regime for solar mini-grids
Policies for attracting investment and establishing markets in solar mini-grids must grapple with a ‘chicken-and-egg’ dynamic. This issue arises because solar mini-grids are naturally monopolistic (Bhattacharyya, 2013) and therefore merit regulation in the form of licensed concessions. Such oversight is theoretically sound: in mature mini-grid markets, to limit the possibility of monopolistic rents; in early-stage markets, to ensure any subsidies to mini-grid developers are passed on to end-users (Box 4.2). However, the practical reality is that current efforts to regulate solar mini-grids in developing countries are often problematic - excessively stringent, unclear or poorly administered regulation often ends up blocking investment, effectively creating barriers to market access, additional costs and unforeseen delays (Tenenbaum et al., 2014).
In order to avoid burdensome regulations, many mini-grid operators in developing countries today operate in a grey legal area, chosing to serve end-users without a formal license or concession. The drawback to this approach is that mini-grid operators are unable to access commercial debt, as banks require the legal certainty of a concession. These operators must then contend with high, equity-based, financing costs, resulting in high generation costs and tariffs, and limiting the attractiveness of mini-grids vis-à-vis other technology options. In turn it can then be difficult to build political will for reforming and implementing favourable regulations for solar mini-grids.
●● In this regard, one of the report’s recommendations is that policymakers consider implementing a dual regulatory regime for solar mini-grids, with two parallel tracks:
●● A light-touch regime with minimal regulatory burden for private sector actors – with no concessions, and simple self-registration by mini-grid operators – can allow operators to move fast and can promote experimentation in business models, but will likely be limited to equity financing.
●● A comprehensive regime – offering exclusive concessions, the possibility of subsidies to operators, with related regulated tariffs, and compensation in case of grid expansion - can provide a favourable regulatory environment, in turn attracting debt financing.
Importantly, mini-grid operators active under the light-touch regime can graduate to the comprehensive regime via a right-of-first refusal. More details of the dual regulatory regime can be found in section of the derisking table (Table 4.1) corresponding to ‘energy market risk’.
By implementing both tracks simultaneously, governments can provide flexibility to build their own administrative capacity, and can best facilitate innovation and evolution as the mini-grid sector grows, in particular as it moves to scale with eventual commercial debt financing.
6 For example, the risk around telecommunication infrastructure might not be relevant for business models that neither include mobile money nor use remote operation, control or maintenance.
Derisking Renewable Energy Investment: Off-Grid Electrification44
Derisking Table for Solar Mini-Grids
Box 4.2: Subsidies for solar mini-grids
Under the DREI conceptual framework, subsidies are classified as ‘direct financial incentives’, which effectively act to compensate for risk. Direct financial incentives are one of three core classes of public instruments, together with ‘policy derisking instruments’, reducing risk, and financial derisking insturments, transferring risk. Table 4.1 expressly focuses on policy and financial derisking instruments which target specific investment risks, and does not include direct financial incentives (whose benefit is not specific to any investment risk).
An important decision for policymakers seeking to promote investment in solar mini-grids is whether to include subsidies in the proposed instrument package and, if so, to which degree. While this decision will depend on the specific market characteristics and public objectives for electrification, there is a strong case for carefully targeted and calibrated subsidies in many solar mini-grid contexts today.
An over-riding rationale for subsidies for solar mini-grids is that access to electricity, given its centrality to human development, can be viewed as a public good (Komives et al., 2007). This is seen in electricity access through traditional grid-extension, which typically receives substantial public subsidies. In Kenya, for example, it estimated that each household grid extension connection benefits from USD 2,280 in subsidies (Blodgett et al., 2017). Moreover, such grid extension often locks-in and benefits from generation-based subsidies provided in the grid-connected power system.
Subsidies for solar mini-grids can also be justified in order to lower solar mini-grid LCOEs to more affordable levels for end-users, or to bring solar mini-grid LCOEs in line with grid-connected tariffs. The possibility of such subsidies is envisaged in the comprehensive regulatory regime proposed in Table 4.1. In order to ensure subsidies are passed on to end-users, mini-grid operators are subject to regulated tariffs.
Derisking Renewable Energy Investment: Off-Grid Electrification 45
Derisking Table for Solar Mini-Grids
The two case studies in this report, in Chapter 5, perform sensitivity analyses examining the level of subsidies required to lower LCOEs to achieve certain tariff objectives. Interestingly, subsidies for solar mini-grids can be cost-effective relative to policy and financial derisking. This cost-effectiveness is a function of the early-stage and high financing cost environment for solar mini-grids; in such environments, an up-front public subsidy avoids these high financing costs on a long-term asset7.
Subsidies for mini-grids can take a number of different forms, including ex-ante upfront capital grants, VAT exemptions on hardware, ex-post (performance based) per kWh premiums, as well as concessional public financial products. In line with the rationale stated above on cost-effectiveness of subsidies in high-financing cost environments, it is likely that the most impactful subsidies in early stage markets will be structured as ex-ante upfront subsidies.
Overtime, as solar mini-grid markets mature, and the next generation of solar mini-grids come online (benefiting from better software, lower battery costs, higher demand and ARPUs, and aggregation of assets, as well a lower financing costs), LCOEs will lower, and policymakers can aim to phase out subsidies, taking a ‘sunset clause’ approach. Note however, that subsidy phase out can politically be difficult, due to self-reinforcing processes (Schmidt et al., 2017).
7 This finding can be contrasted with subsidies for utility-scale renewable energy, which is a relatively more mature technology, typically benefiting from relatively low financing costs, and larger investment sizes. For utility-scale renewable energy, subsidies are typically less cost effective than policy or financial derisking instruments (UNDP, 2013).
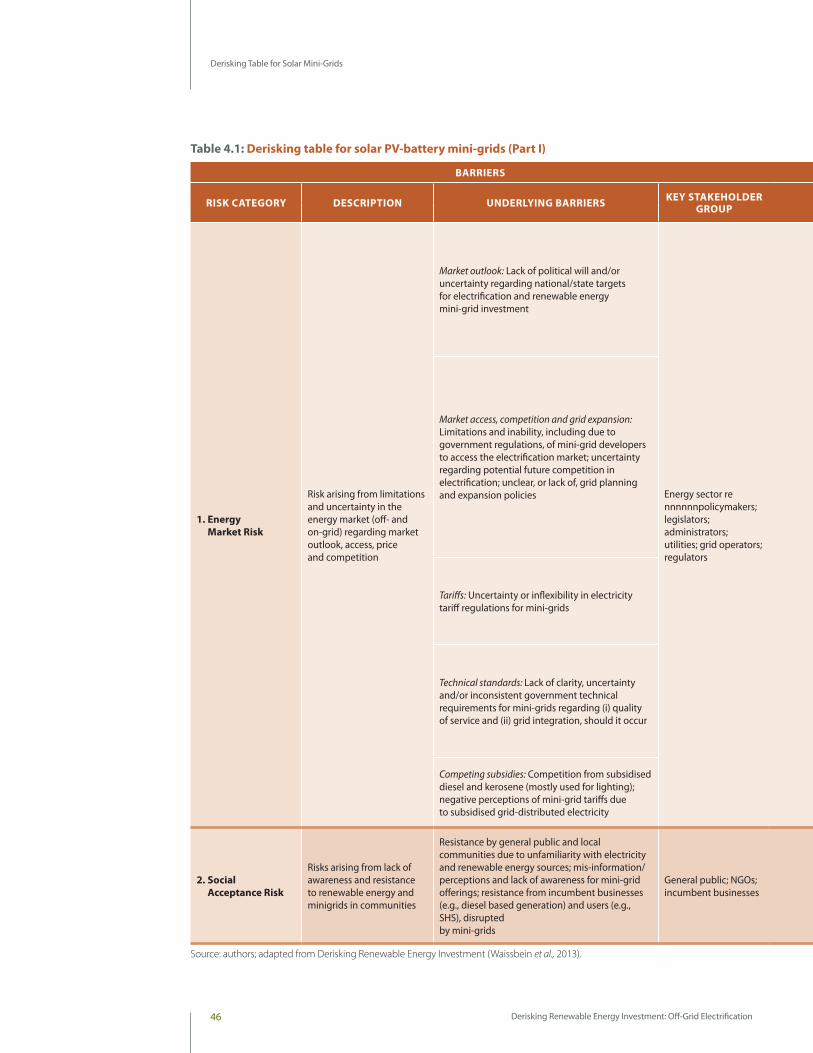
Derisking Renewable Energy Investment: Off-Grid Electrification46
Derisking Table for Solar Mini-Grids
Table 4.1: Derisking table for solar PV-battery mini-grids (Part I)
BARRIERS MENU OF SELECTED PUBLIC INSTRUMENTSWAYS MINI-GRID DEVELOPER CAN MITIGATE RISK
RISK CATEGORY DESCRIPTION UNDERLYING BARRIERS KEY STAKEHOLDER GROUP
POLICY DERISKING INSTRUMENTS FINANCIAL DERISKING INSTRUMENTS
ACTIVITY DESCRIPTION ACTIVITY DESCRIPTION
1. Energy Market Risk
Risk arising from limitations and uncertainty in the energy market (off- and on-grid) regarding market outlook, access, price and competition
Market outlook: Lack of political will and/or uncertainty regarding national/state targets for electrification and renewable energy mini-grid investment
Energy sector re nnnnnnpolicymakers; legislators; administrators; utilities; grid operators; regulators
Build political will and develop realistic and transparent targets, using multi-tier electrification indicators
Establish programmes to raise awareness and build political will with legislators (e.g., conferences, site visits, cross ministerial committees); establish/strengthen energy statistics office; pursue a tiered approach to statistics for electrification; perform initial resource inventory and mapping, including through spatial planning; formulate realistic and transparent targets by tier, technology and demographics; ongoing monitoring of statistics
Market access, competition and grid expansion: Limitations and inability, including due to government regulations, of mini-grid developers to access the electrification market; uncertainty regarding potential future competition in electrification; unclear, or lack of, grid planning and expansion policies
Establish regulatory approach with two, co-existing regimes: (i) light-touch (no license) and (ii) comprehensive (licensed). Mini-grid developers may choose to operate under either regime. Light-touch regime does not provide exclusivity, nor access to government financing or grants (see later risk categories).
Light-touch regime (no license): Establish simple mechanism for mini-grid developers to self-register and provide basic annual reporting; self-registered mini-grid developers have right-of-first-refusal for concessions under the comprehensive regime
Comprehensive regime (licensed): Establish/ develop capacity of institutions (e.g., rural electrification agency, regulator); determine national/state off-grid electricity service areas; define well-designed concessions (e.g, size, years, targets, bundling) for mini-grid developers; implement well-designed mechanism to grant exclusive concessions to mini-grid developers
Comprehensive regime (licensed): Establish compensation scheme (e.g., per kWh) in case of grid expansion
[Minimize grid expansion risk via differentiating mini-grid offer in terms of quality of service]
Tariffs: Uncertainty or inflexibility in electricity tariff regulations for mini-grids
Establish co-existing (i) light-touch (no license) and (ii) comprehensive (licensed) approaches.
Light-touch regime (no license): No tariff controls
Comprehensive regime (licensed): Establish balanced and well-designed regulated tariffs to address monopoly risk, either through (i) tariff tables or (ii) price discovery, via auctions
Technical standards: Lack of clarity, uncertainty and/or inconsistent government technical requirements for mini-grids regarding (i) quality of service and (ii) grid integration, should it occur
Establish co-existing (i) light-touch (no license) and (ii) comprehensive (licensed) approaches.
Light-touch regime (no license): Voluntary compliance with comprehensive regime standards.
Comprehensive regime (licensed): Develop balanced technical standards/requirements for quality of electricity and grid integration, with active enforcement
[Adherence to international good practice on techncial standards]
Competing subsidies: Competition from subsidised diesel and kerosene (mostly used for lighting); negative perceptions of mini-grid tariffs due to subsidised grid-distributed electricity
Reform fossil fuel and grid-distributed electricity subsidies
Assessment of fuel and grid-distributed electricity subsidies; phase-out/down of subsidies*; awareness campaigns accompanying reform; design of transfer programs to vulnerable social groups
2. Social Acceptance Risk
Risks arising from lack of awareness and resistance to renewable energy and minigrids in communities
Resistance by general public and local communities due to unfamiliarity with electricity and renewable energy sources; mis-information/perceptions and lack of awareness for mini-grid offerings; resistance from incumbent businesses (e.g., diesel based generation) and users (e.g., SHS), disrupted by mini-grids
General public; NGOs; incumbent businesses
Develop and coordinate ongoing community impact and public awareness campaigns
Public awareness campaigns; stakeholder dialogues and workshops between policy makers, NGOs, communities, community leaders and end users
In-house programmes to raise awareness on benefits of minigrids
Pilot models for community involvement
Piloting of community models such as revenue sharing or small equity stakes for households, plus employment prospects for individuals.
In-house efforts to incorporate community based models and employment of locals
Source: authors; adapted from Derisking Renewable Energy Investment (Waissbein et al., 2013).
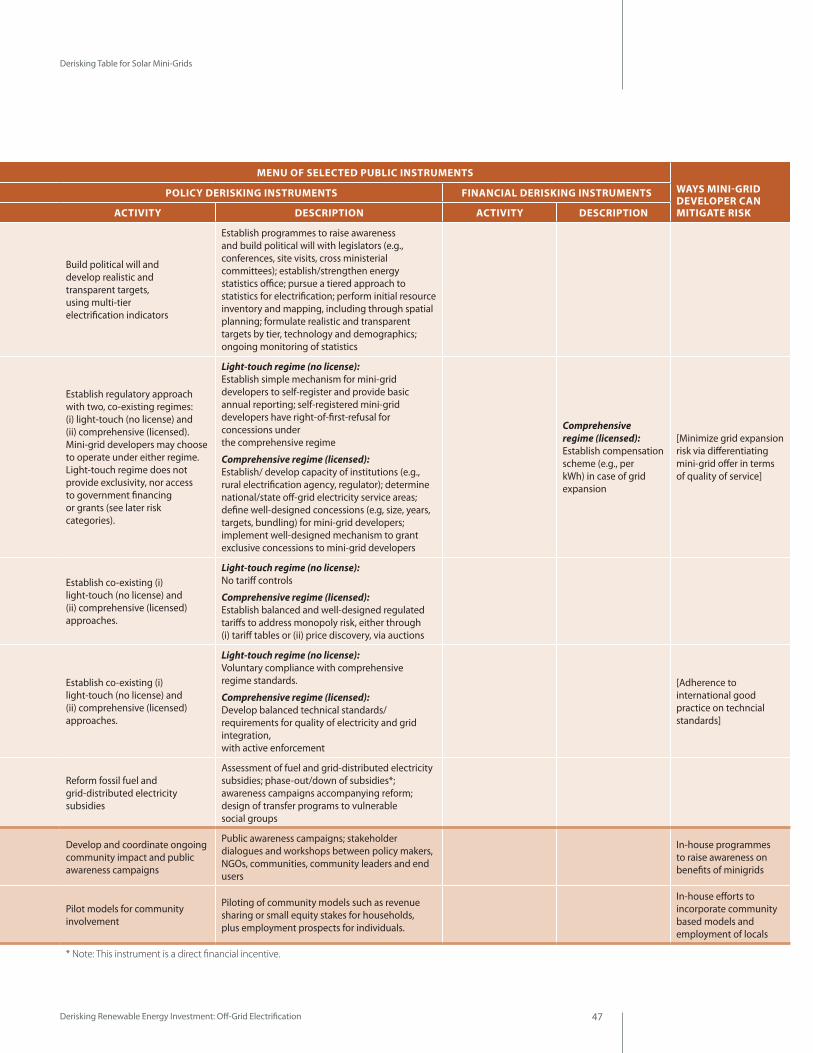
Derisking Renewable Energy Investment: Off-Grid Electrification 47
Derisking Table for Solar Mini-Grids
BARRIERS MENU OF SELECTED PUBLIC INSTRUMENTSWAYS MINI-GRID DEVELOPER CAN MITIGATE RISK
RISK CATEGORY DESCRIPTION UNDERLYING BARRIERS KEY STAKEHOLDER GROUP
POLICY DERISKING INSTRUMENTS FINANCIAL DERISKING INSTRUMENTS
ACTIVITY DESCRIPTION ACTIVITY DESCRIPTION
1. Energy Market Risk
Risk arising from limitations and uncertainty in the energy market (off- and on-grid) regarding market outlook, access, price and competition
Market outlook: Lack of political will and/or uncertainty regarding national/state targets for electrification and renewable energy mini-grid investment
Energy sector re nnnnnnpolicymakers; legislators; administrators; utilities; grid operators; regulators
Build political will and develop realistic and transparent targets, using multi-tier electrification indicators
Establish programmes to raise awareness and build political will with legislators (e.g., conferences, site visits, cross ministerial committees); establish/strengthen energy statistics office; pursue a tiered approach to statistics for electrification; perform initial resource inventory and mapping, including through spatial planning; formulate realistic and transparent targets by tier, technology and demographics; ongoing monitoring of statistics
Market access, competition and grid expansion: Limitations and inability, including due to government regulations, of mini-grid developers to access the electrification market; uncertainty regarding potential future competition in electrification; unclear, or lack of, grid planning and expansion policies
Establish regulatory approach with two, co-existing regimes: (i) light-touch (no license) and (ii) comprehensive (licensed). Mini-grid developers may choose to operate under either regime. Light-touch regime does not provide exclusivity, nor access to government financing or grants (see later risk categories).
Light-touch regime (no license): Establish simple mechanism for mini-grid developers to self-register and provide basic annual reporting; self-registered mini-grid developers have right-of-first-refusal for concessions under the comprehensive regime
Comprehensive regime (licensed): Establish/ develop capacity of institutions (e.g., rural electrification agency, regulator); determine national/state off-grid electricity service areas; define well-designed concessions (e.g, size, years, targets, bundling) for mini-grid developers; implement well-designed mechanism to grant exclusive concessions to mini-grid developers
Comprehensive regime (licensed): Establish compensation scheme (e.g., per kWh) in case of grid expansion
[Minimize grid expansion risk via differentiating mini-grid offer in terms of quality of service]
Tariffs: Uncertainty or inflexibility in electricity tariff regulations for mini-grids
Establish co-existing (i) light-touch (no license) and (ii) comprehensive (licensed) approaches.
Light-touch regime (no license): No tariff controls
Comprehensive regime (licensed): Establish balanced and well-designed regulated tariffs to address monopoly risk, either through (i) tariff tables or (ii) price discovery, via auctions
Technical standards: Lack of clarity, uncertainty and/or inconsistent government technical requirements for mini-grids regarding (i) quality of service and (ii) grid integration, should it occur
Establish co-existing (i) light-touch (no license) and (ii) comprehensive (licensed) approaches.
Light-touch regime (no license): Voluntary compliance with comprehensive regime standards.
Comprehensive regime (licensed): Develop balanced technical standards/requirements for quality of electricity and grid integration, with active enforcement
[Adherence to international good practice on techncial standards]
Competing subsidies: Competition from subsidised diesel and kerosene (mostly used for lighting); negative perceptions of mini-grid tariffs due to subsidised grid-distributed electricity
Reform fossil fuel and grid-distributed electricity subsidies
Assessment of fuel and grid-distributed electricity subsidies; phase-out/down of subsidies*; awareness campaigns accompanying reform; design of transfer programs to vulnerable social groups
2. Social Acceptance Risk
Risks arising from lack of awareness and resistance to renewable energy and minigrids in communities
Resistance by general public and local communities due to unfamiliarity with electricity and renewable energy sources; mis-information/perceptions and lack of awareness for mini-grid offerings; resistance from incumbent businesses (e.g., diesel based generation) and users (e.g., SHS), disrupted by mini-grids
General public; NGOs; incumbent businesses
Develop and coordinate ongoing community impact and public awareness campaigns
Public awareness campaigns; stakeholder dialogues and workshops between policy makers, NGOs, communities, community leaders and end users
In-house programmes to raise awareness on benefits of minigrids
Pilot models for community involvement
Piloting of community models such as revenue sharing or small equity stakes for households, plus employment prospects for individuals.
In-house efforts to incorporate community based models and employment of locals
Source: authors; adapted from Derisking Renewable Energy Investment (Waissbein et al., 2013). * Note: This instrument is a direct financial incentive.
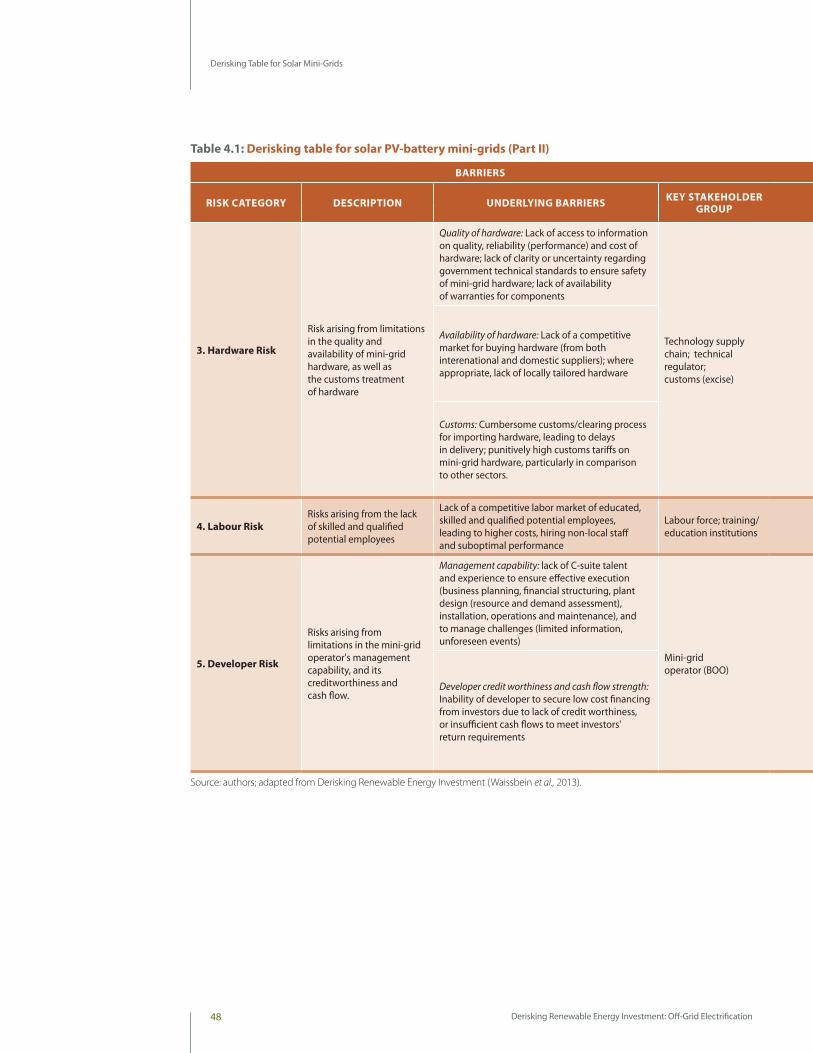
Derisking Renewable Energy Investment: Off-Grid Electrification48
Derisking Table for Solar Mini-Grids
Table 4.1: Derisking table for solar PV-battery mini-grids (Part II)
BARRIERS MENU OF SELECTED PUBLIC INSTRUMENTSWAYS MINI-GRID DEVELOPER CAN MITIGATE RISK
RISK CATEGORY DESCRIPTION UNDERLYING BARRIERS KEY STAKEHOLDER GROUP
POLICY DERISKING INSTRUMENTS FINANCIAL DERISKING INSTRUMENTS
ACTIVITY DESCRIPTION ACTIVITY DESCRIPTION
3. Hardware Risk
Risk arising from limitations in the quality and availability of mini-grid hardware, as well as the customs treatment of hardware
Quality of hardware: Lack of access to information on quality, reliability (performance) and cost of hardware; lack of clarity or uncertainty regarding government technical standards to ensure safety of mini-grid hardware; lack of availability of warranties for components
Technology supply chain; technical regulator; customs (excise)
Develop certification and standards for hardware; adopt internationally recognized standards and share best practices, where applicable
Transparently develop, update (as necessary), disseminate and enforce standards for technical performance and safety; mandate minimum warranties for components
[In-house rigorous sourcing and testing of hardware.]
Availability of hardware: Lack of a competitive market for buying hardware (from both interenational and domestic suppliers); where appropriate, lack of locally tailored hardware
Ensure an open, competitive marketplace for buying hardware
Policy measures to ensure a competitive market for hardware availability; balanced industrial policy objectives, where applicable, for domestic manufacturers, with open markets for international manufacturers; government support for R&D into technical modifications to hardware to accommodate local conditions
Customs: Cumbersome customs/clearing process for importing hardware, leading to delays in delivery; punitively high customs tariffs on mini-grid hardware, particularly in comparison to other sectors.
Streamlined and consistent customs procedures; reform of punitive custom tariff system
Reduction of customs administrative steps; public response timelines; effective and expedited recourse mechanisms. Full cost-benefit economic assessment and benchmarking of tariffs; phase-out/down of punitive customs tariffs; introduction of import tariff holidays and VAT exemptions*
4. Labour RiskRisks arising from the lack of skilled and qualified potential employees
Lack of a competitive labor market of educated, skilled and qualified potential employees, leading to higher costs, hiring non-local staff and suboptimal performance
Labour force; training/education institutions
Programmes to develop competitive, skilled labour market in renewable energy (all roles)
Apprenticeships, certificates and university programmes to build skills in renewable energy (e.g., engineering, marketing, business management)
In-house training of local employees
5. Developer Risk
Risks arising from limitations in the mini-grid operator's management capability, and its creditworthiness and cash flow.
Management capability: lack of C-suite talent and experience to ensure effective execution (business planning, financial structuring, plant design (resource and demand assessment), installation, operations and maintenance), and to manage challenges (limited information, unforeseen events)
Mini-grid operator (BOO)
Government support to improve information flows and network effects
Government support for establishing industry association; government support for initial industry conferences; dissemination of top-level, national resource assessment findings; government sponsored academic studies (e.g., on demand evolution)
Developer credit worthiness and cash flow strength: Inability of developer to secure low cost financing from investors due to lack of credit worthiness, or insufficient cash flows to meet investors' return requirements
Public loans, guarantees and/or equity to mini-grid operators
Direct public loans to minigrid operator; public guarantees to commercial banks that are lending to the minigrid operator; public equity investments in minigrid operator
Engage in robust business planning; consider posting personal collateral to strengthen credit worthiness
Source: authors; adapted from Derisking Renewable Energy Investment (Waissbein et al., 2013).

Derisking Renewable Energy Investment: Off-Grid Electrification 49
Derisking Table for Solar Mini-Grids
BARRIERS MENU OF SELECTED PUBLIC INSTRUMENTSWAYS MINI-GRID DEVELOPER CAN MITIGATE RISK
RISK CATEGORY DESCRIPTION UNDERLYING BARRIERS KEY STAKEHOLDER GROUP
POLICY DERISKING INSTRUMENTS FINANCIAL DERISKING INSTRUMENTS
ACTIVITY DESCRIPTION ACTIVITY DESCRIPTION
3. Hardware Risk
Risk arising from limitations in the quality and availability of mini-grid hardware, as well as the customs treatment of hardware
Quality of hardware: Lack of access to information on quality, reliability (performance) and cost of hardware; lack of clarity or uncertainty regarding government technical standards to ensure safety of mini-grid hardware; lack of availability of warranties for components
Technology supply chain; technical regulator; customs (excise)
Develop certification and standards for hardware; adopt internationally recognized standards and share best practices, where applicable
Transparently develop, update (as necessary), disseminate and enforce standards for technical performance and safety; mandate minimum warranties for components
[In-house rigorous sourcing and testing of hardware.]
Availability of hardware: Lack of a competitive market for buying hardware (from both interenational and domestic suppliers); where appropriate, lack of locally tailored hardware
Ensure an open, competitive marketplace for buying hardware
Policy measures to ensure a competitive market for hardware availability; balanced industrial policy objectives, where applicable, for domestic manufacturers, with open markets for international manufacturers; government support for R&D into technical modifications to hardware to accommodate local conditions
Customs: Cumbersome customs/clearing process for importing hardware, leading to delays in delivery; punitively high customs tariffs on mini-grid hardware, particularly in comparison to other sectors.
Streamlined and consistent customs procedures; reform of punitive custom tariff system
Reduction of customs administrative steps; public response timelines; effective and expedited recourse mechanisms. Full cost-benefit economic assessment and benchmarking of tariffs; phase-out/down of punitive customs tariffs; introduction of import tariff holidays and VAT exemptions*
4. Labour RiskRisks arising from the lack of skilled and qualified potential employees
Lack of a competitive labor market of educated, skilled and qualified potential employees, leading to higher costs, hiring non-local staff and suboptimal performance
Labour force; training/education institutions
Programmes to develop competitive, skilled labour market in renewable energy (all roles)
Apprenticeships, certificates and university programmes to build skills in renewable energy (e.g., engineering, marketing, business management)
In-house training of local employees
5. Developer Risk
Risks arising from limitations in the mini-grid operator's management capability, and its creditworthiness and cash flow.
Management capability: lack of C-suite talent and experience to ensure effective execution (business planning, financial structuring, plant design (resource and demand assessment), installation, operations and maintenance), and to manage challenges (limited information, unforeseen events)
Mini-grid operator (BOO)
Government support to improve information flows and network effects
Government support for establishing industry association; government support for initial industry conferences; dissemination of top-level, national resource assessment findings; government sponsored academic studies (e.g., on demand evolution)
Developer credit worthiness and cash flow strength: Inability of developer to secure low cost financing from investors due to lack of credit worthiness, or insufficient cash flows to meet investors' return requirements
Public loans, guarantees and/or equity to mini-grid operators
Direct public loans to minigrid operator; public guarantees to commercial banks that are lending to the minigrid operator; public equity investments in minigrid operator
Engage in robust business planning; consider posting personal collateral to strengthen credit worthiness
Source: authors; adapted from Derisking Renewable Energy Investment (Waissbein et al., 2013). * Note: This instrument is a direct financial incentive.
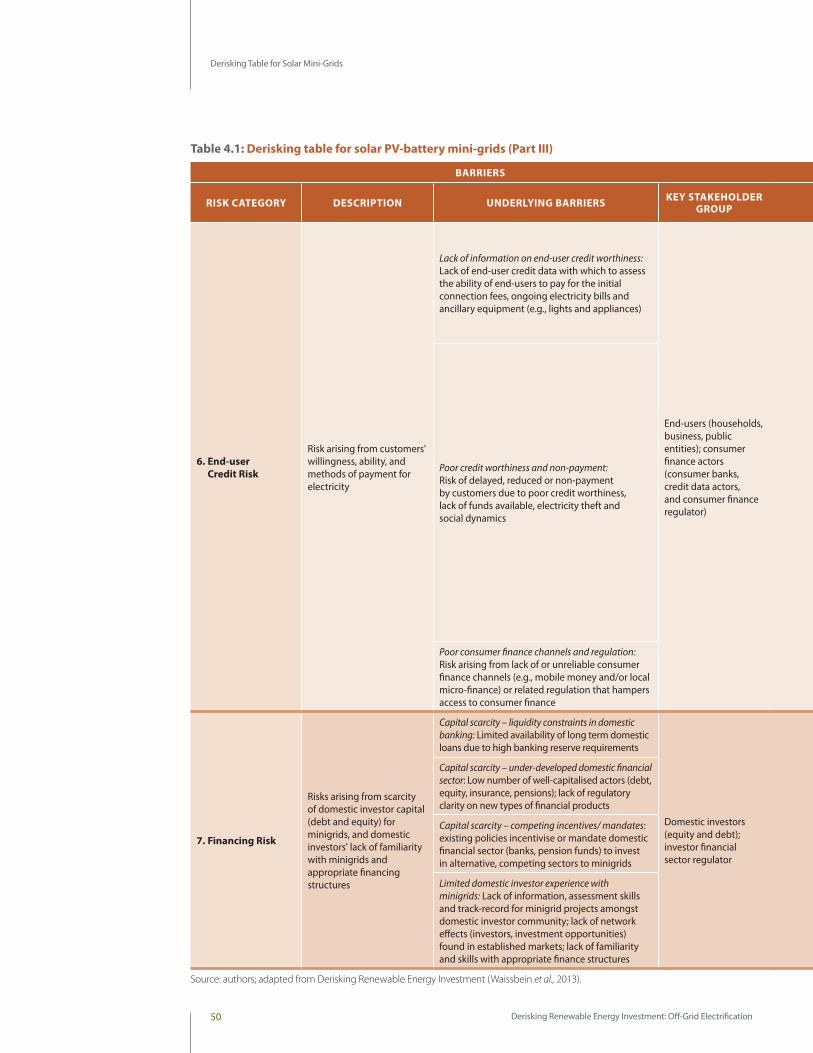
Derisking Renewable Energy Investment: Off-Grid Electrification50
Derisking Table for Solar Mini-Grids
Table 4.1: Derisking table for solar PV-battery mini-grids (Part III)
BARRIERS MENU OF SELECTED PUBLIC INSTRUMENTSWAYS MINI-GRID DEVELOPER CAN MITIGATE RISK
RISK CATEGORY DESCRIPTION UNDERLYING BARRIERS KEY STAKEHOLDER GROUP
POLICY DERISKING INSTRUMENTS FINANCIAL DERISKING INSTRUMENTS
ACTIVITY DESCRIPTION ACTIVITY DESCRIPTION
6. End-user Credit Risk
Risk arising from customers' willingness, ability, and methods of payment for electricity
Lack of information on end-user credit worthiness: Lack of end-user credit data with which to assess the ability of end-users to pay for the initial connection fees, ongoing electricity bills and ancillary equipment (e.g., lights and appliances)
End-users (households, business, public entities); consumer finance actors (consumer banks, credit data actors, and consumer finance regulator)
Facilitate growth of consumer credit data industry
Where applicable, government sponsored digital identity scheme; promotion of balanced privacy and financial regulations allowing for collection of credit data by the private sector; piloting of fintech solutions/platforms for credit data analysis
In-house assessment of credit worthiness and risk modelling, using alternative indicators (employment, family members etc.); use of initial connection fees as a mechanism to test for credit worthiness
Poor credit worthiness and non-payment: Risk of delayed, reduced or non-payment by customers due to poor credit worthiness, lack of funds available, electricity theft and social dynamics
Facilitate end-user's ability to improve creditworthiness over time
Two complementary approaches: (i) Facilitate access to consumer finance (e.g., government-sponsored digital ID scheme; general consumer finance reform; mobile money); (ii) Promote productive use of electricity (e.g, establish network of business development incubators and advisors providing training and guidance covering mini-grid areas) Two possible
approaches to address credit risk: (i) Public loans, guarantees and/or equity to mini-grid operators (ii) Government offtaker via PPA
(i) Direct public loans to mini-grid developer; public guarantees to commercial banks that are lending to the mini-grid developer; public equity investments in mini-grid developer (ii) Government enters into PPA acting as an intermediary offtaker with mini-grid developer. Electricity is then onsold to end-users. This risk transfer/financial derisking approach can be combined with a per kWh subsidy* (direct financial incentive), addressing affordability concerns
Smart payment and metering approaches to incentivize payment; in-house offering for productive use, with training and hardware for businesses/entrepreneurs Government mandates to ensure
creditworthy anchor tenants for mini-grids
Government targets and mandates require creditworthy actors, both private (e.g., cell phone towers) and public (e.g., health centres), to obtain their electricity from renewable energy mini-grids
Poor consumer finance channels and regulation: Risk arising from lack of or unreliable consumer finance channels (e.g., mobile money and/or local micro-finance) or related regulation that hampers access to consumer finance
Well-designed finance and telecom regulations to improve rural access to consumer finance
Enact financial and telecom regulations to enable micro-finance, mobile money etc. at acceptable transaction cost (e.g., fees by mobile telecom network operator for mobile money)
7. Financing Risk
Risks arising from scarcity of domestic investor capital (debt and equity) for minigrids, and domestic investors' lack of familiarity with minigrids and appropriate financing structures
Capital scarcity – liquidity constraints in domestic banking: Limited availability of long term domestic loans due to high banking reserve requirements
Domestic investors (equity and debt); investor financial sector regulator
Reform reserve requirements for domestic lending to businesses
Balanced approach to liquidity requirements, assessing trade-offs between financial stability and renewable energy/electrification objectives
Public loans, guarantees and/or equity to mini-grid operators to address capital scarcity
Direct public loans to mini-grid operators; public guarantees to commercial banks that are lending to the mini-grid operators; public equity investments in mini-grid operators
[Mini-grid develop pursues dual international and domestic financing approaches.]
Capital scarcity – under-developed domestic financial sector: Low number of well-capitalised actors (debt, equity, insurance, pensions); lack of regulatory clarity on new types of financial products
Liberalise domestic financial sector
Liberalisation and introduction of competition into domestic financial sector; reforms to introduce and facilitate new types of finance (e.g., crowdfunding, peer-to-peer lending)
Capital scarcity – competing incentives/ mandates: existing policies incentivise or mandate domestic financial sector (banks, pension funds) to invest in alternative, competing sectors to minigrids
Reform financial sector incentives for investing in specific sectors
Balanced approach to incentives across all sectors; introduce incentives, targets and mandatory lending requirements for renewable energy/minigrids/electrification
Limited domestic investor experience with minigrids: Lack of information, assessment skills and track-record for minigrid projects amongst domestic investor community; lack of network effects (investors, investment opportunities) found in established markets; lack of familiarity and skills with appropriate finance structures
Strengthen domestic investors' (debt and equity) familiarity with and capacity regarding renewable energy minigrids
Mini-grid/electrification finance dialogues and conferences; workshops/training for investors on project assessment and financial structuring
Source: authors; adapted from Derisking Renewable Energy Investment (Waissbein et al., 2013).
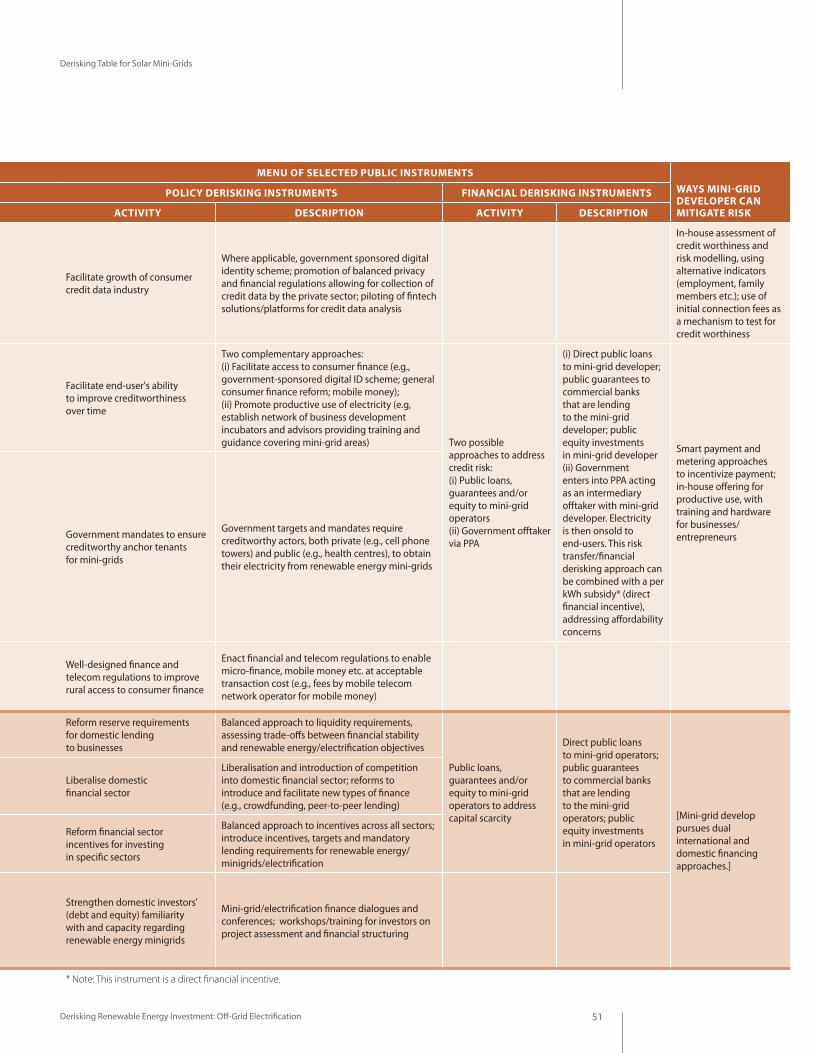
Derisking Renewable Energy Investment: Off-Grid Electrification 51
Derisking Table for Solar Mini-Grids
BARRIERS MENU OF SELECTED PUBLIC INSTRUMENTSWAYS MINI-GRID DEVELOPER CAN MITIGATE RISK
RISK CATEGORY DESCRIPTION UNDERLYING BARRIERS KEY STAKEHOLDER GROUP
POLICY DERISKING INSTRUMENTS FINANCIAL DERISKING INSTRUMENTS
ACTIVITY DESCRIPTION ACTIVITY DESCRIPTION
6. End-user Credit Risk
Risk arising from customers' willingness, ability, and methods of payment for electricity
Lack of information on end-user credit worthiness: Lack of end-user credit data with which to assess the ability of end-users to pay for the initial connection fees, ongoing electricity bills and ancillary equipment (e.g., lights and appliances)
End-users (households, business, public entities); consumer finance actors (consumer banks, credit data actors, and consumer finance regulator)
Facilitate growth of consumer credit data industry
Where applicable, government sponsored digital identity scheme; promotion of balanced privacy and financial regulations allowing for collection of credit data by the private sector; piloting of fintech solutions/platforms for credit data analysis
In-house assessment of credit worthiness and risk modelling, using alternative indicators (employment, family members etc.); use of initial connection fees as a mechanism to test for credit worthiness
Poor credit worthiness and non-payment: Risk of delayed, reduced or non-payment by customers due to poor credit worthiness, lack of funds available, electricity theft and social dynamics
Facilitate end-user's ability to improve creditworthiness over time
Two complementary approaches: (i) Facilitate access to consumer finance (e.g., government-sponsored digital ID scheme; general consumer finance reform; mobile money); (ii) Promote productive use of electricity (e.g, establish network of business development incubators and advisors providing training and guidance covering mini-grid areas) Two possible
approaches to address credit risk: (i) Public loans, guarantees and/or equity to mini-grid operators (ii) Government offtaker via PPA
(i) Direct public loans to mini-grid developer; public guarantees to commercial banks that are lending to the mini-grid developer; public equity investments in mini-grid developer (ii) Government enters into PPA acting as an intermediary offtaker with mini-grid developer. Electricity is then onsold to end-users. This risk transfer/financial derisking approach can be combined with a per kWh subsidy* (direct financial incentive), addressing affordability concerns
Smart payment and metering approaches to incentivize payment; in-house offering for productive use, with training and hardware for businesses/entrepreneurs Government mandates to ensure
creditworthy anchor tenants for mini-grids
Government targets and mandates require creditworthy actors, both private (e.g., cell phone towers) and public (e.g., health centres), to obtain their electricity from renewable energy mini-grids
Poor consumer finance channels and regulation: Risk arising from lack of or unreliable consumer finance channels (e.g., mobile money and/or local micro-finance) or related regulation that hampers access to consumer finance
Well-designed finance and telecom regulations to improve rural access to consumer finance
Enact financial and telecom regulations to enable micro-finance, mobile money etc. at acceptable transaction cost (e.g., fees by mobile telecom network operator for mobile money)
7. Financing Risk
Risks arising from scarcity of domestic investor capital (debt and equity) for minigrids, and domestic investors' lack of familiarity with minigrids and appropriate financing structures
Capital scarcity – liquidity constraints in domestic banking: Limited availability of long term domestic loans due to high banking reserve requirements
Domestic investors (equity and debt); investor financial sector regulator
Reform reserve requirements for domestic lending to businesses
Balanced approach to liquidity requirements, assessing trade-offs between financial stability and renewable energy/electrification objectives
Public loans, guarantees and/or equity to mini-grid operators to address capital scarcity
Direct public loans to mini-grid operators; public guarantees to commercial banks that are lending to the mini-grid operators; public equity investments in mini-grid operators
[Mini-grid develop pursues dual international and domestic financing approaches.]
Capital scarcity – under-developed domestic financial sector: Low number of well-capitalised actors (debt, equity, insurance, pensions); lack of regulatory clarity on new types of financial products
Liberalise domestic financial sector
Liberalisation and introduction of competition into domestic financial sector; reforms to introduce and facilitate new types of finance (e.g., crowdfunding, peer-to-peer lending)
Capital scarcity – competing incentives/ mandates: existing policies incentivise or mandate domestic financial sector (banks, pension funds) to invest in alternative, competing sectors to minigrids
Reform financial sector incentives for investing in specific sectors
Balanced approach to incentives across all sectors; introduce incentives, targets and mandatory lending requirements for renewable energy/minigrids/electrification
Limited domestic investor experience with minigrids: Lack of information, assessment skills and track-record for minigrid projects amongst domestic investor community; lack of network effects (investors, investment opportunities) found in established markets; lack of familiarity and skills with appropriate finance structures
Strengthen domestic investors' (debt and equity) familiarity with and capacity regarding renewable energy minigrids
Mini-grid/electrification finance dialogues and conferences; workshops/training for investors on project assessment and financial structuring
Source: authors; adapted from Derisking Renewable Energy Investment (Waissbein et al., 2013). * Note: This instrument is a direct financial incentive.
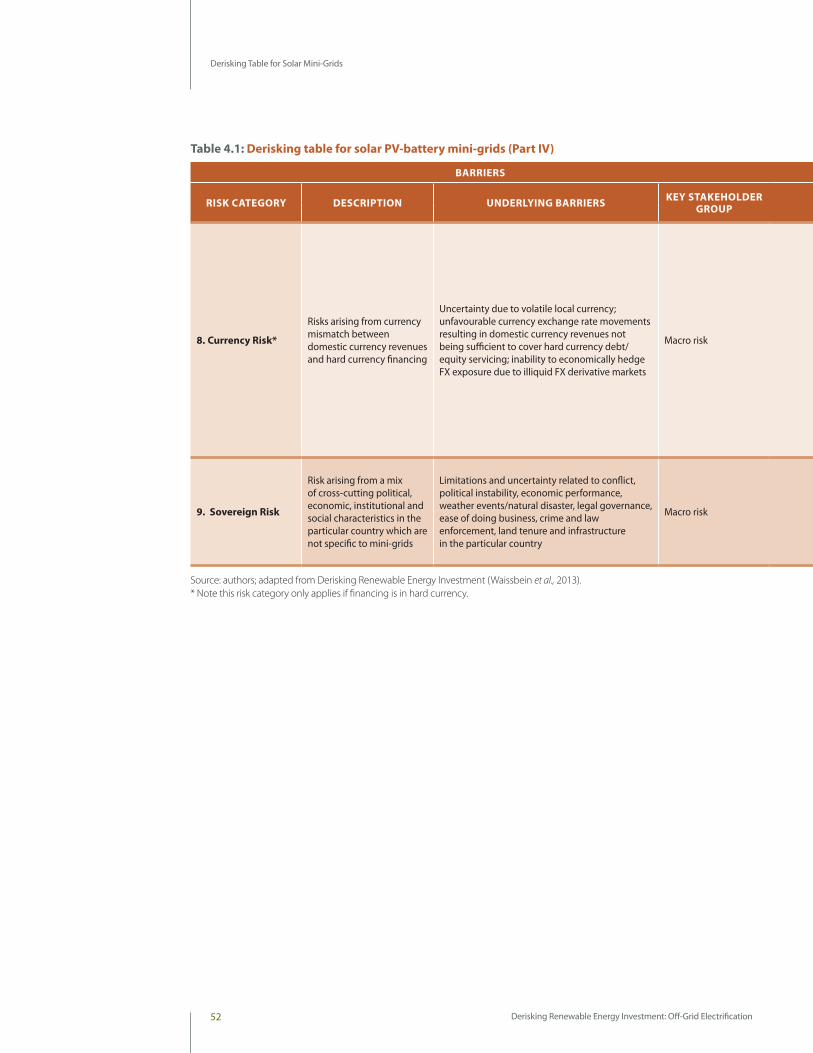
Derisking Renewable Energy Investment: Off-Grid Electrification52
Derisking Table for Solar Mini-Grids
Table 4.1: Derisking table for solar PV-battery mini-grids (Part IV)
BARRIERS MENU OF SELECTED PUBLIC INSTRUMENTSWAYS MINI-GRID DEVELOPER CAN MITIGATE RISK
RISK CATEGORY DESCRIPTION UNDERLYING BARRIERS KEY STAKEHOLDER GROUP
POLICY DERISKING INSTRUMENTS FINANCIAL DERISKING INSTRUMENTS
ACTIVITY DESCRIPTION ACTIVITY DESCRIPTION
8. Currency Risk*
Risks arising from currency mismatch between domestic currency revenues and hard currency financing
Uncertainty due to volatile local currency; unfavourable currency exchange rate movements resulting in domestic currency revenues not being sufficient to cover hard currency debt/equity servicing; inability to economically hedge FX exposure due to illiquid FX derivative markets
Macro riskGovernment support for long term development of liquid domestic FX derivative markets
Regulatory reforms enabling derivative trading for local securities exchanges; steering of large government FX hedging contracts to domestic FX markets.
Financial products to transfer some or all currency risk to public sector
Various design options exist. One option is the government entering into an intermediary PPA with minigrid operator, denominated in hard currency, and then onselling electricity to end-users at a fixed, or more stable, domestic currency tariff. Another option are government subsidised or facilitated F/X hedging programmes (particularly for illiquid F/X trades).
Mini-grid developer engages with private sector hedging instruments.
9. Sovereign Risk
Risk arising from a mix of cross-cutting political, economic, institutional and social characteristics in the particular country which are not specific to mini-grids
Limitations and uncertainty related to conflict, political instability, economic performance, weather events/natural disaster, legal governance, ease of doing business, crime and law enforcement, land tenure and infrastructure in the particular country
Macro risk
Where applicable, risk sharing products by development banks to address political risk
Where applicable, provision of political risk insurance (PRI) covering (i) expropriation, (ii) political violence, (iii) currency restrictions, (iv) breach of contract
* Note this risk category only applies if financing is in hard currency.Source: authors; adapted from Derisking Renewable Energy Investment (Waissbein et al., 2013).
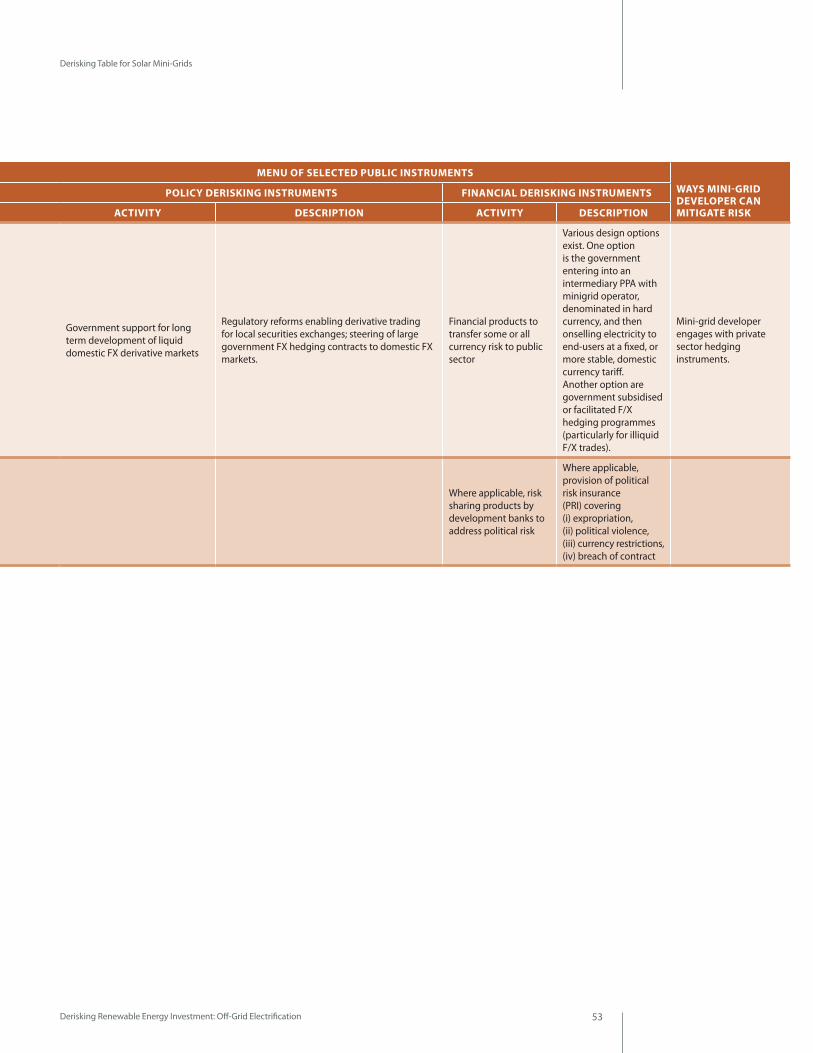
Derisking Renewable Energy Investment: Off-Grid Electrification 53
Derisking Table for Solar Mini-Grids
BARRIERS MENU OF SELECTED PUBLIC INSTRUMENTSWAYS MINI-GRID DEVELOPER CAN MITIGATE RISK
RISK CATEGORY DESCRIPTION UNDERLYING BARRIERS KEY STAKEHOLDER GROUP
POLICY DERISKING INSTRUMENTS FINANCIAL DERISKING INSTRUMENTS
ACTIVITY DESCRIPTION ACTIVITY DESCRIPTION
8. Currency Risk*
Risks arising from currency mismatch between domestic currency revenues and hard currency financing
Uncertainty due to volatile local currency; unfavourable currency exchange rate movements resulting in domestic currency revenues not being sufficient to cover hard currency debt/equity servicing; inability to economically hedge FX exposure due to illiquid FX derivative markets
Macro riskGovernment support for long term development of liquid domestic FX derivative markets
Regulatory reforms enabling derivative trading for local securities exchanges; steering of large government FX hedging contracts to domestic FX markets.
Financial products to transfer some or all currency risk to public sector
Various design options exist. One option is the government entering into an intermediary PPA with minigrid operator, denominated in hard currency, and then onselling electricity to end-users at a fixed, or more stable, domestic currency tariff. Another option are government subsidised or facilitated F/X hedging programmes (particularly for illiquid F/X trades).
Mini-grid developer engages with private sector hedging instruments.
9. Sovereign Risk
Risk arising from a mix of cross-cutting political, economic, institutional and social characteristics in the particular country which are not specific to mini-grids
Limitations and uncertainty related to conflict, political instability, economic performance, weather events/natural disaster, legal governance, ease of doing business, crime and law enforcement, land tenure and infrastructure in the particular country
Macro risk
Where applicable, risk sharing products by development banks to address political risk
Where applicable, provision of political risk insurance (PRI) covering (i) expropriation, (ii) political violence, (iii) currency restrictions, (iv) breach of contract
* Note this risk category only applies if financing is in hard currency.Source: authors; adapted from Derisking Renewable Energy Investment (Waissbein et al., 2013).
Derisking Renewable Energy Investment: Off-Grid Electrification54
Illustrative Solar Mini-Grid Case StudiesChapter 5
●● 5.1 Approach to the Modelling Exercise
●● 5.2 Case Study: Uttar Pradesh, India
●● 5.3 Case Study: Kenya

Derisking Renewable Energy Investment: Off-Grid Electrification 55
Illustrative Solar Mini-Grid Case Studies
Illustrative Solar Mini-Grid Case Studies
This chapter describes the DREI modelling for promotion of private sector solar PV and battery mini-grids (solar mini-grids) in two illustrative case studies: Uttar Pradesh, India and Kenya. The model uses a simplified set of data and assumptions and therefore model outputs are indicative only.
The chapter first provides an overview of the approach to the modelling exercise, describing: the selection of the case studies; the two derisking scenarios modelled in each country; key modelling assumptions; and the exercise’s public instrument table. It then has dedicated sections on each of the two case studies, each including an overview of the country’s energy sector and electrification plans, as well as the modelling results for each case study. The full data sets and assumptions used in preparing these case studies are given in Annex A.
5.1 APPROACH TO THE MODELLING EXERCISE5.1.1 Case Study Country Selection and Target SettingUttar Pradesh, India and Kenya have been selected as the two case studies for this report. This follows an analysis of the twenty high impact energy access countries identified by the SEforAll Global Tracking Framework (IEA and World Bank, 2015) which were then evaluated against four key criteria: (i) level of electricity access, (ii) current mini-grid activity, (iii) level of fuel prices, and (iv) political stability. These criteria were based on criteria used by the SEforAll Global Tracking Framework and IED/DFID (2013). For a more detailed description of the country selection criteria, please refer to the Annex A.
The modelling exercise assumes a 6-year investment target for the period 2018-2023 for solar mini-grid investments in each of the two case studies. The target setting is based on the most recent publicly available census data for the unelectrified population, with the assumption that the unelectrified population grows at the expected population growth rate. The analysis for each country case study then assumes that by 2023, 10% of the unelectrified population will be electrified through solar mini-grids, with the remainder of the unelectrified population likely to be achieved through a combination of other electrification approaches, such as grid extension and solar home systems.
It is important to note that the selection of these countries for solar mini-grid investments, and the modelling exercise’s investment targets, do not preclude the utilization of other technologies, such as solar home systems, for rural electrification.
5.1.2 Modelling Two Scenarios for Each Country In order to study the effects of public derisking instruments, the modelling exercise compares two scenarios to achieve the 6-year investment target to 2023, a pre-derisking scenario and a post-derisking scenario:
●● Pre-derisking Scenario: This scenario assumes that the investment to reach the 6-year investment target for each case study is made under today’s risk environment.
As this scenario captures, or “freezes” the current risk environment today, no additional derisking instruments are modelled, and it uses the typical current financing terms that an investor encounters in the case study markets today.
5
Derisking Renewable Energy Investment: Off-Grid Electrification56
Illustrative Solar Mini-Grid Case Studies
●● Post-derisking Scenario: This scenario assumes that the investment to reach the 6-year investment target for each case study is made under a derisked investment environment where a set of policy and financial derisking instruments are deployed. These instruments address the current barriers to investment.
Thus the post-derisking scenario uses adjusted financing costs and terms (capital structure and loan tenor) compared to the pre-derisking scenario, reflecting the impact of derisking instruments in reducing the financing costs and improving financing terms.
5.1.3 Key Modelling AssumptionsSmall-scale decentralized systems show a relatively high variation in size and cost depending on the communities they serve (i.e., demand profile, economic activities, population density), and their geographic location (i.e., transportation costs, resource availability for renewable technologies). The application of the DREI methodology entails a significant amount of data gathering and requires a number of assumptions to be made in. In addition, solar mini-grid systems currently vary greatly in business models, and are also in the early-stage of market development in the cases studies in this report. In order to keep the scope of the modelling exercise manageable, a set of simplified data and modelling assumptions have been used. Many input parameters, such as demand profile, technology and O&M costs, have been standardized across the case study countries.
●● Generic, forward-looking cost assumptions: Mini-grid solar PV systems show a relatively high variation in size and cost depending on the communities they serve (i.e., demand profile, economic activities, population density), and their geographic location (i.e., transportation costs, capacity factor) (Agenbroad et al., 2017; Blodgett et al., 2016; IRENA, 2016). The modelling assumes generic, non-site-specific costs. Further the model uses a forward-looking cost approach, using technology learning curves to project forward-looking costs at the mid-point of the 6 year investment target of 2018 to 2023.
●● Bottom-up and demand-driven approach to system sizing: The modelling in this study follows a bottom-up, demand-driven approach, whereby first a generic village mini-grid system is modelled (Box 5.1). The system-sizing exercise results in a mini-grid with ~ 10 kW (Kenya) and ~13kW (India) solar PV with battery storage system.8 This sizing is then extrapolated in order to calculate total investment needs, policy and financial instrument costs and their derisking effects to reach the rural electrification target by 2023 for each case study country. The modelling exercise assumes a portfolio of 10 renewable energy mini-grids operating under one entity, with the mini-grids serving the electricity needs of households, small businesses, and community infrastructure, such as schools and street lighting.
●● Dual regulatory regimes: The mini-grid market is still going through a period of experimentation as developers and investors continue to explore different business models, modifying and fine-tuning business plans as they evaluate opportunities in the market. This study recognizes this nascent state of the market
8 In comparison, the typical size of a for-profit mini-grid can, depending on the business model, range anywhere between 240 W to 50 kW.
Derisking Renewable Energy Investment: Off-Grid Electrification 57
Illustrative Solar Mini-Grid Case Studies
and hence the importance of a flexible policy environment to nurture innovation and learning. Accordingly, it proposes two parallel regulatory tracks for private sector developers to engage in: (1) Light-Touch and (2) Comprehensive. As explained in Table 4.1 (Chapter 4), these dual regimes are implemented simultaneously and the developer has the discretion over which one to follow. The explicit establishment of a light-touch regime provides some legal and regulatory certainty, without necessitating operating licenses or imposing tariff regulations. Under the comprehensive regime, on the other hand, mini-grid developers have the possibility to obtain operating licenses and exclusive concessions, enabling the possibility of regulated tariffs, subsidies to operators, and grid expansion compensation. While both regimes have the objective of spurring private sector investment, they provide two alternative approaches to balancing mini-grid regulation with business model flexibility. In the post-derisking scenario, this difference is reflected in the capital structure of mini-grid projects, whereby those operating under the light-touch track are able to access equity at a lower cost than in the pre-derisking scenario, but no debt due to the lack of an operating license. In contrast, those under the comprehensive regulatory track also have access to debt, in addition to lower cost equity.
Light-touch: In the light–touch regime, the modelling exercise assumes an illustrative, commercial 100% equity capital structure for mini-grid developers in the post-derisking scenario. For each country case study, it is assumed that an illustrative 10% of the solar mini-grid investments are made under the light-touch regulatory track.
Comprehensive: In the comprehensive regime, the modelling exercise assumes an illustrative, commer-cial 40% equity – 60% debt capital structure for mini-grid developers in the post-derisking scenario. For each country case study, to calculate the derisking effect and cost of derisking instruments under the two regulatory regimes, it is assumed that an illustrative 90% of the solar mini-grid investments are made under the comprehensive regulatory track..
We perform a sensitivity analysis on the share of mini-grids operating under the light-touch vis-à-vis the comprehensive regime for both case studies.
●● Mini-grid technology: The technology used in the model is crystalline silicon solar photovoltaic system with lithium-ion batteries and AC distribution grid. While the most prevalent battery technology used today is lead-acid, the modelling exercise takes a forward-looking approach and assumes that cost reductions in lithium-ion battery technology and their longer life cycle will make lithium ion batteries the most prevalent technology for mini-grids in the near future (IRENA, 2017).
The full underlying datasets and assumptions for the modelling exercise are set out in Annex A.
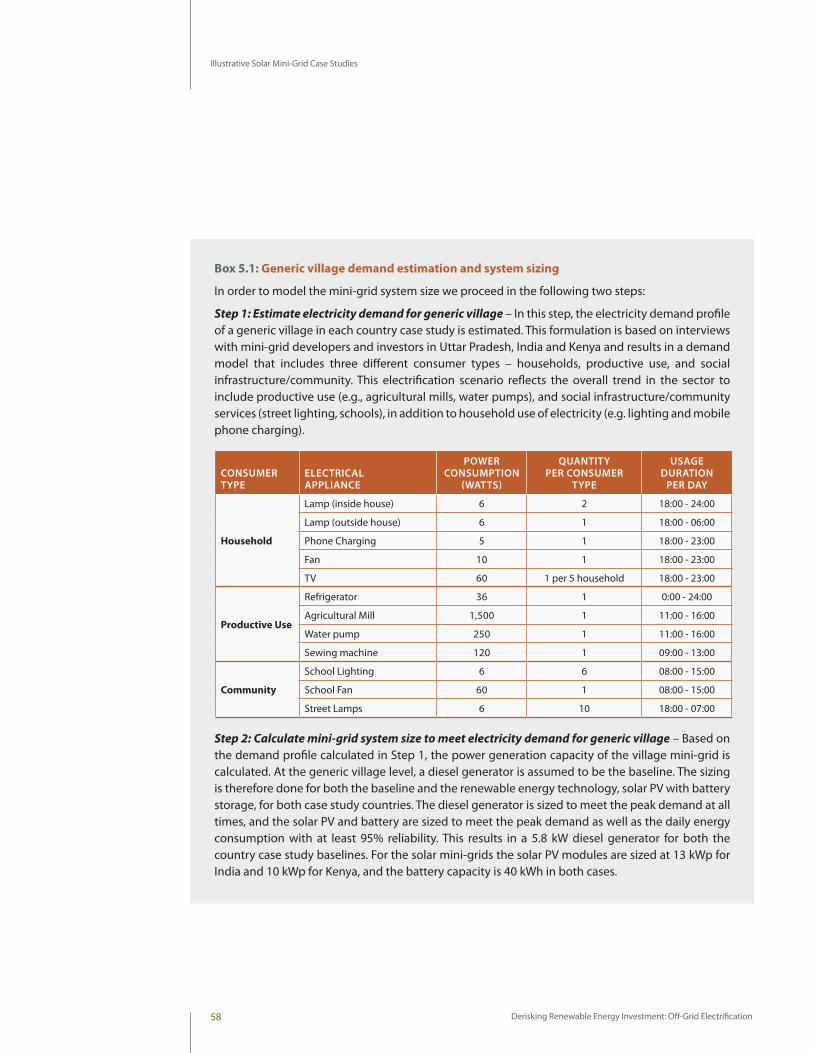
Derisking Renewable Energy Investment: Off-Grid Electrification58
Illustrative Solar Mini-Grid Case Studies
Box 5.1: Generic village demand estimation and system sizing
In order to model the mini-grid system size we proceed in the following two steps:
Step 1: Estimate electricity demand for generic village – In this step, the electricity demand profile of a generic village in each country case study is estimated. This formulation is based on interviews with mini-grid developers and investors in Uttar Pradesh, India and Kenya and results in a demand model that includes three different consumer types – households, productive use, and social infrastructure/community. This electrification scenario reflects the overall trend in the sector to include productive use (e.g., agricultural mills, water pumps), and social infrastructure/community services (street lighting, schools), in addition to household use of electricity (e.g. lighting and mobile phone charging).
Step 2: Calculate mini-grid system size to meet electricity demand for generic village – Based on the demand profile calculated in Step 1, the power generation capacity of the village mini-grid is calculated. At the generic village level, a diesel generator is assumed to be the baseline. The sizing is therefore done for both the baseline and the renewable energy technology, solar PV with battery storage, for both case study countries. The diesel generator is sized to meet the peak demand at all times, and the solar PV and battery are sized to meet the peak demand as well as the daily energy consumption with at least 95% reliability. This results in a 5.8 kW diesel generator for both the country case study baselines. For the solar mini-grids the solar PV modules are sized at 13 kWp for India and 10 kWp for Kenya, and the battery capacity is 40 kWh in both cases.
CONSUMER TYPE
ELECTRICAL APPLIANCE
POWER CONSUMPTION
(WATTS)
QUANTITY PER CONSUMER
TYPE
USAGE DURATION
PER DAY
Household
Lamp (inside house) 6 2 18:00 - 24:00
Lamp (outside house) 6 1 18:00 - 06:00
Phone Charging 5 1 18:00 - 23:00
Fan 10 1 18:00 - 23:00
TV 60 1 per 5 household 18:00 - 23:00
Productive Use
Refrigerator 36 1 0:00 - 24:00
Agricultural Mill 1,500 1 11:00 - 16:00
Water pump 250 1 11:00 - 16:00
Sewing machine 120 1 09:00 - 13:00
Community
School Lighting 6 6 08:00 - 15:00
School Fan 60 1 08:00 - 15:00
Street Lamps 6 10 18:00 - 07:00
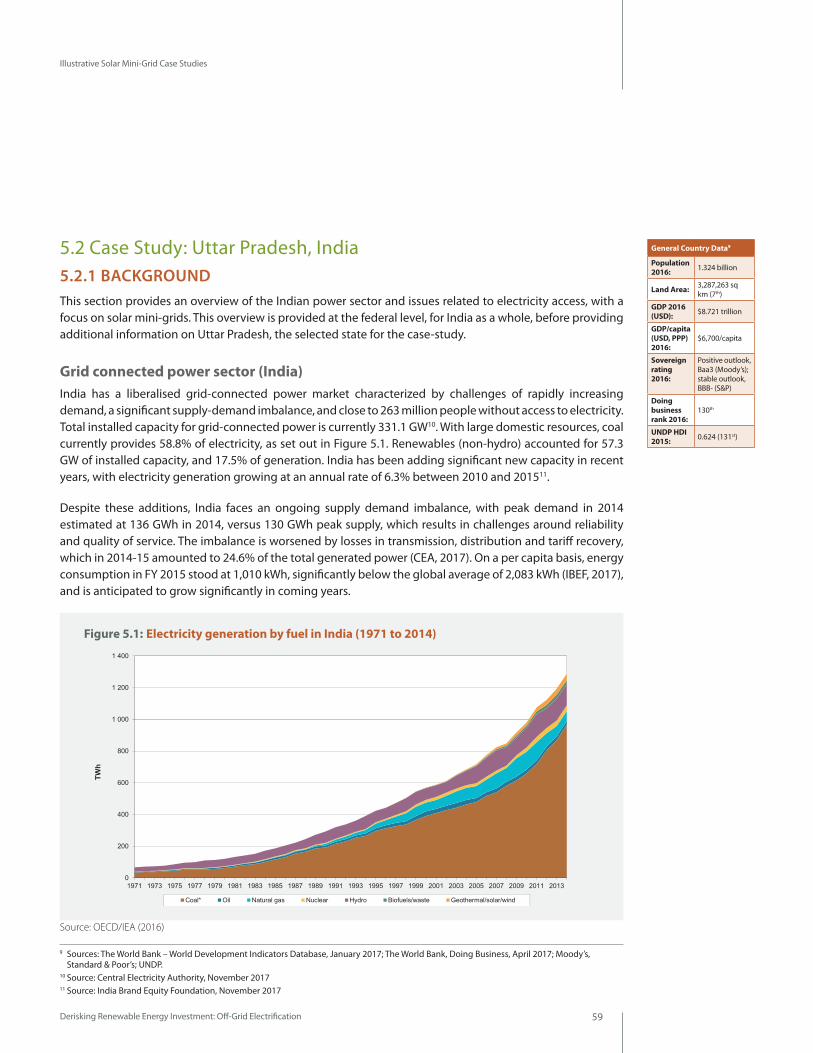
Derisking Renewable Energy Investment: Off-Grid Electrification 59
Illustrative Solar Mini-Grid Case Studies
5.2 Case Study: Uttar Pradesh, India 5.2.1 BACKGROUND This section provides an overview of the Indian power sector and issues related to electricity access, with a focus on solar mini-grids. This overview is provided at the federal level, for India as a whole, before providing additional information on Uttar Pradesh, the selected state for the case-study.
Grid connected power sector (India) India has a liberalised grid-connected power market characterized by challenges of rapidly increasing demand, a significant supply-demand imbalance, and close to 263 million people without access to electricity. Total installed capacity for grid-connected power is currently 331.1 GW10. With large domestic resources, coal currently provides 58.8% of electricity, as set out in Figure 5.1. Renewables (non-hydro) accounted for 57.3 GW of installed capacity, and 17.5% of generation. India has been adding significant new capacity in recent years, with electricity generation growing at an annual rate of 6.3% between 2010 and 201511.
Despite these additions, India faces an ongoing supply demand imbalance, with peak demand in 2014 estimated at 136 GWh in 2014, versus 130 GWh peak supply, which results in challenges around reliability and quality of service. The imbalance is worsened by losses in transmission, distribution and tariff recovery, which in 2014-15 amounted to 24.6% of the total generated power (CEA, 2017). On a per capita basis, energy consumption in FY 2015 stood at 1,010 kWh, significantly below the global average of 2,083 kWh (IBEF, 2017), and is anticipated to grow significantly in coming years.
9 Sources: The World Bank – World Development Indicators Database, January 2017; The World Bank, Doing Business, April 2017; Moody’s, Standard & Poor’s; UNDP.
10 Source: Central Electricity Authority, November 2017 11 Source: India Brand Equity Foundation, November 2017
General Country Data9
Population 2016: 1.324 billion
Land Area: 3,287,263 sq km (7th)
GDP 2016 (USD): $8.721 trillion
GDP/capita (USD, PPP) 2016:
$6,700/capita
Sovereign rating 2016:
Positive outlook, Baa3 (Moody’s); stable outlook, BBB- (S&P)
Doing business rank 2016:
130th
UNDP HDI 2015: 0.624 (131st)
Figure 5.1: Electricity generation by fuel in India (1971 to 2014)
Source: OECD/IEA (2016)
0
200
400
600
800
1 000
1 200
1 400
1971 1973 1975 1977 1979 1981 1983 1985 1987 1989 1991 1993 1995 1997 1999 2001 2003 2005 2007 2009 2011 2013
TWh
Coal* Oil Natural gas Nuclear Hydro Biofuels/waste Geothermal/solar/wind
Electricity generation by fuel
IEA Energy Statistics
India
Statistics on the web: http://www.iea.org/statistics/
For more detailed data, please consult our on-line data service at http://data.iea.org.© OECD/IEA 2016* In this graph, peat and oil shale are aggregated with coal, when relevant.
Derisking Renewable Energy Investment: Off-Grid Electrification60
Illustrative Solar Mini-Grid Case Studies
The Central Electricity Authority (CEA) issued the 20-Year Perspective Transmission Plan for 2014-34 and the updated plan for 2016-36 in order to plan additions to India’s transmission infrastructure. It intends to increase the northern region’s power transmission capacity by 4,600 MW and the southern region’s capacity by 14,400 MW by 2021-22. The total planned investment in the 20-year perspective plan up to 2021-22 is USD 40 billion. The planned transmission lines will be built under a combination of modes: under a cost-plus regime by state-owned Power Grid Corporation of India (PGCIL); as well as through tariff-based competitive bidding and EPC contracts to private players.
While electricity tariffs vary from one state to another, in general tariffs are not cost-reflective. The majority of states in India use an increasing block tariff structure, in which the price per kWh of electricity progressively increases in steps with increasing consumption. Residential and agricultural tariffs are low and highly subsidised by the state governments, and to some extent cross-subsidised by high commercial and industrial tariffs. A combination of subsidisation, distribution losses and inefficient tariff collection has resulted in the current poor financial health of DISCOMs and bundled utilities (Khurana and Banerjee, 2015). Total distribution subsidies amounted to USD 7.5 billion in 2014-1512. In 2015, the government launched Ujwal DISCOM Assurance Yojana (UDAY) to improve the financial health of distribution utilities in India.
Grid-connected renewable energy targets and investment (India)Deployment of grid-connected renewable energy capacity in India has grown significantly in recent years, partly driven by the government’s ambitious targets of deploying 175GW of renewable energy (solar, wind and biomass) by 2022. This includes 100 GW of solar PV (20 GW ultra-mega solar projects, 40 GW utility-scale projects and 40 GW decentralized rooftop projects), 60 GW wind, 10 GW small hydro power and 5 GW biomass-based power projects.
So far, of the 60.1 GW installed capacity of new renewables, the majority is comprised by wind power (32.7 GW), solar PV (14.8 GW) and biomass (8.3 GW)13. However, the annual deployment of solar PV is growing at a much faster rate as compared to wind, and overtook wind for the first time in 2017. To date, financing for wind projects has mostly been provided by private lenders, while financing for solar projects has largely been provided by government banks, followed by private banks (BNEF, 2016). The government’s investment objectives in solar are also supported by its leadership in initiatives such as the International Solar Alliance.
13 Source: Central Electricity Authority, November 2017.
Box 5.2: Electricity and environment in India
The dominance of coal in India’s power sector has contributed greatly to poor air quality. It is estimated that atmospheric emissions from coal-fired power plants in 2010-11 alone have resulted in 80,000 to 115,000 premature deaths (Guttikunda and Jawahar, 2014). While India is the world’s third largest greenhouse gas (GHG) emitter, it has very low GHG emissions on a per capita basis. For its 2015 Intended Nationally Determined Contribution (INDC), India has pledged to reduce its GHG emissions intensity of its GDP by 33-35% by 2030, as compared to 2005 levels. It also aims to achieve about 40 percent cumulative electric power installed capacity from non-fossil fuel based energy resources by 2030 (India’s INDC to UNFCCC, 2015).
Derisking Renewable Energy Investment: Off-Grid Electrification 61
Illustrative Solar Mini-Grid Case Studies
Electricity access (India)Nationally, in binary terms, it is estimated that 263 million people did not have access to electricity in 2012 (IEA and World Bank, 2017). A large proportion of this population is located in the states of Uttar Pradesh, Bihar, Jharkhand, Odisha and West Bengal14. This amounts to approximately 53 million households. Of these, approximately 247 million people live in rural areas and 16 million live in urban areas15. According to a May 2017 progress update report by the Government of India, 13,511 out of the 18,452 villages without electricity access in 2015 had been electrified. It further sets a target of electrifying 45.3 million households lacking electricity access at the time. Recent studies have adapted the multi-tier framework for measuring electricity access for the Indian context and are implementing it selected states (Jain et al., 2016). The key finding is that the states perform less favourably using a multi-tier, multidimensional metric as compared to binary, unidimensional metrics. For instance, while 90% of villages in the surveyed states were electrified as per the official definition, only 63% of all households actually had a grid connection, and only 37% of all households had at least basic electricity services (above Tier 0).
In 2015, the Government of India launched the Deen Dayal Upadhyaya Gram Jyoti Yojana (DDUGJY), which subsumes existing government programs for rural electrification and aims to address three key challenges related to electricity access in India: providing electricity connections to all households, increasing the efficiency of distribution infrastructure, and providing 24x7 power supply for non-agricultural consumers and adequate power supply for agricultural consumers. In 2015, the government launched the 24x7 ‘Power for All’ program – a joint initiative of the government of India with state governments – to fulfil the objectives of DDUGJY through a mixture of grid expansion and rural mini-grids. In October 2017, the government launched the SAUBHAGYA scheme to provide electricity access to all households by March 2019. This initiative will be supported by the Ministry of New and Renewable Energy’s nationwide target for deployment of 2,000 MWp of solar power in off-grid applications by 2022 under the Jawaharlal Nehru National Solar Mission. In practice, SHS are also playing a key role in providing electricity (see Box 5.3).
14 Source: National Sample Survey Organization, 2012.15 According to the 15th Indian Census in 2011, 69.84% of India’s population lives in rural areas and 31.16% lives in urban areas.
Box 5.3: Solar Home Kits in India
Technologies and business models for solar home kits have shown significant innovative activity and diffusion in recent years. Typically solar home kits in India have been sold using the self-ownership model, with customer loans being provided by micro-finance institutions or through partnership with local banks. However, some companies are experimenting with providing electricity on a pay-as-you-go (PAYG) basis, similar to pre-paid mobile phones. In terms of system size, solar home kits can vary from less than 10 W for lighting to several 100 W for lighting and energy efficient appliances such as fans and televisions. Some examples of companies selling solar home kits in India are SELCO, Boond, Orb Energy, ONergy and Simpa Energy. To date, solar home kits have succeeded in attracting investment and diffusing at a much faster rate than mini-grids. As of March 2016, an estimated 5.5m systems have been sold in India. It is estimated that USD 65m have been invested in solar home kit companies just in the last four years (2013-16) (BNEF, 2016).
Derisking Renewable Energy Investment: Off-Grid Electrification62
Illustrative Solar Mini-Grid Case Studies
Mini-grid policies (India)The government of India has put in place a number of policies that affect and guide mini-grid investment. The Rural Electrification Policy (2006) provided some clarity about the legal status and regulations regarding mini-grids. It exempts mini-grids up to 1MW from obligations such as land use change and pollution clearance for certain technologies. It also allows the operators to set retail tariffs based on mutual agreements with customers. Mini-grids are still subject to technical standards and safety measures under the Electricity Act of 2003.
Since 2015, the DDUGJY’s decentralized distribution-cum-generation (DDG) scheme supports the deployment of mini-grid systems in villages where grid supply is not feasible by providing a 90% capital subsidy from the Government of India and a 10% loan from Rural Electrification Corporation or from the state government. The identification of sites and implementation of projects under this scheme is managed by the state utilities and State Renewable Energy Development Agencies (SREDAs).
In June 2016, the Ministry of New and Renewable Energy issued a draft national policy on RE based mini- and micro-grids. It aims to deploy 10,000 projects (or 500 MW capacity) within 5 years. It provides guidelines to be adapted by state governments to draft their own mini-grid policies. Some of the guidelines include specifications of system configurations, recommended pricing models, definition of roles and responsibilities of different actors, setting technology standards, and providing exit options for mini-grid ESCOs.
Besides efforts by the national and state governments to provide universal access to electricity in India, a number of international development actors and donors are working to facilitate project development and private sector investments into mini-grids. Some examples are provided in Box 5.4.
Box 5.4: International Support to solar mini-grids in India (examples)DFID has launched initiatives to support the national and state governments in development of policies through the Energy Access Policy Fund (2015-17), to mobilize public and private investment in sustainable and affordable energy supplies delivered by private energy businesses through the Decentralised Renewable Energy Access Markets (DREAM) program (2016-20), and to improve investment attractiveness for renewable energy through the program on Technical Assistance on India Renewable Energy Finance (2015-17).
KfW has provided a concessional line of credit for € 20 million, as well as a technical assistance grant of €5 million to IREDA in 2016 for its "Access to Energy" Programme. The line of credit is specifically targeted towards financing off-grid solutions for electricity access, and mitigating default risk by project developers.
The Microgrid Investment Accelerator (MIA), is an initiative launched by Allotrope Partners, Facebook Inc. and Microsoft Corp. It will seek to mobilize USD 50 million from 2018 to 2020 and a total of USD 115 million by 2023 by tapping grants and loans from foundations and development banks. It expects to begin disbursing funds to projects in India, Indonesia and East Africa in 2018.
The Rockefeller Foundation in 2010 began developing a model of decentralized renewable energy utilizing an anchor tenant such as a telecom towers in order to provide electricity to households and businesses. In April 2015 they announced the launch of Smart Power for Rural Development, a $75 million project to scale up this model across 1,000 villages in Uttar Pradesh and Bihar. Through its subsidiary, Smart Power India, the initiative has supported seven energy companies to expand electricity service in rural villages across Uttar Pradesh, Bihar, and Jharkhand, India, bringing power to over 40,000 people.
USAID under its PACE-D program is assisting the MoP and MNRE in the deployment of decentralized renewable energy systems since July 2012. It is also supporting off-grid and decentralized through its programs: the Clean Energy Access Network (CLEAN), an all India representative organization launched in 2014 aiming to reduce financial and operational barriers for decentralized clean energy solutions; Sustainable, Clean, Access, Livelihoods, Energy (SCALE), which aims to address the diverse needs of India’s poor through tailored sustainable energy service solutions; and the Partnership on Women’s Entrepreneurship in Clean Energy (wPOWER), which trains women entrepreneurs in business skills and clean energy technologies and products.
Derisking Renewable Energy Investment: Off-Grid Electrification 63
Illustrative Solar Mini-Grid Case Studies
Solar -mini-grid investment to date (India)In recent years there has been an increased interest in mini-grids for rural electricity provision. However, this interest has translated into sporadic and limited investment. In general, several technological solutions, ownership models and service offerings are still being experimented with. Solar PV is the most preferred power generation technology for mini-grid enterprises, followed by biomass. In terms of business models, the build-own-operate-maintain model with pay-as-you-go (PAYG) tariffs is fast emerging as a preferred model. Some examples of private sector mini-grid developers in India include Mera Gao Power, OMC Power, Husk Power, Azure Power, Gram Oorja, and Naturetech Infrastructure.
It is estimated that by March 2016, mini-grids had an installed capacity of 2.9 MW serving 75,000 households. During the period from 2013 to 2016, the 11 leading mini-grid companies in India have raised $16m in equity and $6.26m in debt (BNEF, 2016). For example, in June 2017, Mera Gao Power raised USD 2.5 million in equity funding from the Insitor Seed, the ENGIE Rassembleurs d'Energies Initiative (RDE) and the Electrification Financing Initiative (ElectriFI), with the support of Impact Investment Exchange (IIX). In September 2017, Mitsui and Co. acquired a stake of 1 billion Japanese Yen (approximately USD 9 million) in OMC Power Pvt. Ltd.
Solar mini-grids in Uttar PradeshOf India’s 263 million people lacking electricity access in 2012, Uttar Pradesh accounted for about 121 million people, which equates to 57% of the state’s population (Banerjee et al., 2015). Further, Uttar Pradesh has a relatively high number of private sector firms active in the solar PV-based mini-grid electrification space. Some examples include Mera Gao Power, OMC Power, Husk Power, and Naturetech Infrastructure.
Box 5.5: Examples of Mini-grid Developers in IndiaMera Gao Power is a private enterprise which operates small solar PV mini-grids with 120-250 Wp installed capacity to provide basic electrification for off-grid households. Their mini-grids serve over 150,000 people in 1,500 villages in Uttar Pradesh located in and around Siddhipur district. Each mini-grid serves 30 households on average. Power supply is provided for 7 hours per day for lighting and phone charging. The systems are fully automated systems and do not use any meters, thus reducing capital expenditure. A weekly fixed tariff is collected in cash from the customers, which is based on the number of lights installed and energy consumed. The mini-grids are distributed in a small geographic area, so that a central branch office can provide operation and maintenance services to about 100 mini-grids located in a 10-15km radius around it. Smaller sets of larger villages (200-300HH) are also deserved. The systems are financed by private equity, loans from impact investors and initial grant and award money provided by USAID and WEF.
OMC Power operate solar PV mini-grids at the other end of the spectrum in terms of installed capacity. In their business model, central solar PV plants with 25-100 kW installed capacity and lead acid batteries serve a mini-grid which covers an area of up to 5 sq. km. 50-65% of the generated power is used by telecom towers, which serve as anchor loads with long-term (typically 10 year) contracts. The rest of the power is used by small businesses (banks, petrol stations, etc.) and households. The grid provides 24x7 power and serves up to 3,000 households equipped with load limiters and smart meters for tariff pre-payment. The grids are deployed both in off-grid areas and on-grid areas with poor power supply by the national grid. OMC Power have a joint project with SunEdison to add 5,000 more projects to the current portfolio of 60 projects in 7 district in eastern and central Uttar Pradesh.
Derisking Renewable Energy Investment: Off-Grid Electrification64
Illustrative Solar Mini-Grid Case Studies
In April 2016, the government of Uttar Pradesh enacted the state mini-grid policy, which applies to all mini-grids with less than 500 kWp generation capacity. It prescribes two possible operating models for mini-grids established on build-own-operate-maintain (BOOM) basis. Under the first model, the state government provides a 30% capital subsidy for projects in areas identified by the Uttar Pradesh New and Renewable Energy Development Agency (UPNEDA). The operators are obligated to operate the mini-grid for a minimum of 10 years, to provide electricity for a minimum of 8 hours per day, and to charge fixed flat rate tariffs for loads below 100 W. Under the second model, no subsidy is provided and the mini-grids can be set up at sites identified by the developers. Further, there are no regulations regarding project duration, service level and tariffs. Under both models, in case of extension of the main grid to the project site, the developer can choose to either sell the produced electricity or to transfer the project to the distribution company at terms determined by mutual consent16.
Investments into mini-grids in UP have been on an upward trend in the past few years. As of May 2017, about 3.2 MW of solar based mini-grids covering about 5,000 households had been installed under the government’s DDG scheme. In addition, the state government proposes to add 22 MW of solar based mini-grids by end of FY 2019.17
2023 modelling targetThe modelling case study assumes a 6-year target to provide electricity access to 10% of the state’s unelectrified population using solar mini-grids, amounting to approximately 2.5 million households by 2023. This corresponds to an installed capacity of 323 MWp solar PV.
5.2.2. THE MODEL’S RESULTS
5.2.2.1 Risk environment
InterviewsData for the modelling case study was gathered from 10 interviews held with domestic and international project developers and investors who are considering, or are actively involved in, pursuing solar mini-grid investment opportunities in Uttar Pradesh. An additional six informational interviews were held during the same period with other stakeholders in India.
Financing cost waterfallsThe case study’s analysis of the contribution of investor risks to higher financing costs for solar mini-grids in Uttar Pradesh is shown in the financing cost waterfall in Figure 5.2 (for details, please refer to Figure A.3 in the Annex). Definitions of each of the risk categories is found in Table 4.1 (Chapter 4). A brief summary of the qualitative feedback that project developers and investors shared in their interviews is provided in Table 5.1.
16 Source: UPNEDA, Uttar Pradesh Mini Grid Policy 2016. 17 24x7 Power for All (Uttar Pradesh) document, 2017.
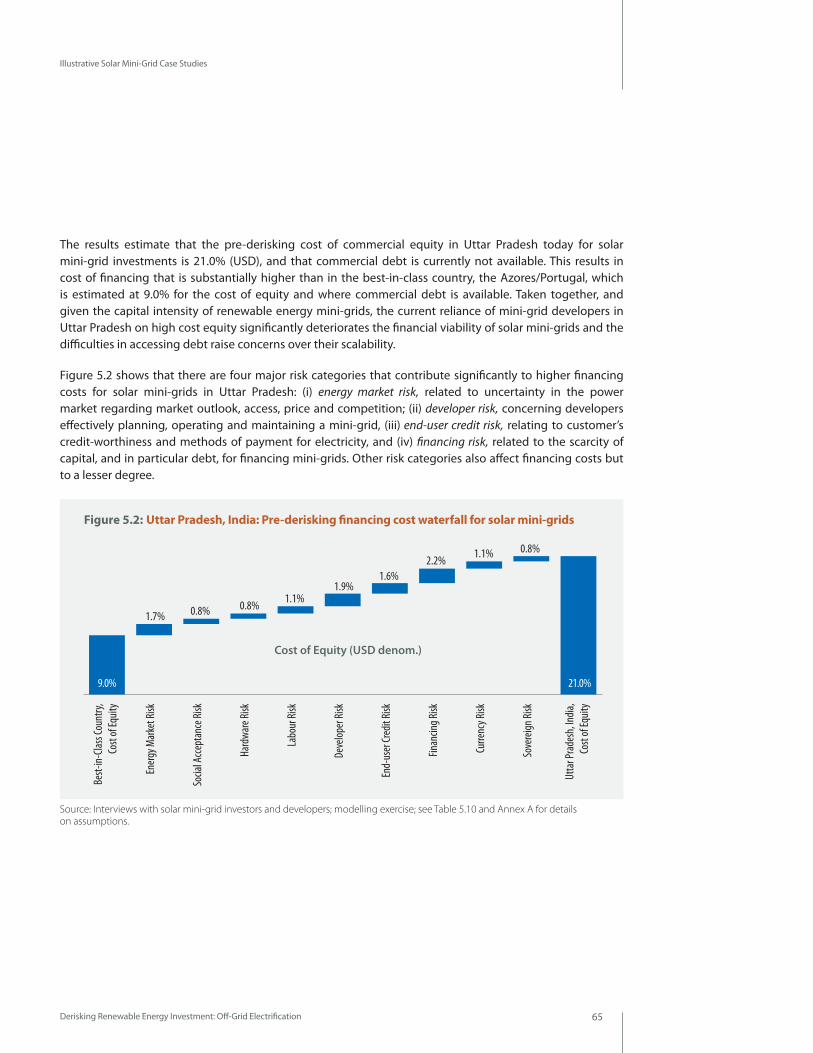
Derisking Renewable Energy Investment: Off-Grid Electrification 65
Illustrative Solar Mini-Grid Case Studies
The results estimate that the pre-derisking cost of commercial equity in Uttar Pradesh today for solar mini-grid investments is 21.0% (USD), and that commercial debt is currently not available. This results in cost of financing that is substantially higher than in the best-in-class country, the Azores/Portugal, which is estimated at 9.0% for the cost of equity and where commercial debt is available. Taken together, and given the capital intensity of renewable energy mini-grids, the current reliance of mini-grid developers in Uttar Pradesh on high cost equity significantly deteriorates the financial viability of solar mini-grids and the difficulties in accessing debt raise concerns over their scalability.
Figure 5.2 shows that there are four major risk categories that contribute significantly to higher financing costs for solar mini-grids in Uttar Pradesh: (i) energy market risk, related to uncertainty in the power market regarding market outlook, access, price and competition; (ii) developer risk, concerning developers effectively planning, operating and maintaining a mini-grid, (iii) end-user credit risk, relating to customer’s credit-worthiness and methods of payment for electricity, and (iv) financing risk, related to the scarcity of capital, and in particular debt, for financing mini-grids. Other risk categories also affect financing costs but to a lesser degree.
Cost of Equity (USD denom.)
Utta
r Pra
desh
, India
,Co
st of
Equit
y
Sove
reign
Risk
Curre
ncy R
isk
Finan
cing R
isk
End-
user
Cred
it Ri
sk
Deve
loper
Risk
Labo
ur Ri
sk
Hard
ware
Risk
Socia
l Acc
epta
nce R
isk
Ener
gy M
arke
t Risk
Best-
in-Cla
ss Co
untry
,Co
st of
Equit
y
9.0% 21.0%
1.7%
0.8%
0.8% 0.8% 1.1% 1.9%
1.6% 2.2% 1.1%
Figure 5.2: Uttar Pradesh, India: Pre-derisking financing cost waterfall for solar mini-grids
Source: Interviews with solar mini-grid investors and developers; modelling exercise; see Table 5.10 and Annex A for details on assumptions.
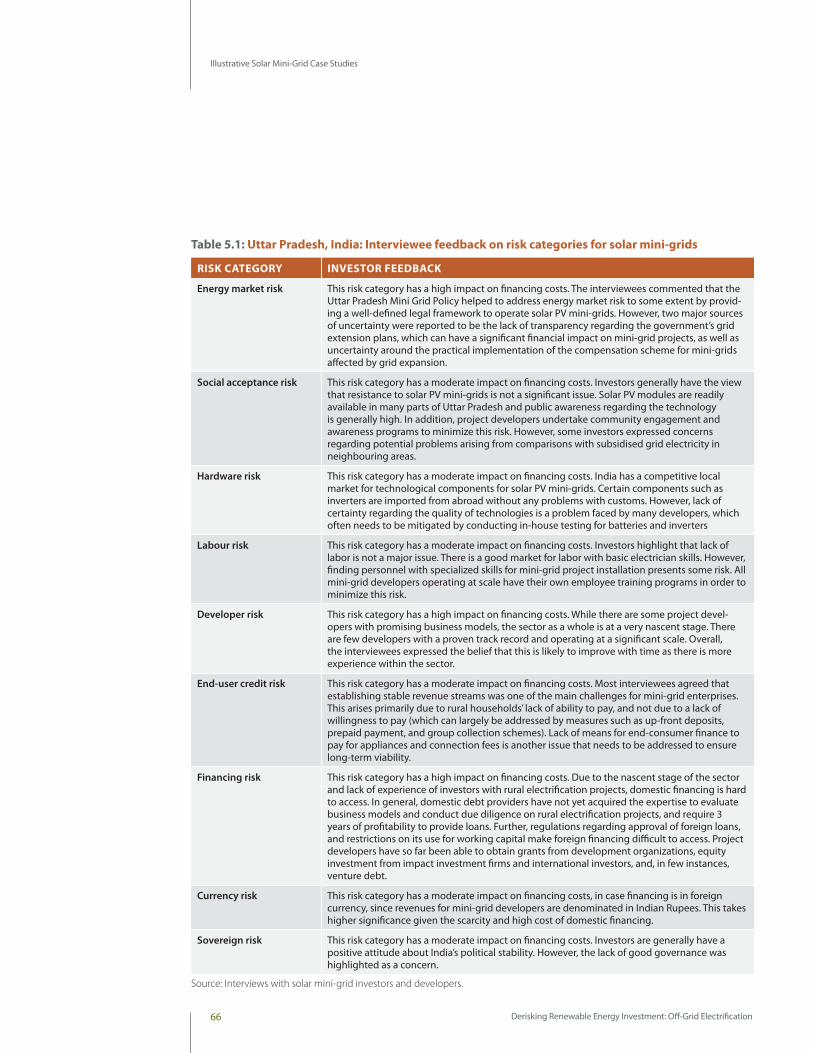
Derisking Renewable Energy Investment: Off-Grid Electrification66
Illustrative Solar Mini-Grid Case Studies
Table 5.1: Uttar Pradesh, India: Interviewee feedback on risk categories for solar mini-grids
RISK CATEGORY INVESTOR FEEDBACK
Energy market risk This risk category has a high impact on financing costs. The interviewees commented that the Uttar Pradesh Mini Grid Policy helped to address energy market risk to some extent by provid-ing a well-defined legal framework to operate solar PV mini-grids. However, two major sources of uncertainty were reported to be the lack of transparency regarding the government’s grid extension plans, which can have a significant financial impact on mini-grid projects, as well as uncertainty around the practical implementation of the compensation scheme for mini-grids affected by grid expansion.
Social acceptance risk This risk category has a moderate impact on financing costs. Investors generally have the view that resistance to solar PV mini-grids is not a significant issue. Solar PV modules are readily available in many parts of Uttar Pradesh and public awareness regarding the technology is generally high. In addition, project developers undertake community engagement and awareness programs to minimize this risk. However, some investors expressed concerns regarding potential problems arising from comparisons with subsidised grid electricity in neighbouring areas.
Hardware risk This risk category has a moderate impact on financing costs. India has a competitive local market for technological components for solar PV mini-grids. Certain components such as inverters are imported from abroad without any problems with customs. However, lack of certainty regarding the quality of technologies is a problem faced by many developers, which often needs to be mitigated by conducting in-house testing for batteries and inverters
Labour risk This risk category has a moderate impact on financing costs. Investors highlight that lack of labor is not a major issue. There is a good market for labor with basic electrician skills. However, finding personnel with specialized skills for mini-grid project installation presents some risk. All mini-grid developers operating at scale have their own employee training programs in order to minimize this risk.
Developer risk This risk category has a high impact on financing costs. While there are some project devel-opers with promising business models, the sector as a whole is at a very nascent stage. There are few developers with a proven track record and operating at a significant scale. Overall, the interviewees expressed the belief that this is likely to improve with time as there is more experience within the sector.
End-user credit risk This risk category has a moderate impact on financing costs. Most interviewees agreed that establishing stable revenue streams was one of the main challenges for mini-grid enterprises. This arises primarily due to rural households’ lack of ability to pay, and not due to a lack of willingness to pay (which can largely be addressed by measures such as up-front deposits, prepaid payment, and group collection schemes). Lack of means for end-consumer finance to pay for appliances and connection fees is another issue that needs to be addressed to ensure long-term viability.
Financing risk This risk category has a high impact on financing costs. Due to the nascent stage of the sector and lack of experience of investors with rural electrification projects, domestic financing is hard to access. In general, domestic debt providers have not yet acquired the expertise to evaluate business models and conduct due diligence on rural electrification projects, and require 3 years of profitability to provide loans. Further, regulations regarding approval of foreign loans, and restrictions on its use for working capital make foreign financing difficult to access. Project developers have so far been able to obtain grants from development organizations, equity investment from impact investment firms and international investors, and, in few instances, venture debt.
Currency risk This risk category has a moderate impact on financing costs, in case financing is in foreign currency, since revenues for mini-grid developers are denominated in Indian Rupees. This takes higher significance given the scarcity and high cost of domestic financing.
Sovereign risk This risk category has a moderate impact on financing costs. Investors are generally have a positive attitude about India’s political stability. However, the lack of good governance was highlighted as a concern.
Source: Interviews with solar mini-grid investors and developers.
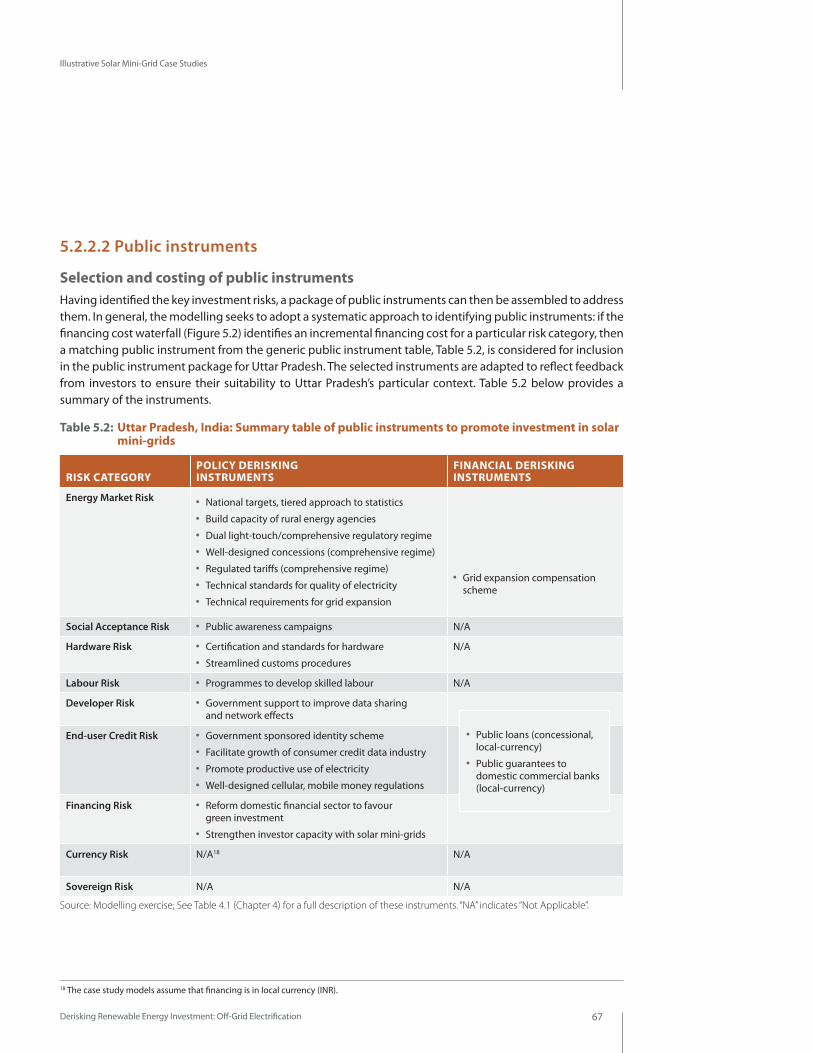
Derisking Renewable Energy Investment: Off-Grid Electrification 67
Illustrative Solar Mini-Grid Case Studies
5.2.2.2 Public instruments
Selection and costing of public instrumentsHaving identified the key investment risks, a package of public instruments can then be assembled to address them. In general, the modelling seeks to adopt a systematic approach to identifying public instruments: if the financing cost waterfall (Figure 5.2) identifies an incremental financing cost for a particular risk category, then a matching public instrument from the generic public instrument table, Table 5.2, is considered for inclusion in the public instrument package for Uttar Pradesh. The selected instruments are adapted to reflect feedback from investors to ensure their suitability to Uttar Pradesh’s particular context. Table 5.2 below provides a summary of the instruments.
Table 5.2: Uttar Pradesh, India: Summary table of public instruments to promote investment in solar mini-grids
18 The case study models assume that financing is in local currency (INR).
RISK CATEGORYPOLICY DERISKING INSTRUMENTS
FINANCIAL DERISKING INSTRUMENTS
Energy Market Risk●● National targets, tiered approach to statistics●● Build capacity of rural energy agencies●● Dual light-touch/comprehensive regulatory regime ●● Well-designed concessions (comprehensive regime)●● Regulated tariffs (comprehensive regime)●● Technical standards for quality of electricity ●● Technical requirements for grid expansion
●● Grid expansion compensation scheme
Social Acceptance Risk ●● Public awareness campaigns N/A
Hardware Risk ●● Certification and standards for hardware●● Streamlined customs procedures
N/A
Labour Risk ●● Programmes to develop skilled labour N/A
Developer Risk ●● Government support to improve data sharing and network effects
End-user Credit Risk ●● Government sponsored identity scheme●● Facilitate growth of consumer credit data industry ●● Promote productive use of electricity ●● Well-designed cellular, mobile money regulations
Financing Risk ●● Reform domestic financial sector to favour green investment
●● Strengthen investor capacity with solar mini-grids
Currency Risk N/A18 N/A
Sovereign Risk N/A N/A
Source: Modelling exercise; See Table 4.1 (Chapter 4) for a full description of these instruments. “NA” indicates “Not Applicable”.
●● Public loans (concessional, local-currency)
●● Public guarantees to domestic commercial banks (local-currency)
18 The case study models assume that financing is in local currency (INR).
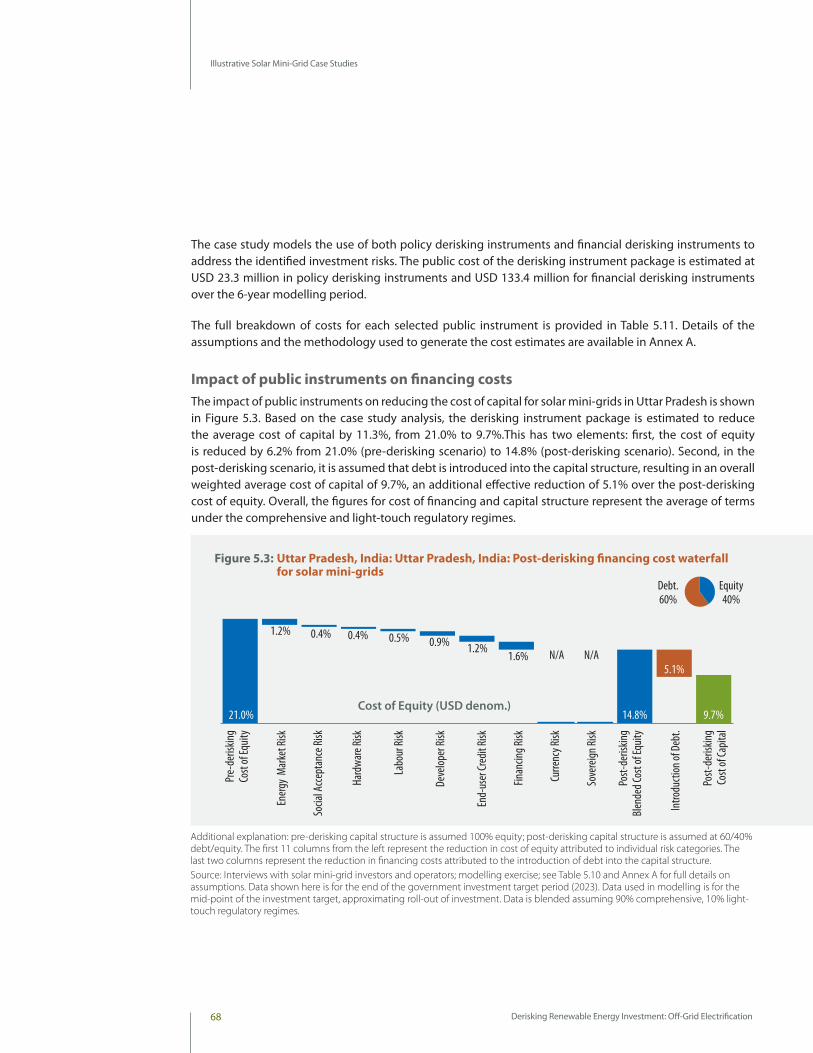
Derisking Renewable Energy Investment: Off-Grid Electrification68
Illustrative Solar Mini-Grid Case Studies
The case study models the use of both policy derisking instruments and financial derisking instruments to address the identified investment risks. The public cost of the derisking instrument package is estimated at USD 23.3 million in policy derisking instruments and USD 133.4 million for financial derisking instruments over the 6-year modelling period.
The full breakdown of costs for each selected public instrument is provided in Table 5.11. Details of the assumptions and the methodology used to generate the cost estimates are available in Annex A.
Impact of public instruments on financing costs The impact of public instruments on reducing the cost of capital for solar mini-grids in Uttar Pradesh is shown in Figure 5.3. Based on the case study analysis, the derisking instrument package is estimated to reduce the average cost of capital by 11.3%, from 21.0% to 9.7%.This has two elements: first, the cost of equity is reduced by 6.2% from 21.0% (pre-derisking scenario) to 14.8% (post-derisking scenario). Second, in the post-derisking scenario, it is assumed that debt is introduced into the capital structure, resulting in an overall weighted average cost of capital of 9.7%, an additional effective reduction of 5.1% over the post-derisking cost of equity. Overall, the figures for cost of financing and capital structure represent the average of terms under the comprehensive and light-touch regulatory regimes.
Cost of Equity (USD denom.)
Post-
deris
king
Blen
ded C
ost o
f Equ
ity
Intro
ducti
on of
Deb
t.
Post-
deris
king
Cost
of Ca
pital
Sove
reign
Risk
Curre
ncy R
isk
Finan
cing R
isk
End-
user
Cred
it Ri
sk
Deve
loper
Risk
Labo
ur Ri
sk
Hard
ware
Risk
Socia
l Acc
epta
nce R
isk
Ener
gy M
arke
t Risk
Pre-
deris
king
Cost
of Eq
uity
21.0% 9.7%
5.1%
14.8%
1.2%
N/A
0.4% 0.4% 0.5% 0.9% 1.2% 1.6% N/A
Equity40%
Debt.60%
Figure 5.3: Uttar Pradesh, India: Uttar Pradesh, India: Post-derisking financing cost waterfall for solar mini-grids
Additional explanation: pre-derisking capital structure is assumed 100% equity; post-derisking capital structure is assumed at 60/40% debt/equity. The first 11 columns from the left represent the reduction in cost of equity attributed to individual risk categories. The last two columns represent the reduction in financing costs attributed to the introduction of debt into the capital structure. Source: Interviews with solar mini-grid investors and operators; modelling exercise; see Table 5.10 and Annex A for full details on assumptions. Data shown here is for the end of the government investment target period (2023). Data used in modelling is for the mid-point of the investment target, approximating roll-out of investment. Data is blended assuming 90% comprehensive, 10% light-touch regulatory regimes.
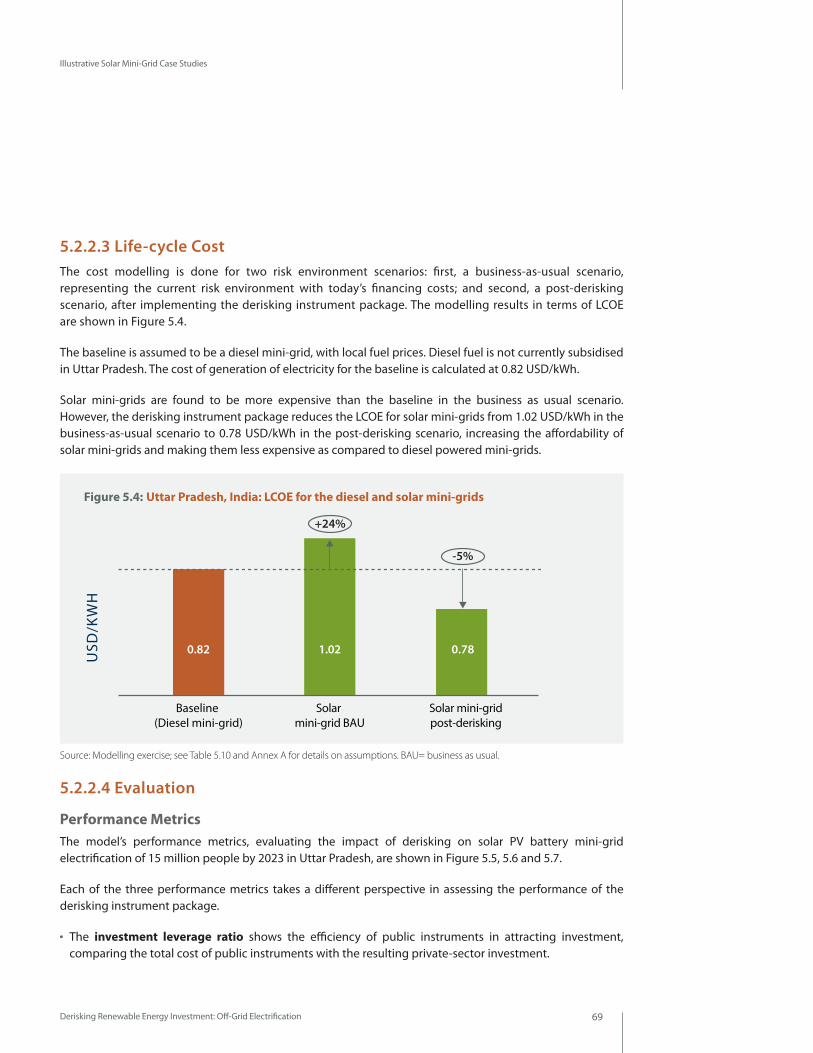
Derisking Renewable Energy Investment: Off-Grid Electrification 69
Illustrative Solar Mini-Grid Case Studies
5.2.2.3 Life-cycle CostThe cost modelling is done for two risk environment scenarios: first, a business-as-usual scenario, representing the current risk environment with today’s financing costs; and second, a post-derisking scenario, after implementing the derisking instrument package. The modelling results in terms of LCOE are shown in Figure 5.4.
The baseline is assumed to be a diesel mini-grid, with local fuel prices. Diesel fuel is not currently subsidised in Uttar Pradesh. The cost of generation of electricity for the baseline is calculated at 0.82 USD/kWh.
Solar mini-grids are found to be more expensive than the baseline in the business as usual scenario. However, the derisking instrument package reduces the LCOE for solar mini-grids from 1.02 USD/kWh in the business-as-usual scenario to 0.78 USD/kWh in the post-derisking scenario, increasing the affordability of solar mini-grids and making them less expensive as compared to diesel powered mini-grids.
5.2.2.4 Evaluation
Performance MetricsThe model’s performance metrics, evaluating the impact of derisking on solar PV battery mini-grid electrification of 15 million people by 2023 in Uttar Pradesh, are shown in Figure 5.5, 5.6 and 5.7.
Each of the three performance metrics takes a different perspective in assessing the performance of the derisking instrument package.
●● The investment leverage ratio shows the efficiency of public instruments in attracting investment, comparing the total cost of public instruments with the resulting private-sector investment.
Solar mini-gridpost-derisking
Solar mini-grid BAU
Baseline (Diesel mini-grid)
0.781.020.82USD
/KW
H
+24%
-5%
Figure 5.4: Uttar Pradesh, India: LCOE for the diesel and solar mini-grids
Source: Modelling exercise; see Table 5.10 and Annex A for details on assumptions. BAU= business as usual.
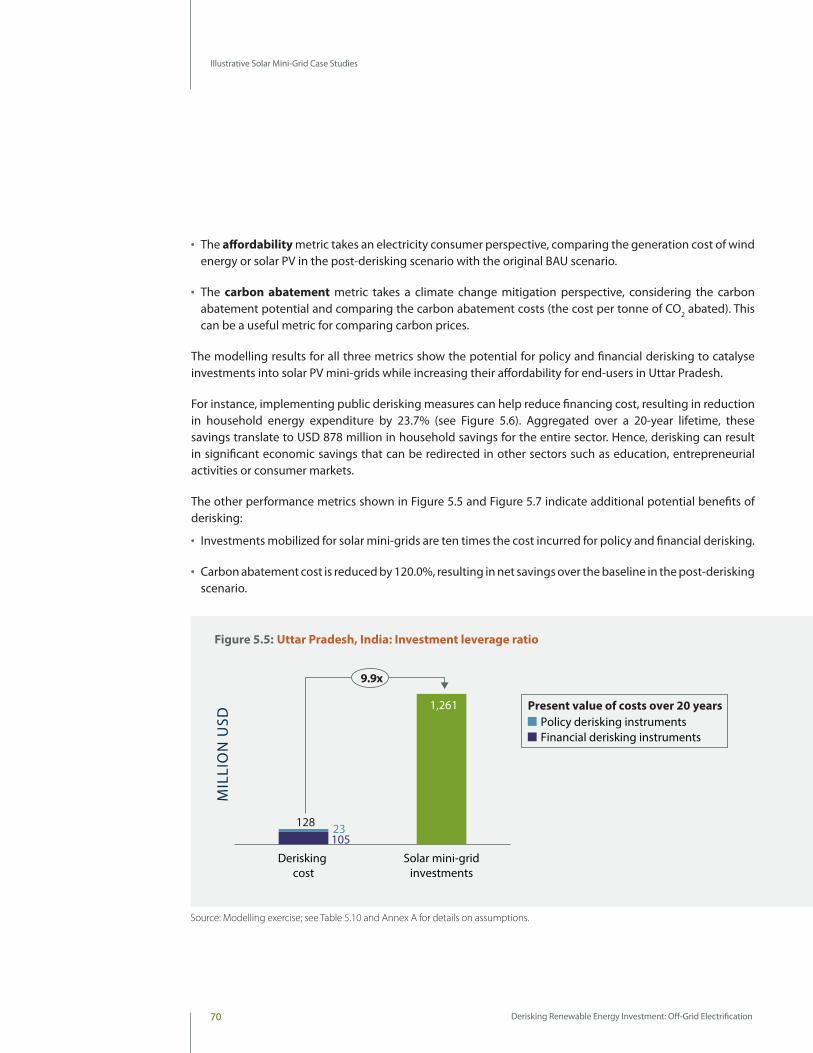
Derisking Renewable Energy Investment: Off-Grid Electrification70
Illustrative Solar Mini-Grid Case Studies
●● The affordability metric takes an electricity consumer perspective, comparing the generation cost of wind energy or solar PV in the post-derisking scenario with the original BAU scenario.
●● The carbon abatement metric takes a climate change mitigation perspective, considering the carbon abatement potential and comparing the carbon abatement costs (the cost per tonne of CO2 abated). This can be a useful metric for comparing carbon prices.
The modelling results for all three metrics show the potential for policy and financial derisking to catalyse investments into solar PV mini-grids while increasing their affordability for end-users in Uttar Pradesh.
For instance, implementing public derisking measures can help reduce financing cost, resulting in reduction in household energy expenditure by 23.7% (see Figure 5.6). Aggregated over a 20-year lifetime, these savings translate to USD 878 million in household savings for the entire sector. Hence, derisking can result in significant economic savings that can be redirected in other sectors such as education, entrepreneurial activities or consumer markets.
The other performance metrics shown in Figure 5.5 and Figure 5.7 indicate additional potential benefits of derisking:
●● Investments mobilized for solar mini-grids are ten times the cost incurred for policy and financial derisking.
●● Carbon abatement cost is reduced by 120.0%, resulting in net savings over the baseline in the post-derisking scenario.
Solar mini-gridinvestments
Derisking cost
9.9x
MIL
LIO
N U
SD 1,261
12810523
Policy derisking instruments Present value of costs over 20 years
Financial derisking instruments
Figure 5.5: Uttar Pradesh, India: Investment leverage ratio
Source: Modelling exercise; see Table 5.10 and Annex A for details on assumptions.
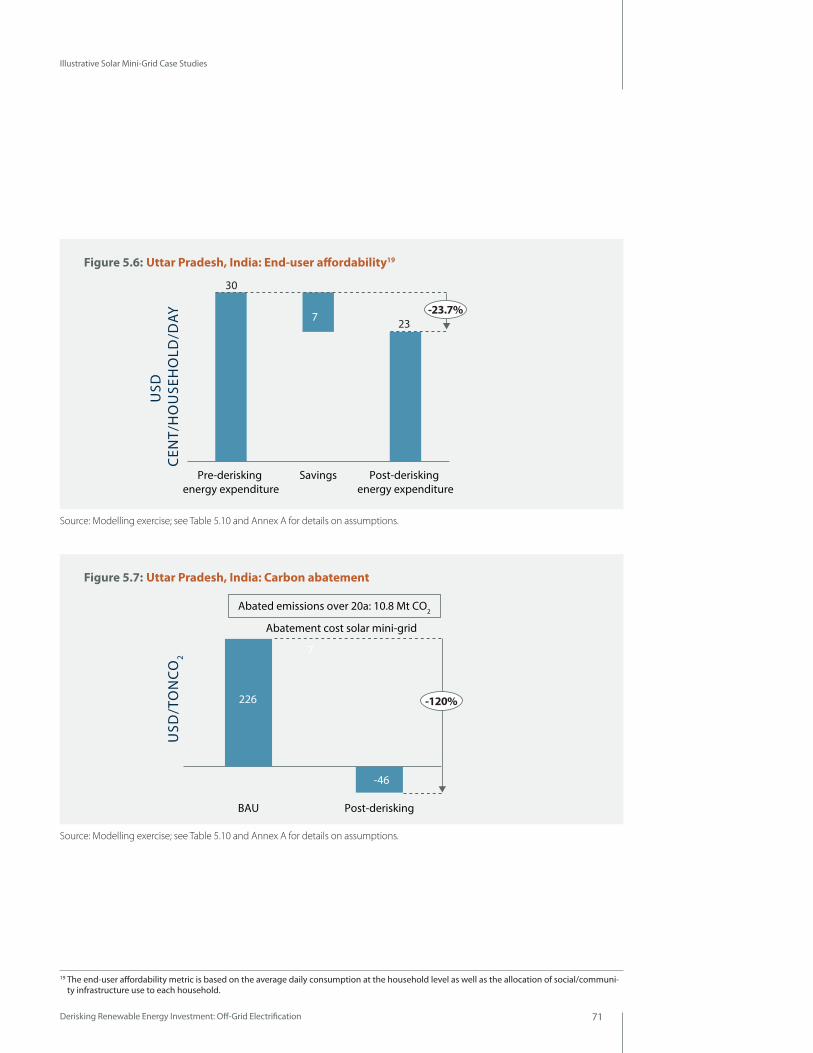
Derisking Renewable Energy Investment: Off-Grid Electrification 71
Illustrative Solar Mini-Grid Case Studies
Post-derisking energy expenditure
SavingsPre-derisking energy expenditure
USD
C
ENT/
HO
USE
HO
LD/D
AY 23
30
7-23.7%
Post-deriskingBAU
USD
/TO
NC
O2
-46
226
7
-120%
Abated emissions over 20a: 10.8 Mt CO2
Abatement cost solar mini-grid
Figure 5.6: Uttar Pradesh, India: End-user affordability19
Figure 5.7: Uttar Pradesh, India: Carbon abatement
Source: Modelling exercise; see Table 5.10 and Annex A for details on assumptions.
Source: Modelling exercise; see Table 5.10 and Annex A for details on assumptions.
19 The end-user affordability metric is based on the average daily consumption at the household level as well as the allocation of social/communi-ty infrastructure use to each household.
Derisking Renewable Energy Investment: Off-Grid Electrification72
Illustrative Solar Mini-Grid Case Studies
Sensitivities An initial set of sensitivity analyses has been performed for the solar mini-grids. The objective of the sensitivity analyses is to gain a better understanding of the robustness of the outputs and to be able to test different scenarios.
Six types of sensitivity analysis have been performed:
1. Key input assumptions
2. Investment target
3. Regulatory track
4. Capital subsidies
5. Load profiles
6. Approach to costing financial derisking instruments
In sum, the analysis is robust to these variations. Derisking solar mini-grids remains a cost-effective policy options in order enable scaling up private investment in off-grid electrification.
1. Sensitivity analysis on key input assumptions A sensitivity analysis has been performed for the following input assumptions: (i) investment costs, (ii) fuel costs for the diesel mini-grid, (iii) financing cost, and (iv) capital structure. The sensitivity analyses illustrate the degree to which each input parameter affects the outputs. In each case, all other assumptions have been constant.
Table 5.3 compares the LCOE of the baseline (diesel mini-grid) with the LCOE of a solar mini-grid in the pre-derisking situation, in a post-derisking situation exclusively under the light-touch regime and exclusively under the comprehensive regime. It then also shows the blended numbers, assuming that 90% of solar mini-grids operate under the comprehensive and 10% under the light-touch regime. As Table 5.3 on page 73 illustrates, the solar mini-grid LCOE is very sensitive to changes in investment costs. The base case modelling takes into consideration learning effects and reductions in hardware costs, given that investment targets are met over a 6 year period. However, if we were to model the full investment target, assuming today’s hardware costs, the post-derisking blended LCOE would be 0.93 USD versus 0.78 USD/kWh, a 20% increase.
Another important input parameter is the capital structure, and the percentage of investment costs that is debt-financed versus equity-financed. Moving the capital structure from 30% Debt/70% Equity to 40% Debt/60% Equity has a meaningful impact on the solar mini-grid LCOE, showing a reduction of 3% from 0.78 USD/kWh to 0.75 USD/kWh. This observation highlights the importance of catalysing cheap debt financing, which requires a somewhat comprehensive regulation in the case of mini-grids (see Chapter 3).
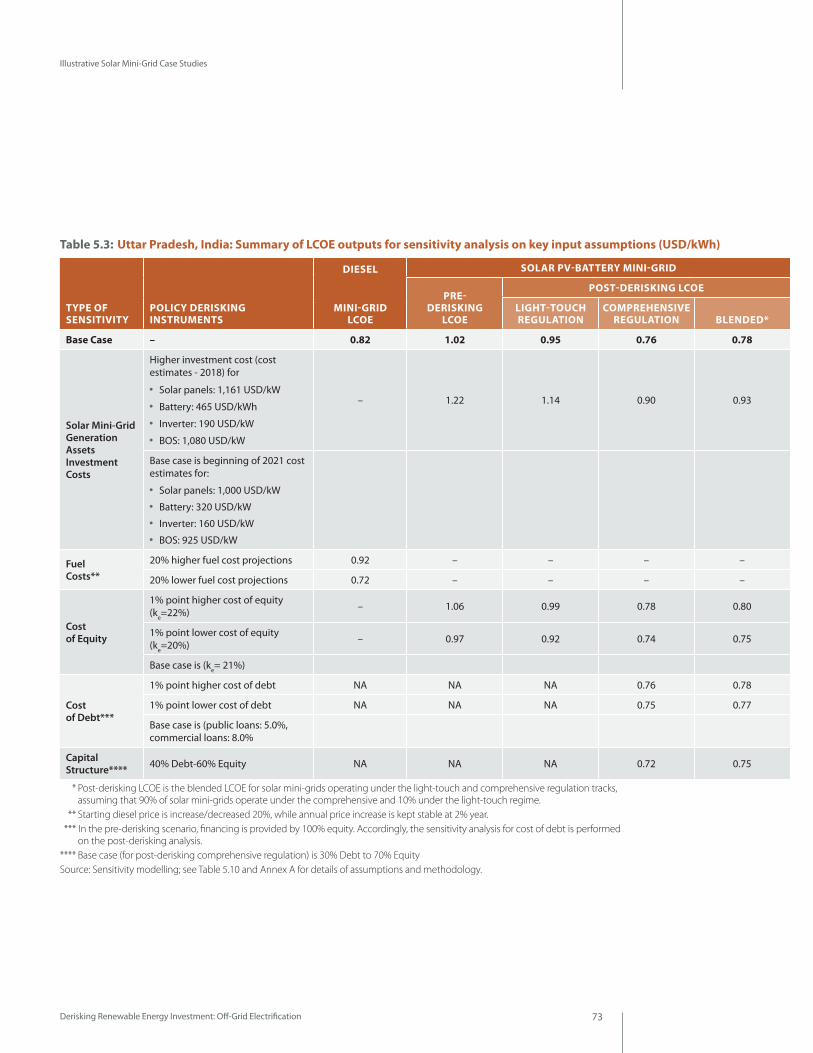
Derisking Renewable Energy Investment: Off-Grid Electrification 73
Illustrative Solar Mini-Grid Case Studies
TYPE OF SENSITIVITY
POLICY DERISKING INSTRUMENTS
DIESEL
MINI-GRID LCOE
SOLAR PV-BATTERY MINI-GRID
PRE- DERISKING
LCOE
POST-DERISKING LCOE
LIGHT-TOUCH REGULATION
COMPREHENSIVE REGULATION BLENDED*
Base Case – 0.82 1.02 0.95 0.76 0.78
Solar Mini-Grid Generation Assets Investment Costs
Higher investment cost (cost estimates - 2018) for
●● Solar panels: 1,161 USD/kW●● Battery: 465 USD/kWh ●● Inverter: 190 USD/kW●● BOS: 1,080 USD/kW
– 1.22 1.14 0.90 0.93
Base case is beginning of 2021 cost estimates for:
●● Solar panels: 1,000 USD/kW●● Battery: 320 USD/kW●● Inverter: 160 USD/kW●● BOS: 925 USD/kW
Fuel Costs**
20% higher fuel cost projections 0.92 – – – –
20% lower fuel cost projections 0.72 – – – –
Cost of Equity
1% point higher cost of equity (ke=22%) – 1.06 0.99 0.78 0.80
1% point lower cost of equity (ke=20%) – 0.97 0.92 0.74 0.75
Base case is (ke= 21%)
Cost of Debt***
1% point higher cost of debt NA NA NA 0.76 0.78
1% point lower cost of debt NA NA NA 0.75 0.77
Base case is (public loans: 5.0%, commercial loans: 8.0%
Capital Structure**** 40% Debt-60% Equity NA NA NA 0.72 0.75
Table 5.3: Uttar Pradesh, India: Summary of LCOE outputs for sensitivity analysis on key input assumptions (USD/kWh)
**** Post-derisking LCOE is the blended LCOE for solar mini-grids operating under the light-touch and comprehensive regulation tracks, assuming that 90% of solar mini-grids operate under the comprehensive and 10% under the light-touch regime.
**** Starting diesel price is increase/decreased 20%, while annual price increase is kept stable at 2% year. **** In the pre-derisking scenario, financing is provided by 100% equity. Accordingly, the sensitivity analysis for cost of debt is performed
on the post-derisking analysis. **** Base case (for post-derisking comprehensive regulation) is 30% Debt to 70% EquitySource: Sensitivity modelling; see Table 5.10 and Annex A for details of assumptions and methodology.

Derisking Renewable Energy Investment: Off-Grid Electrification74
Illustrative Solar Mini-Grid Case Studies
2. Investment targetThe selection of the investment target has important implications for not only the performance metrics, but also for the cost of financial and policy derisking instruments to reach these targets.
Table 5.4 illustrates two additional electrification scenarios, whereby 5% and 20% of the unelectrified population are provided access to electricity. Doubling the amount of people with access to electricity from clean, renewable energy sources would result in a doubling of the economy-wide savings over the life of these investments. While not easily quantifiable, an increase in electrification due to increased market penetration of mini-grids will also result in lower upfront capital costs due to better pricing/cost advantages achieved from scale, resulting in higher investment leverage ratios, as well as higher savings (due to lower LCOEs). These sensitivities show the robustness of the derisking approach to changed investment targets.
Table 5.4: Uttar Pradesh, India: Summary of key outputs for different electrification scenarios
3. Sensitivity analysis on regulatory trackThe level of energy market regulation is an important consideration for renewable mini-grids. As Table 5.5 on page 75 clearly illustrates, renewable mini-grids benefit from clear, transparent, and well-designed concessions as this allows mini-grid operators to access debt financing. For instance, in the case of 100% light-touch regulation, the LCOE would be 0.95 USD/kWh, resulting in households savings of 7.24 USD per annum. With 100% comprehensive regulation, the LCOE would be reduced by 46%, with nearly a six-fold increase in annual household savings. This is primarily driven by the debt financing assumed under the comprehensive regime. However, the cost reductions are contingent on well-designed and administered policy, which may require some amount of policy experimentation in the initial stages.
ELECTRIFICATION SCENARIO
DESCRIPTION OF SCENARIO
NUMBER OF HOUSEHOLDS ELECTRIFIED
INVESTMENT LEVERAGE
RATIO
ECONOMY-WIDE SAVINGS OVER 20 YEARS (USD)
Base Case 10% electrification 2.5 million 9.9x 878 million
Scenario 1** 5% electrification 1.25 million 4.9x 439 million
Scenario 2** 20% electrification 5 million 19.7x 1,756 million
** In the base case, post-derisking LCOE is the blended LCOE for solar mini-grids operating under the light-touch and comprehensive regulatory tracks.
** Scenario 1 and Scenario 2 also assume a 90% comprehensive and 10% light-touch regulatory track breakdown. Source: Sensitivity modelling; see Table 5.10 and Annex A for details of assumptions and methodology.
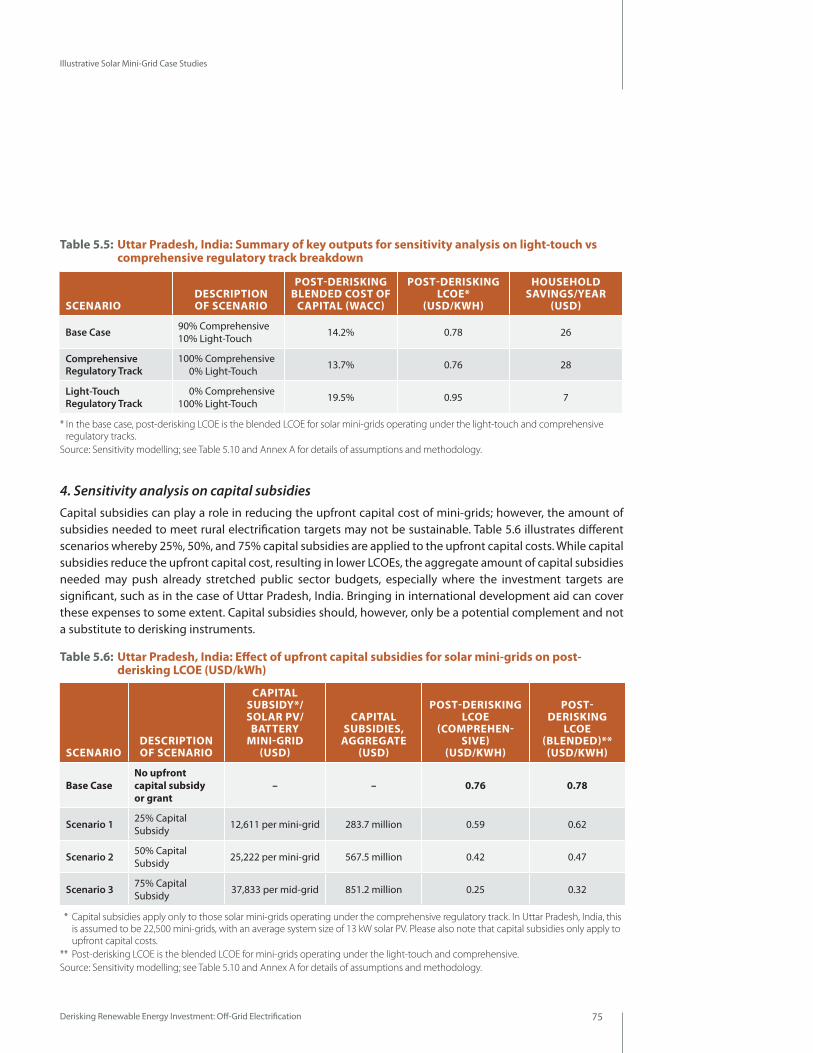
Derisking Renewable Energy Investment: Off-Grid Electrification 75
Illustrative Solar Mini-Grid Case Studies
4. Sensitivity analysis on capital subsidiesCapital subsidies can play a role in reducing the upfront capital cost of mini-grids; however, the amount of subsidies needed to meet rural electrification targets may not be sustainable. Table 5.6 illustrates different scenarios whereby 25%, 50%, and 75% capital subsidies are applied to the upfront capital costs. While capital subsidies reduce the upfront capital cost, resulting in lower LCOEs, the aggregate amount of capital subsidies needed may push already stretched public sector budgets, especially where the investment targets are significant, such as in the case of Uttar Pradesh, India. Bringing in international development aid can cover these expenses to some extent. Capital subsidies should, however, only be a potential complement and not a substitute to derisking instruments.
Table 5.6: Uttar Pradesh, India: Effect of upfront capital subsidies for solar mini-grids on post- derisking LCOE (USD/kWh)
SCENARIODESCRIPTION OF SCENARIO
CAPITAL SUBSIDY*/ SOLAR PV/ BATTERY
MINI-GRID (USD)
CAPITAL SUBSIDIES,
AGGREGATE (USD)
POST-DERISKING LCOE
(COMPREHEN-SIVE)
(USD/KWH)
POST- DERISKING
LCOE (BLENDED)** (USD/KWH)
Base CaseNo upfront capital subsidy or grant
– – 0.76 0.78
Scenario 1 25% Capital Subsidy 12,611 per mini-grid 283.7 million 0.59 0.62
Scenario 2 50% Capital Subsidy 25,222 per mini-grid 567.5 million 0.42 0.47
Scenario 3 75% Capital Subsidy 37,833 per mid-grid 851.2 million 0.25 0.32
SCENARIODESCRIPTION OF SCENARIO
POST-DERISKING BLENDED COST OF
CAPITAL (WACC)
POST-DERISKING LCOE*
(USD/KWH)
HOUSEHOLD SAVINGS/YEAR
(USD)
Base Case 90% Comprehensive 10% Light-Touch 14.2% 0.78 26
Comprehensive Regulatory Track
100% Comprehensive 0% Light-Touch 13.7% 0.76 28
Light-Touch Regulatory Track
0% Comprehensive 100% Light-Touch 19.5% 0.95 7
* In the base case, post-derisking LCOE is the blended LCOE for solar mini-grids operating under the light-touch and comprehensive regulatory tracks.
Source: Sensitivity modelling; see Table 5.10 and Annex A for details of assumptions and methodology.
** Capital subsidies apply only to those solar mini-grids operating under the comprehensive regulatory track. In Uttar Pradesh, India, this is assumed to be 22,500 mini-grids, with an average system size of 13 kW solar PV. Please also note that capital subsidies only apply to upfront capital costs.
** Post-derisking LCOE is the blended LCOE for mini-grids operating under the light-touch and comprehensive. Source: Sensitivity modelling; see Table 5.10 and Annex A for details of assumptions and methodology.
Table 5.5: Uttar Pradesh, India: Summary of key outputs for sensitivity analysis on light-touch vs comprehensive regulatory track breakdown
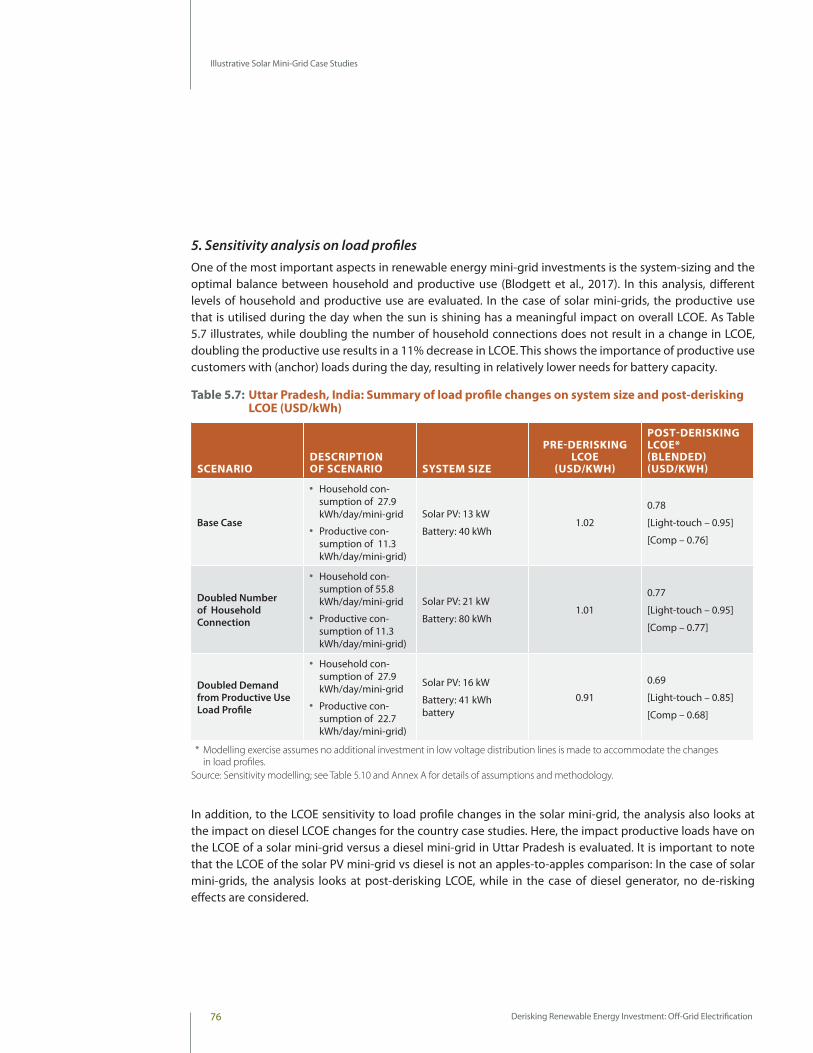
Derisking Renewable Energy Investment: Off-Grid Electrification76
Illustrative Solar Mini-Grid Case Studies
5. Sensitivity analysis on load profilesOne of the most important aspects in renewable energy mini-grid investments is the system-sizing and the optimal balance between household and productive use (Blodgett et al., 2017). In this analysis, different levels of household and productive use are evaluated. In the case of solar mini-grids, the productive use that is utilised during the day when the sun is shining has a meaningful impact on overall LCOE. As Table 5.7 illustrates, while doubling the number of household connections does not result in a change in LCOE, doubling the productive use results in a 11% decrease in LCOE. This shows the importance of productive use customers with (anchor) loads during the day, resulting in relatively lower needs for battery capacity.
Table 5.7: Uttar Pradesh, India: Summary of load profile changes on system size and post-derisking LCOE (USD/kWh)
In addition, to the LCOE sensitivity to load profile changes in the solar mini-grid, the analysis also looks at the impact on diesel LCOE changes for the country case studies. Here, the impact productive loads have on the LCOE of a solar mini-grid versus a diesel mini-grid in Uttar Pradesh is evaluated. It is important to note that the LCOE of the solar PV mini-grid vs diesel is not an apples-to-apples comparison: In the case of solar mini-grids, the analysis looks at post-derisking LCOE, while in the case of diesel generator, no de-risking effects are considered.
SCENARIODESCRIPTION OF SCENARIO SYSTEM SIZE
PRE-DERISKING LCOE
(USD/KWH)
POST-DERISKING LCOE* (BLENDED) (USD/KWH)
Base Case
●● Household con-sumption of 27.9 kWh/day/mini-grid
●● Productive con-sumption of 11.3 kWh/day/mini-grid)
Solar PV: 13 kW
Battery: 40 kWh1.02
0.78
[Light-touch – 0.95]
[Comp – 0.76]
Doubled Number of Household Connection
●● Household con-sumption of 55.8 kWh/day/mini-grid
●● Productive con-sumption of 11.3 kWh/day/mini-grid)
Solar PV: 21 kW
Battery: 80 kWh1.01
0.77
[Light-touch – 0.95]
[Comp – 0.77]
Doubled Demand from Productive Use Load Profile
●● Household con-sumption of 27.9 kWh/day/mini-grid
●● Productive con-sumption of 22.7 kWh/day/mini-grid)
Solar PV: 16 kW
Battery: 41 kWh battery
0.91
0.69
[Light-touch – 0.85]
[Comp – 0.68]
** Modelling exercise assumes no additional investment in low voltage distribution lines is made to accommodate the changes in load profiles.
Source: Sensitivity modelling; see Table 5.10 and Annex A for details of assumptions and methodology.
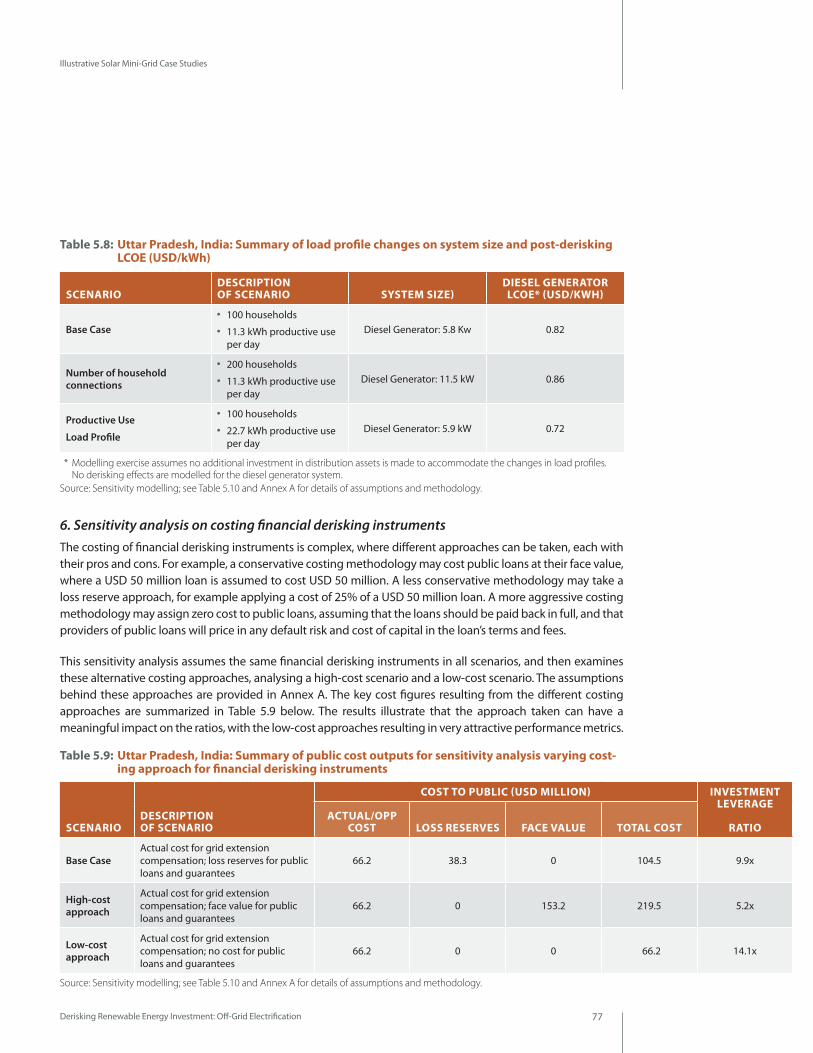
Derisking Renewable Energy Investment: Off-Grid Electrification 77
Illustrative Solar Mini-Grid Case Studies
Table 5.8: Uttar Pradesh, India: Summary of load profile changes on system size and post-derisking LCOE (USD/kWh)
6. Sensitivity analysis on costing financial derisking instruments The costing of financial derisking instruments is complex, where different approaches can be taken, each with their pros and cons. For example, a conservative costing methodology may cost public loans at their face value, where a USD 50 million loan is assumed to cost USD 50 million. A less conservative methodology may take a loss reserve approach, for example applying a cost of 25% of a USD 50 million loan. A more aggressive costing methodology may assign zero cost to public loans, assuming that the loans should be paid back in full, and that providers of public loans will price in any default risk and cost of capital in the loan’s terms and fees.
This sensitivity analysis assumes the same financial derisking instruments in all scenarios, and then examines these alternative costing approaches, analysing a high-cost scenario and a low-cost scenario. The assumptions behind these approaches are provided in Annex A. The key cost figures resulting from the different costing approaches are summarized in Table 5.9 below. The results illustrate that the approach taken can have a meaningful impact on the ratios, with the low-cost approaches resulting in very attractive performance metrics.
Table 5.9: Uttar Pradesh, India: Summary of public cost outputs for sensitivity analysis varying cost-ing approach for financial derisking instruments
SCENARIODESCRIPTION OF SCENARIO SYSTEM SIZE)
DIESEL GENERATOR LCOE* (USD/KWH)
Base Case
●● 100 households●● 11.3 kWh productive use
per day Diesel Generator: 5.8 Kw 0.82
Number of household connections
●● 200 households●● 11.3 kWh productive use
per day Diesel Generator: 11.5 kW 0.86
Productive Use
Load Profile
●● 100 households●● 22.7 kWh productive use
per dayDiesel Generator: 5.9 kW 0.72
SCENARIODESCRIPTION OF SCENARIO
COST TO PUBLIC (USD MILLION) INVESTMENT LEVERAGE
RATIOACTUAL/OPP
COST LOSS RESERVES FACE VALUE TOTAL COST
Base CaseActual cost for grid extension compensation; loss reserves for public loans and guarantees
66.2 38.3 0 104.5 9.9x
High-cost approach
Actual cost for grid extension compensation; face value for public loans and guarantees
66.2 0 153.2 219.5 5.2x
Low-cost approach
Actual cost for grid extension compensation; no cost for public loans and guarantees
66.2 0 0 66.2 14.1x
** Modelling exercise assumes no additional investment in distribution assets is made to accommodate the changes in load profiles. No derisking effects are modelled for the diesel generator system.
Source: Sensitivity modelling; see Table 5.10 and Annex A for details of assumptions and methodology.
Source: Sensitivity modelling; see Table 5.10 and Annex A for details of assumptions and methodology.

Derisking Renewable Energy Investment: Off-Grid Electrification78
Illustrative Solar Mini-Grid Case Studies
SOLAR PV-BATTERY TECHNOLOGY 2023 ElectrificationTarget (number of household connections) 2,500,000Average Capacity Factor (%) 18.0%Average System Size
Solar PV (kW) 13
Battery (kWh) 40
Total Annual Serviced Demand (kWh) 374,575,039
Total System Size to Reach 2023 Target (kW) 322,969
BASELINEBaseline energy mix Diesel generator 100%Average system size (kW) 6Disel Emission Factor (tCO2e/MWh) 0.889
GENERAL COUNTRY INPUTSEffective Corporate Tax Rate (%) 30%Public Cost of Capital (%) 4%
PRE-DERISKING POST DERISKING
FINANCING COSTS Light-Touch Comprehensive Blended/Total
Capital Structure Equity/Debt Split
100%/0%
100%/0%
70%/30%
Cost of Debt Concessional public loan Commercial loans with public guarantees Commercial loans without public guarantees
N/A N/A N/A
N/A N/A N/A
5.0% 8.0% 8.0%
Loan Tenor Concessional public loan Commercial loans with public guarantees Commercial loans without public guarantees
N/A N/A N/A
N/A N/A N/A
10 years 10 years 10 years
Cost of Equity 21.0% 19.5% 17.3%
Weighted Average Cost of Capital (WACC) (After-tax) N/A 19.5% 13.7%
INVESTMENT
Total Investment (USD million) $1,261,110,339 $126,111,034 $1,134,999,305 $1,261,110,339
Debt (USD million) Concessional public loan Commercial loans with public guarantees Commercial loans without public guarantees
N/A N/A N/A
$0 $0 $0
$85,124,948 $85,124,948
$170,249,896
$85,124,948 $85,124,948
$170,249,896
Equity (USD million) $1,261,110,339 $126,111,034 $794,499,514 $920,610,548
COST OF PUBLIC INSTRUMENTS
Policy Derisking Instruments (USD million, present value) Energy Market Risk Activities Social Acceptance Risk Activities Hardware Risk Activities Labour Risk Activities Developer Risk Activities End-user Credit Risk Activities Financing Risk Activities Total
N/A N/A N/A N/A N/A N/A N/A N/A
$7,600,000 $2,800,000 $1,100,000 $2,700,000 $1,400,000 $4,800,000 $2,900,000
$23,300,000
Financial Derisking Instruments (USD million, present value) Energy Market Risk Instruments Compensation Scheme for Grid Extension Developer Risk, End-user Credit Risk, and Financing Risk Instruments Public Loans* Public Guarantees for Commercial Loans* Currency/Macro Risk Instruments Political Risk Instruments Total
N/A
N/A N/A N/A N/A N/A
N/A
N/A N/A N/A N/A N/A
$66,225,187
$21,281,237 $17,024,990
N/A N/A
$104,531,413
$66,225,187
$21,281,237 $17,024,990
N/A N/A
$104,531,413
* Please note that public loans and public guarantees for commercial loans address multiple risk categories at the same time, including developer risk, end-user credit risk, and financing risk.
Table 5.10: Uttar Pradesh, India: Summary modelling assumptions for solar mini-grids
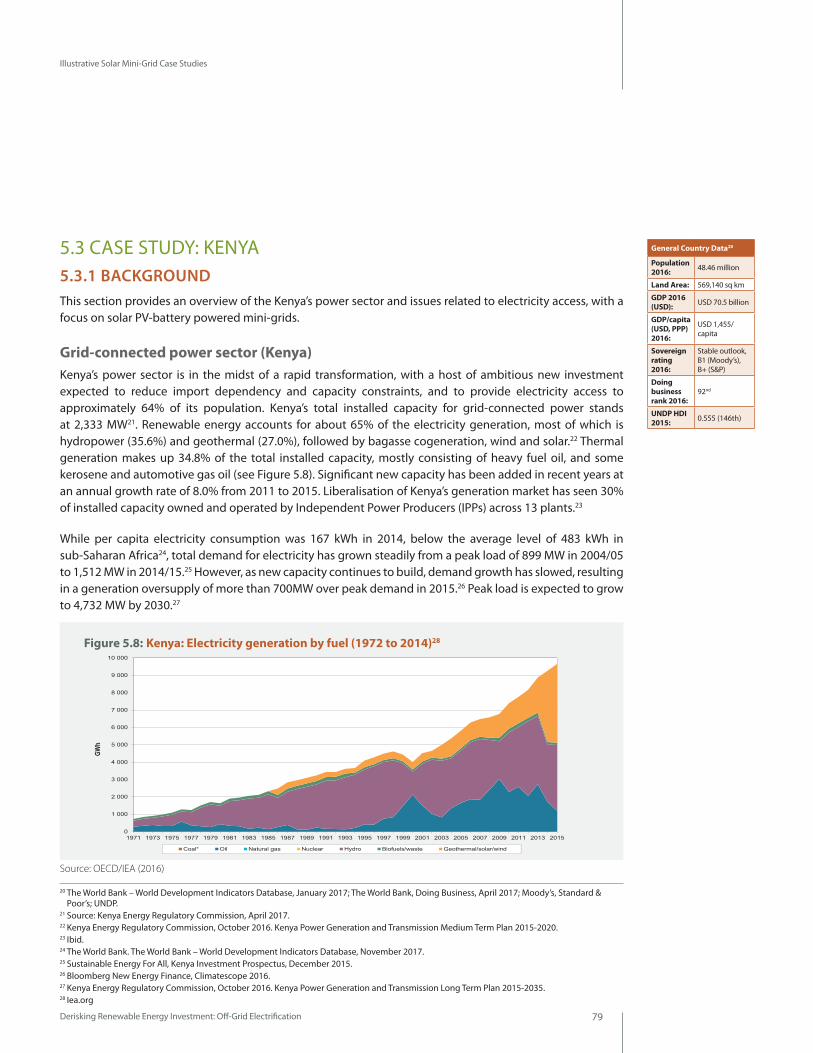
Derisking Renewable Energy Investment: Off-Grid Electrification 79
Illustrative Solar Mini-Grid Case Studies
5.3 CASE STUDY: KENYA 5.3.1 BACKGROUND This section provides an overview of the Kenya’s power sector and issues related to electricity access, with a focus on solar PV-battery powered mini-grids.
Grid-connected power sector (Kenya) Kenya’s power sector is in the midst of a rapid transformation, with a host of ambitious new investment expected to reduce import dependency and capacity constraints, and to provide electricity access to approximately 64% of its population. Kenya’s total installed capacity for grid-connected power stands at 2,333 MW21. Renewable energy accounts for about 65% of the electricity generation, most of which is hydropower (35.6%) and geothermal (27.0%), followed by bagasse cogeneration, wind and solar.22 Thermal generation makes up 34.8% of the total installed capacity, mostly consisting of heavy fuel oil, and some kerosene and automotive gas oil (see Figure 5.8). Significant new capacity has been added in recent years at an annual growth rate of 8.0% from 2011 to 2015. Liberalisation of Kenya’s generation market has seen 30% of installed capacity owned and operated by Independent Power Producers (IPPs) across 13 plants.23
While per capita electricity consumption was 167 kWh in 2014, below the average level of 483 kWh in sub-Saharan Africa24, total demand for electricity has grown steadily from a peak load of 899 MW in 2004/05 to 1,512 MW in 2014/15.25 However, as new capacity continues to build, demand growth has slowed, resulting in a generation oversupply of more than 700MW over peak demand in 2015.26 Peak load is expected to grow to 4,732 MW by 2030.27
20 The World Bank – World Development Indicators Database, January 2017; The World Bank, Doing Business, April 2017; Moody’s, Standard & Poor’s; UNDP.
21 Source: Kenya Energy Regulatory Commission, April 2017.22 Kenya Energy Regulatory Commission, October 2016. Kenya Power Generation and Transmission Medium Term Plan 2015-2020.23 Ibid. 24 The World Bank. The World Bank – World Development Indicators Database, November 2017.25 Sustainable Energy For All, Kenya Investment Prospectus, December 2015. 26 Bloomberg New Energy Finance, Climatescope 2016.27 Kenya Energy Regulatory Commission, October 2016. Kenya Power Generation and Transmission Long Term Plan 2015-2035.28 Iea.org
General Country Data20
Population 2016: 48.46 million
Land Area: 569,140 sq km
GDP 2016 (USD): USD 70.5 billion
GDP/capita (USD, PPP) 2016:
USD 1,455/capita
Sovereign rating 2016:
Stable outlook, B1 (Moody’s), B+ (S&P)
Doing business rank 2016:
92nd
UNDP HDI 2015: 0.555 (146th)
Figure 5.8: Kenya: Electricity generation by fuel (1972 to 2014)28
Source: OECD/IEA (2016)
0
1 000
2 000
3 000
4 000
5 000
6 000
7 000
8 000
9 000
10 000
1971 1973 1975 1977 1979 1981 1983 1985 1987 1989 1991 1993 1995 1997 1999 2001 2003 2005 2007 2009 2011 2013 2015
GWh
Coal* Oil Natural gas Nuclear Hydro Biofuels/waste Geothermal/solar/wind
Electricity generation by fuel
IEA Energy Statistics
Kenya
Statistics on the web: http://www.iea.org/statistics/
For more detailed data, please consult our on-line data service at http://data.iea.org.© OECD/IEA 2017* In this graph, peat and oil shale are aggregated with coal, when relevant.
Derisking Renewable Energy Investment: Off-Grid Electrification80
Illustrative Solar Mini-Grid Case Studies
Transmission and distribution capacity needs to be scaled up substantially to meet the growing needs of the power sector. As of 2015, Kenya had 4,149 km of transmission lines, all of which are 200 kV or 132 kV. Kenya Electricity Transmission Company (KETRACO) is in the process of constructing ~4,500 km new lines and introducing Kenya’s first high-voltage 400 kV and 500 kV DC lines as well as 3 major regional interconnectors to Ethiopia, Uganda, and Tanzania. KETRACO is also planning a further ~4,200 km of lines to expand and strengthen the grid.29 Current transmission and distribution losses are 18%, above the average level of 12% for sub-Saharan Africa.30
Kenya’s electricity tariffs are cost reflective: tariffs are based on a formula that, in addition to the basic rate of charge, reflects long-run marginal costs and features a monthly automatic pass-through of generation-related fuel costs and adjustments for exchange rate movements. The formula also takes into account adjustments for domestic inflation every six months. Residential electricity tariffs in Kenya are based on an increasing block tariff scheme. Non-residential consumers are charged different linear rates depending on their category (commercial, industrial, or government) independent of consumption levels. Thanks to tariff reform measures, the hidden costs of the power sector have decreased significantly in the 2000s, going from around 1.5% of GDP in 2001 to virtually zero by 2008, and there are no explicit subsidies or fiscal transfers to power utilities.31 Kenya does not have any fossil fuel subsidies.
Grid-connected renewable energy targets and investment (Kenya)The Government of Kenya (GoK) has ambitious plans to capitalise on its considerable renewable energy resources, most notably geothermal energy. Kenya has committed to reducing its GHG emissions by 30% relative to business as usual levels by 2030. Kenya is Africa’s largest producer of geothermal energy and continues to invest heavily in this subsector. Kenya’s LTP 2015-2035 anticipates geothermal energy to reach 1,524 MW installed capacity by 2030, largely through projects in the Olkaria and Menengai regions in the Great Rift Valley.32
Wind represents another high potential renewable segment, and the GoK anticipates wind energy to reach 720 MW installed capacity by 2030. Today, the only grid-connected wind power plant is the Ngong Wind Farm, and wind power comprises only a small portion of the total energy mix; the situation, however, will soon change with the connection of the 310 MW Lake Turkana Wind Power project to the main grid.
In addition to geothermal and wind energy, Kenya, as an equatorial country benefitting from over 3500 hours of sunlight annually in some regions, has high solar potential. Kenya’s annual irradiation averages exceeding 5 kWh/m2 per day, with the north of the country showing generally higher and more consistent values. The GoK anticipates solar PV to reach 151 MW installed capacity by 2030.
Energy access (Kenya)In 2014, access to the electricity grid was 36%, with 12.6% in rural areas and 68.4% in urban areas.33 92% of rural households rely on kerosene based lighting appliances (SolarAid, 2014). The national grid connectivity
29 KETRACO, 2014/15.30 The World Bank – World Development Indicators Database, November 201731 IMF, 2013. 32 Kenya Energy Regulatory Commission, October 2016. Kenya Power Generation and Transmission Long Term Plan 2015-2035. 33 Source: World Bank, Sustainable Energy for All (SEforAll) database from the SEforAll Global Tracking Framework led jointly by the World Bank,
International Energy Agency, and the Energy Sector Management Assistance Program.
Derisking Renewable Energy Investment: Off-Grid Electrification 81
Illustrative Solar Mini-Grid Case Studies
level has increased to 47% in 2015, and 55% in mid-2016.34 Kenya is one of the first two countries to have completed the Global Energy Access Survey, the first survey to apply the Multi-Tier Framework Methodology for measuring energy access. According to preliminary results from the 14 underserved counties surveyed, 57% of grid-connected households are in tier 0; over 50% of grid-connected urban households are in tier 3 or above, while only 17% for rural households.35
The GoK’s Last Mile Connectivity Program (LMCP), introduced in 2015, is a three-phase initiative aimed at increasing electricity access to Kenyans across the country. The first phase, launched in April 2016 and expected to take 18 months, connects all consumers within 600 meters of an existing transformer with a subsidised connection price. An additional 1.5 million Kenyans are targeted to have access to electricity through this phase. The second and third phases will include installation and extension of the low voltage network to reach an additional 500,000 customers. The goal is to achieve universal access by 2020.36 The GoK aims to expand electricity services to underserved areas through mini-grids and standalone systems where grid penetration remains limited, poverty levels are high, and social exclusion is prevalent.
34 Source: Kenya Energy Regulatory Commission, October 2016. Kenya Power Generation and Transmission Long Term Plan 2015-2035.35 Source: Barasa, M., "Multi-Tier Framework Survey Kenya: Preliminary Results for 14 Underserved Counties in Kenya", presentation at the Vienna
Energy Forum, 9 May 2017. 36 Source: Kenya Power, public information on Last Mile Connectivity Project (accessed November 2017).
Box 5.6: Solar Home Kits in Kenya
Kenya is unique in the world in terms of the depth and dynamism of its solar off-grid market. The market for standalone solar PV systems started to be developed in Kenya in the mid-1980s, but was catalysed in 2008 when Kenya was selected as one of the two pilot countries for Lighting Africa program. Since then, Kenyan private sector players have developed innovative business models over the past years, including developing efficient sales channels for portable lanterns and solar home systems (SHS); technological innovations such as pay-as-you-go systems; and innovative financing structures to fund their fast growing businesses. Some examples of companies selling solar home kits in Kenya are Azuri Technologies, Bboxx, Brighterlite Kenya Ltd, Go Solar Systems and M-kopa.
The off-grid solar PV market in Kenya has been growing exponentially: 2.7 million quality-certified lanterns and small solar kits have been sold since 2009, out of which 700,000 in fiscal year 2015. The share of quality products improved rapidly – more than 40% of the off-grid lighting market now consists of products that have met Lighting Global standards, up from just 3% in 2009. Investment transaction size has been increasing as the market matures. For example, in 2013, Azuri Technologies raised USD 1.7 million in funding from the Barclays Social Innovation Facility. In October 2017, M-KOPA Solar announced that it secured USD 80 million commercial debt funding from a syndicate which includes Stanbic Bank, CDC, FMO and Nordfund. In the same month, Lendable Inc, a company that bridges the gap between institutional debt investors and high growth alternative lenders in Africa, raised USD 6.5 million in series A funding.
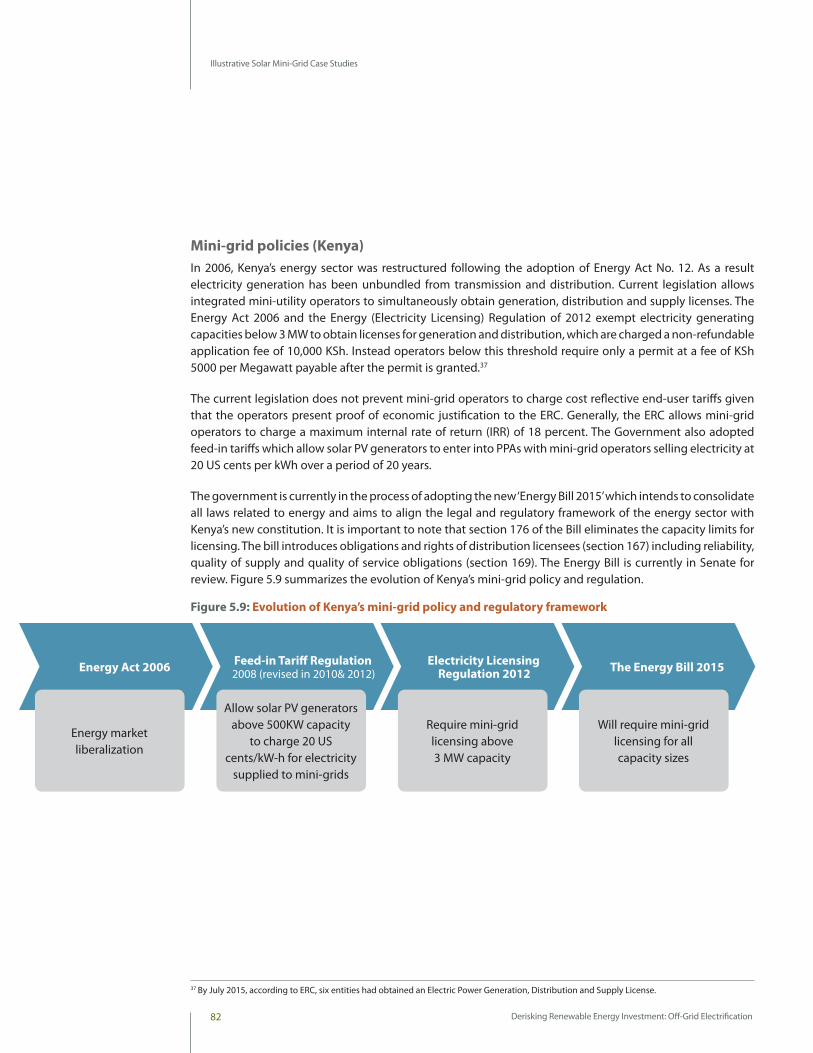
Derisking Renewable Energy Investment: Off-Grid Electrification82
Illustrative Solar Mini-Grid Case Studies
Mini-grid policies (Kenya)In 2006, Kenya’s energy sector was restructured following the adoption of Energy Act No. 12. As a result electricity generation has been unbundled from transmission and distribution. Current legislation allows integrated mini-utility operators to simultaneously obtain generation, distribution and supply licenses. The Energy Act 2006 and the Energy (Electricity Licensing) Regulation of 2012 exempt electricity generating capacities below 3 MW to obtain licenses for generation and distribution, which are charged a non-refundable application fee of 10,000 KSh. Instead operators below this threshold require only a permit at a fee of KSh 5000 per Megawatt payable after the permit is granted.37
The current legislation does not prevent mini-grid operators to charge cost reflective end-user tariffs given that the operators present proof of economic justification to the ERC. Generally, the ERC allows mini-grid operators to charge a maximum internal rate of return (IRR) of 18 percent. The Government also adopted feed-in tariffs which allow solar PV generators to enter into PPAs with mini-grid operators selling electricity at 20 US cents per kWh over a period of 20 years.
The government is currently in the process of adopting the new ‘Energy Bill 2015’ which intends to consolidate all laws related to energy and aims to align the legal and regulatory framework of the energy sector with Kenya’s new constitution. It is important to note that section 176 of the Bill eliminates the capacity limits for licensing. The bill introduces obligations and rights of distribution licensees (section 167) including reliability, quality of supply and quality of service obligations (section 169). The Energy Bill is currently in Senate for review. Figure 5.9 summarizes the evolution of Kenya’s mini-grid policy and regulation.
Figure 5.9: Evolution of Kenya’s mini-grid policy and regulatory framework
37 By July 2015, according to ERC, six entities had obtained an Electric Power Generation, Distribution and Supply License.
Energy Act 2006 Electricity Licensing Regulation 2012
Feed-in Tariff Regulation 2008 (revised in 2010& 2012) The Energy Bill 2015
Will require mini-grid licensing for all capacity sizes
Require mini-grid licensing above 3 MW capacity
Allow solar PV generators above 500KW capacity
to charge 20 US cents/kW-h for electricity
supplied to mini-grids
Energy market liberalization
Derisking Renewable Energy Investment: Off-Grid Electrification 83
Illustrative Solar Mini-Grid Case Studies
Mini-grid investment to date (Kenya)There are 19 government-developed mini‐grid stations in Kenya today, owned by Rural Electrification Authority (REA) and managed by KPLC. The total installed capacity for these mini‐grids is roughly 19 MW, almost all of which is diesel powered.39
There are also mini-grid IPPs and privately owned and operated mini-grids with estimated capacity of roughly 65MW and 500kW, respectively. The only three active for-profit and privately owned mini-grid developers in Kenya are Powerhive, Vulcan and PowerGen. They operate under a prepaid fee-for-service model. Although these private sector companies have been licensed to generate electricity, only Powerhive have received provisional distribution licenses besides KPLC.40 There are also a few additional rural mini-grids that are grant based and operated on a non-profit basis.
Box 5.7: International Support for Mini-Grids in Kenya38
Agence Française de Développement (AFD) in 2016 approved €33 million loan for the retrofitting of 23 KPLC mini‐grid sites to add renewable energy (solar and wind). AFD has also established €60 million lines of credit at local banks to provide capital support to renewable energy in Kenya. This financing is made available, but not exclusively earmarked for mini‐grids.
Department for International Development (DFID) in 2017 provided £30m funding for the Green Mini-Grid Facility which aims to support project preparation and leverage private investment in solar and wind mini-grids. The program is overseen by AFD and managed by a consortium consisting of IED, I-DEV and Practical Action. The first call for proposals took place in March 2017 and the facility looks to add 600,000 new connections by 2020.
GIZ (via German Development Cooperation) in 2013 launched the Promotion of Solar‐Hybrid Mini‐Grids project (€7.5 million) to test the viability of mini‐grids in Kenya through private sector leadership. GIZ is providing technical assistance on mini‐grid policy, implementing mechanisms (e.g. tariff structures, licensing), capacity building with focus on solar technicians, and support to pilot projects. GIZ (funded by DFID, hosted by Energising Development and implemented by GIZ) through the results‐based financing (RBF) intervention (€2.1 million) aims to provide incentives to project developers in Turkana County to create a market for mini‐grid electricity generation and trigger private sector investment. GIZ is cooperating with Barclays Bank of Kenya to provide incentives.
KfW (via German Development Cooperation) has committed €15 million for developing mini‐grids in Turkana and Marsabit County. The selection of private sector will be done through reversed bidding process (RE auction model).
USAID/Power Africa in 2017 provided funding to Powerhive under its Development Innovation Ventures program to develop mini-grids for productive use in 20 villages.
World Bank, under its ‘Off-grid Solar Access Project for Underserved Counties’ approved a $150 million loan to provide solar energy in underserved northeastern counties in July 2017. It will serve an estimated 1.3 million people in 277,000 households across 14 counties.
38 Ibid.39 The World Bank, March 2017. In addition, there are 23 proposed hybrid mini-grid sites (diesel, solar, wind) mapped in the Scaling-up Renewable
Energy Programme (SREP) that require about US$84 million in investment, see SEforAll Kenya Investment Prospectus. 40 Current Activities and Challenges to Scaling Up Mini-Grids in Kenya, May 2016.
Derisking Renewable Energy Investment: Off-Grid Electrification84
Illustrative Solar Mini-Grid Case Studies
2023 modelling target (Kenya)Given current electricity access levels today and taking into account population growth rates, by 2022 Kenya’s population that lacks access to the electricity grid is expected to grow to 36.9 million people. Based on these targets, the modelling exercise assumes a conservative estimate of 10 percent, or 3.520 million people that will be electrified through an estimated 8,000 solar mini-grids.
5.3.2. The Model’s Results
Risk Environment
InterviewsData for the modelling case study was gathered from 12 interviews held with domestic and international project developers and investors who are actively involved in the mini-grid sector in Kenya. An additional four information interviews were held during the same period with other stakeholders in Kenya.
16 Source: UPNEDA, Uttar Pradesh Mini Grid Policy 2016. 17 24x7 Power for All (Uttar Pradesh) document, 2017.
Box 5.8: Powerhive: A Mini-Grid Developer Case Study
Powerhive is a microgrid solution provider in emerging markets, with a proprietary technology platform that streamlines microgrid development and customer management. Customers purchase electricity on a pay-as-you-go basis using mobile money applications on their mobile phones.
●● 2011: the California-based Company was founded.
●● August 2012: the first pilot project of 1.5 kW was commissioned, catering to a small cluster of residential customers in the village of Mokomoni. Customers use the electricity for indoor and outdoor security lighting, mobile phone charging, and to power small appliances such as radios and televisions.
●● Summer 2013: The next three sites were built in the villages of Nyamondo, Matangamano, and Bara Nne, serving approximately 1,500 people. At 10, 20, and 50 kW, they are capable of supporting larger clusters of users, which include light commercial loads from customers such as welders, carpenters, and millers.
●● 2014: the Company began seeking concessions.
●● February 2015: the ERC granted Powerhive’s wholly-owned subsidiary in East Africa concessions to operate as Kenya’s first privately held utility company.
●● December 2015: the Company received $11M equity investment by Enel Green Power, which will help expand the Company's flagship project to 1 MW, bringing electricity to about 90,000 people in western Kenya.
●● January 2016: the Company closed a $20M Series A financing round. Prelude Ventures led the round, which also includes participation from Caterpillar Ventures, Total Energy Ventures, Tao Capital Partners, Pi Investments, and select other private investors.
●● November 2017: Powerhive was awarded a grant by USAID’s Development Innovation Ventures program and Power Africa.
As a direct result of the Kenyan concession, Powerhive is able to significantly scale its service, constructing 100 micro-grids that will serve 100,000 residential and small business customers.
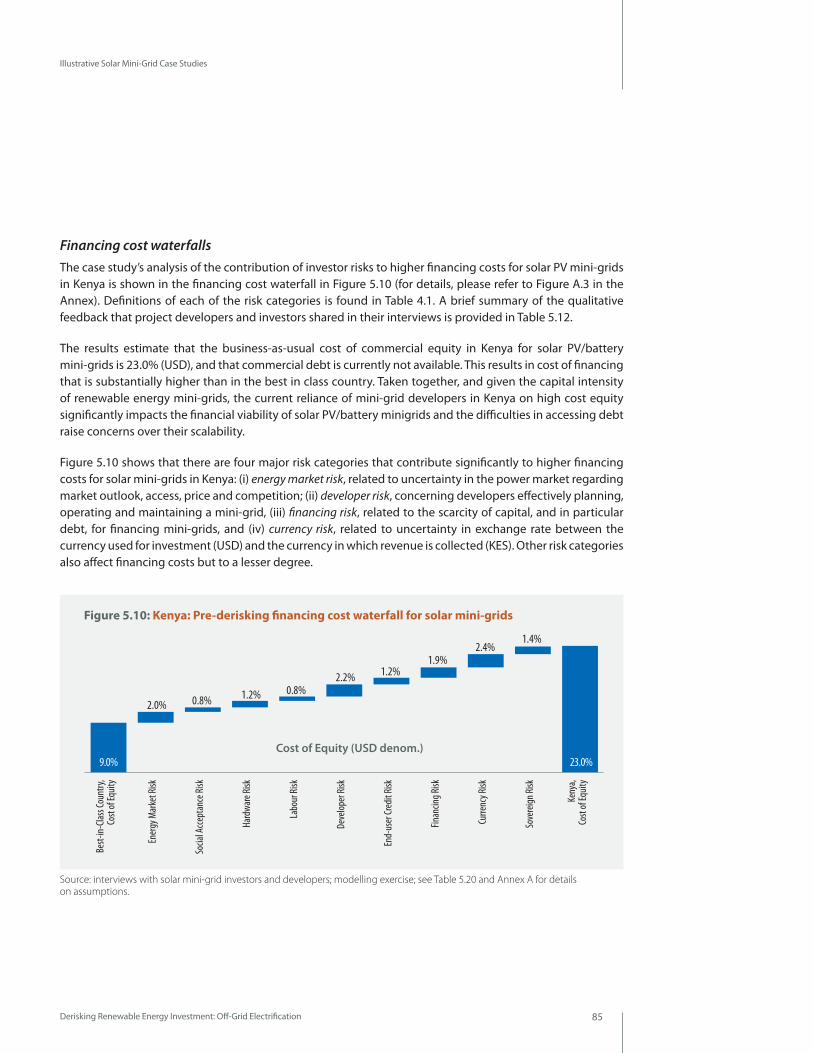
Derisking Renewable Energy Investment: Off-Grid Electrification 85
Illustrative Solar Mini-Grid Case Studies
Financing cost waterfallsThe case study’s analysis of the contribution of investor risks to higher financing costs for solar PV mini-grids in Kenya is shown in the financing cost waterfall in Figure 5.10 (for details, please refer to Figure A.3 in the Annex). Definitions of each of the risk categories is found in Table 4.1. A brief summary of the qualitative feedback that project developers and investors shared in their interviews is provided in Table 5.12.
The results estimate that the business-as-usual cost of commercial equity in Kenya for solar PV/battery mini-grids is 23.0% (USD), and that commercial debt is currently not available. This results in cost of financing that is substantially higher than in the best in class country. Taken together, and given the capital intensity of renewable energy mini-grids, the current reliance of mini-grid developers in Kenya on high cost equity significantly impacts the financial viability of solar PV/battery minigrids and the difficulties in accessing debt raise concerns over their scalability.
Figure 5.10 shows that there are four major risk categories that contribute significantly to higher financing costs for solar mini-grids in Kenya: (i) energy market risk, related to uncertainty in the power market regarding market outlook, access, price and competition; (ii) developer risk, concerning developers effectively planning, operating and maintaining a mini-grid, (iii) financing risk, related to the scarcity of capital, and in particular debt, for financing mini-grids, and (iv) currency risk, related to uncertainty in exchange rate between the currency used for investment (USD) and the currency in which revenue is collected (KES). Other risk categories also affect financing costs but to a lesser degree.
Cost of Equity (USD denom.)
Keny
a,Co
st of
Equit
y
Sove
reign
Risk
Curre
ncy R
isk
Finan
cing R
isk
End-
user
Cred
it Ri
sk
Deve
loper
Risk
Labo
ur Ri
sk
Hard
ware
Risk
Socia
l Acc
epta
nce R
isk
Ener
gy M
arke
t Risk
Best-
in-C
lass C
ount
ry,Co
st of
Equit
y
9.0% 23.0%
2.0%
1.4%
0.8% 1.2% 0.8% 2.2% 1.2%
1.9% 2.4%
Figure 5.10: Kenya: Pre-derisking financing cost waterfall for solar mini-grids
Source: interviews with solar mini-grid investors and developers; modelling exercise; see Table 5.20 and Annex A for details on assumptions.
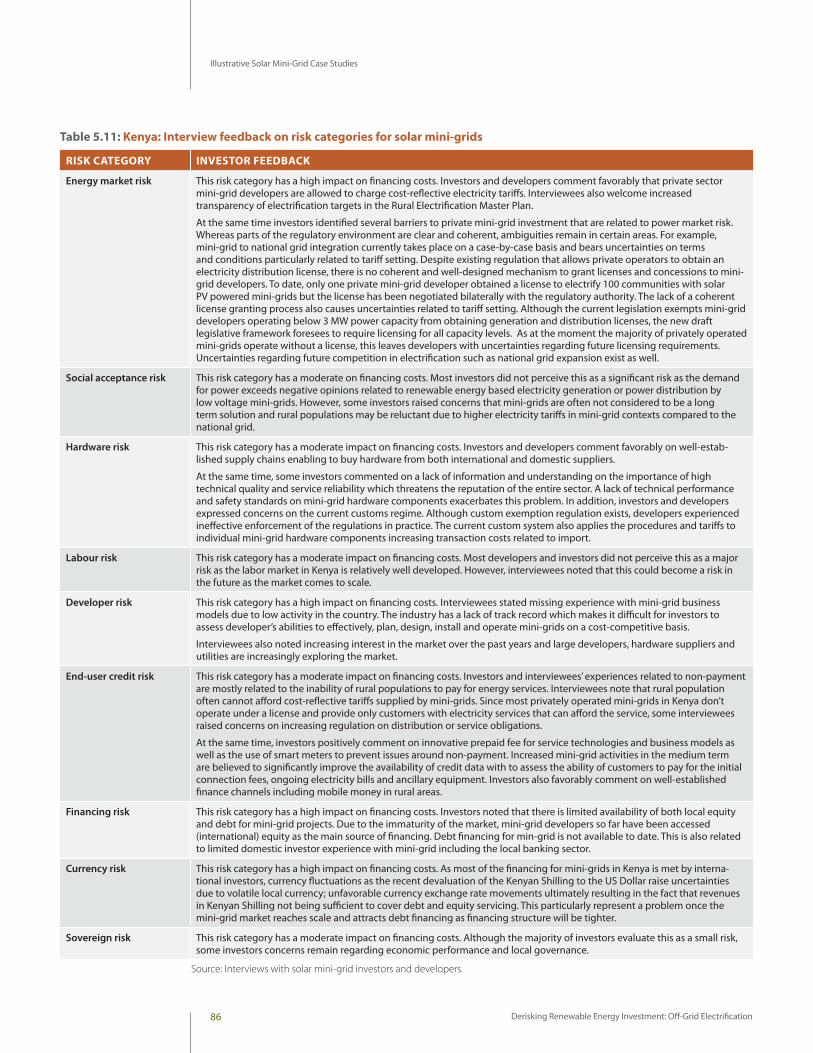
Derisking Renewable Energy Investment: Off-Grid Electrification86
Illustrative Solar Mini-Grid Case Studies
Table 5.11: Kenya: Interview feedback on risk categories for solar mini-grids
RISK CATEGORY INVESTOR FEEDBACK
Energy market risk This risk category has a high impact on financing costs. Investors and developers comment favorably that private sector mini-grid developers are allowed to charge cost-reflective electricity tariffs. Interviewees also welcome increased transparency of electrification targets in the Rural Electrification Master Plan.
At the same time investors identified several barriers to private mini-grid investment that are related to power market risk. Whereas parts of the regulatory environment are clear and coherent, ambiguities remain in certain areas. For example, mini-grid to national grid integration currently takes place on a case-by-case basis and bears uncertainties on terms and conditions particularly related to tariff setting. Despite existing regulation that allows private operators to obtain an electricity distribution license, there is no coherent and well-designed mechanism to grant licenses and concessions to mini-grid developers. To date, only one private mini-grid developer obtained a license to electrify 100 communities with solar PV powered mini-grids but the license has been negotiated bilaterally with the regulatory authority. The lack of a coherent license granting process also causes uncertainties related to tariff setting. Although the current legislation exempts mini-grid developers operating below 3 MW power capacity from obtaining generation and distribution licenses, the new draft legislative framework foresees to require licensing for all capacity levels. As at the moment the majority of privately operated mini-grids operate without a license, this leaves developers with uncertainties regarding future licensing requirements. Uncertainties regarding future competition in electrification such as national grid expansion exist as well.
Social acceptance risk This risk category has a moderate on financing costs. Most investors did not perceive this as a significant risk as the demand for power exceeds negative opinions related to renewable energy based electricity generation or power distribution by low voltage mini-grids. However, some investors raised concerns that mini-grids are often not considered to be a long term solution and rural populations may be reluctant due to higher electricity tariffs in mini-grid contexts compared to the national grid.
Hardware risk This risk category has a moderate impact on financing costs. Investors and developers comment favorably on well-estab-lished supply chains enabling to buy hardware from both international and domestic suppliers.
At the same time, some investors commented on a lack of information and understanding on the importance of high technical quality and service reliability which threatens the reputation of the entire sector. A lack of technical performance and safety standards on mini-grid hardware components exacerbates this problem. In addition, investors and developers expressed concerns on the current customs regime. Although custom exemption regulation exists, developers experienced ineffective enforcement of the regulations in practice. The current custom system also applies the procedures and tariffs to individual mini-grid hardware components increasing transaction costs related to import.
Labour risk This risk category has a moderate impact on financing costs. Most developers and investors did not perceive this as a major risk as the labor market in Kenya is relatively well developed. However, interviewees noted that this could become a risk in the future as the market comes to scale.
Developer risk This risk category has a high impact on financing costs. Interviewees stated missing experience with mini-grid business models due to low activity in the country. The industry has a lack of track record which makes it difficult for investors to assess developer’s abilities to effectively, plan, design, install and operate mini-grids on a cost-competitive basis.
Interviewees also noted increasing interest in the market over the past years and large developers, hardware suppliers and utilities are increasingly exploring the market.
End-user credit risk This risk category has a moderate impact on financing costs. Investors and interviewees’ experiences related to non-payment are mostly related to the inability of rural populations to pay for energy services. Interviewees note that rural population often cannot afford cost-reflective tariffs supplied by mini-grids. Since most privately operated mini-grids in Kenya don’t operate under a license and provide only customers with electricity services that can afford the service, some interviewees raised concerns on increasing regulation on distribution or service obligations.
At the same time, investors positively comment on innovative prepaid fee for service technologies and business models as well as the use of smart meters to prevent issues around non-payment. Increased mini-grid activities in the medium term are believed to significantly improve the availability of credit data with to assess the ability of customers to pay for the initial connection fees, ongoing electricity bills and ancillary equipment. Investors also favorably comment on well-established finance channels including mobile money in rural areas.
Financing risk This risk category has a high impact on financing costs. Investors noted that there is limited availability of both local equity and debt for mini-grid projects. Due to the immaturity of the market, mini-grid developers so far have been accessed (international) equity as the main source of financing. Debt financing for min-grid is not available to date. This is also related to limited domestic investor experience with mini-grid including the local banking sector.
Currency risk This risk category has a high impact on financing costs. As most of the financing for mini-grids in Kenya is met by interna-tional investors, currency fluctuations as the recent devaluation of the Kenyan Shilling to the US Dollar raise uncertainties due to volatile local currency; unfavorable currency exchange rate movements ultimately resulting in the fact that revenues in Kenyan Shilling not being sufficient to cover debt and equity servicing. This particularly represent a problem once the mini-grid market reaches scale and attracts debt financing as financing structure will be tighter.
Sovereign risk This risk category has a moderate impact on financing costs. Although the majority of investors evaluate this as a small risk, some investors concerns remain regarding economic performance and local governance.
Source: Interviews with solar mini-grid investors and developers.
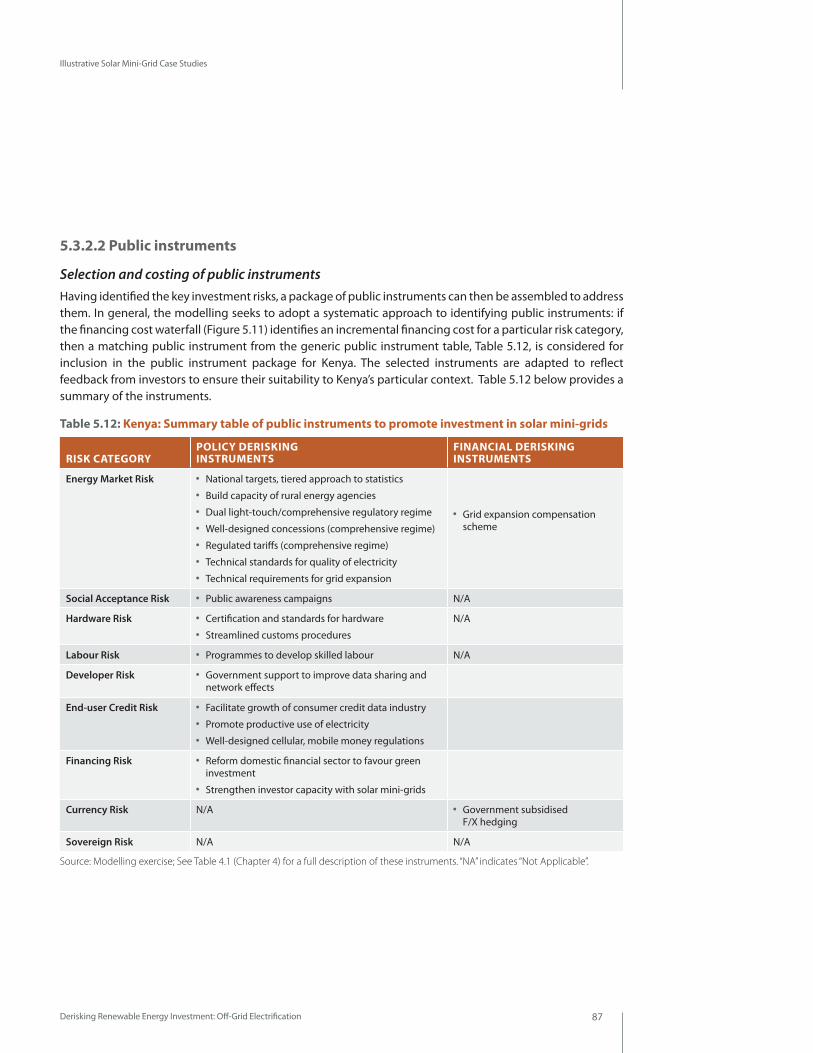
Derisking Renewable Energy Investment: Off-Grid Electrification 87
Illustrative Solar Mini-Grid Case Studies
5.3.2.2 Public instruments
Selection and costing of public instrumentsHaving identified the key investment risks, a package of public instruments can then be assembled to address them. In general, the modelling seeks to adopt a systematic approach to identifying public instruments: if the financing cost waterfall (Figure 5.11) identifies an incremental financing cost for a particular risk category, then a matching public instrument from the generic public instrument table, Table 5.12, is considered for inclusion in the public instrument package for Kenya. The selected instruments are adapted to reflect feedback from investors to ensure their suitability to Kenya’s particular context. Table 5.12 below provides a summary of the instruments.
Table 5.12: Kenya: Summary table of public instruments to promote investment in solar mini-grids
RISK CATEGORYPOLICY DERISKING INSTRUMENTS
FINANCIAL DERISKING INSTRUMENTS
Energy Market Risk ●● National targets, tiered approach to statistics●● Build capacity of rural energy agencies●● Dual light-touch/comprehensive regulatory regime ●● Well-designed concessions (comprehensive regime)●● Regulated tariffs (comprehensive regime)●● Technical standards for quality of electricity ●● Technical requirements for grid expansion
●● Grid expansion compensation scheme
Social Acceptance Risk ●● Public awareness campaigns N/A
Hardware Risk ●● Certification and standards for hardware●● Streamlined customs procedures
N/A
Labour Risk ●● Programmes to develop skilled labour N/A
Developer Risk ●● Government support to improve data sharing and network effects
End-user Credit Risk ●● Facilitate growth of consumer credit data industry ●● Promote productive use of electricity ●● Well-designed cellular, mobile money regulations
Financing Risk ●● Reform domestic financial sector to favour green investment
●● Strengthen investor capacity with solar mini-grids
Currency Risk N/A ●● Government subsidised F/X hedging
Sovereign Risk N/A N/A
Source: Modelling exercise; See Table 4.1 (Chapter 4) for a full description of these instruments. “NA” indicates “Not Applicable”.
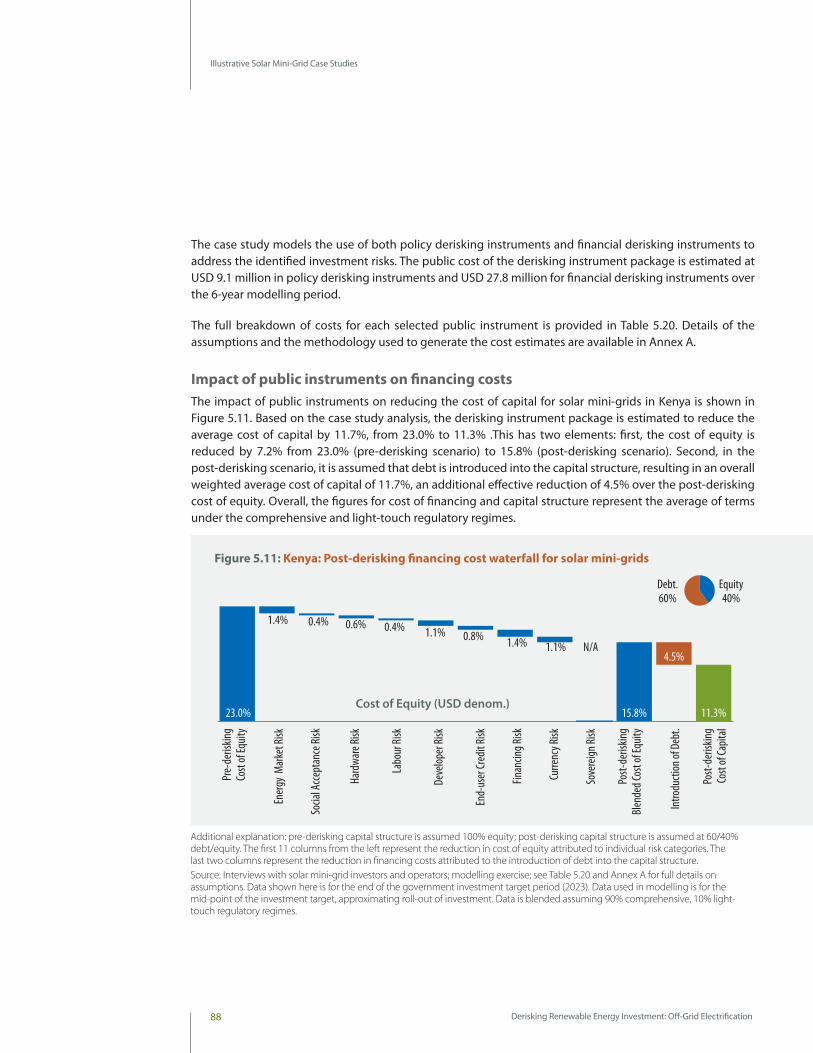
Derisking Renewable Energy Investment: Off-Grid Electrification88
Illustrative Solar Mini-Grid Case Studies
The case study models the use of both policy derisking instruments and financial derisking instruments to address the identified investment risks. The public cost of the derisking instrument package is estimated at USD 9.1 million in policy derisking instruments and USD 27.8 million for financial derisking instruments over the 6-year modelling period.
The full breakdown of costs for each selected public instrument is provided in Table 5.20. Details of the assumptions and the methodology used to generate the cost estimates are available in Annex A.
Impact of public instruments on financing costs The impact of public instruments on reducing the cost of capital for solar mini-grids in Kenya is shown in Figure 5.11. Based on the case study analysis, the derisking instrument package is estimated to reduce the average cost of capital by 11.7%, from 23.0% to 11.3% .This has two elements: first, the cost of equity is reduced by 7.2% from 23.0% (pre-derisking scenario) to 15.8% (post-derisking scenario). Second, in the post-derisking scenario, it is assumed that debt is introduced into the capital structure, resulting in an overall weighted average cost of capital of 11.7%, an additional effective reduction of 4.5% over the post-derisking cost of equity. Overall, the figures for cost of financing and capital structure represent the average of terms under the comprehensive and light-touch regulatory regimes.
Equity40%
Debt.60%
Cost of Equity (USD denom.)
Post-
deris
king
Blen
ded C
ost o
f Equ
ity
Intro
ducti
on of
Deb
t.
Post-
deris
king
Cost
of Ca
pital
Sove
reign
Risk
Curre
ncy R
isk
Finan
cing R
isk
End-
user
Cred
it Ri
sk
Deve
loper
Risk
Labo
ur Ri
sk
Hard
ware
Risk
Socia
l Acc
epta
nce R
isk
Ener
gy M
arke
t Risk
Pre-
deris
king
Cost
of Eq
uity
23.0% 11.3%
4.5%
15.8%
1.4%
N/A
0.4% 0.6% 0.4% 1.1% 0.8% 1.4% 1.1%
Figure 5.11: Kenya: Post-derisking financing cost waterfall for solar mini-grids
Additional explanation: pre-derisking capital structure is assumed 100% equity; post-derisking capital structure is assumed at 60/40% debt/equity. The first 11 columns from the left represent the reduction in cost of equity attributed to individual risk categories. The last two columns represent the reduction in financing costs attributed to the introduction of debt into the capital structure. Source: Interviews with solar mini-grid investors and operators; modelling exercise; see Table 5.20 and Annex A for full details on assumptions. Data shown here is for the end of the government investment target period (2023). Data used in modelling is for the mid-point of the investment target, approximating roll-out of investment. Data is blended assuming 90% comprehensive, 10% light-touch regulatory regimes.
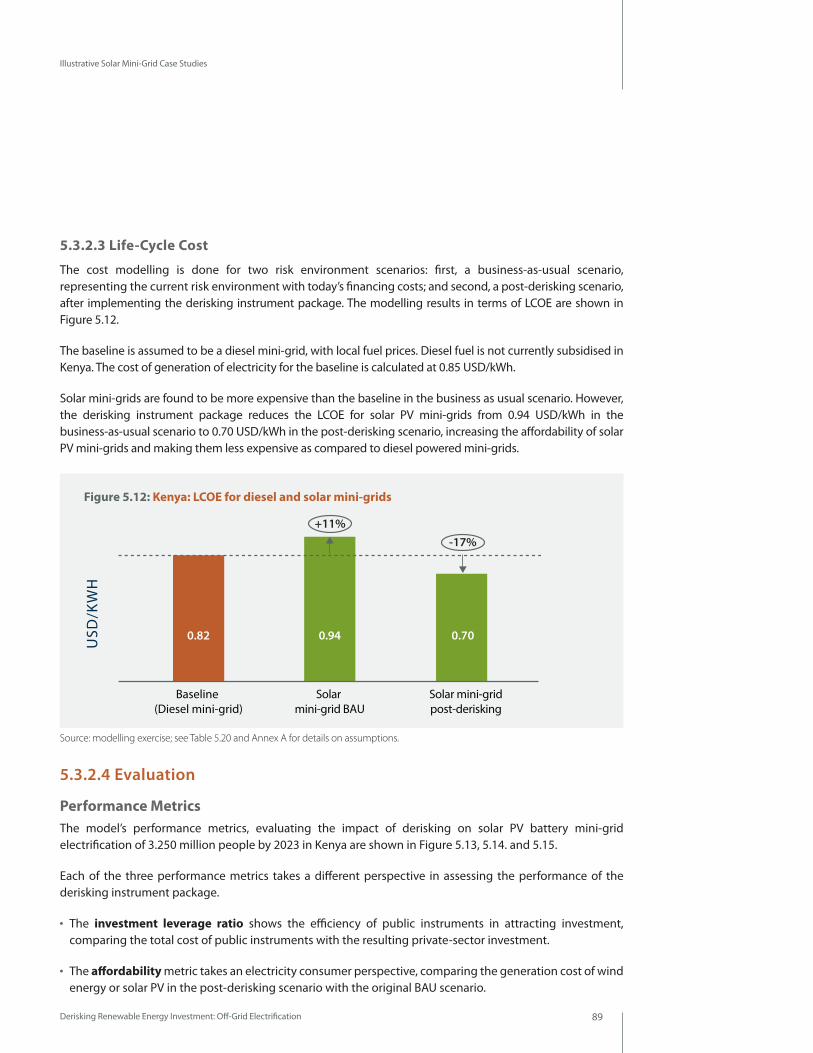
Derisking Renewable Energy Investment: Off-Grid Electrification 89
Illustrative Solar Mini-Grid Case Studies
5.3.2.3 Life-Cycle Cost
The cost modelling is done for two risk environment scenarios: first, a business-as-usual scenario, representing the current risk environment with today’s financing costs; and second, a post-derisking scenario, after implementing the derisking instrument package. The modelling results in terms of LCOE are shown in Figure 5.12.
The baseline is assumed to be a diesel mini-grid, with local fuel prices. Diesel fuel is not currently subsidised in Kenya. The cost of generation of electricity for the baseline is calculated at 0.85 USD/kWh.
Solar mini-grids are found to be more expensive than the baseline in the business as usual scenario. However, the derisking instrument package reduces the LCOE for solar PV mini-grids from 0.94 USD/kWh in the business-as-usual scenario to 0.70 USD/kWh in the post-derisking scenario, increasing the affordability of solar PV mini-grids and making them less expensive as compared to diesel powered mini-grids.
5.3.2.4 Evaluation
Performance MetricsThe model’s performance metrics, evaluating the impact of derisking on solar PV battery mini-grid electrification of 3.250 million people by 2023 in Kenya are shown in Figure 5.13, 5.14. and 5.15.
Each of the three performance metrics takes a different perspective in assessing the performance of the derisking instrument package.
●● The investment leverage ratio shows the efficiency of public instruments in attracting investment, comparing the total cost of public instruments with the resulting private-sector investment.
●● The affordability metric takes an electricity consumer perspective, comparing the generation cost of wind energy or solar PV in the post-derisking scenario with the original BAU scenario.
Solar mini-gridpost-derisking
Solar mini-grid BAU
Baseline (Diesel mini-grid)
0.700.940.82USD
/KW
H
+11%-17%
Figure 5.12: Kenya: LCOE for diesel and solar mini-grids
Source: modelling exercise; see Table 5.20 and Annex A for details on assumptions.
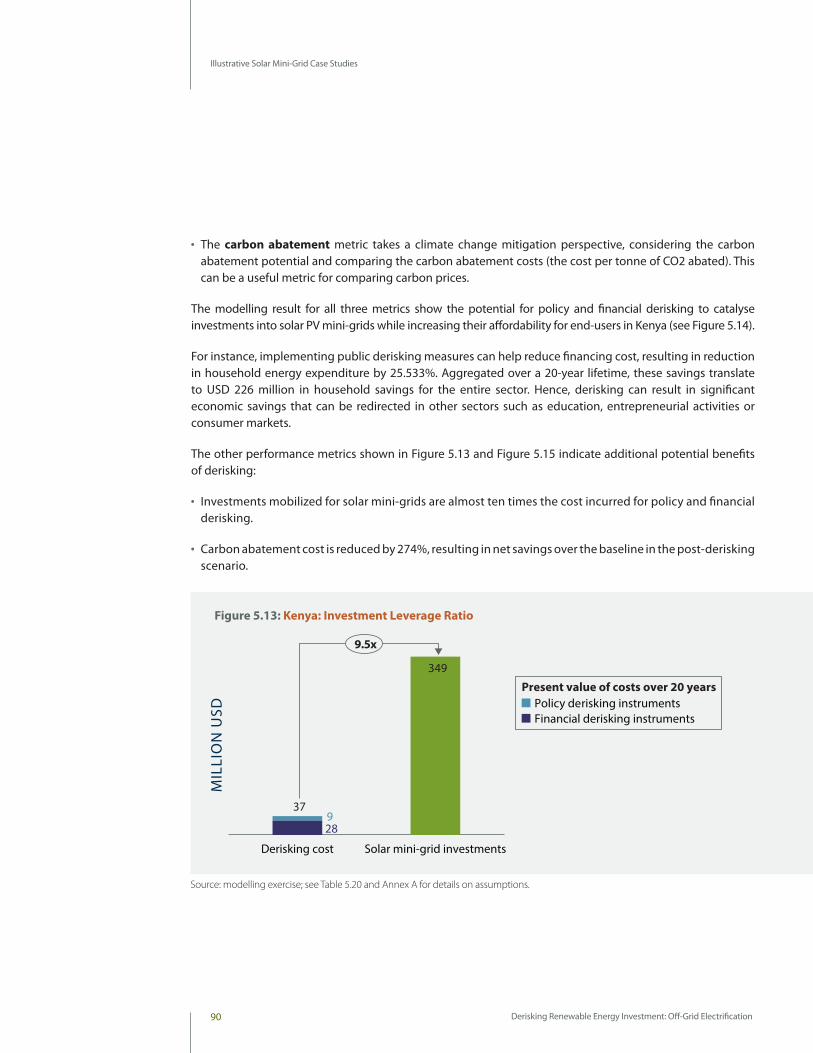
Derisking Renewable Energy Investment: Off-Grid Electrification90
Illustrative Solar Mini-Grid Case Studies
●● The carbon abatement metric takes a climate change mitigation perspective, considering the carbon abatement potential and comparing the carbon abatement costs (the cost per tonne of CO2 abated). This can be a useful metric for comparing carbon prices.
The modelling result for all three metrics show the potential for policy and financial derisking to catalyse investments into solar PV mini-grids while increasing their affordability for end-users in Kenya (see Figure 5.14).
For instance, implementing public derisking measures can help reduce financing cost, resulting in reduction in household energy expenditure by 25.533%. Aggregated over a 20-year lifetime, these savings translate to USD 226 million in household savings for the entire sector. Hence, derisking can result in significant economic savings that can be redirected in other sectors such as education, entrepreneurial activities or consumer markets.
The other performance metrics shown in Figure 5.13 and Figure 5.15 indicate additional potential benefits of derisking:
●● Investments mobilized for solar mini-grids are almost ten times the cost incurred for policy and financial derisking.
●● Carbon abatement cost is reduced by 274%, resulting in net savings over the baseline in the post-derisking scenario.
Solar mini-grid investmentsDerisking cost
9.5x
MIL
LIO
N U
SD
349
37
289
Policy derisking instruments Present value of costs over 20 years
Financial derisking instruments
Figure 5.13: Kenya: Investment Leverage Ratio
Source: modelling exercise; see Table 5.20 and Annex A for details on assumptions.
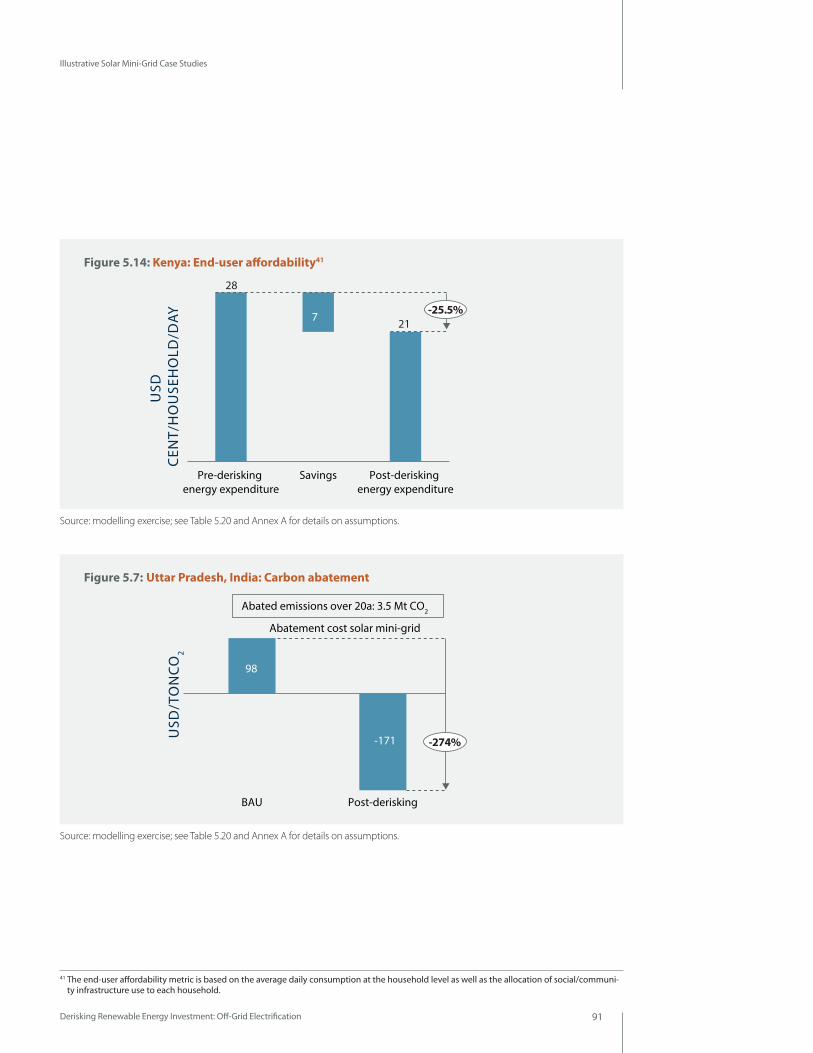
Derisking Renewable Energy Investment: Off-Grid Electrification 91
Illustrative Solar Mini-Grid Case Studies
Post-derisking energy expenditure
SavingsPre-derisking energy expenditure
USD
C
ENT/
HO
USE
HO
LD/D
AY 21
28
7-25.5%
Post-deriskingBAU
USD
/TO
NC
O2
-171
98
-274%
Abated emissions over 20a: 3.5 Mt CO2
Abatement cost solar mini-grid
Figure 5.14: Kenya: End-user affordability41
Figure 5.7: Uttar Pradesh, India: Carbon abatement
Source: modelling exercise; see Table 5.20 and Annex A for details on assumptions.
Source: modelling exercise; see Table 5.20 and Annex A for details on assumptions.
41 The end-user affordability metric is based on the average daily consumption at the household level as well as the allocation of social/communi-ty infrastructure use to each household.
Derisking Renewable Energy Investment: Off-Grid Electrification92
Illustrative Solar Mini-Grid Case Studies
Sensitivities An initial set of sensitivity analyses has been performed for the solar PV-battery mini-grids. The objective of the sensitivity analyses is to gain a better understanding of the robustness of the outputs and to be able to test different scenarios.
Six types of sensitivity analysis have been performed:
1. Key input assumptions
2. Investment target
3. Regulatory track
4. Capital subsidies
5. Load profiles
6. Approach to costing financial derisking instruments
As in Uttar Pradesh, the analysis is robust to these variations. Derisking solar mini-grids remains a cost-effective policy options in order enable scaling up private investment in off-grid electrification.
1. Sensitivity analysis on key input assumptions A sensitivity analysis has been performed for the following input assumptions: (i) investment costs, (ii) fuel costs for the diesel mini-grid, (iii) financing cost, and (iv) capital structure. The sensitivity analyses illustrate the degree to which each input parameter affects the outputs. In each case, all other assumptions have been constant.
Table 5.13 compares the LCOE of the baseline (diesel mini-grid) with the LCOE of a solar mini-grid in the pre-derisking situation, in a post-derisking situation exclusively under the light-touch regime and exclusively under the comprehensive regime. It then also shows the blended numbers, assuming that 90% of solar mini-grids operate under the comprehensive and 10% under the light-touch regime. As Table 5.13 on page 93 illustrates, the solar mini-grid LCOE is very sensitive to changes in investment costs: The base case modelling takes into consideration learning effects and cost reductions in hardware costs, given that investment targets are met over a 6 year period. However, if we were to model the full investment target, assuming today’s hardware costs, the post-derisking blended LCOE would be 0.84 USD versus 0.70 USD/kWh, a 20% increase.
Another important input parameter is the capital structure, and the percentage of investment costs that is debt-financed versus equity-financed. Moving the capital structure from 30% Debt/70% Equity to 40% Debt/60% Equity has a meaningful impact on the solar mini-grid LCOE, showing a reduction of 3% from 0.70 USD/kWh to 0.68 USD/kWh.
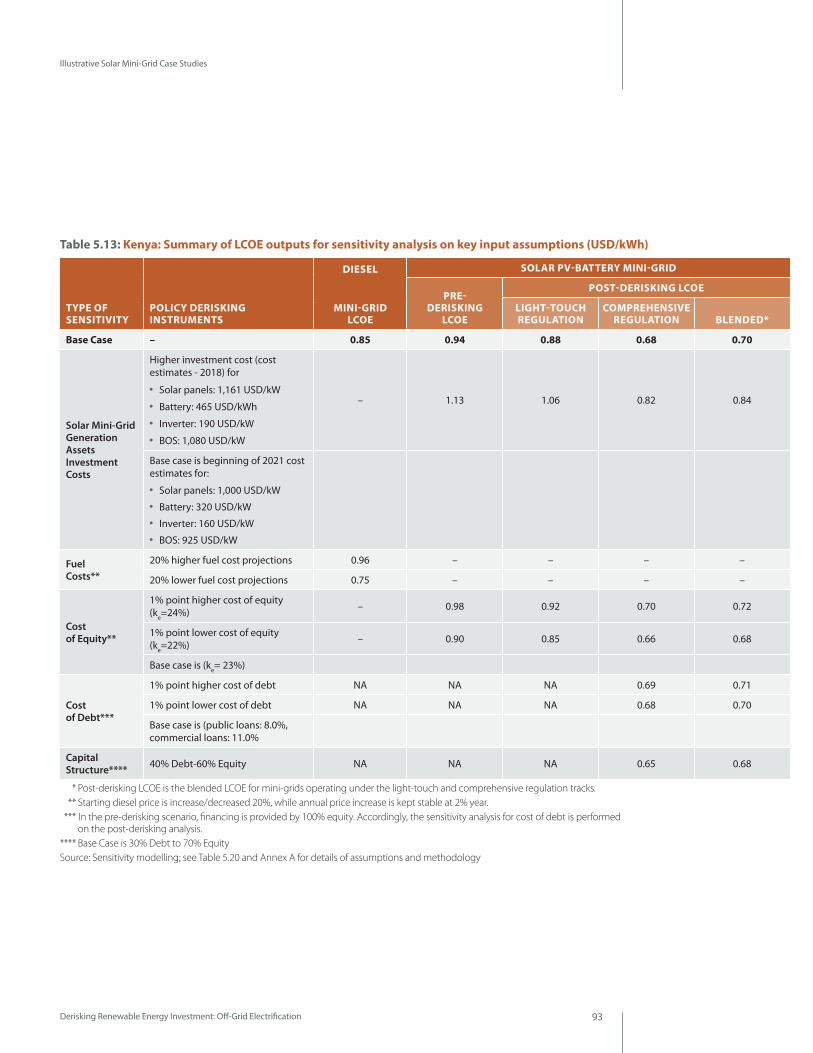
Derisking Renewable Energy Investment: Off-Grid Electrification 93
Illustrative Solar Mini-Grid Case Studies
TYPE OF SENSITIVITY
POLICY DERISKING INSTRUMENTS
DIESEL
MINI-GRID LCOE
SOLAR PV-BATTERY MINI-GRID
PRE- DERISKING
LCOE
POST-DERISKING LCOE
LIGHT-TOUCH REGULATION
COMPREHENSIVE REGULATION BLENDED*
Base Case – 0.85 0.94 0.88 0.68 0.70
Solar Mini-Grid Generation Assets Investment Costs
Higher investment cost (cost estimates - 2018) for
●● Solar panels: 1,161 USD/kW●● Battery: 465 USD/kWh ●● Inverter: 190 USD/kW●● BOS: 1,080 USD/kW
– 1.13 1.06 0.82 0.84
Base case is beginning of 2021 cost estimates for:
●● Solar panels: 1,000 USD/kW●● Battery: 320 USD/kW●● Inverter: 160 USD/kW●● BOS: 925 USD/kW
Fuel Costs**
20% higher fuel cost projections 0.96 – – – –
20% lower fuel cost projections 0.75 – – – –
Cost of Equity**
1% point higher cost of equity (ke=24%) – 0.98 0.92 0.70 0.72
1% point lower cost of equity (ke=22%) – 0.90 0.85 0.66 0.68
Base case is (ke= 23%)
Cost of Debt***
1% point higher cost of debt NA NA NA 0.69 0.71
1% point lower cost of debt NA NA NA 0.68 0.70
Base case is (public loans: 8.0%, commercial loans: 11.0%
Capital Structure**** 40% Debt-60% Equity NA NA NA 0.65 0.68
Table 5.13: Kenya: Summary of LCOE outputs for sensitivity analysis on key input assumptions (USD/kWh)
**** Post-derisking LCOE is the blended LCOE for mini-grids operating under the light-touch and comprehensive regulation tracks.**** Starting diesel price is increase/decreased 20%, while annual price increase is kept stable at 2% year. **** In the pre-derisking scenario, financing is provided by 100% equity. Accordingly, the sensitivity analysis for cost of debt is performed
on the post-derisking analysis. **** Base Case is 30% Debt to 70% EquitySource: Sensitivity modelling; see Table 5.20 and Annex A for details of assumptions and methodology
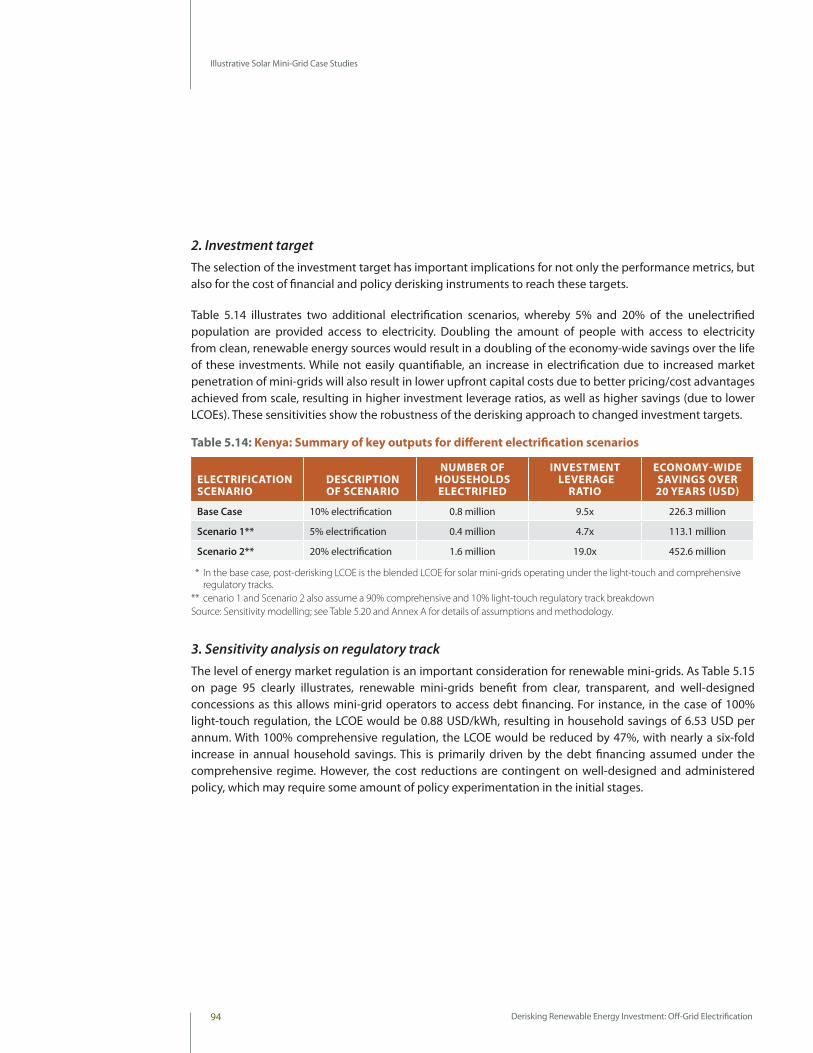
Derisking Renewable Energy Investment: Off-Grid Electrification94
Illustrative Solar Mini-Grid Case Studies
2. Investment targetThe selection of the investment target has important implications for not only the performance metrics, but also for the cost of financial and policy derisking instruments to reach these targets.
Table 5.14 illustrates two additional electrification scenarios, whereby 5% and 20% of the unelectrified population are provided access to electricity. Doubling the amount of people with access to electricity from clean, renewable energy sources would result in a doubling of the economy-wide savings over the life of these investments. While not easily quantifiable, an increase in electrification due to increased market penetration of mini-grids will also result in lower upfront capital costs due to better pricing/cost advantages achieved from scale, resulting in higher investment leverage ratios, as well as higher savings (due to lower LCOEs). These sensitivities show the robustness of the derisking approach to changed investment targets.
Table 5.14: Kenya: Summary of key outputs for different electrification scenarios
3. Sensitivity analysis on regulatory trackThe level of energy market regulation is an important consideration for renewable mini-grids. As Table 5.15 on page 95 clearly illustrates, renewable mini-grids benefit from clear, transparent, and well-designed concessions as this allows mini-grid operators to access debt financing. For instance, in the case of 100% light-touch regulation, the LCOE would be 0.88 USD/kWh, resulting in household savings of 6.53 USD per annum. With 100% comprehensive regulation, the LCOE would be reduced by 47%, with nearly a six-fold increase in annual household savings. This is primarily driven by the debt financing assumed under the comprehensive regime. However, the cost reductions are contingent on well-designed and administered policy, which may require some amount of policy experimentation in the initial stages.
ELECTRIFICATION SCENARIO
DESCRIPTION OF SCENARIO
NUMBER OF HOUSEHOLDS ELECTRIFIED
INVESTMENT LEVERAGE
RATIO
ECONOMY-WIDE SAVINGS OVER 20 YEARS (USD)
Base Case 10% electrification 0.8 million 9.5x 226.3 million
Scenario 1** 5% electrification 0.4 million 4.7x 113.1 million
Scenario 2** 20% electrification 1.6 million 19.0x 452.6 million
** In the base case, post-derisking LCOE is the blended LCOE for solar mini-grids operating under the light-touch and comprehensive regulatory tracks.
** cenario 1 and Scenario 2 also assume a 90% comprehensive and 10% light-touch regulatory track breakdownSource: Sensitivity modelling; see Table 5.20 and Annex A for details of assumptions and methodology.
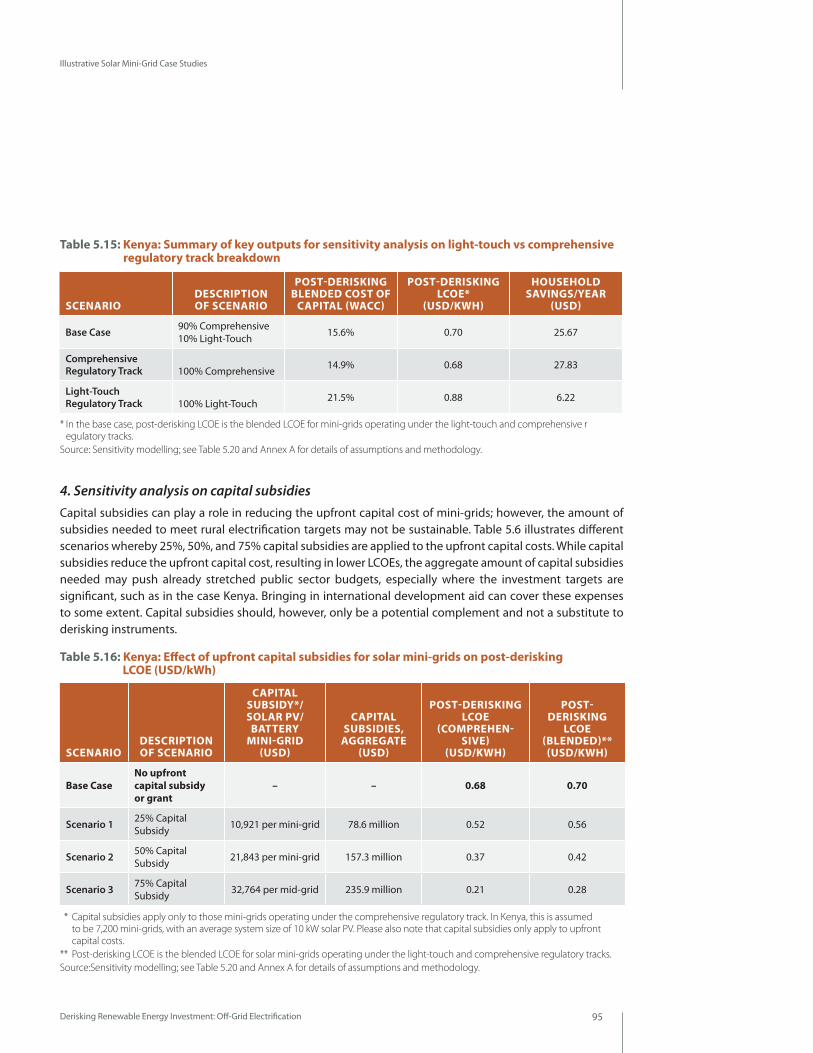
Derisking Renewable Energy Investment: Off-Grid Electrification 95
Illustrative Solar Mini-Grid Case Studies
4. Sensitivity analysis on capital subsidiesCapital subsidies can play a role in reducing the upfront capital cost of mini-grids; however, the amount of subsidies needed to meet rural electrification targets may not be sustainable. Table 5.6 illustrates different scenarios whereby 25%, 50%, and 75% capital subsidies are applied to the upfront capital costs. While capital subsidies reduce the upfront capital cost, resulting in lower LCOEs, the aggregate amount of capital subsidies needed may push already stretched public sector budgets, especially where the investment targets are significant, such as in the case Kenya. Bringing in international development aid can cover these expenses to some extent. Capital subsidies should, however, only be a potential complement and not a substitute to derisking instruments.
Table 5.16: Kenya: Effect of upfront capital subsidies for solar mini-grids on post-derisking LCOE (USD/kWh)
SCENARIODESCRIPTION OF SCENARIO
CAPITAL SUBSIDY*/ SOLAR PV/ BATTERY
MINI-GRID (USD)
CAPITAL SUBSIDIES,
AGGREGATE (USD)
POST-DERISKING LCOE
(COMPREHEN-SIVE)
(USD/KWH)
POST- DERISKING
LCOE (BLENDED)** (USD/KWH)
Base CaseNo upfront capital subsidy or grant
– – 0.68 0.70
Scenario 1 25% Capital Subsidy 10,921 per mini-grid 78.6 million 0.52 0.56
Scenario 2 50% Capital Subsidy 21,843 per mini-grid 157.3 million 0.37 0.42
Scenario 3 75% Capital Subsidy 32,764 per mid-grid 235.9 million 0.21 0.28
SCENARIODESCRIPTION OF SCENARIO
POST-DERISKING BLENDED COST OF
CAPITAL (WACC)
POST-DERISKING LCOE*
(USD/KWH)
HOUSEHOLD SAVINGS/YEAR
(USD)
Base Case 90% Comprehensive 10% Light-Touch 15.6% 0.70 25.67
Comprehensive Regulatory Track
100% Comprehensive 14.9% 0.68 27.83
Light-Touch Regulatory Track
100% Light-Touch 21.5% 0.88 6.22
* In the base case, post-derisking LCOE is the blended LCOE for mini-grids operating under the light-touch and comprehensive r egulatory tracks.
Source: Sensitivity modelling; see Table 5.20 and Annex A for details of assumptions and methodology.
** Capital subsidies apply only to those mini-grids operating under the comprehensive regulatory track. In Kenya, this is assumed to be 7,200 mini-grids, with an average system size of 10 kW solar PV. Please also note that capital subsidies only apply to upfront capital costs.
** Post-derisking LCOE is the blended LCOE for solar mini-grids operating under the light-touch and comprehensive regulatory tracks. Source:Sensitivity modelling; see Table 5.20 and Annex A for details of assumptions and methodology.
Table 5.15: Kenya: Summary of key outputs for sensitivity analysis on light-touch vs comprehensive regulatory track breakdown
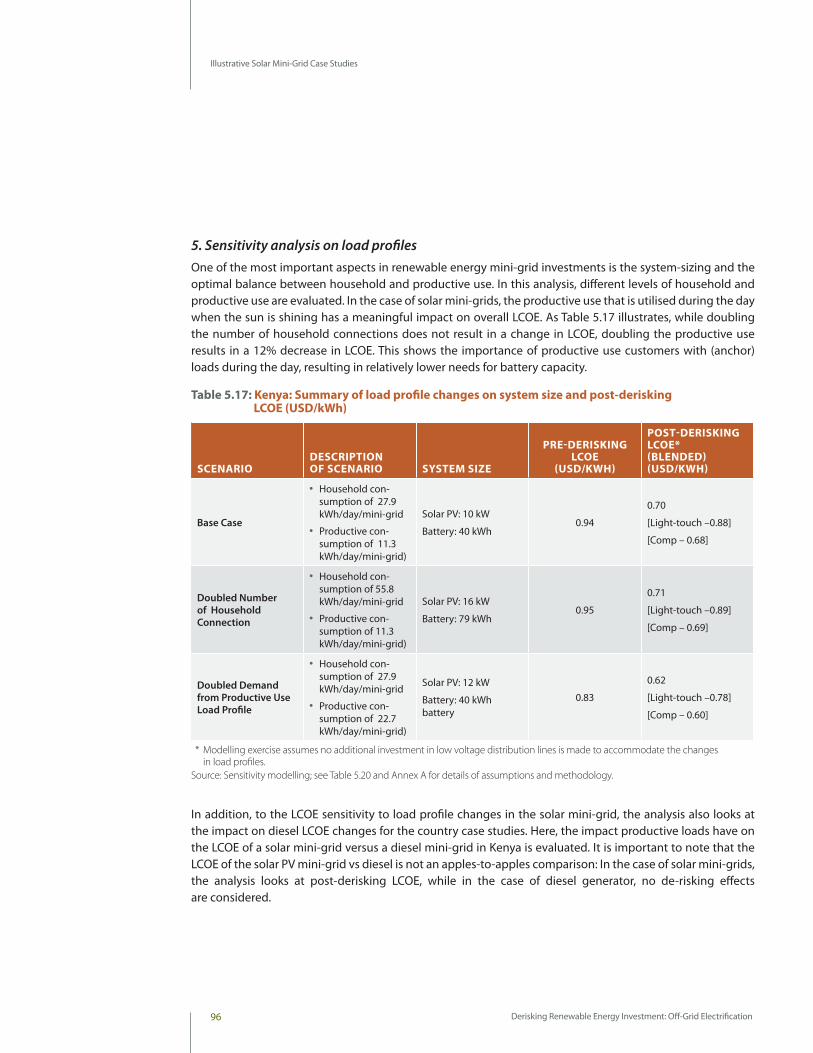
Derisking Renewable Energy Investment: Off-Grid Electrification96
Illustrative Solar Mini-Grid Case Studies
5. Sensitivity analysis on load profilesOne of the most important aspects in renewable energy mini-grid investments is the system-sizing and the optimal balance between household and productive use. In this analysis, different levels of household and productive use are evaluated. In the case of solar mini-grids, the productive use that is utilised during the day when the sun is shining has a meaningful impact on overall LCOE. As Table 5.17 illustrates, while doubling the number of household connections does not result in a change in LCOE, doubling the productive use results in a 12% decrease in LCOE. This shows the importance of productive use customers with (anchor) loads during the day, resulting in relatively lower needs for battery capacity.
Table 5.17: Kenya: Summary of load profile changes on system size and post-derisking LCOE (USD/kWh)
In addition, to the LCOE sensitivity to load profile changes in the solar mini-grid, the analysis also looks at the impact on diesel LCOE changes for the country case studies. Here, the impact productive loads have on the LCOE of a solar mini-grid versus a diesel mini-grid in Kenya is evaluated. It is important to note that the LCOE of the solar PV mini-grid vs diesel is not an apples-to-apples comparison: In the case of solar mini-grids, the analysis looks at post-derisking LCOE, while in the case of diesel generator, no de-risking effects are considered.
SCENARIODESCRIPTION OF SCENARIO SYSTEM SIZE
PRE-DERISKING LCOE
(USD/KWH)
POST-DERISKING LCOE* (BLENDED) (USD/KWH)
Base Case
●● Household con-sumption of 27.9 kWh/day/mini-grid
●● Productive con-sumption of 11.3 kWh/day/mini-grid)
Solar PV: 10 kW
Battery: 40 kWh0.94
0.70
[Light-touch –0.88]
[Comp – 0.68]
Doubled Number of Household Connection
●● Household con-sumption of 55.8 kWh/day/mini-grid
●● Productive con-sumption of 11.3 kWh/day/mini-grid)
Solar PV: 16 kW
Battery: 79 kWh0.95
0.71
[Light-touch –0.89]
[Comp – 0.69]
Doubled Demand from Productive Use Load Profile
●● Household con-sumption of 27.9 kWh/day/mini-grid
●● Productive con-sumption of 22.7 kWh/day/mini-grid)
Solar PV: 12 kW
Battery: 40 kWh battery
0.83
0.62
[Light-touch –0.78]
[Comp – 0.60]
** Modelling exercise assumes no additional investment in low voltage distribution lines is made to accommodate the changes in load profiles.
Source: Sensitivity modelling; see Table 5.20 and Annex A for details of assumptions and methodology.
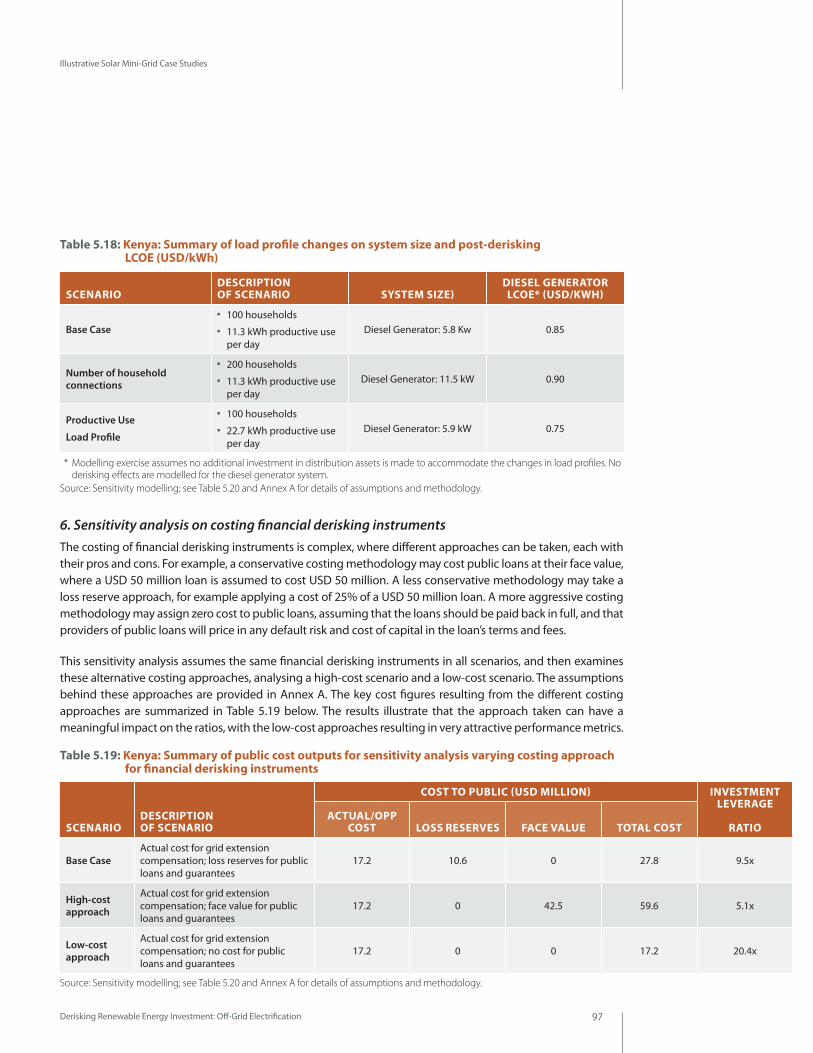
Derisking Renewable Energy Investment: Off-Grid Electrification 97
Illustrative Solar Mini-Grid Case Studies
Table 5.18: Kenya: Summary of load profile changes on system size and post-derisking LCOE (USD/kWh)
6. Sensitivity analysis on costing financial derisking instruments The costing of financial derisking instruments is complex, where different approaches can be taken, each with their pros and cons. For example, a conservative costing methodology may cost public loans at their face value, where a USD 50 million loan is assumed to cost USD 50 million. A less conservative methodology may take a loss reserve approach, for example applying a cost of 25% of a USD 50 million loan. A more aggressive costing methodology may assign zero cost to public loans, assuming that the loans should be paid back in full, and that providers of public loans will price in any default risk and cost of capital in the loan’s terms and fees.
This sensitivity analysis assumes the same financial derisking instruments in all scenarios, and then examines these alternative costing approaches, analysing a high-cost scenario and a low-cost scenario. The assumptions behind these approaches are provided in Annex A. The key cost figures resulting from the different costing approaches are summarized in Table 5.19 below. The results illustrate that the approach taken can have a meaningful impact on the ratios, with the low-cost approaches resulting in very attractive performance metrics.
Table 5.19: Kenya: Summary of public cost outputs for sensitivity analysis varying costing approach for financial derisking instruments
SCENARIODESCRIPTION OF SCENARIO SYSTEM SIZE)
DIESEL GENERATOR LCOE* (USD/KWH)
Base Case
●● 100 households●● 11.3 kWh productive use
per day Diesel Generator: 5.8 Kw 0.85
Number of household connections
●● 200 households●● 11.3 kWh productive use
per day Diesel Generator: 11.5 kW 0.90
Productive Use
Load Profile
●● 100 households●● 22.7 kWh productive use
per dayDiesel Generator: 5.9 kW 0.75
SCENARIODESCRIPTION OF SCENARIO
COST TO PUBLIC (USD MILLION) INVESTMENT LEVERAGE
RATIOACTUAL/OPP
COST LOSS RESERVES FACE VALUE TOTAL COST
Base CaseActual cost for grid extension compensation; loss reserves for public loans and guarantees
17.2 10.6 0 27.8 9.5x
High-cost approach
Actual cost for grid extension compensation; face value for public loans and guarantees
17.2 0 42.5 59.6 5.1x
Low-cost approach
Actual cost for grid extension compensation; no cost for public loans and guarantees
17.2 0 0 17.2 20.4x
** Modelling exercise assumes no additional investment in distribution assets is made to accommodate the changes in load profiles. No derisking effects are modelled for the diesel generator system.
Source: Sensitivity modelling; see Table 5.20 and Annex A for details of assumptions and methodology.
Source: Sensitivity modelling; see Table 5.20 and Annex A for details of assumptions and methodology.
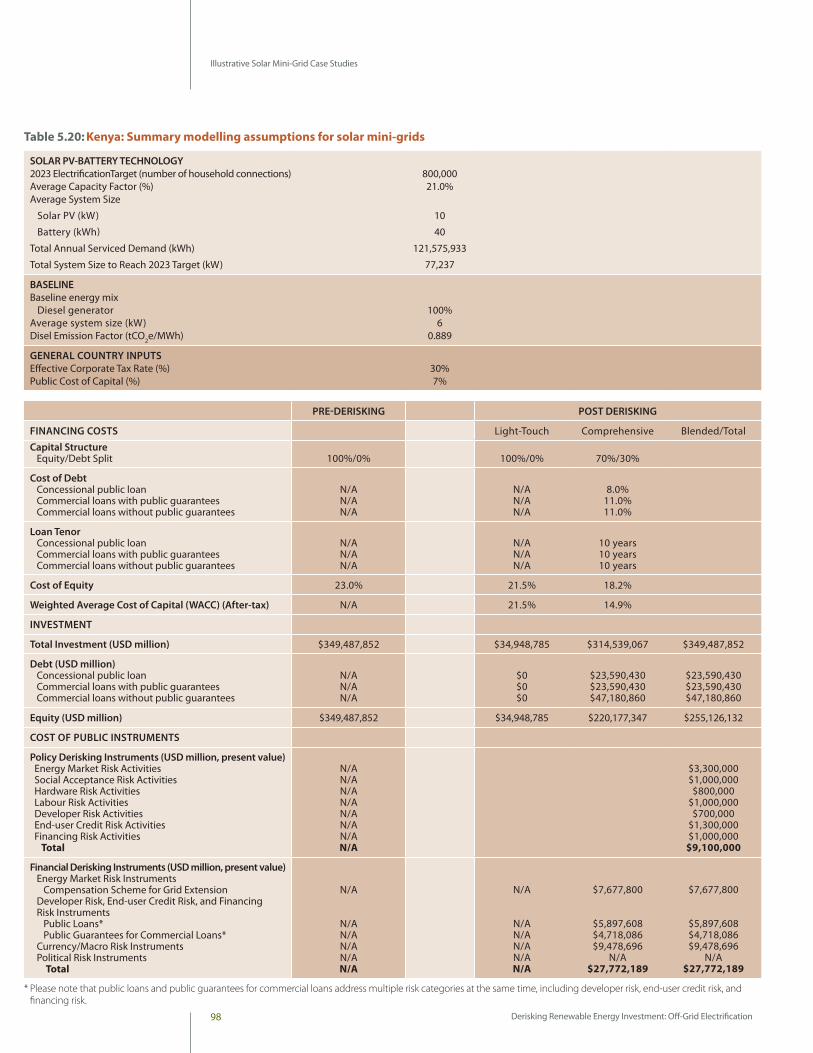
Derisking Renewable Energy Investment: Off-Grid Electrification98
Illustrative Solar Mini-Grid Case Studies
SOLAR PV-BATTERY TECHNOLOGY 2023 ElectrificationTarget (number of household connections) 800,000Average Capacity Factor (%) 21.0%Average System Size
Solar PV (kW) 10
Battery (kWh) 40
Total Annual Serviced Demand (kWh) 121,575,933
Total System Size to Reach 2023 Target (kW) 77,237
BASELINEBaseline energy mix Diesel generator 100%Average system size (kW) 6Disel Emission Factor (tCO2e/MWh) 0.889
GENERAL COUNTRY INPUTSEffective Corporate Tax Rate (%) 30%Public Cost of Capital (%) 7%
PRE-DERISKING POST DERISKING
FINANCING COSTS Light-Touch Comprehensive Blended/Total
Capital Structure Equity/Debt Split
100%/0%
100%/0%
70%/30%
Cost of Debt Concessional public loan Commercial loans with public guarantees Commercial loans without public guarantees
N/A N/A N/A
N/A N/A N/A
8.0%
11.0% 11.0%
Loan Tenor Concessional public loan Commercial loans with public guarantees Commercial loans without public guarantees
N/A N/A N/A
N/A N/A N/A
10 years 10 years 10 years
Cost of Equity 23.0% 21.5% 18.2%
Weighted Average Cost of Capital (WACC) (After-tax) N/A 21.5% 14.9%
INVESTMENT
Total Investment (USD million) $349,487,852 $34,948,785 $314,539,067 $349,487,852
Debt (USD million) Concessional public loan Commercial loans with public guarantees Commercial loans without public guarantees
N/A N/A N/A
$0 $0 $0
$23,590,430 $23,590,430 $47,180,860
$23,590,430 $23,590,430 $47,180,860
Equity (USD million) $349,487,852 $34,948,785 $220,177,347 $255,126,132
COST OF PUBLIC INSTRUMENTS
Policy Derisking Instruments (USD million, present value) Energy Market Risk Activities Social Acceptance Risk Activities Hardware Risk Activities Labour Risk Activities Developer Risk Activities End-user Credit Risk Activities Financing Risk Activities Total
N/A N/A N/A N/A N/A N/A N/A N/A
$3,300,000 $1,000,000 $800,000
$1,000,000 $700,000
$1,300,000 $1,000,000
$9,100,000
Financial Derisking Instruments (USD million, present value) Energy Market Risk Instruments Compensation Scheme for Grid Extension Developer Risk, End-user Credit Risk, and Financing Risk Instruments Public Loans* Public Guarantees for Commercial Loans* Currency/Macro Risk Instruments Political Risk Instruments Total
N/A
N/A N/A N/A N/A N/A
N/A
N/A N/A N/A N/A N/A
$7,677,800
$5,897,608 $4,718,086 $9,478,696
N/A $27,772,189
$7,677,800
$5,897,608 $4,718,086 $9,478,696
N/A $27,772,189
* Please note that public loans and public guarantees for commercial loans address multiple risk categories at the same time, including developer risk, end-user credit risk, and financing risk.
Table 5.20: Kenya: Summary modelling assumptions for solar mini-grids

1
99Derisking Renewable Energy Investment: Off-Grid Electrification
Derisking Renewable Energy Investment: Off-Grid Electrification100
Conclusions Chapter 6
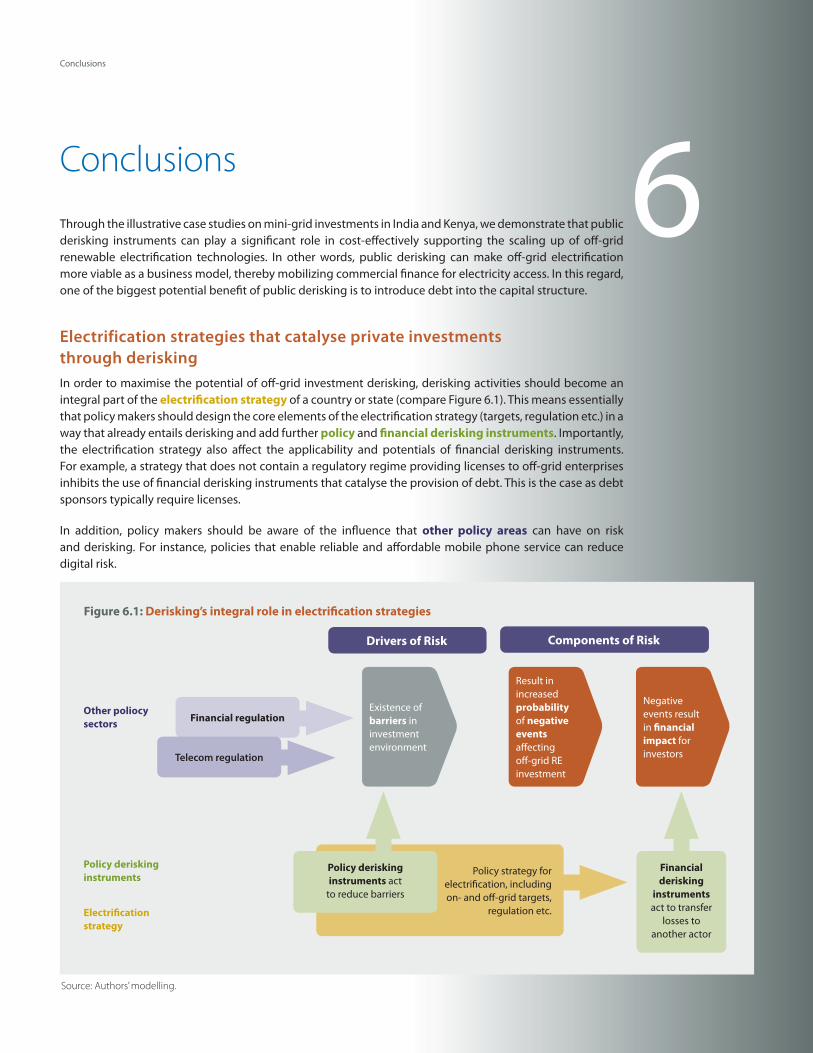
Derisking Renewable Energy Investment: Off-Grid Electrification 101
Conclusions
Conclusions
Through the illustrative case studies on mini-grid investments in India and Kenya, we demonstrate that public derisking instruments can play a significant role in cost-effectively supporting the scaling up of off-grid renewable electrification technologies. In other words, public derisking can make off-grid electrification more viable as a business model, thereby mobilizing commercial finance for electricity access. In this regard, one of the biggest potential benefit of public derisking is to introduce debt into the capital structure.
Electrification strategies that catalyse private investments through deriskingIn order to maximise the potential of off-grid investment derisking, derisking activities should become an integral part of the electrification strategy of a country or state (compare Figure 6.1). This means essentially that policy makers should design the core elements of the electrification strategy (targets, regulation etc.) in a way that already entails derisking and add further policy and financial derisking instruments. Importantly, the electrification strategy also affect the applicability and potentials of financial derisking instruments. For example, a strategy that does not contain a regulatory regime providing licenses to off-grid enterprises inhibits the use of financial derisking instruments that catalyse the provision of debt. This is the case as debt sponsors typically require licenses.
In addition, policy makers should be aware of the influence that other policy areas can have on risk and derisking. For instance, policies that enable reliable and affordable mobile phone service can reduce digital risk.
6
Figure 6.1: Derisking’s integral role in electrification strategies
Financial derisking
instruments act to transfer
losses to another actor
Policy strategy for electrification, including on- and off-grid targets,
regulation etc.
Drivers of Risk
Existence of barriers in investment environment
Result in increased probability of negative events affecting off-grid RE investment
Negative events result in financial impact for investors
Components of Risk
Policy derisking instruments
Other poliocy sectors
Electrification strategy
Source: Authors’ modelling.
Financial regulation
Telecom regulation
Policy derisking instruments act
to reduce barriers
Derisking Renewable Energy Investment: Off-Grid Electrification102
Conclusions
Further areas of workIn addition to more in-depth applications of the DREI framework to off-grid electricity access in developing country contexts, we identify the following areas for further work:
●● Enabling private sector derisking: While this study focuses on public derisking instruments which directly mitigate risks or transfer them to public actors, future work can analyse how public instruments can support derisking measures by the private sector. Examples of such measures include creation of policies and legal and regulatory conditions conducive to aggregation and spatial diversification of assets for off-grid electrification (see, for example, Gershenson et al. (2015) and Malhotra et al. (2017).
●● Subsidy reform: Misdirected and perverse energy subsidies can be a major barrier for both on- and off-grid electricity access. Further work on identifying such effects and possible methods for subsidy reform can help significantly increase the attractiveness of investments for electricity access.
●● The political economy of derisking: The extent to which derisking is implemented and becomes effective depends of course on the political will and feasibility to introduce such measures. Especially policy derisking requires to undergo a political process, as it entails policy reform. Future work should analyse political obstacles and opportunities for derisking and develop recommendations that enable its fast and comprehensive implementation.

1
103Derisking Renewable Energy Investment: Off-Grid Electrification

Derisking Renewable Energy Investment: Off-Grid Electrification104
Annexes
Derisking Renewable Energy Investment: Off-Grid Electrification 105
Annexes
Annexes
Annex A. Methodology And Data For The Illustrative Modelling ExerciseThis annex sets out the methodology, assumptions, and data that have been used in performing the modelling described in this report.
The modelling closely follows the methodology set out in the UNDP Derisking Renewable Energy Investment Report (UNDP, 2013) (“original DREI report”). This annex is organized in line with the DREI report’s framework: Risk Environment (Step 1), Public Instrument Selection (Step 2), Life-Cycle Cost (Step 3), and Performance Metrics (Step 4).
In addition, the financial tool (in Microsoft Excel) utilised in the report builds upon the tool created for the original DREI report framework, but is modified for small-scale mini-grid systems. The financial tool is denominated in US dollars, with January 1, 2018 as the starting period.
The solar mini-grid financial tool is available for download at www.undp.org/DREI/Small-Scale
Country selectionThe country selection for the case studies follows the SEforAll Global Tracking Framework and the IED report “Identifying the gaps and building the evidence base on low carbon mini-grids” (IED, 2013). In addition to countries in Africa and South East Asia, Small Island Developing States (SIDS) in the Pacific, Caribbean and Africa, Indian Ocean, Mediterranean and South China Sea (AIMS) were also evaluated. Box A.1 provides the selection criteria for the country case studies analysed in this paper.
Box A.1: Case study country selection criteria
The following criteria were utilised for the selection of the case study countries:
Level of electricity access and mini-grid market potential: The level of electricity access can be described in terms of absolute number of people lacking access to electricity, and in terms of percentage of people in a country/state lacking electricity access. This determines the potential impact of policy measures in absolute terms, as well as their leverage ratio in the specific case of electrification (excluding other benefits).
Mini-Grid Activity: Countries/states where mini-grids are already deployed are more likely to allow for a sufficient sample size for interviews and provide for responses to be based more on practical experience.
Political stability: This criterion can be used to exclude fragile and conflict affected countries, where adverse conditions are likely to act as show-stoppers for private sector investments, or lead to impractically high risk premiums.
Local fuel prices: This criterion can be used as a measure for competitiveness of renewable energy based mini-grids. Countries with extremely low fuel prices due to subsidies can be excluded due to lack of competitiveness as they do not offer a level playing field for renewable energy technologies for mini-grids.
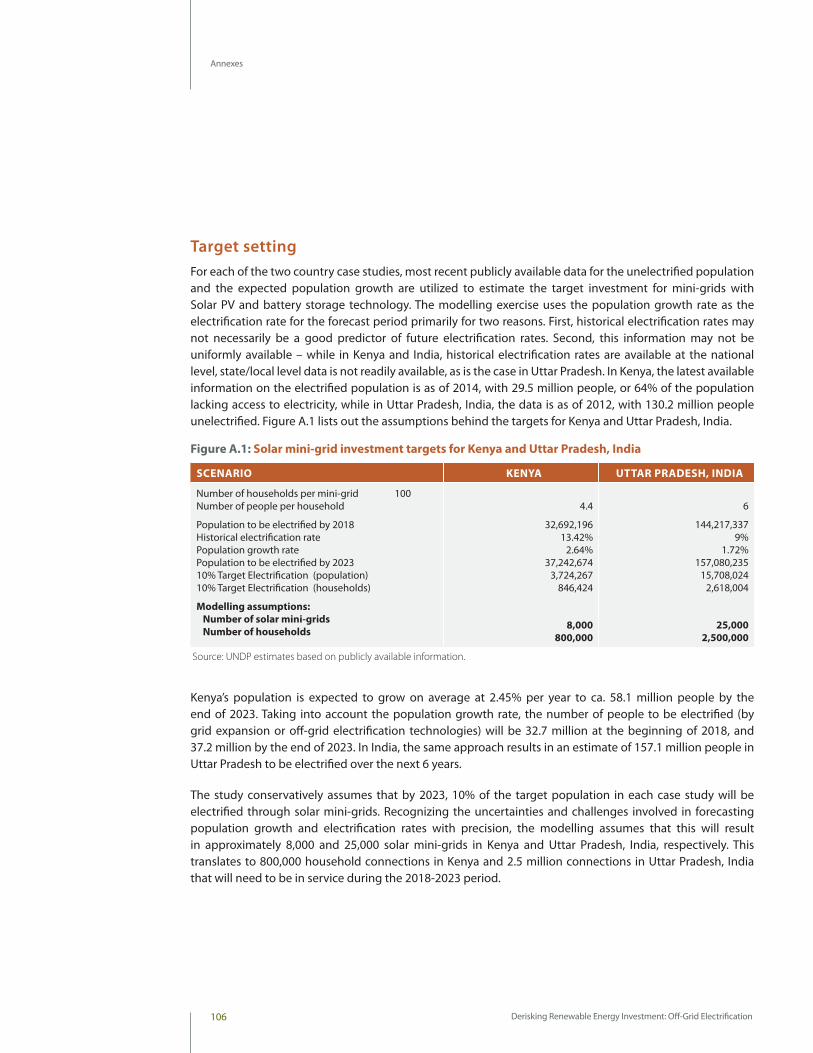
Derisking Renewable Energy Investment: Off-Grid Electrification106
Annexes
Target settingFor each of the two country case studies, most recent publicly available data for the unelectrified population and the expected population growth are utilized to estimate the target investment for mini-grids with Solar PV and battery storage technology. The modelling exercise uses the population growth rate as the electrification rate for the forecast period primarily for two reasons. First, historical electrification rates may not necessarily be a good predictor of future electrification rates. Second, this information may not be uniformly available – while in Kenya and India, historical electrification rates are available at the national level, state/local level data is not readily available, as is the case in Uttar Pradesh. In Kenya, the latest available information on the electrified population is as of 2014, with 29.5 million people, or 64% of the population lacking access to electricity, while in Uttar Pradesh, India, the data is as of 2012, with 130.2 million people unelectrified. Figure A.1 lists out the assumptions behind the targets for Kenya and Uttar Pradesh, India.
Figure A.1: Solar mini-grid investment targets for Kenya and Uttar Pradesh, India
Kenya’s population is expected to grow on average at 2.45% per year to ca. 58.1 million people by the end of 2023. Taking into account the population growth rate, the number of people to be electrified (by grid expansion or off-grid electrification technologies) will be 32.7 million at the beginning of 2018, and 37.2 million by the end of 2023. In India, the same approach results in an estimate of 157.1 million people in Uttar Pradesh to be electrified over the next 6 years.
The study conservatively assumes that by 2023, 10% of the target population in each case study will be electrified through solar mini-grids. Recognizing the uncertainties and challenges involved in forecasting population growth and electrification rates with precision, the modelling assumes that this will result in approximately 8,000 and 25,000 solar mini-grids in Kenya and Uttar Pradesh, India, respectively. This translates to 800,000 household connections in Kenya and 2.5 million connections in Uttar Pradesh, India that will need to be in service during the 2018-2023 period.
SCENARIO KENYA UTTAR PRADESH, INDIA
Number of households per mini-grid 100 Number of people per household
Population to be electrified by 2018 Historical electrification rate Population growth rate Population to be electrified by 2023 10% Target Electrification (population) 10% Target Electrification (households)
Modelling assumptions: Number of solar mini-grids Number of households
4.4
32,692,196 13.42%
2.64% 37,242,674
3,724,267 846,424
8,000 800,000
6
144,217,337 9%
1.72% 157,080,235
15,708,024 2,618,004
25,000 2,500,000
Source: UNDP estimates based on publicly available information.
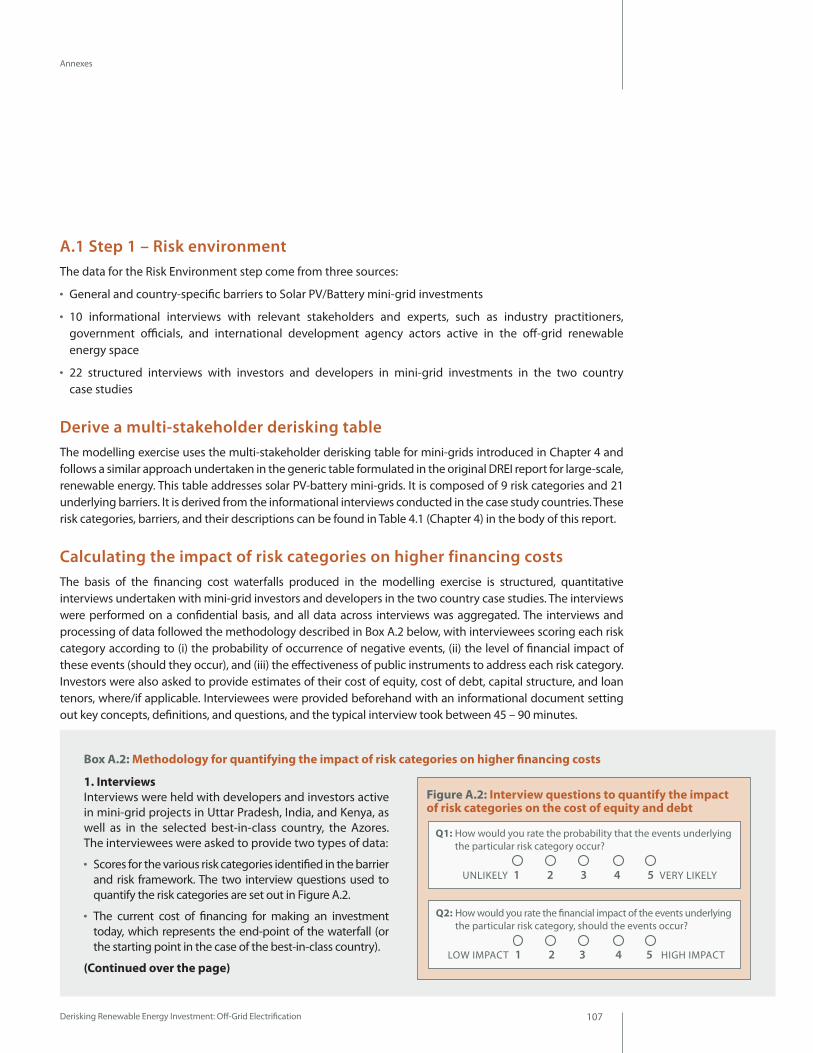
Derisking Renewable Energy Investment: Off-Grid Electrification 107
Annexes
A.1 Step 1 – Risk environment The data for the Risk Environment step come from three sources:
●● General and country-specific barriers to Solar PV/Battery mini-grid investments
●● 10 informational interviews with relevant stakeholders and experts, such as industry practitioners, government officials, and international development agency actors active in the off-grid renewable energy space
●● 22 structured interviews with investors and developers in mini-grid investments in the two country case studies
Derive a multi-stakeholder derisking tableThe modelling exercise uses the multi-stakeholder derisking table for mini-grids introduced in Chapter 4 and follows a similar approach undertaken in the generic table formulated in the original DREI report for large-scale, renewable energy. This table addresses solar PV-battery mini-grids. It is composed of 9 risk categories and 21 underlying barriers. It is derived from the informational interviews conducted in the case study countries. These risk categories, barriers, and their descriptions can be found in Table 4.1 (Chapter 4) in the body of this report.
Calculating the impact of risk categories on higher financing costsThe basis of the financing cost waterfalls produced in the modelling exercise is structured, quantitative interviews undertaken with mini-grid investors and developers in the two country case studies. The interviews were performed on a confidential basis, and all data across interviews was aggregated. The interviews and processing of data followed the methodology described in Box A.2 below, with interviewees scoring each risk category according to (i) the probability of occurrence of negative events, (ii) the level of financial impact of these events (should they occur), and (iii) the effectiveness of public instruments to address each risk category. Investors were also asked to provide estimates of their cost of equity, cost of debt, capital structure, and loan tenors, where/if applicable. Interviewees were provided beforehand with an informational document setting out key concepts, definitions, and questions, and the typical interview took between 45 – 90 minutes.
Box A.2: Methodology for quantifying the impact of risk categories on higher financing costs
1. InterviewsInterviews were held with developers and investors active in mini-grid projects in Uttar Pradesh, India, and Kenya, as well as in the selected best-in-class country, the Azores. The interviewees were asked to provide two types of data:
●● Scores for the various risk categories identified in the barrier and risk framework. The two interview questions used to quantify the risk categories are set out in Figure A.2.
●● The current cost of financing for making an investment today, which represents the end-point of the waterfall (or the starting point in the case of the best-in-class country).
(Continued over the page)
Q1: How would you rate the probability that the events underlying the particular risk category occur?
UNLIKELY 1 2 3 4 5 VERY LIKELY
Q2: How would you rate the financial impact of the events underlying the particular risk category, should the events occur?
LOW IMPACT 1 2 3 4 5 HIGH IMPACT
Figure A.2: Interview questions to quantify the impact of risk categories on the cost of equity and debt
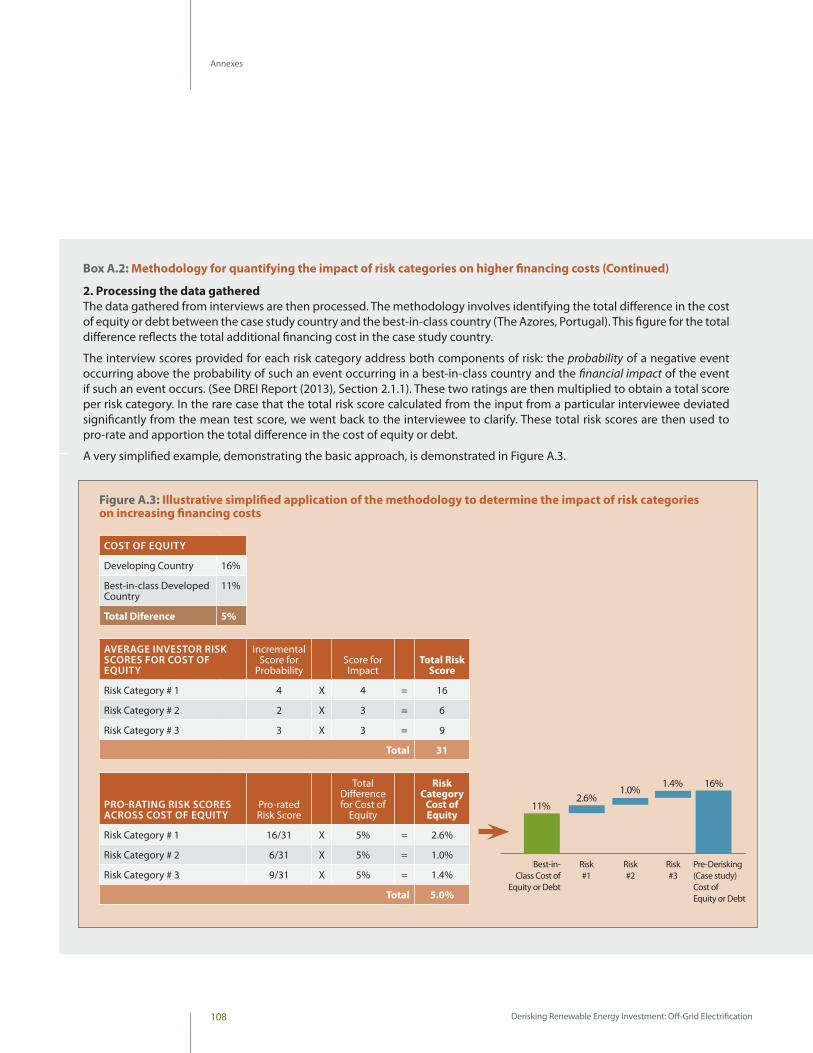
Derisking Renewable Energy Investment: Off-Grid Electrification108
Annexes
Box A.2: Methodology for quantifying the impact of risk categories on higher financing costs (Continued)
2. Processing the data gatheredThe data gathered from interviews are then processed. The methodology involves identifying the total difference in the cost of equity or debt between the case study country and the best-in-class country (The Azores, Portugal). This figure for the total difference reflects the total additional financing cost in the case study country.
The interview scores provided for each risk category address both components of risk: the probability of a negative event occurring above the probability of such an event occurring in a best-in-class country and the financial impact of the event if such an event occurs. (See DREI Report (2013), Section 2.1.1). These two ratings are then multiplied to obtain a total score per risk category. In the rare case that the total risk score calculated from the input from a particular interviewee deviated significantly from the mean test score, we went back to the interviewee to clarify. These total risk scores are then used to pro-rate and apportion the total difference in the cost of equity or debt.
A very simplified example, demonstrating the basic approach, is demonstrated in Figure A.3.
COST OF EQUITY
Developing Country 16%
Best-in-class Developed Country
11%
Total Diference 5%
AVERAGE INVESTOR RISK SCORES FOR COST OF EQUITY
Incremental Score for
Probability Score for Impact
Total Risk Score
Risk Category # 1 4 X 4 = 16
Risk Category # 2 2 X 3 = 6
Risk Category # 3 3 X 3 = 9
Total 31
PRO-RATING RISK SCORES ACROSS COST OF EQUITY
Pro-rated Risk Score
Total Difference for Cost of
Equity
Risk Category
Cost of Equity
Risk Category # 1 16/31 X 5% = 2.6%
Risk Category # 2 6/31 X 5% = 1.0%
Risk Category # 3 9/31 X 5% = 1.4%
Total 5.0%
Best-in-Class Cost of
Equity or Debt
Risk #2
Risk #3
Risk #1
Pre-Derisking(Case study)Cost of Equity or Debt
2.6%11%
1.0%1.4% 16%
Figure A.3: Illustrative simplified application of the methodology to determine the impact of risk categories on increasing financing costs
Derisking Renewable Energy Investment: Off-Grid Electrification 109
Annexes
In addition, the following key steps have been taken in calculating the financing cost waterfalls:
●● In order to make interviews comparable, investors were asked to provide their scores while taking into account four categories of assumptions, as set out in Box A.3 below. The interviewees have been asked to provide scores based on the current investment environment in the case study country today. To maintain consistency, these assumptions have subsequently been used to shape the inputs in the LCOE calculation for solar mini-grid systems in Step 3.
●● The modelling exercise selects the Azores Islands of Portugal42 as the example of a best-in-class investment environment for solar mini-grids. In this way, the Azores Islands serves as the baseline – the left-most column of the financing cost waterfall.
●● Structured interviews were conducted for the best-in-class country and the case study countries. In India, 10 structured interviews were conducted with developers and investors active in Uttar Pradesh and Bihar; in Kenya, 12 interviews were conducted with developers, investors, and industry experts. For the best-in-class country, in addition to an interview with a mini-grid expert in the Azores, publicly available data was used for cost of financing assumptions.
A.2. Step 2 – Public instrument selectionThe derisking table introduced in Chapter 4 lists the public instruments applicable to corresponding risk categories. Individual instruments in the public instrument table were then selected for the country case studies in a comprehensive manner: if the financing cost waterfall identified the incremental financing costs for a particular risk category, then the matching public instrument in the table was deployed and modelled.
Box A.3: The technology and business model assumptions for the two case studies
●● Technology: Assume a solar PV mini-grid with lithium-ion battery storage and high quality c-Si PV panels and BoS manufacturer
●● Developer Model: Assume a private sector, build-own operate (BOO) business model, with around 10 mini-grids under each developer
●● Service Level: Basic lighting, mobile phone charging, household appliances, plus some productive and community/infrastructure use
●● Customers: Less than or equal to 100 households
42 The choice of Azores is mostly based on data availability. Generally, only few mini-grids exist in low-risk environments. The availability of financing data constrained our selection further.
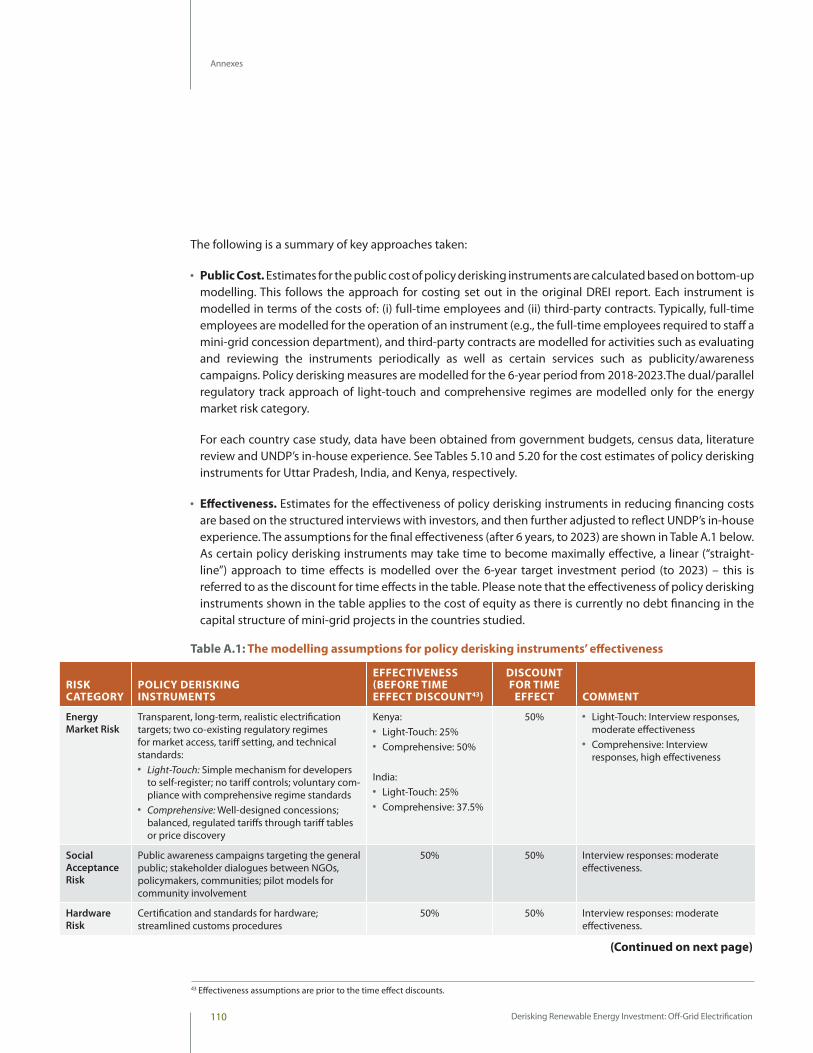
Derisking Renewable Energy Investment: Off-Grid Electrification110
Annexes
The following is a summary of key approaches taken:
●● Public Cost. Estimates for the public cost of policy derisking instruments are calculated based on bottom-up modelling. This follows the approach for costing set out in the original DREI report. Each instrument is modelled in terms of the costs of: (i) full-time employees and (ii) third-party contracts. Typically, full-time employees are modelled for the operation of an instrument (e.g., the full-time employees required to staff a mini-grid concession department), and third-party contracts are modelled for activities such as evaluating and reviewing the instruments periodically as well as certain services such as publicity/awareness campaigns. Policy derisking measures are modelled for the 6-year period from 2018-2023.The dual/parallel regulatory track approach of light-touch and comprehensive regimes are modelled only for the energy market risk category.
For each country case study, data have been obtained from government budgets, census data, literature review and UNDP’s in-house experience. See Tables 5.10 and 5.20 for the cost estimates of policy derisking instruments for Uttar Pradesh, India, and Kenya, respectively.
●● Effectiveness. Estimates for the effectiveness of policy derisking instruments in reducing financing costs are based on the structured interviews with investors, and then further adjusted to reflect UNDP’s in-house experience. The assumptions for the final effectiveness (after 6 years, to 2023) are shown in Table A.1 below. As certain policy derisking instruments may take time to become maximally effective, a linear (“straight-line”) approach to time effects is modelled over the 6-year target investment period (to 2023) – this is referred to as the discount for time effects in the table. Please note that the effectiveness of policy derisking instruments shown in the table applies to the cost of equity as there is currently no debt financing in the capital structure of mini-grid projects in the countries studied.
Table A.1: The modelling assumptions for policy derisking instruments’ effectiveness
(Continued on next page)
RISK CATEGORY
POLICY DERISKING INSTRUMENTS
EFFECTIVENESS (BEFORE TIME EFFECT DISCOUNT43)
DISCOUNT FOR TIME
EFFECT COMMENT
Energy Market Risk
Transparent, long-term, realistic electrification targets; two co-existing regulatory regimes for market access, tariff setting, and technical standards:
●● Light-Touch: Simple mechanism for developers to self-register; no tariff controls; voluntary com-pliance with comprehensive regime standards
●● Comprehensive: Well-designed concessions; balanced, regulated tariffs through tariff tables or price discovery
Kenya:●● Light-Touch: 25%●● Comprehensive: 50%
India:●● Light-Touch: 25%●● Comprehensive: 37.5%
50% ●● Light-Touch: Interview responses, moderate effectiveness
●● Comprehensive: Interview responses, high effectiveness
Social Acceptance Risk
Public awareness campaigns targeting the general public; stakeholder dialogues between NGOs, policymakers, communities; pilot models for community involvement
50% 50% Interview responses: moderate effectiveness.
Hardware Risk
Certification and standards for hardware; streamlined customs procedures
50% 50% Interview responses: moderate effectiveness.
43 Effectiveness assumptions are prior to the time effect discounts.
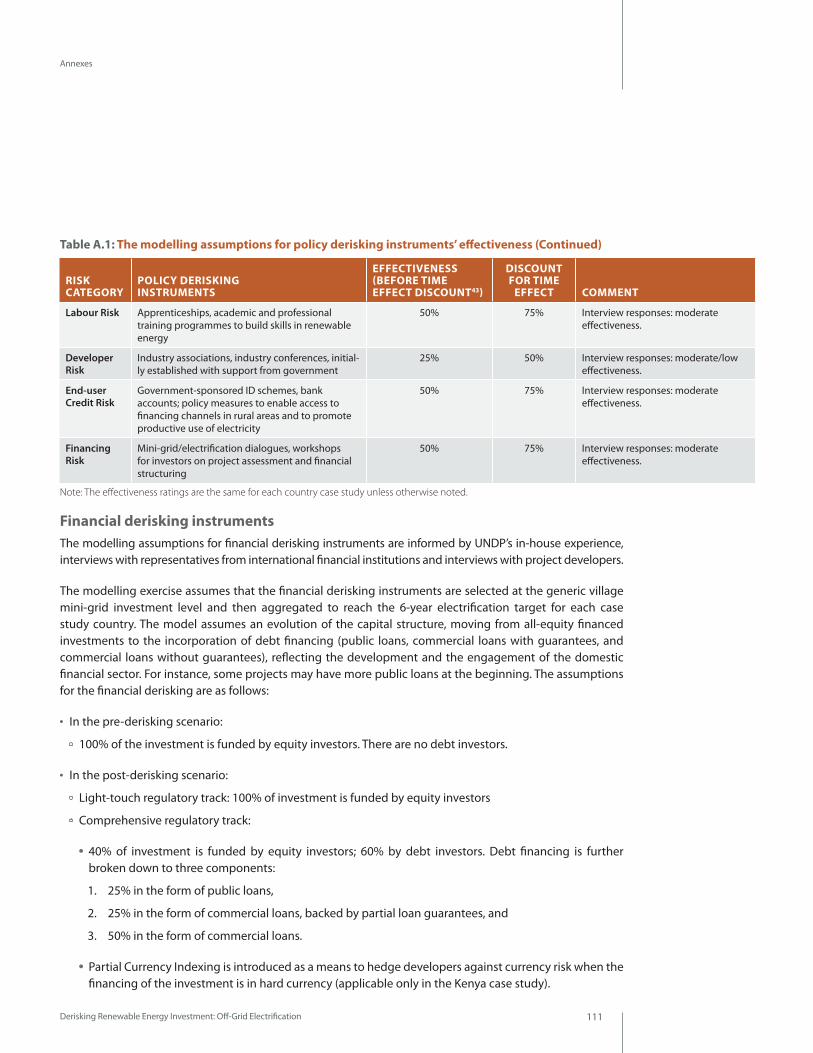
Derisking Renewable Energy Investment: Off-Grid Electrification 111
Annexes
Financial derisking instrumentsThe modelling assumptions for financial derisking instruments are informed by UNDP’s in-house experience, interviews with representatives from international financial institutions and interviews with project developers.
The modelling exercise assumes that the financial derisking instruments are selected at the generic village mini-grid investment level and then aggregated to reach the 6-year electrification target for each case study country. The model assumes an evolution of the capital structure, moving from all-equity financed investments to the incorporation of debt financing (public loans, commercial loans with guarantees, and commercial loans without guarantees), reflecting the development and the engagement of the domestic financial sector. For instance, some projects may have more public loans at the beginning. The assumptions for the financial derisking are as follows:
●● In the pre-derisking scenario:
100% of the investment is funded by equity investors. There are no debt investors.
●● In the post-derisking scenario:
Light-touch regulatory track: 100% of investment is funded by equity investors
Comprehensive regulatory track:
●● 40% of investment is funded by equity investors; 60% by debt investors. Debt financing is further broken down to three components:
1. 25% in the form of public loans,
2. 25% in the form of commercial loans, backed by partial loan guarantees, and
3. 50% in the form of commercial loans.
●● Partial Currency Indexing is introduced as a means to hedge developers against currency risk when the financing of the investment is in hard currency (applicable only in the Kenya case study).
Table A.1: The modelling assumptions for policy derisking instruments’ effectiveness (Continued)
RISK CATEGORY
POLICY DERISKING INSTRUMENTS
EFFECTIVENESS (BEFORE TIME EFFECT DISCOUNT43)
DISCOUNT FOR TIME
EFFECT COMMENT
Labour Risk Apprenticeships, academic and professional training programmes to build skills in renewable energy
50% 75% Interview responses: moderate effectiveness.
Developer Risk
Industry associations, industry conferences, initial-ly established with support from government
25% 50% Interview responses: moderate/low effectiveness.
End-user Credit Risk
Government-sponsored ID schemes, bank accounts; policy measures to enable access to financing channels in rural areas and to promote productive use of electricity
50% 75% Interview responses: moderate effectiveness.
Financing Risk
Mini-grid/electrification dialogues, workshops for investors on project assessment and financial structuring
50% 75% Interview responses: moderate effectiveness.
Note: The effectiveness ratings are the same for each country case study unless otherwise noted.
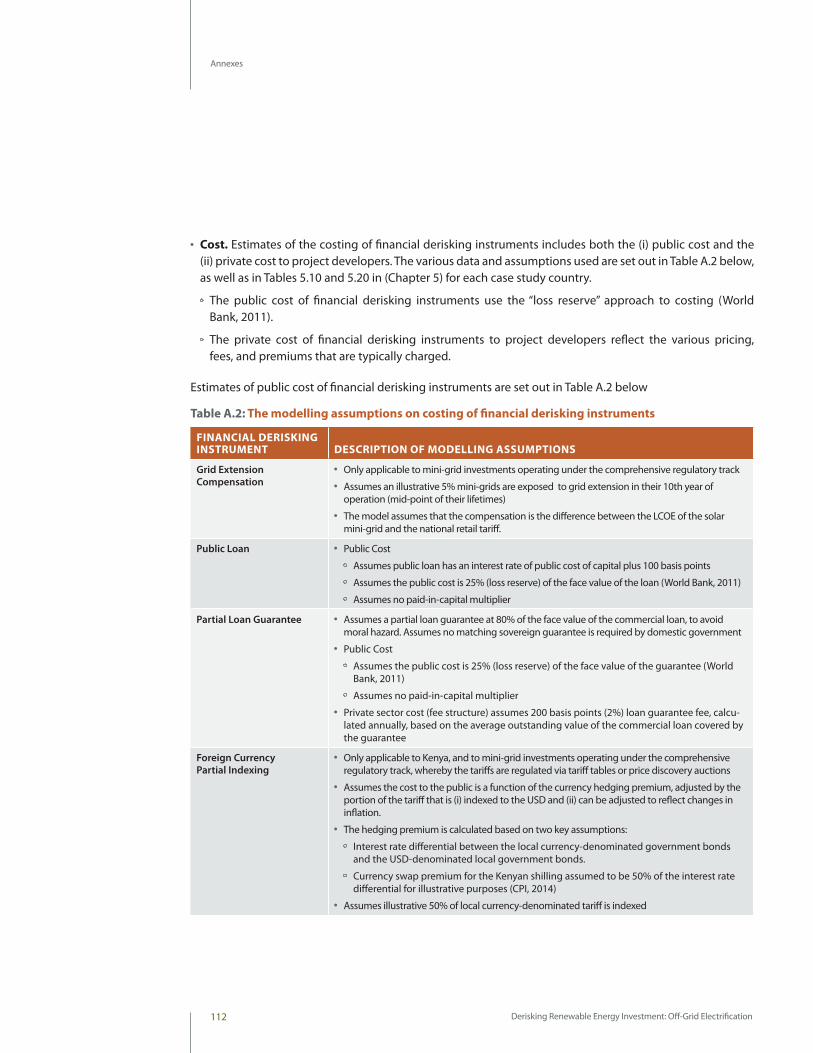
Derisking Renewable Energy Investment: Off-Grid Electrification112
Annexes
●● Cost. Estimates of the costing of financial derisking instruments includes both the (i) public cost and the (ii) private cost to project developers. The various data and assumptions used are set out in Table A.2 below, as well as in Tables 5.10 and 5.20 in (Chapter 5) for each case study country.
The public cost of financial derisking instruments use the “loss reserve” approach to costing (World Bank, 2011).
The private cost of financial derisking instruments to project developers reflect the various pricing, fees, and premiums that are typically charged.
Estimates of public cost of financial derisking instruments are set out in Table A.2 below
Table A.2: The modelling assumptions on costing of financial derisking instruments
FINANCIAL DERISKING INSTRUMENT DESCRIPTION OF MODELLING ASSUMPTIONS
Grid Extension Compensation
●● Only applicable to mini-grid investments operating under the comprehensive regulatory track●● Assumes an illustrative 5% mini-grids are exposed to grid extension in their 10th year of
operation (mid-point of their lifetimes)●● The model assumes that the compensation is the difference between the LCOE of the solar
mini-grid and the national retail tariff.
Public Loan ●● Public Cost
Assumes public loan has an interest rate of public cost of capital plus 100 basis points
Assumes the public cost is 25% (loss reserve) of the face value of the loan (World Bank, 2011)
Assumes no paid-in-capital multiplier
Partial Loan Guarantee ●● Assumes a partial loan guarantee at 80% of the face value of the commercial loan, to avoid moral hazard. Assumes no matching sovereign guarantee is required by domestic government
●● Public Cost
Assumes the public cost is 25% (loss reserve) of the face value of the guarantee (World Bank, 2011)
Assumes no paid-in-capital multiplier●● Private sector cost (fee structure) assumes 200 basis points (2%) loan guarantee fee, calcu-
lated annually, based on the average outstanding value of the commercial loan covered by the guarantee
Foreign Currency Partial Indexing
●● Only applicable to Kenya, and to mini-grid investments operating under the comprehensive regulatory track, whereby the tariffs are regulated via tariff tables or price discovery auctions
●● Assumes the cost to the public is a function of the currency hedging premium, adjusted by the portion of the tariff that is (i) indexed to the USD and (ii) can be adjusted to reflect changes in inflation.
●● The hedging premium is calculated based on two key assumptions:
Interest rate differential between the local currency-denominated government bonds and the USD-denominated local government bonds.
Currency swap premium for the Kenyan shilling assumed to be 50% of the interest rate differential for illustrative purposes (CPI, 2014)
●● Assumes illustrative 50% of local currency-denominated tariff is indexed
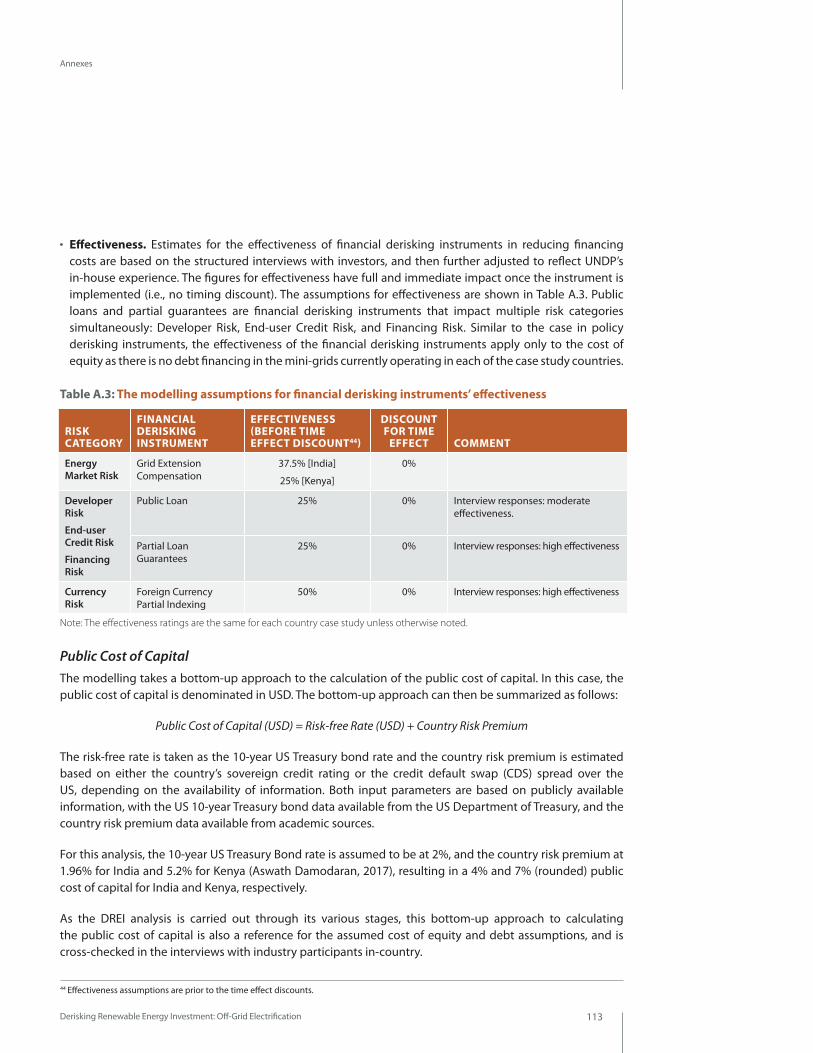
Derisking Renewable Energy Investment: Off-Grid Electrification 113
Annexes
●● Effectiveness. Estimates for the effectiveness of financial derisking instruments in reducing financing costs are based on the structured interviews with investors, and then further adjusted to reflect UNDP’s in-house experience. The figures for effectiveness have full and immediate impact once the instrument is implemented (i.e., no timing discount). The assumptions for effectiveness are shown in Table A.3. Public loans and partial guarantees are financial derisking instruments that impact multiple risk categories simultaneously: Developer Risk, End-user Credit Risk, and Financing Risk. Similar to the case in policy derisking instruments, the effectiveness of the financial derisking instruments apply only to the cost of equity as there is no debt financing in the mini-grids currently operating in each of the case study countries.
Public Cost of CapitalThe modelling takes a bottom-up approach to the calculation of the public cost of capital. In this case, the public cost of capital is denominated in USD. The bottom-up approach can then be summarized as follows:
Public Cost of Capital (USD) = Risk-free Rate (USD) + Country Risk Premium
The risk-free rate is taken as the 10-year US Treasury bond rate and the country risk premium is estimated based on either the country’s sovereign credit rating or the credit default swap (CDS) spread over the US, depending on the availability of information. Both input parameters are based on publicly available information, with the US 10-year Treasury bond data available from the US Department of Treasury, and the country risk premium data available from academic sources.
For this analysis, the 10-year US Treasury Bond rate is assumed to be at 2%, and the country risk premium at 1.96% for India and 5.2% for Kenya (Aswath Damodaran, 2017), resulting in a 4% and 7% (rounded) public cost of capital for India and Kenya, respectively.
As the DREI analysis is carried out through its various stages, this bottom-up approach to calculating the public cost of capital is also a reference for the assumed cost of equity and debt assumptions, and is cross-checked in the interviews with industry participants in-country.
Table A.3: The modelling assumptions for financial derisking instruments’ effectiveness
44 Effectiveness assumptions are prior to the time effect discounts.
Note: The effectiveness ratings are the same for each country case study unless otherwise noted.
RISK CATEGORY
FINANCIAL DERISKING INSTRUMENT
EFFECTIVENESS (BEFORE TIME EFFECT DISCOUNT44)
DISCOUNT FOR TIME
EFFECT COMMENT
Energy Market Risk
Grid Extension Compensation
37.5% [India]
25% [Kenya]
0%
Developer Risk
End-user Credit Risk
Financing Risk
Public Loan 25% 0% Interview responses: moderate effectiveness.
Partial Loan Guarantees
25% 0% Interview responses: high effectiveness
Currency Risk
Foreign Currency Partial Indexing
50% 0% Interview responses: high effectiveness
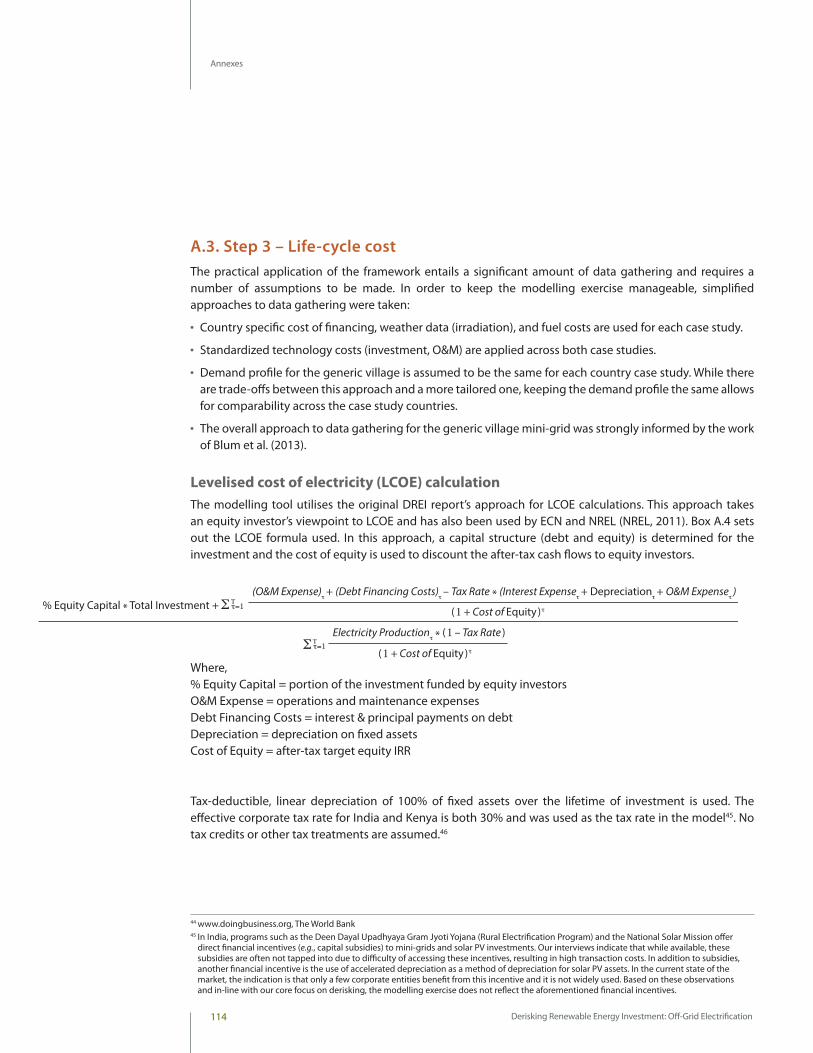
Derisking Renewable Energy Investment: Off-Grid Electrification114
Annexes
A.3. Step 3 – Life-cycle costThe practical application of the framework entails a significant amount of data gathering and requires a number of assumptions to be made. In order to keep the modelling exercise manageable, simplified approaches to data gathering were taken:
●● Country specific cost of financing, weather data (irradiation), and fuel costs are used for each case study.
●● Standardized technology costs (investment, O&M) are applied across both case studies.
●● Demand profile for the generic village is assumed to be the same for each country case study. While there are trade-offs between this approach and a more tailored one, keeping the demand profile the same allows for comparability across the case study countries.
●● The overall approach to data gathering for the generic village mini-grid was strongly informed by the work of Blum et al. (2013).
Levelised cost of electricity (LCOE) calculationThe modelling tool utilises the original DREI report’s approach for LCOE calculations. This approach takes an equity investor’s viewpoint to LCOE and has also been used by ECN and NREL (NREL, 2011). Box A.4 sets out the LCOE formula used. In this approach, a capital structure (debt and equity) is determined for the investment and the cost of equity is used to discount the after-tax cash flows to equity investors.
Tax-deductible, linear depreciation of 100% of fixed assets over the lifetime of investment is used. The effective corporate tax rate for India and Kenya is both 30% and was used as the tax rate in the model45. No tax credits or other tax treatments are assumed.46
44 www.doingbusiness.org, The World Bank 45 In India, programs such as the Deen Dayal Upadhyaya Gram Jyoti Yojana (Rural Electrification Program) and the National Solar Mission offer
direct financial incentives (e.g., capital subsidies) to mini-grids and solar PV investments. Our interviews indicate that while available, these subsidies are often not tapped into due to difficulty of accessing these incentives, resulting in high transaction costs. In addition to subsidies, another financial incentive is the use of accelerated depreciation as a method of depreciation for solar PV assets. In the current state of the market, the indication is that only a few corporate entities benefit from this incentive and it is not widely used. Based on these observations and in-line with our core focus on derisking, the modelling exercise does not reflect the aforementioned financial incentives.
Where, % Equity Capital = portion of the investment funded by equity investors O&M Expense = operations and maintenance expenses Debt Financing Costs = interest & principal payments on debt Depreciation = depreciation on fixed assets Cost of Equity = after-tax target equity IRR
% Equity Capital * Total Investment + Σ Τ τ=1
(O&M Expense)τ + (Debt Financing Costs)
τ – Tax Rate * (Interest Expense
τ + Depreciation
τ + O&M Expense
τ)
Electricity Productionτ * (1 – Tax Rate )
(1 + Cost of Equity)τ
ΣΤ τ=1(1 + Cost of Equity)τ
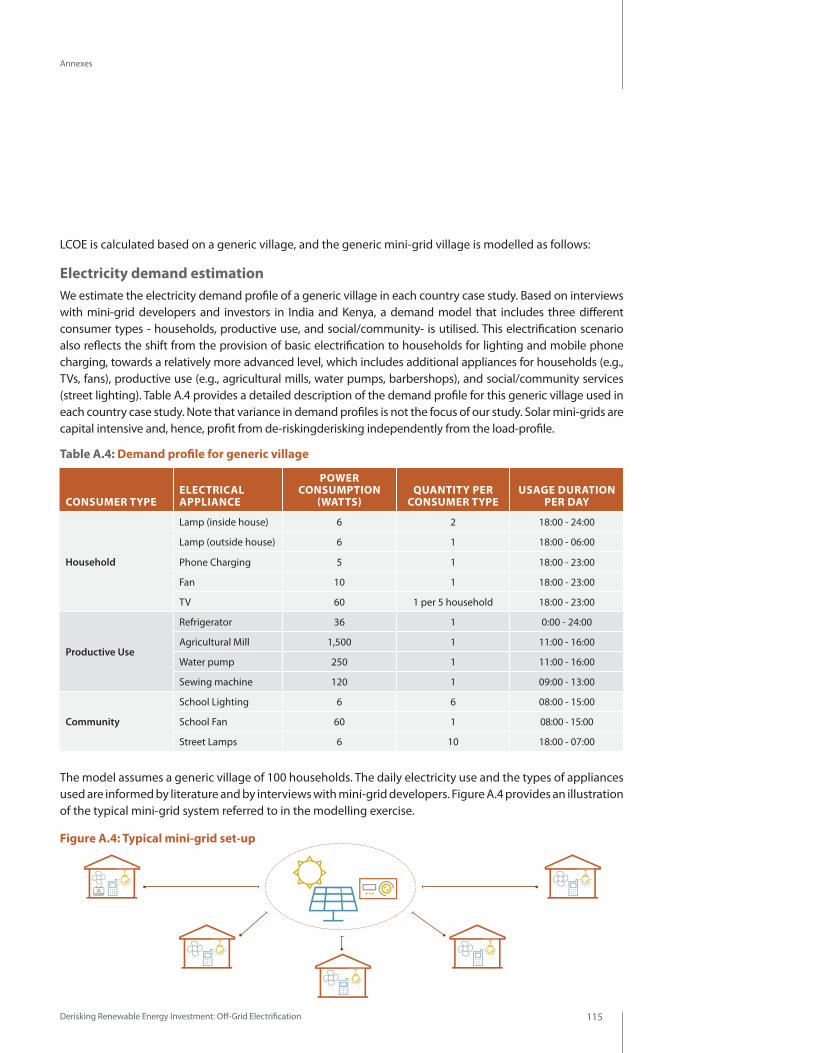
Derisking Renewable Energy Investment: Off-Grid Electrification 115
Annexes
LCOE is calculated based on a generic village, and the generic mini-grid village is modelled as follows:
Electricity demand estimationWe estimate the electricity demand profile of a generic village in each country case study. Based on interviews with mini-grid developers and investors in India and Kenya, a demand model that includes three different consumer types - households, productive use, and social/community- is utilised. This electrification scenario also reflects the shift from the provision of basic electrification to households for lighting and mobile phone charging, towards a relatively more advanced level, which includes additional appliances for households (e.g., TVs, fans), productive use (e.g., agricultural mills, water pumps, barbershops), and social/community services (street lighting). Table A.4 provides a detailed description of the demand profile for this generic village used in each country case study. Note that variance in demand profiles is not the focus of our study. Solar mini-grids are capital intensive and, hence, profit from de-riskingderisking independently from the load-profile.
The model assumes a generic village of 100 households. The daily electricity use and the types of appliances used are informed by literature and by interviews with mini-grid developers. Figure A.4 provides an illustration of the typical mini-grid system referred to in the modelling exercise.
Figure A.4: Typical mini-grid set-up
Table A.4: Demand profile for generic village
CONSUMER TYPE ELECTRICAL APPLIANCE
POWER CONSUMPTION
(WATTS)QUANTITY PER
CONSUMER TYPEUSAGE DURATION
PER DAY
Household
Lamp (inside house) 6 2 18:00 - 24:00
Lamp (outside house) 6 1 18:00 - 06:00
Phone Charging 5 1 18:00 - 23:00
Fan 10 1 18:00 - 23:00
TV 60 1 per 5 household 18:00 - 23:00
Productive Use
Refrigerator 36 1 0:00 - 24:00
Agricultural Mill 1,500 1 11:00 - 16:00
Water pump 250 1 11:00 - 16:00
Sewing machine 120 1 09:00 - 13:00
Community
School Lighting 6 6 08:00 - 15:00
School Fan 60 1 08:00 - 15:00
Street Lamps 6 10 18:00 - 07:00
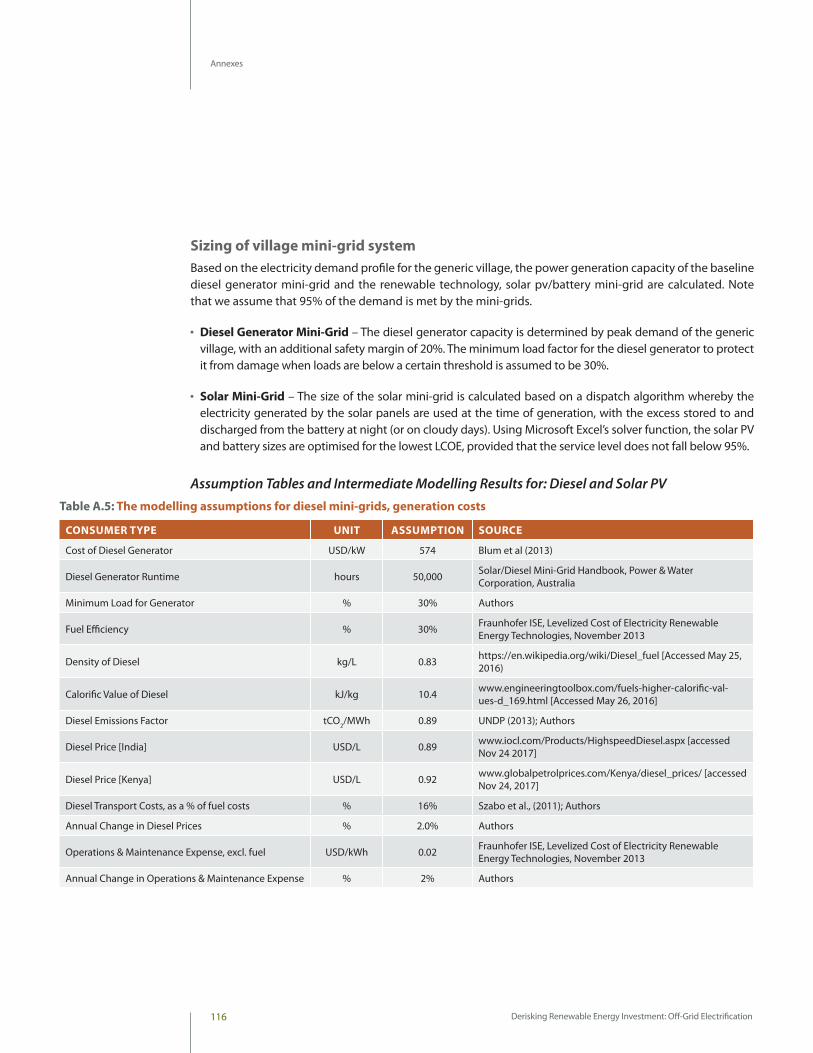
Derisking Renewable Energy Investment: Off-Grid Electrification116
Annexes
Sizing of village mini-grid systemBased on the electricity demand profile for the generic village, the power generation capacity of the baseline diesel generator mini-grid and the renewable technology, solar pv/battery mini-grid are calculated. Note that we assume that 95% of the demand is met by the mini-grids.
●● Diesel Generator Mini-Grid – The diesel generator capacity is determined by peak demand of the generic village, with an additional safety margin of 20%. The minimum load factor for the diesel generator to protect it from damage when loads are below a certain threshold is assumed to be 30%.
●● Solar Mini-Grid – The size of the solar mini-grid is calculated based on a dispatch algorithm whereby the electricity generated by the solar panels are used at the time of generation, with the excess stored to and discharged from the battery at night (or on cloudy days). Using Microsoft Excel’s solver function, the solar PV and battery sizes are optimised for the lowest LCOE, provided that the service level does not fall below 95%.
Assumption Tables and Intermediate Modelling Results for: Diesel and Solar PVTable A.5: The modelling assumptions for diesel mini-grids, generation costs
CONSUMER TYPE UNIT ASSUMPTION SOURCE
Cost of Diesel Generator USD/kW 574 Blum et al (2013)
Diesel Generator Runtime hours 50,000 Solar/Diesel Mini-Grid Handbook, Power & Water Corporation, Australia
Minimum Load for Generator % 30% Authors
Fuel Efficiency % 30% Fraunhofer ISE, Levelized Cost of Electricity Renewable Energy Technologies, November 2013
Density of Diesel kg/L 0.83 https://en.wikipedia.org/wiki/Diesel_fuel [Accessed May 25, 2016)
Calorific Value of Diesel kJ/kg 10.4 www.engineeringtoolbox.com/fuels-higher-calorific-val-ues-d_169.html [Accessed May 26, 2016]
Diesel Emissions Factor tCO2/MWh 0.89 UNDP (2013); Authors
Diesel Price [India] USD/L 0.89 www.iocl.com/Products/HighspeedDiesel.aspx [accessed Nov 24 2017]
Diesel Price [Kenya] USD/L 0.92 www.globalpetrolprices.com/Kenya/diesel_prices/ [accessed Nov 24, 2017]
Diesel Transport Costs, as a % of fuel costs % 16% Szabo et al., (2011); Authors
Annual Change in Diesel Prices % 2.0% Authors
Operations & Maintenance Expense, excl. fuel USD/kWh 0.02 Fraunhofer ISE, Levelized Cost of Electricity Renewable Energy Technologies, November 2013
Annual Change in Operations & Maintenance Expense % 2% Authors
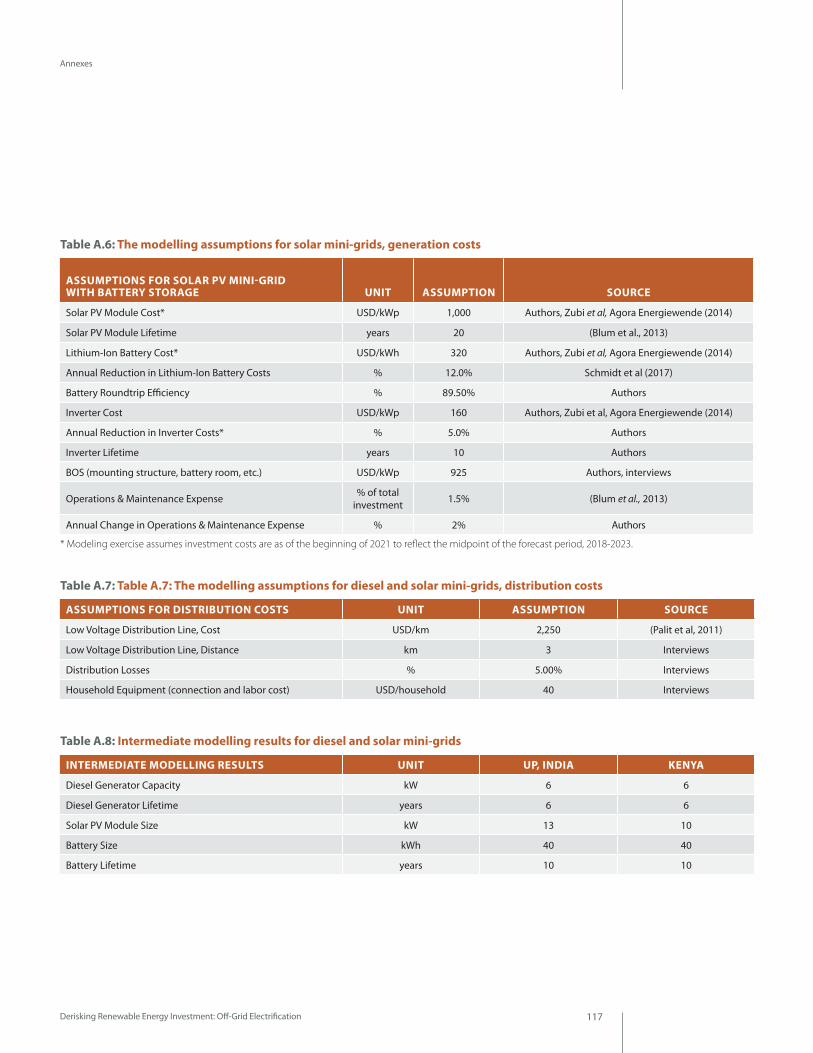
Derisking Renewable Energy Investment: Off-Grid Electrification 117
Annexes
Table A.6: The modelling assumptions for solar mini-grids, generation costs
Table A.7: Table A.7: The modelling assumptions for diesel and solar mini-grids, distribution costs
Table A.8: Intermediate modelling results for diesel and solar mini-grids
ASSUMPTIONS FOR SOLAR PV MINI-GRID WITH BATTERY STORAGE UNIT ASSUMPTION SOURCE
Solar PV Module Cost* USD/kWp 1,000 Authors, Zubi et al, Agora Energiewende (2014)
Solar PV Module Lifetime years 20 (Blum et al., 2013)
Lithium-Ion Battery Cost* USD/kWh 320 Authors, Zubi et al, Agora Energiewende (2014)
Annual Reduction in Lithium-Ion Battery Costs % 12.0% Schmidt et al (2017)
Battery Roundtrip Efficiency % 89.50% Authors
Inverter Cost USD/kWp 160 Authors, Zubi et al, Agora Energiewende (2014)
Annual Reduction in Inverter Costs* % 5.0% Authors
Inverter Lifetime years 10 Authors
BOS (mounting structure, battery room, etc.) USD/kWp 925 Authors, interviews
Operations & Maintenance Expense % of total investment 1.5% (Blum et al., 2013)
Annual Change in Operations & Maintenance Expense % 2% Authors
ASSUMPTIONS FOR DISTRIBUTION COSTS UNIT ASSUMPTION SOURCE
Low Voltage Distribution Line, Cost USD/km 2,250 (Palit et al, 2011)
Low Voltage Distribution Line, Distance km 3 Interviews
Distribution Losses % 5.00% Interviews
Household Equipment (connection and labor cost) USD/household 40 Interviews
INTERMEDIATE MODELLING RESULTS UNIT UP, INDIA KENYA
Diesel Generator Capacity kW 6 6
Diesel Generator Lifetime years 6 6
Solar PV Module Size kW 13 10
Battery Size kWh 40 40
Battery Lifetime years 10 10
* Modeling exercise assumes investment costs are as of the beginning of 2021 to reflect the midpoint of the forecast period, 2018-2023.
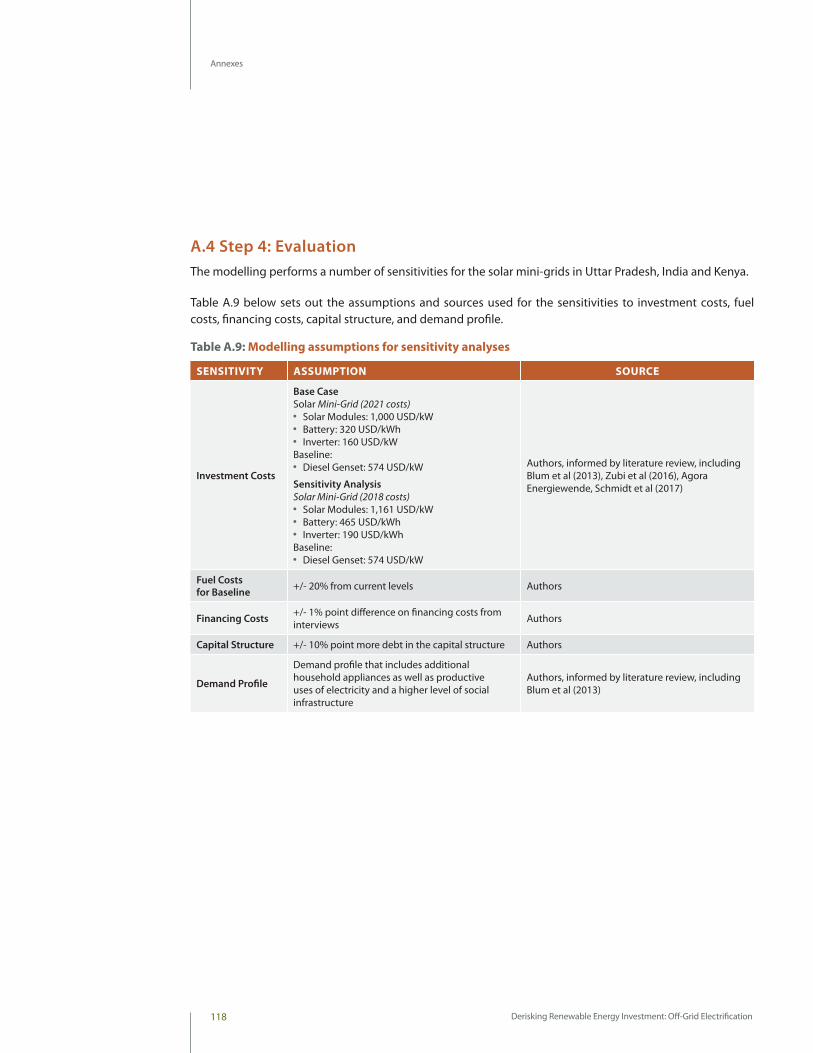
Derisking Renewable Energy Investment: Off-Grid Electrification118
Annexes
A.4 Step 4: EvaluationThe modelling performs a number of sensitivities for the solar mini-grids in Uttar Pradesh, India and Kenya.
Table A.9 below sets out the assumptions and sources used for the sensitivities to investment costs, fuel costs, financing costs, capital structure, and demand profile.
Table A.9: Modelling assumptions for sensitivity analyses
SENSITIVITY ASSUMPTION SOURCE
Investment Costs
Base Case Solar Mini-Grid (2021 costs)
●● Solar Modules: 1,000 USD/kW●● Battery: 320 USD/kWh●● Inverter: 160 USD/kW
Baseline: ●● Diesel Genset: 574 USD/kW
Sensitivity AnalysisSolar Mini-Grid (2018 costs)
●● Solar Modules: 1,161 USD/kW●● Battery: 465 USD/kWh●● Inverter: 190 USD/kWh
Baseline:●● Diesel Genset: 574 USD/kW
Authors, informed by literature review, including Blum et al (2013), Zubi et al (2016), Agora Energiewende, Schmidt et al (2017)
Fuel Costs for Baseline +/- 20% from current levels Authors
Financing Costs +/- 1% point difference on financing costs from interviews Authors
Capital Structure +/- 10% point more debt in the capital structure Authors
Demand Profile
Demand profile that includes additional household appliances as well as productive uses of electricity and a higher level of social infrastructure
Authors, informed by literature review, including Blum et al (2013)
Derisking Renewable Energy Investment: Off-Grid Electrification 119
Annexes
Annex B: ReferencesAgenbroad, J., Carlin, K., Doig, S., Henly, C., Wanless, E., 2017. Energy Within Reach: Growing the minigrid market in sub-Saharan Africa.
Alstone, P., Gershenson, D., Kammen, D.M., 2015. Decentralized energy systems for clean electricity access. Nat. Clim. Chang. 5, 305–314
Aswath Damodaran, 2017. Country Default Spreads and Risk Premiums [WWW Document]. URL http://pages.stern.nyu.edu/~adamodar/New_Home_Page/datafile/ctryprem.html
Banerjee, S.G., Barnes, D., Singh, B., Mayer, K., Samad, H., 2015. Power for All: Electricity Access Challenge in India. The World Bank, Washington DC.
Bhattacharyya, S.C., 2013. To regulate or not to regulate off-grid electricity access in developing countries. Energy Policy 63, 494–503.
Blodgett, C., Moder, E., Kickham, L., Leaf, H., 2017. Financing the Future of Rural Electrification: Achieving Mini-Grid Scalability in Kenya. Seattle, WA, USA.
Blodgett, C., Moder, E., Kickham, L., Leaf, H., 2016. Powering Productivity: Early Insights into Mini Grid Operations in Rural Kenya. Seattle, WA, USA.
Blum, N.U., Sryantoro Wakeling, R., Schmidt, T.S., 2013. Rural electrification through village grids - Assessing the cost competitiveness of isolated renewable energy technologies in Indonesia. Renew. Sustain. Energy Rev. 22, 482–496.
BNEF, 2018. 4Q 2018 Off-Grid and Mini-Grid Market Outlook. Bloomberg New Energy Finance (BNEF), New York.
BNEF, 2017. New Energy Outlook. Bloomberg New Energy Finance (BNEF), New York.
BNEF, 2016. Financing India’s Clean Energy Transition. Bloomberg New Energy Finance (BNEF), New York
Comello, S.D., Reichelstein, S.J., Sahoo, A., Schmidt, T.S., 2017. Enabling Mini-Grid Development in Rural India. World Dev. 93, 94–107.
Filippini, M., 1998. Are Municipal Electricity Distribution Utilities Natural Monopolies? Ann. Public Coop. Econ. 69, 157–174.
Geddes, A., Schmidt, T.S., Steffen, B., 2018. The multiple roles of state investment banks in low-carbon energy finance: An analysis of Australia, the UK and Germany. Energy Policy 115, 158–170.
Gershenson, D., Tilleard, M., Cusack, J., Cooper, D., Monk, A., Kammen, D., 2015. Increasing Private Capital Investment into Energy Access: The Case for Mini-Grid Pooling Facilities. United Nations Environment Programme, Paris
Glemarec, Y., Bayat-Renoux, F., Waissbein, O., 2016. Removing barriers to women entrepreneurs’ engagement in decentralized sustainable energy solutions for the poor.
Global LEAP, 2016. The State of the Global Off-Grid Appliance Market. Global Lighting and Energy Access Partnership (Global LEAP).
Derisking Renewable Energy Investment: Off-Grid Electrification120
Annexes
Hall, S., Foxon, T.J., Bolton, R., 2017. Investing in low-carbon transitions: energy finance as an adaptive market. Clim. Policy 17, 280–298.
IEA, 2017. Energy Access Outlook 2017. The International Energy Agency (IEA), Paris.
IEA, 2011. Energy for all: financing access for the poor, Special early excerpt of World Energy Outlook 2011. The International Energy Agency (IEA), Paris.
IEA and World Bank, 2017. Sustainable Energy for All 2017—Progress toward Sustainable Energy. The International Energy Agency (IEA), Paris and World Bank, Washington, DC.
IEA, World Bank, 2015. “Sustainable Energy for All 2015—Progress Toward Sustainable Energy. The International Energy Agency (IEA), Paris and World Bank, Washington, DC.
IED, 2013. Low Carbon Mini Grids: Identifying the gaps and building the evidence base on low carbon mini-grids. Support Study for DFID. Innovation Energie Développement, Francheville, France.
IRENA, 2016. Solar PV in Africa: Costs and Markets. International Renewable Energy Agency (IRENA), Abu Dhabi.
IRENA, 2015. Renewable Power Generation Costs in 2014. International Renewable Energy Agency (IRENA), Bonn.
IRENA, 2012. Renewable Energy Technologies Cost Analysis Series: Solar Photovoltaics. International Renewable Energy Agency (IRENA), Abu Dhabi.
ISO, 2009. ISO Guide 73, Risk Management – Vocabulary. Geneva, Switzerland: International Standardization Organization.
Jain, A., Urpelainen, J., Stevens, L., 2016. Measuring Energy Access in India. Practical Action Publishing Ltd, The Schumacher Centre, Bourton on Dunsmore, Rugby, Warwickshire CV23 9QZ, UK.
Kavlak, G., McNerney, J., Trancik, J.E., 2016. Evaluating the Changing Causes of Photovoltaics Cost Reduction. SSRN Electron.
Khurana, M., Banerjee, S.G., 2015. Beyond Crisis : The Financial Performance of India’s Power Sector. World Bank Study. Washington, DC: World Bank.
Kittner, N., Lill, F., Kammen, D.M., 2017. Energy storage deployment and innovation for the clean energy transition. Nat. Energy 2, 17125.
Komives, K., Halpern, J., Foster, V., Wodon, Q., Abdullah, R., 2007. Utility Subsidies as Social Transfers: An Empirical Evaluation of Targeting Performance. Dev. Policy Rev. 25, 659–679.
Malhotra, A., Schmidt, T.S., Haelg, L., Waissbein, O., 2017. Scaling up finance for off-grid renewable energy: The role of aggregation and spatial diversification in derisking investments in mini-grids for rural electrification in India. Energy Policy 108.
NREL, 2011. Renewable Energy Cost Modeling: A Toolkit for Establishing Cost-Based Incentives in the United States. Golden, Colorado.
Orlandi, I., McCrone, A., Battley, D., Tyabji, N., Falzon, J., Lerner, A., 2016. How can pay-as-you-go solar be financed? Bloomberg New Energy Finance, London, UK.
Derisking Renewable Energy Investment: Off-Grid Electrification 121
Annexes
Pueyo, A., 2013. The Evidence of Benefits for Poor People of Increased Renewable Electricity Capacity: Literature Review. Institute of Development Studies (IDS), IDS Evidence Report 31, Brighton.
Ricciardi, V., 2008. The Psychology of Risk: The Behavioral Finance Perspective, in: Handbook of Finance. John Wiley & Sons, Inc., Hoboken, NJ, USA.
Riva, F., Ahlborg, H., Hartvigsson, E., Pachauri, S. and Colombo, E., 2018. Electricity access and rural development: Review of complex socio-economic dynamics and casual diagrams for more appropriate energy modelling. Energy for Sustainable Development, 43, pp.203-223.
Schmidt, T., 2015. Will private-sector finance support off-grid energy?, in: Heap, R. (Ed.), Smart Villages: New Thinking for off-Grid Communities Worldwide. Cambridge: Banson, pp. 81–87.
Schmidt, T.S., Blum, N.U., Sryantoro Wakeling, R., 2013. Attracting private investments into rural electrification — A case study on renewable energy based village grids in Indonesia. Energy Sustain. Dev. 17, 581–595.
Schmidt, T.S., Matsuo, T., Michaelowa, A., 2017. Renewable energy policy as an enabler of fossil fuel subsidy reform? Applying a socio-technical perspective to the cases of South Africa and Tunisia. Glob. Environ. Chang. 45, 99–110.
SDFA, 2018. Digital Technologies for Mobilizing Sustainable Finance. Applications of Digitial Technologies to Sustainable Finance. Sustainable Digital Finance Alliance (SDFA), New York.
SEforAll, 2017. Understanding the Landscape. Sustainable Energy for All (SEforAll), Washington DC.
SolarAid, 2014. Kenya Country Report 2014: SolarAid report of SunnyMoney activity in Kenya. Nairobi, Kenya.
Tenenbaum, B., Greacen, C., Siyambalapitiya, T., Knuckles, J., 2014. From the Bottom Up:How Small Power Producers and Mini-Grids Can Deliver Electrification and Renewable Energy in Africa. The World Bank.
UN, 2013. Sustainable Energy For All Initiative [WWW Document]. URL www.sustainableenergyforall.org/
UNCTAD, 2014. World Investment Report 2014 - Investing in the SDGs: An Action Plan. United Nations Conference on Trade and Development, Geneva.
UNDP, 2016. Delivering Sustainable Energy in a Changing Climate: Strategy Note on Sustainable Energy 2017-2021. United Nations Development Programme (UNDP). New York
UNDP, 2013. Derisking Renewable Energy Investments. United Nations Development Programme (UNDP). New York.
WB, 2018. Tracking SDG 7: The Energy Progress Report 2018. The World Bank (WB), Washington DC.
WB, 2011. The Scope for MDB Leverage and Innovation in Climate Finance. The World Bank (WB), Washington DC.
World Bank and BNEF, 2016. Off-grid Solar Market Trends Report 2016. Washington DC/London.
Zerriffi, H., 2011. Innovative business models for the scale-up of energy access efforts for the poorest. Curr. Opin. Environ. Sustain. 3, 272–278.
United Nations Development Programme Bureau for Programming and Policy Support 304 East 45th Street, New York, NY 10017 USA
www.undp.org
December 2018, New York
ETH Zürich, Energy Politics Group Haldeneggsteig 4 CH-8092 Zurich, Switzerland
www.epg.ethz.ch
Recommended