Presentation 1 Venn Diagrams: ExamplePresentation 2 Venn Diagrams: Key DefinitionsPresentation 3 Venn Diagrams: Illustrating SetsPresentation 4 Venn Diagrams: Theoretical ExamplePresentation 5 Venn Diagram: Practical Example
Venn Diagram: Example
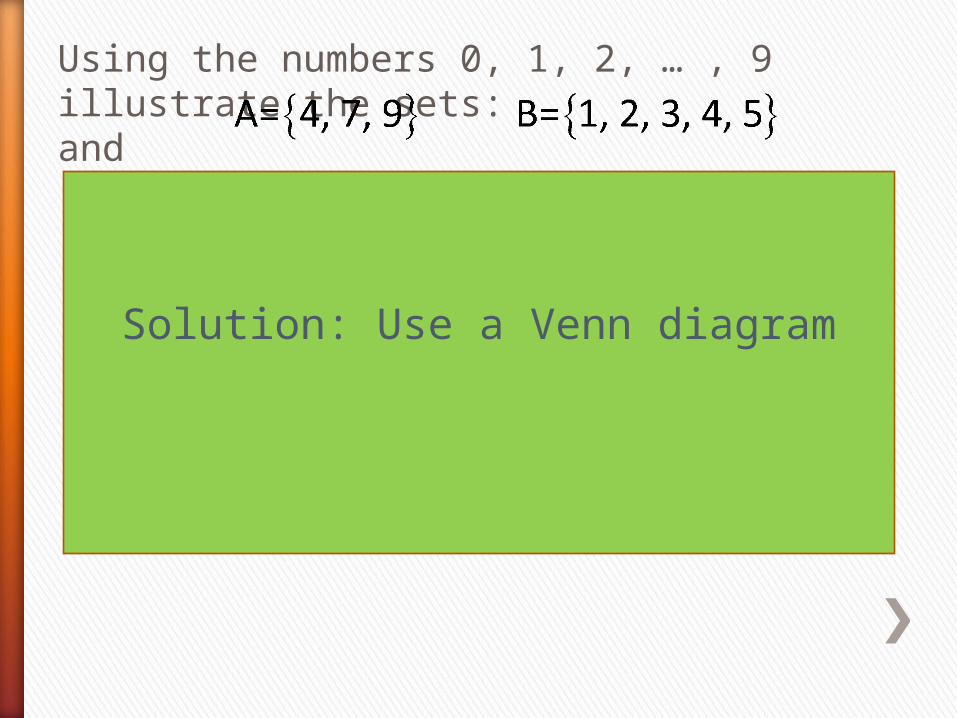
Using the numbers 0, 1, 2, … , 9 illustrate the sets: and
Solution: Use a Venn diagram
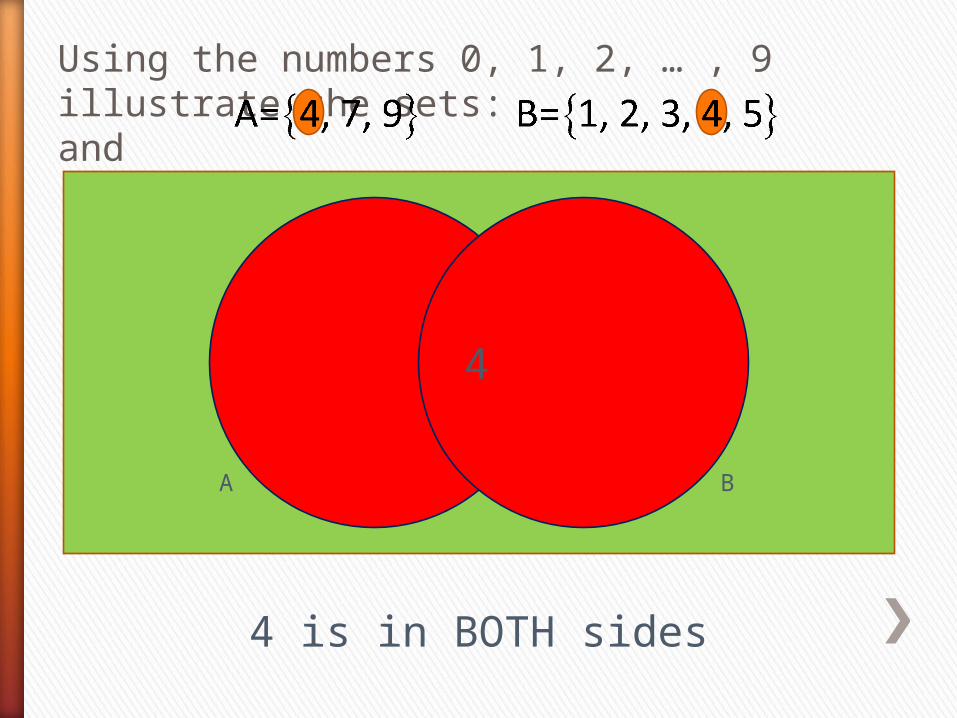
Using the numbers 0, 1, 2, … , 9 illustrate the sets: and
A B
4 is in BOTH sides
4
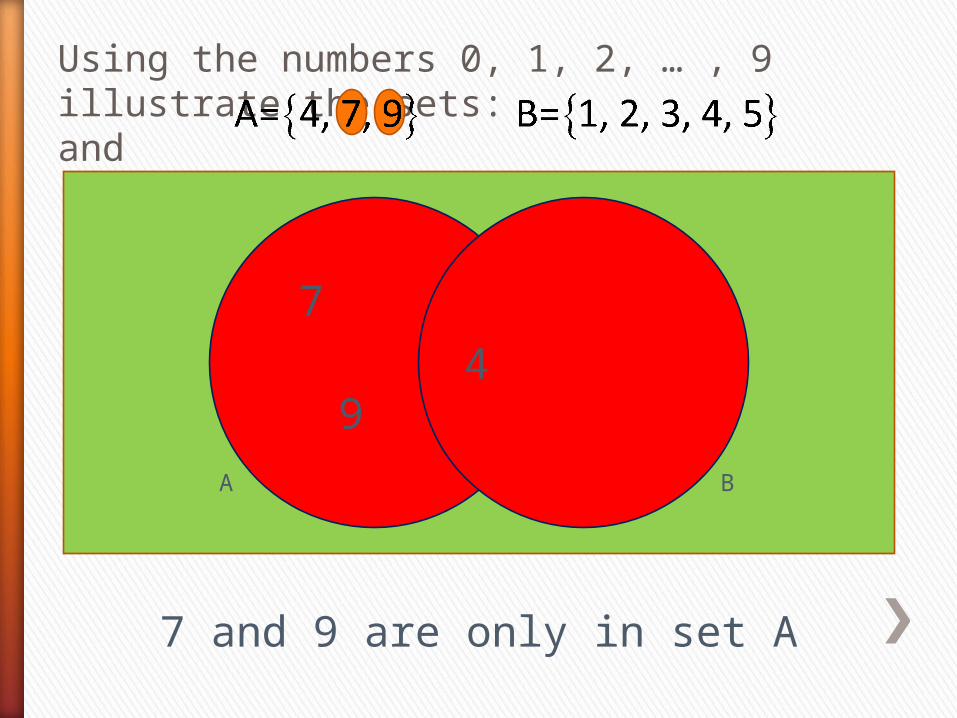
Using the numbers 0, 1, 2, … , 9 illustrate the sets: and
A B
7 and 9 are only in set A
47
9
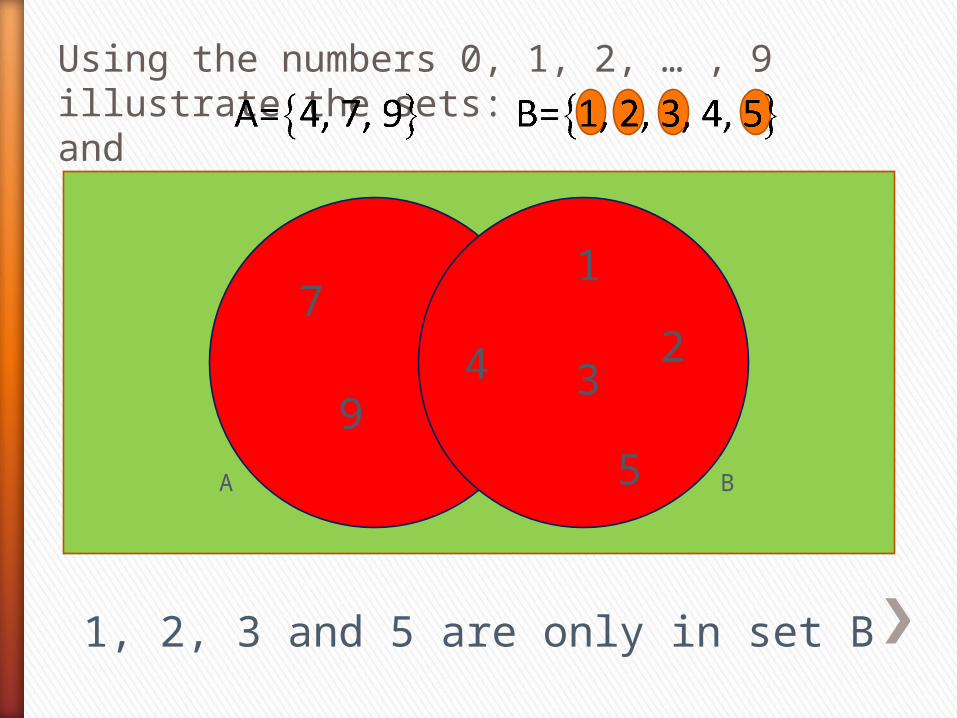
Using the numbers 0, 1, 2, … , 9 illustrate the sets: and
A B
1, 2, 3 and 5 are only in set B
47
9
1
23
5

Using the numbers 0, 1, 2, … , 9 illustrate the sets: and
A B
0, 6 and 8 are not in A or B
47
9
1
23
5
0
6
8
You have finished viewing the presentationVenn Diagrams: Example
Please choose an option
Return to the StartPresentation 2 Venn Diagrams: Key DefinitionsPresentation 3 Venn Diagrams: Illustrating SetsPresentation 4 Venn Diagrams: Theoretical ExamplePresentation 5 Venn Diagram: Practical Example
Venn Diagram: Key Definitions

A B
Intersection: Members of both set A and set B
A B
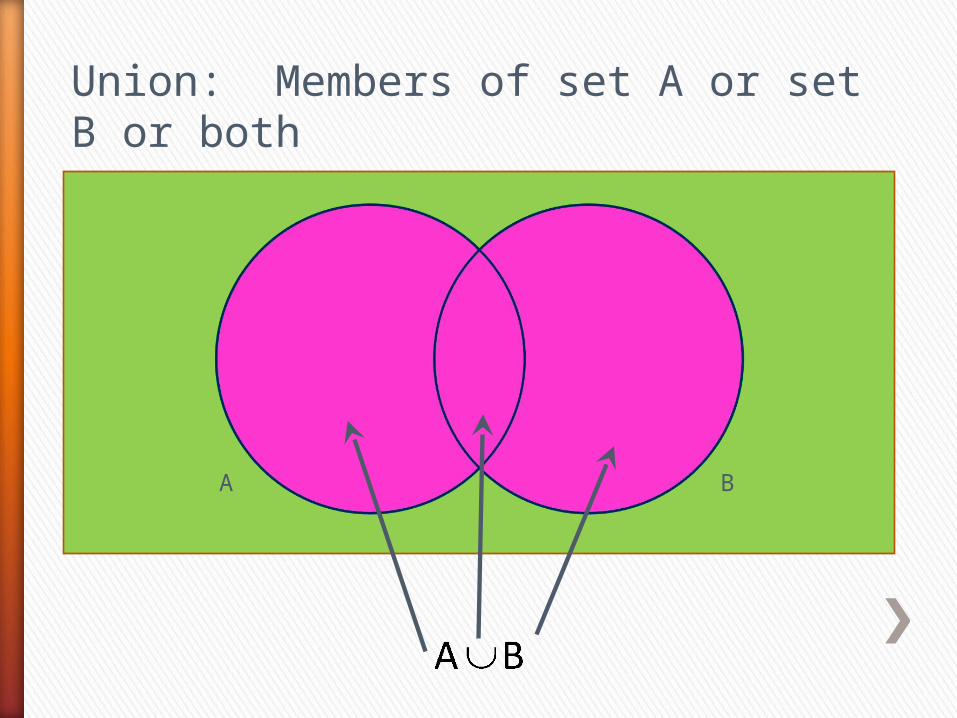
Union: Members of set A or set B or both

Complementary: Members not in the set
A
A’
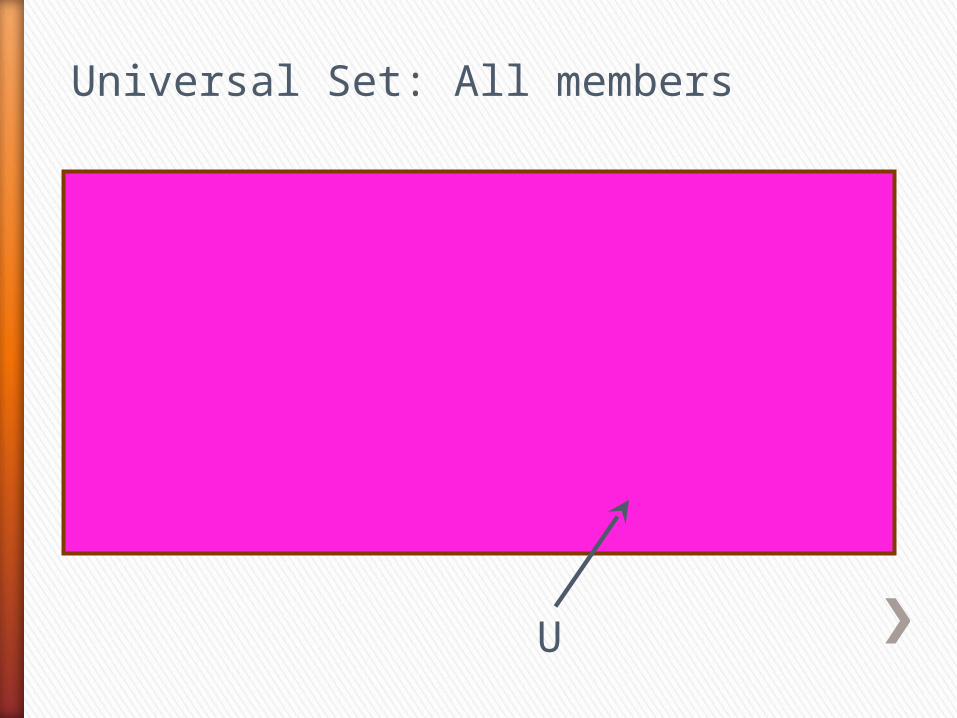
Universal Set: All members
U
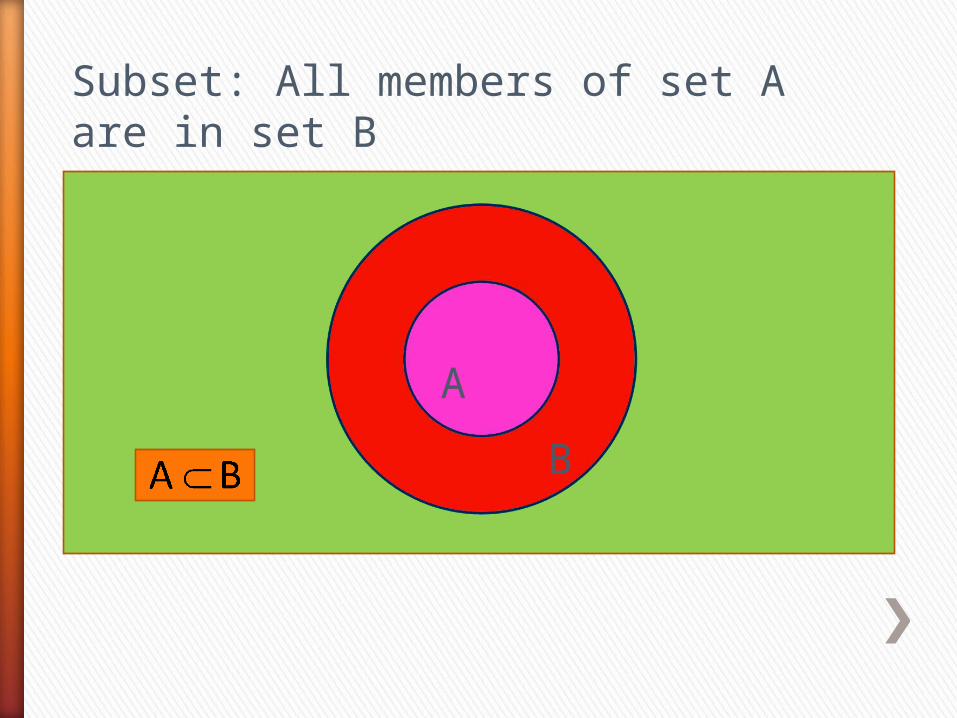
A
B
Subset: All members of set A are in set B
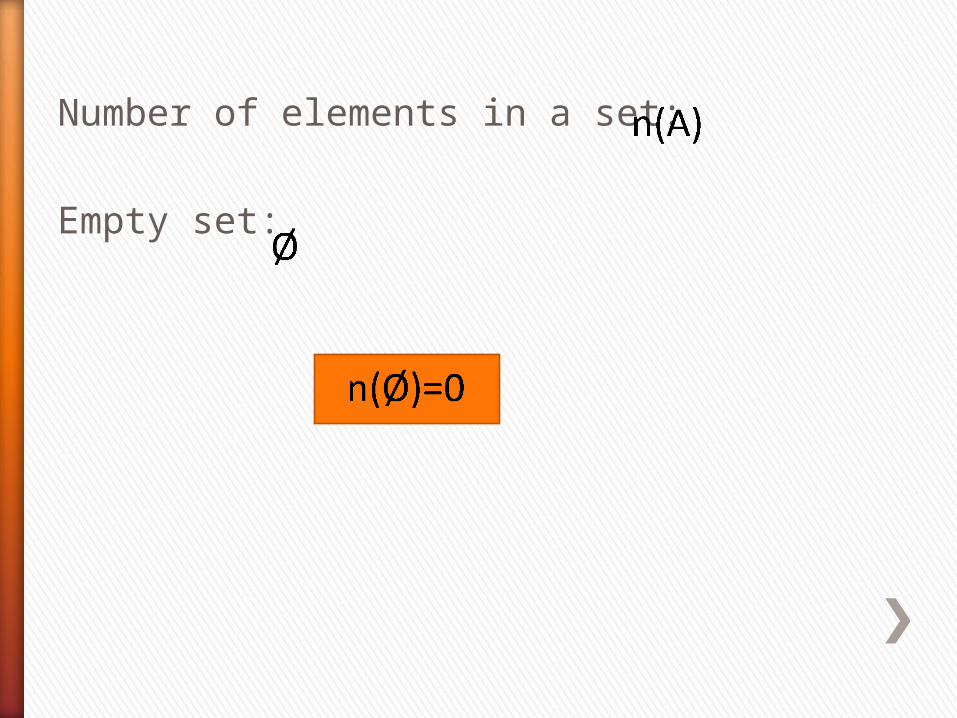
Number of elements in a set:
Empty set:
You have finished viewing the presentationVenn Diagrams: Key Definitions
Please choose an option
Return to the StartPresentation 1 Venn Diagrams: ExamplePresentation 3 Venn Diagrams: Illustrating SetsPresentation 4 Venn Diagrams: Theoretical ExamplePresentation 5 Venn Diagram: Practical Example

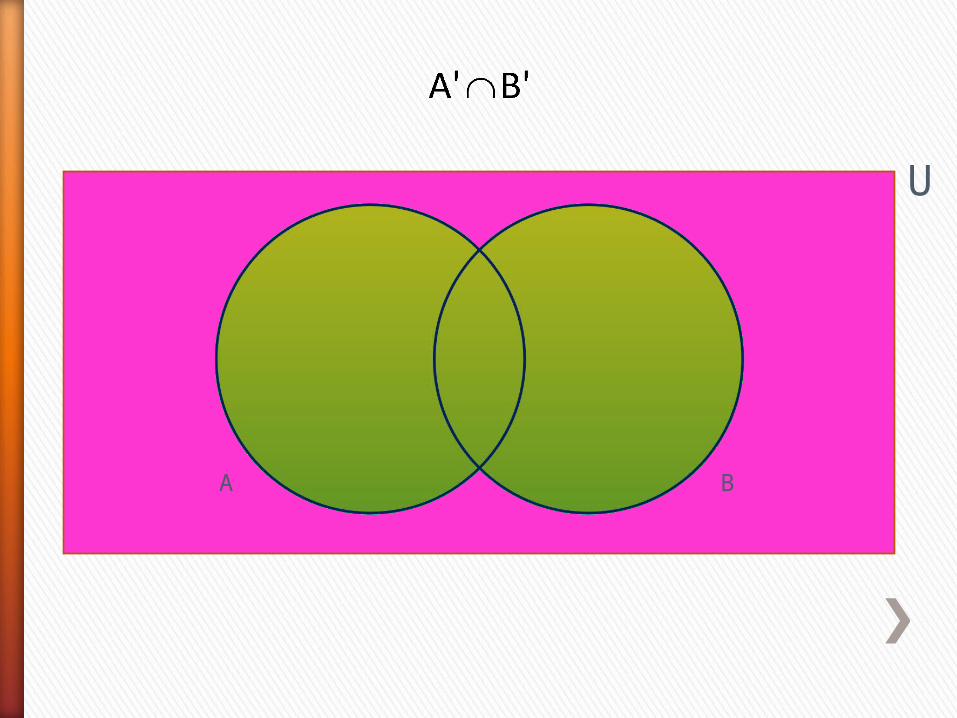
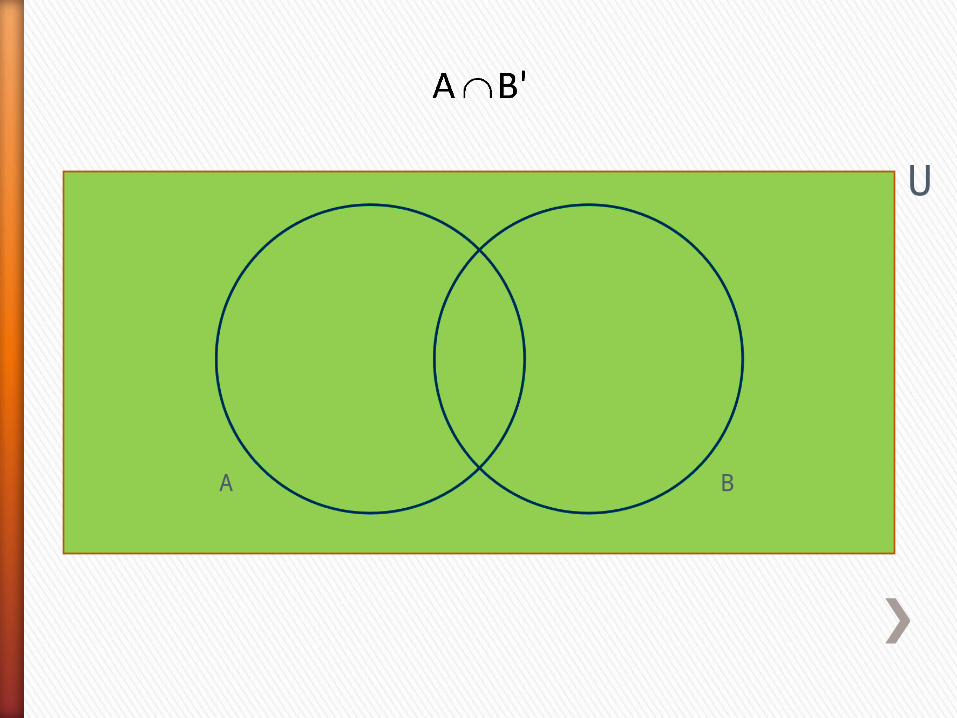
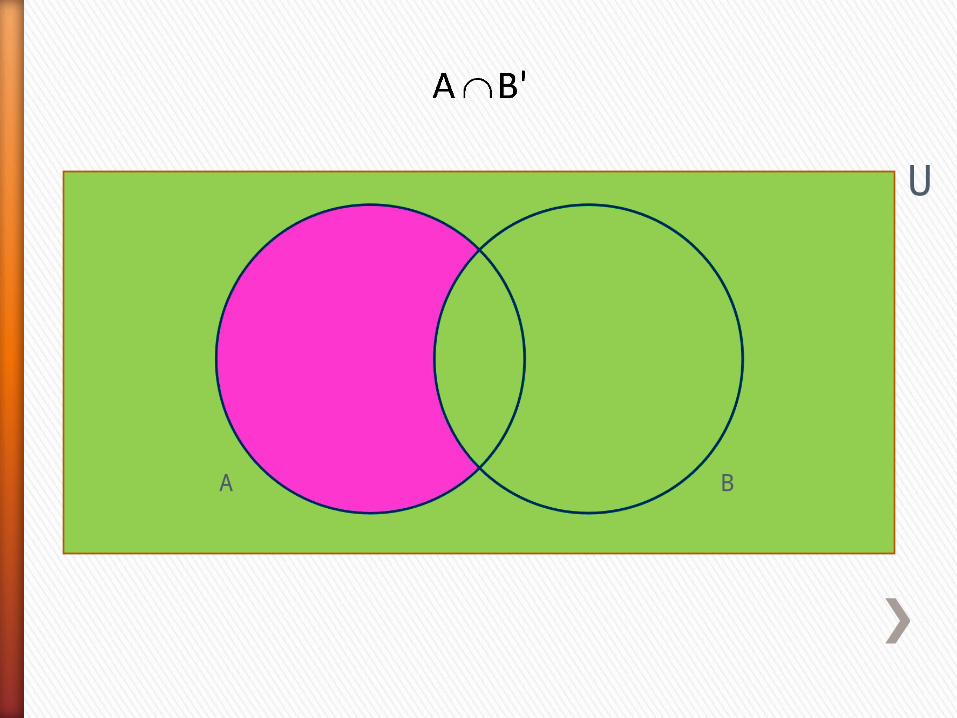
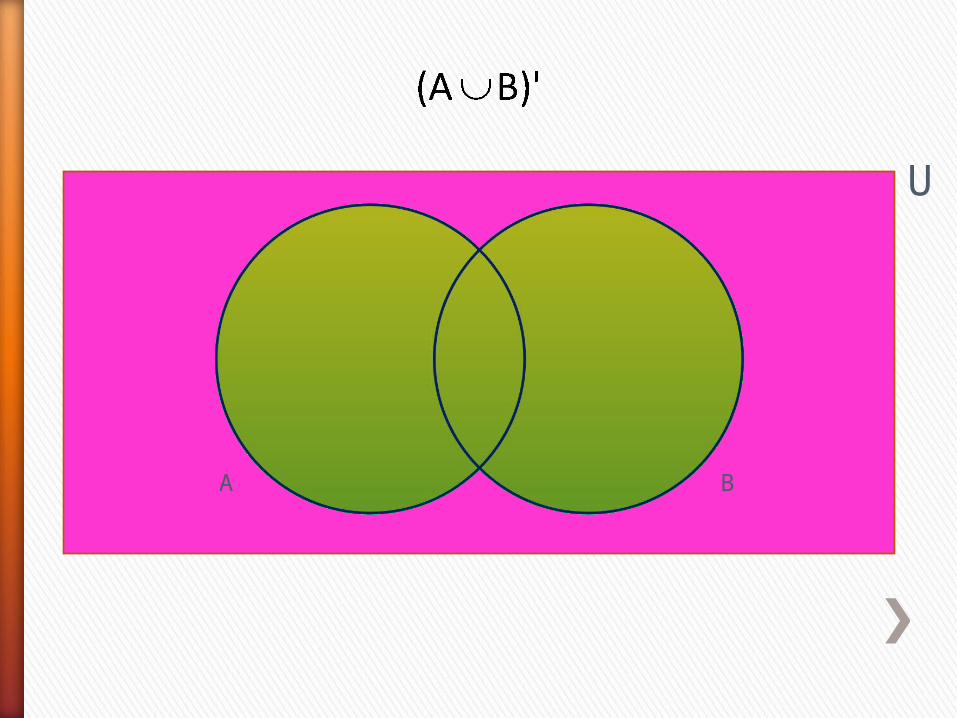
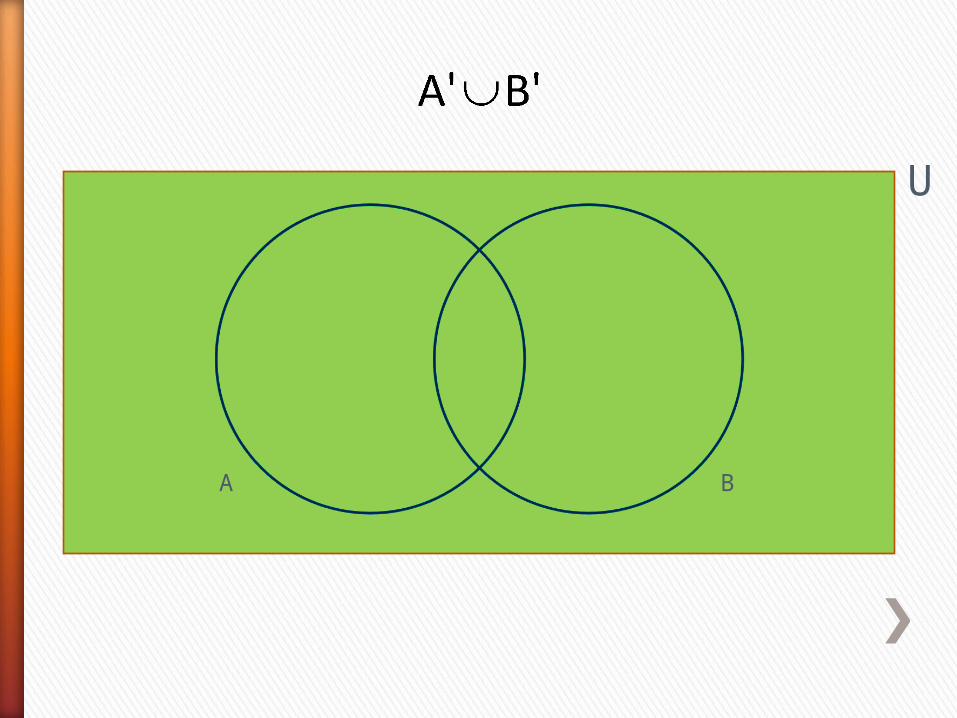
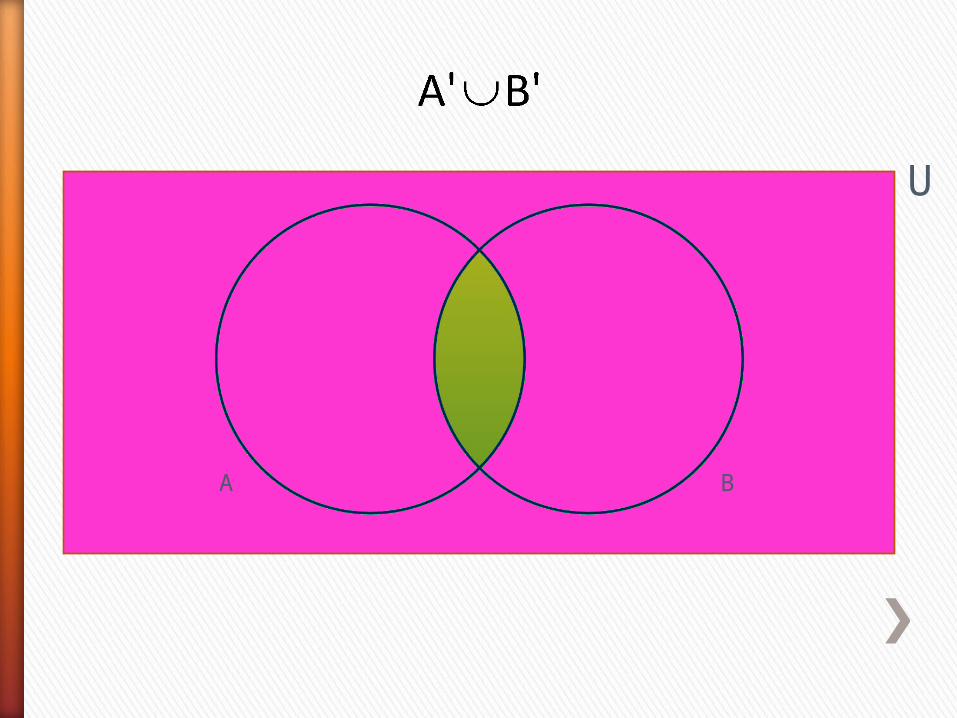
Venn Diagrams: Illustrating Sets
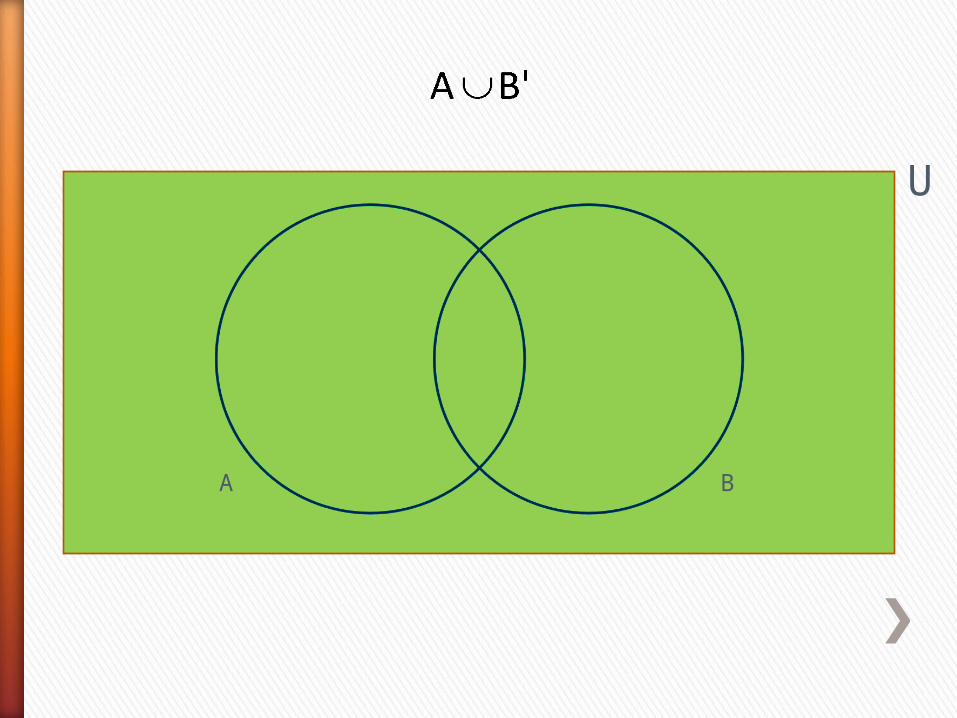
A B
U
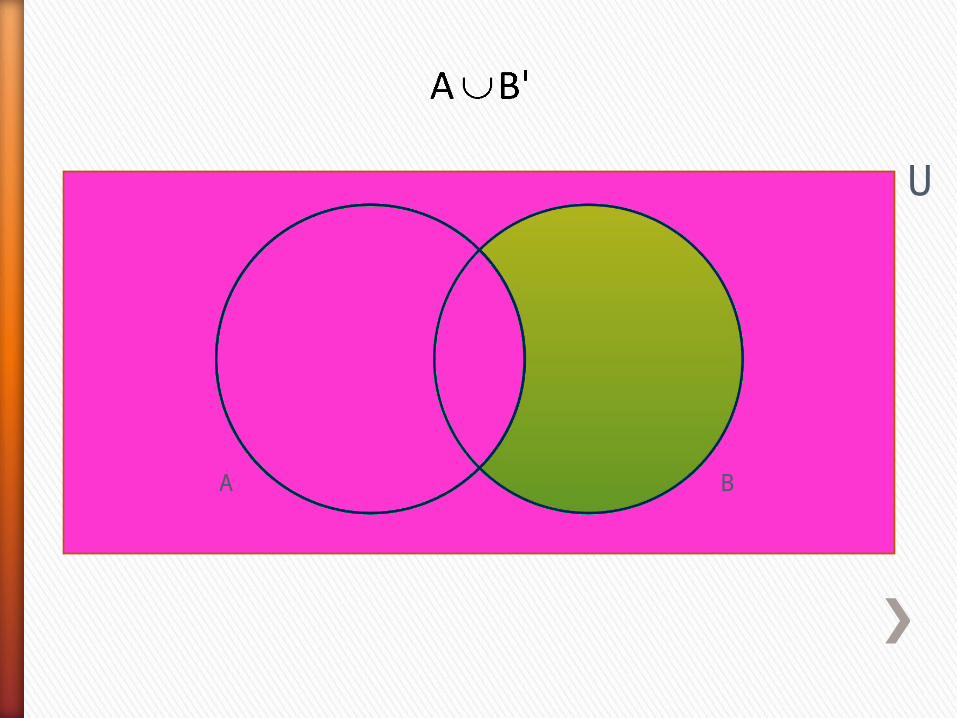
A B
U

A B
U
A B
U
A B
U
A B
U

A B
U
A B
U
A B
U
A B
U
You have finished viewing the presentationVenn Diagrams: Illustrating Sets
Please choose an option
Return to the StartPresentation 1 Venn Diagrams: ExamplePresentation 2 Venn Diagrams: Key DefinitionsPresentation 4 Venn Diagrams: Theoretical ExamplePresentation 5 Venn Diagram: Practical Example
Venn Diagrams: Theoretical Example
A B
U
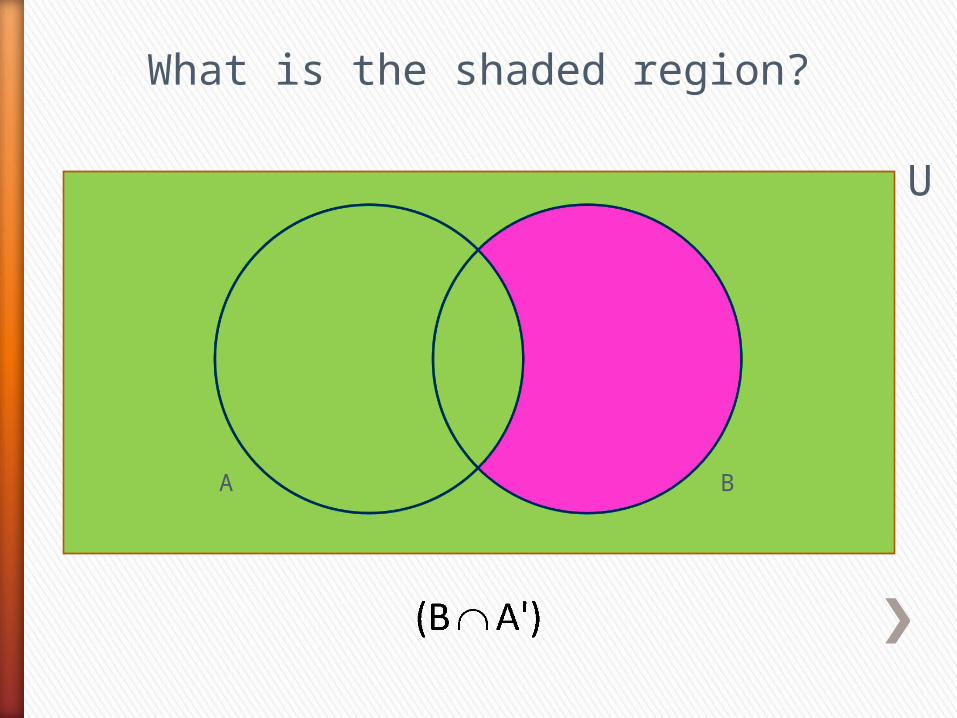
What is the shaded region?
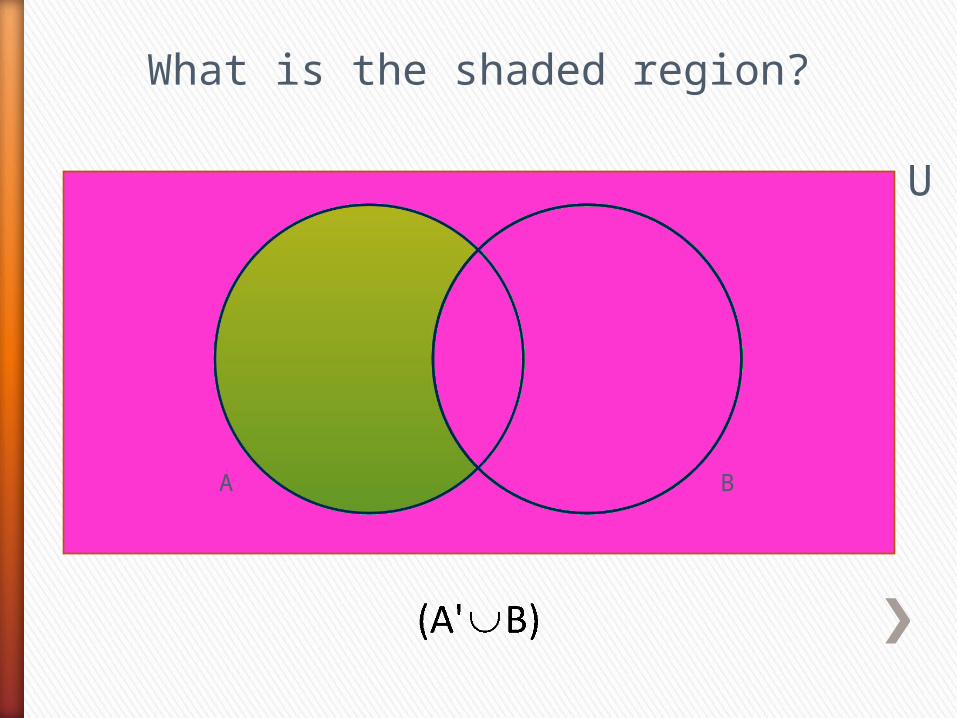
A B
U
What is the shaded region?
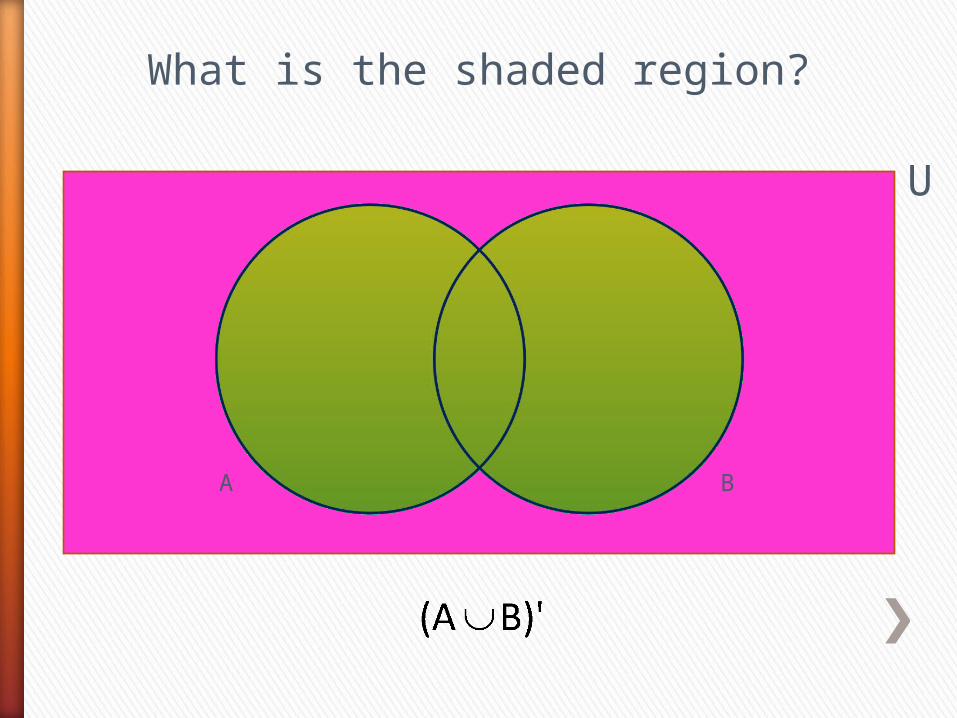
A B
U
What is the shaded region?
A BU
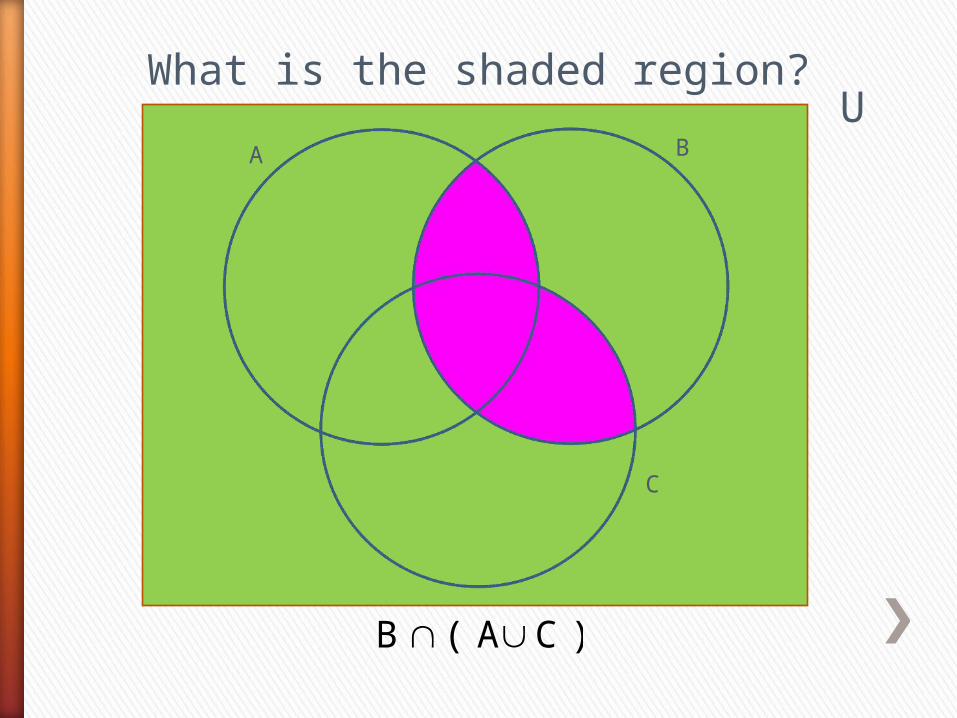
What is the shaded region?
C
) C A ( B
A BU
What is the shaded region?
C
)' C B A (
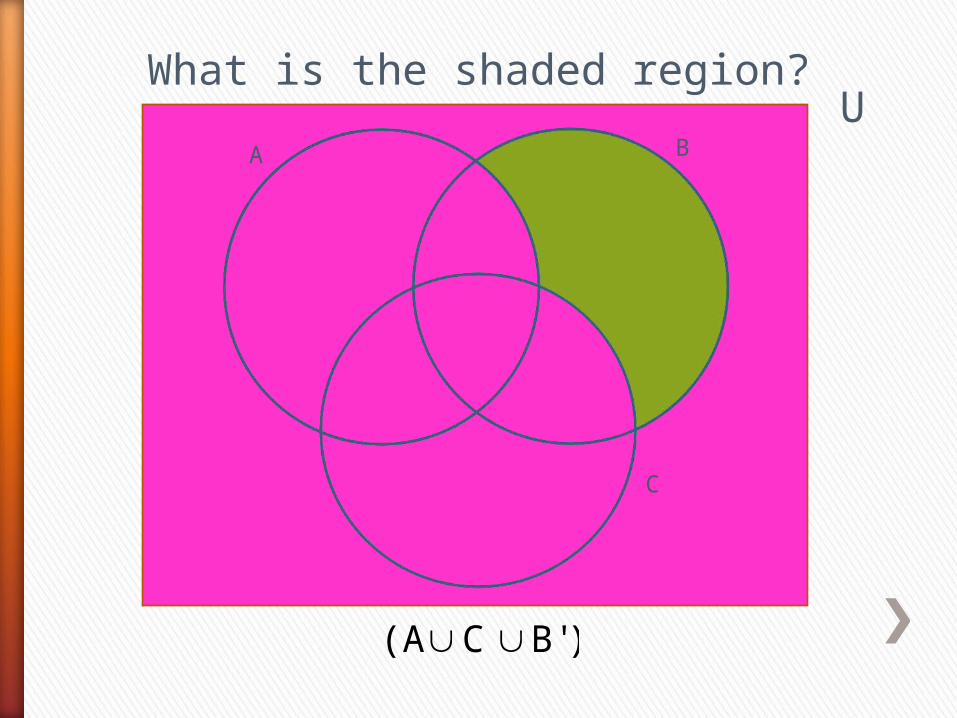
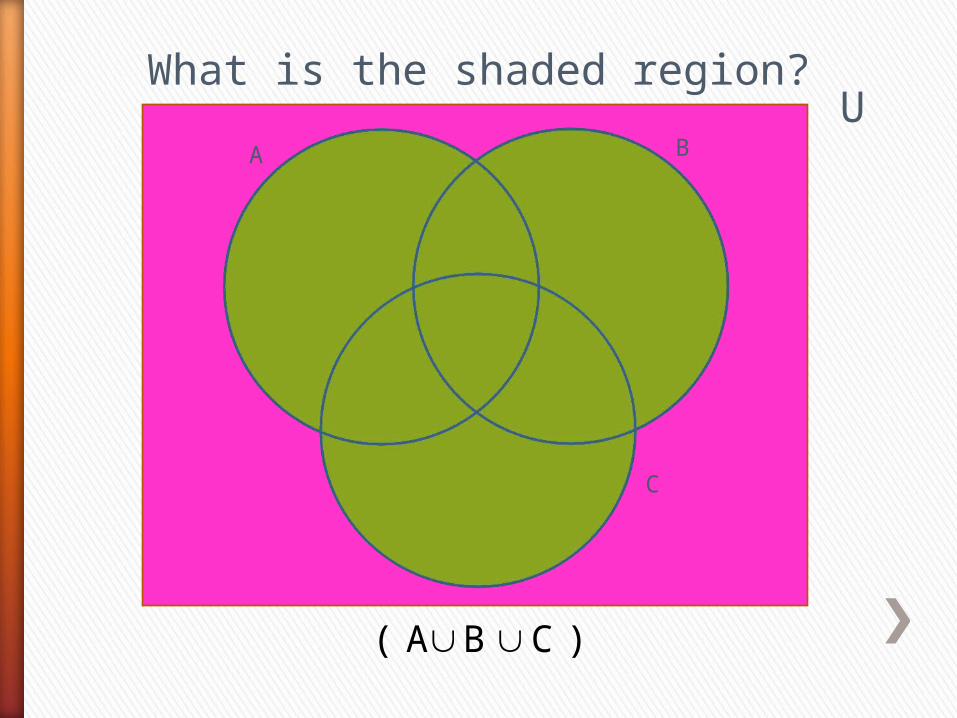
A BU
What is the shaded region?
C
)B' C (A

You have finished viewing the presentationVenn Diagrams: Theoretical Example
Please choose an option
Return to the StartPresentation 1 Venn Diagrams: ExamplePresentation 2 Venn Diagrams: Key DefinitionsPresentation 3 Venn Diagrams: Illustrating SetsPresentation 5 Venn Diagrams: Practical Example
Venn Diagram: Practical Example
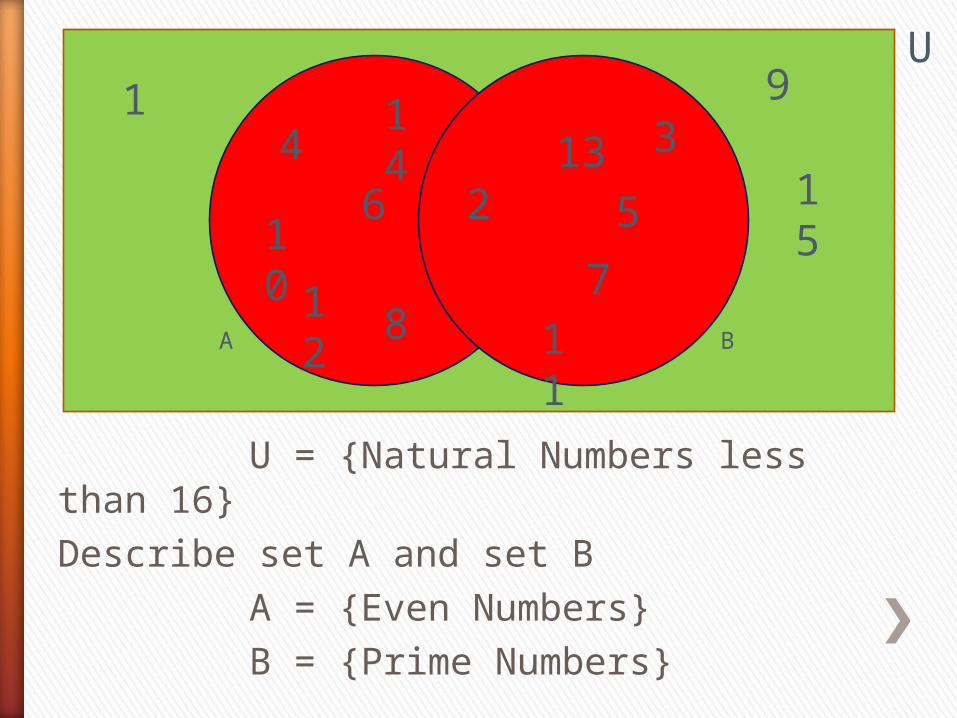
U = {Natural Numbers less than 16}Describe set A and set B
A = {Even Numbers}B = {Prime Numbers}
A B
4
10
14
6
12 8
213
57
3
11
1
15
9U
U
28
20
14
1626
1218 24
30
10
25
15
21
27
13
19
11
29
17
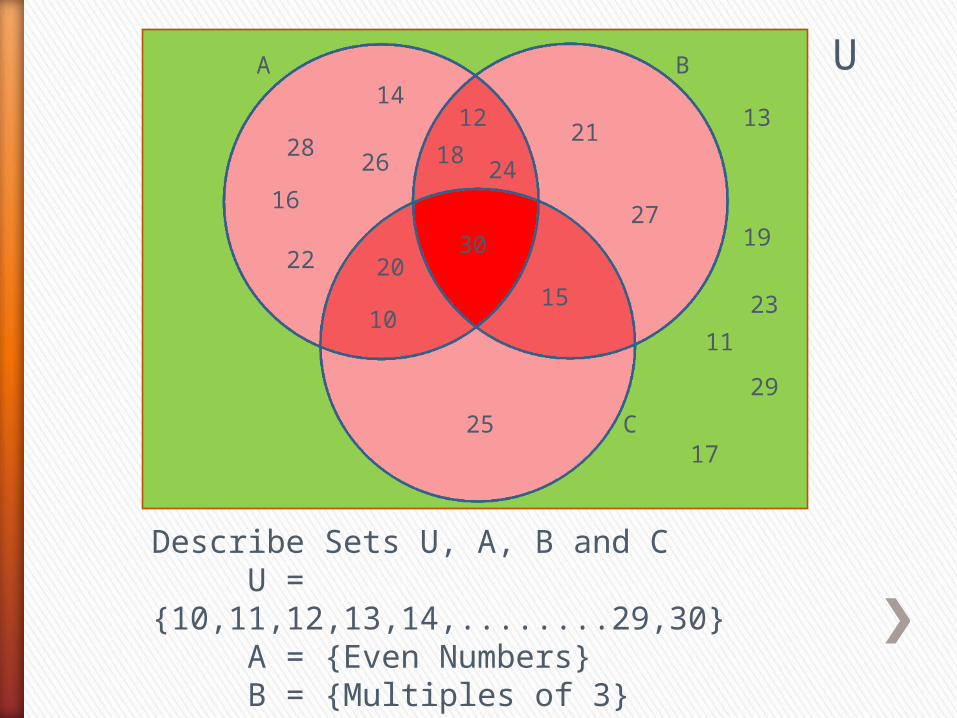
Describe Sets U, A, B and C
U = {10,11,12,13,14,........29,30}A = {Even Numbers}B = {Multiples of 3}C = {Multiples of 5}
C
BA
22
23

You have finished viewing the presentationVenn Diagrams: Practical Example
Please choose an option
Return to the StartPresentation 1 Venn Diagrams: ExamplePresentation 2 Venn Diagrams: Key DefinitionsPresentation 3 Venn Diagrams: Illustrating SetsPresentation 4 Venn Diagrams: Theoretical Example
Recommended