Southeastern Security for Enterprise and Infrastructure (SENSEI) Center
CS 5410 - Computer and Network Security:
Cellular Network Security
Professor Kevin ButlerFall 2015

Southeastern Security for Enterprise and Infrastructure (SENSEI) Center
Reminders• Poster showcase next Monday
• For final project: turn in all of your code, plus a makefile and instructions on how to run it
2

Southeastern Security for Enterprise and Infrastructure (SENSEI) Center
Unintended Consequences• The law of unintended consequences states that
most human actions have at leastone unintended consequence.
• Rigidity in networks: how would you characterize the rigidity of:
• The Internet?
• The telephone network?
3

Southeastern Security for Enterprise and Infrastructure (SENSEI) Center
Low Rate DoS Attacks•While recent attacks on cellular networks seem unrelated, there is
a common factor that catalyzes them all.
• Comparing multiple attacks uncovers causality:
‣ SMS Attack (JCS’09, CCS’05)
‣ Network Characterization and Partial Mitigations (TON’10, MobiCom’06)
‣ Data Teardown/Setup Attacks (USENIX Security’07)
•The architecture of cellular networks inherently makes them susceptible to denial of service attacks.
Clash of Design Philosophies
4

Southeastern Security for Enterprise and Infrastructure (SENSEI) Center
SMS Delivery (simplified)
Network
Internet
PSTN
MSC
VLR
VLR
MSC
ESME
HLR
SMSC
CCH
5

Southeastern Security for Enterprise and Infrastructure (SENSEI) Center
Control Channels• Control channels are used for a handful of
infrequently used functions.
‣ Call setup, SMS delivery, mobility management, etc...
• The SDCCH allows the network to perform most of these functions.
• The number of SDCCHs typically depends on the expected use in an area.
‣ 4/8/12...PCH
AGCHRACH
SDCCH
6

Southeastern Security for Enterprise and Infrastructure (SENSEI) Center
GSM TDMA Frames• TDMA Frame:
7
Slot 0 Slot 1 Slot 2 Slot 3 Slot 4 Slot 5 Slot 6 Slot 7 Frame: 4.615 msec
Frame 0 Frame 1 Frame 2 Frame 50...51 Multiframe:235.365 msec

Southeastern Security for Enterprise and Infrastructure (SENSEI) Center
From Frames to Channels
8
0
1
2
3
4
5
6
7
}Frame:
4.615ms
26 Multiframe:120.00 ms
Southeastern Security for Enterprise and Infrastructure (SENSEI) Center
Recognition• Once you fill the SDCCH channels with SMS
traffic, call setup is blocked
• The goal of an adversary is therefore to fill SDCCHs with SMS traffic.
‣ Not as simple as you might think...
SMS
Voice
SMS SMS SMS SMS SMS SMS SMS
X
9

Southeastern Security for Enterprise and Infrastructure (SENSEI) Center
Reconnaissance• Can such an attack be launched by targeting a single
phone?
‣ Low end phones: 30-50 msgs
‣ High end phones: 500+ msgs (battery dies)
• How do you get messages into the network?
‣ Email, IM, provider websites, bulk senders, etc...
• Don’t the networks have protections?
‣ IP Address blocking, Spam filtering
10

Southeastern Security for Enterprise and Infrastructure (SENSEI) Center
Finding Phones• North American Numbering Plan (NANP)
‣ Mappings between providers and exchanges publicly documented and available on the web
• Implication: An adversary can identify the prefixes used in a target area.
NPA-NXX-XXXX
Numbering Plan Area(Area code)
Numbering Plan Exchange
11

Southeastern Security for Enterprise and Infrastructure (SENSEI) Center
Web-Scraping• Googling for phone numbers gives us better
results:7,300 in NYC6,184 in D.C.in 5 seconds...
12
Southeastern Security for Enterprise and Infrastructure (SENSEI) Center
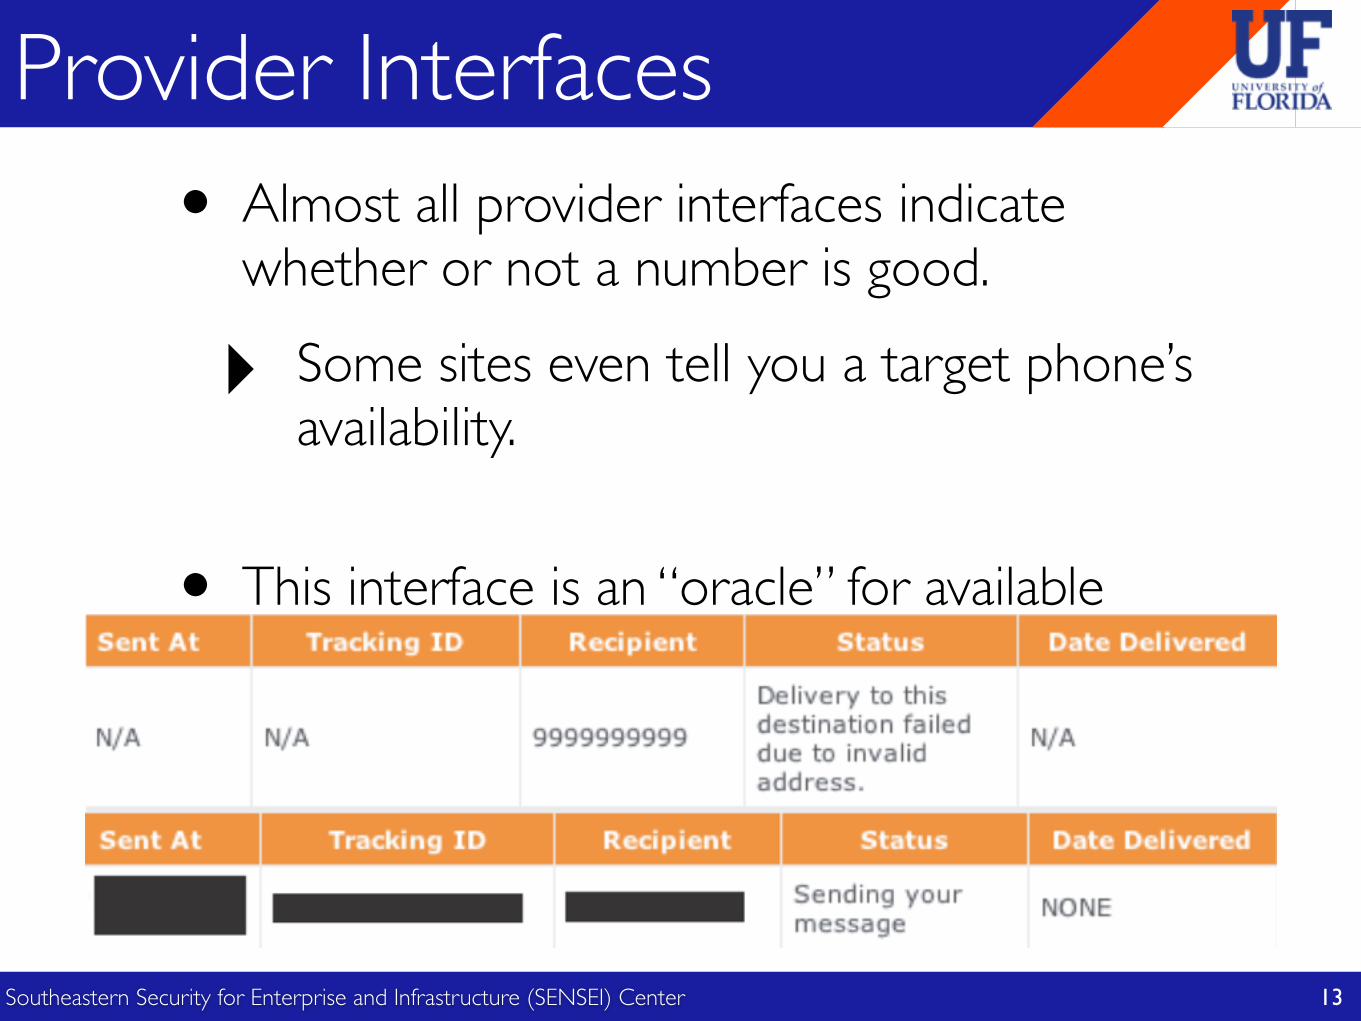
Provider Interfaces• Almost all provider interfaces indicate
whether or not a number is good.
‣ Some sites even tell you a target phone’s availability.
• This interface is an “oracle” for available phones.
13

Southeastern Security for Enterprise and Infrastructure (SENSEI) Center
Exploit (Metro)
• 165 msgs/sec * 1500 bytes = 1933.6 kb/sec
• 193.36 kb/sec on multi-send interface...
• Comparison: Cable modem ~= 768 kb/sec
Sectors in Manhattan
SDCCHs persector
Messages per SDCCH per hour
CCH* SDCCH/8 TCH TCH TCH TCH TCH TCH
TCH TCH TCH TCH TCH TCH TCH TCH
TCH TCH TCH TCH TCH TCH TCH TCH
TCH TCH TCH TCH TCH TCH TCH TCH
TRX 1
TRX 2
TRX 3
TRX 4
0 1 2 3 4 5 6 7
Figure 4: An example air interface with four carriers (each
showing a single frame). The first time slot of the first carrier
is the Common CCH. The second time slot of the first chan-
nel is reserved for SDCCH connections. Over the course of a
multiframe, capacity for eight users is allotted. The remaining
time slots across all carriers are designated for voice data. This
setup is common in many urban areas.
is divided into eight timeslots and, when viewed as a whole, form
a frame. During a given timeslot, the assigned user receives full
control of the channel. From the telephony perspective, a user as-
signed to a given TCH is able to transmit voice data once per frame.
In order to provide the illusion of continuous voice sampling, the
frame length is limited to 4.615 ms. An illustration of this system
is shown in Figure 4.
Because the bandwidth within a given frame is limited, data (es-
pecially relating to the CCH) must often span a number of frames,
as depicted in Figure 5. This aggregation is known as a multiframe
and is typically comprised of 51 frames6. For example, over the
course of a single multiframe, the base station is able to dedicate
up to 34 of the 51 Common CCH slots to paging operations.
Each channel has distinct characteristics. While the PCH is used
to signal each incoming call and text message, its commitment to
each session is limited to the transmission of a TMSI. TCHs, on
the other hand, remain occupied for the duration of a call, which on
average is a number of minutes [44]. The SDDCH, which has ap-
proximately the same bandwidth as the PCH across a multiframe,
is occupied for a number of seconds per session establishment. Ac-
cordingly, in many scenarios, this channel can become a bottleneck.
In order to determine the characteristics of the wireless bottle-
neck, it is necessary to understand the available bandwidth. As
shown in Figure 5, each SDCCH spans four logically consecutive
timeslots in a multiframe. With 184 bits per control channel unit
and a multiframe cycle time of 235.36 ms, the effective bandwidth
is 782 bps [4]. Given that authentication, TMSI renewal, the en-
abling of encryption, and the 160 byte text message must be trans-
ferred, a single SDCCH is commonly held by an individual session
for between four and five seconds [44]. The gray-box testing in
Section 3.1 reinforces the plausibility of this value by observing no
messages delivered in under six seconds.
This service time translates into the ability to handle up to 900
SMS sessions per hour on each SDCCH. In real systems, the total
number of SDCCHs available in a sector is typically equal to twice
the number of carriers7, or one per three to four voice channels.
For example, in an urban location such as the one demonstrated
in Figure 4 where a total of four carriers are used, a total of eight
SDCCHs are allocated. A less populated suburban or rural sector
may only have two carriers per area and therefore have four allo-
6Multiframes can actually contain 26, 51 or 52 frames. A justifica-tion for each case is available in the standards [4].7Actual allocation of SDCCH channels may vary across implemen-tations; however, these are the generally accepted values through-out the community.
SDCCH 0
0 1 2 3 4 5 6 7 0 1 2 3 4 5 6 70 1 2 3 4 5 6 7Time Slot #
SDCCH 1Multiframe
Frame # 0 1 2 3 4 5 6 7 8 9 04 5
0 1 2 3 4 5 6 7
Radio Carrier
Figure 5: Timeslot 1 from each frame in a multiframe creates
the logical SDCCH channel. In a single multiframe, up to eight
users can receive SDCCH access.
cated SDCCHs. Densely populated metropolitan sectors may have
as many as six carriers and therefore support up to 12 SDCCHs per
area.
We now calculate the maximum capacity of the system for an
area. As indicated in a study conducted by the National Communi-
cations System (NCS) [44], the city of Washington D.C. has 40 cel-
lular towers and a total of 120 sectors. This number reflects sectors
of approximately 0.5 to 0.75 mi2 through the 68.2 mi2 city. Assum-
ing that each of the sectors has eight SDCCHs, the total number of
messages per second needed to saturate the SDCCH capacity C is:
C � (120 sectors)
„8 SDCCH1 sector
« „900 msgs/hr1 SDCCH
«
� 864, 000 msgs/hr
� 240 msgs/sec
Manhattan is smaller in area at 31.1 mi2. Assuming the same
sector distribution as Washington D.C., there are 55 sectors. Due
to the greater population density, we assume 12 SDCCHs are used
per sector.
C � (55 sectors)
„12 SDCCH
1 sector
« „900 msg/hr1 SDCCH
«
� 594, 000 msg/hr
� 165 msg/sec
Given that SMSCs in use by service providers in 2000 were capa-
ble of processing 2500 msgs/sec [59], such volumes are achievable
even in the hypothetical case of a sector having twice this number
of SDCCHs.
Using a source transmission size of 1500 bytes as described in
Section 3.1 to submit an SMS from the Internet, Table 3 shows the
bandwidth required at the source to saturate the control channels,
thereby incapacitating legitimate voice and text messaging services
for Washington D.C. and Manhattan. The adversary’s bandwidth
requirements can be reduced by an order of magnitude when at-
tacking providers including Verizon and Cingular Wireless due to
the ability to have a single message repeated to up to ten recipients.
Due to the data gathered in Section 3.1, sending this magnitude
of messages to a small number of recipients would degrade the ef-
fectiveness of such an attack. As shown in the previous section, tar-
geted phones would quickly see their buffers reach capacity. Unde-
liverable messages would then be buffered in the network until the
space alloted per user was also exhausted. These accounts would
likely be flagged and potentially temporarily shut down for receiv-
ing a high number of messages in a short period of time, thereby
14

Southeastern Security for Enterprise and Infrastructure (SENSEI) Center
Attack Profile
• Applied simulation and analysis to better characterize the attacks.
• Examined call blocking under multiple arrival patterns with exponentially distributed service times.
• Using 495 msgs/sec, a blocking probability of 71% is possible with the bandwidth of a cable modem.
0
0.2
0.4
0.6
0.8
1
1.2
0 500 1000 1500 2000 2500 3000 3500 4000
Uti
lizati
on
Time (seconds)
SDCCH Utilization
TCH Utilization
SDCCH Utilization
TCHUtilization
15

Southeastern Security for Enterprise and Infrastructure (SENSEI) Center
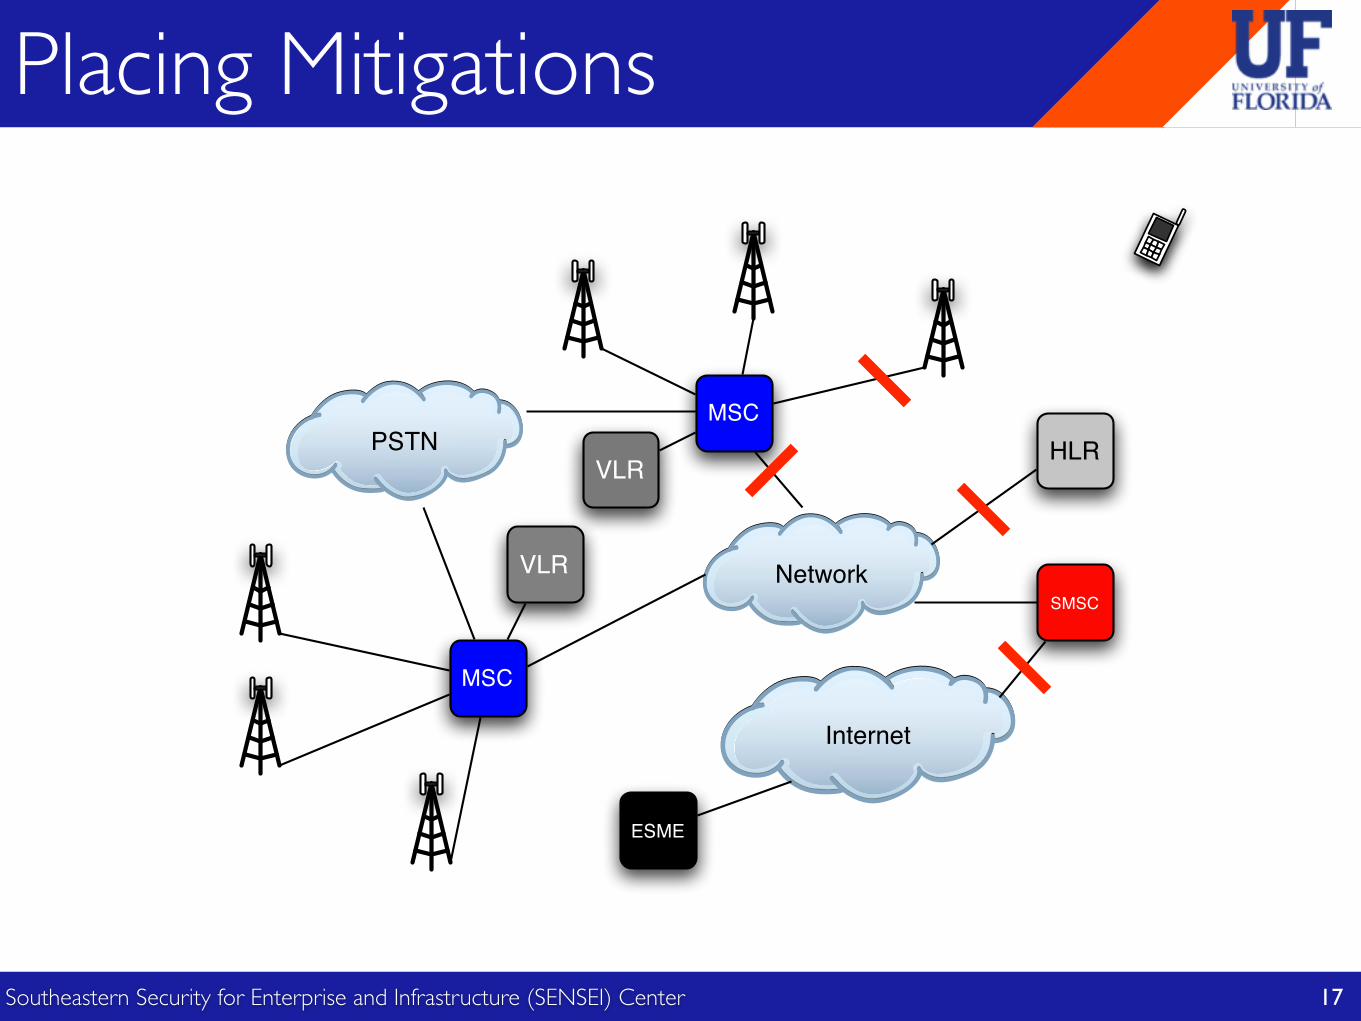
Security Goals• Goal: To preserve the fidelity of both voice services and
legitimate text messages during targeted SMS attacks.
• Security Model:
‣ We must trust equipment in the network core.
‣ We can not trust Internet users or customer devices.
16
Southeastern Security for Enterprise and Infrastructure (SENSEI) Center
Placing Mitigations
Network
Internet
PSTN
MSC
VLR
VLR
MSC
ESME
HLR
SMSC
17

Southeastern Security for Enterprise and Infrastructure (SENSEI) Center
Solution Classifications• Scheduling/Shaping/Regulation
‣ WFQ, Leaky Bucket, Priority Queues
‣ AQM (WRED, REM, AVQ)
• Resource Provisioning
‣ SRP
‣ DRP
‣ DCA
0
0.2
0.4
0.6
0.8
1
0 500 1000 1500 2000 2500 3000 3500 4000
Percent
of A
ttem
pts
Blo
cked
Time (seconds)
Service Queue (SMS)
Service Queue (Voice)
TCH (Voice)
0
0.2
0.4
0.6
0.8
1
0 500 1000 1500 2000 2500 3000 3500 4000
Percent
of A
ttem
pts
Blo
cked
Time (seconds)
SDCCH (SMS)
SDCCH (Voice)
TCH (Voice)
0
0.2
0.4
0.6
0.8
1
0 500 1000 1500 2000 2500 3000 3500 4000
Percen
t o
f A
ttem
pts
Blo
ck
ed
Time (seconds)
SDCCH (SMS)
SDCCH (Voice)
TCH (Voice)
0
0.2
0.4
0.6
0.8
1
0 500 1000 1500 2000 2500 3000 3500 4000
Uti
lizati
on
Time (seconds)
SDCCH
TCH
Service Queue
18

Southeastern Security for Enterprise and Infrastructure (SENSEI) Center
WRED - OverviewLowMedHigh
tlow,mintmed,mintmed,maxtlow,max
19

Southeastern Security for Enterprise and Infrastructure (SENSEI) Center
WRED - OverviewLowMedHigh
closer to a moving average and not capacity, space typically exists
to accommodate sudden bursts of traffic. However, one of the chief
difficulties with traditional RED is that it eliminates the ability of
a provider to offer quality of service (QoS) guarantees because all
traffic entering a queue is dropped with equal probability. Weighted
Random Early Detection (WRED) solves this problem by basing
the probability a given incoming message is dropped on an attribute
such as its contents, source or destination. Arriving messages not
meeting some priority are therefore subject to increased probabil-
ity of drop. The dropping probability for each class of message is
tuned by setting tpriority,min and tpriority,max for each class.
We consider the use of authentication as a means of creating
messaging priority classes. For example, during a crisis, messages
injected to a network from the Internet by an authenticated mu-
nicipality or from emergency personnel could receive priority over
all other text messages. A number of municipalities already use
such systems for emergency [32] and traffic updates [36]. Mes-
sages from authenticated users within the network itself receive
secondary priority. Unauthenticated messages originating from the
Internet are delivered with the lowest priority. Such a system would
allow the informative messages (i.e. evacuation plans, additional
warnings, etc) to be quickly distributed amongst the population.
The remaining messages would then be delivered at ratios corre-
sponding to their priority level. We assume that packet priority
marking occurs at the SMSCs such that additional computational
burden is not placed on base stations.
Here, we illustrate how WRED can provide differentiated ser-
vice to different classes of SMS traffic using the attack scenario
described in Tables 1 and 2. We maintain separate queues, which
are served in a round robin fashion, for voice requests and SMS
requests. We apply WRED to the SMS queue. In this example we
assume legitimate text messages arrive at a sector with an average
rate of 0.7 msgs/sec with the following distribution: 10% high
priority, 80% medium priority, and 10% low priority. The attack
generates an additional 9 msgs/sec.To accommodate sudden bursts of high priority SMS traffic, we
choose an SMS queue size of 12. Because we desire low latency
delivery of high priority messages, we target an average queue oc-
cupancy Qavg = 3.To meet this objective, we must set tlow,min and tlow,max. For
M/M/n systems with a finite queue of size m, the number of mes-sages in the queue, NQ, is:
NQ = PQρ
1 − ρ(2)
where:
PQ =p0(mρ)m
m!(1 − ρ)(3)
where:
p0 =
"
m−1X
n=0
(mρ)n
n!+
(mρ)m
m!(1 − ρ)
#
−1
(4)
Setting NQ = 3, we derive a target load ρtarget = 0.855.ρtarget is the utilization desired at the SDCCHs. Thus, the packet
dropping caused byWREDmust reduce the actual utilization, ρactual
or λSMS/(µSMS · n), caused by the heavy offered load during anattack, to ρtarget. Therefore:
ρtarget = ρactual(1 − Pdrop) (5)
where Pdrop is the overall dropping probability of WRED. For traf-
fic with average arrival rate of λSMS = 9.7 msgs/sec, ρactual =3.23. Solving for Pdrop,
Pdrop = 1 −ρtarget
ρactual= 0.736 (6)
Pdrop can be calculated from the dropping probabilities of theindividual classes of messages by (λlow = 9.07):
Pdrop =Pdrop,high · λhigh + Pdrop,med · λmed + Pdrop,low · λlow
λSMS(7)
Because we desire to deliver all messages of high and medium
priority, we set Pdrop,high = Pdrop,med = 0. Using Equation 7,we find Pdrop,low = 0.787. This value is then used in conjunctionwith Equation 1 to determine tlow,min and tlow,max.
The desired average queue occupancy, Qavg, is 3. From equa-
tion 1, tlow,min must be an integer less than the average queue
occupancy. This leaves three possible values for tlow,min: 0, 1,and 2. The best fit is found when tlow,min = 0 and tlow,max = 4,resulting in 75% dropping of low priority traffic.
Using this method it is possible to set thresholds to meet delivery
targets. Of course, depending on the intensity of an attack, it may
not be possible to meet desired targets according to Equation 7, i.e.,
it may not be possible to limit blocking to only low priority traffic.
While the method outlined here provides just an approximate solu-
tion, given the quantization error in setting tlow,min and tlow,max
(they must be integers), we believe the method is sufficient. We
provide more insight into the performance of WRED in Section 5.
4.3 Resource ProvisioningNone of the above methods deal with the system bottleneck di-
rectly; rather, they strive to affect traffic before it reaches the air
interface. An alternative strategy of addressing targeted SMS at-
tacks instead focuses on the reallocation of the available messaging
bandwidth. We therefore investigate a variety of techniques that
modify the way in which the air interface is used.
To analyze these techniques we resort to simple Erlang-B queue-
ing analysis. We present a brief background here. For more details
see Schwartz [35]. In a system with n servers, and an offered loadin Erlangs of A, the probability that an arriving request is blockedbecause all servers are occupied is given by:
PB =An
n!Pl=n−1
l=0
All!
(8)
The load in Erlangs is the same as the utilization, ρ, in a queueingsystem; it is simply the offered load multiplied by the service time
of the resource. The expected occupancy of the servers is given by:
E(n) = ρ(1 − PB) (9)
4.3.1 Strict Resource Provisioning
Under normal conditions, the resources for service setup and de-
livery are over-provisioned. At a rate of 50, 000 calls/hour in ourbaseline scenario, for example, the calculated average utilization
of SDCCHs per sector is approximately 2%. Given this observa-
tion, if a subset of the total SDCCHs can be used only by voice
calls, blocking due to targeted SMS attacks can be significantly
mitigated. Our first air interface provisioning technique, Strict Re-
source Provisoning (SRP), attempts to address this contention by
allowing text messages to occupy only a subset of the total num-
ber of SDCCHs in a sector. Requests for incoming voice calls can
compete for the entire set of SDCCHs, including the subset used
for SMS. In order to determine appropriate parameters for systems
using SRP, we apply Equations 8 and 9.
Pdrop = Pdrop,max · (Qavg � tmin)(tmax � tmin)
tlow,mintmed,mintmed,maxtlow,max
NQ = PQ�
1� �
20

Southeastern Security for Enterprise and Infrastructure (SENSEI) Center
WRED - Results
•Messages of high and medium-priority experience no blocking, but increased delay.
•An average of 77% of low-priority messages are blocked.
•This is a nice solution, assuming meaningful partitioning of flows.
0
0.2
0.4
0.6
0.8
1
0 500 1000 1500 2000 2500 3000 3500 4000
Perc
ent o
f Atte
mpt
s Blo
cked
Time (seconds)
Service Queue (SMS - Priority 1)Service Queue (SMS - Priority 2)Service Queue (SMS - Priority 3)
Low PrioritySMS Blocking
0
0.2
0.4
0.6
0.8
1
0 500 1000 1500 2000 2500 3000 3500 4000
Uti
lizati
on
Time (seconds)
SDCCH
TCH
Service Queue
Average Queue Occupancy
21

Southeastern Security for Enterprise and Infrastructure (SENSEI) Center
...and yet...• Performance improvements come from one of
two changes: speedup or parallelization.
• As diverse as our solutions appear, they all attempt to maximize performance through the latter.
‣ In many senses, we are not solving the problem - we are pushing food around on our plate.
• Adding bandwidth should logically address this problem.
22

Southeastern Security for Enterprise and Infrastructure (SENSEI) Center
Cellular Data Networks• GPRS/EDGE provide much higher bandwidth service.
• Packet-switched data services are attractive to providers and users for a number of reasons.
• User devices operate in one of three states: IDLE, STANDBY and READY.
‣ IDLE: The device is unavailable.
‣ STANDBY: Available, but not exchanging packets.
‣ READY: Actively listening for packets.
STANDBY
READY
IDLE
GPRSAttach
READYTimer
Expires
PagingRequest
STANDBYTimer
Expires
GPRSDetach
23

Southeastern Security for Enterprise and Infrastructure (SENSEI) Center
Internet
IP Address SGSN
192.168.100.1 192.168.1.2
192.168.100.2 192.168.1.2
HLR
GGSN SGSN
Data Architecture
24

Southeastern Security for Enterprise and Infrastructure (SENSEI) Center
Real Network Configs• To make these simulations represent reality, we use
a Samsung Blackjack in Field Test Mode to discover settings of an operational network.
• Field Test Mode tells us that control channels for voice and data are shared in real networks.
‣ Voice and data traffic may be able to interfere with each other.
25

Southeastern Security for Enterprise and Infrastructure (SENSEI) Center
Reducing Overhead• Because paging is so expensive, we don’t want to do it
for every packet.
• Establishing a connection takes 5 seconds:
‣ Waiting: Paging, Wakeup, Processing, Acquiring timeslots
‣ Transmission
• GPRS differentiates packets at the MAC layer by Temporary Block Flows (TBFs).
‣ Each TBF is assigned a Temporary Flow ID (TFI).
26

Southeastern Security for Enterprise and Infrastructure (SENSEI) Center
Teardown Attack: Overview• TFIs are implemented as 5-bit fields, yielding a
maximum of 32 concurrent flows.
• If you send a message to a phone once every 5 seconds, the targeted device maintains its TFI.
‣ An adversary can therefore cause legitimate flows to block due to TBF/TFI exhaustion.
Because TFIs are implemented as a 5-bit field, an ad-versary capable of sending 32 messages to each sectorin a metropolitan area can exhaust logical resources andtemporarily prevent users from receiving traffic. Tar-geted devices would not need to be infected or controlledby the adversary; rather, hit-list generation techniquessimilar to those discussed in our previous work [16]could be used to locate hosts able to receive traffic. Ifthis task can be repeated before the TBF timers expire, adenial of service attack becomes sustainable. In orderto more explicitly characterize the bandwidth require-ments, we model such an attack on Manhattan usingwell known parameters [35, 48]. Given an area of 31.1miles2 and a sector coverage area of approximately 0.5and 0.75 miles2, Manhattan contains 55 sectors. Usinga READY timer of 5 seconds and 41 byte attack packets(i.e., TCP/IP headers plus one byte), the delivery of le-gitimate data services in Manhattan could be preventedwith the attack shown below:
Capacity ⇥ 55 sectors�32 msgs1 sector
�41 bytes1 msg
�1
5 sec⇥ 110 Kbps
The exhaustion of all hypothetical TBFs may not benecessary given current usage and deployed hardware.As the current demand for voice services far outpacescellular data usage, only a small percentage of physi-cal channels in a sector are used as PDCHs. BecauseGPRS/EDGE are not extremely high bandwidth services,allowing 32 individual flows to be concurrently multi-plexed across a single PDCH would be detrimental toindividual throughput. Accordingly, often only a subsetof the 32 TBFs (4, 8 or 16 [26,33]) are usable. The max-imum number of concurrent TBFs in a sector is there-fore min(d � u, 32), where d is the number of down-link PDCHs and u is the maximum number of users perPDCH. While the number of PDCHs can be dynamicallyincreased in response to rising demand for data services,networks typically hold unused channels to absorb spikesin voice calls. It is therefore unlikely that all 32 TBFswill be available at all times, if ever. A more realistic ap-proximation of the bandwidth required to deny access todata services is given by:
Capacity ⇥ 55 sectors�4⇤ 16 msgs
1 sector�
41 bytes1 msg
�1
5 sec⇥ 14.1⇤ 56.4 Kbps
The brute-force method of attacking a cellular datanetwork in a metropolitan setting is simply to saturateall of the physical channels with traffic. Even at theirgreatest levels of provisioning, the fastest cellular dataservices are simply no match against traffic generated by
Internet-based adversaries [39, 45]. Such attacks, obvi-ous by the sheer volume of traffic created, would likelybe noticed and mitigated at the gateways to the network.However, with knowledge of the interaction between dif-ferent network elements, it is possible for an adversaryto launch a much smaller attack capable of achieving thesame ends. A basic understanding of the packet deliveryprocess provides the requisite information for realizingthis attack.
Given a theoretical maximum capacity of 171.2 Kbpsper frequency and as many as 8 allocated frequencies persector, an adversary attempting the brute-force saturationof such a system would instead need to generate the vol-ume of traffic as calculated as:
Capacity ⇥ 55 sectors�171.2 Kbps1 frequency
�8 frequencies
1 sector⇥ 73.56Mbps
By attacking the logical channels instead of the rawtheoretical bandwidth, an adversary can reduce theamount of traffic needed to deny service to a metropoli-tan area by as much as three orders of magnitude. Notethat networks implementing EDGE, which can providethree times the bandwidth of a GPRS system, would ex-perience the same consequences given the same volumeof attack traffic.
3.4 Exploiting Setup ProceduresIf connections to an end host must repeatedly be reestab-lished, the interarrival time between successive packetsbecomes exceedingly large. Delaying resource reclama-tion is therefore a necessary mechanism to ensure somesemblance of continuous connectivity to the network.This latency, however, is not simply the result of the timerequired for a user to overhear an incoming paging re-quest. To better understand setup cost, we examine anetwork in which resource reclamation occurs immedi-ately after the last packet in a flow is received.
Of particular interest to such an analysis is the per-formance of the common uplink channel, the PRACH.Because this channel is shared by all hosts attempting toestablish connections with the network, the PRACH in-herently has the potential to be a system bottleneck. Tominimize contention, access to the PRACH is mediatedthrough the slotted-ALOHA protocol. Given a channeldivided into timeslots of size t and time synchronizationacross hosts, end devices attempting to establish connec-tions transmit requests at the beginning of a timeslot. Inso doing, the network reduces the amount of time duringwhich collision can occur from 2t in the random accesscase to t. While slotted-ALOHA offers a significant im-provement over random access, its throughput remains
27

Southeastern Security for Enterprise and Infrastructure (SENSEI) Center
Teardown Attack: Results
• If an attacker can send 160Kbps of data traffic, 97% of legitimate traffic will be blocked.
• Note that data service is blocked with less than 30% of the attack traffic previously used to attack SMS.
0
0.2
0.4
0.6
0.8
1
200180160140120100
Av
erag
e P
ercen
t B
lock
ing
Du
rin
g A
ttack
Attack Traffic (kbps)
RACH (Data)
RACH (Voice)
PDTCH (Data)
TCH (Voice)
28

Southeastern Security for Enterprise and Infrastructure (SENSEI) Center
Setup Attack
• To prevent this attack, we reclaim TFIs when the base station sends the “last” packet in a flow.
• If an attacker can send 4950Kbps of attack traffic, over 85% of all legitimate traffic will be blocked.
‣ Voice and SMS will be blocked at the same rate!
0
0.2
0.4
0.6
0.8
1
2200 2750 3300 3850 4400 4950
Average P
ercent
Blo
ckin
g D
urin
g A
ttack
Attack Traffic (kbps)
RACH (Data)
RACH (Voice)
29

Southeastern Security for Enterprise and Infrastructure (SENSEI) Center
Broken Solutions• Add more TFIs.
‣ This is an artificial boundary. Why does it exist?
• Add more bandwidth.
‣ Session establishment requires a few seconds, so adding bandwidth should speed this up and alleviate the problem.
limBW�⇥
Throughput =# Requests
Setup(Paging,Waiting, Processing)Throughput =
#Requests
Setup(Paging,Waiting, Processing) + Transmission
30

Southeastern Security for Enterprise and Infrastructure (SENSEI) Center
The Failure of Bandwidth
0
0.25
0.5
0.75
1
1.25
1.5
0.01 0.1 1 10 100 1000 10000 100000
Con
trol C
hann
el T
hrou
ghpu
t (re
ques
ts/s
ec)
Bandwidth (packets/sec)
5 sec4 sec3 sec2 sec1 sec
Bandwidth (packets/sec)Today
Increased Rate
Decreasing the cost of connection establishment requires reducing
connection setup latency.
Setup Latency =(p
acke
ts/se
c)
31

Southeastern Security for Enterprise and Infrastructure (SENSEI) Center
Connecting the Dots...• The concept of connection establishment is
considerably different in cellular and data networks.
‣ Cellular networks page, wake and negotiate with hosts.
‣ Data networks simply forward packets.
• These networks were specialized to deliver voice, but data service has been shoehorned in...
‣ The setup for data connections simply can not be amortized like voice calls...
32

Southeastern Security for Enterprise and Infrastructure (SENSEI) Center
Clash of Design Philosophies
• The Internet uses the End-to-End Principle as its guiding philosophy.
‣ Cellular data networks are still fundamentally circuit-switched systems.
• Because specialized networks implement more functionality than absolutely necessary for all flows, they exhibit rigidity.
‣ Such systems are unable to adapt to meet changing requirements and conditions.
33

Southeastern Security for Enterprise and Infrastructure (SENSEI) Center
A Cautionary Tale...• Cellular networks are among the most specialized
systems ever constructed.
• Adding services that violate the assumptions upon which the network is optimized allows an attacker to force such systems to fail at very low rates...
‣ The unintended consequence of attempts to save battery life allow attackers to shut down the network.
• Many more vulnerabilities exist in this network...
34
Recommended