New Jersey Agricultural Experiment Station
P-02275-2-06 June 2006
Consumer Perceptions and Preferences for Organic
Aquatic Products: Results from the Telephone Survey
Linda J. O’Dierno
Ramu Govindasamy Venkata Puduri Joseph J. Myers
Sho Islam
Fish & Seafood Program
PO Box 330 Trenton, NJ 08625-0330
(609) 984-6757 FAX: (609) 633-7229
Department of Agricultural, Food and Resource Economics
55 Dudley Road
New Brunswick, NJ 08901-8520 (732) 932-9155 ext.254 FAX: (732) 932-8887
Linda J. O’Dierno, Coordinator, Fish & Seafood Development, New Jersey Department of Agriculture, Trenton; Dr. Govindasamy is Associate Professor, Department of Agricultural, Food and Resource Economics, Rutgers University, New Brunswick, New Jersey; Venkata Puduri is a Postdoctoral Associate, Department of Agricultural, Food and Resource Economics, Rutgers University, New Brunswick, New Jersey; Joseph J. Myers. Aquaculture Development Specialist Fish & Seafood Development, Office of Aquaculture Coordination, New Jersey Department of Agriculture, Trenton; and Shofiul Islam Business Development Associate, Food Innovation Centre, Rutgers University,

i
Acknowledgements The authors would like to thank the following individuals for their assistance in providing
direction and support for this project: Mr. Gary Jensen of USDA, Mr.Robert Collette of
the National Fisheries Institute, Mr. George Lockwood, Mr. Richard Nelson of Silvercup
Feeds, Ms. Deborah Brister of the University of Minnesota, Mr. William Carroll of
Gleneagles Inc., Mr. Robert Rheault of Moonstone Oysters, Ms. Robin Downey of the
Pacific Coast Shellfish Growers Association, Mr. Sherman Wilhelm of the Florida
Department of Agriculture and Consumer Services.
Funding for this project was matched with Federal funds under the Federal-State
Marketing Improvement Program of the Agricultural Marketing Service, U.S.
Department of Agriculture Grant # 12-25-G-0420.
ii
Table of Contents
Acknowledgements.............................................................................................................. i Table of Contents................................................................................................................ ii List of Tables ..................................................................................................................... iii List of Tables (Contd.)....................................................................................................... iv List of Figures ..................................................................................................................... v List of figures (Contd.) ...................................................................................................... vi Executive Summary .......................................................................................................... vii Consumer Perceptions ........................................................................................................ x Introduction......................................................................................................................... 1 Research Objectives............................................................................................................ 5 Methodology....................................................................................................................... 6 Survey Results .................................................................................................................... 9
Demographics ............................................................................................................... 9 Reasons for Consuming Seafood ................................................................................ 10 Factors/Information that would induce consumer to purchase more seafood ............ 11 Seafood Inspection...................................................................................................... 13 Country of Origin Labeling ........................................................................................ 13 Eco-Labeling............................................................................................................... 16 Seafood and Health ..................................................................................................... 16 Farm-Raised Seafood.................................................................................................. 18 Purchase Patterns ........................................................................................................ 18 Species Specific Purchase Patterns............................................................................. 19 Crustaceans ................................................................................................................. 19 Finfish ......................................................................................................................... 21 Molluscan Shellfish .................................................................................................... 24 Farm Raised vs. Wild Caught ..................................................................................... 26 Organic Seafood.......................................................................................................... 29 Consumer Perceptions of Organic Seafood ................................................................ 29 Consumer Perceptions of Organic Seafood Compared to Conventional Seafood...... 30 Purchase Patterns ........................................................................................................ 34 Willingness to Pay ...................................................................................................... 37 Profile of Seafood Consumers .................................................................................... 37 Profile of Consumers Interested in Purchasing Organic Seafood............................... 41 Consumer Willingness to Pay for Organic Seafood ................................................... 44 Opportunities for Market Penetration ......................................................................... 48
Conclusions....................................................................................................................... 50 Consumer Perceptions ................................................................................................ 50 Purchase Decision....................................................................................................... 51 Retail Opportunities .................................................................................................... 51
References......................................................................................................................... 55 Bibliography ..................................................................................................................... 56 Appendix –Telephone Survey........................................................................................... 59
iii
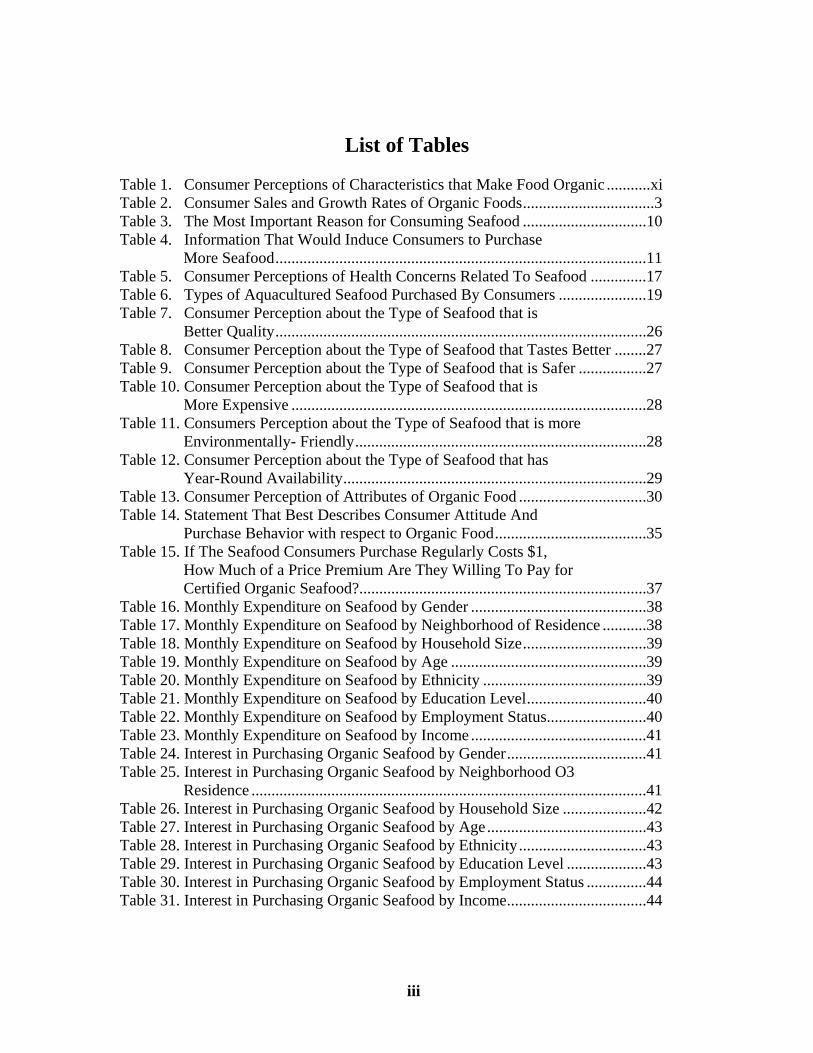
List of Tables Table 1. Consumer Perceptions of Characteristics that Make Food Organic ...........xi Table 2. Consumer Sales and Growth Rates of Organic Foods.................................3 Table 3. The Most Important Reason for Consuming Seafood ...............................10 Table 4. Information That Would Induce Consumers to Purchase
More Seafood.............................................................................................11 Table 5. Consumer Perceptions of Health Concerns Related To Seafood ..............17 Table 6. Types of Aquacultured Seafood Purchased By Consumers ......................19 Table 7. Consumer Perception about the Type of Seafood that is
Better Quality.............................................................................................26 Table 8. Consumer Perception about the Type of Seafood that Tastes Better ........27 Table 9. Consumer Perception about the Type of Seafood that is Safer .................27 Table 10. Consumer Perception about the Type of Seafood that is More Expensive .........................................................................................28 Table 11. Consumers Perception about the Type of Seafood that is more Environmentally- Friendly.........................................................................28 Table 12. Consumer Perception about the Type of Seafood that has Year-Round Availability............................................................................29 Table 13. Consumer Perception of Attributes of Organic Food ................................30 Table 14. Statement That Best Describes Consumer Attitude And Purchase Behavior with respect to Organic Food......................................35 Table 15. If The Seafood Consumers Purchase Regularly Costs $1, How Much of a Price Premium Are They Willing To Pay for Certified Organic Seafood?........................................................................37 Table 16. Monthly Expenditure on Seafood by Gender ............................................38 Table 17. Monthly Expenditure on Seafood by Neighborhood of Residence ...........38 Table 18. Monthly Expenditure on Seafood by Household Size...............................39 Table 19. Monthly Expenditure on Seafood by Age .................................................39 Table 20. Monthly Expenditure on Seafood by Ethnicity .........................................39 Table 21. Monthly Expenditure on Seafood by Education Level..............................40 Table 22. Monthly Expenditure on Seafood by Employment Status.........................40 Table 23. Monthly Expenditure on Seafood by Income ............................................41 Table 24. Interest in Purchasing Organic Seafood by Gender...................................41 Table 25. Interest in Purchasing Organic Seafood by Neighborhood O3 Residence ...................................................................................................41 Table 26. Interest in Purchasing Organic Seafood by Household Size .....................42 Table 27. Interest in Purchasing Organic Seafood by Age........................................43 Table 28. Interest in Purchasing Organic Seafood by Ethnicity................................43 Table 29. Interest in Purchasing Organic Seafood by Education Level ....................43 Table 30. Interest in Purchasing Organic Seafood by Employment Status ...............44 Table 31. Interest in Purchasing Organic Seafood by Income...................................44

iv
List of Tables (Contd.)
Table 32. Willing To Pay For Organic Seafood by Gender ......................................45 Table 33. Willing To Pay For Organic Seafood by Neighborhood ...........................46 Table 34. Willing To Pay For Organic Seafood by Household Size .........................46 Table 35. Willing To Pay For Organic Seafood by Age............................................47 Table 36. Willing To Pay For Organic Seafood by Ethnicity....................................47 Table 37. Willing To Pay For Organic Seafood by Education Level........................47 Table 38. Willing To Pay For Organic Seafood by Employment Status...................48 Table 39. Willing To Pay For Organic Seafood by Income ......................................48 Table 40. Types of Information That Would Induce Consumers To Purchase More Seafood ............................................................................49
v
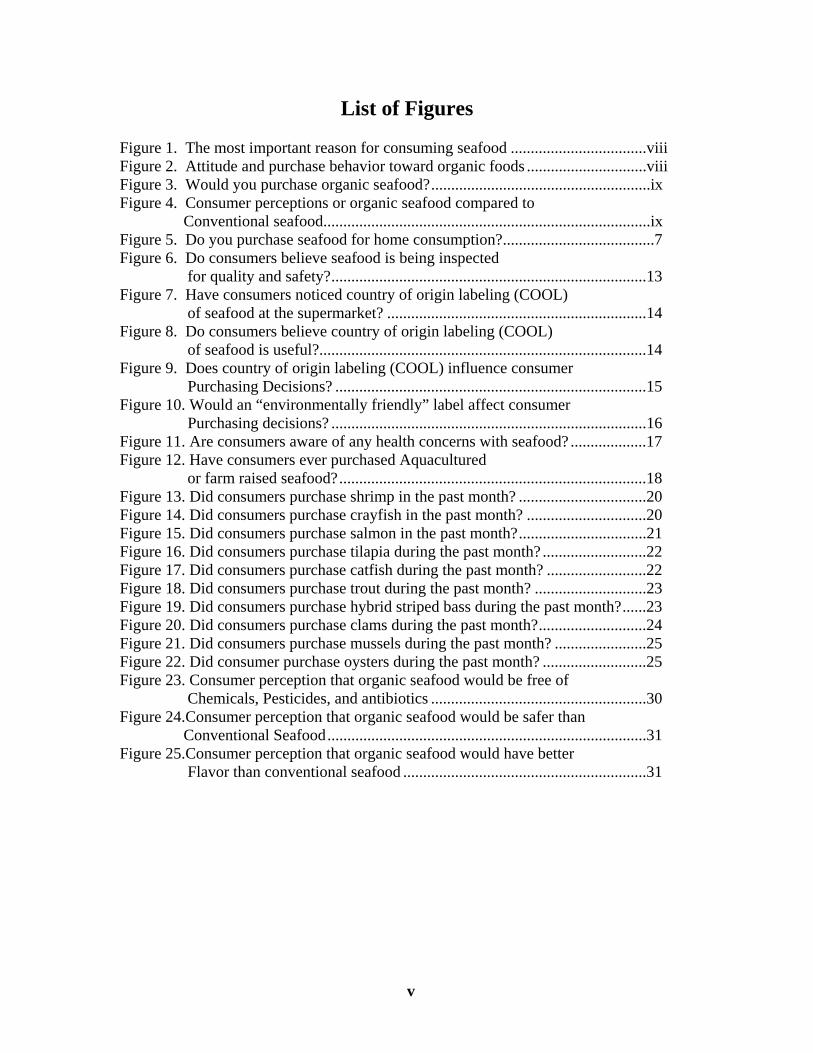
List of Figures Figure 1. The most important reason for consuming seafood ..................................viii Figure 2. Attitude and purchase behavior toward organic foods ..............................viii Figure 3. Would you purchase organic seafood?.......................................................ix Figure 4. Consumer perceptions or organic seafood compared to Conventional seafood..................................................................................ix Figure 5. Do you purchase seafood for home consumption?......................................7 Figure 6. Do consumers believe seafood is being inspected for quality and safety?...............................................................................13 Figure 7. Have consumers noticed country of origin labeling (COOL) of seafood at the supermarket? .................................................................14 Figure 8. Do consumers believe country of origin labeling (COOL) of seafood is useful?..................................................................................14 Figure 9. Does country of origin labeling (COOL) influence consumer Purchasing Decisions? ..............................................................................15 Figure 10. Would an “environmentally friendly” label affect consumer Purchasing decisions? ...............................................................................16 Figure 11. Are consumers aware of any health concerns with seafood? ...................17 Figure 12. Have consumers ever purchased Aquacultured or farm raised seafood?.............................................................................18 Figure 13. Did consumers purchase shrimp in the past month? ................................20 Figure 14. Did consumers purchase crayfish in the past month? ..............................20 Figure 15. Did consumers purchase salmon in the past month?................................21 Figure 16. Did consumers purchase tilapia during the past month? ..........................22 Figure 17. Did consumers purchase catfish during the past month? .........................22 Figure 18. Did consumers purchase trout during the past month? ............................23 Figure 19. Did consumers purchase hybrid striped bass during the past month?......23 Figure 20. Did consumers purchase clams during the past month?...........................24 Figure 21. Did consumers purchase mussels during the past month? .......................25 Figure 22. Did consumer purchase oysters during the past month? ..........................25 Figure 23. Consumer perception that organic seafood would be free of Chemicals, Pesticides, and antibiotics ......................................................30 Figure 24.Consumer perception that organic seafood would be safer than Conventional Seafood................................................................................31 Figure 25.Consumer perception that organic seafood would have better Flavor than conventional seafood .............................................................31

vi
List of figures (Contd.)
Figure 26. Consumer perception that organic seafood would be nutritious than Conventional seafood...............................................................................32 Figure 27. Consumer perception that organic seafood would be of better Quality than conventional seafood............................................................32 Figure 28. Consumer perception that producing organic seafood be better for the Environment than conventional seafood...................................................33 Figure 29. Consumer perception that organic seafood production considers Animal welfare more than conventional seafood production ...................33 Figure 30. Consumer perception that small farmers have a competitive Advantage in the production of organic seafood ......................................34 Figure 31. Are consumers interested in purchasing organic seafood?.......................35 Figure 32. Would consumers change their shopping location to be able to Purchase organic seafood?........................................................................36 Figure 33. Would Consumers Trust an Organic Label for Seafood? ........................36 Figure 34. Interest in purchasing organic seafood .....................................................50
vii
Executive Summary The long-term goal of this project is to develop a better understanding of potential market
opportunities for organically grown fish and shellfish products in the United States.
Organic production offers tremendous potential for small farmers who would like to
differentiate their products and develop viable markets for premium products.
Segmented premium price markets are especially vital to the survival of the small farmer
since cost of production is generally higher and the output is lower for this producer
segment. The methodology employed was a compilation of qualitative and quantitative
data collection in four target markets that were identified as representative of specific
consumer purchase patterns. Those markets were: Colorado Springs, Colorado, Boston,
Massachusetts, Chicago, Illinois, and Central New Jersey. Focus group meetings and
review of on-line supermarket weekly circulars were used to help create questions for a
telephonic survey, which was conducted by a professional survey company with a target
of 200 completed surveys from randomly selected respondents in each target market.
To better examine consumer perceptions and attitudes toward seafood as a food category
and specific purchase patterns, the survey sample used was limited to individuals who
buy seafood for home consumption. Sixty-nine percent of those in the original sample
indicated that they purchased seafood for home consumption while thirty-one percent did
not. If the respondent indicated that he or she did not purchase seafood for home
consumption the survey was terminated. The final returned sample of 800 respondents
consisted of only those respondents who regularly purchase seafood for home
consumption.
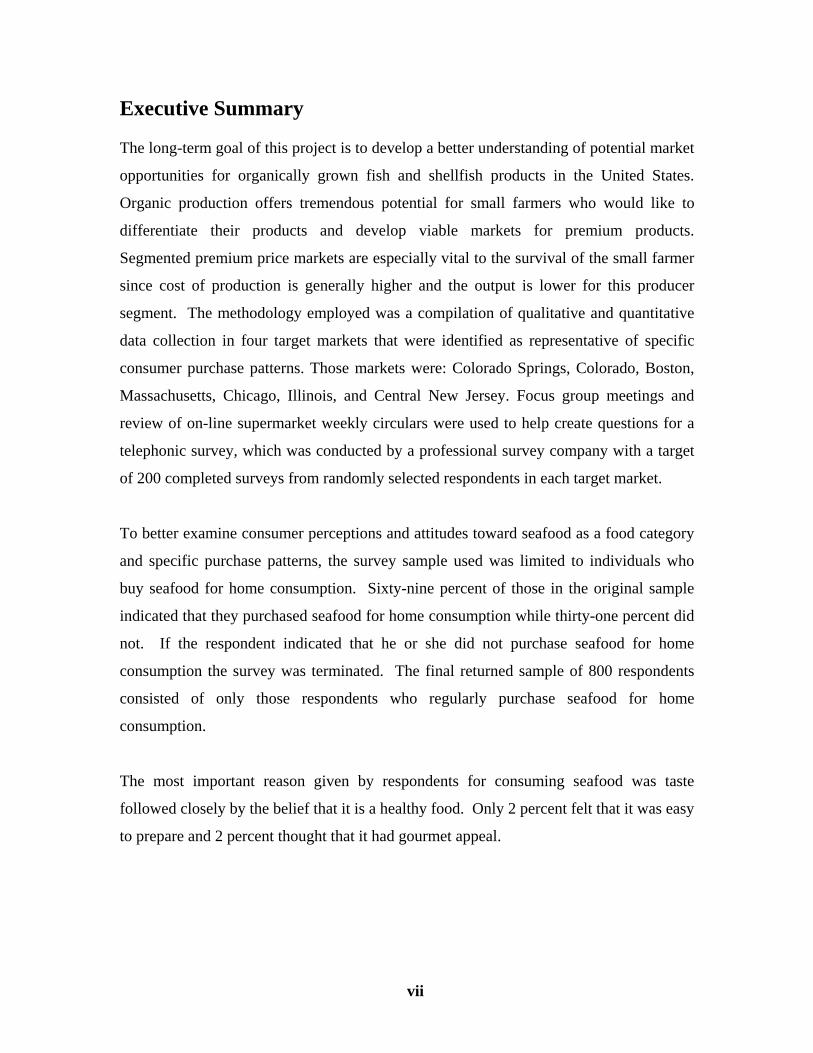
The most important reason given by respondents for consuming seafood was taste
followed closely by the belief that it is a healthy food. Only 2 percent felt that it was easy
to prepare and 2 percent thought that it had gourmet appeal.
viii
Figure 1
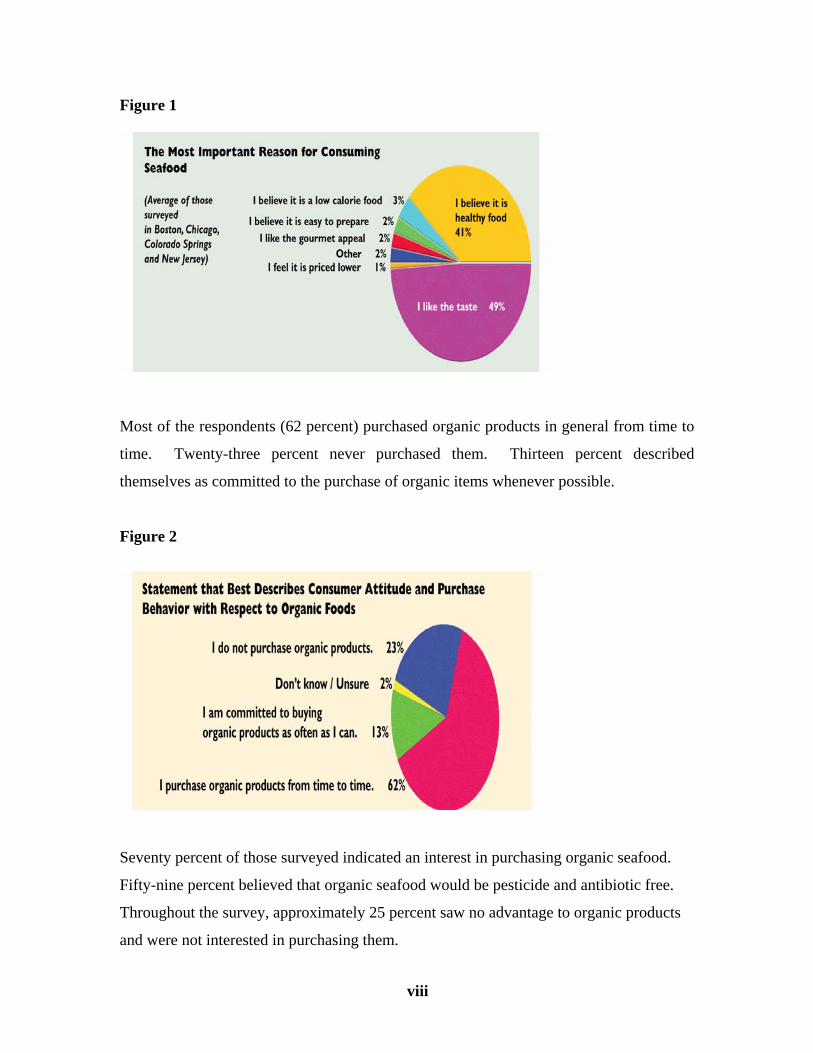
Most of the respondents (62 percent) purchased organic products in general from time to
time. Twenty-three percent never purchased them. Thirteen percent described
themselves as committed to the purchase of organic items whenever possible.
Figure 2
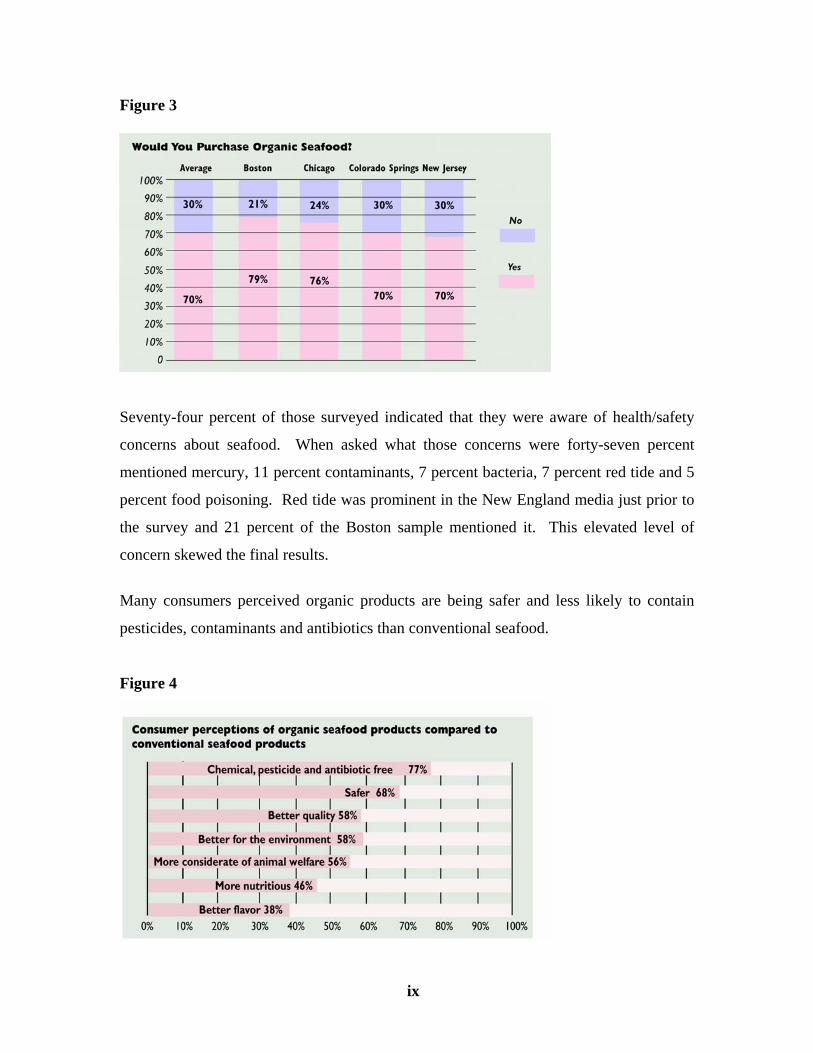
Seventy percent of those surveyed indicated an interest in purchasing organic seafood.
Fifty-nine percent believed that organic seafood would be pesticide and antibiotic free.
Throughout the survey, approximately 25 percent saw no advantage to organic products
and were not interested in purchasing them.
ix
Figure 3
Seventy-four percent of those surveyed indicated that they were aware of health/safety
concerns about seafood. When asked what those concerns were forty-seven percent
mentioned mercury, 11 percent contaminants, 7 percent bacteria, 7 percent red tide and 5
percent food poisoning. Red tide was prominent in the New England media just prior to
the survey and 21 percent of the Boston sample mentioned it. This elevated level of
concern skewed the final results.
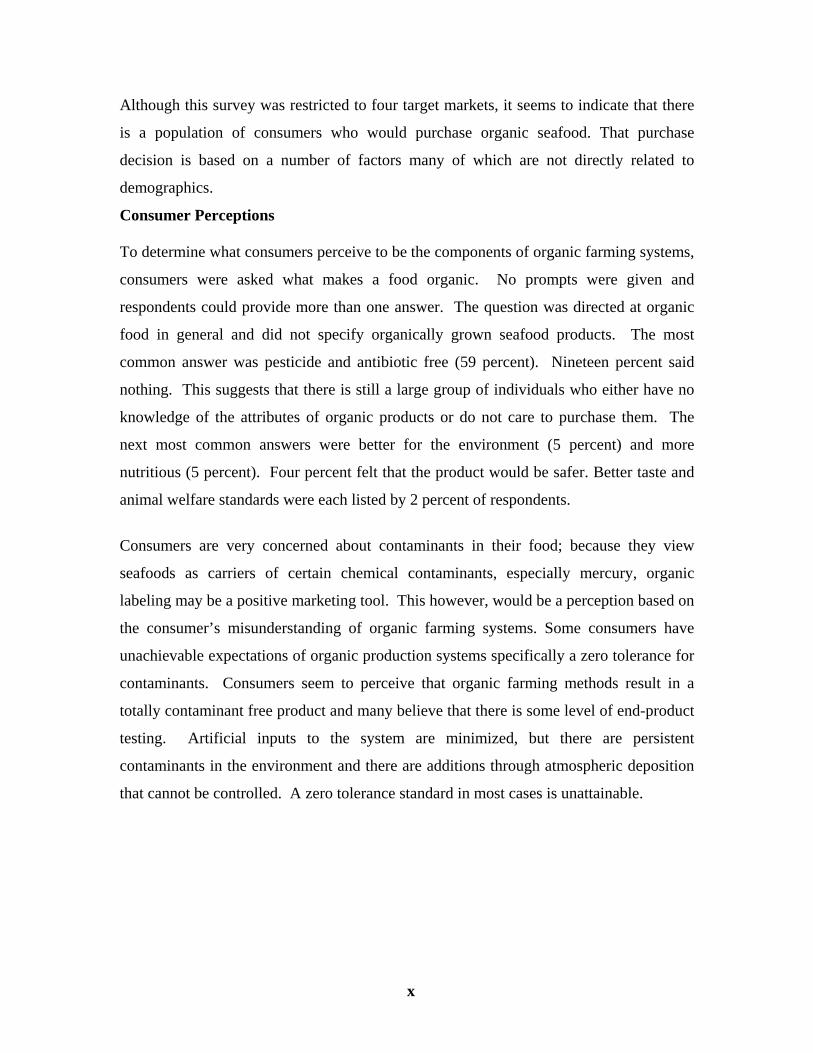
Many consumers perceived organic products are being safer and less likely to contain
pesticides, contaminants and antibiotics than conventional seafood.
Figure 4
x
Although this survey was restricted to four target markets, it seems to indicate that there
is a population of consumers who would purchase organic seafood. That purchase
decision is based on a number of factors many of which are not directly related to
demographics.
Consumer Perceptions To determine what consumers perceive to be the components of organic farming systems,
consumers were asked what makes a food organic. No prompts were given and
respondents could provide more than one answer. The question was directed at organic
food in general and did not specify organically grown seafood products. The most
common answer was pesticide and antibiotic free (59 percent). Nineteen percent said
nothing. This suggests that there is still a large group of individuals who either have no
knowledge of the attributes of organic products or do not care to purchase them. The
next most common answers were better for the environment (5 percent) and more
nutritious (5 percent). Four percent felt that the product would be safer. Better taste and
animal welfare standards were each listed by 2 percent of respondents.
Consumers are very concerned about contaminants in their food; because they view
seafoods as carriers of certain chemical contaminants, especially mercury, organic
labeling may be a positive marketing tool. This however, would be a perception based on
the consumer’s misunderstanding of organic farming systems. Some consumers have
unachievable expectations of organic production systems specifically a zero tolerance for
contaminants. Consumers seem to perceive that organic farming methods result in a
totally contaminant free product and many believe that there is some level of end-product
testing. Artificial inputs to the system are minimized, but there are persistent
contaminants in the environment and there are additions through atmospheric deposition
that cannot be controlled. A zero tolerance standard in most cases is unattainable.
xi
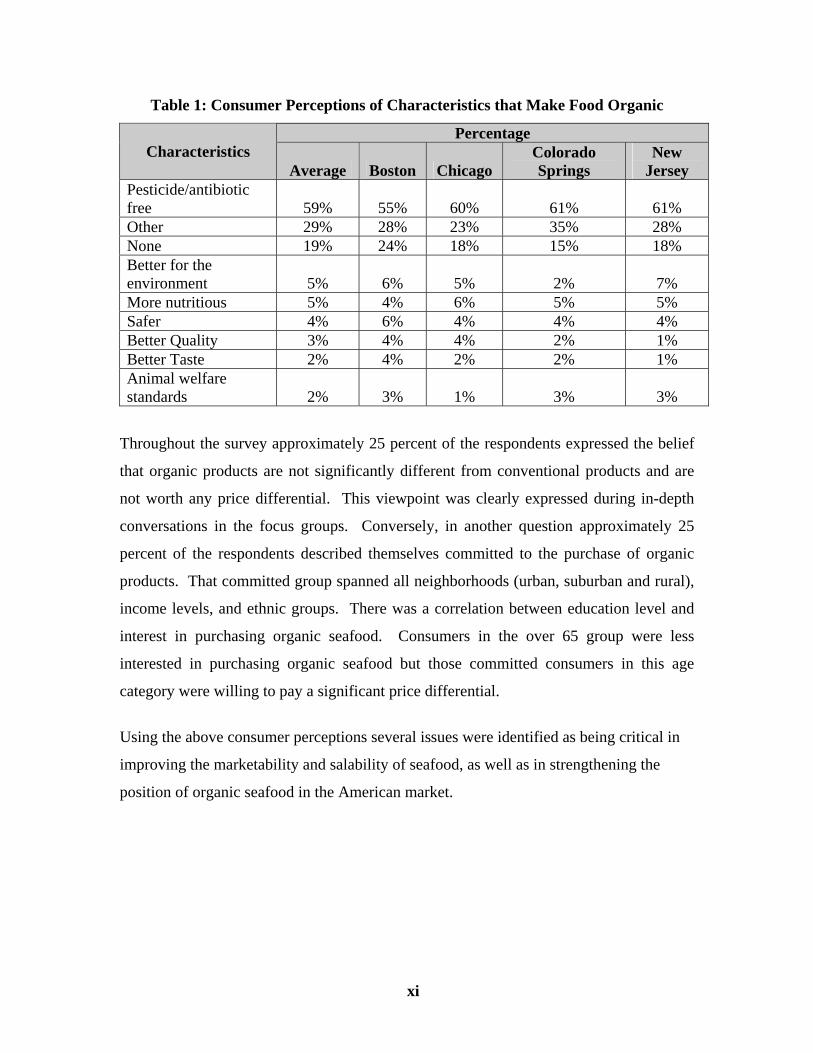
Table 1: Consumer Perceptions of Characteristics that Make Food Organic
Percentage Characteristics
Average Boston Chicago Colorado Springs
New Jersey
Pesticide/antibiotic free 59% 55% 60% 61% 61% Other 29% 28% 23% 35% 28% None 19% 24% 18% 15% 18% Better for the environment 5% 6% 5% 2% 7% More nutritious 5% 4% 6% 5% 5% Safer 4% 6% 4% 4% 4% Better Quality 3% 4% 4% 2% 1% Better Taste 2% 4% 2% 2% 1% Animal welfare standards 2% 3% 1% 3% 3%
Throughout the survey approximately 25 percent of the respondents expressed the belief
that organic products are not significantly different from conventional products and are
not worth any price differential. This viewpoint was clearly expressed during in-depth
conversations in the focus groups. Conversely, in another question approximately 25
percent of the respondents described themselves committed to the purchase of organic
products. That committed group spanned all neighborhoods (urban, suburban and rural),
income levels, and ethnic groups. There was a correlation between education level and
interest in purchasing organic seafood. Consumers in the over 65 group were less
interested in purchasing organic seafood but those committed consumers in this age
category were willing to pay a significant price differential.
Using the above consumer perceptions several issues were identified as being critical in
improving the marketability and salability of seafood, as well as in strengthening the
position of organic seafood in the American market.
1
Introduction
For the purposes of this report, the term seafood is used to characterize all freshwater
and saltwater finfish and shellfish used for food. Likewise, for the purposes of this
report, bivalve molluscan shellfish raised on leased beds are considered farm-raised,
although not all states include these shellfish as a farm-raised product.
Numerous groups have voiced concerns about the deteriorating American diet especially
among young people. Poor diet has led to an increase in diabetes, coronary heart disease,
obesity, which in turn has led to escalating health care costs. Indeed, the number one
cause of death in the United States remains coronary heart disease, although dietary and
lifestyle strategies could significantly change this statistic. Numerous groups including
the American Heart Association, the American Cancer Society, the American Academy
of Natural Sciences, the American Diabetes Association, and the United States
Department of Agriculture all recommend that Americans significantly increase their
consumption of seafood products to maintain good health.
Although consumers have generally positive attitudes toward seafood, its consumption in
the United States has remained relatively static over the past fifty years. Per capita annual
consumption reached a record 16.6 pounds in 2004 (National Marine Fisheries Service).
The top ten products consumed in 2004 were shrimp, canned tuna, salmon, pollock,
catfish, tilapia, crab, cod, clams and flatfish. (National Fisheries Institute). The fish
farming community increasingly supplies shrimp, salmon, catfish, tilapia and clams, so
that the list of top products reflects the growing importance of aquaculture in the
American market. Many speculate that the increase in consumption of farm-raised
products may be due to decreasing prices and increasing supply among those
commodities.
Fish and shellfish account for less than 8 percent of the total for all high protein animal
foods consumed in the United States and, for centuries, wild harvesting of fish and
shellfish provided the bulk of the seafood supply. Blake (2000) discusses how the
centuries old practice of harvesting fish from the wild is in jeopardy due to over-fishing.
2
According to Blake, in 2000 there were 96 species of fish that were classified as
“threatened” and it is estimated that by 2010 there will be 125. Although the United
States has developed an extensive fisheries management program designed to
significantly reduce by-catch, allow species to rebuild, and establish maximum
sustainable yields to help ensure the future of fishery stocks; the vast majority of seafood
consumed in the United States is imported. These imports often originate in countries
that do not have management programs for their wild catch and do not practice
environmentally sound aquaculture.
Although aquaculture is increasingly supplying the American market, many consumers
do not have a clear understanding of fish farming. This is further exacerbated by
misinformation and agenda-driven disinformation that is routinely provided to and
reported by the media. Robertson et al. (1999) conducted a survey of New England
residents to understand consumers’ knowledge and attitudes towards marine aquaculture
and found that most respondents (53.6 percent) were unfamiliar with aquaculture.
Currently aquaculture is the fastest growing food producing sector. In 2002, the Food and
Agriculture Organization (FAO) reported that world aquaculture production of fish,
crustaceans and mollusks totaled 39.8 million metric tons in comparison to captured
production of 93.2 million metric tons (Chan 2005). There are however concerns relating
to aquaculture that have put the industry under the intense scrutiny. Examples of health
concerns that have been widely reported in the media are levels of PCBs and use of
colorants in farmed salmon.
Concerns relating to health and the environment have led to an increased consumer desire
to purchase “natural,” “hormone-free”, and “antibiotic-free” fish and shellfish (Boehmer
at el., 2005). Consumers have come to recognize organic farming as a production
method that can satisfy that desire. Consumers view organic food as being produced
without synthetic pesticides, unnatural fertilizers, added growth hormones, antibiotics,
artificial additives, food coloring, ionizing radiation, and as not genetically modified in
any way. The United States Department of Agriculture (USDA) Organic Food
3
Production Act defines an organic production system as “a production system that is
managed in accordance with the Act and regulations in this part to respond to site-
specific conditions by integrating cultural, biological, and mechanical products that foster
cycling of resources, promote ecological balance and conserve biodiversity”
(www.ams.usda.gov/nop/NOP/standards.html). The USDA focus is the production
system rather than the resulting product.
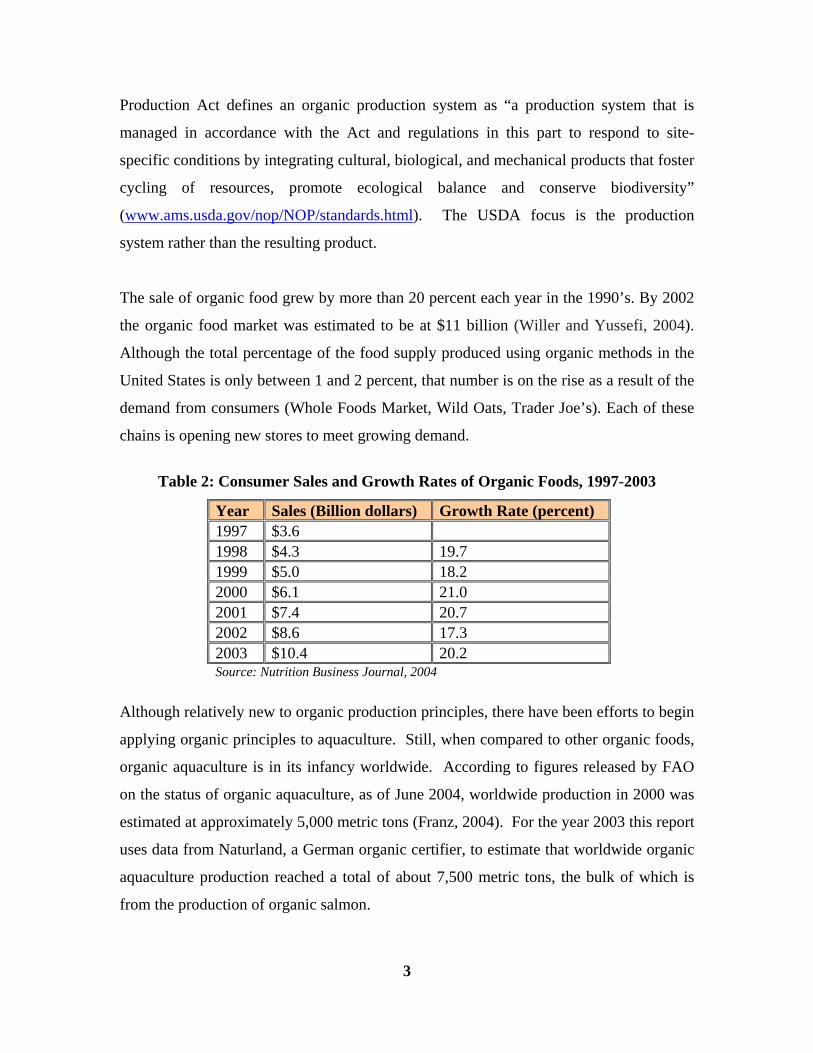
The sale of organic food grew by more than 20 percent each year in the 1990’s. By 2002
the organic food market was estimated to be at $11 billion (Willer and Yussefi, 2004).
Although the total percentage of the food supply produced using organic methods in the
United States is only between 1 and 2 percent, that number is on the rise as a result of the
demand from consumers (Whole Foods Market, Wild Oats, Trader Joe’s). Each of these
chains is opening new stores to meet growing demand.
Table 2: Consumer Sales and Growth Rates of Organic Foods, 1997-2003
Year Sales (Billion dollars) Growth Rate (percent) 1997 $3.6 1998 $4.3 19.7 1999 $5.0 18.2 2000 $6.1 21.0 2001 $7.4 20.7 2002 $8.6 17.3 2003 $10.4 20.2 Source: Nutrition Business Journal, 2004
Although relatively new to organic production principles, there have been efforts to begin
applying organic principles to aquaculture. Still, when compared to other organic foods,
organic aquaculture is in its infancy worldwide. According to figures released by FAO
on the status of organic aquaculture, as of June 2004, worldwide production in 2000 was
estimated at approximately 5,000 metric tons (Franz, 2004). For the year 2003 this report
uses data from Naturland, a German organic certifier, to estimate that worldwide organic
aquaculture production reached a total of about 7,500 metric tons, the bulk of which is
from the production of organic salmon.
4
A study funded by the EU FAIR Programme (Aarset, 2000) to understand European
consumers perception of organic salmon production; revealed that the term ‘organic’ as it
applies to salmon created a great deal of confusion. In general, respondents indicated an
expectation that organic salmon should be environmentally friendly and be produced in a
sustainable manner. This expectation is justified, however, there is so much negative
press about salmon farming systems ( generally focused on intensive production methods,
possibility of escape and contamination of wild gene pools, excessive waste production,
use of drugs, colorants, etc.), that it is difficult to reconcile the two prospectives. In
addition to leaving consumers confused about the terminology, organic aquaculture is a
tough sell among many consumers in Europe. A study done by Seafish Research and
Information (Gross, 2001) surveyed housewives in the UK to understand consumer
attitudes and concluded that the concept of organic seafood did not resonate among
highly committed organic food consumers. These consumers believe that “the concept of
organic seafood lacks credibility.” This lack of credibility existed even though there is an
established organic seal developed by the UK Soils Association.
In the U.S., a survey of seafood consumers conducted by the Seafood Choices Alliance
(2001) indicates interest by a sizable number of respondents in consuming organic
seafood. When respondents were asked how likely they would be to purchase fish
labeled “organic” over a fish of the same species or a similar tasting fish, 36 percent
described themselves as at least somewhat more likely to purchase the product labeled
organic compared to 16 percent who responded less likely. This study looked only at
label considerations and did not include a price component.
5
Research Objectives
The long-term goal of this project is to develop a better understanding of potential market
opportunities for organically grown fish and shellfish products in the United States.
Organic production offers tremendous potential for small farmers who would like to
differentiate their products and develop viable markets for premium products.
Segmented premium price markets are especially vital to the survival of the small farmer
since cost of production is generally higher and the output is lower for this producer
segment.
Availability of appropriate market intelligence will assist farmers in meeting the
challenges of a global market. It will allow industry to adjust business and market
planning to develop innovative strategies that can support viable price structures over the
long term.
Marketability of organically grown fish and shellfish is a national priority supported by
the National Organic Aquaculture Working Group, which operates under the auspices of
the USDA Agriculture Marketing Service National Organic Program and the National
Fisheries Institute, a Washington-based industry trade group. This group provided a draft
set of Organic Standards to the National Organic Standards Board for review. Currently,
there are no accepted standards in the United States for the production of organic
seafood. The lack of standards means that imported product can bear the seal of a foreign
certifying agency and be sold as organic in all states except California. Numerous
European certifying agencies have adopted standards for specific aquacultured products
and labeled product is making its way into the United States market and potentially
capturing long-term market share.
The project identifies those components of “brand” (organically-grown) utility which are
most potent in developing and increasing market share. It provides an in-depth analysis
of consumer and retailer perceptions of seafood, farm-raised seafood and organically
grown

6
seafood in four target markets. The project identifies barriers to consumer acceptance
and suggests possible remedies to lower these barriers. It provides insights into the most
viable markets and market penetration strategies for organically grown seafood products.
The potency of descriptors such as “natural”, “environmentally friendly” and
“sustainable” that could be used on product labels in addition to the federally mandated
term “farm-raised” is explored. The influence of the recently adopted requirement for
country of origin and method of production labeling on purchase decision is evaluated.
For the consumer, the availability of organically grown aquatic products will increase
their comfort level and possibly increase their willingness to purchase and prepare
seafood products for their families. This shift would greatly add to the quality of the
American diet.
Methodology The methodology employed was a compilation of qualitative and quantitative data
collection in four target markets that were identified as representative of specific
consumer purchase patterns. Those markets were: Colorado Springs, Colorado (land-
locked market without a strong seafood consumption tradition but with an influx of
consumers from across the country); Boston, Massachusetts (strong market with a highly
developed seafood tradition); Chicago, Illinois (an inland market that purchases a high
volume of bivalve molluscan shellfish); and Central New Jersey (an affluent, well
educated market).
Prior to the telephone survey, focus group meetings and on-line supermarket weekly
circulars were reviewed to help identify those farmed seafood products that were most
commonly sold in each of the four target markets. The focus groups were also used to
focus and frame the questions for the telesurvey. Price points for those products also
were considered. In several instances, survey questions were developed to mimic
questions asked in other similar studies (specifically Gross 2001) to provide benchmarks.
The focus
7
groups provided direction for a larger telephone survey in each of the target markets. The
telesurvey was developed jointly by staffs at the New Jersey Department of Agriculture
and the Agricultural, Food and Resource Economics group at Rutgers University.
The telephone survey was created with the aim of collecting key information relating to
United States consumers awareness and knowledge of organic aquatic foods, willingness
to pay premium for organic seafood, attitudes towards risks and benefits of different
types of seafoods. Information was also gathered on consumer knowledge and attitudes
relating to product labeling showing country of origin (COOL). A professional telephone
survey company was hired to conduct the survey and phone numbers were randomly
generated. Two hundred telephone surveys were completed utilizing the computer-
assisted telephone interview (CATI) technology in each of the four target markets for a
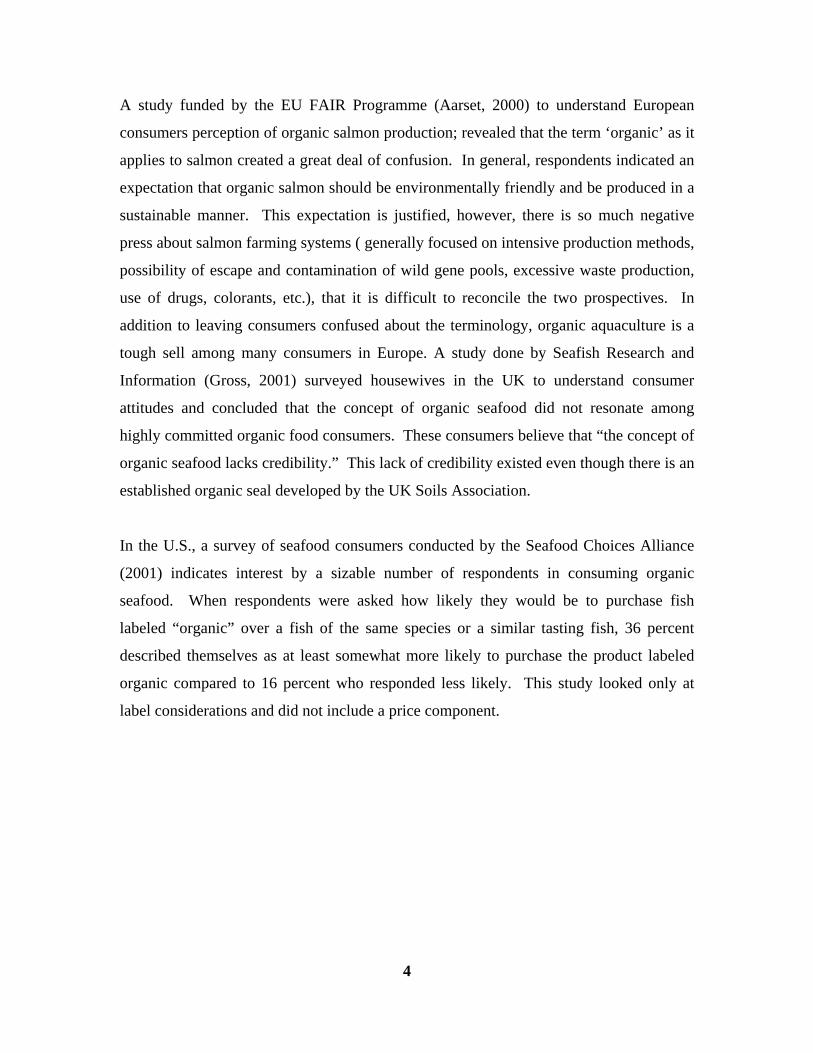
total of 800 surveys. The telephone surveys were limited to individuals (69%) who
actually purchase seafood for home consumption.
Figure 5
To better examine consumer perceptions and attitudes toward seafood as a food category
and specific purchase patterns, the sample was limited to individuals who buy seafood for
home consumption. Sixty-nine percent of the original sample indicated that they
purchased seafood for home consumption while thirty-one percent did not. If the
respondent indicated that he or she did not purchase seafood for home consumption, the
survey was terminated.
8
The survey took a drill down approach. Consumers were first asked about attitudes
toward seafood in general, then farm-raised seafoods, and finally organically grown
seafoods. This approach provides background information so that attitudes about
organically grown seafoods can be considered in comparison and contrast to the entire
seafood product category. In some instances, questions were posed in more than one
format. This provided an opportunity to verify responses.
In evaluating the data collected, many of the questions require a response to a single facet
question while the actual purchase decision is based on an array of product attributes in
addition to other factors. When considering responses to questions dealing with organic
seafood, a comparison to overall attitudes about farm-raised product versus wild harvest
should be considered. This is especially important since many consumers believe that
they lack knowledge about purchase and preparation of seafood. This has been an
ongoing issue for the seafood industry as a whole. This belief is manifested in surveys
and discussion groups where consumers indicate that they rely heavily on the seafood
associates to make purchase decisions. This is not the case with most other center of the
plate protein choices.
After the consumer telesurvey phase of the project was completed, a survey of chain store
seafood managers was conducted. The survey focused on their attitudes toward organic
seafood and their willingness and ability to include such products in their seafood
programs. Several questions focused on their perception of their specific consumers’
attitudes toward seafood.
9
Survey Results Demographics Fifty-three percent of the households surveyed were 1-2 person, while 35 percent were 3-
4 person households. Sixty-four percent of the respondents were female and 36 percent
male. Twenty-five percent considered their neighborhood to be urban, 62 percent
suburban and 10 percent rural. Thirty-four percent were between 36 and 50 years of age,
28 percent between 51 and 65, 21 percent over 65, 14 percent between 21 and 35 and 1
percent younger than 20. The survey was slightly biased toward older consumers
because of the time the survey was conducted, the length of the survey and the greater
willingness among older consumers to participate. Higher levels of seafood consumption
among these older individuals might also have been a factor since many consumers
indicated that they are aware of the heart healthy benefits of seafood. Twenty-seven
percent of those surveyed refused to answer the question dealing with income. Seventeen
percent reported household incomes in-between $50-$75,000, 16 percent $25-$50,000,
15 percent $75-$100,000, 7 percent under $25,000 and 6 percent over $100,000. Fifty
percent were employed full time, 25 percent retired, 10 percent employed part-time, 8
percent homemakers, and 2 percent unemployed but looking for work.
Forty-three percent of those surveyed consumed seafood at home 1-2 times per month
while 31 percent ate seafood at home 3-4 times per month. Only 14 percent reported
consuming seafood at home 5-6 times per month, 6 percent 7-8 times per month and 6
percent 9 or more times per month. Currently, most health organizations recommend a
minimum of two eight-ounce uncooked weight fish servings per week. According to
FDA statistics, the average per capita U.S. weekly consumption is 2.292 ounces, which is
only 14 percent of the recommended intake. In this survey, only 12 percent of those
sampled were consuming the recommended amount of seafood.

10
Reasons for Consuming Seafood The most important reason for consuming seafood was taste as reported by 49 percent of
the respondents while 41 percent indicated health benefits. This is similar to the results
in the survey of consumers in the New York metropolitan area conducted by Gall and
O’Dierno (1992). The ranking of results in the survey was: I purchase seafood because
1) I like the taste; 2) I believe it is a healthy food choice, and 3) I believe it is a low
calorie food.
Table 3: The Most Important Reason for Consuming Seafood
Percentage Reason Average Boston Chicago Colorado Springs New JerseyLike the taste 49% 48% 43% 55% 49% I believe it is healthy food 41% 42% 43% 35% 42%
I believe it is a low calorie food 3% 2% 5% 3% 3%
I believe it is easy to prepare 2% 3% 2% 2% 2%
I like the gourmet appeal 2% 1% 3% 2% 1%
I feel it is priced lower 1% 2% 1% 1% 1%
Other 2% 2% 3% 2% 2%
In the current study, only two percent of the sample felt that it was easy to prepare and
two percent thought it had gourmet appeal. During the focus group portion of the project,
several people indicated that they don’t buy shrimp for home consumption because it is
too difficult to prepare. Both of these attitudes should be relatively simple to change with
a good promotional campaign. One percent felt it was low priced. Currently, the price
gap between seafood and other center of the plate protein choices such as poultry and red
meat is shrinking. This may be a marketable moment for seafood products but it will
require a directed effort to convince consumers.
11
Factors/Information that would induce consumer to purchase more
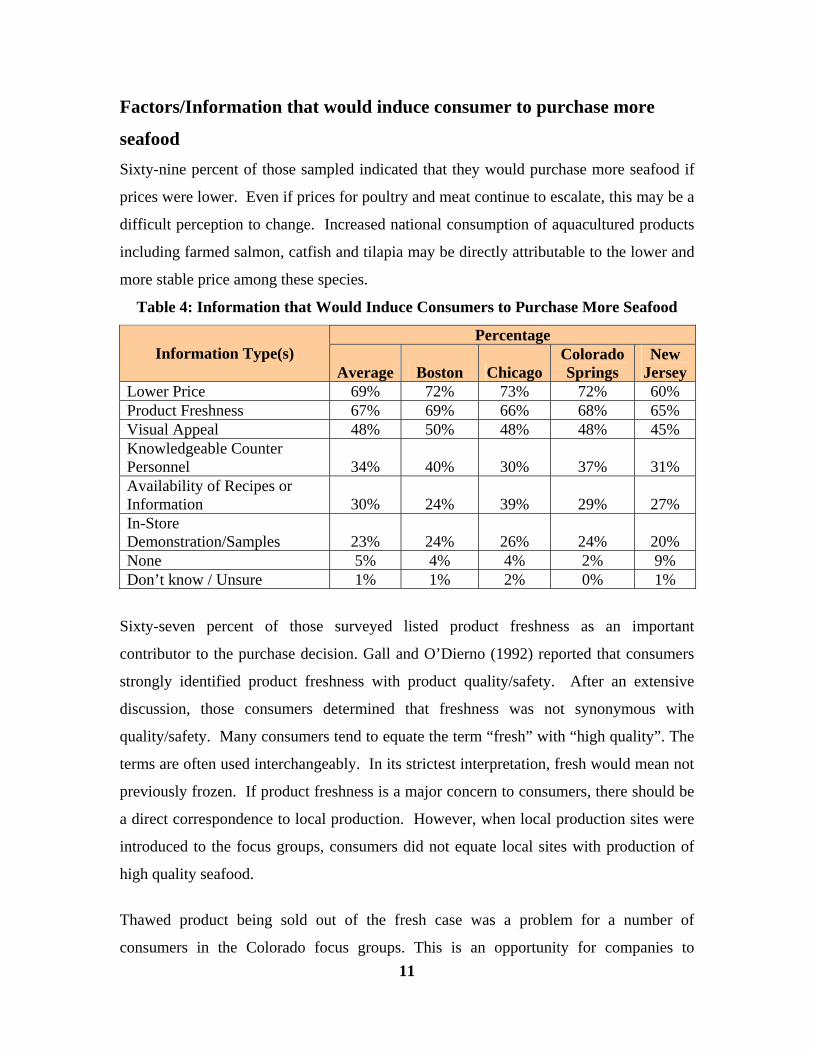
seafood Sixty-nine percent of those sampled indicated that they would purchase more seafood if
prices were lower. Even if prices for poultry and meat continue to escalate, this may be a
difficult perception to change. Increased national consumption of aquacultured products
including farmed salmon, catfish and tilapia may be directly attributable to the lower and
more stable price among these species.
Table 4: Information that Would Induce Consumers to Purchase More Seafood
Percentage Information Type(s)
Average Boston ChicagoColorado Springs
New Jersey
Lower Price 69% 72% 73% 72% 60% Product Freshness 67% 69% 66% 68% 65% Visual Appeal 48% 50% 48% 48% 45% Knowledgeable Counter Personnel 34% 40% 30% 37% 31% Availability of Recipes or Information 30% 24% 39% 29% 27% In-Store Demonstration/Samples 23% 24% 26% 24% 20% None 5% 4% 4% 2% 9% Don’t know / Unsure 1% 1% 2% 0% 1%
Sixty-seven percent of those surveyed listed product freshness as an important
contributor to the purchase decision. Gall and O’Dierno (1992) reported that consumers
strongly identified product freshness with product quality/safety. After an extensive
discussion, those consumers determined that freshness was not synonymous with
quality/safety. Many consumers tend to equate the term “fresh” with “high quality”. The
terms are often used interchangeably. In its strictest interpretation, fresh would mean not
previously frozen. If product freshness is a major concern to consumers, there should be
a direct correspondence to local production. However, when local production sites were
introduced to the focus groups, consumers did not equate local sites with production of
high quality seafood.
Thawed product being sold out of the fresh case was a problem for a number of
consumers in the Colorado focus groups. This is an opportunity for companies to
12
aggressively educate consumers about the quality of frozen products that are produced
using new improved technologies. Frozen product fits into modern lifestyles. Purchasing
frozen product allows consumers to prepare seafood more frequently because they can
shop once a week and still eat seafood several times during the week. In the focus group
portion of this study, many consumers were limited in the number of times that they
would eat seafood by the number of shopping trips they were willing to make. It was
generally agreed among focus group participants that seafood should be consumed on the
day of purchase or the next day at the very latest. Inland consumers in the Colorado focus
groups were concerned about the distance seafood had to travel to reach the market.
Many complained about thawed product that was being sold in the fresh case even when
that product was clearly marked previously frozen, perceiving this as a deceptive
practice.
Visual appeal of the product was listed as being important by 48 percent of those
surveyed and 34 percent felt that knowledgeable counter personnel were important. Both
of these responses highlight the importance of sales associates in driving seafood
purchases. Consumers tend to lack confidence in their ability to select seafood and often
depend on store associates to help them make a decision. Purchase is often based on the
reputation of the store. Many of the consumers in the focus groups indicated that they
restrict their purchase of seafood to specific stores because those are the stores that sell
good quality seafood. Many consumers in the focus groups had a good relationship with
the sales associate and, clearly depended upon his/her suggestions and advice.
In the Gall and O’Dierno (1992) study, consumers were asked what influences the
purchase decision at the seafood counter. Product freshness was the most important
factor while price was second, visual appeal scored third and confidence in the seafood
department fourth.
In the current study, thirty percent wanted more information and recipes. Twenty-three
percent wanted in-store demonstrations and samples. This is similar to opinions voiced
during the focus groups where consumers wanted more information and were unwilling
13
72% 75% 69% 72% 71%
13% 10% 15% 11% 16%
15% 15% 16% 17% 13%
0%10%20%30%40%50%60%70%80%90%
100%
Average Boston Chicago Colorado N.J.
DK/ Unsure
No
Yes
to purchase a new product unless they sampled it first. Demonstrations and sampling
programs are an effective means to entice customers to purchase new or unfamiliar items.
These activities allow customers to taste new products and reduce the anxieties that can
develop if they are not sure that they will like a product when they prepare it at home.
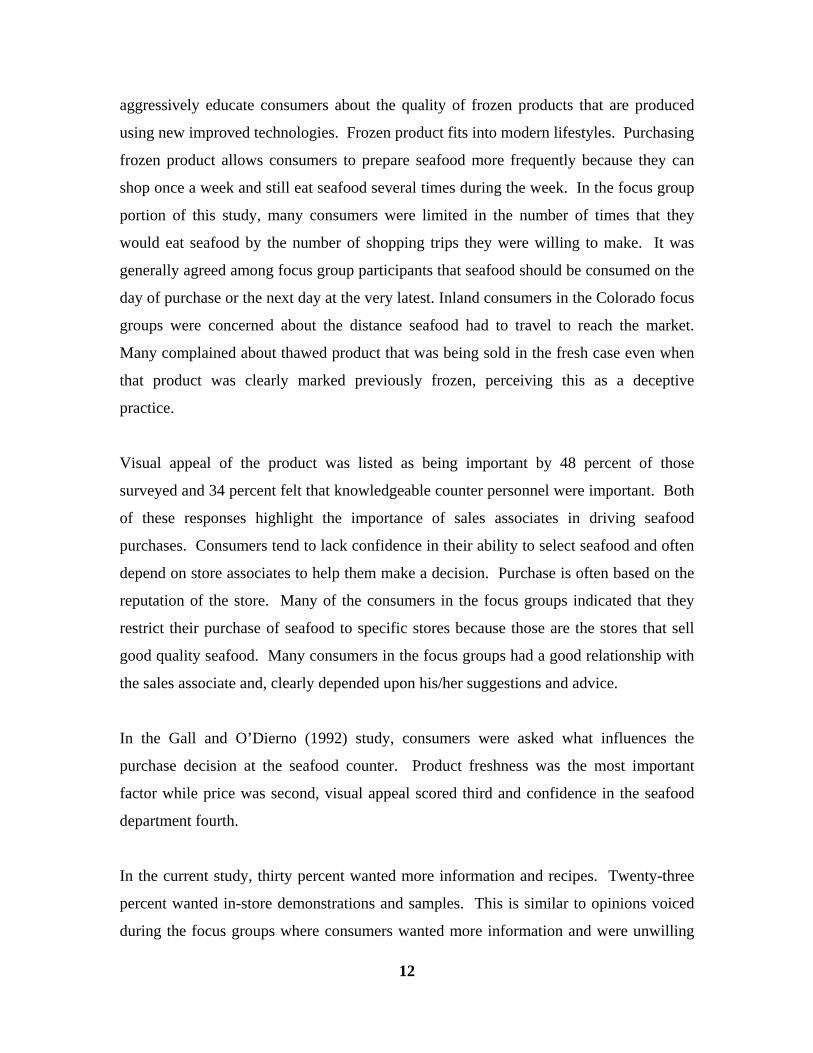
Seafood Inspection Seventy-two percent of the consumers surveyed felt that seafood was being inspected.
Thirteen percent felt that it was not being inspected and fifteen percent were unsure. The
numbers were fairly consistent in each of the markets. During the focus groups,
consumers were unclear about which agency was actually conducting the inspections.
Many people discussed USDA since they were familiar with meat and poultry inspection.
Some people in the focus groups also thought that it was the store that inspected the
product for quality and safety.
Figure 6: Do Consumers Believe Seafood is Being Inspected for Quality and Safety?
Country of Origin Labeling The survey was conducted during August of 2005 a full four months after the USDA
country of origin labeling rule had been implemented so that stores had already begun
complying with the mandatory rule requiring retailers to list production method (wild
caught or farm-raised) and country of origin for all seafood products.
14
30% 32% 27% 27% 33%
69% 68% 72% 72% 66%
1% 1% 1% 1%
0%10%20%30%40%50%60%70%80%90%
100%
Average Boston Chicago Colorado N.J.
DK/ Unsure
No
Yes
82% 80% 86% 82% 82%
14% 17% 10% 13% 15%
4% 3% 4% 3%5%
0%10%20%30%40%50%60%70%80%90%
100%
Average Boston Chicago Colorado N.J.
DK / Unsure
No
Yes
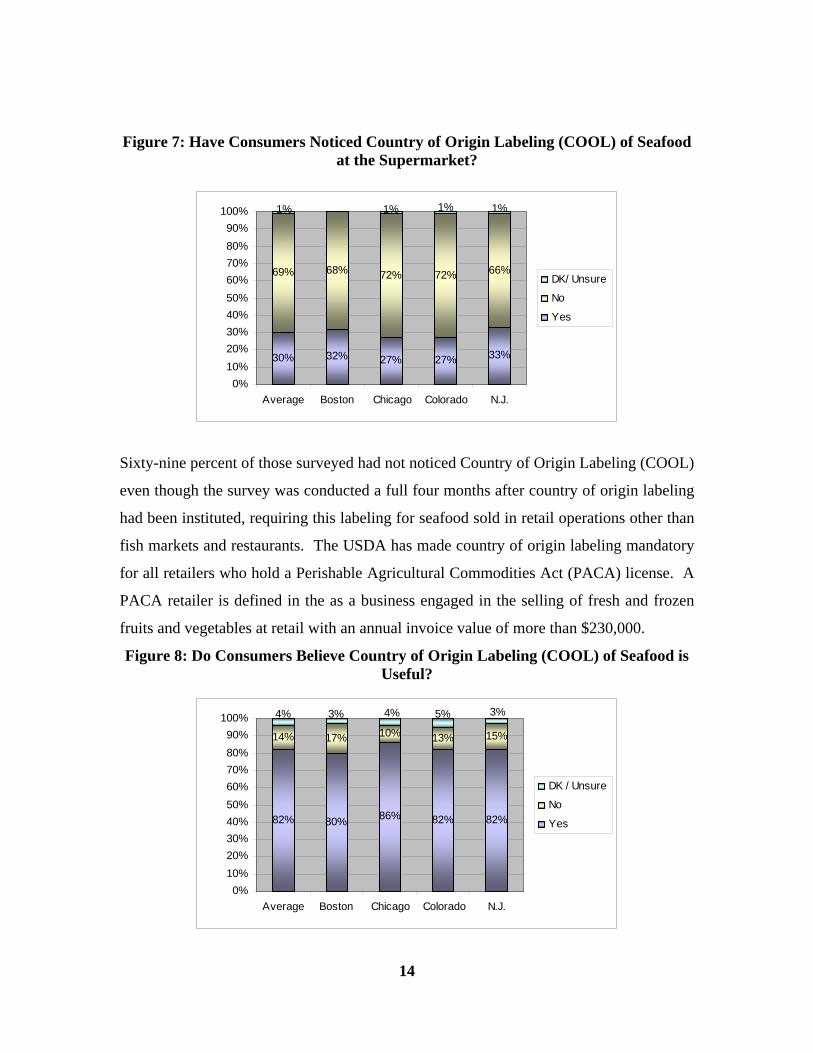
Figure 7: Have Consumers Noticed Country of Origin Labeling (COOL) of Seafood at the Supermarket?
Sixty-nine percent of those surveyed had not noticed Country of Origin Labeling (COOL)
even though the survey was conducted a full four months after country of origin labeling
had been instituted, requiring this labeling for seafood sold in retail operations other than
fish markets and restaurants. The USDA has made country of origin labeling mandatory
for all retailers who hold a Perishable Agricultural Commodities Act (PACA) license. A
PACA retailer is defined in the as a business engaged in the selling of fresh and frozen
fruits and vegetables at retail with an annual invoice value of more than $230,000.
Figure 8: Do Consumers Believe Country of Origin Labeling (COOL) of Seafood is Useful?
15
60% 59% 64% 58% 57%
37% 39% 32% 38% 40%
3% 2% 4% 3%4%
0%10%
20%30%
40%50%
60%70%
80%90%
100%
Average Boston Chicago Colorado N.J.
DK / Unsure
No
Yes
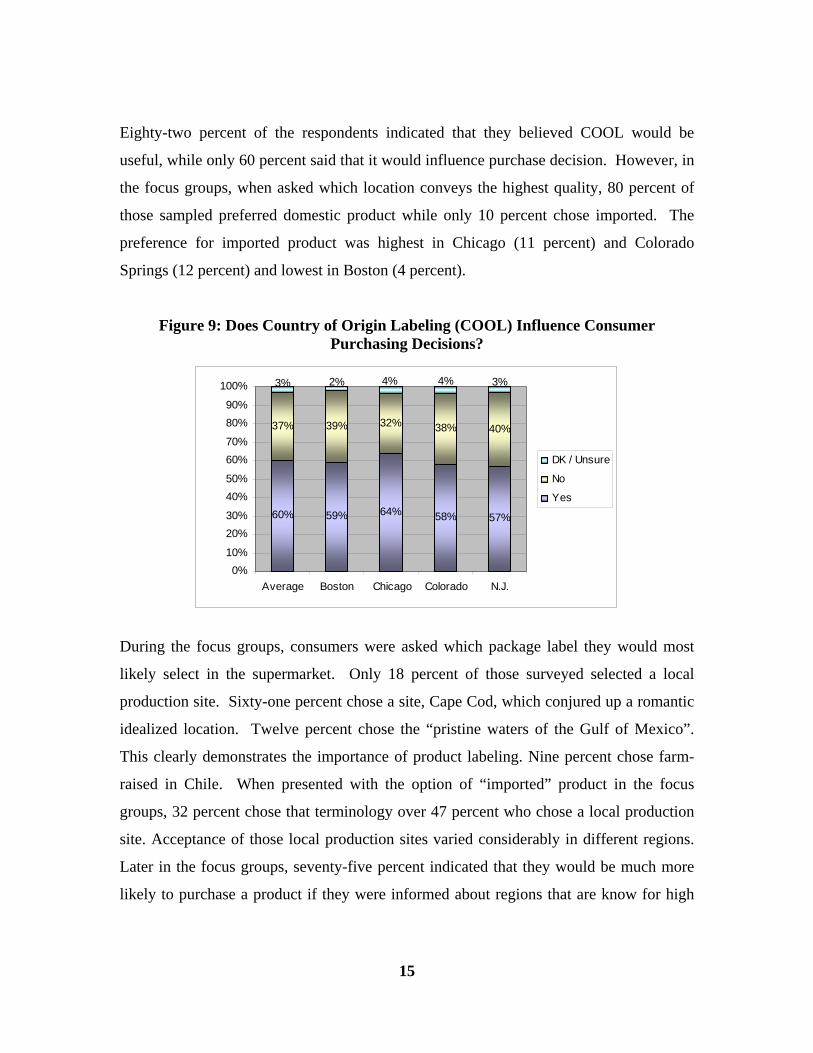
Eighty-two percent of the respondents indicated that they believed COOL would be
useful, while only 60 percent said that it would influence purchase decision. However, in
the focus groups, when asked which location conveys the highest quality, 80 percent of
those sampled preferred domestic product while only 10 percent chose imported. The
preference for imported product was highest in Chicago (11 percent) and Colorado
Springs (12 percent) and lowest in Boston (4 percent).
Figure 9: Does Country of Origin Labeling (COOL) Influence Consumer Purchasing Decisions?
During the focus groups, consumers were asked which package label they would most
likely select in the supermarket. Only 18 percent of those surveyed selected a local
production site. Sixty-one percent chose a site, Cape Cod, which conjured up a romantic
idealized location. Twelve percent chose the “pristine waters of the Gulf of Mexico”.
This clearly demonstrates the importance of product labeling. Nine percent chose farm-
raised in Chile. When presented with the option of “imported” product in the focus
groups, 32 percent chose that terminology over 47 percent who chose a local production
site. Acceptance of those local production sites varied considerably in different regions.
Later in the focus groups, seventy-five percent indicated that they would be much more
likely to purchase a product if they were informed about regions that are know for high

16
69% 69% 72% 64%74%
26% 26% 25%30%
22%
5% 5%4%3%
6%
0%10%20%30%40%50%60%70%80%90%
100%
Average Boston Chicago Colorado N.J.
DK / Unsure
No
Yes
quality. These responses seem to indicate that food miles are not as important as the
consumer’s general perception of the growing area.
Eco-Labeling Sixty-nine percent indicated that an “environmentally-friendly” label would influence the
purchase decision. This was about the same percentage as those that felt country of
origin labeling (60 percent) would influence their purchase decisions. This number was
lowest in Colorado (64 percent) and highest in New Jersey (74 percent).
When retailers were asked whether or not consumers would choose an environmentally
friendly label, only 50 percent thought that it would drive the purchase decision.
Figure 10: Would an “Environmentally-Friendly” Label affect Consumer Purchasing Decision?
Seafood and Health Seventy-four percent of those surveyed were aware of health concerns about seafood.
The highest level of awareness was in New Jersey where 80 percent reported that there
were health concerns about seafood. The second highest number was 78 percent in
Boston. Many consumers in Boston were familiar with the red tide issues that had
widespread press in 2005. Colorado had the lowest level of awareness at 65 percent.

17
Figure 11: Are Consumers Aware of any Health Concerns with Seafood?
Consumers were asked what specific concerns they had heard. No prompts were given.
Sixty-five percent had heard concerns about mercury, 15 percent mentioned contaminants
in general, 7 percent identified bacterial concerns, and 6 percent food poisoning. In both
Chicago and Colorado Springs, people specifically mentioned cadmium as a concern.
Although people were aware of possible health concerns, the quantitative portion of the
study did not provide any insights into the overall level of understanding.
Table 5: Consumer Perception of Health Concerns with Seafood.
Percentage Health Concerns Average Boston Chicago Colorado Springs New JerseyMercury 65% 66% 68% 58% 69% Other 24% 22% 23% 31% 24% Contaminants 15% 10% 11% 22% 18% Red Tide 9% 30% 1% 2% 2% Bacteria 9% 6% 12% 12% 8% Food Poisoning 6% 4% 8% 7% 7% PCBs 3% 3% 1% 5% 4% Cholesterol 2% 4% 0% 1% 3% Viruses 2% 1% 6% 2% 1% Colorants 1% 1% 1% 0% 3% Cadmium 1% 0% 1% 2% 0%
74% 78% 73% 65%80%
24% 21% 25% 19%31%
1%2%2% 4%1%
0%10%20%30%40%50%60%70%80%90%
100%
Average Boston Chicago Colorado N.J.
DK / Unsure
No
Yes
18
Farm-Raised Seafood Purchase Patterns
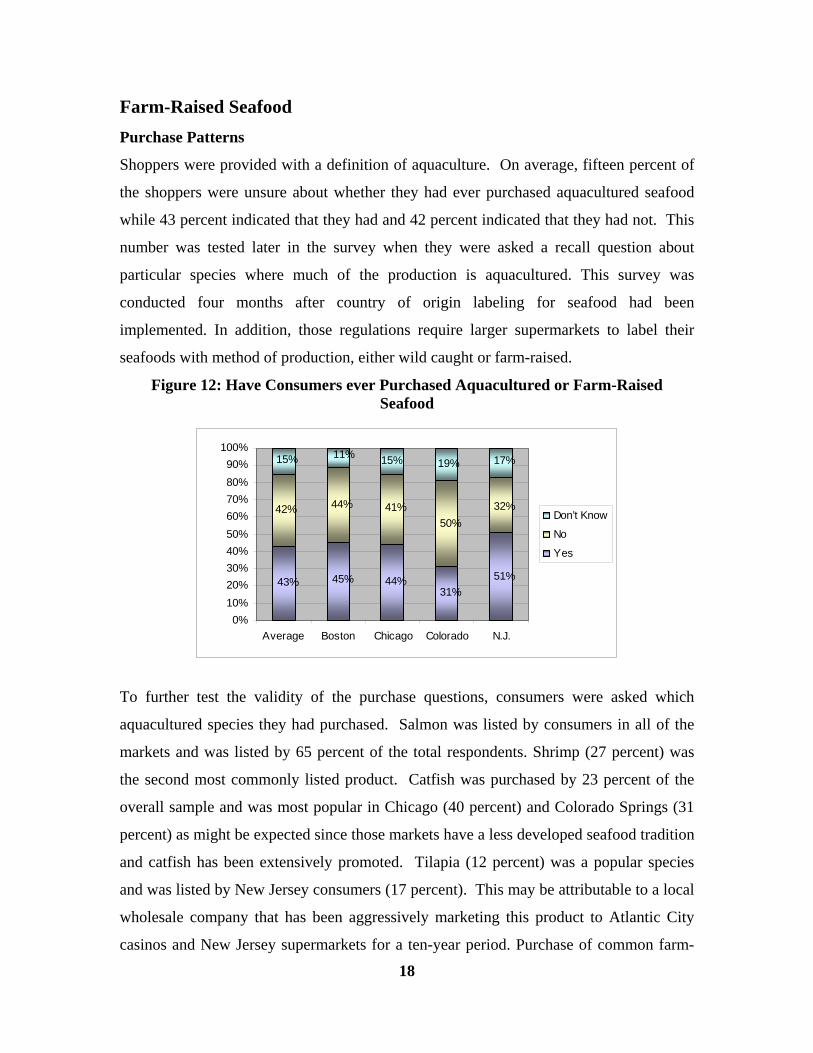
Shoppers were provided with a definition of aquaculture. On average, fifteen percent of
the shoppers were unsure about whether they had ever purchased aquacultured seafood
while 43 percent indicated that they had and 42 percent indicated that they had not. This
number was tested later in the survey when they were asked a recall question about
particular species where much of the production is aquacultured. This survey was
conducted four months after country of origin labeling for seafood had been
implemented. In addition, those regulations require larger supermarkets to label their
seafoods with method of production, either wild caught or farm-raised.
Figure 12: Have Consumers ever Purchased Aquacultured or Farm-Raised Seafood
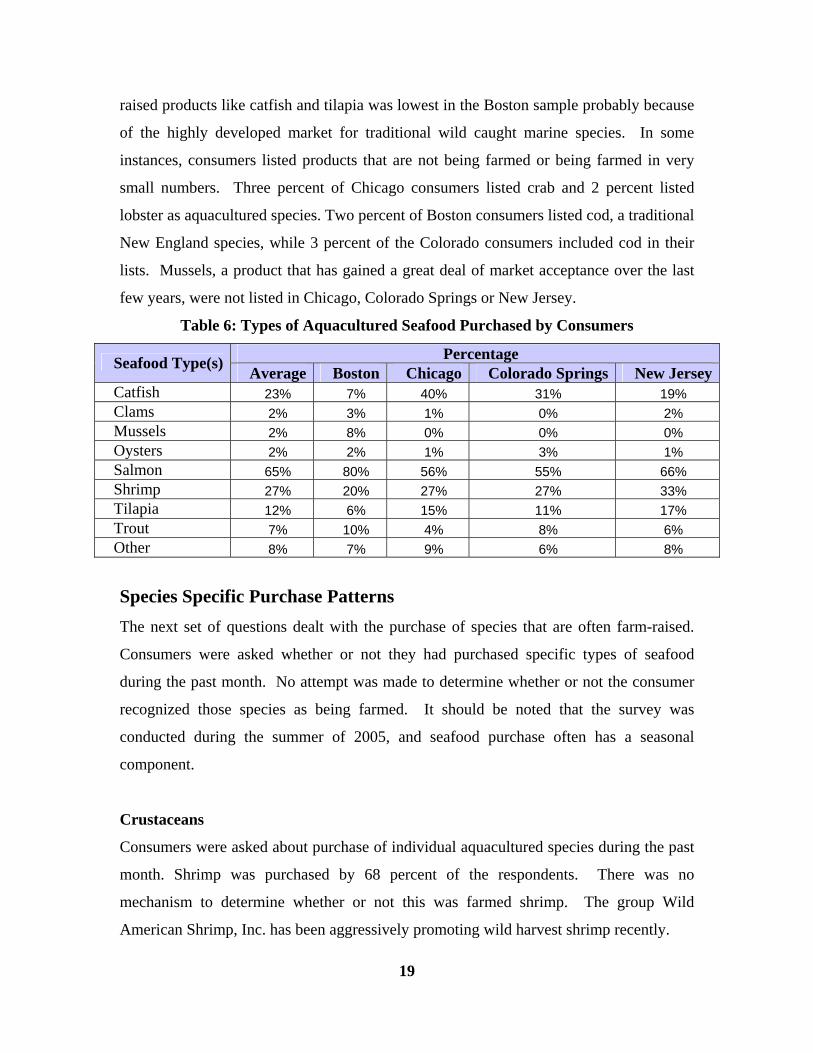
To further test the validity of the purchase questions, consumers were asked which
aquacultured species they had purchased. Salmon was listed by consumers in all of the
markets and was listed by 65 percent of the total respondents. Shrimp (27 percent) was
the second most commonly listed product. Catfish was purchased by 23 percent of the
overall sample and was most popular in Chicago (40 percent) and Colorado Springs (31
percent) as might be expected since those markets have a less developed seafood tradition
and catfish has been extensively promoted. Tilapia (12 percent) was a popular species
and was listed by New Jersey consumers (17 percent). This may be attributable to a local
wholesale company that has been aggressively marketing this product to Atlantic City
casinos and New Jersey supermarkets for a ten-year period. Purchase of common farm-
15%
51%31%
44%45%43%
42% 44% 41%50%
32%
11%15% 17%19%
0%10%20%30%40%50%60%70%80%90%
100%
Average Boston Chicago Colorado N.J.
Don’t Know
No
Yes
19
raised products like catfish and tilapia was lowest in the Boston sample probably because
of the highly developed market for traditional wild caught marine species. In some
instances, consumers listed products that are not being farmed or being farmed in very
small numbers. Three percent of Chicago consumers listed crab and 2 percent listed
lobster as aquacultured species. Two percent of Boston consumers listed cod, a traditional
New England species, while 3 percent of the Colorado consumers included cod in their
lists. Mussels, a product that has gained a great deal of market acceptance over the last
few years, were not listed in Chicago, Colorado Springs or New Jersey.
Table 6: Types of Aquacultured Seafood Purchased by Consumers
Percentage Seafood Type(s) Average Boston Chicago Colorado Springs New JerseyCatfish 23% 7% 40% 31% 19% Clams 2% 3% 1% 0% 2% Mussels 2% 8% 0% 0% 0% Oysters 2% 2% 1% 3% 1% Salmon 65% 80% 56% 55% 66% Shrimp 27% 20% 27% 27% 33% Tilapia 12% 6% 15% 11% 17% Trout 7% 10% 4% 8% 6% Other 8% 7% 9% 6% 8%
Species Specific Purchase Patterns The next set of questions dealt with the purchase of species that are often farm-raised.
Consumers were asked whether or not they had purchased specific types of seafood
during the past month. No attempt was made to determine whether or not the consumer
recognized those species as being farmed. It should be noted that the survey was
conducted during the summer of 2005, and seafood purchase often has a seasonal
component.
Crustaceans
Consumers were asked about purchase of individual aquacultured species during the past
month. Shrimp was purchased by 68 percent of the respondents. There was no
mechanism to determine whether or not this was farmed shrimp. The group Wild
American Shrimp, Inc. has been aggressively promoting wild harvest shrimp recently.

20
68%
32%
69%
31%
66%
34%
63%
37%
75%
25%
0%10%20%30%40%50%60%70%80%90%
100%
Average Boston Chicago Colorado N.J.
No
Yes
98% 99% 97% 98% 98%
2%2%2%2% 1%
1%
0%10%20%30%40%50%60%70%80%90%
100%
Average Boston Chicago Colorado N.J.
DK / Unsure
No
Yes
This effort has been funded in large part by federal grants. The highest purchase level
was in New Jersey (75 percent) and the lowest in Colorado Springs (63 percent). This
level of purchase is supported by the national consumption figures that list shrimp as the
number one seafood consumed in the United States
Figure 13: Did Consumers Purchase Shrimp in the Past Month?
Crayfish purchase was extremely low and indicates that this might be a species where
markets could be significantly expanded. Only two percent indicated that they had
purchased crayfish during the past month. Species-specific purchase patterns will change
depending upon the season and holidays. Crayfish purchase would be expected to
increase during Mardi Gras and summer months when crayfish boils are a popular social
activity.
Figure 14: Did Consumers Purchase Crayfish in the Past Month?

21
Finfish
Salmon was listed by consumers in each of the markets. Sixty-one percent of the total
sample indicated that they had purchased salmon during the past month. Again, there
was no mechanism to determine whether or not this was a farmed product. Among
finfish, salmon has the best market position by a wide margin and was readily accepted in
each of the target markets. This is similar to the national consumption figures compiled
by the National Fisheries Institute (http://www.NFI.org).
Figure 15: Did Consumers Purchase Salmon in the Past Month?
On average 24 percent of the consumers surveyed indicated that they had purchased
tilapia during the past month with the highest purchase levels in New Jersey (35 percent),
and Chicago (31 percent). Boston was the lowest at 12 percent. In Colorado, where it
might be expected that this fish would be good seller, since it is farm-raised and available
year round in a frozen form; it was listed by only 17 percent of the sample. The
characteristics of the product (white fleshed, mild taste, usually available as fillets) make
it an ideal product for the mass U.S. market. An aggressive well-targeted marketing
campaign would most likely boost these sales.
61%
39%
60%
40%
67%
33%
53%
47%
63%
37%
0%10%20%30%40%50%60%70%80%90%
100%
Average Boston Chicago Colorado N.J.
No
Yes
22
24%12%
31%17%
35%
68%81%75%
87%
65%
1%1% 1% 2%
0%10%20%30%40%50%60%70%80%90%
100%
Average Boston Chicago Colorado N.J.
DK/ Unsure
No
Yes
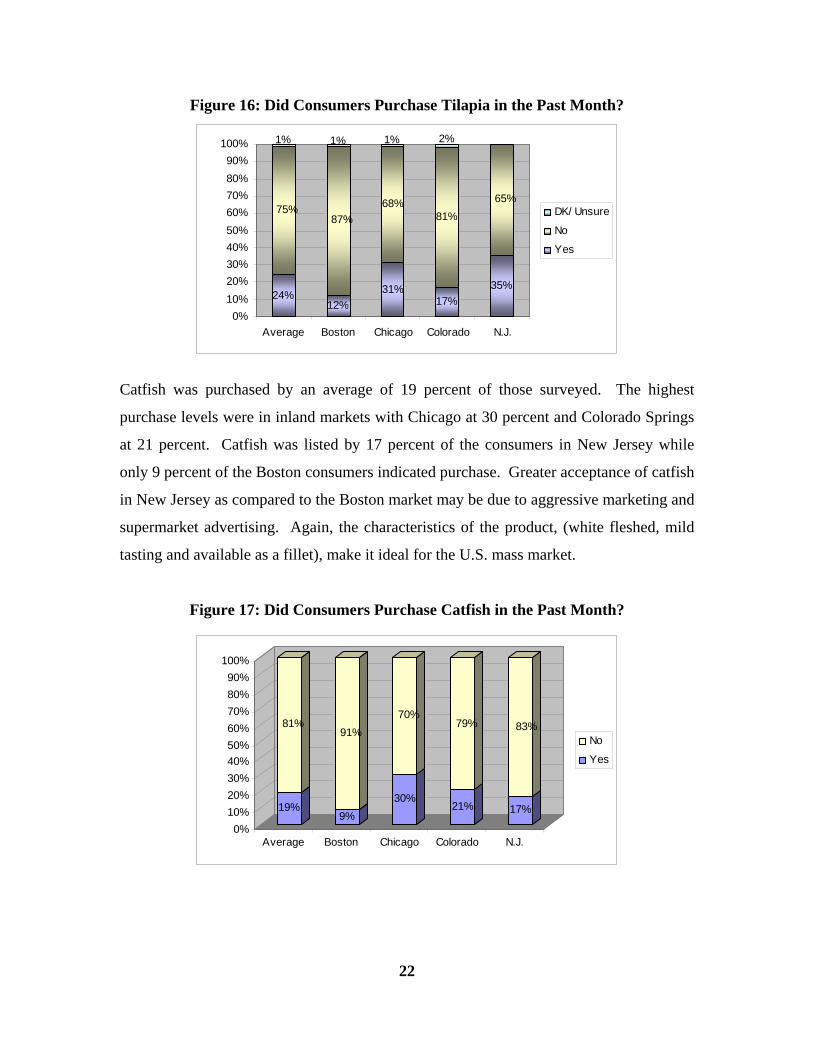
Figure 16: Did Consumers Purchase Tilapia in the Past Month?
Catfish was purchased by an average of 19 percent of those surveyed. The highest
purchase levels were in inland markets with Chicago at 30 percent and Colorado Springs
at 21 percent. Catfish was listed by 17 percent of the consumers in New Jersey while
only 9 percent of the Boston consumers indicated purchase. Greater acceptance of catfish
in New Jersey as compared to the Boston market may be due to aggressive marketing and
supermarket advertising. Again, the characteristics of the product, (white fleshed, mild
tasting and available as a fillet), make it ideal for the U.S. mass market.
Figure 17: Did Consumers Purchase Catfish in the Past Month?
19%
81%
9%
91%
30%
70%
21%
79%
17%
83%
0%10%20%30%40%50%60%70%80%90%
100%
Average Boston Chicago Colorado N.J.
No
Yes
23
5%
97% 96% 98% 99% 94%
4%3% 2% 1%
1%
0%10%20%30%40%50%60%70%80%90%
100%
Average Boston Chicago Colorado N.J.
DK/ Unsure
No
Yes
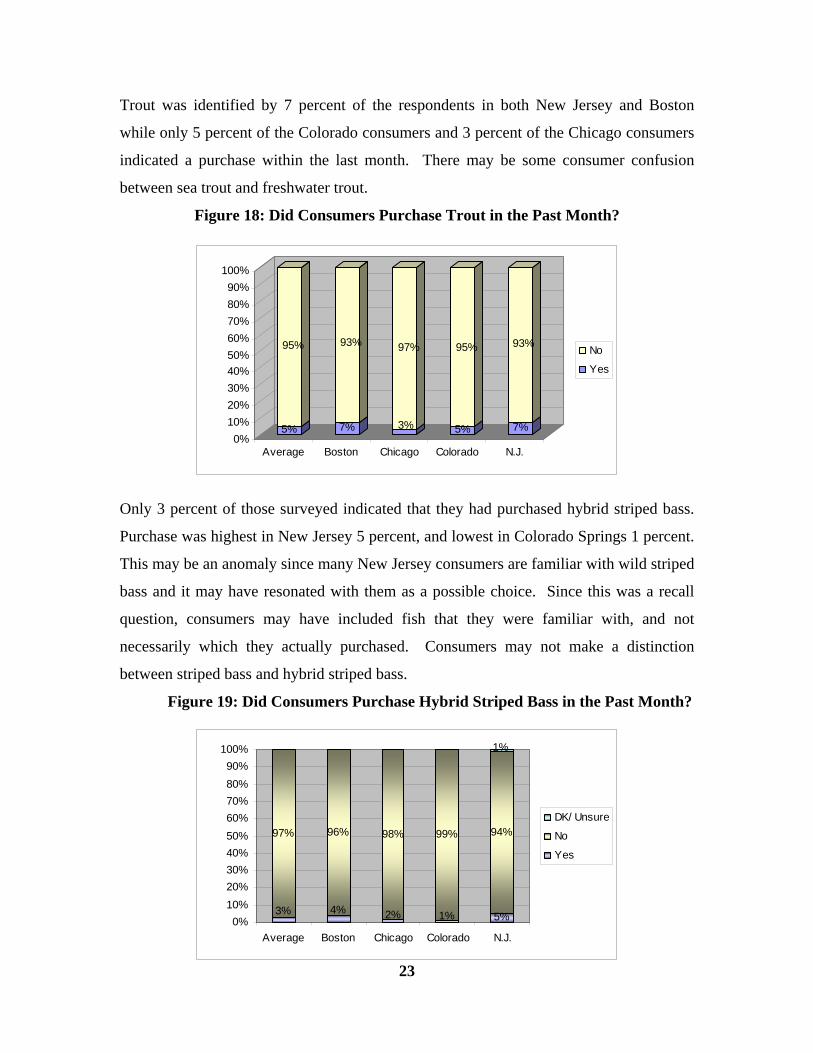
Trout was identified by 7 percent of the respondents in both New Jersey and Boston
while only 5 percent of the Colorado consumers and 3 percent of the Chicago consumers
indicated a purchase within the last month. There may be some consumer confusion
between sea trout and freshwater trout.
Figure 18: Did Consumers Purchase Trout in the Past Month?
Only 3 percent of those surveyed indicated that they had purchased hybrid striped bass.
Purchase was highest in New Jersey 5 percent, and lowest in Colorado Springs 1 percent.
This may be an anomaly since many New Jersey consumers are familiar with wild striped
bass and it may have resonated with them as a possible choice. Since this was a recall
question, consumers may have included fish that they were familiar with, and not
necessarily which they actually purchased. Consumers may not make a distinction
between striped bass and hybrid striped bass.
Figure 19: Did Consumers Purchase Hybrid Striped Bass in the Past Month?
5%
95%
7%
93%
3%
97%
5%
95%
7%
93%
0%10%20%30%40%50%60%70%80%90%
100%
Average Boston Chicago Colorado N.J.
No
Yes
24
16%
84%
28%
72%
7%
93%
7%
93%
20%
80%
0%10%20%30%40%50%60%70%80%90%
100%
Average Boston Chicago Colorado N.J.
No
Yes
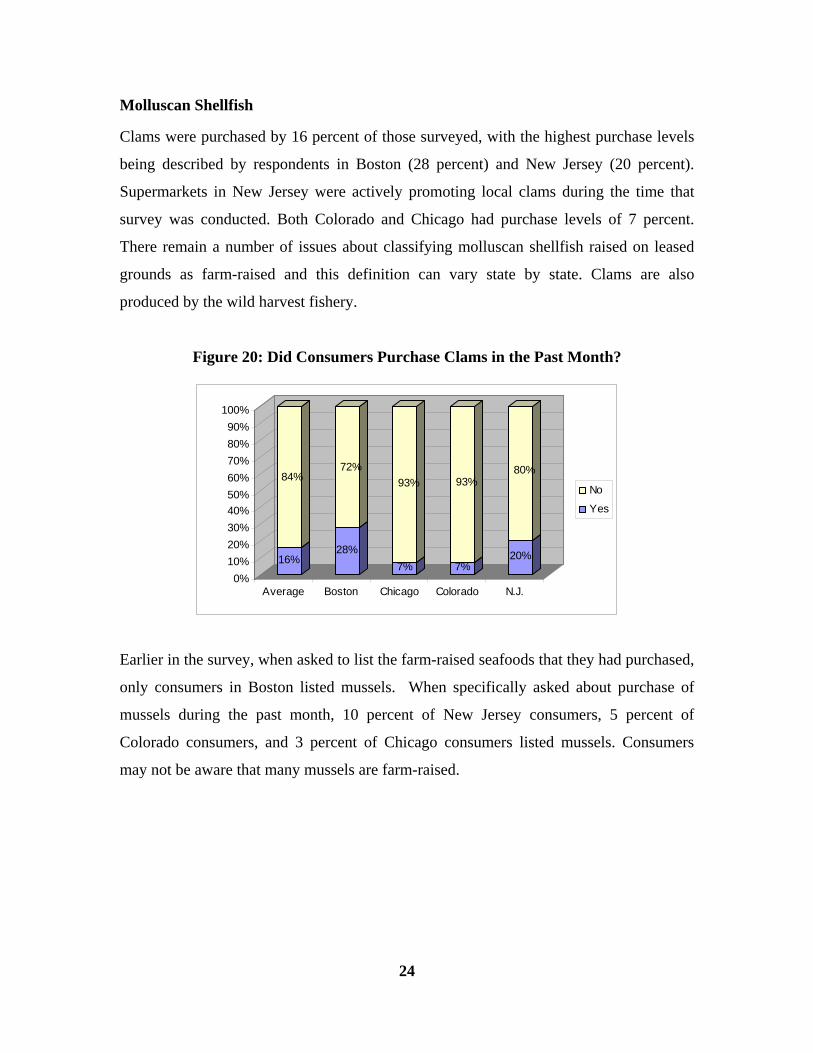
Molluscan Shellfish
Clams were purchased by 16 percent of those surveyed, with the highest purchase levels
being described by respondents in Boston (28 percent) and New Jersey (20 percent).
Supermarkets in New Jersey were actively promoting local clams during the time that
survey was conducted. Both Colorado and Chicago had purchase levels of 7 percent.
There remain a number of issues about classifying molluscan shellfish raised on leased
grounds as farm-raised and this definition can vary state by state. Clams are also
produced by the wild harvest fishery.
Figure 20: Did Consumers Purchase Clams in the Past Month?
Earlier in the survey, when asked to list the farm-raised seafoods that they had purchased,
only consumers in Boston listed mussels. When specifically asked about purchase of
mussels during the past month, 10 percent of New Jersey consumers, 5 percent of
Colorado consumers, and 3 percent of Chicago consumers listed mussels. Consumers
may not be aware that many mussels are farm-raised.
25
9%
91%
16%
84%
3%
97%
5%
95%
10%
90%
0%10%20%30%40%50%60%70%80%90%
100%
Average Boston Chicago Colorado N.J.
No
Yes
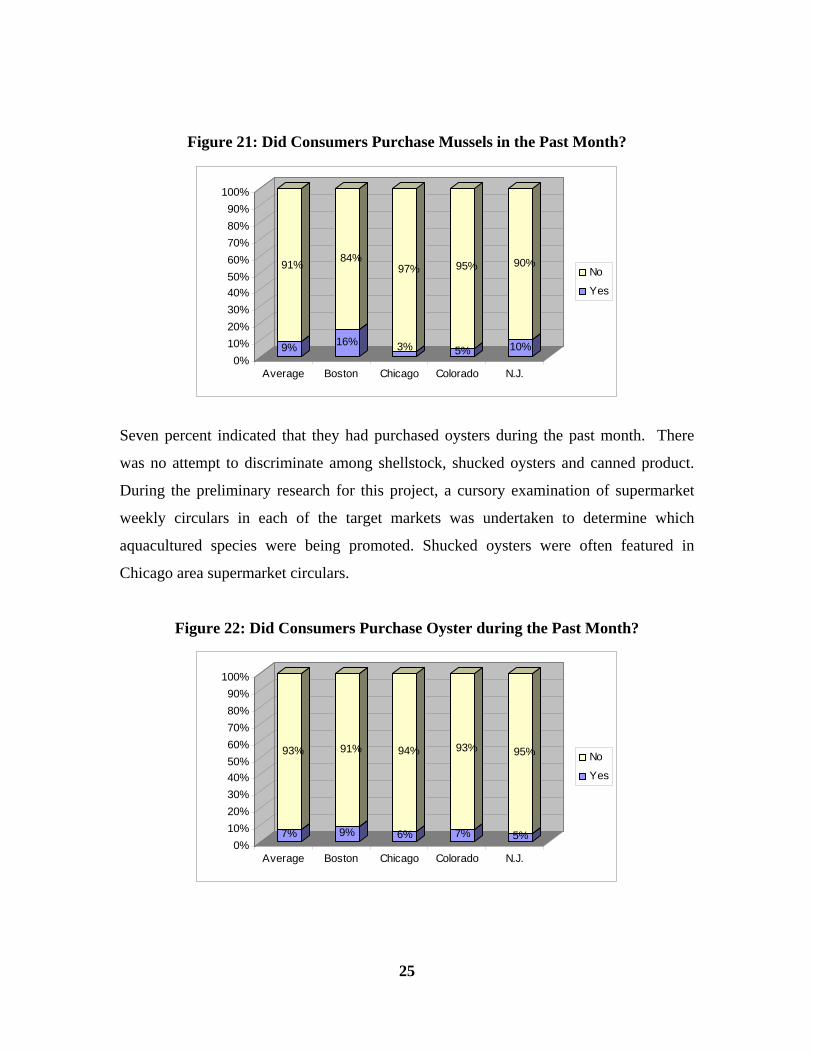
Figure 21: Did Consumers Purchase Mussels in the Past Month?
Seven percent indicated that they had purchased oysters during the past month. There
was no attempt to discriminate among shellstock, shucked oysters and canned product.
During the preliminary research for this project, a cursory examination of supermarket
weekly circulars in each of the target markets was undertaken to determine which
aquacultured species were being promoted. Shucked oysters were often featured in
Chicago area supermarket circulars.
Figure 22: Did Consumers Purchase Oyster during the Past Month?
7%
93%
9%
91%
6%
94%
7%
93%
5%
95%
0%10%20%30%40%50%60%70%80%90%
100%
Average Boston Chicago Colorado N.J.
No
Yes

26
Farm Raised vs. Wild Caught Forty-seven percent of those surveyed believed that wild caught was better quality than
farm-raised. This number was the highest in Boston (57 percent) and lowest in Chicago
(40 percent). It is difficult to determine exactly which attributes contribute to quality. It
could be taste or safety considerations or simply an undefined perception. This prejudice
against farmed product is fostered by the popular food media. Food writers and media
chefs regularly promote the idea that wild harvest seafood is superior to farmed product.
An important example can be found in Mark Bittman’s “Fish: The Complete Guide to
Buying and Cooking.”
Table 7: Consumer Perception about the Type of Seafood that is Better Quality
Percentage Type
Average Boston Chicago Colorado Springs
New Jersey
Farm Raised 35% 24% 41% 34% 42% Wild Caught 47% 57% 40% 46% 43% Don’t Know / Unsure 18% 19% 19% 20% 15%
When asked which type of seafood tastes better, 52 percent responded wild caught while
24 percent chose farm-raised and 24 percent were unsure. The popular food press is a
major driving force behind this concept. Many cookbooks, food columnists and television
chefs reinforce this idea by touting wild harvest as having a more distinct and stronger
flavor. However, stronger flavor may not be valued by the majority of American
consumers. One regional upscale chain in the northeast has begun advertising that they
only carry farmed salmon because of the uniformity of the product. Since wild salmon
species vary in taste, quality and fat content, they want their customers to have a uniform
and expected dining experience.
27
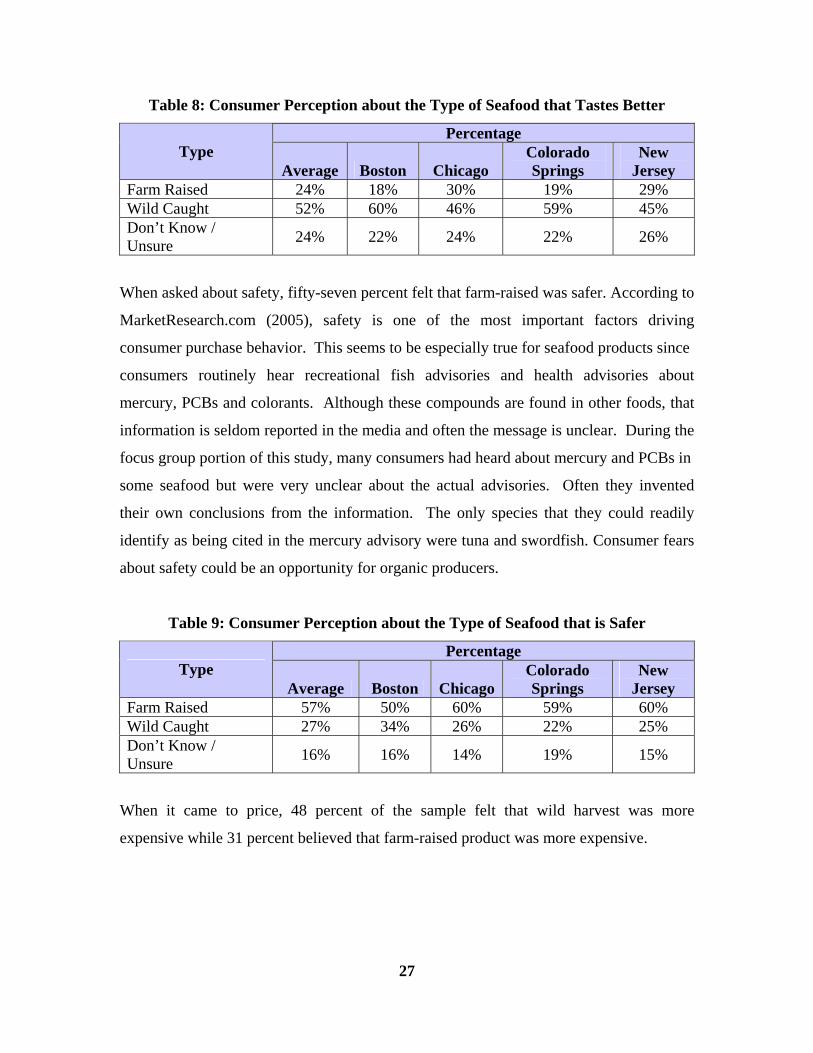
Table 8: Consumer Perception about the Type of Seafood that Tastes Better
Percentage Type
Average Boston Chicago Colorado Springs
New Jersey
Farm Raised 24% 18% 30% 19% 29% Wild Caught 52% 60% 46% 59% 45% Don’t Know / Unsure 24% 22% 24% 22% 26%
When asked about safety, fifty-seven percent felt that farm-raised was safer. According to
MarketResearch.com (2005), safety is one of the most important factors driving
consumer purchase behavior. This seems to be especially true for seafood products since
consumers routinely hear recreational fish advisories and health advisories about
mercury, PCBs and colorants. Although these compounds are found in other foods, that
information is seldom reported in the media and often the message is unclear. During the
focus group portion of this study, many consumers had heard about mercury and PCBs in
some seafood but were very unclear about the actual advisories. Often they invented
their own conclusions from the information. The only species that they could readily
identify as being cited in the mercury advisory were tuna and swordfish. Consumer fears
about safety could be an opportunity for organic producers.
Table 9: Consumer Perception about the Type of Seafood that is Safer
Percentage Type
Average Boston ChicagoColorado Springs
New Jersey
Farm Raised 57% 50% 60% 59% 60% Wild Caught 27% 34% 26% 22% 25% Don’t Know / Unsure 16% 16% 14% 19% 15%
When it came to price, 48 percent of the sample felt that wild harvest was more
expensive while 31 percent believed that farm-raised product was more expensive.
28
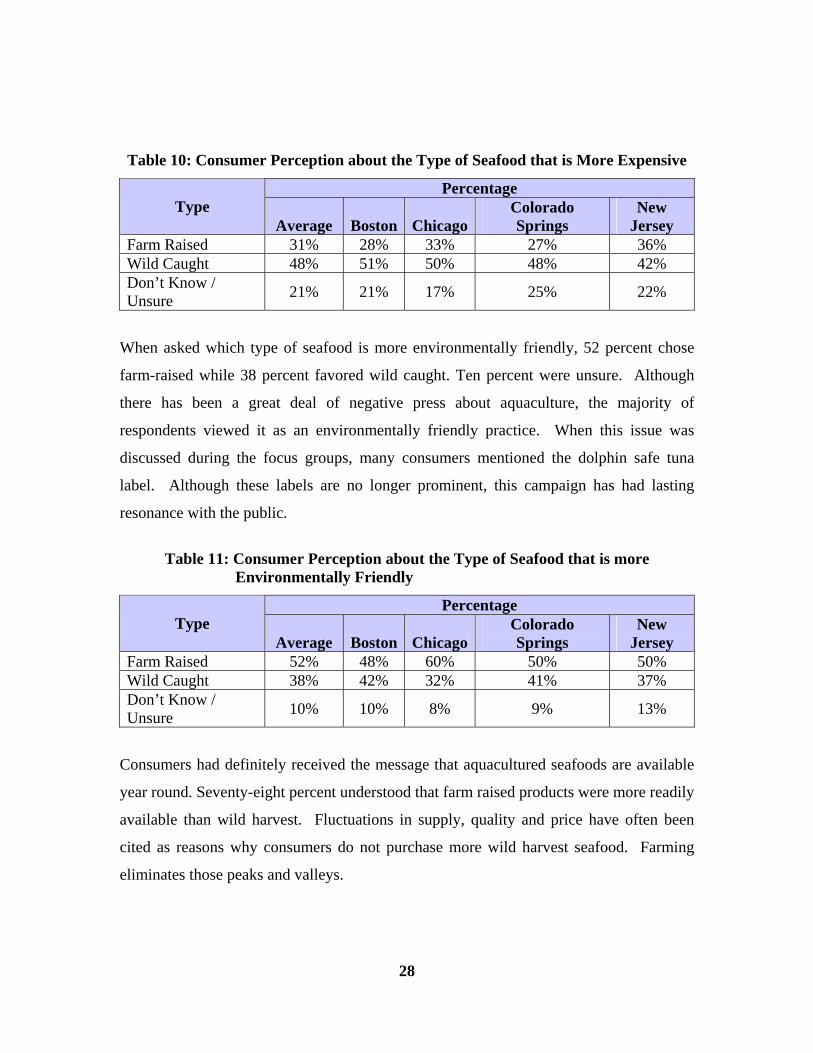
Table 10: Consumer Perception about the Type of Seafood that is More Expensive
Percentage Type
Average Boston ChicagoColorado Springs
New Jersey
Farm Raised 31% 28% 33% 27% 36% Wild Caught 48% 51% 50% 48% 42% Don’t Know / Unsure 21% 21% 17% 25% 22%
When asked which type of seafood is more environmentally friendly, 52 percent chose
farm-raised while 38 percent favored wild caught. Ten percent were unsure. Although
there has been a great deal of negative press about aquaculture, the majority of
respondents viewed it as an environmentally friendly practice. When this issue was
discussed during the focus groups, many consumers mentioned the dolphin safe tuna
label. Although these labels are no longer prominent, this campaign has had lasting
resonance with the public.
Table 11: Consumer Perception about the Type of Seafood that is more
Environmentally Friendly
Percentage Type
Average Boston ChicagoColorado Springs
New Jersey
Farm Raised 52% 48% 60% 50% 50% Wild Caught 38% 42% 32% 41% 37% Don’t Know / Unsure 10% 10% 8% 9% 13%
Consumers had definitely received the message that aquacultured seafoods are available
year round. Seventy-eight percent understood that farm raised products were more readily
available than wild harvest. Fluctuations in supply, quality and price have often been
cited as reasons why consumers do not purchase more wild harvest seafood. Farming
eliminates those peaks and valleys.
29
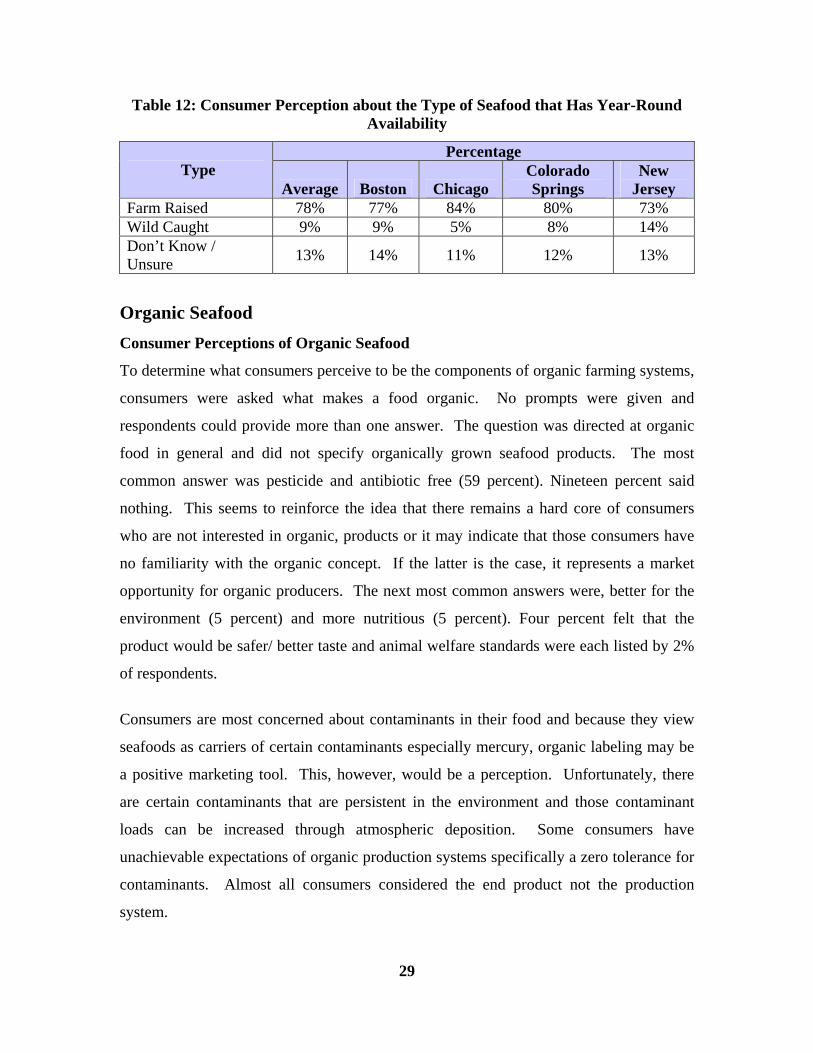
Table 12: Consumer Perception about the Type of Seafood that Has Year-Round Availability
Percentage Type
Average Boston Chicago Colorado Springs
New Jersey
Farm Raised 78% 77% 84% 80% 73% Wild Caught 9% 9% 5% 8% 14% Don’t Know / Unsure 13% 14% 11% 12% 13%
Organic Seafood Consumer Perceptions of Organic Seafood
To determine what consumers perceive to be the components of organic farming systems,
consumers were asked what makes a food organic. No prompts were given and
respondents could provide more than one answer. The question was directed at organic
food in general and did not specify organically grown seafood products. The most
common answer was pesticide and antibiotic free (59 percent). Nineteen percent said
nothing. This seems to reinforce the idea that there remains a hard core of consumers
who are not interested in organic, products or it may indicate that those consumers have
no familiarity with the organic concept. If the latter is the case, it represents a market
opportunity for organic producers. The next most common answers were, better for the
environment (5 percent) and more nutritious (5 percent). Four percent felt that the
product would be safer/ better taste and animal welfare standards were each listed by 2%
of respondents.
Consumers are most concerned about contaminants in their food and because they view
seafoods as carriers of certain contaminants especially mercury, organic labeling may be
a positive marketing tool. This, however, would be a perception. Unfortunately, there
are certain contaminants that are persistent in the environment and those contaminant
loads can be increased through atmospheric deposition. Some consumers have
unachievable expectations of organic production systems specifically a zero tolerance for
contaminants. Almost all consumers considered the end product not the production
system.
30
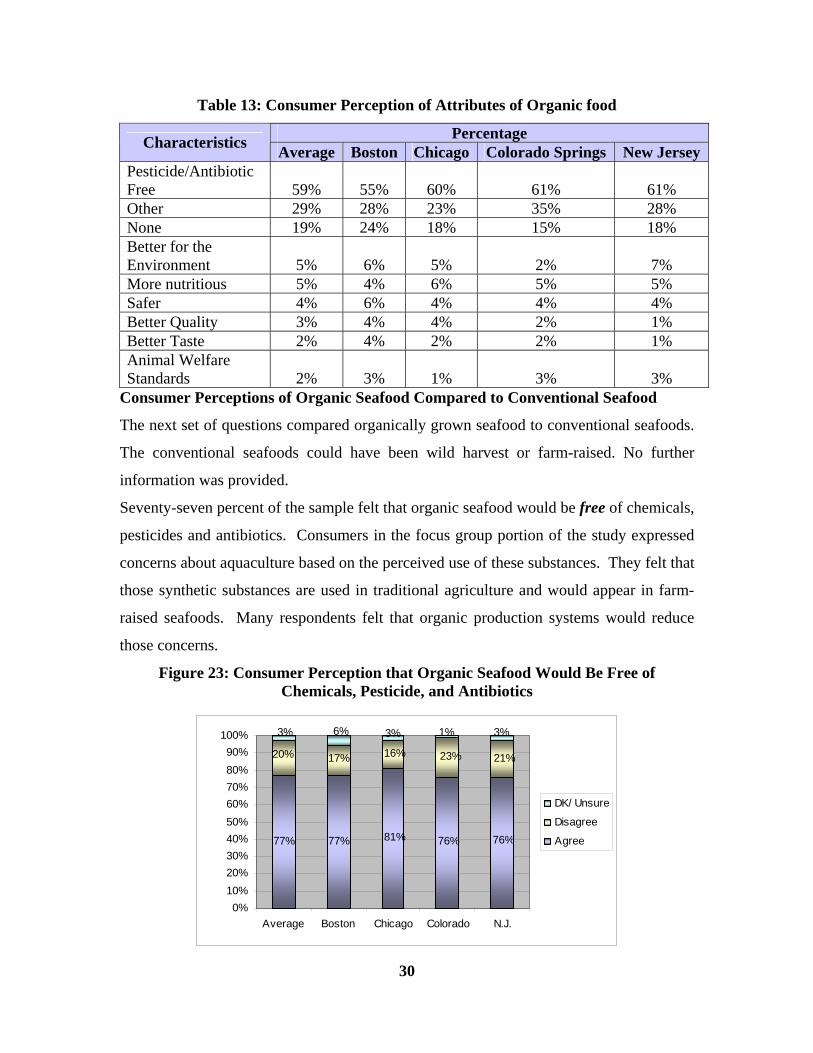
Table 13: Consumer Perception of Attributes of Organic food
Percentage Characteristics Average Boston Chicago Colorado Springs New JerseyPesticide/Antibiotic Free 59% 55% 60% 61% 61% Other 29% 28% 23% 35% 28% None 19% 24% 18% 15% 18% Better for the Environment 5% 6% 5% 2% 7% More nutritious 5% 4% 6% 5% 5% Safer 4% 6% 4% 4% 4% Better Quality 3% 4% 4% 2% 1% Better Taste 2% 4% 2% 2% 1% Animal Welfare Standards 2% 3% 1% 3% 3%
Consumer Perceptions of Organic Seafood Compared to Conventional Seafood
The next set of questions compared organically grown seafood to conventional seafoods.
The conventional seafoods could have been wild harvest or farm-raised. No further
information was provided.
Seventy-seven percent of the sample felt that organic seafood would be free of chemicals,
pesticides and antibiotics. Consumers in the focus group portion of the study expressed
concerns about aquaculture based on the perceived use of these substances. They felt that
those synthetic substances are used in traditional agriculture and would appear in farm-
raised seafoods. Many respondents felt that organic production systems would reduce
those concerns.
Figure 23: Consumer Perception that Organic Seafood Would Be Free of Chemicals, Pesticide, and Antibiotics
77% 77% 81% 76% 76%
21%23%16%17%20%
3%1%3% 6% 3%
0%10%20%30%40%50%60%70%80%90%
100%
Average Boston Chicago Colorado N.J.
DK/ Unsure
Disagree
Agree
31
8% 9% 5% 8%
68% 61%70% 68% 73%
24%27%
21% 27% 19%12%
0%10%20%30%40%50%60%70%80%90%
100%
Average Boston Chicago Colorado N.J.
DK/ Unsure
Disagree
Agree
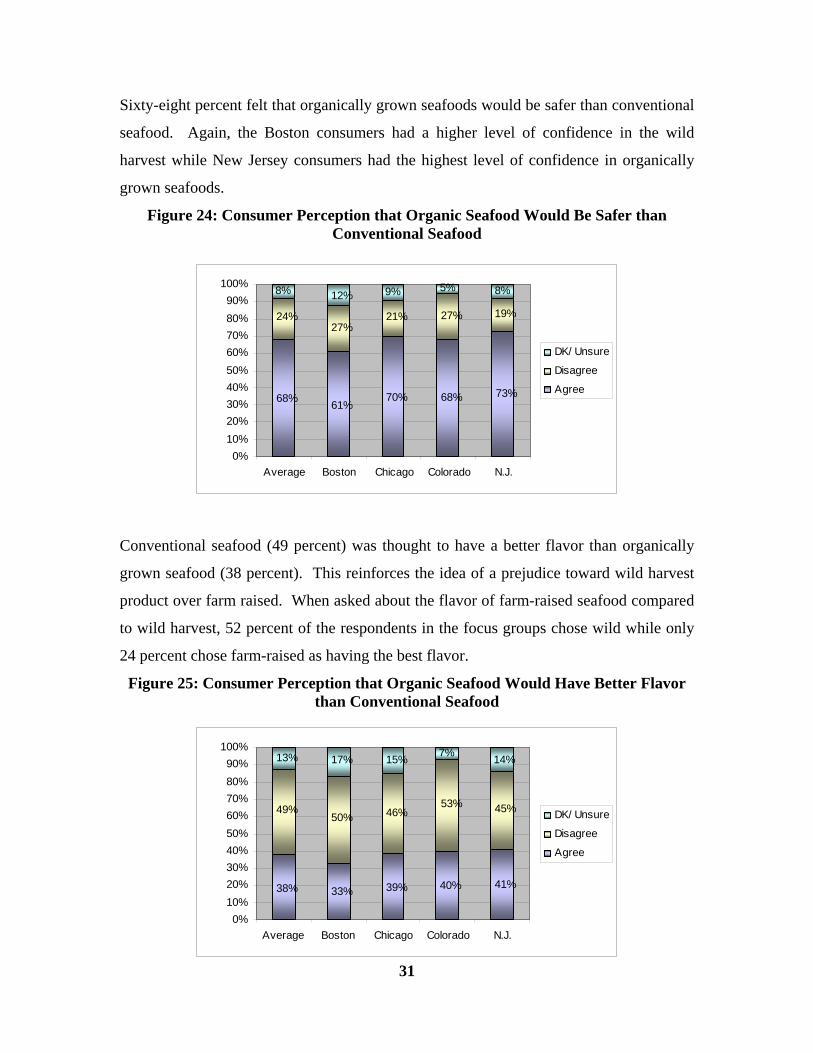
Sixty-eight percent felt that organically grown seafoods would be safer than conventional
seafood. Again, the Boston consumers had a higher level of confidence in the wild
harvest while New Jersey consumers had the highest level of confidence in organically
grown seafoods.
Figure 24: Consumer Perception that Organic Seafood Would Be Safer than Conventional Seafood
Conventional seafood (49 percent) was thought to have a better flavor than organically
grown seafood (38 percent). This reinforces the idea of a prejudice toward wild harvest
product over farm raised. When asked about the flavor of farm-raised seafood compared
to wild harvest, 52 percent of the respondents in the focus groups chose wild while only
24 percent chose farm-raised as having the best flavor.
Figure 25: Consumer Perception that Organic Seafood Would Have Better Flavor than Conventional Seafood
7%
38% 33% 39% 40% 41%
45%53%46%50%
49%
13% 17% 15% 14%
0%10%20%30%40%50%60%70%80%90%
100%
Average Boston Chicago Colorado N.J.
DK/ Unsure
Disagree
Agree
32
9% 10% 7% 8%
56% 51% 57% 57% 58%
35% 39% 32% 36% 34%
11%
0%10%20%30%40%50%60%70%80%90%
100%
Average Boston Chicago Colorado N.J.
DK/ Unsure
Disagree
Agree
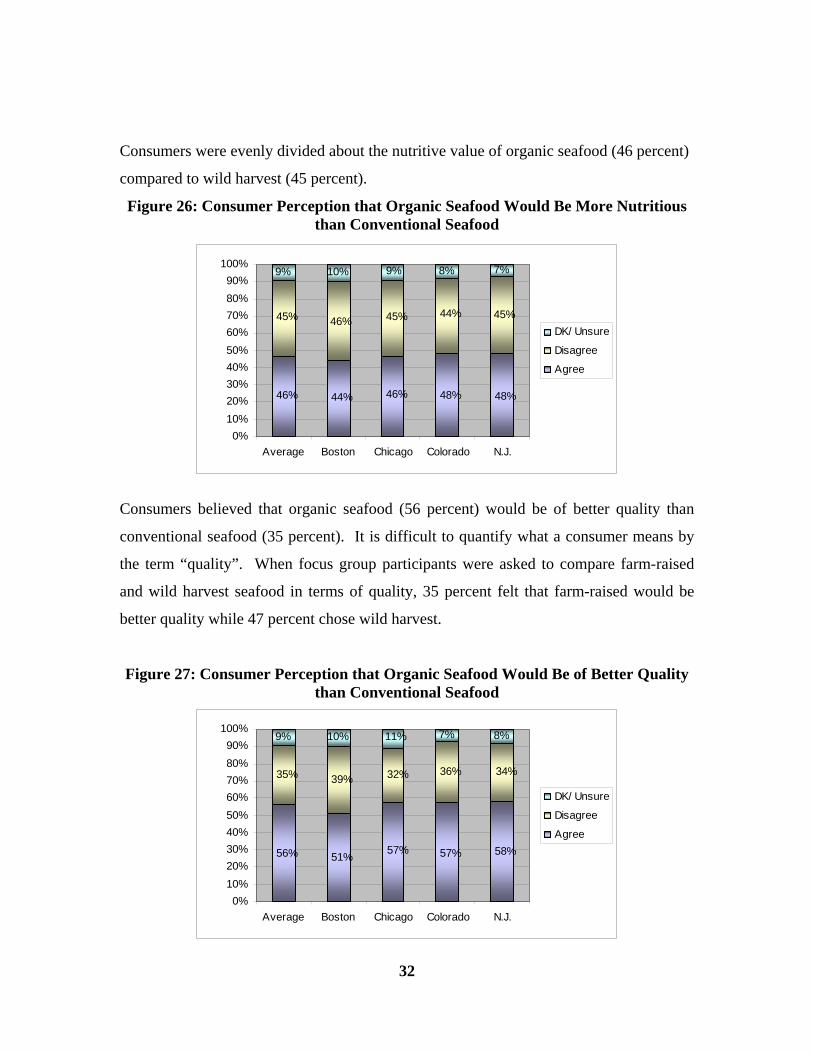
Consumers were evenly divided about the nutritive value of organic seafood (46 percent)
compared to wild harvest (45 percent).
Figure 26: Consumer Perception that Organic Seafood Would Be More Nutritious than Conventional Seafood
Consumers believed that organic seafood (56 percent) would be of better quality than
conventional seafood (35 percent). It is difficult to quantify what a consumer means by
the term “quality”. When focus group participants were asked to compare farm-raised
and wild harvest seafood in terms of quality, 35 percent felt that farm-raised would be
better quality while 47 percent chose wild harvest.
Figure 27: Consumer Perception that Organic Seafood Would Be of Better Quality than Conventional Seafood
9% 10% 8% 7%
46% 44% 46% 48% 48%
45% 46% 45% 44% 45%
9%
0%10%20%30%40%50%60%70%80%90%
100%
Average Boston Chicago Colorado N.J.
DK/ Unsure
Disagree
Agree
33
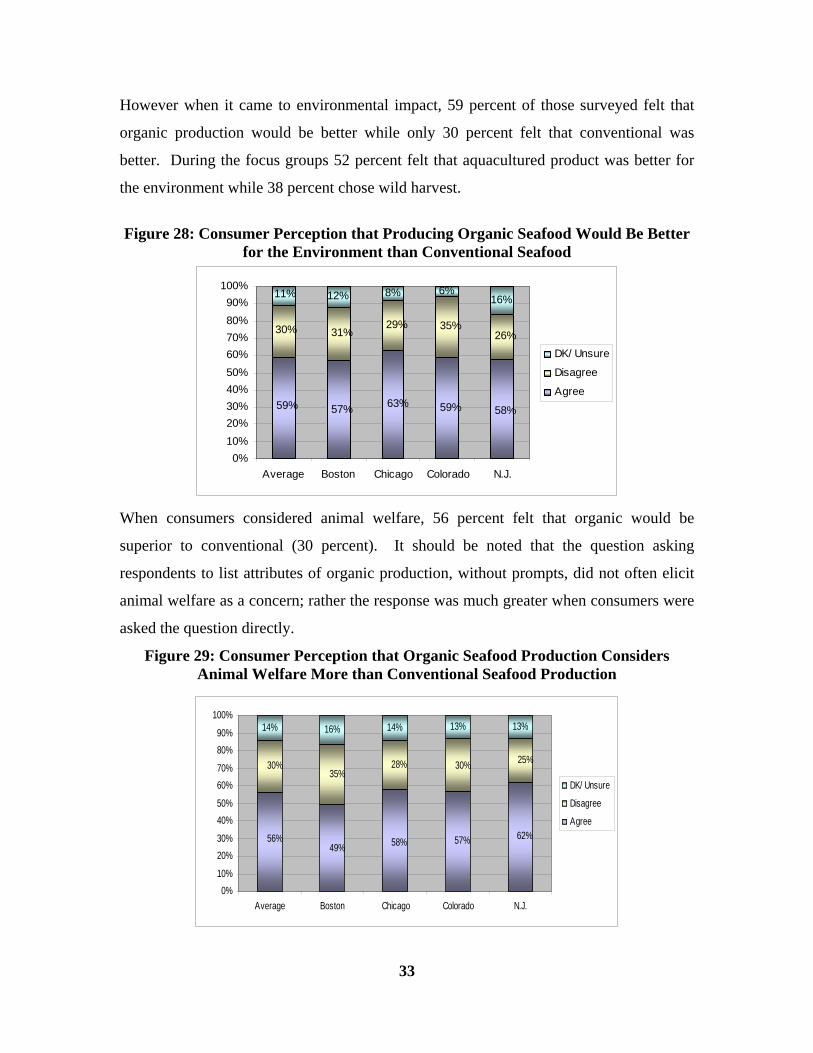
However when it came to environmental impact, 59 percent of those surveyed felt that
organic production would be better while only 30 percent felt that conventional was
better. During the focus groups 52 percent felt that aquacultured product was better for
the environment while 38 percent chose wild harvest.
Figure 28: Consumer Perception that Producing Organic Seafood Would Be Better
for the Environment than Conventional Seafood
When consumers considered animal welfare, 56 percent felt that organic would be
superior to conventional (30 percent). It should be noted that the question asking
respondents to list attributes of organic production, without prompts, did not often elicit
animal welfare as a concern; rather the response was much greater when consumers were
asked the question directly.
Figure 29: Consumer Perception that Organic Seafood Production Considers Animal Welfare More than Conventional Seafood Production
12% 8% 6%16%
59% 57% 63% 59% 58%
30% 31%29% 35%
26%
11%
0%10%20%30%40%50%60%70%80%90%
100%
Average Boston Chicago Colorado N.J.
DK/ Unsure
Disagree
Agree
14% 16% 14% 13% 13%
56%49% 58% 57% 62%
30%35%
28% 30% 25%
0%10%
20%30%
40%50%
60%70%
80%90%
100%
Average Boston Chicago Colorado N.J.
DK/ Unsure
Disagree
Agree

34
44% 47% 45% 40% 46%
39% 36% 36% 48% 34%
20%12%19%17%17%
0%10%20%30%40%50%60%70%80%90%
100%
Average Boston Chicago Colorado N.J.
DK/ Unsure
Disagree
Agree
Forty-four percent of those surveyed felt that small farmers would have a competitive
advantage in the production of organically-farmed seafood. This number was consistent
in all markets.
Figure 30: Consumer Perception that Small Farmers Have a Competitive Advantage in the Production of Organic Seafood
Purchase Patterns The next question dealt with level of commitment to the purchase of organic foods.
Thirteen percent indicated that they purchased organic products as often as they could
while 23 percent did not purchase them at all. Again, approximately 25% of the sample
for one reason or another does not purchase organic products. Sixty-two percent
purchased them from time to time. The question dealt with organic foods in general.
These numbers may have changed if the question specifically referenced organically-
grown seafood since there is a high level of concern about contaminants in seafood and a
general mistrust of aquaculture methods because of water quality issues, perceived use of
antibiotics, hormones and genetically modified organisms.
In 2001, Seafish (The Sea Fish Industry Authority a group in the United Kingdom)
conducted a similar consumer study in the United Kingdom. In that study, 52 percent of
the consumers agreed with the third statement (I’m not convinced about the value of
organic products in terms of health and taste benefits).
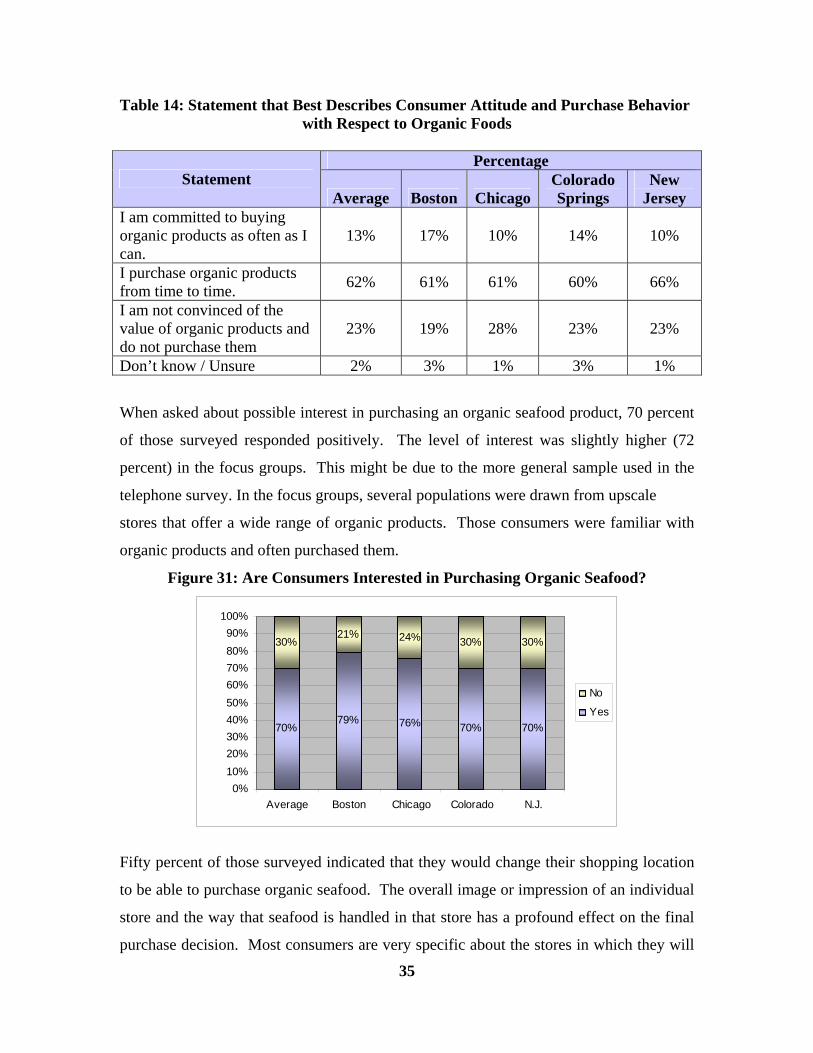
35
Table 14: Statement that Best Describes Consumer Attitude and Purchase Behavior with Respect to Organic Foods
Percentage
Statement Average Boston Chicago
Colorado Springs
New Jersey
I am committed to buying organic products as often as I can.
13% 17% 10% 14% 10%
I purchase organic products from time to time. 62% 61% 61% 60% 66%
I am not convinced of the value of organic products and do not purchase them
23% 19% 28% 23% 23%
Don’t know / Unsure 2% 3% 1% 3% 1%
When asked about possible interest in purchasing an organic seafood product, 70 percent
of those surveyed responded positively. The level of interest was slightly higher (72
percent) in the focus groups. This might be due to the more general sample used in the
telephone survey. In the focus groups, several populations were drawn from upscale
stores that offer a wide range of organic products. Those consumers were familiar with
organic products and often purchased them.
Figure 31: Are Consumers Interested in Purchasing Organic Seafood?
Fifty percent of those surveyed indicated that they would change their shopping location
to be able to purchase organic seafood. The overall image or impression of an individual
store and the way that seafood is handled in that store has a profound effect on the final
purchase decision. Most consumers are very specific about the stores in which they will
70%79% 76% 70% 70%
30%21% 24% 30% 30%
0%10%20%30%40%50%60%70%80%90%
100%
Average Boston Chicago Colorado N.J.
No
Yes
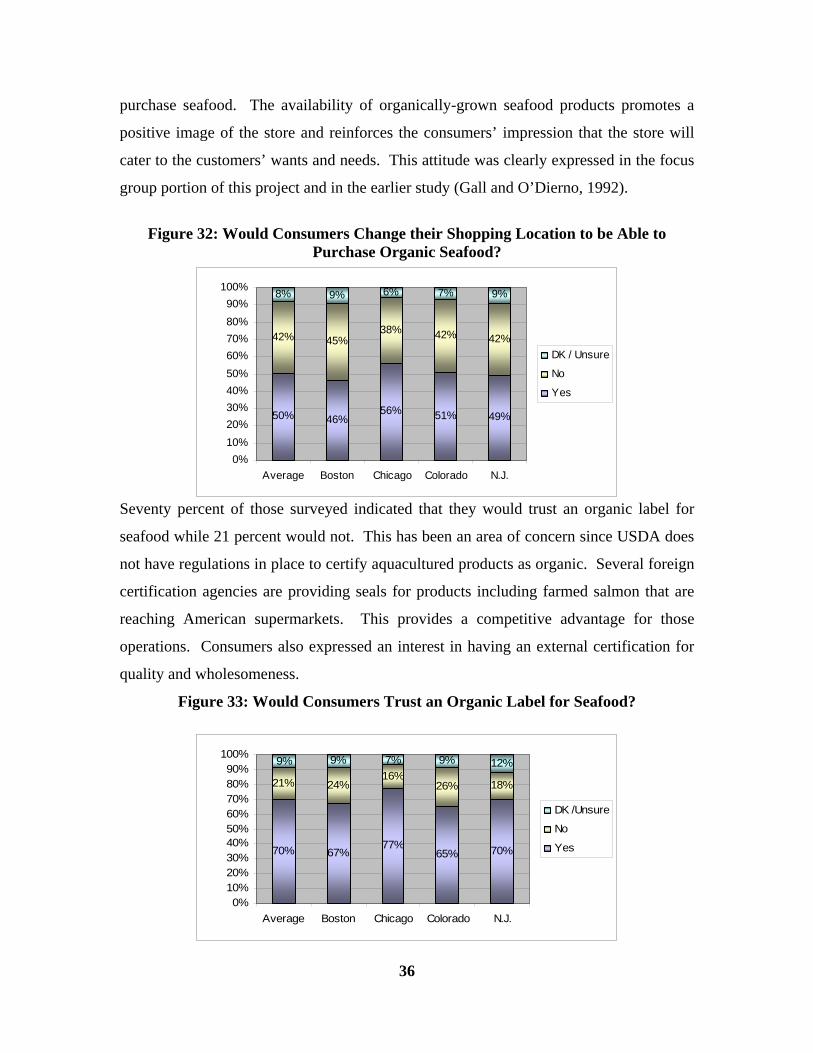
36
70% 67%77%
65% 70%
21% 24%16%
26% 18%
9% 9% 12%9% 7%
0%10%20%30%40%50%60%70%80%90%
100%
Average Boston Chicago Colorado N.J.
DK /Unsure
No
Yes
purchase seafood. The availability of organically-grown seafood products promotes a
positive image of the store and reinforces the consumers’ impression that the store will
cater to the customers’ wants and needs. This attitude was clearly expressed in the focus
group portion of this project and in the earlier study (Gall and O’Dierno, 1992).
Figure 32: Would Consumers Change their Shopping Location to be Able to
Purchase Organic Seafood?
Seventy percent of those surveyed indicated that they would trust an organic label for
seafood while 21 percent would not. This has been an area of concern since USDA does
not have regulations in place to certify aquacultured products as organic. Several foreign
certification agencies are providing seals for products including farmed salmon that are
reaching American supermarkets. This provides a competitive advantage for those
operations. Consumers also expressed an interest in having an external certification for
quality and wholesomeness.
Figure 33: Would Consumers Trust an Organic Label for Seafood?
50% 46%56% 51% 49%
42% 45%38% 42% 42%
8% 9% 6% 7% 9%
0%10%20%30%40%50%60%70%80%90%
100%
Average Boston Chicago Colorado N.J.
DK / Unsure
No
Yes
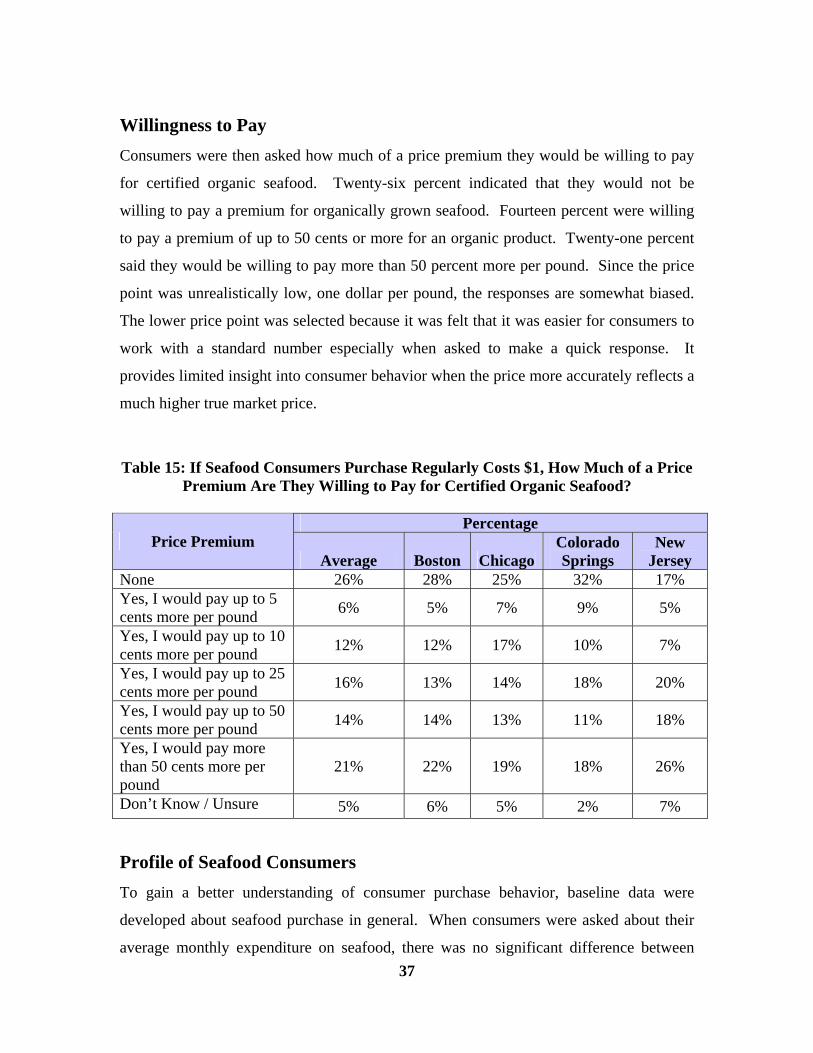
37
Willingness to Pay Consumers were then asked how much of a price premium they would be willing to pay
for certified organic seafood. Twenty-six percent indicated that they would not be
willing to pay a premium for organically grown seafood. Fourteen percent were willing
to pay a premium of up to 50 cents or more for an organic product. Twenty-one percent
said they would be willing to pay more than 50 percent more per pound. Since the price
point was unrealistically low, one dollar per pound, the responses are somewhat biased.
The lower price point was selected because it was felt that it was easier for consumers to
work with a standard number especially when asked to make a quick response. It
provides limited insight into consumer behavior when the price more accurately reflects a
much higher true market price.
Table 15: If Seafood Consumers Purchase Regularly Costs $1, How Much of a Price
Premium Are They Willing to Pay for Certified Organic Seafood?
Percentage Price Premium
Average Boston Chicago Colorado Springs
New Jersey
None 26% 28% 25% 32% 17% Yes, I would pay up to 5 cents more per pound 6% 5% 7% 9% 5%
Yes, I would pay up to 10 cents more per pound 12% 12% 17% 10% 7%
Yes, I would pay up to 25 cents more per pound 16% 13% 14% 18% 20%
Yes, I would pay up to 50 cents more per pound 14% 14% 13% 11% 18%
Yes, I would pay more than 50 cents more per pound
21% 22% 19% 18% 26%
Don’t Know / Unsure 5% 6% 5% 2% 7%
Profile of Seafood Consumers To gain a better understanding of consumer purchase behavior, baseline data were
developed about seafood purchase in general. When consumers were asked about their
average monthly expenditure on seafood, there was no significant difference between
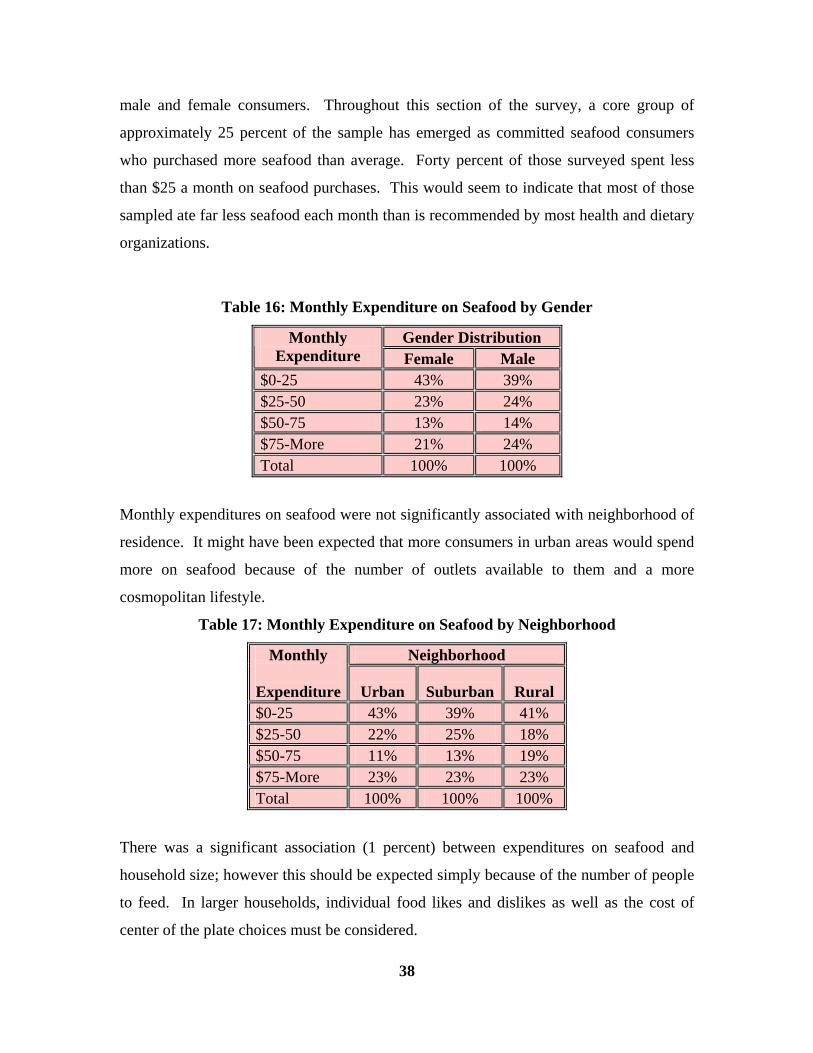
38
male and female consumers. Throughout this section of the survey, a core group of
approximately 25 percent of the sample has emerged as committed seafood consumers
who purchased more seafood than average. Forty percent of those surveyed spent less
than $25 a month on seafood purchases. This would seem to indicate that most of those
sampled ate far less seafood each month than is recommended by most health and dietary
organizations.
Table 16: Monthly Expenditure on Seafood by Gender
Gender Distribution Monthly Expenditure Female Male
$0-25 43% 39% $25-50 23% 24% $50-75 13% 14% $75-More 21% 24% Total 100% 100%
Monthly expenditures on seafood were not significantly associated with neighborhood of
residence. It might have been expected that more consumers in urban areas would spend
more on seafood because of the number of outlets available to them and a more
cosmopolitan lifestyle.
Table 17: Monthly Expenditure on Seafood by Neighborhood
Neighborhood Monthly
Expenditure Urban Suburban Rural $0-25 43% 39% 41% $25-50 22% 25% 18% $50-75 11% 13% 19% $75-More 23% 23% 23% Total 100% 100% 100%
There was a significant association (1 percent) between expenditures on seafood and
household size; however this should be expected simply because of the number of people
to feed. In larger households, individual food likes and dislikes as well as the cost of
center of the plate choices must be considered.
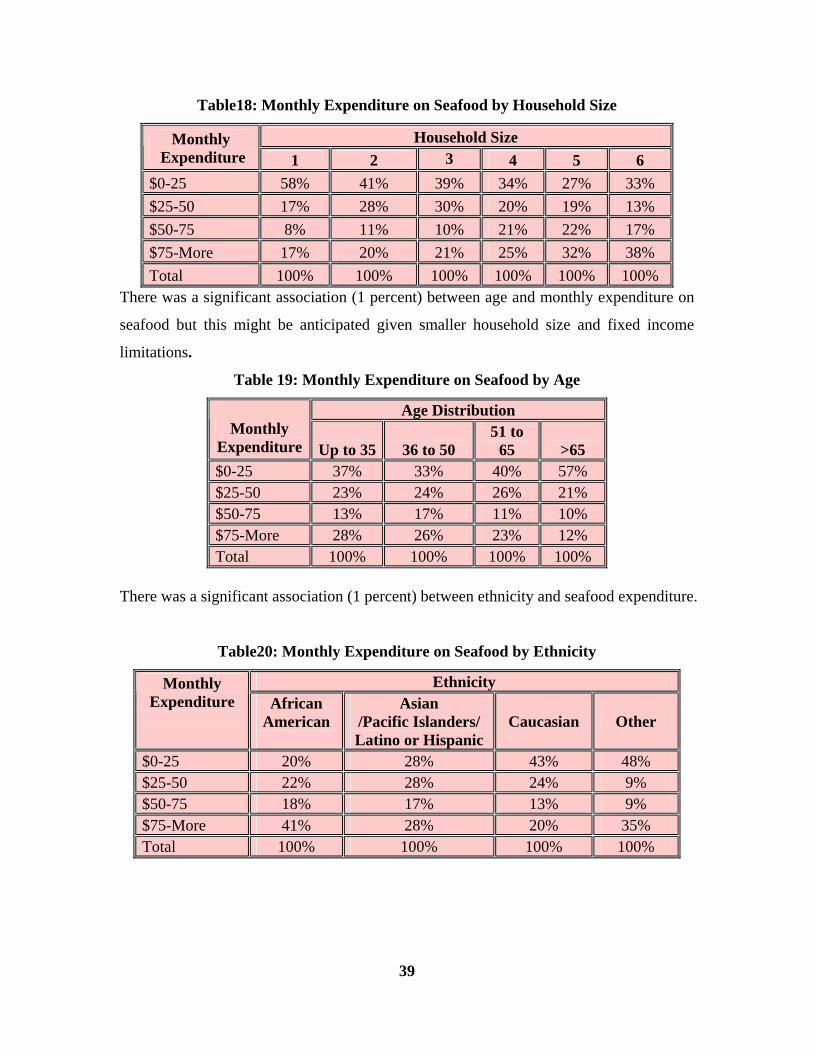
39
Table18: Monthly Expenditure on Seafood by Household Size
Household Size Monthly Expenditure 1 2 3 4 5 6
$0-25 58% 41% 39% 34% 27% 33% $25-50 17% 28% 30% 20% 19% 13% $50-75 8% 11% 10% 21% 22% 17% $75-More 17% 20% 21% 25% 32% 38% Total 100% 100% 100% 100% 100% 100%
There was a significant association (1 percent) between age and monthly expenditure on
seafood but this might be anticipated given smaller household size and fixed income
limitations.
Table 19: Monthly Expenditure on Seafood by Age
Age Distribution Monthly
Expenditure Up to 35 36 to 50 51 to
65 >65 $0-25 37% 33% 40% 57% $25-50 23% 24% 26% 21% $50-75 13% 17% 11% 10% $75-More 28% 26% 23% 12% Total 100% 100% 100% 100%
There was a significant association (1 percent) between ethnicity and seafood expenditure.
Table20: Monthly Expenditure on Seafood by Ethnicity
Ethnicity Monthly Expenditure
African American
Asian /Pacific Islanders/ Latino or Hispanic
Caucasian Other
$0-25 20% 28% 43% 48% $25-50 22% 28% 24% 9% $50-75 18% 17% 13% 9% $75-More 41% 28% 20% 35% Total 100% 100% 100% 100%
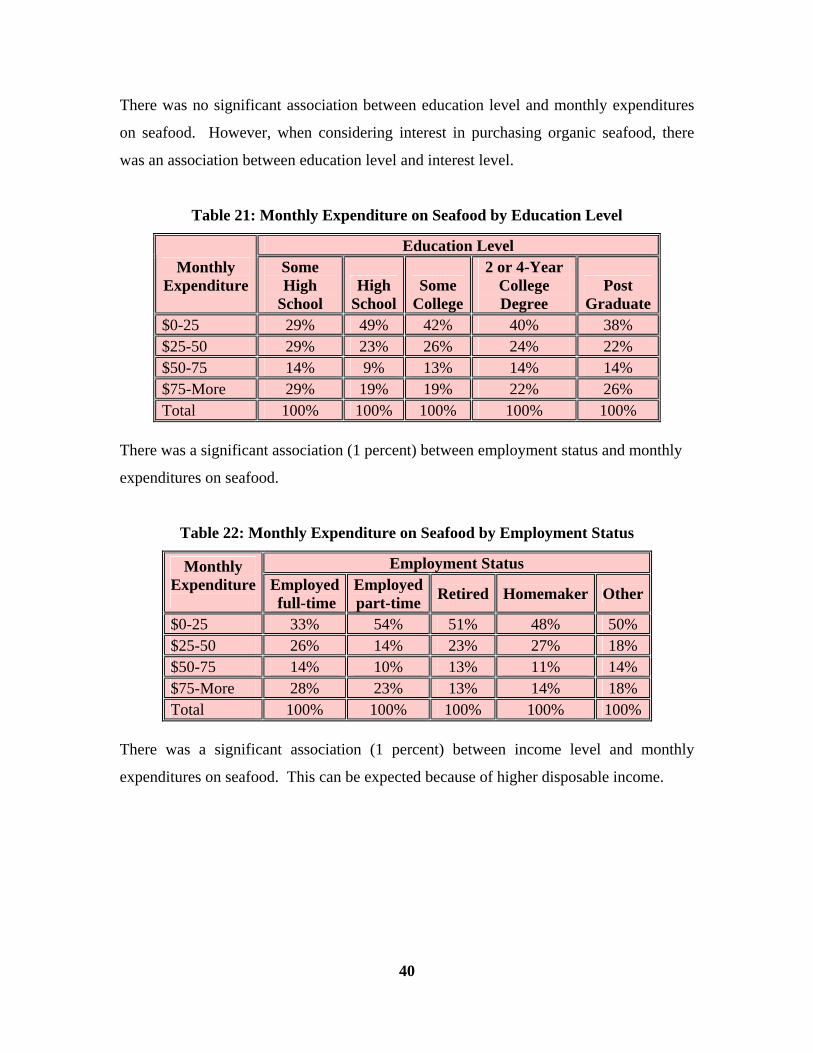
40
There was no significant association between education level and monthly expenditures
on seafood. However, when considering interest in purchasing organic seafood, there
was an association between education level and interest level.
Table 21: Monthly Expenditure on Seafood by Education Level
Education Level Monthly
Expenditure
Some High
School High
SchoolSome
College
2 or 4-Year College Degree
Post Graduate
$0-25 29% 49% 42% 40% 38% $25-50 29% 23% 26% 24% 22% $50-75 14% 9% 13% 14% 14% $75-More 29% 19% 19% 22% 26% Total 100% 100% 100% 100% 100%
There was a significant association (1 percent) between employment status and monthly
expenditures on seafood.
Table 22: Monthly Expenditure on Seafood by Employment Status
Employment Status Monthly Expenditure
Employed full-time
Employed part-time Retired Homemaker Other
$0-25 33% 54% 51% 48% 50% $25-50 26% 14% 23% 27% 18% $50-75 14% 10% 13% 11% 14% $75-More 28% 23% 13% 14% 18% Total 100% 100% 100% 100% 100%
There was a significant association (1 percent) between income level and monthly
expenditures on seafood. This can be expected because of higher disposable income.
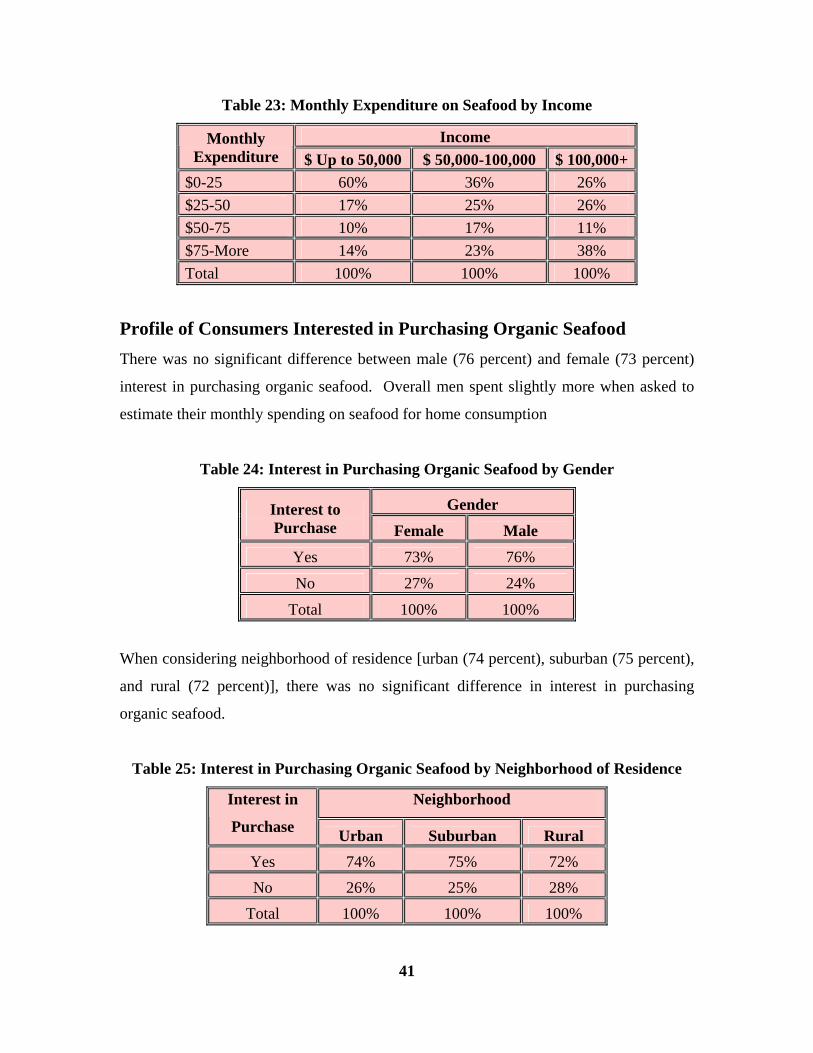
41
Table 23: Monthly Expenditure on Seafood by Income
Income Monthly Expenditure $ Up to 50,000 $ 50,000-100,000 $ 100,000+
$0-25 60% 36% 26% $25-50 17% 25% 26% $50-75 10% 17% 11% $75-More 14% 23% 38% Total 100% 100% 100%
Profile of Consumers Interested in Purchasing Organic Seafood There was no significant difference between male (76 percent) and female (73 percent)
interest in purchasing organic seafood. Overall men spent slightly more when asked to
estimate their monthly spending on seafood for home consumption
Table 24: Interest in Purchasing Organic Seafood by Gender
Gender Interest to Purchase Female Male
Yes 73% 76%
No 27% 24%
Total 100% 100%
When considering neighborhood of residence [urban (74 percent), suburban (75 percent),
and rural (72 percent)], there was no significant difference in interest in purchasing
organic seafood.
Table 25: Interest in Purchasing Organic Seafood by Neighborhood of Residence
Neighborhood Interest in
Purchase Urban Suburban Rural Yes 74% 75% 72% No 26% 25% 28%
Total 100% 100% 100%
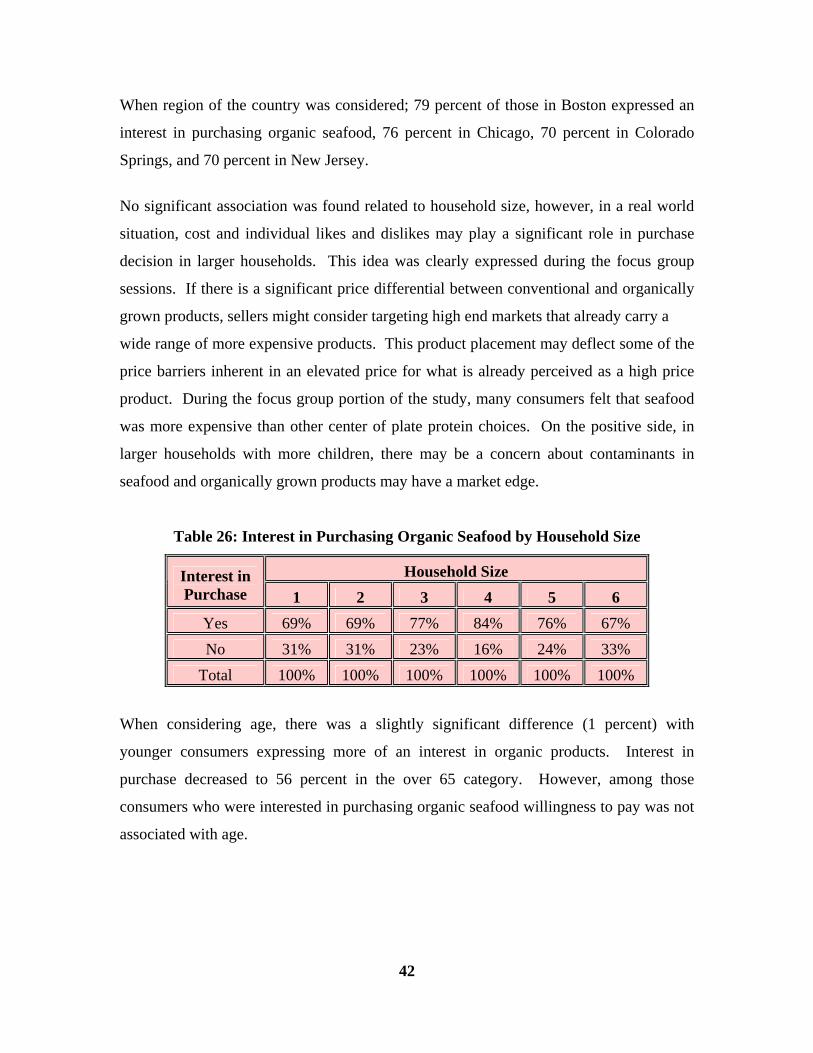
42
When region of the country was considered; 79 percent of those in Boston expressed an
interest in purchasing organic seafood, 76 percent in Chicago, 70 percent in Colorado
Springs, and 70 percent in New Jersey.
No significant association was found related to household size, however, in a real world
situation, cost and individual likes and dislikes may play a significant role in purchase
decision in larger households. This idea was clearly expressed during the focus group
sessions. If there is a significant price differential between conventional and organically
grown products, sellers might consider targeting high end markets that already carry a
wide range of more expensive products. This product placement may deflect some of the
price barriers inherent in an elevated price for what is already perceived as a high price
product. During the focus group portion of the study, many consumers felt that seafood
was more expensive than other center of plate protein choices. On the positive side, in
larger households with more children, there may be a concern about contaminants in
seafood and organically grown products may have a market edge.
Table 26: Interest in Purchasing Organic Seafood by Household Size
Household Size Interest in Purchase 1 2 3 4 5 6
Yes 69% 69% 77% 84% 76% 67% No 31% 31% 23% 16% 24% 33%
Total 100% 100% 100% 100% 100% 100%
When considering age, there was a slightly significant difference (1 percent) with
younger consumers expressing more of an interest in organic products. Interest in
purchase decreased to 56 percent in the over 65 category. However, among those
consumers who were interested in purchasing organic seafood willingness to pay was not
associated with age.
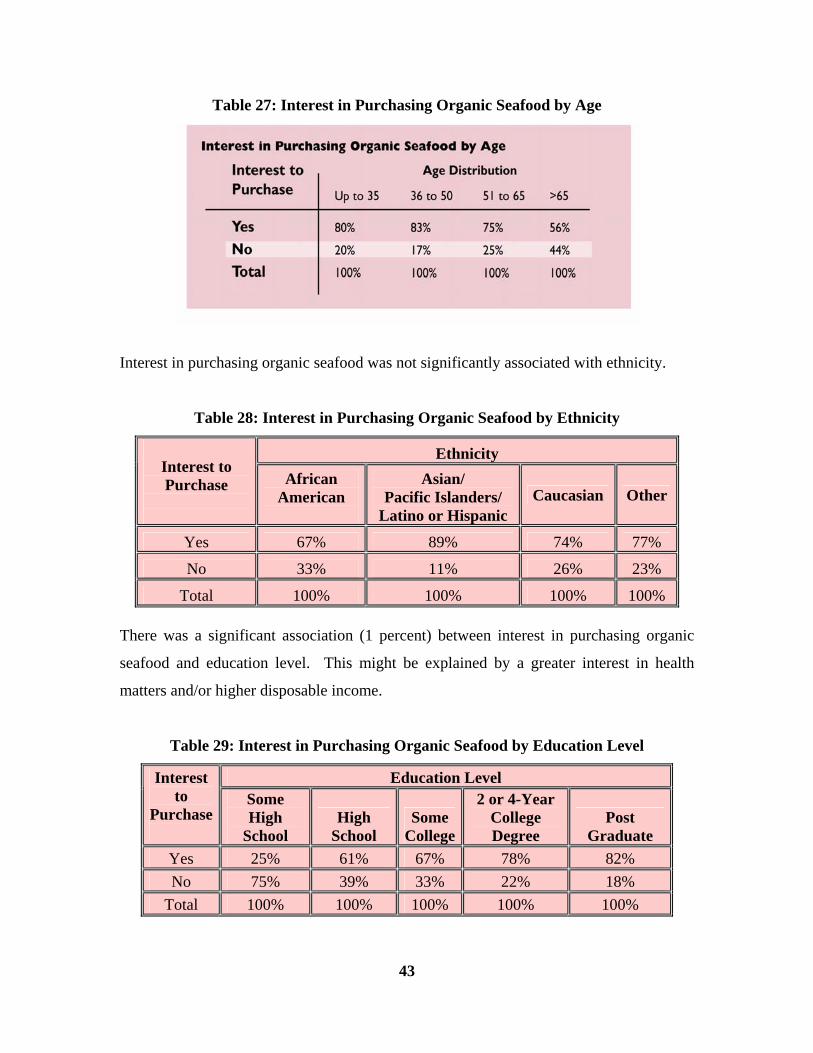
43
Table 27: Interest in Purchasing Organic Seafood by Age
Interest in purchasing organic seafood was not significantly associated with ethnicity.
Table 28: Interest in Purchasing Organic Seafood by Ethnicity
Ethnicity Interest to Purchase
African American
Asian/ Pacific Islanders/
Latino or Hispanic Caucasian Other
Yes 67% 89% 74% 77%
No 33% 11% 26% 23%
Total 100% 100% 100% 100% There was a significant association (1 percent) between interest in purchasing organic
seafood and education level. This might be explained by a greater interest in health
matters and/or higher disposable income.
Table 29: Interest in Purchasing Organic Seafood by Education Level
Education Level Interest to
Purchase
Some High
School High
School Some
College
2 or 4-Year College Degree
Post Graduate
Yes 25% 61% 67% 78% 82% No 75% 39% 33% 22% 18%
Total 100% 100% 100% 100% 100%
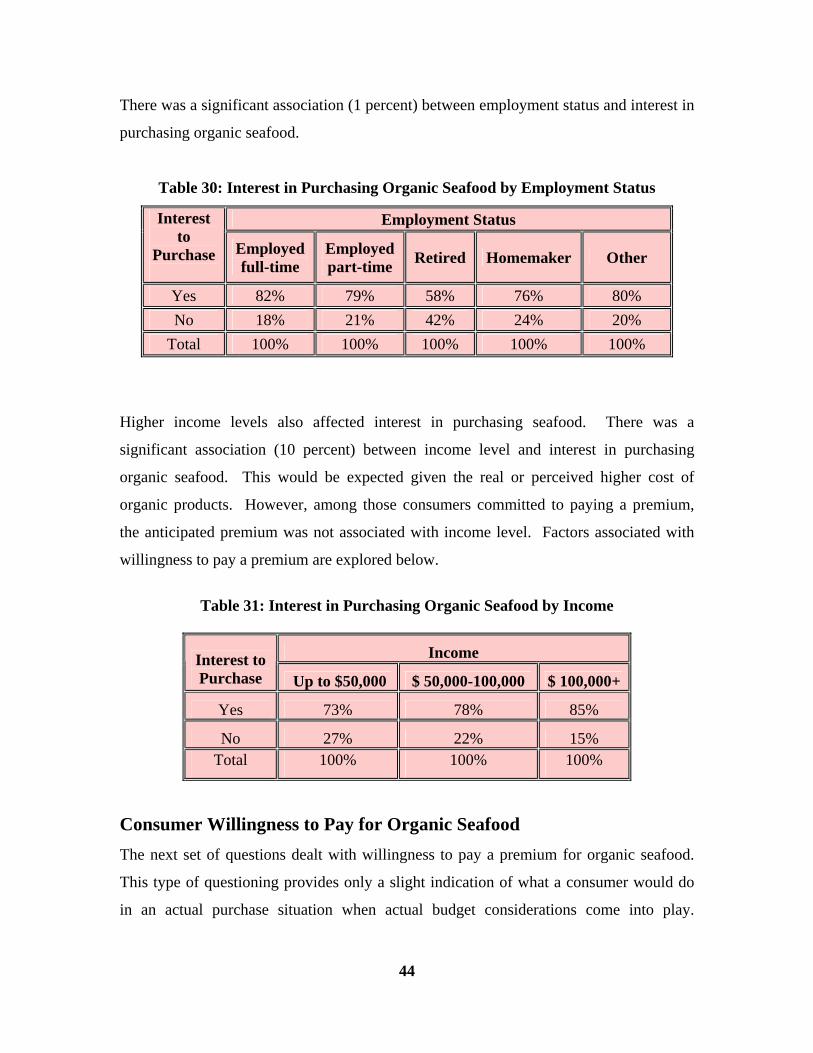
44
There was a significant association (1 percent) between employment status and interest in
purchasing organic seafood.
Table 30: Interest in Purchasing Organic Seafood by Employment Status
Employment Status Interest to
Purchase
Employed full-time
Employed part-time Retired Homemaker Other
Yes 82% 79% 58% 76% 80% No 18% 21% 42% 24% 20%
Total 100% 100% 100% 100% 100%
Higher income levels also affected interest in purchasing seafood. There was a
significant association (10 percent) between income level and interest in purchasing
organic seafood. This would be expected given the real or perceived higher cost of
organic products. However, among those consumers committed to paying a premium,
the anticipated premium was not associated with income level. Factors associated with
willingness to pay a premium are explored below.
Table 31: Interest in Purchasing Organic Seafood by Income
Income Interest to Purchase Up to $50,000 $ 50,000-100,000 $ 100,000+
Yes 73% 78% 85%
No 27% 22% 15% Total 100% 100% 100%
Consumer Willingness to Pay for Organic Seafood The next set of questions dealt with willingness to pay a premium for organic seafood.
This type of questioning provides only a slight indication of what a consumer would do
in an actual purchase situation when actual budget considerations come into play.
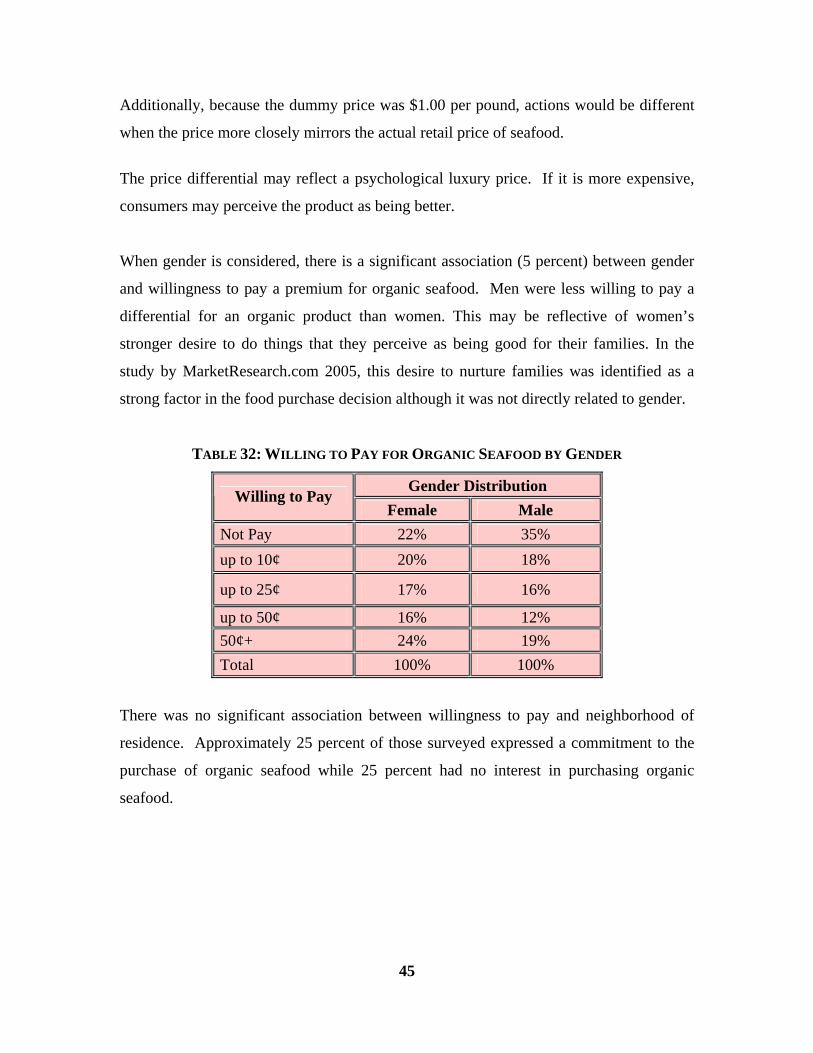
45
Additionally, because the dummy price was $1.00 per pound, actions would be different
when the price more closely mirrors the actual retail price of seafood.
The price differential may reflect a psychological luxury price. If it is more expensive,
consumers may perceive the product as being better.
When gender is considered, there is a significant association (5 percent) between gender
and willingness to pay a premium for organic seafood. Men were less willing to pay a
differential for an organic product than women. This may be reflective of women’s
stronger desire to do things that they perceive as being good for their families. In the
study by MarketResearch.com 2005, this desire to nurture families was identified as a
strong factor in the food purchase decision although it was not directly related to gender.
TABLE 32: WILLING TO PAY FOR ORGANIC SEAFOOD BY GENDER
Gender Distribution Willing to Pay
Female Male Not Pay 22% 35% up to 10¢ 20% 18%
up to 25¢ 17% 16%
up to 50¢ 16% 12% 50¢+ 24% 19% Total 100% 100%
There was no significant association between willingness to pay and neighborhood of
residence. Approximately 25 percent of those surveyed expressed a commitment to the
purchase of organic seafood while 25 percent had no interest in purchasing organic
seafood.
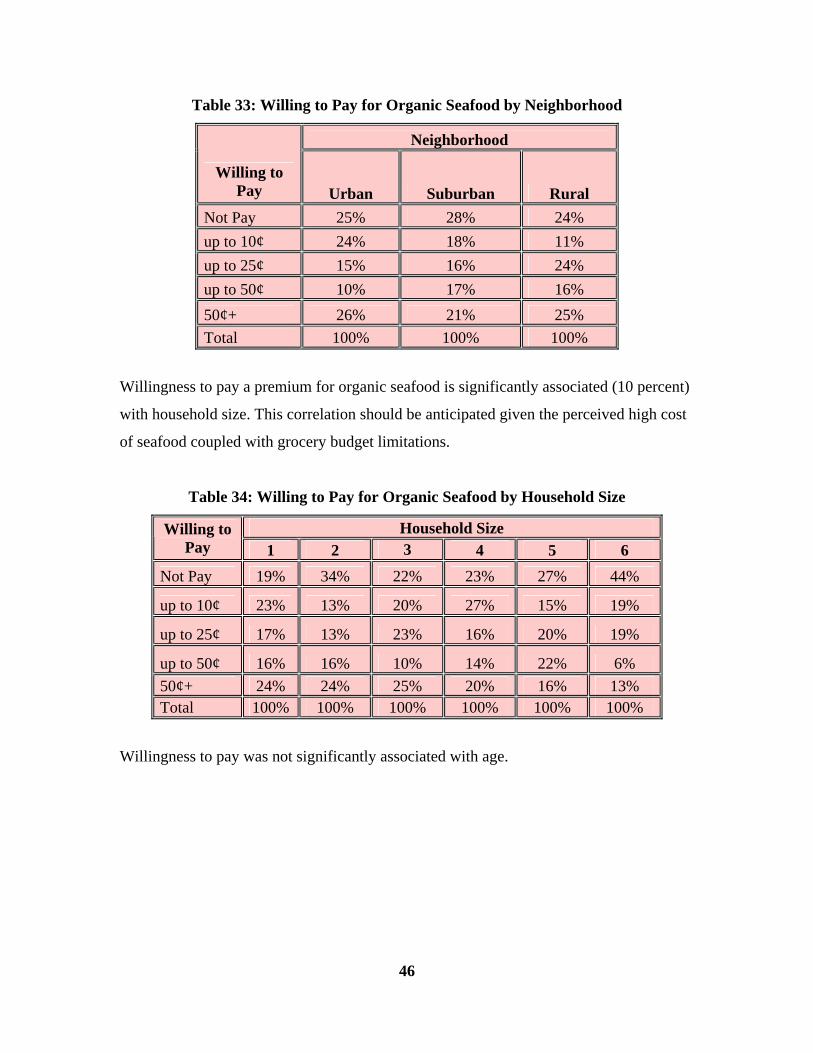
46
Table 33: Willing to Pay for Organic Seafood by Neighborhood
Neighborhood
Willing to Pay Urban Suburban Rural
Not Pay 25% 28% 24% up to 10¢ 24% 18% 11% up to 25¢ 15% 16% 24% up to 50¢ 10% 17% 16% 50¢+ 26% 21% 25% Total 100% 100% 100%
Willingness to pay a premium for organic seafood is significantly associated (10 percent)
with household size. This correlation should be anticipated given the perceived high cost
of seafood coupled with grocery budget limitations.
Table 34: Willing to Pay for Organic Seafood by Household Size
Household Size Willing to Pay 1 2 3 4 5 6
Not Pay 19% 34% 22% 23% 27% 44%
up to 10¢ 23% 13% 20% 27% 15% 19%
up to 25¢ 17% 13% 23% 16% 20% 19%
up to 50¢ 16% 16% 10% 14% 22% 6% 50¢+ 24% 24% 25% 20% 16% 13% Total 100% 100% 100% 100% 100% 100%
Willingness to pay was not significantly associated with age.

47
Table 35: Willing to Pay for Organic Seafood by Age
Age Distribution Willing to Pay UP to 35 36 to 50 51 to 65 >65
Not Pay 29% 22% 28% 29% up to 10¢ 23% 20% 15% 21%
up to 25¢ 16% 19% 15% 16%
up to 50¢ 11% 13% 19% 13% 50¢+ 21% 25% 22% 21% Total 100% 100% 100% 100%
Willingness to pay was not significantly associated with ethnicity.
Table 36: Willing to Pay for Organic Seafood by Ethnicity
Ethnicity Willing to
Pay African
-American
Asian/ Pacific Islanders/
Latino or Hispanic Caucasian Other
Not Pay 21% 16% 28% 29% Up to 10¢ 29% 22% 18% 18% Up to 25¢ 15% 19% 17% 18% Up to 50¢ 12% 13% 15% 6% 50¢+ 24% 31% 22% 29% Total 100% 100% 100% 100%
Willingness to pay was not significantly associated with education level.
Table 37: Willing to Pay for Organic Seafood by Education Level
Education Level
Willing to Pay
Some High School High School Some College 2 or 4-Year
Post Graduate
Not Pay 67% 34% 37% 22% 24% up to 10¢ 0 15% 17% 21% 20% up to 25¢ 0 12% 16% 19% 18% up to 50¢ 0 13% 14% 17% 13% 50¢+ 33% 26% 16% 21% 25% Total 100% 100% 100% 100% 100%

48
Willingness to pay was not significantly associated with employment status
Table 38: Willing to Pay for Seafood by Employment Status
Employment Status Willing to Pay
Employed full-time
Employed part-time Retired Homemaker Other
Not Pay 26% 25% 35% 21% 6% Up to 10¢ 20% 20% 18% 19% 17% Up to 25¢ 18% 16% 15% 17% 22% Up to 50¢ 13% 13% 17% 15% 28%
50¢+ 24% 26% 15% 28% 28% Total 100% 100% 100% 100% 100%
Willingness to pay for organic seafood was not significantly associated with income
level.
Table 39: Willing to Pay for Organic Seafood by Income
Income Willing to Pay $ Up to 50,000 $ 50,000-100,000 $ 100,000+ Not Pay 27% 27% 24% up to 10¢ 24% 20% 14% up to 25¢ 15% 19% 17% up to 50¢ 17% 11% 14% 50¢+ 17% 23% 32% Total 100% 100% 100%
Opportunities for Market Penetration Price or the perception of higher prices is a major limiting factor in the purchase of all
seafood. The price issue is compounded in the case of organic seafood since many
consumers view organic products as being more expensive than conventional products in
the same category. Product freshness and visual appeal are important considerations.
The consumer needs to perceive an inherently higher value for organic seafood. Creating
this perception will require consumer education.
Table 40:
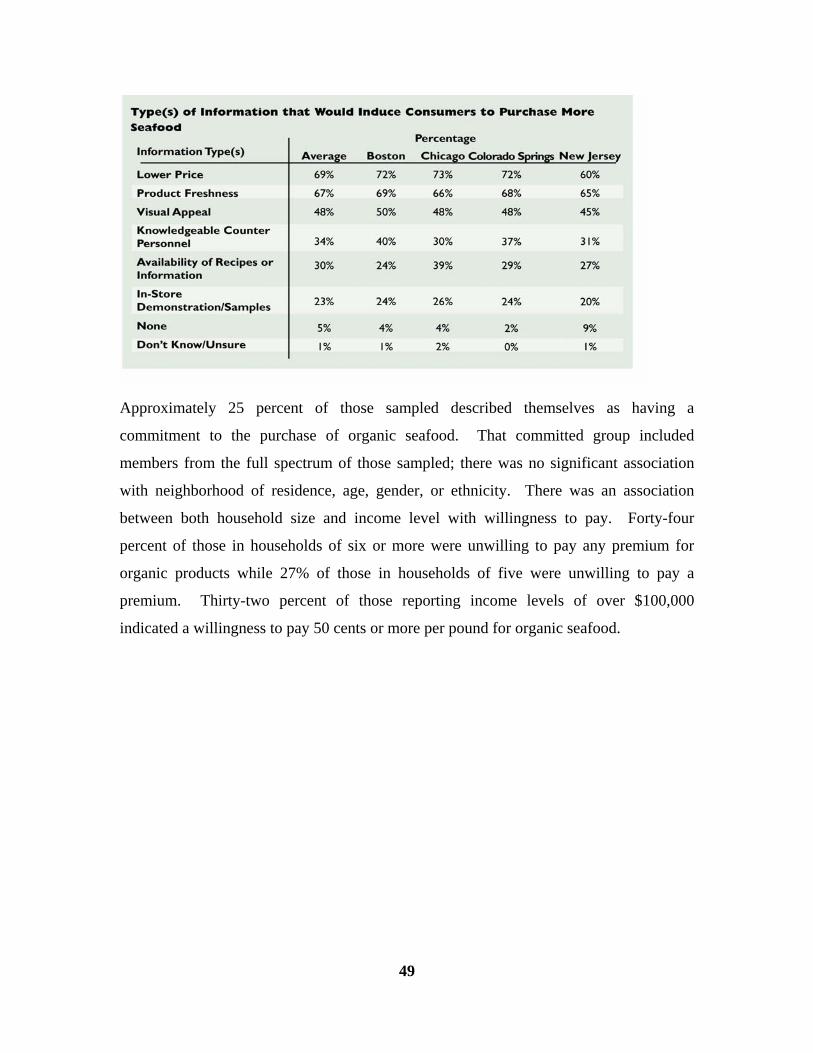
49
Approximately 25 percent of those sampled described themselves as having a
commitment to the purchase of organic seafood. That committed group included
members from the full spectrum of those sampled; there was no significant association
with neighborhood of residence, age, gender, or ethnicity. There was an association
between both household size and income level with willingness to pay. Forty-four
percent of those in households of six or more were unwilling to pay any premium for
organic products while 27% of those in households of five were unwilling to pay a
premium. Thirty-two percent of those reporting income levels of over $100,000
indicated a willingness to pay 50 cents or more per pound for organic seafood.
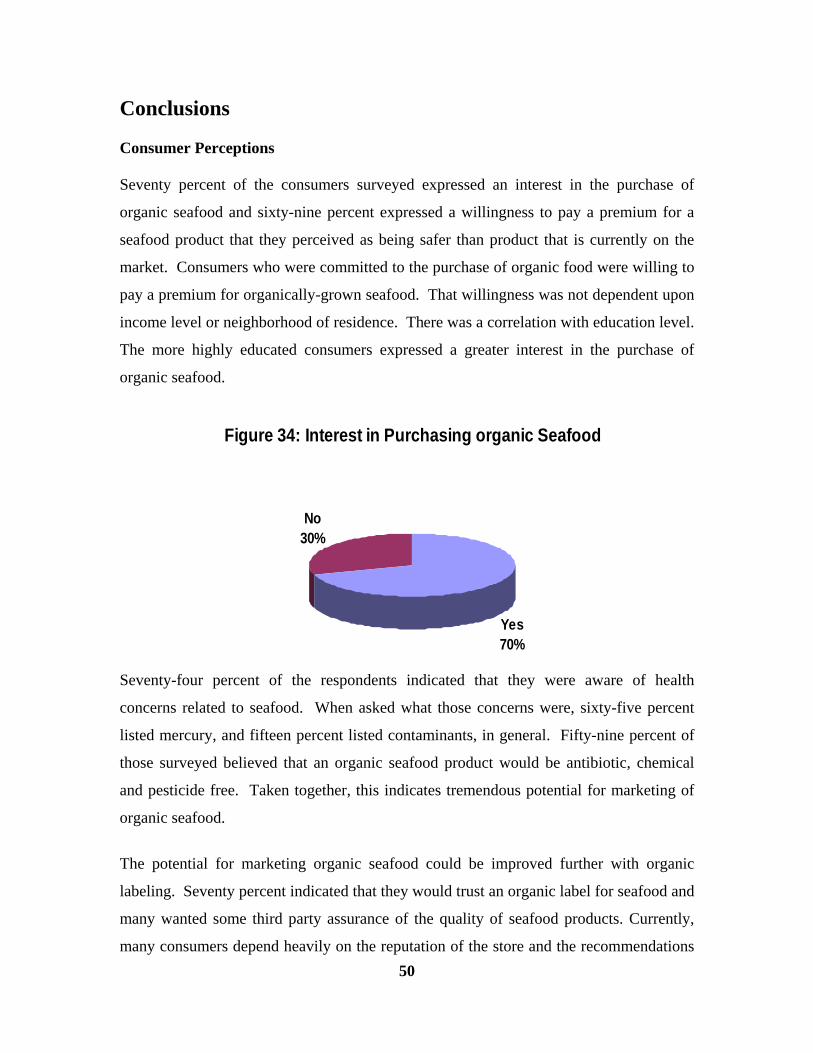
50
Figure 34: Interest in Purchasing organic Seafood
Yes70%
No30%
Conclusions Consumer Perceptions Seventy percent of the consumers surveyed expressed an interest in the purchase of
organic seafood and sixty-nine percent expressed a willingness to pay a premium for a
seafood product that they perceived as being safer than product that is currently on the
market. Consumers who were committed to the purchase of organic food were willing to
pay a premium for organically-grown seafood. That willingness was not dependent upon
income level or neighborhood of residence. There was a correlation with education level.
The more highly educated consumers expressed a greater interest in the purchase of
organic seafood.
Seventy-four percent of the respondents indicated that they were aware of health
concerns related to seafood. When asked what those concerns were, sixty-five percent
listed mercury, and fifteen percent listed contaminants, in general. Fifty-nine percent of
those surveyed believed that an organic seafood product would be antibiotic, chemical
and pesticide free. Taken together, this indicates tremendous potential for marketing of
organic seafood.
The potential for marketing organic seafood could be improved further with organic
labeling. Seventy percent indicated that they would trust an organic label for seafood and
many wanted some third party assurance of the quality of seafood products. Currently,
many consumers depend heavily on the reputation of the store and the recommendations
51
of sales associates when purchasing seafood. Most indicated that they limit their
purchase of seafood products to specific stores. Overall most consumers had very
positive beliefs about organic seafood.
Throughout the survey, approximately 25 percent of the respondents expressed the belief
that organic products are not significantly different from conventional products and are
not worth any price differential.
A comparable 25 percent were committed to the purchase of organic seafood and
believed that it carried an intrinsic value. Those consumers were willing to pay a
premium for a product that they perceived as being safer and better for their families.
Purchase Decision
Consumers purchase much less seafood than competing center of the plate protein
choices such as chicken, beef and poultry. Although seafood consumption as a discrete
category has increased, seafood’s share of the animal protein market in the United States
remains at 8 percent. The final decision to purchase seafood is dependent upon a wide
array of factors working in concert. Forty-nine percent said that the most important
reason that they consume seafood is because they like the taste. Forty-one percent of
those surveyed indicated that the most important reason that they consume seafood is
because they believe it is a healthy food. The overall perception is that the majority of
consumers make their purchase decision based on taste and health benefits.
Retail Opportunities
Seventy-two percent of the retailers surveyed in the third phase of this project indicated
that their customers prefer wild harvest seafood while 19 percent preferred farm-raised.
A number indicated that, although there was an overall preference for wild harvest, price
points are important in the final purchase decision. Most felt that their customers want
the choice.
52
Eighty-six percent indicated that lack of consumer knowledge was a significant barrier to
increased seafood sales. Fifty-four percent felt that negative media coverage also helped
to keep sales down. Only 14 percent felt that their customers actually preferred other
center of the plate protein choices. This is an important observation since, at least in the
minds of retailers, there is no perceived purchase barrier inherent in the product.
Education and information programs can be developed to drive sales.
Retailers did not believe that their customers would buy more seafood if the product was
labeled organic, but they did believe that they would pay a premium for organic products.
Sixty-nine percent believed that an organic label would increase consumer confidence in
the wholesomeness of the product.
Seventy-two percent felt that an organic product would fit into their seafood program.
Most felt that it was important to have in-store demonstrations and sampling programs to
help bolster seafood sales. They also felt that increased positive media coverage in local
newspaper food columns would help raise sales.
Critical issues that need to be addressed to improve the marketability and sale of
seafood as a category.
1) Consumers continue to have a bias against previously frozen products. This
indicates that freshness of seafood is an important attribute that consumers look for
as they make purchasing decisions.
2) Consumers continue to believe that seafood must be used on the date of purchase or
the next day. This belief coupled with concerns about freshness and the quality of
frozen products limits the time and place of purchase.
3) Consumers continue to place their confidence in the store as the authority on fish
quality. This limits consumers’ exposure to seafood and thus reduces their
likelihood of trying species other than those carried by a specific store. It also
emphasizes the need for retail associate training programs.
53
4) To increase consumer confidence in the safety and quality of seafood, labels should
be developed that would allow consumers to feel confident in their purchase
without the assurance of the store. In the case of organic product, this would
require a USDA seal to generate the highest level of confidence. Although products
have entered the American marketplace with foreign organic certification, a USDA
seal would be the most recognized and accepted by consumers. California has
recently banned the sale of any seafood products labeled “organic”, even those
certified by accredited foreign agencies, because of the lack of USDA standards.
Currently most consumers feel that seafood is not being inspected and the usage of
seals whether organic or not would help consumers in identifying products that they
perceive as being “safe” and increasing sales.
5) For the most part consumers are largely unaware of aquaculture as a food
production system. As a result, they tend to associate characteristics of other
farming practices, such as hormone usage in poultry farming, into their
understanding of aquaculture.
6) Consumers overwhelmingly consider seafood as a high priced, luxury alternative
rather than an everyday food. As meat and poultry prices continue to escalate,
seafood will have the opportunity to be repositioned in the minds of consumers. To
increase seafood sales, seafood needs to be positioned as a cost-effective everyday
choice that can be prepared quickly and easily.
Critical issues that need to be addressed in positioning organic seafood in the
American market
1) Overall consumers need to have a better understanding of aquaculture production
systems and the application of organic farming principles to those systems.
2) Availability of organic seafood may dispel some of the consumers’ concerns about
the environmental impacts of aquaculture.
54
3) Availability of organic seafood will help to level the playing field with organic
poultry and meat.
4) Availability of organic seafood may increase the consumers’ comfort level with the
product and result in an increase in seafood consumption, which would have a
positive impact on the American diet.
5) Organic seafood would need to be positioned in those stores in which the largest
number of customers perceive organic products as having a high intrinsic value and
are willing to pay a premium for the product.
55
References Aarset B., Beckmann S., Bigne J., Beveridge M., Bjorndal T., Bunting, M J., McDonagh, P., Mariojouls C., Muir J F., Prothero A., Reisch, L A., Smith A P., Tveteras R. and Young J A., “The European Consumers’ Understanding and Perceptions of Organic Salmon Production”, IIFET 2000 Proceedings, European Union FAIR Programme. Barnes, Nora Ganim " Marketing Opportunities in the Shellfish Industry Based on Perceptions, Preferences and Practices of Consumers in New England”, Slade’s Ferry Bank Center for Business Research, the University of Massachusetts Dartmouth, Charlton College of Business, Spring 2003. Blake, Joe C. “Alternative Farming Methods.” Industry Studies – Agribusiness, The Industrial College of the Armed Forces, 2000. http://www.ndu.edu/icaf/industry/2000/agribusiness/agribusiness.htm Boehmer, Stephanie; Gold, Mary; Hauser, Stephanie; Thomas, Bill and Young, “Ann. Organic Aquaculture”, AFSIC Notes #5, USDA. January 2005. Chan, Tak-chuen T., “Study of Current Status and Potential Sustainable Development of the Aquaculture Industry in Hong Kong”, Civic Exchange, July 2005 Franz, Nicole, “GLOBEFISH”, Organic Aquaculture Production, June 2004. http://www.globefish.org/index.php?id=2181&easysitestatid=701823204 Gall, Ken and Linda O’Dierno, “Aquaculture Marketing Survey: Consumers, Retail Stores, and Food Service in New York and New Jersey’, Northeastern Regional Aquaculture Center 1992. Gross, Tania. “Consumer Attitudes towards Farmed Seafood”, Seafish Research and Information, April 2001. Nutrition Business Journal, “The U.S. Organic Food Industry”, March 2004. Robertson, Roberta A., Carlsen, Erika L., Lindsay and Bruce E. ‘Taste Test: Summary Report. University of New Hampshire Sea Grant College Program. 1999. NHU-S-99-001 Seafood Choices Alliance, “The Marketplace for Sustainable Seafood: Growing Appetites and Shrinking Seas”, June 2003. http://www.seafoodchoices.com/pdf/SCA_report_final.pdf Whole Foods Market. Frequently Asked Questions. August 2002 http://www.wholefoodsmarket.com/issues/org_questions.html. Willer, Helga and Yussefi, Minou, “The World of Organic Agriculture - Statistics and Emerging Trends – 2004”, International Federation of Organic Agriculture Movements, 2004. ISBN 3-934055-33-8.
56
Bibliography DiPietro, Ben“The Public Opinion of Organic Fish”, IntraFish 2, no. 8 (August 2004): 8. Full-text online: Http://www/intrafish.com/pdf/download/6a2daf07c3abc1068e430b217b62e/2004/8/08.pdf DiPietro, Ben “Organic Tilapia: Will it Sell?” IntraFish 2, no. 7 (July 2004): 10-12. Biling-Hwan Lin, Jayachandran N. Variyam, Jane Allshouse, and John Cromartie,”Food and Agricultural Commodity Consumption in the United States: Looking ahead to 2020”, Agricultural Economic Report, no. AER820. Washington, DC: U.S. Department of Agriculture, Economic Research Service, February 2003. Charles, E. and P. Paquotte, “Product Differentiation, Labeling and Quality Approach: Developments and Stakes in the French Shellfish Market”, Aquaculture Economics and Management 3, no. 2 (Aug 1999): 121-129. Cherry, Drew “Swiss Retailer Begs for More Organic Seafood”, IntraFish 2, no. 4 (April 2004): 4. Cho, G.K. and J.W. Heath, “Market Assessment for Organic Salmon in British Columbia,” Proceedings of the 14
th IFOAM organic World Congress, “Cultivating
Communities, August 21 – 24, 2002, Victoria Conference Centre, Canada, compiled by Robert Thompson. Ottowa, Canada: Canadian Organic Growers, 2002. 130. Dimitri, Carolyn,Catherine Greene, and U.S. Department of Agriculture, Economic Research Service, “Recent Growth patterns in the U.S. Organic Foods Market”, Agriculture Information Bulletin, no. 777. Washington, DC: U.S. Department of Agriculture, Economic Research Service, September 2002. Full-text online:http://www.ers.usda.gov. Franz, Nicole and Food and Agriculture Organization (FAO) of the United Nations, “Organic Aquaculture Production”, Fisheries Industry Division. June 2004. Full-text online: http://www.globefish.org Franz, Nicole and Food and Agriculture Organization (FAO) of the United Nations, “Organic Aquaculture Production”, Fisheries Industry division. May 2004. Full-text online: http://www.globefish.org Goldburg , Rebecca J. “Comments of Rebecca Goldburg, PH.D, Concerning Organic Certification of Aquaculture Products Presented to the National Organic Standards Board”, National Organic Standards Board Meeting, June 8-10, 1999, Washington, DC, and environmental Defense fund June 8, 1999. Full-text online: http://www.ams.usda.gov/nosb/archives/minutes/June 99 attachments/12.pdf
57
Handley, S., “Organic Oyster Production: a Marketing Opportunity for New Zealand?” Aquaculture Update (NIWA) 27, no. ½ (Summer 2000): 1-2. Harvey, David J “Aquaculture Outlook”, Semi-Annual Publication. Full-text online: http://usda.mannlib.cornell.edu/reports/erssor/livestock/ldp-aqs/ (accessed Dec. 15, 2004.) Johnston, R.J., Cathy R. Wessells, H. Donath, and F. Asche, “Measuring Consumer Preferences for Ecolabeled Seafood: an International Comparison,” Journal of Agricultural and Resource Economics 26, no. 1 (2001): 20-39. Lockwood, G. S. “Organic Aquaculture-Are There Interested Growers?” Aquaculture Magazine 27, no 3 (May/June 2001) Lockwood, G.S., “Organic Fish: a Major Market Opportunity”, Aquaculture Magazine 26, no.6 (November-December 2001): 24-28. Mansfield, B., “From Catfish to Organic fish: Making Distinctions about Nature as Cultural Economic Practice,” Geoforum 34, no. 3 (2003): 329-342. Maunder, R., B. Kennard, and D. McCrea, “Organic Meat and Fish: Production, Processing and Marketing”, Handbook of Organic Food Processing and Production, edited by S. Wright. 2
nd ed. Oxford, UK: Blackwell Science, 2000. pp. 92-105.
Mayk, Lauren. “Demand Pushes Organic Foods into the Mainstream,” Herald Tribune, April 28, 2003. McGovern, Dan, “Growing Organic Seafood Sales,” IntraFish 2, no. 5 (August 1997): 14, 16-19. Myrland, O. and H.W. Kinnucan, “Direct and Indirect Effects of Generic Advertising: A Model with Application to Salmon”, Aquaculture Economics and Management 5, no. 5/6 (2001): 273-288. Naturland “Aquaculture”, edition.V. Full-text online:http://www.naturland.de/englisch/n4/ seite4_5.html (accessed Dec.15, 2004). Organic Farming Research Foundation, “Frequently Asked Questions about Organic Farming”. Full-text online:http://www.ofrf.org/general/about_organic/ Schettler, Renee and Drica Marcus, “Organic Isn’t Always Best Label for Salmon”, Newsday.Com, April 13, 2004. Full-text online:http://www.organicconsumers.org/Toxic/organic-salmon.cfm Seafood International 18, no. 2, “French Trout Certified Organic”, (2003):7
58
Scheel, Joan “Market Trends: The Health of Organic Foods,” Prepared Foods (May 2003). Staniford, D., “Organically Farmed Salmon is an Oxymoron”, The Organic Standard 3 (July 2001): 14. Stern, M. “Organic Seafood – Gaining Prominence in Europe”, INFOFISH International 2 (2002): 8-11. Sutherland, R.M., “Organic Salmon Production: a Preliminary Analysis of the Economics”, Aquaculture Economics and Management 5, no. ¾ (2001: 191-210. Teisl, M.F., B. Roe, and R.L. Hicks, “Can Eco-Labels Tune a Market? Evidence from Dolphin-Safe Labeling”, Journal of Environmental Economics and Management 43, no. 3 (2002): 339-359. Tournay, Bernadette, “Farms Go Organic”, Fish Farming International 29, no 9 (2002): 10. U.S. Department of Agriculture, “Briefing Room: Organic Farming and Marketing”, Economic Research Service. Updated April 22, 2004. Full-text online:http://www.ers.usda.gov/Briefting/Organic/index.htm Wessells, Cathy R. and D. Holland, “Predicating Consumer Choices for Farmed and Wild Salmon”, Aquaculture Economics and Management 2, no. 2 (1998) 48-59. Wessells, Cathy R. “Ecolabeling and International Seafood Trade: The Roles of Certification Costs and Consumers’ Willingness to Pay”, Fisheries Economics Newsletter 50 (2000): 44-49. Wessells, Cathy R. R.J. Johnston, and H. Donath, “Assessing Consumer Preferences for Ecolabeled Seafood: the Influence of Species, Certifier, and Household Attributes”,. Proceedings From the annual Meeting of the American Agricultural Economics Association, Nashville, Tennessee, 8-11 August 1999 81, American Journal of Agricultural Economics no 5 (1999): 1084-1089.

59
Appendix –Telephone Survey
1. Do you purchase seafood for home consumption? 1. Yes 2. No - THANK THE RESPONDENT AND TERMINATE SURVEY 2. Have you ever purchased aquacultured or farm-raised seafood?
1. Yes 2. No – SKIP TO QUESTION 5 99. Don’t know / Unsure – SKIP TO QUESTION 5
3. What kind(s) of aquacultured or farm-raised seafood have you purchased? (Do not read list) (Respondent may choose more than one answer) 1. CATFISH 2. CLAM 3. COD 4. CRAB 5. LOBSTER 6. MUSSEL 7. OYSTER 8. SALMON 9. SHRIMP 10. TILAPIA 11. TROUT 12. Other (please specify)_______ I am going to read to you different types of fish/shellfish, please tell me if you have purchased the following types of seafood in the past month? 4. In the past month have you bought Trout?
1. Yes 2. No 99. Don’t know / Unsure
5. In the past month have you bought Oysters?
1. Yes 2. No 99. Don’t know / Unsure
6. Clams?
1. Yes 2. No 99. Don’t Know / Unsure

60
7. Tilapia? 1. Yes 2. No 99. Don’t know / Unsure
8. Hybrid striped bass?
1. Yes 2. No 99. Don’t know / Unsure
9. Salmon?
1. Yes 2. No 99. Don’t know / Unsure
10. Catfish?
1. Yes 2. No 99. Don’t know
11. Mussels?
1. Yes 2. No 99. Don’t know / Unsure
12. Shrimp? 1. Yes 2. No 99. Don’t know / Unsure
13. Crayfish?
1. Yes 2. No 99. Don’t know / Unsure
14. What is the most important reason you consume seafood?
1. I like the taste 2. I believe it is a healthy food 3. I believe it is a low calorie food 4. I believe it is easy to prepare 5. I like the gourmet appeal 6. Other [Do not read] Specify: What would you say is the most important reason for
consuming seafood?___________________ 99. Don’t know / Unsure
61
15. What types of information would induce you to purchase seafood or purchase seafood more often? (Respondent may choose more than one answer)
1. Product Freshness 2. Visual Appeal 3. Lower price 4. Knowledgeable Counter Personnel 5. Availability of Recipes or Information 6. In-Store Demonstration/Samples 7. None [Do not read] 99. Don’t know / Unsure
16. Do you believe seafood is being inspected for quality and safety?
1. Yes 2. No 99. Don’t Know/ Unsure
I am going to read you three statements, please select one statement that conveys the highest quality. 17. Which of the following would you say conveys the highest quality?
1. Imported 2. Locally Grown 3. Farm-raised in the USA 99. Don’t know / Unsure
18. And if you had to choose between: IF ASKED: Environmentally-Friendly practices are those that prevent overfishing and protect the environment.
1. Organic 2. All Natural 3. Environmentally-Friendly 99. Don’t know / Unsure
For the following terms, please tell me whether the term better describes FARM-RAISED or WILD-CAUGHT seafood. 19. Which is more environmentally friendly - FARM-RAISED or WILD-CAUGHT
1. Farm-Raised 2. Wild Caught 99. Don’t know / Unsure
20. Which tastes better - FARM-RAISED or WILD-CAUGHT
Farm-Raised Wild Caught Don’t know / Unsure
62
21. Which has better year-round availability - FARM-RAISED or WILD-CAUGHT 1. Farm-Raised 2. Wild Caught 99. Don’t know / Unsure
22. Which is more expensive - FARM-RAISED or WILD-CAUGHT
1. Farm-Raised 2. Wild Caught 99. Don’t know / Unsure
23. Which is better quality - FARM-RAISED or WILD-CAUGHT
1. Farm-Raised 2. Wild Caught 99. Don’t know / Unsure
24. Which is safer - FARM-RAISED or WILD-CAUGHT
1. Farm-Raised 2. Wild Caught
99. Don’t know / Unsure 25. Have you noticed Country of Origin Labeling (COOL) of seafood at the supermarket?
1. Yes 2. No – BRIEFLY EXPLAIN: it is a new requirement from the USDA that
supermarkets display the country of origin of the seafood and whether it is farm-raised or wild-caught.
99. Don’t know / Unsure 26. Do you think Country of Origin Labeling (COOL) of seafood is useful?
1. Yes 2. No 99. Don’t know / Unsure
27. Does Country of Origin Labeling (COOL) influence your purchase decision(s) with seafood?
1. Yes 2. No 99. Don’t know / Unsure
28. Would an “Environmentally-Friendly” label affect your purchasing decision(s)? 1. Yes 2. No 99. Don’t know / Unsure
63
29. Are you aware of any health concerns with seafood? 1. Yes 2. No – SKIP TO QUESTION 32 99. Don’t know / Unsure – SKIP TO QUESTION 32
30. And what concerns would those be? (Do not read list) (Respondent may choose more than one answer)
1. Cholesterol 2. Mercury 3. Cadmium 4. PCBs 5. Bacteria 6. Viruses 7. Red tide 8. Contaminants 9. Colorants 10. GMO 11. Food Poisoning 12. Others (please specify)_________
For the next two questions, we want to know your thoughts on organic foods in general. 31. Please tell me some characteristics you believe make a food an organic food. (Do not read list) (Respondent may choose more than one answer)
1. Pesticide/antibiotic free 2. Safer 3. Better taste 4. Better quality 5. Better for the environment 6. More nutritious 7. Animal welfare standards 8. None 9. Other (please specify)___________
32. Which of the following statements best describes your purchase behavior with respect to organic foods?
1. I am committed to buying organic products as often as I can. 2. I purchase organic products from time to time. 3. I do not purchase organic products. 99. Don’t know / Unsure
64
Now I’m going to ask you few questions relating to organic seafood to better understand your feeling towards it. 33. Would you be interested in purchasing organic seafood?
1. Yes 2. No – SKIP TO QUESTION 37 99. Don’t know
34. Would you change the location where you purchase seafood to be able to purchase organic seafood?
1. Yes 2. No 99. Don’t Know / Unsure
35. Suppose your favorite seafood that you purchase regularly costs $1 per pound. Would you pay more for organic certified?
1. No 2. Yes, I would pay up to 5 cents more per pound 3. Yes, I would pay up to 10 cents more per pound 4. Yes, I would pay up to 25 cents more per pound 5. Yes, I would pay up to 50 cents more per pound 6. Yes, I would pay more than 50 cents more per pound
99. Don’t know / Unsure 36. Would you trust an organic label for seafood?
1. Yes 2. No 99. Don’t know / Unsure
For the next few questions please let me know if you, agree or disagree with the statement that I will read: 37. I believe organic seafood would be free of chemicals, pesticide, and antibiotics.
1. Agree 2. Disagree 99. Don’t know / Unsure
38. I believe organic aquaculture would be safer than conventional seafood.
1. Agree 2. Disagree
99. Don’t know / Unsure 39. I believe organic seafood would have better flavor than conventional seafood.
1. Agree 2. Disagree 99. Don’t know / Unsure
65
40. I believe organic seafood would be more nutritious than conventional seafood.
1. Agree 2. Disagree
99. Don’t know / Unsure 41. I believe organic seafood would be of better quality than conventional seafood.
1. Agree 2. Disagree
99. Don’t know / Unsure 42. I believe that producing organic seafood would be better for the environment than conventional seafood.
1. Agree 2. Disagree
99. Don’t know / Unsure 43. I believe organic seafood production considers animal welfare more than conventional seafood production.
1. Agree 2. Disagree
99. Don’t know / Unsure 44. I believe that small farmers have a competitive advantage in the production of organic seafood
1. Agree 2. Disagree
99. Don’t know / Unsure 45. In a typical month, how many times do you buy seafood for home consumption? _________ 46. On average, how much do you spend on seafood per visit? (rounded to the nearest dollar) $____________________ You’ve been very patient; I just have few final questions for us to classify your answers. 47. INTERVIEWER: RECORD RESPONDENT’S GENDER BY OBSERVATION:
1. Female 2. Male

66
48. Do you consider your neighborhood to be Urban, Suburban or Rural?
1. Urban 2. Suburban 3. Rural 99. Don’t know / Unsure
49. Including yourself, how many people live in your household? __________. 50. What is your age bracket?
1. 20 or less 2. 21 to 35 3. 36 to 50 4. 51 to 65 5. Over 65 0. Refused
51. To which racial or ethnic group(s) do you most identify? (Respondent may choose more than one answer)
1. African-American (Non-Hispanic) 2. Asian/Pacific Islanders 3. Caucasian (Non-Hispanic) 4. Latino or Hispanic 5. Native American, Aleut or Aboriginal Peoples 6. Other (please specify) 0. Refused
52. Are there any other languages spoken in the household besides English? (Do not read list) (Respondent may choose more than one answer)
1. No 2. Spanish 3. French 4. German 5. Chinese 6. Japanese 7. Hindi 8. Other (please specify)_____________ 0. Refused
53. What is the highest level of education you have completed?
1. Some high school 2. High school 3. Some College 4. 2 or 4-year college degree 5. Post graduate degree 0. Refused

67
54. Which of the following best describes your current situation?
1. Employed full-time 2. Employed part-time 3. Retired 4. A homemaker 5. A student 6. Unemployed but looking for work 0. Refused
55. What is your approximate household income before taxes?
1. Under $25,000 2. $25,000 up to $50,000 3. $50,000 up to $75,000 4. $75,000 up to $100,000 5. $100,000 up to $150,000 6. $150,000 up to $200,000 7. Greater than $200,000 0. Refused
Recommended