Security Threat Response Manager
Configuring DSMs
Release 2013.1
Juniper Networks, Inc.
1194 North Mathilda Avenue
Sunnyvale, CA 94089
USA
408-745-2000
www.juniper.net
Published: 2013-07-05
2 �
Copyright Notice
Copyright © 2013 Juniper Networks, Inc. All rights reserved.
Juniper Networks, Junos, Steel-Belted Radius, NetScreen, and ScreenOS are registered trademarks of Juniper Networks, Inc. in the United States and other countries. The Juniper Networks Logo, the Junos logo, and JunosE are trademarks of Juniper Networks, Inc.
The following terms are trademarks or registered trademarks of other companies:
JavaTM and all Java-based trademarks and logos are trademarks or registered trademarks of Oracle and/or its affiliates.
All other trademarks, service marks, registered trademarks, or registered service marks are the property of their respective owners.
All specifications are subject to change without notice. Juniper Networks assumes no responsibility for any inaccuracies in this document or for any obligation to update information in this document. Juniper Networks reserves the right to change, modify, transfer, or otherwise revise this publication without notice.
FCC Statement
The following information is for FCC compliance of Class A devices: This equipment has been tested and found to comply with the limits for a Class A digital device, pursuant to part 15 of the FCC rules. These limits are designed to provide reasonable protection against harmful interference when the equipment is operated in a commercial environment. The equipment generates, uses, and can radiate radio-frequency energy and, if not installed and used in accordance with the instruction manual, may cause harmful interference to radio communications. Operation of this equipment in a residential area is likely to cause harmful interference, in which case users will be required to correct the interference at their own expense. The following information is for FCC compliance of Class B devices: The equipment described in this manual generates and may radiate radio-frequency energy. If it is not installed in accordance with Juniper Networks’ installation instructions, it may cause interference with radio and television reception. This equipment has been tested and found to comply with the limits for a Class B digital device in accordance with the specifications in part 15 of the FCC rules. These specifications are designed to provide reasonable protection against such interference in a residential installation. However, there is no guarantee that interference will not occur in a particular installation. If this equipment does cause harmful interference to radio or television reception, which can be determined by turning the equipment off and on, the user is encouraged to try to correct the interference by one or more of the following measures: Reorient or relocate the receiving antenna. Increase the separation between the equipment and receiver. Consult the dealer or an experienced radio/TV technician for help. Connect the equipment to an outlet on a circuit different from that to which the receiver is connected.
Caution: Changes or modifications to this product could void the user's warranty and authority to operate this device.
Disclaimer
THE SOFTWARE LICENSE AND LIMITED WARRANTY FOR THE ACCOMPANYING PRODUCT, SUBJECT TO THE MODIFICTAIONS SET FORTH BELOW ON THIS PAGE, ARE SET FORTH IN THE INFORMATION PACKET THAT SHIPPED WITH THE PRODUCT AND ARE INCORPORATED HEREIN BY THIS REFERENCE. IF YOU ARE UNABLE TO LOCATE THE SOFTWARE LICENSE OR LIMITED WARRANTY, CONTACT YOUR JUNIPER NETWORKS REPRESENTATIVE FOR A COPY.
Configuring DSMsRelease 2013.1
Copyright © 2013, Juniper Networks, Inc.
All rights reserved. Printed in USA.
Revision History
July 2013—Configuring DSMs
The information in this document is current as of the date listed in the revision history.
END USER LICENSE AGREEMENT
The Juniper Networks product that is the subject of this technical documentation consists of (or is intended for use with) Juniper Networks software. Use of such software is subject to the terms and conditions of the End User License Agreement (“EULA”) posted at http://www.juniper.net/support/eula.html, as modified by the following text, which shall be treated under the EULA as an Entitlement Document taking precedence over any conflicting provisions of such EULA as regards such software:
As regards software accompanying the STRM products (the “Program”), such software contains software licensed by Q1 Labs and is further accompanied by third-party software that is described in the applicable documentation or materials provided by Juniper Networks.

For the convenience of Licensee, the Program may be accompanied by a third party operating system. The operating system is not part of the Program, and is licensed directly by the operating system provider (e.g., Red Hat Inc., Novell Inc., etc.) to Licensee. Neither Juniper Networks nor Q1 Labs is a party to the license between Licensee and the third party operating system provider, and the Program includes the third party operating system “AS IS”, without representation or warranty, express or implied, including any implied warranty of merchantability, fitness for a particular purpose or non-infringement. For an installed Red Hat operating system, see the license file: /usr/share/doc/redhat-release-server-6Server/EULA.
By downloading, installing or using such software, you agree to the terms and conditions of that EULA as so modified.
� 3

4 �
CONTENTS
ABOUT THIS GUIDE
Audience . . . . . . . . . . . . . . . . . . . . . . . . . . . . . . . . . . . . . . . . . . . . . . . . . . . . . . . . . . 15
Documentation Conventions . . . . . . . . . . . . . . . . . . . . . . . . . . . . . . . . . . . . . . . . . . . 15
Technical Documentation. . . . . . . . . . . . . . . . . . . . . . . . . . . . . . . . . . . . . . . . . . . . . . 15
Requesting Technical Support . . . . . . . . . . . . . . . . . . . . . . . . . . . . . . . . . . . . . . . . . . 16
1 OVERVIEW
2 INSTALLING DSMS
Scheduling Automatic Updates . . . . . . . . . . . . . . . . . . . . . . . . . . . . . . . . . . . . . . . . . 20
Viewing Pending Updates . . . . . . . . . . . . . . . . . . . . . . . . . . . . . . . . . . . . . . . . . . . . . 20
Installing a DSM Manually . . . . . . . . . . . . . . . . . . . . . . . . . . . . . . . . . . . . . . . . . . . . . 22
3 3COM 8800 SERIES SWITCH
4 AMBIRON TRUSTWAVE IPANGEL
5 APACHE HTTP SERVER
Configuring Apache Using Syslog . . . . . . . . . . . . . . . . . . . . . . . . . . . . . . . . . . . . . . . 29
Configuring Apache Using Syslog-ng . . . . . . . . . . . . . . . . . . . . . . . . . . . . . . . . . . . . 31
6 APC UPS
7 APPLE MAC OS X
8 APPLICATION SECURITY DBPROTECT
9 ARRAY NETWORKS SSL VPN
10 ARUBA MOBILITY CONTROLLERS
11 BALABIT IT SECURITY
Configuring BalaBIt IT Security for Microsoft Windows Events . . . . . . . . . . . . . . . . .47
Configuring BalaBit IT Security for Microsoft ISA or TMG Event Files . . . . . . . . . . . .51
12 BARRACUDA
Barracuda Spam & Virus Firewall. . . . . . . . . . . . . . . . . . . . . . . . . . . . . . . . . . . . . . . .57
Barracuda Web Application Firewall. . . . . . . . . . . . . . . . . . . . . . . . . . . . . . . . . . . . . .58
13 BIT9 PARITY
14 BLUE COAT SGCreating a Custom Format . . . . . . . . . . . . . . . . . . . . . . . . . . . . . . . . . . . . . . . . . . . . .64
Retrieving Blue Coat Events. . . . . . . . . . . . . . . . . . . . . . . . . . . . . . . . . . . . . . . . . . . .65
Custom Format Addition Key-Value Pairs . . . . . . . . . . . . . . . . . . . . . . . . . . . . . . . . .71
15 BRIDGEWATER
16 CA TECHNOLOGIES
CA ACF2 . . . . . . . . . . . . . . . . . . . . . . . . . . . . . . . . . . . . . . . . . . . . . . . . . . . . . . . . . .77
CA SiteMinder . . . . . . . . . . . . . . . . . . . . . . . . . . . . . . . . . . . . . . . . . . . . . . . . . . . . . .91
CA Top Secret . . . . . . . . . . . . . . . . . . . . . . . . . . . . . . . . . . . . . . . . . . . . . . . . . . . . . .93
17 CHECK POINT
Check Point FireWall-1. . . . . . . . . . . . . . . . . . . . . . . . . . . . . . . . . . . . . . . . . . . . . . .107
Check Point Provider-1. . . . . . . . . . . . . . . . . . . . . . . . . . . . . . . . . . . . . . . . . . . . . . .116
18 CISCO
Cisco ACE Firewall. . . . . . . . . . . . . . . . . . . . . . . . . . . . . . . . . . . . . . . . . . . . . . . . . .119
Cisco Aironet . . . . . . . . . . . . . . . . . . . . . . . . . . . . . . . . . . . . . . . . . . . . . . . . . . . . . .121
Cisco ACS . . . . . . . . . . . . . . . . . . . . . . . . . . . . . . . . . . . . . . . . . . . . . . . . . . . . . . . .123
Cisco ASA . . . . . . . . . . . . . . . . . . . . . . . . . . . . . . . . . . . . . . . . . . . . . . . . . . . . . . . .128
Cisco CallManager. . . . . . . . . . . . . . . . . . . . . . . . . . . . . . . . . . . . . . . . . . . . . . . . . . 132
Cisco CatOS for Catalyst Switches . . . . . . . . . . . . . . . . . . . . . . . . . . . . . . . . . . . . . 134
Cisco CSA . . . . . . . . . . . . . . . . . . . . . . . . . . . . . . . . . . . . . . . . . . . . . . . . . . . . . . . . 135
Cisco FWSM . . . . . . . . . . . . . . . . . . . . . . . . . . . . . . . . . . . . . . . . . . . . . . . . . . . . . . 137
Cisco IDS/IPS . . . . . . . . . . . . . . . . . . . . . . . . . . . . . . . . . . . . . . . . . . . . . . . . . . . . . 138
Cisco IronPort . . . . . . . . . . . . . . . . . . . . . . . . . . . . . . . . . . . . . . . . . . . . . . . . . . . . . 141
Cisco NAC . . . . . . . . . . . . . . . . . . . . . . . . . . . . . . . . . . . . . . . . . . . . . . . . . . . . . . . . 143
Cisco Nexus. . . . . . . . . . . . . . . . . . . . . . . . . . . . . . . . . . . . . . . . . . . . . . . . . . . . . . . 144
Cisco IOS. . . . . . . . . . . . . . . . . . . . . . . . . . . . . . . . . . . . . . . . . . . . . . . . . . . . . . . . . 146
Cisco Pix . . . . . . . . . . . . . . . . . . . . . . . . . . . . . . . . . . . . . . . . . . . . . . . . . . . . . . . . . 148
Cisco VPN 3000 Concentrator. . . . . . . . . . . . . . . . . . . . . . . . . . . . . . . . . . . . . . . . . 149
Cisco Wireless Services Module . . . . . . . . . . . . . . . . . . . . . . . . . . . . . . . . . . . . . . . 151
Cisco Wireless LAN Controllers. . . . . . . . . . . . . . . . . . . . . . . . . . . . . . . . . . . . . . . . 154
19 CITRIX NETSCALER
20 CRYPTOCARD CRYPTO-SHIELD
21 CYBER-ARK VAULT
22 CYBERGUARD FIREWALL/VPN APPLIANCE
23 DAMBALLA FAILSAFE
24 DIGITAL CHINA NETWORKS (DCN)
25 EMC VMWARE
Configuring Syslog for VMWare. . . . . . . . . . . . . . . . . . . . . . . . . . . . . . . . . . . . . . . . 177
Configuring the VMWare Protocol . . . . . . . . . . . . . . . . . . . . . . . . . . . . . . . . . . . . . . 179
26 ENTERASYS
Enterasys Dragon . . . . . . . . . . . . . . . . . . . . . . . . . . . . . . . . . . . . . . . . . . . . . . . . . . 183
Enterasys HiGuard Wireless IPS . . . . . . . . . . . . . . . . . . . . . . . . . . . . . . . . . . . . . . . 190
Enterasys HiPath Wireless Controller . . . . . . . . . . . . . . . . . . . . . . . . . . . . . . . . . . . 192
Enterasys Stackable and Standalone Switches . . . . . . . . . . . . . . . . . . . . . . . . . . . . 193
Enterasys XSR Security Router. . . . . . . . . . . . . . . . . . . . . . . . . . . . . . . . . . . . . . . . 194
Enterasys Matrix Router . . . . . . . . . . . . . . . . . . . . . . . . . . . . . . . . . . . . . . . . . . . . . 195
Enterasys NetSight Automatic Security Manager . . . . . . . . . . . . . . . . . . . . . . . . . . 196
Enterasys Matrix K/N/S Series Switch . . . . . . . . . . . . . . . . . . . . . . . . . . . . . . . . . . . 197
Enterasys NAC . . . . . . . . . . . . . . . . . . . . . . . . . . . . . . . . . . . . . . . . . . . . . . . . . . . . 198
Enterasys 800-Series Switch . . . . . . . . . . . . . . . . . . . . . . . . . . . . . . . . . . . . . . . . . . 199
27 EXTREME NETWORKS EXTREMEWARE
28 F5 NETWORKS
F5 Networks BIG-IP APM. . . . . . . . . . . . . . . . . . . . . . . . . . . . . . . . . . . . . . . . . . . . .203
F5 Networks BIG-IP ASM. . . . . . . . . . . . . . . . . . . . . . . . . . . . . . . . . . . . . . . . . . . . .205
F5 Networks BIG-IP LTM . . . . . . . . . . . . . . . . . . . . . . . . . . . . . . . . . . . . . . . . . . . . .207
F5 Networks FirePass . . . . . . . . . . . . . . . . . . . . . . . . . . . . . . . . . . . . . . . . . . . . . . .210
29 FAIR WARNING
30 FIREEYE
31 FORESCOUT COUNTERACT
32 FORTINET FORTIGATE
33 FOUNDRY FASTIRON
34 GENERIC FIREWALL
35 GENERIC AUTHORIZATION SERVER
36 GREAT BAY BEACON
37 HBGARY ACTIVE DEFENSE
38 HPHP ProCurve . . . . . . . . . . . . . . . . . . . . . . . . . . . . . . . . . . . . . . . . . . . . . . . . . . . . . .237
HP Tandem. . . . . . . . . . . . . . . . . . . . . . . . . . . . . . . . . . . . . . . . . . . . . . . . . . . . . . . .238
Hewlett Packard UNIX (HP-UX) . . . . . . . . . . . . . . . . . . . . . . . . . . . . . . . . . . . . . . . .238
39 HUAWEI
Huawei AR Series Router. . . . . . . . . . . . . . . . . . . . . . . . . . . . . . . . . . . . . . . . . . . . .241
Huawei S Series Switch . . . . . . . . . . . . . . . . . . . . . . . . . . . . . . . . . . . . . . . . . . . . . .243
40 IBMIBM AIX Server. . . . . . . . . . . . . . . . . . . . . . . . . . . . . . . . . . . . . . . . . . . . . . . . . . . . .247
IBM AS/400 iSeries . . . . . . . . . . . . . . . . . . . . . . . . . . . . . . . . . . . . . . . . . . . . . . . . .255
IBM CICS . . . . . . . . . . . . . . . . . . . . . . . . . . . . . . . . . . . . . . . . . . . . . . . . . . . . . . . . .259
IBM Lotus Domino . . . . . . . . . . . . . . . . . . . . . . . . . . . . . . . . . . . . . . . . . . . . . . . . . .263
IBM Proventia Management SiteProtector. . . . . . . . . . . . . . . . . . . . . . . . . . . . . . . . 266
IBM ISS Proventia . . . . . . . . . . . . . . . . . . . . . . . . . . . . . . . . . . . . . . . . . . . . . . . . . . 270
IBM RACF . . . . . . . . . . . . . . . . . . . . . . . . . . . . . . . . . . . . . . . . . . . . . . . . . . . . . . . . 270
IBM DB2. . . . . . . . . . . . . . . . . . . . . . . . . . . . . . . . . . . . . . . . . . . . . . . . . . . . . . . . . . 283
IBM WebSphere Application Server. . . . . . . . . . . . . . . . . . . . . . . . . . . . . . . . . . . . . 294
IBM Informix Audit . . . . . . . . . . . . . . . . . . . . . . . . . . . . . . . . . . . . . . . . . . . . . . . . . . 300
IBM IMS . . . . . . . . . . . . . . . . . . . . . . . . . . . . . . . . . . . . . . . . . . . . . . . . . . . . . . . . . . 300
IBM Guardium . . . . . . . . . . . . . . . . . . . . . . . . . . . . . . . . . . . . . . . . . . . . . . . . . . . . . 305
IBM Tivoli Access Manager for e-business . . . . . . . . . . . . . . . . . . . . . . . . . . . . . . . 308
IBM z/OS . . . . . . . . . . . . . . . . . . . . . . . . . . . . . . . . . . . . . . . . . . . . . . . . . . . . . . . . . 310
IBM Tivoli Endpoint Manager . . . . . . . . . . . . . . . . . . . . . . . . . . . . . . . . . . . . . . . . . . 315
41 ISC BIND
42 IMPERVA SECURESPHERE
43 INFOBLOX NIOS
44 IT-CUBE AGILESIConfiguring agileSI. . . . . . . . . . . . . . . . . . . . . . . . . . . . . . . . . . . . . . . . . . . . . . . . . . 327
Configuring an agileSI Log Source . . . . . . . . . . . . . . . . . . . . . . . . . . . . . . . . . . . . . 328
45 ITRON SMART METER
46 JUNIPER NETWORKS
Juniper Networks AVT . . . . . . . . . . . . . . . . . . . . . . . . . . . . . . . . . . . . . . . . . . . . . . . 333
Juniper DX Application Acceleration Platform . . . . . . . . . . . . . . . . . . . . . . . . . . . . . 335
Juniper EX Series Ethernet Switch . . . . . . . . . . . . . . . . . . . . . . . . . . . . . . . . . . . . . 335
Juniper IDP . . . . . . . . . . . . . . . . . . . . . . . . . . . . . . . . . . . . . . . . . . . . . . . . . . . . . . . 337
Juniper Networks Secure Access . . . . . . . . . . . . . . . . . . . . . . . . . . . . . . . . . . . . . . 338
Juniper Infranet Controller . . . . . . . . . . . . . . . . . . . . . . . . . . . . . . . . . . . . . . . . . . . . 341
Juniper Networks Firewall and VPN . . . . . . . . . . . . . . . . . . . . . . . . . . . . . . . . . . . . 342
Juniper Networks Network and Security Manager. . . . . . . . . . . . . . . . . . . . . . . . . . 342
Juniper Junos OS . . . . . . . . . . . . . . . . . . . . . . . . . . . . . . . . . . . . . . . . . . . . . . . . . . 344
Juniper Steel-Belted Radius. . . . . . . . . . . . . . . . . . . . . . . . . . . . . . . . . . . . . . . . . . . 347
Juniper Networks vGW Virtual Gateway . . . . . . . . . . . . . . . . . . . . . . . . . . . . . . . . . 349
Juniper Security Binary Log Collector . . . . . . . . . . . . . . . . . . . . . . . . . . . . . . . . . . . 351
Juniper Mykonos Web Security . . . . . . . . . . . . . . . . . . . . . . . . . . . . . . . . . . . . . . . . 354
47 KASPERSKY SECURITY CENTER
48 LIEBERMAN RANDOM PASSWORD MANAGER
49 LINUX
Linux DHCP . . . . . . . . . . . . . . . . . . . . . . . . . . . . . . . . . . . . . . . . . . . . . . . . . . . . . . .367
Linux IPtables . . . . . . . . . . . . . . . . . . . . . . . . . . . . . . . . . . . . . . . . . . . . . . . . . . . . . .368
Linux OS. . . . . . . . . . . . . . . . . . . . . . . . . . . . . . . . . . . . . . . . . . . . . . . . . . . . . . . . . .371
50 MCAFEE
McAfee Intrushield . . . . . . . . . . . . . . . . . . . . . . . . . . . . . . . . . . . . . . . . . . . . . . . . . .373
McAfee ePolicy Orchestrator . . . . . . . . . . . . . . . . . . . . . . . . . . . . . . . . . . . . . . . . . .374
McAfee Application / Change Control. . . . . . . . . . . . . . . . . . . . . . . . . . . . . . . . . . . .384
McAfee Web Gateway . . . . . . . . . . . . . . . . . . . . . . . . . . . . . . . . . . . . . . . . . . . . . . .387
51 METAINFO METAIP
52 MICROSOFT
Microsoft Exchange Server . . . . . . . . . . . . . . . . . . . . . . . . . . . . . . . . . . . . . . . . . . .393
Microsoft IAS Server. . . . . . . . . . . . . . . . . . . . . . . . . . . . . . . . . . . . . . . . . . . . . . . . .401
Microsoft DHCP Server . . . . . . . . . . . . . . . . . . . . . . . . . . . . . . . . . . . . . . . . . . . . . .401
Microsoft IIS Server . . . . . . . . . . . . . . . . . . . . . . . . . . . . . . . . . . . . . . . . . . . . . . . . .402
Microsoft ISA . . . . . . . . . . . . . . . . . . . . . . . . . . . . . . . . . . . . . . . . . . . . . . . . . . . . . .408
Microsoft SQL Server . . . . . . . . . . . . . . . . . . . . . . . . . . . . . . . . . . . . . . . . . . . . . . . .408
Microsoft SharePoint . . . . . . . . . . . . . . . . . . . . . . . . . . . . . . . . . . . . . . . . . . . . . . . .413
Microsoft Windows Security Event Log . . . . . . . . . . . . . . . . . . . . . . . . . . . . . . . . . .418
Microsoft Operations Manager . . . . . . . . . . . . . . . . . . . . . . . . . . . . . . . . . . . . . . . . .420
Microsoft System Center Operations Manager . . . . . . . . . . . . . . . . . . . . . . . . . . . .423
53 MOTOROLA SYMBOL AP
54 NETAPP DATA ONTAP
55 NAME VALUE PAIR
NVP Log Format. . . . . . . . . . . . . . . . . . . . . . . . . . . . . . . . . . . . . . . . . . . . . . . . . . . .433
Examples . . . . . . . . . . . . . . . . . . . . . . . . . . . . . . . . . . . . . . . . . . . . . . . . . . . . . . . . .435
56 NIKSUN
57 NOKIA FIREWALL
Integrating Nokia Firewall Using Syslog . . . . . . . . . . . . . . . . . . . . . . . . . . . . . . . . . .439
Integrating Nokia Firewall Using OPSEC . . . . . . . . . . . . . . . . . . . . . . . . . . . . . . . . .442

58 NOMINUM VANTIO
59 NORTEL NETWORKS
Nortel Multiprotocol Router . . . . . . . . . . . . . . . . . . . . . . . . . . . . . . . . . . . . . . . . . . . 447
Nortel Application Switch . . . . . . . . . . . . . . . . . . . . . . . . . . . . . . . . . . . . . . . . . . . . . 450
Nortel Contivity. . . . . . . . . . . . . . . . . . . . . . . . . . . . . . . . . . . . . . . . . . . . . . . . . . . . . 451
Nortel Ethernet Routing Switch 2500/4500/5500. . . . . . . . . . . . . . . . . . . . . . . . . . . 451
Nortel Ethernet Routing Switch 8300/8600 . . . . . . . . . . . . . . . . . . . . . . . . . . . . . . . 452
Nortel Secure Router . . . . . . . . . . . . . . . . . . . . . . . . . . . . . . . . . . . . . . . . . . . . . . . . 454
Nortel Secure Network Access Switch. . . . . . . . . . . . . . . . . . . . . . . . . . . . . . . . . . . 455
Nortel Switched Firewall 5100 . . . . . . . . . . . . . . . . . . . . . . . . . . . . . . . . . . . . . . . . . 456
Nortel Switched Firewall 6000 . . . . . . . . . . . . . . . . . . . . . . . . . . . . . . . . . . . . . . . . . 458
Nortel Threat Protection System . . . . . . . . . . . . . . . . . . . . . . . . . . . . . . . . . . . . . . . 460
Nortel VPN Gateway . . . . . . . . . . . . . . . . . . . . . . . . . . . . . . . . . . . . . . . . . . . . . . . . 461
60 NOVELL EDIRECTORY
61 OPENBSD
62 OPEN LDAP
63 OPEN SOURCE SNORT
64 ORACLE
Oracle Audit Records. . . . . . . . . . . . . . . . . . . . . . . . . . . . . . . . . . . . . . . . . . . . . . . . 479
Oracle DB Listener. . . . . . . . . . . . . . . . . . . . . . . . . . . . . . . . . . . . . . . . . . . . . . . . . . 483
Oracle Audit Vault . . . . . . . . . . . . . . . . . . . . . . . . . . . . . . . . . . . . . . . . . . . . . . . . . . 487
Oracle OS Audit . . . . . . . . . . . . . . . . . . . . . . . . . . . . . . . . . . . . . . . . . . . . . . . . . . . . 488
Oracle BEA WebLogic . . . . . . . . . . . . . . . . . . . . . . . . . . . . . . . . . . . . . . . . . . . . . . . 490
65 OSSEC
66 PALO ALTO NETWORKS
67 PROFTPD
68 RADWARE DEFENSEPRO
69 REDBACK ASE
70 RSA AUTHENTICATION MANAGER
Configuring RSA Using Syslog. . . . . . . . . . . . . . . . . . . . . . . . . . . . . . . . . . . . . . . . .509
Configuring RSA Using the Log File Protocol. . . . . . . . . . . . . . . . . . . . . . . . . . . . . .511
71 SAMHAIN LABS
Using Syslog. . . . . . . . . . . . . . . . . . . . . . . . . . . . . . . . . . . . . . . . . . . . . . . . . . . . . . .515
Using JDBC . . . . . . . . . . . . . . . . . . . . . . . . . . . . . . . . . . . . . . . . . . . . . . . . . . . . . . .516
72 SENTRIGO HEDGEHOG
73 SECURE COMPUTING SIDEWINDER
74 SOLARWINDS ORION
75 SONICWALL
76 SOPHOS
Sophos Enterprise Console . . . . . . . . . . . . . . . . . . . . . . . . . . . . . . . . . . . . . . . . . . .527
Sophos PureMessage . . . . . . . . . . . . . . . . . . . . . . . . . . . . . . . . . . . . . . . . . . . . . . .534
Sophos Astaro Security Gateway. . . . . . . . . . . . . . . . . . . . . . . . . . . . . . . . . . . . . . .541
Sophos Web Security Appliance . . . . . . . . . . . . . . . . . . . . . . . . . . . . . . . . . . . . . . .542
77 SOURCEFIRE
Sourcefire Intrusion Sensor . . . . . . . . . . . . . . . . . . . . . . . . . . . . . . . . . . . . . . . . . . .543
Sourcefire Defense Center (DC) . . . . . . . . . . . . . . . . . . . . . . . . . . . . . . . . . . . . . . .544
78 SQUID WEB PROXY
79 STARENT NETWORKS
80 STONESOFT MANAGEMENT CENTER
81 SUN SOLARIS
Sun Solaris. . . . . . . . . . . . . . . . . . . . . . . . . . . . . . . . . . . . . . . . . . . . . . . . . . . . . . . . 561
Sun Solaris DHCP . . . . . . . . . . . . . . . . . . . . . . . . . . . . . . . . . . . . . . . . . . . . . . . . . . 562
Sun Solaris Sendmail. . . . . . . . . . . . . . . . . . . . . . . . . . . . . . . . . . . . . . . . . . . . . . . . 562
Sun Solaris Basic Security Mode (BSM) . . . . . . . . . . . . . . . . . . . . . . . . . . . . . . . . . 563
82 SYBASE ASE
83 SYMANTEC
Symantec Endpoint Protection. . . . . . . . . . . . . . . . . . . . . . . . . . . . . . . . . . . . . . . . . 573
Symantec SGS . . . . . . . . . . . . . . . . . . . . . . . . . . . . . . . . . . . . . . . . . . . . . . . . . . . . 574
Symantec System Center . . . . . . . . . . . . . . . . . . . . . . . . . . . . . . . . . . . . . . . . . . . . 574
Symantec Data Loss Prevention (DLP) . . . . . . . . . . . . . . . . . . . . . . . . . . . . . . . . . . 578
Symantec PGP Universal Server. . . . . . . . . . . . . . . . . . . . . . . . . . . . . . . . . . . . . . . 581
84 SYMARK
85 TIPPING POINT
Tipping Point Intrusion Prevention System . . . . . . . . . . . . . . . . . . . . . . . . . . . . . . . 587
Tipping Point X505/X506 Device . . . . . . . . . . . . . . . . . . . . . . . . . . . . . . . . . . . . . . . 590
86 TOP LAYER IPS
87 TREND MICRO
Trend Micro InterScan VirusWall . . . . . . . . . . . . . . . . . . . . . . . . . . . . . . . . . . . . . . . 593
Trend Micro Control Manager . . . . . . . . . . . . . . . . . . . . . . . . . . . . . . . . . . . . . . . . . 593
Trend Micro Office Scan . . . . . . . . . . . . . . . . . . . . . . . . . . . . . . . . . . . . . . . . . . . . . 595
Trend Micro Deep Discovery . . . . . . . . . . . . . . . . . . . . . . . . . . . . . . . . . . . . . . . . . . 599

88 TRIPWIRE
89 TROPOS CONTROL
90 UNIVERSAL DSM
91 UNIVERSAL LEEFConfiguring a Universal LEEF Log Source. . . . . . . . . . . . . . . . . . . . . . . . . . . . . . . .609
Sending Events to STRM . . . . . . . . . . . . . . . . . . . . . . . . . . . . . . . . . . . . . . . . . . . . .613
Creating a Universal LEEF Event Map. . . . . . . . . . . . . . . . . . . . . . . . . . . . . . . . . . .614
92 VERDASYS DIGITAL GUARDIAN
93 VERICEPT CONTENT 360 DSM
94 WEBSENSE V-SERIES
Websense TRITON . . . . . . . . . . . . . . . . . . . . . . . . . . . . . . . . . . . . . . . . . . . . . . . . .623
Websense V-Series Data Security Suite . . . . . . . . . . . . . . . . . . . . . . . . . . . . . . . . .626
Websense V-Series Content Gateway . . . . . . . . . . . . . . . . . . . . . . . . . . . . . . . . . . .627
95 SUPPORTED DSMS
INDEX
ABOUT THIS GUIDE
The Configuring DSMs guide provides you with information for configuring log sources (DSMs) and integrating the DSMs with STRM or STRM Log Manager.
Audience This guide is intended for the system administrator responsible for setting up event collection for STRM in your network. This guide assumes that you have STRM administrative access and a knowledge of your corporate network and networking technologies.
Documentation Conventions
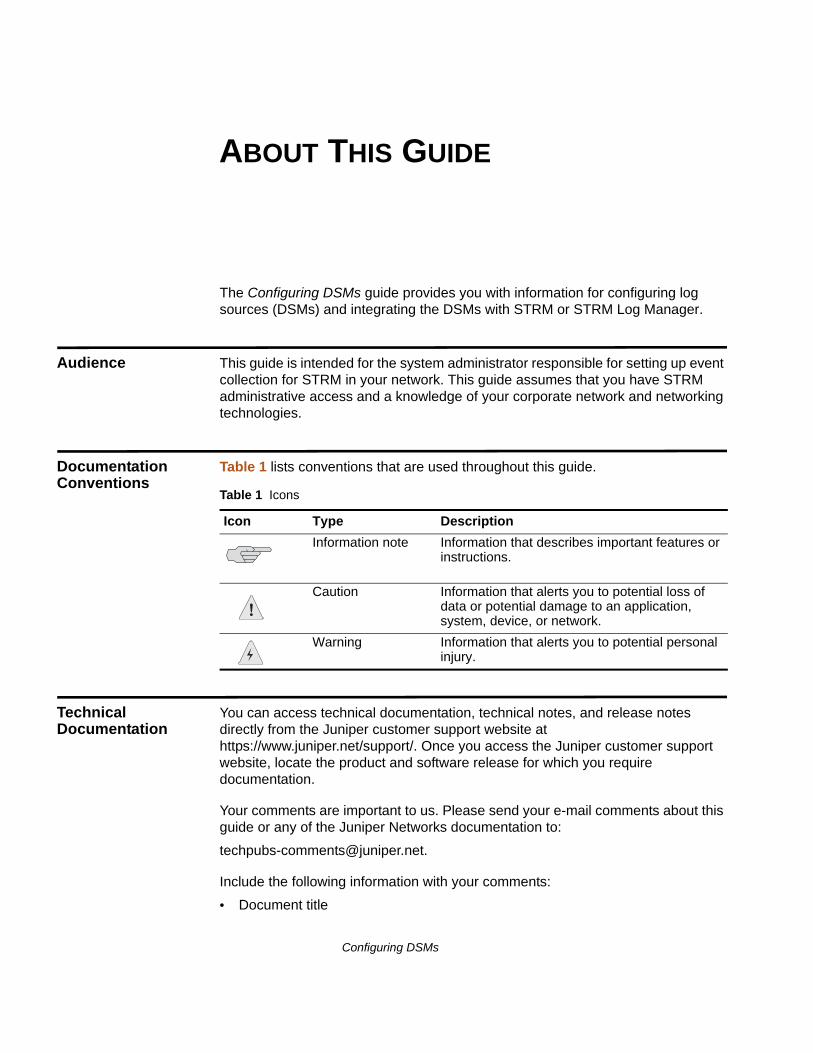
Table 1 lists conventions that are used throughout this guide.
Technical Documentation
You can access technical documentation, technical notes, and release notes directly from the Juniper customer support website at https://www.juniper.net/support/. Once you access the Juniper customer support website, locate the product and software release for which you require documentation.
Your comments are important to us. Please send your e-mail comments about this guide or any of the Juniper Networks documentation to:
Include the following information with your comments:
• Document title
Table 1 Icons
Icon Type Description
Information note Information that describes important features or instructions.
Caution Information that alerts you to potential loss of data or potential damage to an application, system, device, or network.
Warning Information that alerts you to potential personal injury.
Configuring DSMs
16 ABOUT THIS GUIDE
• Page number
Requesting Technical Support
Technical product support is available through the Juniper Networks Technical Assistance Center (JTAC). If you are a customer with an active J-Care or JNASC support contract, or are covered under warranty, and need postsales technical support, you can access our tools and resources online or open a case with JTAC.
• JTAC policies—For a complete understanding of our JTAC procedures and policies, review the JTAC User Guide located at http://www.juniper.net/us/en/local/pdf/resource-guides/7100059-en.pdf .
• Product warranties—For product warranty information, visit http://www.juniper.net/support/warranty/ .
• JTAC Hours of Operation —The JTAC centers have resources available 24 hours a day, 7 days a week, 365 days a year.
Self-Help Online Tools and Resources
For quick and easy problem resolution, Juniper Networks has designed an online self-service portal called the Customer Support Center (CSC) that provides you with the following features:
• Find CSC offerings: http://www.juniper.net/customers/support/
• Search for known bugs: http://www2.juniper.net/kb/
• Find product documentation: http://www.juniper.net/techpubs/
• Find solutions and answer questions using our Knowledge Base: http://kb.juniper.net/
• Download the latest versions of software and review release notes: http://www.juniper.net/customers/csc/software/
• Search technical bulletins for relevant hardware and software notifications: https://www.juniper.net/alerts/
• Join and participate in the Juniper Networks Community Forum: http://www.juniper.net/company/communities/
• Open a case online in the CSC Case Management tool: http://www.juniper.net/cm/
To verify service entitlement by product serial number, use our Serial Number Entitlement (SNE) Tool: https://tools.juniper.net/SerialNumberEntitlementSearch/
Opening a Case with JTAC
You can open a case with JTAC on the Web or by telephone.
• Use the Case Management tool in the CSC at http://www.juniper.net/cm/ .
• Call 1-888-314-JTAC (1-888-314-5822 toll-free in the USA, Canada, and Mexico).
For international or direct-dial options in countries without toll-free numbers, visit us at http://www.juniper.net/support/requesting-support.html.
Configuring DSMs
1
OVERVIEWYou can configure STRM or STRM Log Manager to log and correlate events received from external sources such as security equipment (for example, firewalls), and network equipment (for example, switches and routers). Device Support Modules (DSMs) allows you to integrate STRM or STRM Log Manager with these external devices.
Unless otherwise noted, all references to STRM refer to both STRM and STRM Log Manager.
Events forwarded from your log sources are displayed in the Log Activity tab. All events are correlated and security and policy offenses are created based on correlation rules. These offenses are displayed on the Offenses tab. For more information, see the STRM Users Guide.
NOTEBefore you configure STRM to collect security information from devices, you must set-up your deployment, including off-site sources or targets, using the deployment editor. For more information on the deployment editor, see the STRM Administration Guide.
NOTEInformation found in this documentation about configuring Device Support Modules (DSMs) is based on the latest RPM files located on the Juniper customer support website, located at www.juniper.net/support/.
To configure STRM to receive events from devices, you must:
1 Configure the device to send events to STRM.
2 Configure log sources for STRM to receive events from specific devices. For more information, see the STRM Log Sources Users Guide.
Configuring DSMs

2
INSTALLING DSMSSTRM is preconfigured to perform weekly automatic software updates. This includes DSMs, protocols, and scanner module updates. If no updates are displayed in the Updates window, either your system has not been in operation long enough to retrieve the weekly updates or no updates have been issued. If this occurs, you can manually check for new updates. For more information on scheduling pending updates, see the STRM Administration Guide.
After Device Support Modules (DSMs) or protocols are installed, either through the auto update process or using the command-line, the STRM Console provides the DSM and protocol updates to its managed hosts after the configuration changes are deployed. If you are using high availability (HA), DSMs, protocols, and scanners are installed during replication between the primary and secondary host. During this installation process, the secondary displays the status Upgrading. For more information, see Managing High Availability in the STRM Administration Guide.
This section includes the following topics:
• Scheduling Automatic Updates
• Viewing Pending Updates
• Installing a DSM Manually
CAUTIONUninstalling a Device Support Module (DSM) is not supported in STRM. If you need technical assistance, contact Customer Support. For more information, see Requesting Technical Support.
Configuring DSMs
20 INSTALLING DSMS
Scheduling Automatic Updates
STRM performs automatic updates on a recurring schedule according to the settings on the Update Configuration page; however, if you want to schedule an update or a set of updates to run at a specific time, you can schedule an update using the Schedule the Updates window. This is useful when you want to schedule a large update to run during off-peak hours, thus reducing any performance impacts on your system.
For detailed information on each update, select the update. A description and any error messages are displayed in the right pane of the window.
To schedule an update:
Step 1 Click the Admin tab.
Step 2 On the navigation menu, click System Configuration.
The System Configuration pane is displayed.
Step 3 Click the Auto Update icon.
The Updates window is displayed.
Step 4 Optional. If you want to schedule specific updates, select the updates you want to schedule.
Step 5 From the Schedule list box, select the type of update you want to schedule. Options include:
• All Updates
• Selected Updates
• DSM, Scanner, Protocol Updates
• Minor Updates
NOTEProtocol updates installed automatically require you to restart Tomcat. For more information on manually restarting Tomcat, see the STRM Log Sources Users Guide.
The Schedule the Updates window is displayed.
Step 6 Using the calendar, select the start date and time of when you want to start your scheduled updates.
Step 7 Click OK.
The selected updates are now scheduled.
Viewing Pending Updates
If you are having an issues with DSM events identified with a low level category of stored in the Log Activity tab, the DSM parsing the event might need to be updated. You can view any pending software updates for STRM through the
Configuring DSMs
Viewing Pending Updates 21
Admin tab. You can select and install a pending update from the Auto Update window.
To view your pending updates:
Step 1 Click the Admin tab.
Step 2 On the navigation menu, click System Configuration.
The System Configuration pane is displayed.
Step 3 Click the Auto Update icon.
The Updates window is displayed. The window automatically displays the Check for Updates page, providing the following information:
The Check for Updates page toolbar provides the following functions:
Table 2-1 Check for Updates Window Parameters
Parameter Description
Updates were installed
Specifies the date and time the last update was installed.
Next Update install is scheduled
Specifies the date and time the next update is scheduled to be installed. If there is no date and time indicated, the update is not scheduled to run.
Name Specifies the name of the update.
Type Specifies the type of update. Types include:
• DSM, Scanner, Protocol Updates
• Minor Updates
Status Specifies the status of the update. Status types include:
• New - The update is not yet scheduled to be installed.
• Scheduled - The update is scheduled to be installed.
• Installing - The update is currently installing.
• Failed - The updated failed to install.
Date to Install Specifies the date on which this update is scheduled to be installed.
Table 2-2 Check for Updates Page Parameters Toolbar Functions
Function Description
Hide Select one or more updates, and then click Hide to remove the selected updates from the Check for Updates page. You can view and restore the hidden updates on the Restore Hidden Updates page. For more information, see the STRM Administrator Guide.
Install From this list box, you can manually install updates. When you manually install updates, the installation process starts within a minute. For more information, see the STRM Administrator Guide.
Configuring DSMs
22 INSTALLING DSMS
Step 4 To view details on an update, select the update.
The description and any error messages are displayed in the right pane of the window.
Installing a DSM Manually
The Juniper customer support website contains RPM files that allow you to install new or updated DSMs. Updated DSMs contain improved event parsing for network security products and enhancements for event categorization in the STRM Identification Map (QID map).
This section includes the following topics:
• Installing a Single DSM
• Installing a DSM Bundle
CAUTIONUninstalling a Device Support Module (DSM) is not supported in STRM. If you need technical assistance, contact Customer Support. For more information, see Requesting Technical Support.
Schedule From this list box, you can configure a specific date and time to manually install selected updates on your Console. This is useful when you want to schedule the update installation during off-peak hours. For more information, see the STRM Administrator Guide.
Unschedule From this list box, you can remove preconfigured schedules for manually installing updates on your Console. For more information, see the STRM Administrator Guide.
Search By Name In this text box, you can type a keyword and then press Enter to locate a specific update by name.
Next Refresh This counter displays the amount of time until the next automatic refresh. The list of updates on the Check for Updates page automatically refreshes every 60 seconds. The timer is automatically paused when you select one or more updates.
Pause Click this icon to pause the automatic refresh process. To resume automatic refresh, click the Play icon.
Refresh Click this icon to manually refresh the list of updates.
Table 2-2 Check for Updates Page Parameters Toolbar Functions (continued)
Function Description
Configuring DSMs
Installing a DSM Manually 23
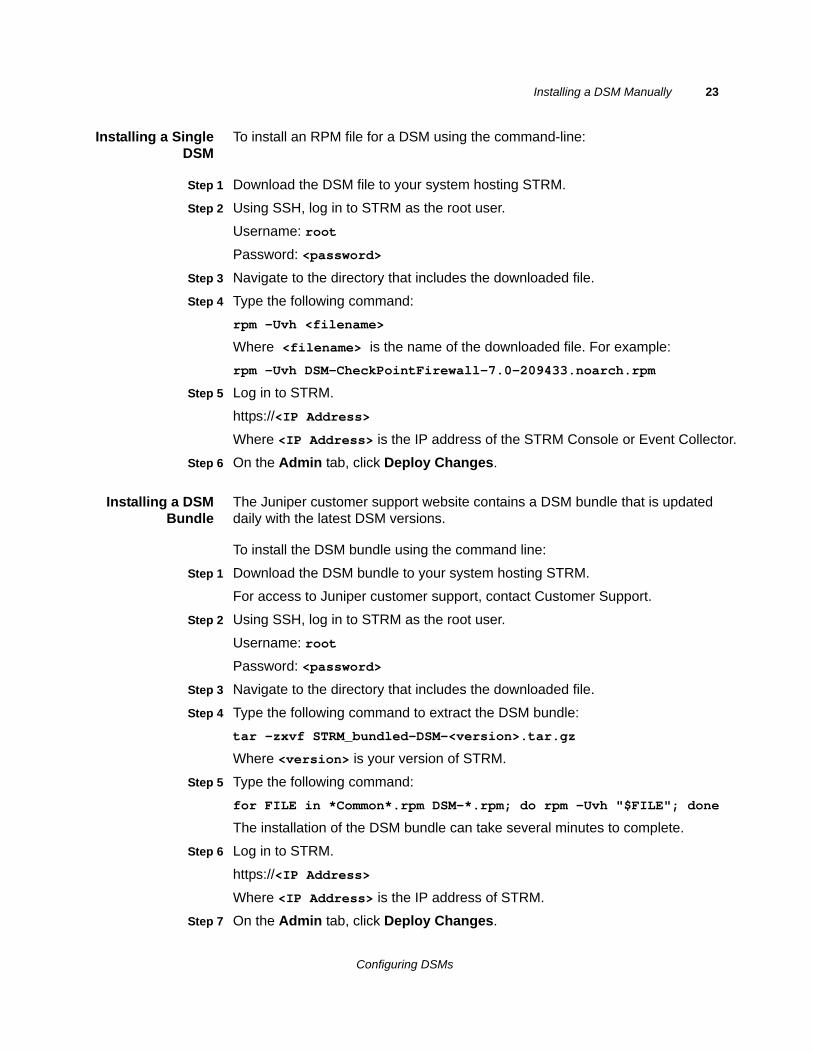
Installing a SingleDSM
To install an RPM file for a DSM using the command-line:
Step 1 Download the DSM file to your system hosting STRM.
Step 2 Using SSH, log in to STRM as the root user.
Username: root
Password: <password>
Step 3 Navigate to the directory that includes the downloaded file.
Step 4 Type the following command:
rpm -Uvh <filename>
Where <filename> is the name of the downloaded file. For example:
rpm -Uvh DSM-CheckPointFirewall-7.0-209433.noarch.rpm
Step 5 Log in to STRM.
https://<IP Address>
Where <IP Address> is the IP address of the STRM Console or Event Collector.
Step 6 On the Admin tab, click Deploy Changes.
Installing a DSMBundle
The Juniper customer support website contains a DSM bundle that is updated daily with the latest DSM versions.
To install the DSM bundle using the command line:
Step 1 Download the DSM bundle to your system hosting STRM.
For access to Juniper customer support, contact Customer Support.
Step 2 Using SSH, log in to STRM as the root user.
Username: root
Password: <password>
Step 3 Navigate to the directory that includes the downloaded file.
Step 4 Type the following command to extract the DSM bundle:
tar -zxvf STRM_bundled-DSM-<version>.tar.gz
Where <version> is your version of STRM.
Step 5 Type the following command:
for FILE in *Common*.rpm DSM-*.rpm; do rpm -Uvh "$FILE"; done
The installation of the DSM bundle can take several minutes to complete.
Step 6 Log in to STRM.
https://<IP Address>
Where <IP Address> is the IP address of STRM.
Step 7 On the Admin tab, click Deploy Changes.
Configuring DSMs

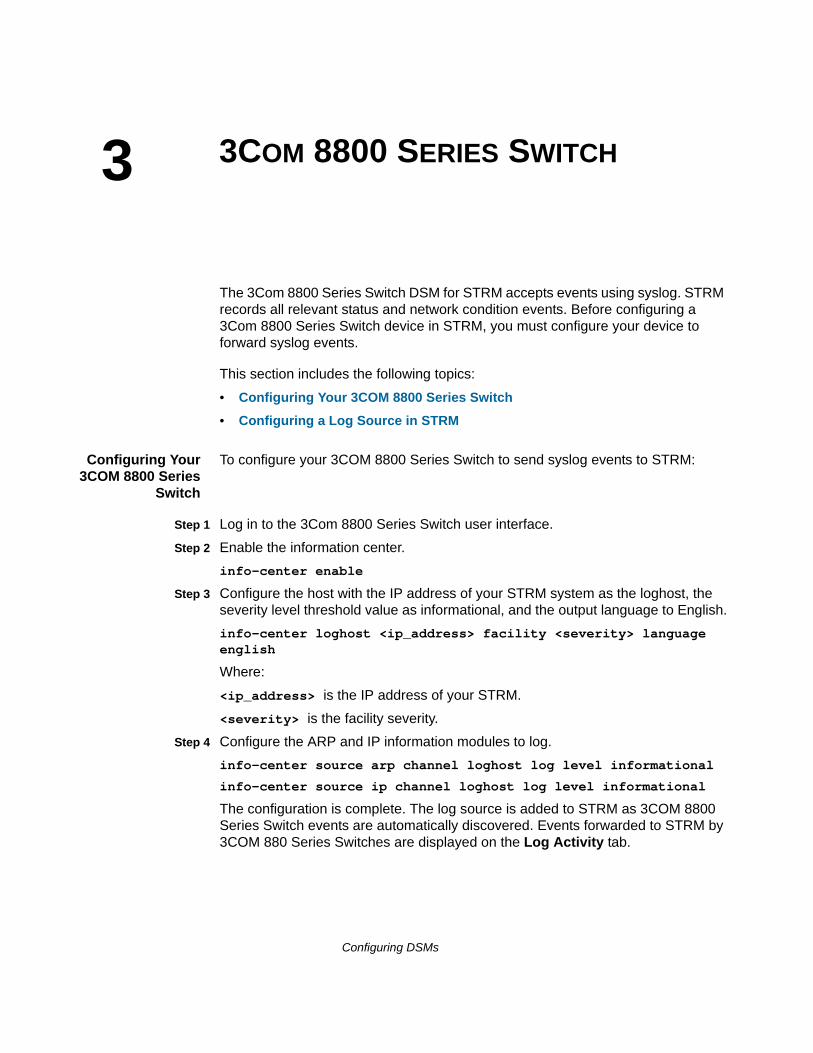
3
3COM 8800 SERIES SWITCHThe 3Com 8800 Series Switch DSM for STRM accepts events using syslog. STRM records all relevant status and network condition events. Before configuring a 3Com 8800 Series Switch device in STRM, you must configure your device to forward syslog events.
This section includes the following topics:
• Configuring Your 3COM 8800 Series Switch
• Configuring a Log Source in STRM
Configuring Your3COM 8800 Series
Switch
To configure your 3COM 8800 Series Switch to send syslog events to STRM:
Step 1 Log in to the 3Com 8800 Series Switch user interface.
Step 2 Enable the information center.
info-center enable
Step 3 Configure the host with the IP address of your STRM system as the loghost, the severity level threshold value as informational, and the output language to English.
info-center loghost <ip_address> facility <severity> language english
Where:
<ip_address> is the IP address of your STRM.
<severity> is the facility severity.
Step 4 Configure the ARP and IP information modules to log.
info-center source arp channel loghost log level informational
info-center source ip channel loghost log level informational
The configuration is complete. The log source is added to STRM as 3COM 8800 Series Switch events are automatically discovered. Events forwarded to STRM by 3COM 880 Series Switches are displayed on the Log Activity tab.
Configuring DSMs
26 3COM 8800 SERIES SWITCH
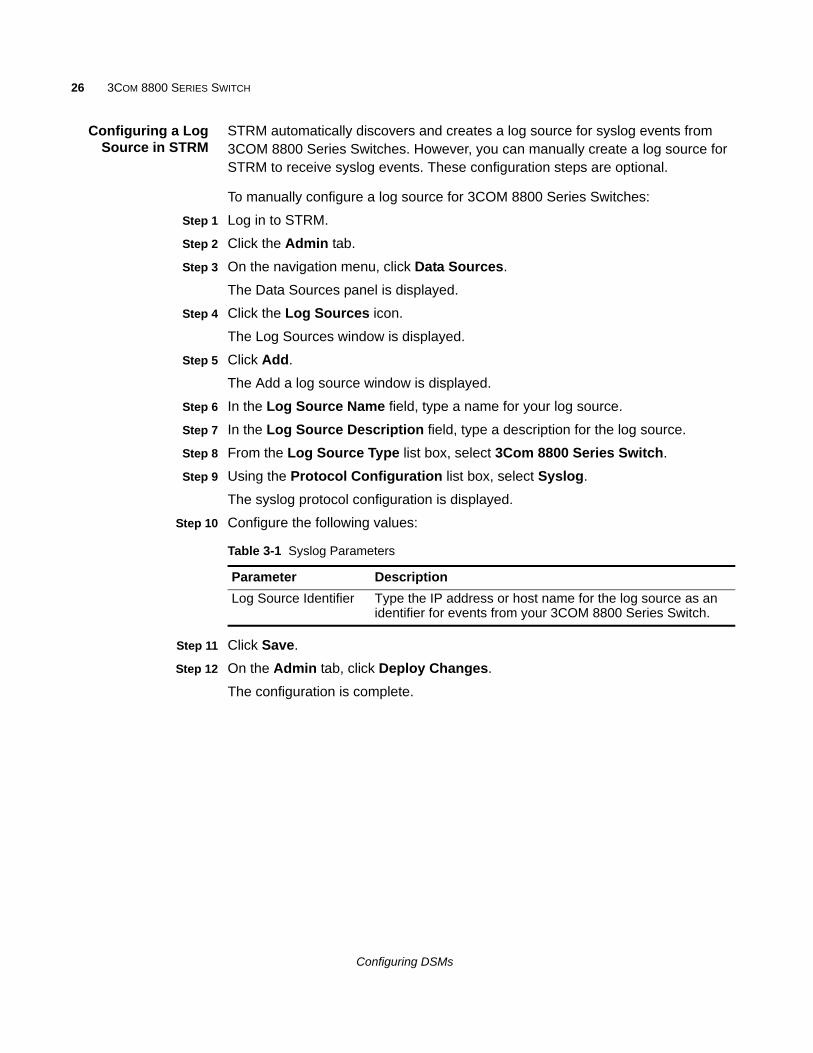
Configuring a LogSource in STRM
STRM automatically discovers and creates a log source for syslog events from 3COM 8800 Series Switches. However, you can manually create a log source for STRM to receive syslog events. These configuration steps are optional.
To manually configure a log source for 3COM 8800 Series Switches:
Step 1 Log in to STRM.
Step 2 Click the Admin tab.
Step 3 On the navigation menu, click Data Sources.
The Data Sources panel is displayed.
Step 4 Click the Log Sources icon.
The Log Sources window is displayed.
Step 5 Click Add.
The Add a log source window is displayed.
Step 6 In the Log Source Name field, type a name for your log source.
Step 7 In the Log Source Description field, type a description for the log source.
Step 8 From the Log Source Type list box, select 3Com 8800 Series Switch.
Step 9 Using the Protocol Configuration list box, select Syslog.
The syslog protocol configuration is displayed.
Step 10 Configure the following values:
Step 11 Click Save.
Step 12 On the Admin tab, click Deploy Changes.
The configuration is complete.
Table 3-1 Syslog Parameters
Parameter Description
Log Source Identifier Type the IP address or host name for the log source as an identifier for events from your 3COM 8800 Series Switch.
Configuring DSMs

4
AMBIRON TRUSTWAVE ipANGELThe Ambiron TrustWave ipAngel DSM for STRM accepts events using syslog. STRM records all Snort-based events from the ipAngel console.
Before you configure STRM to integrate with ipAngel, you must forward your cache and access logs to your STRM. For information on forwarding device logs to STRM, see your vendor documentation.
The events in your cache and access logs that are forwarded from Ambiron TrustWave ipAngel are not automatically discovered. You must configure a log source in STRM for Ambiron TrustWave ipAngel.
STRM does not automatically discover or create log sources for syslog events from Ambiron TrustWave ipAngel appliances. To integrate Ambiron TrustWave ipAngel events with STRM, you must manually create a log source.
To configure a log source:
Step 1 Log in to STRM.
Step 2 Click the Admin tab.
Step 3 On the navigation menu, click Data Sources.
The Data Sources panel is displayed.
Step 4 Click the Log Sources icon.
The Log Sources window is displayed.
Step 5 Click Add.
The Add a log source window is displayed.
Step 6 In the Log Source Name field, type a name for your log source.
Step 7 In the Log Source Description field, type a description for the log source.
Step 8 From the Log Source Type list box, select Ambiron TrustWave ipAngel Intrusion Prevention System (IPS).
Step 9 Using the Protocol Configuration list box, select Syslog.
The syslog protocol configuration is displayed.
Configuring DSMs
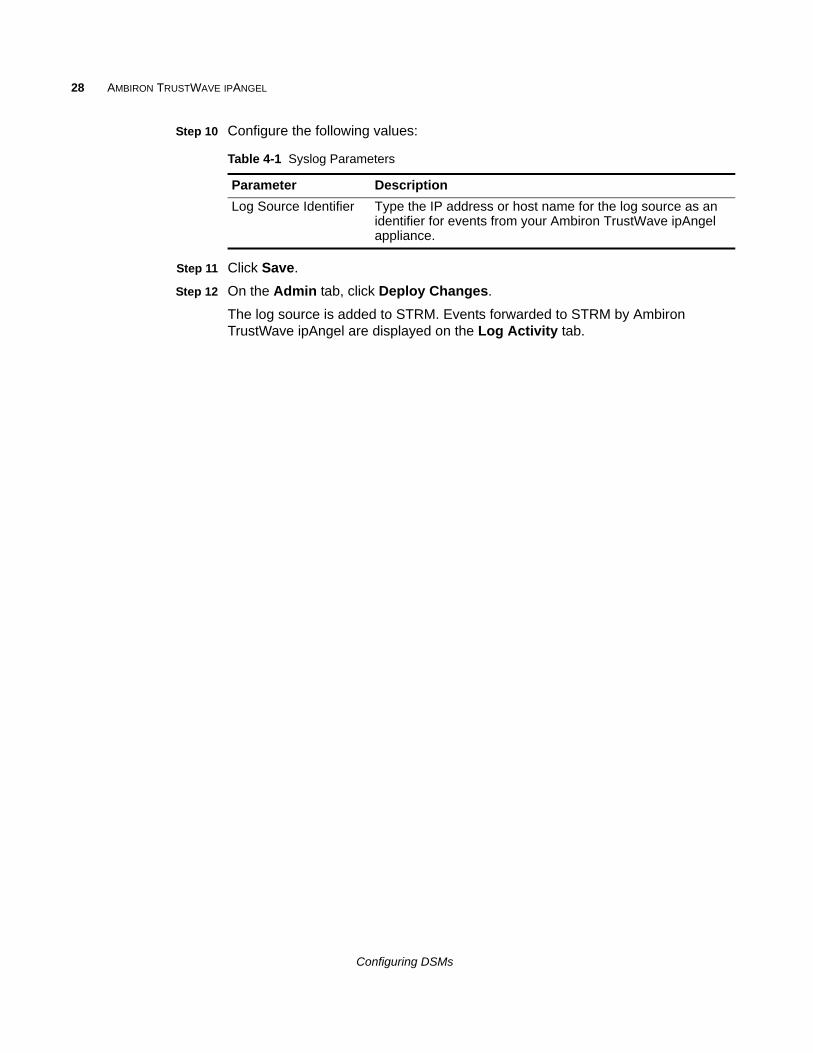
28 AMBIRON TRUSTWAVE IPANGEL
Step 10 Configure the following values:
Step 11 Click Save.
Step 12 On the Admin tab, click Deploy Changes.
The log source is added to STRM. Events forwarded to STRM by Ambiron TrustWave ipAngel are displayed on the Log Activity tab.
Table 4-1 Syslog Parameters
Parameter Description
Log Source Identifier Type the IP address or host name for the log source as an identifier for events from your Ambiron TrustWave ipAngel appliance.
Configuring DSMs
5
APACHE HTTP SERVERThe Apache HTTP Server DSM for STRM accepts Apache events using syslog or syslog-ng. STRM records all relevant HTTP status events. The procedure in this section applies to Apache DSMs operating on UNIX/Linux platforms only.
Select one of the following configuration methods:
• Configuring Apache Using Syslog
• Configuring Apache Using Syslog-ng
CAUTIONDo not run both syslog and syslog-ng at the same time.
Configuring Apache Using Syslog
This section includes the following topics:
• Configuring Syslog for Apache HTTP Server
• Configuring a Log Source in STRM
Configuring Syslogfor Apache HTTP
Server
To configure Apache using the syslog protocol:
Step 1 Log in to the server hosting Apache, as the root user.
Step 2 Edit the Apache configuration file httpd.conf.
Step 3 Add the following information in the Apache configuration file to specify the custom log format:
LogFormat "%h %A %l %u %t \"%r\" %>s %p %b" <log format name>
Where <log format name> is a variable name you provide to define the log format.
Step 4 Add the following information in the Apache configuration file to specify a custom path for the syslog events:
CustomLog “|/usr/bin/logger -t httpd -p <facility>.<priority>” <log format name>
Configuring DSMs
30 APACHE HTTP SERVER
Where:
<facility> is a syslog facility, for example, local0.
<priority> is a syslog priority, for example, info or notice.
<log format name> is a variable name you provide to define the custom log format. The log format name must match the log format defined in Step 4.
For example,
CustomLog “|/usr/bin/logger -t httpd -p local1.info” MyApacheLogs
Step 5 Type the following command to disabled hostname lookup:
HostnameLookups off
Step 6 Save the Apache configuration file.
Step 7 Edit the syslog configuration file.
/etc/syslog.conf
Step 8 Add the following information to your syslog configuration file:
<facility>.<priority> <TAB><TAB>@<host>
Where:
<facility> is the syslog facility, for example, local0. This value must match the value you typed in Step 4.
<priority> is the syslog priority, for example, info or notice. This value must match the value you typed in Step 4.
<TAB> indicates you must press the Tab key.
<host> is the IP address of the STRM Console or Event Collector.
Step 9 Save the syslog configuration file.
Step 10 Type the following command to restart the syslog service:
/etc/init.d/syslog restart
Step 11 Restart Apache to complete the syslog configuration.
The configuration is complete. The log source is added to STRM as syslog events from Apache HTTP Servers are automatically discovered. Events forwarded to STRM by Apache HTTP Servers are displayed on the Log Activity tab of STRM.
Configuring a LogSource in STRM
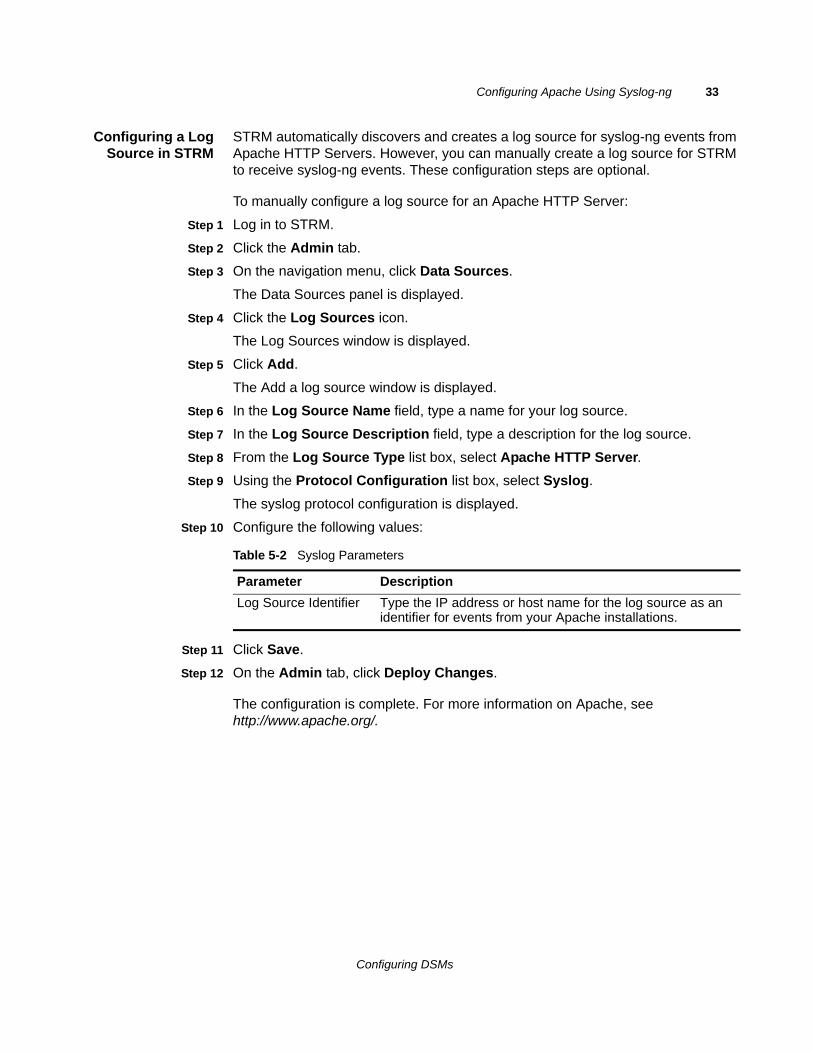
STRM automatically discovers and creates a log source for syslog events from Apache HTTP Servers. However, you can manually create a log source for STRM to receive syslog events. These configuration steps are optional.
To manually configure a log source for an Apache HTTP Server:
Step 1 Log in to STRM.
Step 2 Click the Admin tab.
Configuring DSMs
Configuring Apache Using Syslog-ng 31
Step 3 On the navigation menu, click Data Sources.
The Data Sources panel is displayed.
Step 4 Click the Log Sources icon.
The Log Sources window is displayed.
Step 5 Click Add.
The Add a log source window is displayed.
Step 6 In the Log Source Name field, type a name for your log source.
Step 7 In the Log Source Description field, type a description for the log source.
Step 8 From the Log Source Type list box, select Apache HTTP Server.
Step 9 Using the Protocol Configuration list box, select Syslog.
The syslog protocol configuration is displayed.
Step 10 Configure the following values:
Step 11 Click Save.
Step 12 On the Admin tab, click Deploy Changes.
The configuration is complete. For more information on Apache, see http://www.apache.org/.
Configuring Apache Using Syslog-ng
This section includes the following topics:
• Configuring Syslog-ng for Apache HTTP Server
• Configuring a Log Source in STRM
ConfiguringSyslog-ng for Apache
HTTP Server
To configure Apache using the syslog-ng protocol:
Step 1 Log in to the server hosting Apache, as the root user.
Step 2 Edit the Apache configuration file.
/etc/httpd/conf/httpd.conf
Step 3 Add the following information to the Apache configuration file to specify the LogLevel:
LogLevel info
The LogLevel might already be configured to the info level depending on your Apache installation.
Table 5-1 Syslog Parameters
Parameter Description
Log Source Identifier Type the IP address or host name for the log source as an identifier for events from your Apache installations.
Configuring DSMs
32 APACHE HTTP SERVER
Step 4 Add the following to the Apache configuration file to specify the custom log format:
LogFormat "%h %A %l %u %t \"%r\" %>s %p %b" <log format name>
Where <log format name> is a variable name you provide to define the custom log format.
Step 5 Add the following information to the Apache configuration file to specify a custom path for the syslog events:
CustomLog "|/usr/bin/logger -t 'httpd' -u /var/log/httpd/apache_log.socket" <log format name>
The log format name must match the log format defined in Step 4.
Step 6 Save the Apache configuration file.
Step 7 Edit the syslog-ng configuration file.
/etc/syslog-ng/syslog-ng.conf
Step 8 Add the following information to specify the destination in the syslog-ng configuration file:
source s_apache {
unix-stream("/var/log/httpd/apache_log.socket"
max-connections(512)
keep-alive(yes));
};
destination auth_destination { <udp|tcp>("<IP address>" port(514)); };
log{
source(s_apache);
destination(auth_destination);
};
Where:
<IP address> is the IP address of the STRM Console or Event Collector.
<udp|tcp> is the protocol you select to forward the syslog event.
Step 9 Save the syslog-ng configuration file.
Step 10 Type the following command to restart syslog-ng:
service syslog-ng restart
Step 11 You are now ready to configure the log source in STRM.
The configuration is complete. The log source is added to STRM as syslog events from Apache HTTP Servers are automatically discovered. Events forwarded to STRM by Apache HTTP Servers are displayed on the Log Activity tab of STRM.
Configuring DSMs
Configuring Apache Using Syslog-ng 33
Configuring a LogSource in STRM
STRM automatically discovers and creates a log source for syslog-ng events from Apache HTTP Servers. However, you can manually create a log source for STRM to receive syslog-ng events. These configuration steps are optional.
To manually configure a log source for an Apache HTTP Server:
Step 1 Log in to STRM.
Step 2 Click the Admin tab.
Step 3 On the navigation menu, click Data Sources.
The Data Sources panel is displayed.
Step 4 Click the Log Sources icon.
The Log Sources window is displayed.
Step 5 Click Add.
The Add a log source window is displayed.
Step 6 In the Log Source Name field, type a name for your log source.
Step 7 In the Log Source Description field, type a description for the log source.
Step 8 From the Log Source Type list box, select Apache HTTP Server.
Step 9 Using the Protocol Configuration list box, select Syslog.
The syslog protocol configuration is displayed.
Step 10 Configure the following values:
Step 11 Click Save.
Step 12 On the Admin tab, click Deploy Changes.
The configuration is complete. For more information on Apache, see http://www.apache.org/.
Table 5-2 Syslog Parameters
Parameter Description
Log Source Identifier Type the IP address or host name for the log source as an identifier for events from your Apache installations.
Configuring DSMs

6
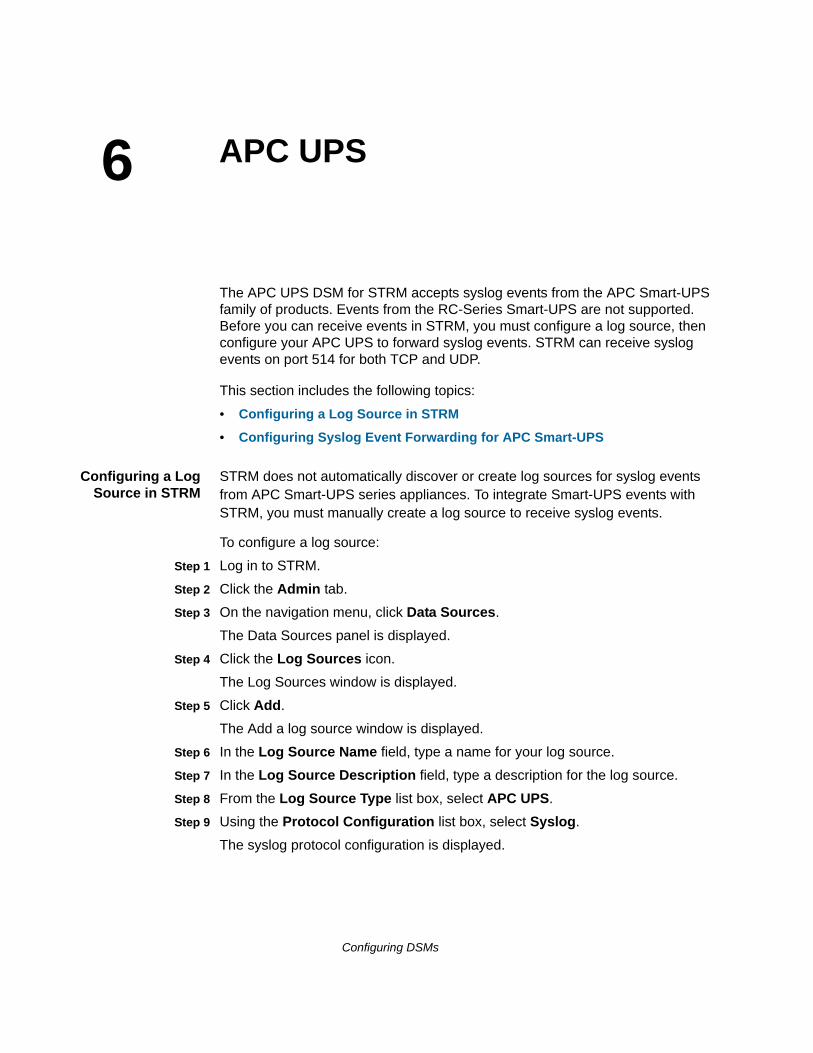
APC UPSThe APC UPS DSM for STRM accepts syslog events from the APC Smart-UPS family of products. Events from the RC-Series Smart-UPS are not supported. Before you can receive events in STRM, you must configure a log source, then configure your APC UPS to forward syslog events. STRM can receive syslog events on port 514 for both TCP and UDP.
This section includes the following topics:
• Configuring a Log Source in STRM
• Configuring Syslog Event Forwarding for APC Smart-UPS
Configuring a LogSource in STRM
STRM does not automatically discover or create log sources for syslog events from APC Smart-UPS series appliances. To integrate Smart-UPS events with STRM, you must manually create a log source to receive syslog events.
To configure a log source:
Step 1 Log in to STRM.
Step 2 Click the Admin tab.
Step 3 On the navigation menu, click Data Sources.
The Data Sources panel is displayed.
Step 4 Click the Log Sources icon.
The Log Sources window is displayed.
Step 5 Click Add.
The Add a log source window is displayed.
Step 6 In the Log Source Name field, type a name for your log source.
Step 7 In the Log Source Description field, type a description for the log source.
Step 8 From the Log Source Type list box, select APC UPS.
Step 9 Using the Protocol Configuration list box, select Syslog.
The syslog protocol configuration is displayed.
Configuring DSMs
36 APC UPS
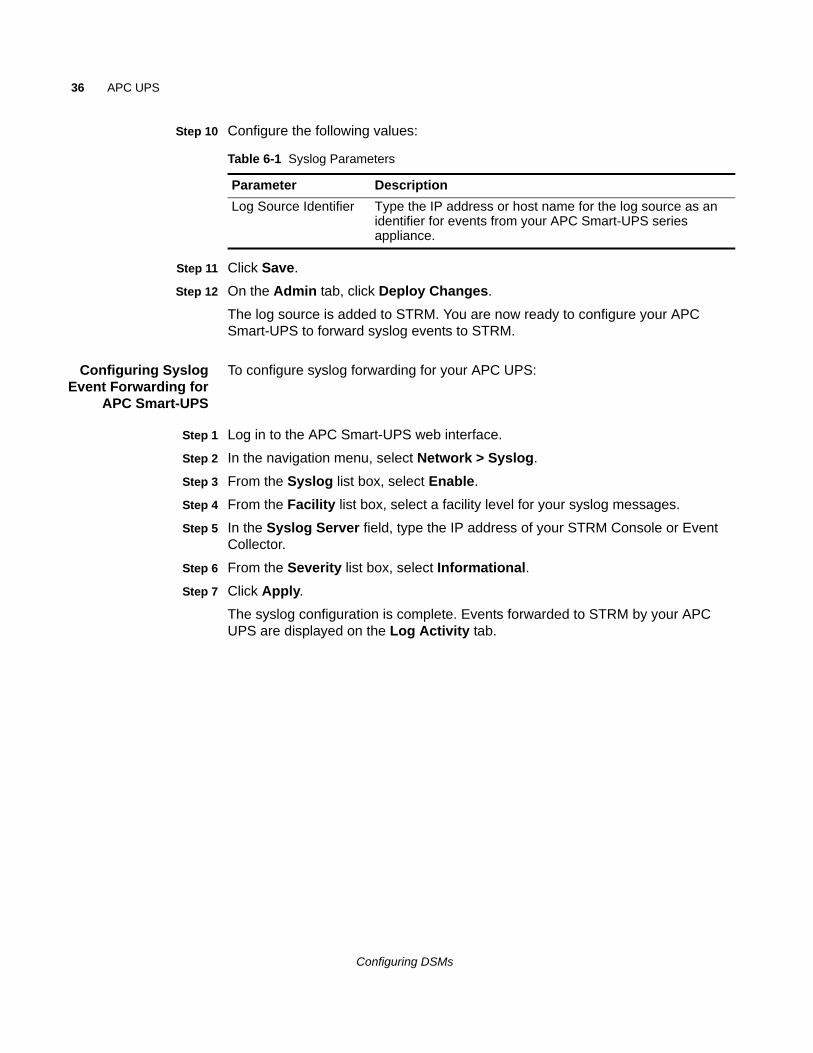
Step 10 Configure the following values:
Step 11 Click Save.
Step 12 On the Admin tab, click Deploy Changes.
The log source is added to STRM. You are now ready to configure your APC Smart-UPS to forward syslog events to STRM.
Configuring SyslogEvent Forwarding for
APC Smart-UPS
To configure syslog forwarding for your APC UPS:
Step 1 Log in to the APC Smart-UPS web interface.
Step 2 In the navigation menu, select Network > Syslog.
Step 3 From the Syslog list box, select Enable.
Step 4 From the Facility list box, select a facility level for your syslog messages.
Step 5 In the Syslog Server field, type the IP address of your STRM Console or Event Collector.
Step 6 From the Severity list box, select Informational.
Step 7 Click Apply.
The syslog configuration is complete. Events forwarded to STRM by your APC UPS are displayed on the Log Activity tab.
Table 6-1 Syslog Parameters
Parameter Description
Log Source Identifier Type the IP address or host name for the log source as an identifier for events from your APC Smart-UPS series appliance.
Configuring DSMs

7
APPLE MAC OS XThe Apple Mac OS X DSM for STRM accepts events using syslog. STRM records all relevant firewall, web server access, web server error, privilege escalation, and informational events. Before you can receive events in STRM, you must create a log source for Mac OS X events, then configure your Apple Mac OS X to forward syslog events to STRM.
This section includes the following topics:
• Configuring a Log Source in STRM
• Configuring Syslog for Apple Mac OS X
Configuring a LogSource in STRM
STRM does not automatically discover or create log sources for syslog events from Apple Mac OS X. To integrate Apple Mac OS X events with STRM, you must manually create a log source to receive syslog events.
To configure a log source:
Step 1 Log in to STRM.
Step 2 Click the Admin tab.
Step 3 On the navigation menu, click Data Sources.
The Data Sources panel is displayed.
Step 4 Click the Log Sources icon.
The Log Sources window is displayed.
Step 5 Click Add.
The Add a log source window is displayed.
Step 6 In the Log Source Name field, type a name for your log source.
Step 7 In the Log Source Description field, type a description for the log source.
Step 8 From the Log Source Type list box, select Mac OS X.
Step 9 Using the Protocol Configuration list box, select Syslog.
The syslog protocol configuration is displayed.
Configuring DSMs
38 APPLE MAC OS X
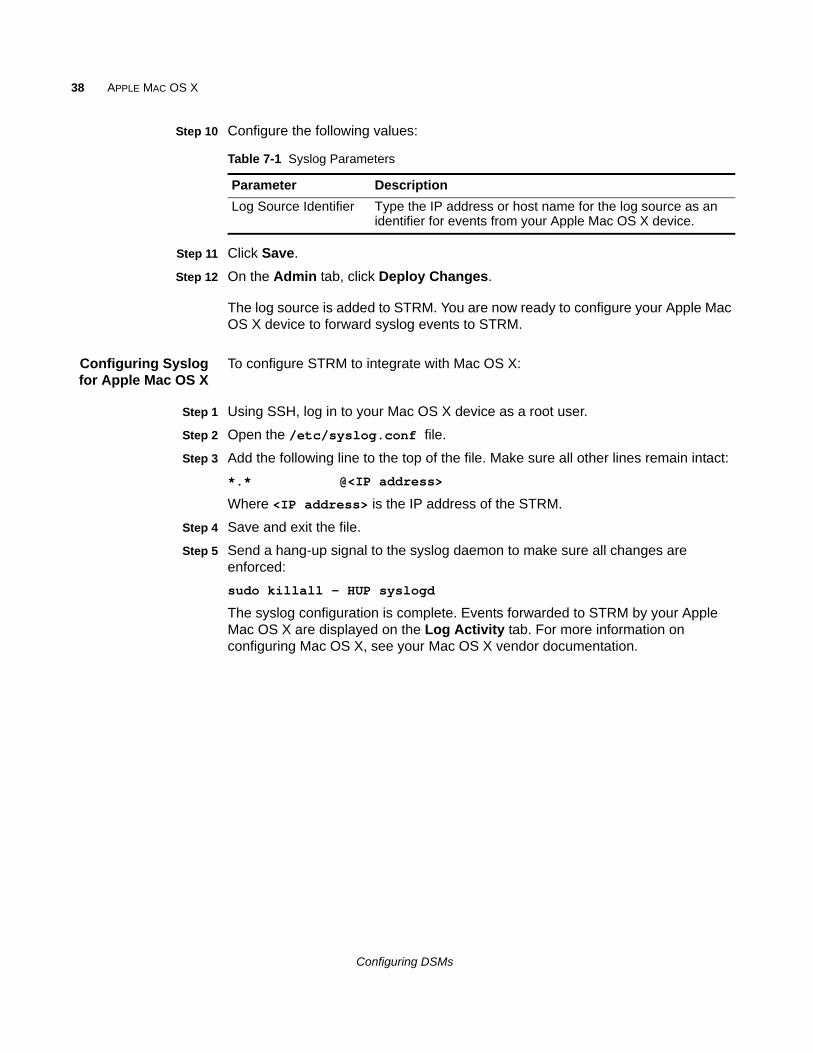
Step 10 Configure the following values:
Step 11 Click Save.
Step 12 On the Admin tab, click Deploy Changes.
The log source is added to STRM. You are now ready to configure your Apple Mac OS X device to forward syslog events to STRM.
Configuring Syslogfor Apple Mac OS X
To configure STRM to integrate with Mac OS X:
Step 1 Using SSH, log in to your Mac OS X device as a root user.
Step 2 Open the /etc/syslog.conf file.
Step 3 Add the following line to the top of the file. Make sure all other lines remain intact:
*.* @<IP address>
Where <IP address> is the IP address of the STRM.
Step 4 Save and exit the file.
Step 5 Send a hang-up signal to the syslog daemon to make sure all changes are enforced:
sudo killall - HUP syslogd
The syslog configuration is complete. Events forwarded to STRM by your Apple Mac OS X are displayed on the Log Activity tab. For more information on configuring Mac OS X, see your Mac OS X vendor documentation.
Table 7-1 Syslog Parameters
Parameter Description
Log Source Identifier Type the IP address or host name for the log source as an identifier for events from your Apple Mac OS X device.
Configuring DSMs
8
APPLICATION SECURITY DBPROTECTThe Application Security DbProtect DSM for STRM accepts syslog events from DbProtect devices installed with the Log Enhanced Event Format (LEEF) Service. The LEEF Relay module for DbProtect translates the default events messages to Log Enhanced Event Format (LEEF) messages for STRM, enabling STRM to record all relevant DbProtect events. Before you can receive events in STRM, you must install and configure the LEEF Service for your DbProtect device to forward syslog events.
This section includes the following topics:
• Installing the DbProtect LEEF Relay Module
• Configuring the DbProtect LEEF Relay
• Configuring a Log Source in STRM
Installing theDbProtect LEEF
Relay Module
The DbProtect LEEF Relay module for DbProtect must be installed on the same server as the DbProtect console. This allows the DbProtect LEEF Relay to work alongside an existing installation using the standard hardware and software prerequisites for a DbProtect console. The DbProtect LEEF Relay requires that you install the .NET 4.0 Framework, which is bundled with the LEEF Relay installation.
NOTEWindows 2003 hosts require the Windows Imaging Components (wic_x86.exe). The Windows Imaging Components are located on the Windows Server Installation CD and must be installed before you continue. For more information, see your Windows 2003 Operating System documentation.
To install the DbProtect LEEF Relay module:
Step 1 Download the DbProtect LEEF Relay module for DbProtect from the Application Security, Inc. customer portal.
http://www.appsecinc.com
Step 2 Save the setup file to the same host as your DbProtect console.
Step 3 Double click setup.exe to start the DbProtect LEEF Relay installation.
The Microsoft .NET Framework 4 Client Profile is displayed.
Configuring DSMs
40 APPLICATION SECURITY DBPROTECT
Step 4 Click Accept, if you agree with the Microsoft .NET Framework 4 End User License Agreement.
The Microsoft .NET Framework 4 is installed on your DbProtect console. After the installation is complete, the DbProtect LEEF Relay module installation Wizard is displayed.
Step 5 Click Next.
The Installation Folder window is displayed.
Step 6 To select the default installation path, click Next.
If you change the default installation directory, make note of the file location as it is required later. The Confirm Installation window is displayed.
Step 7 Click Next.
The DbProtect LEEF Relay module is installed.
Step 8 Click Close.
You are now ready to configure the DbProtect LEEF Relay module.
Configuring theDbProtect LEEF
Relay
After the installation of the DbProtect LEEF Relay is complete, you can configure the service to forward events to STRM.
NOTEThe DbProtect LEEF Relay must be stopped before you edit any configuration values.
To configure the DbProtect LEEF Relay:
Step 1 Navigate to the DbProtect LEEF Relay installation directory.
C:\Program Files (x86)\AppSecInc\AppSecLEEFConverter
Step 2 Edit the DbProtect LEEF Relay configuration file:
AppSecLEEFConverter.exe.config
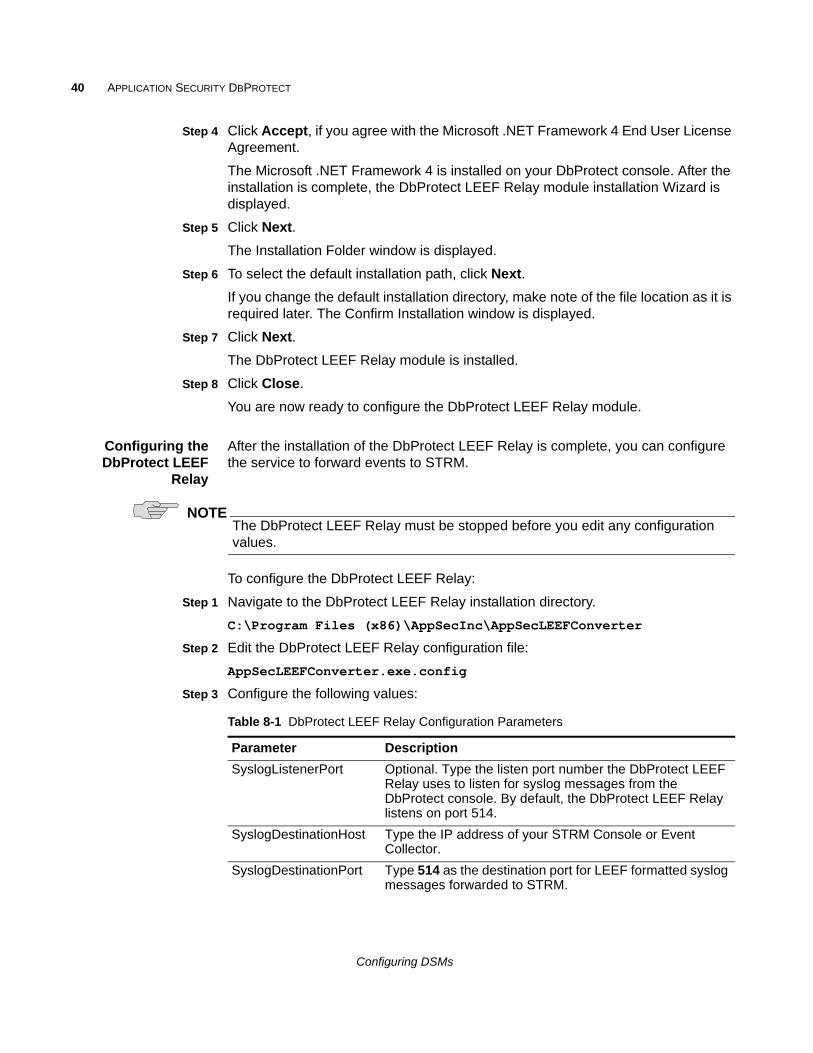
Step 3 Configure the following values:
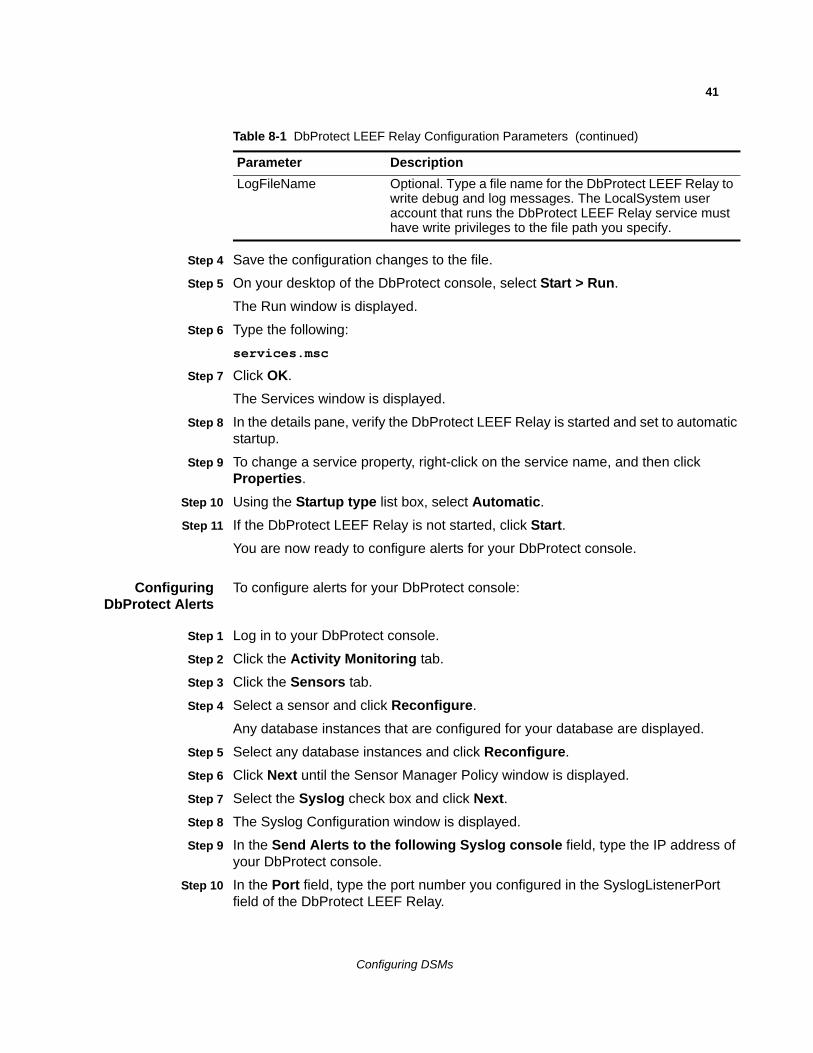
Table 8-1 DbProtect LEEF Relay Configuration Parameters
Parameter Description
SyslogListenerPort Optional. Type the listen port number the DbProtect LEEF Relay uses to listen for syslog messages from the DbProtect console. By default, the DbProtect LEEF Relay listens on port 514.
SyslogDestinationHost Type the IP address of your STRM Console or Event Collector.
SyslogDestinationPort Type 514 as the destination port for LEEF formatted syslog messages forwarded to STRM.
Configuring DSMs
41
Step 4 Save the configuration changes to the file.
Step 5 On your desktop of the DbProtect console, select Start > Run.
The Run window is displayed.
Step 6 Type the following:
services.msc
Step 7 Click OK.
The Services window is displayed.
Step 8 In the details pane, verify the DbProtect LEEF Relay is started and set to automatic startup.
Step 9 To change a service property, right-click on the service name, and then click Properties.
Step 10 Using the Startup type list box, select Automatic.
Step 11 If the DbProtect LEEF Relay is not started, click Start.
You are now ready to configure alerts for your DbProtect console.
ConfiguringDbProtect Alerts
To configure alerts for your DbProtect console:
Step 1 Log in to your DbProtect console.
Step 2 Click the Activity Monitoring tab.
Step 3 Click the Sensors tab.
Step 4 Select a sensor and click Reconfigure.
Any database instances that are configured for your database are displayed.
Step 5 Select any database instances and click Reconfigure.
Step 6 Click Next until the Sensor Manager Policy window is displayed.
Step 7 Select the Syslog check box and click Next.
Step 8 The Syslog Configuration window is displayed.
Step 9 In the Send Alerts to the following Syslog console field, type the IP address of your DbProtect console.
Step 10 In the Port field, type the port number you configured in the SyslogListenerPort field of the DbProtect LEEF Relay.
LogFileName Optional. Type a file name for the DbProtect LEEF Relay to write debug and log messages. The LocalSystem user account that runs the DbProtect LEEF Relay service must have write privileges to the file path you specify.
Table 8-1 DbProtect LEEF Relay Configuration Parameters (continued)
Parameter Description
Configuring DSMs
42 APPLICATION SECURITY DBPROTECT
By default, 514 is the default Syslog listen port for the DbProtect LEEF Relay. For more information, see Configuring the DbProtect LEEF Relay, Step 3.
Step 11 Click Add.
Step 12 Click Next until you reach the Deploy to Sensor window.
Step 13 Click Deploy to Sensor.
The configuration is complete. Events forwarded to STRM by your DbProtect console are added as a log source and automatically displayed on the Log Activity tab.
Configuring a LogSource in STRM
STRM automatically discovers and creates a log source for syslog events in LEEF format from DbProtect devices. However, you can manually create a log source for STRM to receive syslog events. These configuration steps are optional.
To manually configure a log source for DbProtect:
Step 1 Log in to STRM.
Step 2 Click the Admin tab.
Step 3 On the navigation menu, click Data Sources.
The Data Sources panel is displayed.
Step 4 Click the Log Sources icon.
The Log Sources window is displayed.
Step 5 Click Add.
The Add a log source window is displayed.
Step 6 In the Log Source Name field, type a name for your log source.
Step 7 In the Log Source Description field, type a description for the log source.
Step 8 From the Log Source Type list box, select Application Security DbProtect.
Step 9 Using the Protocol Configuration list box, select Syslog.
The syslog protocol configuration is displayed.
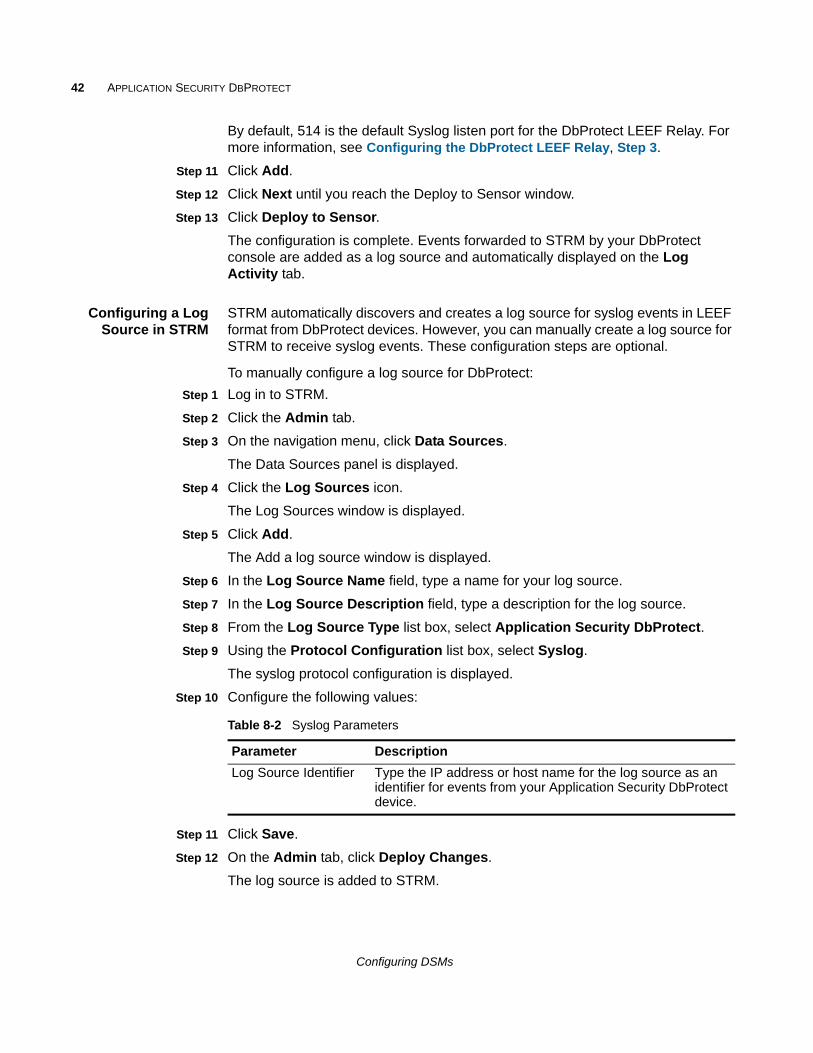
Step 10 Configure the following values:
Step 11 Click Save.
Step 12 On the Admin tab, click Deploy Changes.
The log source is added to STRM.
Table 8-2 Syslog Parameters
Parameter Description
Log Source Identifier Type the IP address or host name for the log source as an identifier for events from your Application Security DbProtect device.
Configuring DSMs
9
ARRAY NETWORKS SSL VPNThe Array Networks SSL VPN DSM for STRM collects events from an ArrayVPN appliance using syslog. For details of configuring ArrayVPN appliances for remote syslog, please consult Array Networks documentation.
After you configure syslog to forward events to STRM, you are now ready to create a log source.
STRM does not automatically discover or create log sources for syslog events from Array Networks SSL VPN appliances. To integrate Array Networks SSL VPN events with STRM, you must manually create a log source.
To create a log source for Array Networks SSL VPN:
Step 1 Log in to STRM.
Step 2 Click the Admin tab.
Step 3 On the navigation menu, click Data Sources.
The Data Sources panel is displayed.
Step 4 Click the Log Sources icon.
The Log Sources window is displayed.
Step 5 Click Add.
The Add a log source window is displayed.
Step 6 In the Log Source Name field, type a name for your log source.
Step 7 In the Log Source Description field, type a description for the log source.
Step 8 From the Log Source Type list box, select Array Networks SSL VPN Access Gateways.
Step 9 Using the Protocol Configuration list box, select Syslog.
The syslog protocol configuration is displayed.
Configuring DSMs
44 ARRAY NETWORKS SSL VPN
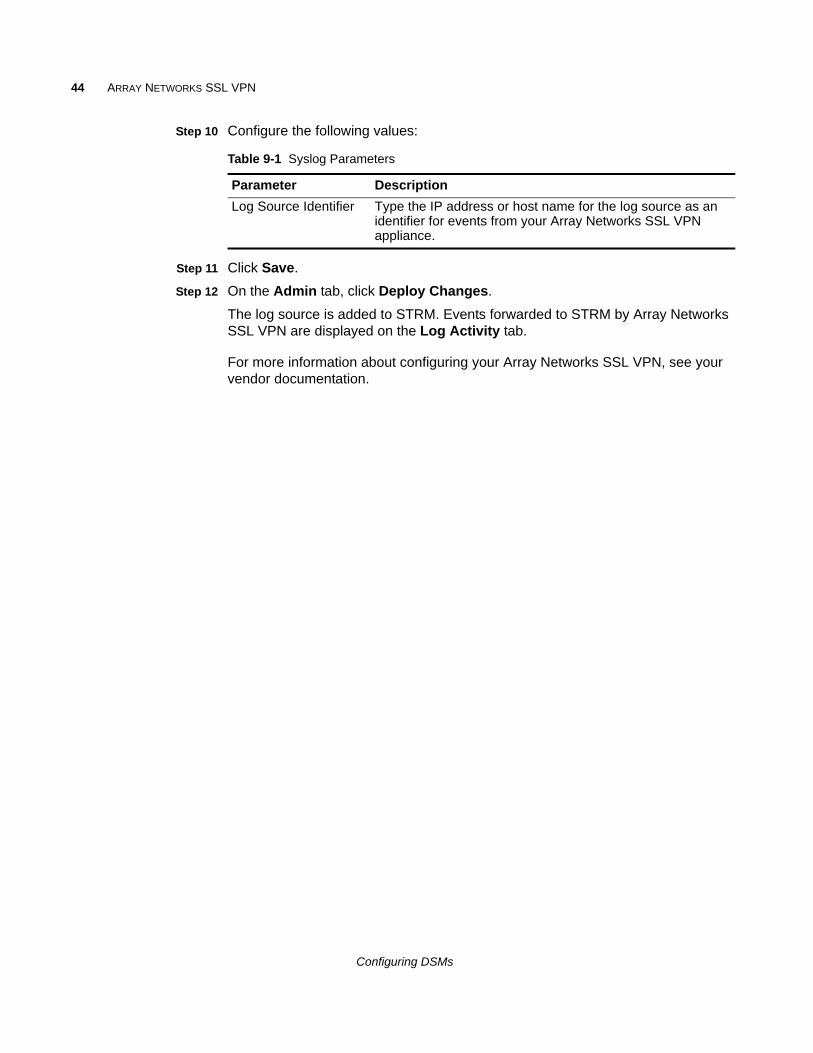
Step 10 Configure the following values:
Step 11 Click Save.
Step 12 On the Admin tab, click Deploy Changes.
The log source is added to STRM. Events forwarded to STRM by Array Networks SSL VPN are displayed on the Log Activity tab.
For more information about configuring your Array Networks SSL VPN, see your vendor documentation.
Table 9-1 Syslog Parameters
Parameter Description
Log Source Identifier Type the IP address or host name for the log source as an identifier for events from your Array Networks SSL VPN appliance.
Configuring DSMs
10
ARUBA MOBILITY CONTROLLERSThe Aruba Mobility Controllers DSM for STRM accepts events using syslog. STRM records all relevant events. Before configuring an Aruba Mobility Controller device in STRM, you must configure your device to forward syslog events.
This section includes the following topics:
• Configuring your Aruba Mobility Controller
• Configuring a Log Source in STRM
Configuring yourAruba Mobility
Controller
To configure the Aruba Wireless Networks (Mobility Controller) device to forward syslog events to STRM:
Step 1 Log in to the Aruba Mobility Controller user interface.
Step 2 From the top menu, select Configuration.
Step 3 From the Switch menu, select Management.
Step 4 Click the Logging tab.
Step 5 From the Logging Servers menu, select Add.
Step 6 Type the IP address of the STRM server that you want to collect logs.
Step 7 Click Add.
Step 8 Optional. Change the logging level for a module:
a Select the check box next to the name of the logging module.
b Choose the logging level you want to change from the list box that is displayed at the bottom of the window.
Step 9 Click Done.
Step 10 Click Apply.
The configuration is complete. The log source is added to STRM as Aruba Mobility Controller events are automatically discovered. Events forwarded to STRM by Aruba Mobility Controller are displayed on the Log Activity tab of STRM.
Configuring DSMs
46 ARUBA MOBILITY CONTROLLERS
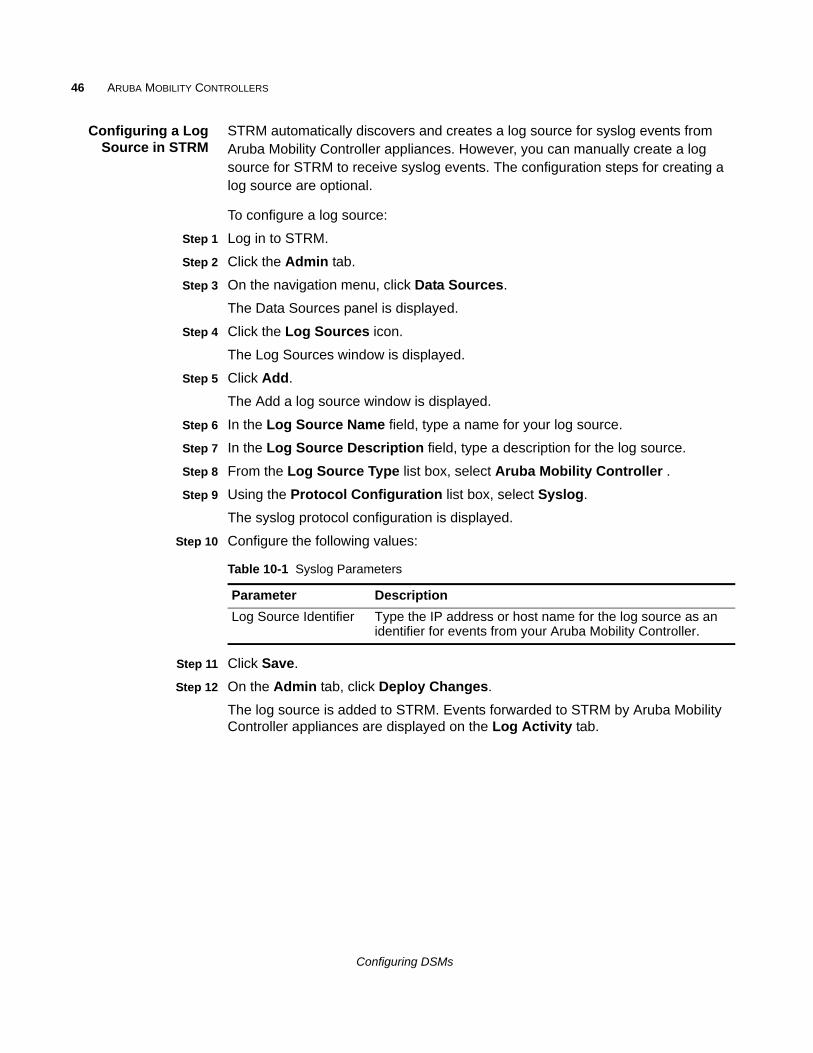
Configuring a LogSource in STRM
STRM automatically discovers and creates a log source for syslog events from Aruba Mobility Controller appliances. However, you can manually create a log source for STRM to receive syslog events. The configuration steps for creating a log source are optional.
To configure a log source:
Step 1 Log in to STRM.
Step 2 Click the Admin tab.
Step 3 On the navigation menu, click Data Sources.
The Data Sources panel is displayed.
Step 4 Click the Log Sources icon.
The Log Sources window is displayed.
Step 5 Click Add.
The Add a log source window is displayed.
Step 6 In the Log Source Name field, type a name for your log source.
Step 7 In the Log Source Description field, type a description for the log source.
Step 8 From the Log Source Type list box, select Aruba Mobility Controller .
Step 9 Using the Protocol Configuration list box, select Syslog.
The syslog protocol configuration is displayed.
Step 10 Configure the following values:
Step 11 Click Save.
Step 12 On the Admin tab, click Deploy Changes.
The log source is added to STRM. Events forwarded to STRM by Aruba Mobility Controller appliances are displayed on the Log Activity tab.
Table 10-1 Syslog Parameters
Parameter Description
Log Source Identifier Type the IP address or host name for the log source as an identifier for events from your Aruba Mobility Controller.
Configuring DSMs
11
BALABIT IT SECURITYThe BalaBit Syslog-ng Agent application can collect and forward syslog events for the Microsoft Security Event Log DSM and the Microsoft ISA DSM in STRM. Events forwarded by the Syslog-ng Agent use the Log Extended Event Format (LEEF). Before you can configure STRM, you must configure your BalaBit IT Security agent to collect and forward the events.
To configure a BalaBIt IT Security agent, select a configuration:
• Configuring BalaBIt IT Security for Microsoft Windows Events
• Configuring BalaBit IT Security for Microsoft ISA or TMG Event Files
Configuring BalaBIt IT Security for Microsoft Windows Events
The Microsoft Windows Security Event Log DSM in STRM can accept events from BalaBit’s Syslog-ng Agent. The BalaBit Syslog-ng Agent reads Windows-based security, application, system, DNS, DHCP, and custom container event logs and forwards syslog events to STRM using the Log Extended Event Format (LEEF).
To configure the BalaBit Syslog-ng Agent, you must:
1 Install the BalaBit Syslog-ng Agent in your Windows host. For more information, see your BalaBit Syslog-ng Agent documentation.
2 Configure Syslog-ng Agent Events. For more information, see Configuring the Syslog-ng Agent Event.
3 Configure STRM as a destination for the Syslog-ng Agent. For more information, see Configuring a Syslog Destination.
4 Restart the Syslog-ng Agent service. For more information, see Restarting the Syslog-ng Agent Service.
5 Optional. Configure the log source in STRM. For more information, see Configuring a Log Source for BalaBit Syslog-ng Events.
Configuring DSMs
48 BALABIT IT SECURITY
Configuring theSyslog-ng Agent
Event
Before you can forward events to STRM, you must specify what Windows-based events the Syslog-ng Agent collects.
To configure the event types collected:
Step 1 From the Start menu, select All Programs > syslog-ng Agent for Windows > Configure syslog-ng Agent for Windows.
The Syslog-ng Agent window is displayed.
Step 2 Expand the syslog-ng Agent Settings pane, and select Eventlog Sources.
Step 3 Double-click on Event Containers.
The Event Containers Properties window is displayed.
Step 4 From the Event Containers pane, select the Enable radio button.
Step 5 Select a check box for each event type you want to collect:
• Application - Select this check box if you want the device to monitor the Windows application event log.
• Security - Select this check box if you want the device to monitor the Windows security event log.
• System - Select this check box if you want the device to monitor the Windows system event log.
NOTEBalaBit’s Syslog-ng Agent supports additional event types, such as DNS or DHCP events using custom containers. For more information, see your BalaBit Syslog-ng Agent documentation.
Step 6 Click Apply, and then click OK.
The event configuration for your BalaBit Syslog-ng Agent is complete. You are now ready to configure STRM as a destination for Syslog-ng Agent events.
Configuring a SyslogDestination
The Syslog-ng Agent allows you to configure multiple destinations for your Windows-based events. To configure STRM as a destination, you must specify the IP address for STRM, and then configure a message template for the LEEF format.
To configure a destination for the Syslog-ng Agent:
Step 1 From the Start menu, select All Programs > syslog-ng Agent for Windows > Configure syslog-ng Agent for Windows.
The Syslog-ng Agent window is displayed.
Step 2 Expand the syslog-ng Agent Settings pane, and click Destinations.
Step 3 Double-click on Add new sever.
The Server Property window is displayed.
Step 4 On the Server tab, click Set Primary Server.
Configuring DSMs
Configuring BalaBIt IT Security for Microsoft Windows Events 49
Step 5 Configure the following parameters:
a Server Name - Type the IP address of your STRM Console or Event Collector.
b Server Port - Type 514 as the TCP port number for events forwarded to STRM.
Step 6 Click the Messages tab.
Step 7 From the Protocol list box, select Legacy BSD Syslog Protocol.
Step 8 In the Template field, define a custom template message for the protocol by typing:
<${PRI}>${BSDDATE} ${HOST} LEEF:${MSG}
The information typed in this field is space delimited.
Step 9 From the Event Message Format pane, in the Message Template field, type the following to define the format for the LEEF events:
1.0|Microsoft|Windows|2k8r2|${EVENT_ID}|devTime=${R_YEAR}-${R_MONTH}-${R_DAY}T${R_HOUR}:${R_MIN}:${R_SEC}GMT${TZOFFSET} devTimeFormat=yyyy-MM-dd'T'HH:mm:ssz cat=${EVENT_TYPE}sev=${EVENT_LEVEL} resource=${HOST} usrName=${EVENT_USERNAME} application=${EVENT_SOURCE} message=${EVENT_MSG}
NOTEThe LEEF format uses tab as a delimiter to separate event attributes from each other. However, the delimiter does not start until after the last pipe character for {Event_ID}. The following fields must include a tab before the event name: devTime, devTimeFormat, cat, sev, resource, usrName, application, and message.
You might need to use a text editor to copy and paste the LEEF message format into the Message Template field.
Step 10 Click OK.
The destination configuration is complete. You are now ready to restart the Syslog-ng Agent service.
Restarting theSyslog-ng Agent
Service
Before the Syslog-ng Agent can forward LEEF formatted events, you must restart the Syslog-ng Agent service on the Windows host.
To restart the Syslog-ng Agent:
Step 1 From the Start menu, select Start > Run.
The Run window is displayed.
Step 2 Type the following:
services.msc
Step 3 Click OK.
The Services window is displayed.
Configuring DSMs
50 BALABIT IT SECURITY
Step 4 In the Name column, right-click on Syslog-ng Agent for Windows, and select Restart.
After the Syslog-ng Agent for Windows service restarts, the configuration is complete. Syslog events from the BalaBit Syslog-ng Agent are automatically discovered by STRM. The Windows events that are automatically discovered are displayed as Microsoft Windows Security Event Logs on the Log Activity tab.
Configuring a LogSource for BalaBitSyslog-ng Events
STRM automatically discovers and creates a log source for syslog events from LEEF formatted messages. However, you can manually create a log source for STRM to receive Windows events. The configuration steps for creating a log source are optional.
To manually create a log source for BalaBit Syslog-ng Events:
Step 1 Log in to STRM.
Step 2 Click the Admin tab.
Step 3 On the navigation menu, click Data Sources.
The Data Sources panel is displayed.
Step 4 Click the Log Sources icon.
The Log Sources window is displayed.
Step 5 Click Add.
The Add a log source window is displayed.
Step 6 In the Log Source Name field, type a name for your BalaBit Syslog-ng Agent log source.
Step 7 In the Log Source Description field, type a description for the log source.
Step 8 From the Log Source Type list box, select Microsoft Windows Security Event Log.
Step 9 Using the Protocol Configuration list box, select Syslog.
The syslog protocol configuration is displayed.
Step 10 Configure the following values:
Step 11 Click Save.
Step 12 On the Admin tab, click Deploy Changes.
The configuration is complete.
Table 11-1 Syslog Parameters
Parameter Description
Log Source Identifier Type the IP address or hostname for the log source as an identifier for events from the BalaBit Syslog-ng Agent.
Configuring DSMs
Configuring BalaBit IT Security for Microsoft ISA or TMG Event Files 51
Configuring BalaBit IT Security for Microsoft ISA or TMG Event Files
The BalaBit Syslog-ng Agent application can collect and forward syslog events for the Microsoft Security Event Log DSM and the Microsoft ISA DSM to STRM. Events forwarded by the Syslog-ng Agent use the Log Extended Event Format (LEEF). Before you can configure STRM, you must configure the Syslog-ng Agent to collect and forward the events.
A STRM Microsoft Internet and Acceleration (ISA) DSM accepts syslog events from Microsoft ISA and Microsoft Threat Management Gateway (TMG) using BalaBit’s Syslog-ng Agent for Windows and BalaBit’s Syslog-ng PE to parse and forward events to STRM. The BalaBit Syslog-ng Agent reads Microsoft ISA or Microsoft TMG event logs and forwards syslog events using the Log Extended Event Format (LEEF).
To configure the BalaBit Syslog-ng Agent, you must:
1 Install the BalaBit Syslog-ng Agent in your Windows host. For more information, see your BalaBit Syslog-ng Agent vendor documentation.
2 Configure the BalaBit Syslog-ng Agent. For more information, see Configuring the BalaBit Syslog-ng Agent.
3 Install a BalaBit Syslog-ng PE for Linux or Unix in relay mode to parse and forward events to STRM. For more information, see your BalaBit Syslog-ng PE vendor documentation.
4 Configure syslog for BalaBit Syslog-ng PE. For more information, see Configuring a BalaBit Syslog-ng PE Relay.
5 Optional. Configure the log source in STRM. For more information, see Configuring a Log Source for BalaBit Syslog-ng Events.
Configuring theBalaBit Syslog-ng
Agent
Before you can forward events to STRM, you must specify what Microsoft ISA or Microsoft TMG event source the Syslog-ng Agent collects.
This section includes the following topics:
• Configuring File Sources
• Configuring a Syslog Destination
• Filtering the Log File for Comment Lines
Configuring FileSources
File sources allow you to define the base log directory and files monitored by the Syslog-ng Agent. If your Microsoft ISA or Microsoft TMG appliance is generating event files for the Web Proxy Server and the Firewall Service, both files can be added.
To configure a File Source Property:
Step 1 From the Start menu, select All Programs > syslog-ng Agent for Windows > Configure syslog-ng Agent for Windows.
The Syslog-ng Agent window is displayed.
Configuring DSMs
52 BALABIT IT SECURITY
Step 2 Expand the syslog-ng Agent Settings pane, and select File Sources.
Step 3 Select the Enable radio button.
Step 4 Click Add to add your Microsoft ISA and TMG event files.
Step 5 From the Base Directory field, click Browse and select the folder for your Microsoft ISA or Microsoft TMG log files.
Step 6 From the File Name Filter field, click Browse and select a log file containing your Microsoft ISA or Microsoft TMG events.
NOTEThe File Name Filter field supports the wildcard (*) and question mark (?) characters to follow log files that are replaced after reaching a specific file size or date.
Step 7 In the Application Name field, type a name to identify the application.
Step 8 From the Log Facility list box, select Use Global Settings.
Step 9 Click OK.
Step 10 To add additional file sources, click Add and repeat this process fromStep 4.
Microsoft ISA and TMG store Web Proxy Service events and Firewall Service events in individual files.
Step 11 Click Apply, and then click OK.
The event configuration is complete. You are now ready to configure a syslog destinations and formatting for your Microsoft TMG and ISA events.
Configuring a Syslog Destination
The Syslog-ng Agent allows you to configure multiple destinations for your Windows-based events. The event logs captured by Microsoft ISA or TMG cannot be parsed by the BalaBit Syslog-ng Agent for Windows, so you must forward your logs to a BalaBit Syslog-ng Premium Edition (PE) for Linux or Unix. To forward your TMG and ISA event logs, you must specify the IP address for your PE relay and configure a message template for the LEEF format. The BalaBit Syslog-ng PE acts as an intermediate syslog server to parse the events and forward the information to STRM.
To configure a syslog destination:
Step 1 From the Start menu, select All Programs > syslog-ng Agent for Windows > Configure syslog-ng Agent for Windows.
The Syslog-ng Agent window is displayed.
Step 2 Expand the syslog-ng Agent Settings pane, and click Destinations.
Step 3 Double-click on Add new sever.
The Server Property window is displayed.
Step 4 On the Server tab, click Set Primary Server.
Configuring DSMs
Configuring BalaBit IT Security for Microsoft ISA or TMG Event Files 53
Step 5 Configure the following parameters:
a Server Name - Type the IP address of your BalaBit Syslog-ng PE relay.
b Server Port - Type 514 as the TCP port number for events forwarded to your BalaBit Syslog-ng PE relay.
Step 6 Click the Messages tab.
Step 7 From the Protocol list box, select Legacy BSD Syslog Protocol.
Step 8 From the File Message Format pane, in the Message Template field, type the following format command:
${FILE_MESSAGE}${TZOFFSET}
Step 9 Click Apply, and then click OK.
The destination configuration is complete. You are now ready to filter comment lines from the event log.
Filtering the Log File for Comment Lines
The event log file for Microsoft ISA or Microsoft TMG can contain comment markers, these comments must be filtered from the event message.
To filter comment lines from the event message:
Step 1 From the Start menu, select All Programs > syslog-ng Agent for Windows > Configure syslog-ng Agent for Windows.
The Syslog-ng Agent window is displayed.
Step 2 Expand the syslog-ng Agent Settings pane, and select Destinations.
Step 3 Right-click on your STRM syslog destination and select Event Filters > Properties.
The Global event filters Properties window is displayed.
Step 4 Configure the following values:
• From the Global file filters pane, select Enable.
• From the Filter Type pane, select Black List Filtering.
Step 5 Click OK.
Step 6 From the filter list menu, double-click Message Contents.
The Message Contents Properties window is displayed.
Step 7 From the Message Contents pane, select the Enable radio button.
Step 8 In the Regular Expression field, type the following regular expression:
^#
Step 9 Click Add.
Step 10 Click Apply, and then click OK.
The event messages containing comments are no longer forwarded.
Configuring DSMs
54 BALABIT IT SECURITY
NOTEYou might be required to restart Syslog-ng Agent for Windows service to begin syslog forwarding. For more information, see your BalaBit Syslog-ng Agent documentation.
Configuring a BalaBitSyslog-ng PE Relay
The BalaBit Syslog-ng Agent for Windows sends Microsoft TMG and ISA event logs to a Balabit Syslog-ng PE installation, which is configured in relay mode. The relay mode installation is responsible for receiving the event log from the BalaBit Syslog-ng Agent for Windows, parsing the event logs in to the LEEF format, then forwarding the events to STRM using syslog.
To configure your BalaBit Syslog-ng PE Relay, you must:
1 Install BalaBit Syslog-ng PE for Linux or Unix in relay mode. For more information, see your BalaBit Syslog-ne PE vendor documentation.
2 Configure syslog on your Syslog-ng PE relay. For more information, see Configuring Syslog-ng.
NOTEFor a sample syslog.conf file you can use to configure Microsoft TMG and ISA logs using your BalaBit Syslog-ng PE relay, see www.juniper.net/support/.
Configuring Syslog-ng
The BalaBit Syslog-ng PE formats the TMG and ISA events in the LEEF format based on the configuration of your syslog.conf file. The syslog.conf file is responsible for parsing the event logs and forwarding the events to STRM.
To edit the syslog configuration file for your BalaBit Syslog-ng PE relay:
Step 1 Using SSH, log in to your BalaBit Syslog-ng PE relay command-line interface (CLI).
Step 2 Edit the following file:
/etc/syslog-ng/etc/syslog.conf
Step 3 From the destinations section, add an IP address and port number for each relay destination.
For example,
####### destinationsdestination d_messages { file("/var/log/messages"); };destination d_remote_tmgfw { tcp("STRM_IP" port(STRM_PORT) log_disk_fifo_size(10000000) template(t_tmgfw)); };destination d_remote_tmgweb { tcp("STRM_IP" port(STRM_PORT) log_disk_fifo_size(10000000) template(t_tmgweb)); };
Where:
STRM_IP is the IP address of your STRM Console or Event Collector.
Configuring DSMs
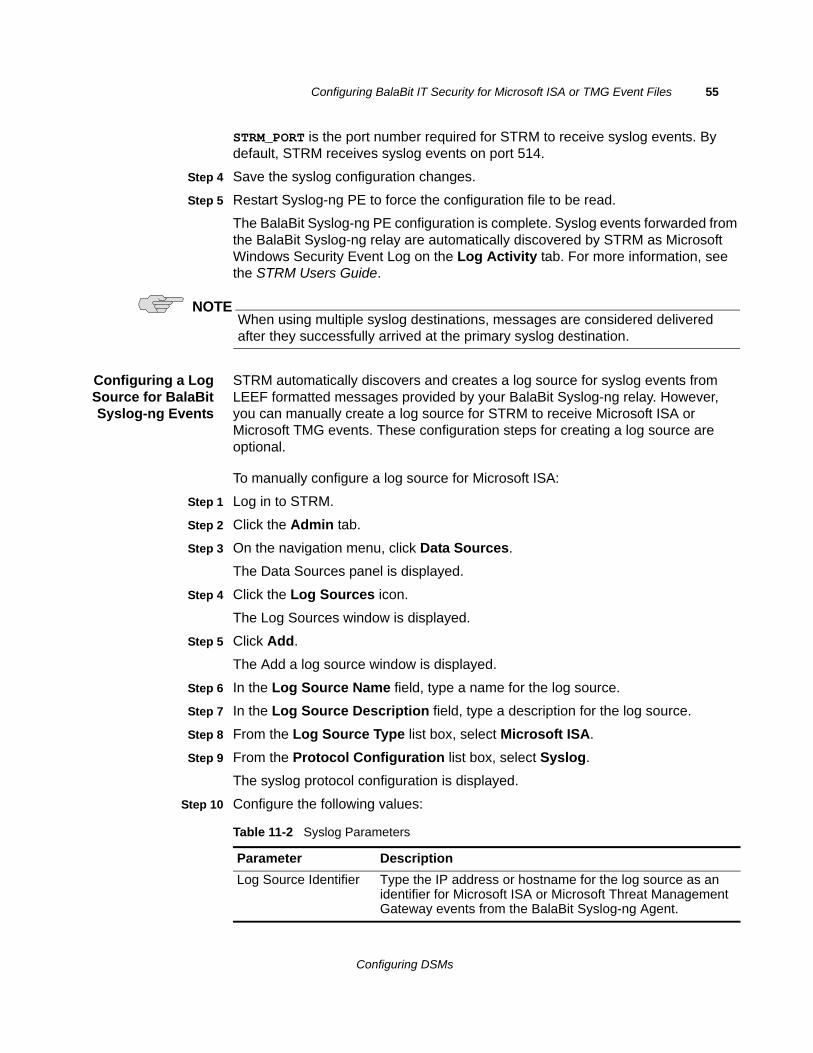
Configuring BalaBit IT Security for Microsoft ISA or TMG Event Files 55
STRM_PORT is the port number required for STRM to receive syslog events. By default, STRM receives syslog events on port 514.
Step 4 Save the syslog configuration changes.
Step 5 Restart Syslog-ng PE to force the configuration file to be read.
The BalaBit Syslog-ng PE configuration is complete. Syslog events forwarded from the BalaBit Syslog-ng relay are automatically discovered by STRM as Microsoft Windows Security Event Log on the Log Activity tab. For more information, see the STRM Users Guide.
NOTEWhen using multiple syslog destinations, messages are considered delivered after they successfully arrived at the primary syslog destination.
Configuring a LogSource for BalaBitSyslog-ng Events
STRM automatically discovers and creates a log source for syslog events from LEEF formatted messages provided by your BalaBit Syslog-ng relay. However, you can manually create a log source for STRM to receive Microsoft ISA or Microsoft TMG events. These configuration steps for creating a log source are optional.
To manually configure a log source for Microsoft ISA:
Step 1 Log in to STRM.
Step 2 Click the Admin tab.
Step 3 On the navigation menu, click Data Sources.
The Data Sources panel is displayed.
Step 4 Click the Log Sources icon.
The Log Sources window is displayed.
Step 5 Click Add.
The Add a log source window is displayed.
Step 6 In the Log Source Name field, type a name for the log source.
Step 7 In the Log Source Description field, type a description for the log source.
Step 8 From the Log Source Type list box, select Microsoft ISA.
Step 9 From the Protocol Configuration list box, select Syslog.
The syslog protocol configuration is displayed.
Step 10 Configure the following values:
Table 11-2 Syslog Parameters
Parameter Description
Log Source Identifier Type the IP address or hostname for the log source as an identifier for Microsoft ISA or Microsoft Threat Management Gateway events from the BalaBit Syslog-ng Agent.
Configuring DSMs

56 BALABIT IT SECURITY
Step 11 Click Save.
Step 12 On the Admin tab, click Deploy Changes.
The BalaBit IT Security configuration for Microsoft ISA and Microsoft TMG events is complete.
Configuring DSMs
12
BARRACUDAThis section includes information on configuring the following DSMs:
• Barracuda Spam & Virus Firewall
• Barracuda Web Application Firewall
Barracuda Spam & Virus Firewall
The Barracuda Spam & Virus Firewall DSM for STRM accepts both Mail syslog events and Web syslog events from Barracuda Spam & Virus Firewall appliances. Mail syslog events contain the event and action taken when the firewall processes email. Web syslog events record information on user activity and configuration changes on your Barracuda Spam & Virus Firewall appliance. Before you can receive events in STRM, you must configure your Barracuda Spam & Virus Firewall to forward syslog events. Syslog messages are sent to STRM from Barracuda Spam & Virus Firewall using UDP port 514. You must verify any firewalls between STRM and your Barracuda Spam & Virus Firewall appliance allow UDP traffic on port 514.
This section includes the following topics:
• Configuring Syslog Event Forwarding
• Configuring a Log Source in STRM
Configuring SyslogEvent Forwarding
To configure syslog forwarding for Barracuda Spam & Virus Firewall:
Step 1 Log in to the Barracuda Spam & Virus Firewall web interface.
Step 2 Click the Advanced tab.
Step 3 From the Advanced menu, select Advanced Networking.
Step 4 From the Mail Syslog field, type IP address of your STRM Console or Event Collector.
Step 5 Click Add.
Step 6 From the Web Interface Syslog field, type IP address of your STRM Console or Event Collector.
Step 7 Click Add.
The syslog configuration is complete.
Configuring DSMs
58 BARRACUDA
Configuring a LogSource in STRM
STRM automatically discovers and creates a log source for syslog events from Barracuda Spam & Virus Firewall appliances. However, you can manually create a log source for STRM to receive syslog events. The configuration steps for creating a log source are optional.
To manually configure a log source for Barracuda Spam & Virus Firewall syslog events:
Step 1 Log in to STRM.
Step 2 Click the Admin tab.
Step 3 On the navigation menu, click Data Sources.
The Data Sources panel is displayed.
Step 4 Click the Log Sources icon.
The Log Sources window is displayed.
Step 5 Click Add.
The Add a log source window is displayed.
Step 6 In the Log Source Name field, type a name for your log source.
Step 7 In the Log Source Description field, type a description for the log source.
Step 8 From the Log Source Type list box, select Barracuda Spam & Virus Firewall.
Step 9 Using the Protocol Configuration list box, select Syslog.
The syslog protocol configuration is displayed.
Step 10 Configure the following values:
Step 11 Click Save.
Step 12 On the Admin tab, click Deploy Changes.
The log source is added to STRM. Events forwarded to STRM by Barracuda Spam & Virus Firewall are displayed on the Log Activity tab.
Barracuda Web Application Firewall
The Barracuda Web Application Firewall DSM for STRM accepts system, web firewall log, access log, and audit log events using syslog. Before you can receive events in STRM, you must configure your Barracuda Web Application Firewall to forward syslog events to STRM in a custom name-value pair event format. Syslog events from Barracuda Web Application Firewall appliances are provided to STRM using UDP port 514. You must verify any firewalls between STRM and your Barracuda Web Application Firewall appliance allow UDP traffic on port 514.
Table 12-1 Syslog Parameters
Parameter Description
Log Source Identifier Type the IP address or host name for the log source as an identifier for events from your Barracuda Spam & Virus Firewall appliance.
Configuring DSMs
Barracuda Web Application Firewall 59
This section includes the following topics:
• Configuring Syslog Event Forwarding
• Configuring a Log Source in STRM
Configuring SyslogEvent Forwarding
To configure syslog forwarding for Barracuda Web Application Firewall:
Step 1 Log in to the Barracuda Web Application Firewall web interface.
Step 2 Click the Advanced tab.
Step 3 From the Advanced menu, select Export Logs.
Step 4 Click Syslog Settings.
Step 5 Configure a syslog facility value for the following options:
• Web Firewall Logs Facility - Select a syslog facility between Local0 and Local7.
• Access Logs Facility - Select a syslog facility between Local0 and Local7.
• Audit Logs Facility - Select a syslog facility between Local0 and Local7.
• System Logs Facility - Select a syslog facility between Local0 and Local7.
Setting a syslog unique facility for each log type allows the Barracuda Web Application Firewall to divide the logs in to different files.
Step 6 Click Save Changes.
The Export Log window is displayed.
Step 7 In the Name field, type name of the syslog server.
Step 8 In the Syslog field, type IP address of your STRM Console or Event Collector.
Step 9 From the Log Time Stamp option, select Yes.
Step 10 From the Log Unit Name option, select Yes.
Step 11 Click Add.
Step 12 From the Web Firewall Logs Format list box, select Custom Format.
Step 13 In the Web Firewall Logs Format field, type the following custom event format:
t=%t|ad=%ad|ci=%ci|cp=%cp|au=%au
Step 14 From the Access Logs Format list box, select Custom Format.
Step 15 In the Access Logs Format field, type the following custom event format:
t=%t|p=%p|s=%s|id=%id|ai=%ai|ap=%ap|ci=%ci|cp=%cp|si=%si|sp=%sp|cu=%cu
Step 16 From the Access Logs Format list box, select Custom Format.
Step 17 In the Access Logs Format field, type the following custom event format:
t=%t|trt=%trt|an=%an|li=%li|lp=%lp
Step 18 Click Save Changes.
Configuring DSMs
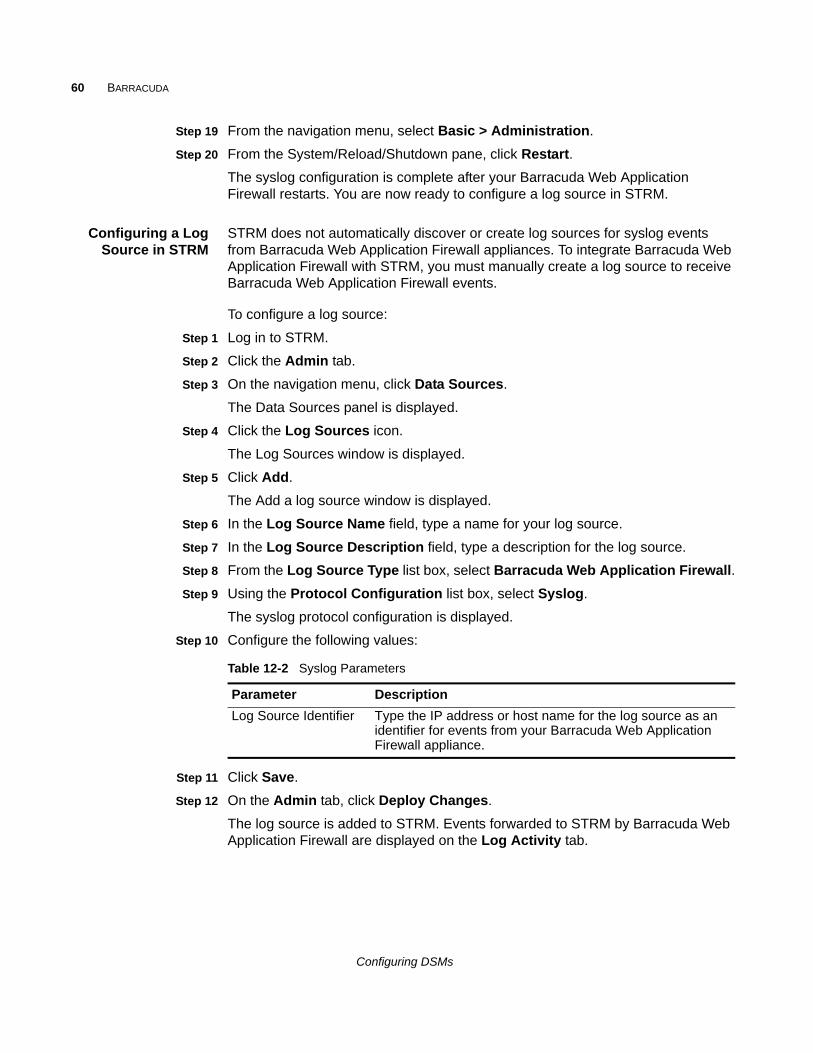
60 BARRACUDA
Step 19 From the navigation menu, select Basic > Administration.
Step 20 From the System/Reload/Shutdown pane, click Restart.
The syslog configuration is complete after your Barracuda Web Application Firewall restarts. You are now ready to configure a log source in STRM.
Configuring a LogSource in STRM
STRM does not automatically discover or create log sources for syslog events from Barracuda Web Application Firewall appliances. To integrate Barracuda Web Application Firewall with STRM, you must manually create a log source to receive Barracuda Web Application Firewall events.
To configure a log source:
Step 1 Log in to STRM.
Step 2 Click the Admin tab.
Step 3 On the navigation menu, click Data Sources.
The Data Sources panel is displayed.
Step 4 Click the Log Sources icon.
The Log Sources window is displayed.
Step 5 Click Add.
The Add a log source window is displayed.
Step 6 In the Log Source Name field, type a name for your log source.
Step 7 In the Log Source Description field, type a description for the log source.
Step 8 From the Log Source Type list box, select Barracuda Web Application Firewall.
Step 9 Using the Protocol Configuration list box, select Syslog.
The syslog protocol configuration is displayed.
Step 10 Configure the following values:
Step 11 Click Save.
Step 12 On the Admin tab, click Deploy Changes.
The log source is added to STRM. Events forwarded to STRM by Barracuda Web Application Firewall are displayed on the Log Activity tab.
Table 12-2 Syslog Parameters
Parameter Description
Log Source Identifier Type the IP address or host name for the log source as an identifier for events from your Barracuda Web Application Firewall appliance.
Configuring DSMs
13
BIT9 PARITYThe Bit9 Parity DSM for STRM accepts events using the Log Enhanced Event Format (LEEF), enabling STRM to record all relevant events. Before configuring a Bit9 Parity DSM in STRM, you must configure your Bit9 Parity device to forward events.
This section includes the following topics:
• Configuring Bit9 Parity
• Configuring a Log Source in STRM
Configuring Bit9Parity
To configure your Bit9 Parity device:
Step 1 Log in to the Bit9 Parity console with Administrator or PowerUser privileges.
Step 2 From the navigation menu on the left side of the console, select Administration > System Configuration.
The System Configuration window is displayed.
Step 3 Click Server Status.
The Server Status window is displayed.
Step 4 Click Edit.
Step 5 In the Syslog address field, type the IP address of your STRM.
Step 6 From the Syslog format list box, select LEEF (Q1Labs).
Step 7 Select the Syslog enabled check box.
Step 8 Click Update.
The configuration is complete. The log source is added to STRM as Bit9 Parity events are automatically discovered. Events forwarded to STRM by Bit9 Parity are displayed on the Log Activity tab of STRM.
Configuring a LogSource in STRM
STRM automatically discovers and creates a log source for syslog events from Bit9 Parity. However, you can manually create a log source for STRM to receive syslog events. These configuration steps are optional.
Configuring DSMs
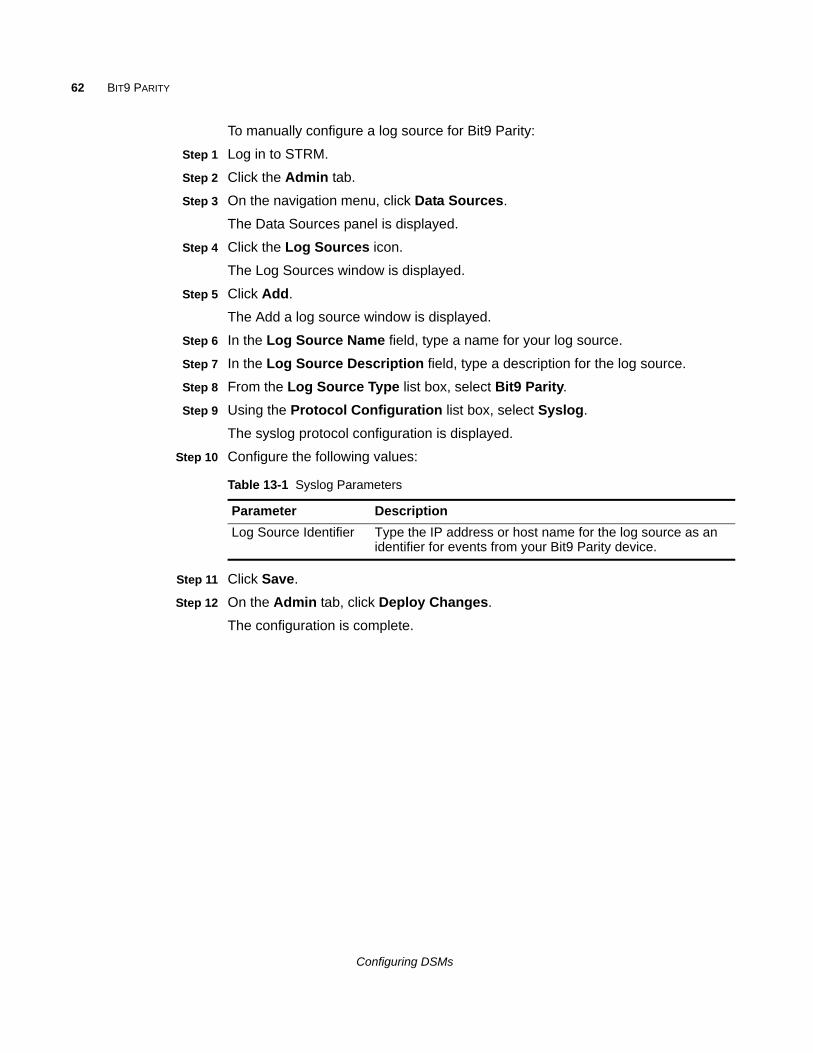
62 BIT9 PARITY
To manually configure a log source for Bit9 Parity:
Step 1 Log in to STRM.
Step 2 Click the Admin tab.
Step 3 On the navigation menu, click Data Sources.
The Data Sources panel is displayed.
Step 4 Click the Log Sources icon.
The Log Sources window is displayed.
Step 5 Click Add.
The Add a log source window is displayed.
Step 6 In the Log Source Name field, type a name for your log source.
Step 7 In the Log Source Description field, type a description for the log source.
Step 8 From the Log Source Type list box, select Bit9 Parity.
Step 9 Using the Protocol Configuration list box, select Syslog.
The syslog protocol configuration is displayed.
Step 10 Configure the following values:
Step 11 Click Save.
Step 12 On the Admin tab, click Deploy Changes.
The configuration is complete.
Table 13-1 Syslog Parameters
Parameter Description
Log Source Identifier Type the IP address or host name for the log source as an identifier for events from your Bit9 Parity device.
Configuring DSMs
14
BLUE COAT SGThe Blue Coat SG DSM for STRM allows you to integrate events from a Blue Coat SG appliance with STRM. STRM records all relevant and available information from the event. The Blue Coat SG DSM supports the following formats:
• Custom Format
• SQUID
• NCSA
• main
• IM
• Streaming
• smartreporter
• bcereportermain_v1
• bcreporterssl_v1
• p2p
• SSL
• bcreportercifs_v1
• CIFS
• MAPI
For more information about your Blue Coat SG Appliance, see your vendor documentation.
This section includes the following topics:
• Creating a Custom Format
• Retrieving Blue Coat Events
• Custom Format Addition Key-Value Pairs
Configuring DSMs
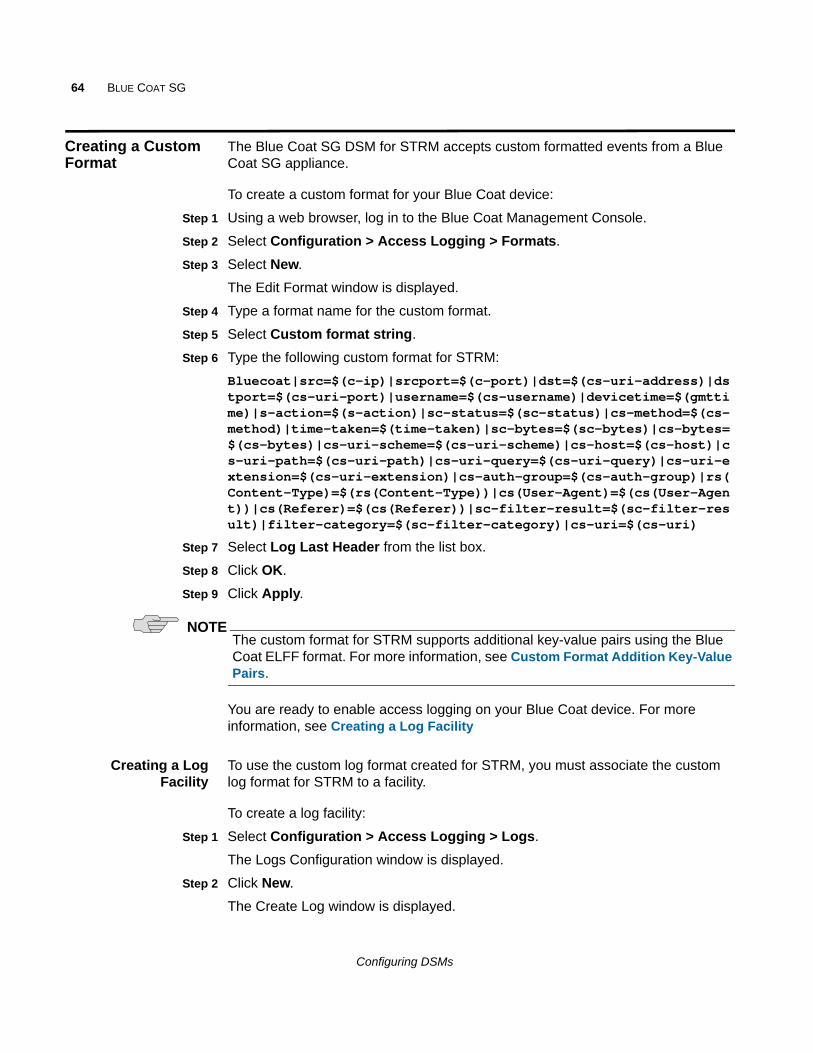
64 BLUE COAT SG
Creating a Custom Format
The Blue Coat SG DSM for STRM accepts custom formatted events from a Blue Coat SG appliance.
To create a custom format for your Blue Coat device:
Step 1 Using a web browser, log in to the Blue Coat Management Console.
Step 2 Select Configuration > Access Logging > Formats.
Step 3 Select New.
The Edit Format window is displayed.
Step 4 Type a format name for the custom format.
Step 5 Select Custom format string.
Step 6 Type the following custom format for STRM:
Bluecoat|src=$(c-ip)|srcport=$(c-port)|dst=$(cs-uri-address)|dstport=$(cs-uri-port)|username=$(cs-username)|devicetime=$(gmttime)|s-action=$(s-action)|sc-status=$(sc-status)|cs-method=$(cs-method)|time-taken=$(time-taken)|sc-bytes=$(sc-bytes)|cs-bytes=$(cs-bytes)|cs-uri-scheme=$(cs-uri-scheme)|cs-host=$(cs-host)|cs-uri-path=$(cs-uri-path)|cs-uri-query=$(cs-uri-query)|cs-uri-extension=$(cs-uri-extension)|cs-auth-group=$(cs-auth-group)|rs(Content-Type)=$(rs(Content-Type))|cs(User-Agent)=$(cs(User-Agent))|cs(Referer)=$(cs(Referer))|sc-filter-result=$(sc-filter-result)|filter-category=$(sc-filter-category)|cs-uri=$(cs-uri)
Step 7 Select Log Last Header from the list box.
Step 8 Click OK.
Step 9 Click Apply.
NOTEThe custom format for STRM supports additional key-value pairs using the Blue Coat ELFF format. For more information, see Custom Format Addition Key-Value Pairs.
You are ready to enable access logging on your Blue Coat device. For more information, see Creating a Log Facility
Creating a LogFacility
To use the custom log format created for STRM, you must associate the custom log format for STRM to a facility.
To create a log facility:
Step 1 Select Configuration > Access Logging > Logs.
The Logs Configuration window is displayed.
Step 2 Click New.
The Create Log window is displayed.
Configuring DSMs
Retrieving Blue Coat Events 65
Step 3 Configure the following parameters:
• Log Name - Type a name for the log facility.
• Log Format - Select the custom format you created in Creating a Custom Format,Step 4.
• Description - Type a description for the log facility.
Step 4 Click OK.
Step 5 Click Apply.
You are ready to enable logging on the Blue Coat device. For more information, see Enabling Access Logging.
Enabling AccessLogging
To enable access logging on your Blue Coat SG device:
Step 1 Select Configuration > Access Logging > General.
The Default Logging tab is displayed.
Step 2 Select the Enable Access Logging check box.
If the Enable Access Logging check box is not selected, logging is disabled globally for all of the formats listed.
Step 3 Click Apply.
You are ready to configure the Blue Coat upload client. For more information, see Retrieving Blue Coat Events.
Retrieving Blue Coat Events
Events from your Blue Coat SG appliance are forwarded using the Blue Coat upload client. STRM can receive forwarded events using FTP or syslog.
• If you are using FTP and the Log File protocol, see Configuring FTP and the Log File Protocol.
• If you are using Syslog, see Configuring Syslog in Blue Coat.
Configuring FTP andthe Log File Protocol
This section includes the following topics:
• Configuring the Blue Coat FTP Client
• Configuring a Log Source in STRM
Configuring the Blue Coat FTP Client
To configure the Blue Coat upload client for FTP:
Step 1 Select Configuration > Access Logging > Logs > Upload Client.
Step 2 From the Log list box, select the log containing your custom format.
Step 3 From the Client type list box, select FTP Client.
Step 4 Click Settings.
Configuring DSMs
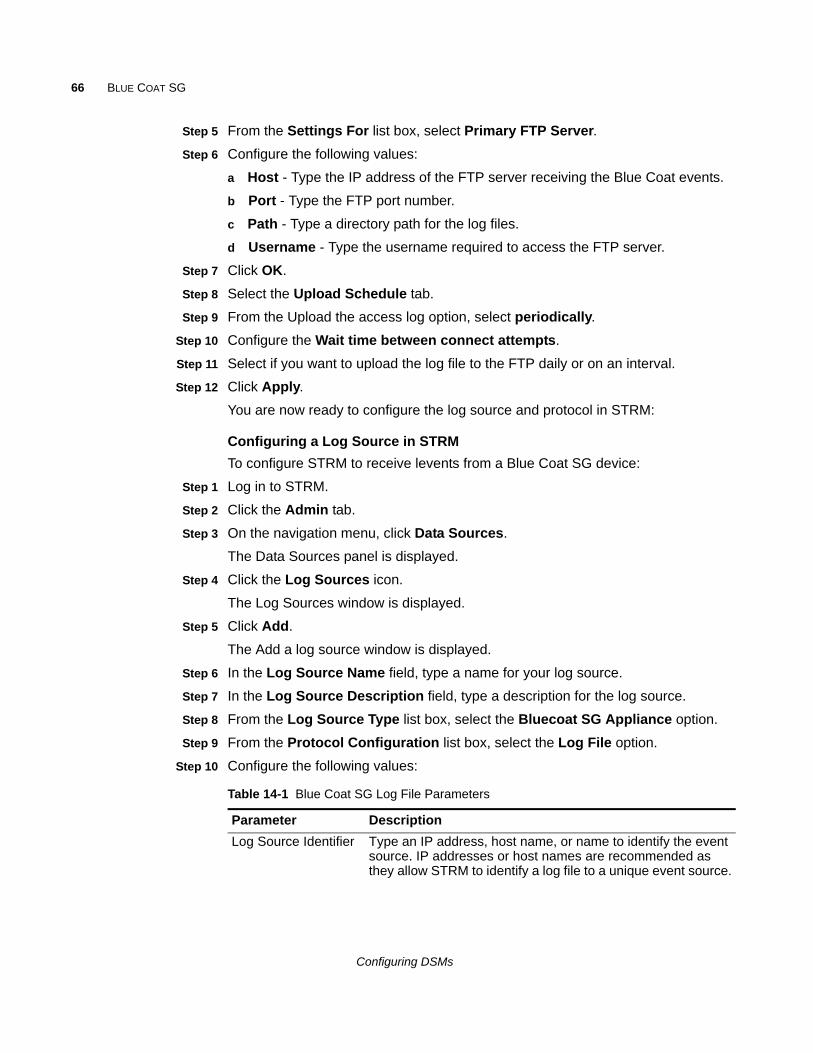
66 BLUE COAT SG
Step 5 From the Settings For list box, select Primary FTP Server.
Step 6 Configure the following values:
a Host - Type the IP address of the FTP server receiving the Blue Coat events.
b Port - Type the FTP port number.
c Path - Type a directory path for the log files.
d Username - Type the username required to access the FTP server.
Step 7 Click OK.
Step 8 Select the Upload Schedule tab.
Step 9 From the Upload the access log option, select periodically.
Step 10 Configure the Wait time between connect attempts.
Step 11 Select if you want to upload the log file to the FTP daily or on an interval.
Step 12 Click Apply.
You are now ready to configure the log source and protocol in STRM:
Configuring a Log Source in STRM
To configure STRM to receive levents from a Blue Coat SG device:
Step 1 Log in to STRM.
Step 2 Click the Admin tab.
Step 3 On the navigation menu, click Data Sources.
The Data Sources panel is displayed.
Step 4 Click the Log Sources icon.
The Log Sources window is displayed.
Step 5 Click Add.
The Add a log source window is displayed.
Step 6 In the Log Source Name field, type a name for your log source.
Step 7 In the Log Source Description field, type a description for the log source.
Step 8 From the Log Source Type list box, select the Bluecoat SG Appliance option.
Step 9 From the Protocol Configuration list box, select the Log File option.
Step 10 Configure the following values:
Table 14-1 Blue Coat SG Log File Parameters
Parameter Description
Log Source Identifier Type an IP address, host name, or name to identify the event source. IP addresses or host names are recommended as they allow STRM to identify a log file to a unique event source.
Configuring DSMs
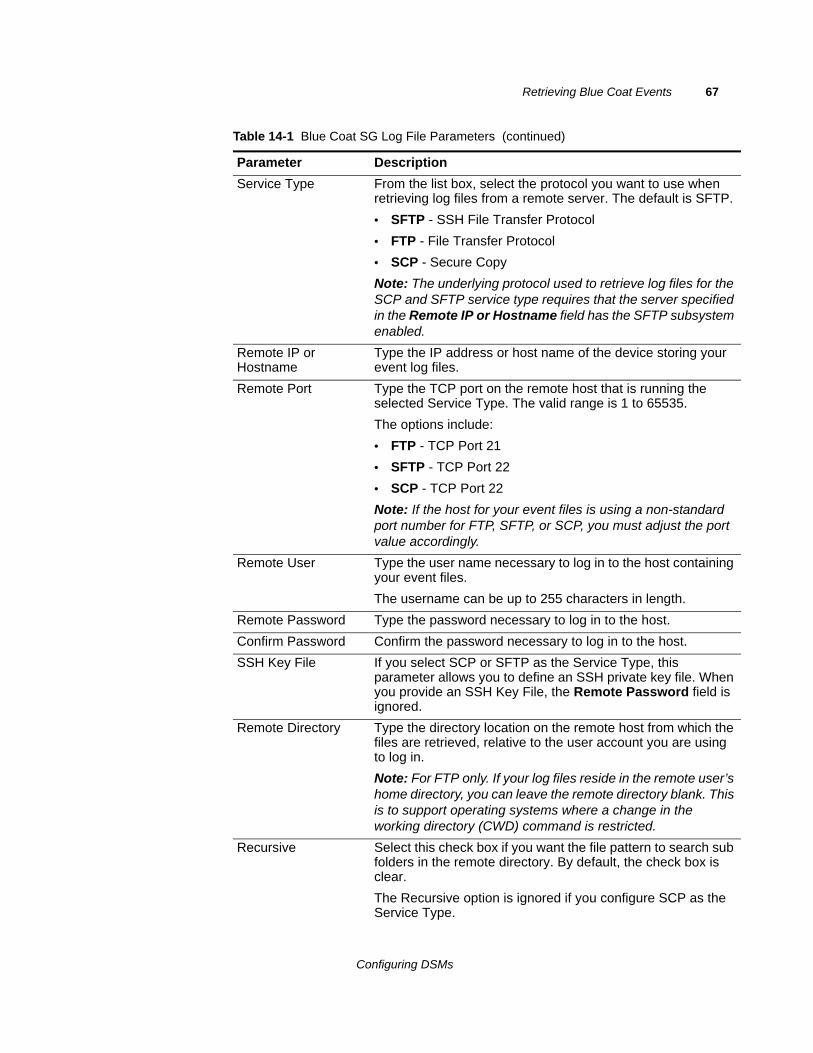
Retrieving Blue Coat Events 67
Service Type From the list box, select the protocol you want to use when retrieving log files from a remote server. The default is SFTP.
• SFTP - SSH File Transfer Protocol
• FTP - File Transfer Protocol
• SCP - Secure Copy
Note: The underlying protocol used to retrieve log files for the SCP and SFTP service type requires that the server specified in the Remote IP or Hostname field has the SFTP subsystem enabled.
Remote IP or Hostname
Type the IP address or host name of the device storing your event log files.
Remote Port Type the TCP port on the remote host that is running the selected Service Type. The valid range is 1 to 65535.
The options include:
• FTP - TCP Port 21
• SFTP - TCP Port 22
• SCP - TCP Port 22
Note: If the host for your event files is using a non-standard port number for FTP, SFTP, or SCP, you must adjust the port value accordingly.
Remote User Type the user name necessary to log in to the host containing your event files.
The username can be up to 255 characters in length.
Remote Password Type the password necessary to log in to the host.
Confirm Password Confirm the password necessary to log in to the host.
SSH Key File If you select SCP or SFTP as the Service Type, this parameter allows you to define an SSH private key file. When you provide an SSH Key File, the Remote Password field is ignored.
Remote Directory Type the directory location on the remote host from which the files are retrieved, relative to the user account you are using to log in.
Note: For FTP only. If your log files reside in the remote user’s home directory, you can leave the remote directory blank. This is to support operating systems where a change in the working directory (CWD) command is restricted.
Recursive Select this check box if you want the file pattern to search sub folders in the remote directory. By default, the check box is clear.
The Recursive option is ignored if you configure SCP as the Service Type.
Table 14-1 Blue Coat SG Log File Parameters (continued)
Parameter Description
Configuring DSMs
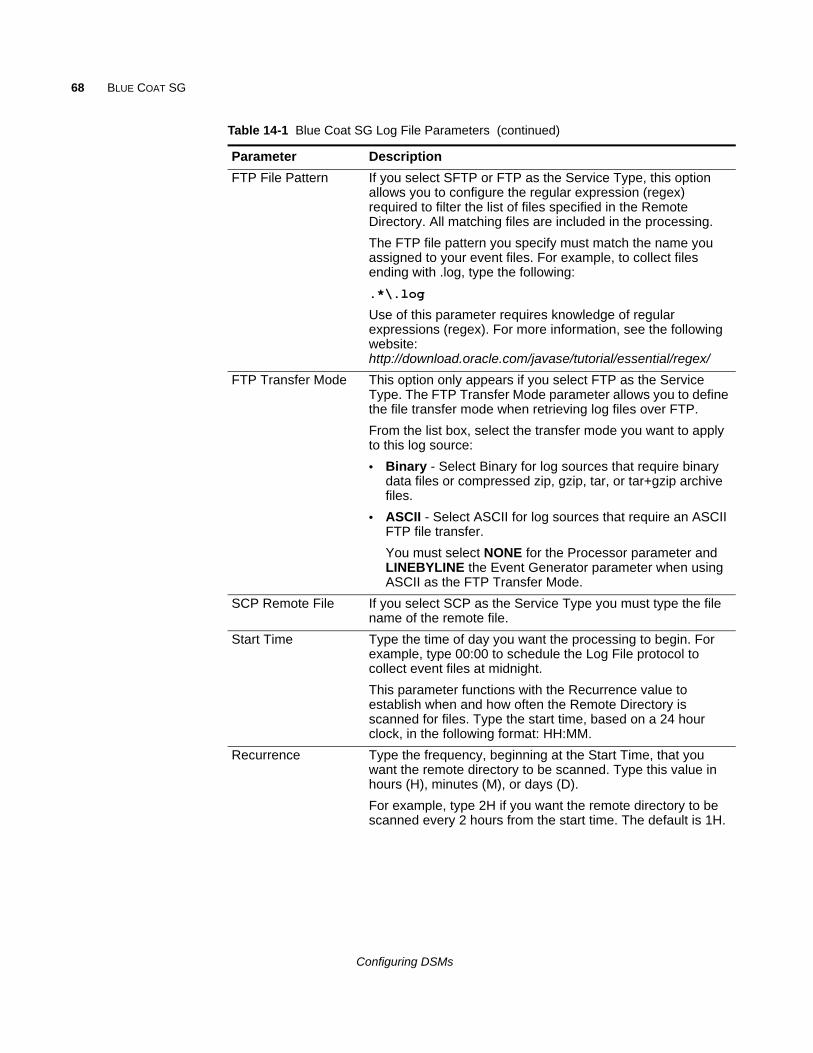
68 BLUE COAT SG
FTP File Pattern If you select SFTP or FTP as the Service Type, this option allows you to configure the regular expression (regex) required to filter the list of files specified in the Remote Directory. All matching files are included in the processing.
The FTP file pattern you specify must match the name you assigned to your event files. For example, to collect files ending with .log, type the following:
.*\.log
Use of this parameter requires knowledge of regular expressions (regex). For more information, see the following website: http://download.oracle.com/javase/tutorial/essential/regex/
FTP Transfer Mode This option only appears if you select FTP as the Service Type. The FTP Transfer Mode parameter allows you to define the file transfer mode when retrieving log files over FTP.
From the list box, select the transfer mode you want to apply to this log source:
• Binary - Select Binary for log sources that require binary data files or compressed zip, gzip, tar, or tar+gzip archive files.
• ASCII - Select ASCII for log sources that require an ASCII FTP file transfer.
You must select NONE for the Processor parameter and LINEBYLINE the Event Generator parameter when using ASCII as the FTP Transfer Mode.
SCP Remote File If you select SCP as the Service Type you must type the file name of the remote file.
Start Time Type the time of day you want the processing to begin. For example, type 00:00 to schedule the Log File protocol to collect event files at midnight.
This parameter functions with the Recurrence value to establish when and how often the Remote Directory is scanned for files. Type the start time, based on a 24 hour clock, in the following format: HH:MM.
Recurrence Type the frequency, beginning at the Start Time, that you want the remote directory to be scanned. Type this value in hours (H), minutes (M), or days (D).
For example, type 2H if you want the remote directory to be scanned every 2 hours from the start time. The default is 1H.
Table 14-1 Blue Coat SG Log File Parameters (continued)
Parameter Description
Configuring DSMs
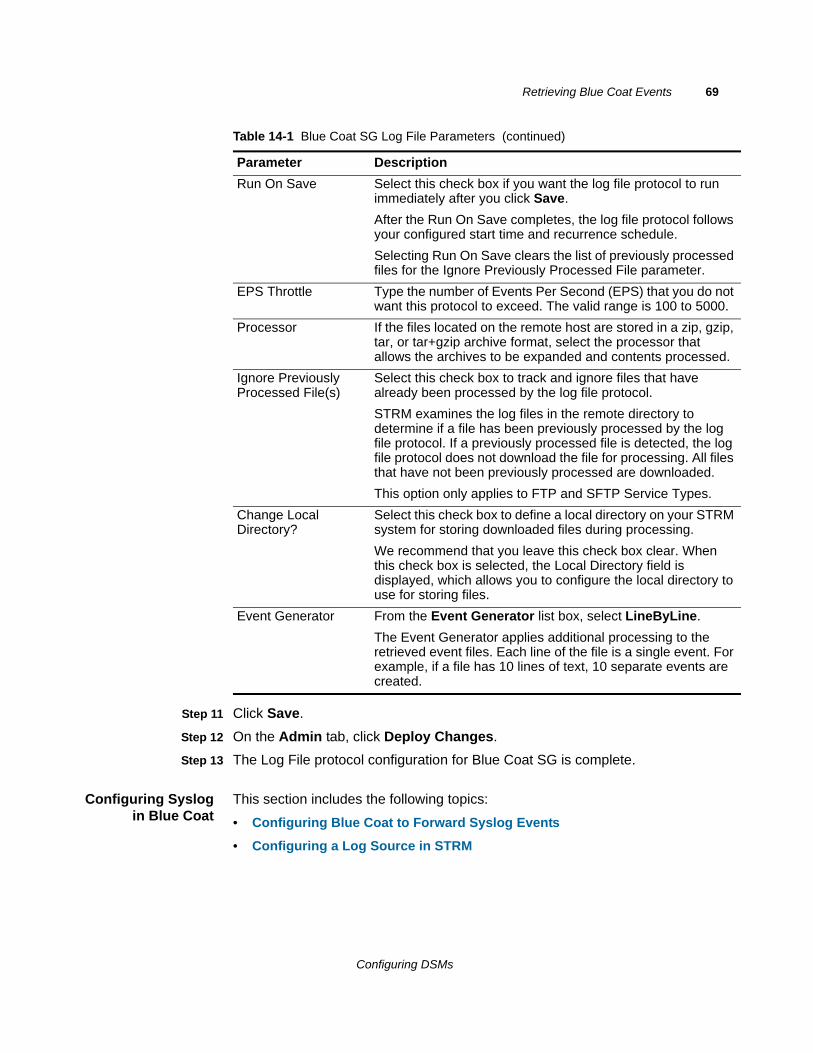
Retrieving Blue Coat Events 69
Step 11 Click Save.
Step 12 On the Admin tab, click Deploy Changes.
Step 13 The Log File protocol configuration for Blue Coat SG is complete.
Configuring Syslogin Blue Coat
This section includes the following topics:
• Configuring Blue Coat to Forward Syslog Events
• Configuring a Log Source in STRM
Run On Save Select this check box if you want the log file protocol to run immediately after you click Save.
After the Run On Save completes, the log file protocol follows your configured start time and recurrence schedule.
Selecting Run On Save clears the list of previously processed files for the Ignore Previously Processed File parameter.
EPS Throttle Type the number of Events Per Second (EPS) that you do not want this protocol to exceed. The valid range is 100 to 5000.
Processor If the files located on the remote host are stored in a zip, gzip, tar, or tar+gzip archive format, select the processor that allows the archives to be expanded and contents processed.
Ignore Previously Processed File(s)
Select this check box to track and ignore files that have already been processed by the log file protocol.
STRM examines the log files in the remote directory to determine if a file has been previously processed by the log file protocol. If a previously processed file is detected, the log file protocol does not download the file for processing. All files that have not been previously processed are downloaded.
This option only applies to FTP and SFTP Service Types.
Change Local Directory?
Select this check box to define a local directory on your STRM system for storing downloaded files during processing.
We recommend that you leave this check box clear. When this check box is selected, the Local Directory field is displayed, which allows you to configure the local directory to use for storing files.
Event Generator From the Event Generator list box, select LineByLine.
The Event Generator applies additional processing to the retrieved event files. Each line of the file is a single event. For example, if a file has 10 lines of text, 10 separate events are created.
Table 14-1 Blue Coat SG Log File Parameters (continued)
Parameter Description
Configuring DSMs
70 BLUE COAT SG
CAUTIONIf your Blue Coat SG appliance is reporting events using syslog (rather than a file transfer protocol) and the destination syslog server becomes unavailable, it is possible that other syslog destinations can stop receiving data until all syslog destinations are again available. This creates the potential for some syslog data to not be sent at all. If you are sending to multiple syslog destinations, a disruption in availability in one syslog destination might interrupt the stream of events to other syslog destinations from your Blue Coat SG appliance.
Configuring Blue Coat to Forward Syslog Events
To configure the Blue Coat upload client for syslog:
Step 1 Select Configuration > Access Logging > Logs > Upload Client.
Step 2 From the Log list box, select the log containing your custom format.
Step 3 From the Client type drop-down list bow, select Custom Client.
Step 4 Click Settings.
Step 5 From the Settings For list box, select Primary Custom Server.
Step 6 Configure the following values:
a Host - Type the IP address for your STRM.
b Port - Type 514 as the syslog port for STRM.
Step 7 Click OK.
Step 8 Select the Upload Schedule tab.
Step 9 From the Upload the access log, select continuously.
Step 10 Click Apply.
You are now ready to configure a log source for Blue Coat SG events.
Configuring a Log Source in STRM
STRM does not automatically discover or create log sources for syslog events from Barracuda Web Application Firewall appliances. To integrate Barracuda Web Application Firewall with STRM, you must manually create a log source to receive Barracuda Web Application Firewall events.
To configure a log source:
Step 1 Log in to STRM.
Step 2 Click the Admin tab.
Step 3 On the navigation menu, click Data Sources.
The Data Sources panel is displayed.
Step 4 Click the Log Sources icon.
The Log Sources window is displayed.
Configuring DSMs
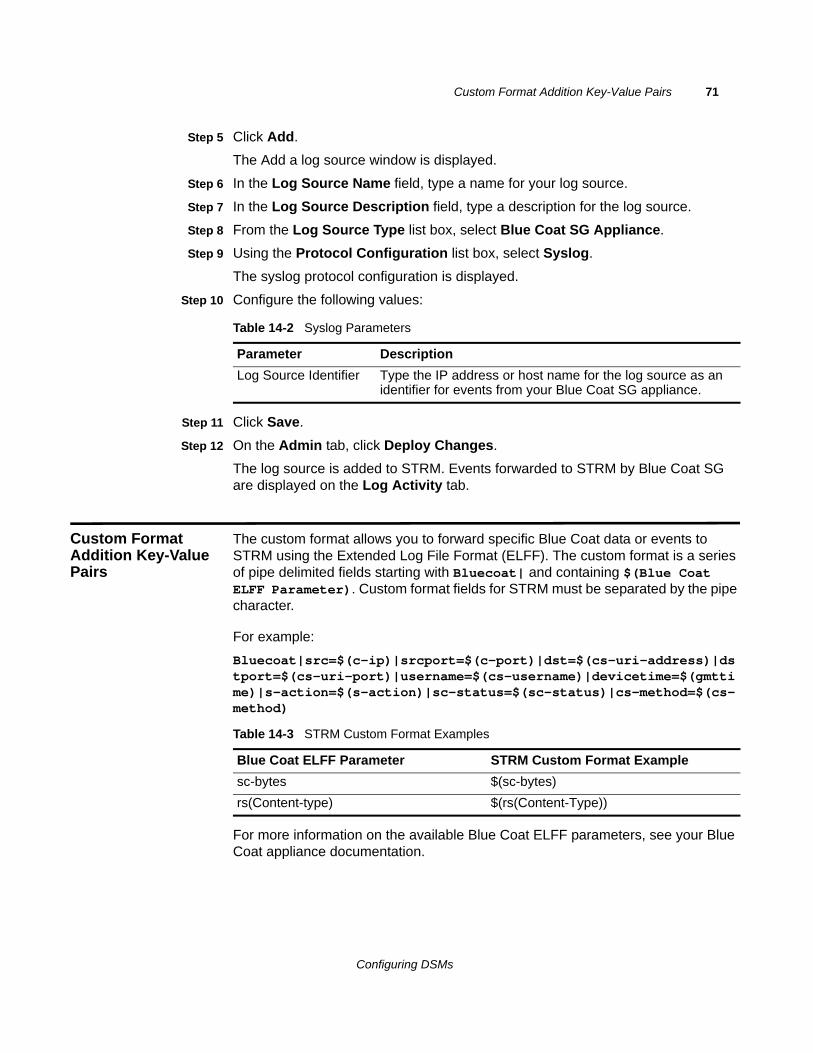
Custom Format Addition Key-Value Pairs 71
Step 5 Click Add.
The Add a log source window is displayed.
Step 6 In the Log Source Name field, type a name for your log source.
Step 7 In the Log Source Description field, type a description for the log source.
Step 8 From the Log Source Type list box, select Blue Coat SG Appliance.
Step 9 Using the Protocol Configuration list box, select Syslog.
The syslog protocol configuration is displayed.
Step 10 Configure the following values:
Step 11 Click Save.
Step 12 On the Admin tab, click Deploy Changes.
The log source is added to STRM. Events forwarded to STRM by Blue Coat SG are displayed on the Log Activity tab.
Custom Format Addition Key-Value Pairs
The custom format allows you to forward specific Blue Coat data or events to STRM using the Extended Log File Format (ELFF). The custom format is a series of pipe delimited fields starting with Bluecoat| and containing $(Blue Coat ELFF Parameter). Custom format fields for STRM must be separated by the pipe character.
For example:
Bluecoat|src=$(c-ip)|srcport=$(c-port)|dst=$(cs-uri-address)|dstport=$(cs-uri-port)|username=$(cs-username)|devicetime=$(gmttime)|s-action=$(s-action)|sc-status=$(sc-status)|cs-method=$(cs-method)
For more information on the available Blue Coat ELFF parameters, see your Blue Coat appliance documentation.
Table 14-2 Syslog Parameters
Parameter Description
Log Source Identifier Type the IP address or host name for the log source as an identifier for events from your Blue Coat SG appliance.
Table 14-3 STRM Custom Format Examples
Blue Coat ELFF Parameter STRM Custom Format Example
sc-bytes $(sc-bytes)
rs(Content-type) $(rs(Content-Type))
Configuring DSMs

15
BRIDGEWATERThe Bridgewater Systems DSM for STRM accepts events using syslog. STRM records all relevant events. Before configuring a Bridgewater Systems device in STRM, you must configure your device to forward syslog events.
This section includes the following topics:
• Configuring Syslog for your Bridgewater Systems Device
• Configuring a Log Source in STRM
Configuring Syslogfor your Bridgewater
Systems Device
To configure your Bridgewater Systems device to send syslog events to STRM:
Step 1 Log in to your Bridgewater Systems device command-line interface (CLI).
Step 2 To log operational messages to the RADIUS and Diameter servers, open the following file:
/etc/syslog.conf
Step 3 To log all operational messages, uncomment the following line:
local1.info /WideSpan/logs/oplog
Step 4 To log error messages only, change the local1.info /WideSpan/logs/oplog line to the following:
local1.err /WideSpan/logs/oplog
NOTERADIUS and Diameter system messages are stored in the /var/adm/messages file.
Step 5 Add the following line:
local1.*@<IP address>
Where <IP address> is the IP address your STRM Console.
Configuring DSMs
74 BRIDGEWATER
Step 6 The RADIUS and Diameter server system messages are stored in the /var/adm/messages file. Add the following line for the system messages:
<facility>.*@<IP address>
Where:
<facility> is the facility used for logging to the /var/adm/messages file.
<IP address> is the IP address of your STRM Console.
Step 7 Save and exit the file.
Step 8 Send a hang-up signal to the syslog daemon to make sure all changes are enforced:
kill -HUP `cat /var/run/syslog.pid`
The configuration is complete. The log source is added to STRM as Bridgewater Systems device events are automatically discovered. Events forwarded to STRM by your Bridgewater Systems device are displayed on the Log Activity tab.
Configuring a LogSource in STRM
STRM automatically discovers and creates a log source for syslog events from a Bridgewater Systems device. However, you can manually create a log source for STRM to receive syslog events. The following configuration steps are optional.
To manually configure a log source for your Bridgewater Systems device:
Step 1 Log in to STRM.
Step 2 Click the Admin tab.
Step 3 On the navigation menu, click Data Sources.
The Data Sources panel is displayed.
Step 4 Click the Log Sources icon.
The Log Sources window is displayed.
Step 5 Click Add.
The Add a log source window is displayed.
Step 6 In the Log Source Name field, type a name for your log source.
Step 7 In the Log Source Description field, type a description for the log source.
Step 8 From the Log Source Type list box, select Bridgewater Systems AAA Service Controller.
Step 9 Using the Protocol Configuration list box, select Syslog.
The syslog protocol configuration is displayed.
Configuring DSMs
75
Step 10 Configure the following values:
Step 11 Click Save.
Step 12 On the Admin tab, click Deploy Changes.
The configuration is complete.
Table 15-1 Syslog Parameters
Parameter Description
Log Source Identifier Type the IP address or host name for the log source as an identifier for events from your Bridgewater Systems device.
Configuring DSMs

16
CA TECHNOLOGIESThis section provides information on the following DSMs:
• CA ACF2
• CA SiteMinder
• CA Top Secret
CA ACF2 STRM includes two options for integrating CA Access Control Facility (ACF2) events:
• Integrating CA ACF2 with STRM Using IBM Security zSecure
• Integrating CA ACF2 with STRM Using Audit Scripts
Integrating CA ACF2with STRM Using IBM
Security zSecure
The CA ACF2 DSM allows you to integrate LEEF events from an ACF2 image on an IBM z/OS mainframe using IBM Security zSecure. Using a zSecure process, events from the System Management Facilities (SMF) are recorded to an event file in the Log Enhanced Event format (LEEF). STRM retrieves the LEEF event log files using the log file protocol and processes the events. You can schedule STRM to retrieve events on a polling interval, which allows STRM to retrieve the events on the schedule you have defined.
Configuring DSMs
78 CA TECHNOLOGIES
To integrate CA ACF2 events:
1 Confirm your installation meets any prerequisite installation requirements. For more information, see Before You Begin.
2 Configure your CA ACF2 z/OS image to write events in LEEF format. For more information, see the IBM Security zSecure Suite: CARLa-Driven Components Installation and Deployment Guide.
3 Create a log source in STRM for CA ACF2 to retrieve your LEEF formatted event logs. For more information, see Creating a Log Source in STRM.
4 Optional. Create a custom event property for CA ACF2 in STRM. For more information, see the STRM Custom Event Properties for IBM z/OS technical note.
Before You Begin
Before you can configure the data collection process, you must complete the basic zSecure installation process. After installing the software, you must also perform the post-installation activities to create and modify the configuration.
The following prerequisites are required:
• You must ensure parmlib member IFAPRDxx is not disabled for IBM Security zSecure Audit on your z/OS image.
• The SCKRLOAD library must be APF-authorized.
• You must configure a process to periodically refresh your CKFREEZE and UNLOAD data sets.
• You must configure an SFTP, FTP, or SCP server on your z/OS image for STRM to download your LEEF event files.
• You must allow SFTP, FTP, or SCP traffic on firewalls located between STRM and your z/OS image.
For instructions on installing and configuring zSecure, see the IBM Security zSecure Suite: CARLa-Driven Components Installation and Deployment Guide.
Creating a Log Source in STRM
The Log File protocol allows STRM to retrieve archived log files from a remote host. These files are transferred, one at a time, to STRM for processing. The log file protocol can manage plain text event logs, compressed files, or archives. Archives must contain plain-text files that can be processed one line at a time. Multi-line event logs are not supported by the log file protocol. IBM z/OS with zSecure writes log files to a specified directory as gzip archives. STRM extracts the archive and processes the events, which are written as one event per line in the file.
To retrieve these events, you must create a log source using the Log File protocol. STRM requires credentials to log in to the system hosting your LEEF formatted event files and a polling interval.
Configuring DSMs
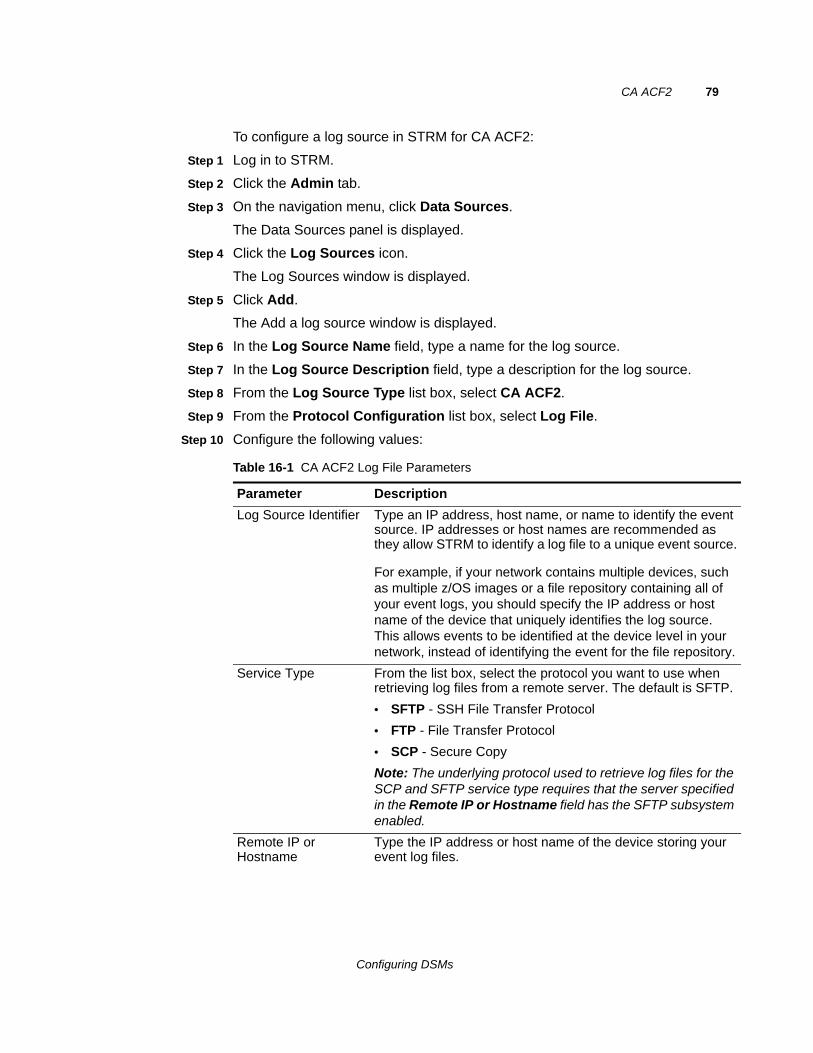
CA ACF2 79
To configure a log source in STRM for CA ACF2:
Step 1 Log in to STRM.
Step 2 Click the Admin tab.
Step 3 On the navigation menu, click Data Sources.
The Data Sources panel is displayed.
Step 4 Click the Log Sources icon.
The Log Sources window is displayed.
Step 5 Click Add.
The Add a log source window is displayed.
Step 6 In the Log Source Name field, type a name for the log source.
Step 7 In the Log Source Description field, type a description for the log source.
Step 8 From the Log Source Type list box, select CA ACF2.
Step 9 From the Protocol Configuration list box, select Log File.
Step 10 Configure the following values:
Table 16-1 CA ACF2 Log File Parameters
Parameter Description
Log Source Identifier Type an IP address, host name, or name to identify the event source. IP addresses or host names are recommended as they allow STRM to identify a log file to a unique event source.
For example, if your network contains multiple devices, such as multiple z/OS images or a file repository containing all of your event logs, you should specify the IP address or host name of the device that uniquely identifies the log source. This allows events to be identified at the device level in your network, instead of identifying the event for the file repository.
Service Type From the list box, select the protocol you want to use when retrieving log files from a remote server. The default is SFTP.
• SFTP - SSH File Transfer Protocol
• FTP - File Transfer Protocol
• SCP - Secure Copy
Note: The underlying protocol used to retrieve log files for the SCP and SFTP service type requires that the server specified in the Remote IP or Hostname field has the SFTP subsystem enabled.
Remote IP or Hostname
Type the IP address or host name of the device storing your event log files.
Configuring DSMs

80 CA TECHNOLOGIES
Remote Port Type the TCP port on the remote host that is running the selected Service Type. The valid range is 1 to 65535.
The options include:
• FTP - TCP Port 21
• SFTP - TCP Port 22
• SCP - TCP Port 22
Note: If the host for your event files is using a non-standard port number for FTP, SFTP, or SCP, you must adjust the port value accordingly.
Remote User Type the user name necessary to log in to the host containing your event files.
The username can be up to 255 characters in length.
Remote Password Type the password necessary to log in to the host.
Confirm Password Confirm the password necessary to log in to the host.
SSH Key File If you select SCP or SFTP as the Service Type, this parameter allows you to define an SSH private key file. When you provide an SSH Key File, the Remote Password field is ignored.
Remote Directory Type the directory location on the remote host from which the files are retrieved, relative to the user account you are using to log in.
Note: For FTP only. If your log files reside in the remote user’s home directory, you can leave the remote directory blank. This is to support operating systems where a change in the working directory (CWD) command is restricted.
Recursive Select this check box if you want the file pattern to search sub folders in the remote directory. By default, the check box is clear.
The Recursive option is ignored if you configure SCP as the Service Type.
Table 16-1 CA ACF2 Log File Parameters (continued)
Parameter Description
Configuring DSMs
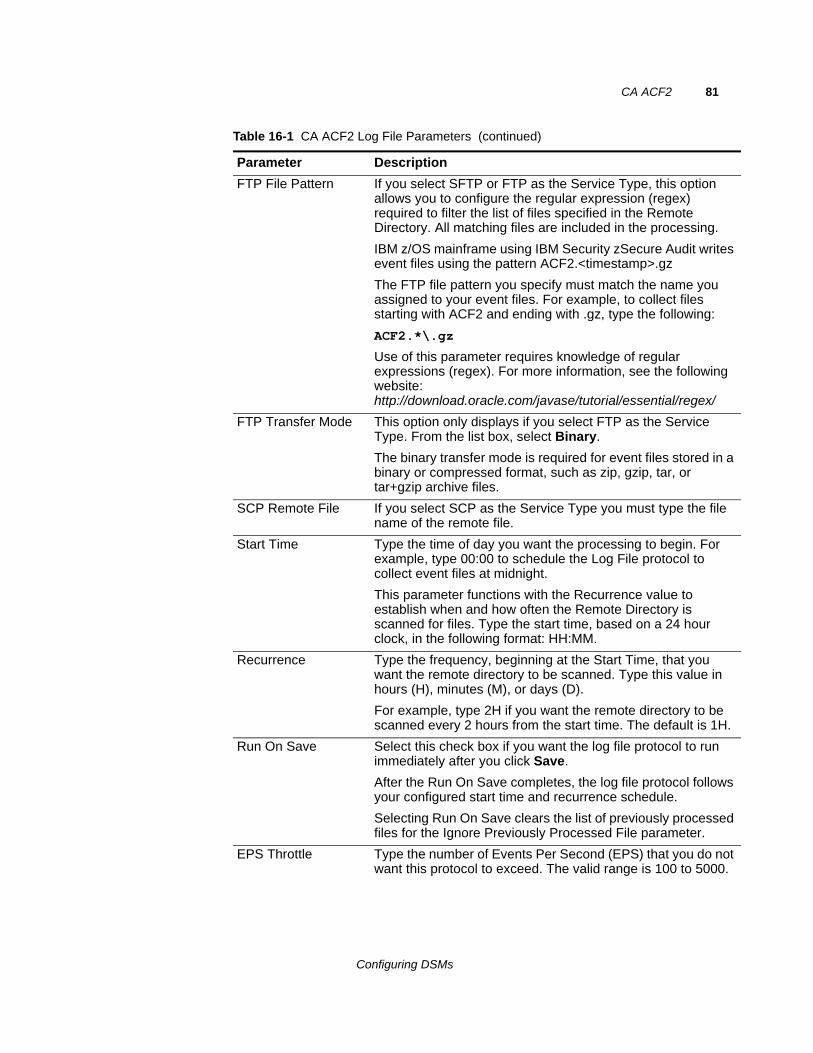
CA ACF2 81
FTP File Pattern If you select SFTP or FTP as the Service Type, this option allows you to configure the regular expression (regex) required to filter the list of files specified in the Remote Directory. All matching files are included in the processing.
IBM z/OS mainframe using IBM Security zSecure Audit writes event files using the pattern ACF2.<timestamp>.gz
The FTP file pattern you specify must match the name you assigned to your event files. For example, to collect files starting with ACF2 and ending with .gz, type the following:
ACF2.*\.gz
Use of this parameter requires knowledge of regular expressions (regex). For more information, see the following website: http://download.oracle.com/javase/tutorial/essential/regex/
FTP Transfer Mode This option only displays if you select FTP as the Service Type. From the list box, select Binary.
The binary transfer mode is required for event files stored in a binary or compressed format, such as zip, gzip, tar, or tar+gzip archive files.
SCP Remote File If you select SCP as the Service Type you must type the file name of the remote file.
Start Time Type the time of day you want the processing to begin. For example, type 00:00 to schedule the Log File protocol to collect event files at midnight.
This parameter functions with the Recurrence value to establish when and how often the Remote Directory is scanned for files. Type the start time, based on a 24 hour clock, in the following format: HH:MM.
Recurrence Type the frequency, beginning at the Start Time, that you want the remote directory to be scanned. Type this value in hours (H), minutes (M), or days (D).
For example, type 2H if you want the remote directory to be scanned every 2 hours from the start time. The default is 1H.
Run On Save Select this check box if you want the log file protocol to run immediately after you click Save.
After the Run On Save completes, the log file protocol follows your configured start time and recurrence schedule.
Selecting Run On Save clears the list of previously processed files for the Ignore Previously Processed File parameter.
EPS Throttle Type the number of Events Per Second (EPS) that you do not want this protocol to exceed. The valid range is 100 to 5000.
Table 16-1 CA ACF2 Log File Parameters (continued)
Parameter Description
Configuring DSMs
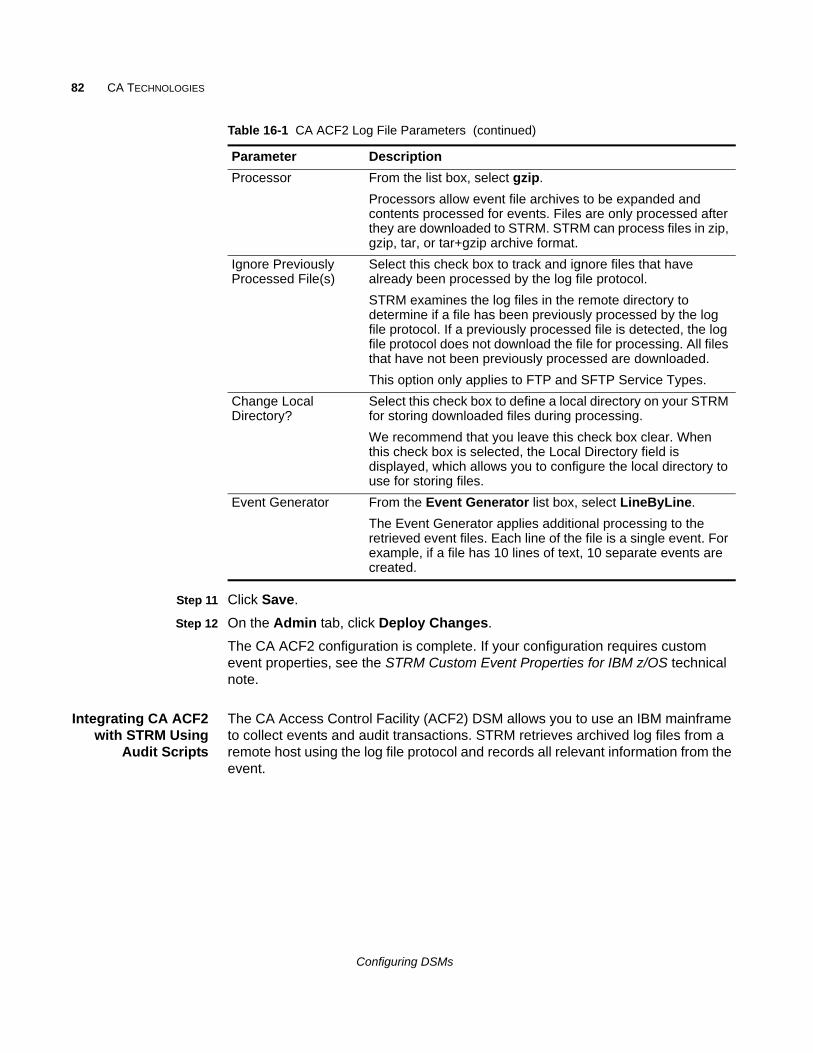
82 CA TECHNOLOGIES
Step 11 Click Save.
Step 12 On the Admin tab, click Deploy Changes.
The CA ACF2 configuration is complete. If your configuration requires custom event properties, see the STRM Custom Event Properties for IBM z/OS technical note.
Integrating CA ACF2with STRM Using
Audit Scripts
The CA Access Control Facility (ACF2) DSM allows you to use an IBM mainframe to collect events and audit transactions. STRM retrieves archived log files from a remote host using the log file protocol and records all relevant information from the event.
Processor From the list box, select gzip.
Processors allow event file archives to be expanded and contents processed for events. Files are only processed after they are downloaded to STRM. STRM can process files in zip, gzip, tar, or tar+gzip archive format.
Ignore Previously Processed File(s)
Select this check box to track and ignore files that have already been processed by the log file protocol.
STRM examines the log files in the remote directory to determine if a file has been previously processed by the log file protocol. If a previously processed file is detected, the log file protocol does not download the file for processing. All files that have not been previously processed are downloaded.
This option only applies to FTP and SFTP Service Types.
Change Local Directory?
Select this check box to define a local directory on your STRM for storing downloaded files during processing.
We recommend that you leave this check box clear. When this check box is selected, the Local Directory field is displayed, which allows you to configure the local directory to use for storing files.
Event Generator From the Event Generator list box, select LineByLine.
The Event Generator applies additional processing to the retrieved event files. Each line of the file is a single event. For example, if a file has 10 lines of text, 10 separate events are created.
Table 16-1 CA ACF2 Log File Parameters (continued)
Parameter Description
Configuring DSMs
CA ACF2 83
To integrate CA ACF2 events into STRM:
1 The IBM mainframe records all security events as Service Management Framework (SMF) records in a live repository.
2 The CA ACF2 data is extracted from the live repository using the SMF dump utility. The SMF file contains all of the events and fields from the previous day in raw SMF format.
3 The QexACF2.load.trs program pulls data from the SMF formatted file. The QexACF2.load.trs program only pulls the relevant events and fields for STRM and writes that information in a condensed format for compatibility. The information is saved in a location accessible by STRM.
4 STRM uses the log file protocol source to retrieve the output file information on a scheduled basis. STRM then imports and processes this file.
This document includes:
• Configuring CA Top Secret to Integrate with STRM
• Creating a Log Source in STRM
Configuring CA ACF2 to Integrate with STRM
To integrate CA ACF2 with STRM:
Step 1 From the Juniper customer support website, download the following compressed file:
qexacf2_bundled.tar.gz
Step 2 On a Linux-based operating system, extract the file:
tar -zxvf qexacf2_bundled.tar.gz
The following files are contained in the archive:
QexACF2.JCL.txt - Job Control Language file
QexACF2.load.trs - Compressed program library (requires IBM TRSMAIN)
trsmain sample JCL.txt - Job Control Language for TRSMAIN to decompress the .trs file
Step 3 Load the files onto the IBM mainframe using the following methods:
a Upload the sample QexACF2_trsmain_JCL.txt and QexACF2.JCL.txt files using the TEXT protocol.
b Upload the QexACF2.load.trs file using a BINARY mode transfer and append to a pre-allocated data set. The QexACF2.load.trs file is a tersed file containing the executable (the mainframe program QexACF2). When you upload the .trs file from a workstation, pre-allocate a file on the mainframe with the following DCB attributes: DSORG=PS, RECFM=FB, LRECL=1024, BLKSIZE=6144. The file transfer type must be binary mode and not text.
Configuring DSMs
84 CA TECHNOLOGIES
NOTEQexACF2 is a small C mainframe program that reads the output of the TSSUTIL (EARLOUT data) line by line. QexACF2 adds a header to each record containing event information, for example, record descriptor, the date, and time. The program places each field into the output record, suppresses trailing blank characters, and delimits each field with the pipe character. This output file is formatted for STRM and the blank suppression reduces network traffic to STRM. This program does not consume CPU or I/O disk resources.
Step 4 Customize the trsmain sample_JCL.txt file according to your installation-specific parameters.
For example, jobcard, data set naming conventions, output destinations, retention periods, and space requirements.
The trsmain sample_JCL.txt file uses the IBM utility TRSMAIN to extract the program stored in the QexACF2.load.trs file.
An example of the QexACF2_trsmain_JCL.txt file includes:
//TRSMAIN JOB (yourvalidjobcard),Q1labs,// MSGCLASS=V//DEL EXEC PGM=IEFBR14 //D1 DD DISP=(MOD,DELETE),DSN=<yourhlq>.QEXACF2.LOAD.TRS // UNIT=SYSDA, // SPACE=(CYL,(10,10)) //TRSMAIN EXEC PGM=TRSMAIN,PARM='UNPACK' //SYSPRINT DD SYSOUT=*,DCB=(LRECL=133,BLKSIZE=12901,RECFM=FBA) //INFILE DD DISP=SHR,DSN=<yourhlq>.QEXACF2.LOAD.TRS //OUTFILE DD DISP=(NEW,CATLG,DELETE), // DSN=<yourhlq>.LOAD, // SPACE=(CYL,(10,10,5),RLSE),UNIT=SYSDA //
The .trs input file is an IBM TERSE formatted library and is extracted by running the JCL, which calls the TRSMAIN. This tersed file, when extracted, creates a PDS linklib with the QexACF2 program as a member.
Step 5 You can STEPLIB to this library or choose to move the program to one of the LINKLIBs that are in LINKLST. The program does not require authorization.
Step 6 After uploading, copy the program to an existing link listed library or add a STEPLIB DD statement with the correct dataset name of the library that will contain the program.
Step 7 The QexACF2_jcl.txt file is a text file containing a sample JCL. You must configure the job card to meet your configuration.
The QexACF2_jcl.txt sample file includes:
//QEXACF2 JOB (T,JXPO,JKSD0093),DEV,NOTIFY=Q1JACK,// MSGCLASS=P,// REGION=0M//*//*QEXACF2 JCL VERSION 1.0 OCTOBER, 2010
Configuring DSMs
CA ACF2 85
//*//************************************************************//* Change below dataset names to sites specific datasets names*
//************************************************************//SET1 SET SMFIN='MVS1.SMF.RECORDS(0)',// QEXOUT='Q1JACK.QEXACF2.OUTPUT',// SMFOUT='Q1JACK.ACF2.DATA'//************************************************************//* Delete old datasets *//************************************************************//DEL EXEC PGM=IEFBR14//DD1 DD DISP=(MOD,DELETE),DSN=&SMFOUT,// UNIT=SYSDA,// SPACE=(CYL,(10,10)),// DCB=(RECFM=FB,LRECL=80)//DD2 DD DISP=(MOD,DELETE),DSN=&QEXOUT,// UNIT=SYSDA,// SPACE=(CYL,(10,10)),// DCB=(RECFM=FB,LRECL=80)//*************************************************************//* Allocate new dataset *//*************************************************************//ALLOC EXEC PGM=IEFBR14//DD1 DD DISP=(NEW,CATLG),DSN=&QEXOUT,// SPACE=(CYL,(100,100)),// DCB=(RECFM=VB,LRECL=1028,BLKSIZE=6144)//*************************************************************//* Execute ACFRPTPP (Report Preprocessor GRO) to extract ACF2*//* SMF records *//*************************************************************//PRESCAN EXEC PGM=ACFRPTPP//SYSPRINT DD SYSOUT=*//SYSUDUMP DD SYSOUT=*//RECMAN1 DD DISP=SHR,DSN=&SMFIN//SMFFLT DD DSN=&SMFOUT,SPACE=(CYL,(100,100)),DISP=(,CATLG),// DCB=(RECFM=FB,LRECL=8192,BLKSIZE=40960),// UNIT=SYSALLDA//************************************************************//* execute QEXACF2 *//************************************************************//EXTRACT EXEC PGM=QEXACF2,DYNAMNBR=10,// TIME=1440//STEPLIB DD DISP=SHR,DSN=Q1JACK.C.LOAD//SYSTSIN DD DUMMY//SYSTSPRT DD SYSOUT=*//SYSPRINT DD SYSOUT=*//CFG DD DUMMY//ACFIN DD DISP=SHR,DSN=&SMFOUT//ACFOUT DD DISP=SHR,DSN=&QEXOUT//************************************************************
Configuring DSMs
86 CA TECHNOLOGIES
//FTP EXEC PGM=FTP,REGION=3800K//INPUT DD *<IPADDR><USER><PASSWORD>PUT '<ACFOUT>' EARL_<THEIPOFTHEMAINFRAMEDEVICE>/<ACFOUT>QUIT//OUTPUT DD SYSOUT=*//SYSPRINT DD SYSOUT=*//*
Step 8 After the output file is created, you must choose one of the following options:
a Schedule a job to a transfer the output file to an interim FTP server.
Each time the job completes, the output file is forwarded to an interim FTP server. You must configure the following parameters in the sample JCL to successfully forward the output to an interim FTP server:
For example:
//FTP EXEC PGM=FTP,REGION=3800K//INPUT DD *<IPADDR><USER><PASSWORD>PUT '<ACFOUT>' EARL_<THEIPOFTHEMAINFRAMEDEVICE>/<ACFOUT>QUIT//OUTPUT DD SYSOUT=*//SYSPRINT DD SYSOUT=*
Where:
<IPADDR> is the IP address or host name of the interim FTP server to receive the output file.
<USER> is the user name required to access the interim FTP server.
<PASSWORD> is the password required to access the interim FTP server.
<THEIPOFTHEMAINFRAMEDEVICE> is the destination of the mainframe or interim FTP server receiving the output.
For example:
PUT 'Q1JACK.QEXACF2.OUTPUT.C320' /192.168.1.101/ACF2/QEXACF2.OUTPUT.C320
<QEXOUTDSN> is the name of the output file saved to the interim FTP server.
You are now ready to create a log source in STRM. For more information, see Creating a Log Source in STRM.
b Schedule STRM to retrieve the output file from CA ACF2.
If the zOS platform is configured to serve files through FTP, SFTP, or allow SCP, then no interim FTP server is required and STRM can pull the output file directly
Configuring DSMs
CA ACF2 87
from the mainframe. The following text must be commented out using //* or deleted from the QexACF2_jcl.txt file:
//FTP EXEC PGM=FTP,REGION=3800K//INPUT DD *<IPADDR><USER><PASSWORD>PUT '<ACFOUT>' EARL_<THEIPOFTHEMAINFRAMEDEVICE>/<ACFOUT>QUIT//OUTPUT DD SYSOUT=*//SYSPRINT DD SYSOUT=*
You are now ready to configure the a log source in STRM.
Creating a Log Source in STRM
A log file protocol source allows STRM to retrieve archived log files from a remote host. The CA ACF2 DSM supports the bulk loading of log files using the log file protocol source.
When configuring your CA ACF2 DSM to use the log file protocol, make sure the hostname or IP address configured in the CA ACF2 is the same as configured in the Remote Host parameter in the Log File protocol configuration.
You are now ready to configure the log source and log file protocol in STRM:
To configure a log source in STRM for CA ACF2:
Step 1 Log in to STRM.
Step 2 Click the Admin tab.
Step 3 On the navigation menu, click Data Sources.
The Data Sources panel is displayed.
Step 4 Click the Log Sources icon.
The Log Sources window is displayed.
Step 5 Click Add.
The Add a log source window is displayed.
Step 6 In the Log Source Name field, type a name for the log source.
Step 7 In the Log Source Description field, type a description for the log source.
Step 8 From the Log Source Type list box, select CA ACF2.
Step 9 From the Protocol Configuration list box, select Log File.
Configuring DSMs
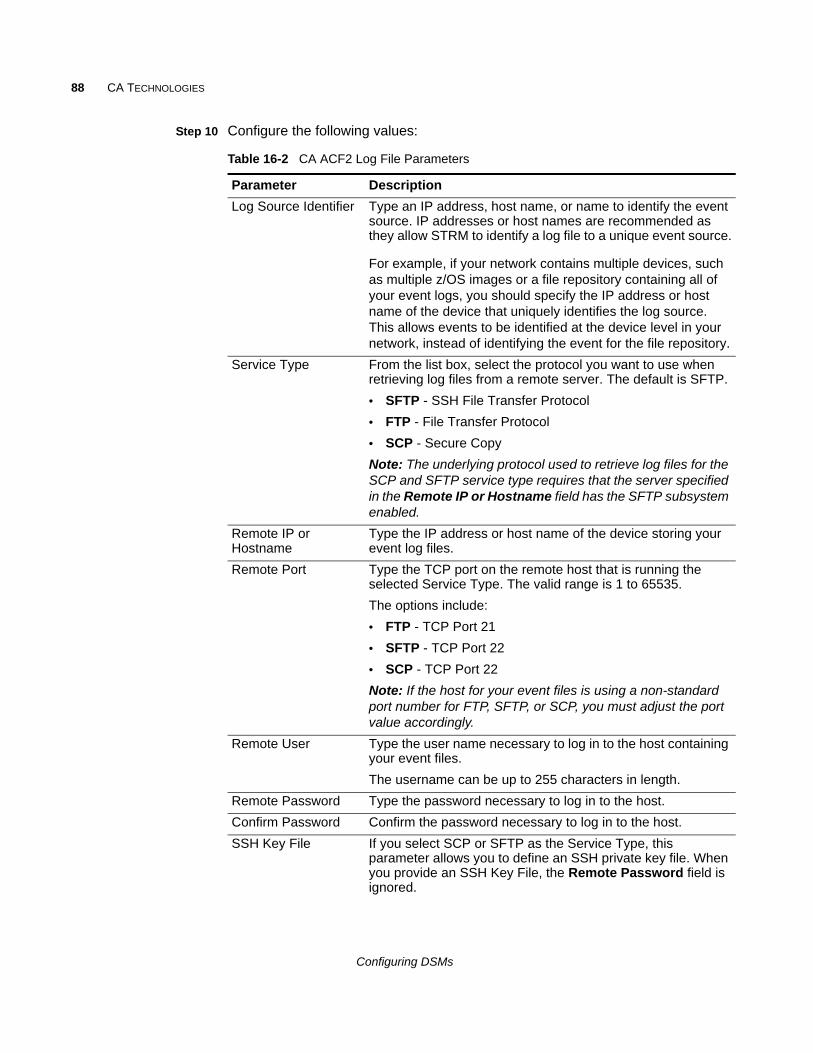
88 CA TECHNOLOGIES
Step 10 Configure the following values:
Table 16-2 CA ACF2 Log File Parameters
Parameter Description
Log Source Identifier Type an IP address, host name, or name to identify the event source. IP addresses or host names are recommended as they allow STRM to identify a log file to a unique event source.
For example, if your network contains multiple devices, such as multiple z/OS images or a file repository containing all of your event logs, you should specify the IP address or host name of the device that uniquely identifies the log source. This allows events to be identified at the device level in your network, instead of identifying the event for the file repository.
Service Type From the list box, select the protocol you want to use when retrieving log files from a remote server. The default is SFTP.
• SFTP - SSH File Transfer Protocol
• FTP - File Transfer Protocol
• SCP - Secure Copy
Note: The underlying protocol used to retrieve log files for the SCP and SFTP service type requires that the server specified in the Remote IP or Hostname field has the SFTP subsystem enabled.
Remote IP or Hostname
Type the IP address or host name of the device storing your event log files.
Remote Port Type the TCP port on the remote host that is running the selected Service Type. The valid range is 1 to 65535.
The options include:
• FTP - TCP Port 21
• SFTP - TCP Port 22
• SCP - TCP Port 22
Note: If the host for your event files is using a non-standard port number for FTP, SFTP, or SCP, you must adjust the port value accordingly.
Remote User Type the user name necessary to log in to the host containing your event files.
The username can be up to 255 characters in length.
Remote Password Type the password necessary to log in to the host.
Confirm Password Confirm the password necessary to log in to the host.
SSH Key File If you select SCP or SFTP as the Service Type, this parameter allows you to define an SSH private key file. When you provide an SSH Key File, the Remote Password field is ignored.
Configuring DSMs
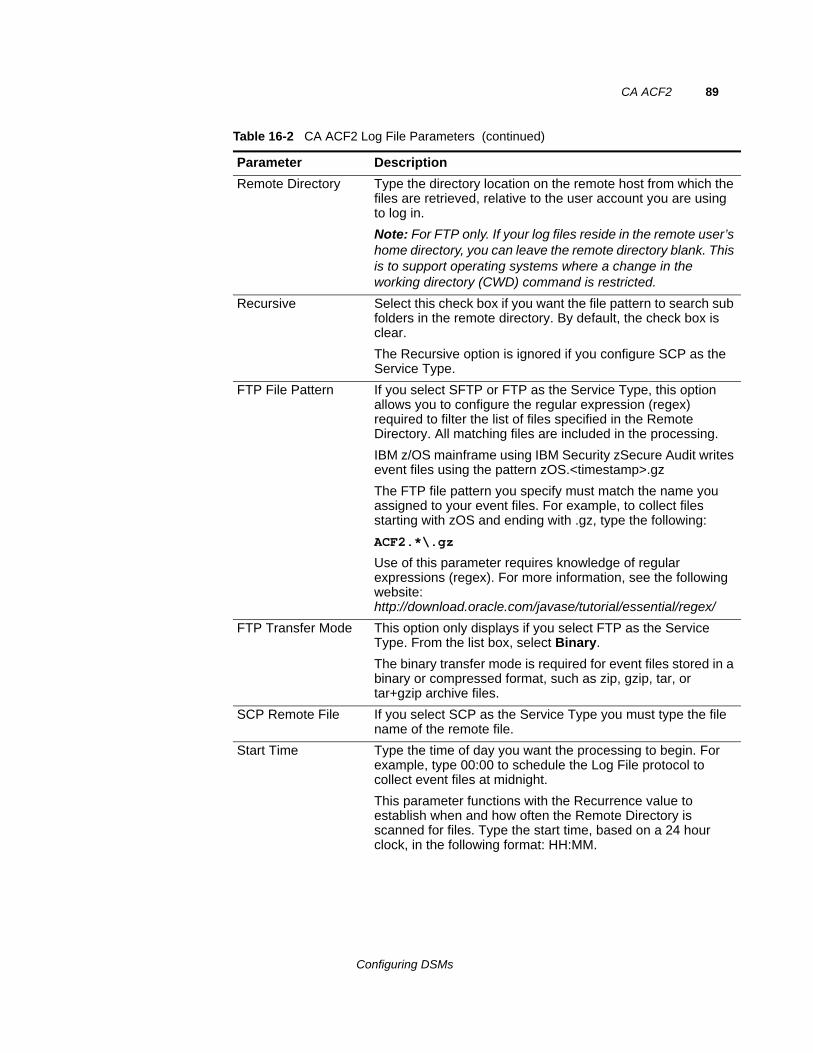
CA ACF2 89
Remote Directory Type the directory location on the remote host from which the files are retrieved, relative to the user account you are using to log in.
Note: For FTP only. If your log files reside in the remote user’s home directory, you can leave the remote directory blank. This is to support operating systems where a change in the working directory (CWD) command is restricted.
Recursive Select this check box if you want the file pattern to search sub folders in the remote directory. By default, the check box is clear.
The Recursive option is ignored if you configure SCP as the Service Type.
FTP File Pattern If you select SFTP or FTP as the Service Type, this option allows you to configure the regular expression (regex) required to filter the list of files specified in the Remote Directory. All matching files are included in the processing.
IBM z/OS mainframe using IBM Security zSecure Audit writes event files using the pattern zOS.<timestamp>.gz
The FTP file pattern you specify must match the name you assigned to your event files. For example, to collect files starting with zOS and ending with .gz, type the following:
ACF2.*\.gz
Use of this parameter requires knowledge of regular expressions (regex). For more information, see the following website: http://download.oracle.com/javase/tutorial/essential/regex/
FTP Transfer Mode This option only displays if you select FTP as the Service Type. From the list box, select Binary.
The binary transfer mode is required for event files stored in a binary or compressed format, such as zip, gzip, tar, or tar+gzip archive files.
SCP Remote File If you select SCP as the Service Type you must type the file name of the remote file.
Start Time Type the time of day you want the processing to begin. For example, type 00:00 to schedule the Log File protocol to collect event files at midnight.
This parameter functions with the Recurrence value to establish when and how often the Remote Directory is scanned for files. Type the start time, based on a 24 hour clock, in the following format: HH:MM.
Table 16-2 CA ACF2 Log File Parameters (continued)
Parameter Description
Configuring DSMs
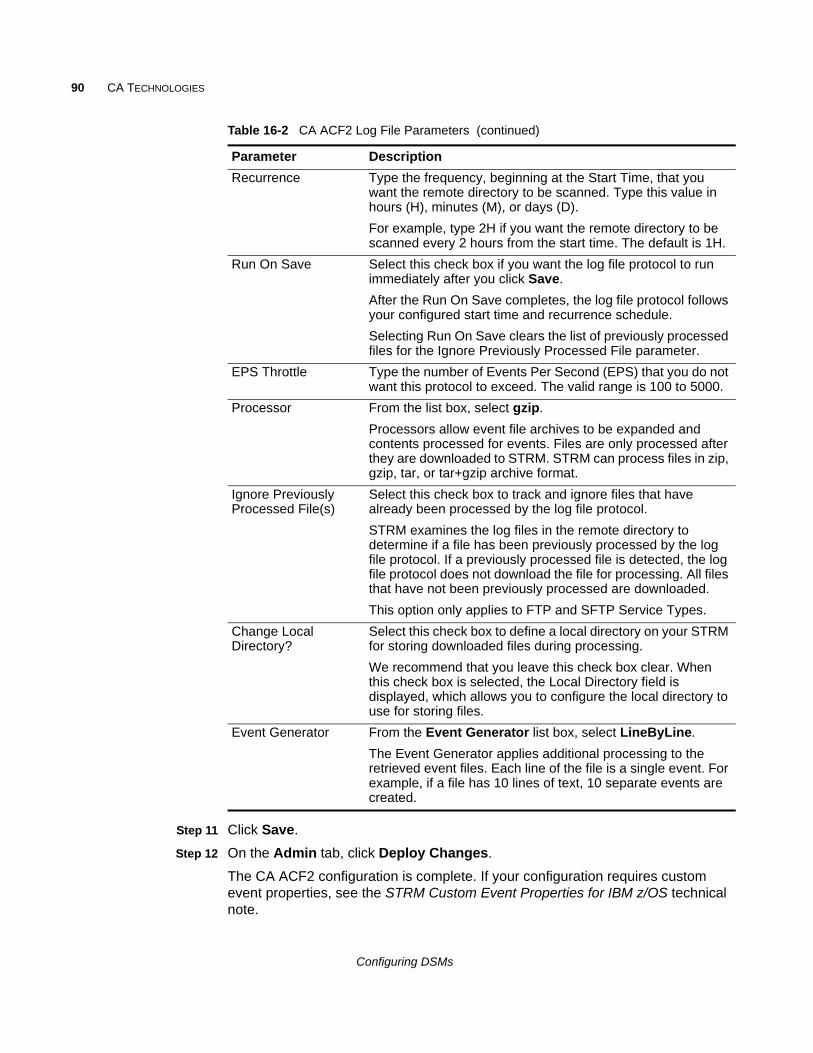
90 CA TECHNOLOGIES
Step 11 Click Save.
Step 12 On the Admin tab, click Deploy Changes.
The CA ACF2 configuration is complete. If your configuration requires custom event properties, see the STRM Custom Event Properties for IBM z/OS technical note.
Recurrence Type the frequency, beginning at the Start Time, that you want the remote directory to be scanned. Type this value in hours (H), minutes (M), or days (D).
For example, type 2H if you want the remote directory to be scanned every 2 hours from the start time. The default is 1H.
Run On Save Select this check box if you want the log file protocol to run immediately after you click Save.
After the Run On Save completes, the log file protocol follows your configured start time and recurrence schedule.
Selecting Run On Save clears the list of previously processed files for the Ignore Previously Processed File parameter.
EPS Throttle Type the number of Events Per Second (EPS) that you do not want this protocol to exceed. The valid range is 100 to 5000.
Processor From the list box, select gzip.
Processors allow event file archives to be expanded and contents processed for events. Files are only processed after they are downloaded to STRM. STRM can process files in zip, gzip, tar, or tar+gzip archive format.
Ignore Previously Processed File(s)
Select this check box to track and ignore files that have already been processed by the log file protocol.
STRM examines the log files in the remote directory to determine if a file has been previously processed by the log file protocol. If a previously processed file is detected, the log file protocol does not download the file for processing. All files that have not been previously processed are downloaded.
This option only applies to FTP and SFTP Service Types.
Change Local Directory?
Select this check box to define a local directory on your STRM for storing downloaded files during processing.
We recommend that you leave this check box clear. When this check box is selected, the Local Directory field is displayed, which allows you to configure the local directory to use for storing files.
Event Generator From the Event Generator list box, select LineByLine.
The Event Generator applies additional processing to the retrieved event files. Each line of the file is a single event. For example, if a file has 10 lines of text, 10 separate events are created.
Table 16-2 CA ACF2 Log File Parameters (continued)
Parameter Description
Configuring DSMs
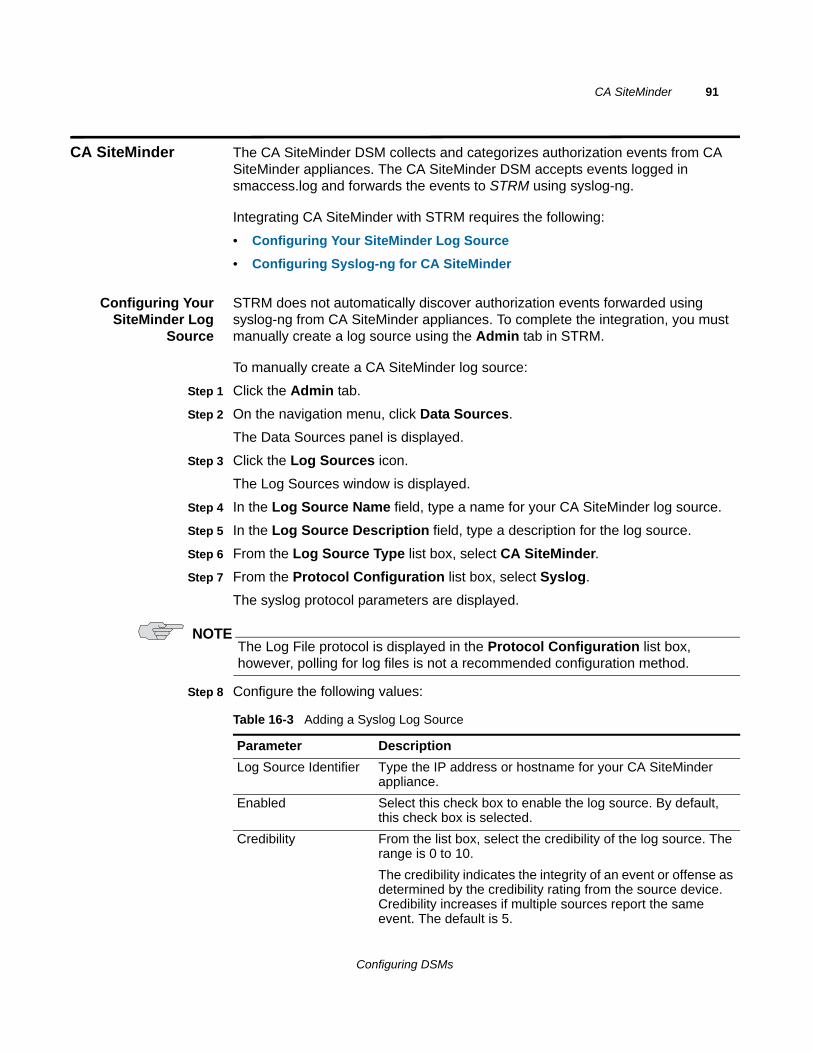
CA SiteMinder 91
CA SiteMinder The CA SiteMinder DSM collects and categorizes authorization events from CA SiteMinder appliances. The CA SiteMinder DSM accepts events logged in smaccess.log and forwards the events to STRM using syslog-ng.
Integrating CA SiteMinder with STRM requires the following:
• Configuring Your SiteMinder Log Source
• Configuring Syslog-ng for CA SiteMinder
Configuring YourSiteMinder Log
Source
STRM does not automatically discover authorization events forwarded using syslog-ng from CA SiteMinder appliances. To complete the integration, you must manually create a log source using the Admin tab in STRM.
To manually create a CA SiteMinder log source:
Step 1 Click the Admin tab.
Step 2 On the navigation menu, click Data Sources.
The Data Sources panel is displayed.
Step 3 Click the Log Sources icon.
The Log Sources window is displayed.
Step 4 In the Log Source Name field, type a name for your CA SiteMinder log source.
Step 5 In the Log Source Description field, type a description for the log source.
Step 6 From the Log Source Type list box, select CA SiteMinder.
Step 7 From the Protocol Configuration list box, select Syslog.
The syslog protocol parameters are displayed.
NOTEThe Log File protocol is displayed in the Protocol Configuration list box, however, polling for log files is not a recommended configuration method.
Step 8 Configure the following values:
Table 16-3 Adding a Syslog Log Source
Parameter Description
Log Source Identifier Type the IP address or hostname for your CA SiteMinder appliance.
Enabled Select this check box to enable the log source. By default, this check box is selected.
Credibility From the list box, select the credibility of the log source. The range is 0 to 10.
The credibility indicates the integrity of an event or offense as determined by the credibility rating from the source device. Credibility increases if multiple sources report the same event. The default is 5.
Configuring DSMs
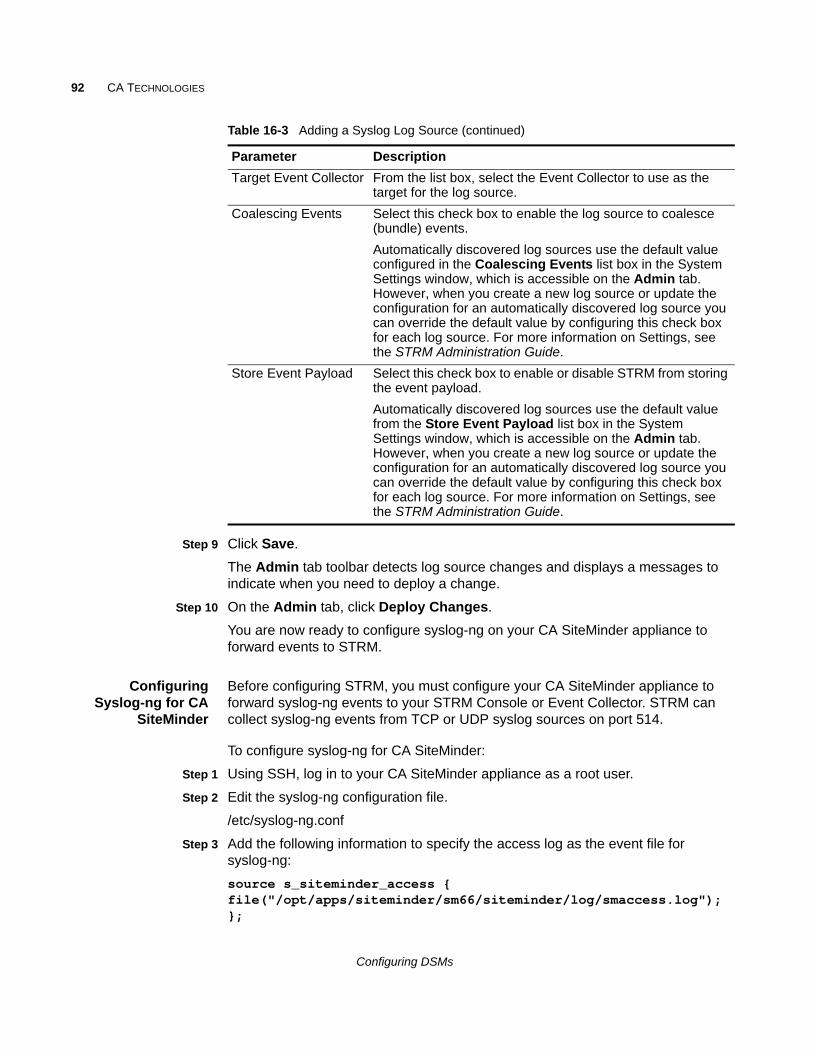
92 CA TECHNOLOGIES
Step 9 Click Save.
The Admin tab toolbar detects log source changes and displays a messages to indicate when you need to deploy a change.
Step 10 On the Admin tab, click Deploy Changes.
You are now ready to configure syslog-ng on your CA SiteMinder appliance to forward events to STRM.
ConfiguringSyslog-ng for CA
SiteMinder
Before configuring STRM, you must configure your CA SiteMinder appliance to forward syslog-ng events to your STRM Console or Event Collector. STRM can collect syslog-ng events from TCP or UDP syslog sources on port 514.
To configure syslog-ng for CA SiteMinder:
Step 1 Using SSH, log in to your CA SiteMinder appliance as a root user.
Step 2 Edit the syslog-ng configuration file.
/etc/syslog-ng.conf
Step 3 Add the following information to specify the access log as the event file for syslog-ng:
source s_siteminder_access {file("/opt/apps/siteminder/sm66/siteminder/log/smaccess.log");};
Target Event Collector From the list box, select the Event Collector to use as the target for the log source.
Coalescing Events Select this check box to enable the log source to coalesce (bundle) events.
Automatically discovered log sources use the default value configured in the Coalescing Events list box in the System Settings window, which is accessible on the Admin tab. However, when you create a new log source or update the configuration for an automatically discovered log source you can override the default value by configuring this check box for each log source. For more information on Settings, see the STRM Administration Guide.
Store Event Payload Select this check box to enable or disable STRM from storing the event payload.
Automatically discovered log sources use the default value from the Store Event Payload list box in the System Settings window, which is accessible on the Admin tab. However, when you create a new log source or update the configuration for an automatically discovered log source you can override the default value by configuring this check box for each log source. For more information on Settings, see the STRM Administration Guide.
Table 16-3 Adding a Syslog Log Source (continued)
Parameter Description
Configuring DSMs
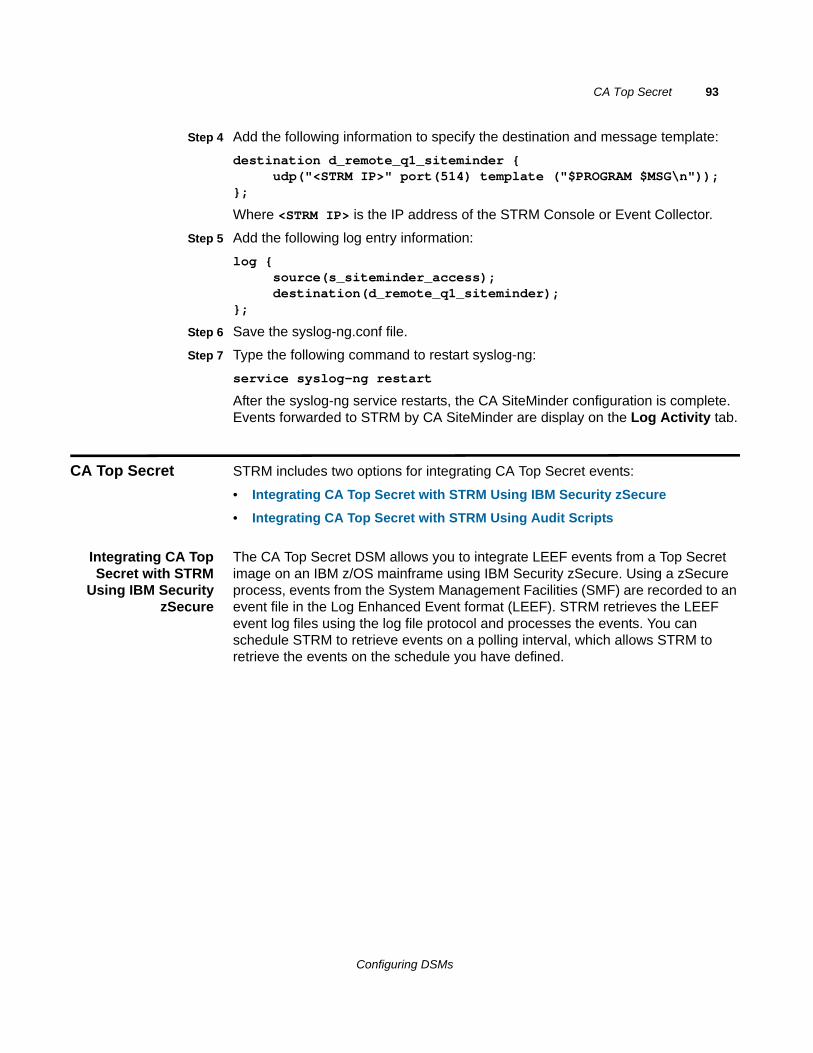
CA Top Secret 93
Step 4 Add the following information to specify the destination and message template:
destination d_remote_q1_siteminder {udp("<STRM IP>" port(514) template ("$PROGRAM $MSG\n"));
};
Where <STRM IP> is the IP address of the STRM Console or Event Collector.
Step 5 Add the following log entry information:
log {source(s_siteminder_access);destination(d_remote_q1_siteminder);
};
Step 6 Save the syslog-ng.conf file.
Step 7 Type the following command to restart syslog-ng:
service syslog-ng restart
After the syslog-ng service restarts, the CA SiteMinder configuration is complete. Events forwarded to STRM by CA SiteMinder are display on the Log Activity tab.
CA Top Secret STRM includes two options for integrating CA Top Secret events:
• Integrating CA Top Secret with STRM Using IBM Security zSecure
• Integrating CA Top Secret with STRM Using Audit Scripts
Integrating CA TopSecret with STRM
Using IBM SecurityzSecure
The CA Top Secret DSM allows you to integrate LEEF events from a Top Secret image on an IBM z/OS mainframe using IBM Security zSecure. Using a zSecure process, events from the System Management Facilities (SMF) are recorded to an event file in the Log Enhanced Event format (LEEF). STRM retrieves the LEEF event log files using the log file protocol and processes the events. You can schedule STRM to retrieve events on a polling interval, which allows STRM to retrieve the events on the schedule you have defined.
Configuring DSMs
94 CA TECHNOLOGIES
To integrate CA Top Secret events:
1 Confirm your installation meets any prerequisite installation requirements. For more information, see Before You Begin.
2 Configure your CA Top Secret z/OS image to write events in LEEF format. For more information, see the IBM Security zSecure Suite: CARLa-Driven Components Installation and Deployment Guide.
3 Create a log source in STRM for CA Top Secret to retrieve your LEEF formatted event logs. For more information, see Creating a Log Source in STRM.
4 Optional. Create a custom event property for CA Top Secret in STRM. For more information, see the STRM Custom Event Properties for IBM z/OS technical note.
Before You Begin
Before you can configure the data collection process, you must complete the basic zSecure installation process. After installing the software, you must also perform the post-installation activities to create and modify the configuration.
The following prerequisites are required:
• You must ensure parmlib member IFAPRDxx is not disabled for IBM Security zSecure Audit on your z/OS image.
• The SCKRLOAD library must be APF-authorized.
• You must configure a process to periodically refresh your CKFREEZE and UNLOAD data sets.
• You must configure an SFTP, FTP, or SCP server on your z/OS image for STRM to download your LEEF event files.
• You must allow SFTP, FTP, or SCP traffic on firewalls located between STRM and your z/OS image.
For instructions on installing and configuring zSecure, see the IBM Security zSecure Suite: CARLa-Driven Components Installation and Deployment Guide.
Creating a Log Source in STRM
The Log File protocol allows STRM to retrieve archived log files from a remote host. These files are transferred, one at a time, to STRM for processing. The log file protocol can manage plain text event logs, compressed files, or archives. Archives must contain plain-text files that can be processed one line at a time. Multi-line event logs are not supported by the log file protocol. IBM z/OS with zSecure writes log files to a specified directory as gzip archives. STRM extracts the archive and processes the events, which are written as one event per line in the file.
To retrieve these events, you must create a log source using the Log File protocol. STRM requires credentials to log in to the system hosting your LEEF formatted event files and a polling interval.
Configuring DSMs
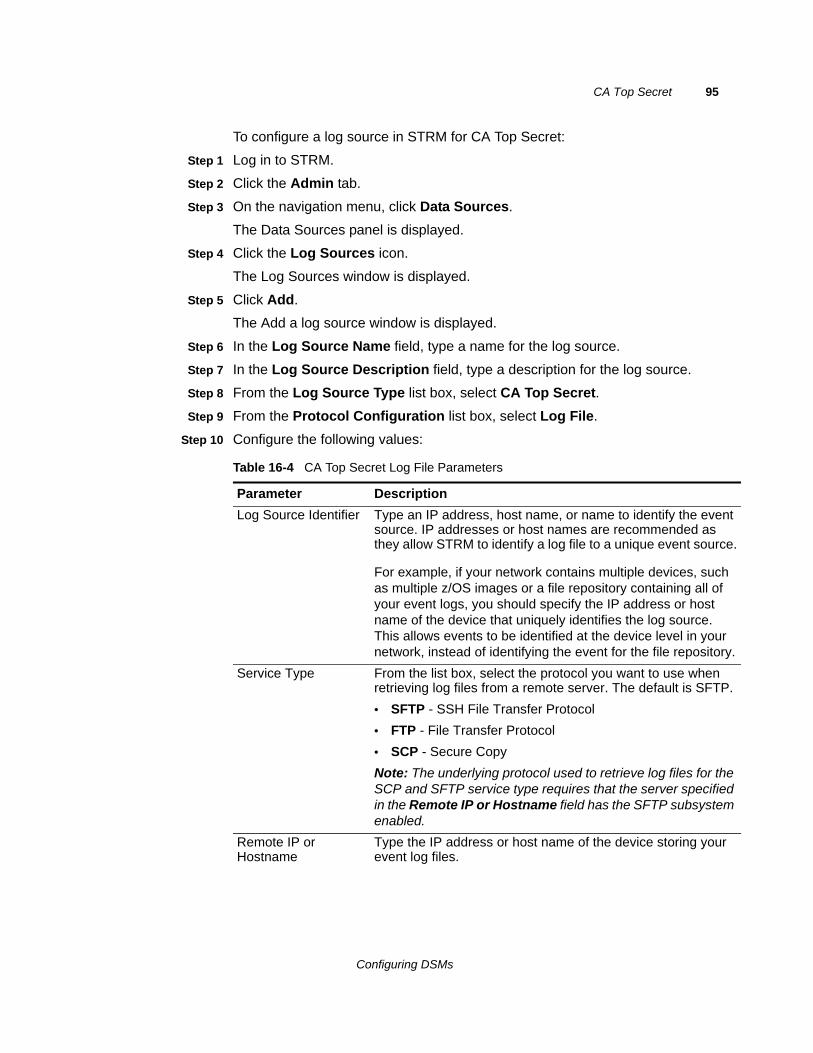
CA Top Secret 95
To configure a log source in STRM for CA Top Secret:
Step 1 Log in to STRM.
Step 2 Click the Admin tab.
Step 3 On the navigation menu, click Data Sources.
The Data Sources panel is displayed.
Step 4 Click the Log Sources icon.
The Log Sources window is displayed.
Step 5 Click Add.
The Add a log source window is displayed.
Step 6 In the Log Source Name field, type a name for the log source.
Step 7 In the Log Source Description field, type a description for the log source.
Step 8 From the Log Source Type list box, select CA Top Secret.
Step 9 From the Protocol Configuration list box, select Log File.
Step 10 Configure the following values:
Table 16-4 CA Top Secret Log File Parameters
Parameter Description
Log Source Identifier Type an IP address, host name, or name to identify the event source. IP addresses or host names are recommended as they allow STRM to identify a log file to a unique event source.
For example, if your network contains multiple devices, such as multiple z/OS images or a file repository containing all of your event logs, you should specify the IP address or host name of the device that uniquely identifies the log source. This allows events to be identified at the device level in your network, instead of identifying the event for the file repository.
Service Type From the list box, select the protocol you want to use when retrieving log files from a remote server. The default is SFTP.
• SFTP - SSH File Transfer Protocol
• FTP - File Transfer Protocol
• SCP - Secure Copy
Note: The underlying protocol used to retrieve log files for the SCP and SFTP service type requires that the server specified in the Remote IP or Hostname field has the SFTP subsystem enabled.
Remote IP or Hostname
Type the IP address or host name of the device storing your event log files.
Configuring DSMs
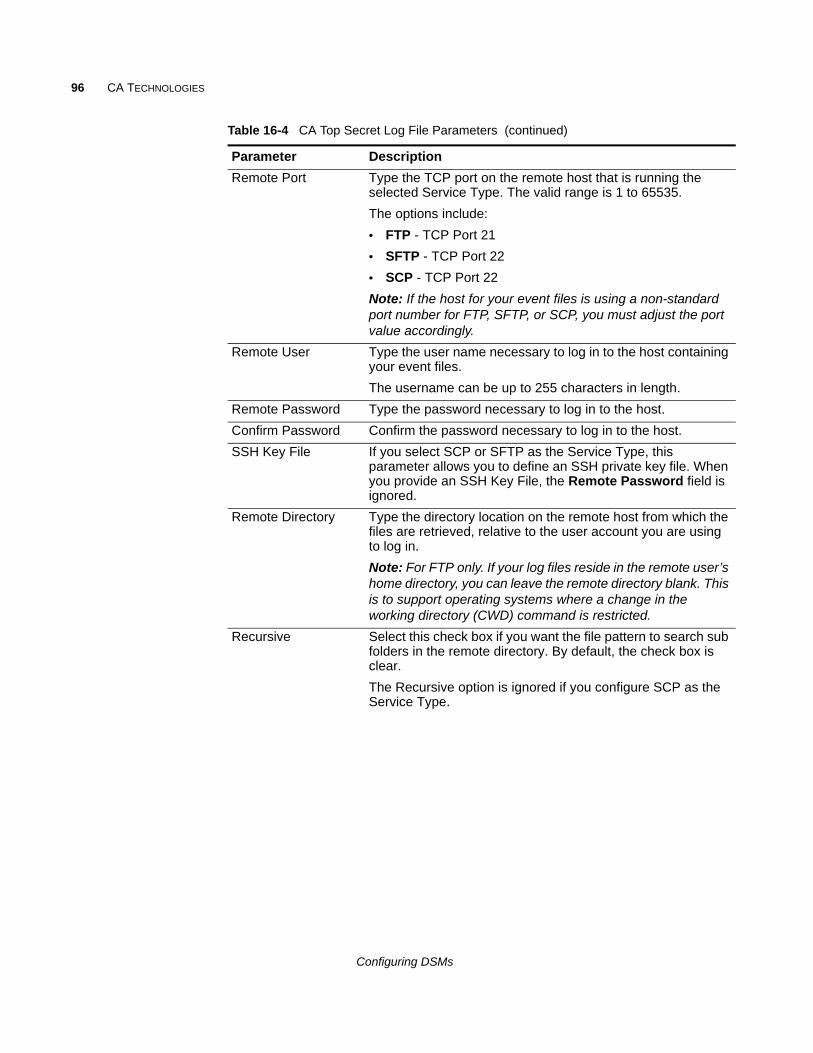
96 CA TECHNOLOGIES
Remote Port Type the TCP port on the remote host that is running the selected Service Type. The valid range is 1 to 65535.
The options include:
• FTP - TCP Port 21
• SFTP - TCP Port 22
• SCP - TCP Port 22
Note: If the host for your event files is using a non-standard port number for FTP, SFTP, or SCP, you must adjust the port value accordingly.
Remote User Type the user name necessary to log in to the host containing your event files.
The username can be up to 255 characters in length.
Remote Password Type the password necessary to log in to the host.
Confirm Password Confirm the password necessary to log in to the host.
SSH Key File If you select SCP or SFTP as the Service Type, this parameter allows you to define an SSH private key file. When you provide an SSH Key File, the Remote Password field is ignored.
Remote Directory Type the directory location on the remote host from which the files are retrieved, relative to the user account you are using to log in.
Note: For FTP only. If your log files reside in the remote user’s home directory, you can leave the remote directory blank. This is to support operating systems where a change in the working directory (CWD) command is restricted.
Recursive Select this check box if you want the file pattern to search sub folders in the remote directory. By default, the check box is clear.
The Recursive option is ignored if you configure SCP as the Service Type.
Table 16-4 CA Top Secret Log File Parameters (continued)
Parameter Description
Configuring DSMs
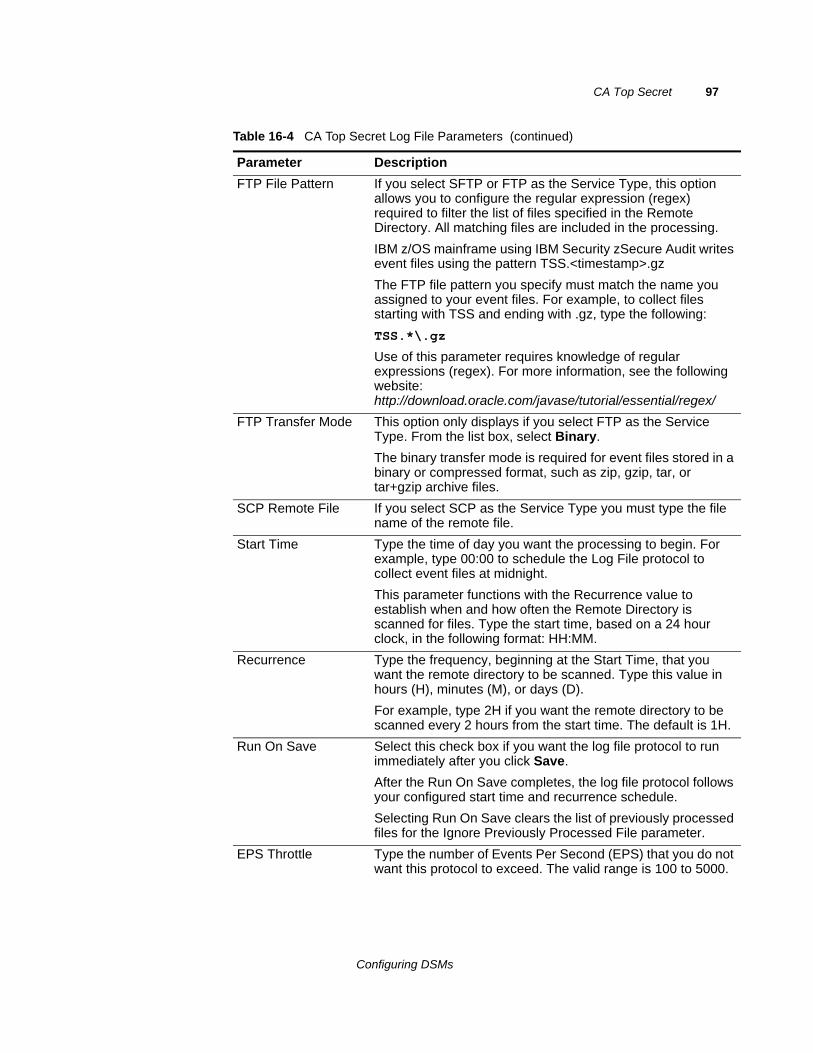
CA Top Secret 97
FTP File Pattern If you select SFTP or FTP as the Service Type, this option allows you to configure the regular expression (regex) required to filter the list of files specified in the Remote Directory. All matching files are included in the processing.
IBM z/OS mainframe using IBM Security zSecure Audit writes event files using the pattern TSS.<timestamp>.gz
The FTP file pattern you specify must match the name you assigned to your event files. For example, to collect files starting with TSS and ending with .gz, type the following:
TSS.*\.gz
Use of this parameter requires knowledge of regular expressions (regex). For more information, see the following website: http://download.oracle.com/javase/tutorial/essential/regex/
FTP Transfer Mode This option only displays if you select FTP as the Service Type. From the list box, select Binary.
The binary transfer mode is required for event files stored in a binary or compressed format, such as zip, gzip, tar, or tar+gzip archive files.
SCP Remote File If you select SCP as the Service Type you must type the file name of the remote file.
Start Time Type the time of day you want the processing to begin. For example, type 00:00 to schedule the Log File protocol to collect event files at midnight.
This parameter functions with the Recurrence value to establish when and how often the Remote Directory is scanned for files. Type the start time, based on a 24 hour clock, in the following format: HH:MM.
Recurrence Type the frequency, beginning at the Start Time, that you want the remote directory to be scanned. Type this value in hours (H), minutes (M), or days (D).
For example, type 2H if you want the remote directory to be scanned every 2 hours from the start time. The default is 1H.
Run On Save Select this check box if you want the log file protocol to run immediately after you click Save.
After the Run On Save completes, the log file protocol follows your configured start time and recurrence schedule.
Selecting Run On Save clears the list of previously processed files for the Ignore Previously Processed File parameter.
EPS Throttle Type the number of Events Per Second (EPS) that you do not want this protocol to exceed. The valid range is 100 to 5000.
Table 16-4 CA Top Secret Log File Parameters (continued)
Parameter Description
Configuring DSMs
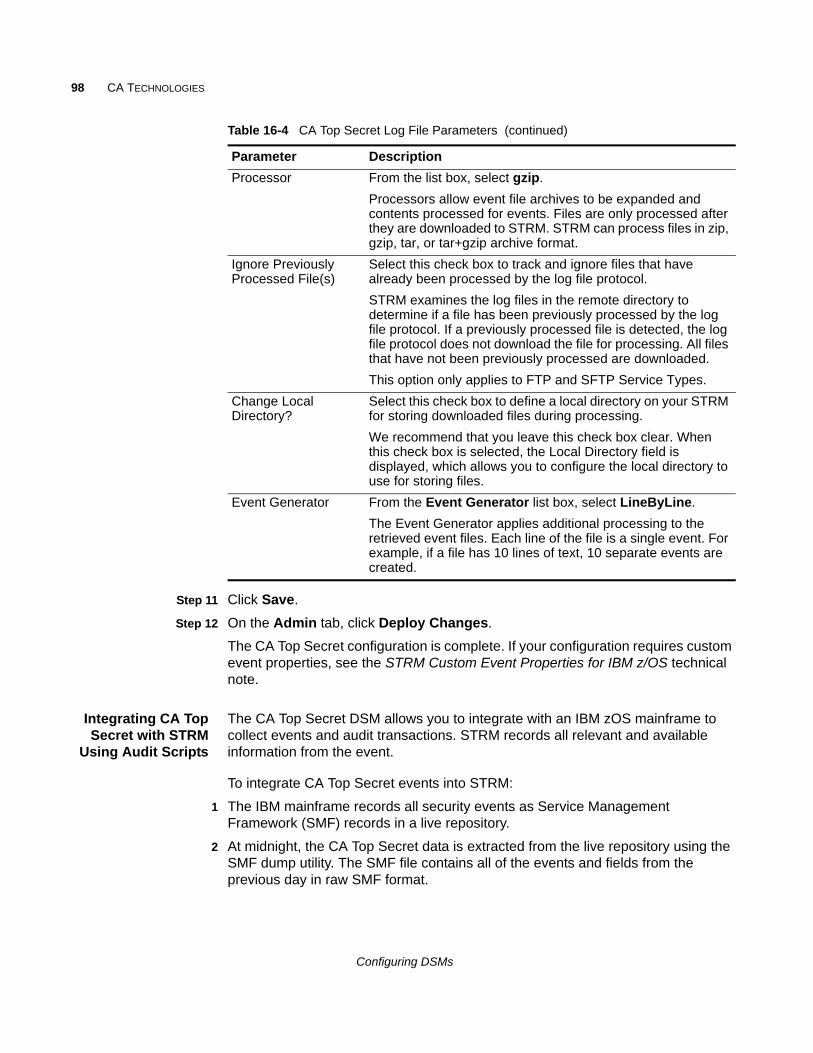
98 CA TECHNOLOGIES
Step 11 Click Save.
Step 12 On the Admin tab, click Deploy Changes.
The CA Top Secret configuration is complete. If your configuration requires custom event properties, see the STRM Custom Event Properties for IBM z/OS technical note.
Integrating CA TopSecret with STRM
Using Audit Scripts
The CA Top Secret DSM allows you to integrate with an IBM zOS mainframe to collect events and audit transactions. STRM records all relevant and available information from the event.
To integrate CA Top Secret events into STRM:
1 The IBM mainframe records all security events as Service Management Framework (SMF) records in a live repository.
2 At midnight, the CA Top Secret data is extracted from the live repository using the SMF dump utility. The SMF file contains all of the events and fields from the previous day in raw SMF format.
Processor From the list box, select gzip.
Processors allow event file archives to be expanded and contents processed for events. Files are only processed after they are downloaded to STRM. STRM can process files in zip, gzip, tar, or tar+gzip archive format.
Ignore Previously Processed File(s)
Select this check box to track and ignore files that have already been processed by the log file protocol.
STRM examines the log files in the remote directory to determine if a file has been previously processed by the log file protocol. If a previously processed file is detected, the log file protocol does not download the file for processing. All files that have not been previously processed are downloaded.
This option only applies to FTP and SFTP Service Types.
Change Local Directory?
Select this check box to define a local directory on your STRM for storing downloaded files during processing.
We recommend that you leave this check box clear. When this check box is selected, the Local Directory field is displayed, which allows you to configure the local directory to use for storing files.
Event Generator From the Event Generator list box, select LineByLine.
The Event Generator applies additional processing to the retrieved event files. Each line of the file is a single event. For example, if a file has 10 lines of text, 10 separate events are created.
Table 16-4 CA Top Secret Log File Parameters (continued)
Parameter Description
Configuring DSMs
CA Top Secret 99
3 The qextopsloadlib program pulls data from the SMF formatted file. The qextopsloadlib program only pulls the relevant events and fields for STRM and writes that information in a condensed format for compatibility. The information is saved in a location accessible by STRM.
4 STRM uses the log file protocol source to retrieve the output file information on a scheduled basis. STRM then imports and processes this file.
This document includes:
• Configuring CA Top Secret to Integrate with STRM
• Creating a Log Source in STRM
Configuring CA Top Secret to Integrate with STRM
To integrate CA Top Secret with STRM:
Step 1 From the Juniper customer support website, download the following compressed file:
qextops_bundled.tar.gz
Step 2 On a Linux-based operating system, extract the file:
tar -zxvf qextops_bundled.tar.gz
The following files are contained in the archive:
qextops_jcl.txt
qextopsloadlib.trs
qextops_trsmain_JCL.txt
Step 3 Load the files onto the IBM mainframe using any terminal emulator file transfer method.
a Upload the sample qextops_trsmain_JCL.txt and qextops_jcl.txt files using the TEXT protocol.
b Upload the qextopsloadlib.trs file using a BINARY mode transfer. The qextopsloadlib.trs file is a tersed file containing the executable (the mainframe program qextops). When you upload the .trs file from a workstation, pre-allocate a file on the mainframe with the following DCB attributes: DSORG=PS, RECFM=FB, LRECL=1024, BLKSIZE=6144. The file transfer type must be binary mode and not text.
NOTEQextops is a small C mainframe program that reads the output of the TSSUTIL (EARLOUT data) line by line. Qextops adds a header to each record containing event information, for example, record descriptor, the date, and time. The program places each field into the output record, suppresses trailing blank characters, and delimits each field with the pipe character. This output file is formatted for STRM and the blank suppression reduces network traffic to STRM. This program does not consume CPU or I/O disk resources.
Configuring DSMs
100 CA TECHNOLOGIES
Step 4 Customize the qextops_trsmain_JCL.txt file according to your installation-specific requirements.
The qextops_trsmain_JCL.txt file uses the IBM utility TRSMAIN to extract the program stored in the qextopsloadlib.trs file.
An example of the qextops_trsmain_JCL.txt file includes:
//TRSMAIN JOB (yourvalidjobcard),Q1labs,// MSGCLASS=V//DEL EXEC PGM=IEFBR14 //D1 DD DISP=(MOD,DELETE),DSN=<yourhlq>.QEXTOPS.TRS // UNIT=SYSDA, // SPACE=(CYL,(10,10)) //TRSMAIN EXEC PGM=TRSMAIN,PARM='UNPACK' //SYSPRINT DD SYSOUT=*,DCB=(LRECL=133,BLKSIZE=12901,RECFM=FBA) //INFILE DD DISP=SHR,DSN=<yourhlq>.QEXTOPS.TRS //OUTFILE DD DISP=(NEW,CATLG,DELETE), // DSN=<yourhlq>.LOAD, // SPACE=(CYL,(10,10,5),RLSE),UNIT=SYSDA //
You must update the file with your installation specific information for parameters, for example, jobcard, data set naming conventions, output destinations, retention periods, and space requirements.
The .trs input file is an IBM TERSE formatted library and is extracted by running the JCL, which calls the TRSMAIN. This tersed file, when extracted, creates a PDS linklib with the qextops program as a member.
Step 5 You can STEPLIB to this library or choose to move the program to one of the LINKLIBs that are in the LINKLST. The program does not require authorization.
Step 6 After uploading, copy the program to an existing link listed library or add a STEPLIB DD statement with the correct dataset name of the library that will contain the program.
Step 7 The qextops_jcl.txt file is a text file containing a sample JCL. You must configure the job card to meet your configuration.
The qextops_jcl.txt sample file includes:
//QEXTOPS JOB (T,JXPO,JKSD0093),DEV,NOTIFY=Q1JACK,// MSGCLASS=P,// REGION=0M//*//*QEXTOPS JCL version 1.0 September, 2010//*//*************************************************************//* Change below dataset names to sites specific datasets names*//************************************************************//SET1 SET TSSOUT='Q1JACK.EARLOUT.ALL',// EARLOUT='Q1JACK.QEXTOPS.PROGRAM.OUTPUT'//************************************************************//* Delete old datasets *//************************************************************
Configuring DSMs
CA Top Secret 101
//DEL EXEC PGM=IEFBR14//DD1 DD DISP=(MOD,DELETE),DSN=&TSSOUT,// UNIT=SYSDA,// SPACE=(CYL,(10,10)),// DCB=(RECFM=FB,LRECL=80)//DD2 DD DISP=(MOD,DELETE),DSN=&EARLOUT,// UNIT=SYSDA,// SPACE=(CYL,(10,10)),// DCB=(RECFM=FB,LRECL=80)//************************************************************//* Allocate new dataset *//************************************************************//ALLOC EXEC PGM=IEFBR14//DD1 DD DISP=(NEW,CATLG),DSN=&EARLOUT,// SPACE=(CYL,(100,100)),// DCB=(RECFM=VB,LRECL=1028,BLKSIZE=6144)//************************************************************//* Execute Top Secret TSSUTIL utility to extract smf records*//************************************************************//REPORT EXEC PGM=TSSUTIL//SMFIN DD DISP=SHR,DSN=&SMFIN1//SMFIN1 DD DISP=SHR,DSN=&SMFIN2//UTILOUT DD DSN=&UTILOUT,// DISP=(,CATLG),UNIT=SYSDA,SPACE=(CYL,(50,10),RLSE),// DCB=(RECFM=FB,LRECL=133,BLKSIZE=0)//EARLOUT DD DSN=&TSSOUT,// DISP=(NEW,CATLG),UNIT=SYSDA,// SPACE=(CYL,(200,100),RLSE),// DCB=(RECFM=VB,LRECL=456,BLKSIZE=27816)//UTILIN DD *
NOLEGENDREPORT EVENT(ALL) END
/*//************************************************************//EXTRACT EXEC PGM=QEXTOPS,DYNAMNBR=10,// TIME=1440//STEPLIB DD DISP=SHR,DSN=Q1JACK.C.LOAD//SYSTSIN DD DUMMY//SYSTSPRT DD SYSOUT=*//SYSPRINT DD SYSOUT=*//CFG DD DUMMY//EARLIN DD DISP=SHR,DSN=&TSSOUT//EARLOUT DD DISP=SHR,DSN=&EARLOUT//************************************************************//FTP EXEC PGM=FTP,REGION=3800K//INPUT DD *<IPADDR><USER><PASSWORD>PUT '<EARLOUT>' EARL_<THEIPOFTHEMAINFRAMEDEVICE>/<EARLOUT>
Configuring DSMs
102 CA TECHNOLOGIES
QUIT//OUTPUT DD SYSOUT=*//SYSPRINT DD SYSOUT=*
Step 8 After the output file is created, you must choose one of the following options:
a Schedule a job to a transfer the output file to an interim FTP server.
Each time the job completes, the output file is forwarded to an intermin FTP server. You must configure the following parameters in the sample JCL to successfully forward the output to an interim FTP server:
For example:
//FTP EXEC PGM=FTP,REGION=3800K//INPUT DD *<IPADDR><USER><PASSWORD>PUT '<EARLOUT>' EARL_<THEIPOFTHEMAINFRAMEDEVICE>/<EARLOUT>QUIT//OUTPUT DD SYSOUT=*//SYSPRINT DD SYSOUT=*
Where:
<IPADDR> is the IP address or host name of the interim FTP server to receive the output file.
<USER> is the user name required to access the interim FTP server.
<PASSWORD> is the password required to access the interim FTP server.
<THEIPOFTHEMAINFRAMEDEVICE> is the destination of the mainframe or interim FTP server receiving the output.
For example:
PUT 'Q1JACK.QEXTOPS.OUTPUT.C320' /192.168.1.101/CA/QEXTOPS.OUTPUT.C320
<QEXOUTDSN> is the name of the output file saved to the interim FTP server.
You are now ready to configure the Log File protocol. See Creating a Log Source in STRM.
b Schedule STRM to retrieve the output file from CA Top Secret.
If the zOS platform is configured to serve files through FTP, SFTP, or allow SCP, then no interim FTP server is required and STRM can pull the output file directly from the mainframe. The following text must be commented out using //* or deleted from the qextops_jcl.txt file:
//FTP EXEC PGM=FTP,REGION=3800K//INPUT DD *<IPADDR><USER><PASSWORD>PUT '<EARLOUT>' EARL_<THEIPOFTHEMAINFRAMEDEVICE>/<EARLOUT>
Configuring DSMs
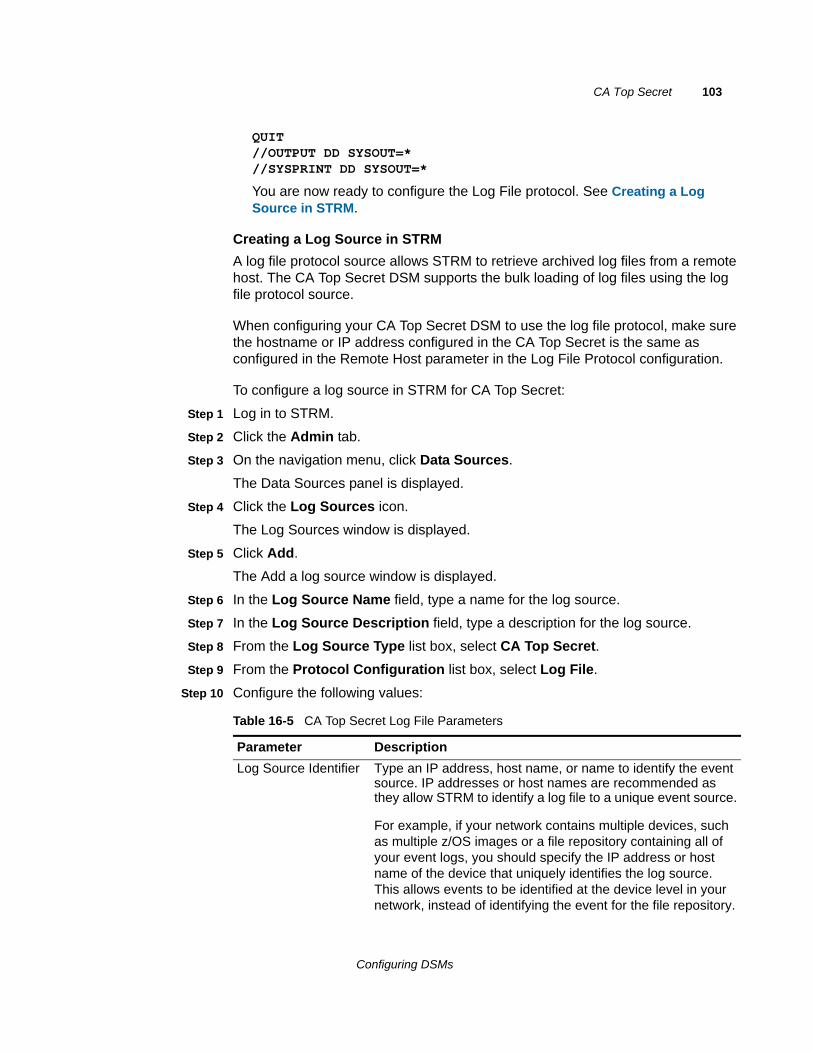
CA Top Secret 103
QUIT//OUTPUT DD SYSOUT=*//SYSPRINT DD SYSOUT=*
You are now ready to configure the Log File protocol. See Creating a Log Source in STRM.
Creating a Log Source in STRM
A log file protocol source allows STRM to retrieve archived log files from a remote host. The CA Top Secret DSM supports the bulk loading of log files using the log file protocol source.
When configuring your CA Top Secret DSM to use the log file protocol, make sure the hostname or IP address configured in the CA Top Secret is the same as configured in the Remote Host parameter in the Log File Protocol configuration.
To configure a log source in STRM for CA Top Secret:
Step 1 Log in to STRM.
Step 2 Click the Admin tab.
Step 3 On the navigation menu, click Data Sources.
The Data Sources panel is displayed.
Step 4 Click the Log Sources icon.
The Log Sources window is displayed.
Step 5 Click Add.
The Add a log source window is displayed.
Step 6 In the Log Source Name field, type a name for the log source.
Step 7 In the Log Source Description field, type a description for the log source.
Step 8 From the Log Source Type list box, select CA Top Secret.
Step 9 From the Protocol Configuration list box, select Log File.
Step 10 Configure the following values:
Table 16-5 CA Top Secret Log File Parameters
Parameter Description
Log Source Identifier Type an IP address, host name, or name to identify the event source. IP addresses or host names are recommended as they allow STRM to identify a log file to a unique event source.
For example, if your network contains multiple devices, such as multiple z/OS images or a file repository containing all of your event logs, you should specify the IP address or host name of the device that uniquely identifies the log source. This allows events to be identified at the device level in your network, instead of identifying the event for the file repository.
Configuring DSMs

104 CA TECHNOLOGIES
Service Type From the list box, select the protocol you want to use when retrieving log files from a remote server. The default is SFTP.
• SFTP - SSH File Transfer Protocol
• FTP - File Transfer Protocol
• SCP - Secure Copy
Note: The underlying protocol used to retrieve log files for the SCP and SFTP service type requires that the server specified in the Remote IP or Hostname field has the SFTP subsystem enabled.
Remote IP or Hostname
Type the IP address or host name of the device storing your event log files.
Remote Port Type the TCP port on the remote host that is running the selected Service Type. The valid range is 1 to 65535.
The options include:
• FTP - TCP Port 21
• SFTP - TCP Port 22
• SCP - TCP Port 22
Note: If the host for your event files is using a non-standard port number for FTP, SFTP, or SCP, you must adjust the port value accordingly.
Remote User Type the user name necessary to log in to the host containing your event files.
The username can be up to 255 characters in length.
Remote Password Type the password necessary to log in to the host.
Confirm Password Confirm the password necessary to log in to the host.
SSH Key File If you select SCP or SFTP as the Service Type, this parameter allows you to define an SSH private key file. When you provide an SSH Key File, the Remote Password field is ignored.
Remote Directory Type the directory location on the remote host from which the files are retrieved, relative to the user account you are using to log in.
Note: For FTP only. If your log files reside in the remote user’s home directory, you can leave the remote directory blank. This is to support operating systems where a change in the working directory (CWD) command is restricted.
Recursive Select this check box if you want the file pattern to search sub folders in the remote directory. By default, the check box is clear.
The Recursive option is ignored if you configure SCP as the Service Type.
Table 16-5 CA Top Secret Log File Parameters (continued)
Parameter Description
Configuring DSMs
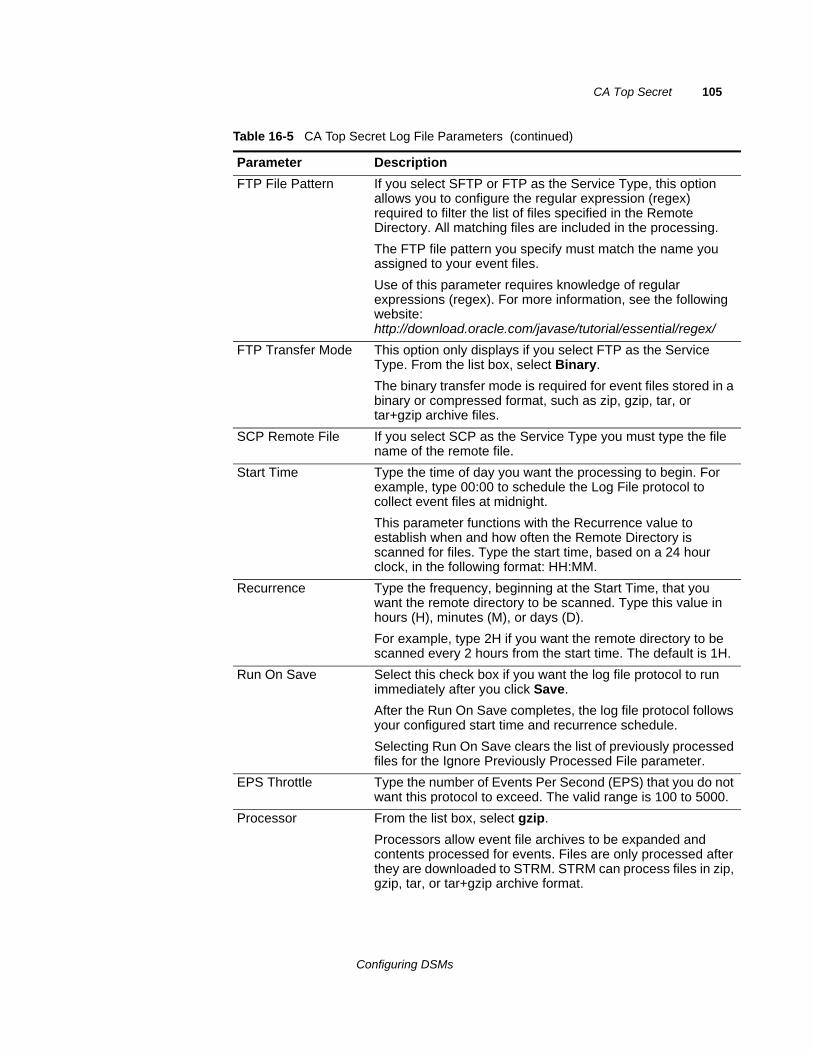
CA Top Secret 105
FTP File Pattern If you select SFTP or FTP as the Service Type, this option allows you to configure the regular expression (regex) required to filter the list of files specified in the Remote Directory. All matching files are included in the processing.
The FTP file pattern you specify must match the name you assigned to your event files.
Use of this parameter requires knowledge of regular expressions (regex). For more information, see the following website: http://download.oracle.com/javase/tutorial/essential/regex/
FTP Transfer Mode This option only displays if you select FTP as the Service Type. From the list box, select Binary.
The binary transfer mode is required for event files stored in a binary or compressed format, such as zip, gzip, tar, or tar+gzip archive files.
SCP Remote File If you select SCP as the Service Type you must type the file name of the remote file.
Start Time Type the time of day you want the processing to begin. For example, type 00:00 to schedule the Log File protocol to collect event files at midnight.
This parameter functions with the Recurrence value to establish when and how often the Remote Directory is scanned for files. Type the start time, based on a 24 hour clock, in the following format: HH:MM.
Recurrence Type the frequency, beginning at the Start Time, that you want the remote directory to be scanned. Type this value in hours (H), minutes (M), or days (D).
For example, type 2H if you want the remote directory to be scanned every 2 hours from the start time. The default is 1H.
Run On Save Select this check box if you want the log file protocol to run immediately after you click Save.
After the Run On Save completes, the log file protocol follows your configured start time and recurrence schedule.
Selecting Run On Save clears the list of previously processed files for the Ignore Previously Processed File parameter.
EPS Throttle Type the number of Events Per Second (EPS) that you do not want this protocol to exceed. The valid range is 100 to 5000.
Processor From the list box, select gzip.
Processors allow event file archives to be expanded and contents processed for events. Files are only processed after they are downloaded to STRM. STRM can process files in zip, gzip, tar, or tar+gzip archive format.
Table 16-5 CA Top Secret Log File Parameters (continued)
Parameter Description
Configuring DSMs
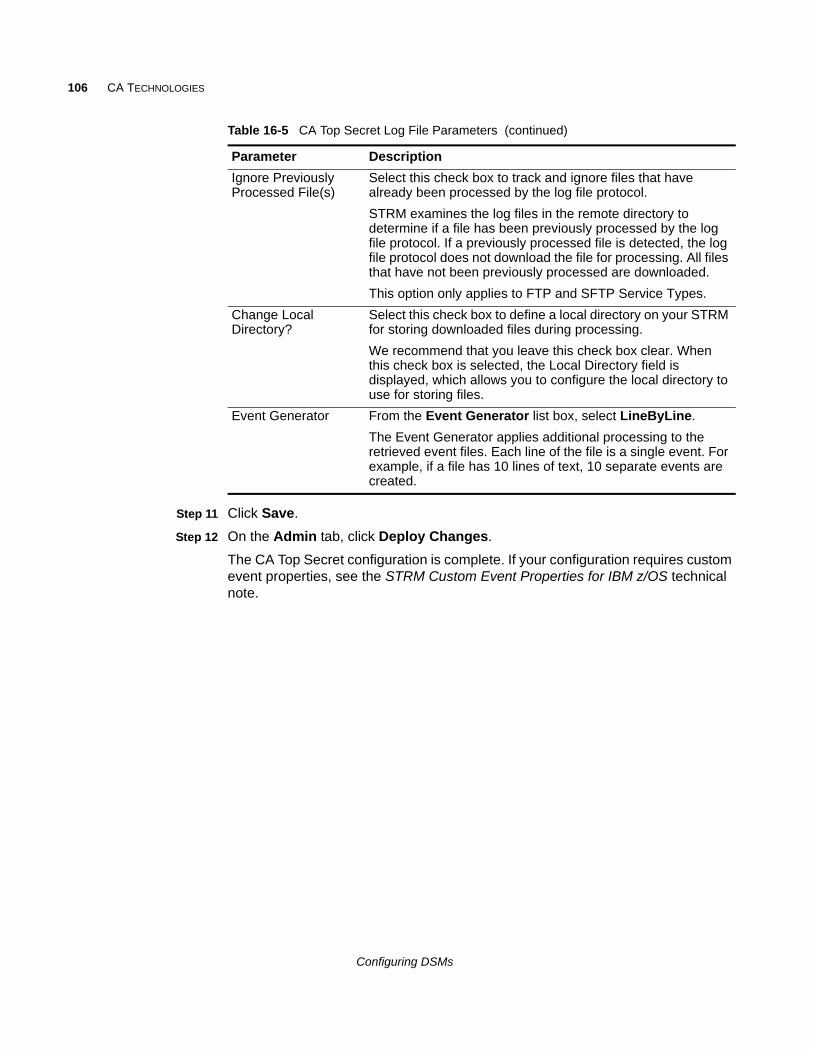
106 CA TECHNOLOGIES
Step 11 Click Save.
Step 12 On the Admin tab, click Deploy Changes.
The CA Top Secret configuration is complete. If your configuration requires custom event properties, see the STRM Custom Event Properties for IBM z/OS technical note.
Ignore Previously Processed File(s)
Select this check box to track and ignore files that have already been processed by the log file protocol.
STRM examines the log files in the remote directory to determine if a file has been previously processed by the log file protocol. If a previously processed file is detected, the log file protocol does not download the file for processing. All files that have not been previously processed are downloaded.
This option only applies to FTP and SFTP Service Types.
Change Local Directory?
Select this check box to define a local directory on your STRM for storing downloaded files during processing.
We recommend that you leave this check box clear. When this check box is selected, the Local Directory field is displayed, which allows you to configure the local directory to use for storing files.
Event Generator From the Event Generator list box, select LineByLine.
The Event Generator applies additional processing to the retrieved event files. Each line of the file is a single event. For example, if a file has 10 lines of text, 10 separate events are created.
Table 16-5 CA Top Secret Log File Parameters (continued)
Parameter Description
Configuring DSMs
17
CHECK POINTThis section provides information on the following DSMs for STRM:
• Check Point FireWall-1
• Check Point Provider-1
Check Point FireWall-1
You can configure STRM to integrate with a Check Point FireWall-1 device using one of the following methods:
• Integrating Check Point FireWall-1 Using Syslog
• Integrating Check Point FireWall-1 Using OPSEC
NOTEDepending on your Operating System, the procedures for the Check Point FireWall-1 device might vary. The following procedures are based on the Check Point SecurePlatform Operating system.
Integrating CheckPoint FireWall-1
Using Syslog
This section describes how to ensure that the STRM Check Point FireWall-1 DSMs accepts FireWall-1 events using syslog.
This section includes the following topics:
• Configuring Syslog for Check Point FireWall-1
• Configuring a Log Source in STRM
Configuring Syslog for Check Point FireWall-1
Before you configure STRM to integrate with a Check Point FireWall-1 device:
NOTEIf Check Point SmartCenter is installed on Microsoft Windows, you must integrate Check Point with STRM using OPSEC. For more information, see Integrating Check Point FireWall-1 Using OPSEC.
Step 1 Type the following command to access the Check Point console as an expert user:
expert
A password prompt is displayed.
Configuring DSMs
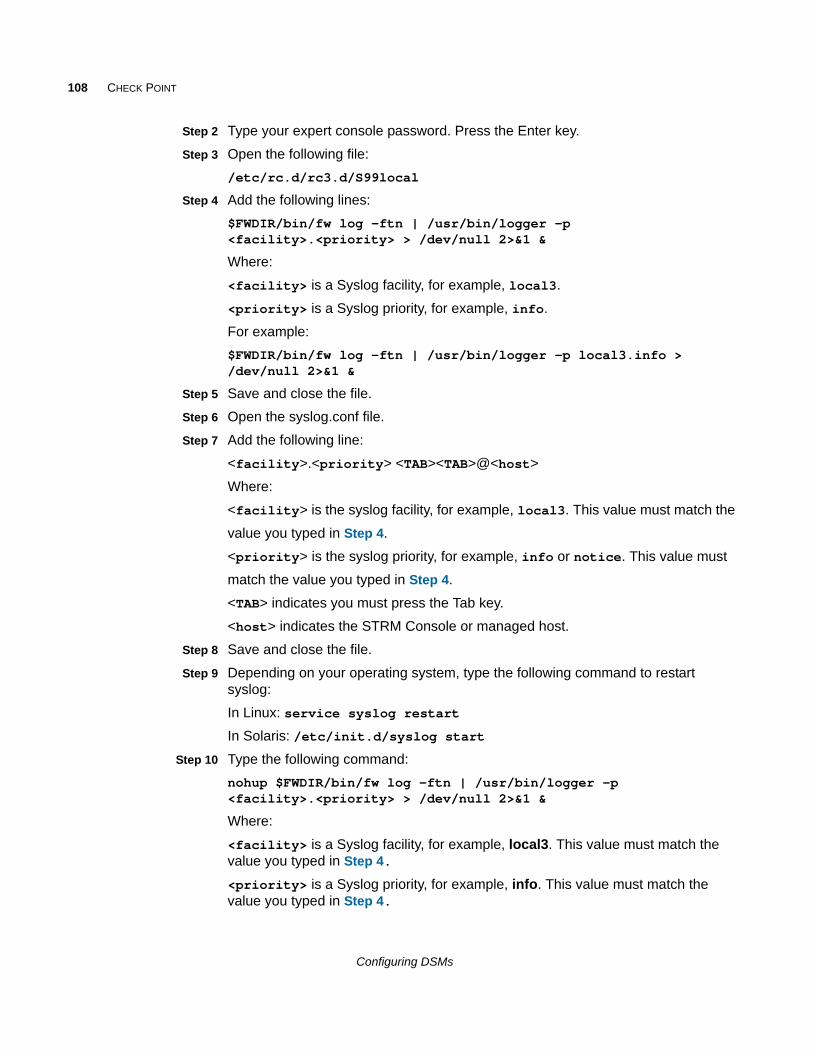
108 CHECK POINT
Step 2 Type your expert console password. Press the Enter key.
Step 3 Open the following file:
/etc/rc.d/rc3.d/S99local
Step 4 Add the following lines:
$FWDIR/bin/fw log -ftn | /usr/bin/logger -p <facility>.<priority> > /dev/null 2>&1 &
Where:
<facility> is a Syslog facility, for example, local3.
<priority> is a Syslog priority, for example, info.
For example:
$FWDIR/bin/fw log -ftn | /usr/bin/logger -p local3.info > /dev/null 2>&1 &
Step 5 Save and close the file.
Step 6 Open the syslog.conf file.
Step 7 Add the following line:
<facility>.<priority> <TAB><TAB>@<host>
Where:
<facility> is the syslog facility, for example, local3. This value must match the
value you typed in Step 4.
<priority> is the syslog priority, for example, info or notice. This value must
match the value you typed in Step 4.
<TAB> indicates you must press the Tab key.
<host> indicates the STRM Console or managed host.
Step 8 Save and close the file.
Step 9 Depending on your operating system, type the following command to restart syslog:
In Linux: service syslog restart
In Solaris: /etc/init.d/syslog start
Step 10 Type the following command:
nohup $FWDIR/bin/fw log -ftn | /usr/bin/logger -p <facility>.<priority> > /dev/null 2>&1 &
Where:
<facility> is a Syslog facility, for example, local3. This value must match the value you typed in Step 4.
<priority> is a Syslog priority, for example, info. This value must match the value you typed in Step 4.
Configuring DSMs
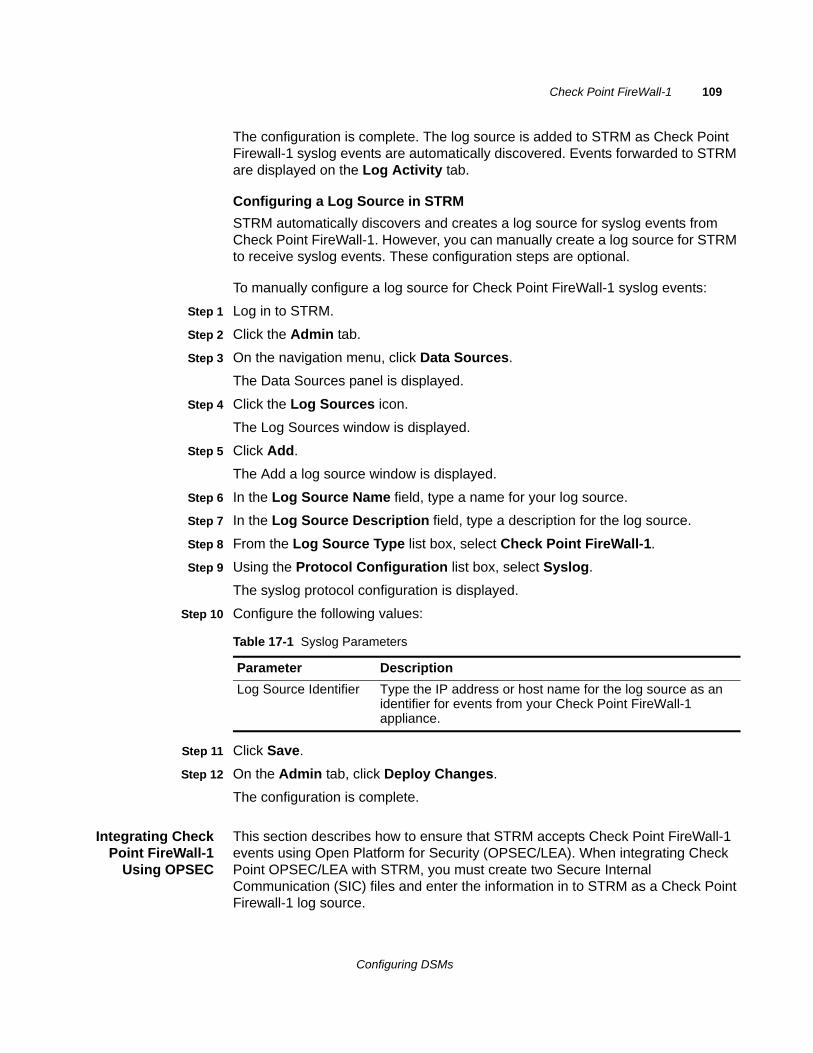
Check Point FireWall-1 109
The configuration is complete. The log source is added to STRM as Check Point Firewall-1 syslog events are automatically discovered. Events forwarded to STRM are displayed on the Log Activity tab.
Configuring a Log Source in STRM
STRM automatically discovers and creates a log source for syslog events from Check Point FireWall-1. However, you can manually create a log source for STRM to receive syslog events. These configuration steps are optional.
To manually configure a log source for Check Point FireWall-1 syslog events:
Step 1 Log in to STRM.
Step 2 Click the Admin tab.
Step 3 On the navigation menu, click Data Sources.
The Data Sources panel is displayed.
Step 4 Click the Log Sources icon.
The Log Sources window is displayed.
Step 5 Click Add.
The Add a log source window is displayed.
Step 6 In the Log Source Name field, type a name for your log source.
Step 7 In the Log Source Description field, type a description for the log source.
Step 8 From the Log Source Type list box, select Check Point FireWall-1.
Step 9 Using the Protocol Configuration list box, select Syslog.
The syslog protocol configuration is displayed.
Step 10 Configure the following values:
Step 11 Click Save.
Step 12 On the Admin tab, click Deploy Changes.
The configuration is complete.
Integrating CheckPoint FireWall-1
Using OPSEC
This section describes how to ensure that STRM accepts Check Point FireWall-1 events using Open Platform for Security (OPSEC/LEA). When integrating Check Point OPSEC/LEA with STRM, you must create two Secure Internal Communication (SIC) files and enter the information in to STRM as a Check Point Firewall-1 log source.
Table 17-1 Syslog Parameters
Parameter Description
Log Source Identifier Type the IP address or host name for the log source as an identifier for events from your Check Point FireWall-1 appliance.
Configuring DSMs
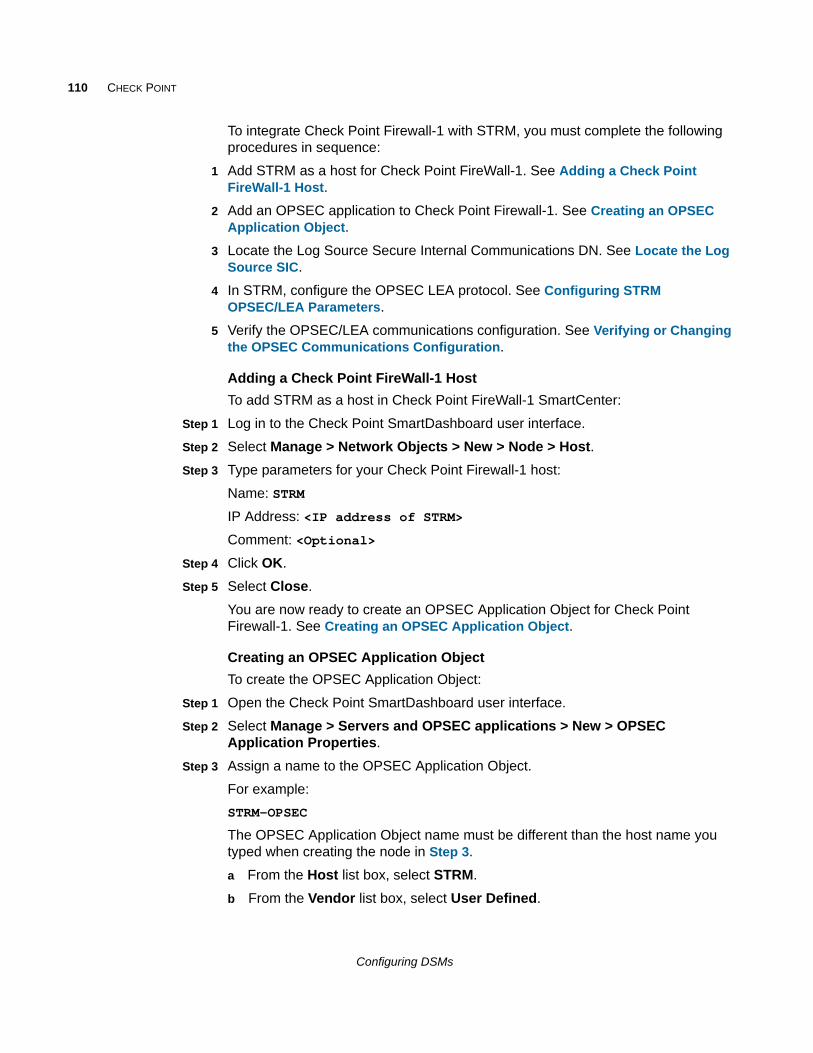
110 CHECK POINT
To integrate Check Point Firewall-1 with STRM, you must complete the following procedures in sequence:
1 Add STRM as a host for Check Point FireWall-1. See Adding a Check Point FireWall-1 Host.
2 Add an OPSEC application to Check Point Firewall-1. See Creating an OPSEC Application Object.
3 Locate the Log Source Secure Internal Communications DN. See Locate the Log Source SIC.
4 In STRM, configure the OPSEC LEA protocol. See Configuring STRM OPSEC/LEA Parameters.
5 Verify the OPSEC/LEA communications configuration. See Verifying or Changing the OPSEC Communications Configuration.
Adding a Check Point FireWall-1 Host
To add STRM as a host in Check Point FireWall-1 SmartCenter:
Step 1 Log in to the Check Point SmartDashboard user interface.
Step 2 Select Manage > Network Objects > New > Node > Host.
Step 3 Type parameters for your Check Point Firewall-1 host:
Name: STRM
IP Address: <IP address of STRM>
Comment: <Optional>
Step 4 Click OK.
Step 5 Select Close.
You are now ready to create an OPSEC Application Object for Check Point Firewall-1. See Creating an OPSEC Application Object.
Creating an OPSEC Application Object
To create the OPSEC Application Object:
Step 1 Open the Check Point SmartDashboard user interface.
Step 2 Select Manage > Servers and OPSEC applications > New > OPSEC Application Properties.
Step 3 Assign a name to the OPSEC Application Object.
For example:
STRM-OPSEC
The OPSEC Application Object name must be different than the host name you typed when creating the node in Step 3.
a From the Host list box, select STRM.
b From the Vendor list box, select User Defined.
Configuring DSMs
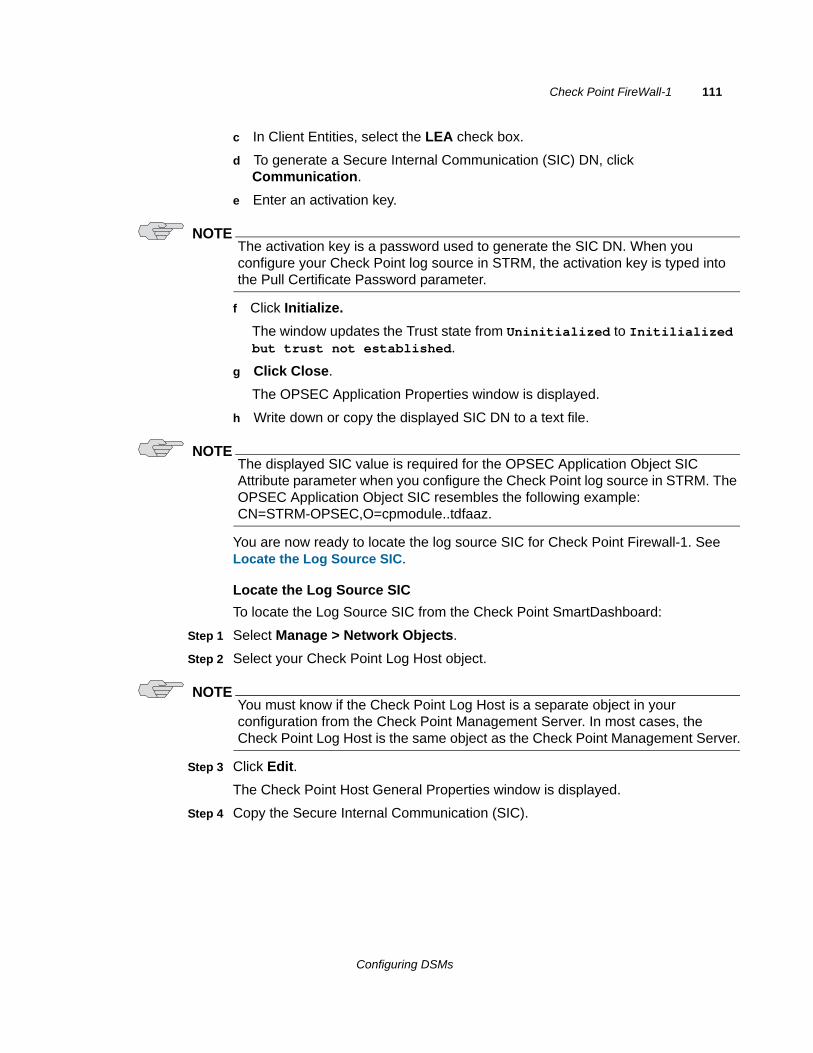
Check Point FireWall-1 111
c In Client Entities, select the LEA check box.
d To generate a Secure Internal Communication (SIC) DN, click Communication.
e Enter an activation key.
NOTEThe activation key is a password used to generate the SIC DN. When you configure your Check Point log source in STRM, the activation key is typed into the Pull Certificate Password parameter.
f Click Initialize.
The window updates the Trust state from Uninitialized to Initilialized but trust not established.
g Click Close.
The OPSEC Application Properties window is displayed.
h Write down or copy the displayed SIC DN to a text file.
NOTEThe displayed SIC value is required for the OPSEC Application Object SIC Attribute parameter when you configure the Check Point log source in STRM. The OPSEC Application Object SIC resembles the following example: CN=STRM-OPSEC,O=cpmodule..tdfaaz.
You are now ready to locate the log source SIC for Check Point Firewall-1. See Locate the Log Source SIC.
Locate the Log Source SIC
To locate the Log Source SIC from the Check Point SmartDashboard:
Step 1 Select Manage > Network Objects.
Step 2 Select your Check Point Log Host object.
NOTEYou must know if the Check Point Log Host is a separate object in your configuration from the Check Point Management Server. In most cases, the Check Point Log Host is the same object as the Check Point Management Server.
Step 3 Click Edit.
The Check Point Host General Properties window is displayed.
Step 4 Copy the Secure Internal Communication (SIC).
Configuring DSMs
112 CHECK POINT
NOTEDepending on your Check Point version, the Communication button might not be available to display the SIC attribute. You can locate the SIC attribute from the Check Point Management Server command-line interface. You must use the cpca_client lscert command from the command-line interface of the Management Server to display all certificates. The Log Source SIC Attribute resembles the following example: cn=cp_mgmt,o=cpmodule…tdfaaz. For more information, see your Check Point Command Line Interface Guide.
You must now install the Security Policy from the Check Point SmartDashboard user interface.
Step 5 Select Policy > Install > OK.
You are now ready to configure the OPSEC LEA protocol. See Configuring STRM OPSEC/LEA Parameters.
Configuring STRM OPSEC/LEA Parameters
To configure the log source in STRM:
Step 1 Log in to STRM.
Step 2 Click the Admin tab.
Step 3 On the navigation menu, click Data Sources.
The Data Sources panel is displayed.
Step 4 Click the Log Sources icon.
The Log Sources window is displayed.
Step 5 Click Add.
The Add a log source window is displayed.
Step 6 From the Log Source Type list box, select Check Point FireWall-1.
Step 7 Using the Protocol Configuration list box, select OPSEC/LEA.
The OPSEC/LEA protocol parameters appear.
Step 8 Configure the following values:
a Log Source Name - Type a name for the log source.
b Log Source Identifier - Type the IP address for the log source. This value must match the value you typed in the Server IP parameter.
c Server IP - Type the IP address of the Check Point host or Check Point Management Server IP.
d Server Port - Type the port used for OPSEC/LEA. The default is 18184.
You must ensure the existing firewall policy permits the LEA/OPSEC connection from your STRM.
e OPSEC Application Object SIC Attribute - Type the SIC DN of the OPSEC Application Object displayed in Creating an OPSEC Application Object - Step h.
Configuring DSMs
Check Point FireWall-1 113
f Log Source SIC Attribute - Type the SIC name for the server generating log sources from Locate the Log Source SIC - Step 4.
SIC attribute names can be up to 255 characters in length and are case sensitive.
g Specify Certificate - Ensure the Specify Certificate check box is clear.
h Pull Certificate Password - Type the activation key password from Creating an OPSEC Application Object - Step e.
i Certificate Authority IP - Type the Check Point Manager Server IP address.
j OPSEC Application - Type the name of the application requesting a certificate.
For example:
If the value is CN=STRM-OPSEC,O=cpmodule...tdfaaz, the OPSEC Application value is STRM-OPSEC.
For more information on the OPSEC/LEA parameters, see the STRM Log Sources Users Guide.
Step 9 Click Save.
Step 10 On the Admin tab, click Deploy Changes.
You are now ready to verify your OPSEC/LEA communications for Check Point Firewall-1.
Verifying orChanging the OPSEC
CommunicationsConfiguration
This section describes how to modify your Check Point FireWall-1 configuration to allow OPSEC communications on non-standard ports, configure communications in a clear text, un-authenticated stream, and verify the configuration in STRM.
This section includes the following information:
• Changing Your Check Point Custom Log Manager (CLM) IP Address
• Changing the Default Port on which OPSEC LEA Communicates
• Configuring OPSEC LEA for Un-Encrypted Communications
Changing Your Check Point Custom Log Manager (CLM) IP Address
If your Check Point configuration includes a Check Point Custom Log Manager (CLM), you might eventually need to change the IP address for the CLM, which impacts any of the automatically discovered Check Point log sources from that CLM in STRM. This is because when you manually add the log source for the CLM using the OPSEC/LEA protocol, then all Check Point firewalls that forward logs to the CLM are automatically discovered by STRM. These automatically discovered log sources cannot be edited. If the CLM IP address changes, you must edit the original Check Point CLM log source that contains the OPSEC/LEA protocol configuration and update the server IP address and log source identifier.
After you update the log source for the new Check Point CLM IP address, then any new events reported from the automatically discovered Check Point log sources are updated.
Configuring DSMs
114 CHECK POINT
NOTEDo not delete and recreate your Check Point CLM or automatically discovered log sources in STRM. Deleting a log source does not delete event data, but can make finding previously recorded events more difficult to find.
To update your Check Point OPSEC log source:
Step 1 Log in to STRM.
Step 2 Click the Admin tab.
Step 3 On the navigation menu, click Data Sources.
The Data Sources panel is displayed.
Step 4 Click the Log Sources icon.
The Log Sources window is displayed.
Step 5 Select the original Check Point CLM log source containing the OPSEC/LEA protocol configuration and click Edit.
Step 6 In the Log Source Identifier field, type a new identifying name of your Check Point CLM.
Step 7 In the Server IP field, type the new IP address of your Check Point CLM.
Step 8 Click Save.
The IP address update for your Check Point CLM in STRM is complete.
Changing the Default Port on which OPSEC LEA Communicates
To change the default port on which OPSEC LEA communicates (that is, port 18184):
Step 1 At the command-line prompt of your Check Point SmartCenter Server, type the following command to stop the firewall services:
cpstop
Step 2 Depending on your Check Point SmartCenter Server operating system, open the following file:
• Linux - $FWDIR\conf\fwopsec.conf
• Windows - %FWDIR%\conf\fwopsec.conf
The default contents of this file are as follows:
# The VPN-1/FireWall-1 default settings are:## sam_server auth_port 0# sam_server port 18183## lea_server auth_port 18184# lea_server port 0## ela_server auth_port 18187# ela_server port 0
Configuring DSMs
Check Point FireWall-1 115
## cpmi_server auth_port 18190## uaa_server auth_port 19191# uaa_server port 0#
Step 3 Change the default lea_server auth_port from 18184 to another port number.
Step 4 Remove the hash (#) mark from that line.
For example:
lea_server auth_port 18888# lea_server port 0
Step 5 Save and close the file.
Step 6 Type the following command to start the firewall services:
cpstart
Configuring OPSEC LEA for Un-Encrypted Communications
To configure the OPSEC LEA protocol for un-encrypted communications:
Step 1 At the command-line prompt of your Check Point SmartCenter Server, stop the firewall services by typing the following command:
cpstop
Step 2 Depending on your Check Point SmartCenter Server operating system, open the following file:
• Linux - $FWDIR\conf\fwopsec.conf
• Windows - %FWDIR%\conf\fwopsec.conf
Step 3 Change the default lea_server auth_port from 18184 to 0.
Step 4 Change the default lea_server port from 0 to 18184.
Step 5 Remove the hash (#) marks from both lines.
For example:
lea_server auth_port 0lea_server port 18184
Step 6 Save and close the file.
Step 7 Type the following command to start the firewall services:
cpstart
Step 8 You are now ready to configure the log source in STRM.
To configure STRM to receive events from a Check Point Firewall-1 device:
Step 1 From the Log Source Type list box, select Check Point FireWall-1.
Step 2 From the Protocol Configuration list box, select OPSEC/LEA.
Configuring DSMs
116 CHECK POINT
For more information on configuring log sources, see the STRM Log Sources Users Guide.
For more information on configuring your Check Point Firewall-1, see your vendor documentation.
Check Point Provider-1
You can configure STRM to integrate with a Check Point Provider-1 device. All events from Check Point Provider-1 are parsed using the Check Point FireWall-1 DSM. You can integrate Check Point Provider-1 using one of the following methods:
• Integrating Check Point Provider-1 Using Syslog
• Integrating Check Point Provider-1 Using OPSEC
NOTEDepending on your Operating System, the procedures for the Check Point Provider-1 device can vary. The following procedures are based on the Check Point SecurePlatform operating system.
Integrating CheckPoint Provider-1
Using Syslog
This method ensures the Check Point FireWall-1 DSM for STRM accepts Check Point Provider-1 events using syslog. STRM records all relevant Check Point Provider-1 events.
Before you configure STRM to integrate with a Check Point Provider-1 device, you must:
Step 1 Type the following command to access the console as an expert user:
expert
A password prompt is displayed.
Step 2 Type your expert console password. Press the Enter key.
Step 3 Type the following command:
csh
Step 4 Select the desired customer logs:
mdsenv <customer name>
Step 5 Type the following command:
# nohup $FWDIR/bin/fw log -ftn | /usr/bin/logger -p <facility>.<priority> 2>&1 &
Where:
<facility> is a Syslog facility, for example, local3.
<priority> is a Syslog priority, for example, info.
You are now ready to configure the log source in STRM.
Configuring DSMs
Check Point Provider-1 117
The configuration is complete. The log source is added to STRM as Check Point Firewall-1 syslog events are automatically discovered. Events forwarded to STRM are displayed on the Log Activity tab.
Configuring a Log Source in STRM
STRM automatically discovers and creates a log source for syslog events from Check Point Provider-1 as Check Point FireWall-1 events. However, you can manually create a log source for STRM to receive syslog events. These configuration steps are optional.
To manually configure a log source for Check Point Provider-1 syslog events:
Step 1 Log in to STRM.
Step 2 Click the Admin tab.
Step 3 On the navigation menu, click Data Sources.
The Data Sources panel is displayed.
Step 4 Click the Log Sources icon.
The Log Sources window is displayed.
Step 5 Click Add.
The Add a log source window is displayed.
Step 6 In the Log Source Name field, type a name for your log source.
Step 7 In the Log Source Description field, type a description for the log source.
Step 8 From the Log Source Type list box, select Check Point Firewall-1.
Step 9 Using the Protocol Configuration list box, select Syslog.
The syslog protocol configuration is displayed.
Step 10 Configure the following values:
Step 11 Click Save.
Step 12 On the Admin tab, click Deploy Changes.
The configuration is complete.
Table 17-2 Syslog Parameters
Parameter Description
Log Source Identifier Type the IP address or host name for the log source as an identifier for events from your Check Point Provider-1 appliance.
Configuring DSMs
118 CHECK POINT
Integrating CheckPoint Provider-1
Using OPSEC
This method ensures the STRM Check Point FireWall-1 DSM accepts Check Point Provider-1 events using OPSEC.
To enable Check Point Provider-1 and STRM integration, you must:
1 Configure Check Point Provider-1 SmartCenter. For more information, see Reconfiguring Check Point Provider-1 SmartCenter.
2 Configure the log source in STRM. For more information, see Configuring the Check Point Log Source.
Reconfiguring Check Point Provider-1 SmartCenter
This section describes how to reconfigure the Check Point Provider-1 SmartCenter. In the Check Point Provider-1 Management Domain GUI (MDG), create a host object representing the STRM. The leapipe is the connection between the Check Point Provider-1 and STRM.
To reconfigure the Check Point Provider-1 SmartCenter (MDG):
Step 1 To create a host object, open the Check Point SmartDashboard user interface and select Manage > Network Objects > New > Node > Host.
Step 2 Type the Name, IP Address, and optional Comment for your host.
Step 3 Click OK.
Step 4 Select Close.
Step 5 To create the OPSEC connection, select Manage > Servers and OPSEC Applications New > OPSEC Application Properties.
Step 6 Type a name and optional comment.
The name you type must be different than the name used in Step 2.
Step 7 From the Host drop-down menu, select the STRM host object that you just created.
Step 8 From Application Properties, select User Defined as the Vendor type.
Step 9 From Client Entries, select LEA.
Step 10 Configure the Secure Internal Communication (SIC) certificate, click Communication and enter an activation key.
Step 11 Select OK and then Close.
Step 12 To install the Policy on your firewall, select Policy > Install > OK.
Configuring the Check Point Log Source
To configure STRM to receive events from a Check Point Provider-1 device:
Step 1 From the Log Source Type list box, select Check Point Firewall-1.
Step 2 From the Protocol Configuration list box, select OPSEC/LEA.
For more information on configuring OPSEC/LEA, see the STRM Log Sources Users Guide.
Configuring DSMs
18
CISCOThis section provides information on the following DSMs:
• Cisco ACE Firewall
• Cisco Aironet
• Cisco ACS
• Cisco ASA
• Cisco CallManager
• Cisco CatOS for Catalyst Switches
• Cisco CSA
• Cisco FWSM
• Cisco IDS/IPS
• Cisco IronPort
• Cisco NAC
• Cisco Nexus
• Cisco IOS
• Cisco Pix
• Cisco VPN 3000 Concentrator
• Cisco Wireless Services Module
• Cisco Wireless LAN Controllers
Cisco ACE Firewall You can integrate a Cisco ACE firewall with STRM. A Cisco ACE firewall DSM accepts events using syslog. STRM records all relevant events. Before you configure STRM to integrate with an ACE firewall, you must configure your Cisco ACE Firewall to forward all device logs to your STRM.
This section includes the following topics:
• Configuring Cisco ACE Firewall
• Configuring a Log Source in STRM
Configuring DSMs
120 CISCO
Configuring CiscoACE Firewall
To forward Cisco ACE device logs to STRM:
Step 1 Log in to your Cisco ACE device.
Step 2 From the shell interface, select Main Menu > Advanced Options > Syslog Configuration.
Step 3 The Syslog Configuration menu varies depending on whether there are any syslog destination hosts configured yet. If no syslog destinations have been added, create one by selecting the Add First Server option. Click OK.
Step 4 Type the hostname or IP address of the destination host and port in the First Syslog Server field. Click OK.
The system restarts with new settings. When finished, the Syslog server window displays the host you have configured.
Step 5 Click OK.
The Syslog Configuration menu is displayed. Notice that options for editing the server configuration, removing the server, or adding a second server are now available.
Step 6 If you want to add another server, click Add Second Server.
At any time, click the View Syslog options to view existing server configurations.
Step 7 To return to the Advanced Menu, click Return.
The configuration is complete. The log source is added to STRM as Cisco ACE Firewall events are automatically discovered. Events forwarded to STRM by Cisco ACE Firewall appliances are displayed on the Log Activity tab of STRM.
Configuring a LogSource in STRM
STRM automatically discovers and creates a log source for syslog events from Cisco ACE Firewalls. However, you can manually create a log source for STRM to receive syslog events. These configuration steps are optional.
To manually configure a log source for Cisco ACE Firewall:
Step 1 Log in to STRM.
Step 2 Click the Admin tab.
Step 3 On the navigation menu, click Data Sources.
The Data Sources panel is displayed.
Step 4 Click the Log Sources icon.
The Log Sources window is displayed.
Step 5 Click Add.
The Add a log source window is displayed.
Step 6 In the Log Source Name field, type a name for your log source.
Step 7 In the Log Source Description field, type a description for the log source.
Configuring DSMs
Cisco Aironet 121
Step 8 From the Log Source Type list box, select Cisco ACE Firewall.
Step 9 Using the Protocol Configuration list box, select Syslog.
The syslog protocol configuration is displayed.
Step 10 Configure the following values:
Step 11 Click Save.
Step 12 On the Admin tab, click Deploy Changes.
The configuration is complete.
Cisco Aironet You can integrate a Cisco Aironet devices with STRM. A Cisco Aironet DSM accepts Cisco Emblem Format events using syslog. Before you configure STRM to integrate with a Cisco Aironet device, you must configure your Cisco Aironet appliance to forward syslog events.
This section includes the following topics:
• Configuring Cisco Aironet
• Configuring a Log Source in STRM
Configuring CiscoAironet
To configure Cisco Aironet to forward events:
Step 1 Establish a connection to the Cisco Aironet device using one of the following methods”
• Telnet to the wireless access point
• Access the console
Step 2 Type the following command to access privileged EXEC mode:
enable
Step 3 Type the following command to access global configuration mode:
config terminal
Step 4 Type the following command to enable message logging:
logging on
Step 5 Configure the syslog facility. The default is local7.
logging facility <facility, for example, local7>
Table 18-1 Syslog Parameters
Parameter Description
Log Source Identifier Type the IP address or host name for the log source as an identifier for events from your Cisco ACE Firewalls.
Configuring DSMs
122 CISCO
Step 6 Type the following command to log messages to your STRM:
logging <IP address of your STRM>
Step 7 Enable timestamp on log messages:
service timestamp log datatime
Step 8 Return to privileged EXEC mode:
end
Step 9 View your entries:
show running-config
Step 10 Save your entries in the configuration file:
copy running-config startup-config
The configuration is complete. The log source is added to STRM as Cisco Aironet events are automatically discovered. Events forwarded to STRM by Cisco Aironet appliances are displayed on the Log Activity tab of STRM.
Configuring a LogSource in STRM
STRM automatically discovers and creates a log source for syslog events from Cisco Aironet. However, you can manually create a log source for STRM to receive syslog events. These configuration steps are optional.
To manually configure a log source for Cisco Aironet:
Step 1 Log in to STRM.
Step 2 Click the Admin tab.
Step 3 On the navigation menu, click Data Sources.
The Data Sources panel is displayed.
Step 4 Click the Log Sources icon.
The Log Sources window is displayed.
Step 5 Click Add.
The Add a log source window is displayed.
Step 6 In the Log Source Name field, type a name for your log source.
Step 7 In the Log Source Description field, type a description for the log source.
Step 8 From the Log Source Type list box, select Cisco Aironet.
Step 9 Using the Protocol Configuration list box, select Syslog.
The syslog protocol configuration is displayed.
Step 10 Configure the following values:
Table 18-2 Syslog Parameters
Parameter Description
Log Source Identifier Type the IP address or host name for the log source as an identifier for events from your Cisco Aironet appliance.
Configuring DSMs
Cisco ACS 123
Step 11 Click Save.
Step 12 On the Admin tab, click Deploy Changes.
The configuration is complete.
Cisco ACS The Cisco ACS DSM for STRM accepts syslog ACS events using syslog. STRM records all relevant and available information from the event. You can integrate Cisco ACS with STRM using one of the following methods:
• Configure your Cisco ACS device to directly send syslog to STRM for Cisco ACS v5.x. See Configuring Syslog for Cisco ACS v5.x.
• Configure your Cisco ACS device to directly send syslog to STRM for Cisco ACS v4.x. See Configuring Syslog for Cisco ACS v4.x.
• A server using the STRM Adaptive Log Exporter (Cisco ACS software version 3.x or later). See Configuring Cisco ACS for the Adaptive Log Exporter.
NOTESTRM only supports Cisco ACS versions prior to v3.x using a Universal DSM.
Configuring Syslogfor Cisco ACS v5.x
To configure syslog forwarding from a Cisco ACS appliance with software version 5.x, you must:
1 Create a remote log target to forward syslog events to STRM. For more information, see Creating a Remote Log Target.
2 Configure event categories logged by Cisco ACS. For more information, see Configuring Cisco ACS Global Logging Categories.
3 Optional. Configure the log source in STRM. For more information, see Configuring a Log Source for Cisco ACS v.5x.
Creating a Remote Log Target
To create a remote log target for your Cisco ACS appliance:
Step 1 Log in to your Cisco ACS appliance.
Step 2 On the navigation menu, click System Administration > Configuration > Log Configuration > Remote Log Targets.
The Remote Log Targets page is displayed.
Step 3 Click Create.
Step 4 Configure the following parameters:
Table 18-1 Remote Target Parameters
Parameter Description
Name Type a name for the remote syslog target.
Description Type a description for the remote syslog target.
Type Select Syslog.
Configuring DSMs
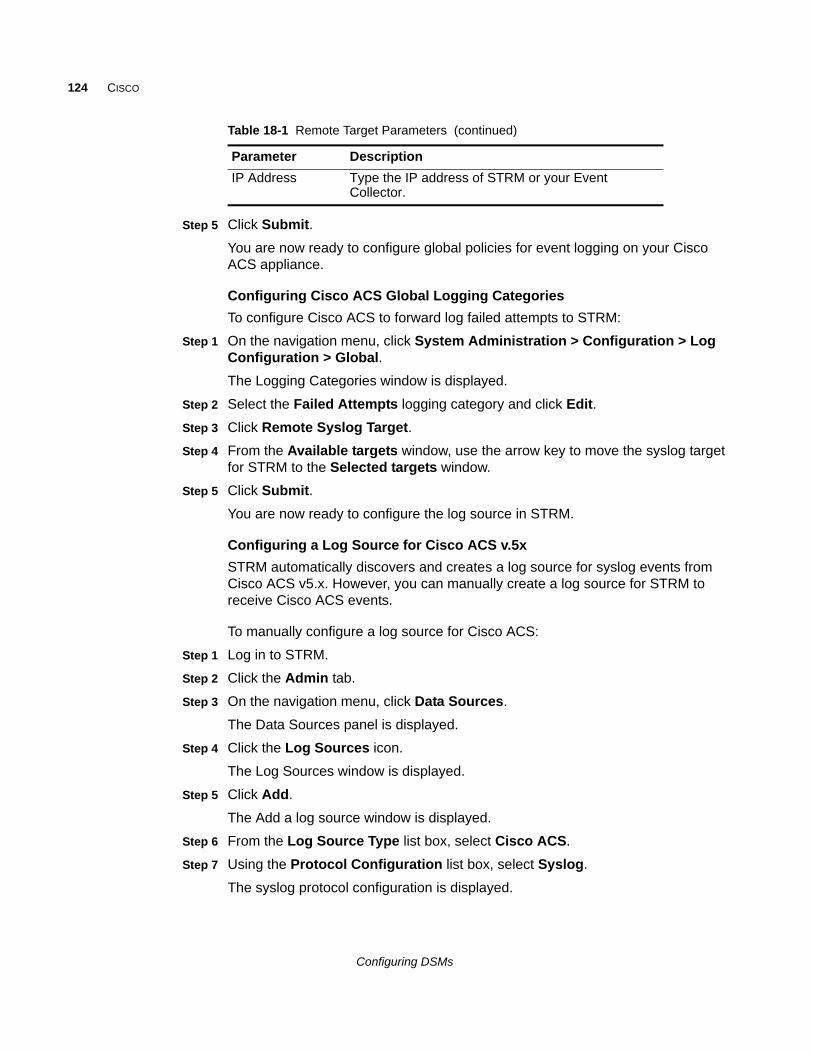
124 CISCO
Step 5 Click Submit.
You are now ready to configure global policies for event logging on your Cisco ACS appliance.
Configuring Cisco ACS Global Logging Categories
To configure Cisco ACS to forward log failed attempts to STRM:
Step 1 On the navigation menu, click System Administration > Configuration > Log Configuration > Global.
The Logging Categories window is displayed.
Step 2 Select the Failed Attempts logging category and click Edit.
Step 3 Click Remote Syslog Target.
Step 4 From the Available targets window, use the arrow key to move the syslog target for STRM to the Selected targets window.
Step 5 Click Submit.
You are now ready to configure the log source in STRM.
Configuring a Log Source for Cisco ACS v.5x
STRM automatically discovers and creates a log source for syslog events from Cisco ACS v5.x. However, you can manually create a log source for STRM to receive Cisco ACS events.
To manually configure a log source for Cisco ACS:
Step 1 Log in to STRM.
Step 2 Click the Admin tab.
Step 3 On the navigation menu, click Data Sources.
The Data Sources panel is displayed.
Step 4 Click the Log Sources icon.
The Log Sources window is displayed.
Step 5 Click Add.
The Add a log source window is displayed.
Step 6 From the Log Source Type list box, select Cisco ACS.
Step 7 Using the Protocol Configuration list box, select Syslog.
The syslog protocol configuration is displayed.
IP Address Type the IP address of STRM or your Event Collector.
Table 18-1 Remote Target Parameters (continued)
Parameter Description
Configuring DSMs
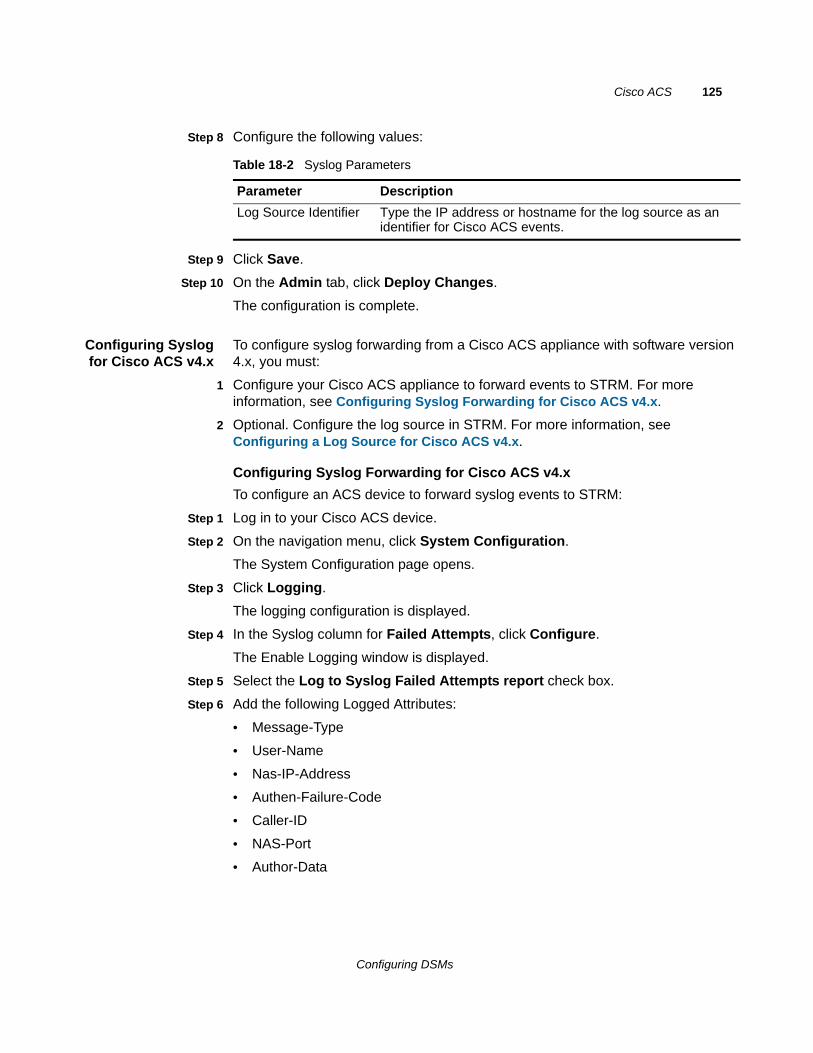
Cisco ACS 125
Step 8 Configure the following values:
Step 9 Click Save.
Step 10 On the Admin tab, click Deploy Changes.
The configuration is complete.
Configuring Syslogfor Cisco ACS v4.x
To configure syslog forwarding from a Cisco ACS appliance with software version 4.x, you must:
1 Configure your Cisco ACS appliance to forward events to STRM. For more information, see Configuring Syslog Forwarding for Cisco ACS v4.x.
2 Optional. Configure the log source in STRM. For more information, see Configuring a Log Source for Cisco ACS v4.x.
Configuring Syslog Forwarding for Cisco ACS v4.x
To configure an ACS device to forward syslog events to STRM:
Step 1 Log in to your Cisco ACS device.
Step 2 On the navigation menu, click System Configuration.
The System Configuration page opens.
Step 3 Click Logging.
The logging configuration is displayed.
Step 4 In the Syslog column for Failed Attempts, click Configure.
The Enable Logging window is displayed.
Step 5 Select the Log to Syslog Failed Attempts report check box.
Step 6 Add the following Logged Attributes:
• Message-Type
• User-Name
• Nas-IP-Address
• Authen-Failure-Code
• Caller-ID
• NAS-Port
• Author-Data
Table 18-2 Syslog Parameters
Parameter Description
Log Source Identifier Type the IP address or hostname for the log source as an identifier for Cisco ACS events.
Configuring DSMs
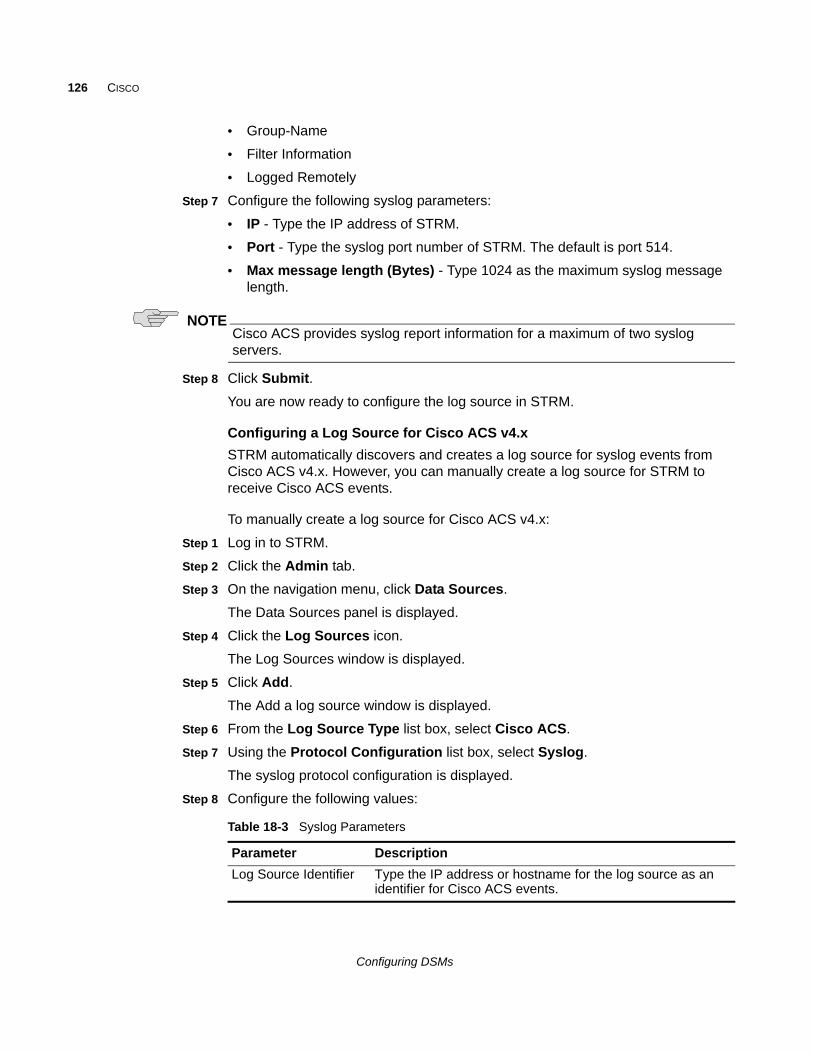
126 CISCO
• Group-Name
• Filter Information
• Logged Remotely
Step 7 Configure the following syslog parameters:
• IP - Type the IP address of STRM.
• Port - Type the syslog port number of STRM. The default is port 514.
• Max message length (Bytes) - Type 1024 as the maximum syslog message length.
NOTECisco ACS provides syslog report information for a maximum of two syslog servers.
Step 8 Click Submit.
You are now ready to configure the log source in STRM.
Configuring a Log Source for Cisco ACS v4.x
STRM automatically discovers and creates a log source for syslog events from Cisco ACS v4.x. However, you can manually create a log source for STRM to receive Cisco ACS events.
To manually create a log source for Cisco ACS v4.x:
Step 1 Log in to STRM.
Step 2 Click the Admin tab.
Step 3 On the navigation menu, click Data Sources.
The Data Sources panel is displayed.
Step 4 Click the Log Sources icon.
The Log Sources window is displayed.
Step 5 Click Add.
The Add a log source window is displayed.
Step 6 From the Log Source Type list box, select Cisco ACS.
Step 7 Using the Protocol Configuration list box, select Syslog.
The syslog protocol configuration is displayed.
Step 8 Configure the following values:
Table 18-3 Syslog Parameters
Parameter Description
Log Source Identifier Type the IP address or hostname for the log source as an identifier for Cisco ACS events.
Configuring DSMs
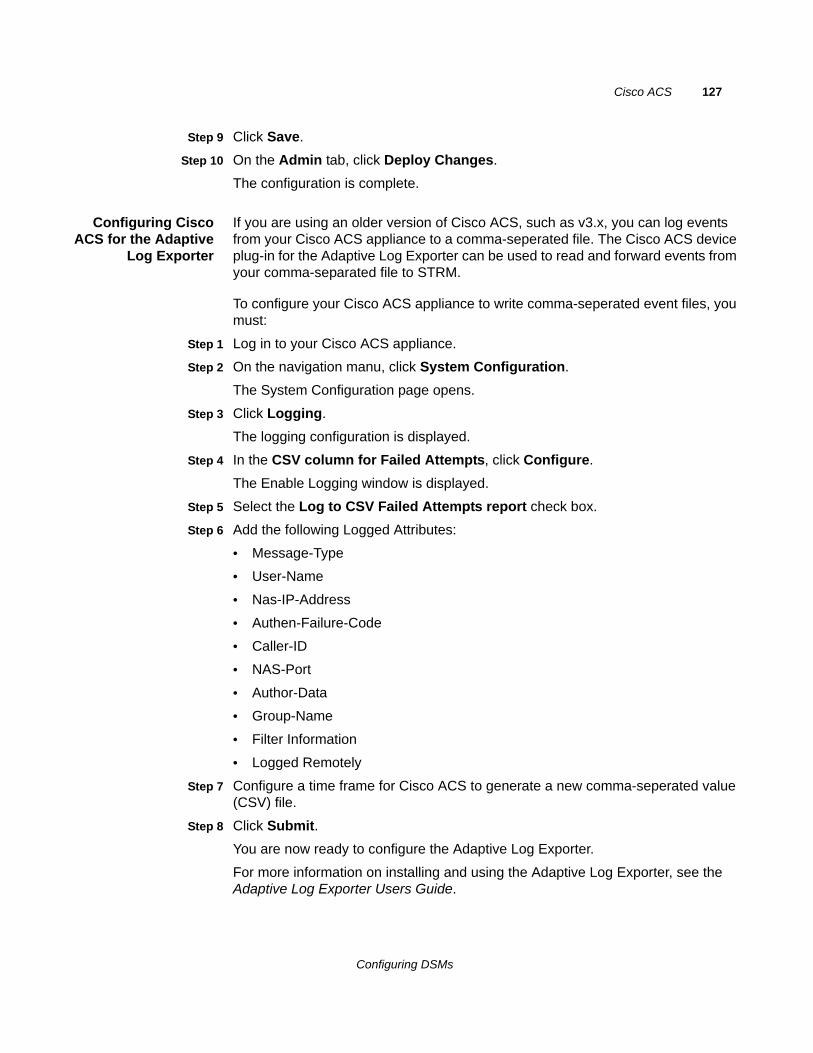
Cisco ACS 127
Step 9 Click Save.
Step 10 On the Admin tab, click Deploy Changes.
The configuration is complete.
Configuring CiscoACS for the Adaptive
Log Exporter
If you are using an older version of Cisco ACS, such as v3.x, you can log events from your Cisco ACS appliance to a comma-seperated file. The Cisco ACS device plug-in for the Adaptive Log Exporter can be used to read and forward events from your comma-separated file to STRM.
To configure your Cisco ACS appliance to write comma-seperated event files, you must:
Step 1 Log in to your Cisco ACS appliance.
Step 2 On the navigation manu, click System Configuration.
The System Configuration page opens.
Step 3 Click Logging.
The logging configuration is displayed.
Step 4 In the CSV column for Failed Attempts, click Configure.
The Enable Logging window is displayed.
Step 5 Select the Log to CSV Failed Attempts report check box.
Step 6 Add the following Logged Attributes:
• Message-Type
• User-Name
• Nas-IP-Address
• Authen-Failure-Code
• Caller-ID
• NAS-Port
• Author-Data
• Group-Name
• Filter Information
• Logged Remotely
Step 7 Configure a time frame for Cisco ACS to generate a new comma-seperated value (CSV) file.
Step 8 Click Submit.
You are now ready to configure the Adaptive Log Exporter.
For more information on installing and using the Adaptive Log Exporter, see the Adaptive Log Exporter Users Guide.
Configuring DSMs
128 CISCO
Cisco ASA You can integrate a Cisco Adaptive Security Appliance (ASA) with STRM. A Cisco ASA DSM accepts events using syslog or NetFlow using NetFlow Security Event Logging (NSEL). STRM records all relevant events. Before you configure STRM, you must configure your Cisco ASA device to forward syslog or NetFlow NSEL events.
Choose one of the following options:
• Forward events to STRM using syslog. See Integrating Cisco ASA Using Syslog
• Forward events to STRM using NetFlow NSEL. See Integrating Cisco ASA for NetFlow using NSEL
Integrating CiscoASA Using Syslog
This section includes the following topics:
• Configuring Syslog Forwarding for Cisco ASA
• Configuring a Log Source in STRM
Configuring Syslog Forwarding for Cisco ASA
This section describes how to configure Cisco ASA to forward syslog events.
Step 1 Log in to the Cisco ASA device.
Step 2 Type the following command to access privileged EXEC mode:
enable
Step 3 Type the following command to access global configuration mode:
conf t
Step 4 Enable logging:
logging enable
Step 5 Configure the logging details:
logging console warning
logging trap warning
logging asdm warning
Step 6 Type the following command to configure logging to STRM:
logging host <interface> <IP address>
Where:
<interface> is the name of the Cisco Adaptive Security Appliance interface.
<IP address> is the IP address of STRM.
NOTEUsing the command show interfaces displays all available interfaces for your Cisco device.
Configuring DSMs
Cisco ASA 129
Step 7 Disable the output object name option:
no names
You must disable the output object name option to ensure that the logs use IP addresses and not object names.
Step 8 Exit the configuration:
exit
Step 9 Save the changes:
write mem
The configuration is complete. The log source is added to STRM as Cisco ASA syslog events are automatically discovered. Events forwarded to STRM by Cisco ASA are displayed on the Log Activity tab of STRM.
Configuring a Log Source in STRM
STRM automatically discovers and creates a log source for syslog events from Cisco ASA. However, you can manually create a log source for STRM to receive syslog events. These configuration steps are optional.
To manually configure a log source for Cisco ASA syslog events:
Step 1 Log in to STRM.
Step 2 Click the Admin tab.
Step 3 On the navigation menu, click Data Sources.
The Data Sources panel is displayed.
Step 4 Click the Log Sources icon.
The Log Sources window is displayed.
Step 5 Click Add.
The Add a log source window is displayed.
Step 6 In the Log Source Name field, type a name for your log source.
Step 7 In the Log Source Description field, type a description for the log source.
Step 8 From the Log Source Type list box, select Cisco Adaptive Security Appliance (ASA).
Step 9 Using the Protocol Configuration list box, select Syslog.
The syslog protocol configuration is displayed.
Step 10 Configure the following values:
Table 18-4 Syslog Parameters
Parameter Description
Log Source Identifier Type the IP address or host name for the log source as an identifier for events from your OSSEC installations.
Configuring DSMs
130 CISCO
Step 11 Click Save.
Step 12 On the Admin tab, click Deploy Changes.
The configuration is complete.
Integrating CiscoASA for NetFlow
using NSEL
This section includes the following topics:
• Configuring NetFlow Using NSEL
• Configuring a Log Source in STRM
Configuring NetFlow Using NSEL
To configure Cisco ASA to forward NetFlow events using NSEL.
Step 1 Log in to the Cisco ASA device command-line interface (CLI).
Step 2 Type the following command to access privileged EXEC mode:
enable
Step 3 Type the following command to access global configuration mode:
conf t
Step 4 Disable the output object name option:
no names
Step 5 Type the following command to enable NetFlow export:
flow-export destination <interface-name> <ipv4-address or hostname> <udp-port>
Where:
<interface-name> is the name of the Cisco Adaptive Security Appliance interface for the NetFlow collector.
<ipv4-address or hostname> is the IP address or host name of the Cisco ASA device with the NetFlow collector application.
<udp-port> is the UDP port number to which NetFlow packets are sent.
NOTESTRM typically uses port 2055 for NetFlow event data on QFlow Collectors. You must configure a different UDP port on your Cisco Adaptive Security Appliance for NetFlow using NSEL.
Step 6 Type the following command to configure the NSEL class-map:
class-map flow_export_class
Step 7 Choose one of the following traffic options:
a To configure a NetFlow access list to match specific traffic, type the command:
match access-list flow_export_acl
b To configure NetFlow to match any traffic, type the command:
match any
Configuring DSMs
Cisco ASA 131
NOTEThe Access Control List (ACL) must exist on the Cisco ASA device before defining the traffic match option in Step 7.
Step 8 Type the following command to configure the NSEL policy-map:
policy-map flow_export_policy
Step 9 Type the following command to define a class for the flow-export action:
class flow_export_class
Step 10 Type the following command to configure the flow-export action:
flow-export event-type all destination <IP address>
Where <IP address> is the IP address of STRM.
NOTEIf you are using a Cisco ASA version before v8.3 you can skipStep 10 as the device defaults to the flow-export destination. For more information, see your Cisco ASA documentation.
Step 11 Type the following command to add the service policy globally:
service-policy flow_export_policy global
Step 12 Exit the configuration:
exit
Step 13 Save the changes:
write mem
You must verify that your collector applications use the Event Time field to correlate events.
Configuring a Log Source in STRM
STRM does not automatically discover or create log sources for syslog events from Cisco ASA using NetFlow and NSEL. To integrate Cisco ASA using NetFlow with STRM, you must manually create a log source to receive NetFlow events.
NOTEYour system must be running the latest version of the NSEL protocol to integrate with a Cisco ASA device using NetFlow NSEL. The NSEL protocol is available on Juniper customer support or through auto updates in STRM.
To configure a log source:
Step 1 Log in to STRM.
Step 2 Click the Admin tab.
Step 3 On the navigation menu, click Data Sources.
The Data Sources panel is displayed.
Configuring DSMs
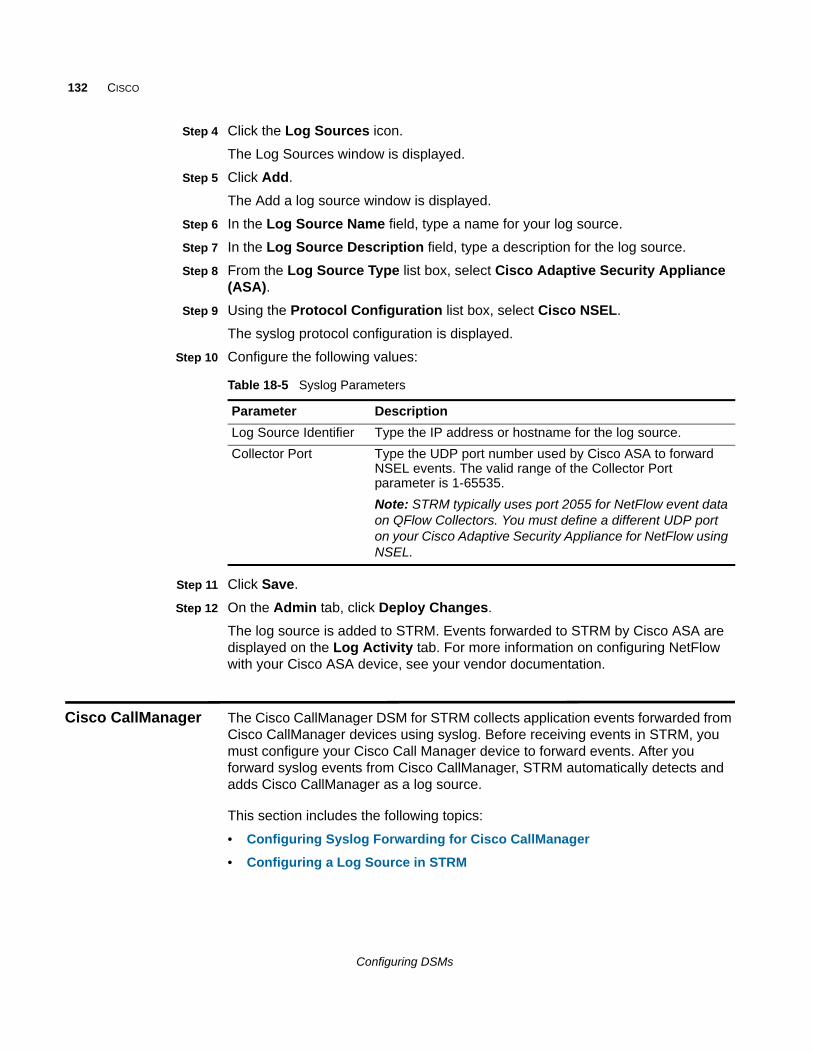
132 CISCO
Step 4 Click the Log Sources icon.
The Log Sources window is displayed.
Step 5 Click Add.
The Add a log source window is displayed.
Step 6 In the Log Source Name field, type a name for your log source.
Step 7 In the Log Source Description field, type a description for the log source.
Step 8 From the Log Source Type list box, select Cisco Adaptive Security Appliance (ASA).
Step 9 Using the Protocol Configuration list box, select Cisco NSEL.
The syslog protocol configuration is displayed.
Step 10 Configure the following values:
Step 11 Click Save.
Step 12 On the Admin tab, click Deploy Changes.
The log source is added to STRM. Events forwarded to STRM by Cisco ASA are displayed on the Log Activity tab. For more information on configuring NetFlow with your Cisco ASA device, see your vendor documentation.
Cisco CallManager The Cisco CallManager DSM for STRM collects application events forwarded from Cisco CallManager devices using syslog. Before receiving events in STRM, you must configure your Cisco Call Manager device to forward events. After you forward syslog events from Cisco CallManager, STRM automatically detects and adds Cisco CallManager as a log source.
This section includes the following topics:
• Configuring Syslog Forwarding for Cisco CallManager
• Configuring a Log Source in STRM
Table 18-5 Syslog Parameters
Parameter Description
Log Source Identifier Type the IP address or hostname for the log source.
Collector Port Type the UDP port number used by Cisco ASA to forward NSEL events. The valid range of the Collector Port parameter is 1-65535.
Note: STRM typically uses port 2055 for NetFlow event data on QFlow Collectors. You must define a different UDP port on your Cisco Adaptive Security Appliance for NetFlow using NSEL.
Configuring DSMs
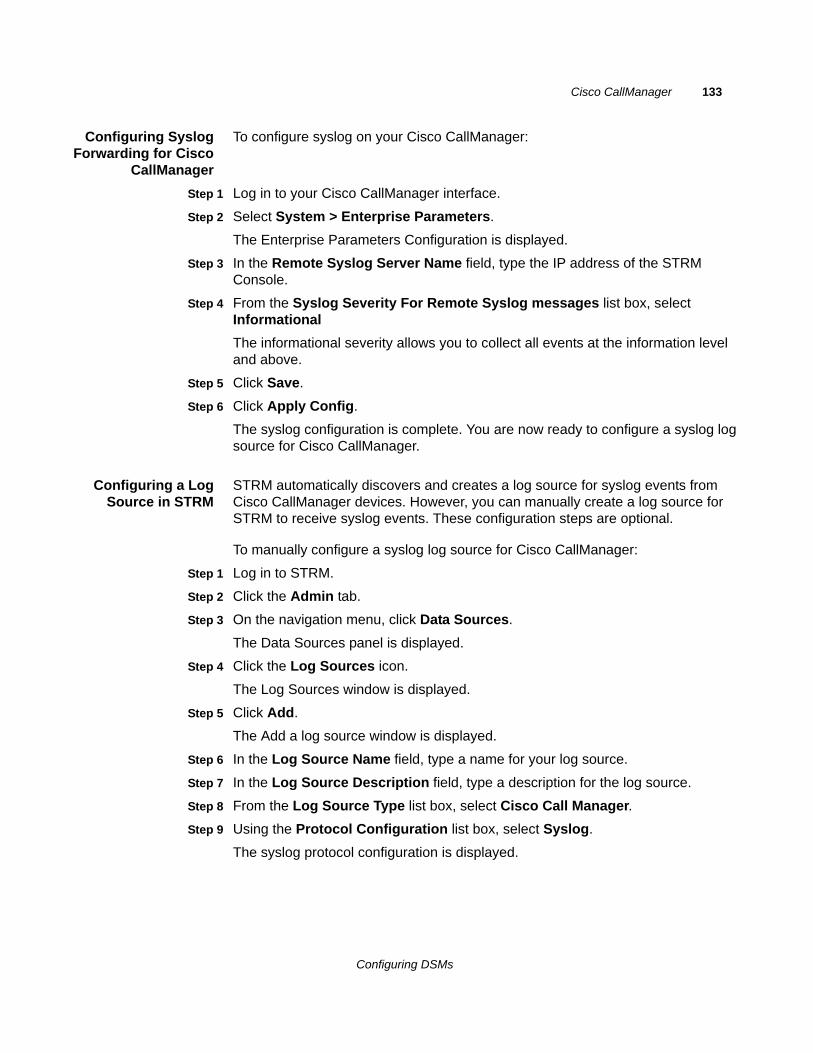
Cisco CallManager 133
Configuring SyslogForwarding for Cisco
CallManager
To configure syslog on your Cisco CallManager:
Step 1 Log in to your Cisco CallManager interface.
Step 2 Select System > Enterprise Parameters.
The Enterprise Parameters Configuration is displayed.
Step 3 In the Remote Syslog Server Name field, type the IP address of the STRM Console.
Step 4 From the Syslog Severity For Remote Syslog messages list box, select Informational
The informational severity allows you to collect all events at the information level and above.
Step 5 Click Save.
Step 6 Click Apply Config.
The syslog configuration is complete. You are now ready to configure a syslog log source for Cisco CallManager.
Configuring a LogSource in STRM
STRM automatically discovers and creates a log source for syslog events from Cisco CallManager devices. However, you can manually create a log source for STRM to receive syslog events. These configuration steps are optional.
To manually configure a syslog log source for Cisco CallManager:
Step 1 Log in to STRM.
Step 2 Click the Admin tab.
Step 3 On the navigation menu, click Data Sources.
The Data Sources panel is displayed.
Step 4 Click the Log Sources icon.
The Log Sources window is displayed.
Step 5 Click Add.
The Add a log source window is displayed.
Step 6 In the Log Source Name field, type a name for your log source.
Step 7 In the Log Source Description field, type a description for the log source.
Step 8 From the Log Source Type list box, select Cisco Call Manager.
Step 9 Using the Protocol Configuration list box, select Syslog.
The syslog protocol configuration is displayed.
Configuring DSMs
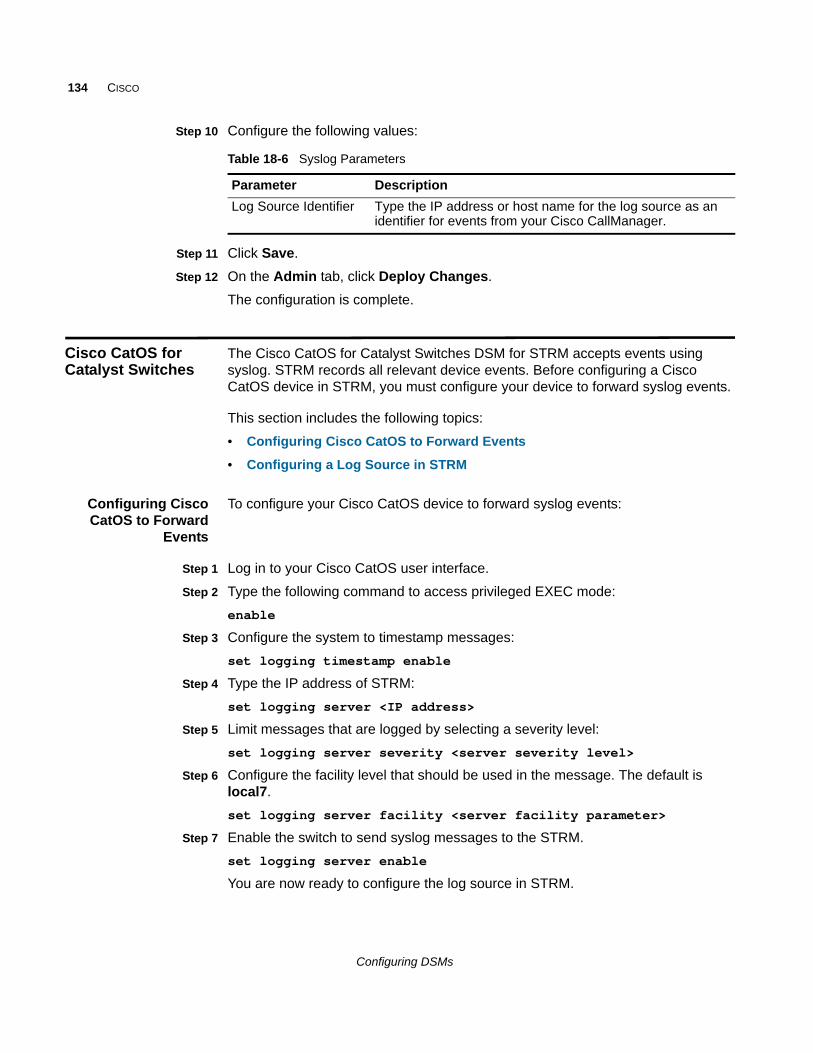
134 CISCO
Step 10 Configure the following values:
Step 11 Click Save.
Step 12 On the Admin tab, click Deploy Changes.
The configuration is complete.
Cisco CatOS for Catalyst Switches
The Cisco CatOS for Catalyst Switches DSM for STRM accepts events using syslog. STRM records all relevant device events. Before configuring a Cisco CatOS device in STRM, you must configure your device to forward syslog events.
This section includes the following topics:
• Configuring Cisco CatOS to Forward Events
• Configuring a Log Source in STRM
Configuring CiscoCatOS to Forward
Events
To configure your Cisco CatOS device to forward syslog events:
Step 1 Log in to your Cisco CatOS user interface.
Step 2 Type the following command to access privileged EXEC mode:
enable
Step 3 Configure the system to timestamp messages:
set logging timestamp enable
Step 4 Type the IP address of STRM:
set logging server <IP address>
Step 5 Limit messages that are logged by selecting a severity level:
set logging server severity <server severity level>
Step 6 Configure the facility level that should be used in the message. The default is local7.
set logging server facility <server facility parameter>
Step 7 Enable the switch to send syslog messages to the STRM.
set logging server enable
You are now ready to configure the log source in STRM.
Table 18-6 Syslog Parameters
Parameter Description
Log Source Identifier Type the IP address or host name for the log source as an identifier for events from your Cisco CallManager.
Configuring DSMs
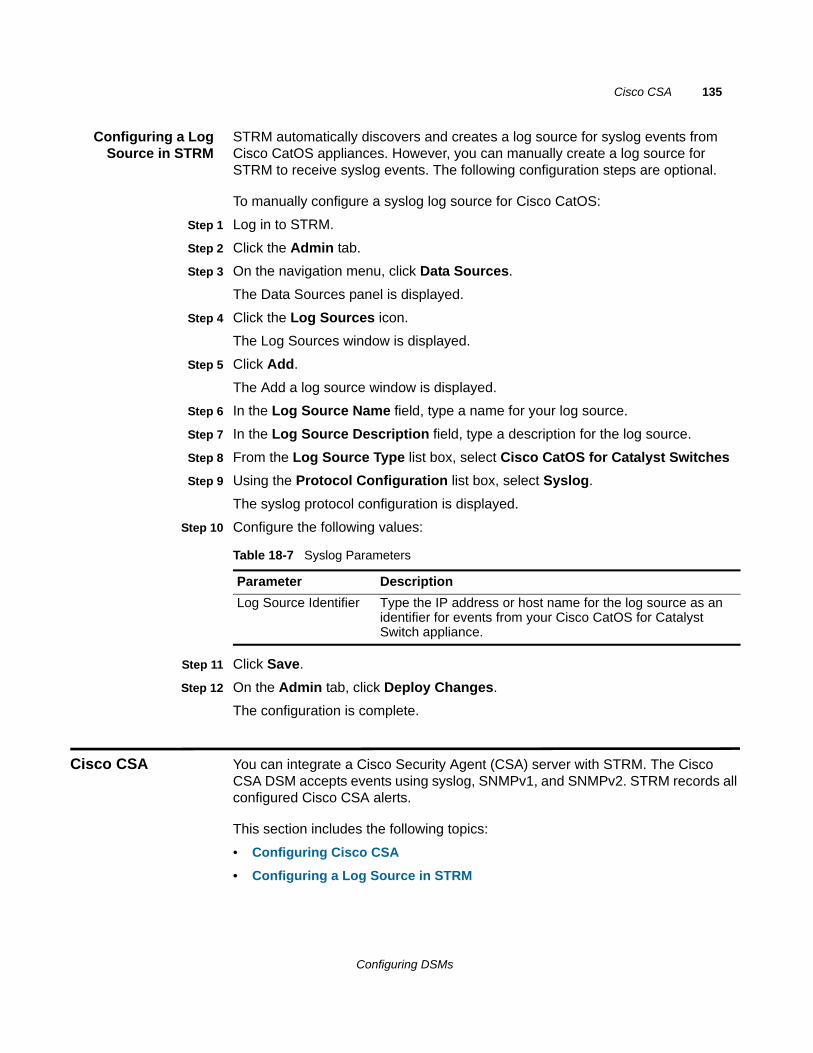
Cisco CSA 135
Configuring a LogSource in STRM
STRM automatically discovers and creates a log source for syslog events from Cisco CatOS appliances. However, you can manually create a log source for STRM to receive syslog events. The following configuration steps are optional.
To manually configure a syslog log source for Cisco CatOS:
Step 1 Log in to STRM.
Step 2 Click the Admin tab.
Step 3 On the navigation menu, click Data Sources.
The Data Sources panel is displayed.
Step 4 Click the Log Sources icon.
The Log Sources window is displayed.
Step 5 Click Add.
The Add a log source window is displayed.
Step 6 In the Log Source Name field, type a name for your log source.
Step 7 In the Log Source Description field, type a description for the log source.
Step 8 From the Log Source Type list box, select Cisco CatOS for Catalyst Switches
Step 9 Using the Protocol Configuration list box, select Syslog.
The syslog protocol configuration is displayed.
Step 10 Configure the following values:
Step 11 Click Save.
Step 12 On the Admin tab, click Deploy Changes.
The configuration is complete.
Cisco CSA You can integrate a Cisco Security Agent (CSA) server with STRM. The Cisco CSA DSM accepts events using syslog, SNMPv1, and SNMPv2. STRM records all configured Cisco CSA alerts.
This section includes the following topics:
• Configuring Cisco CSA
• Configuring a Log Source in STRM
Table 18-7 Syslog Parameters
Parameter Description
Log Source Identifier Type the IP address or host name for the log source as an identifier for events from your Cisco CatOS for Catalyst Switch appliance.
Configuring DSMs
136 CISCO
Configuring CiscoCSA
To configure your Cisco CSA server to forward events:
Step 1 Open the Cisco CSA user interface.
Step 2 Select Events > Alerts.
Step 3 Click New.
The Configuration View window is displayed.
Step 4 Type in values for the following parameters:
a Name - Type a name you wish to assign to your configuration.
b Description - Type a description for the configuration. This parameter is optional.
Step 5 From the Send Alerts, select the event set from the list box to generate alerts.
Step 6 Select the SNMP check box.
Step 7 Type a Community name.
The Community name entered in the CSA user interface must match the Community field configured on STRM. This option is only available using the SNMPv2 protocol.
Step 8 In the Manager IP address parameter, type the IP address of STRM.
Step 9 Click Save.
You are now ready to configure the log source in STRM.
Configuring a LogSource in STRM
STRM automatically discovers and creates a log source for syslog events from Cisco CSA appliances. However, you can manually create a log source for STRM to receive syslog events. The following configuration steps are optional.
To manually configure a syslog log source for Cisco CSA:
Step 1 Log in to STRM.
Step 2 Click the Admin tab.
Step 3 On the navigation menu, click Data Sources.
The Data Sources panel is displayed.
Step 4 Click the Log Sources icon.
The Log Sources window is displayed.
Step 5 Click Add.
The Add a log source window is displayed.
Step 6 In the Log Source Name field, type a name for your log source.
Step 7 In the Log Source Description field, type a description for the log source.
Step 8 From the Log Source Type list box, select Cisco CSA.
Step 9 Using the Protocol Configuration list box, select Syslog.
Configuring DSMs
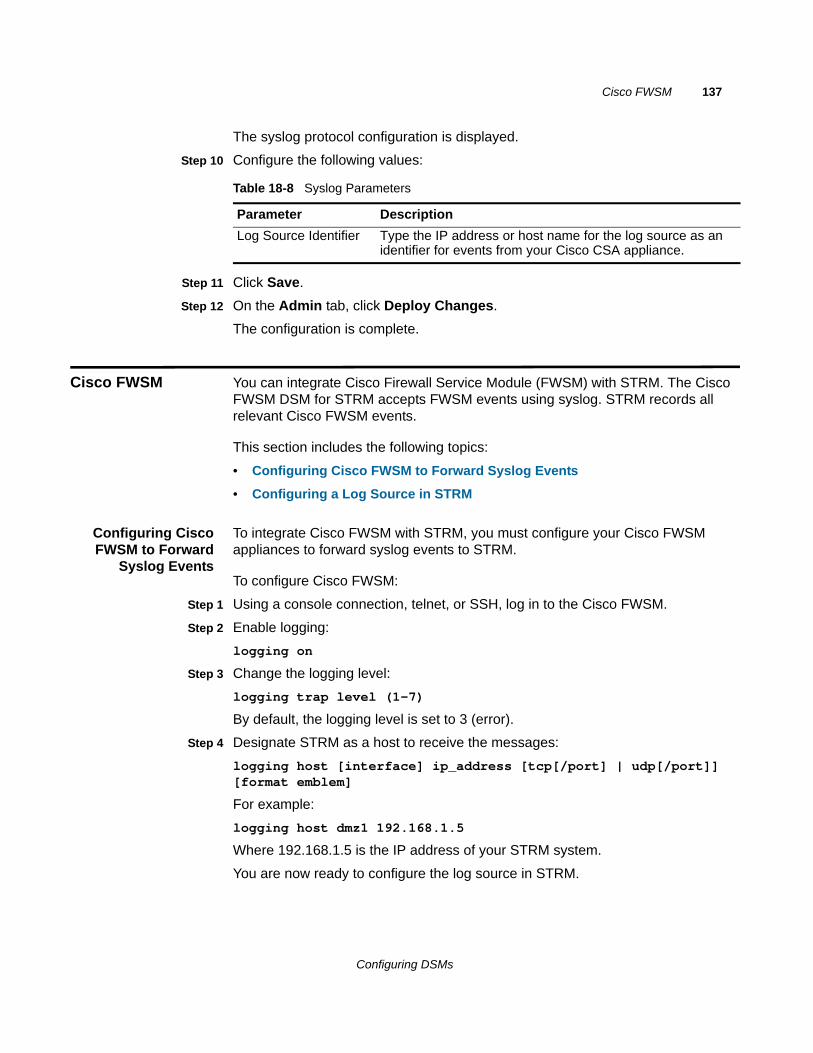
Cisco FWSM 137
The syslog protocol configuration is displayed.
Step 10 Configure the following values:
Step 11 Click Save.
Step 12 On the Admin tab, click Deploy Changes.
The configuration is complete.
Cisco FWSM You can integrate Cisco Firewall Service Module (FWSM) with STRM. The Cisco FWSM DSM for STRM accepts FWSM events using syslog. STRM records all relevant Cisco FWSM events.
This section includes the following topics:
• Configuring Cisco FWSM to Forward Syslog Events
• Configuring a Log Source in STRM
Configuring CiscoFWSM to Forward
Syslog Events
To integrate Cisco FWSM with STRM, you must configure your Cisco FWSM appliances to forward syslog events to STRM.
To configure Cisco FWSM:
Step 1 Using a console connection, telnet, or SSH, log in to the Cisco FWSM.
Step 2 Enable logging:
logging on
Step 3 Change the logging level:
logging trap level (1-7)
By default, the logging level is set to 3 (error).
Step 4 Designate STRM as a host to receive the messages:
logging host [interface] ip_address [tcp[/port] | udp[/port]] [format emblem]
For example:
logging host dmz1 192.168.1.5
Where 192.168.1.5 is the IP address of your STRM system.
You are now ready to configure the log source in STRM.
Table 18-8 Syslog Parameters
Parameter Description
Log Source Identifier Type the IP address or host name for the log source as an identifier for events from your Cisco CSA appliance.
Configuring DSMs
138 CISCO
Configuring a LogSource in STRM
STRM automatically discovers and creates a log source for syslog events from Cisco FWSM appliances. However, you can manually create a log source for STRM to receive syslog events. The following configuration steps are optional.
To manually configure a syslog log source for Cisco FWSM:
Step 1 Log in to STRM.
Step 2 Click the Admin tab.
Step 3 On the navigation menu, click Data Sources.
The Data Sources panel is displayed.
Step 4 Click the Log Sources icon.
The Log Sources window is displayed.
Step 5 Click Add.
The Add a log source window is displayed.
Step 6 In the Log Source Name field, type a name for your log source.
Step 7 In the Log Source Description field, type a description for the log source.
Step 8 From the Log Source Type list box, select Cisco Firewall Services Module (FWSM).
Step 9 Using the Protocol Configuration list box, select Syslog.
The syslog protocol configuration is displayed.
Step 10 Configure the following values:
Step 11 Click Save.
Step 12 On the Admin tab, click Deploy Changes.
The configuration is complete.
Cisco IDS/IPS The Cisco IDS/IPS DSM for STRM polls Cisco IDS/IPS for events using the Security Device Event Exchange (SDEE) protocol. The SDEE specification defines the message format and the protocol used to communicate the events generated by your Cisco IDS/IPS security device. STRM supports SDEE connections by polling directly to the IDS/IPS device and not the management software, which controls the device.
NOTEYou must have security access or web authentication on the device before connecting to STRM.
Table 18-9 Syslog Parameters
Parameter Description
Log Source Identifier Type the IP address or host name for the log source as an identifier for events from your Cisco FWSM appliance.
Configuring DSMs
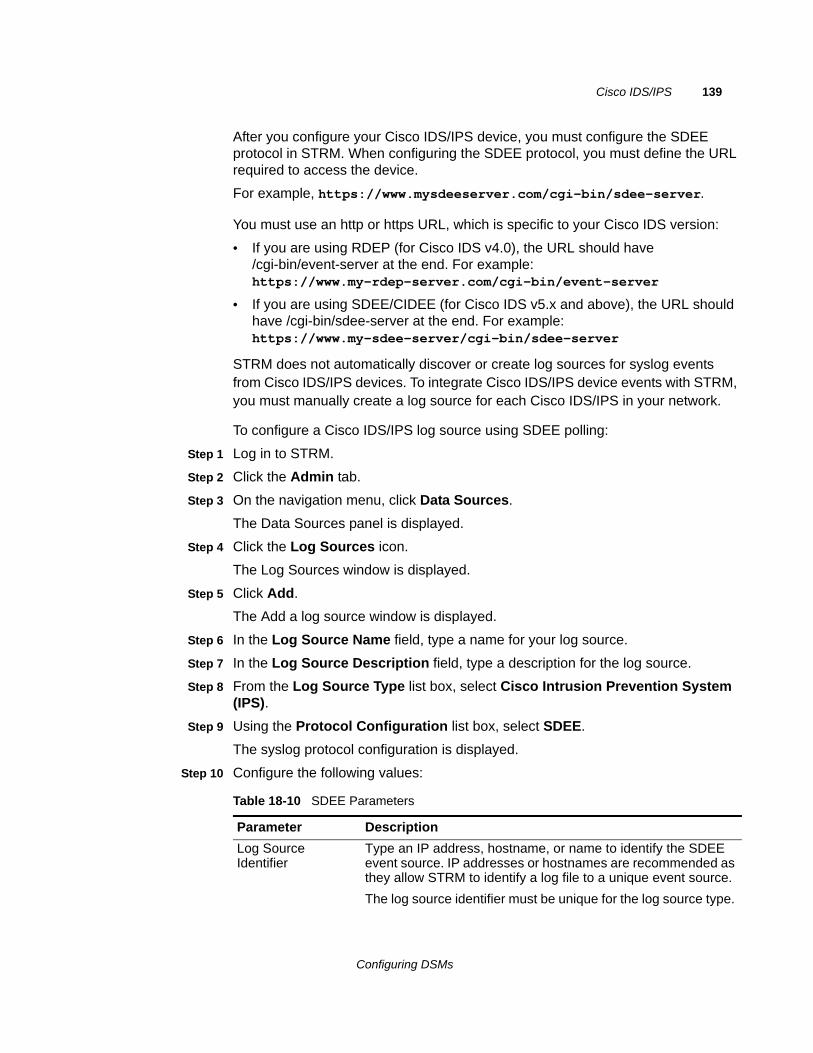
Cisco IDS/IPS 139
After you configure your Cisco IDS/IPS device, you must configure the SDEE protocol in STRM. When configuring the SDEE protocol, you must define the URL required to access the device.
For example, https://www.mysdeeserver.com/cgi-bin/sdee-server.
You must use an http or https URL, which is specific to your Cisco IDS version:
• If you are using RDEP (for Cisco IDS v4.0), the URL should have /cgi-bin/event-server at the end. For example: https://www.my-rdep-server.com/cgi-bin/event-server
• If you are using SDEE/CIDEE (for Cisco IDS v5.x and above), the URL should have /cgi-bin/sdee-server at the end. For example: https://www.my-sdee-server/cgi-bin/sdee-server
STRM does not automatically discover or create log sources for syslog events from Cisco IDS/IPS devices. To integrate Cisco IDS/IPS device events with STRM, you must manually create a log source for each Cisco IDS/IPS in your network.
To configure a Cisco IDS/IPS log source using SDEE polling:
Step 1 Log in to STRM.
Step 2 Click the Admin tab.
Step 3 On the navigation menu, click Data Sources.
The Data Sources panel is displayed.
Step 4 Click the Log Sources icon.
The Log Sources window is displayed.
Step 5 Click Add.
The Add a log source window is displayed.
Step 6 In the Log Source Name field, type a name for your log source.
Step 7 In the Log Source Description field, type a description for the log source.
Step 8 From the Log Source Type list box, select Cisco Intrusion Prevention System (IPS).
Step 9 Using the Protocol Configuration list box, select SDEE.
The syslog protocol configuration is displayed.
Step 10 Configure the following values:
Table 18-10 SDEE Parameters
Parameter Description
Log Source Identifier
Type an IP address, hostname, or name to identify the SDEE event source. IP addresses or hostnames are recommended as they allow STRM to identify a log file to a unique event source.
The log source identifier must be unique for the log source type.
Configuring DSMs
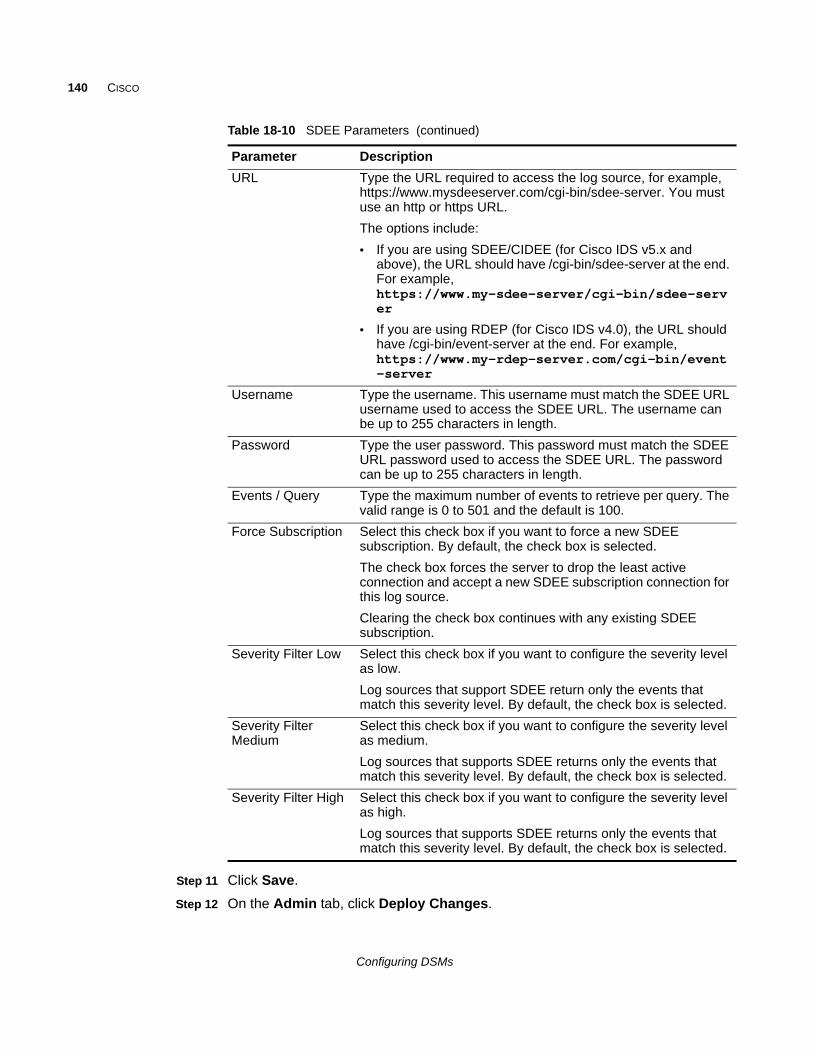
140 CISCO
Step 11 Click Save.
Step 12 On the Admin tab, click Deploy Changes.
URL Type the URL required to access the log source, for example, https://www.mysdeeserver.com/cgi-bin/sdee-server. You must use an http or https URL.
The options include:
• If you are using SDEE/CIDEE (for Cisco IDS v5.x and above), the URL should have /cgi-bin/sdee-server at the end. For example, https://www.my-sdee-server/cgi-bin/sdee-server
• If you are using RDEP (for Cisco IDS v4.0), the URL should have /cgi-bin/event-server at the end. For example, https://www.my-rdep-server.com/cgi-bin/event-server
Username Type the username. This username must match the SDEE URL username used to access the SDEE URL. The username can be up to 255 characters in length.
Password Type the user password. This password must match the SDEE URL password used to access the SDEE URL. The password can be up to 255 characters in length.
Events / Query Type the maximum number of events to retrieve per query. The valid range is 0 to 501 and the default is 100.
Force Subscription Select this check box if you want to force a new SDEE subscription. By default, the check box is selected.
The check box forces the server to drop the least active connection and accept a new SDEE subscription connection for this log source.
Clearing the check box continues with any existing SDEE subscription.
Severity Filter Low Select this check box if you want to configure the severity level as low.
Log sources that support SDEE return only the events that match this severity level. By default, the check box is selected.
Severity Filter Medium
Select this check box if you want to configure the severity level as medium.
Log sources that supports SDEE returns only the events that match this severity level. By default, the check box is selected.
Severity Filter High Select this check box if you want to configure the severity level as high.
Log sources that supports SDEE returns only the events that match this severity level. By default, the check box is selected.
Table 18-10 SDEE Parameters (continued)
Parameter Description
Configuring DSMs
Cisco IronPort 141
The log source is added to STRM. Events polled from your Cisco IDS/IPS appliances are displayed on the Log Activity tab of STRM.
Cisco IronPort The Cisco IronPort DSM for STRM provides event information for email spam, web content filtering, and corporate email policy enforcement. Before you configure STRM to integrate with your Cisco IronPort device, you must select the log type to configure:
• To configure IronPort mail logs, see IronPort Mail Log Configuration.
• To configure IronPort content filtering logs, see IronPort Web Content Filter.
IronPort Mail LogConfiguration
The STRM Cisco IronPort DSM accepts events using syslog. To configure your IronPort device to send syslog events to STRM, you must:
Step 1 Log in to your Cisco IronPort user interface.
Step 2 Select System Administration\Log Subscriptions.
Step 3 Click Add Log Subscription.
Step 4 Configure the following values:
• Log Type - Define a log subscription for both Ironport Text Mail Logs and System Logs.
• Log Name - Type a log name.
• File Name - Use the default configuration value.
• Maximum File Size - Use the default configuration value.
• Log Level - Select Information (Default).
• Retrieval Method - Select Syslog Push.
• Hostname - Type the IP address or server name of your STRM system.
• Protocol - Select UDP.
• Facility - Use the default configuration value. This value depends on the configured Log Type.
Step 5 Save the subscription.
You are now ready to configure the log source in STRM.
Configuring a Log Source in STRM
STRM does not automatically discover or create log sources for syslog events from Cisco IronPort appliances. To integrate Cisco IronPort with STRM, you must manually create a log source to receive Cisco IronPort events.
To create a log source for Cisco IronPort events:
Step 1 Log in to STRM.
Step 2 Click the Admin tab.
Configuring DSMs
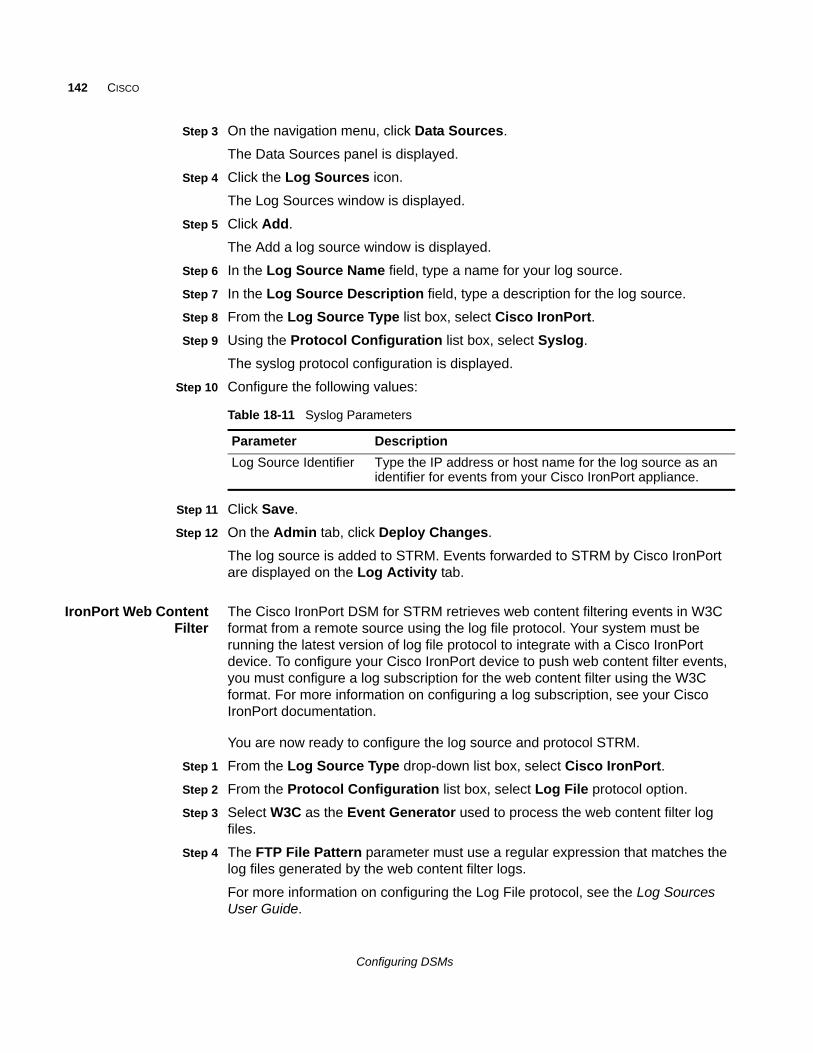
142 CISCO
Step 3 On the navigation menu, click Data Sources.
The Data Sources panel is displayed.
Step 4 Click the Log Sources icon.
The Log Sources window is displayed.
Step 5 Click Add.
The Add a log source window is displayed.
Step 6 In the Log Source Name field, type a name for your log source.
Step 7 In the Log Source Description field, type a description for the log source.
Step 8 From the Log Source Type list box, select Cisco IronPort.
Step 9 Using the Protocol Configuration list box, select Syslog.
The syslog protocol configuration is displayed.
Step 10 Configure the following values:
Step 11 Click Save.
Step 12 On the Admin tab, click Deploy Changes.
The log source is added to STRM. Events forwarded to STRM by Cisco IronPort are displayed on the Log Activity tab.
IronPort Web ContentFilter
The Cisco IronPort DSM for STRM retrieves web content filtering events in W3C format from a remote source using the log file protocol. Your system must be running the latest version of log file protocol to integrate with a Cisco IronPort device. To configure your Cisco IronPort device to push web content filter events, you must configure a log subscription for the web content filter using the W3C format. For more information on configuring a log subscription, see your Cisco IronPort documentation.
You are now ready to configure the log source and protocol STRM.
Step 1 From the Log Source Type drop-down list box, select Cisco IronPort.
Step 2 From the Protocol Configuration list box, select Log File protocol option.
Step 3 Select W3C as the Event Generator used to process the web content filter log files.
Step 4 The FTP File Pattern parameter must use a regular expression that matches the log files generated by the web content filter logs.
For more information on configuring the Log File protocol, see the Log Sources User Guide.
Table 18-11 Syslog Parameters
Parameter Description
Log Source Identifier Type the IP address or host name for the log source as an identifier for events from your Cisco IronPort appliance.
Configuring DSMs
Cisco NAC 143
Cisco NAC The Cisco NAC DSM for STRM accepts events using syslog. STRM records all relevant audit, error, and failure events as well as quarantine and infected system events. Before configuring a Cisco NAC device in STRM, you must configure your device to forward syslog events.
This section includes the following topics:
• Configuring Cisco NAC to Forward Events
• Configuring a Log Source in STRM
Configuring CiscoNAC to Forward
Events
To configure the device to forward syslog events:
Step 1 Log in to the Cisco NAC user interface.
Step 2 In the Monitoring section, select Event Logs.
Step 3 Click the Syslog Settings tab.
Step 4 In the Syslog Server Address field, type the IP address of your STRM.
Step 5 In the Syslog Server Port field, type the syslog port. The default is 514.
Step 6 In the System Health Log Interval field, type the frequency, in minutes, for system statistic log events.
Step 7 Click Update.
You are now ready to configure the log source in STRM.
Configuring a LogSource in STRM
STRM does not automatically discover or create log sources for syslog events from Cisco NAC appliances. To integrate Cisco NAC events with STRM, you must manually create a log source to receive Cisco NAC events.
To create a log source:
Step 1 Log in to STRM.
Step 2 Click the Admin tab.
Step 3 On the navigation menu, click Data Sources.
The Data Sources panel is displayed.
Step 4 Click the Log Sources icon.
The Log Sources window is displayed.
Step 5 Click Add.
The Add a log source window is displayed.
Step 6 In the Log Source Name field, type a name for your log source.
Step 7 In the Log Source Description field, type a description for the log source.
Configuring DSMs
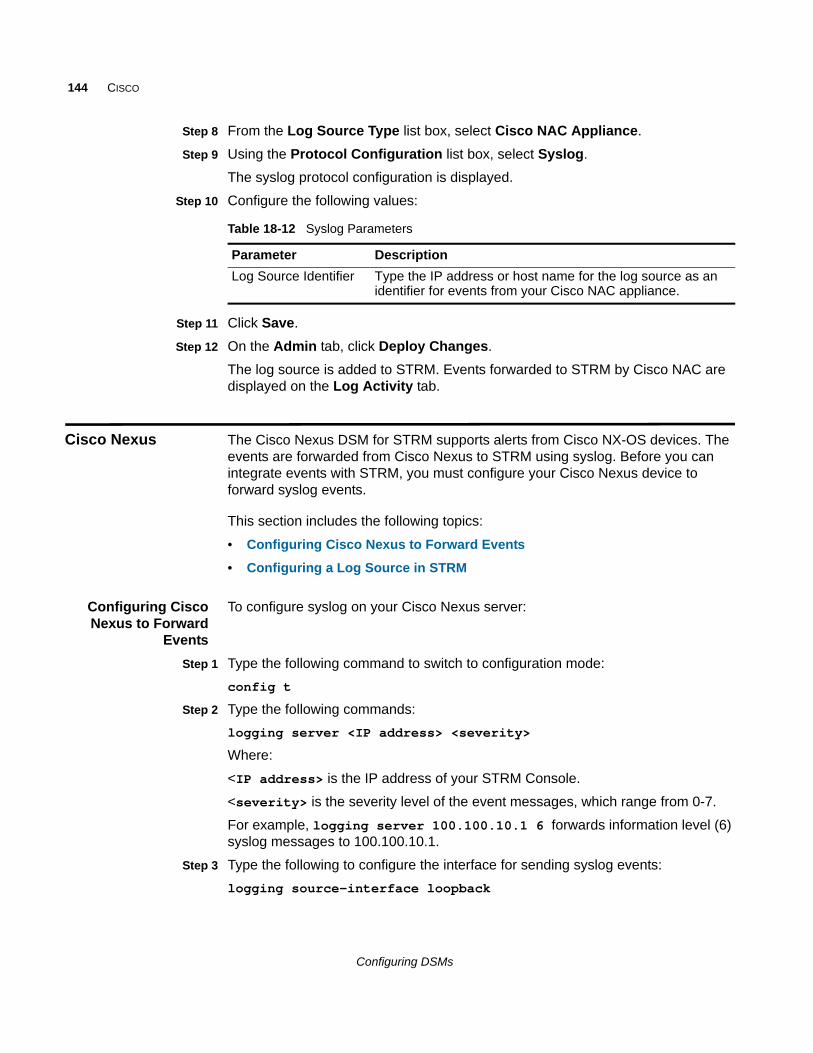
144 CISCO
Step 8 From the Log Source Type list box, select Cisco NAC Appliance.
Step 9 Using the Protocol Configuration list box, select Syslog.
The syslog protocol configuration is displayed.
Step 10 Configure the following values:
Step 11 Click Save.
Step 12 On the Admin tab, click Deploy Changes.
The log source is added to STRM. Events forwarded to STRM by Cisco NAC are displayed on the Log Activity tab.
Cisco Nexus The Cisco Nexus DSM for STRM supports alerts from Cisco NX-OS devices. The events are forwarded from Cisco Nexus to STRM using syslog. Before you can integrate events with STRM, you must configure your Cisco Nexus device to forward syslog events.
This section includes the following topics:
• Configuring Cisco Nexus to Forward Events
• Configuring a Log Source in STRM
Configuring CiscoNexus to Forward
Events
To configure syslog on your Cisco Nexus server:
Step 1 Type the following command to switch to configuration mode:
config t
Step 2 Type the following commands:
logging server <IP address> <severity>
Where:
<IP address> is the IP address of your STRM Console.
<severity> is the severity level of the event messages, which range from 0-7.
For example, logging server 100.100.10.1 6 forwards information level (6) syslog messages to 100.100.10.1.
Step 3 Type the following to configure the interface for sending syslog events:
logging source-interface loopback
Table 18-12 Syslog Parameters
Parameter Description
Log Source Identifier Type the IP address or host name for the log source as an identifier for events from your Cisco NAC appliance.
Configuring DSMs
Cisco Nexus 145
Step 4 Type the following command to save your current configuration as the start up configuration:
copy running-config startup-config
The configuration is complete. The log source is added to STRM as Cisco Nexus events are automatically discovered. Events forwarded to STRM by Cisco Nexus are displayed on the Log Activity tab of STRM.
Configuring a LogSource in STRM
STRM automatically discovers and creates a log source for syslog events from Cisco Nexus. However, you can manually create a log source for STRM to receive syslog events. The following configuration steps are optional.
To manually configure a log source for Cisco Nexus:
Step 1 Log in to STRM.
Step 2 Click the Admin tab.
Step 3 On the navigation menu, click Data Sources.
The Data Sources panel is displayed.
Step 4 Click the Log Sources icon.
The Log Sources window is displayed.
Step 5 Click Add.
The Add a log source window is displayed.
Step 6 In the Log Source Name field, type a name for your log source.
Step 7 In the Log Source Description field, type a description for the log source.
Step 8 From the Log Source Type list box, select Cisco Nexus.
Step 9 Using the Protocol Configuration list box, select Syslog.
The syslog protocol configuration is displayed.
Step 10 Configure the following values:
Step 11 Click Save.
Step 12 On the Admin tab, click Deploy Changes.
The configuration is complete. For more information on configuring a Virtual Device Context (VDC) on your Cisco Nexus device, see your vendor documentation.
Table 18-13 Syslog Parameters
Parameter Description
Log Source Identifier Type the IP address or host name for the log source as an identifier for events from your Cisco Nexus appliances.
Configuring DSMs
146 CISCO
Cisco IOS You can integrate Cisco IOS series devices with STRM. The Cisco IOS DSM for STRM accepts Cisco IOS events using syslog. STRM records all relevant events. The following Cisco Switches and Routers are automatically discovered as Cisco IOS and have their events parsed by the Cisco IOS DSM:
• Cisco 12000 Series Routers
• Cisco 6500 Series Switches
• Cisco 7600 Series Routers
• Cisco Carrier Routing System
• Cisco Integrated Services Router.
This section includes the following topics:
• Configuring Cisco IOS to Forward Events
• Configuring a Log Source in STRM
NOTEMake sure all Access Control Lists (ACLs) are set to LOG.
Configuring CiscoIOS to Forward
Events
To configure a Cisco IOS-based device to forward events:
Step 1 Log in to your Cisco IOS Server, switch, or router.
Step 2 Type the following command to log in to the router in privileged-exec.
enable
Step 3 Type the following command to switch to configuration mode:
conf t
Step 4 Type the following commands:
logging <IP address>
logging source-interface <interface>
Where:
<IP address> is the IP address hosting STRM and the SIM components.
<interface> is the name of the interface, for example, dmz, lan, ethernet0, or ethernet1.
Step 5 Type the following to configure the priority level:
logging trap warning
logging console warning
Where warning is the priority setting for the logs.
Configuring DSMs
Cisco IOS 147
Step 6 Configure the syslog facility:
logging facility syslog
Step 7 Save and exit the file.
Step 8 Copy running-config to startup-config:
copy running-config startup-config
You are now ready to configure the log source in STRM.
The configuration is complete. The log source is added to STRM as Cisco IOS events are automatically discovered. Events forwarded to STRM by Cisco IOS-based devices are displayed on the Log Activity tab of STRM.
Configuring a LogSource in STRM
STRM automatically discovers and creates a log source for syslog events from Cisco IOS. However, you can manually create a log source for STRM to receive syslog events. The following configuration steps are optional.
To manually configure a log source for Cisco IOS-based devices:
Step 1 Log in to STRM.
Step 2 Click the Admin tab.
Step 3 On the navigation menu, click Data Sources.
The Data Sources panel is displayed.
Step 4 Click the Log Sources icon.
The Log Sources window is displayed.
Step 5 Click Add.
The Add a log source window is displayed.
Step 6 In the Log Source Name field, type a name for your log source.
Step 7 In the Log Source Description field, type a description for the log source.
Step 8 From the Log Source Type list box, select one of the following:
• Cisco IOS
• Cisco 12000 Series Routers
• Cisco 6500 Series Switches
• Cisco 7600 Series Routers
• Cisco Carrier Routing System
• Cisco Integrated Services Router
Step 9 Using the Protocol Configuration list box, select Syslog.
The syslog protocol configuration is displayed.
Configuring DSMs
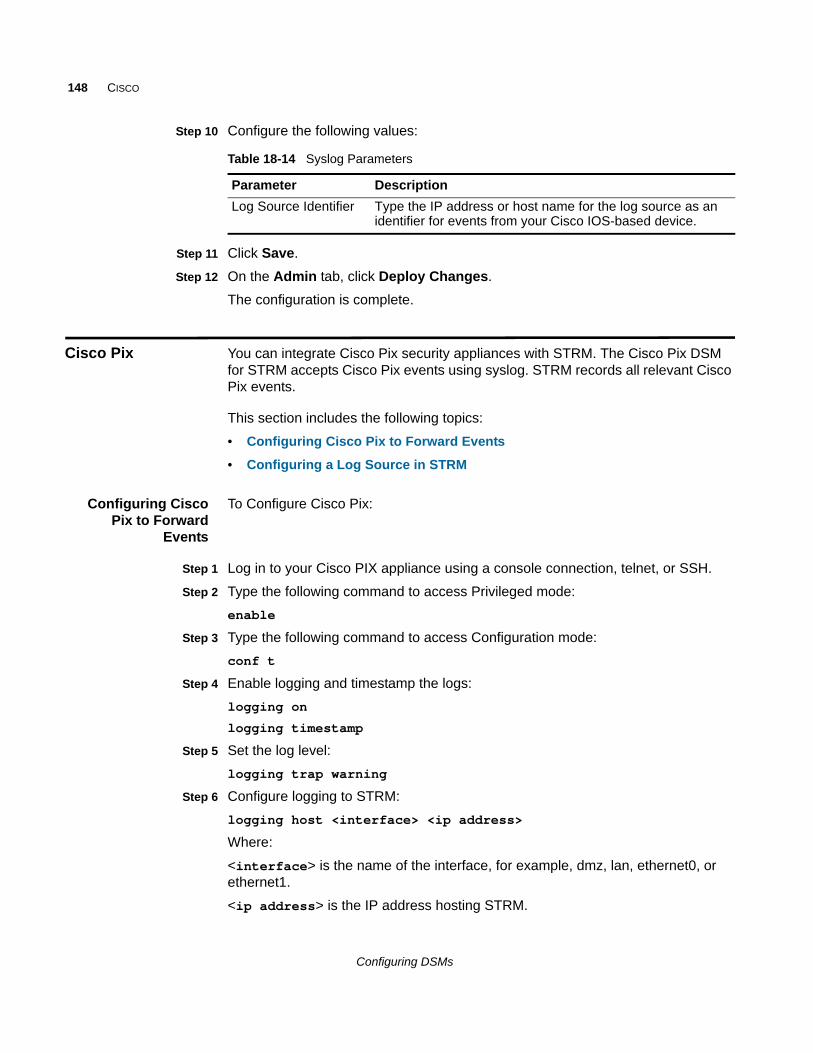
148 CISCO
Step 10 Configure the following values:
Step 11 Click Save.
Step 12 On the Admin tab, click Deploy Changes.
The configuration is complete.
Cisco Pix You can integrate Cisco Pix security appliances with STRM. The Cisco Pix DSM for STRM accepts Cisco Pix events using syslog. STRM records all relevant Cisco Pix events.
This section includes the following topics:
• Configuring Cisco Pix to Forward Events
• Configuring a Log Source in STRM
Configuring CiscoPix to Forward
Events
To Configure Cisco Pix:
Step 1 Log in to your Cisco PIX appliance using a console connection, telnet, or SSH.
Step 2 Type the following command to access Privileged mode:
enable
Step 3 Type the following command to access Configuration mode:
conf t
Step 4 Enable logging and timestamp the logs:
logging on
logging timestamp
Step 5 Set the log level:
logging trap warning
Step 6 Configure logging to STRM:
logging host <interface> <ip address>
Where:
<interface> is the name of the interface, for example, dmz, lan, ethernet0, or ethernet1.
<ip address> is the IP address hosting STRM.
Table 18-14 Syslog Parameters
Parameter Description
Log Source Identifier Type the IP address or host name for the log source as an identifier for events from your Cisco IOS-based device.
Configuring DSMs
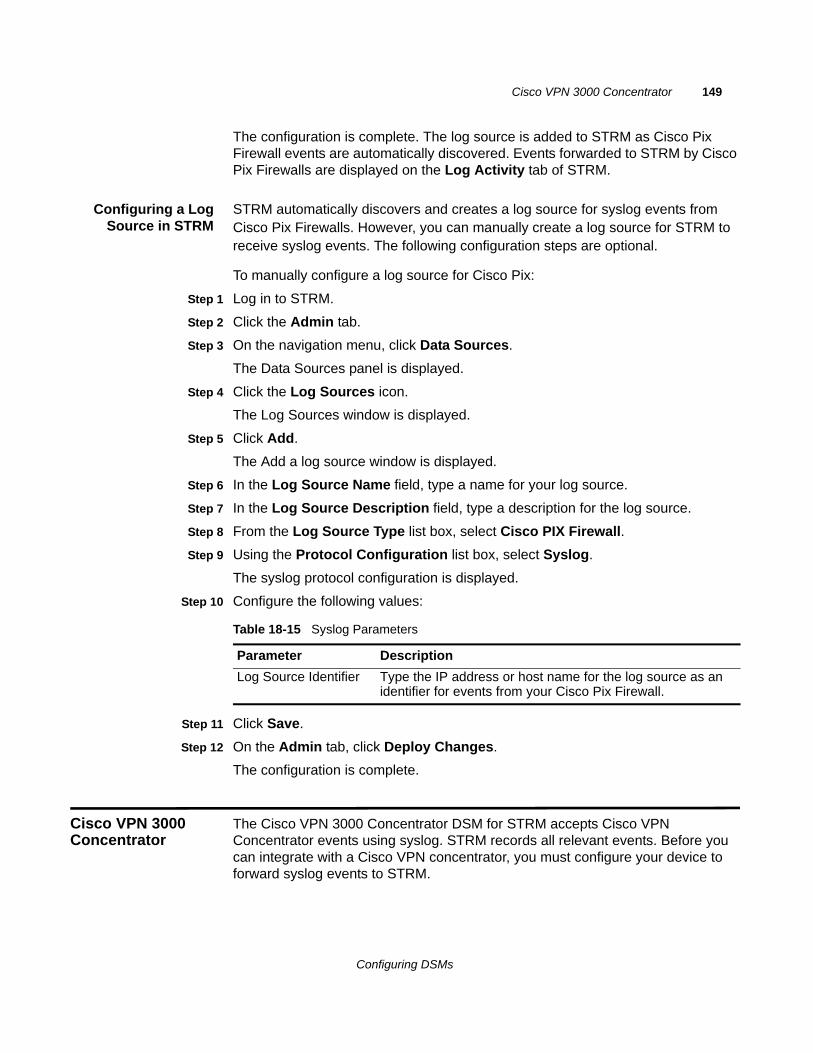
Cisco VPN 3000 Concentrator 149
The configuration is complete. The log source is added to STRM as Cisco Pix Firewall events are automatically discovered. Events forwarded to STRM by Cisco Pix Firewalls are displayed on the Log Activity tab of STRM.
Configuring a LogSource in STRM
STRM automatically discovers and creates a log source for syslog events from Cisco Pix Firewalls. However, you can manually create a log source for STRM to receive syslog events. The following configuration steps are optional.
To manually configure a log source for Cisco Pix:
Step 1 Log in to STRM.
Step 2 Click the Admin tab.
Step 3 On the navigation menu, click Data Sources.
The Data Sources panel is displayed.
Step 4 Click the Log Sources icon.
The Log Sources window is displayed.
Step 5 Click Add.
The Add a log source window is displayed.
Step 6 In the Log Source Name field, type a name for your log source.
Step 7 In the Log Source Description field, type a description for the log source.
Step 8 From the Log Source Type list box, select Cisco PIX Firewall.
Step 9 Using the Protocol Configuration list box, select Syslog.
The syslog protocol configuration is displayed.
Step 10 Configure the following values:
Step 11 Click Save.
Step 12 On the Admin tab, click Deploy Changes.
The configuration is complete.
Cisco VPN 3000 Concentrator
The Cisco VPN 3000 Concentrator DSM for STRM accepts Cisco VPN Concentrator events using syslog. STRM records all relevant events. Before you can integrate with a Cisco VPN concentrator, you must configure your device to forward syslog events to STRM.
Table 18-15 Syslog Parameters
Parameter Description
Log Source Identifier Type the IP address or host name for the log source as an identifier for events from your Cisco Pix Firewall.
Configuring DSMs
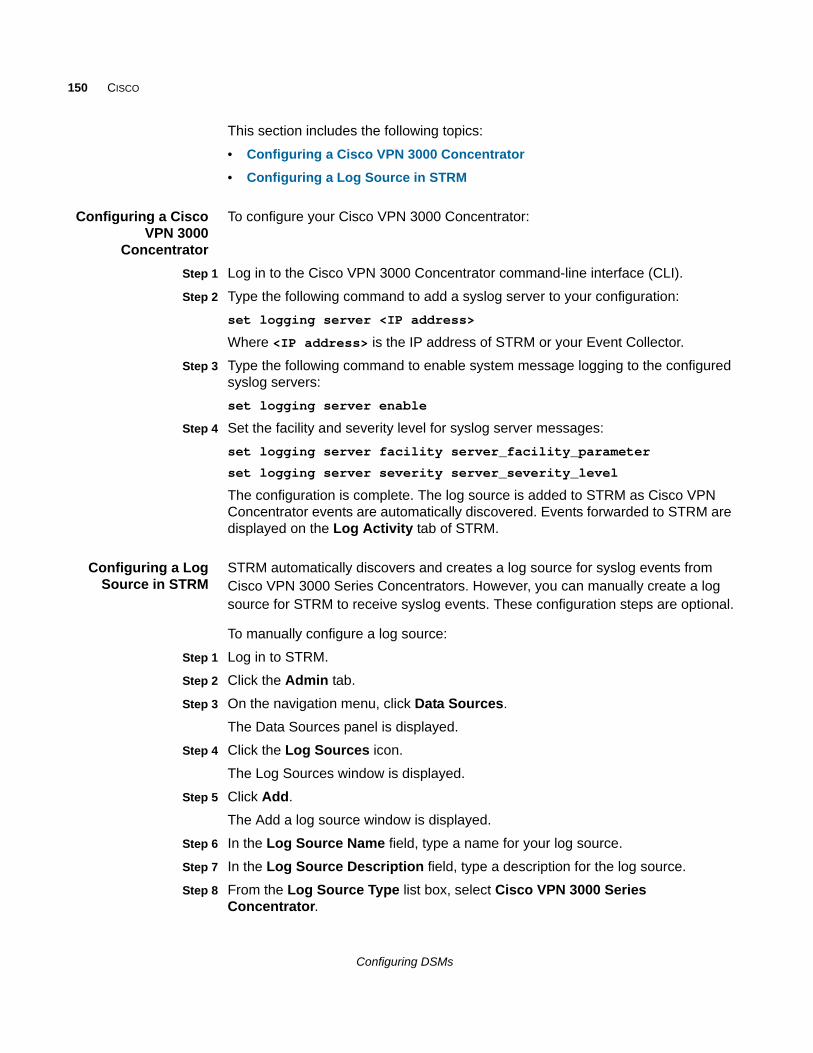
150 CISCO
This section includes the following topics:
• Configuring a Cisco VPN 3000 Concentrator
• Configuring a Log Source in STRM
Configuring a CiscoVPN 3000
Concentrator
To configure your Cisco VPN 3000 Concentrator:
Step 1 Log in to the Cisco VPN 3000 Concentrator command-line interface (CLI).
Step 2 Type the following command to add a syslog server to your configuration:
set logging server <IP address>
Where <IP address> is the IP address of STRM or your Event Collector.
Step 3 Type the following command to enable system message logging to the configured syslog servers:
set logging server enable
Step 4 Set the facility and severity level for syslog server messages:
set logging server facility server_facility_parameter
set logging server severity server_severity_level
The configuration is complete. The log source is added to STRM as Cisco VPN Concentrator events are automatically discovered. Events forwarded to STRM are displayed on the Log Activity tab of STRM.
Configuring a LogSource in STRM
STRM automatically discovers and creates a log source for syslog events from Cisco VPN 3000 Series Concentrators. However, you can manually create a log source for STRM to receive syslog events. These configuration steps are optional.
To manually configure a log source:
Step 1 Log in to STRM.
Step 2 Click the Admin tab.
Step 3 On the navigation menu, click Data Sources.
The Data Sources panel is displayed.
Step 4 Click the Log Sources icon.
The Log Sources window is displayed.
Step 5 Click Add.
The Add a log source window is displayed.
Step 6 In the Log Source Name field, type a name for your log source.
Step 7 In the Log Source Description field, type a description for the log source.
Step 8 From the Log Source Type list box, select Cisco VPN 3000 Series Concentrator.
Configuring DSMs
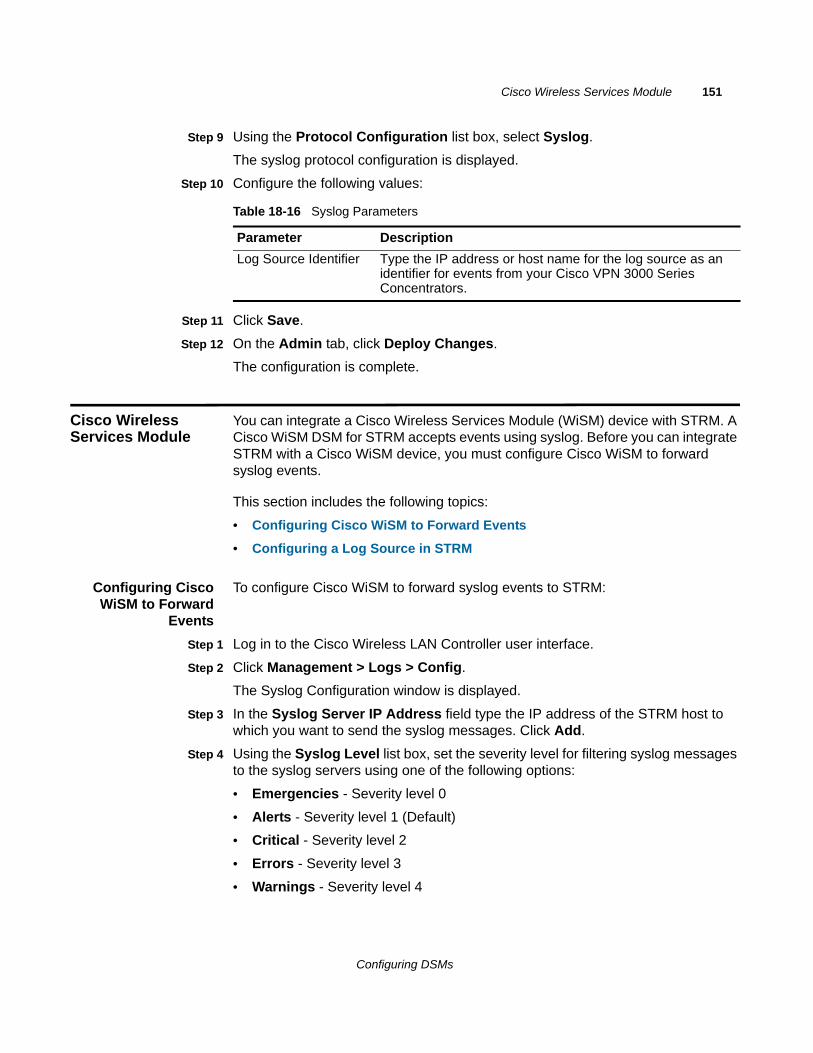
Cisco Wireless Services Module 151
Step 9 Using the Protocol Configuration list box, select Syslog.
The syslog protocol configuration is displayed.
Step 10 Configure the following values:
Step 11 Click Save.
Step 12 On the Admin tab, click Deploy Changes.
The configuration is complete.
Cisco Wireless Services Module
You can integrate a Cisco Wireless Services Module (WiSM) device with STRM. A Cisco WiSM DSM for STRM accepts events using syslog. Before you can integrate STRM with a Cisco WiSM device, you must configure Cisco WiSM to forward syslog events.
This section includes the following topics:
• Configuring Cisco WiSM to Forward Events
• Configuring a Log Source in STRM
Configuring CiscoWiSM to Forward
Events
To configure Cisco WiSM to forward syslog events to STRM:
Step 1 Log in to the Cisco Wireless LAN Controller user interface.
Step 2 Click Management > Logs > Config.
The Syslog Configuration window is displayed.
Step 3 In the Syslog Server IP Address field type the IP address of the STRM host to which you want to send the syslog messages. Click Add.
Step 4 Using the Syslog Level list box, set the severity level for filtering syslog messages to the syslog servers using one of the following options:
• Emergencies - Severity level 0
• Alerts - Severity level 1 (Default)
• Critical - Severity level 2
• Errors - Severity level 3
• Warnings - Severity level 4
Table 18-16 Syslog Parameters
Parameter Description
Log Source Identifier Type the IP address or host name for the log source as an identifier for events from your Cisco VPN 3000 Series Concentrators.
Configuring DSMs
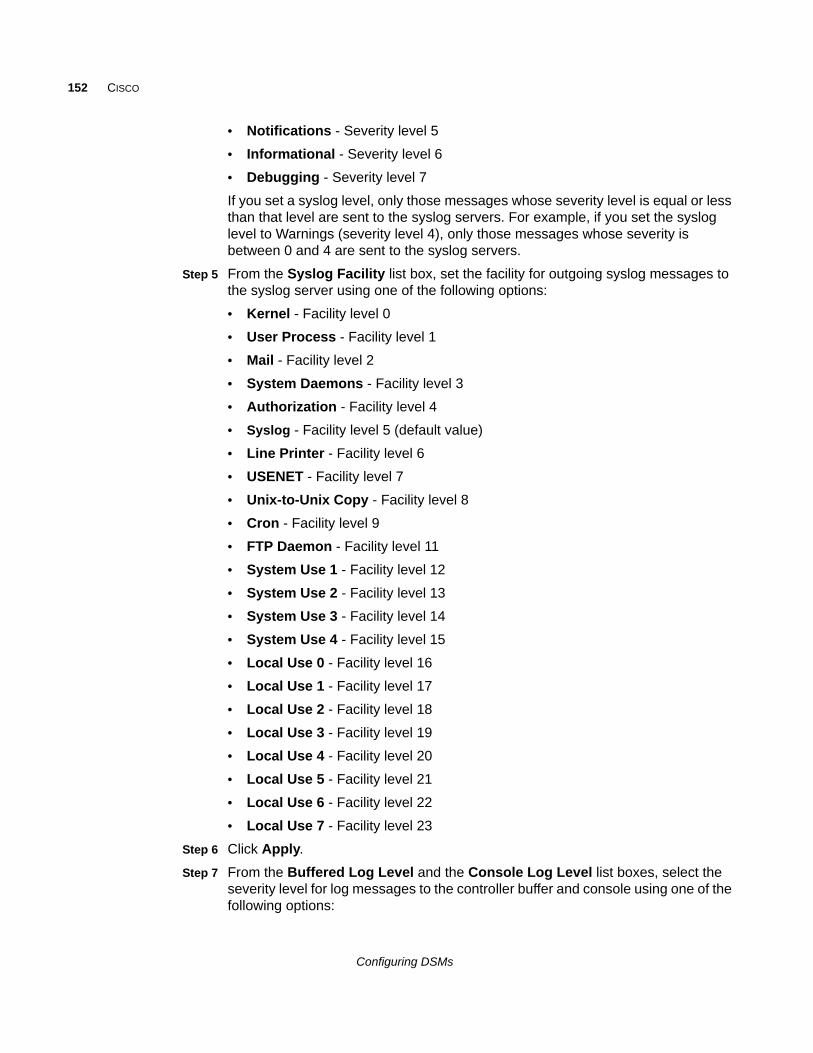
152 CISCO
• Notifications - Severity level 5
• Informational - Severity level 6
• Debugging - Severity level 7
If you set a syslog level, only those messages whose severity level is equal or less than that level are sent to the syslog servers. For example, if you set the syslog level to Warnings (severity level 4), only those messages whose severity is between 0 and 4 are sent to the syslog servers.
Step 5 From the Syslog Facility list box, set the facility for outgoing syslog messages to the syslog server using one of the following options:
• Kernel - Facility level 0
• User Process - Facility level 1
• Mail - Facility level 2
• System Daemons - Facility level 3
• Authorization - Facility level 4
• Syslog - Facility level 5 (default value)
• Line Printer - Facility level 6
• USENET - Facility level 7
• Unix-to-Unix Copy - Facility level 8
• Cron - Facility level 9
• FTP Daemon - Facility level 11
• System Use 1 - Facility level 12
• System Use 2 - Facility level 13
• System Use 3 - Facility level 14
• System Use 4 - Facility level 15
• Local Use 0 - Facility level 16
• Local Use 1 - Facility level 17
• Local Use 2 - Facility level 18
• Local Use 3 - Facility level 19
• Local Use 4 - Facility level 20
• Local Use 5 - Facility level 21
• Local Use 6 - Facility level 22
• Local Use 7 - Facility level 23
Step 6 Click Apply.
Step 7 From the Buffered Log Level and the Console Log Level list boxes, select the severity level for log messages to the controller buffer and console using one of the following options:
Configuring DSMs
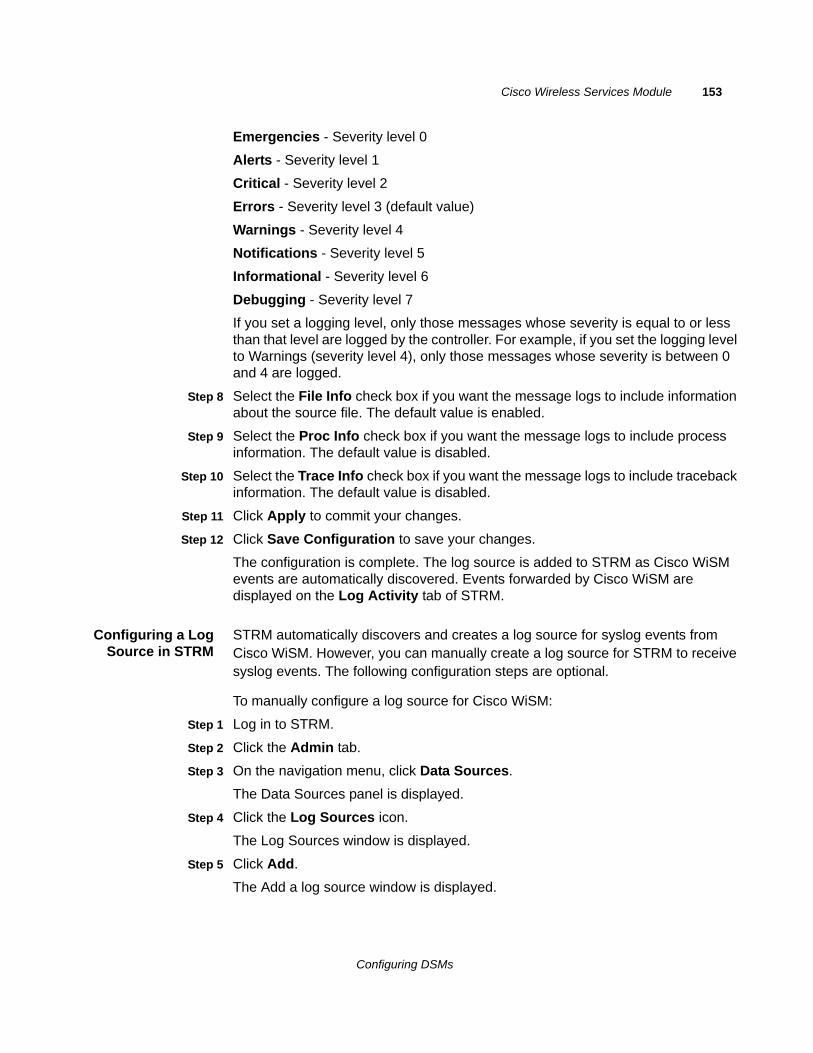
Cisco Wireless Services Module 153
Emergencies - Severity level 0
Alerts - Severity level 1
Critical - Severity level 2
Errors - Severity level 3 (default value)
Warnings - Severity level 4
Notifications - Severity level 5
Informational - Severity level 6
Debugging - Severity level 7
If you set a logging level, only those messages whose severity is equal to or less than that level are logged by the controller. For example, if you set the logging level to Warnings (severity level 4), only those messages whose severity is between 0 and 4 are logged.
Step 8 Select the File Info check box if you want the message logs to include information about the source file. The default value is enabled.
Step 9 Select the Proc Info check box if you want the message logs to include process information. The default value is disabled.
Step 10 Select the Trace Info check box if you want the message logs to include traceback information. The default value is disabled.
Step 11 Click Apply to commit your changes.
Step 12 Click Save Configuration to save your changes.
The configuration is complete. The log source is added to STRM as Cisco WiSM events are automatically discovered. Events forwarded by Cisco WiSM are displayed on the Log Activity tab of STRM.
Configuring a LogSource in STRM
STRM automatically discovers and creates a log source for syslog events from Cisco WiSM. However, you can manually create a log source for STRM to receive syslog events. The following configuration steps are optional.
To manually configure a log source for Cisco WiSM:
Step 1 Log in to STRM.
Step 2 Click the Admin tab.
Step 3 On the navigation menu, click Data Sources.
The Data Sources panel is displayed.
Step 4 Click the Log Sources icon.
The Log Sources window is displayed.
Step 5 Click Add.
The Add a log source window is displayed.
Configuring DSMs
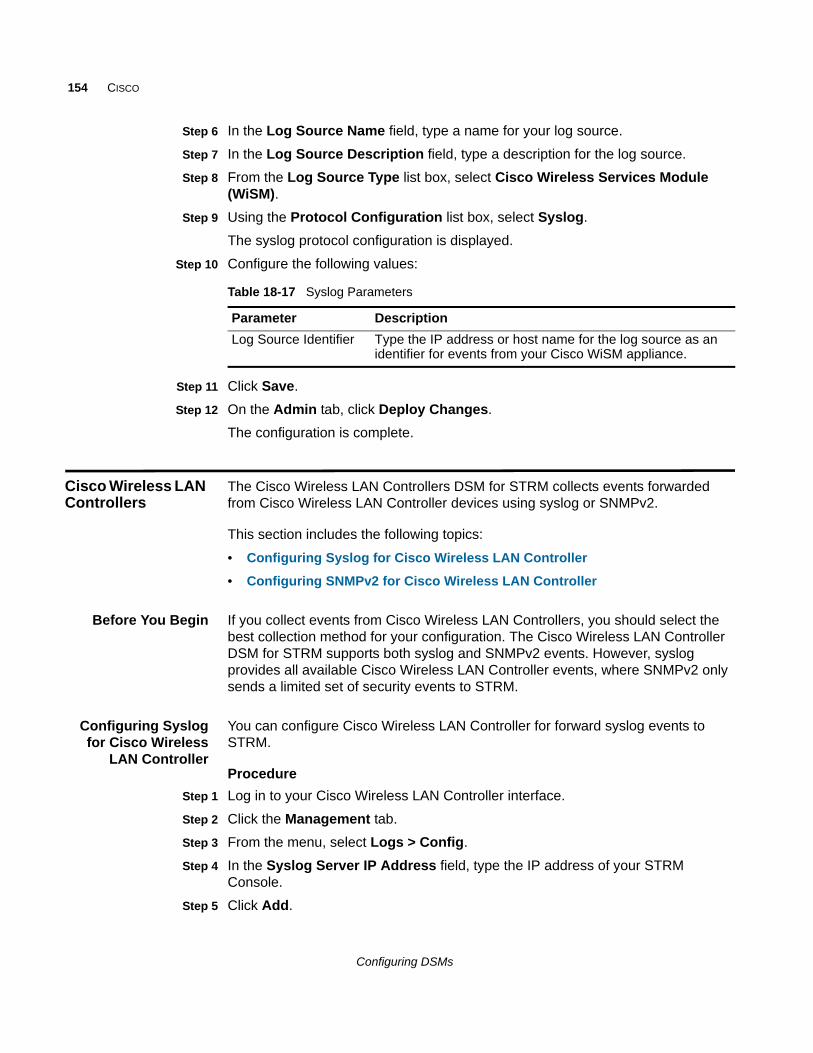
154 CISCO
Step 6 In the Log Source Name field, type a name for your log source.
Step 7 In the Log Source Description field, type a description for the log source.
Step 8 From the Log Source Type list box, select Cisco Wireless Services Module (WiSM).
Step 9 Using the Protocol Configuration list box, select Syslog.
The syslog protocol configuration is displayed.
Step 10 Configure the following values:
Step 11 Click Save.
Step 12 On the Admin tab, click Deploy Changes.
The configuration is complete.
Cisco Wireless LAN Controllers
The Cisco Wireless LAN Controllers DSM for STRM collects events forwarded from Cisco Wireless LAN Controller devices using syslog or SNMPv2.
This section includes the following topics:
• Configuring Syslog for Cisco Wireless LAN Controller
• Configuring SNMPv2 for Cisco Wireless LAN Controller
Before You Begin If you collect events from Cisco Wireless LAN Controllers, you should select the best collection method for your configuration. The Cisco Wireless LAN Controller DSM for STRM supports both syslog and SNMPv2 events. However, syslog provides all available Cisco Wireless LAN Controller events, where SNMPv2 only sends a limited set of security events to STRM.
Configuring Syslogfor Cisco Wireless
LAN Controller
You can configure Cisco Wireless LAN Controller for forward syslog events to STRM.
Procedure
Step 1 Log in to your Cisco Wireless LAN Controller interface.
Step 2 Click the Management tab.
Step 3 From the menu, select Logs > Config.
Step 4 In the Syslog Server IP Address field, type the IP address of your STRM Console.
Step 5 Click Add.
Table 18-17 Syslog Parameters
Parameter Description
Log Source Identifier Type the IP address or host name for the log source as an identifier for events from your Cisco WiSM appliance.
Configuring DSMs
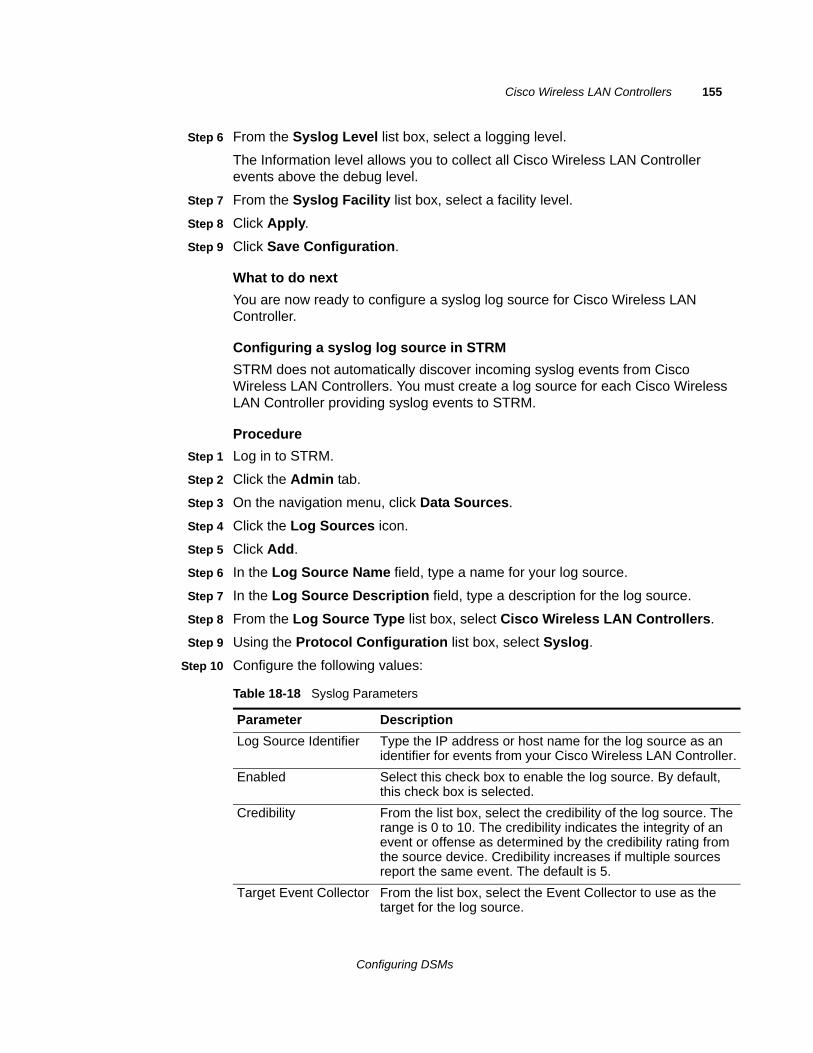
Cisco Wireless LAN Controllers 155
Step 6 From the Syslog Level list box, select a logging level.
The Information level allows you to collect all Cisco Wireless LAN Controller events above the debug level.
Step 7 From the Syslog Facility list box, select a facility level.
Step 8 Click Apply.
Step 9 Click Save Configuration.
What to do next
You are now ready to configure a syslog log source for Cisco Wireless LAN Controller.
Configuring a syslog log source in STRM
STRM does not automatically discover incoming syslog events from Cisco Wireless LAN Controllers. You must create a log source for each Cisco Wireless LAN Controller providing syslog events to STRM.
Procedure
Step 1 Log in to STRM.
Step 2 Click the Admin tab.
Step 3 On the navigation menu, click Data Sources.
Step 4 Click the Log Sources icon.
Step 5 Click Add.
Step 6 In the Log Source Name field, type a name for your log source.
Step 7 In the Log Source Description field, type a description for the log source.
Step 8 From the Log Source Type list box, select Cisco Wireless LAN Controllers.
Step 9 Using the Protocol Configuration list box, select Syslog.
Step 10 Configure the following values:
Table 18-18 Syslog Parameters
Parameter Description
Log Source Identifier Type the IP address or host name for the log source as an identifier for events from your Cisco Wireless LAN Controller.
Enabled Select this check box to enable the log source. By default, this check box is selected.
Credibility From the list box, select the credibility of the log source. The range is 0 to 10. The credibility indicates the integrity of an event or offense as determined by the credibility rating from the source device. Credibility increases if multiple sources report the same event. The default is 5.
Target Event Collector From the list box, select the Event Collector to use as the target for the log source.
Configuring DSMs
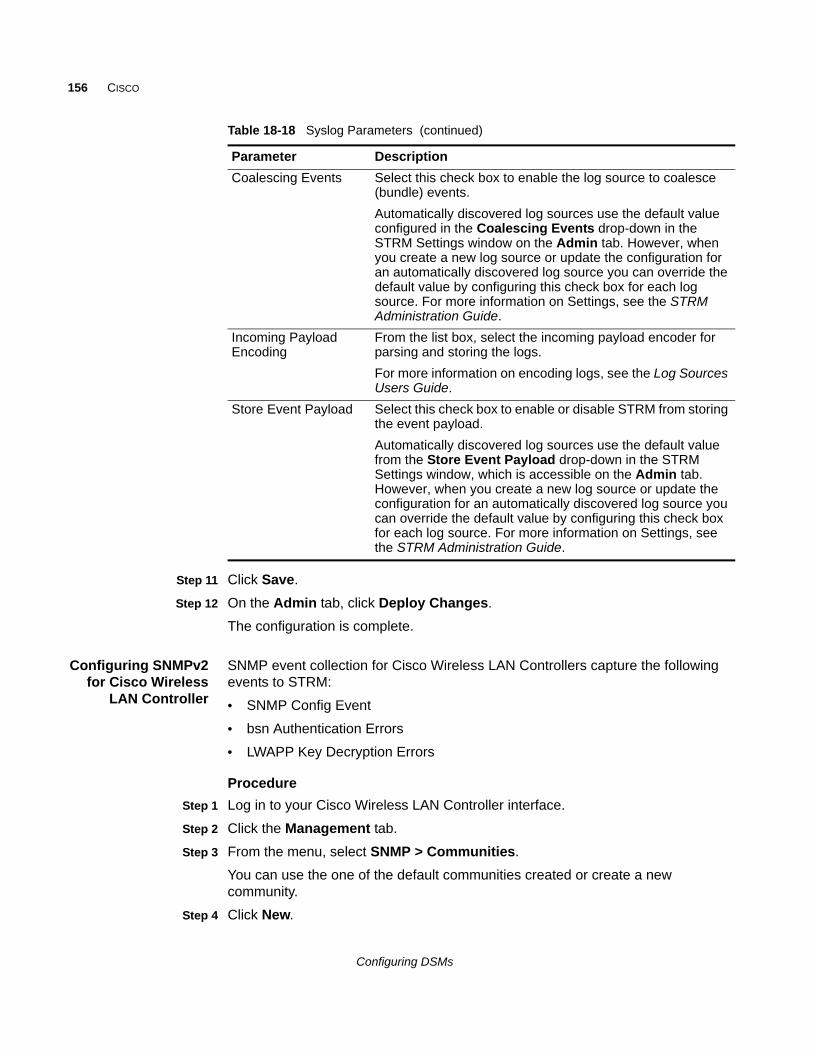
156 CISCO
Step 11 Click Save.
Step 12 On the Admin tab, click Deploy Changes.
The configuration is complete.
Configuring SNMPv2for Cisco Wireless
LAN Controller
SNMP event collection for Cisco Wireless LAN Controllers capture the following events to STRM:
• SNMP Config Event
• bsn Authentication Errors
• LWAPP Key Decryption Errors
Procedure
Step 1 Log in to your Cisco Wireless LAN Controller interface.
Step 2 Click the Management tab.
Step 3 From the menu, select SNMP > Communities.
You can use the one of the default communities created or create a new community.
Step 4 Click New.
Coalescing Events Select this check box to enable the log source to coalesce (bundle) events.
Automatically discovered log sources use the default value configured in the Coalescing Events drop-down in the STRM Settings window on the Admin tab. However, when you create a new log source or update the configuration for an automatically discovered log source you can override the default value by configuring this check box for each log source. For more information on Settings, see the STRM Administration Guide.
Incoming Payload Encoding
From the list box, select the incoming payload encoder for parsing and storing the logs.
For more information on encoding logs, see the Log Sources Users Guide.
Store Event Payload Select this check box to enable or disable STRM from storing the event payload.
Automatically discovered log sources use the default value from the Store Event Payload drop-down in the STRM Settings window, which is accessible on the Admin tab. However, when you create a new log source or update the configuration for an automatically discovered log source you can override the default value by configuring this check box for each log source. For more information on Settings, see the STRM Administration Guide.
Table 18-18 Syslog Parameters (continued)
Parameter Description
Configuring DSMs
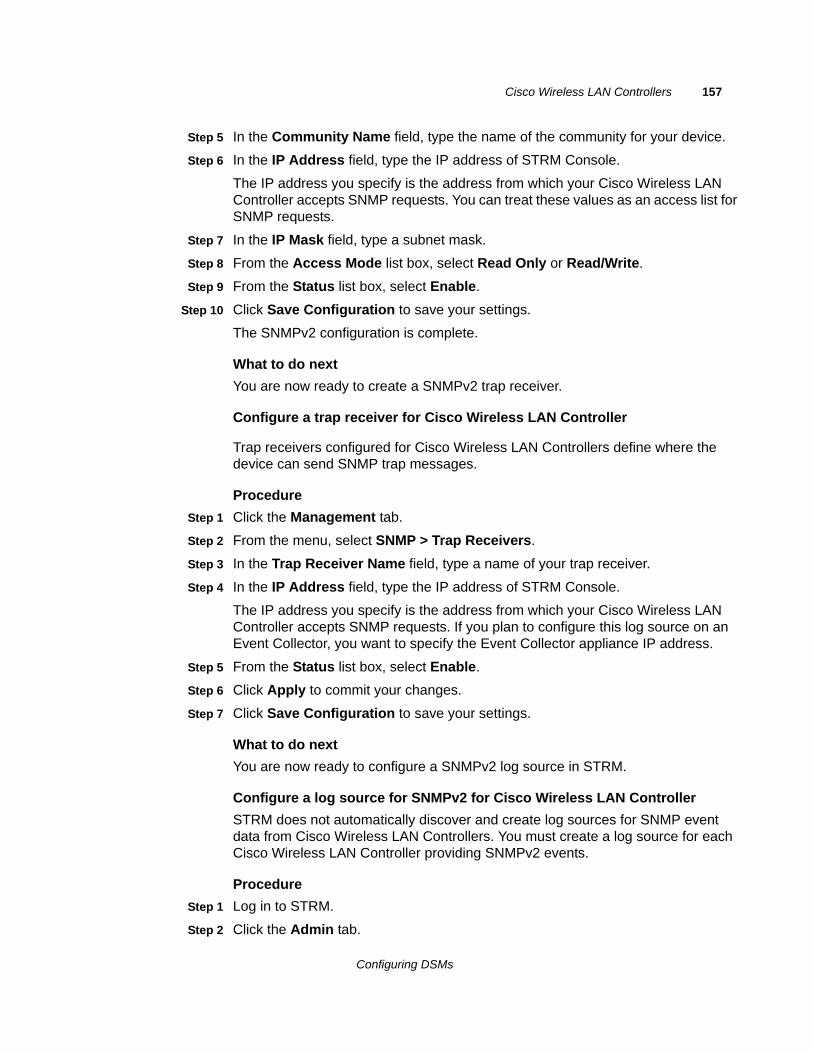
Cisco Wireless LAN Controllers 157
Step 5 In the Community Name field, type the name of the community for your device.
Step 6 In the IP Address field, type the IP address of STRM Console.
The IP address you specify is the address from which your Cisco Wireless LAN Controller accepts SNMP requests. You can treat these values as an access list for SNMP requests.
Step 7 In the IP Mask field, type a subnet mask.
Step 8 From the Access Mode list box, select Read Only or Read/Write.
Step 9 From the Status list box, select Enable.
Step 10 Click Save Configuration to save your settings.
The SNMPv2 configuration is complete.
What to do next
You are now ready to create a SNMPv2 trap receiver.
Configure a trap receiver for Cisco Wireless LAN Controller
Trap receivers configured for Cisco Wireless LAN Controllers define where the device can send SNMP trap messages.
Procedure
Step 1 Click the Management tab.
Step 2 From the menu, select SNMP > Trap Receivers.
Step 3 In the Trap Receiver Name field, type a name of your trap receiver.
Step 4 In the IP Address field, type the IP address of STRM Console.
The IP address you specify is the address from which your Cisco Wireless LAN Controller accepts SNMP requests. If you plan to configure this log source on an Event Collector, you want to specify the Event Collector appliance IP address.
Step 5 From the Status list box, select Enable.
Step 6 Click Apply to commit your changes.
Step 7 Click Save Configuration to save your settings.
What to do next
You are now ready to configure a SNMPv2 log source in STRM.
Configure a log source for SNMPv2 for Cisco Wireless LAN Controller
STRM does not automatically discover and create log sources for SNMP event data from Cisco Wireless LAN Controllers. You must create a log source for each Cisco Wireless LAN Controller providing SNMPv2 events.
Procedure
Step 1 Log in to STRM.
Step 2 Click the Admin tab.
Configuring DSMs
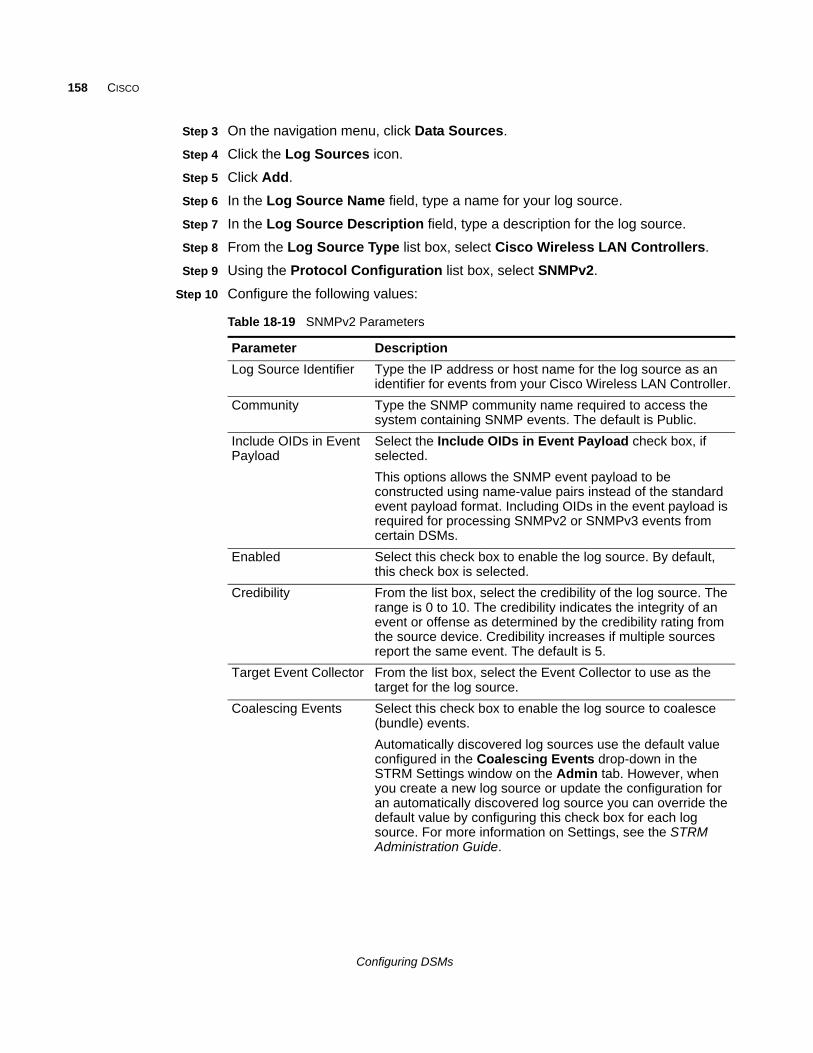
158 CISCO
Step 3 On the navigation menu, click Data Sources.
Step 4 Click the Log Sources icon.
Step 5 Click Add.
Step 6 In the Log Source Name field, type a name for your log source.
Step 7 In the Log Source Description field, type a description for the log source.
Step 8 From the Log Source Type list box, select Cisco Wireless LAN Controllers.
Step 9 Using the Protocol Configuration list box, select SNMPv2.
Step 10 Configure the following values:
Table 18-19 SNMPv2 Parameters
Parameter Description
Log Source Identifier Type the IP address or host name for the log source as an identifier for events from your Cisco Wireless LAN Controller.
Community Type the SNMP community name required to access the system containing SNMP events. The default is Public.
Include OIDs in Event Payload
Select the Include OIDs in Event Payload check box, if selected.
This options allows the SNMP event payload to be constructed using name-value pairs instead of the standard event payload format. Including OIDs in the event payload is required for processing SNMPv2 or SNMPv3 events from certain DSMs.
Enabled Select this check box to enable the log source. By default, this check box is selected.
Credibility From the list box, select the credibility of the log source. The range is 0 to 10. The credibility indicates the integrity of an event or offense as determined by the credibility rating from the source device. Credibility increases if multiple sources report the same event. The default is 5.
Target Event Collector From the list box, select the Event Collector to use as the target for the log source.
Coalescing Events Select this check box to enable the log source to coalesce (bundle) events.
Automatically discovered log sources use the default value configured in the Coalescing Events drop-down in the STRM Settings window on the Admin tab. However, when you create a new log source or update the configuration for an automatically discovered log source you can override the default value by configuring this check box for each log source. For more information on Settings, see the STRM Administration Guide.
Configuring DSMs
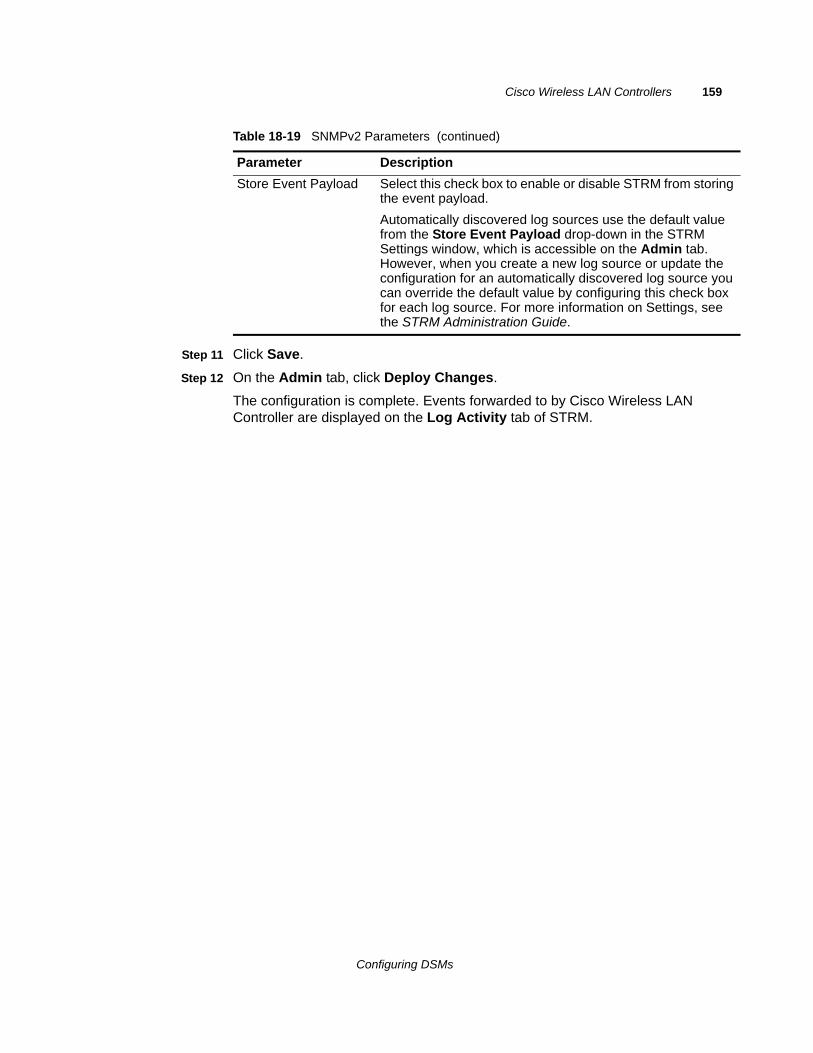
Cisco Wireless LAN Controllers 159
Step 11 Click Save.
Step 12 On the Admin tab, click Deploy Changes.
The configuration is complete. Events forwarded to by Cisco Wireless LAN Controller are displayed on the Log Activity tab of STRM.
Store Event Payload Select this check box to enable or disable STRM from storing the event payload.
Automatically discovered log sources use the default value from the Store Event Payload drop-down in the STRM Settings window, which is accessible on the Admin tab. However, when you create a new log source or update the configuration for an automatically discovered log source you can override the default value by configuring this check box for each log source. For more information on Settings, see the STRM Administration Guide.
Table 18-19 SNMPv2 Parameters (continued)
Parameter Description
Configuring DSMs

160 CISCO
Configuring DSMs
19
CITRIX NETSCALERThe Citrix NetScaler DSM for STRM accepts events using syslog. STRM records all relevant audit log events from Citrix NetScaler.
This section includes the following topics:
• Configuring Syslog for Citrix NetScaler
• Configuring a Log Source in STRM
Configuring Syslogfor Citrix NetScaler
Before you configure STRM to integrate with Citrix NetScaler, you must:
Step 1 Using SSH, log in to your Citrix NetScaler device as a root user.
Step 2 Type the following command to add a remote syslog server:
add audit syslogAction <ActionName> <IP Address> -serverPort 514 -logLevel Info -dateFormat DDMMYYYY
Where:
<ActionName> is a descriptive name for the syslog server action.
<IP Address> is the IP address or hostname of your STRM Console.
For example:
add audit syslogAction action-STRM 10.10.10.10 -serverPort 514 -logLevel Info -dateFormat DDMMYYYY
Step 3 Type the following command to add an audit policy:
add audit syslogPolicy <PolicyName> <Rule> <ActionName>
Where:
<PolicyName> is a descriptive name for the syslog policy.
<Rule> is the rule or expression the policy uses. The only supported value is ns_true.
<ActionName> is a descriptive name for the syslog server action.
For example:
add audit syslogPolicy policy-STRM ns_true action-STRM
Configuring DSMs
162 CITRIX NETSCALER
Step 4 Type the following command to bind the policy globally:
bind system global <PolicyName> -priority <Integer>
Where:
<PolicyName> is a descriptive name for the syslog policy.
<Integer> is a numeric value used to rank message priority for multiple policies that are communicating using syslog.
For example:
bind system global policy-STRM -priority 30
When multiple policies have priority assigned to them as a numeric value the lower priority value is evaluated before the higher value.
Step 5 Type the following command to save the Citrix NetScaler configuration.
save config
Step 6 Type the following command to verify the policy is saved in your configuration:
sh system global
NOTEFor information on configuring syslog using the Citrix NetScaler user interface, see http://support.citrix.com/article/CTX121728 or your vendor documentation.
The configuration is complete. The log source is added to STRM as Citrix NetScaler events are automatically discovered. Events forwarded by Citrix NetScaler are displayed on the Log Activity tab of STRM.
Configuring a LogSource in STRM
STRM automatically discovers and creates a log source for syslog events from Citrix NetScaler. However, you can manually create a log source for STRM to receive syslog events. The following configuration steps are optional.
To manually configure a log source for Citrix NetScaler:
Step 1 Log in to STRM.
Step 2 Click the Admin tab.
Step 3 On the navigation menu, click Data Sources.
The Data Sources panel is displayed.
Step 4 Click the Log Sources icon.
The Log Sources window is displayed.
Step 5 Click Add.
The Add a log source window is displayed.
Step 6 In the Log Source Name field, type a name for your log source.
Step 7 In the Log Source Description field, type a description for the log source.
Step 8 From the Log Source Type list box, select Citrix NetScaler.
Configuring DSMs
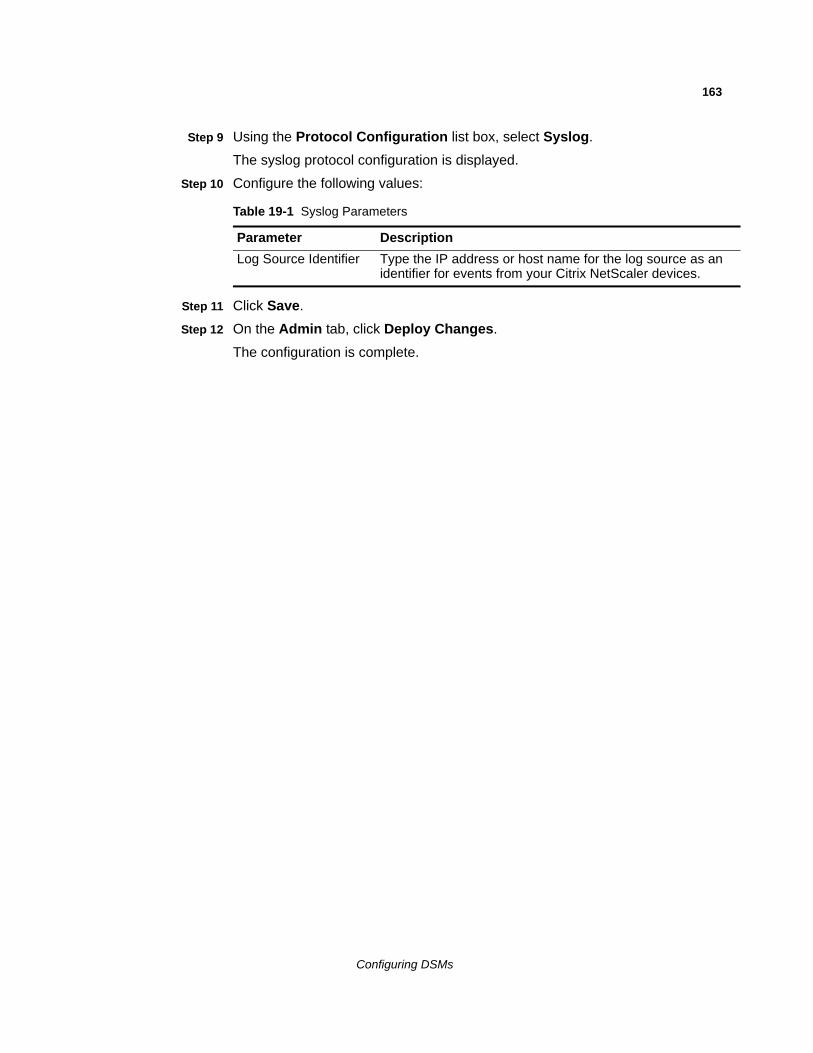
163
Step 9 Using the Protocol Configuration list box, select Syslog.
The syslog protocol configuration is displayed.
Step 10 Configure the following values:
Step 11 Click Save.
Step 12 On the Admin tab, click Deploy Changes.
The configuration is complete.
Table 19-1 Syslog Parameters
Parameter Description
Log Source Identifier Type the IP address or host name for the log source as an identifier for events from your Citrix NetScaler devices.
Configuring DSMs

20
CRYPTOCARD CRYPTO-SHIELDThe STRM CRYPTOCard CRYPTO-Shield DSM for STRM accepts events using syslog. STRM records all relevant events. Before configuring a CRYPTOCard CRYPTO-Shield device in STRM, you must configure your CRYPTOCard CRYPTO-Shield device to forward syslog events.
This section includes the following topics:
• Configuring CRYPTOCard CRYPTO-Shield to Forward Events
• Configuring a Log Source in STRM
ConfiguringCRYPTOCard
CRYPTO-Shield toForward Events
To configure your CRYPTOCard CRYPTO-Shield device to forward syslog events:
Step 1 Log in to your CRYPTOCard CRYPTO-Shield device.
Step 2 Configure the following System Configuration parameters:
NOTEYou must have CRYPTOCard Operator access with the assigned default Super-Operator system role to access the System Configuration parameters.
• log4j.appender.<protocol> - Directs the logs to a syslog host where the <protocol> is the type of log appender, which determines where you want to send logs for storage. The options are: ACC, DBG, or LOG. For this parameter, type the following: org.apache.log4j.net.SyslogAppender
• log4j.appender.<protocol>.SyslogHost <IP address> - Type the IP address or hostname of the syslog server where:
- <protocol> is the type of log appender, which determines where you want to send logs for storage. The options are: ACC, DBG, or LOG.
- <IP address> is the IP address of the STRM host to which you want to send logs. This value can only be specified when the first parameter is configured.
This parameter can only be specified when the log4j.apender.<protocol> parameter is configured.
You are now ready to configure the log source in STRM.
Configuring DSMs
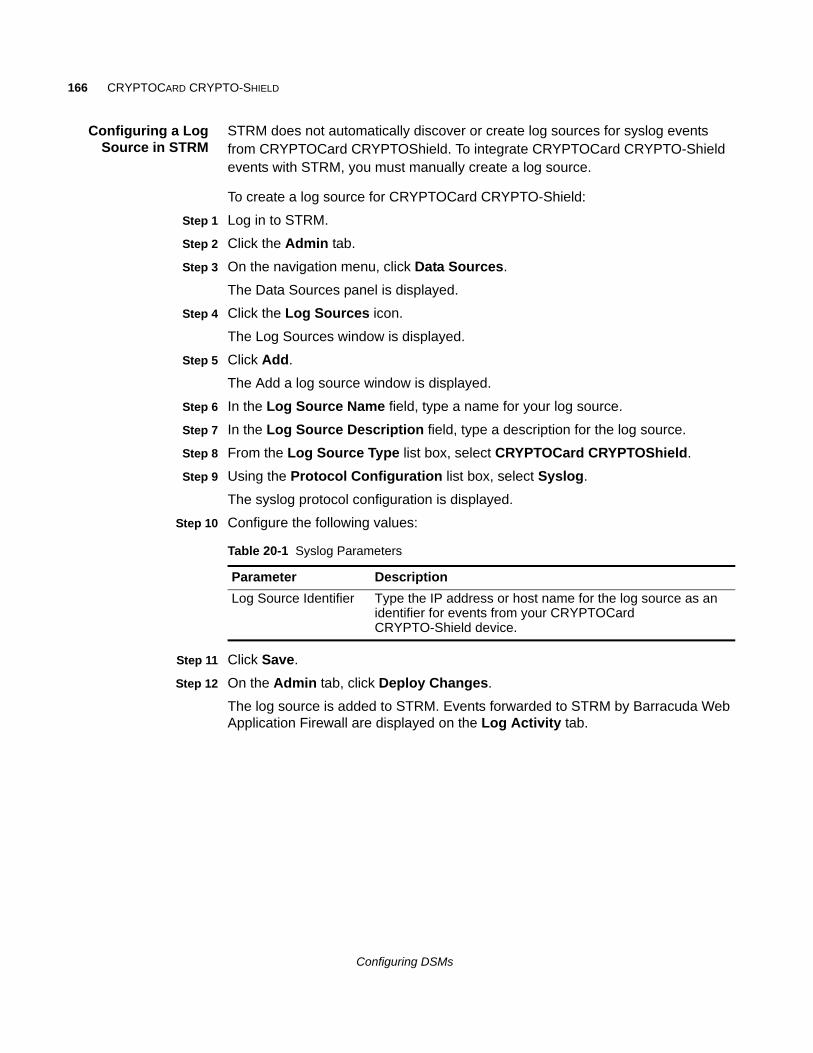
166 CRYPTOCARD CRYPTO-SHIELD
Configuring a LogSource in STRM
STRM does not automatically discover or create log sources for syslog events from CRYPTOCard CRYPTOShield. To integrate CRYPTOCard CRYPTO-Shield events with STRM, you must manually create a log source.
To create a log source for CRYPTOCard CRYPTO-Shield:
Step 1 Log in to STRM.
Step 2 Click the Admin tab.
Step 3 On the navigation menu, click Data Sources.
The Data Sources panel is displayed.
Step 4 Click the Log Sources icon.
The Log Sources window is displayed.
Step 5 Click Add.
The Add a log source window is displayed.
Step 6 In the Log Source Name field, type a name for your log source.
Step 7 In the Log Source Description field, type a description for the log source.
Step 8 From the Log Source Type list box, select CRYPTOCard CRYPTOShield.
Step 9 Using the Protocol Configuration list box, select Syslog.
The syslog protocol configuration is displayed.
Step 10 Configure the following values:
Step 11 Click Save.
Step 12 On the Admin tab, click Deploy Changes.
The log source is added to STRM. Events forwarded to STRM by Barracuda Web Application Firewall are displayed on the Log Activity tab.
Table 20-1 Syslog Parameters
Parameter Description
Log Source Identifier Type the IP address or host name for the log source as an identifier for events from your CRYPTOCard CRYPTO-Shield device.
Configuring DSMs
21
CYBER-ARK VAULTThe Cyber-Ark Vault DSM for STRM accepts events using the Log Enhanced Event Protocol (LEEF). STRM records both user activities and safe activities from the Cyber-Ark Vault in the audit log events. Cyber-Ark Vault integrates with STRM to forward audit logs using syslog to create a complete audit picture of privileged account activities. Before configuring a Cyber-Ark Vault device in STRM, you must configure your device to forward syslog events.
This section includes the following topics:
• Configuring Syslog Forwarding for Cyber-Ark Vault
• Configuring a Log Source in STRM
Configuring SyslogForwarding for
Cyber-Ark Vault
To configure Cyber-Ark Vault to forward syslog events to STRM:
Step 1 Log in to your Cyber-Ark device.
Step 2 Edit the DBParm.ini file.
Step 3 Configure the following parameters:
• SyslogServerIP - Type the IP address of STRM.
• SyslogServerPort - Type the UDP port used to connect to STRM. The default value is 514.
• SyslogMessageCodeFilter - Configure which message codes are sent from the Cyber-Ark Vault to STRM. You can define specific message numbers or a range of numbers. By default, all message codes are sent for user activities and safe activities.
For example, to define a message code of 1,2,3,30 and 5-10, you must type: 1,2,3,5-10,30.
• SyslogTranslatorFile - Type the file path to the LEEF.xsl translator file. The translator file is used to parse Cyber-Ark audit records data in the syslog protocol.
Step 4 Copy LEEF.xsl to the location specified by the SyslogTranslatorFile parameter in the DBParm.ini file.
Configuring DSMs
168 CYBER-ARK VAULT
The configuration is complete. The log source is added to STRM as Cyber-Ark Vault events are automatically discovered. Events forwarded by Cyber-Ark Vault are displayed on the Log Activity tab of STRM.
Configuring a LogSource in STRM
STRM automatically discovers and creates a log source for syslog events from Cyber-Ark Vault. However, you can manually create a log source for STRM to receive syslog events. The following configuration steps are optional.
To manually configure a log source for Cyber-Ark Vault:
Step 1 Log in to STRM.
Step 2 Click the Admin tab.
Step 3 On the navigation menu, click Data Sources.
The Data Sources panel is displayed.
Step 4 Click the Log Sources icon.
The Log Sources window is displayed.
Step 5 Click Add.
The Add a log source window is displayed.
Step 6 In the Log Source Name field, type a name for your log source.
Step 7 In the Log Source Description field, type a description for the log source.
Step 8 From the Log Source Type list box, select Cyber-Ark Vault.
Step 9 Using the Protocol Configuration list box, select Syslog.
The syslog protocol configuration is displayed.
Step 10 Configure the following values:
Step 11 Click Save.
Step 12 On the Admin tab, click Deploy Changes.
The configuration is complete.
Table 21-1 Syslog Parameters
Parameter Description
Log Source Identifier Type the IP address or host name for the log source as an identifier for events from your Cyber-Ark Vault appliance.
Configuring DSMs
22
CYBERGUARD FIREWALL/VPN APPLIANCEThe CyberGuard Firewall VPN Appliance DSM for STRM accepts CyberGuard events using syslog. STRM records all relevant CyberGuard events. STRM supports the CyberGuard KS series of appliances.
This section includes the following topics:
• Configuring CyberGuard to Forward Syslog Events
• Configuring a Log Source in STRM
ConfiguringCyberGuard to
Forward SyslogEvents
To configure a CyberGuard device to forward syslog events:
Step 1 Log in to the CyberGuard user interface.
Step 2 Select the Advanced page.
Step 3 Under System Log, select Enable Remote Logging.
Step 4 Type the IP address of STRM.
Step 5 Click Apply.
The configuration is complete. The log source is added to STRM as CyberGuard events are automatically discovered. Events forwarded by CyberGuard appliances are displayed on the Log Activity tab of STRM.
Configuring a LogSource in STRM
STRM automatically discovers and creates a log source for syslog events from CyberGuard appliances. However, you can manually create a log source for STRM to receive syslog events. The following configuration steps are optional.
To manually configure a log source for CyberGuard appliances:
Step 1 Log in to STRM.
Step 2 Click the Admin tab.
Step 3 On the navigation menu, click Data Sources.
The Data Sources panel is displayed.
Configuring DSMs
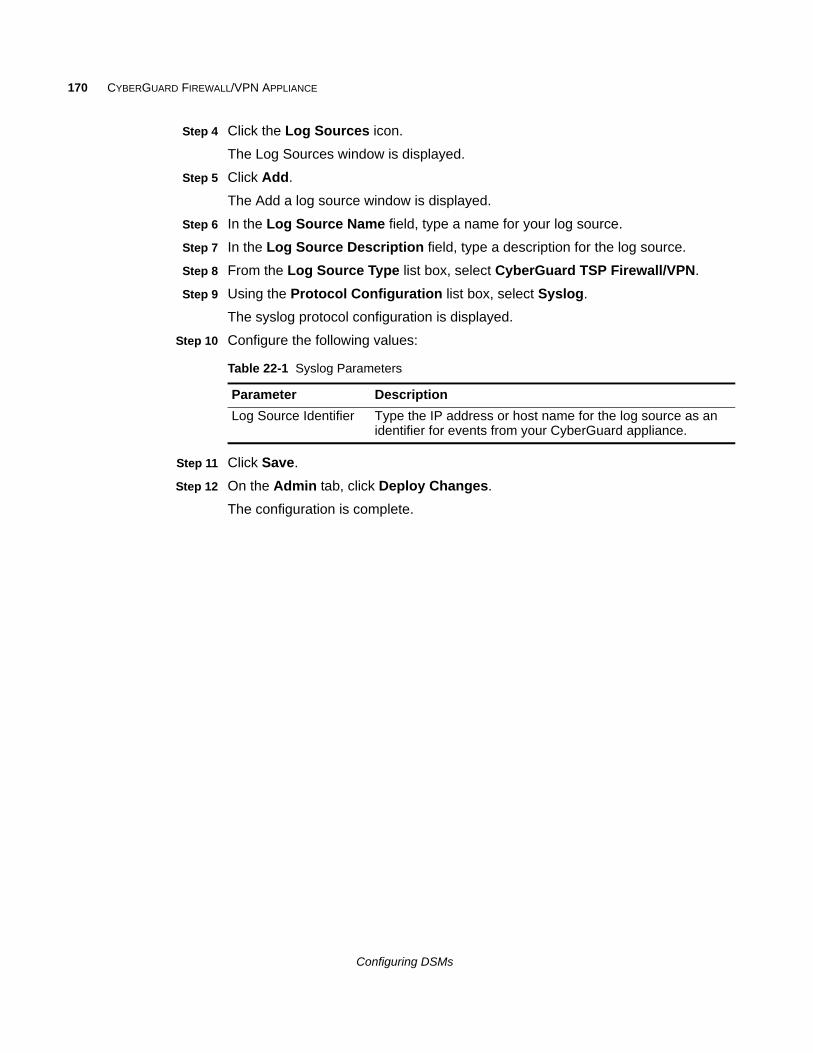
170 CYBERGUARD FIREWALL/VPN APPLIANCE
Step 4 Click the Log Sources icon.
The Log Sources window is displayed.
Step 5 Click Add.
The Add a log source window is displayed.
Step 6 In the Log Source Name field, type a name for your log source.
Step 7 In the Log Source Description field, type a description for the log source.
Step 8 From the Log Source Type list box, select CyberGuard TSP Firewall/VPN.
Step 9 Using the Protocol Configuration list box, select Syslog.
The syslog protocol configuration is displayed.
Step 10 Configure the following values:
Step 11 Click Save.
Step 12 On the Admin tab, click Deploy Changes.
The configuration is complete.
Table 22-1 Syslog Parameters
Parameter Description
Log Source Identifier Type the IP address or host name for the log source as an identifier for events from your CyberGuard appliance.
Configuring DSMs
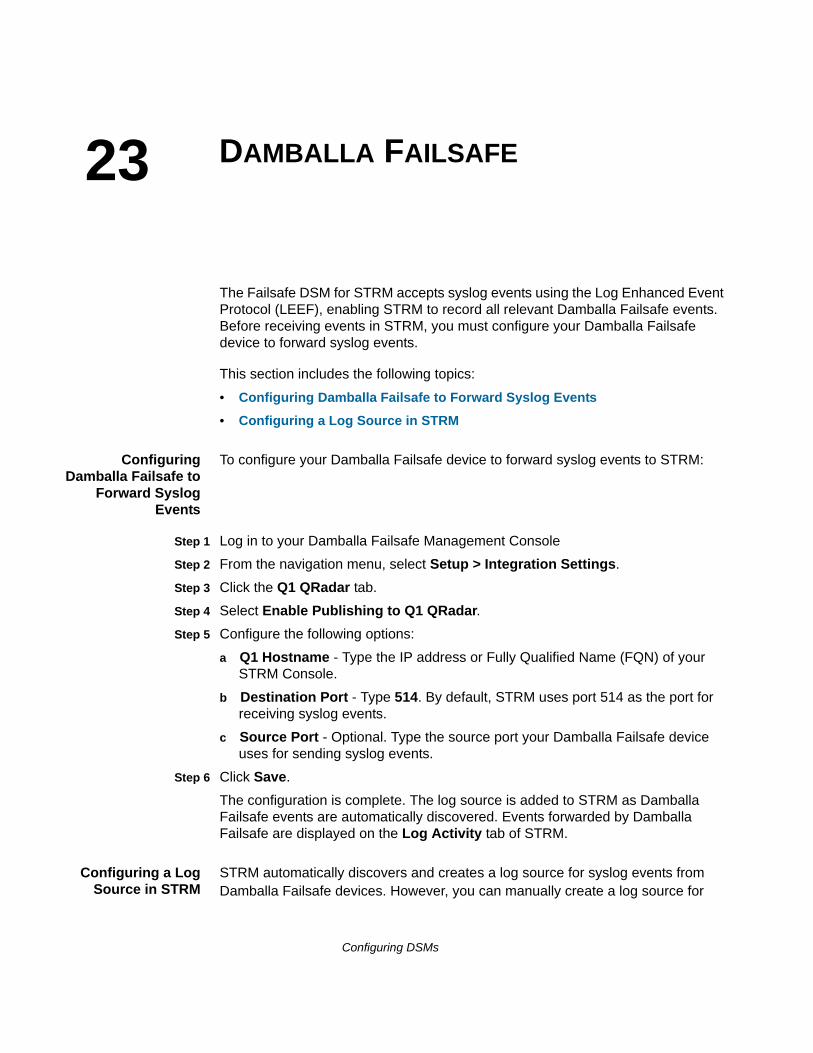
23
DAMBALLA FAILSAFEThe Failsafe DSM for STRM accepts syslog events using the Log Enhanced Event Protocol (LEEF), enabling STRM to record all relevant Damballa Failsafe events. Before receiving events in STRM, you must configure your Damballa Failsafe device to forward syslog events.
This section includes the following topics:
• Configuring Damballa Failsafe to Forward Syslog Events
• Configuring a Log Source in STRM
ConfiguringDamballa Failsafe to
Forward SyslogEvents
To configure your Damballa Failsafe device to forward syslog events to STRM:
Step 1 Log in to your Damballa Failsafe Management Console
Step 2 From the navigation menu, select Setup > Integration Settings.
Step 3 Click the Q1 QRadar tab.
Step 4 Select Enable Publishing to Q1 QRadar.
Step 5 Configure the following options:
a Q1 Hostname - Type the IP address or Fully Qualified Name (FQN) of your STRM Console.
b Destination Port - Type 514. By default, STRM uses port 514 as the port for receiving syslog events.
c Source Port - Optional. Type the source port your Damballa Failsafe device uses for sending syslog events.
Step 6 Click Save.
The configuration is complete. The log source is added to STRM as Damballa Failsafe events are automatically discovered. Events forwarded by Damballa Failsafe are displayed on the Log Activity tab of STRM.
Configuring a LogSource in STRM
STRM automatically discovers and creates a log source for syslog events from Damballa Failsafe devices. However, you can manually create a log source for
Configuring DSMs
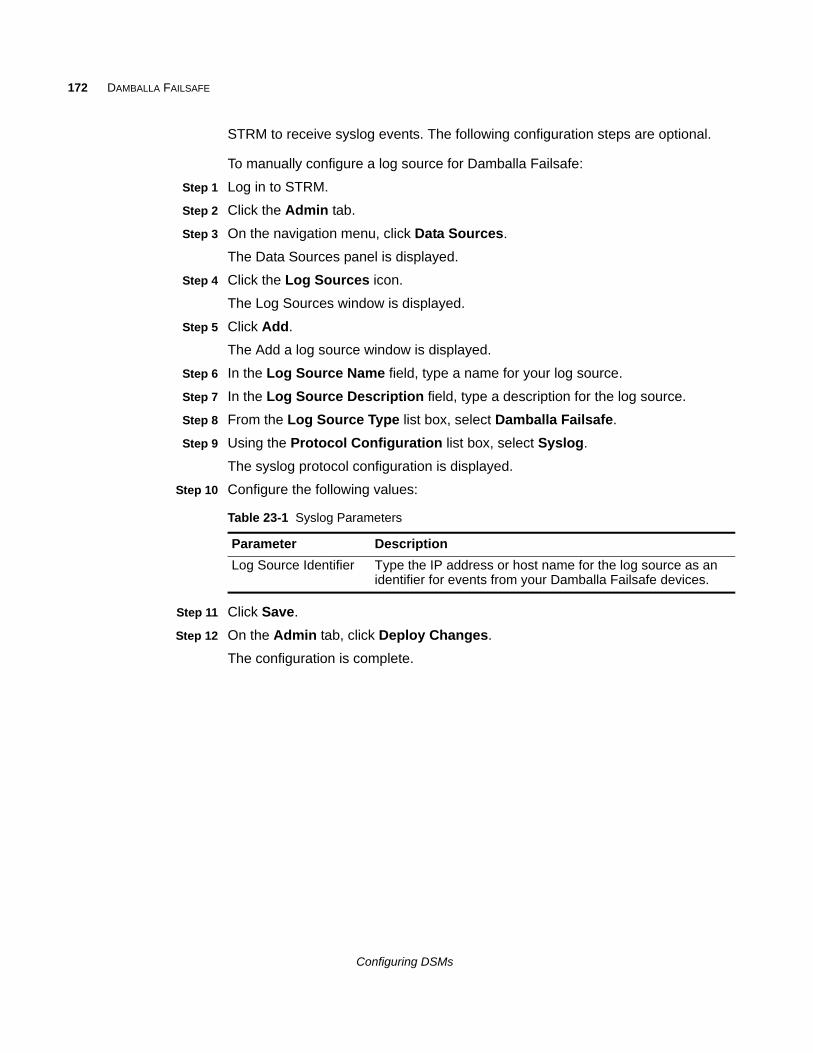
172 DAMBALLA FAILSAFE
STRM to receive syslog events. The following configuration steps are optional.
To manually configure a log source for Damballa Failsafe:
Step 1 Log in to STRM.
Step 2 Click the Admin tab.
Step 3 On the navigation menu, click Data Sources.
The Data Sources panel is displayed.
Step 4 Click the Log Sources icon.
The Log Sources window is displayed.
Step 5 Click Add.
The Add a log source window is displayed.
Step 6 In the Log Source Name field, type a name for your log source.
Step 7 In the Log Source Description field, type a description for the log source.
Step 8 From the Log Source Type list box, select Damballa Failsafe.
Step 9 Using the Protocol Configuration list box, select Syslog.
The syslog protocol configuration is displayed.
Step 10 Configure the following values:
Step 11 Click Save.
Step 12 On the Admin tab, click Deploy Changes.
The configuration is complete.
Table 23-1 Syslog Parameters
Parameter Description
Log Source Identifier Type the IP address or host name for the log source as an identifier for events from your Damballa Failsafe devices.
Configuring DSMs
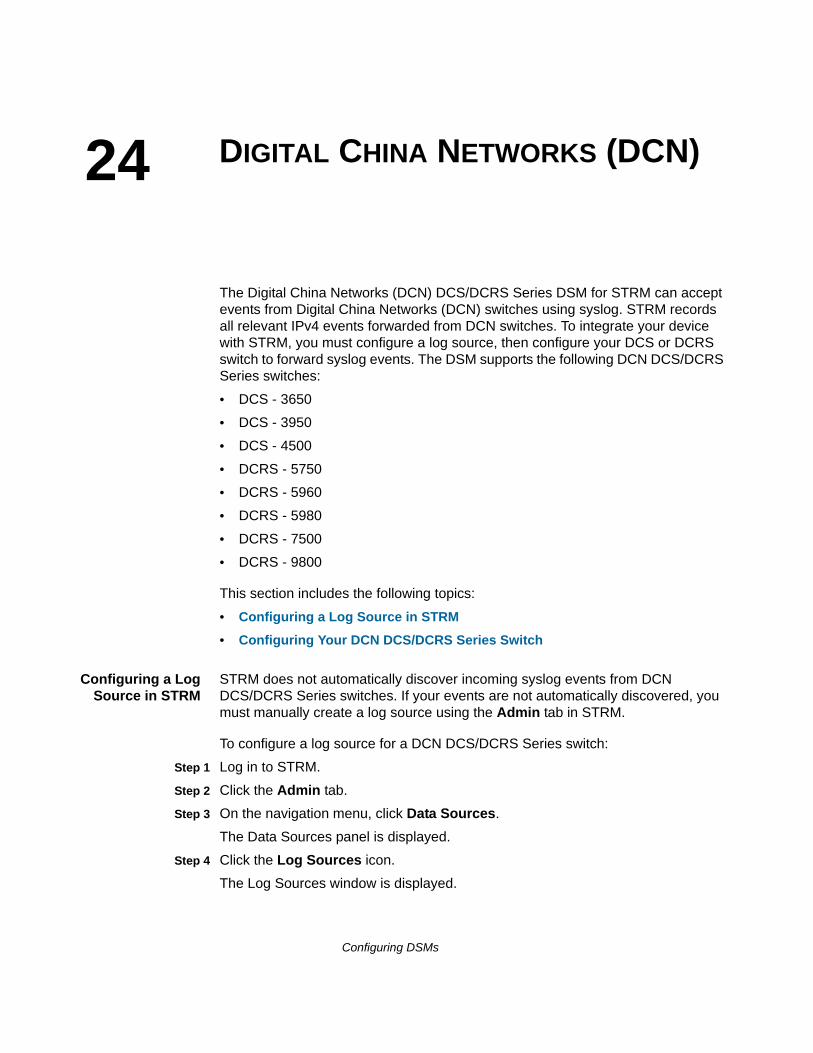
24
DIGITAL CHINA NETWORKS (DCN)The Digital China Networks (DCN) DCS/DCRS Series DSM for STRM can accept events from Digital China Networks (DCN) switches using syslog. STRM records all relevant IPv4 events forwarded from DCN switches. To integrate your device with STRM, you must configure a log source, then configure your DCS or DCRS switch to forward syslog events. The DSM supports the following DCN DCS/DCRS Series switches:
• DCS - 3650
• DCS - 3950
• DCS - 4500
• DCRS - 5750
• DCRS - 5960
• DCRS - 5980
• DCRS - 7500
• DCRS - 9800
This section includes the following topics:
• Configuring a Log Source in STRM
• Configuring Your DCN DCS/DCRS Series Switch
Configuring a LogSource in STRM
STRM does not automatically discover incoming syslog events from DCN DCS/DCRS Series switches. If your events are not automatically discovered, you must manually create a log source using the Admin tab in STRM.
To configure a log source for a DCN DCS/DCRS Series switch:
Step 1 Log in to STRM.
Step 2 Click the Admin tab.
Step 3 On the navigation menu, click Data Sources.
The Data Sources panel is displayed.
Step 4 Click the Log Sources icon.
The Log Sources window is displayed.
Configuring DSMs
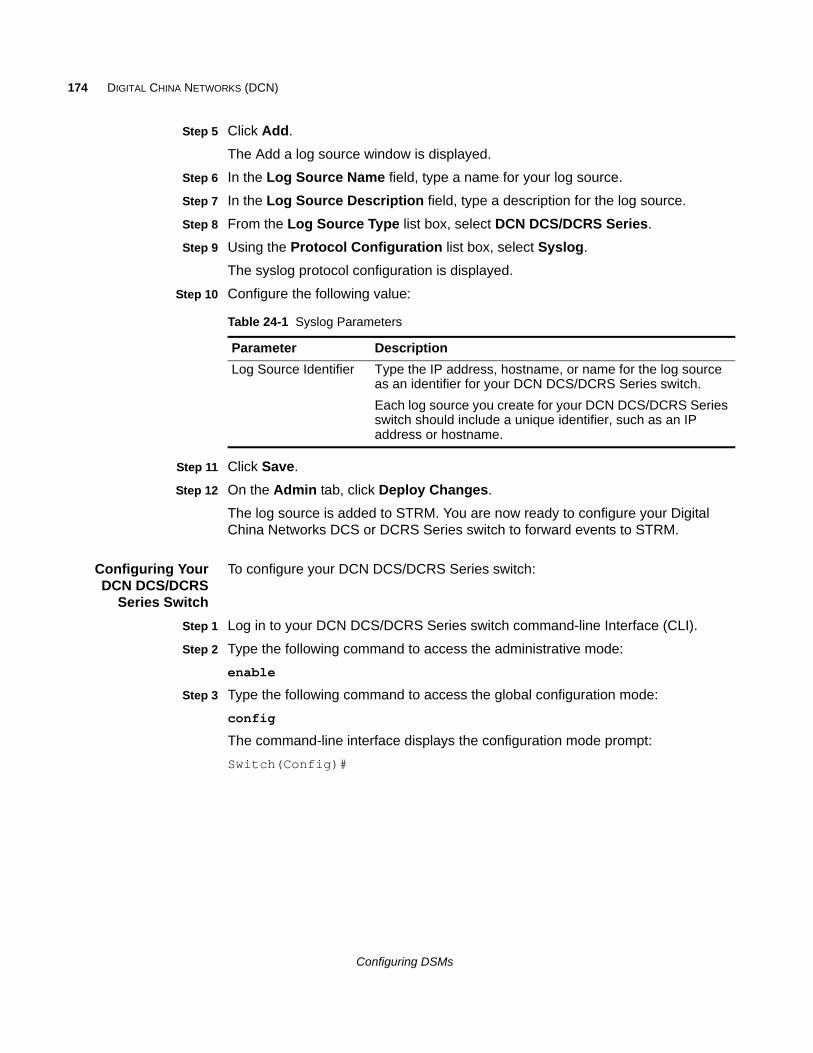
174 DIGITAL CHINA NETWORKS (DCN)
Step 5 Click Add.
The Add a log source window is displayed.
Step 6 In the Log Source Name field, type a name for your log source.
Step 7 In the Log Source Description field, type a description for the log source.
Step 8 From the Log Source Type list box, select DCN DCS/DCRS Series.
Step 9 Using the Protocol Configuration list box, select Syslog.
The syslog protocol configuration is displayed.
Step 10 Configure the following value:
Step 11 Click Save.
Step 12 On the Admin tab, click Deploy Changes.
The log source is added to STRM. You are now ready to configure your Digital China Networks DCS or DCRS Series switch to forward events to STRM.
Configuring YourDCN DCS/DCRS
Series Switch
To configure your DCN DCS/DCRS Series switch:
Step 1 Log in to your DCN DCS/DCRS Series switch command-line Interface (CLI).
Step 2 Type the following command to access the administrative mode:
enable
Step 3 Type the following command to access the global configuration mode:
config
The command-line interface displays the configuration mode prompt:
Switch(Config)#
Table 24-1 Syslog Parameters
Parameter Description
Log Source Identifier Type the IP address, hostname, or name for the log source as an identifier for your DCN DCS/DCRS Series switch.
Each log source you create for your DCN DCS/DCRS Series switch should include a unique identifier, such as an IP address or hostname.
Configuring DSMs
175
Step 4 Type the following command to configure a log host for your switch:
logging <IP address> facility <local> severity <level>
Where:
<IP address> is the IP address of the STRM Console.
<local> is the syslog facility, for example, local0.
<level> is the severity of the syslog events, for example, informational. If you specify a value of informational, you forward all information level events and above, such as, notifications, warnings, errors, critical, alerts, and emergencies.
For example,
logging 10.10.10.1 facility local0 severity informational
Step 5 Type the following command to save your configuration changes:
write
The configuration is complete. You can verify events forwarded to STRM by viewing events in the Log Activity tab.
Configuring DSMs

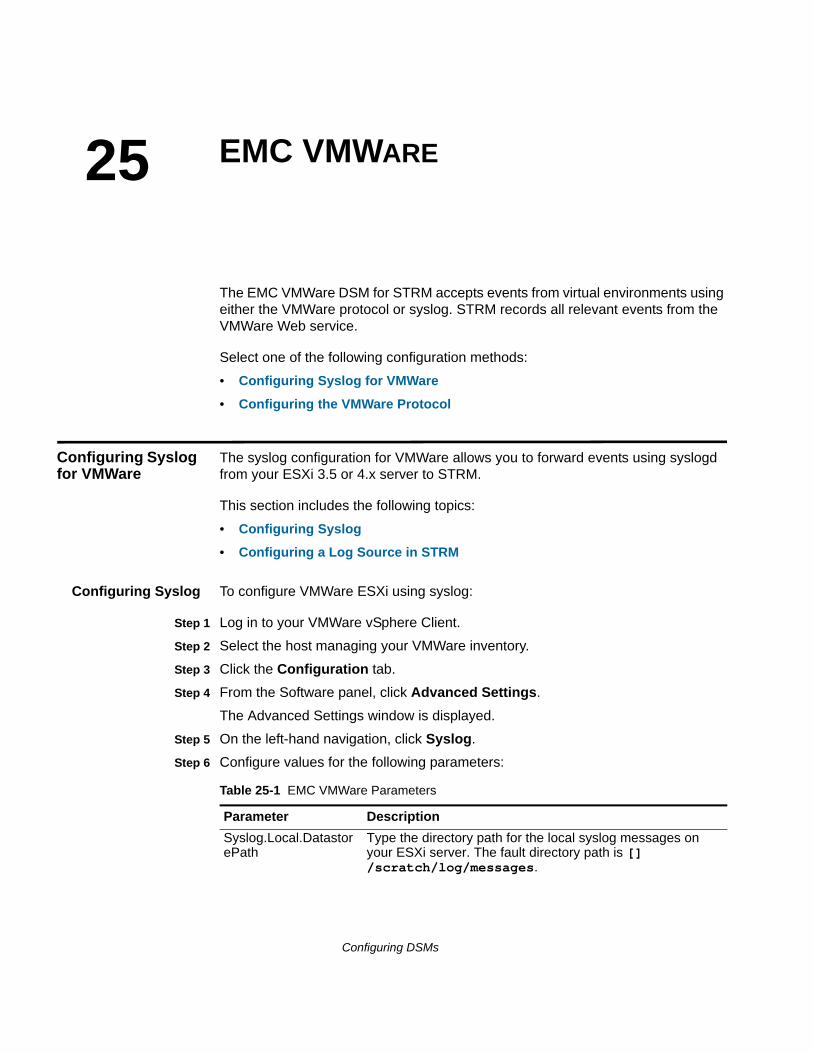
25
EMC VMWAREThe EMC VMWare DSM for STRM accepts events from virtual environments using either the VMWare protocol or syslog. STRM records all relevant events from the VMWare Web service.
Select one of the following configuration methods:
• Configuring Syslog for VMWare
• Configuring the VMWare Protocol
Configuring Syslog for VMWare
The syslog configuration for VMWare allows you to forward events using syslogd from your ESXi 3.5 or 4.x server to STRM.
This section includes the following topics:
• Configuring Syslog
• Configuring a Log Source in STRM
Configuring Syslog To configure VMWare ESXi using syslog:
Step 1 Log in to your VMWare vSphere Client.
Step 2 Select the host managing your VMWare inventory.
Step 3 Click the Configuration tab.
Step 4 From the Software panel, click Advanced Settings.
The Advanced Settings window is displayed.
Step 5 On the left-hand navigation, click Syslog.
Step 6 Configure values for the following parameters:
Table 25-1 EMC VMWare Parameters
Parameter Description
Syslog.Local.DatastorePath
Type the directory path for the local syslog messages on your ESXi server. The fault directory path is [] /scratch/log/messages.
Configuring DSMs
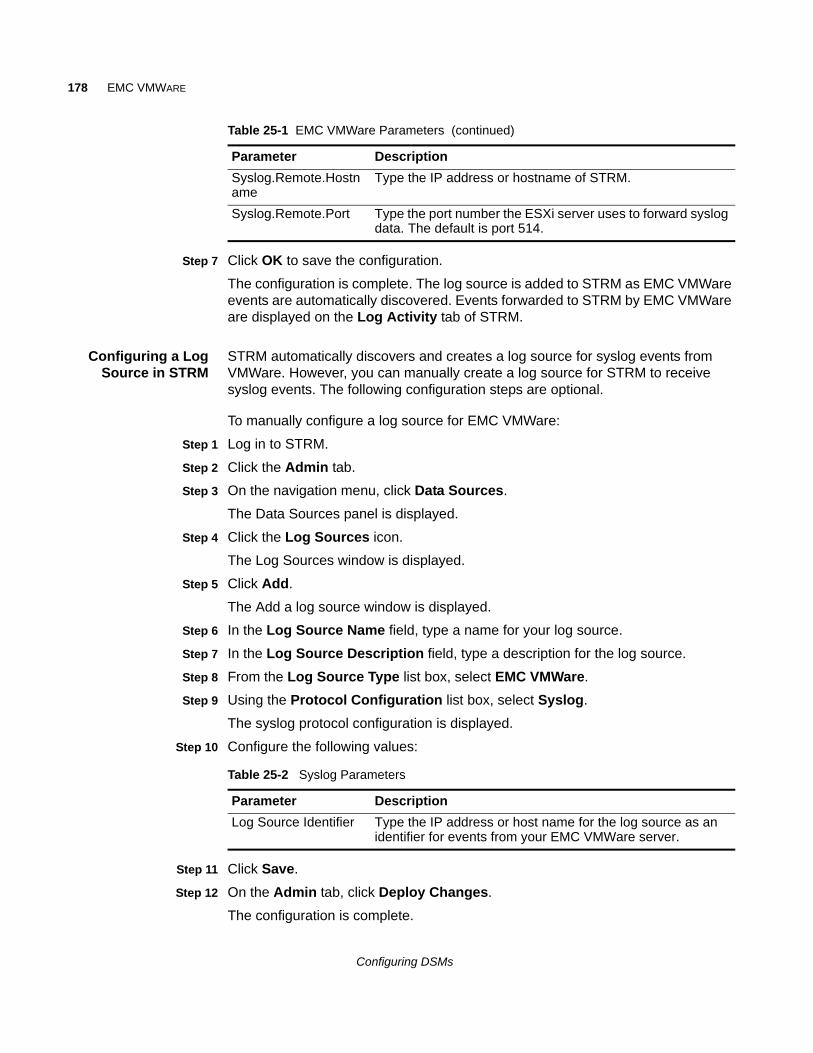
178 EMC VMWARE
Step 7 Click OK to save the configuration.
The configuration is complete. The log source is added to STRM as EMC VMWare events are automatically discovered. Events forwarded to STRM by EMC VMWare are displayed on the Log Activity tab of STRM.
Configuring a LogSource in STRM
STRM automatically discovers and creates a log source for syslog events from VMWare. However, you can manually create a log source for STRM to receive syslog events. The following configuration steps are optional.
To manually configure a log source for EMC VMWare:
Step 1 Log in to STRM.
Step 2 Click the Admin tab.
Step 3 On the navigation menu, click Data Sources.
The Data Sources panel is displayed.
Step 4 Click the Log Sources icon.
The Log Sources window is displayed.
Step 5 Click Add.
The Add a log source window is displayed.
Step 6 In the Log Source Name field, type a name for your log source.
Step 7 In the Log Source Description field, type a description for the log source.
Step 8 From the Log Source Type list box, select EMC VMWare.
Step 9 Using the Protocol Configuration list box, select Syslog.
The syslog protocol configuration is displayed.
Step 10 Configure the following values:
Step 11 Click Save.
Step 12 On the Admin tab, click Deploy Changes.
The configuration is complete.
Syslog.Remote.Hostname
Type the IP address or hostname of STRM.
Syslog.Remote.Port Type the port number the ESXi server uses to forward syslog data. The default is port 514.
Table 25-1 EMC VMWare Parameters (continued)
Parameter Description
Table 25-2 Syslog Parameters
Parameter Description
Log Source Identifier Type the IP address or host name for the log source as an identifier for events from your EMC VMWare server.
Configuring DSMs
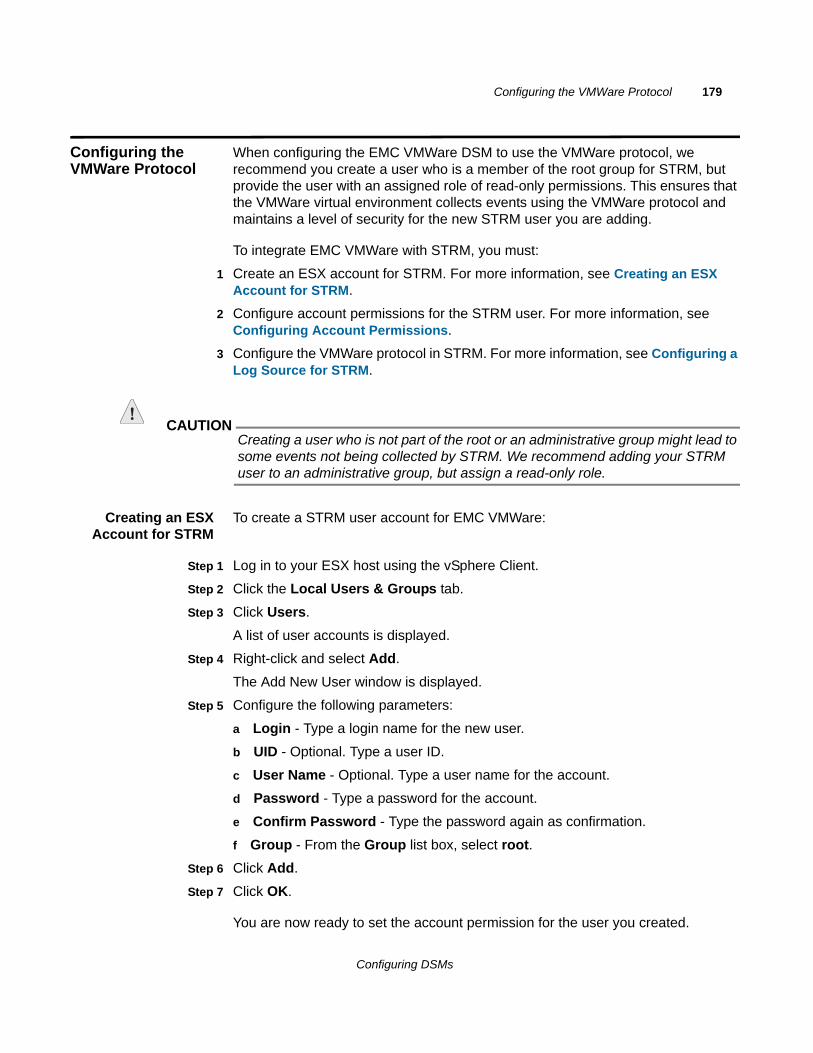
Configuring the VMWare Protocol 179
Configuring the VMWare Protocol
When configuring the EMC VMWare DSM to use the VMWare protocol, we recommend you create a user who is a member of the root group for STRM, but provide the user with an assigned role of read-only permissions. This ensures that the VMWare virtual environment collects events using the VMWare protocol and maintains a level of security for the new STRM user you are adding.
To integrate EMC VMWare with STRM, you must:
1 Create an ESX account for STRM. For more information, see Creating an ESX Account for STRM.
2 Configure account permissions for the STRM user. For more information, see Configuring Account Permissions.
3 Configure the VMWare protocol in STRM. For more information, see Configuring a Log Source for STRM.
CAUTIONCreating a user who is not part of the root or an administrative group might lead to some events not being collected by STRM. We recommend adding your STRM user to an administrative group, but assign a read-only role.
Creating an ESXAccount for STRM
To create a STRM user account for EMC VMWare:
Step 1 Log in to your ESX host using the vSphere Client.
Step 2 Click the Local Users & Groups tab.
Step 3 Click Users.
A list of user accounts is displayed.
Step 4 Right-click and select Add.
The Add New User window is displayed.
Step 5 Configure the following parameters:
a Login - Type a login name for the new user.
b UID - Optional. Type a user ID.
c User Name - Optional. Type a user name for the account.
d Password - Type a password for the account.
e Confirm Password - Type the password again as confirmation.
f Group - From the Group list box, select root.
Step 6 Click Add.
Step 7 Click OK.
You are now ready to set the account permission for the user you created.
Configuring DSMs
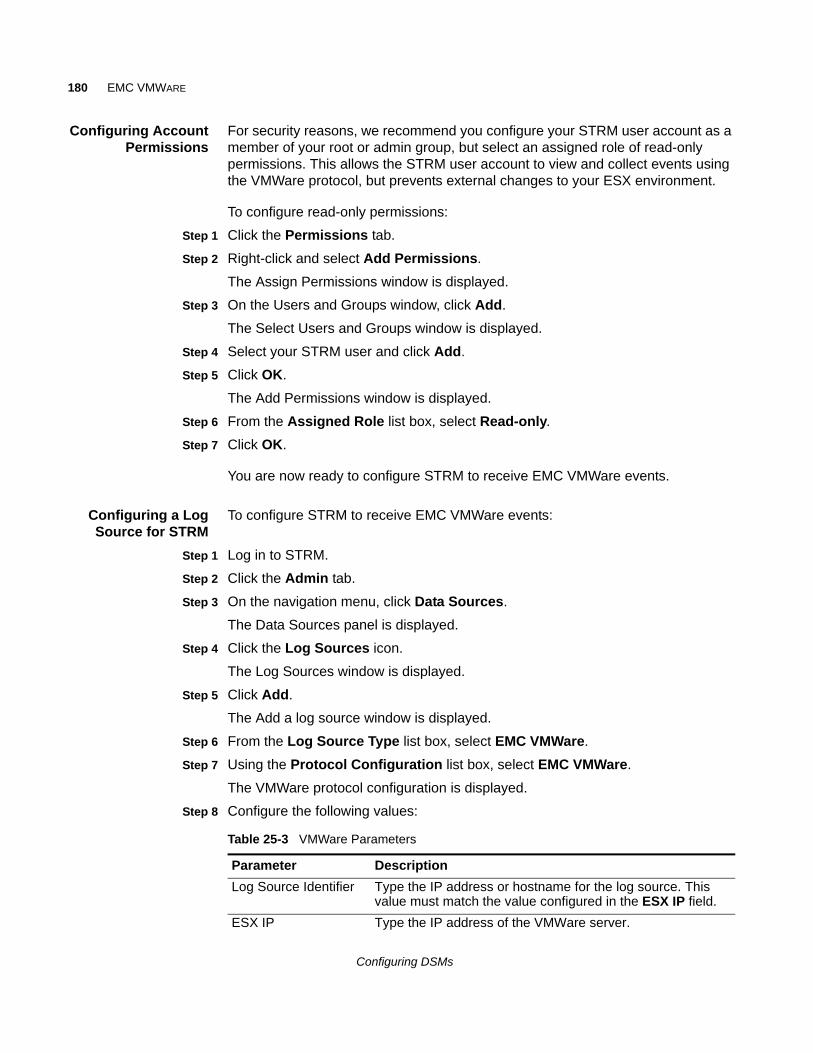
180 EMC VMWARE
Configuring AccountPermissions
For security reasons, we recommend you configure your STRM user account as a member of your root or admin group, but select an assigned role of read-only permissions. This allows the STRM user account to view and collect events using the VMWare protocol, but prevents external changes to your ESX environment.
To configure read-only permissions:
Step 1 Click the Permissions tab.
Step 2 Right-click and select Add Permissions.
The Assign Permissions window is displayed.
Step 3 On the Users and Groups window, click Add.
The Select Users and Groups window is displayed.
Step 4 Select your STRM user and click Add.
Step 5 Click OK.
The Add Permissions window is displayed.
Step 6 From the Assigned Role list box, select Read-only.
Step 7 Click OK.
You are now ready to configure STRM to receive EMC VMWare events.
Configuring a LogSource for STRM
To configure STRM to receive EMC VMWare events:
Step 1 Log in to STRM.
Step 2 Click the Admin tab.
Step 3 On the navigation menu, click Data Sources.
The Data Sources panel is displayed.
Step 4 Click the Log Sources icon.
The Log Sources window is displayed.
Step 5 Click Add.
The Add a log source window is displayed.
Step 6 From the Log Source Type list box, select EMC VMWare.
Step 7 Using the Protocol Configuration list box, select EMC VMWare.
The VMWare protocol configuration is displayed.
Step 8 Configure the following values:
Table 25-3 VMWare Parameters
Parameter Description
Log Source Identifier Type the IP address or hostname for the log source. This value must match the value configured in the ESX IP field.
ESX IP Type the IP address of the VMWare server.
Configuring DSMs
Configuring the VMWare Protocol 181
Step 9 Click Save.
Step 10 On the Admin tab, click Deploy Changes.
For more information about your VMWare ESX server, see your vendor documentation.
User Name Type the username required to access the VMWare server.
Password Type the password required to access the VMWare server.
Table 25-3 VMWare Parameters (continued)
Parameter Description
Configuring DSMs

26
ENTERASYSThis section provides information on the following DSMs:
• Enterasys Dragon
• Enterasys HiGuard Wireless IPS
• Enterasys HiPath Wireless Controller
• Enterasys Stackable and Standalone Switches
• Enterasys XSR Security Router
• Enterasys Matrix Router
• Enterasys NetSight Automatic Security Manager
• Enterasys Matrix K/N/S Series Switch
• Enterasys NAC
• Enterasys 800-Series Switch
Enterasys Dragon The Enterasys Dragon DSM for STRM accepts Enterasys events using either syslog or SNMPv3. STRM records all relevant Enterasys Dragon events. Before you configure STRM to integrate with Enterasys Dragon, you must create an Alarm Tool policy using either an SNMPv3 or Syslog notification rule.
To configure your STRM Enterasys Dragon DSM, you must:
1 Choose one of the following:
a Create an Alarm Tool policy using an SNMPv3 notification rule. See Creating an Alarm Tool Policy Using an SNMPv3 Notification Rule.
Configuring DSMs
184 ENTERASYS
b Create an Alarm Tool policy using a Syslog notification rule. See Creating a Policy with a Syslog Notification Rule.
2 Configure the log source within STRM. See Configuring a Log Source in STRM.
3 Configure Dragon Enterprise Management Server (EMS) to forward syslog messages. See Configuring the EMS to Forward Syslog Messages to STRM
Creating an AlarmTool Policy Using anSNMPv3 Notification
Rule
This procedure describes how to configure an Alarm Tool policy using an SNMPv3 notification rule. Use SNMPv3 notification rules if you need to transfer PDATA binary data elements.
To configure Enterasys Dragon with an Alarm Tool policy using an SNMPv3 notification rule:
Step 1 Log in to the Enterasys Dragon EMS.
Step 2 Click the Alarm Tool icon.
Step 3 Configure the Alarm Tool Policy:
a In the Alarm Tool Policy View > Custom Policies menu tree, right-click and select Add Alarm Tool Policy.
The Add Alarm Tool Policy window is displayed.
b In the Add Alarm Tool Policy field, type a policy name.
For example:
STRM
c Click OK.
d In the menu tree, select the policy name you entered from Stepb.
Step 4 To configure the event group:
a Click the Events Group tab.
b Click New.
The Event Group Editor is displayed.
c Select the event group or individual events to monitor.
d Click Add.
A prompt is displayed.
e Click Yes.
f In the right column of the Event Group Editor, type Dragon-Events.
g Click OK.
Step 5 Configure the SNMPv3 notification rules:
a Click the Notification Rules tab.
b Click New.
c In the name field, type STRM-Rule.
Configuring DSMs
Enterasys Dragon 185
d Click OK.
e In the Notification Rules panel, select STRM-Rule.
f Click the SNMP V3 tab.
g Click New.
h Update SNMP V3 values, as required:
- Server IP Address - Type the STRM IP address.
NOTEDo not change the OID.
- Inform - Select the Inform check box.
- Security Name - Type the SNMPv3 username.
- Auth Password - Type the appropriate password.
- Priv Password - Type the appropriate password.
- Message - Type the following on one line:
Dragon Event: %DATE%,,%TIME%,,%NAME%,,%SENSOR%,,%PROTO%,,%SIP%,,%DIP%,,%SPORT%,,%DPORT%,, %DIR%,,%DATA%,,<<<%PDATA%>>>
NOTEVerify that the security passwords and protocols match data configured in the SNMP configuration.
i Click OK.
Step 6 Verify that the notification events are logged as separate events:
a Click the Global Options tab.
b Click the Main tab.
c Make sure that Concatenate Events is not selected.
Step 7 Configure the SNMP options:
a Click the Global Options tab.
b Click the SNMP tab
c Type the IP address of the EMS server sending SNMP traps.
Step 8 Configure the alarm information:
a Click the Alarms tab.
b Click New.
c Type values for the following parameters:
- Name - Type STRM-Alarm.
- Type - Select Real Time.
- Event Group - Select Dragon-Events.
Configuring DSMs
186 ENTERASYS
- Notification Rule - Select the STRM-Rule check box.
d Click OK.
e Click Commit.
Step 9 Navigate to the Enterprise View.
Step 10 Right-click on the Alarm Tool and select Associate Alarm Tool Policy.
Step 11 Select the STRM policy. Click OK.
Step 12 From the Enterprise menu, right-click and select Deploy.
You are now ready to configure the log source SNMP protocol in STRM.
Creating a Policywith a Syslog
Notification Rule
This procedure describes how to configure an Alarm Tool policy using a Syslog notification rule in the Log Event Extended Format (LEEF) message format. LEEF is the preferred message format for sending notifications to Dragon Network Defense when the notification rate is very high or when IPv6 addresses are displayed.
If you prefer not to use syslog notifications in LEEF format, refer to your Enterasys Dragon documentation for more information.
NOTEUse SNMPv3 notification rules if you need to transfer PDATA, which is a binary data element. Do not use a Syslog notification rule.
To configure Enterasys Dragon with an Alarm Tool policy using a syslog notification rule:
Step 1 Log in to the Enterasys Dragon EMS.
Step 2 Click the Alarm Tool icon.
Step 3 Configure the Alarm Tool Policy:
a In the Alarm Tool Policy View > Custom Policies menu tree, right-click and select Add Alarm Tool Policy.
The Add Alarm Tool Policy window is displayed.
b In the Add Alarm Tool Policy field, type a policy name.
For example:
STRM
c Click OK.
d In the menu tree, select STRM.
Step 4 To configure the event group:
a Click the Events Group tab.
b Click New.
The Event Group Editor is displayed.
Configuring DSMs
Enterasys Dragon 187
c Select the event group or individual events to monitor.
d Click Add.
A prompt is displayed.
e Click Yes.
f In the right column of the Event Group Editor, type Dragon-Events.
g Click OK.
Step 5 Configure the Syslog notification rule:
a Click the Notification Rules tab.
b Click New.
c In the name field, type STRM-RuleSys.
d Click OK.
e In the Notification Rules panel, select the newly created STRM-RuleSys item.
f Click the Syslog tab.
g Click New.
The Syslog Editor is displayed.
h Update the following values:
- Facility - Using the Facility list box, select a facility.
- Level - Using the Level list box, select notice.
- Message - Using the Type list box, select LEEF.
LEEF:Version=1.0|Vendor|Product|ProductVersion|eventID|devTime|proto|src|sensor|dst|srcPort|dstPort|direction|eventData|
NOTEThe LEEF message format delineates between fields using a pipe delimiter between each keyword.
i Click OK.
Step 6 Verify that the notification events are logged as separate events:
a Click the Global Options tab.
b Click the Main tab.
c Make sure that Concatenate Events is not selected.
Step 7 Configure the alarm information:
a Click the Alarms tab.
b Click New.
c Type values for the parameters:
- Name - Type STRM-Alarm.
- Type - Select Real Time.
Configuring DSMs
188 ENTERASYS
- Event Group - Select Dragon-Events.
- Notification Rule - Select the STRM-RuleSys check box.
d Click OK.
e Click Commit.
Step 8 Navigate to the Enterprise View.
Step 9 Right-click on the Alarm Tool and select Associate Alarm Tool Policy.
Step 10 Select the newly created STRM policy. Click OK.
Step 11 In the Enterprise menu, right-click the policy and select Deploy.
You are now ready to configure a syslog log source in STRM.
Configuring a LogSource in STRM
You are now ready to configure the log source in STRM:
Step 1 Log in to STRM.
Step 2 Click the Admin tab.
Step 3 On the navigation menu, click Data Sources.
The Data Sources panel is displayed.
Step 4 Click the Log Sources icon.
The Log Sources window is displayed.
Step 5 Click Add.
The Add a log source window is displayed.
Step 6 In the Log Source Name field, type a name for your log source.
Step 7 In the Log Source Description field, type a description for the log source.
Step 8 From the Log Source Type list box, select Enterasys Dragon Network IPS.
Step 9 From the Protocol Configuration list box, select either the SNMPv3 or Syslog option. For more information on configuring a specific protocol, see the STRM Log Sources Users Guide.
For more information about Enterasys Dragon device, see your Enterasys Dragon documentation.
NOTEUsing the event mapping tool in the Log Activity tab, you can map a normalized or raw event to a high-level and low-level category (or QID). However, you cannot map combination Dragon messages using the event mapping tool. For more information, see the STRM Users Guide.
Configuring DSMs
Enterasys Dragon 189
Configuring the EMSto Forward Syslog
Messages to STRM
Starting with Dragon Enterprise Management Server (EMS) v7.4.0 appliances, you must use syslog-ng for forwarding events to a Security and Information Manager such as STRM. Syslogd has been replaced by syslog-ng in Dragon EMS v7.4.0 and above.
To configure EMS to forward syslog messages, you must choose one of the following:
• If you are using syslog-ng and Enterasys Dragon EMS v7.4.0 and above, see Configuring syslog-ng Using Enterasys Dragon EMS v7.4.0 and above.
• If you are using syslogd and Enterasys Dragon EMS v7.4.0 and below, see Configuring syslogd Using Enterasys Dragon EMS v7.4.0 and below.
Configuring syslog-ng Using Enterasys Dragon EMS v7.4.0 and above
This section describes the steps to configure syslog-ng in non-encrypted mode and syslogd to forward syslog messages to STRM. If you are using encrypted syslog-ng, refer to your Enterasys documentation.
CAUTIONDo not run both syslog-ng and syslogd at the same time.
To configure syslog-ng in non-encrypted mode:
Step 1 On your EMS system, open the following file:
/opt/syslog-ng/etc/syslog-ng.conf
Step 2 Configure a Facility filter for the Syslog notification rule.
For example, if you selected facility local1:
filter filt_facility_local1 {facility(local1); };
Step 3 Configure a Level filter for the Syslog notification rule.
For example, if you selected level notice:
filter filt_level_notice {level(notice); };
Step 4 Configure a destination statement for the STRM.
For example, if the IP address of the STRM is 10.10.1.1 and you want to use syslog port of 514, type:
destination siem { tcp("10.10.1.1" port(514)); };
Step 5 Add a log statement for the notification rule:
log {source(s_local);filter (filt_facility_local1); filter (filt_level_notice);destination(siem);};
Configuring DSMs
190 ENTERASYS
Step 6 Save the file and restart syslog-ng.
cd /etc/rc.d./rc.syslog-ng stop./rc.syslog-ng start
Step 7 The Enterasys Dragon EMS configuration is complete.
Configuring syslogd Using Enterasys Dragon EMS v7.4.0 and below
If your Dragon Enterprise Management Server (EMS) is using a version earlier than v7.4.0 on the appliance, you must use syslogd for forwarding events to a Security and Information Manager such as STRM.
To configure syslogd, you must:
Step 1 On the Dragon EMS system, open the following file:
/etc/syslog.conf
Step 2 Add a line to forward the facility and level you configured in the syslog notification rule to STRM.
For example, to define the local1 facility and notice level:
local1.notice @<IP address>
Where:
<IP address> is the IP address of the STRM system.
Step 3 Save the file and restart syslogd.
cd /etc/rc.d./rc.syslog stop./rc.syslog start
Step 4 The Enterasys Dragon EMS configuration is complete.
Enterasys HiGuard Wireless IPS
The Enterasys HiGuard Wireless IPS DSM for STRM accepts events using syslog. STRM records all relevant events. Before configuring the Enterasys HiGuard Wireless IPS device in STRM, you must configure your device to forward syslog events.
This section includes the following topics:
• Configuring Enterasys HiGuard
• Configuring a Log Source in STRM
ConfiguringEnterasys HiGuard
To configure the device to forward syslog events:
Step 1 Log in to the HiGuard Wireless IPS user interface.
Configuring DSMs
Enterasys HiGuard Wireless IPS 191
Step 2 In the left navigation pane, click Syslog, which allows the management server to send events to designated syslog receivers.
The Syslog Configuration panel is displayed.
Step 3 In the System Integration Status section, enable syslog integration.
This allows the management server to send messages to the configured syslog servers. By default, the management server enables syslog.
The Current Status field displays the status of the syslog server. The options are: Running or Stopped. An error status is displayed if one of the following occurs:
• One of the configured and enabled syslog servers includes a hostname that cannot be resolved.
• The management server is stopped.
• An internal error has occurred. If this occurs, please contact Enterasys Technical Support.
Step 4 From Manage Syslog Servers, click Add.
The Syslog Configuration window is displayed.
Step 5 Type values for the following parameters:
• Syslog Server (IP Address/Hostname) - Type the IP address or hostname of the syslog server to which events should be sent.
NOTEConfigured syslog servers use the DNS names and DNS suffixes configured in the Server initialization and Setup Wizard on the HWMH Config Shell.
• Port Number - Type the port number of the syslog server to which HWMH sends events. The default is 514.
• Message Format - Select Plain Text as the format for sending events.
• Enabled? - Select if the events are to be sent to this syslog server.
Step 6 Save your configuration.
The configuration is complete. The log source is added to STRM as HiGuard events are automatically discovered. Events forwarded to STRM by Enterasys HiGuard are displayed on the Log Activity tab of STRM.
Configuring a LogSource in STRM
STRM automatically discovers and creates a log source for syslog events from Enterasys HiGuard. However, you can manually create a log source for STRM to receive syslog events. The following configuration steps are optional.
To manually configure a log source for OSSEC:
Step 1 Log in to STRM.
Step 2 Click the Admin tab.
Configuring DSMs
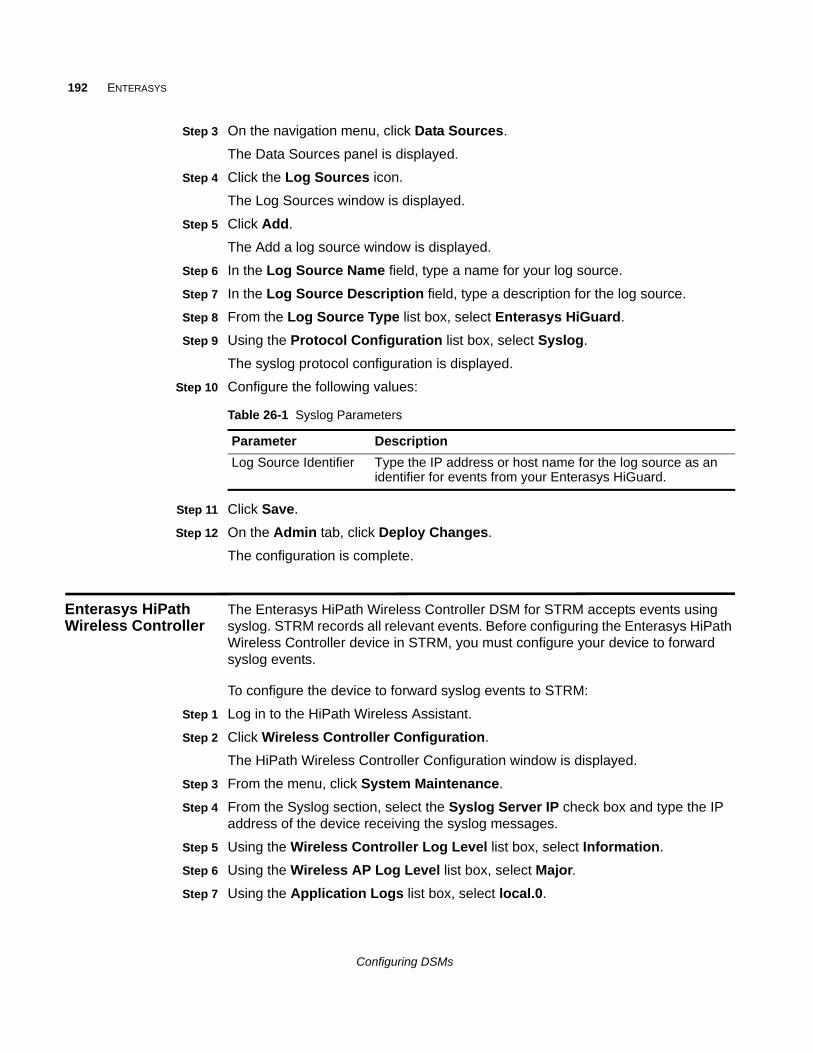
192 ENTERASYS
Step 3 On the navigation menu, click Data Sources.
The Data Sources panel is displayed.
Step 4 Click the Log Sources icon.
The Log Sources window is displayed.
Step 5 Click Add.
The Add a log source window is displayed.
Step 6 In the Log Source Name field, type a name for your log source.
Step 7 In the Log Source Description field, type a description for the log source.
Step 8 From the Log Source Type list box, select Enterasys HiGuard.
Step 9 Using the Protocol Configuration list box, select Syslog.
The syslog protocol configuration is displayed.
Step 10 Configure the following values:
Step 11 Click Save.
Step 12 On the Admin tab, click Deploy Changes.
The configuration is complete.
Enterasys HiPath Wireless Controller
The Enterasys HiPath Wireless Controller DSM for STRM accepts events using syslog. STRM records all relevant events. Before configuring the Enterasys HiPath Wireless Controller device in STRM, you must configure your device to forward syslog events.
To configure the device to forward syslog events to STRM:
Step 1 Log in to the HiPath Wireless Assistant.
Step 2 Click Wireless Controller Configuration.
The HiPath Wireless Controller Configuration window is displayed.
Step 3 From the menu, click System Maintenance.
Step 4 From the Syslog section, select the Syslog Server IP check box and type the IP address of the device receiving the syslog messages.
Step 5 Using the Wireless Controller Log Level list box, select Information.
Step 6 Using the Wireless AP Log Level list box, select Major.
Step 7 Using the Application Logs list box, select local.0.
Table 26-1 Syslog Parameters
Parameter Description
Log Source Identifier Type the IP address or host name for the log source as an identifier for events from your Enterasys HiGuard.
Configuring DSMs
Enterasys Stackable and Standalone Switches 193
Step 8 Using the Service Logs list box, select local.3.
Step 9 Using the Audit Logs list box, select local.6.
Step 10 Click Apply.
Step 11 You are now ready to configure the log source in STRM.
To configure STRM to receive events from the Enterasys HiPath Wireless Controller device:
From the Log Source Type list box, select the Enterasys HiPath option.
For more information on configuring log sources, see the STRM Log Sources Users Guide.
For more information about your Enterasys HiPath Wireless Controller device, see your vendor documentation.
Enterasys Stackable and Standalone Switches
The Enterasys Stackable and Standalone Switches DSM for STRM accepts events using syslog. STRM records all relevant events. Before configuring an Enterasys Stackable and Standalone Switches device in STRM, you must configure your device to forward syslog events.
To configure the device to forward syslog events to STRM:
Step 1 Log in to the Enterasys Stackable and Standalone Switch device.
Step 2 Type the following command:
set logging server <index> [ip-addr <IP address>] [facility <facility>] [severity <severity>] [descr <description>] [port <port>] [state <enable | disable>]
Where:
<index> is the server table index number (1 to 8) for this server.
<ip address> is the IP address of the server you wish to send syslog messages. This is an optional field. If you do not define an IP address, an entry in the Syslog server table is created with the specified index number and a message is displayed indicating that no IP address has been assigned.
<facility> is a syslog facility. Valid values are local0 to local7. This is an optional field. If not specified, the default value configured with the set logging default command is applied.
<severity> is the server severity level that the server will log messages. The valid range is 1 to 8. If not specified, the default value configured with the set logging default command is applied. This is an optional field. Valid values include:
- 1: Emergencies (system is unusable)
- 2: Alerts (immediate action required)
Configuring DSMs
194 ENTERASYS
- 3: Critical conditions
- 4: Error conditions
- 5: Warning conditions
- 6: Notifications (significant conditions)
- 7: Informational messages
- 8: Debugging messages
<description> is a description of the facility/server. This is an optional field.
<port> is the default UDP port that the client uses to send messages to the server. If not specified, the default value configured with the set logging default command is applied. This is an optional field.
<enable | disable> enables or disables this facility/server configuration. This is an optional field. If state is not specified, the server will not be enabled or disabled.
Step 3 You are now ready to configure the log source in STRM.
To configure STRM to receive events from an Enterasys Stackable and Standalone Switch device:
From the Log Source Type list box, select one of the following options: Enterasys Stackable and Standalone Switches, Enterasys A-Series, Enterasys B2-Series, Enterasys B3-Series, Enterasys C2-Series, Enterasys C3-Series, Enterasys D-Series, Enterasys G-Series, or Enterasys I-Series.
For more information on configuring log sources, see the STRM Log Source Users Guide.
For more information about your Enterasys Stackable and Standalone Switches, see your vendor documentation.
Enterasys XSR Security Router
The Enterasys XSR Security Router DSM for STRM accepts events using syslog. STRM records all relevant events. Before configuring an Enterasys XSR Security Router in STRM, you must configure your device to forward syslog events.
To configure the device to send syslog events to STRM:
Step 1 Using Telnet or SSH, log in to the XSR Security Router command-line interface.
Step 2 Type the following command to access config mode:
enable
config
Step 3 Type the following command:
logging <IP address> low
Where <IP address> is the IP address of your STRM.
Configuring DSMs
Enterasys Matrix Router 195
Step 4 Exit from config mode.
Step 5 Save the configuration:
exit
copy running-config startup-config
Step 6 You are now ready to configure the log sources in STRM.
To configure STRM to receive events from an Enterasys XSR Security Router:
From the Log Source Type list box, select Enterasys XSR Security Routers.
For more information on configuring log sources, see the STRM Log Sources Users Guide.
For more information about your Enterasys XSR Security Router, see your vendor documentation.
Enterasys Matrix Router
The Enterasys Matrix Router DSM for STRM accepts Enterasys Matrix events using SNMPv1, SNMPv2, SNMPv3, and syslog. You can integrate Enterasys Matrix Router version 3.5 with STRM. STRM records all SNMP events and syslog login, logout, and login failed events. Before you configure STRM to integrate with Enterasys Matrix, you must:
Step 1 Log in to the switch/router as a privileged user.
Step 2 Type the following command:
set logging server <server number> description <description> facility <facility> ip_addr <ip address> port <port> severity <severity>
Where:
<server number> is the server number 1 to 8.
<description> is a description of the server.
<facility> is a syslog facility, for example, local0.
<ip address> is the IP address of the server you wish to send syslog messages.
<port> is the default UDP port that the client uses to send messages to the server. Use port 514 unless otherwise stated.
<severity> is the server severity level 1 to 9 where 1 indicates an emergency and 8 is debug level.
For example:
set logging server 5 description ourlogserver facility local0 ip_addr 1.2.3.4 port 514 severity 8
Configuring DSMs

196 ENTERASYS
Step 3 You are now ready to configure the log source in STRM.
To configure STRM to receive events from an Enterasys Matrix device:
From the Log Source Type list box, select Enterasys Matrix E1 Switch.
For more information on configuring log sources, see the STRM Log Sources Users Guide.
Enterasys NetSight Automatic Security Manager
The Enterasys NetSight Automatic Security Manager DSM for STRM accepts events using syslog. STRM records all relevant events. Before configuring an Enterasys NetSight Automatic Security Manager device in STRM, you must configure your device to forward syslog events.
To configure the device to send syslog events to STRM:
Step 1 Log in to the Automatic Security Manager user interface.
Step 2 Click the Automated Security Manager icon to access the Automated Security Manager Configuration window.
NOTEYou can also access the Automated Security Manager Configuration window
from the Tool menu.
Step 3 From the left navigation menu, select Rule Definitions.
Step 4 Choose one of the following options:
a If a rule is currently configured, highlight the rule. Click Edit.
b To create a new rule, click Create.
Step 5 Select the Notifications check box.
Step 6 Click Edit.
The Edit Notifications window is displayed.
Step 7 Click Create.
The Create Notification window is displayed.
Step 8 Using the Type list box, select Syslog.
Step 9 In the Syslog Server IP/Name field, type the IP address of the device that will receive syslog traffic.
Step 10 Click Apply.
Step 11 Click Close.
Step 12 In the Notification list box, select the notification configured above.
Step 13 Click OK.
Configuring DSMs
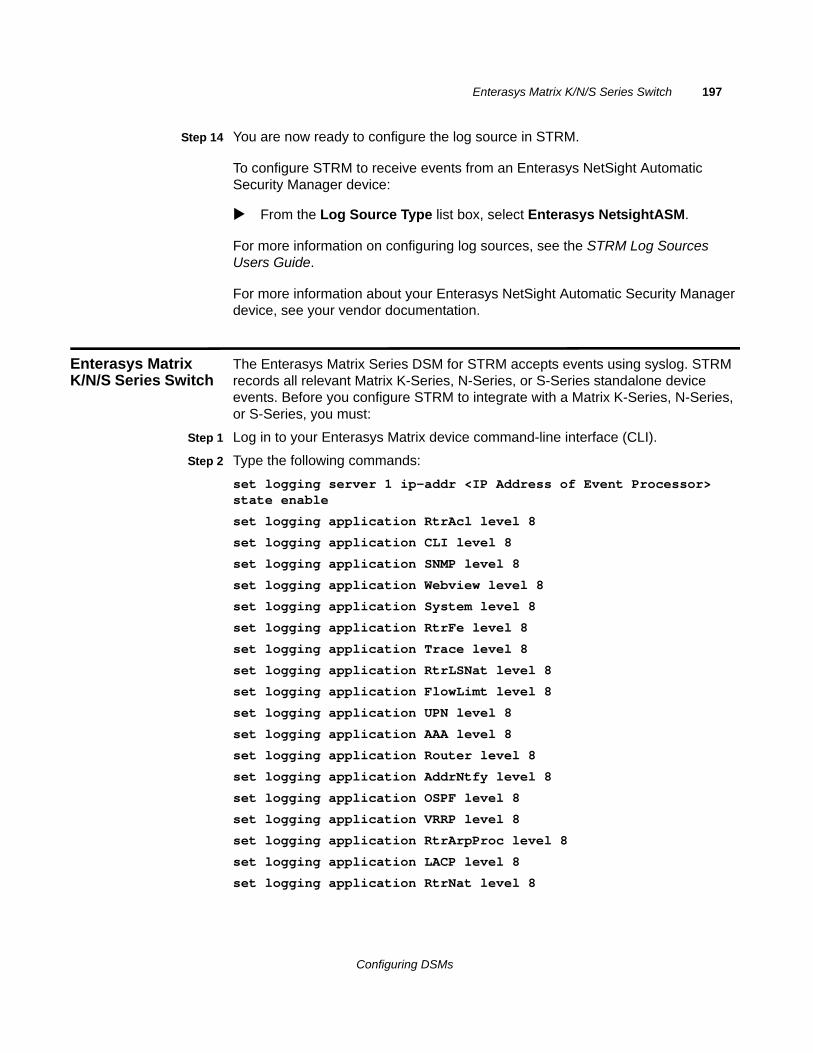
Enterasys Matrix K/N/S Series Switch 197
Step 14 You are now ready to configure the log source in STRM.
To configure STRM to receive events from an Enterasys NetSight Automatic Security Manager device:
From the Log Source Type list box, select Enterasys NetsightASM.
For more information on configuring log sources, see the STRM Log Sources Users Guide.
For more information about your Enterasys NetSight Automatic Security Manager device, see your vendor documentation.
Enterasys Matrix K/N/S Series Switch
The Enterasys Matrix Series DSM for STRM accepts events using syslog. STRM records all relevant Matrix K-Series, N-Series, or S-Series standalone device events. Before you configure STRM to integrate with a Matrix K-Series, N-Series, or S-Series, you must:
Step 1 Log in to your Enterasys Matrix device command-line interface (CLI).
Step 2 Type the following commands:
set logging server 1 ip-addr <IP Address of Event Processor> state enable
set logging application RtrAcl level 8
set logging application CLI level 8
set logging application SNMP level 8
set logging application Webview level 8
set logging application System level 8
set logging application RtrFe level 8
set logging application Trace level 8
set logging application RtrLSNat level 8
set logging application FlowLimt level 8
set logging application UPN level 8
set logging application AAA level 8
set logging application Router level 8
set logging application AddrNtfy level 8
set logging application OSPF level 8
set logging application VRRP level 8
set logging application RtrArpProc level 8
set logging application LACP level 8
set logging application RtrNat level 8
Configuring DSMs
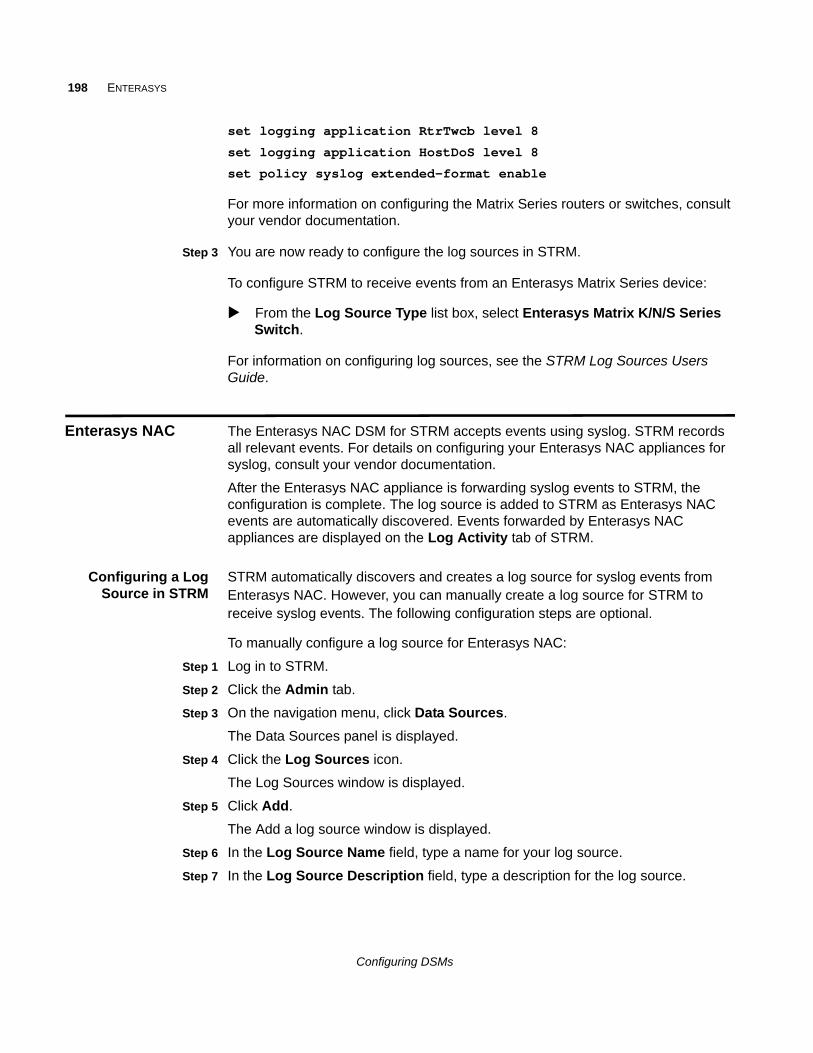
198 ENTERASYS
set logging application RtrTwcb level 8
set logging application HostDoS level 8
set policy syslog extended-format enable
For more information on configuring the Matrix Series routers or switches, consult your vendor documentation.
Step 3 You are now ready to configure the log sources in STRM.
To configure STRM to receive events from an Enterasys Matrix Series device:
From the Log Source Type list box, select Enterasys Matrix K/N/S Series Switch.
For information on configuring log sources, see the STRM Log Sources Users Guide.
Enterasys NAC The Enterasys NAC DSM for STRM accepts events using syslog. STRM records all relevant events. For details on configuring your Enterasys NAC appliances for syslog, consult your vendor documentation.
After the Enterasys NAC appliance is forwarding syslog events to STRM, the configuration is complete. The log source is added to STRM as Enterasys NAC events are automatically discovered. Events forwarded by Enterasys NAC appliances are displayed on the Log Activity tab of STRM.
Configuring a LogSource in STRM
STRM automatically discovers and creates a log source for syslog events from Enterasys NAC. However, you can manually create a log source for STRM to receive syslog events. The following configuration steps are optional.
To manually configure a log source for Enterasys NAC:
Step 1 Log in to STRM.
Step 2 Click the Admin tab.
Step 3 On the navigation menu, click Data Sources.
The Data Sources panel is displayed.
Step 4 Click the Log Sources icon.
The Log Sources window is displayed.
Step 5 Click Add.
The Add a log source window is displayed.
Step 6 In the Log Source Name field, type a name for your log source.
Step 7 In the Log Source Description field, type a description for the log source.
Configuring DSMs
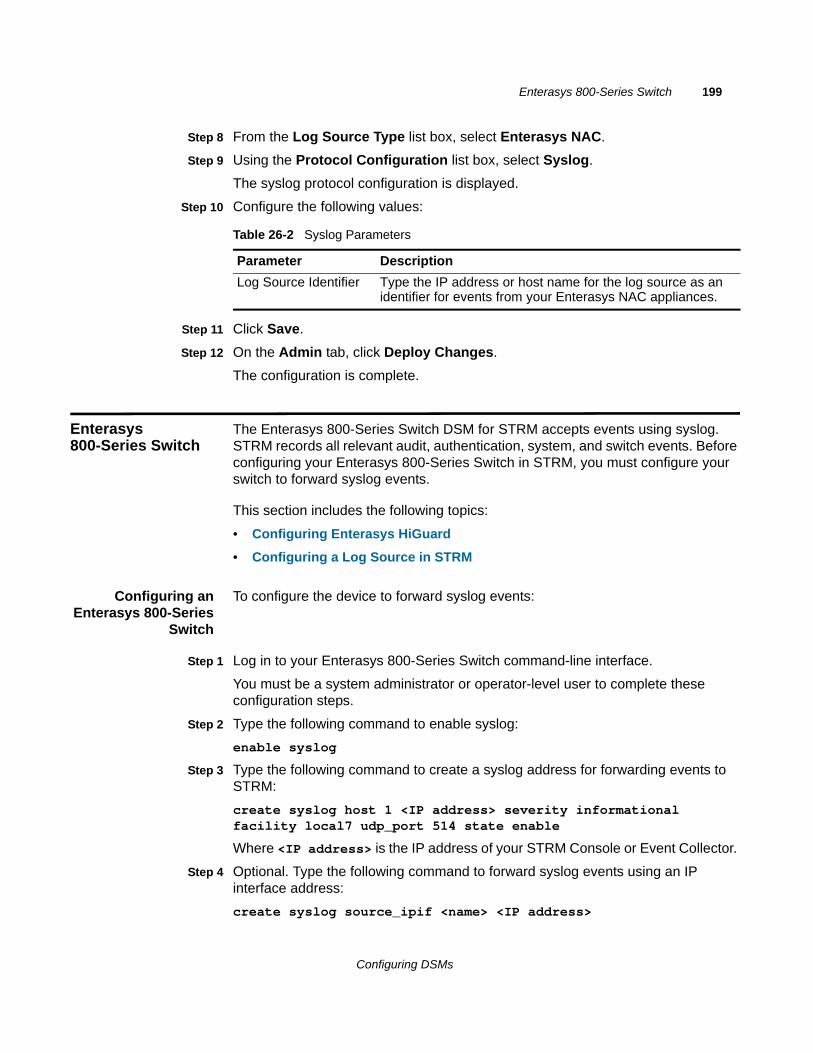
Enterasys 800-Series Switch 199
Step 8 From the Log Source Type list box, select Enterasys NAC.
Step 9 Using the Protocol Configuration list box, select Syslog.
The syslog protocol configuration is displayed.
Step 10 Configure the following values:
Step 11 Click Save.
Step 12 On the Admin tab, click Deploy Changes.
The configuration is complete.
Enterasys 800-Series Switch
The Enterasys 800-Series Switch DSM for STRM accepts events using syslog. STRM records all relevant audit, authentication, system, and switch events. Before configuring your Enterasys 800-Series Switch in STRM, you must configure your switch to forward syslog events.
This section includes the following topics:
• Configuring Enterasys HiGuard
• Configuring a Log Source in STRM
Configuring anEnterasys 800-Series
Switch
To configure the device to forward syslog events:
Step 1 Log in to your Enterasys 800-Series Switch command-line interface.
You must be a system administrator or operator-level user to complete these configuration steps.
Step 2 Type the following command to enable syslog:
enable syslog
Step 3 Type the following command to create a syslog address for forwarding events to STRM:
create syslog host 1 <IP address> severity informational facility local7 udp_port 514 state enable
Where <IP address> is the IP address of your STRM Console or Event Collector.
Step 4 Optional. Type the following command to forward syslog events using an IP interface address:
create syslog source_ipif <name> <IP address>
Table 26-2 Syslog Parameters
Parameter Description
Log Source Identifier Type the IP address or host name for the log source as an identifier for events from your Enterasys NAC appliances.
Configuring DSMs
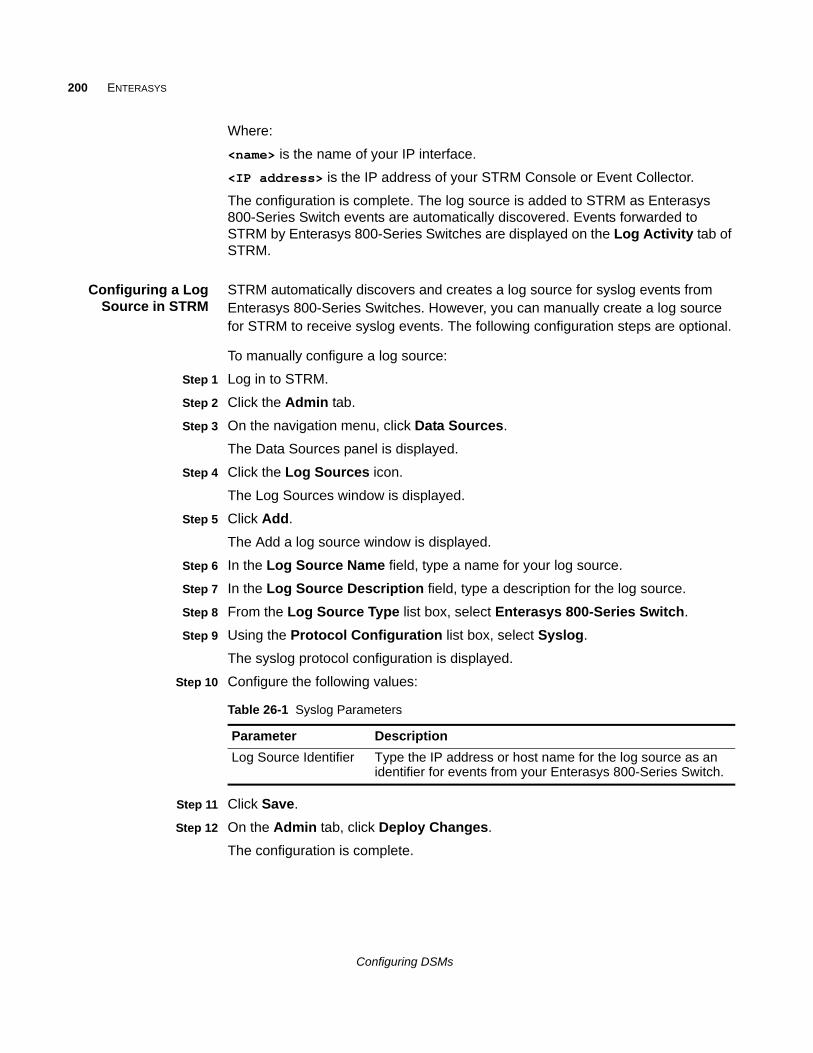
200 ENTERASYS
Where:
<name> is the name of your IP interface.
<IP address> is the IP address of your STRM Console or Event Collector.
The configuration is complete. The log source is added to STRM as Enterasys 800-Series Switch events are automatically discovered. Events forwarded to STRM by Enterasys 800-Series Switches are displayed on the Log Activity tab of STRM.
Configuring a LogSource in STRM
STRM automatically discovers and creates a log source for syslog events from Enterasys 800-Series Switches. However, you can manually create a log source for STRM to receive syslog events. The following configuration steps are optional.
To manually configure a log source:
Step 1 Log in to STRM.
Step 2 Click the Admin tab.
Step 3 On the navigation menu, click Data Sources.
The Data Sources panel is displayed.
Step 4 Click the Log Sources icon.
The Log Sources window is displayed.
Step 5 Click Add.
The Add a log source window is displayed.
Step 6 In the Log Source Name field, type a name for your log source.
Step 7 In the Log Source Description field, type a description for the log source.
Step 8 From the Log Source Type list box, select Enterasys 800-Series Switch.
Step 9 Using the Protocol Configuration list box, select Syslog.
The syslog protocol configuration is displayed.
Step 10 Configure the following values:
Step 11 Click Save.
Step 12 On the Admin tab, click Deploy Changes.
The configuration is complete.
Table 26-1 Syslog Parameters
Parameter Description
Log Source Identifier Type the IP address or host name for the log source as an identifier for events from your Enterasys 800-Series Switch.
Configuring DSMs
27
EXTREME NETWORKS EXTREMEWAREThe Extreme Networks ExtremeWare DSM for STRM accepts Extreme events from using syslog. STRM records all relevant events from Extreme Networks ExtremeWare and Extremeware XOS devices. Before you configure STRM to integrate with an ExtremeWare device, you must configure syslog within your Extreme Ware device. For more information on configuring syslog, see your vendor documentation.
After you have configured your ExtremeWare appliance to forward syslog events, you must configure a log source in STRM. Configuring a Log Source in STRM
Configuring a LogSource in STRM
STRM does not automatically discover or create log sources for syslog events from ExtremeWare appliances. To integrate with STRM, you must manually create a log source to receive the incoming ExtremeWare events forwarded to STRM.
To configure a log source:
Step 1 Log in to STRM.
Step 2 Click the Admin tab.
Step 3 On the navigation menu, click Data Sources.
The Data Sources panel is displayed.
Step 4 Click the Log Sources icon.
The Log Sources window is displayed.
Step 5 Click Add.
The Add a log source window is displayed.
Step 6 In the Log Source Name field, type a name for your log source.
Step 7 In the Log Source Description field, type a description for the log source.
Step 8 From the Log Source Type list box, select Extreme Networks ExtremeWare Operating System (OS).
Step 9 Using the Protocol Configuration list box, select Syslog.
The syslog protocol configuration is displayed.
Configuring DSMs
202 EXTREME NETWORKS EXTREMEWARE
Step 10 Configure the following values:
Step 11 Click Save.
Step 12 On the Admin tab, click Deploy Changes.
The log source is added to STRM. Events forwarded to STRM by Extreme Networks ExtremeWare appliances are displayed on the Log Activity tab.
Table 27-1 Syslog Parameters
Parameter Description
Log Source Identifier Type the IP address or host name for the log source as an identifier for events from your ExtremeWare appliance.
Configuring DSMs
28
F5 NETWORKSThis section provides information on the following DSMs:
• F5 Networks BIG-IP APM
• F5 Networks BIG-IP ASM
• F5 Networks BIG-IP LTM
• F5 Networks FirePass
F5 Networks BIG-IP APM
The F5 Networks BIG-IP Access Policy Manager (APM) DSM for STRM collects access and authentication security events from a BIG-IP APM device using syslog. Before receiving events in STRM, you must configure your F5 Networks APM device to forward syslog events to STRM.
This section includes the following topics:
• Configuring Syslog Forwarding for BIG-IP APM
• Configuring a Log Source in STRM
Configuring SyslogForwarding for
BIG-IP APM
To configure your BIG-IP LTM device to forward syslog events, choose your BIG-IP APM software version:
• Configuring Remote Syslog for F5 BIG-IP APM 11.x
• Configuring Remote Syslog for F5 BIG-IP APM 10.x
Configuring Remote Syslog for F5 BIG-IP APM 11.x
To configure syslog for F5 BIG-IP APM 11.x:
Step 1 Log in to the command-line of your F5 BIG-IP device.
Step 2 Type the following command to add a single remote syslog server:
tmsh syslog remote server {<Name> {host <IP Address>}}
Where:
<Name> is the name of the F5 BIG-IP APM syslog source.
<IP Address> is the IP address of the STRM Console.
Configuring DSMs
204 F5 NETWORKS
For example,
bigpipe syslog remote server {BIGIP_APM {host 10.100.100.101}}
Step 3 Type the following to save the configuration changes:
tmsh save sys config partitions all
The configuration is complete. The log source is added to STRM as F5 Networks BIG-IP APM events are automatically discovered. Events forwarded to STRM by F5 Networks BIG-IP APM are displayed on the Log Activity tab in STRM.
Configuring Remote Syslog for F5 BIG-IP APM 10.x
To configure syslog for F5 BIG-IP APM 10.x:
Step 1 Log in to the command-line of your F5 BIG-IP device.
Step 2 Type the following command to add a single remote syslog server:
bigpipe syslog remote server {<Name> {host <IP Address>}}
Where:
<Name> is the name of the F5 BIG-IP APM syslog source.
<IP Address> is the IP address of STRM Console.
For example,
bigpipe syslog remote server {BIGIP_APM {host 10.100.100.101}}
Step 3 Type the following to save the configuration changes:
bigpipe save
The configuration is complete. The log source is added to STRM as F5 Networks BIG-IP APM events are automatically discovered. Events forwarded to STRM by F5 Networks BIG-IP APM are displayed on the Log Activity tab.
Configuring a LogSource in STRM
STRM automatically discovers and creates a log source for syslog events from F5 Networks BIG-IP APM appliances. However, you can manually create a log source for STRM to receive syslog events. These configuration steps are optional.
To manually configure a log source for F5 Networks BIG-IP APM:
Step 1 Log in to STRM.
Step 2 Click the Admin tab.
Step 3 On the navigation menu, click Data Sources.
The Data Sources panel is displayed.
Step 4 Click the Log Sources icon.
The Log Sources window is displayed.
Step 5 Click Add.
The Add a log source window is displayed.
Step 6 In the Log Source Name field, type a name for your log source.
Configuring DSMs
F5 Networks BIG-IP ASM 205
Step 7 In the Log Source Description field, type a description for the log source.
Step 8 From the Log Source Type list box, select F5 Networks BIG-IP APM.
Step 9 Using the Protocol Configuration list box, select Syslog.
The syslog protocol configuration is displayed.
Step 10 Configure the following values:
Step 11 Click Save.
Step 12 On the Admin tab, click Deploy Changes.
The configuration is complete.
F5 Networks BIG-IP ASM
The F5 Networks BIG-IP Application Security Manager (ASM) DSM for STRM collects web application security events from BIG-IP ASM appliances using syslog. Before receiving events in STRM, you must configure your F5 Networks ASM appliance with a logging profile to forward application events to STRM.
This section includes the following topics:
• Configuring F5 Networks BIG-IP ASM
• Configuring a Log Source in STRM
Configuring F5Networks BIG-IP ASM
To forward syslog events from an F5 Networks BIG-IP ASM appliance to STRM, you must configure a logging profile. A logging profile allows you to configure remote storage for syslog events, which can be forwarded directly to STRM.
To configure a logging profile:
Step 1 Log in to the F5 Networks BIG-IP ASM appliance user interface.
Step 2 On the navigation pane, select Application Security > Options.
Step 3 Click Logging Profiles.
The Logging Profiles is displayed.
Step 4 Click Create.
The Create New Logging Profile is displayed.
Step 5 From the Configuration list box, select Advanced.
Advanced configuration options are displayed.
Step 6 Configure the following parameters:
a Type a Profile Name.
Table 28-1 Syslog Parameters
Parameter Description
Log Source Identifier Type the IP address or host name for the log source as an identifier for events from your F5 Networks BIG-IP APM appliance.
Configuring DSMs
206 F5 NETWORKS
For example, type STRM.
b Optional. Type a Profile Description.
NOTEIf you do not want data logged locally as well as remotely, you must clear the Local Storage check box.
c Select the Remote Storage check box.
d From the Type list box, select Reporting Server.
e From the Protocol list box, select TCP.
f Configure the Server Addresses fields:
- IP address - Type the IP address of the STRM Console.
- Port - Type a port value of 514.
g Select the Guarantee Logging check box.
NOTEEnabling the Guarantee Logging option ensures the system log requests continue for the web application when the logging utility is competing for system resources. Enabling the Guarantee Logging option can slow access to the associated web application.
h Select the Report Detected Anomalies check box, to allow the system to log details.
i Click Create.
The display refreshes with the new logging profile. The log source is added to STRM as F5 Networks BIG-IP ASM events are automatically discovered. Events forwarded by F5 Networks BIG-IP ASM are displayed on the Log Activity tab of STRM.
Configuring a LogSource in STRM
STRM automatically discovers and creates a log source for syslog events from F5 Networks BIG-IP ASM appliances. However, you can manually create a log source for STRM to receive syslog events. These configuration steps are optional.
To manually configure a log source for F5 Networks BIG-IP ASM:
Step 1 Log in to STRM.
Step 2 Click the Admin tab.
Step 3 On the navigation menu, click Data Sources.
The Data Sources panel is displayed.
Step 4 Click the Log Sources icon.
The Log Sources window is displayed.
Step 5 Click Add.
The Add a log source window is displayed.
Configuring DSMs
F5 Networks BIG-IP LTM 207
Step 6 In the Log Source Name field, type a name for your log source.
Step 7 In the Log Source Description field, type a description for the log source.
Step 8 From the Log Source Type list box, select F5 Networks BIG-IP ASM.
Step 9 Using the Protocol Configuration list box, select Syslog.
The syslog protocol configuration is displayed.
Step 10 Configure the following values:
Step 11 Click Save.
Step 12 On the Admin tab, click Deploy Changes.
The configuration is complete.
F5 Networks BIG-IP LTM
The F5 Networks BIG-IP Local Traffic Manager (LTM) DSM for STRM collects networks security events from a BIG-IP device using syslog. Before receiving events in STRM, you must configure a log source for STRM, then configure your BIG-IP LTM device to forward syslog events.
This section includes the following topics:
• Configuring a Log Source in STRM
• Configuring Syslog Forwarding for BIG-IP LTM
For more information on adding remote syslog sources, see your F5 Networks BIG-IP LTM product documentation.
Configuring a LogSource in STRM
STRM does not automatically discover or create log sources for syslog events from F5 BIG-IP LTM appliances. To integrate F5 BIG-IP LTM with STRM, you must manually create a log source to receive syslog events.
To configure a log source for BIG-IP LTM:
Step 1 Log in to STRM.
Step 2 Click the Admin tab.
Step 3 On the navigation menu, click Data Sources.
The Data Sources panel is displayed.
Step 4 Click the Log Sources icon.
The Log Sources window is displayed.
Table 28-2 Syslog Parameters
Parameter Description
Log Source Identifier Type the IP address or host name for the log source as an identifier for events from your F5 Networks BIG-IP ASM appliance.
Configuring DSMs
208 F5 NETWORKS
Step 5 Click Add.
The Add a log source window is displayed.
Step 6 In the Log Source Name field, type a name for your log source.
Step 7 In the Log Source Description field, type a description for the log source.
Step 8 From the Log Source Type list box, select F5 Networks BIG-IP LTM.
Step 9 Using the Protocol Configuration list box, select Syslog.
The syslog protocol configuration is displayed.
Step 10 Configure the following values:
Step 11 Click Save.
Step 12 On the Admin tab, click Deploy Changes.
You are now ready to configure your BIG-IP LTM appliance to forward syslog events to STRM.
Configuring SyslogForwarding for
BIG-IP LTM
To configure your BIG-IP LTM device to forward syslog events, select your BIG-IP LTM software version:
• Configuring Remote Syslog for F5 BIG-IP LTM 11.x
• Configuring Remote Syslog for F5 BIG-IP LTM 10.x
• Configuring Remote Syslog for F5 BIG-IP LTM 9.4.2 to 9.4.8
Configuring Remote Syslog for F5 BIG-IP LTM 11.x
To configure syslog for F5 BIG-IP LTM 11.x:
Step 1 Log in to the command-line of your F5 BIG-IP device.
Step 2 Type the following command to add a single remote syslog server:
tmsh syslog remote server {<Name> {host <IP Address>}}
Where:
<Name> is the name of the F5 BIG-IP LTM syslog source.
<IP Address> is the IP address of STRM.
For example,
tmsh syslog remote server {BIGIPsyslog {host 10.100.100.100}}
Step 3 Save the configuration changes:
tmsh save sys config partitions all
Table 28-3 Syslog Parameters
Parameter Description
Log Source Identifier Type the IP address or host name for the log source as an identifier for events from your BIG-IP LTM appliance.
Configuring DSMs
F5 Networks BIG-IP LTM 209
The configuration is complete. Events forwarded from your F5 Networks BIG-IP LTM appliance are displayed on the Log Activity tab in STRM.
Configuring Remote Syslog for F5 BIG-IP LTM 10.x
To configure syslog for F5 BIG-IP LTM 10.x:
Step 1 Log in to the command-line of your F5 BIG-IP device.
Step 2 Type the following command to add a single remote syslog server:
bigpipe syslog remote server {<Name> {host <IP Address>}}
Where:
<Name> is the name of the F5 BIG-IP LTM syslog source.
<IP Address> is the IP address of STRM.
For example:
bigpipe syslog remote server {BIGIPsyslog {host 10.100.100.100}}
Step 3 Save the configuration changes:
bigpipe save
NOTEF5 Networks modified the syslog output format in BIG-IP v10.x to include the use of local/ before the hostname in the syslog header. The syslog header format containing local/ is not supported in STRM, but a workaround is available to correct the syslog header. For more information, see https://kb.juniper.net/InfoCenter/kb20922.
The configuration is complete. Events forwarded from your F5 Networks BIG-IP LTM appliance are displayed on the Log Activity tab in STRM.
Configuring Remote Syslog for F5 BIG-IP LTM 9.4.2 to 9.4.8
To configure syslog for F5 BIG-IP LTM 9.4.2 to 9.4.8:
Step 1 Log in to the command-line of your F5 BIG-IP device.
Step 2 Type the following command to add a single remote syslog server:
bigpipe syslog remote server <IP Address>
Where <IP Address> is the IP address of STRM.
For example:
bigpipe syslog remote server 10.100.100.100
Step 3 Type the following to save the configuration changes:
bigpipe save
The configuration is complete. Events forwarded from your F5 Networks BIG-IP LTM appliance are displayed on the Log Activity tab in STRM.
Configuring DSMs
210 F5 NETWORKS
F5 Networks FirePass
The F5 Networks FirePass DSM for STRM collects system events from an F5 FirePass SSL VPN device using syslog. By default, remote logging is disabled and must be enabled in the F5 Networks FirePass device. Before receiving events in STRM, you must configure your F5 Networks FirePass device to forward system events to STRM as a remote syslog server.
This section includes the following topics:
• Configuring Syslog Forwarding for F5 FirePass
• Configuring a Log Source in STRM
Configuring SyslogForwarding for F5
FirePass
To forward syslog events from an F5 Networks BIG-IP FirePass SSL VPM appliance to STRM, you must enable and configure a remote log server. The remote log server can forward events directly to STRM.
To configure a remote syslog server:
Step 1 Log in to the F5 Networks FirePass Admin Console.
Step 2 On the navigation pane, select Device Management > Maintenance > Logs.
The Logging Option is displayed.
Step 3 From the System Logs menu, select the Enable Remote Log Server check box.
Step 4 From the System Logs menu, clear the Enable Extended System Logs check box.
Step 5 In the Remote host parameter, type the IP address or hostname of your STRM.
Step 6 From the Log Level list box, select Information.
The Log Level parameter monitors application level system messages.
Step 7 From the Kernel Log Level list box, select Information.
The Kernel Log Level parameter monitors Linux kernel system messages.
Step 8 Click Apply System Log Changes.
The changes are applied and the configuration is complete. The log source is added to STRM as F5 Networks FirePass events are automatically discovered. Events forwarded to STRM by F5 Networks BIG-IP ASM are displayed on the Log Activity tab in STRM.
Configuring DSMs

F5 Networks FirePass 211
Configuring a LogSource in STRM
STRM automatically discovers and creates a log source for syslog events from F5 Networks FirePass appliances. However, you can manually create a log source for STRM to receive syslog events. These configuration steps are optional.
To manually configure a log source for F5 Networks FirePass:
Step 1 Log in to STRM.
Step 2 Click the Admin tab.
Step 3 On the navigation menu, click Data Sources.
The Data Sources panel is displayed.
Step 4 Click the Log Sources icon.
The Log Sources window is displayed.
Step 5 Click Add.
The Add a log source window is displayed.
Step 6 In the Log Source Name field, type a name for your log source.
Step 7 In the Log Source Description field, type a description for the log source.
Step 8 From the Log Source Type list box, select F5 Networks FirePass.
Step 9 Using the Protocol Configuration list box, select Syslog.
The syslog protocol configuration is displayed.
Step 10 Configure the following values:
Step 11 Click Save.
Step 12 On the Admin tab, click Deploy Changes.
The configuration is complete.
Table 28-4 Syslog Parameters
Parameter Description
Log Source Identifier Type the IP address or host name for the log source as an identifier for events from your F5 Networks FirePass appliance.
Configuring DSMs

29
FAIR WARNINGThe Fair Warning DSM for STRM retrieves event files from a remote source using the log file protocol source. STRM records event categories from the Fair Warning log files about user activity related to patient privacy and security threats to medical records. Your system must be running the latest version of log file protocol to integrate with a Fair Warning appliance.
When configuring your Fair Warning device to use the log file protocol, make sure the hostname or IP address configured in the Fair Warning system is the same as configured in the Remote Host parameter in the Log File Protocol configuration.
You are now ready to configure the log source and protocol in STRM.
To configure STRM to receive events from a Fair Warning device:
Step 1 Log in to STRM.
Step 2 Click the Admin tab.
Step 3 On the navigation menu, click Data Sources.
The Data Sources panel is displayed.
Step 4 Click the Log Sources icon.
The Log Sources window is displayed.
Step 5 Click Add.
The Add a log source window is displayed.
Step 6 In the Log Source Name field, type a name for your log source.
Step 7 In the Log Source Description field, type a description for the log source.
Step 8 From the Log Source Type list box, select Fair Warning.
Step 9 Select the Log File option from the Protocol Configuration list box.
Step 10 Select Fair Warning as the Event Generator used to process the web content filter log files.
Configuring DSMs
214 FAIR WARNING
Step 11 The FTP file pattern must use a regular expression that matches the log files generated by the Fair Warning system.
For more information on full parameters for the Log File protocol, see the STRM Log Sources Users Guide.
For more information on configuring Fair Warning, consult your vendor documentation.
Configuring DSMs
30
FIREEYEThe FireEye DSM for STRM accepts rsyslog events in Log Event Extended Format (LEEF). This DSM applies to FireEye MPS, eMPS and MA appliances. STRM records all relevant notification alerts sent by FireEye appliances. Before configuring a FireEye appliance in STRM, you must configure your device to send events to STRM.
This section includes the following topics:
• Configuring FireEye to Forward Syslog Events
• Configuring a Log Source in STRM
Configuring FireEyeto Forward Syslog
Events
To integrate the FireEye DSM with STRM:
Step 1 Log in to the FireEye appliance using the CLI.
Step 2 Type the following command to activate configuration mode:
enable
configure terminal
Step 3 Enable rsyslog notifications:
fenotify rsyslog enable
Step 4 Add STRM as an rsyslog notification consumer:
fenotify rsyslog trap-sink STRM
Step 5 Type the IP address for the STRM system receiving rsyslog trap-sink notifications:
fenotify rsyslog trap-sink STRM address <IP address>
Where <IP address> is the IP address of the STRM system.
Step 6 Type the following command to define the rsyslog event format:
fenotify rsyslog trap-sink STRM prefer message format leef
Step 7 Save the configuration changes to the FireEye appliance:
write memory
You are now ready to configure a log source in STRM.
Configuring DSMs
216 FIREEYE
Configuring a LogSource in STRM
STRM does not automatically discover or create log sources for syslog events from FireEye appliances. To integrate FireEye events with STRM, you must manually create a log source.
To create a log source for FireEye:
Step 1 Log in to STRM.
Step 2 Click the Admin tab.
Step 3 On the navigation menu, click Data Sources.
The Data Sources panel is displayed.
Step 4 Click the Log Sources icon.
The Log Sources window is displayed.
Step 5 Click Add.
The Add a log source window is displayed.
Step 6 In the Log Source Name field, type a name for your log source.
Step 7 In the Log Source Description field, type a description for the log source.
Step 8 From the Log Source Type list box, select FireEye.
Step 9 Using the Protocol Configuration list box, select Syslog.
The syslog protocol configuration is displayed.
Step 10 Configure the following values:
Step 11 Click Save.
Step 12 On the Admin tab, click Deploy Changes.
The log source is added to STRM. Events forwarded by FireEye are displayed on the Log Activity tab.
Table 1-1 Syslog Parameters
Parameter Description
Log Source Identifier Type the IP address or host name for the log source as an identifier for events from your FireEye appliance.
Configuring DSMs
31
FORESCOUT COUNTERACTThe ForeScout CounterACT DSM for STRM accepts Log Extended Event Format (LEEF) events from CounterACT using syslog. Before configuring STRM, you must install a plug-in for your ForeScout CounterACT appliance and configure ForeScout CounterACT to forward syslog events to STRM.
This section includes the following topics:
• Configuring ForeScout CounterACT
• Configuring a Log Source in STRM
STRM records the following ForeScout CounterACT events:
• Denial of Service (DoS)
• Authentication
• Exploit
• Suspicious
• System
ConfiguringForeScout
CounterACT
This section includes the following topics:
• Configuring the ForeScout CounterACT Plug-in
• Configuring ForeScout CounterACT Policies
Configuring the ForeScout CounterACT Plug-in
To integrate STRM with ForeScout CounterACT, you must download, install and configure a plug-in for CounterACT. The plug-in extends ForeScout CounterACT and provides the framework for forwarding LEEF events to STRM.
To configure the Plug-in for ForeScout CounterACT:
Step 1 From the ForeScout website, download the plug-in for ForeScout CounterACT.
Step 2 Log in to your ForeScout CounterACT appliance.
Step 3 From the CounterACT Console toolbar, select Options > Plugins > Install and select the location of the plug-in file.
The plug-in is installed and displayed in the Plugins pane.
Configuring DSMs
218 FORESCOUT COUNTERACT
Step 4 From the Plugins pane, select the STRM plug-in and click Configure.
The Add STRM wizard is displayed.
Step 5 In the Server Address field, type IP address of STRM.
Step 6 From the Port list box, select 514.
Step 7 Click Next.
Step 8 From the Assigned CounterACT devices pane, choose one of the following options:
• Default Server - Select this option to make all devices on this ForeScout CounterACT forward events to STRM.
• Assign CounterACT devices - Select this option to assign which individual devices running on ForeScout CounterACT forward events to STRM. The Assign CounterACT devices option is only available if you have one or more ForeScout CounterACT server.
Step 9 Click Finish.
The plug-in configuration is complete. You are now ready to define the events forwarded to STRM by ForeScout CounterACT policies.
Configuring ForeScout CounterACT Policies
ForeScout CounterACT policies test conditions to trigger management and remediation actions on the appliance. The plug-in provides an additional action for policies to forward the event to the STRM using syslog. To forward events to STRM, you must define a CounterACT policy that includes the STRM update action. The policy condition must be met at least once to initiate an event to STRM. You must configure each policy to send updates to STRM for events you want to record.
To create or edit a CounterACT policy:
Step 1 Select a policy for ForeScout CounterACT.
Step 2 From the Actions tree, select Audit > Send Updates to STRM Server.
Step 3 From the Contents tab, configure the following values:
a Select the Send host property results check box.
b Choose one of the type of events to forward for the policy:
- Send All - Select this option to include all properties discovered for the policy to STRM.
- Send Specific - Select this option to select and send only specific properties for the policy to STRM.
c Select the Send policy status check box.
Configuring DSMs
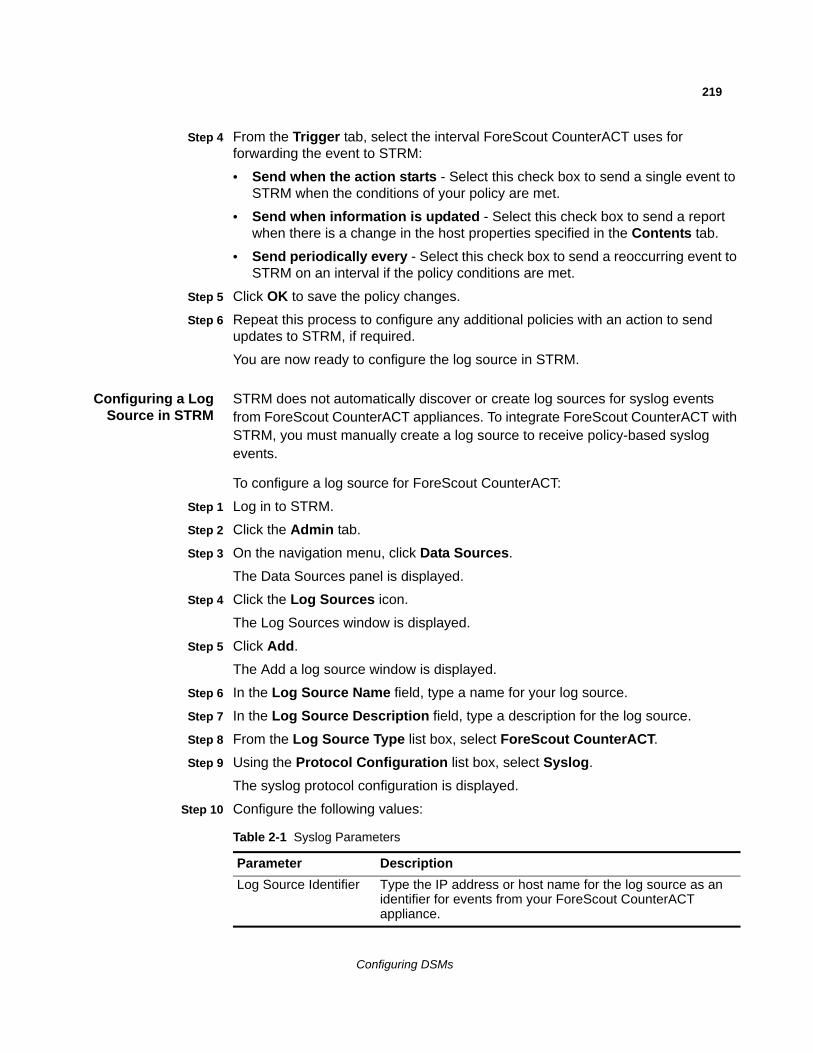
219
Step 4 From the Trigger tab, select the interval ForeScout CounterACT uses for forwarding the event to STRM:
• Send when the action starts - Select this check box to send a single event to STRM when the conditions of your policy are met.
• Send when information is updated - Select this check box to send a report when there is a change in the host properties specified in the Contents tab.
• Send periodically every - Select this check box to send a reoccurring event to STRM on an interval if the policy conditions are met.
Step 5 Click OK to save the policy changes.
Step 6 Repeat this process to configure any additional policies with an action to send updates to STRM, if required.
You are now ready to configure the log source in STRM.
Configuring a LogSource in STRM
STRM does not automatically discover or create log sources for syslog events from ForeScout CounterACT appliances. To integrate ForeScout CounterACT with STRM, you must manually create a log source to receive policy-based syslog events.
To configure a log source for ForeScout CounterACT:
Step 1 Log in to STRM.
Step 2 Click the Admin tab.
Step 3 On the navigation menu, click Data Sources.
The Data Sources panel is displayed.
Step 4 Click the Log Sources icon.
The Log Sources window is displayed.
Step 5 Click Add.
The Add a log source window is displayed.
Step 6 In the Log Source Name field, type a name for your log source.
Step 7 In the Log Source Description field, type a description for the log source.
Step 8 From the Log Source Type list box, select ForeScout CounterACT.
Step 9 Using the Protocol Configuration list box, select Syslog.
The syslog protocol configuration is displayed.
Step 10 Configure the following values:
Table 2-1 Syslog Parameters
Parameter Description
Log Source Identifier Type the IP address or host name for the log source as an identifier for events from your ForeScout CounterACT appliance.
Configuring DSMs

Configuring DSMs
220
Step 1 Click Save.
Step 2 On the Admin tab, click Deploy Changes.
The log source is added to STRM. Events forwarded by ForeScout CounterACT are displayed on the Log Activity tab of STRM.
32
FORTINET FORTIGATEThe Fortinet FortiGate DSM for STRM accepts FortiGate IPS/Firewall events using syslog. STRM records all relevant events. Before you configure STRM to integrate with the device, you must configure syslog within your FortiGate device. For more information on configuring a Fortinet FortiGate device, see your vendor documentation.
The configuration is complete. The log source is added to STRM as Fortinet FortiGate events are automatically discovered. Events forwarded by Fortinet FortiGate are displayed on the Log Activity tab of STRM.
Configuring a LogSource in STRM
STRM automatically discovers and creates a log source for syslog events from Fortinet FortiGate. However, you can manually create a log source for STRM to receive syslog events. The following configuration steps are optional.
To manually configure a log source for Fortinet FortiGate:
Step 1 Log in to STRM.
Step 2 Click the Admin tab.
Step 3 On the navigation menu, click Data Sources.
The Data Sources panel is displayed.
Step 4 Click the Log Sources icon.
The Log Sources window is displayed.
Step 5 Click Add.
The Add a log source window is displayed.
Step 6 In the Log Source Name field, type a name for your log source.
Step 7 In the Log Source Description field, type a description for the log source.
Step 8 From the Log Source Type list box, select Fortinet FortiGate Security Gateway.
Step 9 Using the Protocol Configuration list box, select Syslog.
The syslog protocol configuration is displayed.
Configuring DSMs
222 FORTINET FORTIGATE
Step 10 Configure the following values:
Step 11 Click Save.
Step 12 On the Admin tab, click Deploy Changes.
The configuration is complete.
Table 3-1 Syslog Parameters
Parameter Description
Log Source Identifier Type the IP address or host name for the log source as an identifier for events from your Fortinet FortiGate appliance.
Configuring DSMs
33
FOUNDRY FASTIRONYou can integrate a Foundry FastIron device with STRM. A Foundry FastIron device accepts events using syslog. Before you configure STRM to integrate with a Foundry FastIron RX device, you must:
Step 1 Log in to the Foundry FastIron device command-line interface (CLI).
Step 2 Type the following command to enable logging:
logging on
Local syslog is now enabled with the following defaults:
• Messages of all syslog levels (Emergencies - Debugging) are logged.
• Up to 50 messages are retained in the local syslog buffer.
• No syslog server is specified.
Step 3 Type the following command to define an IP address for the syslog server:
logging host <IP Address>
Where <IP Address> is the IP address of your STRM.
Step 4 You are now ready to configure the log source in STRM.
To configure STRM to receive events from a Foundry FastIron device:
From the Log Source Type list box, select the Foundry FastIron option.
For more information on configuring log sources, see the STRM Log Sources Users Guide. For more information about Foundry FastIron device see your vendor documentation.
Configuring DSMs

34
GENERIC FIREWALLThe generic firewall server DSM for STRM accepts events using syslog. STRM records all relevant events.
This section includes the following topics:
• Configuring Event Properties in STRM
• Configuring a Log Source in STRM
Configuring EventProperties in STRM
To configure STRM to interpret the incoming generic firewall events:
Step 1 Forward all firewall logs to your STRM.
For information on forwarding firewall logs from your generic firewall to STRM, see your firewall vendor documentation.
Step 2 Open the following file:
/opt/qradar/conf/genericFirewall.conf
Make sure you copy this file to systems hosting the Event Collector and the STRM Console.
Step 3 Restart the Tomcat server:
service tomcat restart
A message is displayed indicating that the Tomcat server has restarted.
Step 4 Enable or disable regular expressions in your patterns by setting the regex_enabled property accordingly. By default, regular expressions are disabled. For example:
regex_enabled=false
When you set the regex_enabled property to false, the system generates regular expressions based on the tags you entered while attempting to retrieve the corresponding data values from the logs.
When you set the regex_enabled property to true, you can define custom regex to control patterns. These regex are directly applied to the logs and the first captured group is returned. When defining custom regex patterns, you must adhere to regex rules, as defined by the Java programming language. For more information, see the following website: http://download.oracle.com/javase/tutorial/essential/regex/
Configuring DSMs
226 GENERIC FIREWALL
To integrate a generic firewall with STRM, make sure you specify the classes directly instead of using the predefined classes. For example, the digit class (/\d/) becomes /[0-9]/. Also, instead of using numeric qualifiers, re-write the expression to use the primitive qualifiers (/?/,/*/ and /+/).
Step 5 Review the file to determine a pattern for accepted packets.
For example, if your device generates the following log messages for accepted packets:
Aug. 5, 2005 08:30:00 Packet accepted. Source IP: 192.168.1.1 Source Port: 80 Destination IP: 192.168.1.2 Destination Port: 80 Protocol: tcp
The pattern for accepted packets is Packet accepted.
Step 6 Add the following to the file:
accept_pattern=<accept pattern>
Where <accept pattern> is the pattern determined in Step 5. For example:
accept pattern=Packet accepted
Patterns are case insensitive.
Step 7 Review the file to determine a pattern for denied packets.
For example, if your device generates the following log messages for denied packets:
Aug. 5, 2005 08:30:00 Packet denied. Source IP: 192.168.1.1 Source Port: 21 Destination IP: 192.168.1.2 Destination Port: 21 Protocol: tcp
The pattern for denied packets is Packet denied.
Step 8 Add the following to the file:
deny_pattern=<deny pattern>
Where <deny pattern> is the pattern determined in Step 7.
Patterns are case insensitive.
Step 9 Review the file to determine a pattern, if present, for the following:
source ip
source port
destination ip
destination port
protocol
For example, if your device generates the following log message:
Aug. 5, 2005 08:30:00 Packet accepted. Source IP: 192.168.1.1 Source Port: 80 Destination IP: 192.168.1.2 Destination Port: 80 Protocol: tcp
The pattern for source IP is Source IP.
Configuring DSMs
227
Step 10 Add the following to the file:
source_ip_pattern=<source ip pattern>
source_port_pattern=<source port pattern>
destination_ip_pattern=<destination ip pattern>
destination_port_pattern=<destination port pattern>
protocol_pattern=<protocol pattern>
Where <source ip pattern>, <source port pattern>, <destination ip pattern>, <destination port pattern>, and <protocol pattern> are the corresponding patterns identified in Step 9.
NOTEPatterns are case insensitive and you can add multiple patterns. For multiple patterns, separate using a # symbol.
Step 11 Save and exit the file.
You are now ready to configure the log source in STRM.
Configuring a LogSource in STRM
STRM does not automatically discover or create log sources for syslog events from generic firewall appliances. To integrate generic firewalls with STRM, you must manually create a log source to receive the events.
To configure a log source:
Step 1 Log in to STRM.
Step 2 Click the Admin tab.
Step 3 On the navigation menu, click Data Sources.
The Data Sources panel is displayed.
Step 4 Click the Log Sources icon.
The Log Sources window is displayed.
Step 5 Click Add.
The Add a log source window is displayed.
Step 6 In the Log Source Name field, type a name for your log source.
Step 7 In the Log Source Description field, type a description for the log source.
Step 8 From the Log Source Type list box, select Configurable Firewall Filter.
Step 9 Using the Protocol Configuration list box, select Syslog.
The syslog protocol configuration is displayed.
Configuring DSMs
228 GENERIC FIREWALL
Step 10 Configure the following values:
Step 11 Click Save.
Step 12 On the Admin tab, click Deploy Changes.
The log source is added to STRM. Events forwarded to STRM by generic firewalls are displayed on the Log Activity tab.
Table 5-1 Syslog Parameters
Parameter Description
Log Source Identifier Type the IP address or host name for the log source as an identifier for events from your generic firewall appliance.
Configuring DSMs
35
GENERIC AUTHORIZATION SERVERthe generic authorization server DSM for STRM accepts events using syslog. STRM records all relevant events.
This section includes the following topics:
• Configuring Event Properties in STRM
• Configuring a Log Source in STRM
Configuring EventProperties in STRM
To configure STRM to interpret the incoming generic authorization events:
Step 1 Forward all authentication server logs to your STRM system.
For information on forwarding authentication server logs to STRM, see your generic authorization server vendor documentation.
Step 2 Open the following file:
/opt/qradar/conf/genericAuthServer.conf
Make sure you copy this file to systems hosting the Event Collector and the Console.
Step 3 Restart the Tomcat server:
service tomcat restart
A message is displayed indicating that the Tomcat server has restarted.
Step 4 Enable or disable regular expressions in your patterns by setting the regex_enabled property accordingly. By default, regular expressions are disabled. For example:
regex_enabled=false
When you set the regex_enabled property to false, the system generates regular expressions (regex) based on the tags you entered while attempting to retrieve the corresponding data values from the logs.
When you set the regex_enabled property to true, you can define custom regex to control patterns. These regex are directly applied to the logs and the first captured group is returned. When defining custom regex patterns, you must adhere to regex rules, as defined by the Java programming language. For more information, see the following website: http://download.oracle.com/javase/tutorial/essential/regex/
Configuring DSMs
230 GENERIC AUTHORIZATION SERVER
To integrate the generic authorization server with STRM, make sure you specify the classes directly instead of using the predefined classes. For example, the digit class (/\d/) becomes /[0-9]/. Also, instead of using numeric qualifiers, re-write the expression to use the primitive qualifiers (/?/,/*/ and /+/).
Step 5 Review the file to determine a pattern for successful login:
For example, if your authentication server generates the following log message for accepted packets:
Jun 27 12:11:21 expo sshd[19926]: Accepted password for root from 10.100.100.109 port 1727 ssh2
The pattern for successful login is Accepted password.
Step 6 Add the following entry to the file:
login_success_pattern=<login success pattern>
Where <login success pattern> is the pattern determined in Step 5.
For example:
login_success_pattern=Accepted password
All entries are case insensitive.
Step 7 Review the file to determine a pattern for login failures.
For example, if your authentication server generates the following log message for login failures:
Jun 27 12:58:33 expo sshd[20627]: Failed password for root from 10.100.100.109 port 1849 ssh2
The pattern for login failures is Failed password.
Step 8 Add the following to the file:
login_failed_pattern=<login failure pattern>
Where <login failure pattern> is the pattern determined for login failure.
For example:
login_failed_pattern=Failed password
All entries are case insensitive.
Step 9 Review the file to determine a pattern for logout:
For example, if your authentication server generates the following log message for logout:
Jun 27 13:00:01 expo su(pam_unix)[22723]: session closed for user genuser
The pattern for lookout is session closed.
Step 10 Add the following to the genericAuthServer.conf file:
logout_pattern=<logout pattern>
Where <logout pattern> is the pattern determined for logout in Step 9.
Configuring DSMs

231
For example:
logout_pattern=session closed
All entries are case insensitive.
Step 11 Review the file to determine a pattern, if present, for source IP address and source port.
For example, if your authentication server generates the following log message:
Jun 27 12:11:21 expo sshd[19926]: Accepted password for root from 10.100.100.109 port 1727 ssh2
The pattern for source IP address is from and the pattern for source port is port.
Step 12 Add an entry to the file for source IP address and source port:
source_ip_pattern=<source IP pattern>
source_port_pattern=<source port pattern>
Where <source IP pattern> and <source port pattern> are the patterns identified in Step 11 for source IP address and source port.
For example:
source_ip_pattern=from
source_port_pattern=port
Step 13 Review the file to determine if a pattern exists for username.
For example:
Jun 27 12:11:21 expo sshd[19926]: Accepted password for root from 10.100.100.109 port 1727 ssh2
The pattern for username is for.
Step 14 Add an entry to the file for the username pattern:
For example:
user_name_pattern=for
You are now ready to configure the log source in STRM.
Configuring a LogSource in STRM
STRM does not automatically discover or create log sources for syslog events from generic authorization appliances. To integrate generic authorization appliance event with STRM, you must manually create a log source to receive the events.
To configure a log source:
Step 1 Log in to STRM.
Step 2 Click the Admin tab.
Step 3 On the navigation menu, click Data Sources.
The Data Sources panel is displayed.
Configuring DSMs
232 GENERIC AUTHORIZATION SERVER
Step 4 Click the Log Sources icon.
The Log Sources window is displayed.
Step 5 Click Add.
The Add a log source window is displayed.
Step 6 In the Log Source Name field, type a name for your log source.
Step 7 In the Log Source Description field, type a description for the log source.
Step 8 From the Log Source Type list box, select Configurable Authentication message filter.
Step 9 Using the Protocol Configuration list box, select Syslog.
The syslog protocol configuration is displayed.
Step 10 Configure the following values:
Step 11 Click Save.
Step 12 On the Admin tab, click Deploy Changes.
The log source is added to STRM. Events forwarded to STRM by generic authorization appliances are displayed on the Log Activity tab.
Table 6-1 Syslog Parameters
Parameter Description
Log Source Identifier Type the IP address or host name for the log source as an identifier for events from your generic authorization appliance.
Configuring DSMs
36
GREAT BAY BEACONThe Great Bay Beacon DSM for STRM supports syslog alerts from the Great Bay Beacon Endpoint Profiler. STRM records all relevant endpoint security events. Before you can integrate with STRM, you must configure your Great Bay Beacon Endpoint Profiler to forward syslog event messages to STRM.
To configure your Great Bay Beacon Endpoint Profiler:
Step 1 Log in to your Great Bay Beacon Endpoint Profiler.
Step 2 To create an event, select Configuration > Events > Create Events.
A list of currently configured events is displayed.
Step 3 From the Event Delivery Method pane, select the Syslog check box.
Step 4 To apply your changes, select Configuration Apply Changes > Update Modules.
Step 5 RepeatStep 2 toStep 4 to configure all of the events you want to monitor in STRM.
Step 6 Configure STRM as an external log source for your Great Bay Beacon Endpoint Profiler.
For information on configuring STRM as an external log source, see the Great Bay Beacon Endpoint Profiler Configuration Guide.
You are now ready to configure the log source in STRM.
STRM automatically detects syslog events from your Great Bay Beacon Endpoint Profiler. However, if you want to manually configure STRM to receive events:
From the Log Source Type list box, select Great Bay Beacon.
For more information on configuring log sources, see the STRM Log Sources Users Guide.
Configuring DSMs

37
HBGARY ACTIVE DEFENSEThe HBGary Active Defense DSM for STRM accepts several event types forwarded from HBGary Active Defense devices, such as access, system, system configuration, and policy events. Events from Active Defense are forwarded in the Log Event Extended Format (LEEF) to STRM using syslog. Before you can configure STRM, you must configure a route for your HBGary Active Defense device to forward events to a syslog destination.
This section includes the following topics:
• Configuring Active Defense
• Configuring a Log Source in STRM
Configuring ActiveDefense
To configure a route for syslog events in Active Defense:
Step 1 Log in to the Active Defense Management Console.
Step 2 From the navigation menu, select Settings > Alerts.
The Alerts window is displayed.
Step 3 Click Add Route.
The Route Editor is displayed.
Step 4 In the Route Name field, type a name for the syslog route you are adding to Active Defense.
Step 5 From the Route Type list box, select LEEF (Q1 Labs).
Step 6 In the Settings pane, configure the following values:
• Host - Type the IP address or hostname for your STRM Console or Event Collector.
• Port - Type 514 as the port number.
Step 7 In the Events pane, select any events you want to forward to STRM.
Step 8 Click OK to save your configuration changes.
The Active Defense device configuration is complete. You are now ready to configure a log source in STRM. For more information on configuring a route in Active Defense, see your HBGary Active Defense User Guide.
Configuring DSMs
236 HBGARY ACTIVE DEFENSE
Configuring a LogSource in STRM
STRM automatically discovers and creates a log source for LEEF formatted syslog events forwarded from Active Defense. However, you can manually create a log source for STRM to receive Active Defense syslog events. These configuration steps for creating a log source are optional.
To manually configure log source in STRM:
Step 1 Log in to STRM.
Step 2 Click the Admin tab.
Step 3 In the navigation menu, click Data Sources.
The Data Sources panel is displayed.
Step 4 Click the Log Sources icon.
The Log Sources window is displayed.
Step 5 Click Add.
The Add a log source window is displayed.
Step 6 In the Log Source Name field, type a name for the log source.
Step 7 In the Log Source Description field, type a description for the log source.
Step 8 From the Log Source Type list box, select HBGary Active Defense.
Step 9 From the Protocol Configuration list box, select Syslog.
Step 10 Configure the following values:
For more information on configuring log sources, see the STRM Log Sources Users Guide.
Step 11 Click Save.
Step 12 On the Admin tab, click Deploy Changes.
The HBGary Active Defense configuration is complete.
Table 8-1 HBGary Active Defense Syslog Configuration
Parameter Description
Log Source Identifier Type the IP address or hostname for your HBGary Active Defense device.
The IP address or hostname identifies your HBGary Active Defense device as a unique event source in STRM.
Configuring DSMs
38
HPThis section provides information on the following DSMs:
• HP ProCurve
• HP Tandem
• Hewlett Packard UNIX (HP-UX)
HP ProCurve You can integrate an HP ProCurve device with STRM. An HP ProCurve switch DSM accepts events using syslog. Before you configure STRM to integrate with an HP ProCurve device, you must:
Step 1 Log into the HP ProCurve device.
Step 2 Type the following command to make global configuration level changes.
config
If successful, the CLI will change to ProCurve(config)# as the prompt.
Step 3 Type the following command to logging <syslog-ip-addr>
Where <syslog-ip-addr> is the IP address of the STRM.
Step 4 To exit config mode, press CTRL+Z.
Step 5 Type write mem to save the current configuration to the startup configuration for your HP ProCurve device.
Step 6 You are now ready to configure the log source in STRM.
To configure STRM to receive events from an HP ProCurve device:
From the Log Source Type list box, select HP ProCurve.
For information about installing and configuring the log file protocol, see the STRM Log Sources Users Guide.
For more information about HP ProCurve see your vendor documentation.
Configuring DSMs
238 HP
HP Tandem You can integrate an HP Tandem device with STRM. An HP Tandem device accepts SafeGuard Audit file events using a log file protocol source.
A log file protocol source allows STRM to retrieve archived log files from a remote host. The HP Tandem DSM supports the bulk loading of log files using the log file protocol source.
When configuring your HP Tandem device to use the log file protocol, make sure the hostname or IP address configured in the HP Tandem device is the same as configured in the Remote Host parameter in the Log File Protocol configuration.
The SafeGuard Audit file names have the following format:
Annnnnnn
The single alphabetic character A is followed by a seven-digit decimal integer nnnnnnn, which increments by one each time a name is generated in the same audit pool.
You are now ready to configure the log source and protocol in STRM:
Step 1 From the Log Source Type list box, select HP Tandem.
Step 2 To configure the log file protocol, from the Protocol Configuration list box, select Log File.
NOTEYour system must be running the latest version of the log file protocol to integrate with an HP Tandem device:
For the full list of Log File protocol parameters, see the STRM Log Sources Users Guide. For more information about HP Tandem see your vendor documentation.
Hewlett Packard UNIX (HP-UX)
You can integrate an HP-UX device with STRM. An HP-UX DSM accepts events using syslog. Before you configure STRM to integrate with an HP-UX device, you must:
Step 1 Log in to the HP-UX device command-line interface.
Step 2 Open the following file:
/etc/syslog.conf
Step 3 Add the following line:
<facility>.<level> <destination>
Where:
<facility> is auth.
<level> is info.
<destination> is the IP address of the STRM.
Configuring DSMs
Hewlett Packard UNIX (HP-UX) 239
Step 4 Save and exit the file.
Step 5 Type the following command to ensure that syslogd enforces the changes to the syslog.conf file.
kill -HUP ‘cat /var/run/syslog.pid‘
NOTEThe above command is surrounded with back quotation marks.
Step 6 You are now ready to configure the log source in STRM.
To configure STRM to receive events from an HP-UX device:
From the Log Source Type list box, select the Hewlett Packard UniX option.
For more information on configuring log sources, see the STRM Log Sources Users Guide. For more information about HP-UX, see your vendor documentation.
Configuring DSMs

39
HUAWEIThis section includes configurations for the following DSMs:
• Huawei AR Series Router
• Huawei S Series Switch
Huawei AR Series Router
The Huawei AR Series Router DSM for STRM can accept events from Huawei AR Series Routers using syslog. STRM records all relevant IPv4 events forwarded from Huawei AR Series Router. To integrate your device with STRM, you must create a log source, then configure your AR Series Router to forward syslog events. The DSM supports events from the following Huawei AR Series Routers:
• AR150
• AR200
• AR1200
• AR2200
• AR3200
This section includes the following topics:
• Configuring a Log Source in STRM
• Configuring Your Huawei AR Series Router
Configuring a LogSource in STRM
STRM does not automatically discover incoming syslog events from Huawei AR Series Routers. If your events are not automatically discovered, you must manually create a log source from the Admin tab in STRM.
To configure a log source for a Huawei AR Series Router:
Step 1 Log in to STRM.
Step 2 Click the Admin tab.
Step 3 On the navigation menu, click Data Sources.
The Data Sources panel is displayed.
Step 4 Click the Log Sources icon.
The Log Sources window is displayed.
Configuring DSMs
242 HUAWEI
Step 5 Click Add.
The Add a log source window is displayed.
Step 6 In the Log Source Name field, type a name for your log source.
Step 7 In the Log Source Description field, type a description for the log source.
Step 8 From the Log Source Type list box, select Huawei AR Series Router.
Step 9 From the Protocol Configuration list box, select Syslog.
The syslog protocol configuration is displayed.
Step 10 Configure the following values:
Step 11 Click Save.
Step 12 On the Admin tab, click Deploy Changes.
The log source is added to STRM. You are now ready to configure your Huawei AR Series Router to forward events to STRM.
Configuring YourHuawei AR Series
Router
To forward syslog events to STRM, you must configure your Huawei AR Series Router as an information center, then configure a log host. The log host you create for your Huawei AR Series Router should forward events to your STRM Console or an Event Collector.
To configure your Huawei AR Series Router to forward events to STRM:
Step 1 Log in to your Huawei AR Series Router command-line Interface (CLI).
Step 2 Type the following command to access the system view:
system-view
Step 3 Type the following command to enable the information center:
info-center enable
Step 4 Type the following command to send informational level log messages to the default channel:
info-center source default channel loghost log level informational debug state off trap state off
Step 5 Optional. To verify your Huawei AR Series Router source configuration, type the command:
display channel loghost
Table 10-1 Syslog Parameters
Parameter Description
Log Source Identifier Type the IP address, host name, or name for the log source as an identifier for your Huawei AR Series Router.
Each log source you create for your Huawei AR Series Router should include a unique identifier, such as an IP address or host name.
Configuring DSMs
Huawei S Series Switch 243
Step 6 Type the following command to configure the IP address for STRM as the loghost for your switch:
info-center loghost <IP address> facility <local>
Where:
<IP address> is the IP address of the STRM Console or Event Collector.
<local> is the syslog facility, for example, local0.
For example,
info-center loghost 10.10.10.1 facility local0
Step 7 Type the following command to exit the configuration:
quit
The configuration is complete. You can verify events forwarded to STRM by viewing events on the Log Activity tab.
Huawei S Series Switch
The Huawei S Series Switch DSM for STRM can accept events from Huawei S Series Switch appliances using syslog. STRM records all relevant IPv4 events forwarded from Huawei S Series Switches. To integrate your device with STRM, you must configure a log source, then configure your S Series Switch to forward syslog events. The DSM supports events from the following Huawei S Series Switches:
• S5700
• S7700
• S9700
This section includes the following topics:
• Configuring a Log Source in STRM
• Configuring Your Huawei S Series Switch
Configuring a LogSource in STRM
STRM does not automatically discover incoming syslog events from Huawei S Series Switches. If your events are not automatically discovered, you must manually create a log source from the Admin tab in STRM.
To configure a log source for a Huawei S Series Switch:
Step 1 Log in to STRM.
Step 2 Click the Admin tab.
Step 3 On the navigation menu, click Data Sources.
The Data Sources panel is displayed.
Step 4 Click the Log Sources icon.
The Log Sources window is displayed.
Configuring DSMs
244 HUAWEI
Step 5 Click Add.
The Add a log source window is displayed.
Step 6 In the Log Source Name field, type a name for your log source.
Step 7 In the Log Source Description field, type a description for the log source.
Step 8 From the Log Source Type list box, select Huawei S Series Switch.
Step 9 From the Protocol Configuration list box, select Syslog.
The syslog protocol configuration is displayed.
Step 10 Configure the following values:
Step 11 Click Save.
Step 12 On the Admin tab, click Deploy Changes.
The log source is added to STRM. You are now ready to configure your Huawei S Series Switch to forward events to STRM.
Configuring YourHuawei S Series
Switch
To forward syslog events to STRM, you must configure your Huawei S Series Switch as an information center, then configure a log host. The log host you create for your Huawei S Series Switch should forward events to your STRM Console or an Event Collector.
To configure your Huawei S Series switch to forward events to STRM:
Step 1 Log in to your Huawei S Series Switch command-line Interface (CLI).
Step 2 Type the following command to access the system view:
system-view
Step 3 Type the following command to enable the information center:
info-center enable
Step 4 Type the following command to send informational level log messages to the default channel:
info-center source default channel loghost log level informational debug state off trap state off
Step 5 Optional. To verify your Huawei S Series Switch source configuration, type the command:
display channel loghost
Table 10-2 Syslog Parameters
Parameter Description
Log Source Identifier Type the IP address, host name, or name for the log source as an identifier for your Huawei S Series switch.
Each log source you create for your Huawei S Series switch should include a unique identifier, such as an IP address or host name.
Configuring DSMs
Huawei S Series Switch 245
Step 6 Type the following command to configure the IP address for STRM as the loghost for your switch:
info-center loghost <IP address> facility <local>
Where:
<IP address> is the IP address of the STRM Console or Event Collector.
<local> is the syslog facility, for example, local0.
For example,
info-center loghost 10.10.10.1 facility local0
Step 7 Type the following command to exit the configuration:
quit
The configuration is complete. You can verify events forwarded to STRM by viewing events on the Log Activity tab.
Configuring DSMs

40
IBMThis section provides information on the following DSMs:
• IBM AIX Server
• IBM AS/400 iSeries
• IBM CICS
• IBM Lotus Domino
• IBM Proventia Management SiteProtector
• IBM ISS Proventia
• IBM RACF
• IBM DB2
• IBM WebSphere Application Server
• IBM Informix Audit
• IBM IMS
• IBM Guardium
• IBM Tivoli Access Manager for e-business
• IBM z/OS
• IBM Tivoli Endpoint Manager
IBM AIX Server STRM supports two separate event collection methods for IBM AIX®. The following methods of event collection are supported:
• Syslog - Event collection using syslog allows you to configure IBM AIX to forward system events to STRM. For more information, see Configuring the Syslog Protocol for System Events
• Log File Protocol - Event collection using the log file protocol allows you to collect audit events written to a file by the audit.pl script. The log file protocol import and parses the file containing audit events on a schedule you specify in STRM. For more information, see Configuring the Log File Protocol for Audit Events.
Configuring DSMs
248 IBM
Configuring theSyslog Protocol for
System Events
The IBM AIX DSM for STRM accepts system events from IBM AIX using syslog. STRM records all relevant login, logoff, session opened, session closed, and accepted/failed password events. If you are using syslog on a UNIX host, we recommend that you upgrade the standard syslog to a more recent syslog forwarder, such as, syslog-ng.
• To configure syslog events in IBM AIX, see Configuring Syslog.
• To configure a log source in STRM, see Configuring a Log Source in STRM.
Configuring Syslog
To configure syslog forwarding for IBM AIX:
Step 1 Log in to your IBM AIX system as a root user.
Step 2 Open the /etc/syslog.conf file.
Step 3 Forward the system authentication logs to STRM by adding the following line to the file:
auth.info @<IP address>
Where <IP address> is the IP address of the STRM.
NOTEA tab is required between auth.info and @<IP address> to configure syslog for IBM AIX.
For example,
##### begin /etc/syslog.conf mail.debug /var/adm/maillogmail.none /var/adm/maillogauth.notice /var/adm/authloglpr.debug /var/adm/lpd-errskern.debug /var/adm/messages*.emerg;*.alert;*.crit;*.warning;*.err;*.notice;*.info /var/adm/messagesauth.info @<10.100.100.1>##### end /etc/syslog.conf
Step 4 Save and exit the file.
Step 5 Restart syslog:
refresh -s syslogd
After the syslog server restarts, the configuration is complete. STRM automatically discovers syslog events forwarded from IBM AIX.
Configuring a Log Source in STRM
STRM automatically discovers and creates a log source for syslog events from IBM AIX. However, you can manually create a log source for STRM to receive syslog events. The following configuration steps are optional.
Configuring DSMs

IBM AIX Server 249
To manually configure a syslog log source for IBM AIX:
Step 1 Log in to STRM.
Step 2 Click the Admin tab.
Step 3 On the navigation menu, click Data Sources.
The Data Sources panel is displayed.
Step 4 Click the Log Sources icon.
The Log Sources window is displayed.
Step 5 Click Add.
The Add a log source window is displayed.
Step 6 In the Log Source Name field, type a name for your log source.
Step 7 In the Log Source Description field, type a description for the log source.
Step 8 From the Log Source Type list box, select IBM AIX Server.
Step 9 Using the Protocol Configuration list box, select Syslog.
The syslog protocol configuration is displayed.
Step 10 Configure the following values:
Step 11 Click Save.
Step 12 On the Admin tab, click Deploy Changes.
The configuration is complete.
Configuring the LogFile Protocol for
Audit Events
The log file protocol reads events created from the audit.pl script by converting binary logs on your IBM AIX server in to single line events that are readable by STRM. The audit.pl script should be schedule to run each time you want to convert your audit logs to a readable format. The audit script determines which audit logs to read based on the configuration of your auditing configuration in the /etc/security/audit/config file on your IBM AIX server. This allows you to determine which classes and folders are read by the script and written to an event file on your system. The log file protocol then retrieves the event file and imports the events to STRM.
NOTEWe recommend that you configure auditing as defined in your IBM AIX Server documentation. As auditing all events can produce a large volume of data.
Table 11-1 Syslog Parameters
Parameter Description
Log Source Identifier Type the IP address or host name for the log source as an identifier for events from your IBM AIX.
Configuring DSMs
250 IBM
This section includes the following topics:
• Configuring Auditing in IBM AIX
• Configuring the Audit Script
• Configuring a Log Source in STRM
Configuring Auditing in IBM AIX
Step 1 Edit the following audit configuration file on your IBM AIX server to determine the folders and classes that are required for auditing:
/etc/security/audit/config
Step 2 In the Start section of the audit file, edit the configuration to enable binmode.
For example,
binmode = on
Step 3 In the Start section of the audit file, edit the configuration to determine which directories contain the binary audit logs.
In most cases, you do not have to edit the binary file (bin1 and bin2) directories.
For example, the default configuration for IBM AIX auditing writes binary logs to the following directories:
trail = /audit/trailbin1 = /audit/bin1bin2 = /audit/bin2binsize = 10240cmds = /etc/security/audit/bincmds
Step 4 In the Classes section of the audit file, edit the configuration to determine which classes are audited.
For information on configuring classes, see your IBM AIX documentation.
CAUTIONThe default classes configured in IBM AIX captures a large number of audit events. We recommend you configure the classes in the audit configuration on your IBM AIX system to prevent performance issues.
Step 5 Save the auditing configuration changes.
Step 6 Type the following command to start auditing on your IBM AIX system:
audit start
Configuring the Audit Script
To configure IBM AIX for auditing:
Step 1 From the Juniper customer support website, download the following archive file:
audit.pl.gz
Configuring DSMs
IBM AIX Server 251
Step 2 Copy the audit script to a folder on your IBM AIX server.
NOTEThe audit.pl script requires a minimum version of Perl 5.8 installed on your IBM AIX server.
Step 3 Type the following command to extract the file:
tar -zxvf audit.pl.gz
Step 4 Type the following command and include any additional command parameters to start the audit script:
./audit.pl
Table 11-2 Command Parameters
Parameters Description
-r The -r parameter defines the results directory where the audit script writes the event files that have been converted in to a format readable by STRM.
If you do not specify a results directory, the script writes the events to the following directory:
/audit/results/
The directory you specift for your audit result files is required in the Remote Directory field when you configure a log source using the log file protocol.
Note: To prevent errors, you must verify that any directory you specify exists on your IBM AIX system.
-n The -n parameter renames the audit files processed by the script. By default, audit files are processed as AIX_AUDIT_<timestamp>.
The value you specify using the -n parameter must also be configured in the FTP File Pattern field when you configure a log source using the log file protocol.
-l The -l parameter defines the name of the last record file. By default, the last record file is named lastrecord.txt.
The last record file is used by the script to determine the last event processed by the audit script. The last record file ensures the audit script processes events where it left off and prevents duplicate events from being added to the results file.
-m The -m parameter defines the maximum number of audit files to retain on your IBM AIX system. By default, the script keeps 30 audit files.
When the number of audit files exceeds the value of the -m parameter, the script deletes the audit file with the oldest timestamp.
-t The -t parameter defines the directory that contains the audit trail file. The default is /audit/trail.
-h The -h parameter displays the help and usage information.
-v The -v parameter displays the script version information.
Configuring DSMs
252 IBM
The script converts the binary audit records to event files readable by STRM. The configuration is complete.
NOTEWe recommend you configure a cronjob for the audit.pl script. Adding 0 * * * * /audit.pl allows the audit script to run hourly. Any configuration parameters required must be added after you specify audit.pl. For more information, see your system documentation.
You are now ready to configure a log source for IBM AIX in STRM.
Configuring a Log Source in STRM
A log file protocol source allows STRM to retrieve archived audit log files from a remote host. The IBM AIX DSM supports the bulk loading of log files using the log file protocol source. When configuring your IBM AIX to use the log file protocol, make sure the log file protocol is reading the archived audit log.
You are now ready to configure the log source and protocol in STRM:
Step 1 Log in to STRM.
Step 2 Click the Admin tab.
Step 3 On the navigation menu, click Data Sources.
The Data Sources panel is displayed.
Step 4 Click the Log Sources icon.
The Log Sources window is displayed.
Step 5 Click Add.
The Add a log source window is displayed.
Step 6 In the Log Source Name field, type a name for the log source.
Step 7 In the Log Source Description field, type a description for the log source.
Step 8 From the Log Source Type list box, select IBM AIX Audit.
Step 9 From the Protocol Configuration list box, select Log File.
Step 10 Configure the following values:
Table 11-3 IBM AIX Audit Log File Parameters
Parameter Description
Log Source Identifier Type an IP address, host name, or name to identify the event source. IP addresses or host names are recommended as they allow STRM to identify a log file to a unique event source.
Configuring DSMs

IBM AIX Server 253
Service Type From the list box, select the protocol you want to use when retrieving log files from a remote server. The default is SFTP.
• SFTP - SSH File Transfer Protocol
• FTP - File Transfer Protocol
• SCP - Secure Copy
Note: The underlying protocol used to retrieve log files for the SCP and SFTP service type requires that the server specified in the Remote IP or Hostname field has the SFTP subsystem enabled.
Remote IP or Hostname
Type the IP address or host name of the device storing your event log files.
Remote Port Type the TCP port on the remote host that is running the selected Service Type. The valid range is 1 to 65535.
The options include:
• FTP - TCP Port 21
• SFTP - TCP Port 22
• SCP - TCP Port 22
Note: If the host for your event files is using a non-standard port number for FTP, SFTP, or SCP, you must adjust the port value accordingly.
Remote User Type the user name necessary to log in to the host containing your event files.
The username can be up to 255 characters in length.
Remote Password Type the password necessary to log in to IBM AIX.
Confirm Password Confirm the password necessary to log in to IBM AIX.
SSH Key File If you select SCP or SFTP as the Service Type, this parameter allows you to define an SSH private key file. When you provide an SSH Key File, the Remote Password field is ignored.
Remote Directory Type the directory location on the remote host from which the files are retrieved, relative to the user account you are using to log in.
Note: For FTP only. If your log files reside in the remote user’s home directory, you can leave the remote directory blank. This is to support operating systems where a change in the working directory (CWD) command is restricted.
Recursive Select this check box if you want the file pattern to search sub folders in the remote directory. By default, the check box is clear.
The Recursive option is ignored if you configure SCP as the Service Type.
Table 11-3 IBM AIX Audit Log File Parameters (continued)
Parameter Description
Configuring DSMs
254 IBM
FTP File Pattern If you select SFTP or FTP as the Service Type, this option allows you to configure the regular expression (regex) required to filter the list of files specified in the Remote Directory. All matching files are included in the processing.
IBM z/OS mainframe using IBM Security zSecure Audit writes event files using the pattern AIX_Audit_<timestamp>.gz
The FTP file pattern you specify must match the name you assigned to your AIX audit files by the -n parameter of the audit script. For example, to collect files starting with AIX_AUDIT and ending with your timestamp value, type the following:
AIX_Audit_*
Use of this parameter requires knowledge of regular expressions (regex). For more information, see the following website: http://download.oracle.com/javase/tutorial/essential/regex/
FTP Transfer Mode This option only displays if you select FTP as the Service Type. From the list box, select Binary.
The binary transfer mode is required for event files stored in a binary or compressed format, such as zip, gzip, tar, or tar+gzip archive files.
SCP Remote File If you select SCP as the Service Type you must type the file name of the remote file.
Start Time Type the time of day you want the processing to begin. For example, type 00:00 to schedule the Log File protocol to collect event files at midnight.
This parameter functions with the Recurrence value to establish when and how often the Remote Directory is scanned for files. Type the start time, based on a 24 hour clock, in the following format: HH:MM.
Recurrence Type the frequency, beginning at the Start Time, that you want the remote directory to be scanned. Type this value in hours (H), minutes (M), or days (D).
For example, type 2H if you want the remote directory to be scanned every 2 hours from the start time. The default is 1H.
Run On Save Select this check box if you want the log file protocol to run immediately after you click Save.
After the Run On Save completes, the log file protocol follows your configured start time and recurrence schedule.
Selecting Run On Save clears the list of previously processed files for the Ignore Previously Processed File parameter.
EPS Throttle Type the number of Events Per Second (EPS) that you do not want this protocol to exceed. The valid range is 100 to 5000.
Table 11-3 IBM AIX Audit Log File Parameters (continued)
Parameter Description
Configuring DSMs
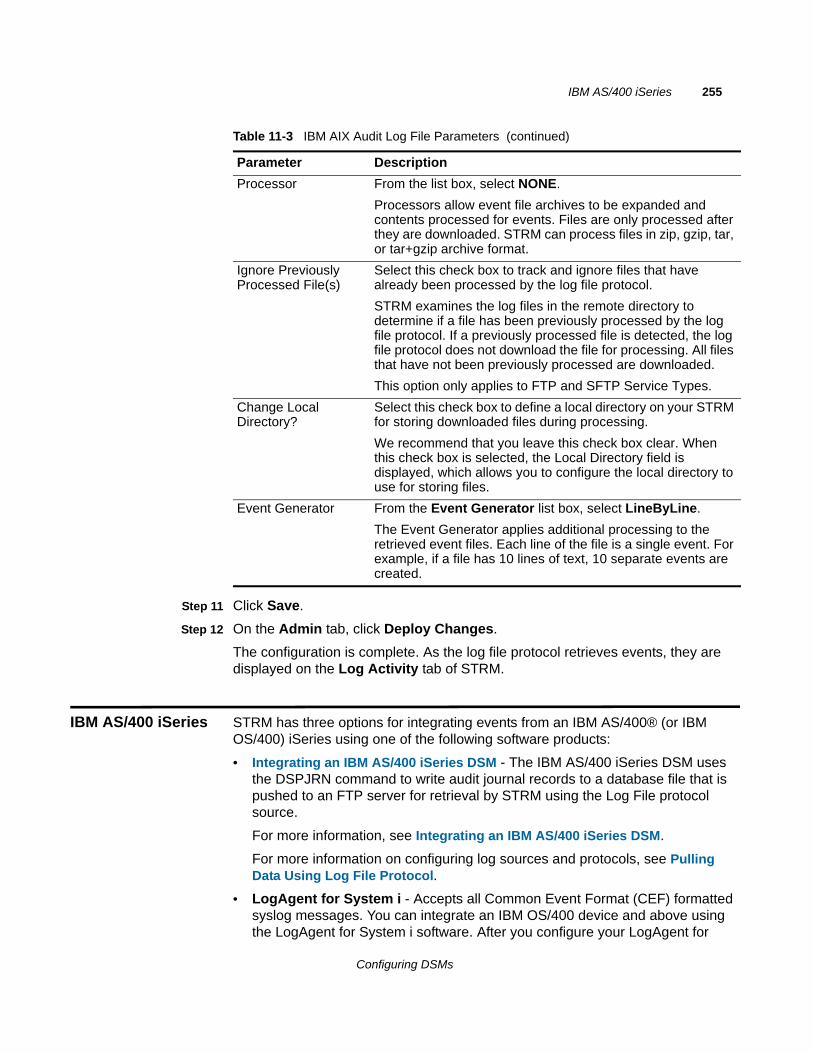
IBM AS/400 iSeries 255
Step 11 Click Save.
Step 12 On the Admin tab, click Deploy Changes.
The configuration is complete. As the log file protocol retrieves events, they are displayed on the Log Activity tab of STRM.
IBM AS/400 iSeries STRM has three options for integrating events from an IBM AS/400® (or IBM OS/400) iSeries using one of the following software products:
• Integrating an IBM AS/400 iSeries DSM - The IBM AS/400 iSeries DSM uses the DSPJRN command to write audit journal records to a database file that is pushed to an FTP server for retrieval by STRM using the Log File protocol source.
For more information, see Integrating an IBM AS/400 iSeries DSM.
For more information on configuring log sources and protocols, see Pulling Data Using Log File Protocol.
• LogAgent for System i - Accepts all Common Event Format (CEF) formatted syslog messages. You can integrate an IBM OS/400 device and above using the LogAgent for System i software. After you configure your LogAgent for
Processor From the list box, select NONE.
Processors allow event file archives to be expanded and contents processed for events. Files are only processed after they are downloaded. STRM can process files in zip, gzip, tar, or tar+gzip archive format.
Ignore Previously Processed File(s)
Select this check box to track and ignore files that have already been processed by the log file protocol.
STRM examines the log files in the remote directory to determine if a file has been previously processed by the log file protocol. If a previously processed file is detected, the log file protocol does not download the file for processing. All files that have not been previously processed are downloaded.
This option only applies to FTP and SFTP Service Types.
Change Local Directory?
Select this check box to define a local directory on your STRM for storing downloaded files during processing.
We recommend that you leave this check box clear. When this check box is selected, the Local Directory field is displayed, which allows you to configure the local directory to use for storing files.
Event Generator From the Event Generator list box, select LineByLine.
The Event Generator applies additional processing to the retrieved event files. Each line of the file is a single event. For example, if a file has 10 lines of text, 10 separate events are created.
Table 11-3 IBM AIX Audit Log File Parameters (continued)
Parameter Description
Configuring DSMs
256 IBM
System i software, use the Log File protocol source to pull the syslog CEF messages.
For more information, see your Patrick Townsend Security Solutions LogAgent for System i documentation.
For more information on configuring log sources and protocols, see Pulling Data Using Log File Protocol.
• PowerTech Interact - Accepts all Common Event Format (CEF) formatted syslog messages. You can integrate an IBM OS/400 device using the PowerTech Interact software. After you configure your PowerTech Interact software, use the Log File protocol source to pull the syslog CEF messages.
For more information, see your PowerTech Interact documentation.
• Raz-Lee iSecurity - Accepts iSecurity formatted events using the Log Enhanced Event Format protocol (LEEF). After you configure your iSecurity software, the syslog events are automatically discovered by STRM. For more information, see Configuring Raz-Lee iSecurity.
Integrating an IBMAS/400 iSeries DSM
The STRM IBM AS/400 iSeries DSM allows you to integrate with an IBM AS/400 iSeries to collect audit records and event information. The IBM AS/400 iSeries DSM uses an agent running on the iSeries that manages, gathers and transfers the event information. The program leverages the DSPJRN command to write audit journal records to a database file. These records are reformatted and forwarded to an FTP server where STRM can retrieve the records using FTP.
To integrate IBM iSeries events into STRM:
Step 1 The IBM iSeries system records and writes security events in the Audit Journal and the QHST logs. QHST logs are stored in the Audit Journal as TYPE5 messages. For more information on configuring your AS/400 iSeries DSM, see Configuring an IBM iSeries to Integrate with STRM.
Step 2 During your scheduled audit collection, the AJLIB/AUDITJRN command is run by an iSeries Job Scheduler using DSPJRN to collect, format and write the Audit Journal records to a database file. The database file containing the audit record information is transferred from the iSeries to an FTP server.
Step 3 Use the log file protocol source to pull the formatted audit file from the FTP server on a scheduled basis. For more information on configuring log sources and protocols, see Pulling Data Using Log File Protocol.
Configuring an IBM iSeries to Integrate with STRM
To integrate an IBM iSeries with STRM:
Step 1 From the Juniper customer support website, download the following files:
AJLIB.SAVF
Step 2 Copy the AJLIB.SAVF file onto a computer or terminal that has FTP access to the IBM AS/400 iSeries.
Configuring DSMs
IBM AS/400 iSeries 257
Step 3 Create a generic online SAVF file on the iSeries using the command:
CRTSAVF QGPL/SAVF
Step 4 Using FTP on the computer or terminal, replace the iSeries generic SAVF with the AJLIB.SAVF file downloaded from Juniper customer support:
bin
cd qgpl
lcd c:\
put ajlib.savf savf
quit
If you are transferring your SAVF file from another iSeries, the file must be sent with the required FTP subcommand mode BINARY before the GET or PUT statement.
Step 5 Restore the AJLIB library on the IBM iSeries:
RSTLIB
Step 6 Setup the data collection start date and time for the Audit Journal Library (AJLIB):
AJLIB/SETUP
You are prompted for a username and password. If you start the Audit Journal Collector a failure message is sent to QSYSOPR.
The setup function sets a default start date and time for data collection from the Audit Journal to 08:00:00 of the current day.
NOTETo preserve your previous start date and time information for a previous installation you must run AJLIB/DATETIME. Record the previous start date and time and type those values when you run AJLIB/SETUP. The start date and time must contain a valid date and time in the six character system date and system time format. The end date and time must be a valid date and time or left blank.
Step 7 Run AJLIB/DATETIME.
This updates the IBM AS/400 iSeries with the data collection start date and time if you made changes.
Step 8 Run AJLIB/AUDITJRN.
This launches the Audit Journal Collection program to gather and send the records to your remote FTP server: If the transfer to the FTP server fails, a message is sent to QSYSOPR. The process for launching AJLIB/AUDITJRN is typically automated by an iSeries Job Scheduler to collect records periodically.
NOTEIf the FTP transfer is successful, the current data and time information is written into the start time for AJLIB/DATETIME to update the gather time and the end time is set to blank. If the FTP transfer fails, the export file is erased and no updates are made to the gather date or time.
Configuring DSMs
258 IBM
Pulling Data Using Log File Protocol
You are now ready to configure the log source and protocol in STRM:
Step 1 To configure STRM to receive events from an IBM AS/400 iSeries, you must select the IBM AS/400 iSeries option from the Log Source Type list box.
Step 2 To configure the log file protocol for the IBM AS/400 iSeries DSM, you must select the Log File option from the Protocol Configuration list box and define the location of your FTP server connection settings.
NOTEIf you are using the PowerTech Interact or LogAgent for System i software to collect CEF formatted syslog messages, you must select the Syslog option from the Protocol Configuration list box.
Step 3 We recommend when you use the Log File protocol option that you select a secure protocol for transferring files, such as Secure File Transfer Protocol (SFTP).
For more information on configuring log sources and protocols, see the STRM Log Sources Users Guide.
Configuring Raz-LeeiSecurity
The Raz-Lee iSecurity for System i user interface allows detailed security audits of systems for compliance and securing iSeries infrastructure. You can integrate STRM to read iSecurity events using the Log Enhanced Event Protocol (LEEF). Before configuring your device in STRM, you must:
1 Configure the Raz-Lee iSecurity user interface to forward syslog events to STRM. For more information, see Configuring iSecurity to Forward Syslog Events.
2 Configure the log source in STRM. For more information, see Configuring a Log Source in STRM.
Configuring iSecurity to Forward Syslog Events
To integrate the device with STRM:
Step 1 Log in to the IBM System i command-line interface.
Step 2 Type the following command to access the audit menu options:
STRAUD
Step 3 From the Audit menu, select 81. System Configuration.
The iSecurity/Base System Configuration window is displayed.
Step 4 From the iSecurity/Base System Configuration menu, select 31. SYSLOG Definitions.
The SYSLOG Definitions window is displayed.
Step 5 Configure the following parameters:
a Send SYSLOG message - Select Yes.
b Destination address - Type the IP address of STRM.
c “Facility” to use - Type a facility level.
Configuring DSMs
IBM CICS 259
d “Severity” range to auto send - Type a severity level.
e Message structure - Type any additional message structure parameters required for your syslog messages.
Step 6 You are now ready to configure the log source in STRM.
Configuring a Log Source in STRM
You are now ready to configure the log source in STRM. STRM automatically detects syslog events from iSecurity on the System i. If you want to manually configure STRM to receive events from a System i device:
From the Log Source Type list box, select the IBM iSecurity option.
For more information on configuring log sources, see the STRM Log Sources Users Guide. For more information about Raz-Lee iSecurity, see your vendor documentation.
IBM CICS The IBM CICS® DSM allows you to integrate events from IBM Custom Information Control System (CICS®) events from an IBM z/OS® mainframe using IBM Security zSecure. Using a zSecure process, events from the System Management Facilities (SMF) are recorded to an event file in the Log Enhanced Event format (LEEF). STRM retrieves the LEEF event log files using the log file protocol and processes the events. You can schedule STRM to retrieve events on a polling interval, which allows STRM to retrieve the events on the schedule you have defined.
To integrate IBM CICS events:
1 Confirm your installation meets any prerequisite installation requirements. For more information, see Before You Begin.
2 Configure your IBM z/OS image to write events in LEEF format. For more information, see the IBM Security zSecure Suite: CARLa-Driven Components Installation and Deployment Guide.
3 Create a log source in STRM for IBM CICS to retrieve your LEEF formatted event logs. For more information, see Creating a Log Source in STRM.
4 Optional. Create a custom event property for IBM CICS in STRM. For more information, see the STRM Custom Event Properties for IBM z/OS technical note.
Before You Begin Before you can configure the data collection process, you must complete the basic zSecure installation process. After installing the software, you must also perform the post-installation activities to create and modify the configuration.
The following prerequisites are required:
• You must ensure parmlib member IFAPRDxx is not disabled for IBM Security zSecure Audit on your z/OS image.
Configuring DSMs
260 IBM
• The SCKRLOAD library must be APF-authorized.
• You must configure a process to periodically refresh your CKFREEZE and UNLOAD data sets.
• You must configure an SFTP, FTP, or SCP server on your z/OS image for STRM to download your LEEF event files.
• You must allow SFTP, FTP, or SCP traffic on firewalls located between STRM and your z/OS image.
For instructions on installing and configuring zSecure, see the IBM Security zSecure Suite: CARLa-Driven Components Installation and Deployment Guide.
Creating a LogSource in STRM
The Log File protocol allows STRM to retrieve archived log files from a remote host. These files are transferred, one at a time, to STRM for processing. The log file protocol can manage plain text event logs, compressed files, or archives. Archives must contain plain-text files that can be processed one line at a time. Multi-line event logs are not supported by the log file protocol. IBM z/OS with zSecure writes log files to a specified directory as gzip archives. STRM extracts the archive and processes the events, which are written as one event per line in the file.
To retrieve these events, you must create a log source using the Log File protocol. STRM requires credentials to log in to the system hosting your LEEF formatted event files and a polling interval.
To configure a log source in STRM for IBM z/OS:
Step 1 Log in to STRM.
Step 2 Click the Admin tab.
Step 3 On the navigation menu, click Data Sources.
The Data Sources panel is displayed.
Step 4 Click the Log Sources icon.
The Log Sources window is displayed.
Step 5 Click Add.
The Add a log source window is displayed.
Step 6 In the Log Source Name field, type a name for the log source.
Step 7 In the Log Source Description field, type a description for the log source.
Step 8 From the Log Source Type list box, select IBM CICS.
Step 9 From the Protocol Configuration list box, select Log File.
Configuring DSMs
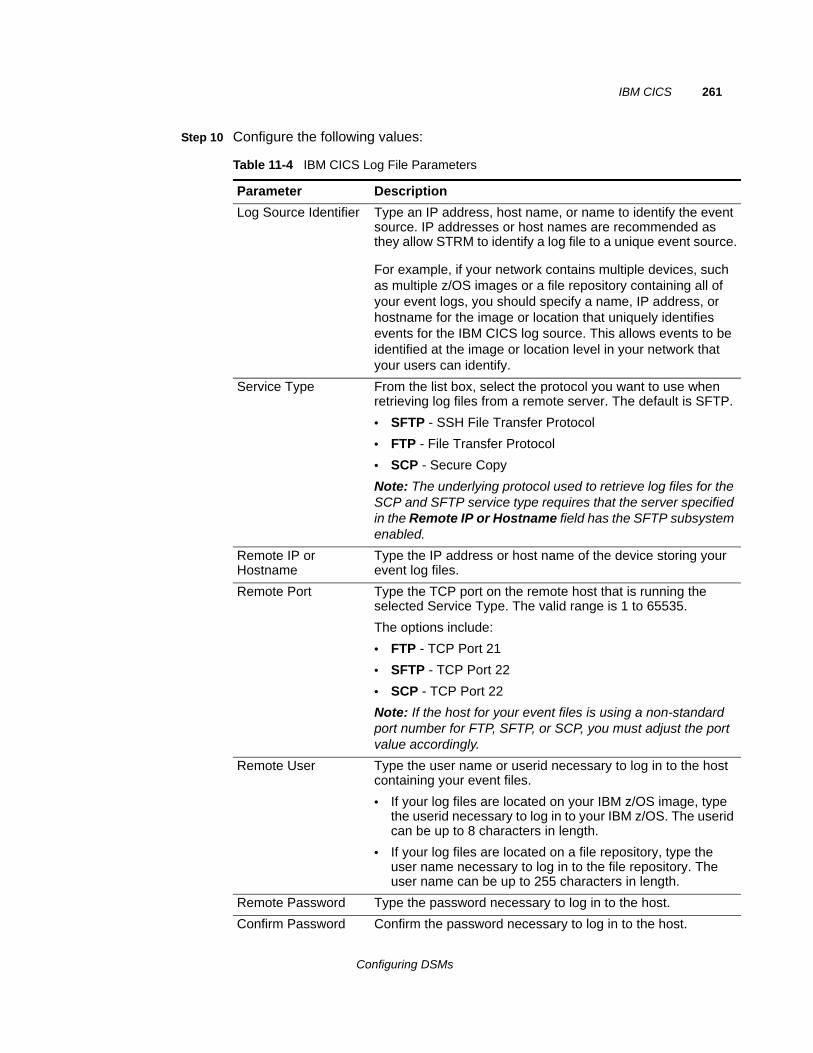
IBM CICS 261
Step 10 Configure the following values:
Table 11-4 IBM CICS Log File Parameters
Parameter Description
Log Source Identifier Type an IP address, host name, or name to identify the event source. IP addresses or host names are recommended as they allow STRM to identify a log file to a unique event source.
For example, if your network contains multiple devices, such as multiple z/OS images or a file repository containing all of your event logs, you should specify a name, IP address, or hostname for the image or location that uniquely identifies events for the IBM CICS log source. This allows events to be identified at the image or location level in your network that your users can identify.
Service Type From the list box, select the protocol you want to use when retrieving log files from a remote server. The default is SFTP.
• SFTP - SSH File Transfer Protocol
• FTP - File Transfer Protocol
• SCP - Secure Copy
Note: The underlying protocol used to retrieve log files for the SCP and SFTP service type requires that the server specified in the Remote IP or Hostname field has the SFTP subsystem enabled.
Remote IP or Hostname
Type the IP address or host name of the device storing your event log files.
Remote Port Type the TCP port on the remote host that is running the selected Service Type. The valid range is 1 to 65535.
The options include:
• FTP - TCP Port 21
• SFTP - TCP Port 22
• SCP - TCP Port 22
Note: If the host for your event files is using a non-standard port number for FTP, SFTP, or SCP, you must adjust the port value accordingly.
Remote User Type the user name or userid necessary to log in to the host containing your event files.
• If your log files are located on your IBM z/OS image, type the userid necessary to log in to your IBM z/OS. The userid can be up to 8 characters in length.
• If your log files are located on a file repository, type the user name necessary to log in to the file repository. The user name can be up to 255 characters in length.
Remote Password Type the password necessary to log in to the host.
Confirm Password Confirm the password necessary to log in to the host.
Configuring DSMs
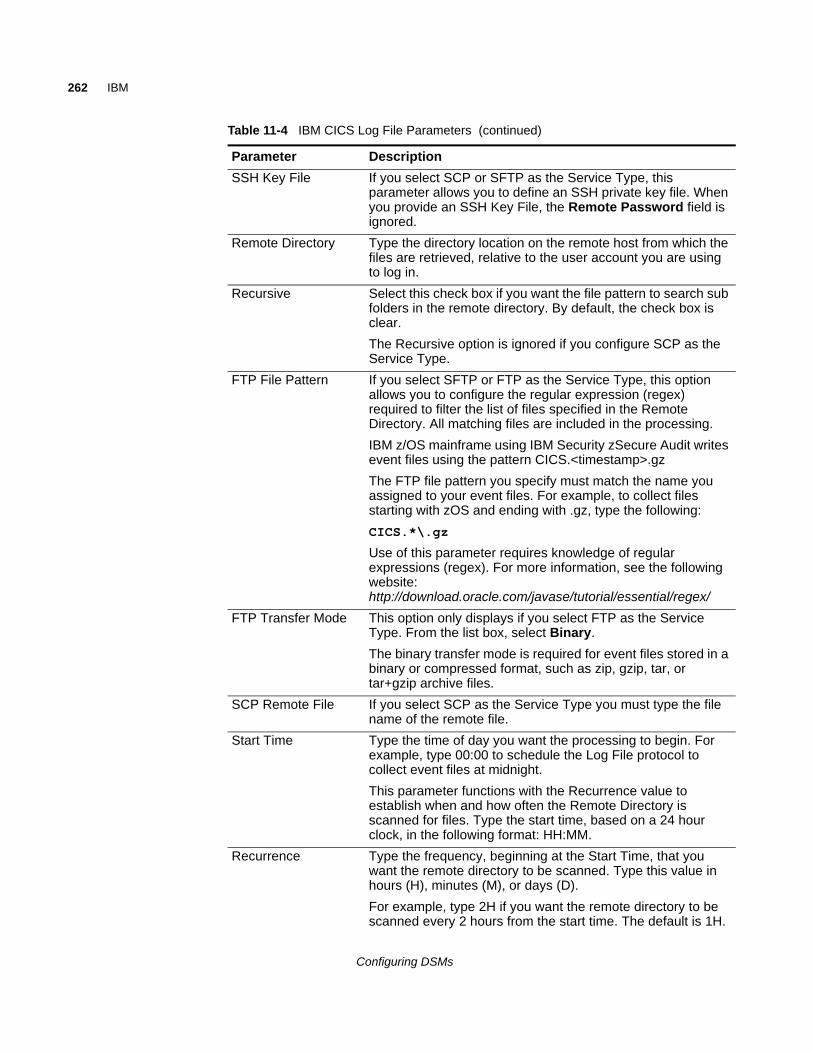
262 IBM
SSH Key File If you select SCP or SFTP as the Service Type, this parameter allows you to define an SSH private key file. When you provide an SSH Key File, the Remote Password field is ignored.
Remote Directory Type the directory location on the remote host from which the files are retrieved, relative to the user account you are using to log in.
Recursive Select this check box if you want the file pattern to search sub folders in the remote directory. By default, the check box is clear.
The Recursive option is ignored if you configure SCP as the Service Type.
FTP File Pattern If you select SFTP or FTP as the Service Type, this option allows you to configure the regular expression (regex) required to filter the list of files specified in the Remote Directory. All matching files are included in the processing.
IBM z/OS mainframe using IBM Security zSecure Audit writes event files using the pattern CICS.<timestamp>.gz
The FTP file pattern you specify must match the name you assigned to your event files. For example, to collect files starting with zOS and ending with .gz, type the following:
CICS.*\.gz
Use of this parameter requires knowledge of regular expressions (regex). For more information, see the following website: http://download.oracle.com/javase/tutorial/essential/regex/
FTP Transfer Mode This option only displays if you select FTP as the Service Type. From the list box, select Binary.
The binary transfer mode is required for event files stored in a binary or compressed format, such as zip, gzip, tar, or tar+gzip archive files.
SCP Remote File If you select SCP as the Service Type you must type the file name of the remote file.
Start Time Type the time of day you want the processing to begin. For example, type 00:00 to schedule the Log File protocol to collect event files at midnight.
This parameter functions with the Recurrence value to establish when and how often the Remote Directory is scanned for files. Type the start time, based on a 24 hour clock, in the following format: HH:MM.
Recurrence Type the frequency, beginning at the Start Time, that you want the remote directory to be scanned. Type this value in hours (H), minutes (M), or days (D).
For example, type 2H if you want the remote directory to be scanned every 2 hours from the start time. The default is 1H.
Table 11-4 IBM CICS Log File Parameters (continued)
Parameter Description
Configuring DSMs
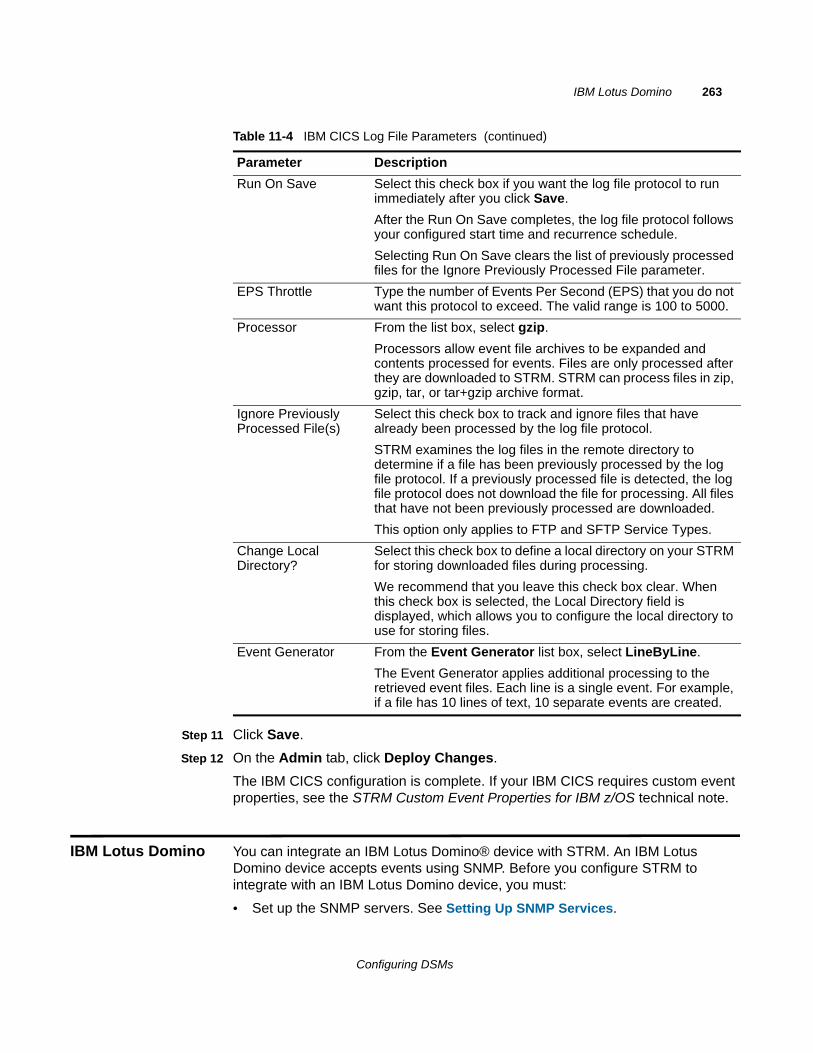
IBM Lotus Domino 263
Step 11 Click Save.
Step 12 On the Admin tab, click Deploy Changes.
The IBM CICS configuration is complete. If your IBM CICS requires custom event properties, see the STRM Custom Event Properties for IBM z/OS technical note.
IBM Lotus Domino You can integrate an IBM Lotus Domino® device with STRM. An IBM Lotus Domino device accepts events using SNMP. Before you configure STRM to integrate with an IBM Lotus Domino device, you must:
• Set up the SNMP servers. See Setting Up SNMP Services.
Run On Save Select this check box if you want the log file protocol to run immediately after you click Save.
After the Run On Save completes, the log file protocol follows your configured start time and recurrence schedule.
Selecting Run On Save clears the list of previously processed files for the Ignore Previously Processed File parameter.
EPS Throttle Type the number of Events Per Second (EPS) that you do not want this protocol to exceed. The valid range is 100 to 5000.
Processor From the list box, select gzip.
Processors allow event file archives to be expanded and contents processed for events. Files are only processed after they are downloaded to STRM. STRM can process files in zip, gzip, tar, or tar+gzip archive format.
Ignore Previously Processed File(s)
Select this check box to track and ignore files that have already been processed by the log file protocol.
STRM examines the log files in the remote directory to determine if a file has been previously processed by the log file protocol. If a previously processed file is detected, the log file protocol does not download the file for processing. All files that have not been previously processed are downloaded.
This option only applies to FTP and SFTP Service Types.
Change Local Directory?
Select this check box to define a local directory on your STRM for storing downloaded files during processing.
We recommend that you leave this check box clear. When this check box is selected, the Local Directory field is displayed, which allows you to configure the local directory to use for storing files.
Event Generator From the Event Generator list box, select LineByLine.
The Event Generator applies additional processing to the retrieved event files. Each line is a single event. For example, if a file has 10 lines of text, 10 separate events are created.
Table 11-4 IBM CICS Log File Parameters (continued)
Parameter Description
Configuring DSMs
264 IBM
• Start the Domino Server add-in tasks. See Starting the Domino Server Add-in Tasks.
• Configure the SNMP services. See Configuring SNMP Services
Setting Up SNMPServices
To set up the SNMP services on the IBM Lotus Domino server:
Step 1 Install the Lotus Domino SNMP Agent as a service. From the command prompt, go to the Lotus\Domino directory and type the following command:
Insnmp -SC
Step 2 Confirm that the Microsoft SNMP service is installed.
Step 3 Start the SNMP and LNSNMP services. From a command prompt, type the following commands:
net start snmp
net start lnsnmp
Step 4 Select Start > Program > Administrative Tools > Services to open the Services MMC
Step 5 Double-click on the SNMP service and select the Traps tab.
Step 6 In the Community name field, type public and click add to list:
Step 7 In the Traps destinations section, select Add and type the IP address of your STRM. Click Add.
Step 8 Click OK.
Step 9 Confirm that both SNMP agents are set to Automatic so they run upon server boot.
Starting the DominoServer Add-in Tasks
After you configure the SNMP services, you must start the Domino server add-in tasks. Repeat the below procedure for each Domino partition.
To start the Domino server add-in tasks:
Step 1 Log in to the Domino Server console.
Step 2 To support SNMP traps for Domino events, type the following command to start the Event Interceptor add-in task:
load intrcpt
Step 3 To support Domino statistic threshold traps, type the following command to start the Statistic Collector add-in task:
load collect
Step 4 Arrange for the add-in tasks to be restarted automatically the next time that Domino is restarted. Add intrcpt and collect to the ServerTasks variable in Domino's NOTES.INI file.
Configuring DSMs
IBM Lotus Domino 265
Configuring SNMPServices
To configure SNMP services:
NOTEConfigurations might vary depending on your environment. See your vendor documentation for more information.
Step 1 Open the Domino Administrator utility and authenticate with administrative credentials.
Step 2 Click on the Files tab, and the Monitoring Configuration (events4.nsf) document.
Step 3 Expand the DDM Configuration Tree and select DDM Probes By Type.
Step 4 Select Enable Probes, and then select Enable All Probes In View.
NOTEYou might receive a warning after performing this action. This is a normal result, as some of the probes require additional configuration.
Step 5 Select DDM Filter.
You can either create a new DDM Filter or edit the existing DDM Default Filter.
Step 6 Apply the DDM Filter to enhanced and simple events. Choose to log all event types.
Step 7 Depending on the environment, you can choose to apply the filter to all servers in a domain or only to specific servers.
Step 8 Click Save. Close when finished.
Step 9 Expand the Event Handlers tree and select Event Handlers By Server.
Step 10 Select New Event Handler.
Step 11 Configure the following parameters:
• Basic - Servers to monitor: Choose to monitor either all servers in the domain or only specific servers.
• Basic - Notification trigger: Any event that matches the criteria.
• Event - Criteria to match: Events can be any type.
• Event - Criteria to match: Events must be one of these priorities (Check all the boxes).
• Event - Criteria to match: Events can have any message.
• Action - Notification method: SNMP Trap.
• Action - Enablement: Enable this notification.
Step 12 Click Save. Close when finished.
You are now ready to configure the log source in STRM.
To configure STRM to receive events from as IBM Lotus Domino device:
From the Log Source Type list box, select the IBM Lotus Domino option.
Configuring DSMs
266 IBM
For more information on configuring log sources, see the STRM Log Sources Users Guide. For more information about IBM Lotus Domino see your vendor documentation.
IBM Proventia Management SiteProtector
The IBM Proventia® Management SiteProtector™ DSM for STRM accepts SiteProtector events by polling the SiteProtector database. This allows STRM to record Intrusion Prevention System (IPS) events and audit events directly from the IBM SiteProtector database.
NOTEThe IBM Proventia Management SiteProtector DSM requires the latest JDBC Protocol to collect audit events.
The IBM Proventia Management SiteProtector DSM for STRM can accept detailed SiteProtector events by reading information from the primary SensorData1 table. The SensorData1 table is generated with information from several other tables in the IBM SiteProtector database. SensorData1 remains the primary table for collecting events.
IDP events include information from SensorData1, along with information from the following tables:
• SensorDataAVP1
• SensorDataReponse1
Audit events include information from the following tables:
• AuditInfo
• AuditTrail
Audit events are not collected by default and make a separate query to the AuditInfo and AuditTrail tables when you select the Include Audit Events check box. For more information about your SiteProtector database tables, see your vendor documentation.
Before you configure STRM to integrate with SiteProtector, we recommend you create a database user account and password in SiteProtector for STRM. Your STRM user must have read permissions for the SensorData1 table, which stores SiteProtector events. The JDBC - SiteProtector protocol allows STRM to log in and poll for events from the database. Creating a STRM account is not required, but it is recommended for tracking and securing your event data.
NOTEEnsure that no firewall rules are blocking the communication between the SiteProtector console and STRM.
Configuring DSMs
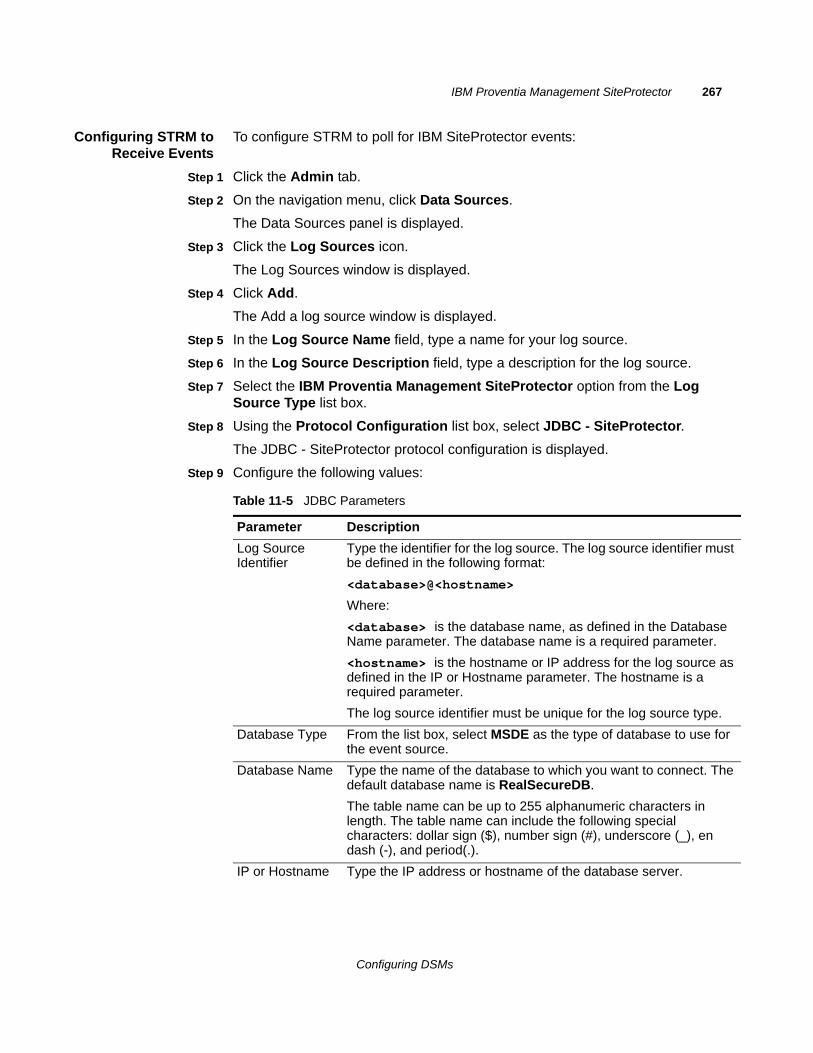
IBM Proventia Management SiteProtector 267
Configuring STRM toReceive Events
To configure STRM to poll for IBM SiteProtector events:
Step 1 Click the Admin tab.
Step 2 On the navigation menu, click Data Sources.
The Data Sources panel is displayed.
Step 3 Click the Log Sources icon.
The Log Sources window is displayed.
Step 4 Click Add.
The Add a log source window is displayed.
Step 5 In the Log Source Name field, type a name for your log source.
Step 6 In the Log Source Description field, type a description for the log source.
Step 7 Select the IBM Proventia Management SiteProtector option from the Log Source Type list box.
Step 8 Using the Protocol Configuration list box, select JDBC - SiteProtector.
The JDBC - SiteProtector protocol configuration is displayed.
Step 9 Configure the following values:
Table 11-5 JDBC Parameters
Parameter Description
Log Source Identifier
Type the identifier for the log source. The log source identifier must be defined in the following format:
<database>@<hostname>
Where:
<database> is the database name, as defined in the Database Name parameter. The database name is a required parameter.
<hostname> is the hostname or IP address for the log source as defined in the IP or Hostname parameter. The hostname is a required parameter.
The log source identifier must be unique for the log source type.
Database Type From the list box, select MSDE as the type of database to use for the event source.
Database Name Type the name of the database to which you want to connect. The default database name is RealSecureDB.
The table name can be up to 255 alphanumeric characters in length. The table name can include the following special characters: dollar sign ($), number sign (#), underscore (_), en dash (-), and period(.).
IP or Hostname Type the IP address or hostname of the database server.
Configuring DSMs
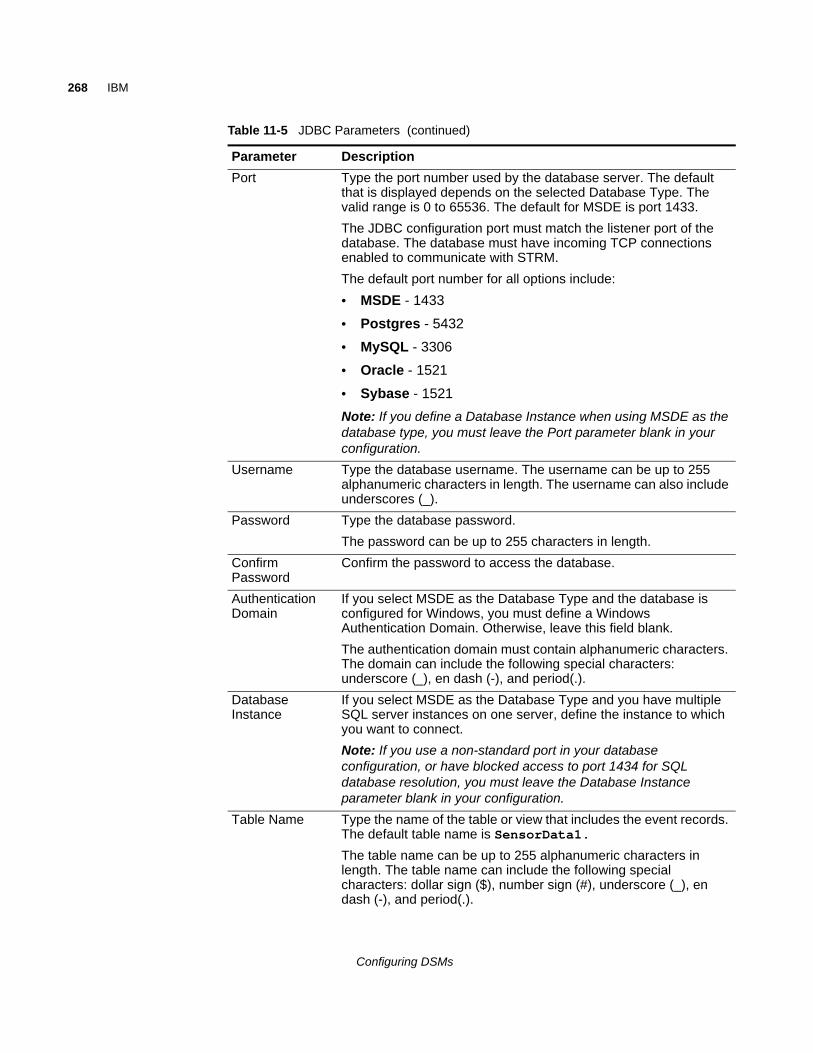
268 IBM
Port Type the port number used by the database server. The default that is displayed depends on the selected Database Type. The valid range is 0 to 65536. The default for MSDE is port 1433.
The JDBC configuration port must match the listener port of the database. The database must have incoming TCP connections enabled to communicate with STRM.
The default port number for all options include:
• MSDE - 1433
• Postgres - 5432
• MySQL - 3306
• Oracle - 1521
• Sybase - 1521
Note: If you define a Database Instance when using MSDE as the database type, you must leave the Port parameter blank in your configuration.
Username Type the database username. The username can be up to 255 alphanumeric characters in length. The username can also include underscores (_).
Password Type the database password.
The password can be up to 255 characters in length.
Confirm Password
Confirm the password to access the database.
Authentication Domain
If you select MSDE as the Database Type and the database is configured for Windows, you must define a Windows Authentication Domain. Otherwise, leave this field blank.
The authentication domain must contain alphanumeric characters. The domain can include the following special characters: underscore (_), en dash (-), and period(.).
Database Instance
If you select MSDE as the Database Type and you have multiple SQL server instances on one server, define the instance to which you want to connect.
Note: If you use a non-standard port in your database configuration, or have blocked access to port 1434 for SQL database resolution, you must leave the Database Instance parameter blank in your configuration.
Table Name Type the name of the table or view that includes the event records. The default table name is SensorData1.
The table name can be up to 255 alphanumeric characters in length. The table name can include the following special characters: dollar sign ($), number sign (#), underscore (_), en dash (-), and period(.).
Table 11-5 JDBC Parameters (continued)
Parameter Description
Configuring DSMs
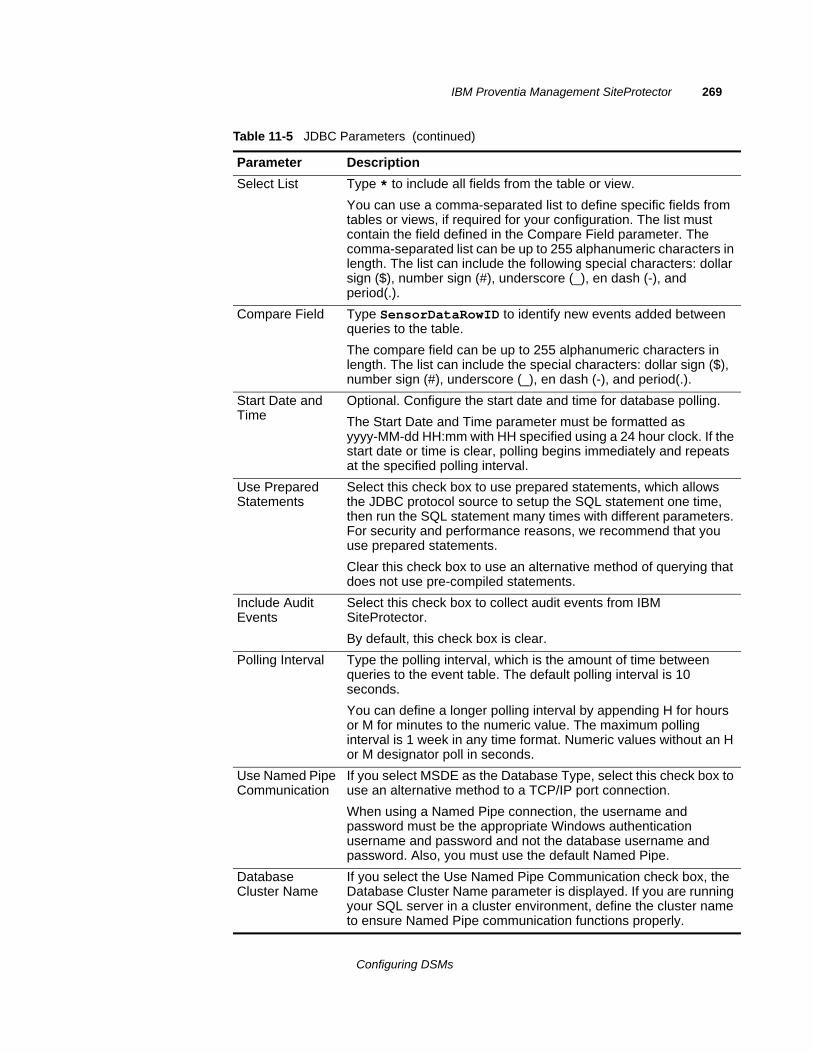
IBM Proventia Management SiteProtector 269
Select List Type * to include all fields from the table or view.
You can use a comma-separated list to define specific fields from tables or views, if required for your configuration. The list must contain the field defined in the Compare Field parameter. The comma-separated list can be up to 255 alphanumeric characters in length. The list can include the following special characters: dollar sign ($), number sign (#), underscore (_), en dash (-), and period(.).
Compare Field Type SensorDataRowID to identify new events added between queries to the table.
The compare field can be up to 255 alphanumeric characters in length. The list can include the special characters: dollar sign ($), number sign (#), underscore (_), en dash (-), and period(.).
Start Date and Time
Optional. Configure the start date and time for database polling.
The Start Date and Time parameter must be formatted as yyyy-MM-dd HH:mm with HH specified using a 24 hour clock. If the start date or time is clear, polling begins immediately and repeats at the specified polling interval.
Use Prepared Statements
Select this check box to use prepared statements, which allows the JDBC protocol source to setup the SQL statement one time, then run the SQL statement many times with different parameters. For security and performance reasons, we recommend that you use prepared statements.
Clear this check box to use an alternative method of querying that does not use pre-compiled statements.
Include Audit Events
Select this check box to collect audit events from IBM SiteProtector.
By default, this check box is clear.
Polling Interval Type the polling interval, which is the amount of time between queries to the event table. The default polling interval is 10 seconds.
You can define a longer polling interval by appending H for hours or M for minutes to the numeric value. The maximum polling interval is 1 week in any time format. Numeric values without an H or M designator poll in seconds.
Use Named Pipe Communication
If you select MSDE as the Database Type, select this check box to use an alternative method to a TCP/IP port connection.
When using a Named Pipe connection, the username and password must be the appropriate Windows authentication username and password and not the database username and password. Also, you must use the default Named Pipe.
Database Cluster Name
If you select the Use Named Pipe Communication check box, the Database Cluster Name parameter is displayed. If you are running your SQL server in a cluster environment, define the cluster name to ensure Named Pipe communication functions properly.
Table 11-5 JDBC Parameters (continued)
Parameter Description
Configuring DSMs
270 IBM
Step 10 Click Save.
Step 11 On the Admin tab, click Deploy Changes.
The configuration is complete.
IBM ISS Proventia The IBM Integrated Systems Solutions® (ISS) Proventia DSM for STRM accepts IBM Proventia® events using SNMP. STRM records all relevant events. Before you configure STRM to integrate with IBM Proventia, you must:
Step 1 In the Proventia Manager user interface navigation pane, expand the System node.
Step 2 Select System.
Step 3 Select Services.
The Service Configuration page is displayed.
Step 4 Click the SNMP tab.
Step 5 Select SNMP Traps Enabled.
Step 6 In the Trap Receiver field, type the IP address of your STRM you wish to monitor incoming SNMP traps.
Step 7 In the Trap Community field, type the appropriate community name.
Step 8 From the Trap Version list, select the trap version.
Step 9 Click Save Changes.
You are now ready to configure STRM to receive SNMP traps.
To configure STRM to receive events from an ISS Proventia device:
From the Log Source Type list box, select IBM Proventia Network Intrusion Prevention System (IPS).
For information on configuring SNMP in the STRM, see the STRM Log Sources Users Guide. For more information about your ISS Proventia device, see your vendor documentation.
IBM RACF STRM includes two options for integrating event from IBM RACF®:
• Integrating IBM RACF with STRM Using IBM Security zSecure
• Integrating IBM RACF with STRM Using Audit Scripts
Integrating IBM RACFwith STRM Using IBM
Security zSecure
The IBM RACF DSM allows you to integrate events from an IBM z/OS® mainframe using IBM Security zSecure™. Using a zSecure process, events from the System Management Facilities (SMF) are recorded to an event file in the Log Enhanced Event format (LEEF). STRM retrieves the LEEF event log files using the log file protocol and processes the events. You can schedule STRM to retrieve events on
Configuring DSMs
IBM RACF 271
a polling interval, which allows STRM to retrieve the events on the schedule you have defined.
To integrate IBM RACF LEEF events:
1 Confirm your installation meets any prerequisite installation requirements. For more information, see Before You Begin.
2 Configure your IBM z/OS image to write events in LEEF format. For more information, see the IBM Security zSecure Suite: CARLa-Driven Components Installation and Deployment Guide.
3 Create a log source in STRM for IBM RACF to retrieve your LEEF formatted event logs. For more information, see Creating an IBM RACF Log Source in STRM.
4 Optional. Create a custom event property for IBM RACF in STRM. For more information, see the STRM Custom Event Properties for IBM z/OS technical note.
Before You Begin
Before you can configure the data collection process, you must complete the basic zSecure installation process. After installing the software, you must also perform the post-installation activities to create and modify the configuration.
The following prerequisites are required:
• You must ensure parmlib member IFAPRDxx is not disabled for IBM Security zSecure Audit on your z/OS image.
• The SCKRLOAD library must be APF-authorized.
• You must configure a process to periodically refresh your CKFREEZE and UNLOAD data sets.
• You must configure an SFTP, FTP, or SCP server on your z/OS image for STRM to download your LEEF event files.
• You must allow SFTP, FTP, or SCP traffic on firewalls located between STRM and your z/OS image.
For instructions on installing and configuring zSecure, see the IBM Security zSecure Suite: CARLa-Driven Components Installation and Deployment Guide.
Creating an IBM RACF Log Source in STRM
The Log File protocol allows STRM to retrieve archived log files from a remote host. These files are transferred, one at a time, to STRM for processing. The log file protocol can manage plain text event logs, compressed files, or archives. Archives must contain plain-text files that can be processed one line at a time. Multi-line event logs are not supported by the log file protocol. IBM z/OS with zSecure writes log files to a specified directory as gzip archives. STRM extracts the archive and processes the events, which are written as one event per line in the file.
Configuring DSMs
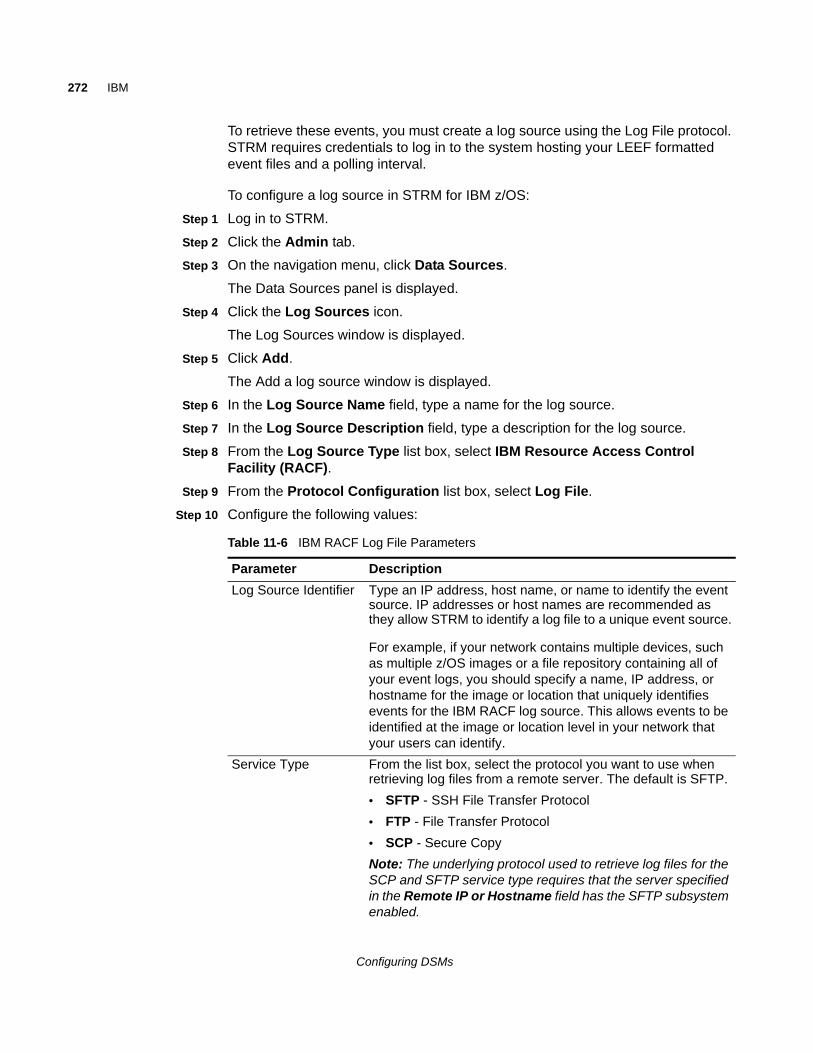
272 IBM
To retrieve these events, you must create a log source using the Log File protocol. STRM requires credentials to log in to the system hosting your LEEF formatted event files and a polling interval.
To configure a log source in STRM for IBM z/OS:
Step 1 Log in to STRM.
Step 2 Click the Admin tab.
Step 3 On the navigation menu, click Data Sources.
The Data Sources panel is displayed.
Step 4 Click the Log Sources icon.
The Log Sources window is displayed.
Step 5 Click Add.
The Add a log source window is displayed.
Step 6 In the Log Source Name field, type a name for the log source.
Step 7 In the Log Source Description field, type a description for the log source.
Step 8 From the Log Source Type list box, select IBM Resource Access Control Facility (RACF).
Step 9 From the Protocol Configuration list box, select Log File.
Step 10 Configure the following values:
Table 11-6 IBM RACF Log File Parameters
Parameter Description
Log Source Identifier Type an IP address, host name, or name to identify the event source. IP addresses or host names are recommended as they allow STRM to identify a log file to a unique event source.
For example, if your network contains multiple devices, such as multiple z/OS images or a file repository containing all of your event logs, you should specify a name, IP address, or hostname for the image or location that uniquely identifies events for the IBM RACF log source. This allows events to be identified at the image or location level in your network that your users can identify.
Service Type From the list box, select the protocol you want to use when retrieving log files from a remote server. The default is SFTP.
• SFTP - SSH File Transfer Protocol
• FTP - File Transfer Protocol
• SCP - Secure Copy
Note: The underlying protocol used to retrieve log files for the SCP and SFTP service type requires that the server specified in the Remote IP or Hostname field has the SFTP subsystem enabled.
Configuring DSMs
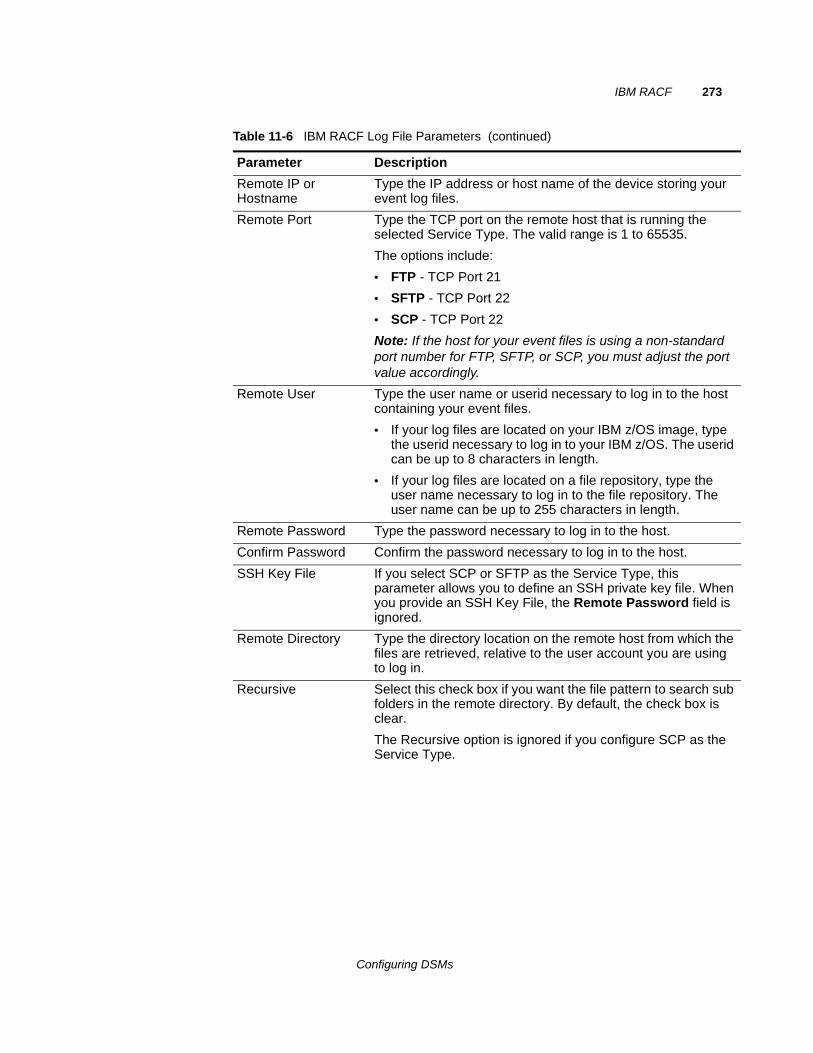
IBM RACF 273
Remote IP or Hostname
Type the IP address or host name of the device storing your event log files.
Remote Port Type the TCP port on the remote host that is running the selected Service Type. The valid range is 1 to 65535.
The options include:
• FTP - TCP Port 21
• SFTP - TCP Port 22
• SCP - TCP Port 22
Note: If the host for your event files is using a non-standard port number for FTP, SFTP, or SCP, you must adjust the port value accordingly.
Remote User Type the user name or userid necessary to log in to the host containing your event files.
• If your log files are located on your IBM z/OS image, type the userid necessary to log in to your IBM z/OS. The userid can be up to 8 characters in length.
• If your log files are located on a file repository, type the user name necessary to log in to the file repository. The user name can be up to 255 characters in length.
Remote Password Type the password necessary to log in to the host.
Confirm Password Confirm the password necessary to log in to the host.
SSH Key File If you select SCP or SFTP as the Service Type, this parameter allows you to define an SSH private key file. When you provide an SSH Key File, the Remote Password field is ignored.
Remote Directory Type the directory location on the remote host from which the files are retrieved, relative to the user account you are using to log in.
Recursive Select this check box if you want the file pattern to search sub folders in the remote directory. By default, the check box is clear.
The Recursive option is ignored if you configure SCP as the Service Type.
Table 11-6 IBM RACF Log File Parameters (continued)
Parameter Description
Configuring DSMs
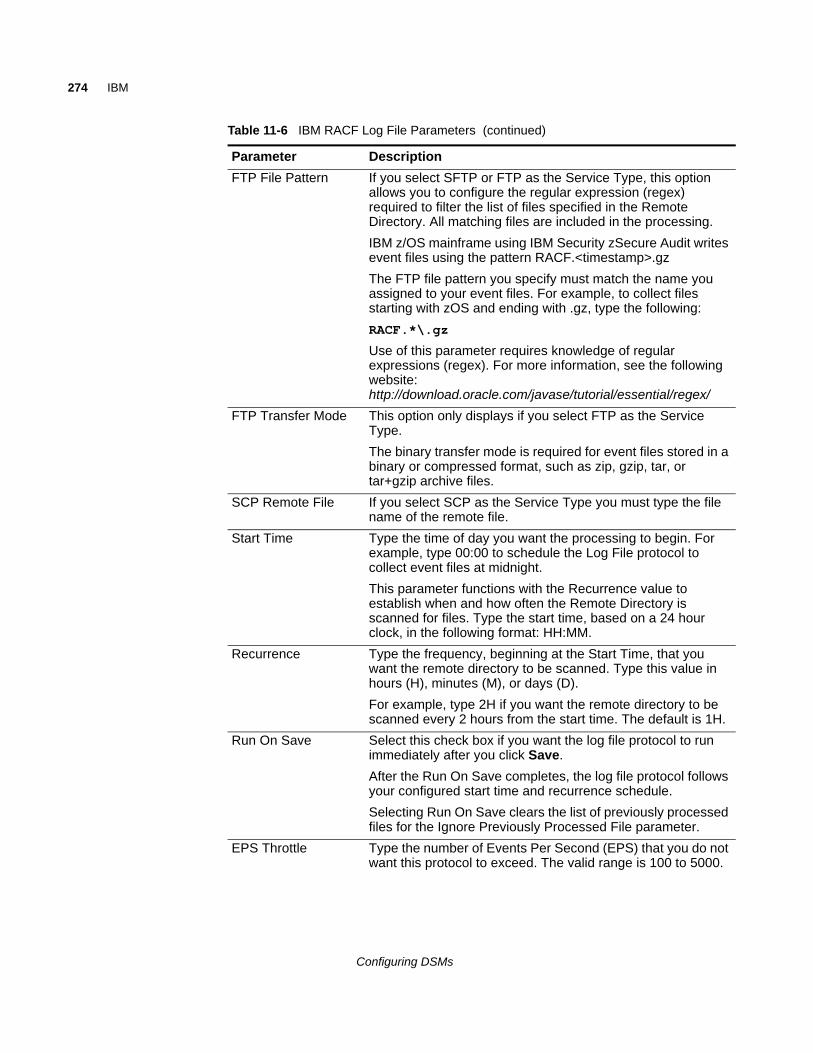
274 IBM
FTP File Pattern If you select SFTP or FTP as the Service Type, this option allows you to configure the regular expression (regex) required to filter the list of files specified in the Remote Directory. All matching files are included in the processing.
IBM z/OS mainframe using IBM Security zSecure Audit writes event files using the pattern RACF.<timestamp>.gz
The FTP file pattern you specify must match the name you assigned to your event files. For example, to collect files starting with zOS and ending with .gz, type the following:
RACF.*\.gz
Use of this parameter requires knowledge of regular expressions (regex). For more information, see the following website: http://download.oracle.com/javase/tutorial/essential/regex/
FTP Transfer Mode This option only displays if you select FTP as the Service Type.
The binary transfer mode is required for event files stored in a binary or compressed format, such as zip, gzip, tar, or tar+gzip archive files.
SCP Remote File If you select SCP as the Service Type you must type the file name of the remote file.
Start Time Type the time of day you want the processing to begin. For example, type 00:00 to schedule the Log File protocol to collect event files at midnight.
This parameter functions with the Recurrence value to establish when and how often the Remote Directory is scanned for files. Type the start time, based on a 24 hour clock, in the following format: HH:MM.
Recurrence Type the frequency, beginning at the Start Time, that you want the remote directory to be scanned. Type this value in hours (H), minutes (M), or days (D).
For example, type 2H if you want the remote directory to be scanned every 2 hours from the start time. The default is 1H.
Run On Save Select this check box if you want the log file protocol to run immediately after you click Save.
After the Run On Save completes, the log file protocol follows your configured start time and recurrence schedule.
Selecting Run On Save clears the list of previously processed files for the Ignore Previously Processed File parameter.
EPS Throttle Type the number of Events Per Second (EPS) that you do not want this protocol to exceed. The valid range is 100 to 5000.
Table 11-6 IBM RACF Log File Parameters (continued)
Parameter Description
Configuring DSMs

IBM RACF 275
Step 11 Click Save.
Step 12 On the Admin tab, click Deploy Changes.
The IBM RACF configuration is complete. If your IBM RACF requires custom event properties, see the STRM Custom Event Properties for IBM z/OS technical note.
Integrating IBM RACFwith STRM Using
Audit Scripts
The IBM Resource Access Control Facility (RACF®) DSM for STRM allows you to integrate with an IBM z/OS mainframe using IBM RACF for auditing transactions. STRM records all relevant and available information from the event.
To integrate the IBM RACF events into STRM:
1 The IBM mainframe system records all security events as Service Management Framework (SMF) records in a live repository.
2 At midnight, the IBM RACF data is extracted from the live repository using the SMF dump utility. The RACFICE utility IRRADU00 (an IBM utility) creates a log file containing all of the events and fields from the previous day in raw SMF record format.
Processor From the list box, select gzip.
Processors allow event file archives to be expanded and contents processed for events. Files are only processed after they are downloaded to STRM. STRM can process files in zip, gzip, tar, or tar+gzip archive format.
Ignore Previously Processed File(s)
Select this check box to track and ignore files that have already been processed by the log file protocol.
STRM examines the log files in the remote directory to determine if a file has been previously processed by the log file protocol. If a previously processed file is detected, the log file protocol does not download the file for processing. All files that have not been previously processed are downloaded.
This option only applies to FTP and SFTP Service Types.
Change Local Directory?
Select this check box to define a local directory on your STRM for storing downloaded files during processing.
We recommend that you leave this check box clear. When this check box is selected, the Local Directory field is displayed, which allows you to configure the local directory to use for storing files.
Event Generator From the Event Generator list box, select LineByLine.
The Event Generator applies additional processing to the retrieved event files. Each line of the file is a single event. For example, if a file has 10 lines of text, 10 separate events are created.
Table 11-6 IBM RACF Log File Parameters (continued)
Parameter Description
Configuring DSMs
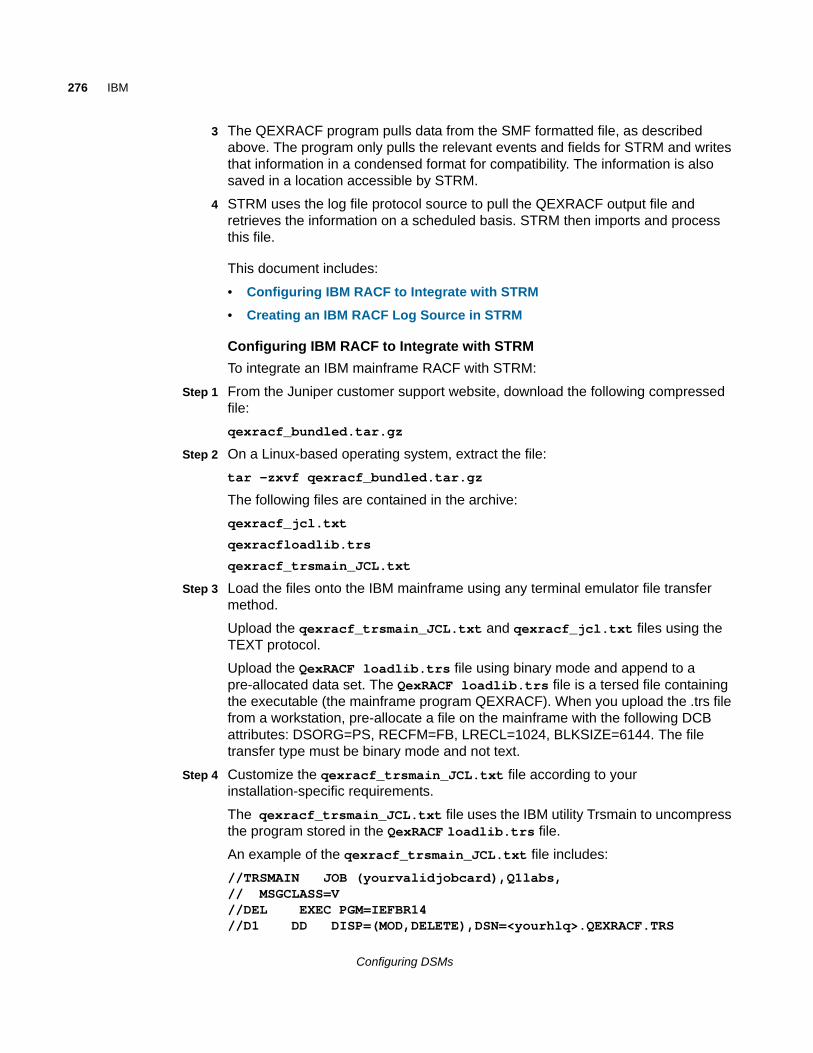
276 IBM
3 The QEXRACF program pulls data from the SMF formatted file, as described above. The program only pulls the relevant events and fields for STRM and writes that information in a condensed format for compatibility. The information is also saved in a location accessible by STRM.
4 STRM uses the log file protocol source to pull the QEXRACF output file and retrieves the information on a scheduled basis. STRM then imports and process this file.
This document includes:
• Configuring IBM RACF to Integrate with STRM
• Creating an IBM RACF Log Source in STRM
Configuring IBM RACF to Integrate with STRM
To integrate an IBM mainframe RACF with STRM:
Step 1 From the Juniper customer support website, download the following compressed file:
qexracf_bundled.tar.gz
Step 2 On a Linux-based operating system, extract the file:
tar -zxvf qexracf_bundled.tar.gz
The following files are contained in the archive:
qexracf_jcl.txt
qexracfloadlib.trs
qexracf_trsmain_JCL.txt
Step 3 Load the files onto the IBM mainframe using any terminal emulator file transfer method.
Upload the qexracf_trsmain_JCL.txt and qexracf_jcl.txt files using the TEXT protocol.
Upload the QexRACF loadlib.trs file using binary mode and append to a pre-allocated data set. The QexRACF loadlib.trs file is a tersed file containing the executable (the mainframe program QEXRACF). When you upload the .trs file from a workstation, pre-allocate a file on the mainframe with the following DCB attributes: DSORG=PS, RECFM=FB, LRECL=1024, BLKSIZE=6144. The file transfer type must be binary mode and not text.
Step 4 Customize the qexracf_trsmain_JCL.txt file according to your installation-specific requirements.
The qexracf_trsmain_JCL.txt file uses the IBM utility Trsmain to uncompress the program stored in the QexRACF loadlib.trs file.
An example of the qexracf_trsmain_JCL.txt file includes:
//TRSMAIN JOB (yourvalidjobcard),Q1labs, // MSGCLASS=V//DEL EXEC PGM=IEFBR14//D1 DD DISP=(MOD,DELETE),DSN=<yourhlq>.QEXRACF.TRS
Configuring DSMs
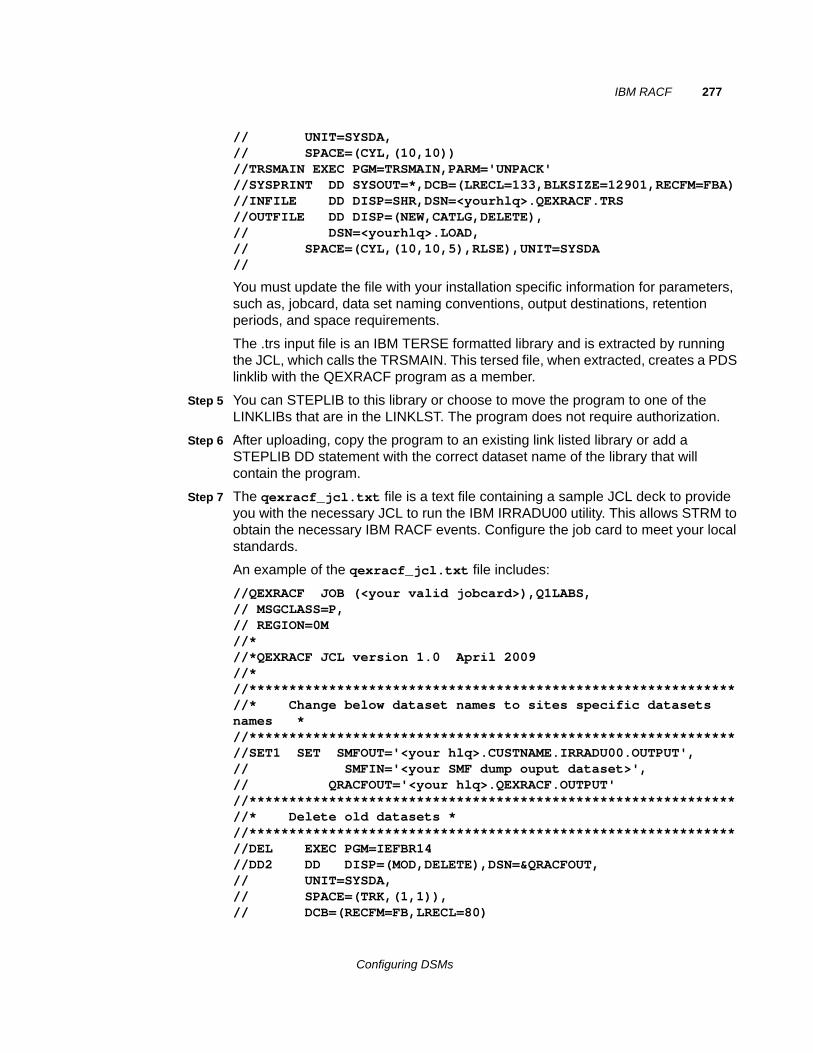
IBM RACF 277
// UNIT=SYSDA,// SPACE=(CYL,(10,10))//TRSMAIN EXEC PGM=TRSMAIN,PARM='UNPACK' //SYSPRINT DD SYSOUT=*,DCB=(LRECL=133,BLKSIZE=12901,RECFM=FBA)//INFILE DD DISP=SHR,DSN=<yourhlq>.QEXRACF.TRS//OUTFILE DD DISP=(NEW,CATLG,DELETE),// DSN=<yourhlq>.LOAD, // SPACE=(CYL,(10,10,5),RLSE),UNIT=SYSDA//
You must update the file with your installation specific information for parameters, such as, jobcard, data set naming conventions, output destinations, retention periods, and space requirements.
The .trs input file is an IBM TERSE formatted library and is extracted by running the JCL, which calls the TRSMAIN. This tersed file, when extracted, creates a PDS linklib with the QEXRACF program as a member.
Step 5 You can STEPLIB to this library or choose to move the program to one of the LINKLIBs that are in the LINKLST. The program does not require authorization.
Step 6 After uploading, copy the program to an existing link listed library or add a STEPLIB DD statement with the correct dataset name of the library that will contain the program.
Step 7 The qexracf_jcl.txt file is a text file containing a sample JCL deck to provide you with the necessary JCL to run the IBM IRRADU00 utility. This allows STRM to obtain the necessary IBM RACF events. Configure the job card to meet your local standards.
An example of the qexracf_jcl.txt file includes:
//QEXRACF JOB (<your valid jobcard>),Q1LABS,// MSGCLASS=P,// REGION=0M//*//*QEXRACF JCL version 1.0 April 2009//*//*************************************************************//* Change below dataset names to sites specific datasets names *//*************************************************************//SET1 SET SMFOUT='<your hlq>.CUSTNAME.IRRADU00.OUTPUT',// SMFIN='<your SMF dump ouput dataset>',// QRACFOUT='<your hlq>.QEXRACF.OUTPUT'//*************************************************************//* Delete old datasets *//*************************************************************//DEL EXEC PGM=IEFBR14//DD2 DD DISP=(MOD,DELETE),DSN=&QRACFOUT,// UNIT=SYSDA,// SPACE=(TRK,(1,1)),// DCB=(RECFM=FB,LRECL=80)
Configuring DSMs
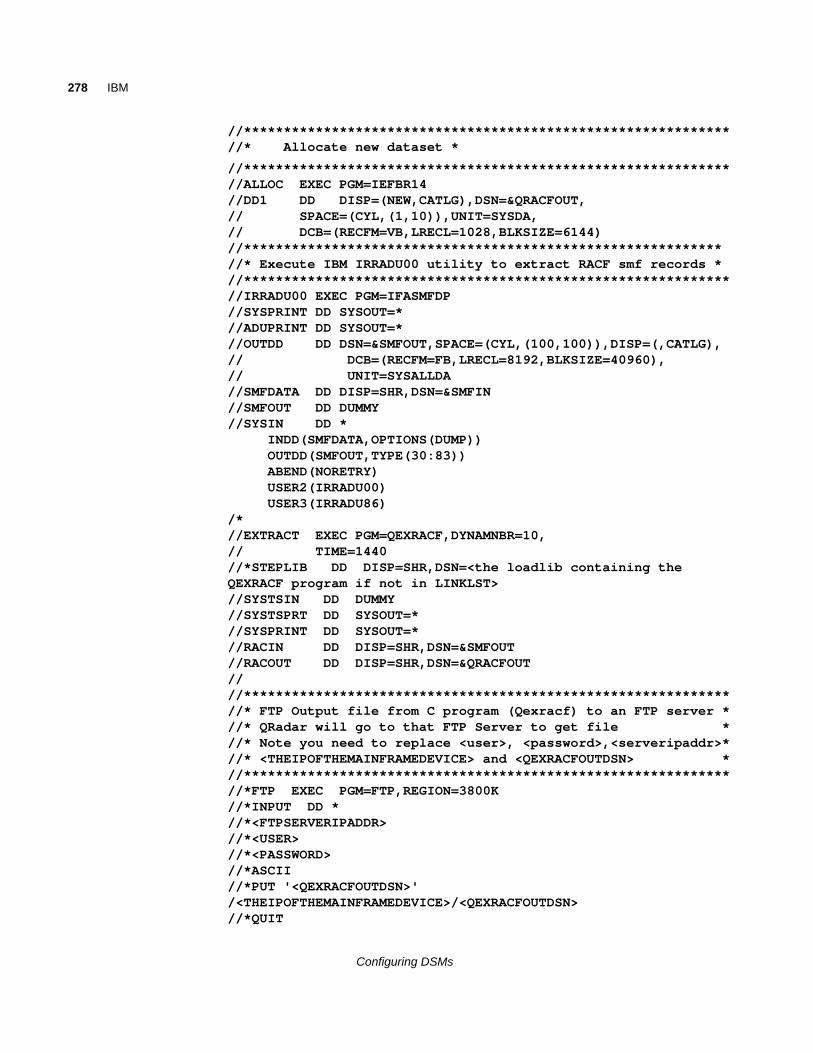
278 IBM
//*************************************************************//* Allocate new dataset *
//*************************************************************//ALLOC EXEC PGM=IEFBR14//DD1 DD DISP=(NEW,CATLG),DSN=&QRACFOUT,// SPACE=(CYL,(1,10)),UNIT=SYSDA,// DCB=(RECFM=VB,LRECL=1028,BLKSIZE=6144)//************************************************************//* Execute IBM IRRADU00 utility to extract RACF smf records *//*************************************************************//IRRADU00 EXEC PGM=IFASMFDP//SYSPRINT DD SYSOUT=*//ADUPRINT DD SYSOUT=*//OUTDD DD DSN=&SMFOUT,SPACE=(CYL,(100,100)),DISP=(,CATLG),// DCB=(RECFM=FB,LRECL=8192,BLKSIZE=40960),// UNIT=SYSALLDA//SMFDATA DD DISP=SHR,DSN=&SMFIN//SMFOUT DD DUMMY//SYSIN DD *
INDD(SMFDATA,OPTIONS(DUMP))OUTDD(SMFOUT,TYPE(30:83))ABEND(NORETRY)USER2(IRRADU00)USER3(IRRADU86)
/*//EXTRACT EXEC PGM=QEXRACF,DYNAMNBR=10,// TIME=1440//*STEPLIB DD DISP=SHR,DSN=<the loadlib containing the QEXRACF program if not in LINKLST>//SYSTSIN DD DUMMY//SYSTSPRT DD SYSOUT=*//SYSPRINT DD SYSOUT=*//RACIN DD DISP=SHR,DSN=&SMFOUT//RACOUT DD DISP=SHR,DSN=&QRACFOUT////*************************************************************//* FTP Output file from C program (Qexracf) to an FTP server *//* QRadar will go to that FTP Server to get file *//* Note you need to replace <user>, <password>,<serveripaddr>*//* <THEIPOFTHEMAINFRAMEDEVICE> and <QEXRACFOUTDSN> *//*************************************************************//*FTP EXEC PGM=FTP,REGION=3800K//*INPUT DD *//*<FTPSERVERIPADDR>//*<USER>//*<PASSWORD>//*ASCII//*PUT '<QEXRACFOUTDSN>' /<THEIPOFTHEMAINFRAMEDEVICE>/<QEXRACFOUTDSN>//*QUIT
Configuring DSMs
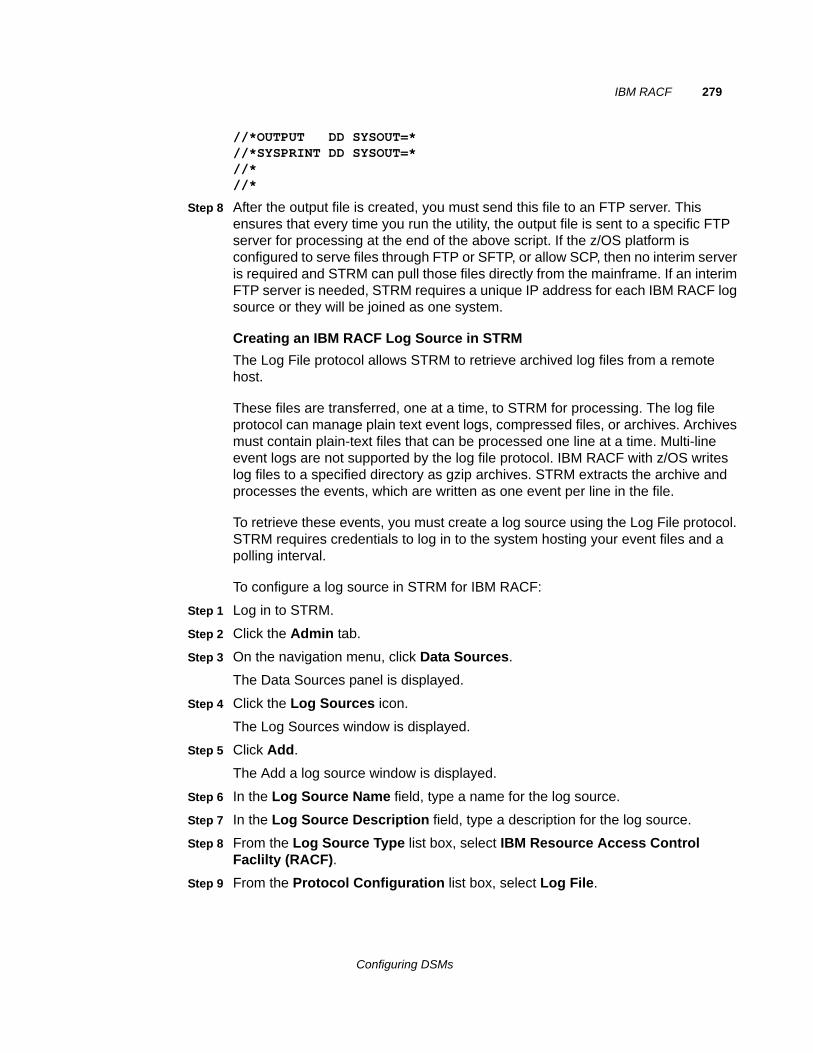
IBM RACF 279
//*OUTPUT DD SYSOUT=*//*SYSPRINT DD SYSOUT=*//*//*
Step 8 After the output file is created, you must send this file to an FTP server. This ensures that every time you run the utility, the output file is sent to a specific FTP server for processing at the end of the above script. If the z/OS platform is configured to serve files through FTP or SFTP, or allow SCP, then no interim server is required and STRM can pull those files directly from the mainframe. If an interim FTP server is needed, STRM requires a unique IP address for each IBM RACF log source or they will be joined as one system.
Creating an IBM RACF Log Source in STRM
The Log File protocol allows STRM to retrieve archived log files from a remote host.
These files are transferred, one at a time, to STRM for processing. The log file protocol can manage plain text event logs, compressed files, or archives. Archives must contain plain-text files that can be processed one line at a time. Multi-line event logs are not supported by the log file protocol. IBM RACF with z/OS writes log files to a specified directory as gzip archives. STRM extracts the archive and processes the events, which are written as one event per line in the file.
To retrieve these events, you must create a log source using the Log File protocol. STRM requires credentials to log in to the system hosting your event files and a polling interval.
To configure a log source in STRM for IBM RACF:
Step 1 Log in to STRM.
Step 2 Click the Admin tab.
Step 3 On the navigation menu, click Data Sources.
The Data Sources panel is displayed.
Step 4 Click the Log Sources icon.
The Log Sources window is displayed.
Step 5 Click Add.
The Add a log source window is displayed.
Step 6 In the Log Source Name field, type a name for the log source.
Step 7 In the Log Source Description field, type a description for the log source.
Step 8 From the Log Source Type list box, select IBM Resource Access Control Faclilty (RACF).
Step 9 From the Protocol Configuration list box, select Log File.
Configuring DSMs
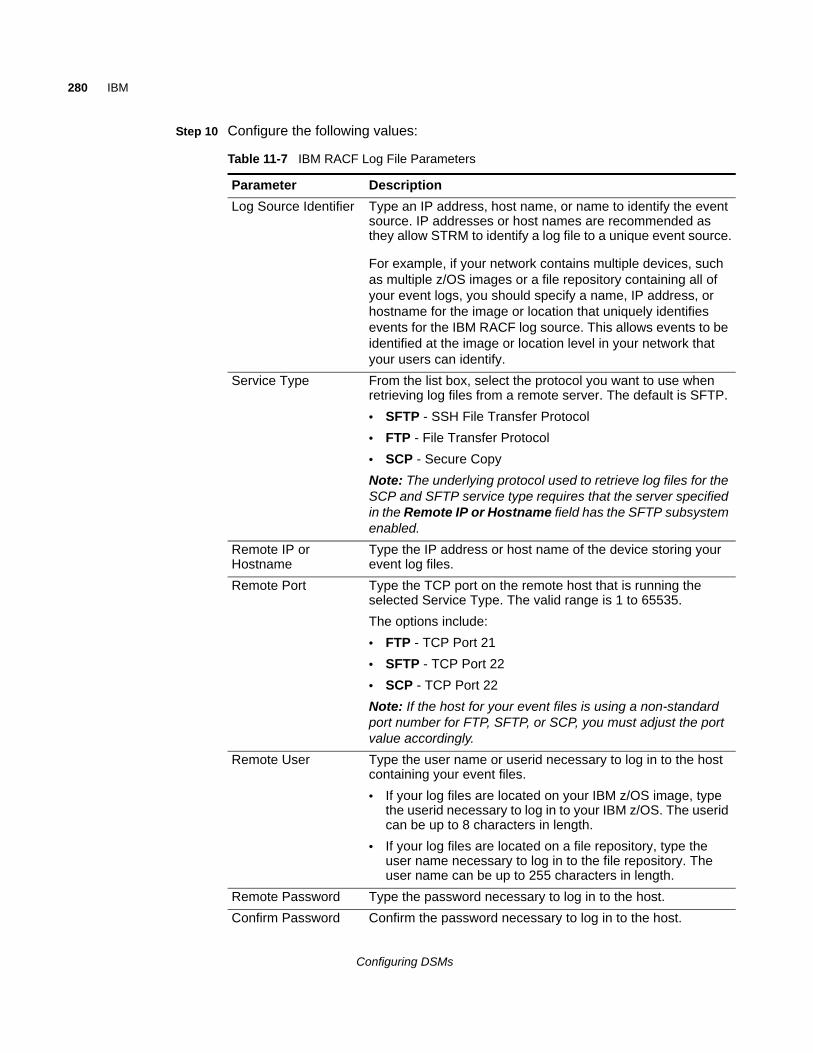
280 IBM
Step 10 Configure the following values:
Table 11-7 IBM RACF Log File Parameters
Parameter Description
Log Source Identifier Type an IP address, host name, or name to identify the event source. IP addresses or host names are recommended as they allow STRM to identify a log file to a unique event source.
For example, if your network contains multiple devices, such as multiple z/OS images or a file repository containing all of your event logs, you should specify a name, IP address, or hostname for the image or location that uniquely identifies events for the IBM RACF log source. This allows events to be identified at the image or location level in your network that your users can identify.
Service Type From the list box, select the protocol you want to use when retrieving log files from a remote server. The default is SFTP.
• SFTP - SSH File Transfer Protocol
• FTP - File Transfer Protocol
• SCP - Secure Copy
Note: The underlying protocol used to retrieve log files for the SCP and SFTP service type requires that the server specified in the Remote IP or Hostname field has the SFTP subsystem enabled.
Remote IP or Hostname
Type the IP address or host name of the device storing your event log files.
Remote Port Type the TCP port on the remote host that is running the selected Service Type. The valid range is 1 to 65535.
The options include:
• FTP - TCP Port 21
• SFTP - TCP Port 22
• SCP - TCP Port 22
Note: If the host for your event files is using a non-standard port number for FTP, SFTP, or SCP, you must adjust the port value accordingly.
Remote User Type the user name or userid necessary to log in to the host containing your event files.
• If your log files are located on your IBM z/OS image, type the userid necessary to log in to your IBM z/OS. The userid can be up to 8 characters in length.
• If your log files are located on a file repository, type the user name necessary to log in to the file repository. The user name can be up to 255 characters in length.
Remote Password Type the password necessary to log in to the host.
Confirm Password Confirm the password necessary to log in to the host.
Configuring DSMs
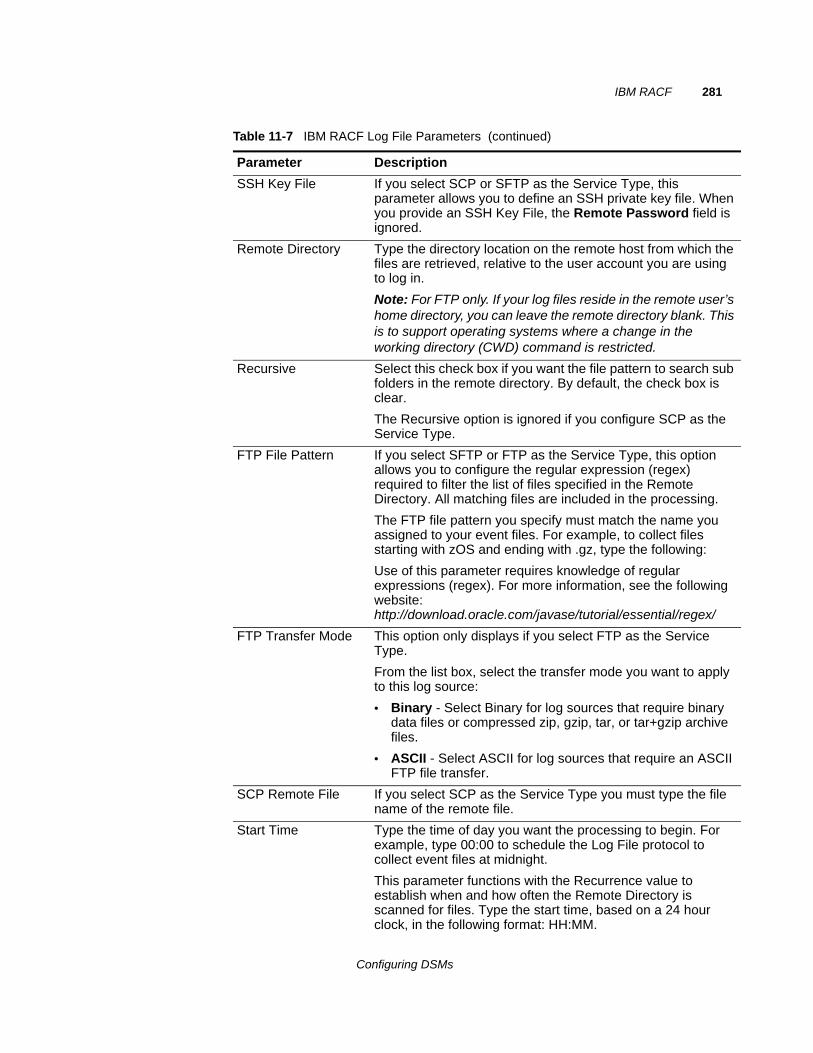
IBM RACF 281
SSH Key File If you select SCP or SFTP as the Service Type, this parameter allows you to define an SSH private key file. When you provide an SSH Key File, the Remote Password field is ignored.
Remote Directory Type the directory location on the remote host from which the files are retrieved, relative to the user account you are using to log in.
Note: For FTP only. If your log files reside in the remote user’s home directory, you can leave the remote directory blank. This is to support operating systems where a change in the working directory (CWD) command is restricted.
Recursive Select this check box if you want the file pattern to search sub folders in the remote directory. By default, the check box is clear.
The Recursive option is ignored if you configure SCP as the Service Type.
FTP File Pattern If you select SFTP or FTP as the Service Type, this option allows you to configure the regular expression (regex) required to filter the list of files specified in the Remote Directory. All matching files are included in the processing.
The FTP file pattern you specify must match the name you assigned to your event files. For example, to collect files starting with zOS and ending with .gz, type the following:
Use of this parameter requires knowledge of regular expressions (regex). For more information, see the following website: http://download.oracle.com/javase/tutorial/essential/regex/
FTP Transfer Mode This option only displays if you select FTP as the Service Type.
From the list box, select the transfer mode you want to apply to this log source:
• Binary - Select Binary for log sources that require binary data files or compressed zip, gzip, tar, or tar+gzip archive files.
• ASCII - Select ASCII for log sources that require an ASCII FTP file transfer.
SCP Remote File If you select SCP as the Service Type you must type the file name of the remote file.
Start Time Type the time of day you want the processing to begin. For example, type 00:00 to schedule the Log File protocol to collect event files at midnight.
This parameter functions with the Recurrence value to establish when and how often the Remote Directory is scanned for files. Type the start time, based on a 24 hour clock, in the following format: HH:MM.
Table 11-7 IBM RACF Log File Parameters (continued)
Parameter Description
Configuring DSMs
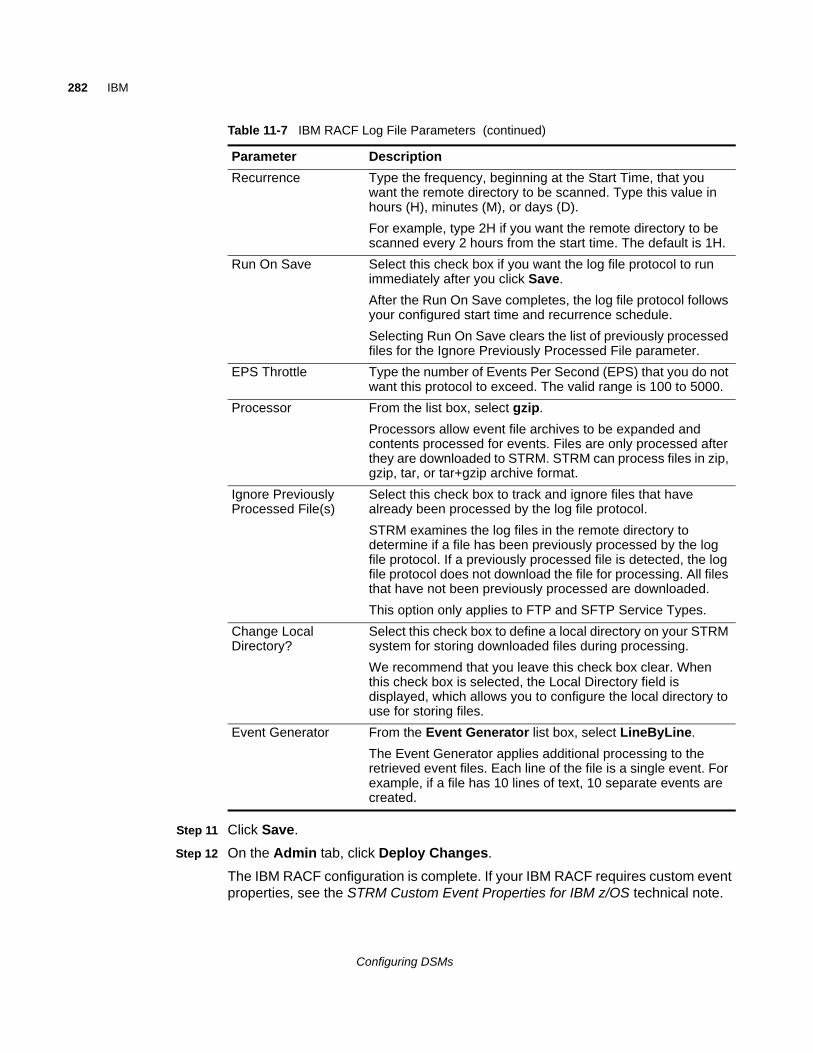
282 IBM
Step 11 Click Save.
Step 12 On the Admin tab, click Deploy Changes.
The IBM RACF configuration is complete. If your IBM RACF requires custom event properties, see the STRM Custom Event Properties for IBM z/OS technical note.
Recurrence Type the frequency, beginning at the Start Time, that you want the remote directory to be scanned. Type this value in hours (H), minutes (M), or days (D).
For example, type 2H if you want the remote directory to be scanned every 2 hours from the start time. The default is 1H.
Run On Save Select this check box if you want the log file protocol to run immediately after you click Save.
After the Run On Save completes, the log file protocol follows your configured start time and recurrence schedule.
Selecting Run On Save clears the list of previously processed files for the Ignore Previously Processed File parameter.
EPS Throttle Type the number of Events Per Second (EPS) that you do not want this protocol to exceed. The valid range is 100 to 5000.
Processor From the list box, select gzip.
Processors allow event file archives to be expanded and contents processed for events. Files are only processed after they are downloaded to STRM. STRM can process files in zip, gzip, tar, or tar+gzip archive format.
Ignore Previously Processed File(s)
Select this check box to track and ignore files that have already been processed by the log file protocol.
STRM examines the log files in the remote directory to determine if a file has been previously processed by the log file protocol. If a previously processed file is detected, the log file protocol does not download the file for processing. All files that have not been previously processed are downloaded.
This option only applies to FTP and SFTP Service Types.
Change Local Directory?
Select this check box to define a local directory on your STRM system for storing downloaded files during processing.
We recommend that you leave this check box clear. When this check box is selected, the Local Directory field is displayed, which allows you to configure the local directory to use for storing files.
Event Generator From the Event Generator list box, select LineByLine.
The Event Generator applies additional processing to the retrieved event files. Each line of the file is a single event. For example, if a file has 10 lines of text, 10 separate events are created.
Table 11-7 IBM RACF Log File Parameters (continued)
Parameter Description
Configuring DSMs
IBM DB2 283
IBM DB2 STRM has two options for integrating events from IBM DB2®:
• Integrating IBM DB2 with LEEF Events
• Integrating IBM DB2 Audit Events
Integrating IBM DB2with LEEF Events
The IBM DB2 DSM allows you to integrate DB2 events in LEEF format from an IBM z/OS® mainframe using IBM Security zSecure®. Using a zSecure process, events from the System Management Facilities (SMF) are recorded to an event file in the Log Enhanced Event format (LEEF). STRM retrieves the LEEF event log files using the log file protocol and processes the events. You can schedule STRM to retrieve events on a polling interval, which allows you to retrieve the events on the schedule you have defined.
To integrate IBM DB2 events:
1 Confirm your installation meets any prerequisite installation requirements. For more information, see Before You Begin.
2 Configure your IBM DB2 image to write events in LEEF format. For more information, see the IBM Security zSecure Suite: CARLa-Driven Components Installation and Deployment Guide.
3 Create a log source in STRM for IBM DB2 to retrieve your LEEF formatted event logs. For more information, see Creating an IBM DB2 Log Source in STRM.
4 Optional. Create a custom event property for IBM DB2 in STRM. For more information, see the STRM Custom Event Properties for IBM z/OS technical note.
Before You Begin Before you can configure the data collection process, you must complete the basic zSecure installation process. After installing the software, you must also perform the post-installation activities to create and modify the configuration.
The following prerequisites are required:
• You must ensure parmlib member IFAPRDxx is not disabled for IBM Security zSecure Audit on your IBM DB2 z/OS image.
• The SCKRLOAD library must be APF-authorized.
• You must configure a process to periodically refresh your CKFREEZE and UNLOAD data sets.
• You must configure an SFTP, FTP, or SCP server on your z/OS image for STRM to download your LEEF event files.
• You must allow SFTP, FTP, or SCP traffic on firewalls located between STRM and your z/OS image.
For instructions on installing and configuring zSecure, see the IBM Security zSecure Suite: CARLa-Driven Components Installation and Deployment Guide.
Configuring DSMs
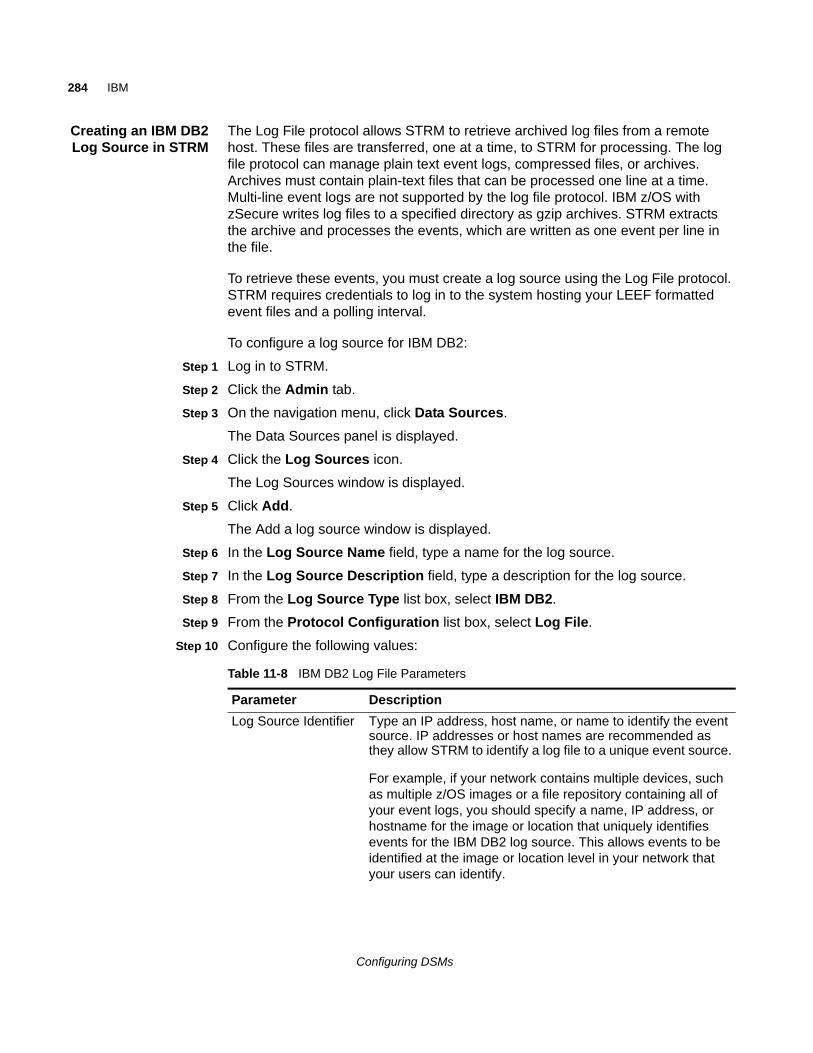
284 IBM
Creating an IBM DB2Log Source in STRM
The Log File protocol allows STRM to retrieve archived log files from a remote host. These files are transferred, one at a time, to STRM for processing. The log file protocol can manage plain text event logs, compressed files, or archives. Archives must contain plain-text files that can be processed one line at a time. Multi-line event logs are not supported by the log file protocol. IBM z/OS with zSecure writes log files to a specified directory as gzip archives. STRM extracts the archive and processes the events, which are written as one event per line in the file.
To retrieve these events, you must create a log source using the Log File protocol. STRM requires credentials to log in to the system hosting your LEEF formatted event files and a polling interval.
To configure a log source for IBM DB2:
Step 1 Log in to STRM.
Step 2 Click the Admin tab.
Step 3 On the navigation menu, click Data Sources.
The Data Sources panel is displayed.
Step 4 Click the Log Sources icon.
The Log Sources window is displayed.
Step 5 Click Add.
The Add a log source window is displayed.
Step 6 In the Log Source Name field, type a name for the log source.
Step 7 In the Log Source Description field, type a description for the log source.
Step 8 From the Log Source Type list box, select IBM DB2.
Step 9 From the Protocol Configuration list box, select Log File.
Step 10 Configure the following values:
Table 11-8 IBM DB2 Log File Parameters
Parameter Description
Log Source Identifier Type an IP address, host name, or name to identify the event source. IP addresses or host names are recommended as they allow STRM to identify a log file to a unique event source.
For example, if your network contains multiple devices, such as multiple z/OS images or a file repository containing all of your event logs, you should specify a name, IP address, or hostname for the image or location that uniquely identifies events for the IBM DB2 log source. This allows events to be identified at the image or location level in your network that your users can identify.
Configuring DSMs
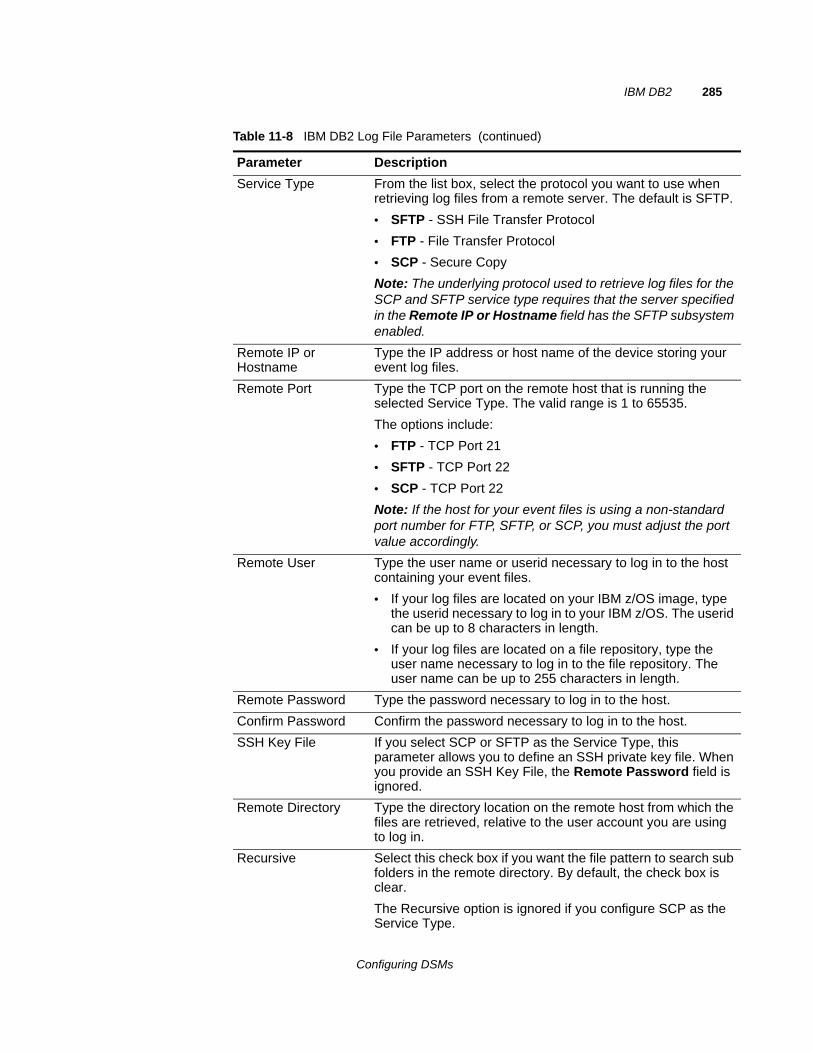
IBM DB2 285
Service Type From the list box, select the protocol you want to use when retrieving log files from a remote server. The default is SFTP.
• SFTP - SSH File Transfer Protocol
• FTP - File Transfer Protocol
• SCP - Secure Copy
Note: The underlying protocol used to retrieve log files for the SCP and SFTP service type requires that the server specified in the Remote IP or Hostname field has the SFTP subsystem enabled.
Remote IP or Hostname
Type the IP address or host name of the device storing your event log files.
Remote Port Type the TCP port on the remote host that is running the selected Service Type. The valid range is 1 to 65535.
The options include:
• FTP - TCP Port 21
• SFTP - TCP Port 22
• SCP - TCP Port 22
Note: If the host for your event files is using a non-standard port number for FTP, SFTP, or SCP, you must adjust the port value accordingly.
Remote User Type the user name or userid necessary to log in to the host containing your event files.
• If your log files are located on your IBM z/OS image, type the userid necessary to log in to your IBM z/OS. The userid can be up to 8 characters in length.
• If your log files are located on a file repository, type the user name necessary to log in to the file repository. The user name can be up to 255 characters in length.
Remote Password Type the password necessary to log in to the host.
Confirm Password Confirm the password necessary to log in to the host.
SSH Key File If you select SCP or SFTP as the Service Type, this parameter allows you to define an SSH private key file. When you provide an SSH Key File, the Remote Password field is ignored.
Remote Directory Type the directory location on the remote host from which the files are retrieved, relative to the user account you are using to log in.
Recursive Select this check box if you want the file pattern to search sub folders in the remote directory. By default, the check box is clear.
The Recursive option is ignored if you configure SCP as the Service Type.
Table 11-8 IBM DB2 Log File Parameters (continued)
Parameter Description
Configuring DSMs
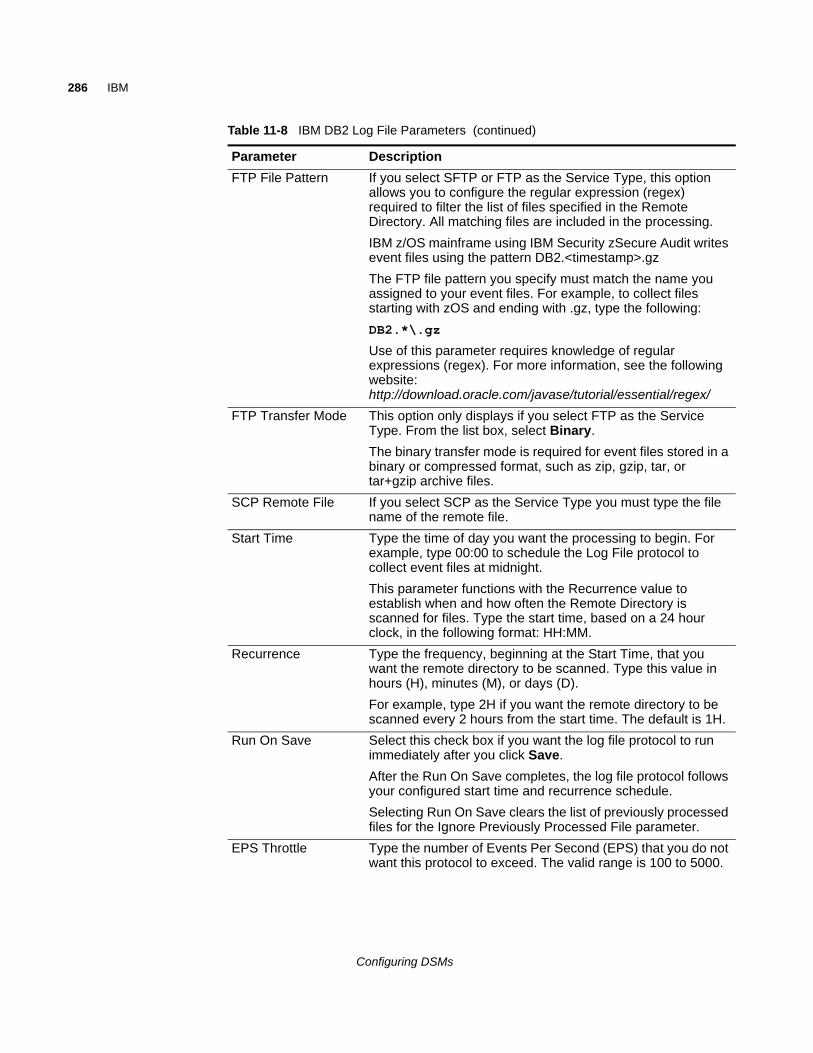
286 IBM
FTP File Pattern If you select SFTP or FTP as the Service Type, this option allows you to configure the regular expression (regex) required to filter the list of files specified in the Remote Directory. All matching files are included in the processing.
IBM z/OS mainframe using IBM Security zSecure Audit writes event files using the pattern DB2.<timestamp>.gz
The FTP file pattern you specify must match the name you assigned to your event files. For example, to collect files starting with zOS and ending with .gz, type the following:
DB2.*\.gz
Use of this parameter requires knowledge of regular expressions (regex). For more information, see the following website: http://download.oracle.com/javase/tutorial/essential/regex/
FTP Transfer Mode This option only displays if you select FTP as the Service Type. From the list box, select Binary.
The binary transfer mode is required for event files stored in a binary or compressed format, such as zip, gzip, tar, or tar+gzip archive files.
SCP Remote File If you select SCP as the Service Type you must type the file name of the remote file.
Start Time Type the time of day you want the processing to begin. For example, type 00:00 to schedule the Log File protocol to collect event files at midnight.
This parameter functions with the Recurrence value to establish when and how often the Remote Directory is scanned for files. Type the start time, based on a 24 hour clock, in the following format: HH:MM.
Recurrence Type the frequency, beginning at the Start Time, that you want the remote directory to be scanned. Type this value in hours (H), minutes (M), or days (D).
For example, type 2H if you want the remote directory to be scanned every 2 hours from the start time. The default is 1H.
Run On Save Select this check box if you want the log file protocol to run immediately after you click Save.
After the Run On Save completes, the log file protocol follows your configured start time and recurrence schedule.
Selecting Run On Save clears the list of previously processed files for the Ignore Previously Processed File parameter.
EPS Throttle Type the number of Events Per Second (EPS) that you do not want this protocol to exceed. The valid range is 100 to 5000.
Table 11-8 IBM DB2 Log File Parameters (continued)
Parameter Description
Configuring DSMs
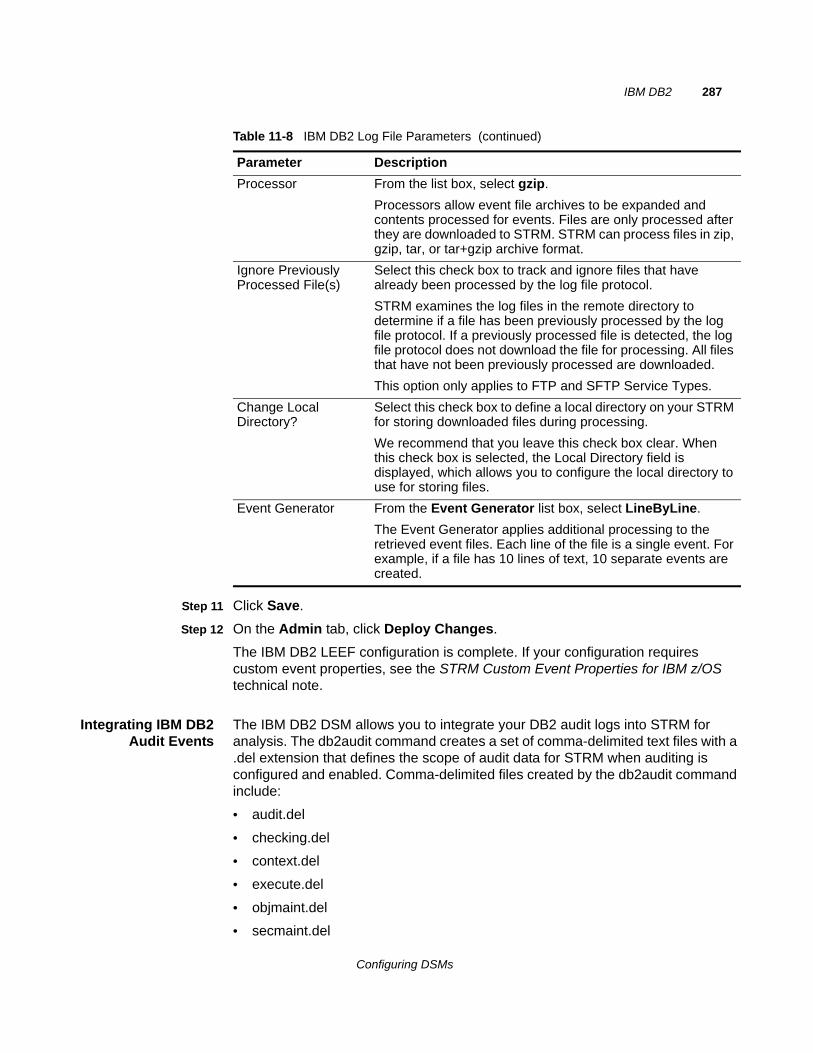
IBM DB2 287
Step 11 Click Save.
Step 12 On the Admin tab, click Deploy Changes.
The IBM DB2 LEEF configuration is complete. If your configuration requires custom event properties, see the STRM Custom Event Properties for IBM z/OS technical note.
Integrating IBM DB2Audit Events
The IBM DB2 DSM allows you to integrate your DB2 audit logs into STRM for analysis. The db2audit command creates a set of comma-delimited text files with a .del extension that defines the scope of audit data for STRM when auditing is configured and enabled. Comma-delimited files created by the db2audit command include:
• audit.del
• checking.del
• context.del
• execute.del
• objmaint.del
• secmaint.del
Processor From the list box, select gzip.
Processors allow event file archives to be expanded and contents processed for events. Files are only processed after they are downloaded to STRM. STRM can process files in zip, gzip, tar, or tar+gzip archive format.
Ignore Previously Processed File(s)
Select this check box to track and ignore files that have already been processed by the log file protocol.
STRM examines the log files in the remote directory to determine if a file has been previously processed by the log file protocol. If a previously processed file is detected, the log file protocol does not download the file for processing. All files that have not been previously processed are downloaded.
This option only applies to FTP and SFTP Service Types.
Change Local Directory?
Select this check box to define a local directory on your STRM for storing downloaded files during processing.
We recommend that you leave this check box clear. When this check box is selected, the Local Directory field is displayed, which allows you to configure the local directory to use for storing files.
Event Generator From the Event Generator list box, select LineByLine.
The Event Generator applies additional processing to the retrieved event files. Each line of the file is a single event. For example, if a file has 10 lines of text, 10 separate events are created.
Table 11-8 IBM DB2 Log File Parameters (continued)
Parameter Description
Configuring DSMs
288 IBM
• sysadmin.del
• validate.del
To integrate the IBM DB2 DSM with STRM, you must:
Step 1 Use the db2audit command to ensure the IBM DB2 records security events. See your IBM DB2 vendor documentation for more information.
Step 2 Extract the DB2 audit data of events contained in the instance to a log file, depending on your version of IBM DB2:
• If you are using DB2 v9.5 and above, see Extracting Audit Data: DB2 v9.5 and Above.
• If you are using DB2 v8.x to v9.4, see Extracting Audit Data: DB2 v8.x to v9.4
Step 3 Use the log file protocol source to pull the output instance log file and send that information back to STRM on a scheduled basis. STRM then imports and processes this file. See Creating an IBM DB2 Log Source in STRM.
NOTEThe IBM DB2 DSM does not support the IBM z/OS mainframe operating system.
Extracting Audit Data: DB2 v9.5 and Above
To extract audit data when you are using IBM DB2 v9.5 and above:
Step 1 Log into a DB2 account with SYSADMIN privilege.
Step 2 Move the audit records from the database instance to the audit log:
db2audit flush
For example, the flush command response might resemble the following:
AUD00001 Operation succeeded.
Step 3 Archive and move the active instance to a new location for future extraction:
db2audit archive
For example, an archive command response might resemble the following:
Node AUD Archived or Interim Log FileMessage---- --- ------------------------------0 AUD00001 dbsaudit.instance.log.0.20091217125028AUD00001 Operation succeeded.
NOTEIn DB2 v9.5 and above, the archive command replaces the prune command. The archive command moves the active audit log to a new location, effectively pruning all non-active records from the log. An archive command must be complete before an extract can be performed.
Configuring DSMs
IBM DB2 289
Step 4 Extract the data from the archived audit log and write the data to .del files:
db2audit extract delasc from files db2audit.instance.log.0.200912171528
For example, an archive command response might resemble the following:
AUD00001 Operation succeeded.
NOTEDouble-quotation marks (“) are used as the default text delimiter in the ASCII files, do not change the delimiter.
Step 5 Move the .del files to a storage location where STRM can pull the file. The movement of the comma-delimited (.del) files should be synchronized with the file pull interval in STRM.
You are now ready to configure STRM to receive DB2 log files. See Creating an IBM DB2 Log Source in STRM.
Extracting Audit Data: DB2 v8.x to v9.4
To extract audit data when you are using IBM DB2 v8.x to v9.4.
Step 1 Log into a DB2 account with SYSADMIN privilege.
Step 2 Type the following start command to audit a database instance:
db2audit start
For example, the start command response might resemble the following:
AUD00001 Operation succeeded.
Step 3 Move the audit records from the instance to the audit log:
db2audit flush
For example, the flush command response might resemble the following:
AUD00001 Operation succeeded.
Step 4 Extract the data from the archived audit log and write the data to .del files:
db2audit extract delasc
For example, an archive command response might resemble the following:
AUD00001 Operation succeeded.
NOTEDouble-quotation marks (“) are used as the default text delimiter in the ASCII files, do not change the delimiter.
Step 5 Remove non-active records:
db2audit prune all
Step 6 Move the .del files to a storage location where STRM can pull the file. The movement of the comma-delimited (.del) files should be synchronized with the file pull interval in STRM.
Configuring DSMs
290 IBM
You are now ready to create a log source in STRM to receive DB2 log files.
Creating an IBM DB2 Log Source in STRM
A log file protocol source allows STRM to retrieve archived log files from a remote host. The IBM DB2 DSM supports the bulk loading of log files using the log file protocol source.
When configuring your IBM DB2 to use the log file protocol, make sure the hostname or IP address configured in the IBM DB2 system is the same as configured in the Remote Host parameter in the Log File protocol configuration. For more information, see the STRM Log Sources Users Guide.
To configure a log source for IBM DB2:
Step 1 Log in to STRM.
Step 2 Click the Admin tab.
Step 3 On the navigation menu, click Data Sources.
The Data Sources panel is displayed.
Step 4 Click the Log Sources icon.
The Log Sources window is displayed.
Step 5 Click Add.
The Add a log source window is displayed.
Step 6 In the Log Source Name field, type a name for the log source.
Step 7 In the Log Source Description field, type a description for the log source.
Step 8 From the Log Source Type list box, select IBM DB2.
Step 9 From the Protocol Configuration list box, select Log File.
Step 10 Configure the following values:
Table 11-9 IBM DB2 Log File Parameters
Parameter Description
Log Source Identifier Type an IP address, host name, or name to identify the event source. IP addresses or host names are recommended as they allow STRM to identify a log file to a unique event source.
For example, if your network contains multiple devices, such as multiple z/OS images or a file repository containing all of your event logs, you should specify a name, IP address, or hostname for the image or location that uniquely identifies events for the IBM DB2 log source. This allows events to be identified at the image or location level in your network that your users can identify.
Configuring DSMs
IBM DB2 291
Service Type From the list box, select the protocol you want to use when retrieving log files from a remote server. The default is SFTP.
• SFTP - SSH File Transfer Protocol
• FTP - File Transfer Protocol
• SCP - Secure Copy
Note: The underlying protocol used to retrieve log files for the SCP and SFTP service type requires that the server specified in the Remote IP or Hostname field has the SFTP subsystem enabled.
Remote IP or Hostname
Type the IP address or host name of the device storing your event log files.
Remote Port Type the TCP port on the remote host that is running the selected Service Type. The valid range is 1 to 65535.
The options include:
• FTP - TCP Port 21
• SFTP - TCP Port 22
• SCP - TCP Port 22
Note: If the host for your event files is using a non-standard port number for FTP, SFTP, or SCP, you must adjust the port value accordingly.
Remote User Type the user name necessary to log in to the host containing your event files.
The username can be up to 255 characters in length.
Remote Password Type the password necessary to log in to the host.
Confirm Password Confirm the password necessary to log in to the host.
SSH Key File If you select SCP or SFTP as the Service Type, this parameter allows you to define an SSH private key file. When you provide an SSH Key File, the Remote Password field is ignored.
Remote Directory Type the directory location on the remote host from which the files are retrieved, relative to the user account you are using to log in.
Note: For FTP only. If your log files reside in the remote user’s home directory, you can leave the remote directory blank. This is to support operating systems where a change in the working directory (CWD) command is restricted.
Recursive Select this check box if you want the file pattern to search sub folders in the remote directory. By default, the check box is clear.
The Recursive option is ignored if you configure SCP as the Service Type.
Table 11-9 IBM DB2 Log File Parameters (continued)
Parameter Description
Configuring DSMs
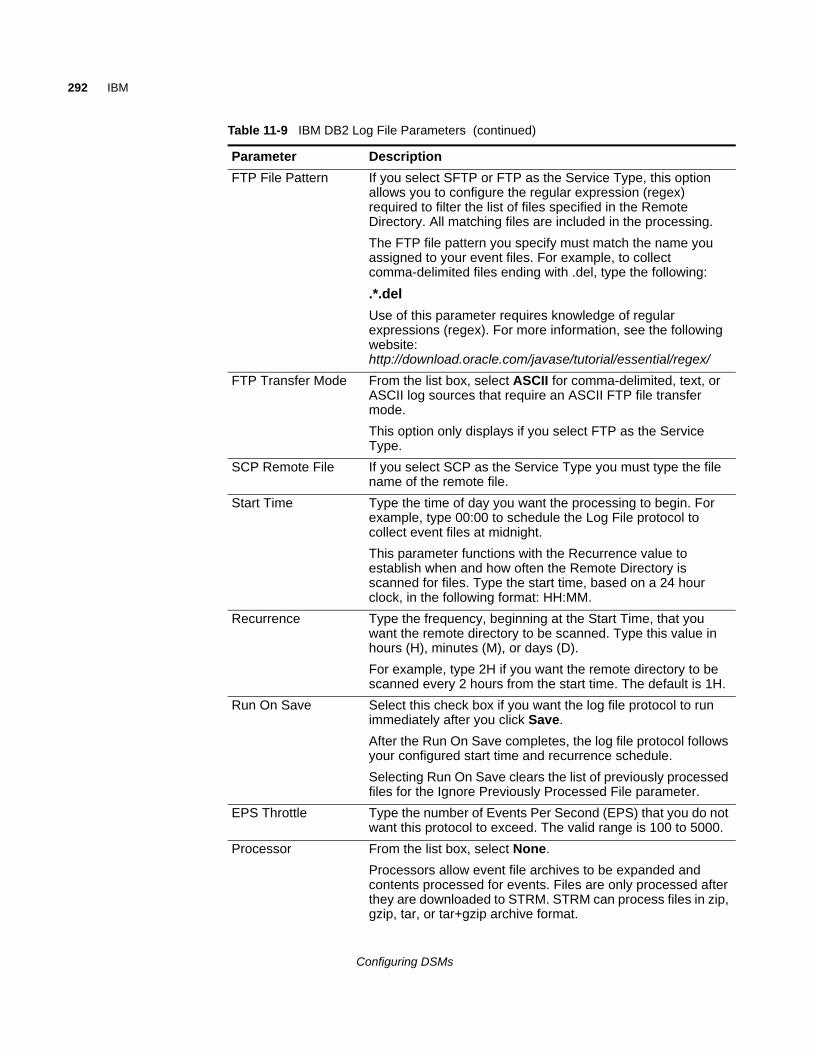
292 IBM
FTP File Pattern If you select SFTP or FTP as the Service Type, this option allows you to configure the regular expression (regex) required to filter the list of files specified in the Remote Directory. All matching files are included in the processing.
The FTP file pattern you specify must match the name you assigned to your event files. For example, to collect comma-delimited files ending with .del, type the following:
.*.del
Use of this parameter requires knowledge of regular expressions (regex). For more information, see the following website: http://download.oracle.com/javase/tutorial/essential/regex/
FTP Transfer Mode From the list box, select ASCII for comma-delimited, text, or ASCII log sources that require an ASCII FTP file transfer mode.
This option only displays if you select FTP as the Service Type.
SCP Remote File If you select SCP as the Service Type you must type the file name of the remote file.
Start Time Type the time of day you want the processing to begin. For example, type 00:00 to schedule the Log File protocol to collect event files at midnight.
This parameter functions with the Recurrence value to establish when and how often the Remote Directory is scanned for files. Type the start time, based on a 24 hour clock, in the following format: HH:MM.
Recurrence Type the frequency, beginning at the Start Time, that you want the remote directory to be scanned. Type this value in hours (H), minutes (M), or days (D).
For example, type 2H if you want the remote directory to be scanned every 2 hours from the start time. The default is 1H.
Run On Save Select this check box if you want the log file protocol to run immediately after you click Save.
After the Run On Save completes, the log file protocol follows your configured start time and recurrence schedule.
Selecting Run On Save clears the list of previously processed files for the Ignore Previously Processed File parameter.
EPS Throttle Type the number of Events Per Second (EPS) that you do not want this protocol to exceed. The valid range is 100 to 5000.
Processor From the list box, select None.
Processors allow event file archives to be expanded and contents processed for events. Files are only processed after they are downloaded to STRM. STRM can process files in zip, gzip, tar, or tar+gzip archive format.
Table 11-9 IBM DB2 Log File Parameters (continued)
Parameter Description
Configuring DSMs
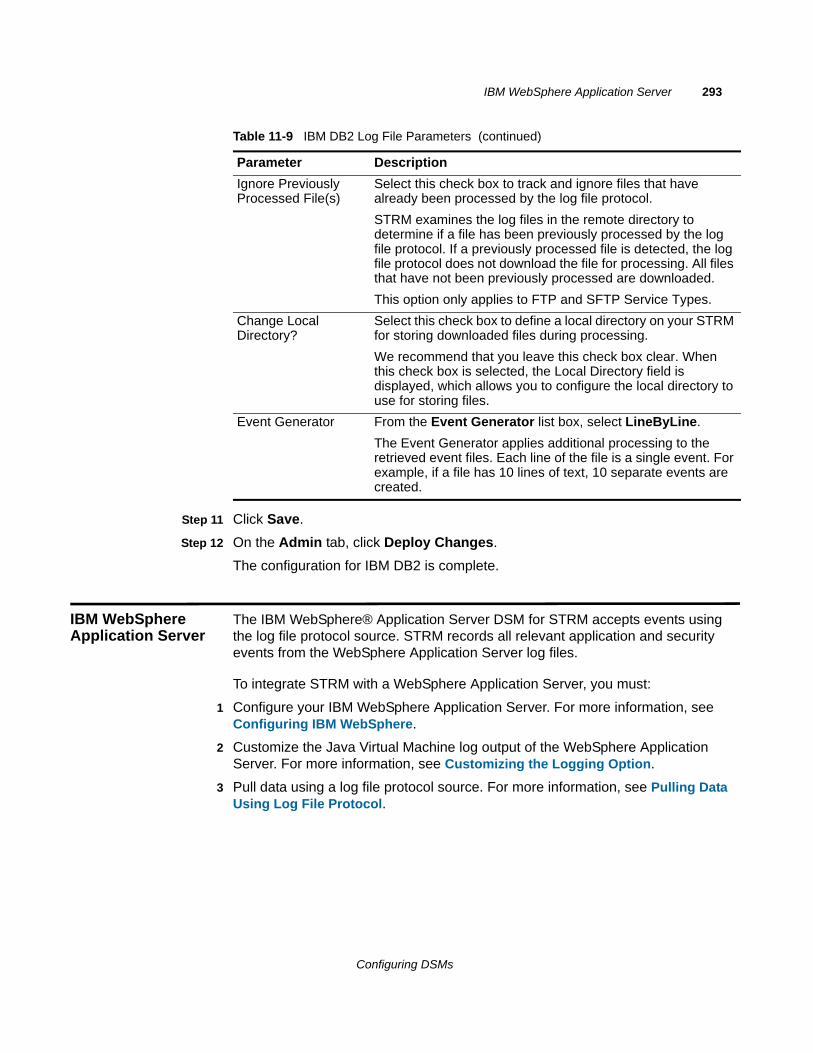
IBM WebSphere Application Server 293
Step 11 Click Save.
Step 12 On the Admin tab, click Deploy Changes.
The configuration for IBM DB2 is complete.
IBM WebSphere Application Server
The IBM WebSphere® Application Server DSM for STRM accepts events using the log file protocol source. STRM records all relevant application and security events from the WebSphere Application Server log files.
To integrate STRM with a WebSphere Application Server, you must:
1 Configure your IBM WebSphere Application Server. For more information, see Configuring IBM WebSphere.
2 Customize the Java Virtual Machine log output of the WebSphere Application Server. For more information, see Customizing the Logging Option.
3 Pull data using a log file protocol source. For more information, see Pulling Data Using Log File Protocol.
Ignore Previously Processed File(s)
Select this check box to track and ignore files that have already been processed by the log file protocol.
STRM examines the log files in the remote directory to determine if a file has been previously processed by the log file protocol. If a previously processed file is detected, the log file protocol does not download the file for processing. All files that have not been previously processed are downloaded.
This option only applies to FTP and SFTP Service Types.
Change Local Directory?
Select this check box to define a local directory on your STRM for storing downloaded files during processing.
We recommend that you leave this check box clear. When this check box is selected, the Local Directory field is displayed, which allows you to configure the local directory to use for storing files.
Event Generator From the Event Generator list box, select LineByLine.
The Event Generator applies additional processing to the retrieved event files. Each line of the file is a single event. For example, if a file has 10 lines of text, 10 separate events are created.
Table 11-9 IBM DB2 Log File Parameters (continued)
Parameter Description
Configuring DSMs
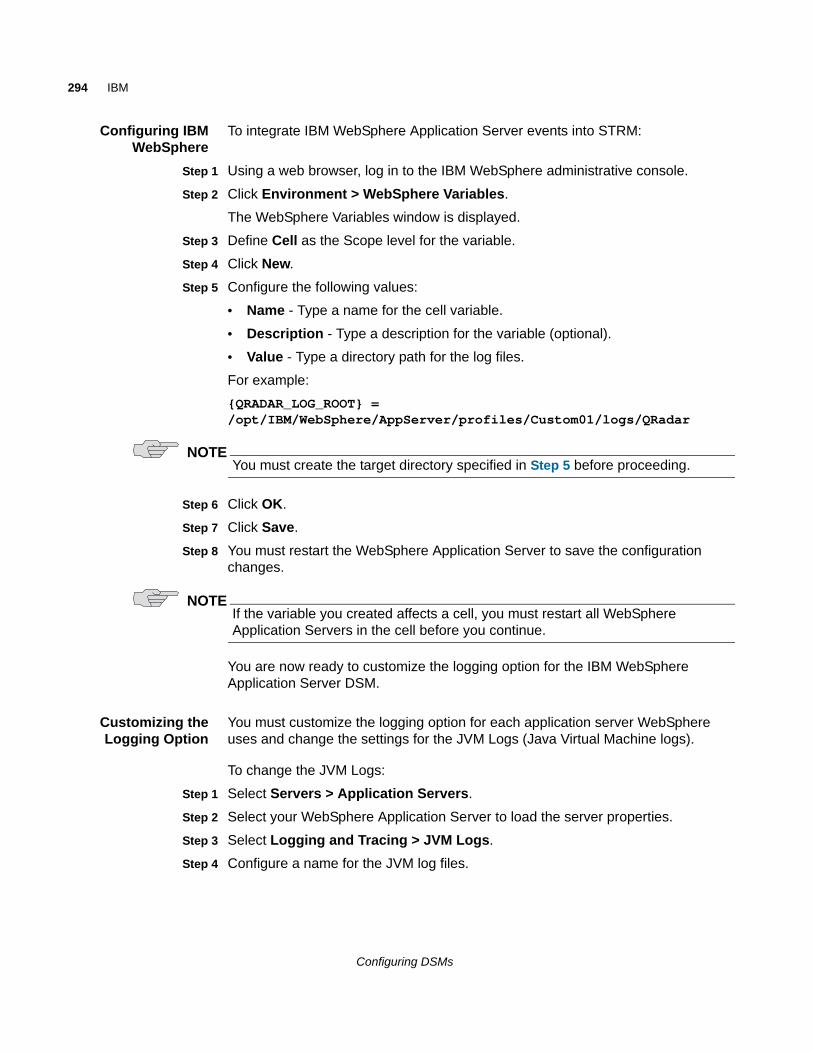
294 IBM
Configuring IBMWebSphere
To integrate IBM WebSphere Application Server events into STRM:
Step 1 Using a web browser, log in to the IBM WebSphere administrative console.
Step 2 Click Environment > WebSphere Variables.
The WebSphere Variables window is displayed.
Step 3 Define Cell as the Scope level for the variable.
Step 4 Click New.
Step 5 Configure the following values:
• Name - Type a name for the cell variable.
• Description - Type a description for the variable (optional).
• Value - Type a directory path for the log files.
For example:
{QRADAR_LOG_ROOT} = /opt/IBM/WebSphere/AppServer/profiles/Custom01/logs/QRadar
NOTEYou must create the target directory specified in Step 5 before proceeding.
Step 6 Click OK.
Step 7 Click Save.
Step 8 You must restart the WebSphere Application Server to save the configuration changes.
NOTEIf the variable you created affects a cell, you must restart all WebSphere Application Servers in the cell before you continue.
You are now ready to customize the logging option for the IBM WebSphere Application Server DSM.
Customizing theLogging Option
You must customize the logging option for each application server WebSphere uses and change the settings for the JVM Logs (Java Virtual Machine logs).
To change the JVM Logs:
Step 1 Select Servers > Application Servers.
Step 2 Select your WebSphere Application Server to load the server properties.
Step 3 Select Logging and Tracing > JVM Logs.
Step 4 Configure a name for the JVM log files.
Configuring DSMs
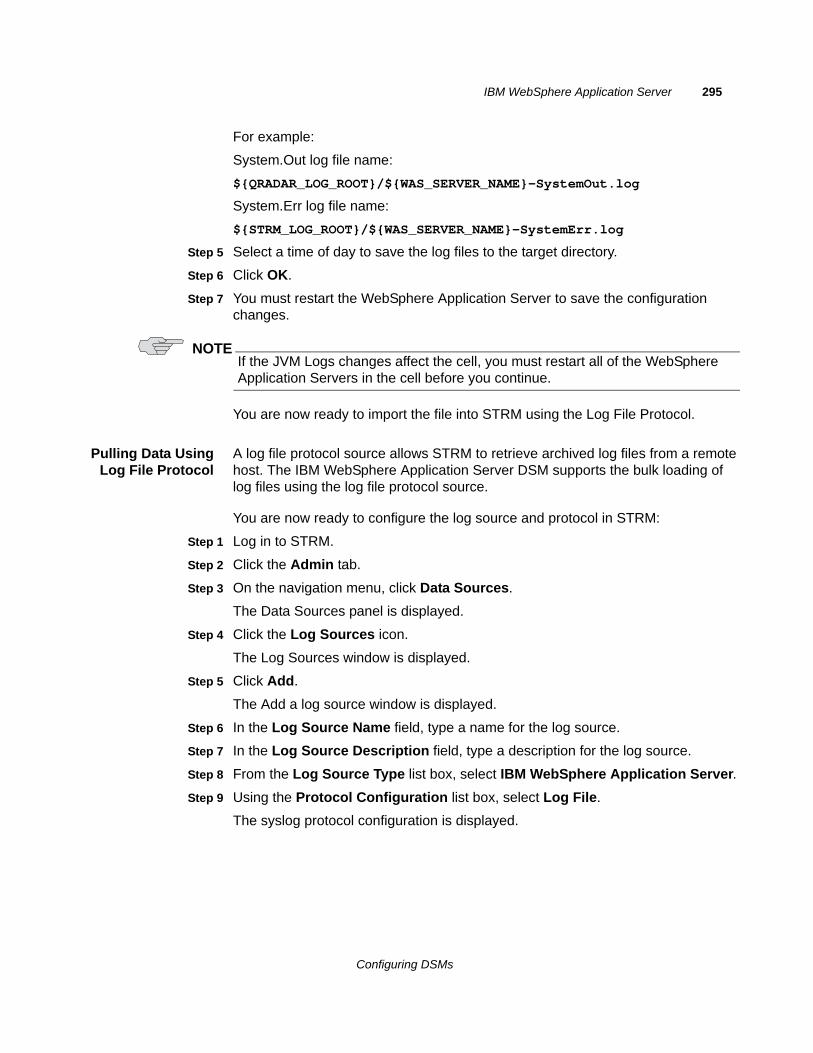
IBM WebSphere Application Server 295
For example:
System.Out log file name:
${QRADAR_LOG_ROOT}/${WAS_SERVER_NAME}-SystemOut.log
System.Err log file name:
${STRM_LOG_ROOT}/${WAS_SERVER_NAME}-SystemErr.log
Step 5 Select a time of day to save the log files to the target directory.
Step 6 Click OK.
Step 7 You must restart the WebSphere Application Server to save the configuration changes.
NOTEIf the JVM Logs changes affect the cell, you must restart all of the WebSphere Application Servers in the cell before you continue.
You are now ready to import the file into STRM using the Log File Protocol.
Pulling Data UsingLog File Protocol
A log file protocol source allows STRM to retrieve archived log files from a remote host. The IBM WebSphere Application Server DSM supports the bulk loading of log files using the log file protocol source.
You are now ready to configure the log source and protocol in STRM:
Step 1 Log in to STRM.
Step 2 Click the Admin tab.
Step 3 On the navigation menu, click Data Sources.
The Data Sources panel is displayed.
Step 4 Click the Log Sources icon.
The Log Sources window is displayed.
Step 5 Click Add.
The Add a log source window is displayed.
Step 6 In the Log Source Name field, type a name for the log source.
Step 7 In the Log Source Description field, type a description for the log source.
Step 8 From the Log Source Type list box, select IBM WebSphere Application Server.
Step 9 Using the Protocol Configuration list box, select Log File.
The syslog protocol configuration is displayed.
Configuring DSMs
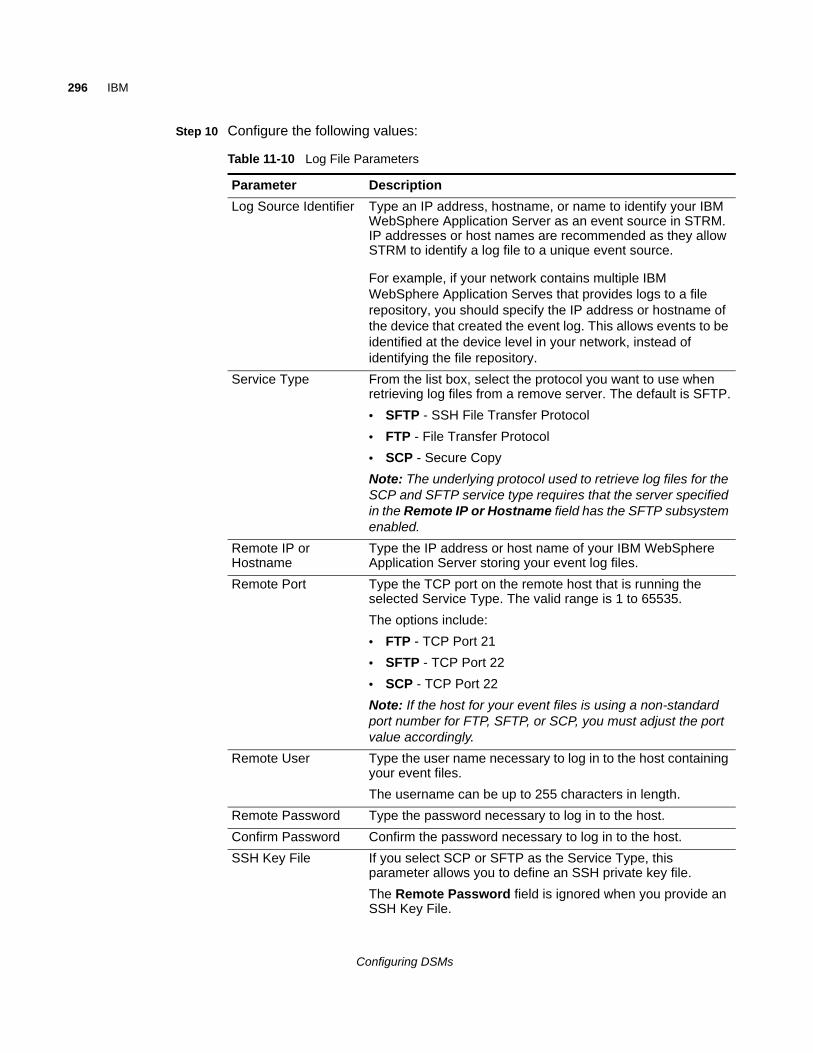
296 IBM
Step 10 Configure the following values:
Table 11-10 Log File Parameters
Parameter Description
Log Source Identifier Type an IP address, hostname, or name to identify your IBM WebSphere Application Server as an event source in STRM. IP addresses or host names are recommended as they allow STRM to identify a log file to a unique event source.
For example, if your network contains multiple IBM WebSphere Application Serves that provides logs to a file repository, you should specify the IP address or hostname of the device that created the event log. This allows events to be identified at the device level in your network, instead of identifying the file repository.
Service Type From the list box, select the protocol you want to use when retrieving log files from a remove server. The default is SFTP.
• SFTP - SSH File Transfer Protocol
• FTP - File Transfer Protocol
• SCP - Secure Copy
Note: The underlying protocol used to retrieve log files for the SCP and SFTP service type requires that the server specified in the Remote IP or Hostname field has the SFTP subsystem enabled.
Remote IP or Hostname
Type the IP address or host name of your IBM WebSphere Application Server storing your event log files.
Remote Port Type the TCP port on the remote host that is running the selected Service Type. The valid range is 1 to 65535.
The options include:
• FTP - TCP Port 21
• SFTP - TCP Port 22
• SCP - TCP Port 22
Note: If the host for your event files is using a non-standard port number for FTP, SFTP, or SCP, you must adjust the port value accordingly.
Remote User Type the user name necessary to log in to the host containing your event files.
The username can be up to 255 characters in length.
Remote Password Type the password necessary to log in to the host.
Confirm Password Confirm the password necessary to log in to the host.
SSH Key File If you select SCP or SFTP as the Service Type, this parameter allows you to define an SSH private key file.
The Remote Password field is ignored when you provide an SSH Key File.
Configuring DSMs
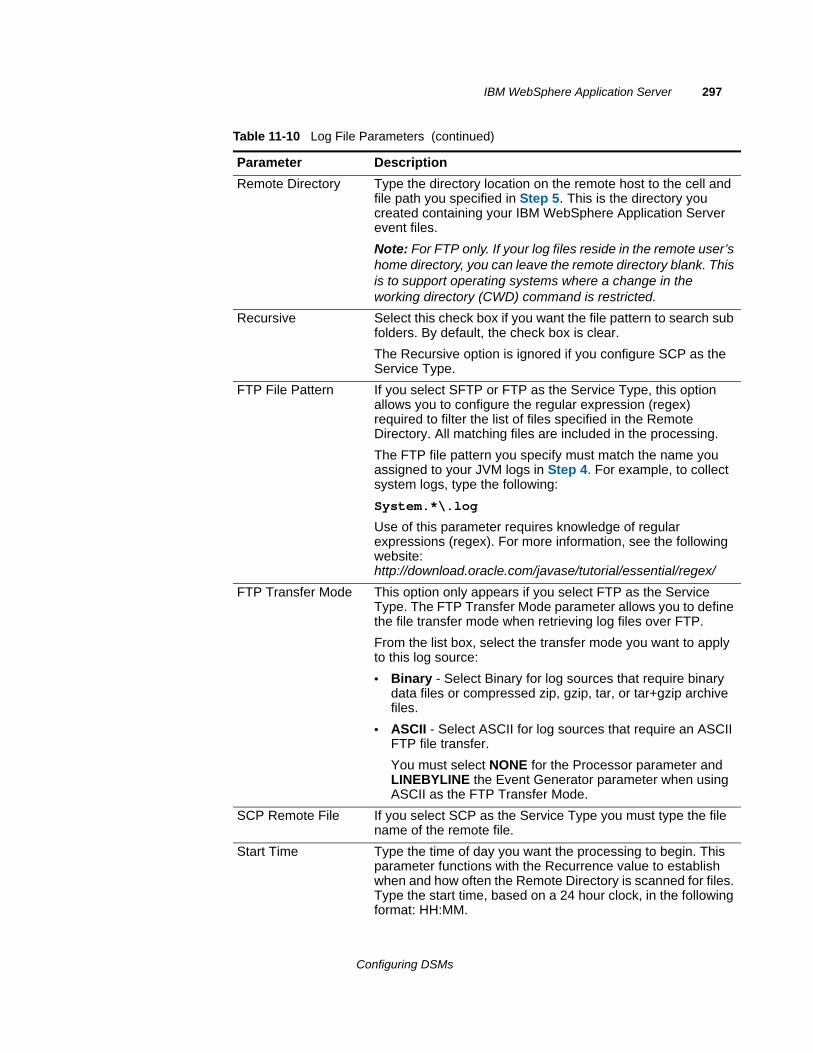
IBM WebSphere Application Server 297
Remote Directory Type the directory location on the remote host to the cell and file path you specified in Step 5. This is the directory you created containing your IBM WebSphere Application Server event files.
Note: For FTP only. If your log files reside in the remote user’s home directory, you can leave the remote directory blank. This is to support operating systems where a change in the working directory (CWD) command is restricted.
Recursive Select this check box if you want the file pattern to search sub folders. By default, the check box is clear.
The Recursive option is ignored if you configure SCP as the Service Type.
FTP File Pattern If you select SFTP or FTP as the Service Type, this option allows you to configure the regular expression (regex) required to filter the list of files specified in the Remote Directory. All matching files are included in the processing.
The FTP file pattern you specify must match the name you assigned to your JVM logs in Step 4. For example, to collect system logs, type the following:
System.*\.log
Use of this parameter requires knowledge of regular expressions (regex). For more information, see the following website: http://download.oracle.com/javase/tutorial/essential/regex/
FTP Transfer Mode This option only appears if you select FTP as the Service Type. The FTP Transfer Mode parameter allows you to define the file transfer mode when retrieving log files over FTP.
From the list box, select the transfer mode you want to apply to this log source:
• Binary - Select Binary for log sources that require binary data files or compressed zip, gzip, tar, or tar+gzip archive files.
• ASCII - Select ASCII for log sources that require an ASCII FTP file transfer.
You must select NONE for the Processor parameter and LINEBYLINE the Event Generator parameter when using ASCII as the FTP Transfer Mode.
SCP Remote File If you select SCP as the Service Type you must type the file name of the remote file.
Start Time Type the time of day you want the processing to begin. This parameter functions with the Recurrence value to establish when and how often the Remote Directory is scanned for files. Type the start time, based on a 24 hour clock, in the following format: HH:MM.
Table 11-10 Log File Parameters (continued)
Parameter Description
Configuring DSMs
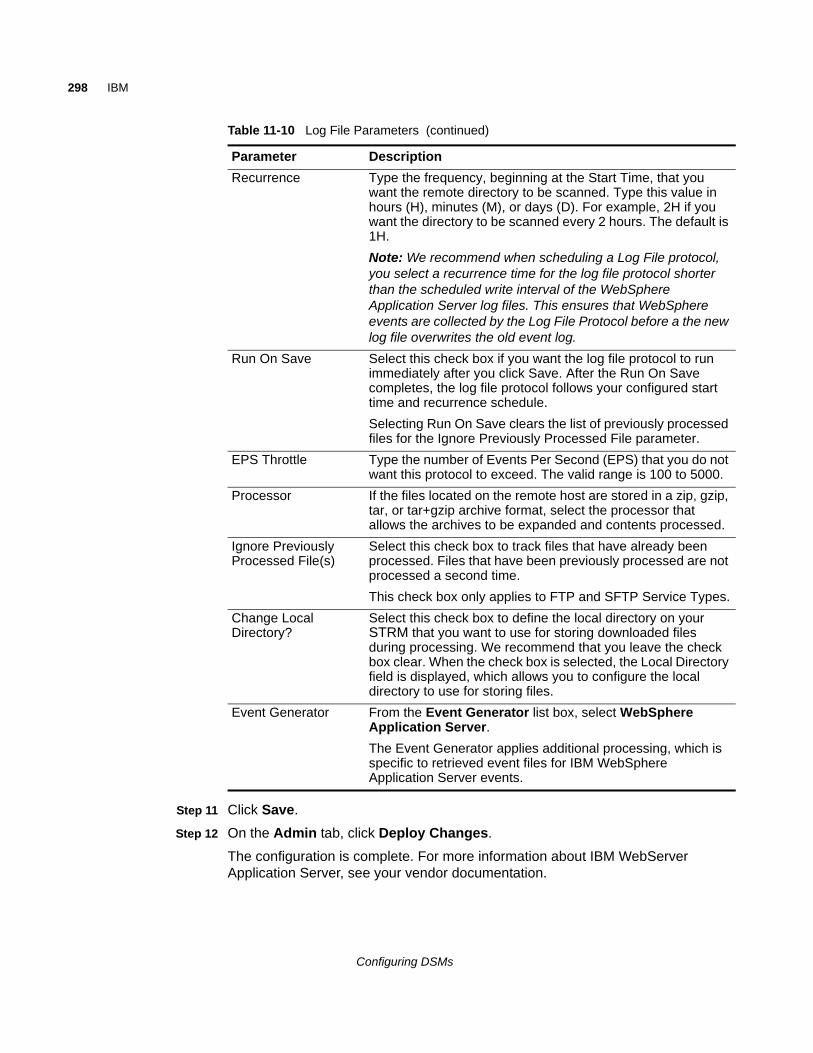
298 IBM
Step 11 Click Save.
Step 12 On the Admin tab, click Deploy Changes.
The configuration is complete. For more information about IBM WebServer Application Server, see your vendor documentation.
Recurrence Type the frequency, beginning at the Start Time, that you want the remote directory to be scanned. Type this value in hours (H), minutes (M), or days (D). For example, 2H if you want the directory to be scanned every 2 hours. The default is 1H.
Note: We recommend when scheduling a Log File protocol, you select a recurrence time for the log file protocol shorter than the scheduled write interval of the WebSphere Application Server log files. This ensures that WebSphere events are collected by the Log File Protocol before a the new log file overwrites the old event log.
Run On Save Select this check box if you want the log file protocol to run immediately after you click Save. After the Run On Save completes, the log file protocol follows your configured start time and recurrence schedule.
Selecting Run On Save clears the list of previously processed files for the Ignore Previously Processed File parameter.
EPS Throttle Type the number of Events Per Second (EPS) that you do not want this protocol to exceed. The valid range is 100 to 5000.
Processor If the files located on the remote host are stored in a zip, gzip, tar, or tar+gzip archive format, select the processor that allows the archives to be expanded and contents processed.
Ignore Previously Processed File(s)
Select this check box to track files that have already been processed. Files that have been previously processed are not processed a second time.
This check box only applies to FTP and SFTP Service Types.
Change Local Directory?
Select this check box to define the local directory on your STRM that you want to use for storing downloaded files during processing. We recommend that you leave the check box clear. When the check box is selected, the Local Directory field is displayed, which allows you to configure the local directory to use for storing files.
Event Generator From the Event Generator list box, select WebSphere Application Server.
The Event Generator applies additional processing, which is specific to retrieved event files for IBM WebSphere Application Server events.
Table 11-10 Log File Parameters (continued)
Parameter Description
Configuring DSMs
IBM Informix Audit 299
IBM Informix Audit The IBM Informix® Audit DSM allows STRM to integrate IBM Informix audit logs into STRM for analysis. STRM retrieves the IBM Informix archived audit log files from a remote host using the Log File protocol configuration. STRM records all configured IBM Informix Audit events.
For more information about IBM Informix auditing configuration, see your IBM Informix documentation at the following website: http://publib.boulder.ibm.com/infocenter/idshelp/v10/index.jsp?topic=/com.ibm.tfg.doc/tfg26.htm
When configuring your IBM Informix to use the log file protocol, make sure the hostname or IP address configured in the IBM Informix is the same as configured in the Remote Host parameter in the Log File protocol configuration.
You are now ready to configure the log source and protocol in STRM:
Step 1 To configure STRM to receive events from an IBM Informix device, you must select the IBM Informix Audit option from the Log Source Type list box.
Step 2 To configure the log file protocol, you must select the Log File option from the Protocol Configuration list box.
Step 3 We recommend that you use a secure protocol for transferring files, such as Secure File Transfer Protocol (SFTP).
For more information on configuring log sources and protocols, see the STRM Log Sources Users Guide.
IBM IMS The IBM Information Management System (IMS™) DSM for STRM allows you to use an IBM mainframe to collect events and audit IMS database transactions. STRM retrieves archived log files from a remote host using the log file protocol and records all relevant information from the event.
To integrate IBM IMS events into STRM:
Step 1 The IBM mainframe records all security events as Service Management Framework (SMF) records in a live repository.
Step 2 The IBM IMS data is extracted from the live repository using the SMF dump utility. The SMF file contains all of the events and fields from the previous day in raw SMF format.
Step 3 The qeximsloadlib.trs program pulls data from the SMF formatted file. The qeximsloadlib.trs program only pulls the relevant events and fields for STRM and writes that information in a condensed format for compatibility. The information is saved in a location accessible by STRM.
Step 4 STRM uses the log file protocol source to retrieve the output file information for STRM on a scheduled basis. STRM then imports and processes this file.
Configuring DSMs
300 IBM
This document includes:
• Configuring IBM IMS to Integrate with STRM
• Pulling Data Using Log File Protocol
Configuring IBM IMSto Integrate with
STRM
To integrate IBM IMS with STRM:
Step 1 From the Juniper customer support website, download the following compressed file:
QexIMS_bundled.tar.gz
Step 2 On a Linux-based operating system, extract the file:
tar -zxvf qexims_bundled.tar.gz
The following files are contained in the archive:
qexims_jcl.txt - Job Control Language file
qeximsloadlib.trs - Compressed program library (requires IBM TRSMAIN)
qexims_trsmain_JCL.txt - Job Control Language for TRSMAIN to decompress the .trs file
Step 3 Load the files onto the IBM mainframe using the following methods:
a Upload the sample qexims_trsmain_JCL.txt and qexims_jcl.txt files using the TEXT protocol.
b Upload the qeximsloadlib.trs file using BINARY mode transfer and append to a pre-allocated data set. The qeximsloadlib.trs file is a tersed file containing the executable (the mainframe program QexIMS). When you upload the .trs file from a workstation, pre-allocate a file on the mainframe with the following DCB attributes: DSORG=PS, RECFM=FB, LRECL= 1024, BLKSIZE=6144. The file transfer type must be binary mode and not text.
NOTEQexIMS is a small C mainframe program that reads the output of the IMS log file (EARLOUT data) line by line. QexIMS adds a header to each record containing event information, for example, record descriptor, the date, and time. The program places each field into the output record, suppresses trailing blank characters, and delimits each field with the pipe character. This output file is formatted for STRM and the blank suppression reduces network traffic to STRM. This program does not consume CPU or I/O disk resources.
Step 4 Customize the qexims_trsmain_JCL.txt file according to your installation specific information for parameters.
For example, jobcard, data set naming conventions, output destinations, retention periods, and space requirements.
The qexims_trsmain_JCL.txt file uses the IBM utility TRSMAIN to extract the program stored in the qeximsloadlib.trs file.
Configuring DSMs
IBM IMS 301
An example of the qexims_trsmain_JCL.txt file includes:
//TRSMAIN JOB (yourvalidjobcard),Q1labs,// MSGCLASS=V//DEL EXEC PGM=IEFBR14//D1 DD DISP=(MOD,DELETE),DSN=<yourhlq>.QEXIMS.TRS// UNIT=SYSDA,// SPACE=(CYL,(10,10))//TRSMAIN EXEC PGM=TRSMAIN,PARM='UNPACK'//SYSPRINT DD SYSOUT=*,DCB=(LRECL=133,BLKSIZE=12901,RECFM=FBA)//INFILE DD DISP=SHR,DSN=<yourhlq>.QEXIMS.TRS//OUTFILE DD DISP=(NEW,CATLG,DELETE),// DSN=<yourhlq>.LOAD,// SPACE=(CYL,(1,1,5),RLSE),UNIT=SYSDA//
The .trs input file is an IBM TERSE formatted library and is extracted by running the JCL, which calls the TRSMAIN. This tersed file, when extracted, creates a PDS linklib with the qexims program as a member.
Step 5 You can STEPLIB to this library or choose to move the program to one of the LINKLIBs that are in LINKLST. The program does not require authorization.
Step 6 The qexims_jcl.txt file is a text file containing a sample JCL. You must configure the job card to meet your configuration.
The qexims_jcl.txt sample file includes:
//QEXIMS JOB (T,JXPO,JKSD0093),DEV,NOTIFY=Q1JACK,// MSGCLASS=P,// REGION=0M//*//*QEXIMS JCL VERSION 1.0 FEBRUARY 2011//*//************************************************************//* Change dataset names to site specific dataset names *
//************************************************************//SET1 SET IMSOUT='Q1JACK.QEXIMS.OUTPUT',// IMSIN='Q1JACK.QEXIMS.INPUT.DATA'//************************************************************//* Delete old datasets *//************************************************************//DEL EXEC PGM=IEFBR14//DD1 DD DISP=(MOD,DELETE),DSN=&IMSOUT,// UNIT=SYSDA,// SPACE=(CYL,(10,10)),// DCB=(RECFM=FB,LRECL=80)//************************************************************//* Allocate new dataset//************************************************************//ALLOC EXEC PGM=IEFBR14//DD1 DD DISP=(NEW,CATLG),DSN=&IMSOUT,// SPACE=(CYL,(21,2)),
Configuring DSMs
302 IBM
// DCB=(RECFM=VB,LRECL=1028,BLKSIZE=6144)//EXTRACT EXEC PGM=QEXIMS,DYNAMNBR=10,// TIME=1440//STEPLIB DD DISP=SHR,DSN=Q1JACK.C.LOAD//SYSTSIN DD DUMMY//SYSTSPRT DD SYSOUT=*//SYSPRINT DD SYSOUT=*//IMSIN DD DISP=SHR,DSN=&IMSIN//IMSOUT DD DISP=SHR,DSN=&IMSOUT//*FTP EXEC PGM=FTP,REGION=3800K//*INPUT DD *//*<target server>//*<USER>//*<PASSWORD>//*ASCII//*PUT '<IMSOUT>' /TARGET DIRECTORY>/<IMSOUT>//*QUIT//*OUTPUT DD SYSOUT=*//*SYSPRINT DD SYSOUT=*//*
Step 7 After the output file is created, you must choose one of the following options:
a Schedule a job to transfer the output file to an interim FTP server.
Each time the job completes, the output file is forwarded to an intermin FTP server. You must configure the following parameters in the sample JCL to successfully forward the output to an interim FTP server:
For example:
//*FTP EXEC PGM=FTP,REGION=3800K//*INPUT DD *//*<target server>//*<USER>//*<PASSWORD>//*ASCII//*PUT '<IMSOUT>' /TARGET DIRECTORY>/<IMSOUT>//*QUIT//*OUTPUT DD SYSOUT=*//*SYSPRINT DD SYSOUT=*
Where:
<target server> is the IP address or host name of the interim FTP server to receive the output file.
<USER> is the user name required to access the interim FTP server.
<PASSWORD> is the password required to access the interim FTP server.
<IMSOUT> is the name of the output file saved to the interim FTP server.
Configuring DSMs
IBM IMS 303
For example:
PUT 'Q1JACK.QEXIMS.OUTPUT.C320' /192.168.1.101/IMS/QEXIMS.OUTPUT.C320
NOTEYou must remove commented lines beginning with //* for the script to properly forward the output file to the interim FTP server.
You are now ready to configure the Log File protocol.
b Schedule STRM to retrieve the output file from IBM IMS.
If the mainframe is configured to serve files through FTP, SFTP, or allow SCP, then no interim FTP server is required and STRM can pull the output file directly from the mainframe. The following text must be commented out using //* or deleted from the qexims_jcl.txt file:
//*FTP EXEC PGM=FTP,REGION=3800K//*INPUT DD *//*<target server>//*<USER>//*<PASSWORD>//*ASCII//*PUT '<IMSOUT>' /TARGET DIRECTORY>/<IMSOUT>//*QUIT//*OUTPUT DD SYSOUT=*//*SYSPRINT DD SYSOUT=*
You are now ready to configure the Log File protocol.
Pulling Data UsingLog File Protocol
A log file protocol source allows STRM to retrieve archived log files from a remote host. The IBM IMS DSM supports the bulk loading of log files using the log file protocol source.
When configuring your IBM IMS DSM to use the log file protocol, make sure the hostname or IP address configured in the IBM IMS is the same as configured in the Remote Host parameter in the Log File protocol configuration.
You are now ready to configure the log source and log file protocol in STRM:
Step 1 To configure STRM to receive events from the IBM IMS, you must select the IBM IMS option from the Log Source Type list box.
Step 2 To configure the log file protocol, you must select the Log File protocol option from the Protocol Configuration list box.
For more information on configuring log sources and protocols, see the STRM Log Sources Users Guide.
Configuring DSMs
304 IBM
IBM Guardium IBM Guardium® is a database activity and audit tracking tool for system administrators to retrieve detailed auditing events across database platforms. STRM receives IBM Guardium Policy Builder events in the Log Event Extended Format (LEEF) using syslog.
NOTEThese instructions require that you install the 8.2p45 fix for InfoSphere Guardium. For more information on this fix, see the Fix Central website at http://www.ibm.com/support/fixcentral/.
Before you configure STRM to integrate with IBM Guardium, you must:
1 Create a syslog destination for policy violation events. For more information, see Creating a Syslog Destination for Events.
2 Configure your existing policies to generate syslog events. For more information, see Configuring Policies to Generate Syslog Events.
3 Install the policy on IBM Guardium. For more information, see Installing an IBM Guardium Policy.
4 Configure the log source in STRM. For more information, see Configuring a Log Source in STRM.
Creating a SyslogDestination for
Events
STRM collects informational, error, alert, and warnings from IBM Guardium using syslog. To create a syslog destination for these events on IBM Guardium, you must log in to the command-line interface (CLI) and define the IP address for STRM.
To create a syslog destination:
Step 1 Using SSH, log in to IBM Guardium as the root user.
Username: <username>
Password: <password>
Step 2 Type the following command to configure the syslog destination for informational events:
store remote add daemon.info <IP address>:<port> <tcp|udp>
For example, store remote add daemon.info 10.10.1.1:514 tcp
Where:
<IP address> is the IP address of your STRM Console or Event Collector.
<port> is the syslog port number used to communicate to the STRM Console or Event Collector.
<tcp|udp> is the protocol used to communicate to the STRM Console or Event Collector.
Step 3 Type the following command to configure the syslog destination for warning events:
store remote add daemon.warning <IP address>:<port> <tcp|udp>
Configuring DSMs
IBM Guardium 305
Where:
<IP address> is the IP address of your STRM Console or Event Collector.
<port> is the syslog port number used to communicate to the STRM Console or Event Collector.
<tcp|udp> is the protocol used to communicate to the STRM Console or Event Collector.
Step 4 Type the following command to configure the syslog destination for error events:
store remote add daemon.err <IP address>:<port> <tcp|udp>
Where:
<IP address> is the IP address of your STRM Console or Event Collector.
<port> is the syslog port number used to communicate to the STRM Console or Event Collector.
<tcp|udp> is the protocol used to communicate to the STRM Console or Event Collector.
Step 5 Type the following command to configure the syslog destination for alert events:
store remote add daemon.alert <IP address>:<port> <tcp|udp>
Where:
<IP address> is the IP address of your STRM Console or Event Collector.
<port> is the syslog port number used to communicate to the STRM Console or Event Collector.
<tcp|udp> is the protocol used to communicate to the STRM Console or Event Collector.
You are now ready to configure a policy for IBM InfoSphere Guardium.
Configuring Policiesto Generate Syslog
Events
Policies in IBM Guardium are responsible for reacting to events and forwarding the event information to STRM.
To modify an existing policy in IBM Guardium:
Step 1 Click the Tools tab.
Step 2 From the left-hand navigation, select Policy Builder.
Step 3 From the Policy Finder pane, select an existing policy and click Edit Rules.
Step 4 Click Edit this Rule individually.
The Access Rule Definition is displayed.
Step 5 Click Add Action.
Step 6 From the Action list box, select one of the following alert types:
• Alert Per Match - A notification is provided for every policy violation.
• Alert Daily - A notification is provided the first time a policy violation occurs that day.
Configuring DSMs
306 IBM
• Alert Once Per Session - A notification is provided per policy violation for unique session.
• Alert Per Time Granularity - A notification is provided per your selected time frame.
Step 7 From the Message Template list box, select STRM.
Step 8 From Notification Type, select SYSLOG.
Step 9 Click Add, then click Apply.
Step 10 Click Save.
Step 11 Repeat Step 2 to Step 10 for all rules within the policy you want to forward to STRM.
For more information on configuring a policy, see your IBM InfoSphere Guardium vendor documentation. After you have configured all of your policies, you are now ready to install the policy on your IBM Guardium system.
NOTEDue to the configurable policies, STRM can only automatically discover the default policy events. If you have customized policies that forward events to STRM, you must manually create a log source to capture those events.
Installing an IBMGuardium Policy
Any new or edited policy in IBM Guardium must be installed before the updated alert actions or rule changes can occur.
To install a policy in IBM Guardium:
Step 1 Click the Administration Console tab.
Step 2 From the left-hand navigation, select Configuration > Policy Installation.
Step 3 From the Policy Installer pane, select a policy you modified in Step 3, Configuring Policies to Generate Syslog Events.
Step 4 From the drop-down list, select Install and Override.
A confirmation is displayed to install the policy to all Inspection Engines.
Step 5 Click OK.
For more information on installing a policy, see your IBM InfoSphere Guardium vendor documentation. After you have installed all of your policies, you are ready to configure the log source in STRM.
Configuring a LogSource in STRM
STRM only automatically discovers default policy events from IBM Guardium. Due to the configurable nature of policies, we recommend that you configure a log source manually for IBM Guardium.
To add an IBM Guardium log source in STRM:
Step 1 Log in to STRM.
Step 2 Click the Admin tab.
Configuring DSMs
IBM Tivoli Access Manager for e-business 307
Step 3 In the navigation menu, click Data Sources.
The Data Sources panel is displayed.
Step 4 Click the Log Sources icon.
The Log Sources window is displayed.
Step 5 Click Add.
The Add a log source window is displayed.
Step 6 In the Log Source Name field, type a name for the log source.
Step 7 In the Log Source Description field, type a description for the log source.
Step 8 From the Log Source Type list box, select IBM Guardium.
Step 9 From the Protocol Configuration list box, select Syslog.
Step 10 Configure the following values:
For more information on configuring log sources, see the STRM Log Sources Users Guide.
Step 11 Click Save.
Step 12 On the Admin tab, click Deploy Changes.
The IBM Infosphere Guardium configuration is complete.
IBM Tivoli Access Manager for e-business
The IBM Tivoli® Access Manager for e-business DSM for STRM accepts access, audit, and HTTP events forwarded from IBM Tivoli Access Manager. STRM collects audit, access, and HTTP events from IBM Tivoli Access Manager for e-business using syslog. Before you can configure STRM, you must configure Tivoli Access Manager for e-business to forward events to a syslog destination.
This section includes the following topics:
• Configuring Tivoli Access Manager for e-business
• Configuring a Log Source in STRM
Configuring TivoliAccess Manager for
e-business
To configure Tivoli Access Manager for e-business:
Step 1 Log in to Tivoli Access Manager’s IBM Security Web Gateway.
Step 2 From the navigation menu, select Secure Reverse Proxy Settings > Manage > Reverse Proxy.
The Reverse Proxy pane is displayed.
Table 11-11 IBM Guardium Syslog Configuration
Parameter Description
Log Source Identifier Type the IP address or hostname for the IBM InfoSphere Guardium appliance.
Configuring DSMs

308 IBM
Step 3 From the Instance column, select an instance.
Step 4 Click the Manage list box and select Configuration > Advanced.
The text of the WebSEAL configuration file is displayed.
Step 5 Locate the Authorization API Logging configuration.
The remote syslog configuration begins with logcfg. For example,
# As an example, to send authorization events to a remote syslog server:# logcfg = audit.azn:rsyslog server=<IP address>,port=514,log_id=<log name>
Step 6 Copy the remote syslog configuration (logcfg) to a new line without the comment (#) marker.
Edit the remote syslog configuration.
For example,
logcfg = audit.azn:rsyslog server=<IP address>,port=514,log_id=<log name>logcfg = audit.authn:rsyslog server=<IP address>,port=514,log_id=<log name>logcfg = http:rsyslog server=<IP address>,port=514,log_id=<log name>
Where:
<IP address> is the IP address of your STRM Console or Event Collector.
<Log name> is the name assigned to the log that is forwarded to STRM. For example, log_id=WebSEAL-log.
Step 7 Click Submit.
The Deploy button is displayed in the navigation menu.
Step 8 From the navigation menu, click Deploy.
A confirmation window is displayed.
Step 9 Click Deploy.
You must restart the reverse proxy instance to continue.
Step 10 From the Instance column, select your instance configuration.
Step 11 Click the Manage list box and select Control > Restart.
A status message is displayed after the restart completes. For more information on configuring a syslog destination, see your IBM Tivoli Access Manager for e-business vendor documentation. You are now ready to configure a log source in STRM.
Configuring a LogSource in STRM
STRM automatically discovers syslog audit and access events, but does not automatically discover HTTP events forwarded from IBM Tivoli Access Manager for e-business. Since STRM automatically discovers audit and access events, you are not required to create a log source. However, you can manually create a log source for STRM to receive IBM Tivoli Access Manager for e-business syslog events. The following configuration steps for creating a log source are optional.
Configuring DSMs
IBM z/OS 309
To manually configure log source in STRM:
Step 1 Log in to STRM.
Step 2 Click the Admin tab.
Step 3 In the navigation menu, click Data Sources.
The Data Sources panel is displayed.
Step 4 Click the Log Sources icon.
The Log Sources window is displayed.
Step 5 Click Add.
The Add a log source window is displayed.
Step 6 In the Log Source Name field, type a name for the log source.
Step 7 In the Log Source Description field, type a description for the log source.
Step 8 From the Log Source Type list box, select IBM Tivoli Access Manager for e-business.
Step 9 From the Protocol Configuration list box, select Syslog.
Step 10 Configure the following values:
For more information on configuring log sources, see the STRM Log Sources Users Guide.
Step 11 Click Save.
Step 12 On the Admin tab, click Deploy Changes.
The IBM Tivoli Access Manager for e-business configuration is complete.
IBM z/OS The IBM z/OS® DSM for STRM allows you to integrate with an IBM z/OS mainframe using IBM Security zSecure® Audit to collect security, authorization, and audit events. Using a zSecure process, events from the System Management Facilities (SMF) are recorded to an event file in the Log Enhanced Event format (LEEF). STRM retrieves the LEEF event log files using the log file protocol and processes the events. You can schedule STRM to retrieve events on a polling interval, which allows STRM to retrieve the events on the schedule you have defined.
Table 11-12 IBM Tivloi Access Manager for e-business Syslog Configuration
Parameter Description
Log Source Identifier Type the IP address or hostname for your IBM Tivoli Access Manager for e-business appliance.
The IP address or hostname identifies your IBM Tivoli Access Manager for e-business as a unique event source in STRM.
Configuring DSMs
310 IBM
To integrate IBM z/OS events from IBM Security zSecure Audit into STRM:
1 Confirm your installation meets any prerequisite installation requirements. For more information, see Before You Begin.
2 Configure your IBM z/OS image. For more information, see the IBM Security zSecure Suite: CARLa-Driven Components Installation and Deployment Guide.
3 Create a log source in STRM for IBM z/OS to retrieve your LEEF formatted event logs. For more information, see Creating an IBM z/OS Log Source in STRM.
4 Optional. Create a custom event property for IBM z/OS in STRM. For more information, see the STRM Custom Event Properties for IBM z/OS technical note.
Before You Begin Before you can configure the data collection process, you must complete the basic zSecure installation process. After installing the software, you must also perform the post-installation activities to create and modify the configuration.
The following prerequisites are required:
• You must ensure parmlib member IFAPRDxx is not disabled for IBM Security zSecure Audit on your z/OS image.
• The SCKRLOAD library must be APF-authorized.
• You must configure a process to periodically refresh your CKFREEZE and UNLOAD data sets.
• You must configure an SFTP, FTP, or SCP server on your z/OS image for STRM to download your LEEF event files.
• You must allow SFTP, FTP, or SCP traffic on firewalls located between STRM and your z/OS image.
For instructions on installing and configuring zSecure, see the IBM Security zSecure Suite: CARLa-Driven Components Installation and Deployment Guide.
Creating an IBM z/OSLog Source in STRM
The Log File protocol allows STRM to retrieve archived log files from a remote host. These files are transferred, one at a time, to STRM for processing. The log file protocol can manage plain text event logs, compressed files, or archives. Archives must contain plain-text files that can be processed one line at a time. Multi-line event logs are not supported by the log file protocol. IBM z/OS with zSecure writes log files to a specified directory as gzip archives. STRM extracts the archive and processes the events, which are written as one event per line in the file.
To retrieve these events, you must create a log source using the Log File protocol. STRM requires credentials to log in to the system hosting your LEEF formatted event files and a polling interval.
To configure a log source in STRM for IBM z/OS:
Step 1 Log in to STRM.
Step 2 Click the Admin tab.
Configuring DSMs
IBM z/OS 311
Step 3 On the navigation menu, click Data Sources.
The Data Sources panel is displayed.
Step 4 Click the Log Sources icon.
The Log Sources window is displayed.
Step 5 Click Add.
The Add a log source window is displayed.
Step 6 In the Log Source Name field, type a name for the log source.
Step 7 In the Log Source Description field, type a description for the log source.
Step 8 From the Log Source Type list box, select IBM z/OS.
Step 9 From the Protocol Configuration list box, select Log File.
Step 10 Configure the following values:
Table 11-13 z/OS Log File Parameters
Parameter Description
Log Source Identifier Type an IP address, host name, or name to identify the event source. IP addresses or host names are recommended as they allow STRM to identify a log file to a unique event source.
For example, if your network contains multiple devices, such as multiple z/OS images or a file repository containing all of your event logs, you should specify a name, IP address, or hostname for the image or location that uniquely identifies events for the IBM z/OS log source. This allows events to be identified at the image or location level in your network that your users can identify.
Service Type From the list box, select the protocol you want to use when retrieving log files from a remote server. The default is SFTP.
• SFTP - SSH File Transfer Protocol
• FTP - File Transfer Protocol
• SCP - Secure Copy
Note: The underlying protocol used to retrieve log files for the SCP and SFTP service type requires that the server specified in the Remote IP or Hostname field has the SFTP subsystem enabled.
Remote IP or Hostname
Type the IP address or host name of the device storing your event log files.
Configuring DSMs
312 IBM
Remote Port Type the TCP port on the remote host that is running the selected Service Type. The valid range is 1 to 65535.
The options include:
• FTP - TCP Port 21
• SFTP - TCP Port 22
• SCP - TCP Port 22
Note: If the host for your event files is using a non-standard port number for FTP, SFTP, or SCP, you must adjust the port value accordingly.
Remote User Type the user name or userid necessary to log in to the host containing your event files.
• If your log files are located on your IBM z/OS image, type the userid necessary to log in to your IBM z/OS. The userid can be up to 8 characters in length.
• If your log files are located on a file repository, type the user name necessary to log in to the file repository. The user name can be up to 255 characters in length.
Remote Password Type the password necessary to log in to the host.
Confirm Password Confirm the password necessary to log in to the host.
SSH Key File If you select SCP or SFTP as the Service Type, this parameter allows you to define an SSH private key file. When you provide an SSH Key File, the Remote Password field is ignored.
Remote Directory Type the directory location on the remote host from which the files are retrieved, relative to the user account you are using to log in.
Recursive Select this check box if you want the file pattern to search sub folders in the remote directory. By default, the check box is clear.
The Recursive option is ignored if you configure SCP as the Service Type.
Table 11-13 z/OS Log File Parameters (continued)
Parameter Description
Configuring DSMs
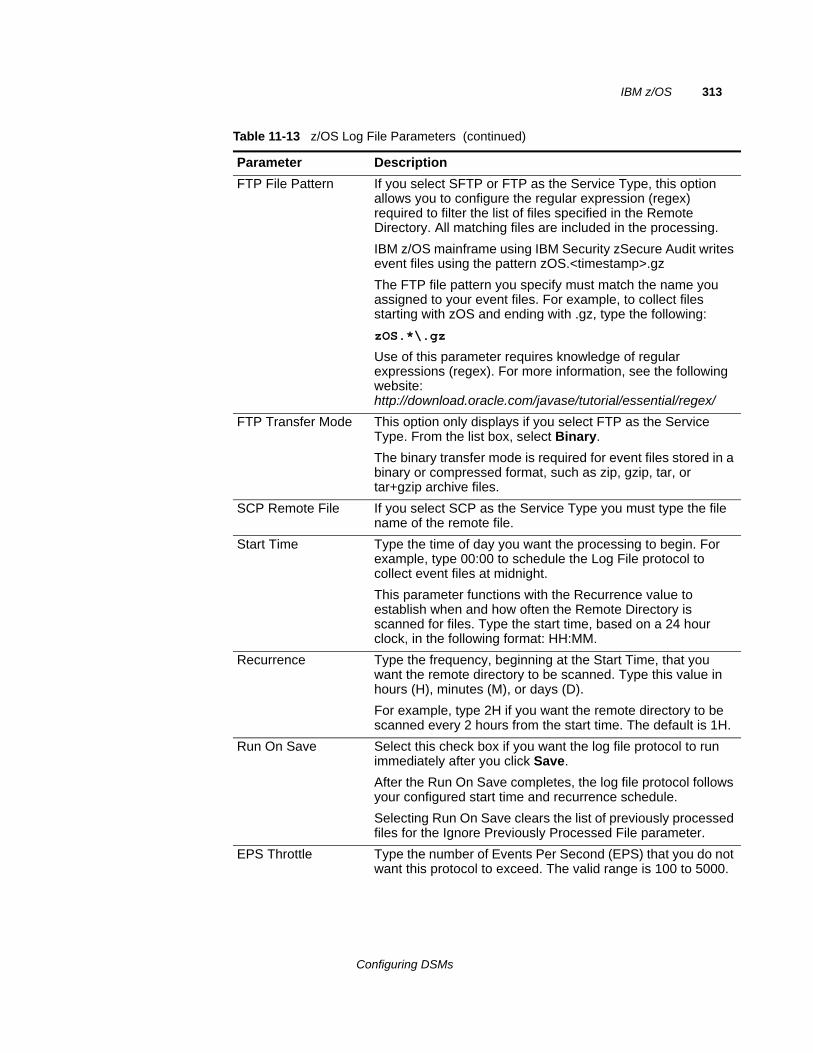
IBM z/OS 313
FTP File Pattern If you select SFTP or FTP as the Service Type, this option allows you to configure the regular expression (regex) required to filter the list of files specified in the Remote Directory. All matching files are included in the processing.
IBM z/OS mainframe using IBM Security zSecure Audit writes event files using the pattern zOS.<timestamp>.gz
The FTP file pattern you specify must match the name you assigned to your event files. For example, to collect files starting with zOS and ending with .gz, type the following:
zOS.*\.gz
Use of this parameter requires knowledge of regular expressions (regex). For more information, see the following website: http://download.oracle.com/javase/tutorial/essential/regex/
FTP Transfer Mode This option only displays if you select FTP as the Service Type. From the list box, select Binary.
The binary transfer mode is required for event files stored in a binary or compressed format, such as zip, gzip, tar, or tar+gzip archive files.
SCP Remote File If you select SCP as the Service Type you must type the file name of the remote file.
Start Time Type the time of day you want the processing to begin. For example, type 00:00 to schedule the Log File protocol to collect event files at midnight.
This parameter functions with the Recurrence value to establish when and how often the Remote Directory is scanned for files. Type the start time, based on a 24 hour clock, in the following format: HH:MM.
Recurrence Type the frequency, beginning at the Start Time, that you want the remote directory to be scanned. Type this value in hours (H), minutes (M), or days (D).
For example, type 2H if you want the remote directory to be scanned every 2 hours from the start time. The default is 1H.
Run On Save Select this check box if you want the log file protocol to run immediately after you click Save.
After the Run On Save completes, the log file protocol follows your configured start time and recurrence schedule.
Selecting Run On Save clears the list of previously processed files for the Ignore Previously Processed File parameter.
EPS Throttle Type the number of Events Per Second (EPS) that you do not want this protocol to exceed. The valid range is 100 to 5000.
Table 11-13 z/OS Log File Parameters (continued)
Parameter Description
Configuring DSMs
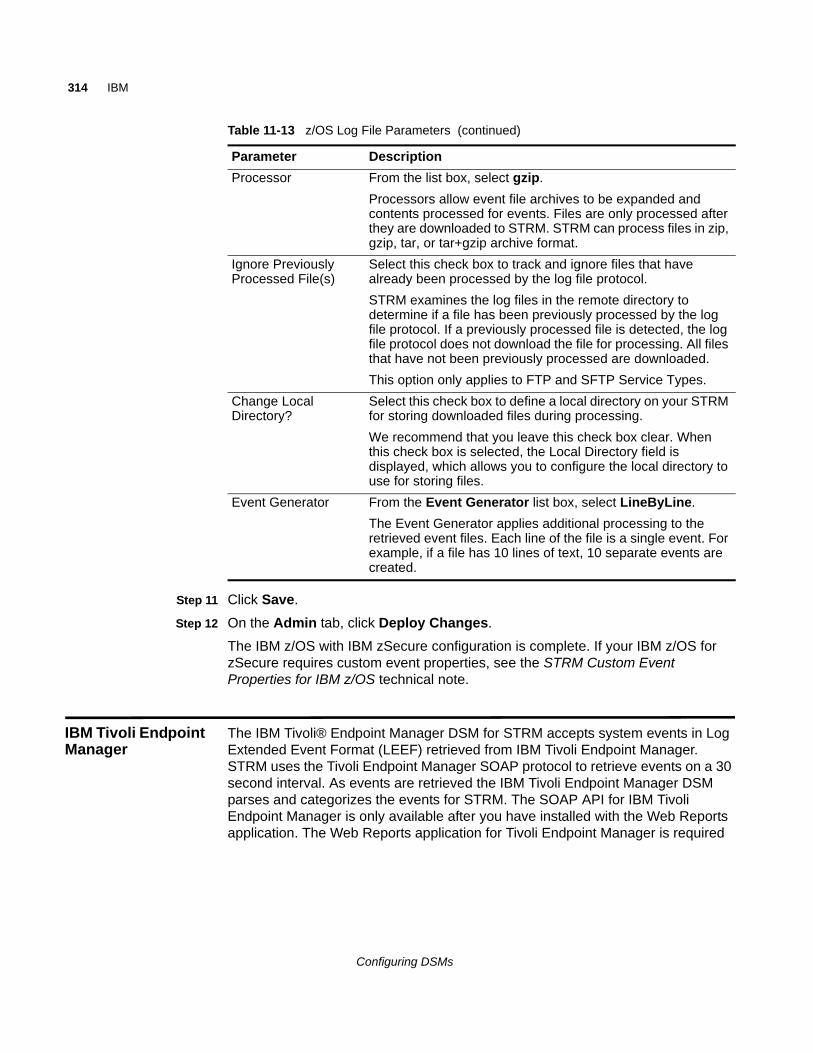
314 IBM
Step 11 Click Save.
Step 12 On the Admin tab, click Deploy Changes.
The IBM z/OS with IBM zSecure configuration is complete. If your IBM z/OS for zSecure requires custom event properties, see the STRM Custom Event Properties for IBM z/OS technical note.
IBM Tivoli Endpoint Manager
The IBM Tivoli® Endpoint Manager DSM for STRM accepts system events in Log Extended Event Format (LEEF) retrieved from IBM Tivoli Endpoint Manager. STRM uses the Tivoli Endpoint Manager SOAP protocol to retrieve events on a 30 second interval. As events are retrieved the IBM Tivoli Endpoint Manager DSM parses and categorizes the events for STRM. The SOAP API for IBM Tivoli Endpoint Manager is only available after you have installed with the Web Reports application. The Web Reports application for Tivoli Endpoint Manager is required
Processor From the list box, select gzip.
Processors allow event file archives to be expanded and contents processed for events. Files are only processed after they are downloaded to STRM. STRM can process files in zip, gzip, tar, or tar+gzip archive format.
Ignore Previously Processed File(s)
Select this check box to track and ignore files that have already been processed by the log file protocol.
STRM examines the log files in the remote directory to determine if a file has been previously processed by the log file protocol. If a previously processed file is detected, the log file protocol does not download the file for processing. All files that have not been previously processed are downloaded.
This option only applies to FTP and SFTP Service Types.
Change Local Directory?
Select this check box to define a local directory on your STRM for storing downloaded files during processing.
We recommend that you leave this check box clear. When this check box is selected, the Local Directory field is displayed, which allows you to configure the local directory to use for storing files.
Event Generator From the Event Generator list box, select LineByLine.
The Event Generator applies additional processing to the retrieved event files. Each line of the file is a single event. For example, if a file has 10 lines of text, 10 separate events are created.
Table 11-13 z/OS Log File Parameters (continued)
Parameter Description
Configuring DSMs
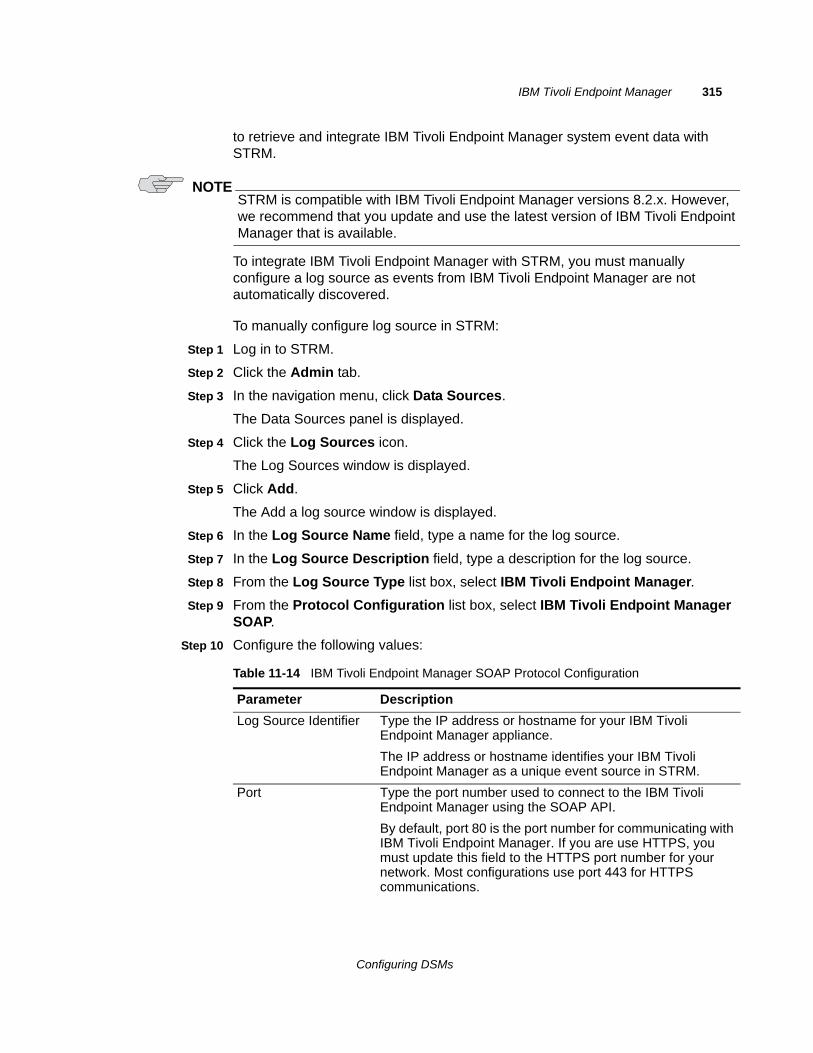
IBM Tivoli Endpoint Manager 315
to retrieve and integrate IBM Tivoli Endpoint Manager system event data with STRM.
NOTESTRM is compatible with IBM Tivoli Endpoint Manager versions 8.2.x. However, we recommend that you update and use the latest version of IBM Tivoli Endpoint Manager that is available.
To integrate IBM Tivoli Endpoint Manager with STRM, you must manually configure a log source as events from IBM Tivoli Endpoint Manager are not automatically discovered.
To manually configure log source in STRM:
Step 1 Log in to STRM.
Step 2 Click the Admin tab.
Step 3 In the navigation menu, click Data Sources.
The Data Sources panel is displayed.
Step 4 Click the Log Sources icon.
The Log Sources window is displayed.
Step 5 Click Add.
The Add a log source window is displayed.
Step 6 In the Log Source Name field, type a name for the log source.
Step 7 In the Log Source Description field, type a description for the log source.
Step 8 From the Log Source Type list box, select IBM Tivoli Endpoint Manager.
Step 9 From the Protocol Configuration list box, select IBM Tivoli Endpoint Manager SOAP.
Step 10 Configure the following values:
Table 11-14 IBM Tivoli Endpoint Manager SOAP Protocol Configuration
Parameter Description
Log Source Identifier Type the IP address or hostname for your IBM Tivoli Endpoint Manager appliance.
The IP address or hostname identifies your IBM Tivoli Endpoint Manager as a unique event source in STRM.
Port Type the port number used to connect to the IBM Tivoli Endpoint Manager using the SOAP API.
By default, port 80 is the port number for communicating with IBM Tivoli Endpoint Manager. If you are use HTTPS, you must update this field to the HTTPS port number for your network. Most configurations use port 443 for HTTPS communications.
Configuring DSMs
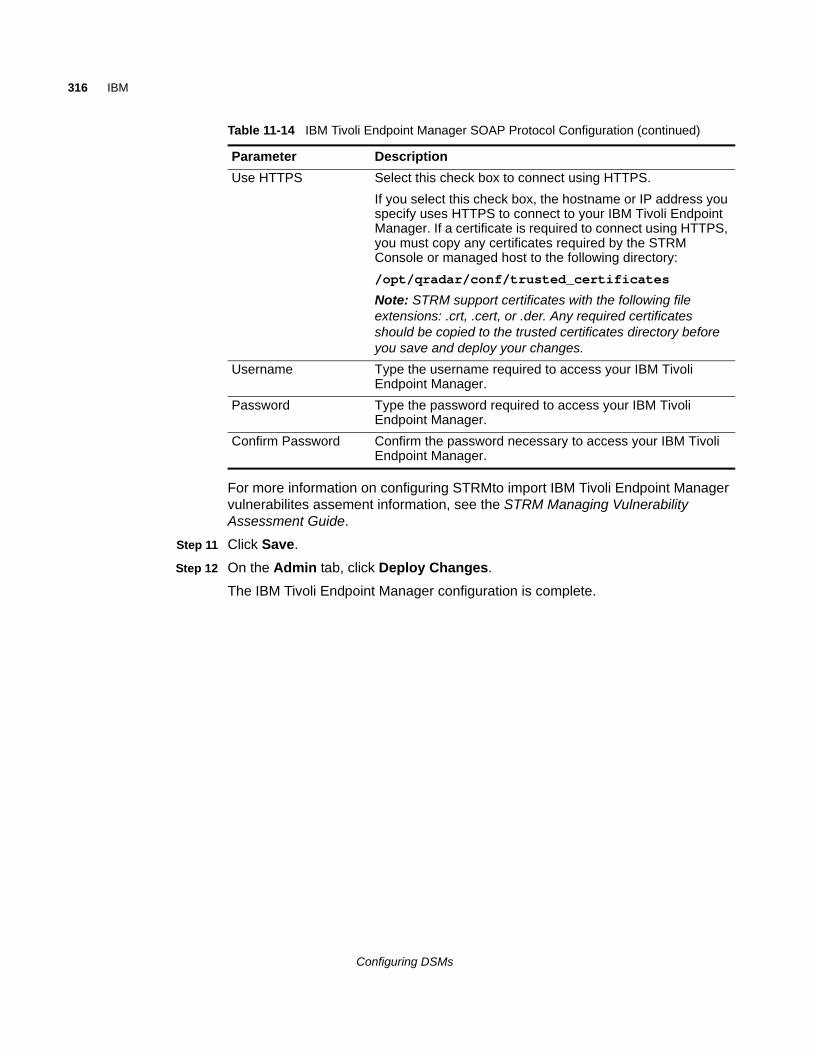
316 IBM
For more information on configuring STRMto import IBM Tivoli Endpoint Manager vulnerabilites assement information, see the STRM Managing Vulnerability Assessment Guide.
Step 11 Click Save.
Step 12 On the Admin tab, click Deploy Changes.
The IBM Tivoli Endpoint Manager configuration is complete.
Use HTTPS Select this check box to connect using HTTPS.
If you select this check box, the hostname or IP address you specify uses HTTPS to connect to your IBM Tivoli Endpoint Manager. If a certificate is required to connect using HTTPS, you must copy any certificates required by the STRM Console or managed host to the following directory:
/opt/qradar/conf/trusted_certificates
Note: STRM support certificates with the following file extensions: .crt, .cert, or .der. Any required certificates should be copied to the trusted certificates directory before you save and deploy your changes.
Username Type the username required to access your IBM Tivoli Endpoint Manager.
Password Type the password required to access your IBM Tivoli Endpoint Manager.
Confirm Password Confirm the password necessary to access your IBM Tivoli Endpoint Manager.
Table 11-14 IBM Tivoli Endpoint Manager SOAP Protocol Configuration (continued)
Parameter Description
Configuring DSMs

IBM Tivoli Endpoint Manager 317
Configuring DSMs

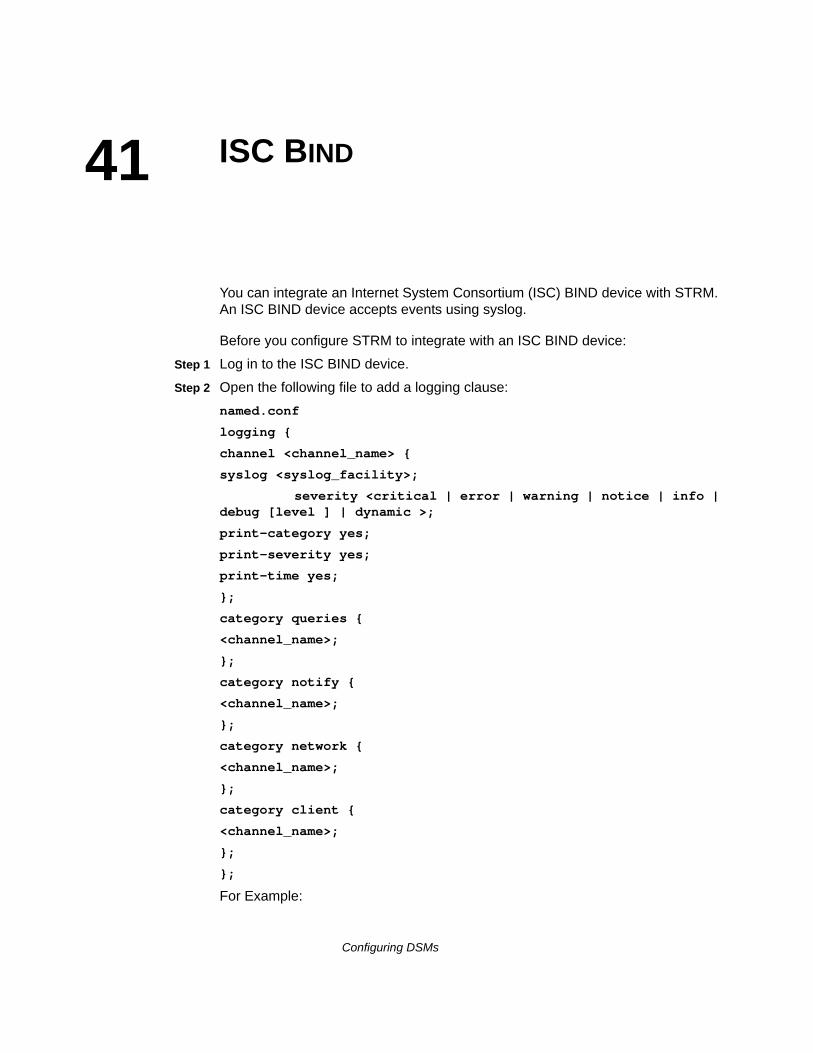
41
ISC BINDYou can integrate an Internet System Consortium (ISC) BIND device with STRM. An ISC BIND device accepts events using syslog.
Before you configure STRM to integrate with an ISC BIND device:
Step 1 Log in to the ISC BIND device.
Step 2 Open the following file to add a logging clause:
named.conf
logging {
channel <channel_name> {
syslog <syslog_facility>;
severity <critical | error | warning | notice | info | debug [level ] | dynamic >;
print-category yes;
print-severity yes;
print-time yes;
};
category queries {
<channel_name>;
};
category notify {
<channel_name>;
};
category network {
<channel_name>;
};
category client {
<channel_name>;
};
};
For Example:
Configuring DSMs
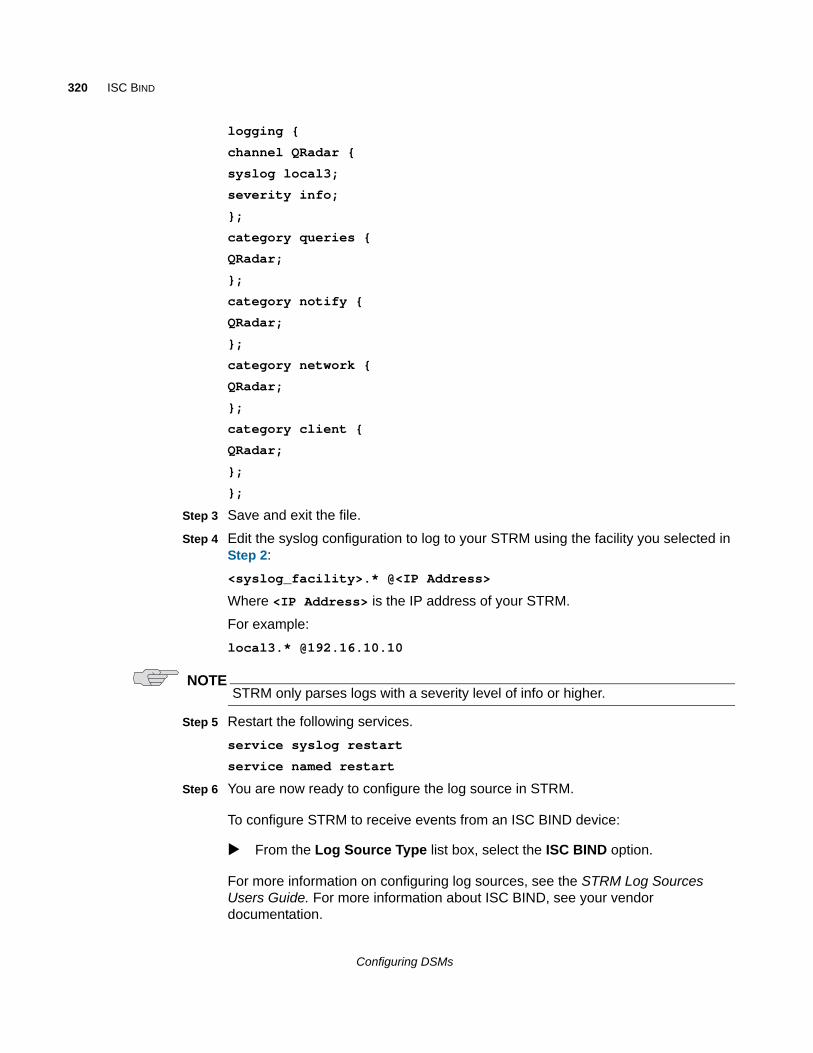
320 ISC BIND
logging {
channel QRadar {
syslog local3;
severity info;
};
category queries {
QRadar;
};
category notify {
QRadar;
};
category network {
QRadar;
};
category client {
QRadar;
};
};
Step 3 Save and exit the file.
Step 4 Edit the syslog configuration to log to your STRM using the facility you selected in Step 2:
<syslog_facility>.* @<IP Address>
Where <IP Address> is the IP address of your STRM.
For example:
local3.* @192.16.10.10
NOTESTRM only parses logs with a severity level of info or higher.
Step 5 Restart the following services.
service syslog restart
service named restart
Step 6 You are now ready to configure the log source in STRM.
To configure STRM to receive events from an ISC BIND device:
From the Log Source Type list box, select the ISC BIND option.
For more information on configuring log sources, see the STRM Log Sources Users Guide. For more information about ISC BIND, see your vendor documentation.
Configuring DSMs
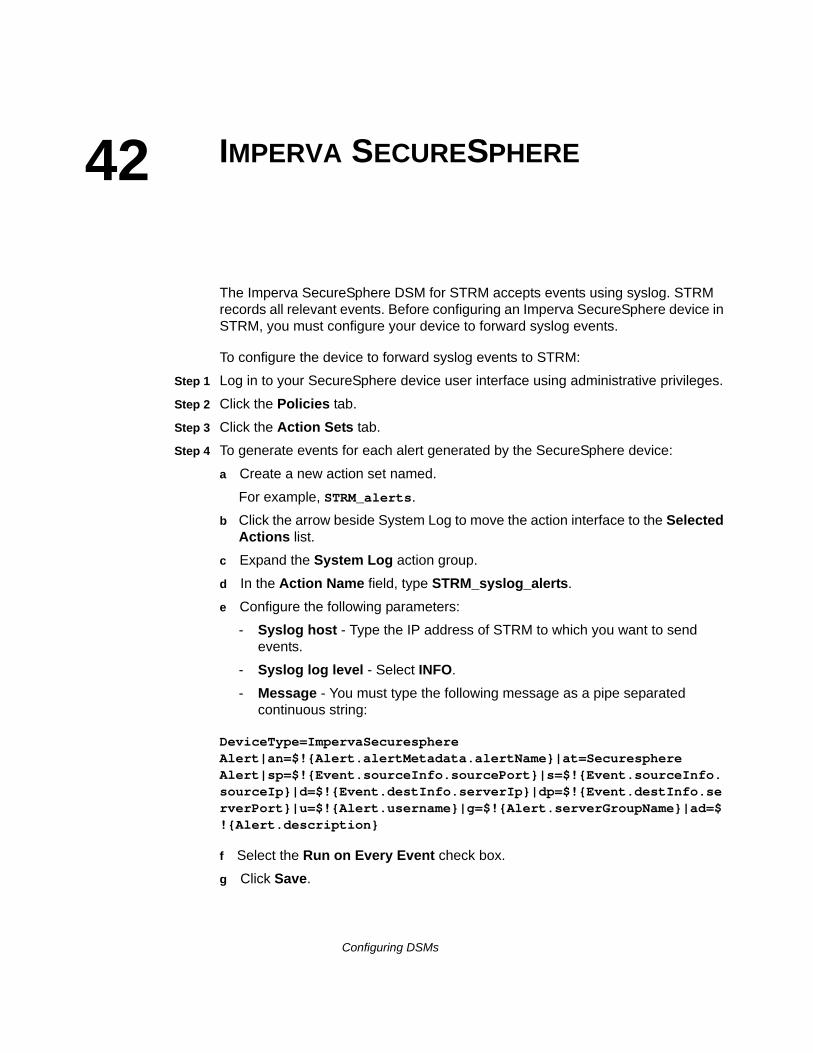
42
IMPERVA SECURESPHEREThe Imperva SecureSphere DSM for STRM accepts events using syslog. STRM records all relevant events. Before configuring an Imperva SecureSphere device in STRM, you must configure your device to forward syslog events.
To configure the device to forward syslog events to STRM:
Step 1 Log in to your SecureSphere device user interface using administrative privileges.
Step 2 Click the Policies tab.
Step 3 Click the Action Sets tab.
Step 4 To generate events for each alert generated by the SecureSphere device:
a Create a new action set named.
For example, STRM_alerts.
b Click the arrow beside System Log to move the action interface to the Selected Actions list.
c Expand the System Log action group.
d In the Action Name field, type STRM_syslog_alerts.
e Configure the following parameters:
- Syslog host - Type the IP address of STRM to which you want to send events.
- Syslog log level - Select INFO.
- Message - You must type the following message as a pipe separated continuous string:
DeviceType=ImpervaSecuresphere Alert|an=$!{Alert.alertMetadata.alertName}|at=Securesphere Alert|sp=$!{Event.sourceInfo.sourcePort}|s=$!{Event.sourceInfo.sourceIp}|d=$!{Event.destInfo.serverIp}|dp=$!{Event.destInfo.serverPort}|u=$!{Alert.username}|g=$!{Alert.serverGroupName}|ad=$!{Alert.description}
f Select the Run on Every Event check box.
g Click Save.
Configuring DSMs
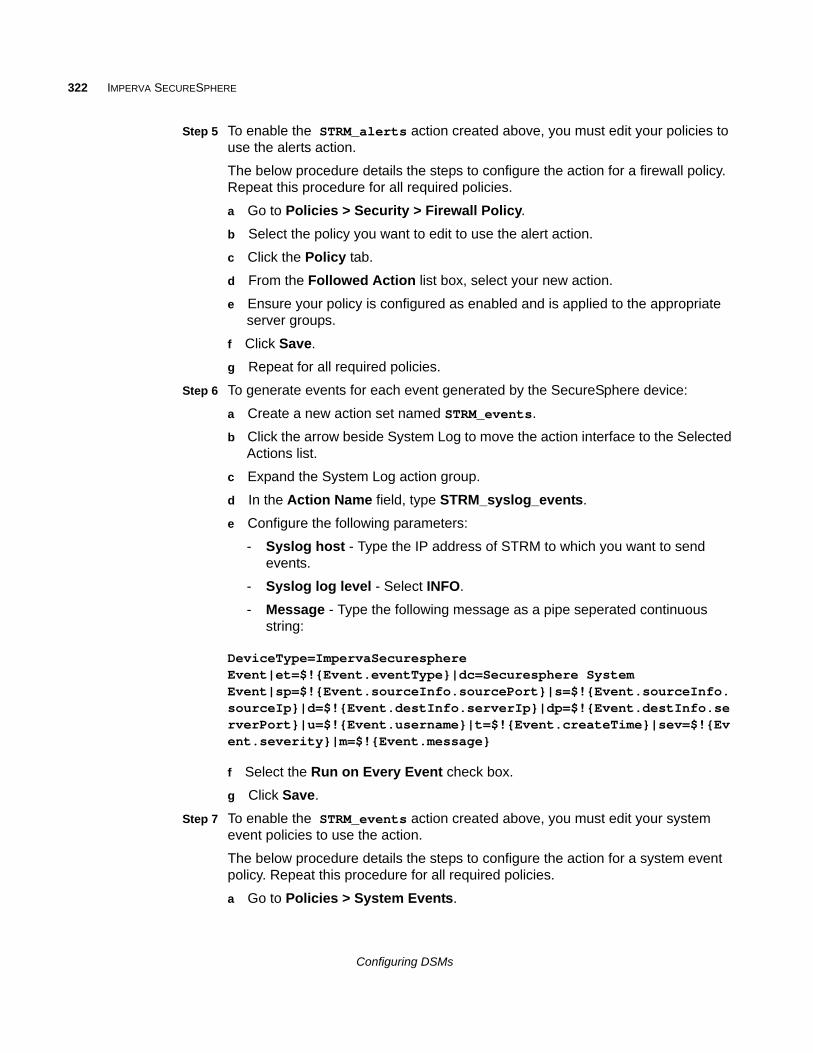
322 IMPERVA SECURESPHERE
Step 5 To enable the STRM_alerts action created above, you must edit your policies to use the alerts action.
The below procedure details the steps to configure the action for a firewall policy. Repeat this procedure for all required policies.
a Go to Policies > Security > Firewall Policy.
b Select the policy you want to edit to use the alert action.
c Click the Policy tab.
d From the Followed Action list box, select your new action.
e Ensure your policy is configured as enabled and is applied to the appropriate server groups.
f Click Save.
g Repeat for all required policies.
Step 6 To generate events for each event generated by the SecureSphere device:
a Create a new action set named STRM_events.
b Click the arrow beside System Log to move the action interface to the Selected Actions list.
c Expand the System Log action group.
d In the Action Name field, type STRM_syslog_events.
e Configure the following parameters:
- Syslog host - Type the IP address of STRM to which you want to send events.
- Syslog log level - Select INFO.
- Message - Type the following message as a pipe seperated continuous string:
DeviceType=ImpervaSecuresphere Event|et=$!{Event.eventType}|dc=Securesphere System Event|sp=$!{Event.sourceInfo.sourcePort}|s=$!{Event.sourceInfo.sourceIp}|d=$!{Event.destInfo.serverIp}|dp=$!{Event.destInfo.serverPort}|u=$!{Event.username}|t=$!{Event.createTime}|sev=$!{Event.severity}|m=$!{Event.message}
f Select the Run on Every Event check box.
g Click Save.
Step 7 To enable the STRM_events action created above, you must edit your system event policies to use the action.
The below procedure details the steps to configure the action for a system event policy. Repeat this procedure for all required policies.
a Go to Policies > System Events.
Configuring DSMs
323
b Select or create the system event policy you want to edit to use the event action.
c Click the Followed Action tab.
d From the list box, select the new action.
e Click Save.
f Repeat for all required system event policies.
Step 8 You are now ready to configure the log source in STRM.
To configure STRM to receive events from a SecureSphere device:
From the Log Source Type list box, select the Imperva SecureSphere option.
For more information on configuring log sources, see the STRM Log Sources Users Guide. For more information about your Imperva SecureSphere device, see your vendor documentation.
Configuring DSMs

43
INFOBLOX NIOSThe Infoblox NIOS DSM for STRM accepts events using syslog, enabling STRM to record all relevant events from an Infoblox NIOS device. Before configuring STRM, you must configure your Infoblox NIOS device to send syslog events to STRM. For more information on configuring logs on your Infoblox NIOS device, see your Infoblox NIOS vendor documentation.
Configuring a LogSource in STRM
STRM does not automatically discover or create log sources for syslog events from Infoblox NIOS appliances. To integrate Infoblox NIOS appliances with STRM, you must manually create a log source to receive Infoblox NIOS events.
To configure a log source:
Step 1 Log in to STRM.
Step 2 Click the Admin tab.
Step 3 On the navigation menu, click Data Sources.
The Data Sources panel is displayed.
Step 4 Click the Log Sources icon.
The Log Sources window is displayed.
Step 5 Click Add.
The Add a log source window is displayed.
Step 6 In the Log Source Name field, type a name for your log source.
Step 7 In the Log Source Description field, type a description for the log source.
Step 8 From the Log Source Type list box, select Infoblox NIOS.
Step 9 Using the Protocol Configuration list box, select Syslog.
The syslog protocol configuration is displayed.
Step 10 Configure the following values:
Table 14-1 Syslog Parameters
Parameter Description
Log Source Identifier Type the IP address or host name for the log source as an identifier for events from your Infoblox NIOS appliance.
Configuring DSMs

326 INFOBLOX NIOS
Step 11 Click Save.
Step 12 On the Admin tab, click Deploy Changes.
The log source is added to STRM. Events forwarded to STRM by Infoblox NIOS are displayed on the Log Activity tab.
Configuring DSMs
44
IT-CUBE AGILESIThe iT-CUBE agileSI DSM for STRM can accept security-based and audit SAP events from agileSI installations that are integrated with your SAP system. STRM uses the event data defined as security risks in your SAP environment to generate offenses and correlate event data for your security team. SAP security events are written in Log Event Extended Format (LEEF) to a log file produced by agileSI. STRM retrieves the new events using the SMB Tail protocol. To retrieve events from agileSI, you must create a log source using the SMB Tail protocol and provide STRM credentials to log in and poll the LEEF formatted agileSI event file. STRM is updated with new events each time the SMB Tail protocol polls the event file for new SAP events.
To integrate iT-CUBE agileSI with STRM:
1 Configure the log file and connector in iT-CUBE agileSI. For more information, see Configuring agileSI.
2 Configure a log source in STRM for agileSI. For more information, see Configuring an agileSI Log Source.
Configuring agileSI To configure agileSI, you must create a logical filename for your events and configure the connector settings with the path to your agileSI event log. The location of the LEEF formatted event file must be in a location viewable by Samba and accessible with the credentials you configure for the log source in STRM.
To configure agileSI to forward events to STRM:
Step 1 In agileSI core system installation, define a logical file name for the output file containing your SAP security events.
SAP provides a concept which enables you to use platform-independent logical file names in your application programs. Create a logical file name and path using transaction “FILE” (Logical File Path Definition) according to your organization’s requirements.
Configuring DSMs
328 IT-CUBE AGILESI
Step 2 Log in to agileSI.
For example, http://<sap-system-url:port>/sap/bc/webdynpro/itcube/ ccf?sap-client=<client>&sap-language=EN
Where:
<sap-system-url> is the IP address and port number of your SAP system, such as 10.100.100.125:50041.
<client> is the agent in your agileSI deployment.
Step 3 From the menu, click Display/Change to enable change mode for agileSI.
Step 4 From the toolbar, select Tools > Core Consumer Connector Settings.
The Core Consumer Connector Settings are displayed.
Step 5 Configure the following values:
a From the Consumer Connector list box, select Q1 Labs.
b Select the Active check box.
c From the Connector Type list box, select File.
d From the Logical File Name field, type the path to your logical file name you configured in Step 1.
For example, /ITCUBE/LOG_FILES.
The file created for the agileSI events is labeled LEEFYYYYDDMM.TXT where YYYYDDMM is the year, day, and month. The event file for the current day is appended with new events every time the extractor runs. iT-CUBE agileSI creates a new LEEF file for SAP events daily.
Step 6 Click Save.
The configuration for your connector is saved. Before you can complete the agileSI configuration, you must deploy the changes for agileSI using extractors.
Step 7 From the toolbar, select Tools > Extractor Management.
The Extractor Management settings are displayed.
Step 8 Click Deploy all.
The configuration for agileSI events is complete. You are now ready to configure a log source in STRM.
Configuring an agileSI Log Source
STRM must be configured to log in and poll the event file using the SMB Tail protocol. The SMB Tail protocol logs in and retrieves events logged by agileSI in the LEEFYYYDDMM.txt file.
To configure a log source using the SMB Tail protocol:
Step 1 Log in to STRM.
Step 2 Click the Admin tab.
Configuring DSMs
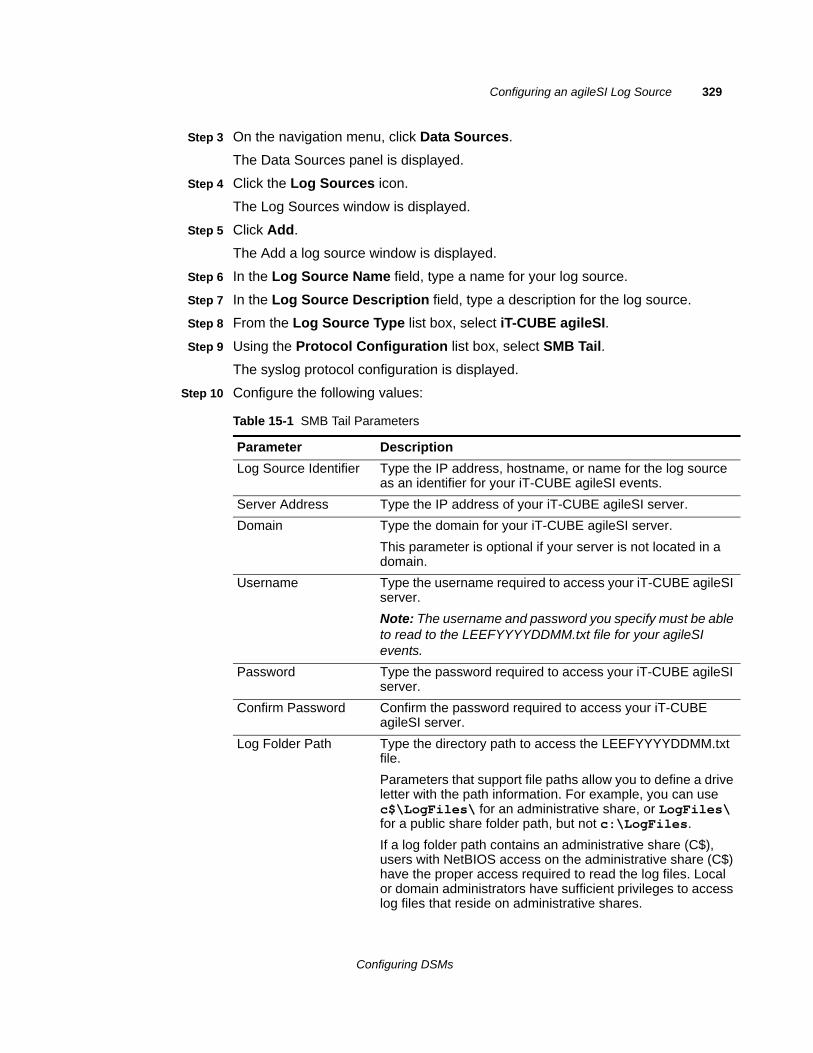
Configuring an agileSI Log Source 329
Step 3 On the navigation menu, click Data Sources.
The Data Sources panel is displayed.
Step 4 Click the Log Sources icon.
The Log Sources window is displayed.
Step 5 Click Add.
The Add a log source window is displayed.
Step 6 In the Log Source Name field, type a name for your log source.
Step 7 In the Log Source Description field, type a description for the log source.
Step 8 From the Log Source Type list box, select iT-CUBE agileSI.
Step 9 Using the Protocol Configuration list box, select SMB Tail.
The syslog protocol configuration is displayed.
Step 10 Configure the following values:
Table 15-1 SMB Tail Parameters
Parameter Description
Log Source Identifier Type the IP address, hostname, or name for the log source as an identifier for your iT-CUBE agileSI events.
Server Address Type the IP address of your iT-CUBE agileSI server.
Domain Type the domain for your iT-CUBE agileSI server.
This parameter is optional if your server is not located in a domain.
Username Type the username required to access your iT-CUBE agileSI server.
Note: The username and password you specify must be able to read to the LEEFYYYYDDMM.txt file for your agileSI events.
Password Type the password required to access your iT-CUBE agileSI server.
Confirm Password Confirm the password required to access your iT-CUBE agileSI server.
Log Folder Path Type the directory path to access the LEEFYYYYDDMM.txt file.
Parameters that support file paths allow you to define a drive letter with the path information. For example, you can use c$\LogFiles\ for an administrative share, or LogFiles\ for a public share folder path, but not c:\LogFiles.
If a log folder path contains an administrative share (C$), users with NetBIOS access on the administrative share (C$) have the proper access required to read the log files. Local or domain administrators have sufficient privileges to access log files that reside on administrative shares.
Configuring DSMs
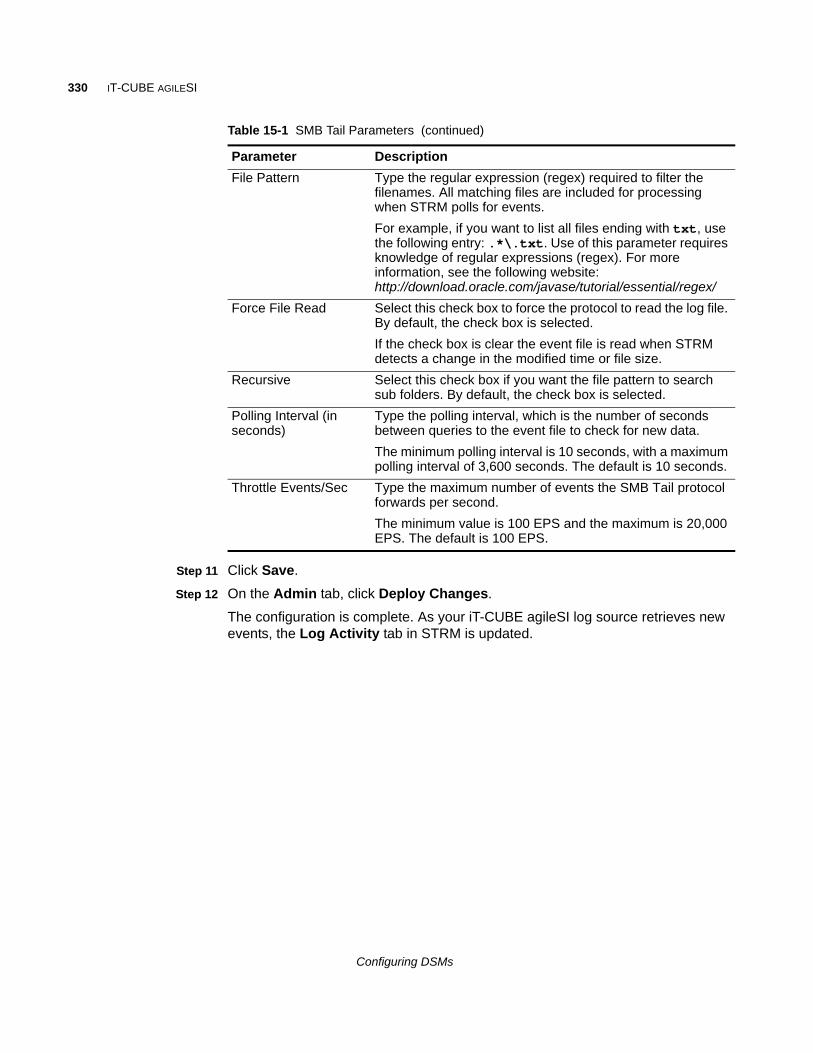
330 IT-CUBE AGILESI
Step 11 Click Save.
Step 12 On the Admin tab, click Deploy Changes.
The configuration is complete. As your iT-CUBE agileSI log source retrieves new events, the Log Activity tab in STRM is updated.
File Pattern Type the regular expression (regex) required to filter the filenames. All matching files are included for processing when STRM polls for events.
For example, if you want to list all files ending with txt, use the following entry: .*\.txt. Use of this parameter requires knowledge of regular expressions (regex). For more information, see the following website: http://download.oracle.com/javase/tutorial/essential/regex/
Force File Read Select this check box to force the protocol to read the log file. By default, the check box is selected.
If the check box is clear the event file is read when STRM detects a change in the modified time or file size.
Recursive Select this check box if you want the file pattern to search sub folders. By default, the check box is selected.
Polling Interval (in seconds)
Type the polling interval, which is the number of seconds between queries to the event file to check for new data.
The minimum polling interval is 10 seconds, with a maximum polling interval of 3,600 seconds. The default is 10 seconds.
Throttle Events/Sec Type the maximum number of events the SMB Tail protocol forwards per second.
The minimum value is 100 EPS and the maximum is 20,000 EPS. The default is 100 EPS.
Table 15-1 SMB Tail Parameters (continued)
Parameter Description
Configuring DSMs
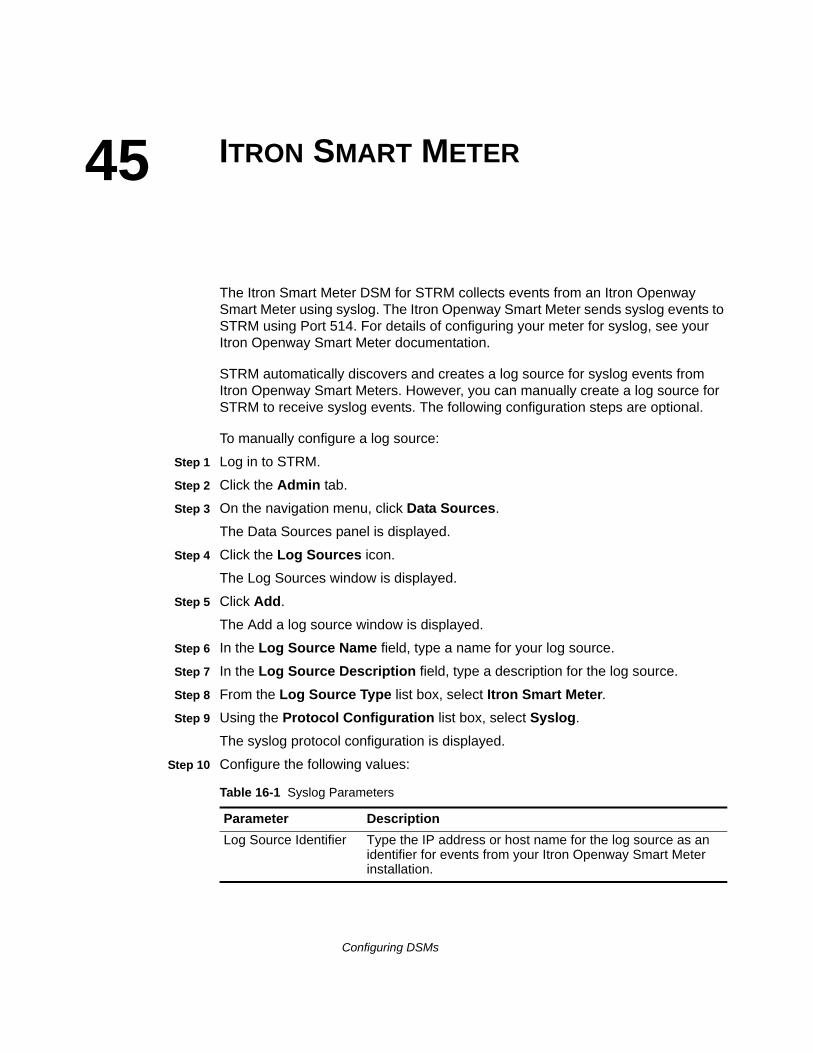
45
ITRON SMART METERThe Itron Smart Meter DSM for STRM collects events from an Itron Openway Smart Meter using syslog. The Itron Openway Smart Meter sends syslog events to STRM using Port 514. For details of configuring your meter for syslog, see your Itron Openway Smart Meter documentation.
STRM automatically discovers and creates a log source for syslog events from Itron Openway Smart Meters. However, you can manually create a log source for STRM to receive syslog events. The following configuration steps are optional.
To manually configure a log source:
Step 1 Log in to STRM.
Step 2 Click the Admin tab.
Step 3 On the navigation menu, click Data Sources.
The Data Sources panel is displayed.
Step 4 Click the Log Sources icon.
The Log Sources window is displayed.
Step 5 Click Add.
The Add a log source window is displayed.
Step 6 In the Log Source Name field, type a name for your log source.
Step 7 In the Log Source Description field, type a description for the log source.
Step 8 From the Log Source Type list box, select Itron Smart Meter.
Step 9 Using the Protocol Configuration list box, select Syslog.
The syslog protocol configuration is displayed.
Step 10 Configure the following values:
Table 16-1 Syslog Parameters
Parameter Description
Log Source Identifier Type the IP address or host name for the log source as an identifier for events from your Itron Openway Smart Meter installation.
Configuring DSMs

332 ITRON SMART METER
Step 11 Click Save.
Step 12 On the Admin tab, click Deploy Changes.
The configuration is complete.
Configuring DSMs
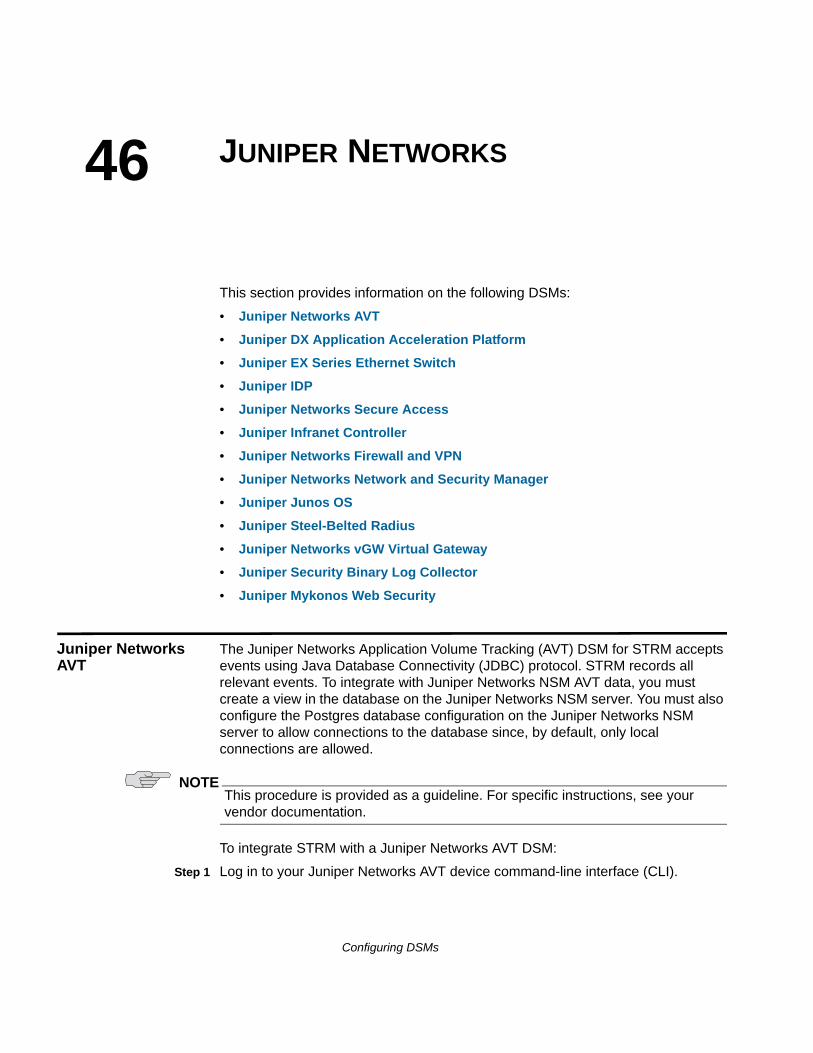
46
JUNIPER NETWORKSThis section provides information on the following DSMs:
• Juniper Networks AVT
• Juniper DX Application Acceleration Platform
• Juniper EX Series Ethernet Switch
• Juniper IDP
• Juniper Networks Secure Access
• Juniper Infranet Controller
• Juniper Networks Firewall and VPN
• Juniper Networks Network and Security Manager
• Juniper Junos OS
• Juniper Steel-Belted Radius
• Juniper Networks vGW Virtual Gateway
• Juniper Security Binary Log Collector
• Juniper Mykonos Web Security
Juniper Networks AVT
The Juniper Networks Application Volume Tracking (AVT) DSM for STRM accepts events using Java Database Connectivity (JDBC) protocol. STRM records all relevant events. To integrate with Juniper Networks NSM AVT data, you must create a view in the database on the Juniper Networks NSM server. You must also configure the Postgres database configuration on the Juniper Networks NSM server to allow connections to the database since, by default, only local connections are allowed.
NOTEThis procedure is provided as a guideline. For specific instructions, see your vendor documentation.
To integrate STRM with a Juniper Networks AVT DSM:
Step 1 Log in to your Juniper Networks AVT device command-line interface (CLI).
Configuring DSMs
334 JUNIPER NETWORKS
Step 2 Open the following file:
/var/netscreen/DevSvr/pgsql/data/pg_hba.conf file
Step 3 Add the following line to the end of the file:
host all all <IP address>/32 trust
Where <IP address> is the IP address of your STRM Console or Event Collector you want to connect to the database.
Step 4 Reload the Postgres service:
su - nsm -c "pg_ctl reload -D /var/netscreen/DevSvr/pgsql/data"
Step 5 As the Juniper Networks NSM user, create the view:
create view strm_avt_view as SELECT a.name, a.category, v.srcip,v.dstip,v.dstport, v."last", u.name as userinfo, v.id, v.device, v.vlan,v.sessionid, v.bytecnt,v.pktcnt, v."first" FROM avt_part v JOIN app a ON v.app =a.id JOIN userinfo u ON v.userinfo = u.id;
The view is created.
You are now ready to configure the log source in STRM.
To configure STRM to receive events from a Juniper Networks AVT device:
Step 1 From the Log Source Type list box, select Juniper Networks AVT.
Step 2 You must also configure the JDBC protocol for the log source. Use the following parameters to configure the JDBC protocol:
a Database Type - From the Database Type list box, select Postgres.
b Database Name - Type profilerDb.
c IP or Hostname - Type the IP address of the Juniper Networks NSM system.
d Port - Type 5432.
e Username - Type the username for the profilerDb database.
f Password - Type the password for profilerDB database.
g Table Name - Type strm_avt_view.
h Select List - Type * for the select list.
i Compare Field - Type id for the Compare Field.
j Use Prepared Statements -The Use Prepared Statements check box must be clear. The Juniper Networks AVT DSM does not support prepared statements.
k Polling Interval - Type 10 for the Polling interval.
NOTEThe Database Name and Table Name parameters are case sensitive.
For more information on configuring log sources and protocols, see the STRM Log Sources Users Guide.
Configuring DSMs
Juniper DX Application Acceleration Platform 335
For more information about the Juniper Networks AVT device, see your vendor documentation.
Juniper DX Application Acceleration Platform
The Juniper DX Application Acceleration Platforms off-load core networking and I/O responsibilities from web and application servers to improve the performance of web-based applications, increasing productivity of local, remote, and mobile users. The Juniper DX Application Acceleration Platform DSM for STRM accepts events using syslog. STRM records all relevant status and network condition events. Before configuring STRM, you must configure your Juniper device to forward syslog events.
To configure the device to forward syslog events to STRM:
Step 1 Log in to the Juniper DX user interface.
Step 2 Browse to the desired cluster configuration (Services - Cluster Name), Logging section.
Step 3 Select the Enable Logging check box.
Step 4 Select the desired Log Format.
STRM supports Juniper DX logs using the common and perf2 formats only.
Step 5 Select the desired Log Delimiter format.
STRM supports comma delimited logs only.
Step 6 In the Log Host section, type the IP address of your STRM.
Step 7 In the Log Port section, type the UDP port on which you wish to export logs.
Step 8 You are now ready to configure the log source in STRM.
To configure STRM to receive events from a Juniper DX Application Acceleration Platform:
From the Log Source Type list box, select the Juniper DX Application Acceleration Platform option.
For more information on configuring log sources, see the STRM Log Sources Users Guide.
Juniper EX Series Ethernet Switch
The Juniper EX Series Ethernet Switch DSM for STRM accepts events using syslog. The Juniper EX Series Ethernet Switch DSM supports Juniper EX Series Ethernet Switches running Junos OS. Before you can integrate STRM with a Juniper EX Series Ethernet Switch, you must configure your Juniper EX Series Switch to forward syslog events.
To configure a Juniper EX Series Ethernet Switch to forward syslog to STRM:
Step 1 Log in to the Juniper EX Series Ethernet Switch command-line interface (CLI).
Configuring DSMs
336 JUNIPER NETWORKS
Step 2 Type the following command:
configure
Step 3 Type the following command:
set system syslog host <IP address> <option> <level>
Where:
<IP address> is the IP address of your STRM.
<level> is info, error, warning, or any,
<option> is one of the following options from Table 17-1.
For example:
set system syslog host 10.77.12.12 firewall info
Configures the Juniper EX Series Ethernet Switch to send info messages from firewall filtering systems to your STRM.
Step 4 Repeat Step 3 to configure any additional syslog destinations and options. Each additional option must be identified using a separate syslog destination configuration.
Step 5 You are now ready to configure the Juniper EX Series Ethernet Switch in STRM.
Table 17-1 Juniper Networks EX Series Switch Options
Option Description
any All facilities
authorization Authorization system
change-log Configuration change log
conflict-log Configuration conflict log
daemon Various system processes
dfc Dynamic flow capture
explicit-priority Include priority and facility in messages
external Local external applications
facility-override Alternate facility for logging to remote host
firewall Firewall filtering system
ftp FTP process
interactive-commands Commands run by the UI
kernel Kernel
log-prefix Prefix for all logging to this host
match Regular expression for lines to be logged
pfe Packet Forwarding Engine
user User processes
Configuring DSMs
Juniper IDP 337
To configure STRM to receive events from a Juniper EX Series Ethernet Switch:
From the Log Source Type list box. select Juniper EX-Series Ethernet Switch option.
For more information on configuring log sources, see the STRM Log Sources Users Guide. For more information about your Juniper switch, see your vendor documentation.
Juniper IDP The Juniper IDP DSM for STRM accepts events using syslog. STRM records all relevant Juniper IDP events. To integrate STRM with a Juniper IDP device, you must:
• Configuring the IDP Sensor
• Configuring STRM to Collect IDP Events
Configuring the IDPSensor
To configure the IDP Sensor to send logs to a syslog server:
Step 1 Log in to the Juniper NSM user interface.
Step 2 In NSM, double-click on the Sensor in Device Manager.
Step 3 Select Global Settings.
Step 4 Select Enable Syslog.
Step 5 Type the Syslog Server IP address to forward events to STRM.
Step 6 Click OK.
Step 7 Use Update Device to load the new settings onto the IDP Sensor.
The format of the syslog message sent by the IDP Sensor is as follows:
<day id>, <record id>, <timeReceived>, <timeGenerated>, <domain>, <domainVersion>, <deviceName>, <deviceIpAddress>, <category>, <subcategory>,<src zone>, <src intface>, <src addr>, <src port>, <nat src addr>, <nat src port>, <dstzone>, <dst intface>, <dst addr>, <dst port>, <nat dst addr>, <nat dst port>,<protocol>, <rule domain>, <rule domainVersion>, <policyname>, <rulebase>, <rulenumber>, <action>, <severity>, <is alert>, <elapsed>, <bytes in>, <bytes out>, <bytestotal>, <packet in>, <packet out>, <packet total>, <repeatCount>, <hasPacketData>,<varData Enum>, <misc-str>, <user str>, <application str>, <uri str>
For example:
[[email protected] dayId="20061012" recordId="0" timeRecv="2006/10/12 21:52:21" timeGen="2006/10/12 21:52:21" domain="" devDomVer2="0" device_ip="10.209.83.4" cat="Predefined" attack="TROJAN:SUBSEVEN:SCAN" srcZn="NULL" srcIntf="NULL" srcAddr="192.168.170.20" srcPort="63396"
Configuring DSMs
338 JUNIPER NETWORKS
natSrcAddr="NULL" natSrcPort="0" dstZn="NULL" dstIntf="NULL" dstAddr="192.168.170.10" dstPort="27374" natDstAddr="NULL" natDstPort="0" protocol="TCP" ruleDomain="" ruleVer="5" policy="Policy2" rulebase="IDS" ruleNo="4" action="NONE" severity="LOW" alert="no" elaspedTime="0" inbytes="0" outbytes="0" totBytes="0" inPak="0" outPak="0" totPak="0" repCount="0" packetData="no" varEnum="31" misc="<017>'interface=eth2" user="NULL" app="NULL" uri="NULL"]
Configuring STRM toCollect IDP Events
Juniper NSM is a central management server for Juniper IDP. You can configure STRM to collect and represent the Juniper IDP alerts as coming from a central NSM, or STRM can collect syslog from the individual Juniper IDP device.
To configure STRM to receive events from Juniper Networks Secure Access device:
From the Log Source Type list box, select Juniper Networks Intrusion Detection and Prevention (IDP).
For more information on configuring devices, see the STRM Log Sources Users Guide. For more information about Juniper IDP, see your Network and Security Manager documentation.
Juniper Networks Secure Access
The Juniper Networks Secure Access DSM for STRM accepts login and session information using syslog in WebTrends Enhanced Log File (WELF) format. You can integrate Juniper SA and Juniper IC with STRM.
NOTEIf your Juniper device is running release 5.5R3-HF2 - 6.1 or above, we recommend that you use the WELF:WELF format for logging. See your vendor documentation to determine if your device and license support logging in WELF:WELF format.
This document provides information for integrating a Juniper Secure Access device using one of the following formats:
• WELF:WELF (Recommended). See Using the WELF:WELF Format.
• Syslog. See Using the Syslog Format.
Using theWELF:WELF Format
To integrate a Juniper Networks Secure Access device with STRM using the WELF:WELF format:
Step 1 Log in to your Juniper device administration user interface:
https://10.xx.xx.xx/admin
Step 2 Configure syslog server information for events:
a If a WELF:WELF file is configured, go to Step f. Otherwise, go to Stepb.
Configuring DSMs
Juniper Networks Secure Access 339
b From the left panel, select System > Log/Monitoring > Events > Filter.
The Filter menu is displayed.
c Click New Filter.
d Select WELF.
e Click Save Changes.
f From the left panel, select System > Log/Monitoring > Events > Settings.
g From the Select Events to Log pane, select the events that you wish to log.
h In the Server name/IP field, type the name or IP address of the syslog server.
i From the Facility list box, select the facility.
j From the Filter list box, select WELF:WELF.
k Click Add, then click Save Changes.
Step 3 Configure syslog server information for user access:
a If a WELF:WELF file is configured, go to Step e. Otherwise, go to Step b.
b From the left panel, select System > Log/Monitoring > User Access > Filter.
The Filter menu is displayed.
c Click New Filter.
d Select WELF. Click Save Changes.
e From the left panel, select System > Log/Monitoring > User Access > Settings.
f From the Select Events to Log pane, select the events that you wish to log.
g In the Server name/IP field, type the name or IP address of the syslog server.
h From the Facility list box, select the facility.
i From the Filter list box, select WELF:WELF.
j Click Add and click Save Changes.
Step 4 Configure syslog server information for administrator access:
a If a WELF:WELF file is configured, go to Stepf. Otherwise, go to Stepb.
b From the left panel, select System > Log/Monitoring > Admin Access > Filter.
The Filter menu is displayed.
c Click New Filter.
d Select WELF.
e Click Save Changes.
f From the left panel, select System > Log/Monitoring > Admin Access > Settings.
Configuring DSMs
340 JUNIPER NETWORKS
g From the Select Events to Log pane, select the events that you wish to log.
h In the Server name/IP field, type the name or IP address of the syslog server.
i From the Facility list box, select the facility.
j From the Filter list box, select WELF:WELF.
k Click Add, then click Save Changes.
Step 5 Configure syslog server information for client logs:
a If a WELF:WELF file is configured, go to Stepe. Otherwise, go to Step b.
b From the left panel, select System > Log/Monitoring > Client Logs > Filter.
The Filter menu is displayed.
c Click New Filter.
d Select WELF. Click Save Changes.
e From the left pane, select System > Log/Monitoring > Client Logs > Settings.
f From the Select Events to Log pane, select the events that you wish to log.
g In the Server name/IP field, type the name or IP address of the syslog server.
h From the Facility list box, select the facility.
i From the Filter list box, select WELF:WELF.
j Click Add, then click Save Changes.
Step 6 You are now ready to configure the log source in STRM.
To configure STRM to receive events from Juniper Networks Secure Access device:
From the Log Source Type list box, select Juniper Networks Secure Access (SA) SSL VPN.
For more information on configuring log sources, see the STRM Log Sources Users Guide. For more information about your Juniper device, see your vendor documentation.
Using the SyslogFormat
To integrate a Juniper Networks Secure Access device with STRM using syslog:
Step 1 Log in to your Juniper device administration user interface:
https://10.xx.xx.xx/admin
Step 2 Configure syslog server information for events:
a From the left pane, select System > Log/Monitoring > Events > Settings.
b From the Select Events to Log section, select the events that you wish to log.
c In the Server name/IP field, type the name or IP address of the syslog server.
Configuring DSMs
Juniper Infranet Controller 341
Step 3 Configure syslog server information for user access:
a From the left pane, select System > Log/Monitoring > User Access > Settings.
b From the Select Events to Log section, select the events that you wish to log.
c In the Server name/IP field, type the name or IP address of the syslog server.
Step 4 Configure syslog server information for administrator access:
a From the left pane, select System > Log/Monitoring > Admin Access > Settings.
b From the Select Events to Log section, select the events that you wish to log.
c In the Server name/IP field, type the name or IP address of the syslog server.
Step 5 Configure syslog server information for client logs:
a From the left pane, select System > Log/Monitoring > Client Logs > Settings.
b From the Select Events to Log section, select the events that you wish to log.
c In the Server name/IP field, type the name or IP address of the syslog server.
You are now ready to configure the log source in STRM.
To configure STRM to receive events from Juniper Networks Secure Access device:
From the Log Source Type list box, select Juniper Networks Secure Access (SA) SSL VPN.
For more information on configuring log sources, see the STRM Log Sources Users Guide. For more information about your Juniper device, see your vendor documentation.
Juniper Infranet Controller
The Juniper Networks Infranet Controller DSM for STRM accepts DHCP events using syslog. STRM records all relevant events from a Juniper Networks Infranet Controller. Before you configure STRM to integrate with a Juniper Networks Infranet Controller, you must configure syslog within the server. For more information on configuring your Juniper Networks Infranet Controller, consult your vendor documentation.
After you configure syslog for your Juniper Infranet Controller, you are now ready to configure the log source in STRM.
To configure STRM to receive events from your Juniper Networks Infranet Controller:
From the Log Source Type list box, select Juniper Networks Infranet Controller option.
Configuring DSMs
342 JUNIPER NETWORKS
For more information on configuring devices, see the STRM Log Sources Users Guide.
Juniper Networks Firewall and VPN
The Juniper Networks Firewall and VPN DSM for STRM accepts Juniper Firewall and VPN events using UDP syslog. STRM records all relevant firewall and VPN events.
NOTETCP syslog is not supported. You must use UDP syslog.
Before you configure STRM to integrate with the Juniper Networks Firewall and VPN device, you must:
Step 1 Log in to your Juniper Networks Firewall and VPN user interface.
Step 2 Select Configuration > Report Settings > Syslog.
Step 3 Select the enable syslog messages check box.
Step 4 Type the IP address of your STRM Console or Event Collector.
Step 5 Click Apply.
You are now ready to configure the log source in STRM.
To configure STRM to receive events from a Juniper Networks Firewall and VPN device:
From the Log Source Type list box, select Juniper Networks Firewall and VPN option.
For more information on configuring log sources, see the STRM Log Sources Users Guide. For more information about your Juniper Networks Firewall and VPN device, see your Juniper documentation.
Juniper Networks Network and Security Manager
The Juniper Networks Network and Security Manager (NSM) DSM for STRM accepts Juniper Networks NSM and Juniper Networks Secure Service Gateway (SSG) logs. All Juniper SSG logs must be forwarded through Juniper NSM to STRM. All other Juniper devices should be forwarded directory to STRM.
For more information on advanced filtering of Juniper Networks NSM logs, see your Juniper Networks vendor documentation.
To integrate a Juniper Networks NSM device with STRM, you must:
• Configuring Juniper Networks NSM to Export Logs to Syslog
• Configuring Juniper Networks NSM in STRM
Configuring DSMs
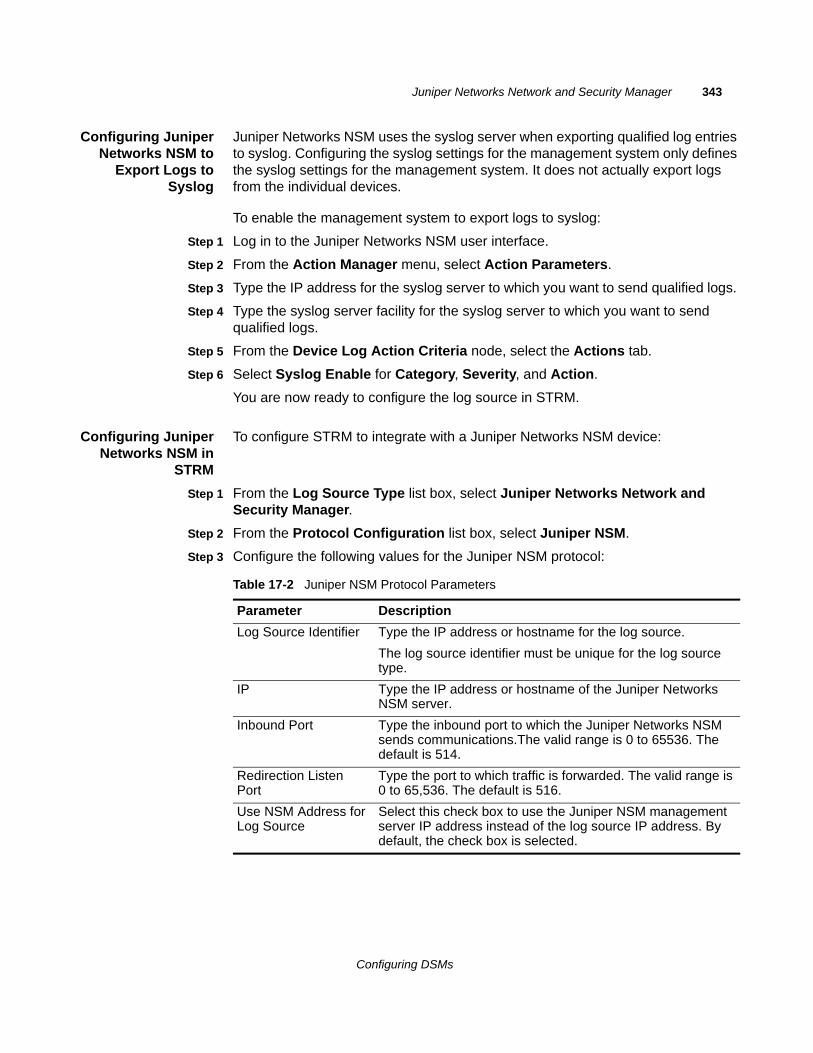
Juniper Networks Network and Security Manager 343
Configuring JuniperNetworks NSM to
Export Logs toSyslog
Juniper Networks NSM uses the syslog server when exporting qualified log entries to syslog. Configuring the syslog settings for the management system only defines the syslog settings for the management system. It does not actually export logs from the individual devices.
To enable the management system to export logs to syslog:
Step 1 Log in to the Juniper Networks NSM user interface.
Step 2 From the Action Manager menu, select Action Parameters.
Step 3 Type the IP address for the syslog server to which you want to send qualified logs.
Step 4 Type the syslog server facility for the syslog server to which you want to send qualified logs.
Step 5 From the Device Log Action Criteria node, select the Actions tab.
Step 6 Select Syslog Enable for Category, Severity, and Action.
You are now ready to configure the log source in STRM.
Configuring JuniperNetworks NSM in
STRM
To configure STRM to integrate with a Juniper Networks NSM device:
Step 1 From the Log Source Type list box, select Juniper Networks Network and Security Manager.
Step 2 From the Protocol Configuration list box, select Juniper NSM.
Step 3 Configure the following values for the Juniper NSM protocol:
Table 17-2 Juniper NSM Protocol Parameters
Parameter Description
Log Source Identifier Type the IP address or hostname for the log source.
The log source identifier must be unique for the log source type.
IP Type the IP address or hostname of the Juniper Networks NSM server.
Inbound Port Type the inbound port to which the Juniper Networks NSM sends communications.The valid range is 0 to 65536. The default is 514.
Redirection Listen Port
Type the port to which traffic is forwarded. The valid range is 0 to 65,536. The default is 516.
Use NSM Address for Log Source
Select this check box to use the Juniper NSM management server IP address instead of the log source IP address. By default, the check box is selected.
Configuring DSMs
344 JUNIPER NETWORKS
NOTEIn the STRM interface, the Juniper NSM protocol configuration enables you to use the Juniper Networks NSM IP address by selecting the Use NSM Address for Event Source check box. If you wish to change the configuration to use the originating IP address (clear the check box), you must log in to your STRM Console, as a root user, and reboot the Console (for an all-in-one system) or the Event Collector hosting the log sources (in a distributed environment) using the following command: shutdown -r now
Juniper Junos OS The Juniper Junos OS Platform DSM for STRM accepts events using syslog, structured-data syslog, or PCAP (SRX Series only). STRM records all valid syslog or structured-data syslog events.
The Juniper Junos OS Platform DSM supports the following Juniper devices running Junos OS:
• Juniper M Series Multiservice Edge Routing
• Juniper MX Series Ethernet Services Router
• Juniper T Series Core Platform
• Juniper SRX Series Services Gateway
For information on configuring PCAP data using a Juniper Networks SRX Series appliance, see Configuring Juniper Networks SRX Series PCAP Protocol.
NOTEFor more information about structured-data syslog, see RFC 5424 at the Internet Engineering Task Force: http://www.ietf.org/
Before you configure STRM to integrate with a Juniper device, you must forward data to STRM using syslog or structured-data syslog.
Step 1 Log in to your Juniper platform command-line interface (CLI).
Step 2 Include the following syslog statements at the set system hierarchy level:
[set system]syslog {
host (hostname) {facility <severity>;explicit-priority;any any;authorization any;firewall any;
Configuring DSMs
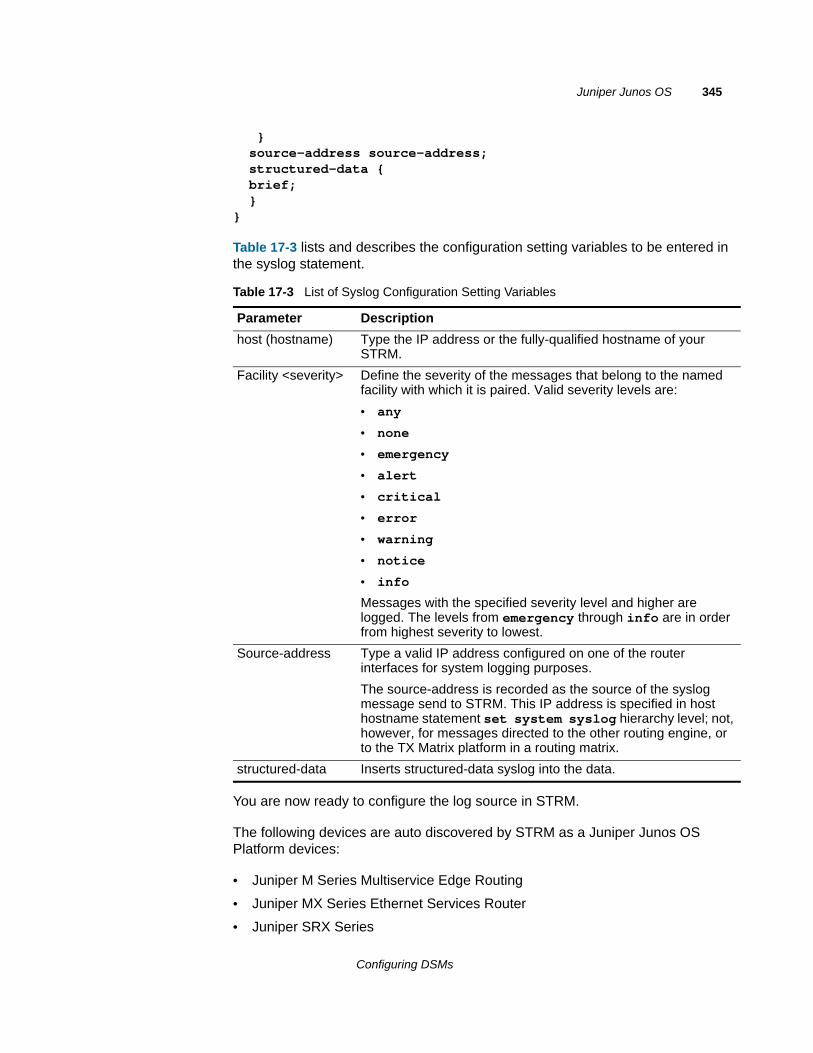
Juniper Junos OS 345
}source-address source-address;structured-data {brief;}
}
Table 17-3 lists and describes the configuration setting variables to be entered in the syslog statement.
You are now ready to configure the log source in STRM.
The following devices are auto discovered by STRM as a Juniper Junos OS Platform devices:
• Juniper M Series Multiservice Edge Routing
• Juniper MX Series Ethernet Services Router
• Juniper SRX Series
Table 17-3 List of Syslog Configuration Setting Variables
Parameter Description
host (hostname) Type the IP address or the fully-qualified hostname of your STRM.
Facility <severity> Define the severity of the messages that belong to the named facility with which it is paired. Valid severity levels are:
• any
• none
• emergency
• alert
• critical
• error
• warning
• notice
• info
Messages with the specified severity level and higher are logged. The levels from emergency through info are in order from highest severity to lowest.
Source-address Type a valid IP address configured on one of the router interfaces for system logging purposes.
The source-address is recorded as the source of the syslog message send to STRM. This IP address is specified in host hostname statement set system syslog hierarchy level; not, however, for messages directed to the other routing engine, or to the TX Matrix platform in a routing matrix.
structured-data Inserts structured-data syslog into the data.
Configuring DSMs
346 JUNIPER NETWORKS
• Juniper EX Series Ethernet Switch
• Juniper T Series Core Platform
To manually configure STRM to receive events from a Juniper Junos OS Platform device:
From the Log Source Type list box, select one of the following options: Juniper JunOS Platform, Juniper M Series Multiservice Edge Routing, Juniper MX Series Ethernet Services Router, Juniper SRX Series, or Juniper T Series Core Platform.
For more information on configuring log sources, see the STRM Log Sources Users Guide. For more information about your Juniper device, see your vendor documentation.
Configuring JuniperNetworks SRX Series
PCAP Protocol
The Juniper SRX Series appliance supports forwarding of packet capture (PCAP) and syslog data to STRM. Syslog data is forwarded to STRM on port 514. The IP address and outgoing PCAP port number is configured on the Juniper Networks SRX Series appliance interface. The Juniper Networks SRX Series appliance must be configured using the to forward PCAP data in the format <IP Address>:<Port>.
Where:
<IP Address> is the IP address of STRM.
<Port> is the outgoing port address for the PCAP data.
For more information on Configuring Packet Capture, see your Juniper Networks Junos OS documentation.
You are now ready to configure the log source and protocol in STRM. For more information see Configuring a New Juniper Networks SRX Log Source with PCAP.
Configuring a New Juniper Networks SRX Log Source with PCAP
The Juniper Networks SRX Series appliance is auto discovered by STRM as a Juniper Junos OS Platform. STRM detects the syslog data and adds the log source automatically. The PCAP data can be added to STRM as Juniper SRX Series Services Gateway log source using the PCAP Syslog Combination protocol. Adding the PCAP Syslog Combination protocol after STRM auto discovers the Junos OS syslog data adds an additional log source to your existing log source limit. Deleting the existing syslog entry, then adding the PCAP Syslog Combination protocol adds both syslog and PCAP data as single log source.
To configure STRM to access the Juniper Networks SRX Series as a single log source:
Step 1 Log in to STRM.
Step 2 Click the Admin tab.
Configuring DSMs
Juniper Steel-Belted Radius 347
Step 3 On the navigation menu, click Data Sources.
The Data Sources pane is displayed.
Step 4 Click the Log Sources icon.
The Log Sources window is displayed.
NOTEYou must install the latest PCAP Protocol from Juniper customer support before configuring the PCAP log source. For information on installing a protocol, see the STRM Log Sources Users Guide.
Step 5 Click Add.
The Add a log source window is displayed.
Step 6 From the Log Source Type list box, select Juniper SRX Series Services Gateway.
Step 7 From the Protocol Configuration list box, select PCAP Syslog Combination.
Step 8 Type the Log Source Identifier.
Step 9 Type the Incoming PCAP Port.
To configure the Incoming PCAP Port parameter in the log source, enter the outgoing port address for the PCAP data as configured on the Juniper Networks SRX Series appliance interface. For more information on configuring log sources, see the STRM Log Sources Users Guide.
Step 10 Click Save.
The Log Sources window is displayed.
Step 11 Select the auto discovered syslog-only Junos OS log source for your Juniper Networks SRX Series appliance.
Step 12 Click Delete.
A delete log source confirmation window is displayed.
Step 13 Click Yes.
The Junos OS syslog log source is deleted from the log source list. You should now have the PCAP Syslog Combination protocol in your log source list.
Step 14 On the Admin tab, click Deploy Changes.
Juniper Steel-Belted Radius
The Juniper Steel-Belted Radius DSM for STRM accepts syslog events from a client running the STRM Adaptive Log Exporter utility using the Windows operating system, or on Linux using syslog. STRM records all successful and unsuccessful login attempts. You can integrate Juniper Networks Steel-Belted Radius with STRM using one of the following methods:
• Configure Juniper Steel Belted-Radius to use the Adaptive Log Exporter on Microsoft Windows operating systems. For more information, see Configuring Juniper Steel-Belted Radius for the Adaptive Log Exporter.
Configuring DSMs
348 JUNIPER NETWORKS
• Configure Juniper Steel-Belted Radius using syslog on Linux-based operating systems. For more information, see Configuring Juniper Steel-Belted Radius for Syslog.
Configuring JuniperSteel-Belted Radius
for the Adaptive LogExporter
To integrate a Juniper Steel-Belted Radius DSM with STRM using the Adaptive Log Exporter:
Step 1 From the Start menu, select Start > Programs > Adaptive Log Exporter > Configure Adapter Log Exporter.
The Adaptive Log Exporter must be installed on the same system as your Juniper SBR system. The Adaptive Log Exporter must be updated to include the Juniper SBR device plug-in. For more information, see your Adaptive Log Exporter Users Guide.
Step 2 Click the Devices tab.
Step 3 Select Juniper SBR, right-click and select Add Device.
The New Juniper SBR Properties window is displayed.
Step 4 Configure the following parameters:
a Name - Type a name for the device. The name can include alphanumeric characters and underscore (_) characters.
b Description - Type a description for this device.
c Device Address - Type the IP address or hostname that the device. The IP address or hostname is used to identify the device in syslog messages forwarded to STRM. This is the IP address or hostname that will appear in STRM.
d Root Log Directory - Type the location where Juniper SBR stores log files. Report log files should be located in the Steel-Belted Radius directory <radiusdir>\authReports. The Adaptive Log Exporter monitors the Root Log Directory for any .CSV files having a date stamp in the file name matching the current day.
Step 5 From the Adaptive Log Exporter toolbar, click Save.
Step 6 From the Adaptive Log Exporter toolbar, click Deploy.
NOTEYou must use the default values for the log file heading in the Juniper Steel-Belted Radius appliance. If the log file headings have been changed from the default values and STRM is not parsing SBR events properly, please contact Juniper Customer Support.
Step 7 You are now ready to configure the log source in STRM.
Juniper SBR events provided from the Adaptive Log Exporter are automatically discovered by STRM. If you want to manually configure STRM to receive events from Juniper Steel-Belted Radius:
Configuring DSMs
Juniper Networks vGW Virtual Gateway 349
From the Log Source Type drop-down box, select the Juniper Steel-Belted Radius option.
For more information on configuring log sources, see the STRM Log Sources Users Guide.
Configuring JuniperSteel-Belted Radius
for Syslog
To integrate a Juniper Steel-Belted Radius DSM with STRM using syslog on a Linux-based operating system:
Step 1 Using SSH log in to your Juniper Steel-Belted Radius device, as a root user.
Step 2 Edit the following file:
/etc/syslog.conf
Step 3 Add the following information:
<facility>.<priority> @<IP address>
Where:
<facility> is the syslog facility, for example, local3.
<priority> is the syslog priority, for example, info.
<IP address> is the IP address of STRM.
Step 4 Save the file.
Step 5 From the command-line, type the following command to restart syslog:
service syslog restart
Step 6 You are now ready to configure the log source in STRM.
To configure STRM to receive events from Juniper Steel-Belted Radius:
From the Log Source Type list box, select the Juniper Steel-Belted Radius option.
For more information on configuring log sources, see the STRM Log Sources Users Guide. For more information on configuring your Steel-Belted Radius server consult your vendor documentation.
Juniper Networks vGW Virtual Gateway
The Juniper Networks vGW Virtual Gateway DSM for STRM accepts events using syslog and NetFlow from your vGW management server or firewall. STRM records all relevant events, such as admin, policy, IDS logs, and firewall events. Before configuring an Juniper Networks vGW Virtual Gateway in STRM, you must configure vGW to forward syslog events.
To integrate STRM with a Juniper Networks vGW Virtual Gateway:
Step 1 Log in to your Juniper Networks vGW user interface.
Step 2 Select Settings.
Configuring DSMs
350 JUNIPER NETWORKS
Step 3 From Security Settings, select Global.
Step 4 From External Logging, select one of the following:
• Send Syslog from vGW management server - Central logging with syslog event provided from a management server.
If you select the option Send Syslog from vGW management server, all events forwarded to STRM contain the IP address of the vGW management server.
• Send Syslog from Firewalls - Distribute logging with each Firewall Security VM providing syslog events.
Step 5 Type values for the following parameters:
a Syslog Server - Type the IP address of your vGW management server if you selected to Send Syslog from vGW management server. Or, type the IP address of STRM if you selected Send Syslog from Firewalls.
b Syslog Server Port - Type the port address for syslog. This is typically port 514.
Step 6 From the External Logging panel, click Save.
Only changes made to the External Logging section are stored when you click Save. Any changes made to NetFlow require that you save using the button within NetFlow Configuration section.
Step 7 From the NetFlow Configuration panel, select the enable check box.
NetFlow does not support central logging from a vGW management server. From the External Logging section, you must select the option Send Syslog from Firewalls.
Step 8 Type values for the following parameters:
a NetFlow collector address - Type the IP address of STRM.
b NetFlow collector port - Type a port address for NetFlow events.
NOTESTRM typically uses port 2055 for NetFlow event data on QFlow Collectors. You must configure a different NetFlow collector port on your Juniper Networks vGW Series Virtual Gateway for NetFlow.
Step 9 From the NetFlow Configuration, click Save.
Step 10 You are now ready to configure the log source in STRM.
STRM automatically detects syslog forwarded from Juniper Networks vGW. If you want to manually configure STRM to receive syslog events:
From the Log Source Type list box, select Juniper vGW.
For more information on configuring log sources, see the STRM Log Sources Users Guide. For more information, see your Juniper Networks vGW documentation.
Configuring DSMs
Juniper Security Binary Log Collector 351
Juniper Security Binary Log Collector
The Juniper Security Binary Log Collector DSM for STRM can accept audit, system, firewall and intrusion prevention system (IPS) events in binary format from Juniper SRX or Juniper Networks J Series appliances. The Juniper Networks binary log file format is intended to increase performance when writing large amounts of data to an event log. To integrate your device with STRM, you must configure your Juniper appliance to stream binary formatted events, then configure a log source in STRM.
This section includes the following topics:
• Configuring the Juniper Networks Binary Log Format
• Configuring a Log Source in STRM
Configuring theJuniper Networks
Binary Log Format
The binary log format from Juniper SRX or J Series appliances are streamed to STRM using the UDP protocol. You must specify a unique port for streaming binary formatted events, the standard syslog port for STRM cannot understand binary formatted events. The default port assigned to STRM for receiving streaming binary events from Juniper appliances is port 40798.
NOTEThe Juniper Binary Log Collector DSM only supports events forwarded in Streaming mode. The Event mode is not supported.
To configure your binary event streaming:
Step 1 Log in to your Juniper SRX or J Series using the command-line Interface (CLI).
Step 2 Type the following command to edit your device configuration:
configure
Step 3 Type the following command to configure the IP address and port number for streaming binary formatted events:
set security log stream <Name> host <IP address> port <Port>
Where:
<Name> is the name assigned to the stream.
<IP address> is the IP address of your STRM Console or Event Collector.
<Port> is a unique port number assigned for streaming binary formatted events to STRM. By default, STRM listens for binary streaming data on port 40798. For a list of ports used by STRM, see the STRM Common Ports List technical note.
Step 4 Type the following command to set the security log format to binary:
set security log stream <Name> format binary
Where <Name> is the name you specified for your binary format stream in Step 3.
Step 5 Type the following command to enable security log streaming:
set security log mode stream
Configuring DSMs
352 JUNIPER NETWORKS
Step 6 Type the following command to set the source IP address for the event stream:
set security log source-address <IP address>
Where <IP address> is the IP address of your Juniper SRX Series or Juniper J Series appliance.
Step 7 Type the following command to save the configuration changes:
commit
Step 8 Type the following command to exit the configuration mode:
exit
The configuration of your Juniper SRX or J Series appliance is complete. You are now ready to configure a log source in STRM.
Configuring a LogSource in STRM
STRM does not automatically discover incoming Juniper Security Binary Log Collector events from Juniper SRX or Juniper J Series appliances. If your events are not automatically discovered, you must manually create a log source using the Admin tab in STRM.
To configure a log source for your Juniper Security Binary Log Collector events:
Step 1 Log in to STRM.
Step 2 Click the Admin tab.
Step 3 On the navigation menu, click Data Sources.
The Data Sources pane is displayed.
Step 4 Click the Log Sources icon.
The Log Sources window is displayed.
Step 5 Click Add.
The Add a log source window is displayed.
Step 6 In the Log Source Name field, type a name for your log source.
Step 7 In the Log Source Description field, type a description for the log source.
Step 8 From the Log Source Type list box, select Juniper Security Binary Log Collector.
Step 9 Using the Protocol Configuration list box, select Juniper Security Binary Log Collector.
The Juniper Security Binary Log Collector protocol configuration is displayed.
Configuring DSMs
Juniper Security Binary Log Collector 353
Step 10 Configure the following values:
Step 11 Click Save.
Step 12 On the Admin tab, click Deploy Changes.
The configuration is complete. You can verify events forwarded to STRM by viewing events in the Log Activity tab.
Table 17-4 Juniper Security Binary Log Collector Parameters
Parameter Description
Log Source Identifier Type an IP address or hostname to identify the log source. The identifier address should be the Juniper SRX or J Series appliance generating the binary event stream.
Binary Collector Port Specify the port number used by the Juniper Networks SRX or J Series appliance to forward incoming binary data to STRM. The UDP port number for binary data is the same port configured in Configuring the Juniper Networks Binary Log Format, Step 3.
If you edit the outgoing port number for the binary event stream from your Juniper Networks SRX or J Series appliance, you must also edit your Juniper log source and update the Binary Collector Port parameter in STRM.
To edit the port:
1 In the Binary Collector Port field, type the new port number for receiving binary event data.
2 Click Save.
Event collection is stopped for the log source until you fully deploy STRM.
3 On the Admin tab, select Advanced > Deploy Full Configuration.
The port update is complete and event collection starts on the new port number.
Note: When you click Deploy Full Configuration, STRM restarts all services, resulting in a gap in data collection for events and flows until the deployment completes.
XML Template File Location
Type the path to the XML file used to decode the binary stream from your Juniper SRX or Juniper J Series appliance.
By default, STRM includes an XML template file for decoding the binary stream in the following directory:
/opt/qradar/conf/security_log.xml
Configuring DSMs
354 JUNIPER NETWORKS
Juniper Mykonos Web Security
The Juniper Mykonos DSM for STRM accepts events forwarded from Juniper Mykonos Web Security (MWS) appliances using syslog. Juniper Mykonos Web Security provides incident logging and access logging events to STRM.
Before you can receive events in STRM, you must configure event forwarding on your Juniper Mykonos Web Security, then define the events you want to forward.
This section includes the following topics:
• Configuring Syslog Forwarding
• Configuring Event Logging
• Configuring a Log Source in STRM
Configuring SyslogForwarding
To configure a remote syslog server for Juniper Mykonos Web Security, you must SSH in to a configuration interface. The configuration interface allows you to setup or configure core settings on your Juniper Mykonos Web Security appliance.
To configure syslog forwarding:
Step 1 Using SSH, log in to your Juniper Mykonos device using port 2022.
https://<Mykonos IP address>:<port>
Where:
<Mykonos IP address> is the IP address of your Juniper Mykonos Web Security appliance.
<Port> is the port number of your Juniper Mykonos Web Security appliance configuration interface. The default SSH configuration port is 2022.
Step 2 From the Choose a Tool menu, select Logging.
Step 3 Click Run Tool.
Step 4 From the Log Destination menu, select Remote Syslog Server.
Step 5 In the Syslog Server field, type the IP address of your STRM Console or Event Collector.
Step 6 Click Save.
Step 7 From the Choose a Tool menu, select Quit.
Step 8 Type Exit to close your SSH session.
You are now ready to configure event logging on your Juniper Mykonos Web Security appliance.
Configuring DSMs
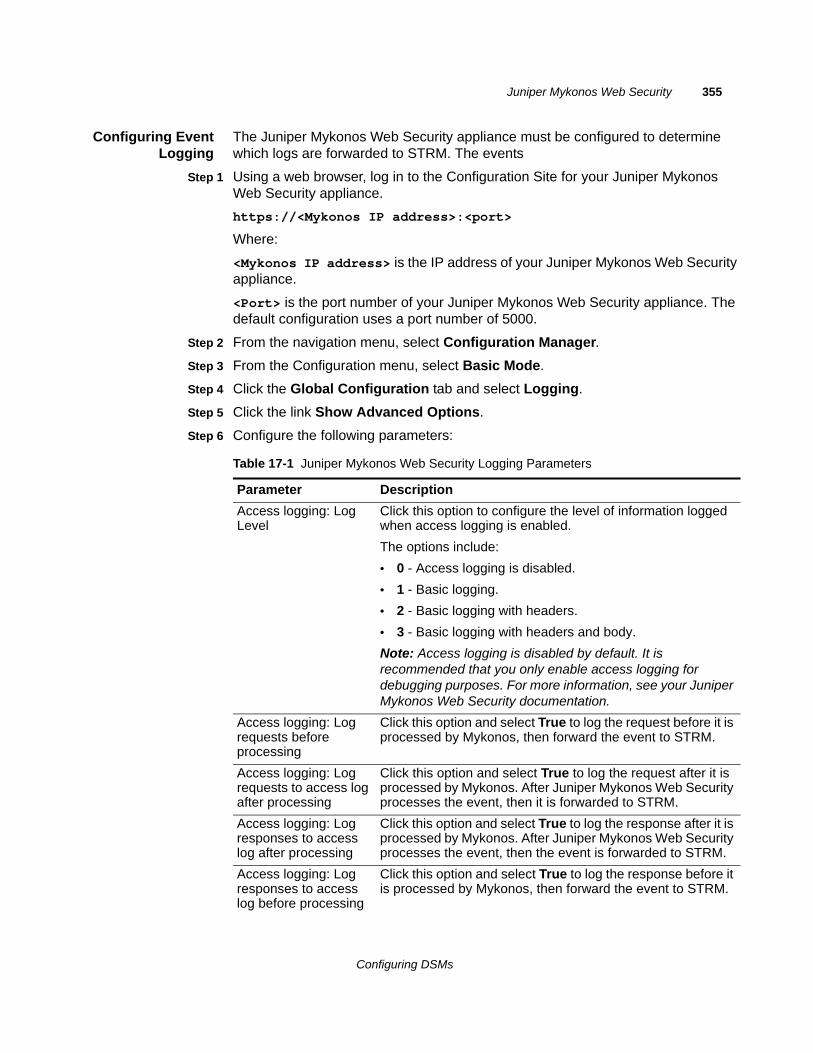
Juniper Mykonos Web Security 355
Configuring EventLogging
The Juniper Mykonos Web Security appliance must be configured to determine which logs are forwarded to STRM. The events
Step 1 Using a web browser, log in to the Configuration Site for your Juniper Mykonos Web Security appliance.
https://<Mykonos IP address>:<port>
Where:
<Mykonos IP address> is the IP address of your Juniper Mykonos Web Security appliance.
<Port> is the port number of your Juniper Mykonos Web Security appliance. The default configuration uses a port number of 5000.
Step 2 From the navigation menu, select Configuration Manager.
Step 3 From the Configuration menu, select Basic Mode.
Step 4 Click the Global Configuration tab and select Logging.
Step 5 Click the link Show Advanced Options.
Step 6 Configure the following parameters:
Table 17-1 Juniper Mykonos Web Security Logging Parameters
Parameter Description
Access logging: Log Level
Click this option to configure the level of information logged when access logging is enabled.
The options include:
• 0 - Access logging is disabled.
• 1 - Basic logging.
• 2 - Basic logging with headers.
• 3 - Basic logging with headers and body.
Note: Access logging is disabled by default. It is recommended that you only enable access logging for debugging purposes. For more information, see your Juniper Mykonos Web Security documentation.
Access logging: Log requests before processing
Click this option and select True to log the request before it is processed by Mykonos, then forward the event to STRM.
Access logging: Log requests to access log after processing
Click this option and select True to log the request after it is processed by Mykonos. After Juniper Mykonos Web Security processes the event, then it is forwarded to STRM.
Access logging: Log responses to access log after processing
Click this option and select True to log the response after it is processed by Mykonos. After Juniper Mykonos Web Security processes the event, then the event is forwarded to STRM.
Access logging: Log responses to access log before processing
Click this option and select True to log the response before it is processed by Mykonos, then forward the event to STRM.
Configuring DSMs
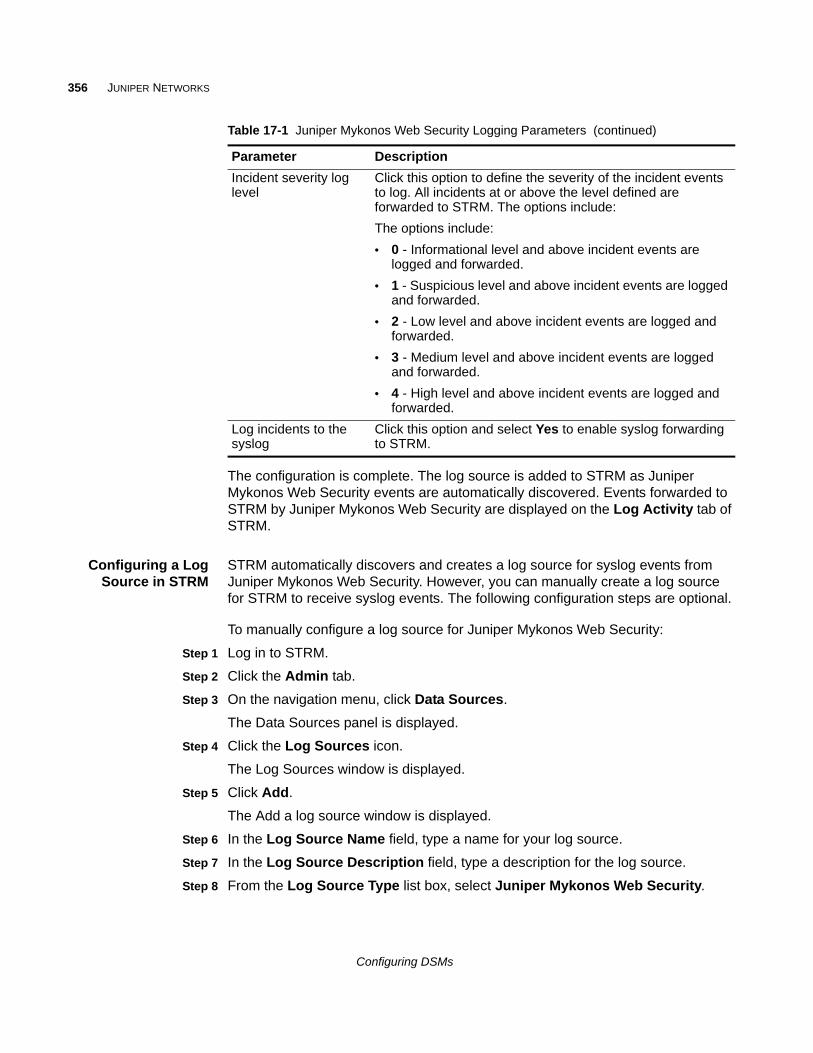
356 JUNIPER NETWORKS
The configuration is complete. The log source is added to STRM as Juniper Mykonos Web Security events are automatically discovered. Events forwarded to STRM by Juniper Mykonos Web Security are displayed on the Log Activity tab of STRM.
Configuring a LogSource in STRM
STRM automatically discovers and creates a log source for syslog events from Juniper Mykonos Web Security. However, you can manually create a log source for STRM to receive syslog events. The following configuration steps are optional.
To manually configure a log source for Juniper Mykonos Web Security:
Step 1 Log in to STRM.
Step 2 Click the Admin tab.
Step 3 On the navigation menu, click Data Sources.
The Data Sources panel is displayed.
Step 4 Click the Log Sources icon.
The Log Sources window is displayed.
Step 5 Click Add.
The Add a log source window is displayed.
Step 6 In the Log Source Name field, type a name for your log source.
Step 7 In the Log Source Description field, type a description for the log source.
Step 8 From the Log Source Type list box, select Juniper Mykonos Web Security.
Incident severity log level
Click this option to define the severity of the incident events to log. All incidents at or above the level defined are forwarded to STRM. The options include:
The options include:
• 0 - Informational level and above incident events are logged and forwarded.
• 1 - Suspicious level and above incident events are logged and forwarded.
• 2 - Low level and above incident events are logged and forwarded.
• 3 - Medium level and above incident events are logged and forwarded.
• 4 - High level and above incident events are logged and forwarded.
Log incidents to the syslog
Click this option and select Yes to enable syslog forwarding to STRM.
Table 17-1 Juniper Mykonos Web Security Logging Parameters (continued)
Parameter Description
Configuring DSMs
Juniper Mykonos Web Security 357
Step 9 Using the Protocol Configuration list box, select Syslog.
The syslog protocol configuration is displayed.
Step 10 Configure the following values:
Step 11 Click Save.
Step 12 On the Admin tab, click Deploy Changes.
The configuration is complete.
Table 17-1 Syslog Parameters
Parameter Description
Log Source Identifier Type the IP address or host name for the log source as an identifier for events from your Juniper Mykonos Web Security appliance.
Configuring DSMs

47
KASPERSKY SECURITY CENTERThe Kaspersky Security Center DSM retrieves events directly from a database on your Kaspersky Security Center appliance. STRM uses the JDBC protocol to poll a view created specifically for STRM to collect antivirus, server, and audit events.
Before you can receive events in STRM, you must create a database view for STRM to poll using the JDBC protocol. We also recommend that you create a user for STRM, as STRM requires a user account to poll the database for events. After you have configured a database view and a user account for STRM, you are ready to configure a log source in STRM for Kaspersky Security Center.
This section includes the following topics:
• Creating a Database View for Kaspersky Security Center
• Configuring the Log Source in STRM
Creating a DatabaseView for Kaspersky
Security Center
To collect audit event data, you must create a database view on your Kaspersky server that is accessible to STRM. To create a database view, you can download the klsql2.zip tool, which is available from Kaspersky or use another program that allows you to create database views. The instructions provided below define the steps required to create the dbo.events view using the Kaspersky Labs tool.
To create a database view:
Step 1 From the Kaspersky Labs website, download the klsql2.zip file:
http://support.kaspersky.com/ak8/troubleshooting?print=true&qid=208282563
Step 2 Copy klsql2.zip to your Kaspersky Security Center Administration Server.
Step 3 Extract klsql2.zip to a directory.
Step 4 The following files are included:
• klsql2.exe
• libmysql.dll
• src.sql
• start.cmd
Step 5 In any text editor, edit the src.sql file.
Configuring DSMs
360 KASPERSKY SECURITY CENTER
Step 6 Delete the following line:
SELECT * FROM v_akpub_host
Step 7 Type the following Transact-SQL statement to create the dbo.events database view:
create view dbo.events as select e.nId, e.strEventType as 'EventId', e.wstrDescription as 'EventDesc', e.tmRiseTime as 'DeviceTime', h.nIp as 'SourceInt', e.wstrPar1, e.wstrPar2, e.wstrPar3, e.wstrPar4, e.wstrPar5, e.wstrPar6, e.wstrPar7, e.wstrPar8, e.wstrPar9 from dbo.v_akpub_ev_event e, dbo.v_akpub_host h where e.strHostname = h.strName;
Step 8 Save the src.sql file.
Step 9 From the command line, navigate to the location of the klsql2 files.
Step 10 Type the following command to create the view on your Kaspersky Security Center appliance:
klsql2 -i src.sql -o result.xml
The dbo.events view is created. You are now ready to configure the log source in STRM to poll the view for Kaspersky Security Center events.
NOTEKaspersky Security Center database administrators should ensure that STRM is allowed to poll the database for events using TCP port 1433 or the port configured for your log source. Protocol connections are often disabled on databases by default and additional configuration steps might be required to allow connections for event polling. Any firewalls located between Kaspersky Security Center and STRM should also be configured to allow traffic for event polling.
Configuring the LogSource in STRM
STRM requires a user account with the proper credentials to access the view you created in the Kaspersky Security Center database. To successfully poll for audit data from the Kaspersky Security Center database, you must create a new user or provide the log source with existing user credentials to read from the dbo.events view. For more information on creating a user account, see your Kaspersky Security Center documentation.
To configure a log source for Kaspersky Security Center events:
Step 1 Click the Admin tab.
Step 2 On the navigation menu, click Data Sources.
The Data Sources panel is displayed.
Step 3 Click the Log Sources icon.
The Log Sources window is displayed.
Step 4 In the Log Source Name field, type a name for the log source.
Step 5 In the Log Source Description field, type a description for the log source.
Configuring DSMs
361
Step 6 From the Log Source Type list box, select Kaspersky Security Center.
Step 7 From the Protocol Configuration list box, select JDBC.
The JDBC protocol parameters appear.
Step 8 Configure the following values:
Table 18-1 Kaspersky Security Center JDBC Parameters
Parameter Description
Log Source Identifier
Type the identifier for the log source. Type the log source identifier in the following format:
<Kaspersky Database>@<Kaspersky Database Server IP or Host Name>
Where:
<Kaspersky Database> is the database name, as entered in the Database Name parameter.
<Kaspersky Database Server IP or Host Name> is the hostname or IP address for this log source, as entered in the IP or Hostname parameter.
Database Type From the list box, select MSDE.
Database Name Type KAV as the name of the Kaspersky Security Center database.
IP or Hostname Type the IP address or hostname of the SQL server that hosts the Kaspersky Security Center database.
Port Type the port number used by the database server. The default port for MSDE is 1433. You must enable and verify you can communicate using the port you specify in the Port field.
The JDBC configuration port must match the listener port of the Kaspersky database. The Kaspersky database must have incoming TCP connections enabled to communicate with STRM.
Note: If you define a Database Instance when using MSDE as the database type, you must leave the Port parameter blank in your configuration.
Username Type the username the log source can use to access the Kaspersky database.
Password Type the password the log source can use to access the Kaspersky database.
The password can be up to 255 characters in length.
Confirm Password
Confirm the password required to access the database. The confirmation password must be identical to the password entered in the Password field.
Authentication Domain
If you select MSDE as the Database Type and the database is configured for Windows, you must define the Window Authentication Domain. Otherwise, leave this field blank.
Configuring DSMs
362 KASPERSKY SECURITY CENTER
Database Instance
Optional. Type the database instance, if you have multiple SQL server instances on your database server.
Note: If you use a non-standard port in your database configuration, or have blocked access to port 1434 for SQL database resolution, you must leave the Database Instance parameter blank in your configuration.
Table Name Type dbo.events as the name of the table or view that includes the event records.
Select List Type * for all fields from the table or view.
You can use a comma-separated list to define specific fields from tables or views, if required for your configuration. The list must contain the field defined in the Compare Field parameter. The comma-separated list can be up to 255 alphanumeric characters in length. The list can include the following special characters: dollar sign ($), number sign (#), underscore (_), en dash (-), and period(.).
Compare Field Type nld as the compare field. The compare field is used to identify new events added between queries to the table.
Start Date and Time
Optional. Type the start date and time for database polling.
The Start Date and Time parameter must be formatted as yyyy-MM-dd HH:mm with HH specified using a 24 hour clock. If the start date or time is clear, polling begins immediately and repeats at the specified polling interval.
Use Prepared Statements
Select the Use Prepared Statements check box.
Prepared statements allows the JDBC protocol source to setup the SQL statement one time, then run the SQL statement many times with different parameters. For security and performance reasons, we recommend that you use prepared statements.
Clearing this check box requires you to use an alternative method of querying that does not use pre-compiled statements.
Polling Interval Type the polling interval, which is the amount of time between queries to the view you created. The default polling interval is 10 seconds.
You can define a longer polling interval by appending H for hours or M for minutes to the numeric value. The maximum polling interval is 1 week in any time format. Numeric values entered without an H or M poll in seconds.
EPS Throttle Type the number of Event Per Second (EPS) that you do not want this protocol to exceed. The default value is 20000 EPS.
Use Named Pipe Communication
Clear the Use Named Pipe Communications check box.
When using a Named Pipe connection, the username and password must be the appropriate Windows authentication username and password and not the database username and password. Also, you must use the default Named Pipe.
Table 18-1 Kaspersky Security Center JDBC Parameters (continued)
Parameter Description
Configuring DSMs
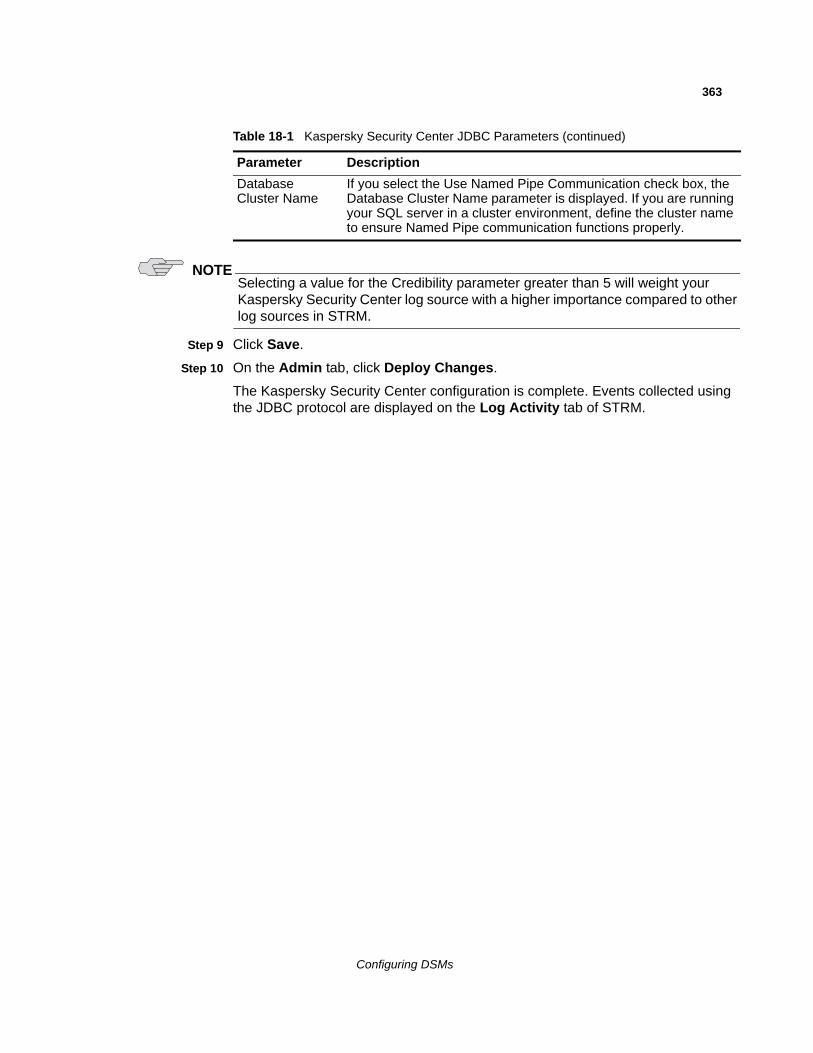
363
NOTESelecting a value for the Credibility parameter greater than 5 will weight your Kaspersky Security Center log source with a higher importance compared to other log sources in STRM.
Step 9 Click Save.
Step 10 On the Admin tab, click Deploy Changes.
The Kaspersky Security Center configuration is complete. Events collected using the JDBC protocol are displayed on the Log Activity tab of STRM.
Database Cluster Name
If you select the Use Named Pipe Communication check box, the Database Cluster Name parameter is displayed. If you are running your SQL server in a cluster environment, define the cluster name to ensure Named Pipe communication functions properly.
Table 18-1 Kaspersky Security Center JDBC Parameters (continued)
Parameter Description
Configuring DSMs

48
LIEBERMAN RANDOM PASSWORD MANAGERThe Lieberman Random Password Manager DSM for allows you to integrate STRM with Lieberman Enterprise Random Password Manager and Lieberman Random Password Manager software using syslog events in the Log Extended Event Format (LEEF). The Lieberman Random Password Manager forwards syslog events to STRM using Port 514. STRM records all relevant password management events. For information on configuring syslog forwarding, see your vendor documentation.
You are now ready to configure the log source in STRM.
STRM automatically detects syslog events forwarded from Lieberman Random Password Manager and Lieberman Enterprise Random Password Manager devices. However, if you want to manually configure STRM to receive events from these devices:
From the Log Source Type list box, select Lieberman Random Password Manager.
For more information on configuring log sources, see the STRM Log Sources Users Guide.
Configuring DSMs

49
LINUXThis section provides information on the following DSMs:
• Linux DHCP
• Linux IPtables
• Linux OS
Linux DHCP The Linux DHCP Server DSM for STRM accepts DHCP events using syslog. STRM records all relevant events from a Linux DHCP Server. Before you configure STRM to integrate with a Linux DHCP Server, you must configure syslog within your Linux DHCP Server to forward syslog events to STRM.
For more information on configuring your Linux DHCP Server, consult the man pages or associated documentation for your DHCP daemon.
STRM automatically discovers and creates log sources for syslog events forwarded from Linux DHCP Servers. However, you can manually create a log source for STRM to receive Linux DHCP Server events. The following configuration steps for creating a log source are optional.
To manually create a log source in STRM:
Step 1 Log in to STRM.
Step 2 Click the Admin tab.
Step 3 On the navigation menu, click Data Sources.
The Data Sources panel is displayed.
Step 4 Click the Log Sources icon.
The Log Sources window is displayed.
Step 5 Click Add.
The Add a log source window is displayed.
Step 6 In the Log Source Name field, type a name for your Linux DHCP Server.
Step 7 In the Log Source Description field, type a description for the log source.
Step 8 From the Log Source Type list box, select Linux DHCP Server.
Configuring DSMs
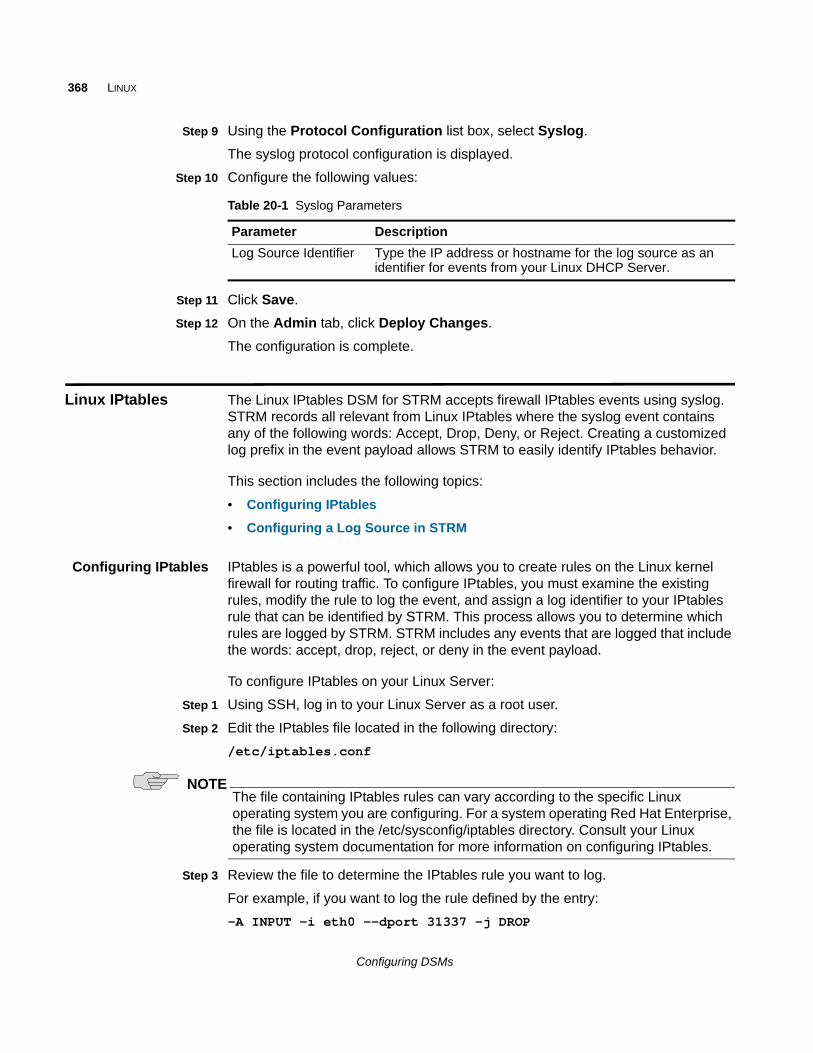
368 LINUX
Step 9 Using the Protocol Configuration list box, select Syslog.
The syslog protocol configuration is displayed.
Step 10 Configure the following values:
Step 11 Click Save.
Step 12 On the Admin tab, click Deploy Changes.
The configuration is complete.
Linux IPtables The Linux IPtables DSM for STRM accepts firewall IPtables events using syslog. STRM records all relevant from Linux IPtables where the syslog event contains any of the following words: Accept, Drop, Deny, or Reject. Creating a customized log prefix in the event payload allows STRM to easily identify IPtables behavior.
This section includes the following topics:
• Configuring IPtables
• Configuring a Log Source in STRM
Configuring IPtables IPtables is a powerful tool, which allows you to create rules on the Linux kernel firewall for routing traffic. To configure IPtables, you must examine the existing rules, modify the rule to log the event, and assign a log identifier to your IPtables rule that can be identified by STRM. This process allows you to determine which rules are logged by STRM. STRM includes any events that are logged that include the words: accept, drop, reject, or deny in the event payload.
To configure IPtables on your Linux Server:
Step 1 Using SSH, log in to your Linux Server as a root user.
Step 2 Edit the IPtables file located in the following directory:
/etc/iptables.conf
NOTEThe file containing IPtables rules can vary according to the specific Linux operating system you are configuring. For a system operating Red Hat Enterprise, the file is located in the /etc/sysconfig/iptables directory. Consult your Linux operating system documentation for more information on configuring IPtables.
Step 3 Review the file to determine the IPtables rule you want to log.
For example, if you want to log the rule defined by the entry:
-A INPUT -i eth0 --dport 31337 -j DROP
Table 20-1 Syslog Parameters
Parameter Description
Log Source Identifier Type the IP address or hostname for the log source as an identifier for events from your Linux DHCP Server.
Configuring DSMs
Linux IPtables 369
Step 4 Insert a matching rule immediately before each rule you want to log:
-A INPUT -i eth0 --dport 31337 -j DROP-A INPUT -i eth0 --dport 31337 -j DROP
Step 5 Update the target of the new rule to LOG for each rule you want to log. For example:
-A INPUT -i eth0 --dport 31337 -j LOG-A INPUT -i eth0 --dport 31337 -j DROP
Step 6 Set the log level of the LOG target to a SYSLOG priority level, such as info or notice:
-A INPUT -i eth0 --dport 31337 -j LOG --log-level info-A INPUT -i eth0 --dport 31337 -j DROP
Step 7 Configure a log prefix to identify the rule behavior. Set the log prefix parameter to Q1Target=<rule>.
Where <rule> is one of fw_accept, fw_drop, fw_reject, or fw_deny.
For example, if the rule being logged by the firewall targets dropped events, the log prefix setting should be Q1Target=fw_drop.
-A INPUT -i eth0 --dport 31337 -j LOG --log-level info --log-prefix "Q1Target=fw_drop "-A INPUT -i eth0 --dport 31337 -j DROP
NOTEThe trailing space is required before the closing quotation mark.
Step 8 Save and exit the file.
Step 9 Restart IPtables:
/etc/init.d/iptables restart
Step 10 Open the syslog.conf file.
Step 11 Add the following line:
kern.<log level> @<IP address>
Where:
<log level> is the previously set log level.
<IP address> is the IP address of STRM.
Step 12 Save and exit the file.
Step 13 Restart the syslog daemon:
/etc/init.d/syslog restart
After the syslog daemon restarts, events are forwarded to STRM. IPtable events forwarded from Linux Servers are automatically discovered and displayed in the Log Activity tab of STRM.
Configuring a LogSource in STRM
STRM automatically discovers and creates log sources for IPtables syslog events forwarded from Linux Servers. However, you can manually create a log source for
Configuring DSMs
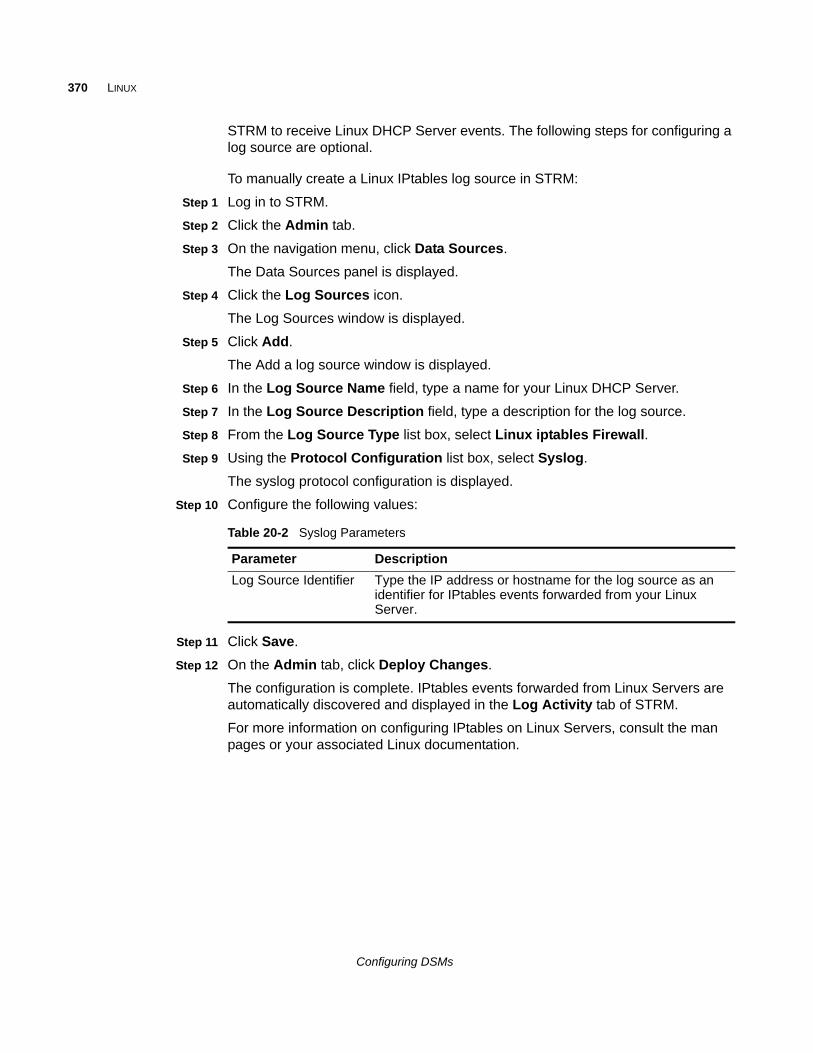
370 LINUX
STRM to receive Linux DHCP Server events. The following steps for configuring a log source are optional.
To manually create a Linux IPtables log source in STRM:
Step 1 Log in to STRM.
Step 2 Click the Admin tab.
Step 3 On the navigation menu, click Data Sources.
The Data Sources panel is displayed.
Step 4 Click the Log Sources icon.
The Log Sources window is displayed.
Step 5 Click Add.
The Add a log source window is displayed.
Step 6 In the Log Source Name field, type a name for your Linux DHCP Server.
Step 7 In the Log Source Description field, type a description for the log source.
Step 8 From the Log Source Type list box, select Linux iptables Firewall.
Step 9 Using the Protocol Configuration list box, select Syslog.
The syslog protocol configuration is displayed.
Step 10 Configure the following values:
Step 11 Click Save.
Step 12 On the Admin tab, click Deploy Changes.
The configuration is complete. IPtables events forwarded from Linux Servers are automatically discovered and displayed in the Log Activity tab of STRM.
For more information on configuring IPtables on Linux Servers, consult the man pages or your associated Linux documentation.
Table 20-2 Syslog Parameters
Parameter Description
Log Source Identifier Type the IP address or hostname for the log source as an identifier for IPtables events forwarded from your Linux Server.
Configuring DSMs
Linux OS 371
Linux OS The Linux OS DSM for STRM records Linux operating system events and forwards the events using syslog or syslog-ng. Linux OS supports cron, HTTPS, FTP, NTP, Simple Authentication Security Layer (SASL), SMTP, SNMP, SSH, Switch User (SU), and Pluggable Authentication Module (PAM) events.
If you are using syslog on a UNIX host, we recommends that you upgrade the standard syslog to a more recent version, such as, syslog-ng.
To integrate Linux OS with STRM, select one of the following syslog configurations for event collection:
• Configuring Linux OS Using Syslog
• Configuring Linux OS Using Syslog-ng
CAUTIONDo not run both syslog and syslog-ng at the same time.
Configuring Linux OSUsing Syslog
To configure Linux OS using the syslog protocol:
Step 1 Log in to your Linux OS device, as a root user.
Step 2 Open the /etc/syslog.conf file.
Step 3 Add the following facility information:
authpriv.* @<IP address>
Where <IP address> is the IP address of the STRM.
Step 4 Save the file.
Step 5 Restart syslog:
service syslog restart
Step 6 You are now ready to configure the log source in STRM.
To configure STRM to receive events from Linux OS:
From the Log Source Type list box, select Linux OS.
For more information on configuring log sources, see the STRM Log Sources Users Guide. For more information on syslog, see your Linux operating system documentation.
Configuring Linux OSUsing Syslog-ng
To configure Linux OS using the syslog-ng protocol:
Step 1 Log in to your Linux OS device, as a root user.
Step 2 Open the /etc/syslog-ng/syslog-ng.conf file.
Configuring DSMs
372 LINUX
Step 3 Add the following facility information:
filter auth_filter{ facility(authpriv); };
destination auth_destination { tcp("<IP address>" port(514)); };
log{
source(<Sourcename>);
filter(auth_filter);
destination(auth_destination);
};
Where:
<IP address> is the IP address of the STRM.
<Source name> is the name of the source defined in the configuration file.
Step 4 Save the file.
Step 5 Restart syslog-ng:
service syslog-ng restart
Step 6 You are now ready to configure the log source in STRM.
To configure STRM to receive events from Linux OS:
From the Log Source Type list box, select Linux OS.
For more information on configuring log sources, see the STRM Log Sources Users Guide. For more information on syslog-ng, see your Linux operating system documentation.
Configuring DSMs
50
MCAFEEThis section provides information on the following DSMs:
• McAfee Intrushield
• McAfee ePolicy Orchestrator
• McAfee Application / Change Control
• McAfee Web Gateway
McAfee Intrushield The McAfee Intrushield DSM for STRM accepts events using syslog. STRM records all relevant events. Before you configure STRM to integrate with a McAfee Intrushield device, you must:
Step 1 Log in to the McAfee Intrushield Manager user interface.
Step 2 In the dashboard click Configure.
Step 3 From the Resource Tree, click the root node (Admin-Domain-Name).
Step 4 Select Alert Notification > Syslog Forwarder.
Step 5 Type the Syslog Server details.
a The Enable Syslog Forwarder must be configured as Yes.
b The Port must be configured to 514.
Step 6 Click Edit.
Step 7 Choose one of the following:
a If you are using a version of McAfee Intrushield that does not have patches applied, type the following to customize the message string:
|$ALERT_ID$|$ALERT_TYPE$|$ATTACK_TIME$|"$ATTACK_NAME$"|$ATTACK_ID$|$ATTACK_SEVERITY$|$ATTACK_SIGNATURE$|$ATTACK_CONFIDENCE$|$ADMIN_DOMAIN$|$SENSOR_NAME$|$INTERFACE$|$SOURCE_IP$|$SOURCE_PORT$|$DESTINATION_IP$|$DESTINATION_PORT$|
The custom message string must be entered as a single line, no carriage returns. Versions of McAfee Intrushield that do not have patches applied use different message strings than patched versions. If you are unsure what string type to use, contact McAfee Customer Support.
Configuring DSMs
374 MCAFEE
b If you are using a version of McAfee Intrushield that has patches applied from 3.x and above, type the following to customize the message string:
|$IV_ALERT_ID$|$IV_ALERT_TYPE$|$IV_ATTACK_TIME$|"$IV_ATTACK_NAME$"|$IV_ATTACK_ID$|$IV_ATTACK_SEVERITY$|$IV_ATTACK_SIGNATURE$|$IV_ATTACK_CONFIDENCE$|$IV_ADMIN_DOMAIN$|$IV_SENSOR_NAME$|$IV_INTERFACE$|$IV_SOURCE_IP$|$IV_SOURCE_PORT$|$IV_DESTINATION_IP$|$IV_DESTINATION_PORT$|
The custom message string must be entered as a single line, no carriage returns. Versions of McAfee Intrushield with patches applied use custom message strings that begin with $IV. If you are unsure what string type to use, contact McAfee Customer Support.
Step 8 You are now ready to configure the log source in STRM.
To configure STRM to receive events from a McAfee IntruShield device:
From the Log Source Type list box, select McAfee IntruShield Network IPS Appliance.
For more information on configuring log sources, see the STRM Log Sources Users Guide. For more information on McAfee Intrushield, see your vendor documentation.
McAfee ePolicy Orchestrator
The McAfee ePolicy Orchestrator (ePO) DSM for STRM accepts events using Java Database Connectivity (JDBC) or Simple Network Management Protocol (SNMPv2, and SNMPv3). STRM records all relevant ePO anti-virus events from JDBC or SNMP. You can configure McAfee ePolicy Orchestrator to integrate with STRM using one of the following methods:
• Configuring STRM to Receive Events Using the JDBC Protocol
• Configuring ePO to Forward SNMP Events
Configuring STRM toReceive EventsUsing the JDBC
Protocol
To configure STRM to access the ePO database using the JDBC protocol:
Step 1 Click the Admin tab.
Step 2 On the navigation menu, click Data Sources.
The Data Sources panel is displayed.
Step 3 Click the Log Sources icon.
The Log Sources window is displayed.
Step 4 Click Add.
The Add a log source window is displayed.
Configuring DSMs
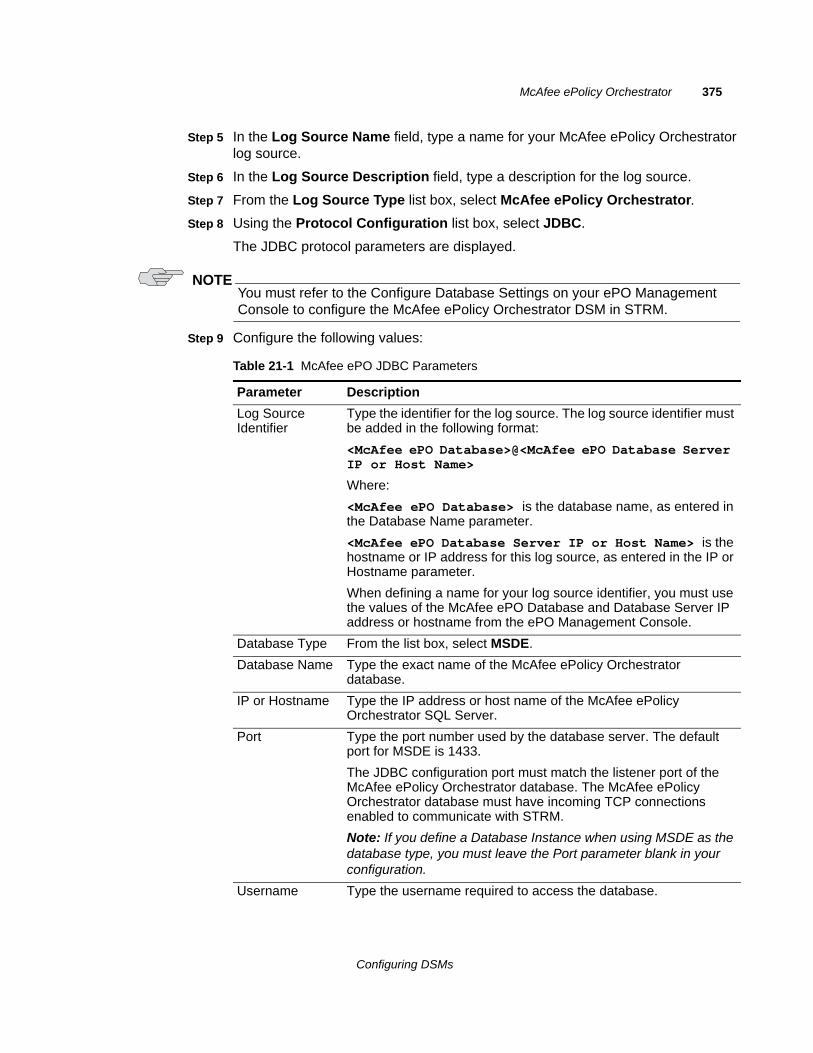
McAfee ePolicy Orchestrator 375
Step 5 In the Log Source Name field, type a name for your McAfee ePolicy Orchestrator log source.
Step 6 In the Log Source Description field, type a description for the log source.
Step 7 From the Log Source Type list box, select McAfee ePolicy Orchestrator.
Step 8 Using the Protocol Configuration list box, select JDBC.
The JDBC protocol parameters are displayed.
NOTEYou must refer to the Configure Database Settings on your ePO Management Console to configure the McAfee ePolicy Orchestrator DSM in STRM.
Step 9 Configure the following values:
Table 21-1 McAfee ePO JDBC Parameters
Parameter Description
Log Source Identifier
Type the identifier for the log source. The log source identifier must be added in the following format:
<McAfee ePO Database>@<McAfee ePO Database Server IP or Host Name>
Where:
<McAfee ePO Database> is the database name, as entered in the Database Name parameter.
<McAfee ePO Database Server IP or Host Name> is the hostname or IP address for this log source, as entered in the IP or Hostname parameter.
When defining a name for your log source identifier, you must use the values of the McAfee ePO Database and Database Server IP address or hostname from the ePO Management Console.
Database Type From the list box, select MSDE.
Database Name Type the exact name of the McAfee ePolicy Orchestrator database.
IP or Hostname Type the IP address or host name of the McAfee ePolicy Orchestrator SQL Server.
Port Type the port number used by the database server. The default port for MSDE is 1433.
The JDBC configuration port must match the listener port of the McAfee ePolicy Orchestrator database. The McAfee ePolicy Orchestrator database must have incoming TCP connections enabled to communicate with STRM.
Note: If you define a Database Instance when using MSDE as the database type, you must leave the Port parameter blank in your configuration.
Username Type the username required to access the database.
Configuring DSMs
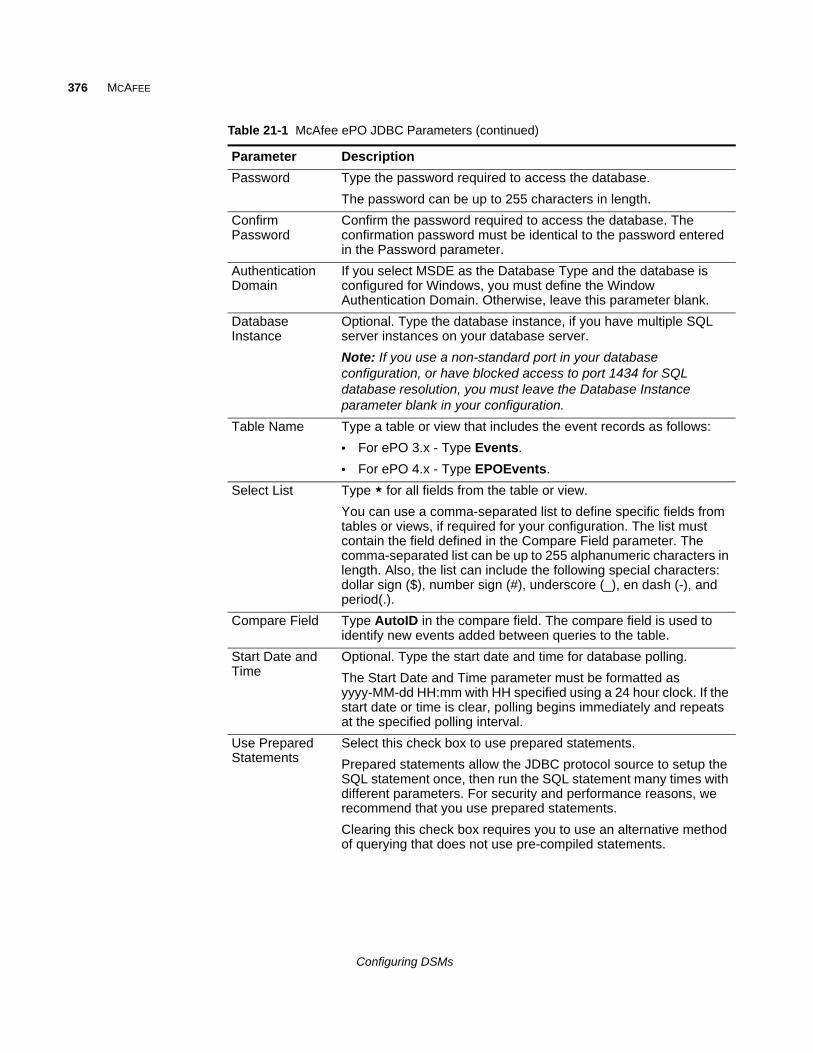
376 MCAFEE
Password Type the password required to access the database.
The password can be up to 255 characters in length.
Confirm Password
Confirm the password required to access the database. The confirmation password must be identical to the password entered in the Password parameter.
Authentication Domain
If you select MSDE as the Database Type and the database is configured for Windows, you must define the Window Authentication Domain. Otherwise, leave this parameter blank.
Database Instance
Optional. Type the database instance, if you have multiple SQL server instances on your database server.
Note: If you use a non-standard port in your database configuration, or have blocked access to port 1434 for SQL database resolution, you must leave the Database Instance parameter blank in your configuration.
Table Name Type a table or view that includes the event records as follows:
• For ePO 3.x - Type Events.
• For ePO 4.x - Type EPOEvents.
Select List Type * for all fields from the table or view.
You can use a comma-separated list to define specific fields from tables or views, if required for your configuration. The list must contain the field defined in the Compare Field parameter. The comma-separated list can be up to 255 alphanumeric characters in length. Also, the list can include the following special characters: dollar sign ($), number sign (#), underscore (_), en dash (-), and period(.).
Compare Field Type AutoID in the compare field. The compare field is used to identify new events added between queries to the table.
Start Date and Time
Optional. Type the start date and time for database polling.
The Start Date and Time parameter must be formatted as yyyy-MM-dd HH:mm with HH specified using a 24 hour clock. If the start date or time is clear, polling begins immediately and repeats at the specified polling interval.
Use Prepared Statements
Select this check box to use prepared statements.
Prepared statements allow the JDBC protocol source to setup the SQL statement once, then run the SQL statement many times with different parameters. For security and performance reasons, we recommend that you use prepared statements.
Clearing this check box requires you to use an alternative method of querying that does not use pre-compiled statements.
Table 21-1 McAfee ePO JDBC Parameters (continued)
Parameter Description
Configuring DSMs
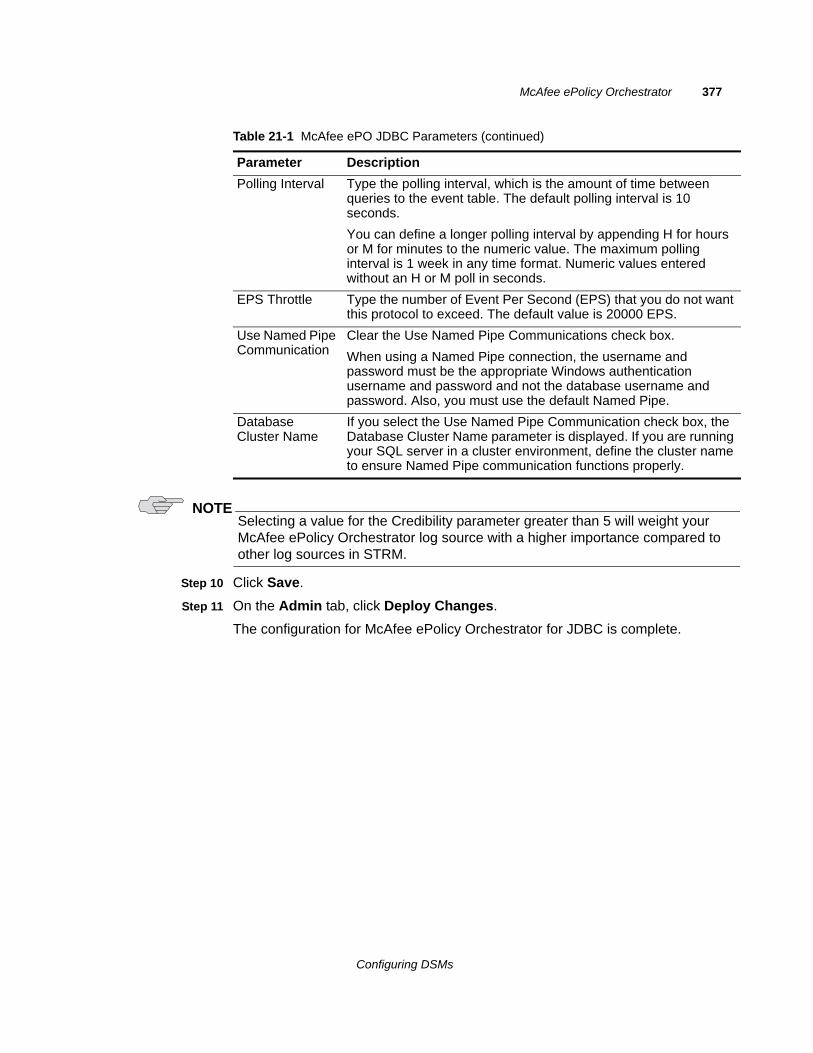
McAfee ePolicy Orchestrator 377
NOTESelecting a value for the Credibility parameter greater than 5 will weight your McAfee ePolicy Orchestrator log source with a higher importance compared to other log sources in STRM.
Step 10 Click Save.
Step 11 On the Admin tab, click Deploy Changes.
The configuration for McAfee ePolicy Orchestrator for JDBC is complete.
Polling Interval Type the polling interval, which is the amount of time between queries to the event table. The default polling interval is 10 seconds.
You can define a longer polling interval by appending H for hours or M for minutes to the numeric value. The maximum polling interval is 1 week in any time format. Numeric values entered without an H or M poll in seconds.
EPS Throttle Type the number of Event Per Second (EPS) that you do not want this protocol to exceed. The default value is 20000 EPS.
Use Named Pipe Communication
Clear the Use Named Pipe Communications check box.
When using a Named Pipe connection, the username and password must be the appropriate Windows authentication username and password and not the database username and password. Also, you must use the default Named Pipe.
Database Cluster Name
If you select the Use Named Pipe Communication check box, the Database Cluster Name parameter is displayed. If you are running your SQL server in a cluster environment, define the cluster name to ensure Named Pipe communication functions properly.
Table 21-1 McAfee ePO JDBC Parameters (continued)
Parameter Description
Configuring DSMs
378 MCAFEE
Configuring ePO toForward SNMP
Events
To configure ePO to forward events using SNMP, you must complete the following configuration steps on your McAfee ePolicy Orchestrator device:
1 Add a registered server. For more information, see Adding a Registered Server to McAfee ePO.
2 Configure the SNMP trap notifications on your ePO device. For more information, see Configuring SNMP Notifications.
3 Configure the log source and protocol in STRM. For more information, see Configuring the Log Source in STRM.
4 Optional. Install the Java Cryptography Extension for high level SNMP decryption algorithms. For more information, see Installing the Java Cryptography Extension.
Adding a Registered Server to McAfee ePO
Step 1 Log in to your McAfee ePolicy Orchestrator console.
Step 2 Select Menu > Configuration > Registered Servers.
Step 3 Click New Server.
The Registered Server Builder wizard is displayed.
Step 4 From the Server Type menu, select SNMP Server.
Step 5 Type the name and any additional notes about the SNMP server, click Next.
The Details page is displayed.
Step 6 From the Address list box, select the type of server address you are using:
a DNS Name - Type the DNS name of STRM.
b IPv4 - Type the IPv4 address of STRM.
c IPv6 - Type the IPv6 address of STRM.
Step 7 From the SNMP Version list box, select the SNMP version to use with STRM.
a If you are using SNMPv2c, you must provide the Community name.
b If you are using SNMPv3, you must provide the SNMPv3 Security details.
Step 8 Click Send Test Trap to verify the SNMP configuration.
Step 9 Click Save.
The SNMP server you configured is added to the Registered Server page.
You are now ready to configure the SNMP notifications in McAfee ePolicy Orchestrator.
Configuring SNMP Notifications
To configure the event type to generate SNMP trap notifications:
Step 1 Select Menu > Automation > Automatic Responses.
Configuring DSMs
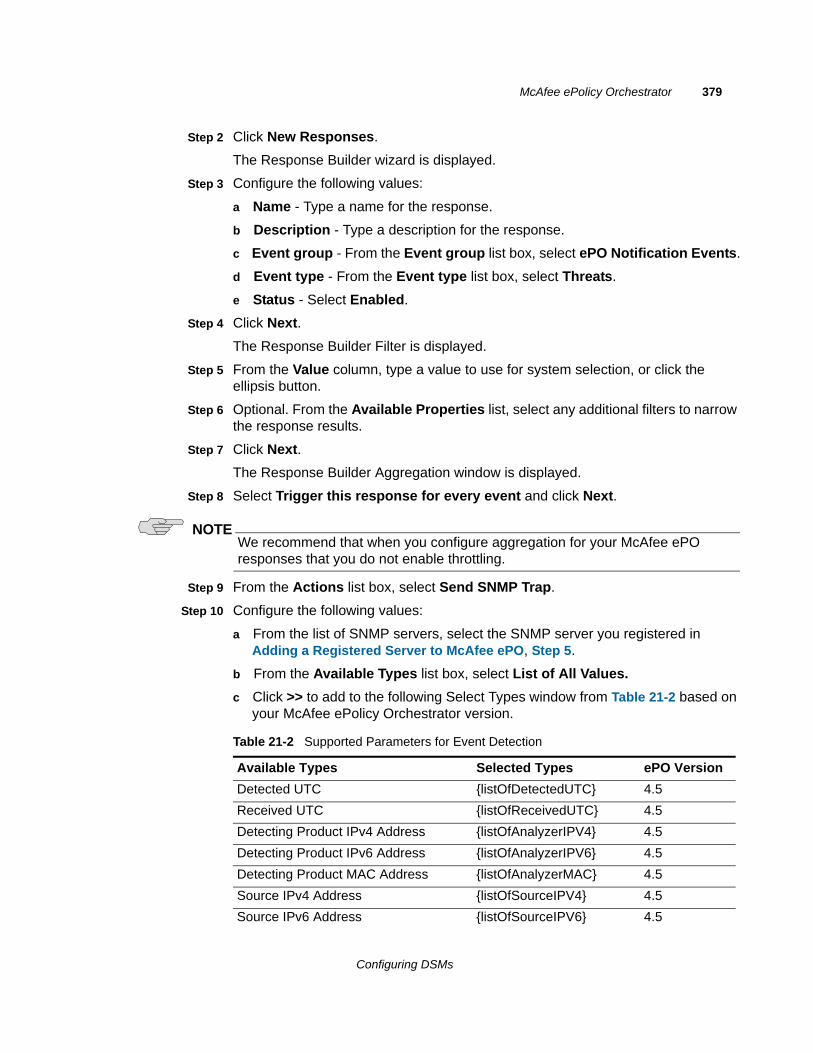
McAfee ePolicy Orchestrator 379
Step 2 Click New Responses.
The Response Builder wizard is displayed.
Step 3 Configure the following values:
a Name - Type a name for the response.
b Description - Type a description for the response.
c Event group - From the Event group list box, select ePO Notification Events.
d Event type - From the Event type list box, select Threats.
e Status - Select Enabled.
Step 4 Click Next.
The Response Builder Filter is displayed.
Step 5 From the Value column, type a value to use for system selection, or click the ellipsis button.
Step 6 Optional. From the Available Properties list, select any additional filters to narrow the response results.
Step 7 Click Next.
The Response Builder Aggregation window is displayed.
Step 8 Select Trigger this response for every event and click Next.
NOTEWe recommend that when you configure aggregation for your McAfee ePO responses that you do not enable throttling.
Step 9 From the Actions list box, select Send SNMP Trap.
Step 10 Configure the following values:
a From the list of SNMP servers, select the SNMP server you registered in Adding a Registered Server to McAfee ePO, Step 5.
b From the Available Types list box, select List of All Values.
c Click >> to add to the following Select Types window from Table 21-2 based on your McAfee ePolicy Orchestrator version.
Table 21-2 Supported Parameters for Event Detection
Available Types Selected Types ePO Version
Detected UTC {listOfDetectedUTC} 4.5
Received UTC {listOfReceivedUTC} 4.5
Detecting Product IPv4 Address {listOfAnalyzerIPV4} 4.5
Detecting Product IPv6 Address {listOfAnalyzerIPV6} 4.5
Detecting Product MAC Address {listOfAnalyzerMAC} 4.5
Source IPv4 Address {listOfSourceIPV4} 4.5
Source IPv6 Address {listOfSourceIPV6} 4.5
Configuring DSMs
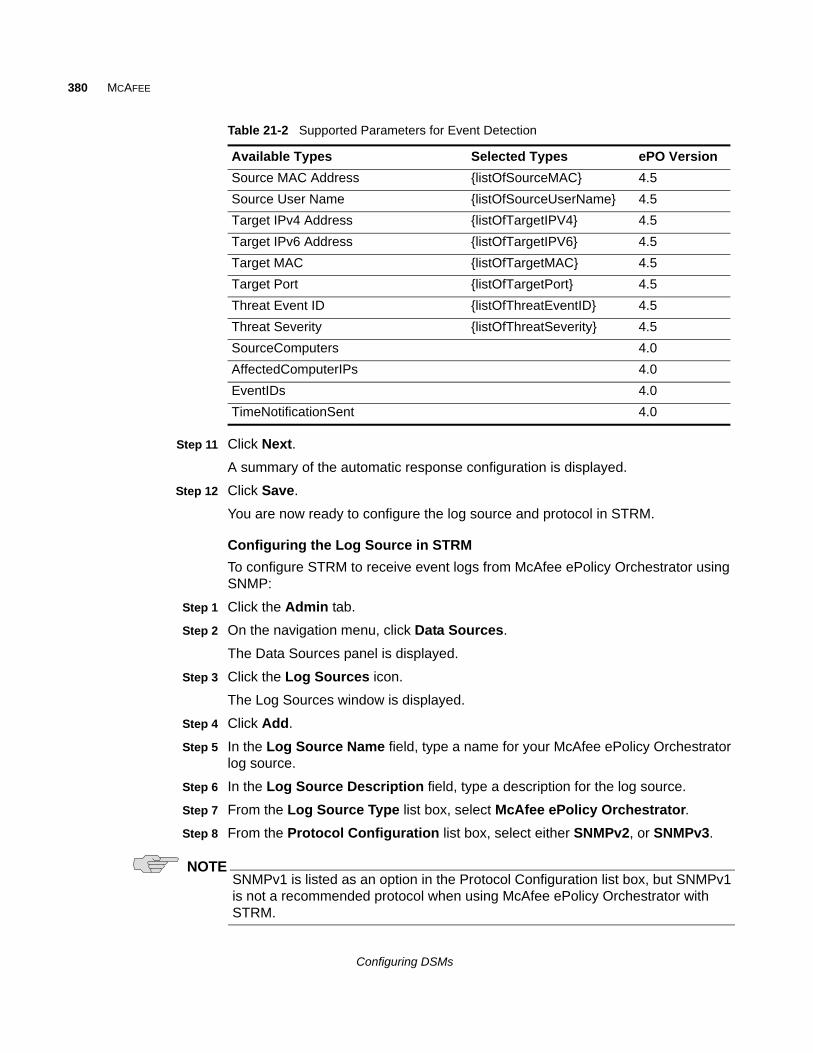
380 MCAFEE
Step 11 Click Next.
A summary of the automatic response configuration is displayed.
Step 12 Click Save.
You are now ready to configure the log source and protocol in STRM.
Configuring the Log Source in STRM
To configure STRM to receive event logs from McAfee ePolicy Orchestrator using SNMP:
Step 1 Click the Admin tab.
Step 2 On the navigation menu, click Data Sources.
The Data Sources panel is displayed.
Step 3 Click the Log Sources icon.
The Log Sources window is displayed.
Step 4 Click Add.
Step 5 In the Log Source Name field, type a name for your McAfee ePolicy Orchestrator log source.
Step 6 In the Log Source Description field, type a description for the log source.
Step 7 From the Log Source Type list box, select McAfee ePolicy Orchestrator.
Step 8 From the Protocol Configuration list box, select either SNMPv2, or SNMPv3.
NOTESNMPv1 is listed as an option in the Protocol Configuration list box, but SNMPv1 is not a recommended protocol when using McAfee ePolicy Orchestrator with STRM.
Source MAC Address {listOfSourceMAC} 4.5
Source User Name {listOfSourceUserName} 4.5
Target IPv4 Address {listOfTargetIPV4} 4.5
Target IPv6 Address {listOfTargetIPV6} 4.5
Target MAC {listOfTargetMAC} 4.5
Target Port {listOfTargetPort} 4.5
Threat Event ID {listOfThreatEventID} 4.5
Threat Severity {listOfThreatSeverity} 4.5
SourceComputers 4.0
AffectedComputerIPs 4.0
EventIDs 4.0
TimeNotificationSent 4.0
Table 21-2 Supported Parameters for Event Detection
Available Types Selected Types ePO Version
Configuring DSMs
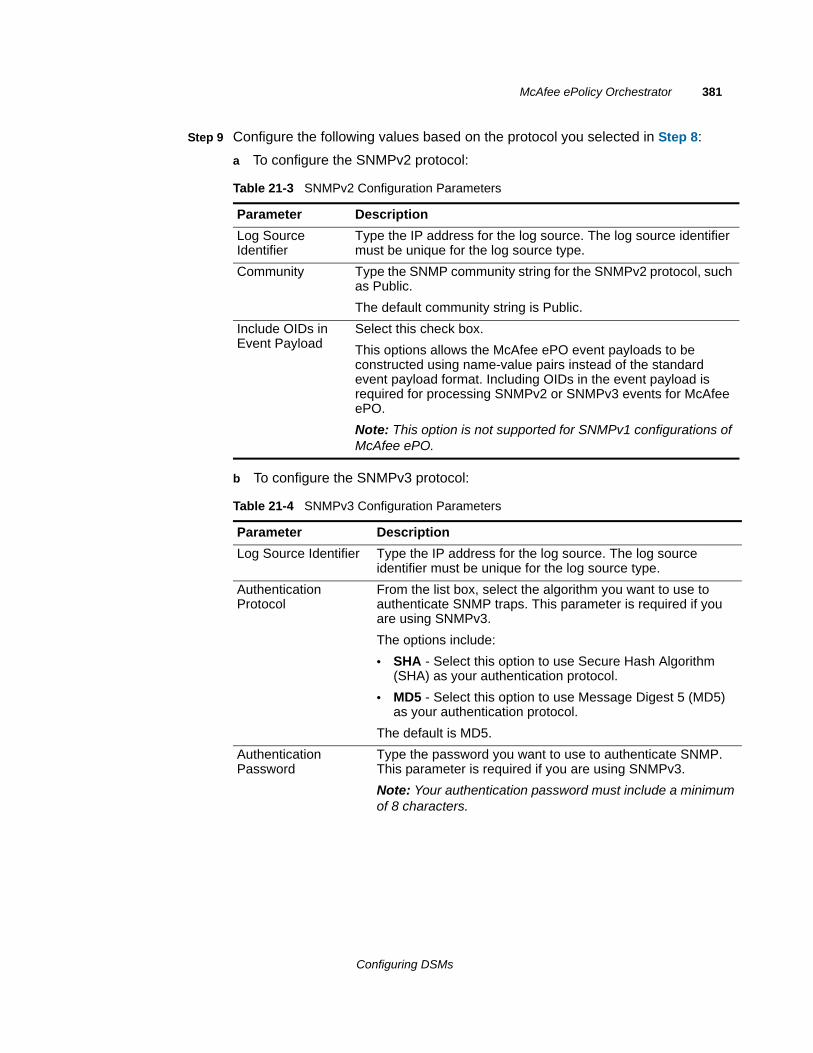
McAfee ePolicy Orchestrator 381
Step 9 Configure the following values based on the protocol you selected in Step 8:
a To configure the SNMPv2 protocol:
b To configure the SNMPv3 protocol:
Table 21-3 SNMPv2 Configuration Parameters
Parameter Description
Log Source Identifier
Type the IP address for the log source. The log source identifier must be unique for the log source type.
Community Type the SNMP community string for the SNMPv2 protocol, such as Public.
The default community string is Public.
Include OIDs in Event Payload
Select this check box.
This options allows the McAfee ePO event payloads to be constructed using name-value pairs instead of the standard event payload format. Including OIDs in the event payload is required for processing SNMPv2 or SNMPv3 events for McAfee ePO.
Note: This option is not supported for SNMPv1 configurations of McAfee ePO.
Table 21-4 SNMPv3 Configuration Parameters
Parameter Description
Log Source Identifier Type the IP address for the log source. The log source identifier must be unique for the log source type.
Authentication Protocol
From the list box, select the algorithm you want to use to authenticate SNMP traps. This parameter is required if you are using SNMPv3.
The options include:
• SHA - Select this option to use Secure Hash Algorithm (SHA) as your authentication protocol.
• MD5 - Select this option to use Message Digest 5 (MD5) as your authentication protocol.
The default is MD5.
Authentication Password
Type the password you want to use to authenticate SNMP. This parameter is required if you are using SNMPv3.
Note: Your authentication password must include a minimum of 8 characters.
Configuring DSMs
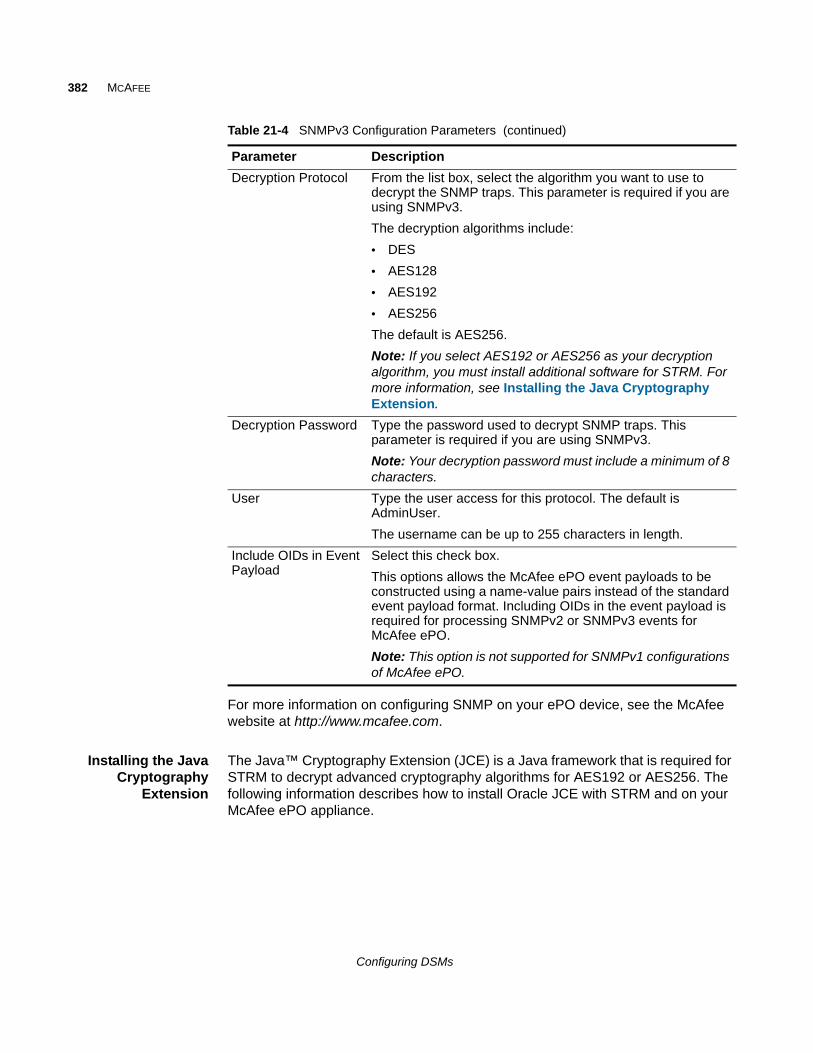
382 MCAFEE
For more information on configuring SNMP on your ePO device, see the McAfee website at http://www.mcafee.com.
Installing the JavaCryptography
Extension
The Java™ Cryptography Extension (JCE) is a Java framework that is required for STRM to decrypt advanced cryptography algorithms for AES192 or AES256. The following information describes how to install Oracle JCE with STRM and on your McAfee ePO appliance.
Decryption Protocol From the list box, select the algorithm you want to use to decrypt the SNMP traps. This parameter is required if you are using SNMPv3.
The decryption algorithms include:
• DES
• AES128
• AES192
• AES256
The default is AES256.
Note: If you select AES192 or AES256 as your decryption algorithm, you must install additional software for STRM. For more information, see Installing the Java Cryptography Extension.
Decryption Password Type the password used to decrypt SNMP traps. This parameter is required if you are using SNMPv3.
Note: Your decryption password must include a minimum of 8 characters.
User Type the user access for this protocol. The default is AdminUser.
The username can be up to 255 characters in length.
Include OIDs in Event Payload
Select this check box.
This options allows the McAfee ePO event payloads to be constructed using a name-value pairs instead of the standard event payload format. Including OIDs in the event payload is required for processing SNMPv2 or SNMPv3 events for McAfee ePO.
Note: This option is not supported for SNMPv1 configurations of McAfee ePO.
Table 21-4 SNMPv3 Configuration Parameters (continued)
Parameter Description
Configuring DSMs
McAfee ePolicy Orchestrator 383
To allow AES192 or AES256 decryption on STRM, you must:
1 Install the JCE on McAfee ePolicy Orchestrator
2 Install the JCE on STRM
Install the JCE on McAfee ePolicy Orchestrator
To install the Oracle JCE on your McAfee ePO appliance:
Step 1 Download the latest version of the Java Cryptography Extension:
http://www.oracle.com/technetwork/java/javase/downloads/index.html
There may be several versions of the JCE available for download. The version you download should match the version of the Java™ installed on your McAfee ePO appliance.
Step 2 Copy the JCE zip file to the following directory on your McAfee ePO appliance:
<McAfee ePO>/jre/lib/security
Where <McAfee ePO> is the installation path for ePolicy Orchestrator.
The installation is complete.
NOTEYou do not need to extract the zip files for the Java Cryptography Extension on your McAfee ePolicy Orchestrator appliance.
Install the JCE on STRM
To install the Oracle JCE on STRM:
Step 1 Download the latest version of the Java™ Cryptography Extension:
http://www.oracle.com/technetwork/java/javase/downloads/index.html
There may be several versions of the JCE available for download. The version you download should match the version of Java installed on STRM.
Step 2 Extract the JCE file.
The following Java archive (JAR) files are included in the JCE download:
• local_policy.jar
• US_export_policy.jar
Step 3 Using SSH, log in to your STRM Console or Event Collector as a root user.
Username: root
Password: <password>
Step 4 Copy the JCE jar files to the following directory on your STRM Console or Event Collector:
/usr/java/latest/jre/lib/
The JCE jar files are only copied to the system receiving the AES192 or AE256 encrypted files from McAfee ePolicy Orchestrator. Depending on your configuration, this could be the STRM Console or an Event Collector.
Configuring DSMs
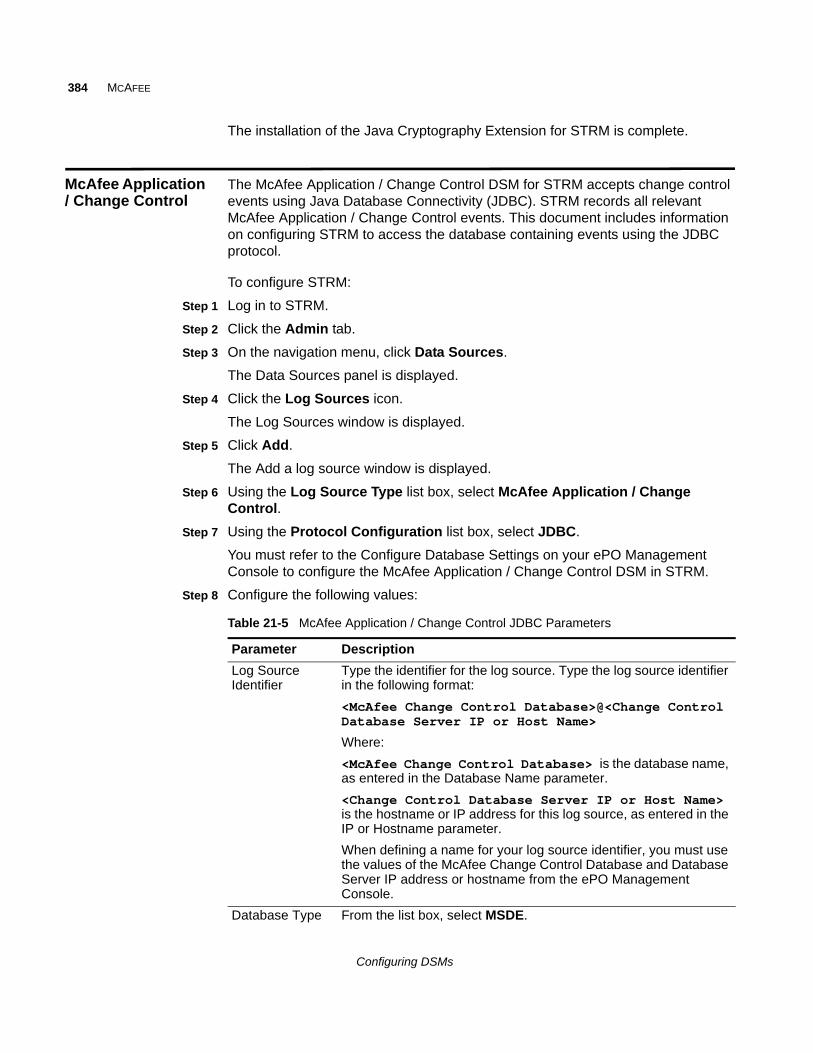
384 MCAFEE
The installation of the Java Cryptography Extension for STRM is complete.
McAfee Application / Change Control
The McAfee Application / Change Control DSM for STRM accepts change control events using Java Database Connectivity (JDBC). STRM records all relevant McAfee Application / Change Control events. This document includes information on configuring STRM to access the database containing events using the JDBC protocol.
To configure STRM:
Step 1 Log in to STRM.
Step 2 Click the Admin tab.
Step 3 On the navigation menu, click Data Sources.
The Data Sources panel is displayed.
Step 4 Click the Log Sources icon.
The Log Sources window is displayed.
Step 5 Click Add.
The Add a log source window is displayed.
Step 6 Using the Log Source Type list box, select McAfee Application / Change Control.
Step 7 Using the Protocol Configuration list box, select JDBC.
You must refer to the Configure Database Settings on your ePO Management Console to configure the McAfee Application / Change Control DSM in STRM.
Step 8 Configure the following values:
Table 21-5 McAfee Application / Change Control JDBC Parameters
Parameter Description
Log Source Identifier
Type the identifier for the log source. Type the log source identifier in the following format:
<McAfee Change Control Database>@<Change Control Database Server IP or Host Name>
Where:
<McAfee Change Control Database> is the database name, as entered in the Database Name parameter.
<Change Control Database Server IP or Host Name> is the hostname or IP address for this log source, as entered in the IP or Hostname parameter.
When defining a name for your log source identifier, you must use the values of the McAfee Change Control Database and Database Server IP address or hostname from the ePO Management Console.
Database Type From the list box, select MSDE.
Configuring DSMs
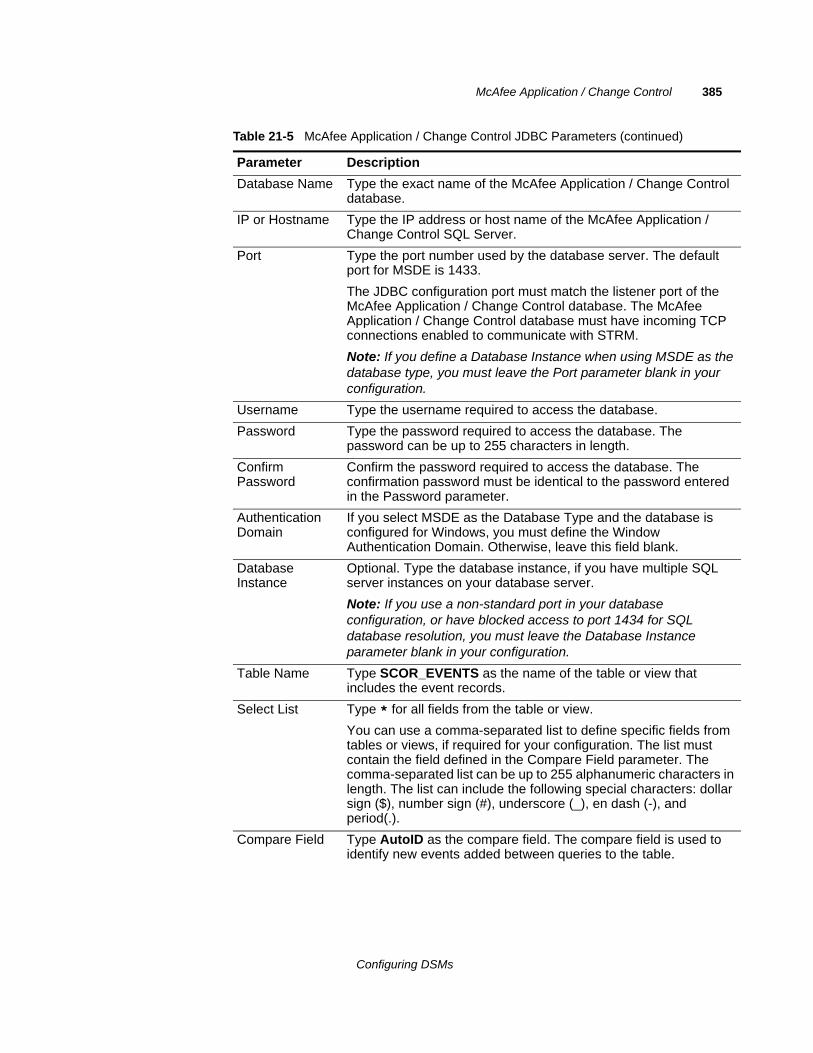
McAfee Application / Change Control 385
Database Name Type the exact name of the McAfee Application / Change Control database.
IP or Hostname Type the IP address or host name of the McAfee Application / Change Control SQL Server.
Port Type the port number used by the database server. The default port for MSDE is 1433.
The JDBC configuration port must match the listener port of the McAfee Application / Change Control database. The McAfee Application / Change Control database must have incoming TCP connections enabled to communicate with STRM.
Note: If you define a Database Instance when using MSDE as the database type, you must leave the Port parameter blank in your configuration.
Username Type the username required to access the database.
Password Type the password required to access the database. The password can be up to 255 characters in length.
Confirm Password
Confirm the password required to access the database. The confirmation password must be identical to the password entered in the Password parameter.
Authentication Domain
If you select MSDE as the Database Type and the database is configured for Windows, you must define the Window Authentication Domain. Otherwise, leave this field blank.
Database Instance
Optional. Type the database instance, if you have multiple SQL server instances on your database server.
Note: If you use a non-standard port in your database configuration, or have blocked access to port 1434 for SQL database resolution, you must leave the Database Instance parameter blank in your configuration.
Table Name Type SCOR_EVENTS as the name of the table or view that includes the event records.
Select List Type * for all fields from the table or view.
You can use a comma-separated list to define specific fields from tables or views, if required for your configuration. The list must contain the field defined in the Compare Field parameter. The comma-separated list can be up to 255 alphanumeric characters in length. The list can include the following special characters: dollar sign ($), number sign (#), underscore (_), en dash (-), and period(.).
Compare Field Type AutoID as the compare field. The compare field is used to identify new events added between queries to the table.
Table 21-5 McAfee Application / Change Control JDBC Parameters (continued)
Parameter Description
Configuring DSMs
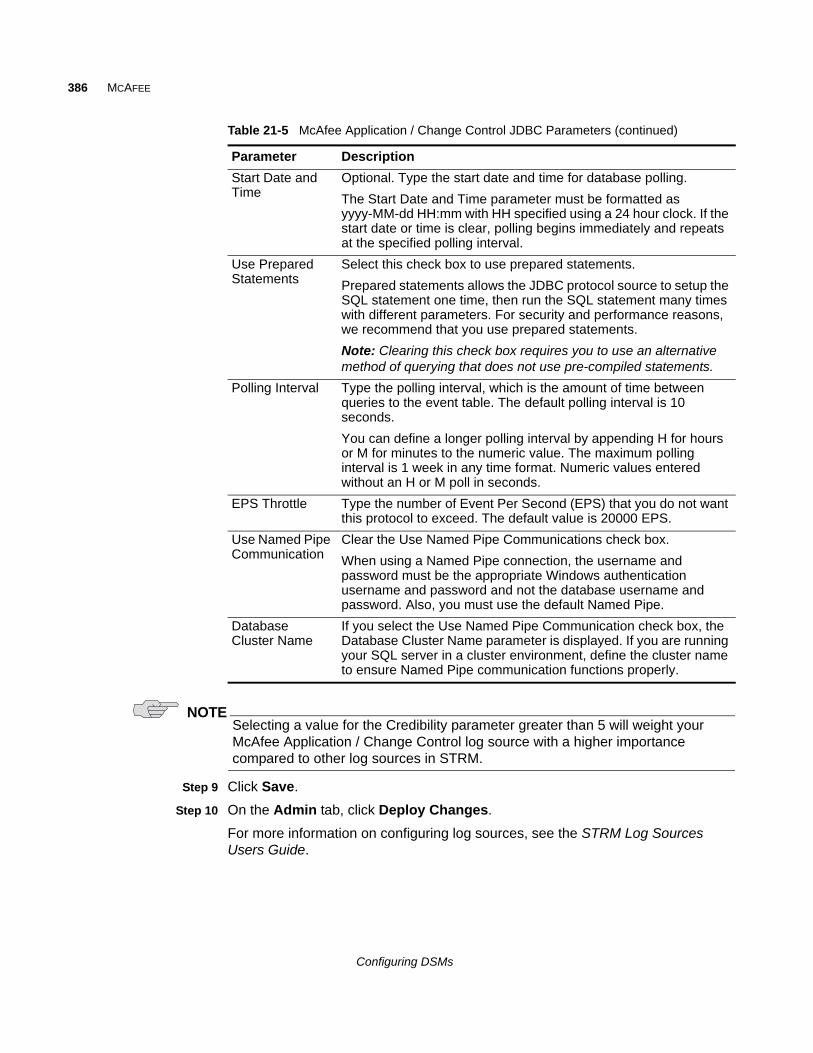
386 MCAFEE
NOTESelecting a value for the Credibility parameter greater than 5 will weight your McAfee Application / Change Control log source with a higher importance compared to other log sources in STRM.
Step 9 Click Save.
Step 10 On the Admin tab, click Deploy Changes.
For more information on configuring log sources, see the STRM Log Sources Users Guide.
Start Date and Time
Optional. Type the start date and time for database polling.
The Start Date and Time parameter must be formatted as yyyy-MM-dd HH:mm with HH specified using a 24 hour clock. If the start date or time is clear, polling begins immediately and repeats at the specified polling interval.
Use Prepared Statements
Select this check box to use prepared statements.
Prepared statements allows the JDBC protocol source to setup the SQL statement one time, then run the SQL statement many times with different parameters. For security and performance reasons, we recommend that you use prepared statements.
Note: Clearing this check box requires you to use an alternative method of querying that does not use pre-compiled statements.
Polling Interval Type the polling interval, which is the amount of time between queries to the event table. The default polling interval is 10 seconds.
You can define a longer polling interval by appending H for hours or M for minutes to the numeric value. The maximum polling interval is 1 week in any time format. Numeric values entered without an H or M poll in seconds.
EPS Throttle Type the number of Event Per Second (EPS) that you do not want this protocol to exceed. The default value is 20000 EPS.
Use Named Pipe Communication
Clear the Use Named Pipe Communications check box.
When using a Named Pipe connection, the username and password must be the appropriate Windows authentication username and password and not the database username and password. Also, you must use the default Named Pipe.
Database Cluster Name
If you select the Use Named Pipe Communication check box, the Database Cluster Name parameter is displayed. If you are running your SQL server in a cluster environment, define the cluster name to ensure Named Pipe communication functions properly.
Table 21-5 McAfee Application / Change Control JDBC Parameters (continued)
Parameter Description
Configuring DSMs
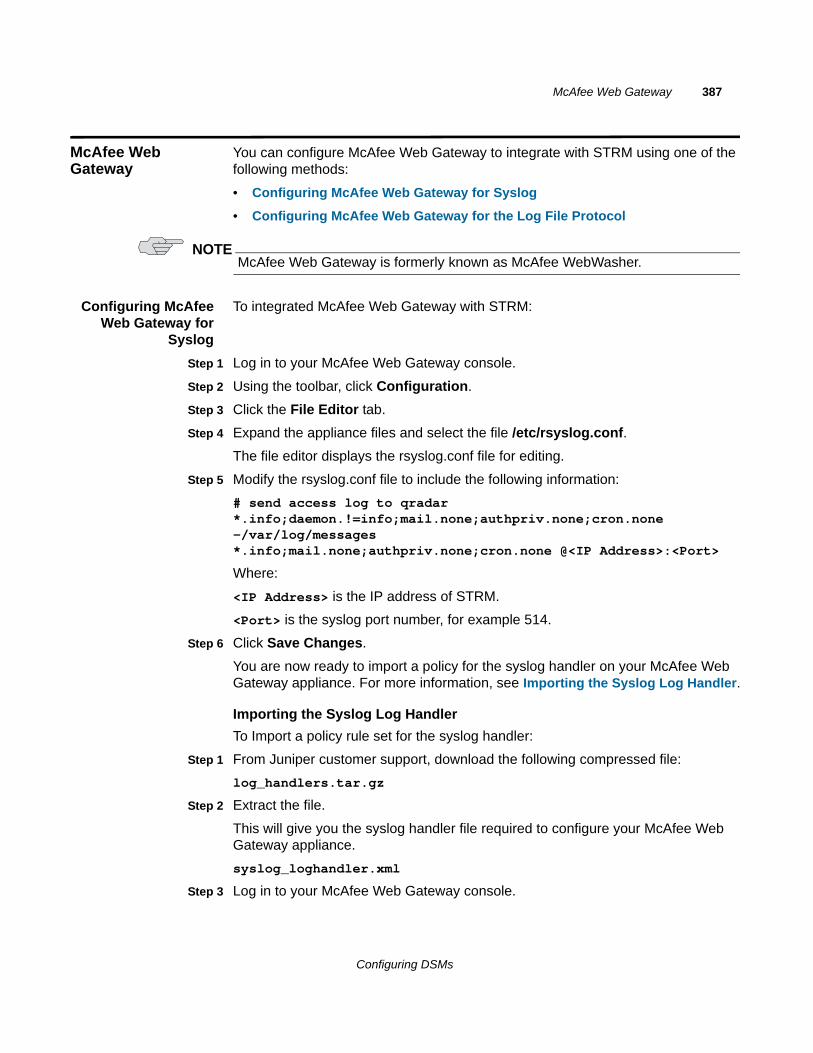
McAfee Web Gateway 387
McAfee Web Gateway
You can configure McAfee Web Gateway to integrate with STRM using one of the following methods:
• Configuring McAfee Web Gateway for Syslog
• Configuring McAfee Web Gateway for the Log File Protocol
NOTEMcAfee Web Gateway is formerly known as McAfee WebWasher.
Configuring McAfeeWeb Gateway for
Syslog
To integrated McAfee Web Gateway with STRM:
Step 1 Log in to your McAfee Web Gateway console.
Step 2 Using the toolbar, click Configuration.
Step 3 Click the File Editor tab.
Step 4 Expand the appliance files and select the file /etc/rsyslog.conf.
The file editor displays the rsyslog.conf file for editing.
Step 5 Modify the rsyslog.conf file to include the following information:
# send access log to qradar*.info;daemon.!=info;mail.none;authpriv.none;cron.none -/var/log/messages*.info;mail.none;authpriv.none;cron.none @<IP Address>:<Port>
Where:
<IP Address> is the IP address of STRM.
<Port> is the syslog port number, for example 514.
Step 6 Click Save Changes.
You are now ready to import a policy for the syslog handler on your McAfee Web Gateway appliance. For more information, see Importing the Syslog Log Handler.
Importing the Syslog Log Handler
To Import a policy rule set for the syslog handler:
Step 1 From Juniper customer support, download the following compressed file:
log_handlers.tar.gz
Step 2 Extract the file.
This will give you the syslog handler file required to configure your McAfee Web Gateway appliance.
syslog_loghandler.xml
Step 3 Log in to your McAfee Web Gateway console.
Configuring DSMs
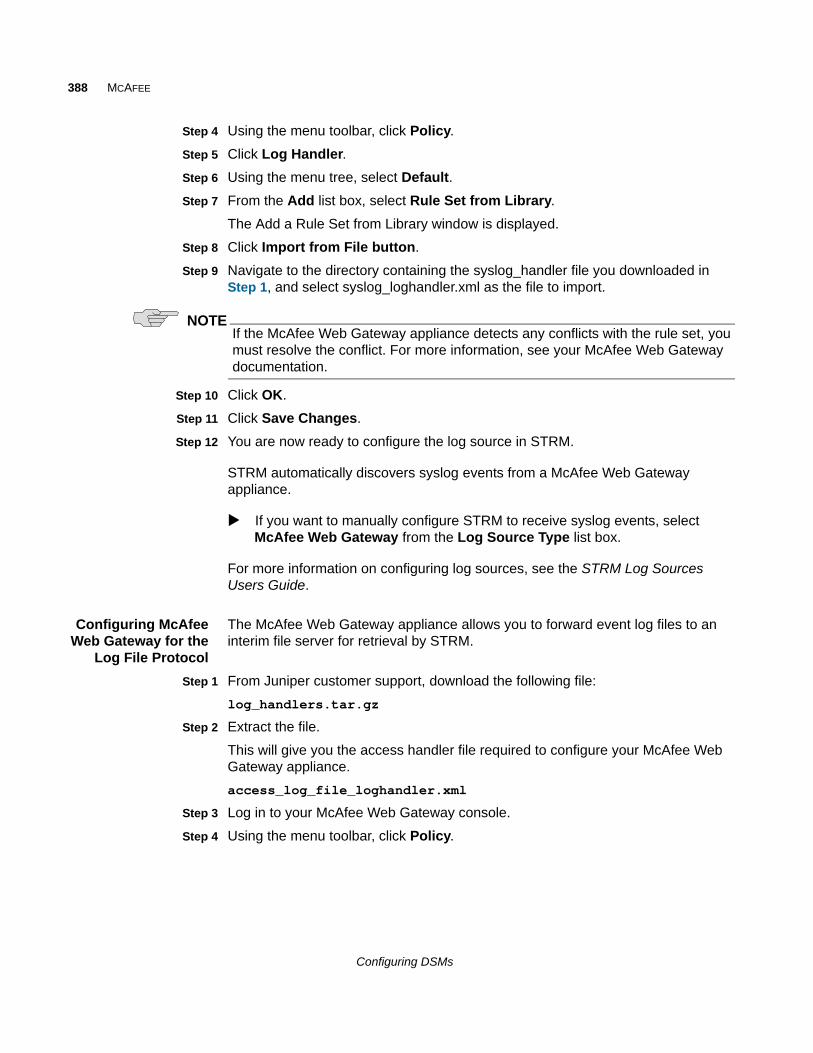
388 MCAFEE
Step 4 Using the menu toolbar, click Policy.
Step 5 Click Log Handler.
Step 6 Using the menu tree, select Default.
Step 7 From the Add list box, select Rule Set from Library.
The Add a Rule Set from Library window is displayed.
Step 8 Click Import from File button.
Step 9 Navigate to the directory containing the syslog_handler file you downloaded in Step 1, and select syslog_loghandler.xml as the file to import.
NOTEIf the McAfee Web Gateway appliance detects any conflicts with the rule set, you must resolve the conflict. For more information, see your McAfee Web Gateway documentation.
Step 10 Click OK.
Step 11 Click Save Changes.
Step 12 You are now ready to configure the log source in STRM.
STRM automatically discovers syslog events from a McAfee Web Gateway appliance.
If you want to manually configure STRM to receive syslog events, select McAfee Web Gateway from the Log Source Type list box.
For more information on configuring log sources, see the STRM Log Sources Users Guide.
Configuring McAfeeWeb Gateway for the
Log File Protocol
The McAfee Web Gateway appliance allows you to forward event log files to an interim file server for retrieval by STRM.
Step 1 From Juniper customer support, download the following file:
log_handlers.tar.gz
Step 2 Extract the file.
This will give you the access handler file required to configure your McAfee Web Gateway appliance.
access_log_file_loghandler.xml
Step 3 Log in to your McAfee Web Gateway console.
Step 4 Using the menu toolbar, click Policy.
Configuring DSMs
McAfee Web Gateway 389
NOTEIf there is an existing access log configuration in your McAfee Web Gateway appliance, you must delete the existing access log from the Rule Set Library before adding access_log_file_loghandler.xml.
Step 5 Click Log Handler.
Step 6 Using the menu tree, select Default.
Step 7 From the Add list box, select Rule Set from Library.
The Add a Rule Set from Library window is displayed.
Step 8 Click Import from File button.
Step 9 Navigate to the directory containing the access_log_file_loghandler.xml file you downloaded in Step 1, and select syslog_loghandler.xml as the file to import.
When importing the rule set for access_log_file_loghandler.xml, a conflict occurs stating the Access Log Configuration already exists in the current configuration and a conflict solution is presented.
Step 10 If the McAfee Web Gateway appliance detects that the Access Log Configuration already exists, select the Conflict Solution: Change name option presented to resolve the rule set conflict.
For more information on resolving conflicts, see your McAfee Web Gateway vendor documentation.
You must configure your access.log file to be pushed to an interim server on an auto rotation. It does not matter if you push your files to the interim server based on time or size for your access.log file. For more information on auto rotation, see your McAfee Web Gateway vendor documentation.
NOTEDue to the size of access.log files generated, we recommend you select the option GZIP files after rotation in your McAfee Web Gate appliance.
Step 11 Click OK.
Step 12 Click Save Changes.
NOTEBy default McAfee Web Gateway is configured to write access logs to the /opt/mwg/log/user-defined-logs/access.log/ directory.
You are now ready to configure STRM to receive access.log files from McAfee Web Gateway. For more information, see Pulling Data Using the Log File Protocol.
Configuring DSMs
Configuring DSMs
McAfee Web Gateway 390
Pulling Data Using the Log File Protocol
A log file protocol source allows STRM to retrieve archived log files from a remote host. The McAfee Web Gateway DSM supports the bulk loading of access.log files using the log file protocol source. The default directory for the McAfee Web Gateway access logs are
You are now ready to configure the log source and protocol in STRM:
Step 1 To configure STRM to receive events from a McAfee Web Gateway appliance, select McAfee Web Gateway from the Log Source Type list box.
Step 2 To configure the protocol, you must select the Log File option from the Protocol Configuration list box.
Step 3 To configure the File Pattern parameter, you must type a regex string for the access.log file, such as access[0-9]+\.log.
NOTEIf you selected to GZIP your access.log files, you must type access[0-9]+\.log\.gz for the FIle Pattern field and from the Processor list box, select GZIP.
51
METAINFO METAIPThe MetaInfo MetaIP DSM for STRM accepts MetaIP events using syslog. STRM records all relevant and available information from the event. Before configuring a MetaIP device in STRM, you must configure your device to forward syslog events. For information on configuring your MetaInfo MetaIP appliance, see your vendor documentation.
After you configure your MetaInfo MetaIP appliance the configuration for STRM is complete. STRM automatically discovers and creates a log source for syslog events forwarded from MetaInfo MetaIP appliances. However, you can manually create a log source for STRM to receive syslog events. The following configuration steps are optional.
To manually configure a log source for MetaInfo MetaIP:
Step 1 Log in to STRM.
Step 2 Click the Admin tab.
Step 3 On the navigation menu, click Data Sources.
The Data Sources panel is displayed.
Step 4 Click the Log Sources icon.
The Log Sources window is displayed.
Step 5 Click Add.
The Add a log source window is displayed.
Step 6 In the Log Source Name field, type a name for your log source.
Step 7 In the Log Source Description field, type a description for the log source.
Step 8 From the Log Source Type list box, select Metainfo MetaIP.
Step 9 Using the Protocol Configuration list box, select Syslog.
The syslog protocol configuration is displayed.
Step 10 Configure the following values:
Table 22-1 Syslog Parameters
Parameter Description
Log Source Identifier Type the IP address or host name for the log source as an identifier for events from your MetaInfo MetaIP appliances.
Configuring DSMs

392 METAINFO METAIP
Step 11 Click Save.
Step 12 On the Admin tab, click Deploy Changes.
The configuration is complete.
Configuring DSMs
52
MICROSOFTThis section provides information on the following DSMs:
• Microsoft Exchange Server
• Microsoft IAS Server
• Microsoft DHCP Server
• Microsoft IIS Server
• Microsoft ISA
• Microsoft SQL Server
• Microsoft SharePoint
• Microsoft Windows Security Event Log
• Microsoft Operations Manager
• Microsoft System Center Operations Manager
Microsoft Exchange Server
The Microsoft Exchange Server DSM for STRM accepts Exchange events by polling for event log files.
Supported Versions STRM supports collecting events from Microsoft Exchange Servers with the following products:
Supported EventTypes
The Microsoft Exchange Protocol for STRM supports several event types for mail and security events. Each event type contains events in a separate log file on your Microsoft Exchange Server. To retrieve events, you must create a log source in STRM to poll the Exchange Server for the event log, which is downloaded by the
Table 23-1 Microsoft Exchange Supported Versions
Version Product
Microsoft Exchange 2003 Adaptive Log ExporterNote: For more information, see the Adaptive Log Exporter User Guide.
Microsoft Exchange 2007 Micorsoft Exchange Protocol
Microsoft Exchange 2010 Micorsoft Exchange Protocol
Configuring DSMs
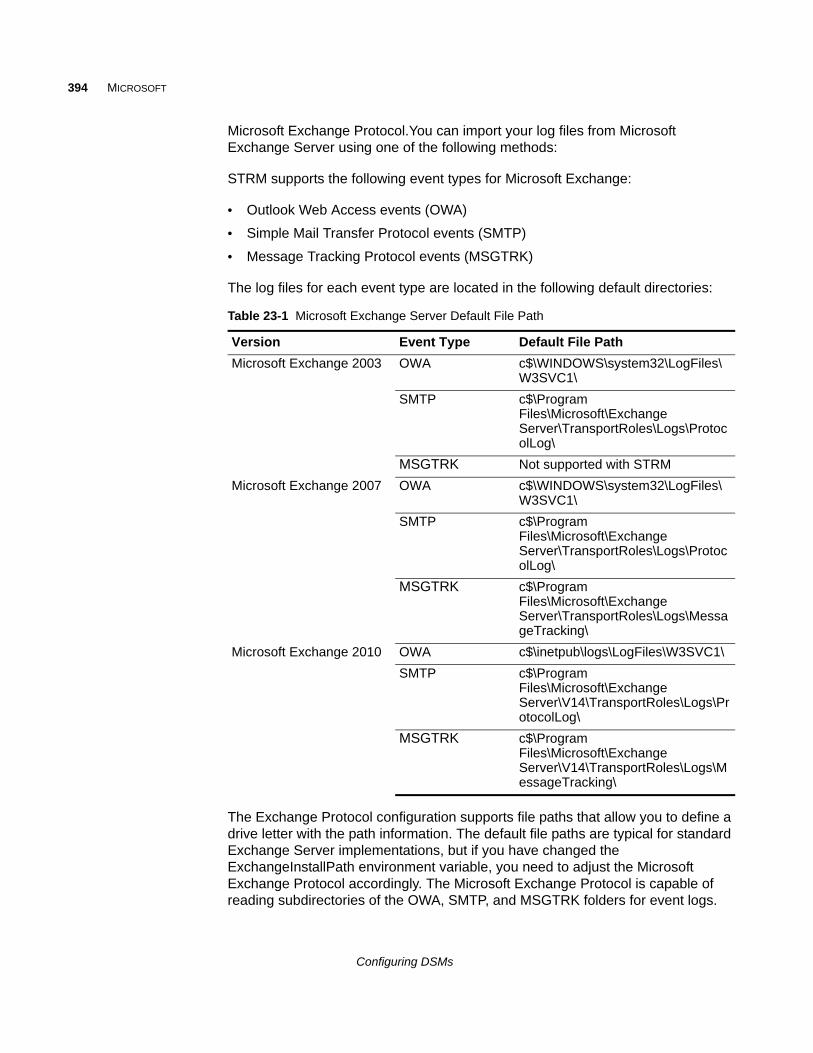
394 MICROSOFT
Microsoft Exchange Protocol.You can import your log files from Microsoft Exchange Server using one of the following methods:
STRM supports the following event types for Microsoft Exchange:
• Outlook Web Access events (OWA)
• Simple Mail Transfer Protocol events (SMTP)
• Message Tracking Protocol events (MSGTRK)
The log files for each event type are located in the following default directories:
The Exchange Protocol configuration supports file paths that allow you to define a drive letter with the path information. The default file paths are typical for standard Exchange Server implementations, but if you have changed the ExchangeInstallPath environment variable, you need to adjust the Microsoft Exchange Protocol accordingly. The Microsoft Exchange Protocol is capable of reading subdirectories of the OWA, SMTP, and MSGTRK folders for event logs.
Table 23-1 Microsoft Exchange Server Default File Path
Version Event Type Default File Path
Microsoft Exchange 2003 OWA c$\WINDOWS\system32\LogFiles\W3SVC1\
SMTP c$\Program Files\Microsoft\Exchange Server\TransportRoles\Logs\ProtocolLog\
MSGTRK Not supported with STRM
Microsoft Exchange 2007 OWA c$\WINDOWS\system32\LogFiles\W3SVC1\
SMTP c$\Program Files\Microsoft\Exchange Server\TransportRoles\Logs\ProtocolLog\
MSGTRK c$\Program Files\Microsoft\Exchange Server\TransportRoles\Logs\MessageTracking\
Microsoft Exchange 2010 OWA c$\inetpub\logs\LogFiles\W3SVC1\
SMTP c$\Program Files\Microsoft\Exchange Server\V14\TransportRoles\Logs\ProtocolLog\
MSGTRK c$\Program Files\Microsoft\Exchange Server\V14\TransportRoles\Logs\MessageTracking\
Configuring DSMs
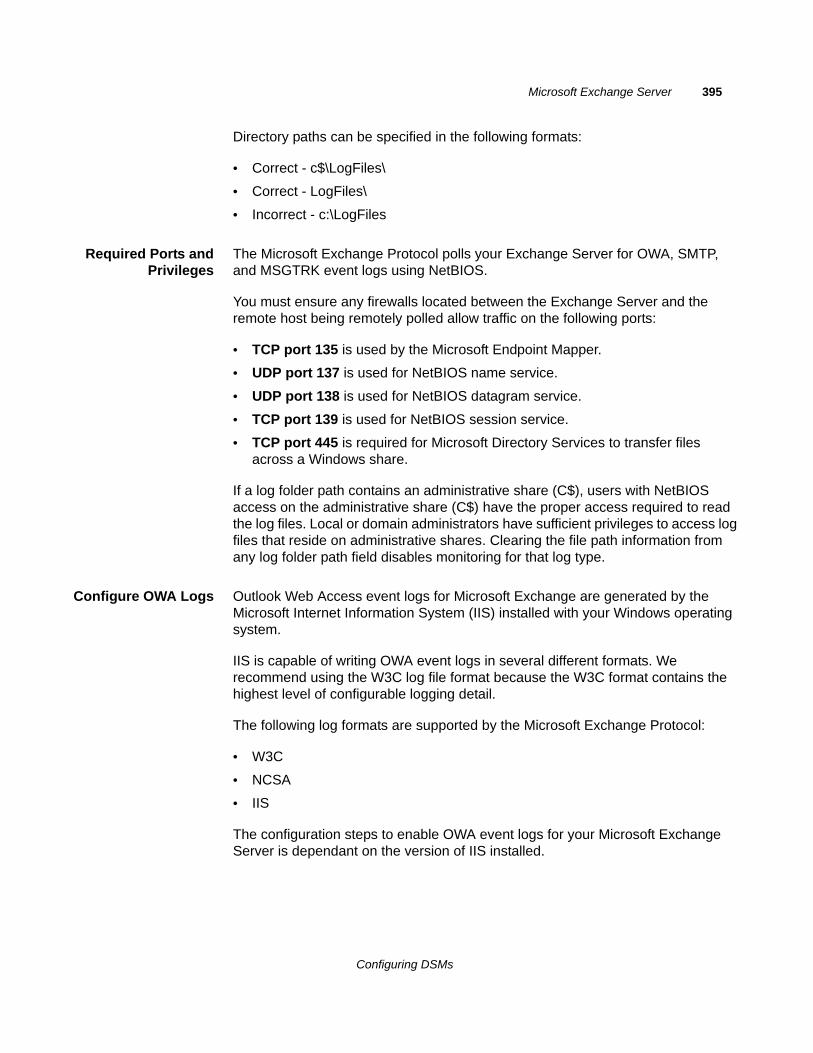
Microsoft Exchange Server 395
Directory paths can be specified in the following formats:
• Correct - c$\LogFiles\
• Correct - LogFiles\
• Incorrect - c:\LogFiles
Required Ports andPrivileges
The Microsoft Exchange Protocol polls your Exchange Server for OWA, SMTP, and MSGTRK event logs using NetBIOS.
You must ensure any firewalls located between the Exchange Server and the remote host being remotely polled allow traffic on the following ports:
• TCP port 135 is used by the Microsoft Endpoint Mapper.
• UDP port 137 is used for NetBIOS name service.
• UDP port 138 is used for NetBIOS datagram service.
• TCP port 139 is used for NetBIOS session service.
• TCP port 445 is required for Microsoft Directory Services to transfer files across a Windows share.
If a log folder path contains an administrative share (C$), users with NetBIOS access on the administrative share (C$) have the proper access required to read the log files. Local or domain administrators have sufficient privileges to access log files that reside on administrative shares. Clearing the file path information from any log folder path field disables monitoring for that log type.
Configure OWA Logs Outlook Web Access event logs for Microsoft Exchange are generated by the Microsoft Internet Information System (IIS) installed with your Windows operating system.
IIS is capable of writing OWA event logs in several different formats. We recommend using the W3C log file format because the W3C format contains the highest level of configurable logging detail.
The following log formats are supported by the Microsoft Exchange Protocol:
• W3C
• NCSA
• IIS
The configuration steps to enable OWA event logs for your Microsoft Exchange Server is dependant on the version of IIS installed.
Configuring DSMs
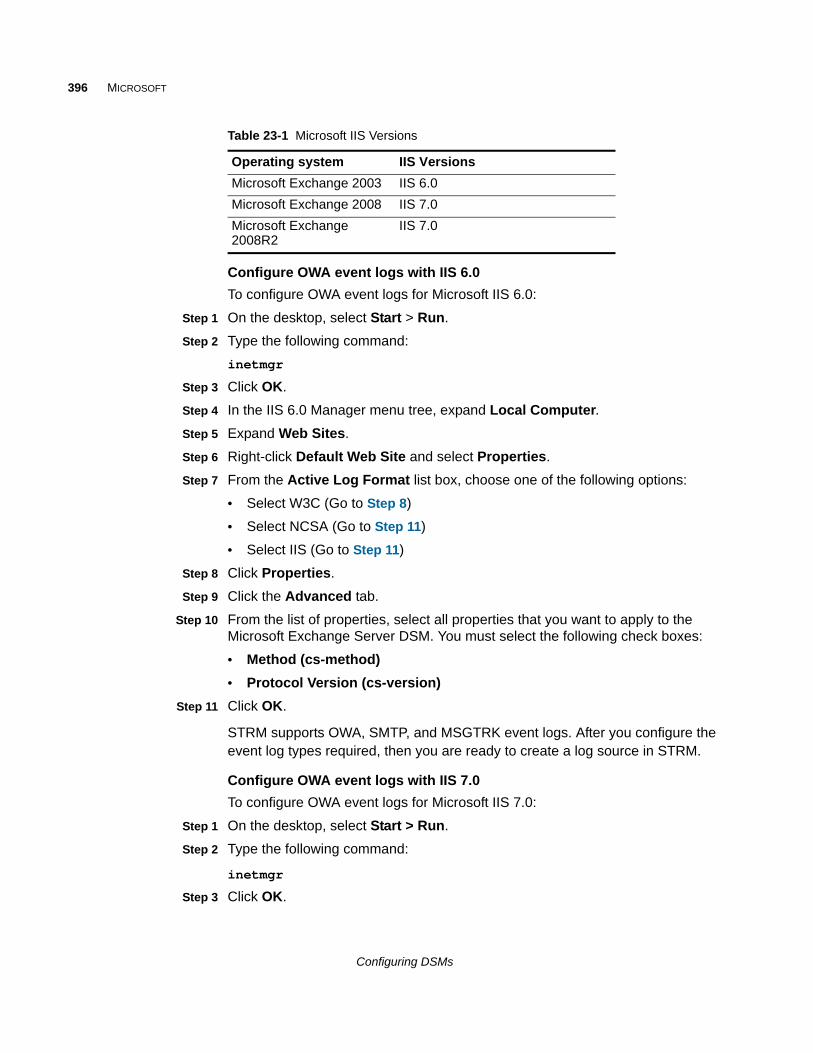
396 MICROSOFT
Configure OWA event logs with IIS 6.0
To configure OWA event logs for Microsoft IIS 6.0:
Step 1 On the desktop, select Start > Run.
Step 2 Type the following command:
inetmgr
Step 3 Click OK.
Step 4 In the IIS 6.0 Manager menu tree, expand Local Computer.
Step 5 Expand Web Sites.
Step 6 Right-click Default Web Site and select Properties.
Step 7 From the Active Log Format list box, choose one of the following options:
• Select W3C (Go to Step 8)
• Select NCSA (Go to Step 11)
• Select IIS (Go to Step 11)
Step 8 Click Properties.
Step 9 Click the Advanced tab.
Step 10 From the list of properties, select all properties that you want to apply to the Microsoft Exchange Server DSM. You must select the following check boxes:
• Method (cs-method)
• Protocol Version (cs-version)
Step 11 Click OK.
STRM supports OWA, SMTP, and MSGTRK event logs. After you configure the event log types required, then you are ready to create a log source in STRM.
Configure OWA event logs with IIS 7.0
To configure OWA event logs for Microsoft IIS 7.0:
Step 1 On the desktop, select Start > Run.
Step 2 Type the following command:
inetmgr
Step 3 Click OK.
Table 23-1 Microsoft IIS Versions
Operating system IIS Versions
Microsoft Exchange 2003 IIS 6.0
Microsoft Exchange 2008 IIS 7.0
Microsoft Exchange 2008R2
IIS 7.0
Configuring DSMs
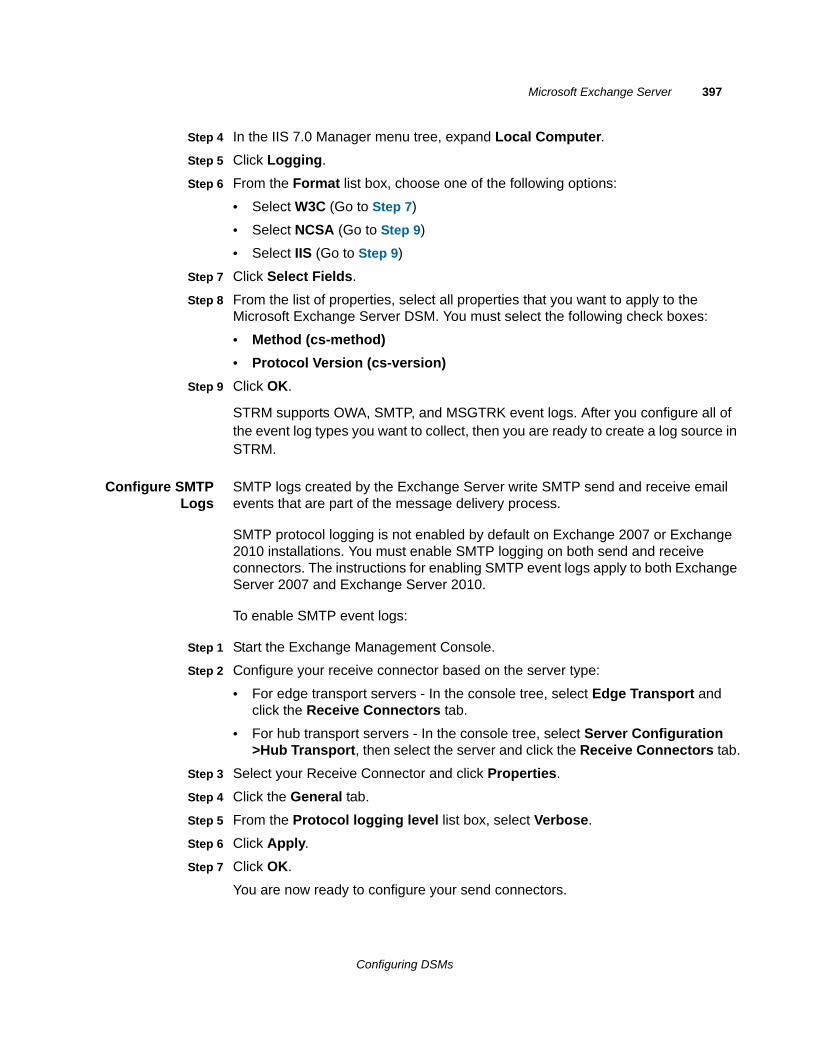
Microsoft Exchange Server 397
Step 4 In the IIS 7.0 Manager menu tree, expand Local Computer.
Step 5 Click Logging.
Step 6 From the Format list box, choose one of the following options:
• Select W3C (Go to Step 7)
• Select NCSA (Go to Step 9)
• Select IIS (Go to Step 9)
Step 7 Click Select Fields.
Step 8 From the list of properties, select all properties that you want to apply to the Microsoft Exchange Server DSM. You must select the following check boxes:
• Method (cs-method)
• Protocol Version (cs-version)
Step 9 Click OK.
STRM supports OWA, SMTP, and MSGTRK event logs. After you configure all of the event log types you want to collect, then you are ready to create a log source in STRM.
Configure SMTPLogs
SMTP logs created by the Exchange Server write SMTP send and receive email events that are part of the message delivery process.
SMTP protocol logging is not enabled by default on Exchange 2007 or Exchange 2010 installations. You must enable SMTP logging on both send and receive connectors. The instructions for enabling SMTP event logs apply to both Exchange Server 2007 and Exchange Server 2010.
To enable SMTP event logs:
Step 1 Start the Exchange Management Console.
Step 2 Configure your receive connector based on the server type:
• For edge transport servers - In the console tree, select Edge Transport and click the Receive Connectors tab.
• For hub transport servers - In the console tree, select Server Configuration >Hub Transport, then select the server and click the Receive Connectors tab.
Step 3 Select your Receive Connector and click Properties.
Step 4 Click the General tab.
Step 5 From the Protocol logging level list box, select Verbose.
Step 6 Click Apply.
Step 7 Click OK.
You are now ready to configure your send connectors.
Configuring DSMs
398 MICROSOFT
Step 8 Configure your send connector based on the server type:
• For edge transport servers - In the console tree, select Edge Transport and click the Send Connectors tab.
• For hub transport servers - In the console tree, select Organization Configuration > Hub Transport, then select the server and click the Send Connectors tab.
Step 9 Select your Send Connector and click Properties.
Step 10 Click the General tab.
Step 11 From the Protocol logging level list box, select Verbose.
Step 12 Click Apply.
Step 13 Click OK.
Logging for SMTP is now enabled.
Configure MSGTRKLogs
Message Tracking logs created by the Exchange Server detail the message activity that takes on your Exchange Server, including the message path information.
MSGTRK logs are enabled by default on Exchange 2007 or Exchange 2010 installations. The following configuration steps are optional.
To enable MSGTRK event logs:
Step 1 Start the Exchange Management Console.
Step 2 Configure your receive connector based on the server type:
• For edge transport servers - In the console tree, select Edge Transport and click Properties.
• For hub transport servers - In the console tree, select Server Configuration >Hub Transport, then select the server and click Properties.
Step 3 Click the Log Settings tab.
Step 4 Select the Enable message tracking check box.
Step 5 Click Apply.
Step 6 Click OK.
MSGTRK events are now enabled on your Exchange Server.
Configure a LogSource
The Microsoft Windows Exchange protocol supports SMTP, OWA, and message tracking logs for Microsoft Exchange.
To configure a log source:
Step 1 Click the Admin tab.
Configuring DSMs
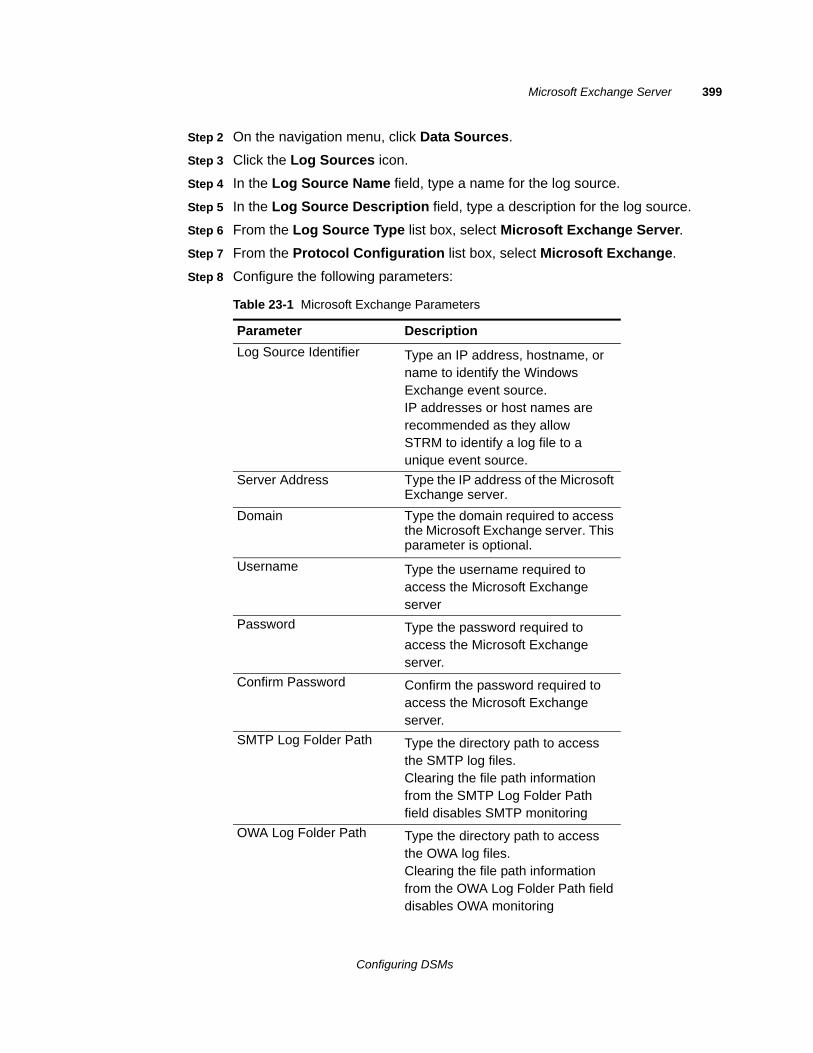
Microsoft Exchange Server 399
Step 2 On the navigation menu, click Data Sources.
Step 3 Click the Log Sources icon.
Step 4 In the Log Source Name field, type a name for the log source.
Step 5 In the Log Source Description field, type a description for the log source.
Step 6 From the Log Source Type list box, select Microsoft Exchange Server.
Step 7 From the Protocol Configuration list box, select Microsoft Exchange.
Step 8 Configure the following parameters:
Table 23-1 Microsoft Exchange Parameters
Parameter Description
Log Source Identifier Type an IP address, hostname, or name to identify the Windows Exchange event source.IP addresses or host names are recommended as they allowSTRM to identify a log file to a unique event source.
Server Address Type the IP address of the Microsoft Exchange server.
Domain Type the domain required to access the Microsoft Exchange server. This parameter is optional.
Username Type the username required to access the Microsoft Exchange server
Password Type the password required to access the Microsoft Exchange server.
Confirm Password Confirm the password required to access the Microsoft Exchange server.
SMTP Log Folder Path Type the directory path to access the SMTP log files.Clearing the file path information from the SMTP Log Folder Path field disables SMTP monitoring
OWA Log Folder Path Type the directory path to access the OWA log files.Clearing the file path information from the OWA Log Folder Path field disables OWA monitoring
Configuring DSMs
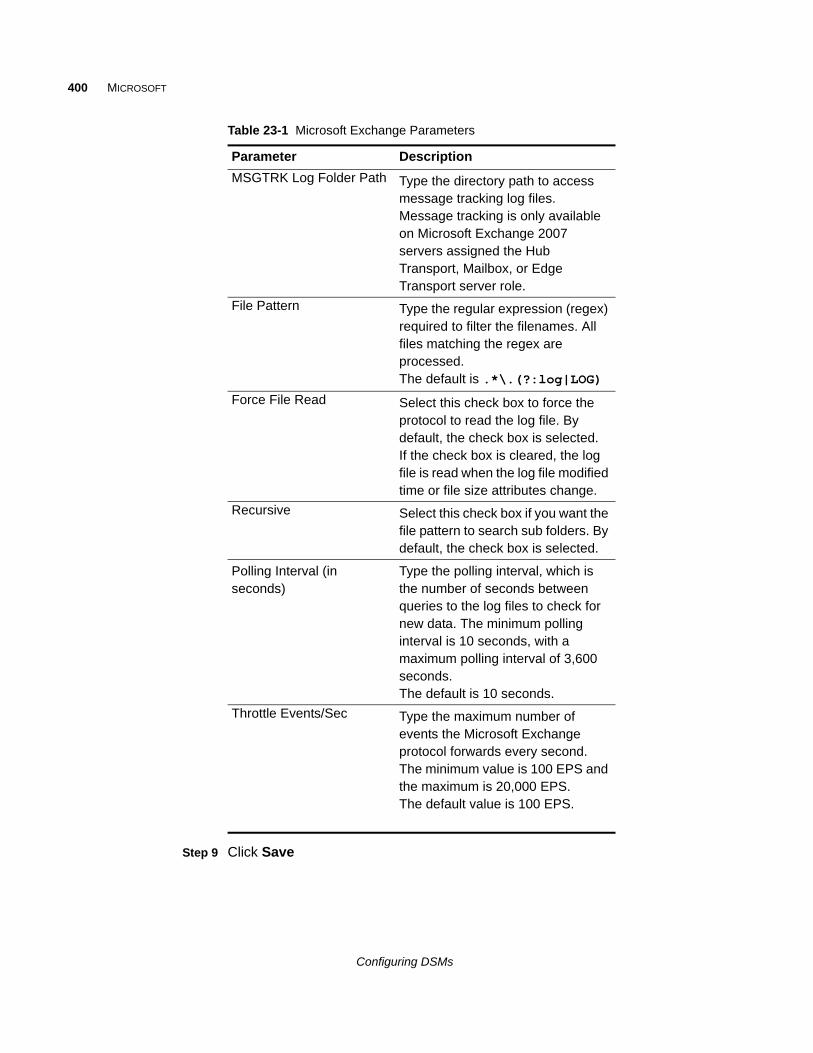
400 MICROSOFT
Step 9 Click Save
MSGTRK Log Folder Path Type the directory path to access message tracking log files.Message tracking is only available on Microsoft Exchange 2007 servers assigned the Hub Transport, Mailbox, or Edge Transport server role.
File Pattern Type the regular expression (regex) required to filter the filenames. All files matching the regex are processed.The default is .*\.(?:log|LOG)
Force File Read Select this check box to force the protocol to read the log file. By default, the check box is selected.If the check box is cleared, the log file is read when the log file modified time or file size attributes change.
Recursive Select this check box if you want the file pattern to search sub folders. By default, the check box is selected.
Polling Interval (in seconds)
Type the polling interval, which is the number of seconds between queries to the log files to check for new data. The minimum polling interval is 10 seconds, with a maximum polling interval of 3,600 seconds.The default is 10 seconds.
Throttle Events/Sec Type the maximum number of events the Microsoft Exchange protocol forwards every second. The minimum value is 100 EPS and the maximum is 20,000 EPS.The default value is 100 EPS.
Table 23-1 Microsoft Exchange Parameters
Parameter Description
Configuring DSMs
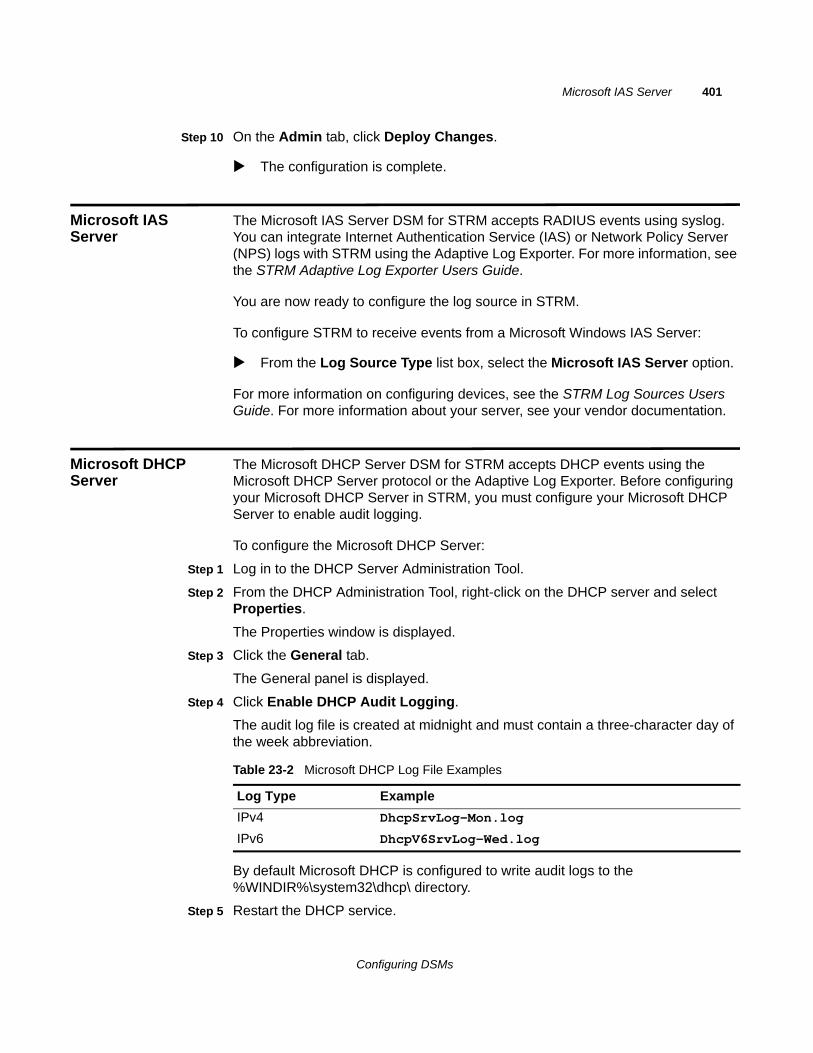
Microsoft IAS Server 401
Step 10 On the Admin tab, click Deploy Changes.
The configuration is complete.
Microsoft IAS Server
The Microsoft IAS Server DSM for STRM accepts RADIUS events using syslog. You can integrate Internet Authentication Service (IAS) or Network Policy Server (NPS) logs with STRM using the Adaptive Log Exporter. For more information, see the STRM Adaptive Log Exporter Users Guide.
You are now ready to configure the log source in STRM.
To configure STRM to receive events from a Microsoft Windows IAS Server:
From the Log Source Type list box, select the Microsoft IAS Server option.
For more information on configuring devices, see the STRM Log Sources Users Guide. For more information about your server, see your vendor documentation.
Microsoft DHCP Server
The Microsoft DHCP Server DSM for STRM accepts DHCP events using the Microsoft DHCP Server protocol or the Adaptive Log Exporter. Before configuring your Microsoft DHCP Server in STRM, you must configure your Microsoft DHCP Server to enable audit logging.
To configure the Microsoft DHCP Server:
Step 1 Log in to the DHCP Server Administration Tool.
Step 2 From the DHCP Administration Tool, right-click on the DHCP server and select Properties.
The Properties window is displayed.
Step 3 Click the General tab.
The General panel is displayed.
Step 4 Click Enable DHCP Audit Logging.
The audit log file is created at midnight and must contain a three-character day of the week abbreviation.
By default Microsoft DHCP is configured to write audit logs to the %WINDIR%\system32\dhcp\ directory.
Step 5 Restart the DHCP service.
Table 23-2 Microsoft DHCP Log File Examples
Log Type Example
IPv4 DhcpSrvLog-Mon.log
IPv6 DhcpV6SrvLog-Wed.log
Configuring DSMs
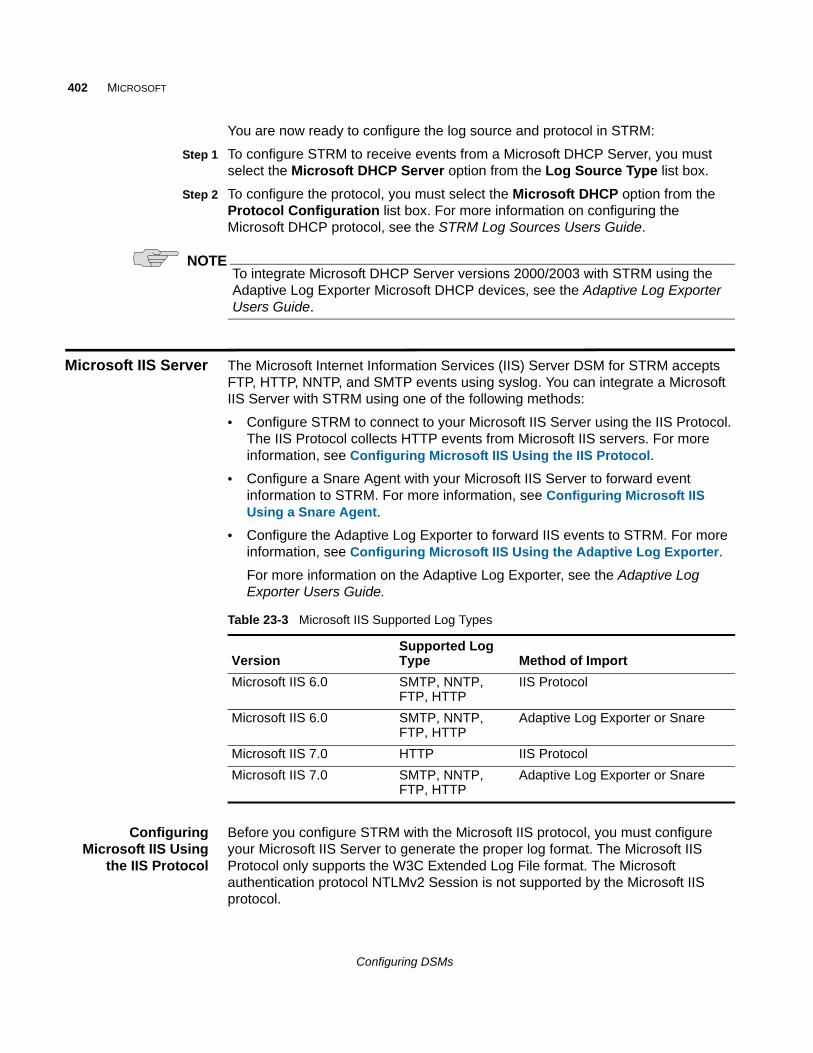
402 MICROSOFT
You are now ready to configure the log source and protocol in STRM:
Step 1 To configure STRM to receive events from a Microsoft DHCP Server, you must select the Microsoft DHCP Server option from the Log Source Type list box.
Step 2 To configure the protocol, you must select the Microsoft DHCP option from the Protocol Configuration list box. For more information on configuring the Microsoft DHCP protocol, see the STRM Log Sources Users Guide.
NOTETo integrate Microsoft DHCP Server versions 2000/2003 with STRM using the Adaptive Log Exporter Microsoft DHCP devices, see the Adaptive Log Exporter Users Guide.
Microsoft IIS Server The Microsoft Internet Information Services (IIS) Server DSM for STRM accepts FTP, HTTP, NNTP, and SMTP events using syslog. You can integrate a Microsoft IIS Server with STRM using one of the following methods:
• Configure STRM to connect to your Microsoft IIS Server using the IIS Protocol. The IIS Protocol collects HTTP events from Microsoft IIS servers. For more information, see Configuring Microsoft IIS Using the IIS Protocol.
• Configure a Snare Agent with your Microsoft IIS Server to forward event information to STRM. For more information, see Configuring Microsoft IIS Using a Snare Agent.
• Configure the Adaptive Log Exporter to forward IIS events to STRM. For more information, see Configuring Microsoft IIS Using the Adaptive Log Exporter.
For more information on the Adaptive Log Exporter, see the Adaptive Log Exporter Users Guide.
ConfiguringMicrosoft IIS Using
the IIS Protocol
Before you configure STRM with the Microsoft IIS protocol, you must configure your Microsoft IIS Server to generate the proper log format. The Microsoft IIS Protocol only supports the W3C Extended Log File format. The Microsoft authentication protocol NTLMv2 Session is not supported by the Microsoft IIS protocol.
Table 23-3 Microsoft IIS Supported Log Types
VersionSupported Log Type Method of Import
Microsoft IIS 6.0 SMTP, NNTP, FTP, HTTP
IIS Protocol
Microsoft IIS 6.0 SMTP, NNTP, FTP, HTTP
Adaptive Log Exporter or Snare
Microsoft IIS 7.0 HTTP IIS Protocol
Microsoft IIS 7.0 SMTP, NNTP, FTP, HTTP
Adaptive Log Exporter or Snare
Configuring DSMs
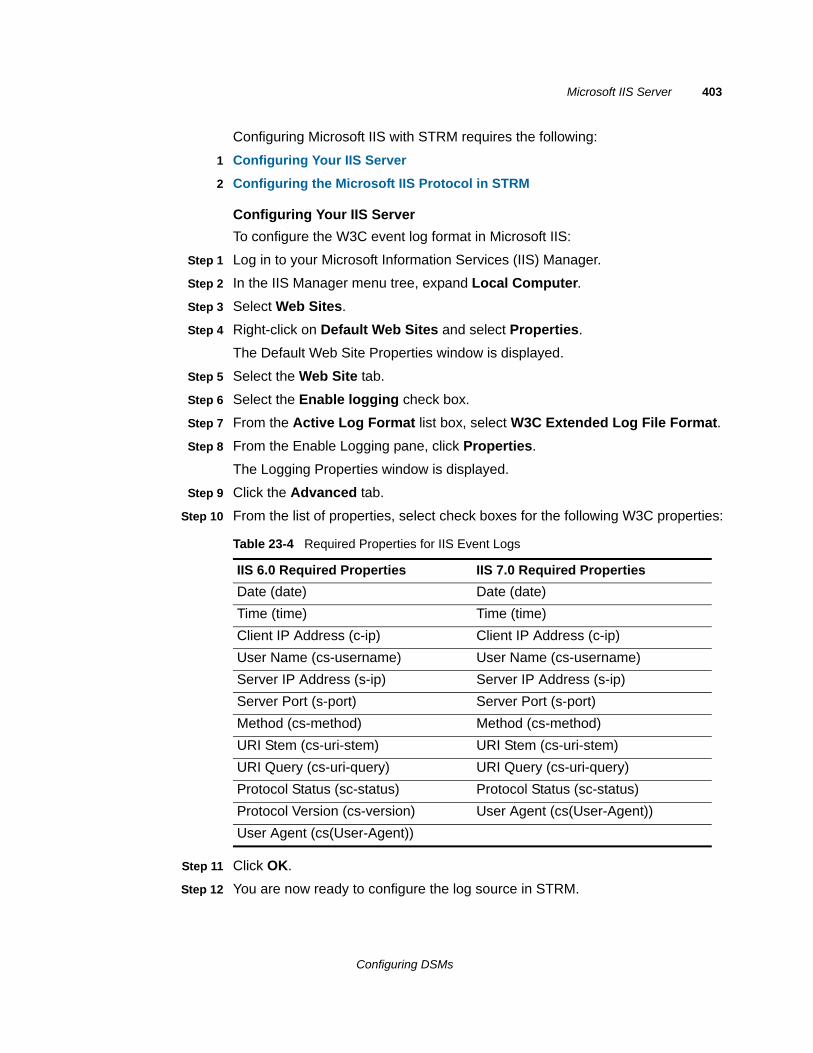
Microsoft IIS Server 403
Configuring Microsoft IIS with STRM requires the following:
1 Configuring Your IIS Server
2 Configuring the Microsoft IIS Protocol in STRM
Configuring Your IIS Server
To configure the W3C event log format in Microsoft IIS:
Step 1 Log in to your Microsoft Information Services (IIS) Manager.
Step 2 In the IIS Manager menu tree, expand Local Computer.
Step 3 Select Web Sites.
Step 4 Right-click on Default Web Sites and select Properties.
The Default Web Site Properties window is displayed.
Step 5 Select the Web Site tab.
Step 6 Select the Enable logging check box.
Step 7 From the Active Log Format list box, select W3C Extended Log File Format.
Step 8 From the Enable Logging pane, click Properties.
The Logging Properties window is displayed.
Step 9 Click the Advanced tab.
Step 10 From the list of properties, select check boxes for the following W3C properties:
Step 11 Click OK.
Step 12 You are now ready to configure the log source in STRM.
Table 23-4 Required Properties for IIS Event Logs
IIS 6.0 Required Properties IIS 7.0 Required Properties
Date (date) Date (date)
Time (time) Time (time)
Client IP Address (c-ip) Client IP Address (c-ip)
User Name (cs-username) User Name (cs-username)
Server IP Address (s-ip) Server IP Address (s-ip)
Server Port (s-port) Server Port (s-port)
Method (cs-method) Method (cs-method)
URI Stem (cs-uri-stem) URI Stem (cs-uri-stem)
URI Query (cs-uri-query) URI Query (cs-uri-query)
Protocol Status (sc-status) Protocol Status (sc-status)
Protocol Version (cs-version) User Agent (cs(User-Agent))
User Agent (cs(User-Agent))
Configuring DSMs
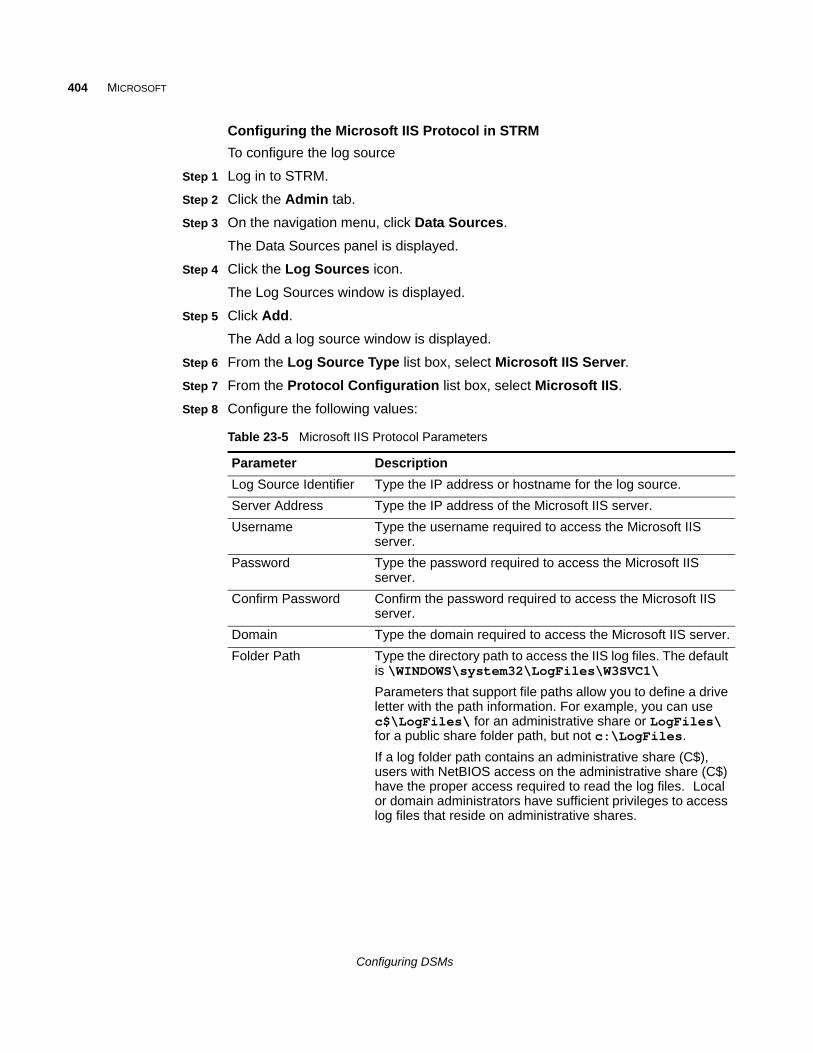
404 MICROSOFT
Configuring the Microsoft IIS Protocol in STRM
To configure the log source
Step 1 Log in to STRM.
Step 2 Click the Admin tab.
Step 3 On the navigation menu, click Data Sources.
The Data Sources panel is displayed.
Step 4 Click the Log Sources icon.
The Log Sources window is displayed.
Step 5 Click Add.
The Add a log source window is displayed.
Step 6 From the Log Source Type list box, select Microsoft IIS Server.
Step 7 From the Protocol Configuration list box, select Microsoft IIS.
Step 8 Configure the following values:
Table 23-5 Microsoft IIS Protocol Parameters
Parameter Description
Log Source Identifier Type the IP address or hostname for the log source.
Server Address Type the IP address of the Microsoft IIS server.
Username Type the username required to access the Microsoft IIS server.
Password Type the password required to access the Microsoft IIS server.
Confirm Password Confirm the password required to access the Microsoft IIS server.
Domain Type the domain required to access the Microsoft IIS server.
Folder Path Type the directory path to access the IIS log files. The default is \WINDOWS\system32\LogFiles\W3SVC1\
Parameters that support file paths allow you to define a drive letter with the path information. For example, you can use c$\LogFiles\ for an administrative share or LogFiles\ for a public share folder path, but not c:\LogFiles.
If a log folder path contains an administrative share (C$), users with NetBIOS access on the administrative share (C$) have the proper access required to read the log files. Local or domain administrators have sufficient privileges to access log files that reside on administrative shares.
Configuring DSMs
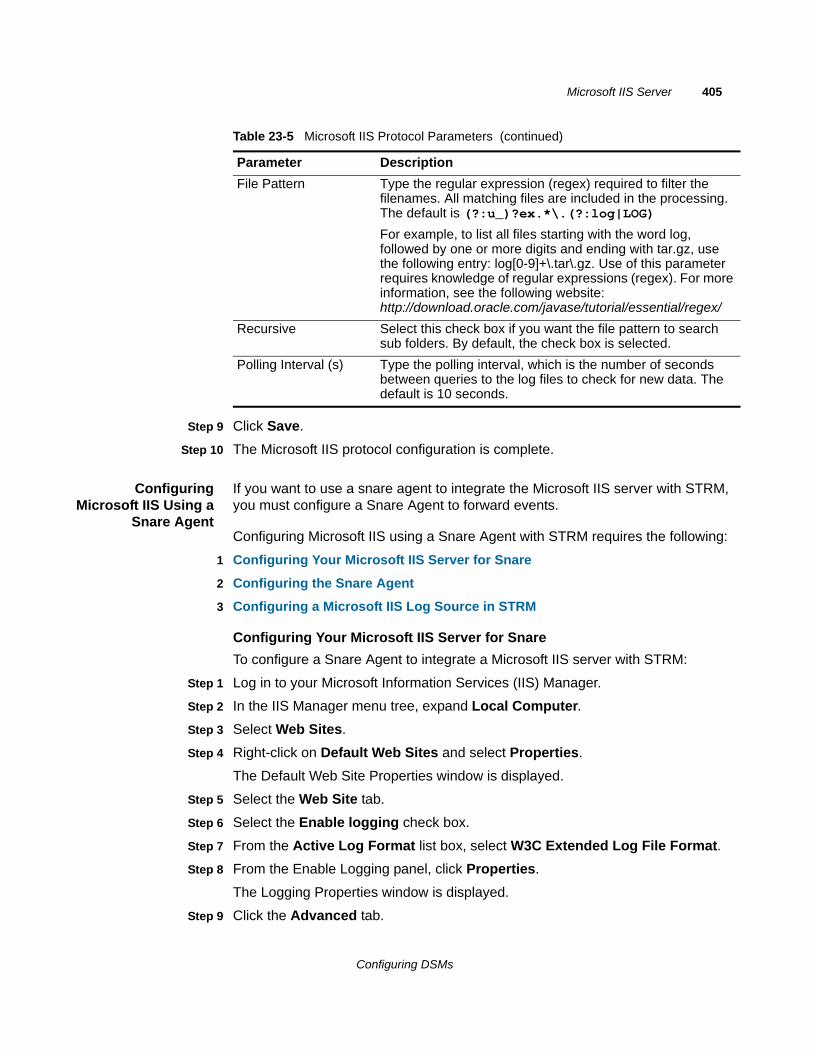
Microsoft IIS Server 405
Step 9 Click Save.
Step 10 The Microsoft IIS protocol configuration is complete.
ConfiguringMicrosoft IIS Using a
Snare Agent
If you want to use a snare agent to integrate the Microsoft IIS server with STRM, you must configure a Snare Agent to forward events.
Configuring Microsoft IIS using a Snare Agent with STRM requires the following:
1 Configuring Your Microsoft IIS Server for Snare
2 Configuring the Snare Agent
3 Configuring a Microsoft IIS Log Source in STRM
Configuring Your Microsoft IIS Server for Snare
To configure a Snare Agent to integrate a Microsoft IIS server with STRM:
Step 1 Log in to your Microsoft Information Services (IIS) Manager.
Step 2 In the IIS Manager menu tree, expand Local Computer.
Step 3 Select Web Sites.
Step 4 Right-click on Default Web Sites and select Properties.
The Default Web Site Properties window is displayed.
Step 5 Select the Web Site tab.
Step 6 Select the Enable logging check box.
Step 7 From the Active Log Format list box, select W3C Extended Log File Format.
Step 8 From the Enable Logging panel, click Properties.
The Logging Properties window is displayed.
Step 9 Click the Advanced tab.
File Pattern Type the regular expression (regex) required to filter the filenames. All matching files are included in the processing. The default is (?:u_)?ex.*\.(?:log|LOG)
For example, to list all files starting with the word log, followed by one or more digits and ending with tar.gz, use the following entry: log[0-9]+\.tar\.gz. Use of this parameter requires knowledge of regular expressions (regex). For more information, see the following website: http://download.oracle.com/javase/tutorial/essential/regex/
Recursive Select this check box if you want the file pattern to search sub folders. By default, the check box is selected.
Polling Interval (s) Type the polling interval, which is the number of seconds between queries to the log files to check for new data. The default is 10 seconds.
Table 23-5 Microsoft IIS Protocol Parameters (continued)
Parameter Description
Configuring DSMs
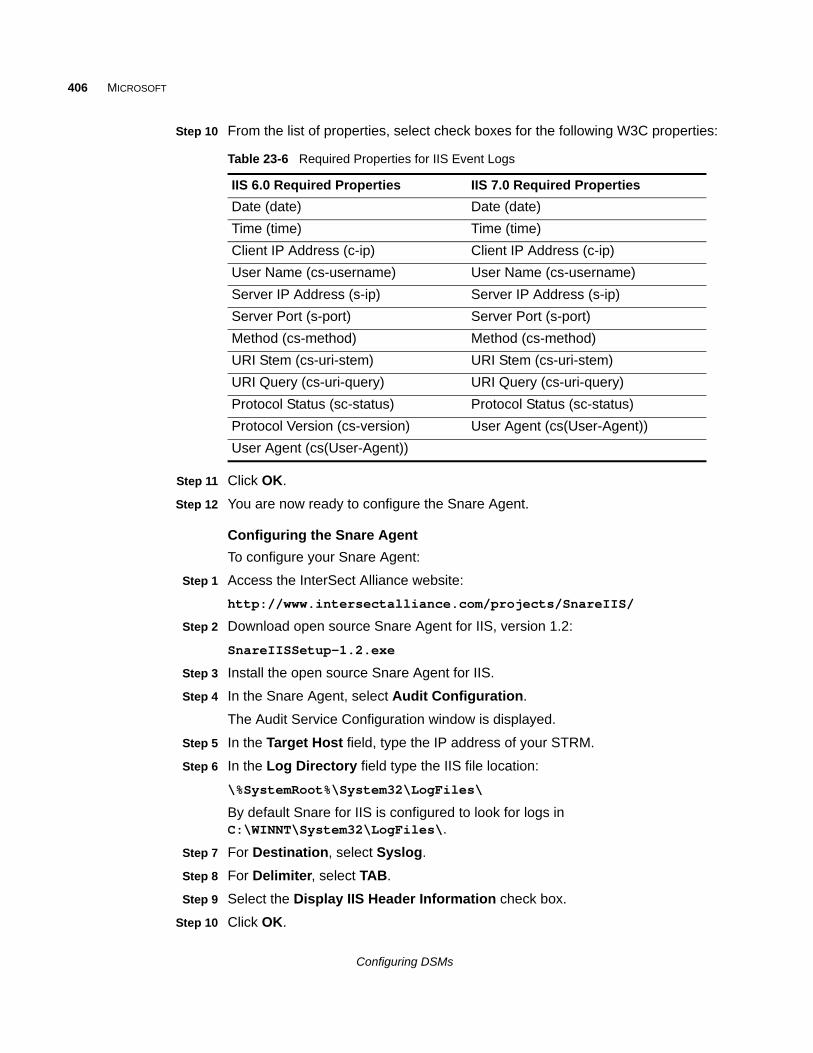
406 MICROSOFT
Step 10 From the list of properties, select check boxes for the following W3C properties:
Step 11 Click OK.
Step 12 You are now ready to configure the Snare Agent.
Configuring the Snare Agent
To configure your Snare Agent:
Step 1 Access the InterSect Alliance website:
http://www.intersectalliance.com/projects/SnareIIS/
Step 2 Download open source Snare Agent for IIS, version 1.2:
SnareIISSetup-1.2.exe
Step 3 Install the open source Snare Agent for IIS.
Step 4 In the Snare Agent, select Audit Configuration.
The Audit Service Configuration window is displayed.
Step 5 In the Target Host field, type the IP address of your STRM.
Step 6 In the Log Directory field type the IIS file location:
\%SystemRoot%\System32\LogFiles\
By default Snare for IIS is configured to look for logs in C:\WINNT\System32\LogFiles\.
Step 7 For Destination, select Syslog.
Step 8 For Delimiter, select TAB.
Step 9 Select the Display IIS Header Information check box.
Step 10 Click OK.
Table 23-6 Required Properties for IIS Event Logs
IIS 6.0 Required Properties IIS 7.0 Required Properties
Date (date) Date (date)
Time (time) Time (time)
Client IP Address (c-ip) Client IP Address (c-ip)
User Name (cs-username) User Name (cs-username)
Server IP Address (s-ip) Server IP Address (s-ip)
Server Port (s-port) Server Port (s-port)
Method (cs-method) Method (cs-method)
URI Stem (cs-uri-stem) URI Stem (cs-uri-stem)
URI Query (cs-uri-query) URI Query (cs-uri-query)
Protocol Status (sc-status) Protocol Status (sc-status)
Protocol Version (cs-version) User Agent (cs(User-Agent))
User Agent (cs(User-Agent))
Configuring DSMs
Microsoft IIS Server 407
Configuring a Microsoft IIS Log Source in STRM
STRM automatically discovers and creates a log source for syslog events from Microsoft IIS forwarded from a Snare agent. However, you can manually create a log source for STRM to receive syslog events. The following configuration steps are optional.
To manually create a Microsoft IIS log source in STRM:
Step 1 Log in to STRM.
Step 2 Click the Admin tab.
Step 3 On the navigation menu, click Data Sources.
The Data Sources panel is displayed.
Step 4 Click the Log Sources icon.
The Log Sources window is displayed.
Step 5 Click Add.
The Add a log source window is displayed.
Step 6 From the Log Source Type list box, select Microsoft IIS Server.
Step 7 From the Protocol Configuration list box, select Syslog.
Step 8 Configure the following values:
Step 9 Click Save.
Step 10 On the Admin tab, click Deploy Changes.
The configuration is complete.
ConfiguringMicrosoft IIS Using
the Adaptive LogExporter
The Adaptive Log Exporter is a stand-alone application that allows you to integrate device logs or application event data with STRM or STRM Log Manager. The Adaptive Log Export supports NCSA, IIS, and W3C active log formats.
To integrate the Adaptive Log Exporter with Microsoft IIS:
Step 1 Log in to your Microsoft Information Services (IIS) Manager.
Step 2 In the IIS Manager menu tree, expand Local Computer.
Step 3 Select Web Sites.
Step 4 Right-click on Default Web Site and select Properties.
The Web Sites Properties window is displayed.
Step 5 From the Active Log Format list box, select one of the following:
• Select NCSA. Go to Step 9.
Table 23-7 Microsoft IIS Syslog Configuration
Parameter Description
Log Source Identifier Type the IP address or hostname for the log source.
Configuring DSMs
408 MICROSOFT
• Select IIS. Go to Step 9.
• Select W3C. Go to Step 6.
Step 6 Click Properties.
The Properties window is displayed.
Step 7 Click the Advanced tab.
Step 8 From the list of properties, select all event properties that you want to apply to the Microsoft IIS event log. The selected properties must include the following:
a Select the Method (cs-method) check box.
b Select the Protocol Version (cs-version) check box.
Step 9 Click OK.
Step 10 You are now ready to configure the Adaptive Log Exporter.
For more information on installing and configuring Microsoft IIS for the Adaptive Log Exporter, see the Adaptive Log Exporter User Guide.
Microsoft ISA The Microsoft Internet and Acceleration (ISA) DSM for STRM accepts events using syslog. You can integrate Microsoft ISA Server with STRM using the Adaptive Log Exporter. For more information on the Adaptive Log Exporter, see the STRM Adaptive Log Exporter Users Guide.
NOTEThe Microsoft ISA DSM also supports events from Microsoft Threat Management Gateway using the Adaptive Log Exporter.
Microsoft SQL Server
The Microsoft SQL Server DSM STRM accepts SQL events using syslog or JDBC. You can integrate Microsoft SQL Server with STRM using one of the following methods:
• JDBC - Microsoft SQL Server 2008 Enterprise allows you to capture audit events using JDBC by generating a table view containing audit events. Audit events are only available using Microsoft SQL Server 2008 Enterprise.
• Adaptive Log Exporter - You can integrate Microsoft SQL Server 2000 and 2005 with STRM using the Adaptive Log Exporter to collect ERRORLOG messages from databases managed by your Microsoft SQL Server. For more information on the Adaptive Log Exporter, see the Adaptive Log Exporter Users Guide.
Configuring Auditsfor MS SQL Server
2008 Enterprise
To configure Microsoft SQL Server 2008 Enterprise, you must create an auditing object for audit events. The auditing object allows you log database events to a file.
Configuring DSMs
Microsoft SQL Server 409
To create an audit object:
Step 1 Log in to your Microsoft SQL Server Management Studio.
Step 2 From the navigation menu, select Security > Audits.
Step 3 Right-click Audits and select New Audit.
The Create Audit window is displayed.
Step 4 In the Audit name field, type a name for the new audit file.
Step 5 From the Audit destination list box, select File.
Step 6 From the File path field, specify a directory path for your Microsoft SQL Server audit file.
Step 7 Click OK.
The audit object is created for Microsoft SQL 2008 Server.
Step 8 Right-click on your audit object and select Enable Audit.
You are now ready to create your server and database audit specifications.
Creating an AuditSpecification
An audit specification allows you to define the level of auditing events that are written to an audit file. You can create an audit specification at the server level or at the database level. Depending on your requirements, you might require both a server and database audit specification.
• Creating a Server Audit Specification
• Creating a Database Audit Specification
Creating a Server Audit Specification
To create an audit specification at the server level:
Step 1 From the navigation menu, select Security > Server Audit Specifications.
Step 2 Right-click Server Audit Specifications and select New Server Audit Specifications.
The Create Server Audit Specification window is displayed.
Step 3 In the Name field, type a name for the new audit file.
Step 4 From the Audit list box, select the audit you created for your Microsoft SQL Server.
Step 5 In the Actions pane, add any actions and objects to the server audit.
Step 6 Click OK.
The Server Audit Specification is created.
Step 7 Right-click on your server audit specification and select Enable Server Audit Specification.
You are now ready to create an audit specification for your database.
Configuring DSMs
410 MICROSOFT
Creating a Database Audit Specification
To create an audit specification at the database level:
Step 1 From the navigation menu, select <Database> > Security > Database Audit Specifications.
Step 2 Right-click Server Audit Specifications and select New Database Audit Specifications.
The Create Server Audit Specification window is displayed.
Step 3 In the Name field, type a name for the new audit file.
Step 4 From the Audit list box, select the audit you created for your database.
Step 5 In the Actions pane, add any actions and objects to the database audit.
Step 6 Click OK.
The Database Audit Specification is created.
Step 7 Right-click on your database audit specification and select Enable Database Audit Specification.
You are now ready to create a view in the database for audit events.
Creating a DatabaseView
The database view contains the audit events from your server audit specification and database audit specification. A database view allows STRM to poll for audit events from a database table using JDBC.
To create a database view:
Step 1 From the toolbar, click New Query.
The Query window is displayed.
Step 2 Type the following Transact-SQL statement:
create view dbo.AuditData as SELECT * FROM sys.fn_get_audit_file('<Audit File Path and Name>',default,default);GO
Where <Audit File Path and Name> is the name of the file you specified for writing audit events in Configuring Audits for MS SQL Server 2008 Enterprise, Step 4.
For example,
create view dbo.AuditData as SELECT * FROM sys.fn_get_audit_file('C:\inetpub\logs\SQLAudits*’,default,default);GO
Step 3 From the Standard toolbar, click Execute.
If successful, the Messages pane displays the following:
Command(s) completed successfully.
Configuring DSMs
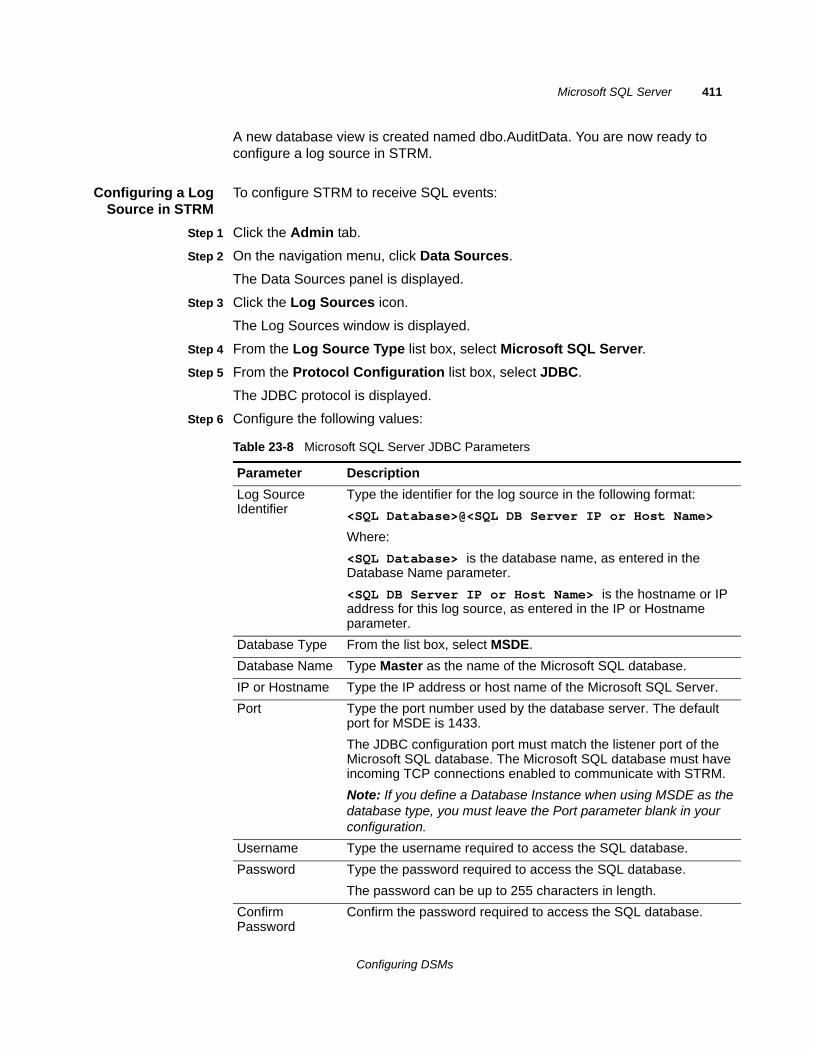
Microsoft SQL Server 411
A new database view is created named dbo.AuditData. You are now ready to configure a log source in STRM.
Configuring a LogSource in STRM
To configure STRM to receive SQL events:
Step 1 Click the Admin tab.
Step 2 On the navigation menu, click Data Sources.
The Data Sources panel is displayed.
Step 3 Click the Log Sources icon.
The Log Sources window is displayed.
Step 4 From the Log Source Type list box, select Microsoft SQL Server.
Step 5 From the Protocol Configuration list box, select JDBC.
The JDBC protocol is displayed.
Step 6 Configure the following values:
Table 23-8 Microsoft SQL Server JDBC Parameters
Parameter Description
Log Source Identifier
Type the identifier for the log source in the following format:
<SQL Database>@<SQL DB Server IP or Host Name>
Where:
<SQL Database> is the database name, as entered in the Database Name parameter.
<SQL DB Server IP or Host Name> is the hostname or IP address for this log source, as entered in the IP or Hostname parameter.
Database Type From the list box, select MSDE.
Database Name Type Master as the name of the Microsoft SQL database.
IP or Hostname Type the IP address or host name of the Microsoft SQL Server.
Port Type the port number used by the database server. The default port for MSDE is 1433.
The JDBC configuration port must match the listener port of the Microsoft SQL database. The Microsoft SQL database must have incoming TCP connections enabled to communicate with STRM.
Note: If you define a Database Instance when using MSDE as the database type, you must leave the Port parameter blank in your configuration.
Username Type the username required to access the SQL database.
Password Type the password required to access the SQL database.
The password can be up to 255 characters in length.
Confirm Password
Confirm the password required to access the SQL database.
Configuring DSMs
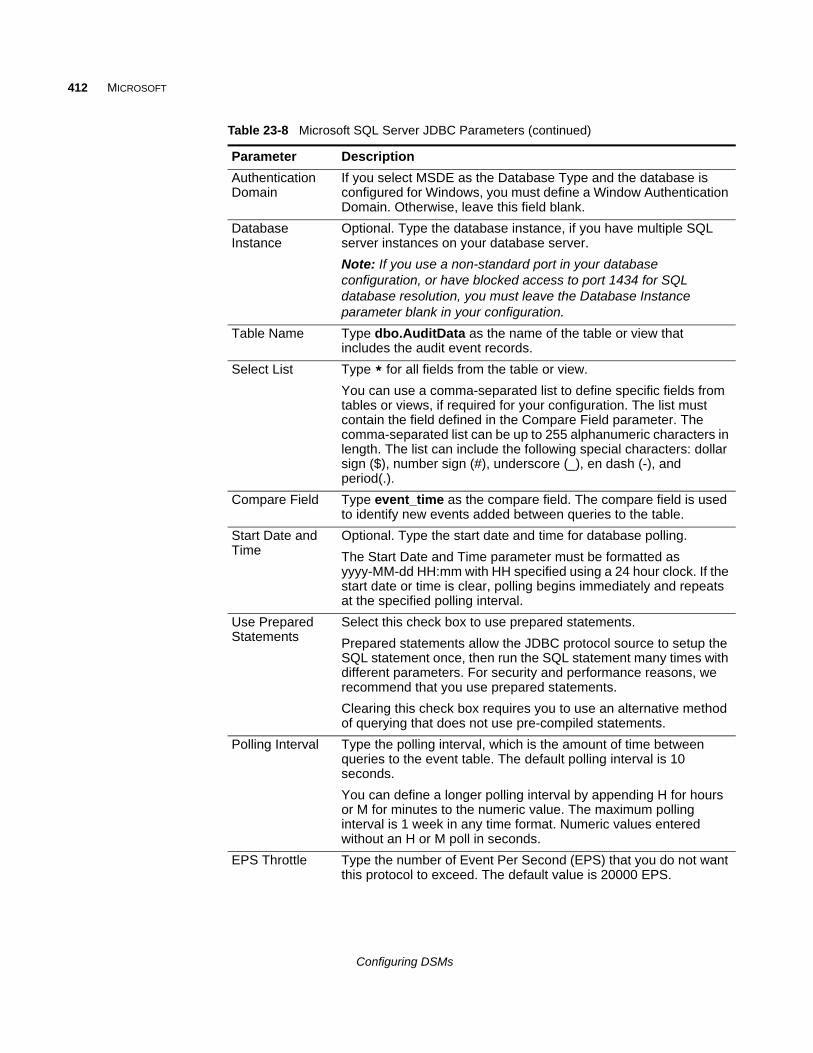
412 MICROSOFT
Authentication Domain
If you select MSDE as the Database Type and the database is configured for Windows, you must define a Window Authentication Domain. Otherwise, leave this field blank.
Database Instance
Optional. Type the database instance, if you have multiple SQL server instances on your database server.
Note: If you use a non-standard port in your database configuration, or have blocked access to port 1434 for SQL database resolution, you must leave the Database Instance parameter blank in your configuration.
Table Name Type dbo.AuditData as the name of the table or view that includes the audit event records.
Select List Type * for all fields from the table or view.
You can use a comma-separated list to define specific fields from tables or views, if required for your configuration. The list must contain the field defined in the Compare Field parameter. The comma-separated list can be up to 255 alphanumeric characters in length. The list can include the following special characters: dollar sign ($), number sign (#), underscore (_), en dash (-), and period(.).
Compare Field Type event_time as the compare field. The compare field is used to identify new events added between queries to the table.
Start Date and Time
Optional. Type the start date and time for database polling.
The Start Date and Time parameter must be formatted as yyyy-MM-dd HH:mm with HH specified using a 24 hour clock. If the start date or time is clear, polling begins immediately and repeats at the specified polling interval.
Use Prepared Statements
Select this check box to use prepared statements.
Prepared statements allow the JDBC protocol source to setup the SQL statement once, then run the SQL statement many times with different parameters. For security and performance reasons, we recommend that you use prepared statements.
Clearing this check box requires you to use an alternative method of querying that does not use pre-compiled statements.
Polling Interval Type the polling interval, which is the amount of time between queries to the event table. The default polling interval is 10 seconds.
You can define a longer polling interval by appending H for hours or M for minutes to the numeric value. The maximum polling interval is 1 week in any time format. Numeric values entered without an H or M poll in seconds.
EPS Throttle Type the number of Event Per Second (EPS) that you do not want this protocol to exceed. The default value is 20000 EPS.
Table 23-8 Microsoft SQL Server JDBC Parameters (continued)
Parameter Description
Configuring DSMs
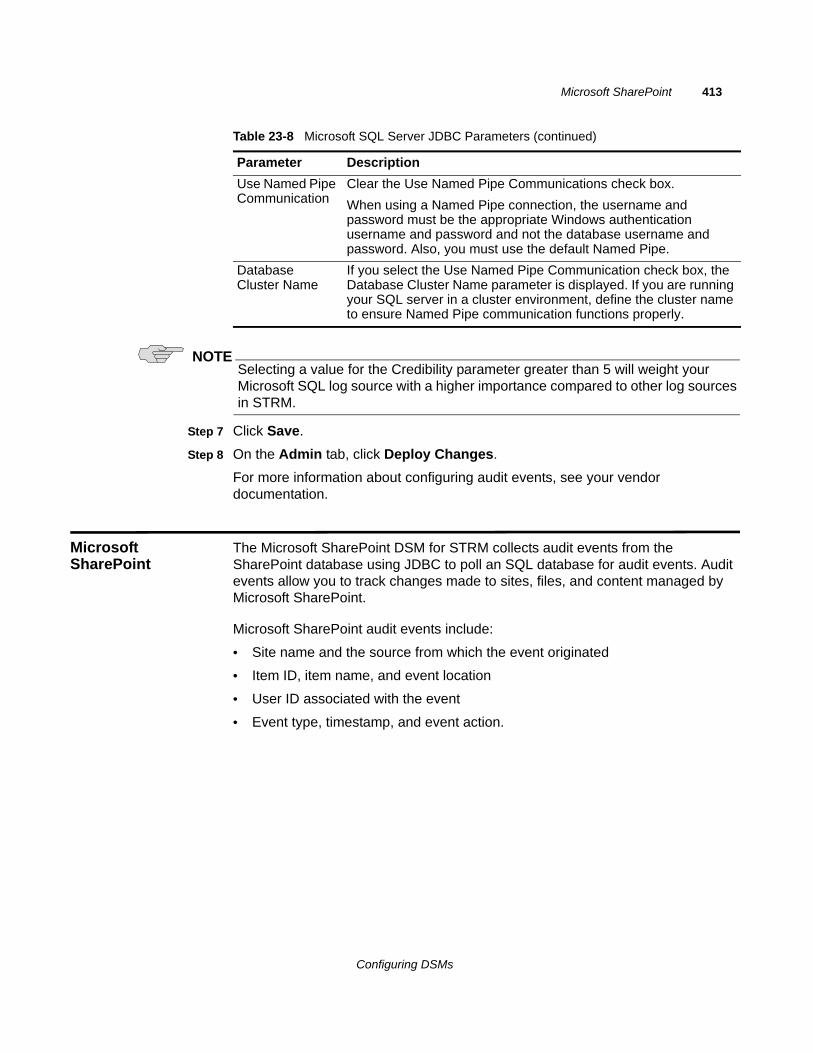
Microsoft SharePoint 413
NOTESelecting a value for the Credibility parameter greater than 5 will weight your Microsoft SQL log source with a higher importance compared to other log sources in STRM.
Step 7 Click Save.
Step 8 On the Admin tab, click Deploy Changes.
For more information about configuring audit events, see your vendor documentation.
Microsoft SharePoint
The Microsoft SharePoint DSM for STRM collects audit events from the SharePoint database using JDBC to poll an SQL database for audit events. Audit events allow you to track changes made to sites, files, and content managed by Microsoft SharePoint.
Microsoft SharePoint audit events include:
• Site name and the source from which the event originated
• Item ID, item name, and event location
• User ID associated with the event
• Event type, timestamp, and event action.
Use Named Pipe Communication
Clear the Use Named Pipe Communications check box.
When using a Named Pipe connection, the username and password must be the appropriate Windows authentication username and password and not the database username and password. Also, you must use the default Named Pipe.
Database Cluster Name
If you select the Use Named Pipe Communication check box, the Database Cluster Name parameter is displayed. If you are running your SQL server in a cluster environment, define the cluster name to ensure Named Pipe communication functions properly.
Table 23-8 Microsoft SQL Server JDBC Parameters (continued)
Parameter Description
Configuring DSMs
414 MICROSOFT
Before you can integrate Microsoft SharePoint with STRM, you must:
1 Configure the audit events you want to collect for Microsoft SharePoint. For more information, see Configuring Microsoft SharePoint Audit Events.
2 Create an SQL database view for STRM in Microsoft SharePoint. For more information, see Creating a Database View for Microsoft SharePoint.
3 Configure a log source to collect audit events from Microsoft SharePoint. For more information, see Configuring a Log Source in STRM.
NOTEEnsure that no firewall rules are blocking the communication between STRM and the database associated with Microsoft SharePoint.
ConfiguringMicrosoft SharePoint
Audit Events
The audit settings for Microsoft SharePoint allow you to define what events are tracked for each site managed by Microsoft SharePoint.
To configure audit events for Microsoft SharePoint:
Step 1 Log in to your Microsoft SharePoint site.
Step 2 From the Site Actions list box, select Site Settings.
Step 3 From the Site Collection Administration list, click Site collection audit settings.
Step 4 From the Documents and Items section, select a check box for each document and item audit event you want to audit.
Step 5 From the Lists, Libraries, and Sites section, select a check box for each content audit event you want to enable.
Step 6 Click OK.
You are now ready to create a database view for STRM to poll Microsoft SharePoint events.
Creating a DatabaseView for Microsoft
SharePoint
Microsoft SharePoint uses SQL Server Management Studio (SSMS) to manage the SharePoint SQL databases. To collect audit event data, you must create a database view on your Microsoft SharePoint server that is accessible to STRM.
To create a database view using SQL Server Management Studio:
Step 1 Log in to the system hosting your Microsoft SharePoint SQL database.
Step 2 On the desktop, select Start > Run.
The Run window is displayed.
Step 3 Type the following:
ssms
Step 4 Click OK.
The Microsoft SQL Server 2008 displays the Connect to Server window.
Step 5 Log in to your Microsoft SharePoint database.
Configuring DSMs
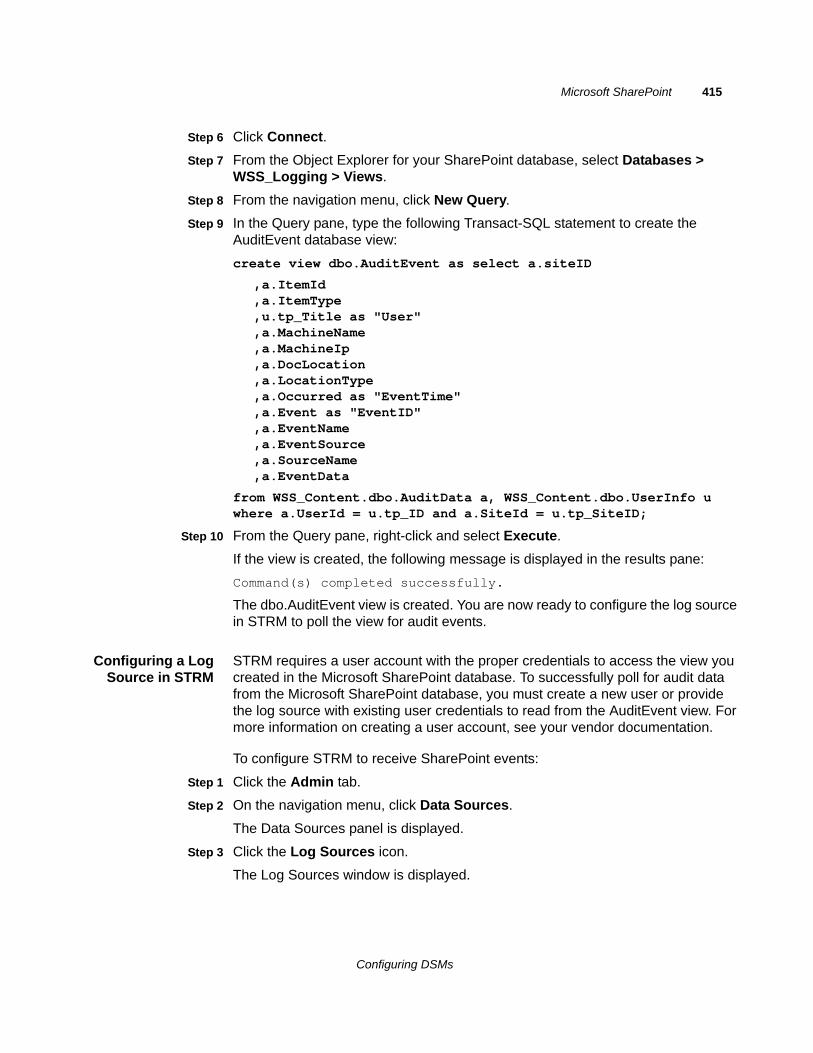
Microsoft SharePoint 415
Step 6 Click Connect.
Step 7 From the Object Explorer for your SharePoint database, select Databases > WSS_Logging > Views.
Step 8 From the navigation menu, click New Query.
Step 9 In the Query pane, type the following Transact-SQL statement to create the AuditEvent database view:
create view dbo.AuditEvent as select a.siteID
,a.ItemId,a.ItemType,u.tp_Title as "User",a.MachineName,a.MachineIp,a.DocLocation,a.LocationType,a.Occurred as "EventTime",a.Event as "EventID",a.EventName,a.EventSource,a.SourceName,a.EventData
from WSS_Content.dbo.AuditData a, WSS_Content.dbo.UserInfo u where a.UserId = u.tp_ID and a.SiteId = u.tp_SiteID;
Step 10 From the Query pane, right-click and select Execute.
If the view is created, the following message is displayed in the results pane:
Command(s) completed successfully.
The dbo.AuditEvent view is created. You are now ready to configure the log source in STRM to poll the view for audit events.
Configuring a LogSource in STRM
STRM requires a user account with the proper credentials to access the view you created in the Microsoft SharePoint database. To successfully poll for audit data from the Microsoft SharePoint database, you must create a new user or provide the log source with existing user credentials to read from the AuditEvent view. For more information on creating a user account, see your vendor documentation.
To configure STRM to receive SharePoint events:
Step 1 Click the Admin tab.
Step 2 On the navigation menu, click Data Sources.
The Data Sources panel is displayed.
Step 3 Click the Log Sources icon.
The Log Sources window is displayed.
Configuring DSMs
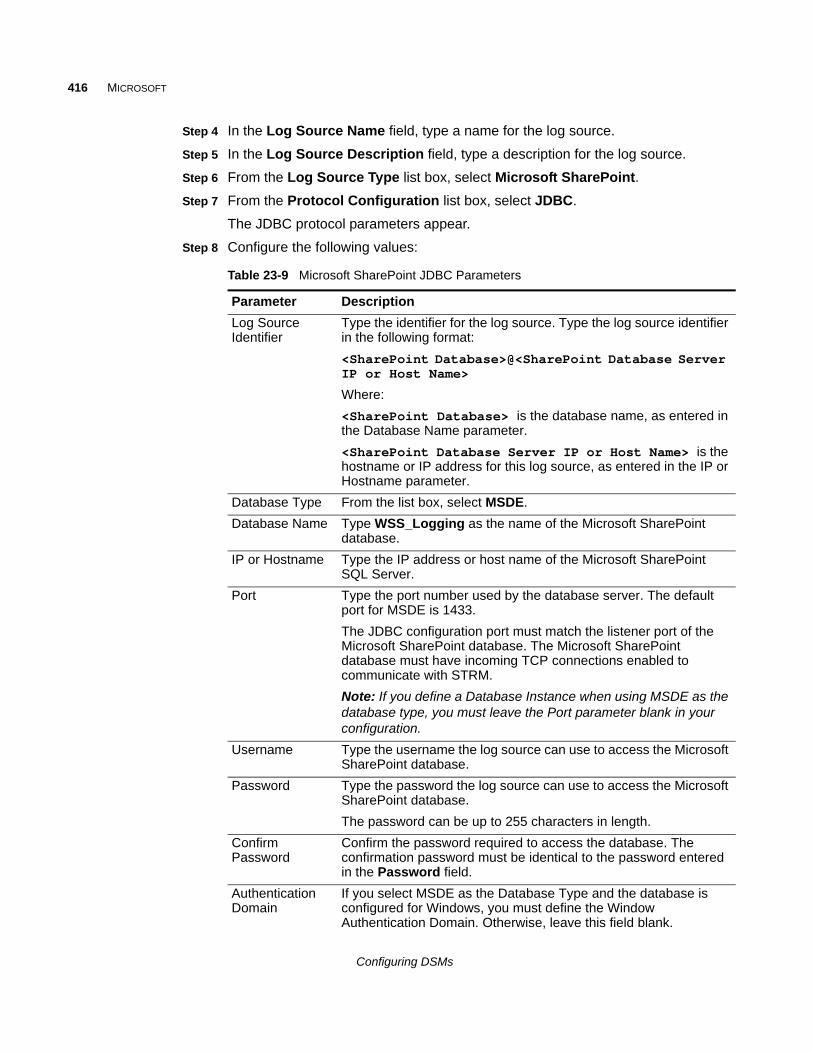
416 MICROSOFT
Step 4 In the Log Source Name field, type a name for the log source.
Step 5 In the Log Source Description field, type a description for the log source.
Step 6 From the Log Source Type list box, select Microsoft SharePoint.
Step 7 From the Protocol Configuration list box, select JDBC.
The JDBC protocol parameters appear.
Step 8 Configure the following values:
Table 23-9 Microsoft SharePoint JDBC Parameters
Parameter Description
Log Source Identifier
Type the identifier for the log source. Type the log source identifier in the following format:
<SharePoint Database>@<SharePoint Database Server IP or Host Name>
Where:
<SharePoint Database> is the database name, as entered in the Database Name parameter.
<SharePoint Database Server IP or Host Name> is the hostname or IP address for this log source, as entered in the IP or Hostname parameter.
Database Type From the list box, select MSDE.
Database Name Type WSS_Logging as the name of the Microsoft SharePoint database.
IP or Hostname Type the IP address or host name of the Microsoft SharePoint SQL Server.
Port Type the port number used by the database server. The default port for MSDE is 1433.
The JDBC configuration port must match the listener port of the Microsoft SharePoint database. The Microsoft SharePoint database must have incoming TCP connections enabled to communicate with STRM.
Note: If you define a Database Instance when using MSDE as the database type, you must leave the Port parameter blank in your configuration.
Username Type the username the log source can use to access the Microsoft SharePoint database.
Password Type the password the log source can use to access the Microsoft SharePoint database.
The password can be up to 255 characters in length.
Confirm Password
Confirm the password required to access the database. The confirmation password must be identical to the password entered in the Password field.
Authentication Domain
If you select MSDE as the Database Type and the database is configured for Windows, you must define the Window Authentication Domain. Otherwise, leave this field blank.
Configuring DSMs
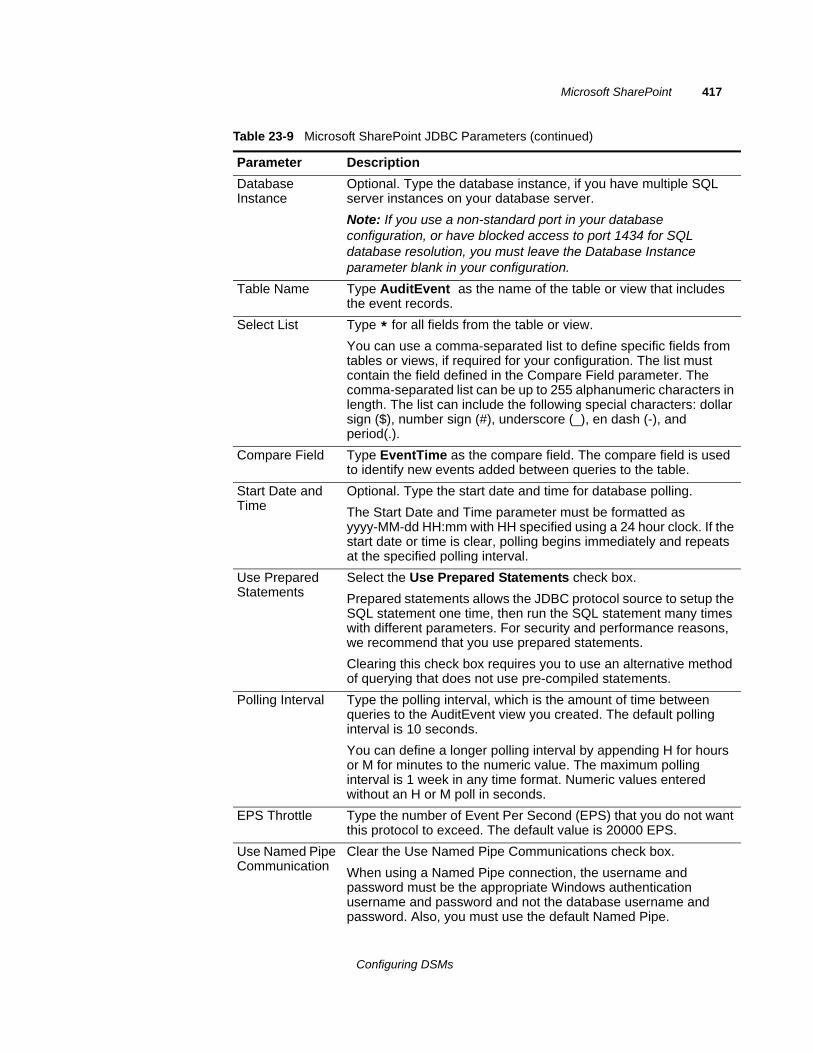
Microsoft SharePoint 417
Database Instance
Optional. Type the database instance, if you have multiple SQL server instances on your database server.
Note: If you use a non-standard port in your database configuration, or have blocked access to port 1434 for SQL database resolution, you must leave the Database Instance parameter blank in your configuration.
Table Name Type AuditEvent as the name of the table or view that includes the event records.
Select List Type * for all fields from the table or view.
You can use a comma-separated list to define specific fields from tables or views, if required for your configuration. The list must contain the field defined in the Compare Field parameter. The comma-separated list can be up to 255 alphanumeric characters in length. The list can include the following special characters: dollar sign ($), number sign (#), underscore (_), en dash (-), and period(.).
Compare Field Type EventTime as the compare field. The compare field is used to identify new events added between queries to the table.
Start Date and Time
Optional. Type the start date and time for database polling.
The Start Date and Time parameter must be formatted as yyyy-MM-dd HH:mm with HH specified using a 24 hour clock. If the start date or time is clear, polling begins immediately and repeats at the specified polling interval.
Use Prepared Statements
Select the Use Prepared Statements check box.
Prepared statements allows the JDBC protocol source to setup the SQL statement one time, then run the SQL statement many times with different parameters. For security and performance reasons, we recommend that you use prepared statements.
Clearing this check box requires you to use an alternative method of querying that does not use pre-compiled statements.
Polling Interval Type the polling interval, which is the amount of time between queries to the AuditEvent view you created. The default polling interval is 10 seconds.
You can define a longer polling interval by appending H for hours or M for minutes to the numeric value. The maximum polling interval is 1 week in any time format. Numeric values entered without an H or M poll in seconds.
EPS Throttle Type the number of Event Per Second (EPS) that you do not want this protocol to exceed. The default value is 20000 EPS.
Use Named Pipe Communication
Clear the Use Named Pipe Communications check box.
When using a Named Pipe connection, the username and password must be the appropriate Windows authentication username and password and not the database username and password. Also, you must use the default Named Pipe.
Table 23-9 Microsoft SharePoint JDBC Parameters (continued)
Parameter Description
Configuring DSMs
418 MICROSOFT
NOTESelecting a value for the Credibility parameter greater than 5 will weight your Microsoft SharePoint log source with a higher importance compared to other log sources in STRM.
Step 9 Click Save.
Step 10 On the Admin tab, click Deploy Changes.
The Microsoft SharePoint configuration is complete.
Microsoft Windows Security Event Log
The Microsoft Windows Security Event Log DSM for STRM accepts Windows-based events using syslog.
You can integrate Window Microsoft Security Event Log events with STRM using one of the following methods:
• Use a WinCollect agent to retrieve Windows-based events from multiple Windows systems in your network. For more information on WinCollect, see the WinCollect User Guide.
• Use the Adaptive Log Exporter. For more information on the Adaptive Log Exporter, see the Adaptive Log Exporter Users Guide.
• Use the Microsoft Security Event Log protocol to collect events using WMI. For more information, see Using WMI
• Set-up the Snare Agent to forward Microsoft Windows Security Event Logs to STRM. See Using the Snare Agent
Using WMI Before you can configure a log source using the Microsoft Windows Security Event Log protocol, you must configure your system DCOM settings for each host you want to monitor. Ensure the following is configured for each host:
• Make sure you have appropriate administrative permissions. For this process, you must be a member of the Administrators group on the remote computer.
• Make sure you have Windows 2000, Windows 2003, Windows 2008, XP, or Vista software, or Windows 7 installed. The Windows Event Log Protocol supports 32 or 64-bit systems.
• Configure DCOM and enable the host.
• Enable Windows Management Instrumentation on the host.
• Activate the remote registry service.
Database Cluster Name
If you select the Use Named Pipe Communication check box, the Database Cluster Name parameter is displayed. If you are running your SQL server in a cluster environment, define the cluster name to ensure Named Pipe communication functions properly.
Table 23-9 Microsoft SharePoint JDBC Parameters (continued)
Parameter Description
Configuring DSMs
Microsoft Windows Security Event Log 419
• If a firewall is installed on the host (for example, Windows firewall) or is located between the host and STRM (such as a hardware or other intermediary firewall), you must configure the firewall to allow DCOM communication. This includes configuring the firewall to permit port 135 to be accessible on the host, as well as permitting DCOM ports (generally random ports above 1024). If necessary, you can also configure specific ports to be accessible to DCOM. This depends on the version of Windows. For more information, see your Windows documentation.
• Configure a system or domain account that includes security configuration permitting access to the Window event log protocol DCOM components, Windows event log protocol name space, and appropriate access to the remote registry keys.
You are now ready to configure the log source in STRM:
Step 1 To configure STRM to receive events from Windows security event logs, you must select the Microsoft Windows Security Event Log option from the Log Source Type list box.
Step 2 To configure the Windows Event Log protocol, you must select the Microsoft Security Event Log option from the Protocol Configuration list box. Your system must be running the latest version of the Windows Event Log protocol to retrieve File Replication and Directory Service events:
Using the SnareAgent
To configure the Snare Agent to forward Windows security event logs to STRM:
Step 1 Download and install the Snare Agent.
NOTETo download a Snare Agent, see the following website: http://www.intersectalliance.com/projects/SnareWindows/index.html
Step 2 On the navigation menu, select Network Configuration.
Step 3 Type the IP address of the STRM system in the Destination Snare Server address field.
Step 4 Select the Enable SYSLOG Header check box.
Step 5 Click Change Configuration.
Step 6 On the navigation menu, select Objectives Configuration.
Step 7 In the Identify the event types to be captured field, select check boxes to define the event types you want snare to forward to STRM.
The Microsoft Windows Event Log DSM supports Informational, Warning, Error, Success Audit, and Failure Audit event types.
Step 8 In the Identify the event logs field, select check boxes to define the event logs you want snare to forward to STRM.
The Microsoft Windows Event Log DSM supports Security, System, Application, DNS Server, File Replication and Directory Service log types.
Configuring DSMs
420 MICROSOFT
Step 9 Click Change Configuration.
Step 10 On the navigation menu, select Apply the Latest Audit Configuration.
The value entered in the override host name detection with field must match the IP address or hostname assigned to the device configured in the STRM setup.
You are now ready to configure the log source in STRM:
Step 1 To configure STRM to receive events from Windows security event logs, you must select the Microsoft Windows Security Event Log option from the Log Source Type list box.
Step 2 To configure the Windows Event Log protocol, you must select the Microsoft Security Event Log option from the Protocol Configuration list box. Your system must be running the latest version of the Windows Event Log protocol to retrieve File Replication and Directory Service log types:
For more information on configuring devices, see the STRM Log Sources Users Guide. For more information about your server, see your vendor documentation.
Microsoft Operations Manager
The Microsoft Operations Manager DSM for STRM accepts Microsoft Operations Manager (MOM) events by polling the OnePoint database allowing STRM to record the relevant events.
Before you configure STRM to integrate with the Microsoft Operations Manager, you must ensure a database user account is configured with appropriate permissions to access the MOM OnePoint SQL Server database. Access to the OnePoint database SDK views is managed through the MOM SDK View User database role. For more information, please see your Microsoft Operations Manager documentation.
NOTEMake sure that no firewall rules are blocking the communication between STRM and the SQL Server database associated with MOM. For MOM installations that use a separate, dedicated computer for the SQL Server database, the SDKEventView view is queried on the database system, not the system running MOM.
To configure STRM to receive MOM events:
Step 1 Click the Admin tab.
Step 2 On the navigation menu, click Data Sources.
The Data Sources panel is displayed.
Step 3 Click the Log Sources icon.
The Log Sources window is displayed.
Step 4 From the Log Source Type list box, select Microsoft Operations Manager.
Configuring DSMs
Microsoft Operations Manager 421
Step 5 From the Protocol Configuration list box, select JDBC.
The JDBC protocol parameters appear.
Step 6 Configure the following values:
Table 23-10 Microsoft Operations Manager JDBC Parameters
Parameter Description
Log Source Identifier
Type the identifier for the log source. Type the log source identifier in the following format:
<MOM Database>@<MOM Database Server IP or Host Name>
Where:
<MOM Database> is the database name, as entered in the Database Name parameter.
<MOM Database Server IP or Host Name> is the hostname or IP address for this log source, as entered in the IP or Hostname parameter.
Database Type From the list box, select MSDE.
Database Name Type OnePoint as the name of the Microsoft Operations Manager database.
IP or Hostname Type the IP address or host name of the Microsoft Operations Manager SQL Server.
Port Type the port number used by the database server. The default port for MSDE is 1433.
The JDBC configuration port must match the listener port of the Microsoft Operations Manager database. The Microsoft Operations Manager database must have incoming TCP connections enabled to communicate with STRM.
Note: If you define a Database Instance when using MSDE as the database type, you must leave the Port parameter blank in your configuration.
Username Type the username required to access the database.
Password Type the password required to access the database. The password can be up to 255 characters in length.
Confirm Password
Confirm the password required to access the database. The confirmation password must be identical to the password entered in the Password parameter.
Authentication Domain
If you select MSDE as the Database Type and the database is configured for Windows, you must define the Window Authentication Domain. Otherwise, leave this field blank.
Configuring DSMs
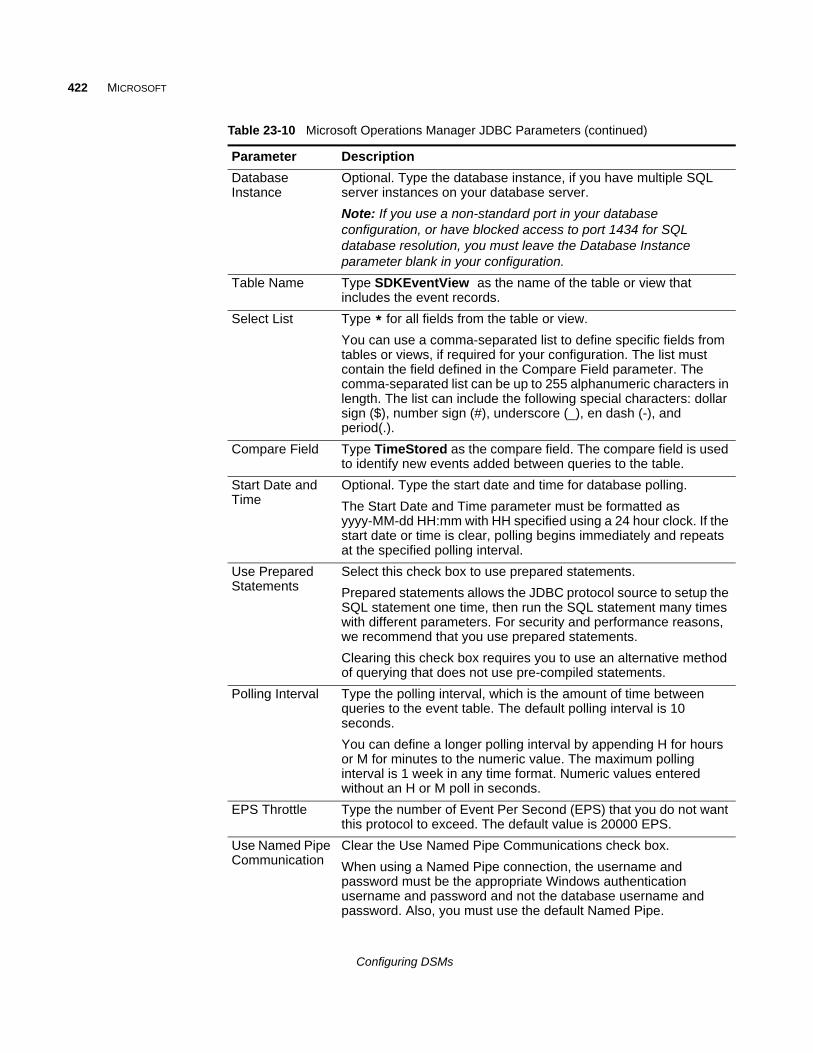
422 MICROSOFT
Database Instance
Optional. Type the database instance, if you have multiple SQL server instances on your database server.
Note: If you use a non-standard port in your database configuration, or have blocked access to port 1434 for SQL database resolution, you must leave the Database Instance parameter blank in your configuration.
Table Name Type SDKEventView as the name of the table or view that includes the event records.
Select List Type * for all fields from the table or view.
You can use a comma-separated list to define specific fields from tables or views, if required for your configuration. The list must contain the field defined in the Compare Field parameter. The comma-separated list can be up to 255 alphanumeric characters in length. The list can include the following special characters: dollar sign ($), number sign (#), underscore (_), en dash (-), and period(.).
Compare Field Type TimeStored as the compare field. The compare field is used to identify new events added between queries to the table.
Start Date and Time
Optional. Type the start date and time for database polling.
The Start Date and Time parameter must be formatted as yyyy-MM-dd HH:mm with HH specified using a 24 hour clock. If the start date or time is clear, polling begins immediately and repeats at the specified polling interval.
Use Prepared Statements
Select this check box to use prepared statements.
Prepared statements allows the JDBC protocol source to setup the SQL statement one time, then run the SQL statement many times with different parameters. For security and performance reasons, we recommend that you use prepared statements.
Clearing this check box requires you to use an alternative method of querying that does not use pre-compiled statements.
Polling Interval Type the polling interval, which is the amount of time between queries to the event table. The default polling interval is 10 seconds.
You can define a longer polling interval by appending H for hours or M for minutes to the numeric value. The maximum polling interval is 1 week in any time format. Numeric values entered without an H or M poll in seconds.
EPS Throttle Type the number of Event Per Second (EPS) that you do not want this protocol to exceed. The default value is 20000 EPS.
Use Named Pipe Communication
Clear the Use Named Pipe Communications check box.
When using a Named Pipe connection, the username and password must be the appropriate Windows authentication username and password and not the database username and password. Also, you must use the default Named Pipe.
Table 23-10 Microsoft Operations Manager JDBC Parameters (continued)
Parameter Description
Configuring DSMs
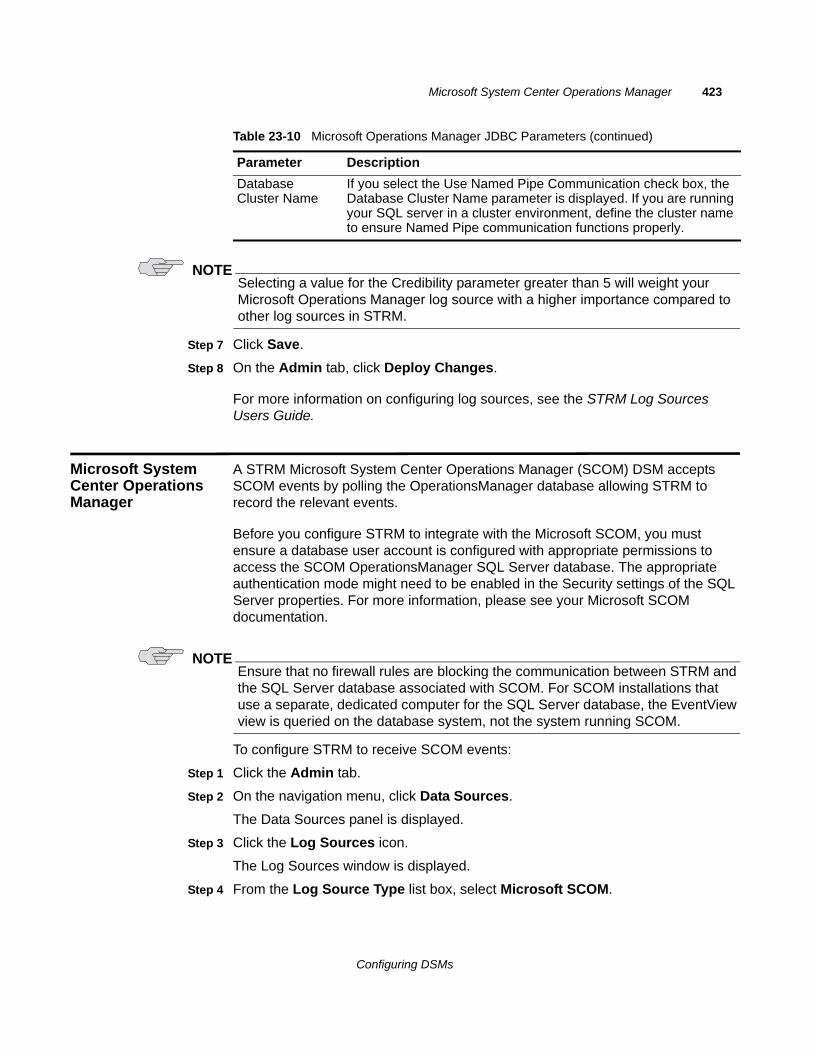
Microsoft System Center Operations Manager 423
NOTESelecting a value for the Credibility parameter greater than 5 will weight your Microsoft Operations Manager log source with a higher importance compared to other log sources in STRM.
Step 7 Click Save.
Step 8 On the Admin tab, click Deploy Changes.
For more information on configuring log sources, see the STRM Log Sources Users Guide.
Microsoft System Center Operations Manager
A STRM Microsoft System Center Operations Manager (SCOM) DSM accepts SCOM events by polling the OperationsManager database allowing STRM to record the relevant events.
Before you configure STRM to integrate with the Microsoft SCOM, you must ensure a database user account is configured with appropriate permissions to access the SCOM OperationsManager SQL Server database. The appropriate authentication mode might need to be enabled in the Security settings of the SQL Server properties. For more information, please see your Microsoft SCOM documentation.
NOTEEnsure that no firewall rules are blocking the communication between STRM and the SQL Server database associated with SCOM. For SCOM installations that use a separate, dedicated computer for the SQL Server database, the EventView view is queried on the database system, not the system running SCOM.
To configure STRM to receive SCOM events:
Step 1 Click the Admin tab.
Step 2 On the navigation menu, click Data Sources.
The Data Sources panel is displayed.
Step 3 Click the Log Sources icon.
The Log Sources window is displayed.
Step 4 From the Log Source Type list box, select Microsoft SCOM.
Database Cluster Name
If you select the Use Named Pipe Communication check box, the Database Cluster Name parameter is displayed. If you are running your SQL server in a cluster environment, define the cluster name to ensure Named Pipe communication functions properly.
Table 23-10 Microsoft Operations Manager JDBC Parameters (continued)
Parameter Description
Configuring DSMs
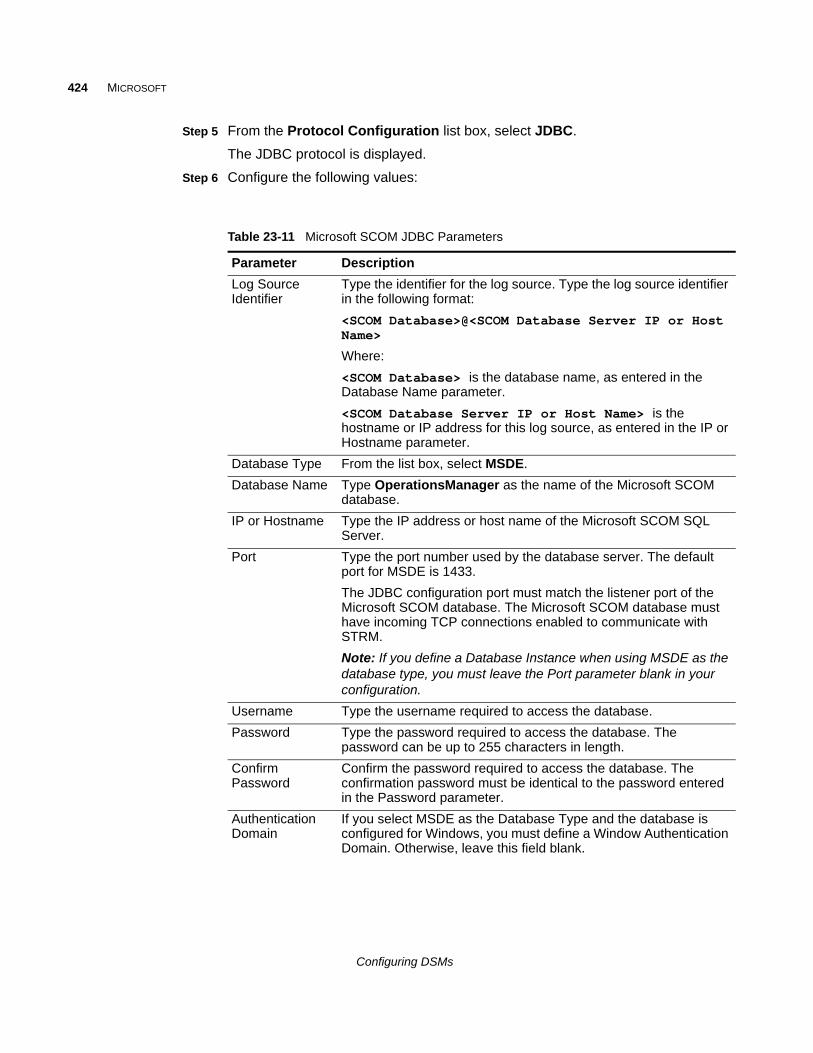
424 MICROSOFT
Step 5 From the Protocol Configuration list box, select JDBC.
The JDBC protocol is displayed.
Step 6 Configure the following values:
Table 23-11 Microsoft SCOM JDBC Parameters
Parameter Description
Log Source Identifier
Type the identifier for the log source. Type the log source identifier in the following format:
<SCOM Database>@<SCOM Database Server IP or Host Name>
Where:
<SCOM Database> is the database name, as entered in the Database Name parameter.
<SCOM Database Server IP or Host Name> is the hostname or IP address for this log source, as entered in the IP or Hostname parameter.
Database Type From the list box, select MSDE.
Database Name Type OperationsManager as the name of the Microsoft SCOM database.
IP or Hostname Type the IP address or host name of the Microsoft SCOM SQL Server.
Port Type the port number used by the database server. The default port for MSDE is 1433.
The JDBC configuration port must match the listener port of the Microsoft SCOM database. The Microsoft SCOM database must have incoming TCP connections enabled to communicate with STRM.
Note: If you define a Database Instance when using MSDE as the database type, you must leave the Port parameter blank in your configuration.
Username Type the username required to access the database.
Password Type the password required to access the database. The password can be up to 255 characters in length.
Confirm Password
Confirm the password required to access the database. The confirmation password must be identical to the password entered in the Password parameter.
Authentication Domain
If you select MSDE as the Database Type and the database is configured for Windows, you must define a Window Authentication Domain. Otherwise, leave this field blank.
Configuring DSMs

Microsoft System Center Operations Manager 425
Database Instance
Optional. Type the database instance, if you have multiple SQL server instances on your database server.
Note: If you use a non-standard port in your database configuration, or have blocked access to port 1434 for SQL database resolution, you must leave the Database Instance parameter blank in your configuration.
Table Name Type EventView as the name of the table or view that includes the event records.
Select List Type * for all fields from the table or view.
You can use a comma-separated list to define specific fields from tables or views, if required for your configuration. The list must contain the field defined in the Compare Field parameter. The comma-separated list can be up to 255 alphanumeric characters in length. The list can include the following special characters: dollar sign ($), number sign (#), underscore (_), en dash (-), and period(.).
Compare Field Type TimeAdded as the compare field. The compare field is used to identify new events added between queries to the table.
Start Date and Time
Optional. Type the start date and time for database polling.
The Start Date and Time parameter must be formatted as yyyy-MM-dd HH:mm with HH specified using a 24 hour clock. If the start date or time is clear, polling begins immediately and repeats at the specified polling interval.
Use Prepared Statements
Select this check box to use prepared statements.
Prepared statements allows the JDBC protocol source to setup the SQL statement one time, then run the SQL statement many times with different parameters. For security and performance reasons, we recommend that you use prepared statements.
Clearing this check box requires you to use an alternative method of querying that does not use pre-compiled statements.
Polling Interval Type the polling interval, which is the amount of time between queries to the event table. The default polling interval is 10 seconds.
You can define a longer polling interval by appending H for hours or M for minutes to the numeric value. The maximum polling interval is 1 week in any time format. Numeric values entered without an H or M poll in seconds.
EPS Throttle Type the number of Event Per Second (EPS) that you do not want this protocol to exceed. The default value is 20000 EPS.
Use Named Pipe Communication
Clear the Use Named Pipe Communications check box.
When using a Named Pipe connection, the username and password must be the appropriate Windows authentication username and password and not the database username and password. Also, you must use the default Named Pipe.
Table 23-11 Microsoft SCOM JDBC Parameters (continued)
Parameter Description
Configuring DSMs

426 MICROSOFT
NOTESelecting a value for the Credibility parameter greater than 5 will weight your Microsoft SCOM log source with a higher importance compared to other log sources in STRM.
Step 7 Click Save.
Step 8 On the Admin tab, click Deploy Changes.
For more information on configuring log sources, see the STRM Log Sources Users Guide.
Database Cluster Name
If you select the Use Named Pipe Communication check box, the Database Cluster Name parameter is displayed. If you are running your SQL server in a cluster environment, define the cluster name to ensure Named Pipe communication functions properly.
Table 23-11 Microsoft SCOM JDBC Parameters (continued)
Parameter Description
Configuring DSMs

Microsoft System Center Operations Manager 427
Configuring DSMs

428 MICROSOFT
Configuring DSMs
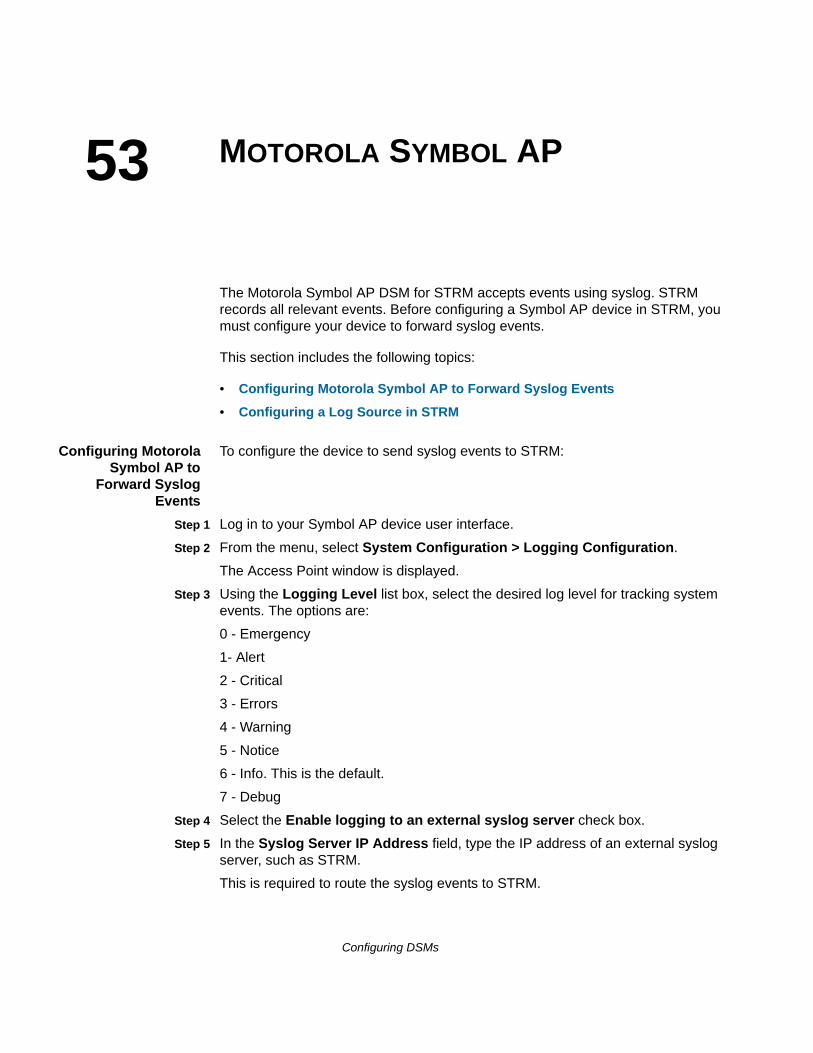
53
MOTOROLA SYMBOL APThe Motorola Symbol AP DSM for STRM accepts events using syslog. STRM records all relevant events. Before configuring a Symbol AP device in STRM, you must configure your device to forward syslog events.
This section includes the following topics:
• Configuring Motorola Symbol AP to Forward Syslog Events
• Configuring a Log Source in STRM
Configuring MotorolaSymbol AP to
Forward SyslogEvents
To configure the device to send syslog events to STRM:
Step 1 Log in to your Symbol AP device user interface.
Step 2 From the menu, select System Configuration > Logging Configuration.
The Access Point window is displayed.
Step 3 Using the Logging Level list box, select the desired log level for tracking system events. The options are:
0 - Emergency
1- Alert
2 - Critical
3 - Errors
4 - Warning
5 - Notice
6 - Info. This is the default.
7 - Debug
Step 4 Select the Enable logging to an external syslog server check box.
Step 5 In the Syslog Server IP Address field, type the IP address of an external syslog server, such as STRM.
This is required to route the syslog events to STRM.
Configuring DSMs
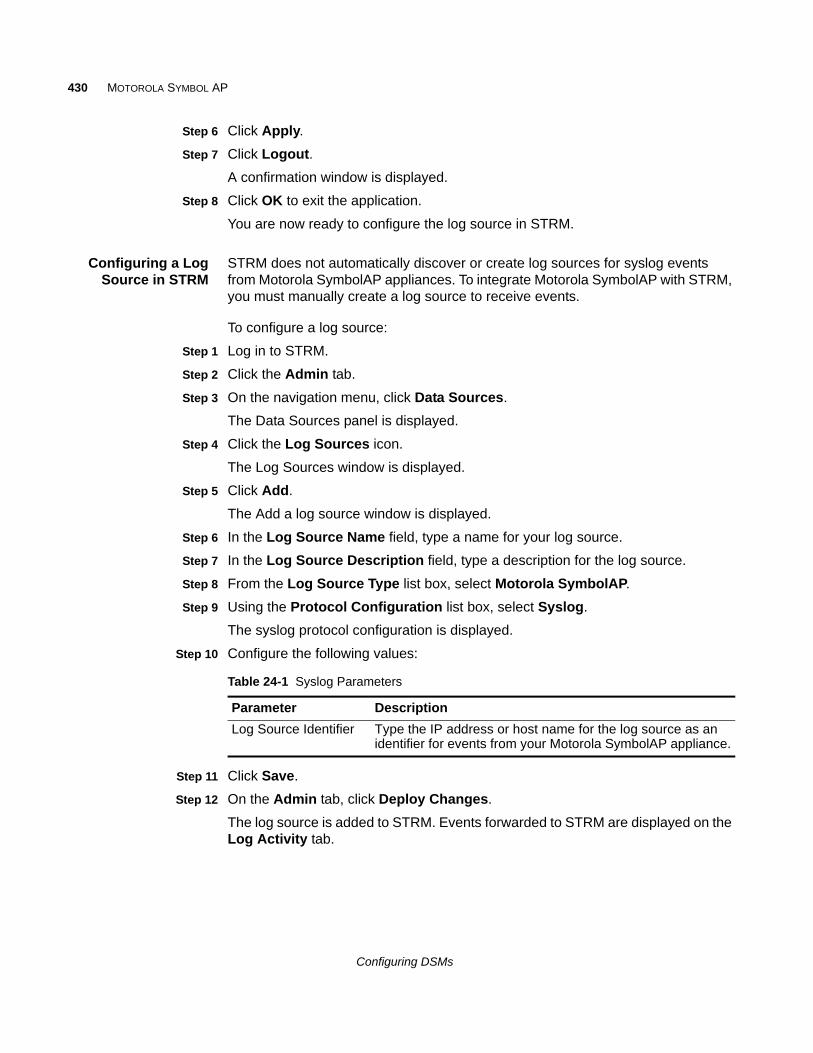
430 MOTOROLA SYMBOL AP
Step 6 Click Apply.
Step 7 Click Logout.
A confirmation window is displayed.
Step 8 Click OK to exit the application.
You are now ready to configure the log source in STRM.
Configuring a LogSource in STRM
STRM does not automatically discover or create log sources for syslog events from Motorola SymbolAP appliances. To integrate Motorola SymbolAP with STRM, you must manually create a log source to receive events.
To configure a log source:
Step 1 Log in to STRM.
Step 2 Click the Admin tab.
Step 3 On the navigation menu, click Data Sources.
The Data Sources panel is displayed.
Step 4 Click the Log Sources icon.
The Log Sources window is displayed.
Step 5 Click Add.
The Add a log source window is displayed.
Step 6 In the Log Source Name field, type a name for your log source.
Step 7 In the Log Source Description field, type a description for the log source.
Step 8 From the Log Source Type list box, select Motorola SymbolAP.
Step 9 Using the Protocol Configuration list box, select Syslog.
The syslog protocol configuration is displayed.
Step 10 Configure the following values:
Step 11 Click Save.
Step 12 On the Admin tab, click Deploy Changes.
The log source is added to STRM. Events forwarded to STRM are displayed on the Log Activity tab.
Table 24-1 Syslog Parameters
Parameter Description
Log Source Identifier Type the IP address or host name for the log source as an identifier for events from your Motorola SymbolAP appliance.
Configuring DSMs
54
NETAPP DATA ONTAPThe NetApp Data ONTAP DSM for STRM accepts syslog events from a client running the Adaptive Log Exporter. The Adaptive Log Exporter is an external event collection agent. The Adaptive Log Exporter allows you to collect events using a NetApp Data ONTAP plug-in. The Adaptive Log Exporter can read and process event log messages generated from Common Internet File System (CIFS) auditing on the NetApp Data ONTAP device and forward the events.
For more information on using the Adaptive Log Exporter, see the Adaptive Log Exporter Users Guide.
NOTEThe NetApp Data ONTAP plug-in for the Adaptive Log Exporter only supports CIFS. For information on configuring CIFS on your NetApp Data ONTAP device, see your vendor documentation.
STRM automatically detects the NetApp Data ONTAP events from the Adaptive Log Exporter. To manually configure STRM to receive events from NetApp Data ONTAP:
From the Log Source Type list box, select the NetApp Data ONTAP option.
Configuring DSMs

55
NAME VALUE PAIRThe Name Value Pair (NVP) DSM allows you to integrate STRM with devices that might not natively send logs using syslog. The NVP DSM provides a log format that allows you to send logs to STRM. For example, for a device that does not export logs natively with syslog, you can create a script to export the logs from a device that STRM does not support, format the logs in the NVP log format, and send the logs to STRM using syslog. The NVP DSM log source configured in STRM then receives the logs and is able to parse the data since the logs are received in the NVP log format.
NOTEEvents for the NVP DSM are not automatically discovered by STRM.
The NVP DSM accepts events using syslog. STRM records all relevant events. The log format for the NVP DSM must be a tab-separated single line list of Name=Parameter. The NVP DSM does not require a valid syslog header.
NOTEThe NVP DSM assumes an ability to create custom scripts or thorough knowledge of your device capabilities to send logs to STRM using syslog in NVP format.
This section provides information on the following:
• NVP Log Format
• Examples
NVP Log Format Table 26-1 includes a list of tags that the NVP DSM is able to parse:
Table 26-1 NVP Log Format Tags
Tag Description
DeviceType Type NVP as the DeviceType. This identifies the log formats as a Name Value Pair log message.
This is a required parameter and DeviceType=NVP must be the first pair in the list.
Configuring DSMs
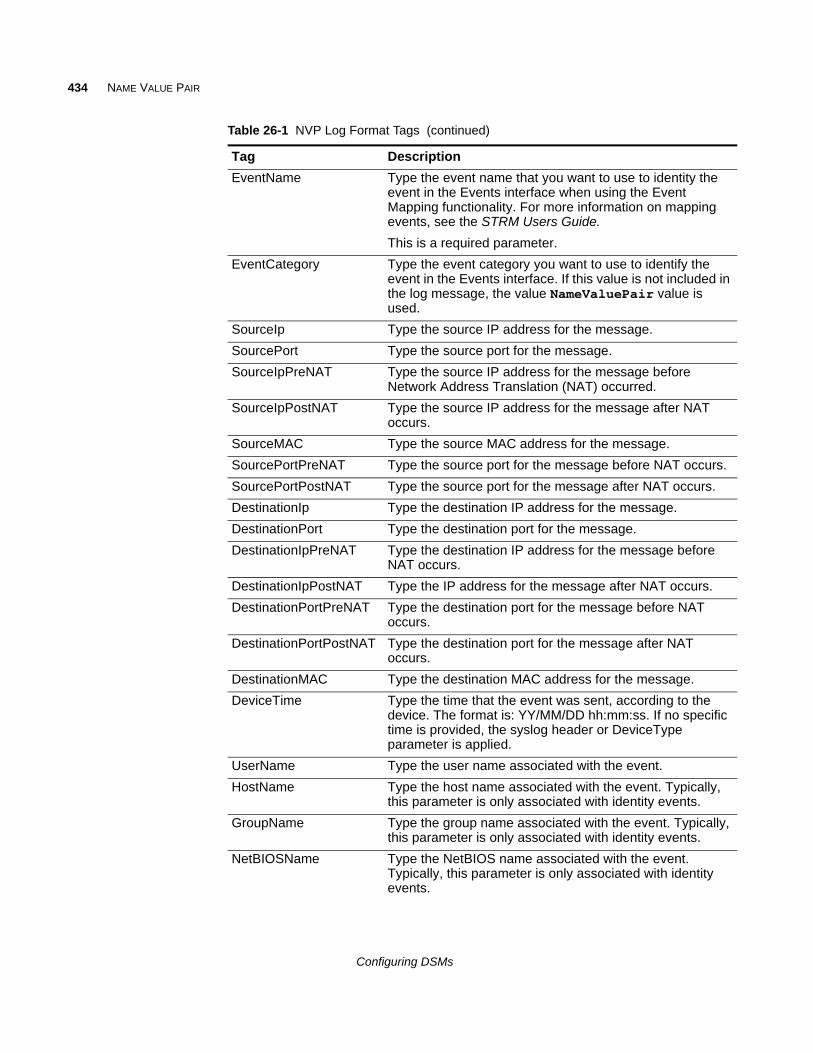
434 NAME VALUE PAIR
EventName Type the event name that you want to use to identity the event in the Events interface when using the Event Mapping functionality. For more information on mapping events, see the STRM Users Guide.
This is a required parameter.
EventCategory Type the event category you want to use to identify the event in the Events interface. If this value is not included in the log message, the value NameValuePair value is used.
SourceIp Type the source IP address for the message.
SourcePort Type the source port for the message.
SourceIpPreNAT Type the source IP address for the message before Network Address Translation (NAT) occurred.
SourceIpPostNAT Type the source IP address for the message after NAT occurs.
SourceMAC Type the source MAC address for the message.
SourcePortPreNAT Type the source port for the message before NAT occurs.
SourcePortPostNAT Type the source port for the message after NAT occurs.
DestinationIp Type the destination IP address for the message.
DestinationPort Type the destination port for the message.
DestinationIpPreNAT Type the destination IP address for the message before NAT occurs.
DestinationIpPostNAT Type the IP address for the message after NAT occurs.
DestinationPortPreNAT Type the destination port for the message before NAT occurs.
DestinationPortPostNAT Type the destination port for the message after NAT occurs.
DestinationMAC Type the destination MAC address for the message.
DeviceTime Type the time that the event was sent, according to the device. The format is: YY/MM/DD hh:mm:ss. If no specific time is provided, the syslog header or DeviceType parameter is applied.
UserName Type the user name associated with the event.
HostName Type the host name associated with the event. Typically, this parameter is only associated with identity events.
GroupName Type the group name associated with the event. Typically, this parameter is only associated with identity events.
NetBIOSName Type the NetBIOS name associated with the event. Typically, this parameter is only associated with identity events.
Table 26-1 NVP Log Format Tags (continued)
Tag Description
Configuring DSMs
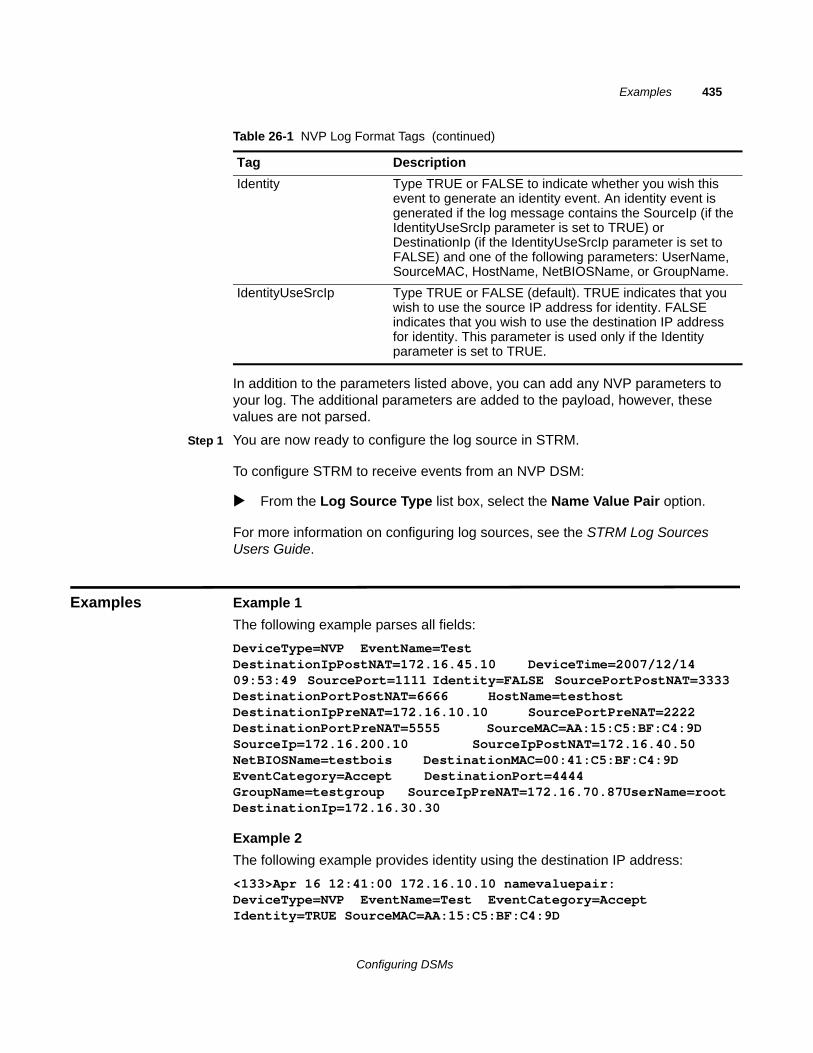
Examples 435
In addition to the parameters listed above, you can add any NVP parameters to your log. The additional parameters are added to the payload, however, these values are not parsed.
Step 1 You are now ready to configure the log source in STRM.
To configure STRM to receive events from an NVP DSM:
From the Log Source Type list box, select the Name Value Pair option.
For more information on configuring log sources, see the STRM Log Sources Users Guide.
Examples Example 1
The following example parses all fields:
DeviceType=NVP EventName=Test DestinationIpPostNAT=172.16.45.10 DeviceTime=2007/12/14 09:53:49 SourcePort=1111 Identity=FALSE SourcePortPostNAT=3333 DestinationPortPostNAT=6666 HostName=testhost DestinationIpPreNAT=172.16.10.10 SourcePortPreNAT=2222 DestinationPortPreNAT=5555 SourceMAC=AA:15:C5:BF:C4:9D SourceIp=172.16.200.10 SourceIpPostNAT=172.16.40.50 NetBIOSName=testbois DestinationMAC=00:41:C5:BF:C4:9D EventCategory=Accept DestinationPort=4444 GroupName=testgroup SourceIpPreNAT=172.16.70.87UserName=root DestinationIp=172.16.30.30
Example 2
The following example provides identity using the destination IP address:
<133>Apr 16 12:41:00 172.16.10.10 namevaluepair: DeviceType=NVP EventName=Test EventCategory=Accept Identity=TRUE SourceMAC=AA:15:C5:BF:C4:9D
Identity Type TRUE or FALSE to indicate whether you wish this event to generate an identity event. An identity event is generated if the log message contains the SourceIp (if the IdentityUseSrcIp parameter is set to TRUE) or DestinationIp (if the IdentityUseSrcIp parameter is set to FALSE) and one of the following parameters: UserName, SourceMAC, HostName, NetBIOSName, or GroupName.
IdentityUseSrcIp Type TRUE or FALSE (default). TRUE indicates that you wish to use the source IP address for identity. FALSE indicates that you wish to use the destination IP address for identity. This parameter is used only if the Identity parameter is set to TRUE.
Table 26-1 NVP Log Format Tags (continued)
Tag Description
Configuring DSMs
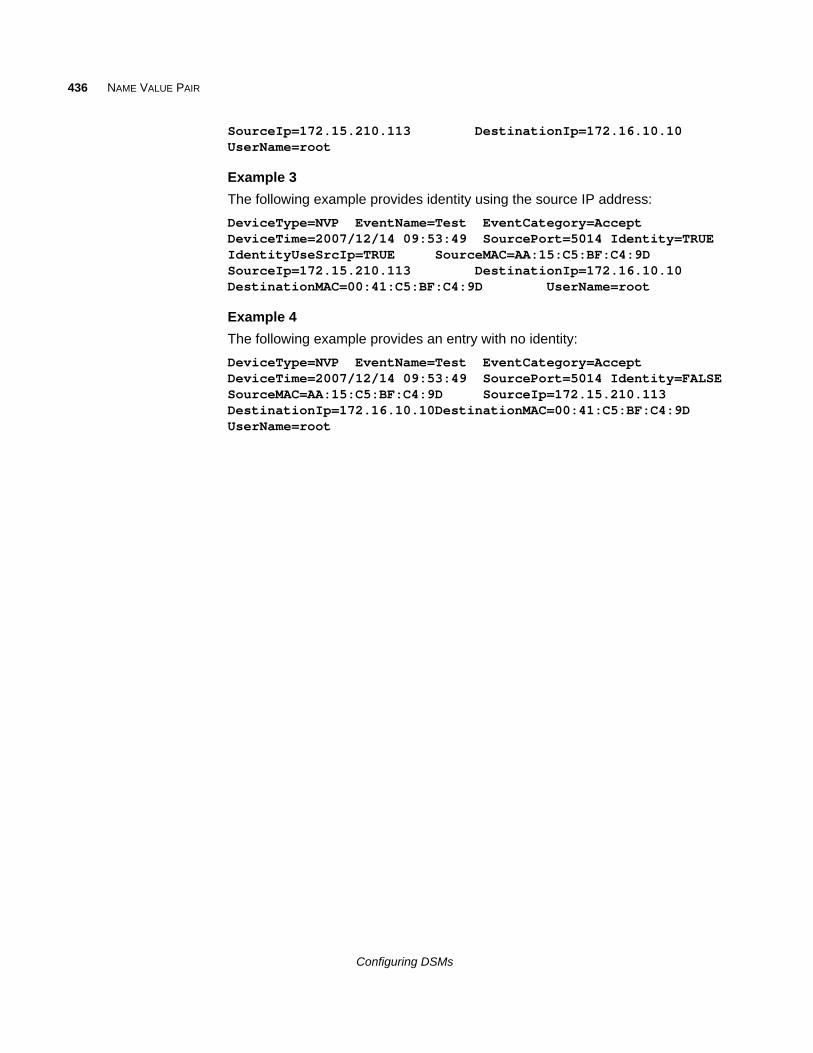
436 NAME VALUE PAIR
SourceIp=172.15.210.113 DestinationIp=172.16.10.10UserName=root
Example 3
The following example provides identity using the source IP address:
DeviceType=NVP EventName=Test EventCategory=Accept DeviceTime=2007/12/14 09:53:49 SourcePort=5014 Identity=TRUE IdentityUseSrcIp=TRUE SourceMAC=AA:15:C5:BF:C4:9D SourceIp=172.15.210.113 DestinationIp=172.16.10.10 DestinationMAC=00:41:C5:BF:C4:9D UserName=root
Example 4
The following example provides an entry with no identity:
DeviceType=NVP EventName=Test EventCategory=Accept DeviceTime=2007/12/14 09:53:49 SourcePort=5014 Identity=FALSESourceMAC=AA:15:C5:BF:C4:9D SourceIp=172.15.210.113 DestinationIp=172.16.10.10DestinationMAC=00:41:C5:BF:C4:9D UserName=root
Configuring DSMs
56
NIKSUNThe Niksun DSM for STRM accepts Niksun events using syslog. STRM records all relevant Niksun events. You can integrate NetDetector/NetVCR2005, version 3.2.1sp1_2 with STRM. Before you configure STRM to integrate with a Niksun device, you must configure syslog within your Niksun device. For more information on configuring Niksun, consult your Niksun documentation.
You are now ready to configure the log source in STRM.
To configure STRM to receive events from a Niksun device:
From the Log Source Type list box, select the Niksun 2005 v3.5 option.
For more information on configuring log sources, see the STRM Log Sources Users Guide.
Configuring DSMs

57
NOKIA FIREWALLThe Check Point Firewall-1 DSM allows STRM to accept events Check Point-based Firewall events sent from Nokia Firewall appliances. The syslog and OPSEC protocols allow two methods for STRM to collect Check Point events from Nokia Firewall appliances.
This section contains the following topics:
• Integrating Nokia Firewall Using Syslog
• Integrating Nokia Firewall Using OPSEC
Integrating Nokia Firewall Using Syslog
This method allows you to configure your Nokia Firewall to accept Check Point syslog events forwarded from your Nokia Firewall appliance.
To configure STRM to integrate with a Nokia Firewall device, you must:
1 Configure iptables on your STRM Console or Event Collector to receive syslog events from Nokia Firewall. For more information, see Configuring IPtables for Nokia Syslog Events.
2 Configure your Nokia Firewall to forward syslog event data. For more information, see Configuring Nokia Firewall Syslog Event Forwarding.
3 Configure the events logged by the Nokia Firewall. For more information, see Configuring Events Logged by Nokia Firewall.
4 Optional. Configure a log source in STRM. For more information, see Configuring a Log Source for Syslog.
Configuring IPtablesfor Nokia Syslog
Events
Nokia Firewalls require a TCP reset (rst) or a TCP acknowledge (ack) from STRM on port 256 before forwarding syslog events. This TCP request is an online status request designed to ensure that STRM is online and able to receive syslog events. If a valid reset or acknowledge is received from STRM, then Nokia Firewall begins forwarding events to STRM on UDP port 514. By default, STRM does not respond to any online status requests from TCP port 256. You must configure IPtables on your STRM Console or any Event Collectors that receive Check Point events from a Nokia Firewall to respond to an online status request.
Configuring DSMs
440 NOKIA FIREWALL
To configure STRM to respond to a Nokia Firewall online status request:
Step 1 Using SSH, log in to STRM as the root user.
Login: root
Password: <password>
Step 2 Type the following command to edit the IPtables file:
vi /opt/qradar/conf/iptables.pre
The IPtables configuration file is displayed.
Step 3 Type the following command to instruct STRM to respond to your Nokia Firewall with a TCP reset on port 256:
-A INPUT -s <IP address> -p tcp --dport 256 -j REJECT --reject-with tcp-reset
Where <IP address> is the IP address of your Nokia Firewall. You must include a TCP reset for each Nokia Firewall IP address that sends events to your STRM Console or Event Collector. For example,
-A INPUT -s 10.10.100.10/32 -p tcp --dport 256 -j REJECT --reject-with tcp-reset
-A INPUT -s 10.10.110.11/32 -p tcp --dport 256 -j REJECT --reject-with tcp-reset
-A INPUT -s 10.10.120.12/32 -p tcp --dport 256 -j REJECT --reject-with tcp-reset
Step 4 Save your IPtables configuration.
Step 5 Type the following command to update IPtables in STRM:
./opt/qradar/bin/iptables_update.pl
Step 6 Repeat Step 1 to Step 5 to configure any additional Event Collectors in your deployment that receive syslog events from a Nokia Firewall.
You are now ready to configure your Nokia Firewall to forward events to STRM.
Configuring NokiaFirewall Syslog Event
Forwarding
To configure your Nokia Firewall to forward events to STRM:
Step 1 Log in to the Nokia Voyager.
Step 2 Click Config.
Step 3 In the System Configuration pane, click System Logging.
Step 4 In the Add new remote IP address to log to field, type the IP address of your STRM Console or Event Collector.
Step 5 Click Apply.
Step 6 Click Save.
You are now ready to configure which events are logged by your Nokia Firewall to the logger.
Configuring DSMs
Integrating Nokia Firewall Using Syslog 441
Configuring EventsLogged by Nokia
Firewall
To configure which events are logged by your Nokia Firewall and forwarded to STRM, you must configure a custom script for your Nokia Firewall.
To configure a script for your Nokia Firewall:
Step 1 Using SSH, log in to Nokia Firewall as an administrative user.
If you cannot connect to your Nokia Firewall, SSH may be disabled. You must enable the command-line using the Nokia Voyager web interface or connect directly using a serial connection. For more information, see your Nokia Voyager documentation.
Step 2 Type the following command to edit your Nokia Firewall rc.local file:
vi /var/etc/rc.local
Step 3 Add the following command to your rc.local file:
$FWDIR/bin/fw log -ftn | /bin/logger -p local1.info &
Step 4 Save the changes to your rc.local file.
The terminal is displayed.
Step 5 To begin logging immediately, type the following command:
nohup $FWDIR/bin/fw log -ftn | /bin/logger -p local1.info &
You are now ready to configure the log source in STRM.
Configuring a LogSource for Syslog
Check Point events forwarded by your Nokia Firewall are automatically discovered by the Check Point Firewall-1 DSM. The automatic discovery process creates a log source for syslog events from Nokia Firewall appliances. However, you can manually create a log source for your Nokia Firewall appliance. The following steps are optional.
To manually configure a log source for Nokia Firewall:
Step 1 Log in to STRM.
Step 2 Click the Admin tab.
Step 3 On the navigation menu, click Data Sources.
The Data Sources panel is displayed.
Step 4 Click the Log Sources icon.
The Log Sources window is displayed.
Step 5 Click Add.
The Add a log source window is displayed.
Step 6 In the Log Source Name field, type a name for your log source.
Step 7 In the Log Source Description field, type a description for the log source.
Step 8 From the Log Source Type list box, select Check Point Firewall-1.
Step 9 Using the Protocol Configuration list box, select Syslog.
The syslog protocol configuration is displayed.
Configuring DSMs
442 NOKIA FIREWALL
Step 10 Configure the following values:
Step 11 Click Save.
Step 12 On the Admin tab, click Deploy Changes.
The syslog configuration for receiving Check Point events from Nokia Firewalls over syslog is complete. Check Point events from your Nokia Firewall are displayed in the Log Activity tab in STRM.
Integrating Nokia Firewall Using OPSEC
STRM can accept Check Point FireWall-1 events from Nokia Firewalls using the Check Point FireWall-1 DSM configured using the OPSEC/LEA protocol. Before you configure STRM to integrate with a Nokia Firewall device, you must:
1 Configure Nokia Firewall using OPSEC, see Reconfiguring Nokia Firewall Using OPSEC.
2 Configure a log source in STRM for your Nokia Firewall using the OPSEC LEA protocol, see Configuring a Log Source in STRM.
Reconfiguring NokiaFirewall Using
OPSEC
To reconfigure Nokia Firewall using OPSEC:
Step 1 To create a host object for your STRM, open up the Check Point SmartDashboard GUI and select Manage > Network Objects > New > Node > Host.
Step 2 type the Name, IP Address, and optional Comment for your STRM.
Step 3 Click OK.
Step 4 Select Close.
Step 5 To create the OPSEC connection, select Manage > Servers and OPSEC Applications > New > OPSEC Application Properties.
Step 6 Type the Name and optional Comment.
The name you type must be different than the name in Step 2.
Step 7 From the Host drop-down menu, select the STRM host object that you created.
Step 8 From Application Properties, select User Defined as the Vendor Type.
Step 9 From Client Entries, select LEA.
Step 10 Select Communication and enter an activation key to configure the Secure Internal Communication (SIC) certificate.
Step 11 Select OK and then select Close.
Step 12 To install the policy on your firewall, select Policy > Install > OK.
Table 28-1 Syslog Parameters
Parameter Description
Log Source Identifier Type the IP address or hostname for the log source as an identifier for events from your Nokia Firewall appliance.
Configuring DSMs
Integrating Nokia Firewall Using OPSEC 443
For more information on policies, see your vendor documentation. You are now ready to configure a log source for your Nokia Firewall in STRM.
Configuring a LogSource in STRM
To configure the log source in STRM, you must:
Step 1 Log in to STRM.
Step 2 Click the Admin tab.
Step 3 On the navigation menu, click Data Sources.
The Data Sources panel is displayed.
Step 4 Click the Log Sources icon.
The Log Sources window is displayed.
Step 5 Click Add.
The Add a log source window is displayed.
Step 6 In the Log Source Name field, type a name for your log source.
Step 7 In the Log Source Description field, type a description for the log source.
Step 8 From the Log Source Type list box, select Check Point FireWall-1.
Step 9 Using the Protocol Configuration list box, select OPSEC/LEA.
The OPSEC/LEA protocol parameters appear.
Step 10 Configure the following values:
Table 28-2 OPSEC/LEA Parameters
Parameter Description
Log Source Identifier
Type an IP address, hostname, or name to identify the event source. IP addresses or hostnames are recommended as they allow STRM to identify a log file to a unique event source.
Server IP Type the IP address of the server.
Server Port Type the port used for OPSEC communication. The valid range is 0 to 65,536 and the default is 18184.
Use Server IP for Log Source
Select this check box if you want to use the LEA server’s IP address instead of the managed device’s IP address for a log source. By default, the check box is selected.
Statistics Report Interval
Type the interval, in seconds, during which the number of syslog events are recorded in the qradar.log file.
The valid range is 4 to 2,147,483,648 and the default is 600.
Configuring DSMs
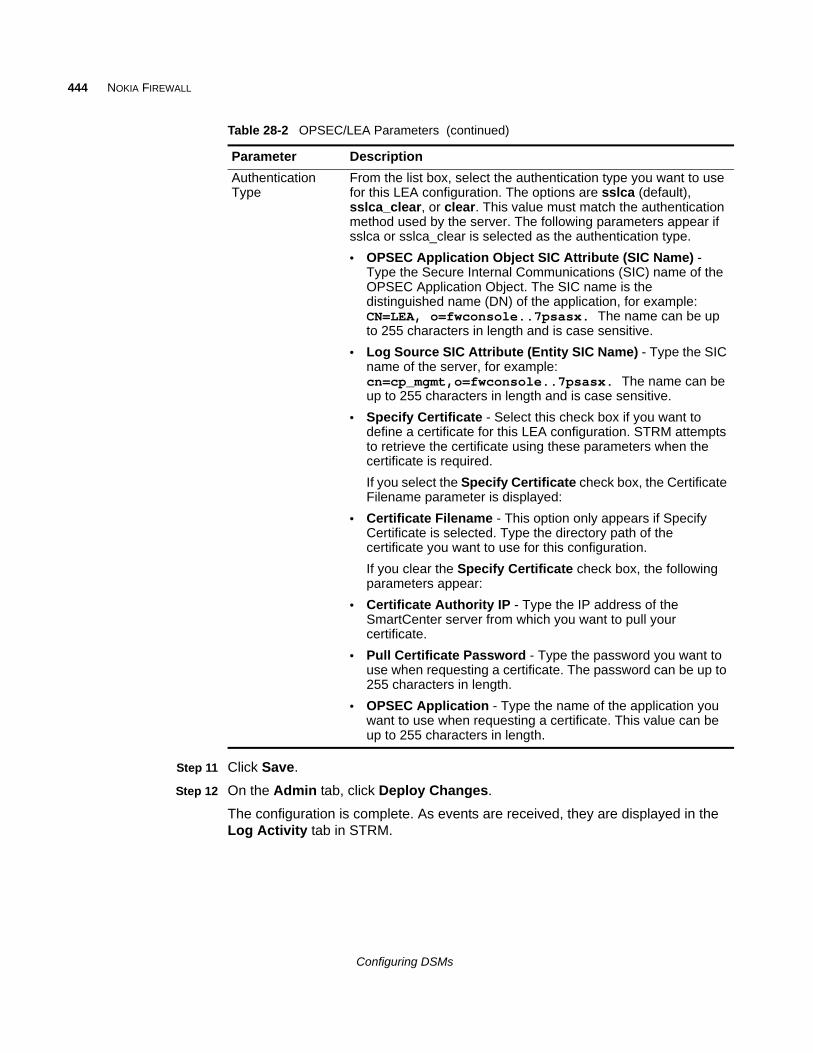
444 NOKIA FIREWALL
Step 11 Click Save.
Step 12 On the Admin tab, click Deploy Changes.
The configuration is complete. As events are received, they are displayed in the Log Activity tab in STRM.
Authentication Type
From the list box, select the authentication type you want to use for this LEA configuration. The options are sslca (default), sslca_clear, or clear. This value must match the authentication method used by the server. The following parameters appear if sslca or sslca_clear is selected as the authentication type.
• OPSEC Application Object SIC Attribute (SIC Name) - Type the Secure Internal Communications (SIC) name of the OPSEC Application Object. The SIC name is the distinguished name (DN) of the application, for example: CN=LEA, o=fwconsole..7psasx. The name can be up to 255 characters in length and is case sensitive.
• Log Source SIC Attribute (Entity SIC Name) - Type the SIC name of the server, for example: cn=cp_mgmt,o=fwconsole..7psasx. The name can be up to 255 characters in length and is case sensitive.
• Specify Certificate - Select this check box if you want to define a certificate for this LEA configuration. STRM attempts to retrieve the certificate using these parameters when the certificate is required.
If you select the Specify Certificate check box, the Certificate Filename parameter is displayed:
• Certificate Filename - This option only appears if Specify Certificate is selected. Type the directory path of the certificate you want to use for this configuration.
If you clear the Specify Certificate check box, the following parameters appear:
• Certificate Authority IP - Type the IP address of the SmartCenter server from which you want to pull your certificate.
• Pull Certificate Password - Type the password you want to use when requesting a certificate. The password can be up to 255 characters in length.
• OPSEC Application - Type the name of the application you want to use when requesting a certificate. This value can be up to 255 characters in length.
Table 28-2 OPSEC/LEA Parameters (continued)
Parameter Description
Configuring DSMs
58
NOMINUM VANTIOThe Nominum Vantio DSM for STRM accepts syslog events in Log Extended Event Format (LEEF) forwarded from Nominum Vantio engines installed with the Nominum Vantio LEEF Adapter. STRM accepts all relevant events forwarded from Nominum Vantio.
The Vantio LEEF Adapter creates LEEF messages based on Lightweight View Policy (LVP) matches. In order to generate LVP matches for the Vantio LEEF Adapter to process, you most configure Lightweight Views and the lvp-monitor for the Vantio engine. LVP is an optionally licensed component of the Nominum Vantio product. For more information about configuring LVP, please see the Vantio Administrator’s Manual.
Before you can integrate Nominum Vantio events with STRM, you must install and configure the Vantio LEEF adapter. To obtain the Vantio LEEF adapter or request additional information, you can email Nominum at the following address: [email protected].
This section includes the following topics:
• Configuring the Vantio LEEF Adapter
• Configuring a Log Source in STRM
Configuring theVantio LEEF Adapter
To install and configure your Vantio LEEF Adapter:
Step 1 Using SSH, log in to your Vantio engine server.
Step 2 Install the Vantio LEEF Adapter:
sudo rpm -I VantioLEEFAdapter-0.1-a.x86_64.rpm
Step 3 Edit the Vantio LEEF Adapter configuration file.
usr/local/nom/sbin/VantioLEEFAdapter
Step 4 Configure the Vantio LEEF Adapter configuration to forward LEEF events to STRM:
-qradar-dest-addr=<IP Address>
Where <IP Address> is the IP address of your STRM Console or Event Collector.
Step 5 Save the Vantio LEEF configuration file.
Configuring DSMs
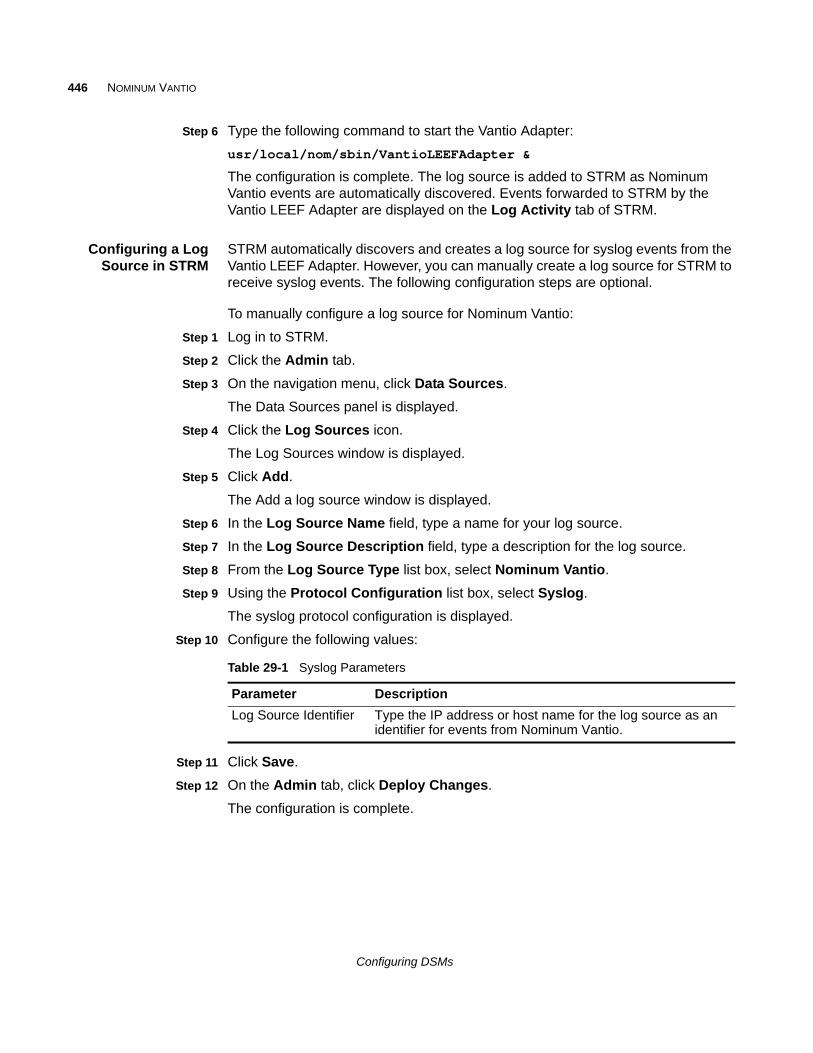
446 NOMINUM VANTIO
Step 6 Type the following command to start the Vantio Adapter:
usr/local/nom/sbin/VantioLEEFAdapter &
The configuration is complete. The log source is added to STRM as Nominum Vantio events are automatically discovered. Events forwarded to STRM by the Vantio LEEF Adapter are displayed on the Log Activity tab of STRM.
Configuring a LogSource in STRM
STRM automatically discovers and creates a log source for syslog events from the Vantio LEEF Adapter. However, you can manually create a log source for STRM to receive syslog events. The following configuration steps are optional.
To manually configure a log source for Nominum Vantio:
Step 1 Log in to STRM.
Step 2 Click the Admin tab.
Step 3 On the navigation menu, click Data Sources.
The Data Sources panel is displayed.
Step 4 Click the Log Sources icon.
The Log Sources window is displayed.
Step 5 Click Add.
The Add a log source window is displayed.
Step 6 In the Log Source Name field, type a name for your log source.
Step 7 In the Log Source Description field, type a description for the log source.
Step 8 From the Log Source Type list box, select Nominum Vantio.
Step 9 Using the Protocol Configuration list box, select Syslog.
The syslog protocol configuration is displayed.
Step 10 Configure the following values:
Step 11 Click Save.
Step 12 On the Admin tab, click Deploy Changes.
The configuration is complete.
Table 29-1 Syslog Parameters
Parameter Description
Log Source Identifier Type the IP address or host name for the log source as an identifier for events from Nominum Vantio.
Configuring DSMs
59
NORTEL NETWORKSThis section provides information on the following DSMs:
• Nortel Multiprotocol Router
• Nortel Application Switch
• Nortel Contivity
• Nortel Ethernet Routing Switch 2500/4500/5500
• Nortel Ethernet Routing Switch 8300/8600
• Nortel Secure Router
• Nortel Secure Network Access Switch
• Nortel Switched Firewall 5100
• Nortel Switched Firewall 6000
• Nortel Threat Protection System
• Nortel VPN Gateway
Nortel Multiprotocol Router
The Nortel Multiprotocol Router DSM for STRM accepts Nortel Multiprotocol Router events using syslog. STRM records all relevant events. Before you configure STRM to integrate with a Nortel Multiprotocol Router device, you must:
Step 1 Log in to your Nortel Multiprotocol Router device.
Step 2 At the prompt, type the following command:
bcc
The Bay Command Console prompt is displayed.
Welcome to the Bay Command Console!
* To enter configuration mode, type config
* To list all system commands, type ?
* To exit the BCC, type exit
bcc>
Step 3 Type the following command to access configuration mode:
config
Configuring DSMs
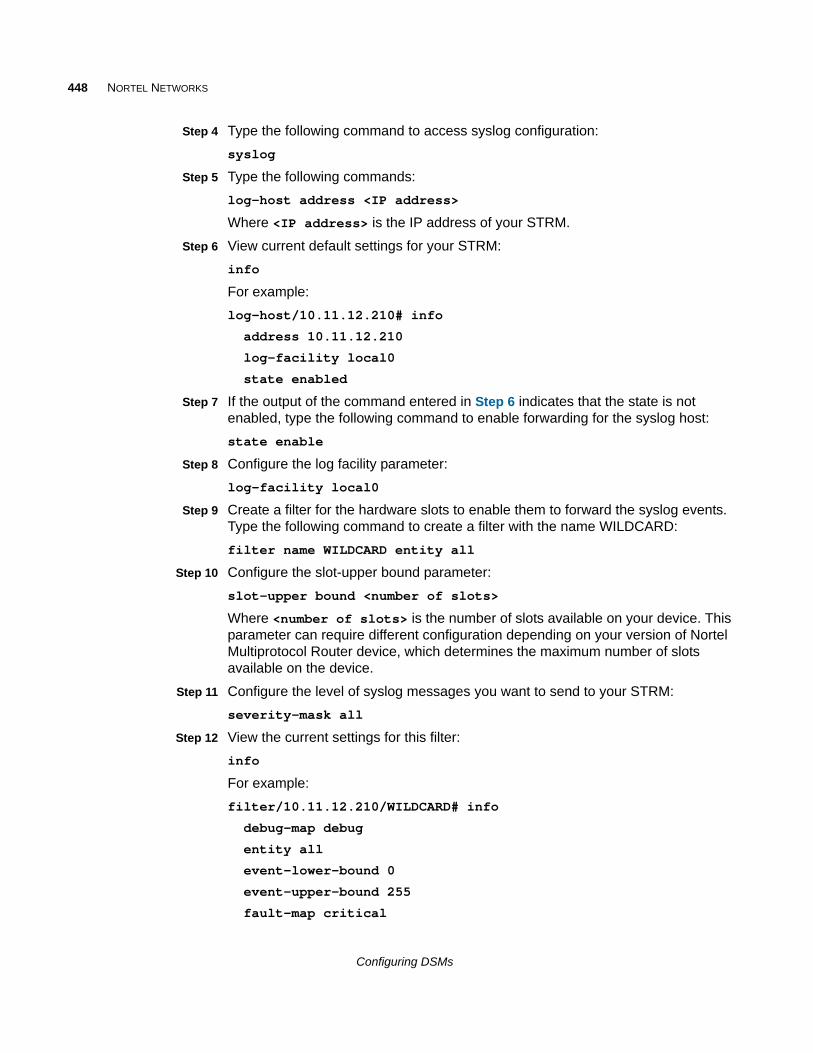
448 NORTEL NETWORKS
Step 4 Type the following command to access syslog configuration:
syslog
Step 5 Type the following commands:
log-host address <IP address>
Where <IP address> is the IP address of your STRM.
Step 6 View current default settings for your STRM:
info
For example:
log-host/10.11.12.210# info
address 10.11.12.210
log-facility local0
state enabled
Step 7 If the output of the command entered in Step 6 indicates that the state is not enabled, type the following command to enable forwarding for the syslog host:
state enable
Step 8 Configure the log facility parameter:
log-facility local0
Step 9 Create a filter for the hardware slots to enable them to forward the syslog events. Type the following command to create a filter with the name WILDCARD:
filter name WILDCARD entity all
Step 10 Configure the slot-upper bound parameter:
slot-upper bound <number of slots>
Where <number of slots> is the number of slots available on your device. This parameter can require different configuration depending on your version of Nortel Multiprotocol Router device, which determines the maximum number of slots available on the device.
Step 11 Configure the level of syslog messages you want to send to your STRM:
severity-mask all
Step 12 View the current settings for this filter:
info
For example:
filter/10.11.12.210/WILDCARD# info
debug-map debug
entity all
event-lower-bound 0
event-upper-bound 255
fault-map critical
Configuring DSMs
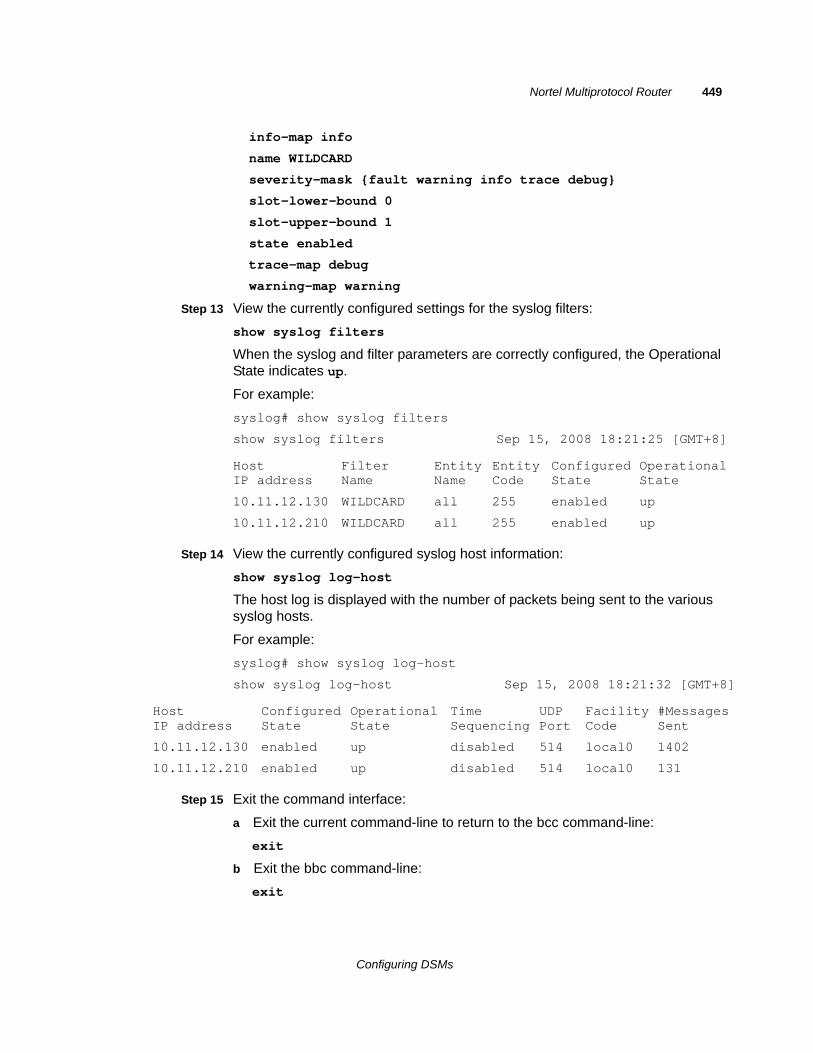
Nortel Multiprotocol Router 449
info-map info
name WILDCARD
severity-mask {fault warning info trace debug}
slot-lower-bound 0
slot-upper-bound 1
state enabled
trace-map debug
warning-map warning
Step 13 View the currently configured settings for the syslog filters:
show syslog filters
When the syslog and filter parameters are correctly configured, the Operational State indicates up.
For example:
syslog# show syslog filters
show syslog filters Sep 15, 2008 18:21:25 [GMT+8]
Step 14 View the currently configured syslog host information:
show syslog log-host
The host log is displayed with the number of packets being sent to the various syslog hosts.
For example:
syslog# show syslog log-host
show syslog log-host Sep 15, 2008 18:21:32 [GMT+8]
Step 15 Exit the command interface:
a Exit the current command-line to return to the bcc command-line:
exit
b Exit the bbc command-line:
exit
Host IP address
Filter Name
Entity Name
Entity Code
Configured State
Operational State
10.11.12.130 WILDCARD all 255 enabled up
10.11.12.210 WILDCARD all 255 enabled up
Host IP address
Configured State
Operational State
Time Sequencing
UDP Port
Facility Code
#Messages Sent
10.11.12.130 enabled up disabled 514 local0 1402
10.11.12.210 enabled up disabled 514 local0 131
Configuring DSMs
450 NORTEL NETWORKS
c Exit the command-line session:
logout
Step 16 You are now ready to configure the log source in STRM.
To configure STRM to receive events from a Nortel Multiprotocol Router device:
From the Log Source Type list box, select the Nortel Multiprotocol Router option.
For more information on configuring log sources, see the STRM Log Sources Users Guide. For more information about your device, see your vendor documentation.
Nortel Application Switch
Nortel Application Switches integrate routing and switching by forwarding traffic at layer 2 speed using layer 4-7 information. The Nortel Application Switch DSM for STRM accepts events using syslog. STRM records all relevant status and network condition events. Before configuring a Nortel Application Switch device in STRM, you must configure your device to send syslog events to STRM.
To configure the device to send syslog events to STRM:
Step 1 Log in to the Nortel Application Switch command-line interface (CLI).
Step 2 Type the following command:
/cfg/sys/syslog/host
Step 3 At the prompt, type the IP address of your STRM:
Enter new syslog host: <IP address>
Where <IP address> is the IP address of your STRM.
Step 4 Apply the configuration:
apply
Step 5 After the new configuration is applied, save your configuration:
save
Step 6 Type y at the prompt to confirm that you wish to save the configuration to flash. For example:
Confirm saving to FLASH [y/n]: y
New config successfully saved to FLASH
Step 7 You are now ready to configure the log source in STRM.
To configure STRM to receive events from a Nortel Application Switch:
From the Log Source Type list box, select the Nortel Application Switch option.
Configuring DSMs
Nortel Contivity 451
For more information on configuring log sources, see the STRM Log Sources Users Guide. For more information about the Nortel Application Switch, see your vendor documentation.
Nortel Contivity A STRM Nortel Contivity DSM accepts Nortel Contivity events using syslog. STRM records all relevant events.
Before you configure STRM to integrate with a Nortel Contivity device, you must:
Step 1 Log in to the Nortel Contivity command-line interface (CLI).
Step 2 Type the following command:
enable <password>
Where <password> is the Nortel Contivity device administrative password.
Step 3 Type the following command:
config t
Step 4 Configure the logging information:
logging <IP address> facility-filter all level all
Where <IP address> is the IP address of the STRM.
Step 5 Type the following command to exit the command-line:
exit
Step 6 You are now ready to configure the log source in STRM.
To configure STRM to receive events from a Nortel Contivity device:
From the Log Source Type list box, select the Nortel Contivity VPN Switch option.
For more information on configuring log sources, see the STRM Log Sources Users Guide. For more information about your Nortel Contivity device, see your vendor documentation.
Nortel Ethernet Routing Switch 2500/4500/5500
A STRM Nortel Ethernet Routing Switch (ERS) 2500/4500/5500 DSM accepts events using syslog. STRM records all relevant events. Before configuring a Nortel ERS 2500/4500/5500 device in STRM, you must configure your device to send syslog events to STRM.
To configure the device to send syslog events to STRM:
Step 1 Log in to the Nortel ERS 2500/4500/5500 user interface.
Step 2 Type the following commands to access global configuration mode:
ena
config term
Configuring DSMs
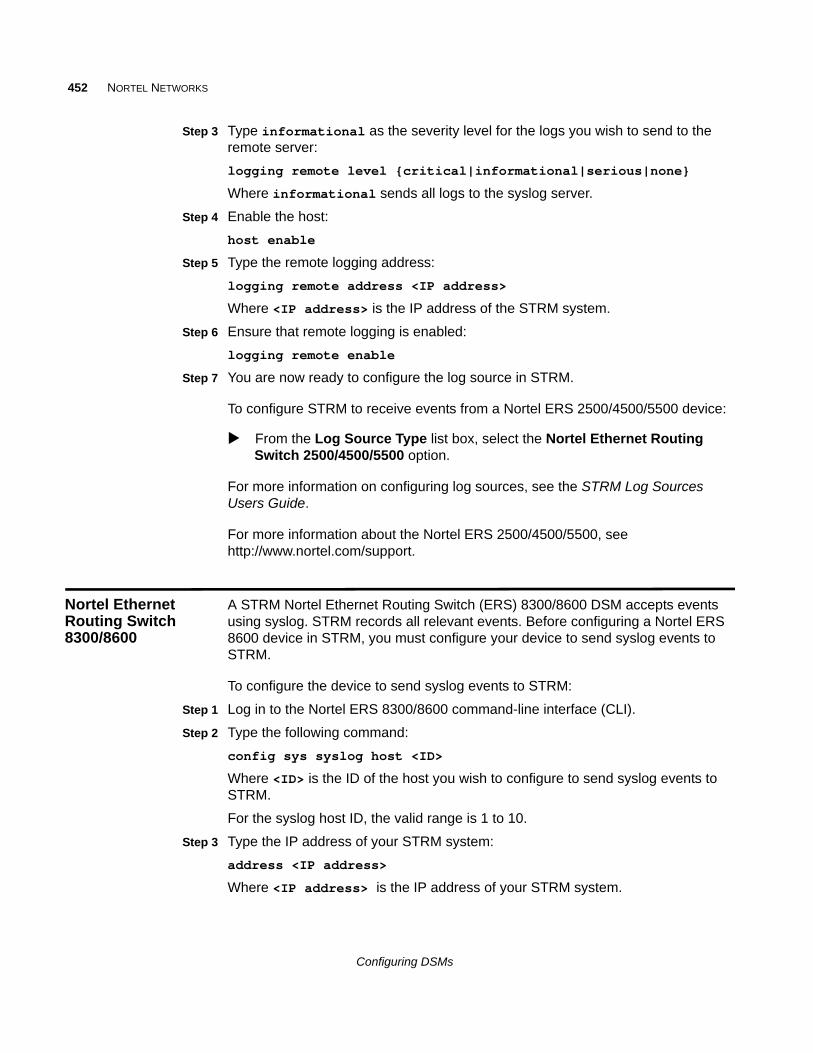
452 NORTEL NETWORKS
Step 3 Type informational as the severity level for the logs you wish to send to the remote server:
logging remote level {critical|informational|serious|none}
Where informational sends all logs to the syslog server.
Step 4 Enable the host:
host enable
Step 5 Type the remote logging address:
logging remote address <IP address>
Where <IP address> is the IP address of the STRM system.
Step 6 Ensure that remote logging is enabled:
logging remote enable
Step 7 You are now ready to configure the log source in STRM.
To configure STRM to receive events from a Nortel ERS 2500/4500/5500 device:
From the Log Source Type list box, select the Nortel Ethernet Routing Switch 2500/4500/5500 option.
For more information on configuring log sources, see the STRM Log Sources Users Guide.
For more information about the Nortel ERS 2500/4500/5500, see http://www.nortel.com/support.
Nortel Ethernet Routing Switch 8300/8600
A STRM Nortel Ethernet Routing Switch (ERS) 8300/8600 DSM accepts events using syslog. STRM records all relevant events. Before configuring a Nortel ERS 8600 device in STRM, you must configure your device to send syslog events to STRM.
To configure the device to send syslog events to STRM:
Step 1 Log in to the Nortel ERS 8300/8600 command-line interface (CLI).
Step 2 Type the following command:
config sys syslog host <ID>
Where <ID> is the ID of the host you wish to configure to send syslog events to STRM.
For the syslog host ID, the valid range is 1 to 10.
Step 3 Type the IP address of your STRM system:
address <IP address>
Where <IP address> is the IP address of your STRM system.
Configuring DSMs
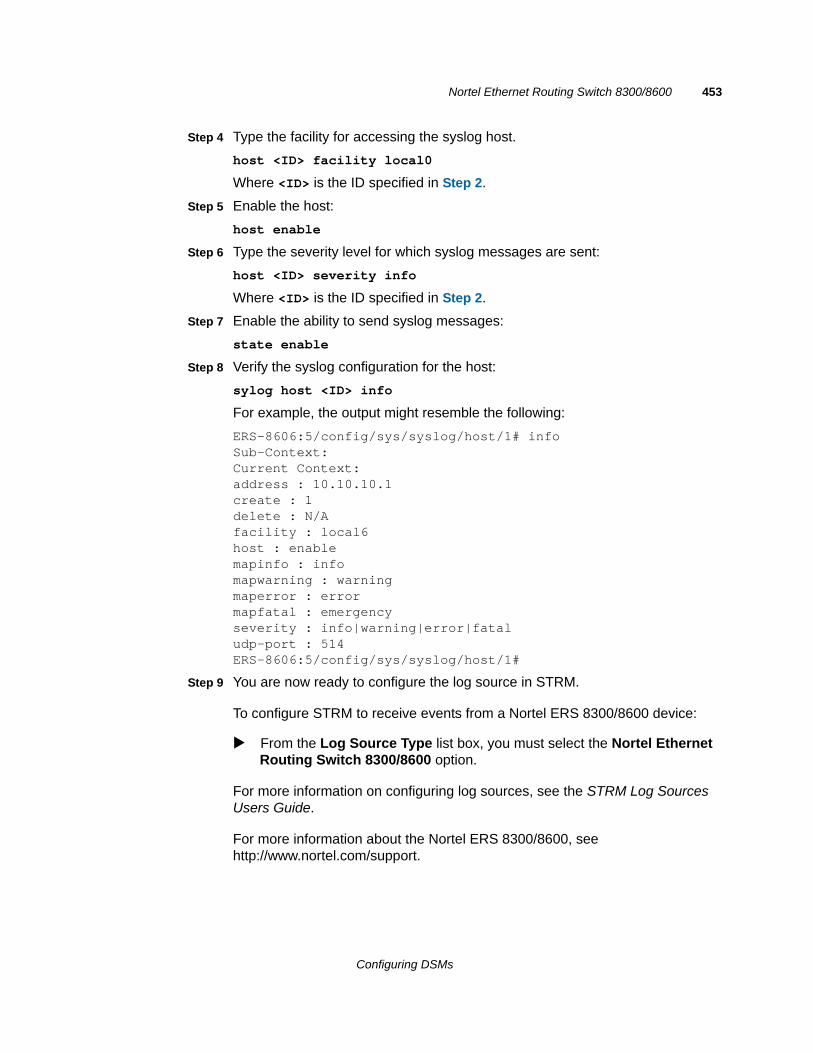
Nortel Ethernet Routing Switch 8300/8600 453
Step 4 Type the facility for accessing the syslog host.
host <ID> facility local0
Where <ID> is the ID specified in Step 2.
Step 5 Enable the host:
host enable
Step 6 Type the severity level for which syslog messages are sent:
host <ID> severity info
Where <ID> is the ID specified in Step 2.
Step 7 Enable the ability to send syslog messages:
state enable
Step 8 Verify the syslog configuration for the host:
sylog host <ID> info
For example, the output might resemble the following:
ERS-8606:5/config/sys/syslog/host/1# infoSub-Context:Current Context:address : 10.10.10.1create : 1delete : N/Afacility : local6host : enablemapinfo : infomapwarning : warningmaperror : errormapfatal : emergencyseverity : info|warning|error|fataludp-port : 514ERS-8606:5/config/sys/syslog/host/1#
Step 9 You are now ready to configure the log source in STRM.
To configure STRM to receive events from a Nortel ERS 8300/8600 device:
From the Log Source Type list box, you must select the Nortel Ethernet Routing Switch 8300/8600 option.
For more information on configuring log sources, see the STRM Log Sources Users Guide.
For more information about the Nortel ERS 8300/8600, see http://www.nortel.com/support.
Configuring DSMs
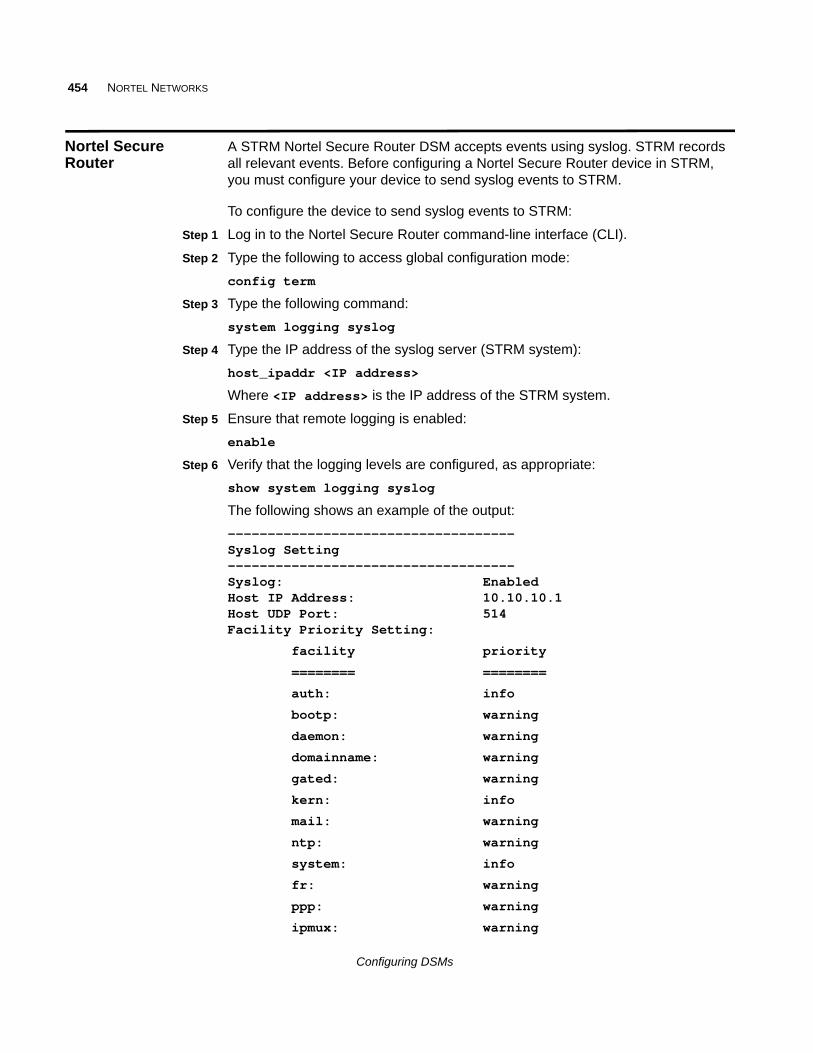
454 NORTEL NETWORKS
Nortel Secure Router
A STRM Nortel Secure Router DSM accepts events using syslog. STRM records all relevant events. Before configuring a Nortel Secure Router device in STRM, you must configure your device to send syslog events to STRM.
To configure the device to send syslog events to STRM:
Step 1 Log in to the Nortel Secure Router command-line interface (CLI).
Step 2 Type the following to access global configuration mode:
config term
Step 3 Type the following command:
system logging syslog
Step 4 Type the IP address of the syslog server (STRM system):
host_ipaddr <IP address>
Where <IP address> is the IP address of the STRM system.
Step 5 Ensure that remote logging is enabled:
enable
Step 6 Verify that the logging levels are configured, as appropriate:
show system logging syslog
The following shows an example of the output:
------------------------------------Syslog Setting------------------------------------Syslog: EnabledHost IP Address: 10.10.10.1Host UDP Port: 514Facility Priority Setting:
facility priority
======== ========
auth: info
bootp: warning
daemon: warning
domainname: warning
gated: warning
kern: info
mail: warning
ntp: warning
system: info
fr: warning
ppp: warning
ipmux: warning
Configuring DSMs

Nortel Secure Network Access Switch 455
bundle: warning
qos: warning
hdlc: warning
local7: warning
vpn: warning
firewall: warning
Step 7 You are now ready to configure the log source in STRM.
To configure STRM to receive events from a Nortel Secure Router device:
From the Log Source Type list box, select the Nortel Secure Router option.
For more information on configuring log sources, see the STRM Log Sources Users Guide.
For more information about the Nortel Secure Router, see http://www.nortel.com/support.
Nortel Secure Network Access Switch
A STRM Nortel Secure Network Access Switch (SNAS) DSM accepts events using syslog. STRM records all relevant events.
Before configuring a Nortel SNAS device in STRM, you must:
Step 1 Log in to the Nortel SNAS user interface.
Step 2 Select the Config tab.
Step 3 Select Secure Access Domain and Syslog from the Navigation pane.
The Secure Access Domain window is displayed.
Step 4 From the Secure Access Domain list, select the secure access domain. Click Refresh.
Step 5 Click Add.
The Add New Remote Server window is displayed.
Step 6 Click Update.
The server is displayed in the secure access domain table.
Step 7 Using the toolbar, click Apply to send the current changes to the Nortel SNAS.
Step 8 You are now ready to configure the log source in STRM.
To configure STRM to receive events from a Nortel SNAS device:
From the Log Source Type list box, select the Nortel Secure Network Access Switch (SNAS) option.
For more information on configuring log sources, see the STRM Log Sources Users Guide.
Configuring DSMs
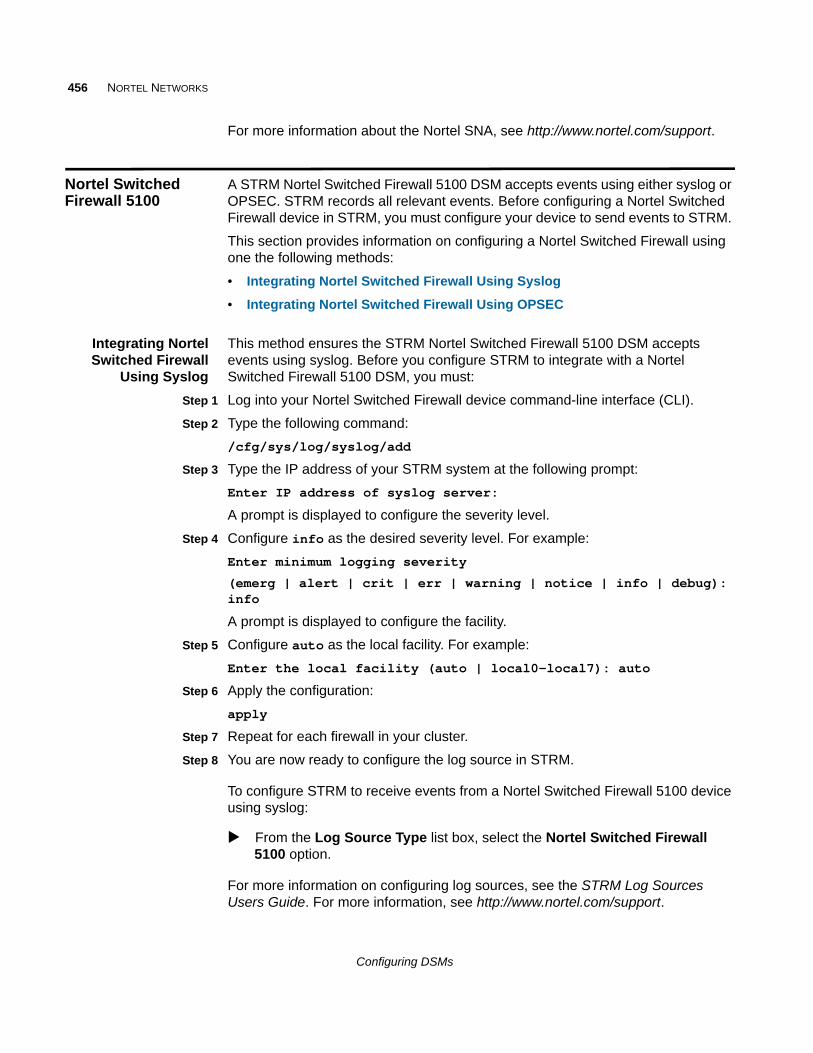
456 NORTEL NETWORKS
For more information about the Nortel SNA, see http://www.nortel.com/support.
Nortel Switched Firewall 5100
A STRM Nortel Switched Firewall 5100 DSM accepts events using either syslog or OPSEC. STRM records all relevant events. Before configuring a Nortel Switched Firewall device in STRM, you must configure your device to send events to STRM.
This section provides information on configuring a Nortel Switched Firewall using one the following methods:
• Integrating Nortel Switched Firewall Using Syslog
• Integrating Nortel Switched Firewall Using OPSEC
Integrating NortelSwitched Firewall
Using Syslog
This method ensures the STRM Nortel Switched Firewall 5100 DSM accepts events using syslog. Before you configure STRM to integrate with a Nortel Switched Firewall 5100 DSM, you must:
Step 1 Log into your Nortel Switched Firewall device command-line interface (CLI).
Step 2 Type the following command:
/cfg/sys/log/syslog/add
Step 3 Type the IP address of your STRM system at the following prompt:
Enter IP address of syslog server:
A prompt is displayed to configure the severity level.
Step 4 Configure info as the desired severity level. For example:
Enter minimum logging severity
(emerg | alert | crit | err | warning | notice | info | debug): info
A prompt is displayed to configure the facility.
Step 5 Configure auto as the local facility. For example:
Enter the local facility (auto | local0-local7): auto
Step 6 Apply the configuration:
apply
Step 7 Repeat for each firewall in your cluster.
Step 8 You are now ready to configure the log source in STRM.
To configure STRM to receive events from a Nortel Switched Firewall 5100 device using syslog:
From the Log Source Type list box, select the Nortel Switched Firewall 5100 option.
For more information on configuring log sources, see the STRM Log Sources Users Guide. For more information, see http://www.nortel.com/support.
Configuring DSMs
Nortel Switched Firewall 5100 457
Integrating NortelSwitched Firewall
Using OPSEC
This method ensures the STRM Nortel Switched Firewall 5100 DSM accepts Check Point FireWall-1 events using OPSEC.
NOTEDepending on your Operating System, the procedures for the Check Point SmartCenter Server can vary. The following procedures are based on the Check Point SecurePlatform Operating system.
To enable Nortel Switched Firewall and STRM integration, you must:
1 Reconfigure Check Point SmartCenter Server. See Reconfiguring Check Point SmartCenter Server.
2 Configure the log source in STRM. For more information, see Configure the Log Source within STRM.
Reconfiguring Check Point SmartCenter Server
This section describes how to reconfigure the Check Point SmartCenter Server. In the Check Point SmartCenter Server, create a host object representing the STRM system. The leapipe is the connection between the Check Point SmartCenter Server and STRM.
To reconfigure the Check Point SmartCenter Server:
Step 1 To create a host object, open the Check Point SmartDashboard user interface and select Manage > Network Objects > New > Node > Host.
Step 2 Type the Name, IP Address, and optional Comment for your host.
Step 3 Click OK.
Step 4 Select Close.
Step 5 To create the OPSEC connection, select Manage > Servers and OPSEC applications > New > OPSEC Application Properties.
Step 6 Type the Name and optional Comment.
The name you type must be different than the name in Step 2.
Step 7 From the Host drop-down menu, select the host object you have created in Step 1.
Step 8 From Application Properties, select User Defined as the vendor.
Step 9 From Client Entries, select LEA.
Step 10 Click Communication.
Step 11 Choose a password in the provide field. This password is necessary when pulling the certificate to the Firewall Director.
Step 12 Click OK and then click Close.
Step 13 To install the Security Policy on your firewall, select Policy > Install > OK.
Configuring DSMs
458 NORTEL NETWORKS
Configure the Log Source within STRM
You are now ready to configure the log source in STRM.
Step 1 To configure STRM to receive events from a Nortel Switched Firewall 5100 device using OPSEC, you must select the Nortel Switched Firewall 5100 option from the Log Source Type list box.
Step 2 To configure STRM to receive events from a Check Point SmartCenter Server using OPSEC LEA, you must select the LEA option from the Protocol Configuration list box when configuring your protocol configuration.
For more information, see the STRM Log Sources Users Guide.
Nortel Switched Firewall 6000
A STRM Nortel Switched Firewall 6000 DSM accepts events using either syslog or OPSEC. STRM records all relevant events. Before configuring a Nortel Switched Firewall device in STRM, you must configure your device to send events to STRM.
This section provides information on configuring a Nortel Switched Firewall 6000 device with STRM using one of the following methods:
• Integrating Nortel Switched Firewall Using Syslog
• Integrating Nortel Switched Firewall Using OPSEC
Integrating NortelSwitched Firewall
Using Syslog
This method ensures the STRM Nortel Switched Firewall 6000 DSM accepts events using syslog. Before you configure STRM to integrate with a Nortel Switched Firewall 6000 DSM, you must:
Step 1 Log into your Nortel Switched Firewall device command-line interface (CLI).
Step 2 Type the following command:
/cfg/sys/log/syslog/add
Step 3 Type the IP address of your STRM system at the following prompt:
Enter IP address of syslog server:
A prompt is displayed to configure the severity level.
Step 4 Configure info as the desired severity level. For example:
Enter minimum logging severity
(emerg | alert | crit | err | warning | notice | info | debug): info
A prompt is displayed to configure the facility.
Step 5 Configure auto as the local facility. For example:
Enter the local facility (auto | local0-local7): auto
Step 6 Apply the configuration:
apply
Configuring DSMs
Nortel Switched Firewall 6000 459
Step 7 You are now ready to configure the log source in STRM.
To configure STRM to receive events from an Nortel Switched Firewall 6000 using syslog:
From the Log Source Type list box, select the Nortel Switched Firewall 6000 option.
For more information on configuring log sources, see the STRM Log Sources Users Guide. For more information, see http://www.nortel.com/support.
Integrating NortelSwitched Firewall
Using OPSEC
This method ensures the STRM Nortel Switched Firewall 6000 DSM accepts Check Point FireWall-1 events using OPSEC.
NOTEDepending on your Operating System, the procedures for the Check Point SmartCenter Server can vary. The following procedures are based on the Check Point SecurePlatform Operating system.
To enable Nortel Switched Firewall and STRM integration, you must:
Step 1 Reconfigure Check Point SmartCenter Server. See Reconfiguring Check Point SmartCenter Server.
Step 2 Configure the OPSEC LEA protocol in STRM.
To configure STRM to receive events from a Check Point SmartCenter Server using OPSEC LEA, you must select the LEA option from the Protocol Configuration list box when configuring LEA.
For more information, see the STRM Log Sources Users Guide.
Step 3 Configure the log source in STRM.
To configure STRM to receive events from a Nortel Switched Firewall 6000 device using OPSEC you must select the Nortel Switched Firewall 6000 option from the Log Source Type list box. For more information on configuring log sources, see the STRM Log Sources Users Guide.
For more information, see http://www.nortel.com/support.
Reconfiguring Check Point SmartCenter Server
This section describes how to reconfigure the Check Point SmartCenter Server. In the Check Point SmartCenter Server, create a host object representing the STRM system. The leapipe is the connection between the Check Point SmartCenter Server and STRM.
Configuring DSMs
460 NORTEL NETWORKS
To reconfigure the Check Point SmartCenter Server:
Step 1 To create a host object, open the Check Point SmartDashboard user interface and select Manage > Network Objects > New > Node > Host.
Step 2 Type the Name, IP Address, and optional Comment for your host.
Step 3 Click OK.
Step 4 Select Close.
Step 5 To create the OPSEC connection, select Manage > Servers and OPSEC applications > New > OPSEC Application Properties.
Step 6 Type the Name and optional Comment.
The name you type must be different than the name in Step 2.
Step 7 From the Host drop-down menu, select the host object you have created in Step 1.
Step 8 From Application Properties, select User Defined as the vendor.
Step 9 From Client Entries, select LEA.
Step 10 Click Communication to generate a Secure Internal Communication (SIC) certificate and enter an activation key.
Step 11 Click OK and then click Close.
Step 12 To install the Security Policy on your firewall, select Policy > Install > OK.
The configuration is complete.
Nortel Threat Protection System
A STRM Nortel Threat Protection System (TPS) DSM accepts events using syslog. STRM records all relevant events.
Before configuring a Nortel TPS device in STRM, you must:
Step 1 Log in to the Nortel TPS user interface.
Step 2 Select Policy & Response > Intrusion Sensor > Detection & Prevention.
The Detection & Prevention window is displayed.
Step 3 Click Edit next to the intrusion policy you want to configure alerting option.
The Edit Policy window is displayed.
Step 4 Click Alerting.
The Alerting window is displayed.
Step 5 Under Syslog Configuration, select on next to State to enable syslog alerting.
Step 6 From the list boxes, select the facility and priority levels.
Step 7 Optional. In the Logging Host field, type the IP address of your STRM system. This configures your STRM system to be your logging host. Separate multiple hosts with commas.
Configuring DSMs

Nortel VPN Gateway 461
Step 8 Click Save.
The syslog alerting configuration is saved.
Step 9 Apply the policy to your appropriate detection engines.
Step 10 You are now ready to configure the log source in STRM.
To configure STRM to receive events from a Nortel TPS device:
From the Log Source Type list box, select the Nortel Threat Protection System (TPS) Intrusion Sensor option.
For more information on configuring log sources, see the STRM Log Sources Users Guide. For more information about Nortel TPS, see http://www.nortel.com/support.
Nortel VPN Gateway
A STRM Nortel VPN Gateway DSM accepts events using syslog. STRM records all relevant operating system (OS), system control, traffic processing, startup, configuration reload, AAA, and IPsec events. Before configuring a Nortel VPN Gateway device in STRM, you must configure your device to send syslog events to STRM.
To configure the device to send syslog events to STRM:
Step 1 Log in to the Nortel VPN Gateway command-line interface (CLI).
Step 2 Type the following command:
/cfg/sys/syslog/add
Step 3 At the prompt, type the IP address of your STRM system:
Enter new syslog host: <IP address>
Where <IP address> is the IP address of your STRM system.
Step 4 Apply the configuration:
apply
Step 5 View all syslog servers currently added to your system configuration:
/cfg/sys/syslog/list
Step 6 You are now ready to configure the log source in STRM.
To configure STRM to receive events from a Nortel VPN Gateway device:
From the Log Source Type list box, select the Nortel VPN Gateway option.
For more information on configuring log sources, see the STRM Log Sources Users Guide. For more information about the Nortel VPN Gateway, see http://www.nortel.com/support.
Configuring DSMs

60
NOVELL EDIRECTORYThe Novell eDirectory DSM for STRM accepts audit events from Novell eDirectory using syslog. To use the Novell eDirectory DSM, you must have the following components installed:
• Novell eDirectory v8.8 with service pack 6 (sp6)
• Novell iManager v2.7
• XDASv2
To configure Novell eDirectory with STRM, you must:
1 Configure the XDASv2 property file to forward events to STRM. For more information, see Configuring XDASv2 to Forward Events.
2 Load the XDASv2 module on your Linux or Windows Operating System. For more information, see Loading the XDASv2 Module.
3 Configure auditing using Novell iManager. For more information, see Configuring Event Auditing Using Novell iManager.
4 Configure STRM. For more information, see Configuring STRM with Novell eDirectory.
Configuring XDASv2to Forward Events
By default, XDASv2 is configured to log events to a file. To forward events from XDASv2 to STRM, you must edit the xdasconfig.properties and configure the file for syslog forwarding. Audit events must be forwarded by syslog to STRM, instead of being logged to a file.
To configure XDASv2 to forward syslog events:
Step 1 Log in to the server hosting Novell eDirectory.
Step 2 Open the following file for editing:
• Windows - C:\Novell\NDS\xdasconfig.properties
• Linux or Solaris - etc/opt/novell/configuration/xdasconfig.properties
Step 3 To set the root logger, remove the comment marker (#) from the following line:
log4j.rootLogger=debug, S, R
Configuring DSMs
464 NOVELL EDIRECTORY
Step 4 To set the appender, remove the comment marker (#) from the following line:
log4j.appender.S=org.apache.log4j.net.SyslogAppender
Step 5 To configure the IP address for the syslog destination, remove the comment marker (#) and edit the following lines:
log4j.appender.S.Host=<IP address>log4j.appender.S.Port=<Port>
Where,
<IP address> is the IP address or hostname of STRM.
<Port> is the port number for the UDP or TCP protocol. The default port for syslog communication is port 514 for STRM or Event Collectors.
Step 6 To configure the syslog protocol, remove the comment marker (#) and type the protocol (UDP, TCP, or SSL) use in the following line:
log4j.appender.S.Protocol=TCP
The encrypted protocol SSL is not supported by STRM.
Step 7 To set the severity level for logging events, remove the comment marker (#) from the following line:
log4j.appender.S.Threshold=INFO
The default value of INFO is the correct severity level for events.
Step 8 To set the facility for logging events, remove the comment marker (#) from the following line:
log4j.appender.S.Facility=USER
The default value of USER is the correct facility value for events.
Step 9 To set the facility for logging events, remove the comment marker (#) from the following line:
log4j.appender.R.MaxBackupIndex=10
Step 10 Save the xdas.properties file.
After you configure the syslog properties for XDASv2 events, you are ready to load the XDASv2 module.
Loading the XDASv2Module
Before you can configure events in Novell iManager, you must load the changes you made to the XDASv2 module. To load the XDASv2 module, select your operating system.
• To load the XDASv2 in Linux, see Loading the XDASv2 on a Linux Operating System.
• To load the XDASv2 in Windows, see Loading the XDASv2 on a Windows Operating System.
Configuring DSMs
465
NOTEIf your Novell eDirectory has Novell Module Authentication Service (NMAS) installed with NMAS auditing enabled, the changes made to XDASv2 modules are loaded automatically. If you have NMAS installed, you should configure event auditing. For information on configuring event auditing, see Configuring Event Auditing Using Novell iManager.
Loading the XDASv2 on a Linux Operating System
Step 1 Log in to your Linux server hosting Novell eDirectory, as a root user.
Step 2 Type the following command:
ndstrace -c "load xdasauditds"
You are now ready to configure event auditing in Novell eDirectory. For more information, see Configuring Event Auditing Using Novell iManager.
Loading the XDASv2 on a Windows Operating System
Step 1 Log in to your Windows server hosting Novell eDirectory.
Step 2 On your desktop, click Start > Run.
The Run window is displayed.
Step 3 Type the following:
C:\Novell\NDS\ndscons.exe
This is the default installation path for the Windows Operating System. If you installed Novell eDirectory to a different directory, then the correct path is required.
Step 4 Click OK.
The Novell Directory Service console displays a list of available modules.
Step 5 From the Services tab, select xdasauditds.
Step 6 Click Start.
The xdasauditds service is started for Novell eDirectory.
Step 7 Click Startup.
The Service window is displayed.
Step 8 In the Startup Type panel, select the Automatic check box.
Step 9 Click OK.
Step 10 Close the Novell eDirectory Services window.
You are now ready to configure event auditing in Novell eDirectory. For more information, see Configuring Event Auditing Using Novell iManager.
Configuring DSMs
466 NOVELL EDIRECTORY
Configuring EventAuditing Using
Novell iManager
To configure event auditing for XDASv2 in Novell iManager:
Step 1 Log in to your Novell iManager console user interface.
Step 2 From the navigation bar, click Roles and Tasks.
Step 3 In the left-hand navigation, click eDirectory Auditing > Audit Configuration.
The Audit Configuration panel is displayed.
Step 4 In the NPC Server name field, type the name of your NPC Server.
Step 5 Click OK.
The Audit Configuration for the NPC Server is displayed.
Step 6 Configure the following parameters:
a On the Components panel, select one or both of the following:
- DS - Select this check box to audit XDASv2 events for an eDirectory object.
- LDAP - Select this check box to audit XDASv2 events for a Lightweight Directory Access Protocol (LDAP) object.
b On the Log Event’s Large Values panel, select one of the following:
- Log Large Values - Select this option to log events that are larger than 768 bytes.
- Don’t Log Large Values - Select this option to log events less than 768 bytes. If a value exceeds 768 bytes, then the event is truncated.
c On the XDAS Events Configuration, select the check boxes of the events you want XDAS to capture and forward to STRM.
d Click Apply.
Step 7 On the XDAS tab, click XDASRoles.
The XDAS Roles Configuration panel is displayed.
Step 8 Configure the following role parameters:
a Select a check box for each object class to support event collection.
b From the Available Attribute(s) list, select any attributes and click the arrow to add these to the Selected Attribute(s) list.
c Click OK after you have added the object attributes.
d Click Apply.
Step 9 On the XDAS tab, click XDASAccounts.
The XDAS Accounts Configuration panel is displayed.
Step 10 Configure the following account parameters:
a From the Available Classes list, select any classes and click the arrow to add these to the Selected Attribute(s) list.
b Click OK after you have added the object attributes.
Configuring DSMs
467
c Click Apply.
You are now ready to configure STRM.
Configuring STRMwith NovelleDirectory
STRM automatically detects syslog events from Novell eDirectory. However, if you want to manually configure STRM to receive events from Novell eDirectory:
From the Log Source Type list box, select Novell eDirectory.
For more information on configuring log sources, see the STRM Log Sources Users Guide. For more information about Novell eDirectory, Novell iManager, or XDASv2, see your vendor documentation.
Configuring DSMs

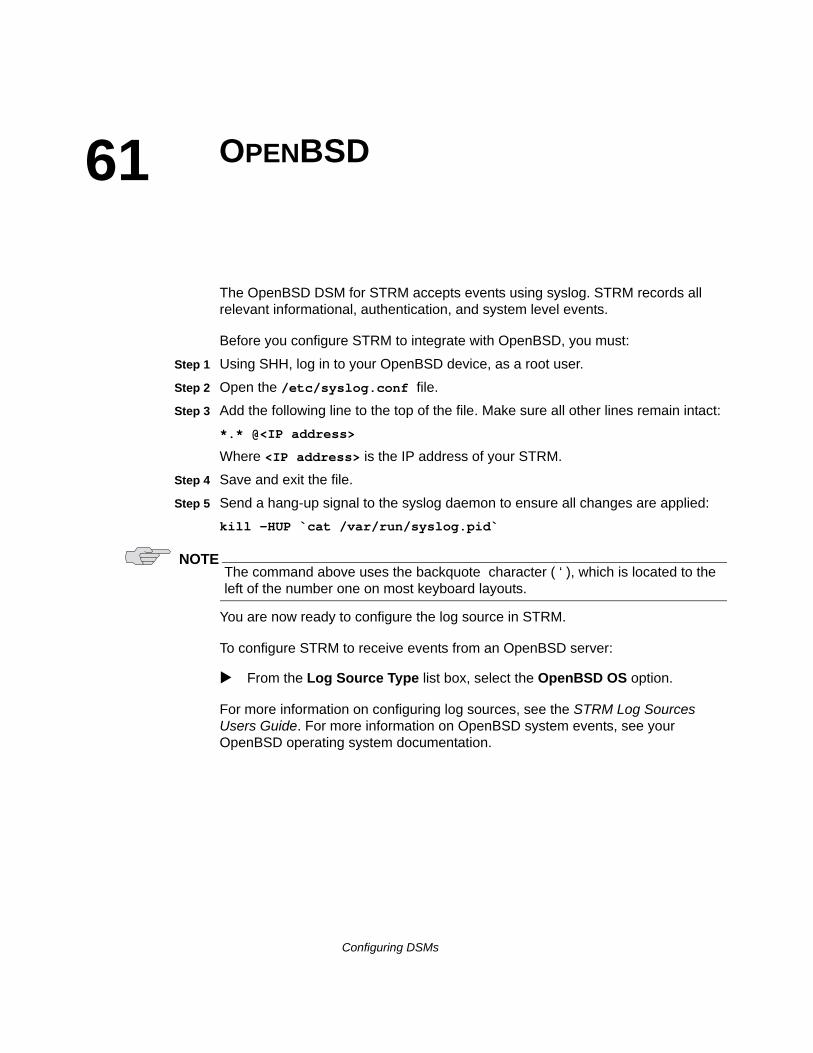
61
OPENBSDThe OpenBSD DSM for STRM accepts events using syslog. STRM records all relevant informational, authentication, and system level events.
Before you configure STRM to integrate with OpenBSD, you must:
Step 1 Using SHH, log in to your OpenBSD device, as a root user.
Step 2 Open the /etc/syslog.conf file.
Step 3 Add the following line to the top of the file. Make sure all other lines remain intact:
*.* @<IP address>
Where <IP address> is the IP address of your STRM.
Step 4 Save and exit the file.
Step 5 Send a hang-up signal to the syslog daemon to ensure all changes are applied:
kill -HUP `cat /var/run/syslog.pid`
NOTEThe command above uses the backquote character ( ‘ ), which is located to the left of the number one on most keyboard layouts.
You are now ready to configure the log source in STRM.
To configure STRM to receive events from an OpenBSD server:
From the Log Source Type list box, select the OpenBSD OS option.
For more information on configuring log sources, see the STRM Log Sources Users Guide. For more information on OpenBSD system events, see your OpenBSD operating system documentation.
Configuring DSMs

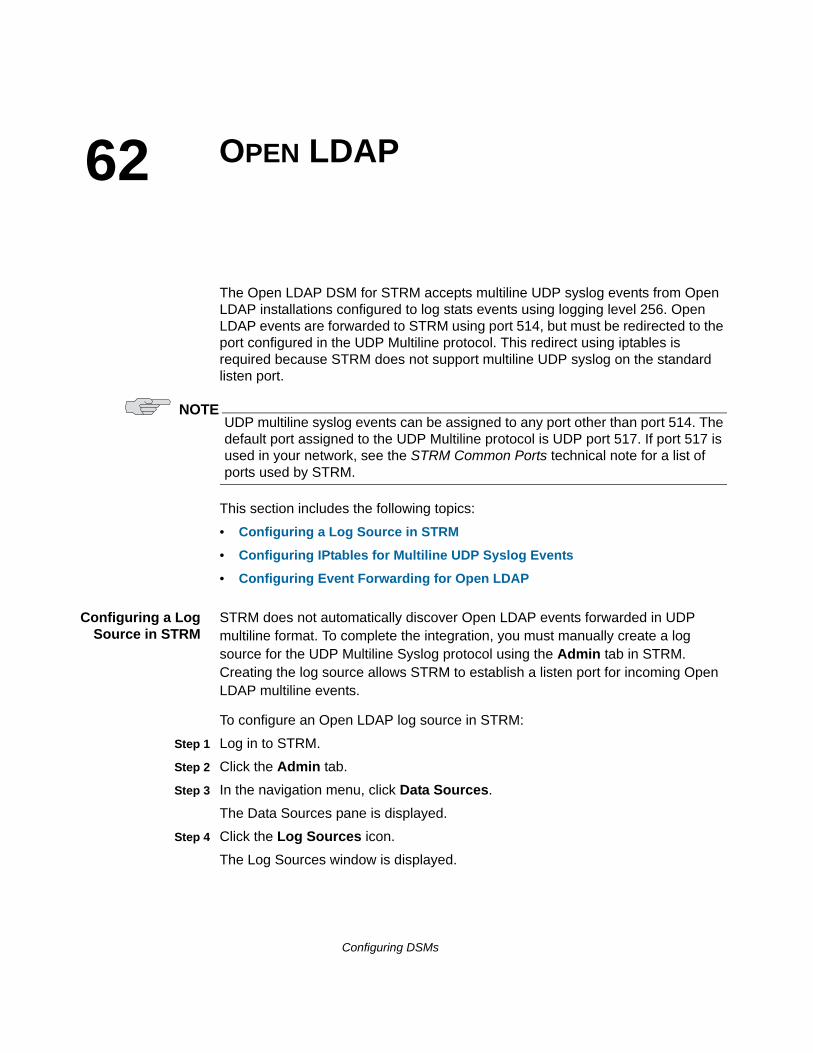
62
OPEN LDAPThe Open LDAP DSM for STRM accepts multiline UDP syslog events from Open LDAP installations configured to log stats events using logging level 256. Open LDAP events are forwarded to STRM using port 514, but must be redirected to the port configured in the UDP Multiline protocol. This redirect using iptables is required because STRM does not support multiline UDP syslog on the standard listen port.
NOTEUDP multiline syslog events can be assigned to any port other than port 514. The default port assigned to the UDP Multiline protocol is UDP port 517. If port 517 is used in your network, see the STRM Common Ports technical note for a list of ports used by STRM.
This section includes the following topics:
• Configuring a Log Source in STRM
• Configuring IPtables for Multiline UDP Syslog Events
• Configuring Event Forwarding for Open LDAP
Configuring a LogSource in STRM
STRM does not automatically discover Open LDAP events forwarded in UDP multiline format. To complete the integration, you must manually create a log source for the UDP Multiline Syslog protocol using the Admin tab in STRM. Creating the log source allows STRM to establish a listen port for incoming Open LDAP multiline events.
To configure an Open LDAP log source in STRM:
Step 1 Log in to STRM.
Step 2 Click the Admin tab.
Step 3 In the navigation menu, click Data Sources.
The Data Sources pane is displayed.
Step 4 Click the Log Sources icon.
The Log Sources window is displayed.
Configuring DSMs
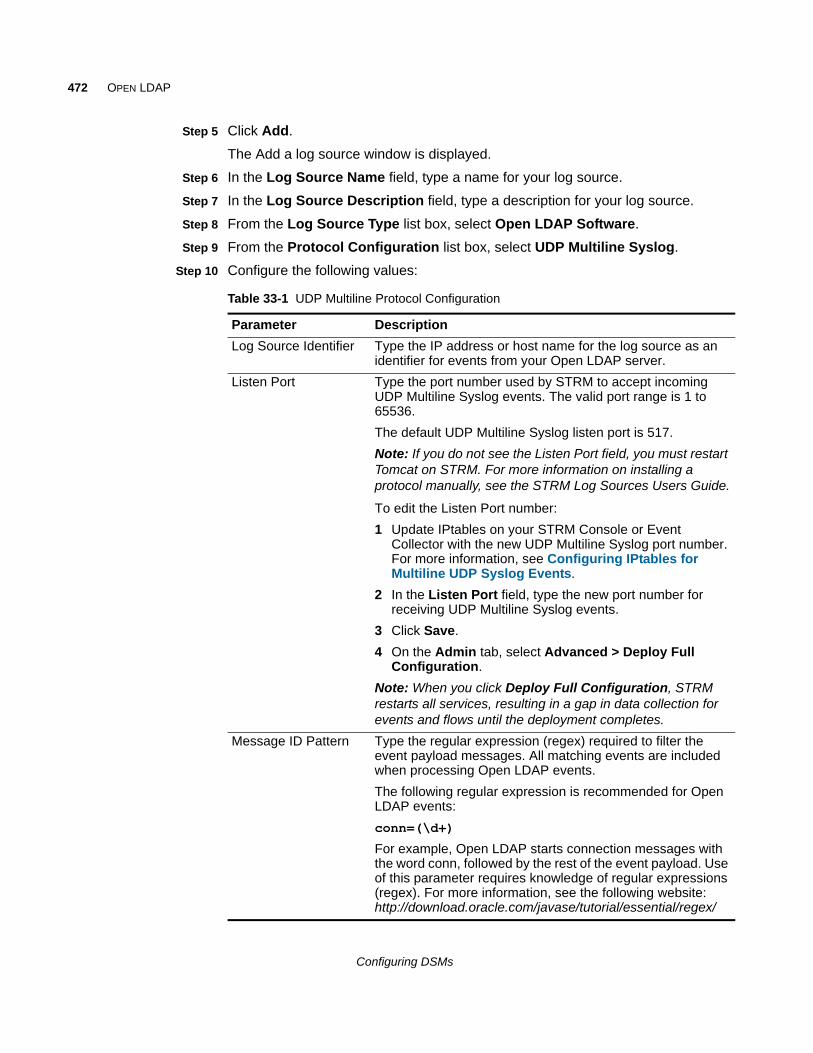
472 OPEN LDAP
Step 5 Click Add.
The Add a log source window is displayed.
Step 6 In the Log Source Name field, type a name for your log source.
Step 7 In the Log Source Description field, type a description for your log source.
Step 8 From the Log Source Type list box, select Open LDAP Software.
Step 9 From the Protocol Configuration list box, select UDP Multiline Syslog.
Step 10 Configure the following values:
Table 33-1 UDP Multiline Protocol Configuration
Parameter Description
Log Source Identifier Type the IP address or host name for the log source as an identifier for events from your Open LDAP server.
Listen Port Type the port number used by STRM to accept incoming UDP Multiline Syslog events. The valid port range is 1 to 65536.
The default UDP Multiline Syslog listen port is 517.
Note: If you do not see the Listen Port field, you must restart Tomcat on STRM. For more information on installing a protocol manually, see the STRM Log Sources Users Guide.
To edit the Listen Port number:
1 Update IPtables on your STRM Console or Event Collector with the new UDP Multiline Syslog port number. For more information, see Configuring IPtables for Multiline UDP Syslog Events.
2 In the Listen Port field, type the new port number for receiving UDP Multiline Syslog events.
3 Click Save.
4 On the Admin tab, select Advanced > Deploy Full Configuration.
Note: When you click Deploy Full Configuration, STRM restarts all services, resulting in a gap in data collection for events and flows until the deployment completes.
Message ID Pattern Type the regular expression (regex) required to filter the event payload messages. All matching events are included when processing Open LDAP events.
The following regular expression is recommended for Open LDAP events:
conn=(\d+)
For example, Open LDAP starts connection messages with the word conn, followed by the rest of the event payload. Use of this parameter requires knowledge of regular expressions (regex). For more information, see the following website: http://download.oracle.com/javase/tutorial/essential/regex/
Configuring DSMs
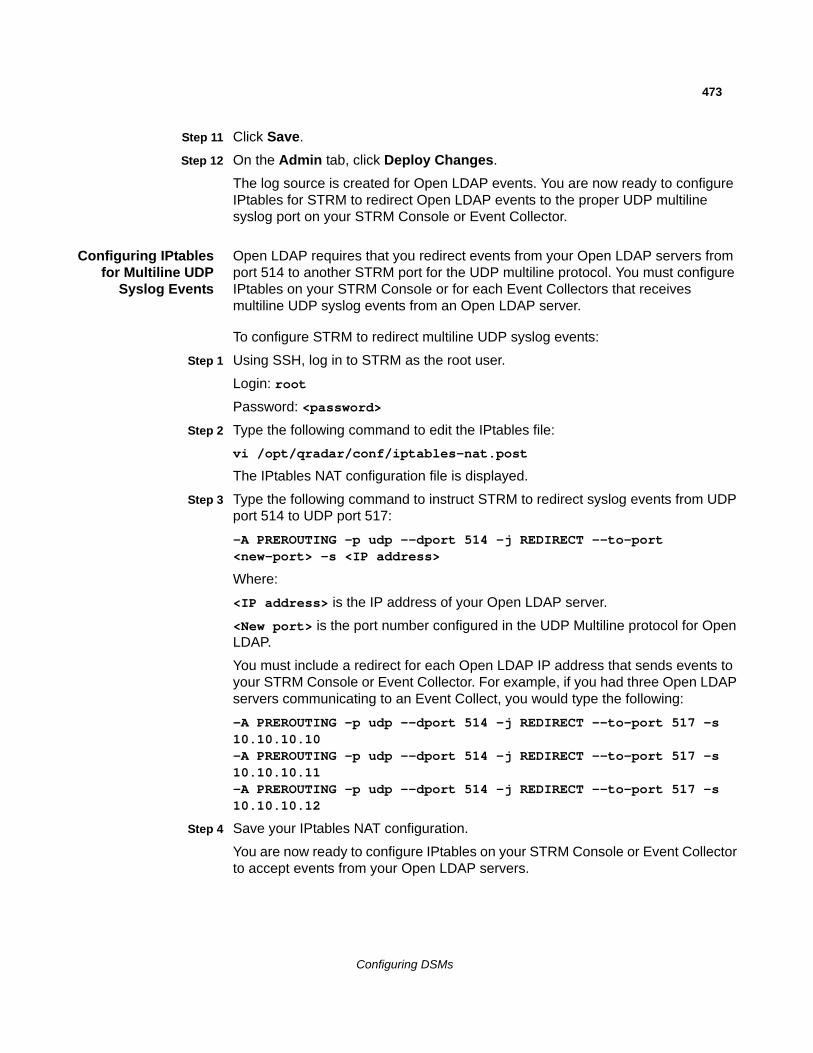
473
Step 11 Click Save.
Step 12 On the Admin tab, click Deploy Changes.
The log source is created for Open LDAP events. You are now ready to configure IPtables for STRM to redirect Open LDAP events to the proper UDP multiline syslog port on your STRM Console or Event Collector.
Configuring IPtablesfor Multiline UDP
Syslog Events
Open LDAP requires that you redirect events from your Open LDAP servers from port 514 to another STRM port for the UDP multiline protocol. You must configure IPtables on your STRM Console or for each Event Collectors that receives multiline UDP syslog events from an Open LDAP server.
To configure STRM to redirect multiline UDP syslog events:
Step 1 Using SSH, log in to STRM as the root user.
Login: root
Password: <password>
Step 2 Type the following command to edit the IPtables file:
vi /opt/qradar/conf/iptables-nat.post
The IPtables NAT configuration file is displayed.
Step 3 Type the following command to instruct STRM to redirect syslog events from UDP port 514 to UDP port 517:
-A PREROUTING -p udp --dport 514 -j REDIRECT --to-port <new-port> -s <IP address>
Where:
<IP address> is the IP address of your Open LDAP server.
<New port> is the port number configured in the UDP Multiline protocol for Open LDAP.
You must include a redirect for each Open LDAP IP address that sends events to your STRM Console or Event Collector. For example, if you had three Open LDAP servers communicating to an Event Collect, you would type the following:
-A PREROUTING -p udp --dport 514 -j REDIRECT --to-port 517 -s 10.10.10.10-A PREROUTING -p udp --dport 514 -j REDIRECT --to-port 517 -s 10.10.10.11-A PREROUTING -p udp --dport 514 -j REDIRECT --to-port 517 -s 10.10.10.12
Step 4 Save your IPtables NAT configuration.
You are now ready to configure IPtables on your STRM Console or Event Collector to accept events from your Open LDAP servers.
Configuring DSMs
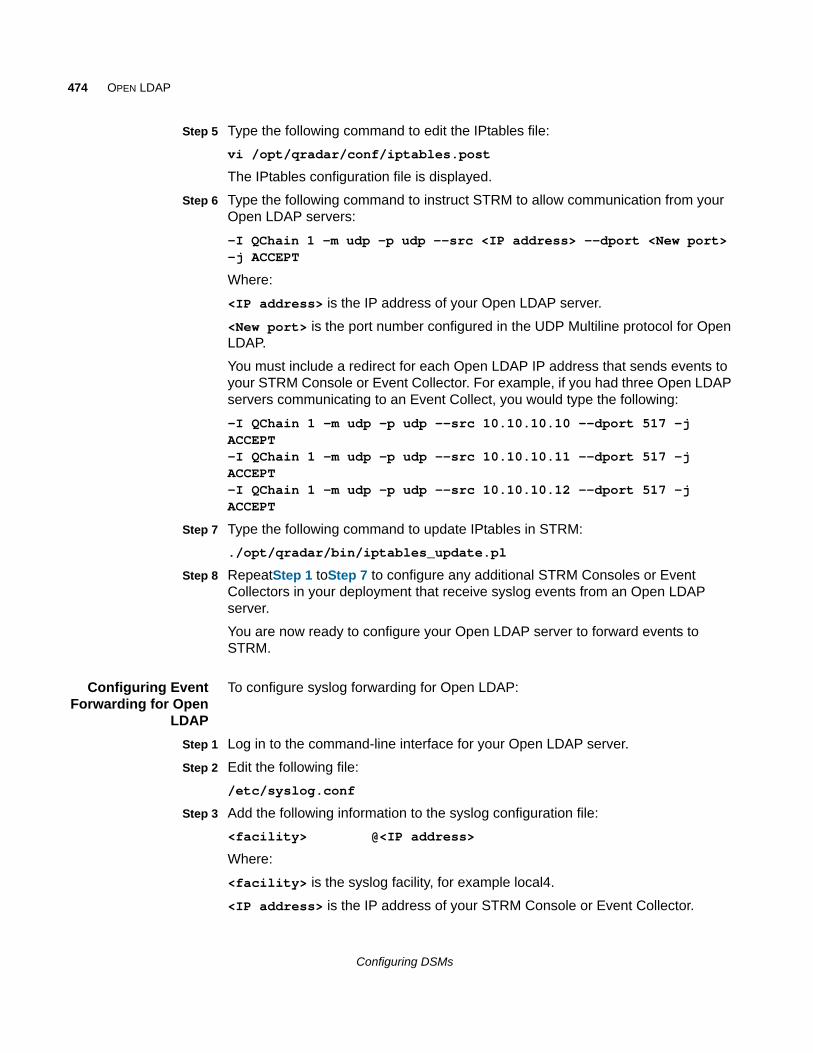
474 OPEN LDAP
Step 5 Type the following command to edit the IPtables file:
vi /opt/qradar/conf/iptables.post
The IPtables configuration file is displayed.
Step 6 Type the following command to instruct STRM to allow communication from your Open LDAP servers:
-I QChain 1 -m udp -p udp --src <IP address> --dport <New port> -j ACCEPT
Where:
<IP address> is the IP address of your Open LDAP server.
<New port> is the port number configured in the UDP Multiline protocol for Open LDAP.
You must include a redirect for each Open LDAP IP address that sends events to your STRM Console or Event Collector. For example, if you had three Open LDAP servers communicating to an Event Collect, you would type the following:
-I QChain 1 -m udp -p udp --src 10.10.10.10 --dport 517 -j ACCEPT-I QChain 1 -m udp -p udp --src 10.10.10.11 --dport 517 -j ACCEPT-I QChain 1 -m udp -p udp --src 10.10.10.12 --dport 517 -j ACCEPT
Step 7 Type the following command to update IPtables in STRM:
./opt/qradar/bin/iptables_update.pl
Step 8 RepeatStep 1 toStep 7 to configure any additional STRM Consoles or Event Collectors in your deployment that receive syslog events from an Open LDAP server.
You are now ready to configure your Open LDAP server to forward events to STRM.
Configuring EventForwarding for Open
LDAP
To configure syslog forwarding for Open LDAP:
Step 1 Log in to the command-line interface for your Open LDAP server.
Step 2 Edit the following file:
/etc/syslog.conf
Step 3 Add the following information to the syslog configuration file:
<facility> @<IP address>
Where:
<facility> is the syslog facility, for example local4.
<IP address> is the IP address of your STRM Console or Event Collector.
Configuring DSMs
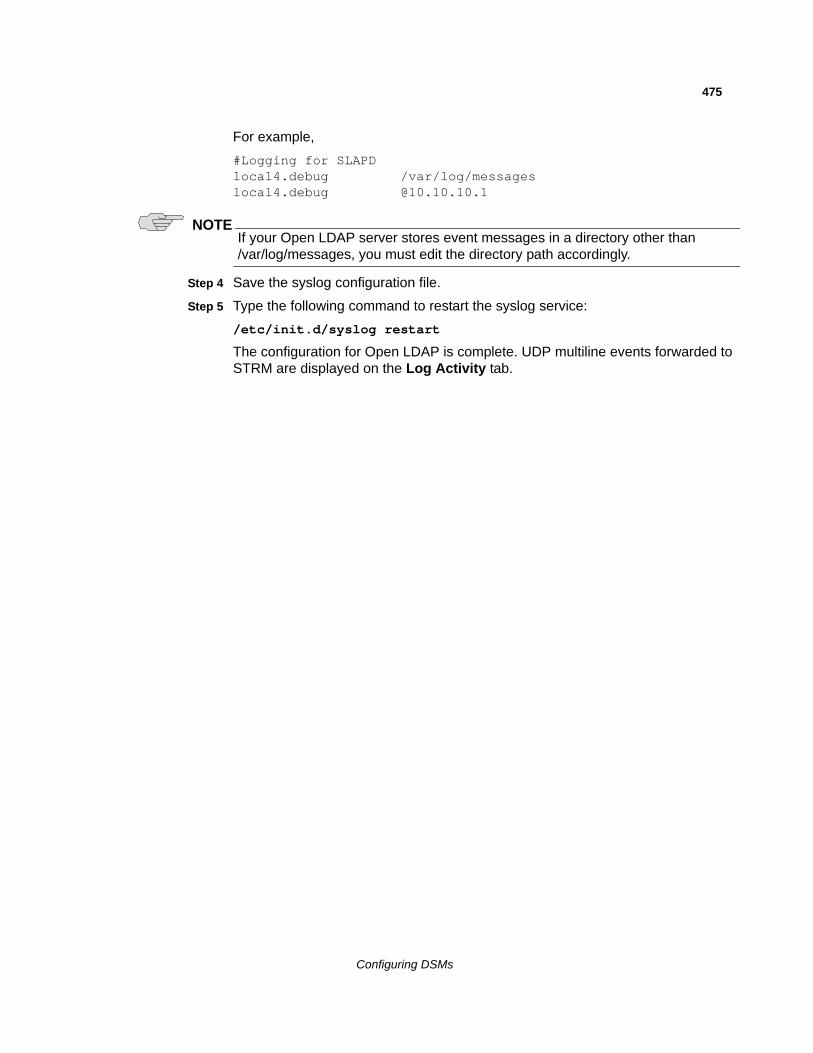
475
For example,
#Logging for SLAPDlocal4.debug /var/log/messageslocal4.debug @10.10.10.1
NOTEIf your Open LDAP server stores event messages in a directory other than /var/log/messages, you must edit the directory path accordingly.
Step 4 Save the syslog configuration file.
Step 5 Type the following command to restart the syslog service:
/etc/init.d/syslog restart
The configuration for Open LDAP is complete. UDP multiline events forwarded to STRM are displayed on the Log Activity tab.
Configuring DSMs

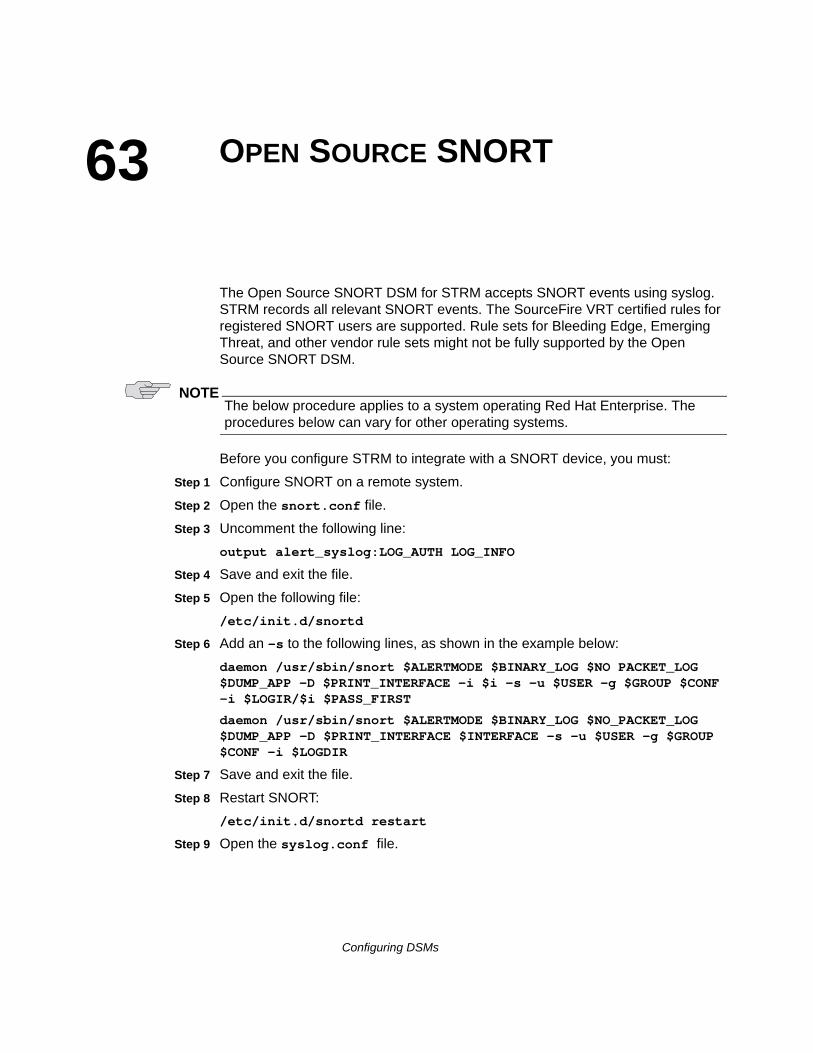
63
OPEN SOURCE SNORTThe Open Source SNORT DSM for STRM accepts SNORT events using syslog. STRM records all relevant SNORT events. The SourceFire VRT certified rules for registered SNORT users are supported. Rule sets for Bleeding Edge, Emerging Threat, and other vendor rule sets might not be fully supported by the Open Source SNORT DSM.
NOTEThe below procedure applies to a system operating Red Hat Enterprise. The procedures below can vary for other operating systems.
Before you configure STRM to integrate with a SNORT device, you must:
Step 1 Configure SNORT on a remote system.
Step 2 Open the snort.conf file.
Step 3 Uncomment the following line:
output alert_syslog:LOG_AUTH LOG_INFO
Step 4 Save and exit the file.
Step 5 Open the following file:
/etc/init.d/snortd
Step 6 Add an -s to the following lines, as shown in the example below:
daemon /usr/sbin/snort $ALERTMODE $BINARY_LOG $NO PACKET_LOG $DUMP_APP -D $PRINT_INTERFACE -i $i -s -u $USER -g $GROUP $CONF -i $LOGIR/$i $PASS_FIRST
daemon /usr/sbin/snort $ALERTMODE $BINARY_LOG $NO_PACKET_LOG $DUMP_APP -D $PRINT_INTERFACE $INTERFACE -s -u $USER -g $GROUP $CONF -i $LOGDIR
Step 7 Save and exit the file.
Step 8 Restart SNORT:
/etc/init.d/snortd restart
Step 9 Open the syslog.conf file.
Configuring DSMs
478 OPEN SOURCE SNORT
Step 10 Update the file to reflect the following:
auth.info @<IP Address>
Where <IP Address> is the system to which you want logs sent.
Step 11 Save and exit the file.
Step 12 Restart syslog:
/etc/init.d/syslog restart
You are now ready to configure the log source in STRM.
To configure STRM to receive events from a SNORT device:
from the Log Source Type list boxlist box, select Snort Open Source IDS.
For more information on configuring log sources, see the STRM Log Sources Users Guide. For more information about SNORT, see the SNORT documentation at http://www.snort.org/docs/.
Configuring DSMs
64
ORACLEThis section provides information on configuring the following DSMs:
• Oracle Audit Records
• Oracle DB Listener
• Oracle Audit Vault
• Oracle OS Audit
• Oracle BEA WebLogic
Oracle Audit Records
Oracle databases track auditing events, such as, user login and logouts, permission changes, table creation, and deletion and database inserts. STRM can collect these events for correlation and reporting purposes through the use of the Oracle Audit DSM. For more information, see your Oracle documentation.
NOTEOracle provides two modes of audit logs. STRM does not support fine grained auditing.
Oracle RDBMS is supported on Linux only when using syslog. Microsoft Windows hosts and Linux are supported when using JDBC to view database audit tables. When using a Microsoft Windows host, verify database audit tables are enabled. These procedures should be considered guidelines only. We recommend that you have experience with Oracle DBA before performing the procedures in this document. For more information, see your vendor documentation.
Before STRM can collect Oracle Audit events from an Oracle RDBMS instance, that instance must be configured to write audit records to either syslog or the database audit tables. For complete details and instructions for configuring auditing, see your vendor documentation.
NOTENot all versions of Oracle can send audit events using syslog. Oracle v9i and 10g Release 1 can only send audit events to the database. Oracle v10g Release 2 and Oracle v11g can write audit events to the database or to syslog. If you are using v10g Release 1 or v9i, you must use JDBC-based events. If you are using Oracle v10g Release 2, you can use syslog or JDBC-based events.
Configuring DSMs
480 ORACLE
To configure an Oracle Audit device to write audit logs to STRM, see Integrating Oracle Audit Device with STRM. If your system includes a large Oracle audit table (greater than 1 GB), see Improving Performance With Large Audit Tables.
Integrating OracleAudit Device with
STRM
To configure the device to write audit logs:
Step 1 Log in to the Oracle host as an Oracle user (This user was used to install Oracle, for example oracle).
Step 2 Make sure the ORACLE_HOME and ORACLE_SID environment variables are configured properly for your deployment.
Step 3 Open the following file:
${ORACLE_HOME}/dbs/init${ORACLE_SID}.ora
Step 4 Choose one of the following options:
a For database audit trails, type the following command:
*.audit_trail=’DB’
b For syslog, type the following command:
*.audit_trail=’os’
*.audit_syslog_level=’local0.info’
You must make sure the syslog daemon on the Oracle host is configured to forward the audit log to STRM. For systems running Red Hat Enterprise, the following line in the /etc/syslog.conf file effects the forwarding:
local0.info @qradar.domain.tld
Where qradar.domain.tld is the hostname of the STRM that receives the events. The syslog configuration must be re-loaded for the above command to be recognized. On a system running Red Hat Enterprise, type the following line to reload the syslog configuration:
kill -HUP /var/run/syslogd.pid
Step 5 Save and exit the file.
Step 6 To restart the database:
a Connect to SQLplus and log in as sysdba:
For example,
Enter user-name: sys as sysdba
b Shut down the database:
shutdown immediate
c Restart the database:
startup
Configuring DSMs
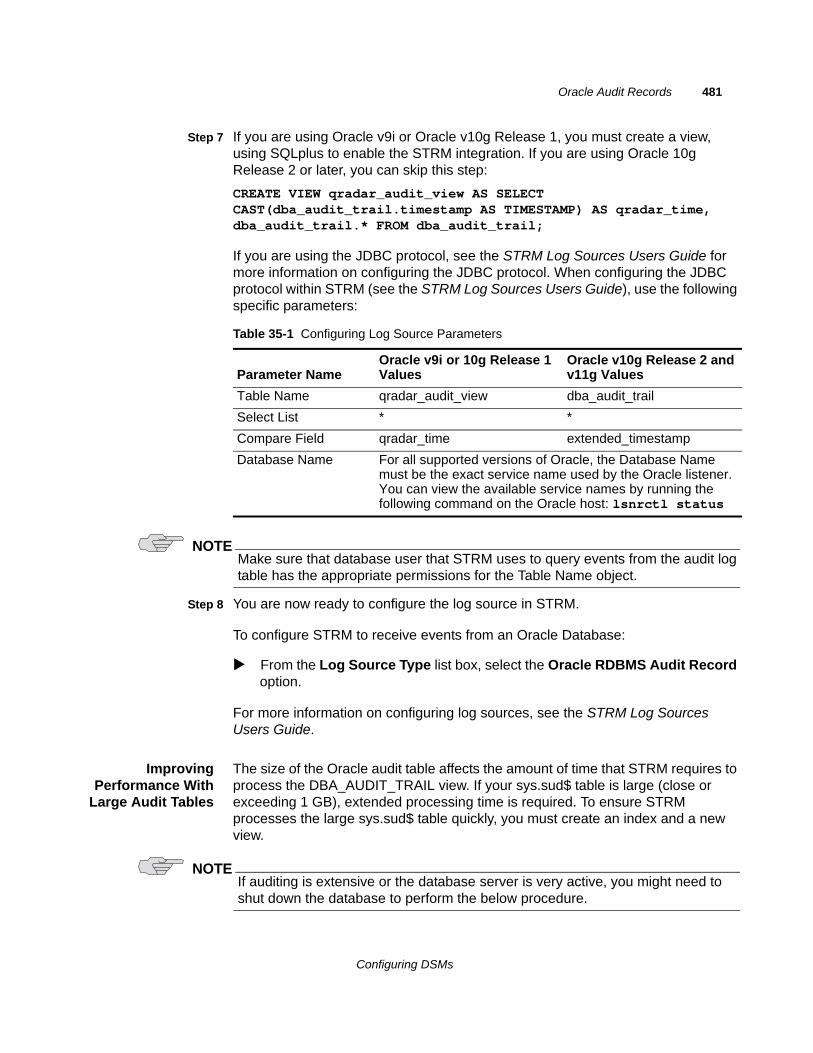
Oracle Audit Records 481
Step 7 If you are using Oracle v9i or Oracle v10g Release 1, you must create a view, using SQLplus to enable the STRM integration. If you are using Oracle 10g Release 2 or later, you can skip this step:
CREATE VIEW qradar_audit_view AS SELECT CAST(dba_audit_trail.timestamp AS TIMESTAMP) AS qradar_time, dba_audit_trail.* FROM dba_audit_trail;
If you are using the JDBC protocol, see the STRM Log Sources Users Guide for more information on configuring the JDBC protocol. When configuring the JDBC protocol within STRM (see the STRM Log Sources Users Guide), use the following specific parameters:
NOTEMake sure that database user that STRM uses to query events from the audit log table has the appropriate permissions for the Table Name object.
Step 8 You are now ready to configure the log source in STRM.
To configure STRM to receive events from an Oracle Database:
From the Log Source Type list box, select the Oracle RDBMS Audit Record option.
For more information on configuring log sources, see the STRM Log Sources Users Guide.
ImprovingPerformance With
Large Audit Tables
The size of the Oracle audit table affects the amount of time that STRM requires to process the DBA_AUDIT_TRAIL view. If your sys.sud$ table is large (close or exceeding 1 GB), extended processing time is required. To ensure STRM processes the large sys.sud$ table quickly, you must create an index and a new view.
NOTEIf auditing is extensive or the database server is very active, you might need to shut down the database to perform the below procedure.
Table 35-1 Configuring Log Source Parameters
Parameter NameOracle v9i or 10g Release 1 Values
Oracle v10g Release 2 and v11g Values
Table Name qradar_audit_view dba_audit_trail
Select List * *
Compare Field qradar_time extended_timestamp
Database Name For all supported versions of Oracle, the Database Name must be the exact service name used by the Oracle listener. You can view the available service names by running the following command on the Oracle host: lsnrctl status
Configuring DSMs
482 ORACLE
To create an index and a new view:
Step 1 Access the Juniper customer support website:
www.juniper.net/support/
Step 2 From the Software tab, select Scripts.
Step 3 Download the appropriate file for your version of Oracle:
a If you are using Oracle 9i or 10g Release 1, download the following file:
oracle_9i_dba_audit_view.sql
b If you are using Oracle v10g Release 2 and v11g, download the following file:
oracle_alt_dba_audit_view.sql
Step 4 Copy the downloaded file to a local directory.
Step 5 Change the directory to the location where you copied the file in Step 4.
Step 6 Log in to SQLplus and log in as sysdba:
sqlplus / as sysdba
Step 7 At the SQL prompt, type one of the following commands, depending on your version of Oracle Audit:
To create an index, the file might already be in use and must have exclusive access.
a If you are using Oracle 9i or 10g Release 1, type the following command:
@oracle_9i_dba_audit_view.sql
b If you are using Oracle v10g Release 2 and v11g, type the following command:
@oracle_alt_dba_audit_view.sql
Step 8 Make sure the database user configured in STRM has SELECT permissions on the view.
For example if the user is USER1:
grant select on sys.alt_dba_audit_view to USER1;
Step 9 Log out of SQLplus.
Step 10 Log in to STRM.
Step 11 Update the JDBC protocol configuration for this entry to include the following:
• Table Name - Update the table name from DBA_AUDIT_TRAIL to sys.alt_dba_audit_view.
• Compare Field - Update the field from entended_timestamp to ntimestamp.
For more information, see the STRM Log Sources Users Guide.
Step 12 Click Save.
The configuration is complete.
Configuring DSMs
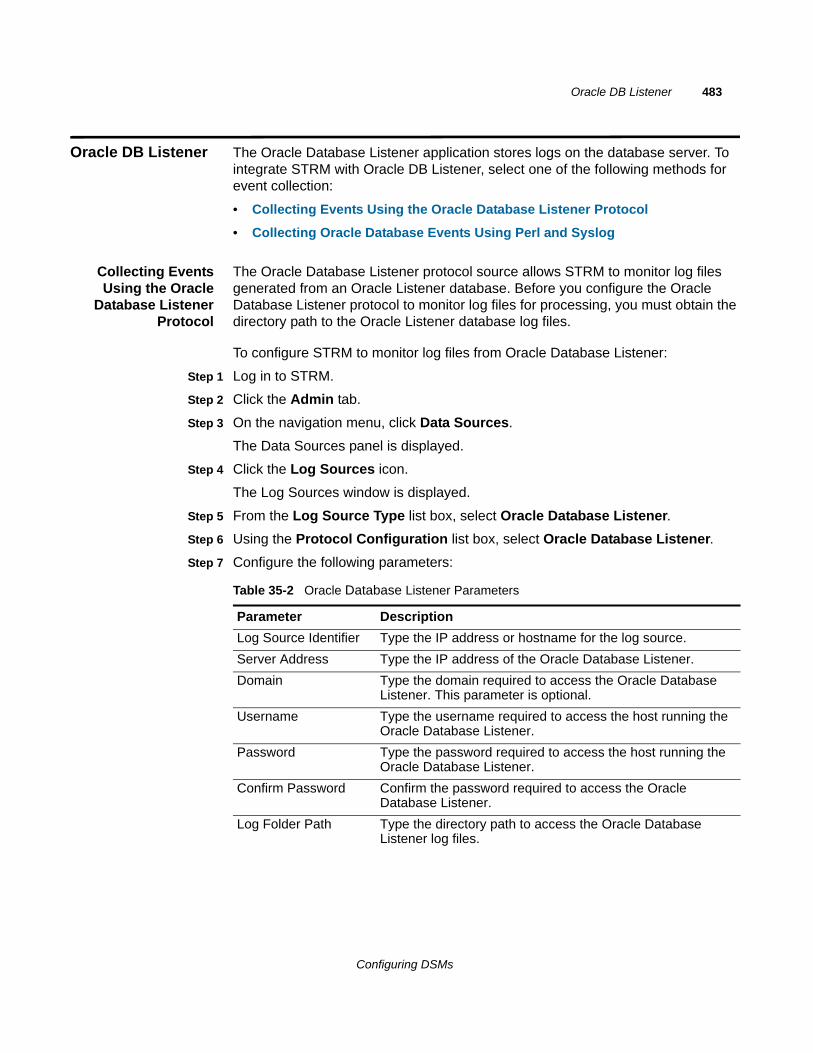
Oracle DB Listener 483
Oracle DB Listener The Oracle Database Listener application stores logs on the database server. To integrate STRM with Oracle DB Listener, select one of the following methods for event collection:
• Collecting Events Using the Oracle Database Listener Protocol
• Collecting Oracle Database Events Using Perl and Syslog
Collecting EventsUsing the Oracle
Database ListenerProtocol
The Oracle Database Listener protocol source allows STRM to monitor log files generated from an Oracle Listener database. Before you configure the Oracle Database Listener protocol to monitor log files for processing, you must obtain the directory path to the Oracle Listener database log files.
To configure STRM to monitor log files from Oracle Database Listener:
Step 1 Log in to STRM.
Step 2 Click the Admin tab.
Step 3 On the navigation menu, click Data Sources.
The Data Sources panel is displayed.
Step 4 Click the Log Sources icon.
The Log Sources window is displayed.
Step 5 From the Log Source Type list box, select Oracle Database Listener.
Step 6 Using the Protocol Configuration list box, select Oracle Database Listener.
Step 7 Configure the following parameters:
Table 35-2 Oracle Database Listener Parameters
Parameter Description
Log Source Identifier Type the IP address or hostname for the log source.
Server Address Type the IP address of the Oracle Database Listener.
Domain Type the domain required to access the Oracle Database Listener. This parameter is optional.
Username Type the username required to access the host running the Oracle Database Listener.
Password Type the password required to access the host running the Oracle Database Listener.
Confirm Password Confirm the password required to access the Oracle Database Listener.
Log Folder Path Type the directory path to access the Oracle Database Listener log files.
Configuring DSMs
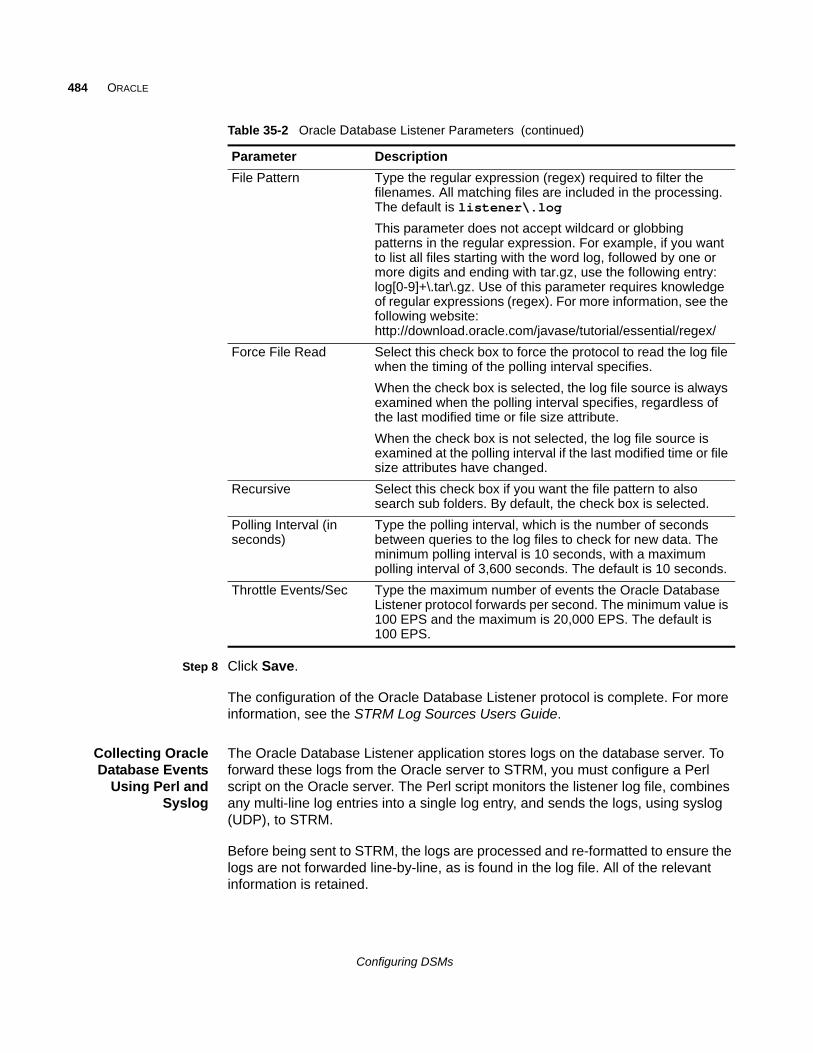
484 ORACLE
Step 8 Click Save.
The configuration of the Oracle Database Listener protocol is complete. For more information, see the STRM Log Sources Users Guide.
Collecting OracleDatabase Events
Using Perl andSyslog
The Oracle Database Listener application stores logs on the database server. To forward these logs from the Oracle server to STRM, you must configure a Perl script on the Oracle server. The Perl script monitors the listener log file, combines any multi-line log entries into a single log entry, and sends the logs, using syslog (UDP), to STRM.
Before being sent to STRM, the logs are processed and re-formatted to ensure the logs are not forwarded line-by-line, as is found in the log file. All of the relevant information is retained.
File Pattern Type the regular expression (regex) required to filter the filenames. All matching files are included in the processing. The default is listener\.log
This parameter does not accept wildcard or globbing patterns in the regular expression. For example, if you want to list all files starting with the word log, followed by one or more digits and ending with tar.gz, use the following entry: log[0-9]+\.tar\.gz. Use of this parameter requires knowledge of regular expressions (regex). For more information, see the following website: http://download.oracle.com/javase/tutorial/essential/regex/
Force File Read Select this check box to force the protocol to read the log file when the timing of the polling interval specifies.
When the check box is selected, the log file source is always examined when the polling interval specifies, regardless of the last modified time or file size attribute.
When the check box is not selected, the log file source is examined at the polling interval if the last modified time or file size attributes have changed.
Recursive Select this check box if you want the file pattern to also search sub folders. By default, the check box is selected.
Polling Interval (in seconds)
Type the polling interval, which is the number of seconds between queries to the log files to check for new data. The minimum polling interval is 10 seconds, with a maximum polling interval of 3,600 seconds. The default is 10 seconds.
Throttle Events/Sec Type the maximum number of events the Oracle Database Listener protocol forwards per second. The minimum value is 100 EPS and the maximum is 20,000 EPS. The default is 100 EPS.
Table 35-2 Oracle Database Listener Parameters (continued)
Parameter Description
Configuring DSMs
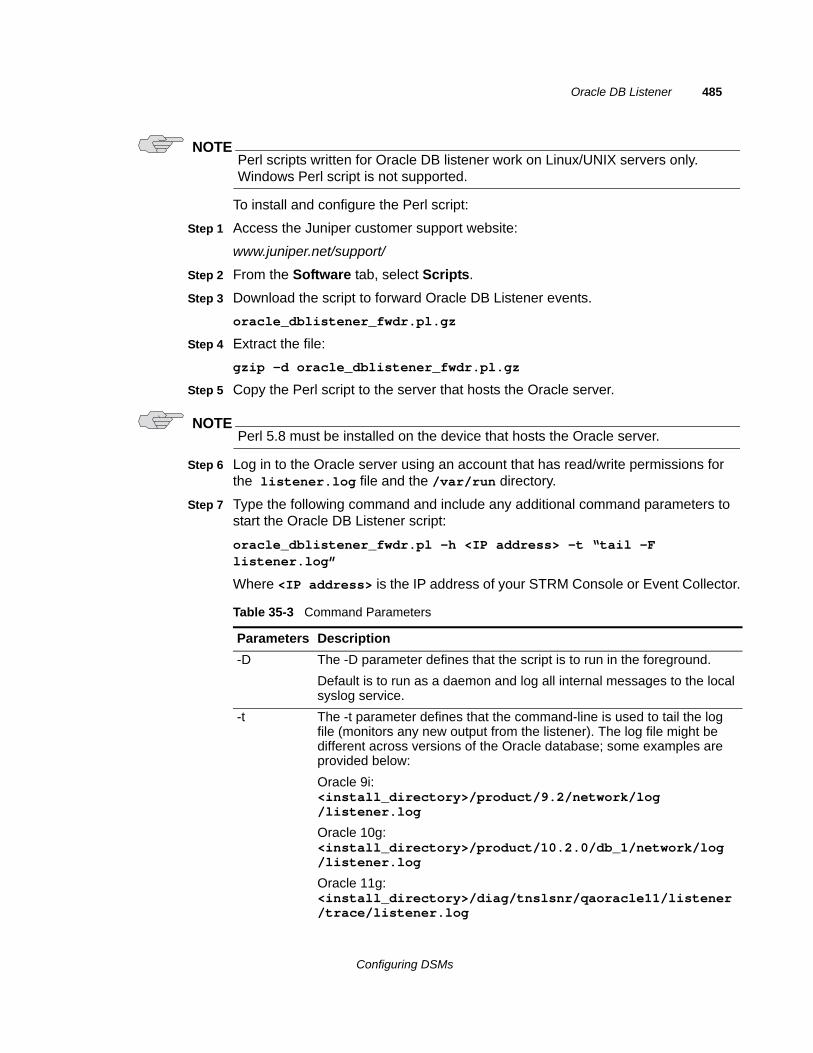
Oracle DB Listener 485
NOTEPerl scripts written for Oracle DB listener work on Linux/UNIX servers only. Windows Perl script is not supported.
To install and configure the Perl script:
Step 1 Access the Juniper customer support website:
www.juniper.net/support/
Step 2 From the Software tab, select Scripts.
Step 3 Download the script to forward Oracle DB Listener events.
oracle_dblistener_fwdr.pl.gz
Step 4 Extract the file:
gzip -d oracle_dblistener_fwdr.pl.gz
Step 5 Copy the Perl script to the server that hosts the Oracle server.
NOTEPerl 5.8 must be installed on the device that hosts the Oracle server.
Step 6 Log in to the Oracle server using an account that has read/write permissions for the listener.log file and the /var/run directory.
Step 7 Type the following command and include any additional command parameters to start the Oracle DB Listener script:
oracle_dblistener_fwdr.pl -h <IP address> -t “tail -F listener.log”
Where <IP address> is the IP address of your STRM Console or Event Collector.
Table 35-3 Command Parameters
Parameters Description
-D The -D parameter defines that the script is to run in the foreground.
Default is to run as a daemon and log all internal messages to the local syslog service.
-t The -t parameter defines that the command-line is used to tail the log file (monitors any new output from the listener). The log file might be different across versions of the Oracle database; some examples are provided below:
Oracle 9i: <install_directory>/product/9.2/network/log/listener.log
Oracle 10g: <install_directory>/product/10.2.0/db_1/network/log/listener.log
Oracle 11g: <install_directory>/diag/tnslsnr/qaoracle11/listener/trace/listener.log
Configuring DSMs
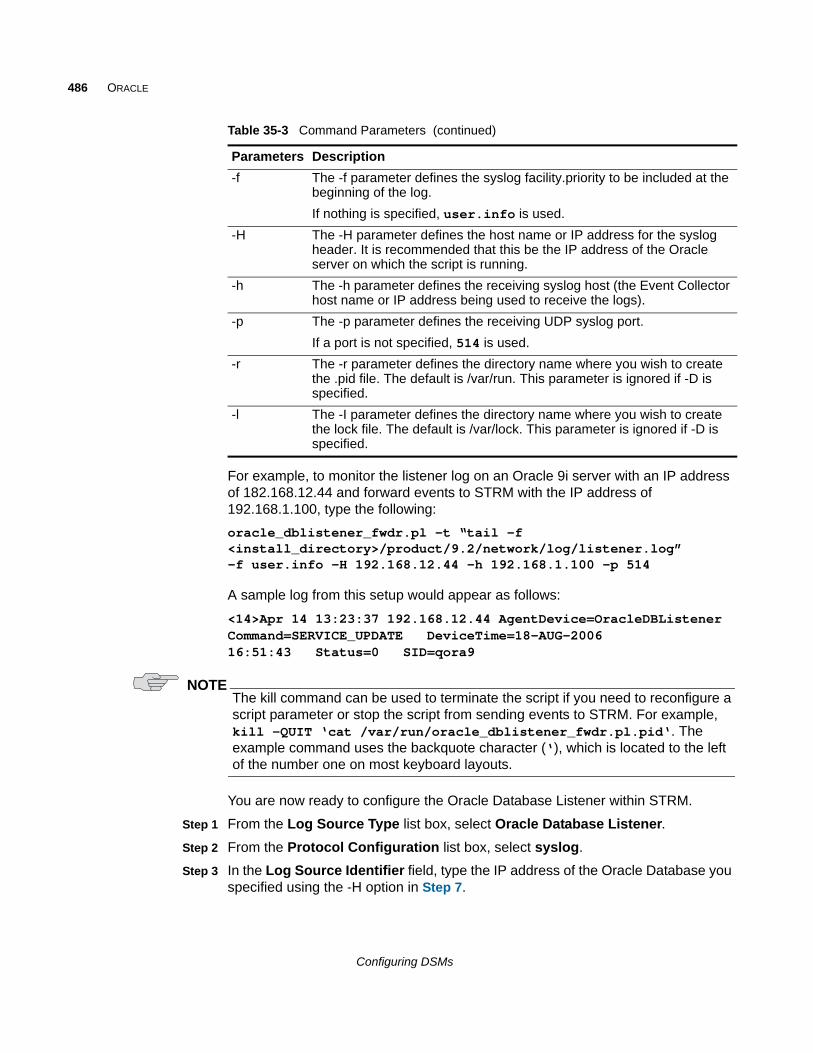
486 ORACLE
For example, to monitor the listener log on an Oracle 9i server with an IP address of 182.168.12.44 and forward events to STRM with the IP address of 192.168.1.100, type the following:
oracle_dblistener_fwdr.pl –t “tail –f <install_directory>/product/9.2/network/log/listener.log” –f user.info –H 192.168.12.44 –h 192.168.1.100 –p 514
A sample log from this setup would appear as follows:
<14>Apr 14 13:23:37 192.168.12.44 AgentDevice=OracleDBListener Command=SERVICE_UPDATE DeviceTime=18-AUG-2006 16:51:43 Status=0 SID=qora9
NOTEThe kill command can be used to terminate the script if you need to reconfigure a script parameter or stop the script from sending events to STRM. For example, kill -QUIT ‘cat /var/run/oracle_dblistener_fwdr.pl.pid‘. The example command uses the backquote character (‘), which is located to the left of the number one on most keyboard layouts.
You are now ready to configure the Oracle Database Listener within STRM.
Step 1 From the Log Source Type list box, select Oracle Database Listener.
Step 2 From the Protocol Configuration list box, select syslog.
Step 3 In the Log Source Identifier field, type the IP address of the Oracle Database you specified using the -H option in Step 7.
-f The -f parameter defines the syslog facility.priority to be included at the beginning of the log.
If nothing is specified, user.info is used.
-H The -H parameter defines the host name or IP address for the syslog header. It is recommended that this be the IP address of the Oracle server on which the script is running.
-h The -h parameter defines the receiving syslog host (the Event Collector host name or IP address being used to receive the logs).
-p The -p parameter defines the receiving UDP syslog port.
If a port is not specified, 514 is used.
-r The -r parameter defines the directory name where you wish to create the .pid file. The default is /var/run. This parameter is ignored if -D is specified.
-l The -I parameter defines the directory name where you wish to create the lock file. The default is /var/lock. This parameter is ignored if -D is specified.
Table 35-3 Command Parameters (continued)
Parameters Description
Configuring DSMs
Oracle Audit Vault 487
The configuration of the Oracle Database Listener protocol is complete. For more information on Oracle Database Listener, see your vendor documentation.
Oracle Audit Vault The Oracle Audit Vault DSM for STRM accepts events on Oracle v10.2.3.2 and above using Java Database Connectivity (JDBC) to accesses alerts on the JDBC protocol. STRM records Oracle Audit Vault alerts from the source database and captures events as configured by the Oracle Audit Policy Setting. When events occur, the alerts are stored in avsys.av$alert_store table. Customized events are created in Oracle Audit Vault by a user with AV_AUDITOR permissions.
See your vendor documentation about configuration of Audit Policy Settings in Oracle Audit Vault.
In Oracle Audit Vault, alert names are not mapped to a STRM Identifier (QID). Using the Map Event function in the STRM Events interface a normalized or raw event can be mapped to a high-level and low-level category (or QID). Using the Oracle Audit Vault DSM, category mapping can be done by mapping your high or low category alerts directly to an alert name (ALERT_NAME field) in the payload. For information about the Events interface, see the STRM Users Guide.
To configure Oracle Audit Vault DSM with STRM, see Configuring STRM to Receive Oracle Audit Vault Alerts.
Configuring STRM toReceive Oracle Audit
Vault Alerts
To configure STRM to access the Oracle Audit Vault database using the JDBC protocol:
Step 1 Log in to STRM.
Step 2 Click the Admin tab.
Step 3 On the navigation menu, click Data Sources.
The Data Sources panel is displayed.
Step 4 Click the Log Sources icon.
The Log Sources window is displayed.
Step 5 Click Add.
Step 6 Using the Log Source Type list box, select Oracle Audit Vault.
Step 7 Using the Protocol Configuration list box, select JDBC.
Step 8 Configure the following values:
a Database Type: Oracle
b Database Name: <Audit Vault Database Name>
Configuring DSMs
488 ORACLE
c Table Name: avsys.av$alert_store
d Select List: *
e Compare Field: ALERT_SEQUENCE
f IP or Hostname: <Location of Oracle Audit Vault Server>
g Port: <Default Port>
h Username: <Database Access Username having AV_AUDITOR role>
i Password: <Password>
j Polling Interval: <Default Interval>
NOTEVerify the AV_AUDITOR password has been entered correctly before saving the JDBC protocol configuration. Oracle Audit Vault might lock the user account due to repeated failed login attempts. When the AV_AUDITOR account is locked, data in the avsys.av$alert_store cannot be accessed. In order to unlock this user account, it is necessary to first correct the password entry in the protocol configuration. Then log in to Oracle Audit Vault through the Oracle sqlplus prompt as the avadmindva user to perform an alter user <AV_AUDITOR USER> account unlock command.
Step 9 Click Save.
Step 10 On the Admin tab, click Deploy Changes.
NOTEThe local time zone conversion-dependent Oracle timestamps are not supported in earlier versions of the JDBC protocol for STRM so fields AV_ALERT_TIME, ACTUAL_ALERT_TIME, and TIME_CLEARED in the payload only display object identifiers until your JDBC protocol is updated.
Oracle OS Audit The Oracle OS Audit DSM for STRM allows monitoring of the audit records that are stored in the local operating system file. When audit event files are created or updated in the local operating system directory, a Perl script detects the change, and forwards the data to STRM. The Perl script monitors the Audit log file, combines any multi-line log entries into a single log entry to ensure the logs are not forwarded line-by-line, as is found in the log file, then sends the logs using syslog to STRM. Perl scripts written for Oracle OS Audit work on Linux/UNIX servers only. Windows-based Perl installations are not supported.
To integrate the Oracle OS Audit DSM with STRM:
Step 1 Access the Juniper customer support website:
www.juniper.net/support/
Step 2 From the Software tab, select Scripts.
Configuring DSMs
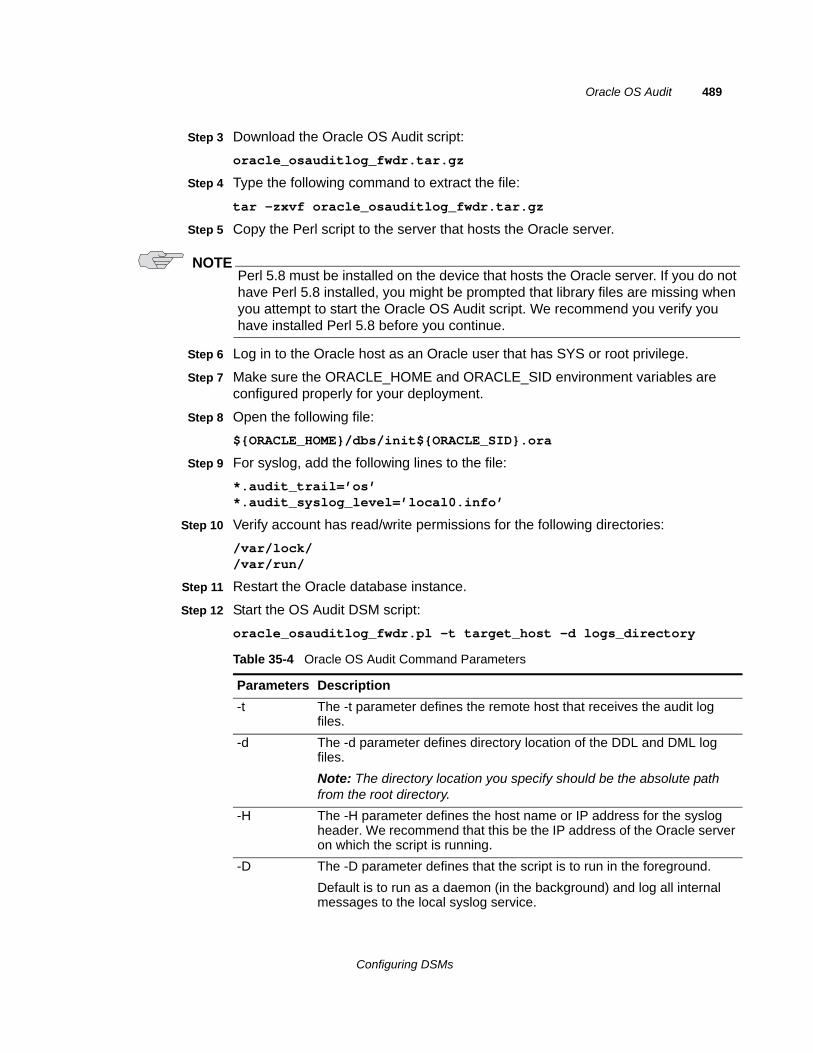
Oracle OS Audit 489
Step 3 Download the Oracle OS Audit script:
oracle_osauditlog_fwdr.tar.gz
Step 4 Type the following command to extract the file:
tar -zxvf oracle_osauditlog_fwdr.tar.gz
Step 5 Copy the Perl script to the server that hosts the Oracle server.
NOTEPerl 5.8 must be installed on the device that hosts the Oracle server. If you do not have Perl 5.8 installed, you might be prompted that library files are missing when you attempt to start the Oracle OS Audit script. We recommend you verify you have installed Perl 5.8 before you continue.
Step 6 Log in to the Oracle host as an Oracle user that has SYS or root privilege.
Step 7 Make sure the ORACLE_HOME and ORACLE_SID environment variables are configured properly for your deployment.
Step 8 Open the following file:
${ORACLE_HOME}/dbs/init${ORACLE_SID}.ora
Step 9 For syslog, add the following lines to the file:
*.audit_trail=’os’*.audit_syslog_level=’local0.info’
Step 10 Verify account has read/write permissions for the following directories:
/var/lock//var/run/
Step 11 Restart the Oracle database instance.
Step 12 Start the OS Audit DSM script:
oracle_osauditlog_fwdr.pl -t target_host -d logs_directory
Table 35-4 Oracle OS Audit Command Parameters
Parameters Description
-t The -t parameter defines the remote host that receives the audit log files.
-d The -d parameter defines directory location of the DDL and DML log files.
Note: The directory location you specify should be the absolute path from the root directory.
-H The -H parameter defines the host name or IP address for the syslog header. We recommend that this be the IP address of the Oracle server on which the script is running.
-D The -D parameter defines that the script is to run in the foreground.
Default is to run as a daemon (in the background) and log all internal messages to the local syslog service.
Configuring DSMs
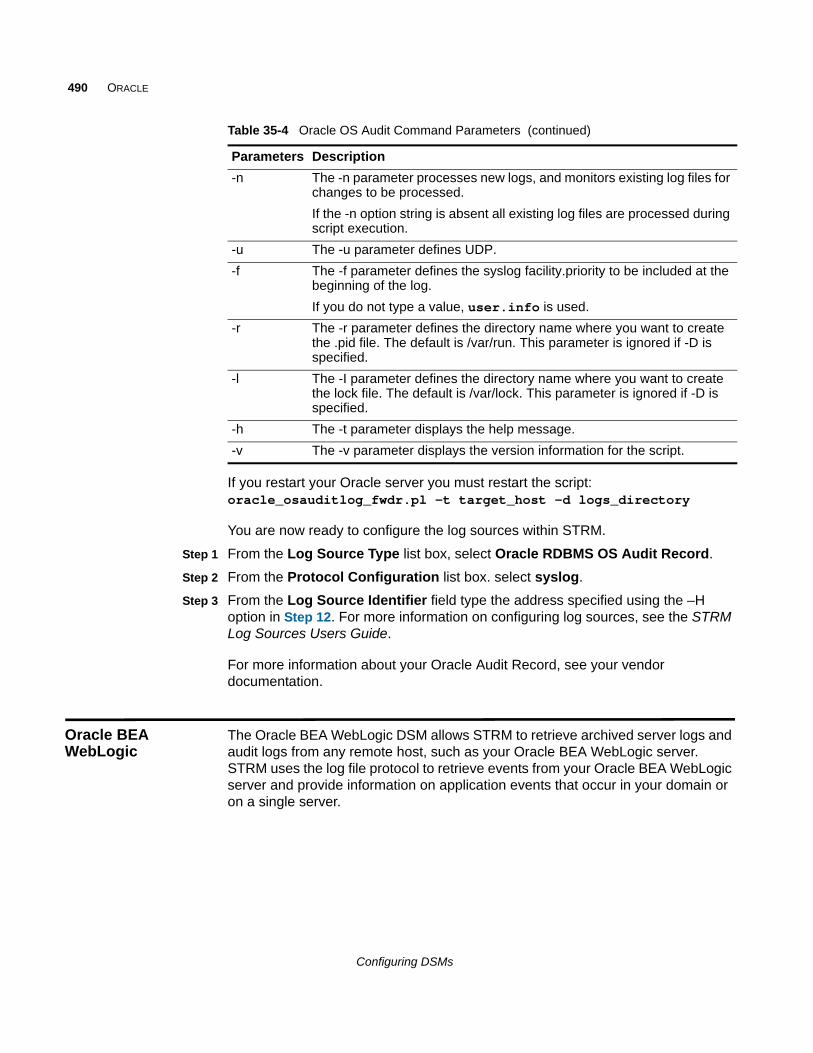
490 ORACLE
If you restart your Oracle server you must restart the script: oracle_osauditlog_fwdr.pl -t target_host -d logs_directory
You are now ready to configure the log sources within STRM.
Step 1 From the Log Source Type list box, select Oracle RDBMS OS Audit Record.
Step 2 From the Protocol Configuration list box. select syslog.
Step 3 From the Log Source Identifier field type the address specified using the –H option in Step 12. For more information on configuring log sources, see the STRM Log Sources Users Guide.
For more information about your Oracle Audit Record, see your vendor documentation.
Oracle BEA WebLogic
The Oracle BEA WebLogic DSM allows STRM to retrieve archived server logs and audit logs from any remote host, such as your Oracle BEA WebLogic server. STRM uses the log file protocol to retrieve events from your Oracle BEA WebLogic server and provide information on application events that occur in your domain or on a single server.
-n The -n parameter processes new logs, and monitors existing log files for changes to be processed.
If the -n option string is absent all existing log files are processed during script execution.
-u The -u parameter defines UDP.
-f The -f parameter defines the syslog facility.priority to be included at the beginning of the log.
If you do not type a value, user.info is used.
-r The -r parameter defines the directory name where you want to create the .pid file. The default is /var/run. This parameter is ignored if -D is specified.
-l The -I parameter defines the directory name where you want to create the lock file. The default is /var/lock. This parameter is ignored if -D is specified.
-h The -t parameter displays the help message.
-v The -v parameter displays the version information for the script.
Table 35-4 Oracle OS Audit Command Parameters (continued)
Parameters Description
Configuring DSMs
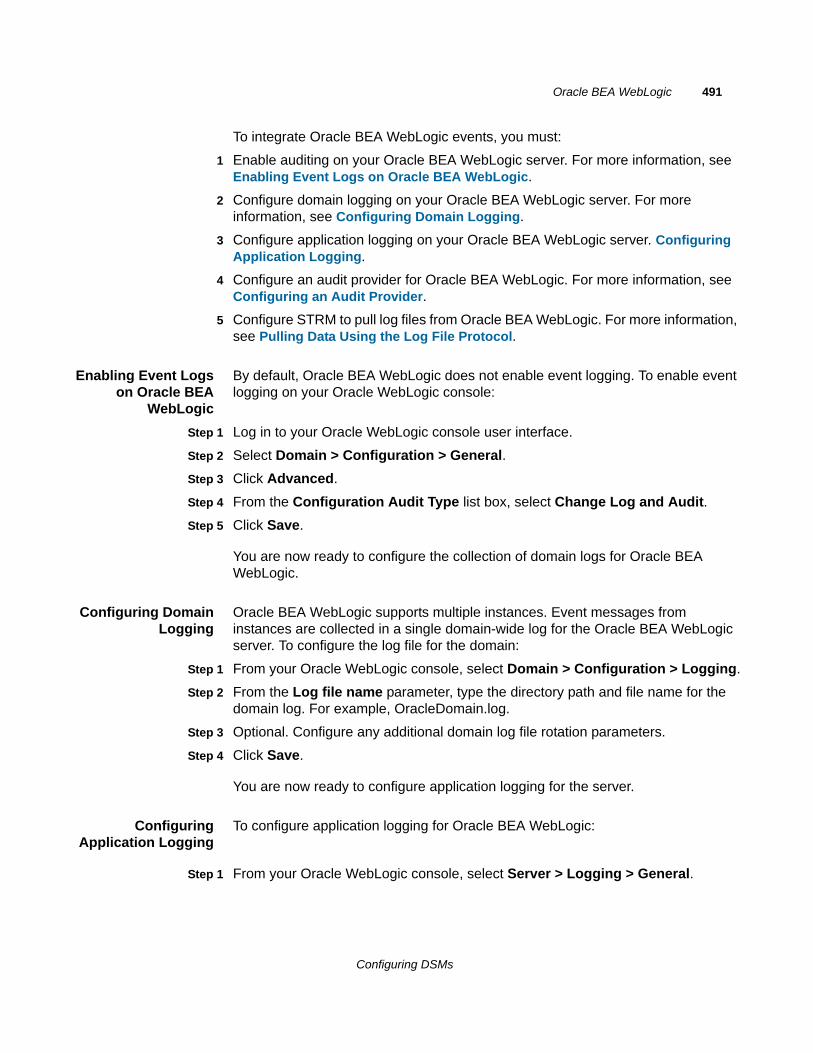
Oracle BEA WebLogic 491
To integrate Oracle BEA WebLogic events, you must:
1 Enable auditing on your Oracle BEA WebLogic server. For more information, see Enabling Event Logs on Oracle BEA WebLogic.
2 Configure domain logging on your Oracle BEA WebLogic server. For more information, see Configuring Domain Logging.
3 Configure application logging on your Oracle BEA WebLogic server. Configuring Application Logging.
4 Configure an audit provider for Oracle BEA WebLogic. For more information, see Configuring an Audit Provider.
5 Configure STRM to pull log files from Oracle BEA WebLogic. For more information, see Pulling Data Using the Log File Protocol.
Enabling Event Logson Oracle BEA
WebLogic
By default, Oracle BEA WebLogic does not enable event logging. To enable event logging on your Oracle WebLogic console:
Step 1 Log in to your Oracle WebLogic console user interface.
Step 2 Select Domain > Configuration > General.
Step 3 Click Advanced.
Step 4 From the Configuration Audit Type list box, select Change Log and Audit.
Step 5 Click Save.
You are now ready to configure the collection of domain logs for Oracle BEA WebLogic.
Configuring DomainLogging
Oracle BEA WebLogic supports multiple instances. Event messages from instances are collected in a single domain-wide log for the Oracle BEA WebLogic server. To configure the log file for the domain:
Step 1 From your Oracle WebLogic console, select Domain > Configuration > Logging.
Step 2 From the Log file name parameter, type the directory path and file name for the domain log. For example, OracleDomain.log.
Step 3 Optional. Configure any additional domain log file rotation parameters.
Step 4 Click Save.
You are now ready to configure application logging for the server.
ConfiguringApplication Logging
To configure application logging for Oracle BEA WebLogic:
Step 1 From your Oracle WebLogic console, select Server > Logging > General.
Configuring DSMs
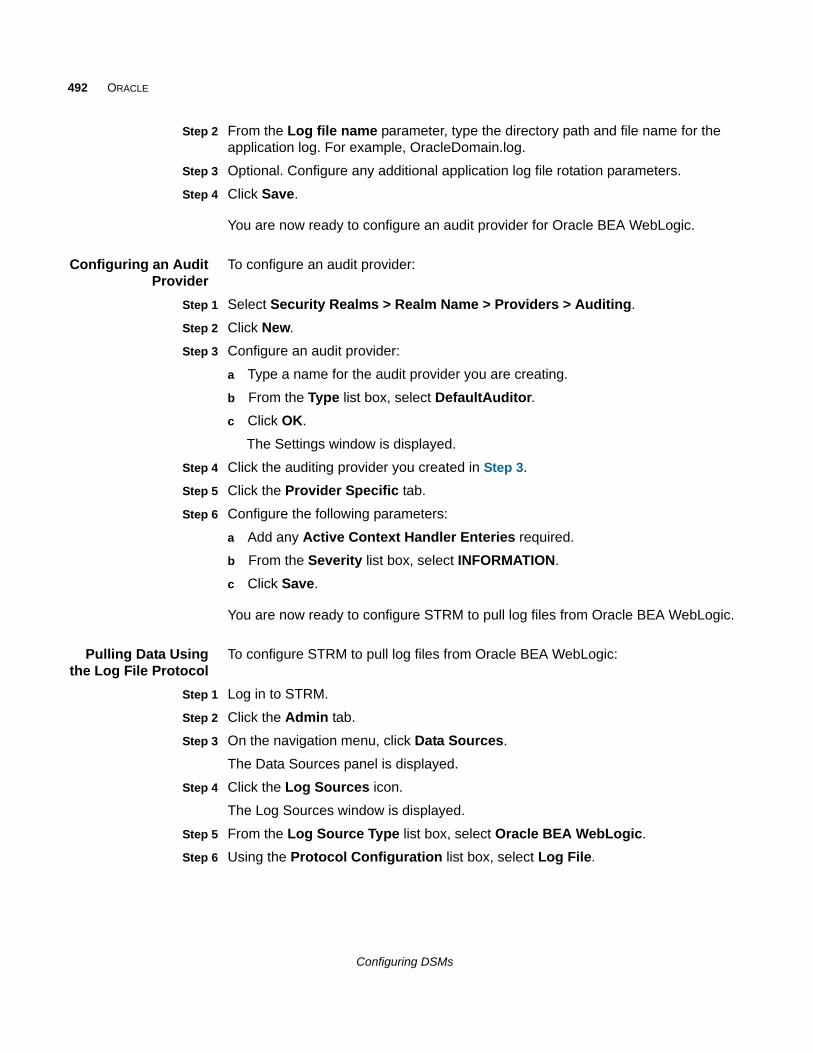
492 ORACLE
Step 2 From the Log file name parameter, type the directory path and file name for the application log. For example, OracleDomain.log.
Step 3 Optional. Configure any additional application log file rotation parameters.
Step 4 Click Save.
You are now ready to configure an audit provider for Oracle BEA WebLogic.
Configuring an AuditProvider
To configure an audit provider:
Step 1 Select Security Realms > Realm Name > Providers > Auditing.
Step 2 Click New.
Step 3 Configure an audit provider:
a Type a name for the audit provider you are creating.
b From the Type list box, select DefaultAuditor.
c Click OK.
The Settings window is displayed.
Step 4 Click the auditing provider you created in Step 3.
Step 5 Click the Provider Specific tab.
Step 6 Configure the following parameters:
a Add any Active Context Handler Enteries required.
b From the Severity list box, select INFORMATION.
c Click Save.
You are now ready to configure STRM to pull log files from Oracle BEA WebLogic.
Pulling Data Usingthe Log File Protocol
To configure STRM to pull log files from Oracle BEA WebLogic:
Step 1 Log in to STRM.
Step 2 Click the Admin tab.
Step 3 On the navigation menu, click Data Sources.
The Data Sources panel is displayed.
Step 4 Click the Log Sources icon.
The Log Sources window is displayed.
Step 5 From the Log Source Type list box, select Oracle BEA WebLogic.
Step 6 Using the Protocol Configuration list box, select Log File.
Configuring DSMs
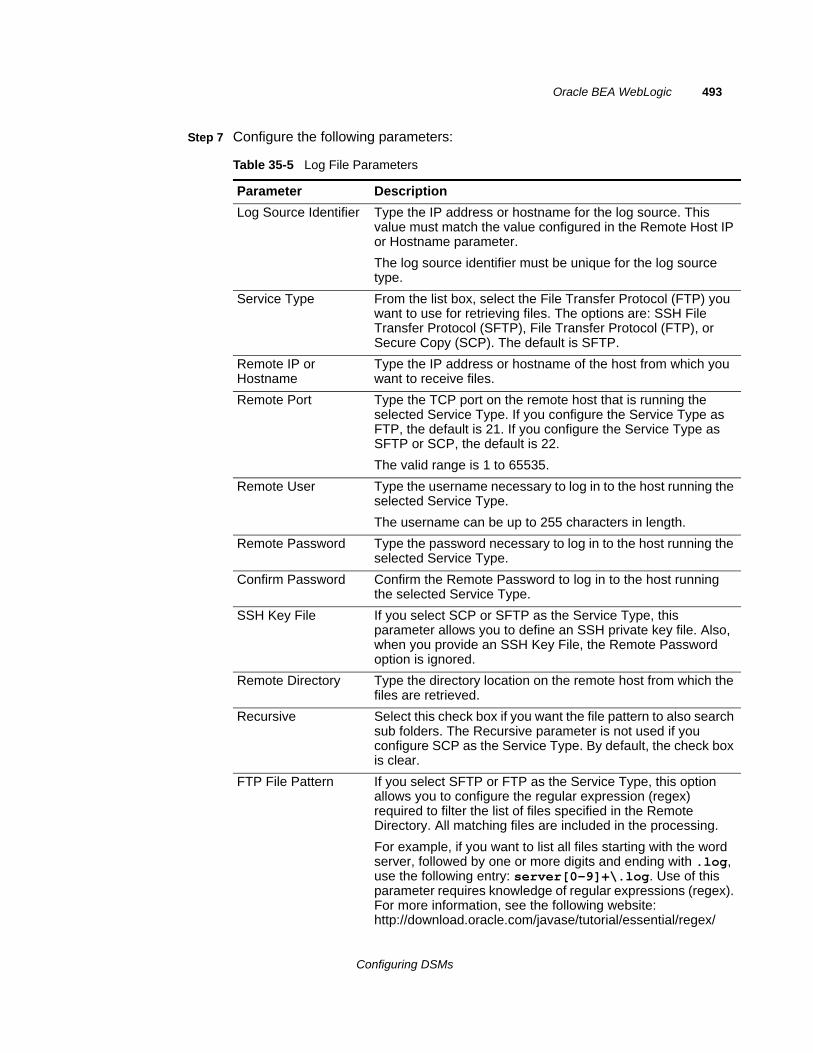
Oracle BEA WebLogic 493
Step 7 Configure the following parameters:
Table 35-5 Log File Parameters
Parameter Description
Log Source Identifier Type the IP address or hostname for the log source. This value must match the value configured in the Remote Host IP or Hostname parameter.
The log source identifier must be unique for the log source type.
Service Type From the list box, select the File Transfer Protocol (FTP) you want to use for retrieving files. The options are: SSH File Transfer Protocol (SFTP), File Transfer Protocol (FTP), or Secure Copy (SCP). The default is SFTP.
Remote IP or Hostname
Type the IP address or hostname of the host from which you want to receive files.
Remote Port Type the TCP port on the remote host that is running the selected Service Type. If you configure the Service Type as FTP, the default is 21. If you configure the Service Type as SFTP or SCP, the default is 22.
The valid range is 1 to 65535.
Remote User Type the username necessary to log in to the host running the selected Service Type.
The username can be up to 255 characters in length.
Remote Password Type the password necessary to log in to the host running the selected Service Type.
Confirm Password Confirm the Remote Password to log in to the host running the selected Service Type.
SSH Key File If you select SCP or SFTP as the Service Type, this parameter allows you to define an SSH private key file. Also, when you provide an SSH Key File, the Remote Password option is ignored.
Remote Directory Type the directory location on the remote host from which the files are retrieved.
Recursive Select this check box if you want the file pattern to also search sub folders. The Recursive parameter is not used if you configure SCP as the Service Type. By default, the check box is clear.
FTP File Pattern If you select SFTP or FTP as the Service Type, this option allows you to configure the regular expression (regex) required to filter the list of files specified in the Remote Directory. All matching files are included in the processing.
For example, if you want to list all files starting with the word server, followed by one or more digits and ending with .log, use the following entry: server[0-9]+\.log. Use of this parameter requires knowledge of regular expressions (regex). For more information, see the following website: http://download.oracle.com/javase/tutorial/essential/regex/
Configuring DSMs
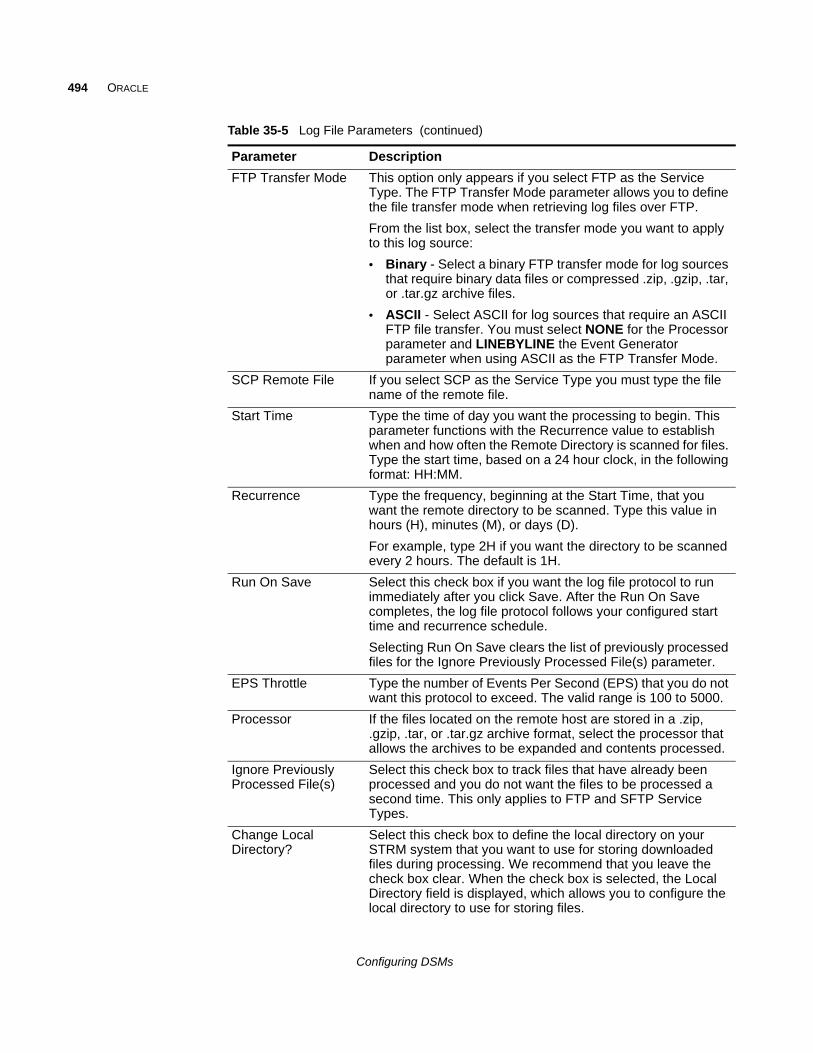
494 ORACLE
FTP Transfer Mode This option only appears if you select FTP as the Service Type. The FTP Transfer Mode parameter allows you to define the file transfer mode when retrieving log files over FTP.
From the list box, select the transfer mode you want to apply to this log source:
• Binary - Select a binary FTP transfer mode for log sources that require binary data files or compressed .zip, .gzip, .tar, or .tar.gz archive files.
• ASCII - Select ASCII for log sources that require an ASCII FTP file transfer. You must select NONE for the Processor parameter and LINEBYLINE the Event Generator parameter when using ASCII as the FTP Transfer Mode.
SCP Remote File If you select SCP as the Service Type you must type the file name of the remote file.
Start Time Type the time of day you want the processing to begin. This parameter functions with the Recurrence value to establish when and how often the Remote Directory is scanned for files. Type the start time, based on a 24 hour clock, in the following format: HH:MM.
Recurrence Type the frequency, beginning at the Start Time, that you want the remote directory to be scanned. Type this value in hours (H), minutes (M), or days (D).
For example, type 2H if you want the directory to be scanned every 2 hours. The default is 1H.
Run On Save Select this check box if you want the log file protocol to run immediately after you click Save. After the Run On Save completes, the log file protocol follows your configured start time and recurrence schedule.
Selecting Run On Save clears the list of previously processed files for the Ignore Previously Processed File(s) parameter.
EPS Throttle Type the number of Events Per Second (EPS) that you do not want this protocol to exceed. The valid range is 100 to 5000.
Processor If the files located on the remote host are stored in a .zip, .gzip, .tar, or .tar.gz archive format, select the processor that allows the archives to be expanded and contents processed.
Ignore Previously Processed File(s)
Select this check box to track files that have already been processed and you do not want the files to be processed a second time. This only applies to FTP and SFTP Service Types.
Change Local Directory?
Select this check box to define the local directory on your STRM system that you want to use for storing downloaded files during processing. We recommend that you leave the check box clear. When the check box is selected, the Local Directory field is displayed, which allows you to configure the local directory to use for storing files.
Table 35-5 Log File Parameters (continued)
Parameter Description
Configuring DSMs

Oracle BEA WebLogic 495
Step 8 Click Save.
Step 9 On the Admin tab, click Deploy Changes.
The configuration is complete.
Event Generator From the Event Generator list box, select Oracle BEA WebLogic.
Table 35-5 Log File Parameters (continued)
Parameter Description
Configuring DSMs

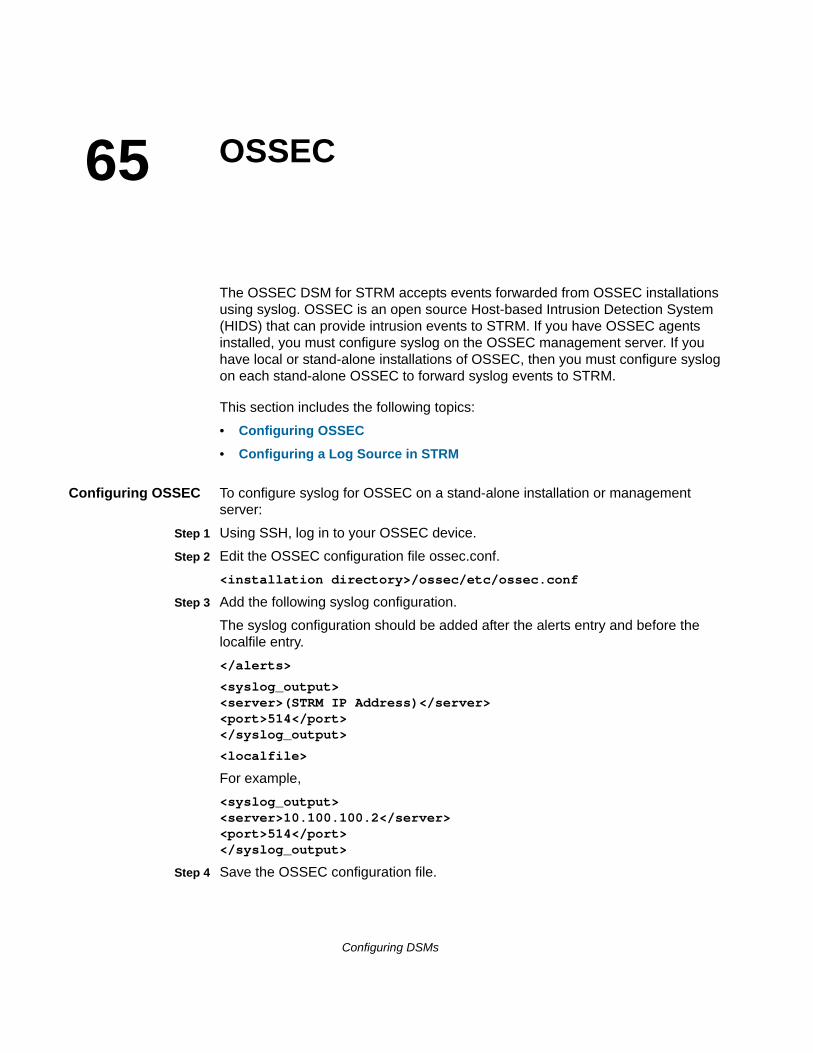
65
OSSECThe OSSEC DSM for STRM accepts events forwarded from OSSEC installations using syslog. OSSEC is an open source Host-based Intrusion Detection System (HIDS) that can provide intrusion events to STRM. If you have OSSEC agents installed, you must configure syslog on the OSSEC management server. If you have local or stand-alone installations of OSSEC, then you must configure syslog on each stand-alone OSSEC to forward syslog events to STRM.
This section includes the following topics:
• Configuring OSSEC
• Configuring a Log Source in STRM
Configuring OSSEC To configure syslog for OSSEC on a stand-alone installation or management server:
Step 1 Using SSH, log in to your OSSEC device.
Step 2 Edit the OSSEC configuration file ossec.conf.
<installation directory>/ossec/etc/ossec.conf
Step 3 Add the following syslog configuration.
The syslog configuration should be added after the alerts entry and before the localfile entry.
</alerts>
<syslog_output><server>(STRM IP Address)</server><port>514</port></syslog_output>
<localfile>
For example,
<syslog_output><server>10.100.100.2</server><port>514</port></syslog_output>
Step 4 Save the OSSEC configuration file.
Configuring DSMs
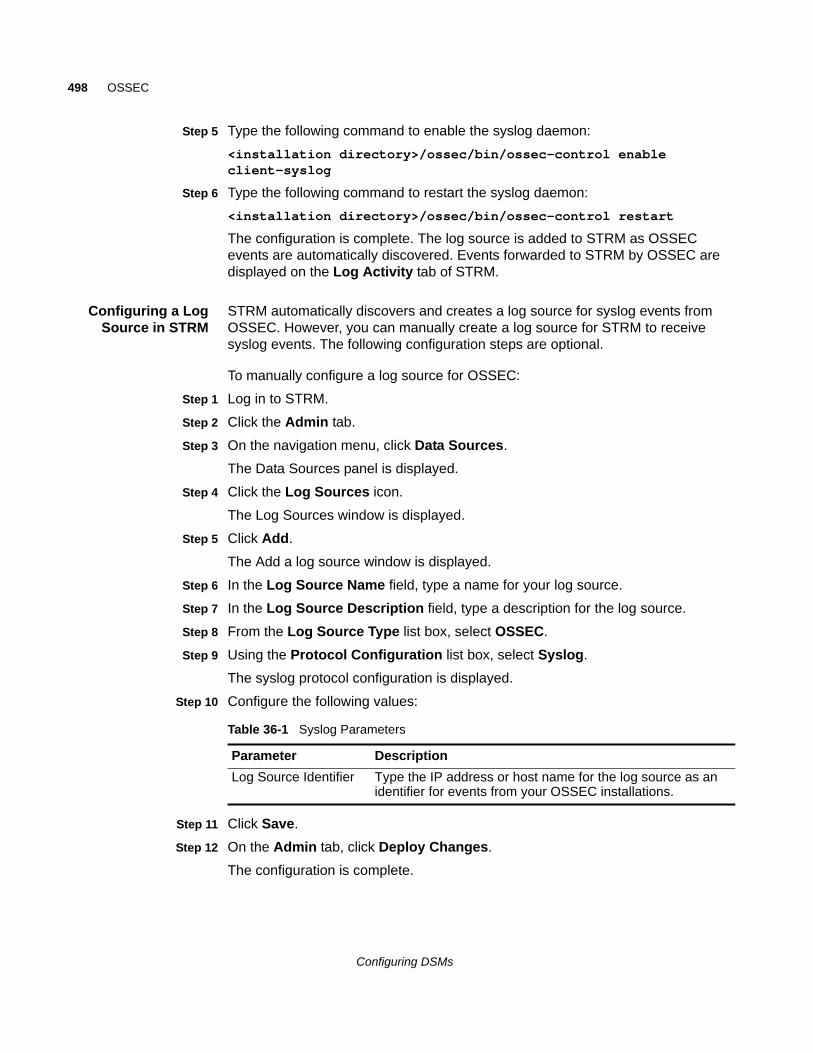
498 OSSEC
Step 5 Type the following command to enable the syslog daemon:
<installation directory>/ossec/bin/ossec-control enable client-syslog
Step 6 Type the following command to restart the syslog daemon:
<installation directory>/ossec/bin/ossec-control restart
The configuration is complete. The log source is added to STRM as OSSEC events are automatically discovered. Events forwarded to STRM by OSSEC are displayed on the Log Activity tab of STRM.
Configuring a LogSource in STRM
STRM automatically discovers and creates a log source for syslog events from OSSEC. However, you can manually create a log source for STRM to receive syslog events. The following configuration steps are optional.
To manually configure a log source for OSSEC:
Step 1 Log in to STRM.
Step 2 Click the Admin tab.
Step 3 On the navigation menu, click Data Sources.
The Data Sources panel is displayed.
Step 4 Click the Log Sources icon.
The Log Sources window is displayed.
Step 5 Click Add.
The Add a log source window is displayed.
Step 6 In the Log Source Name field, type a name for your log source.
Step 7 In the Log Source Description field, type a description for the log source.
Step 8 From the Log Source Type list box, select OSSEC.
Step 9 Using the Protocol Configuration list box, select Syslog.
The syslog protocol configuration is displayed.
Step 10 Configure the following values:
Step 11 Click Save.
Step 12 On the Admin tab, click Deploy Changes.
The configuration is complete.
Table 36-1 Syslog Parameters
Parameter Description
Log Source Identifier Type the IP address or host name for the log source as an identifier for events from your OSSEC installations.
Configuring DSMs
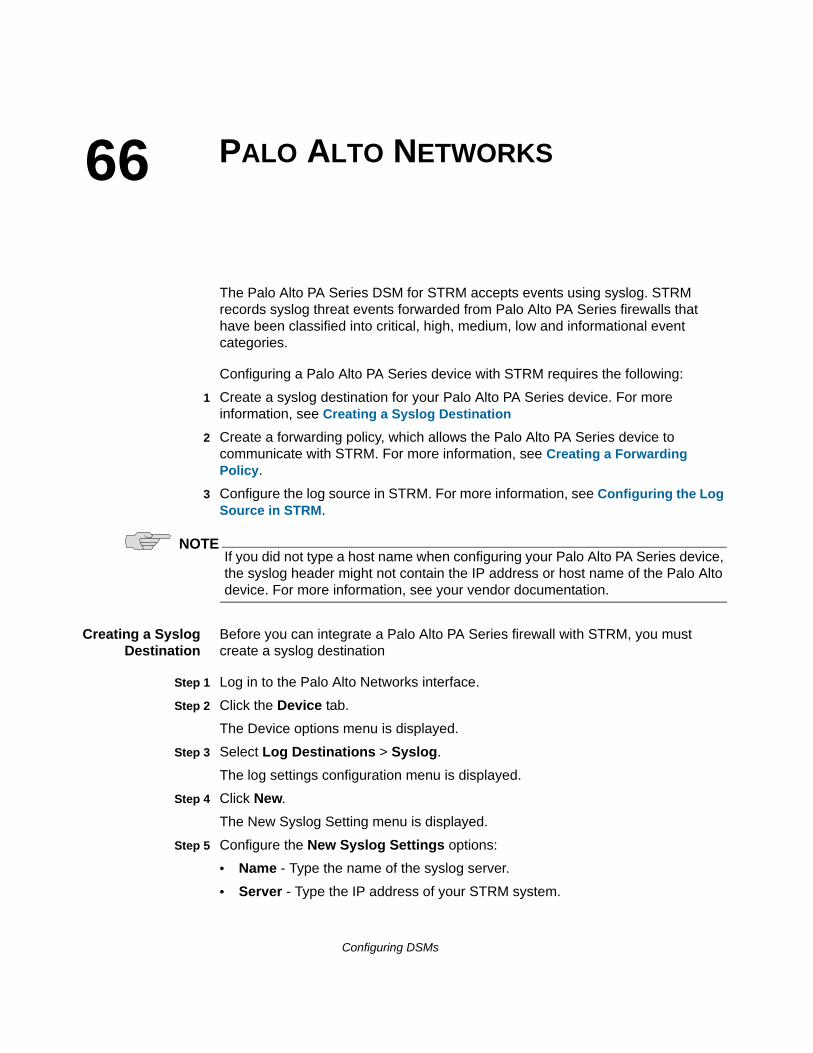
66
PALO ALTO NETWORKSThe Palo Alto PA Series DSM for STRM accepts events using syslog. STRM records syslog threat events forwarded from Palo Alto PA Series firewalls that have been classified into critical, high, medium, low and informational event categories.
Configuring a Palo Alto PA Series device with STRM requires the following:
1 Create a syslog destination for your Palo Alto PA Series device. For more information, see Creating a Syslog Destination
2 Create a forwarding policy, which allows the Palo Alto PA Series device to communicate with STRM. For more information, see Creating a Forwarding Policy.
3 Configure the log source in STRM. For more information, see Configuring the Log Source in STRM.
NOTEIf you did not type a host name when configuring your Palo Alto PA Series device, the syslog header might not contain the IP address or host name of the Palo Alto device. For more information, see your vendor documentation.
Creating a SyslogDestination
Before you can integrate a Palo Alto PA Series firewall with STRM, you must create a syslog destination
Step 1 Log in to the Palo Alto Networks interface.
Step 2 Click the Device tab.
The Device options menu is displayed.
Step 3 Select Log Destinations > Syslog.
The log settings configuration menu is displayed.
Step 4 Click New.
The New Syslog Setting menu is displayed.
Step 5 Configure the New Syslog Settings options:
• Name - Type the name of the syslog server.
• Server - Type the IP address of your STRM system.
Configuring DSMs
500 PALO ALTO NETWORKS
• Port - Type the port number the STRM system to receive syslog events. The default port number is 514.
• Facility - From the drop-down list box, select the facility level from the available options.
Step 6 Click OK.
You have now entered the syslog destination, but you must also define the severity of events that are contained in the syslog messages.
Step 7 Select Log Setting > System.
The System Log Settings window is displayed, which allow you to define the contents of the syslog messages for STRM.
Step 8 Click Edit.
Step 9 Select the check box for each event severity level you want contained in the syslog message.
Step 10 Type the name of the syslog destination you created in Step 5.
Step 11 Click OK.
This saves the candidate configuration, but you must commit your changes to the active configuration.
Step 12 Click the Device tab.
The Device options menu is displayed.
Step 13 Click Commit from the top of the page to update your Palo Alto PA Series firewall with the active configuration.
Step 14 You are now ready to create a forwarding policy to allow communications between your Palo Alto Networks device and STRM.
Creating aForwarding Policy
Network traffic between Palo Alto PA Series devices and STRM can be blocked if your STRM Console or Event Collector is in a different security zone than your Palo Alto PA Series device. A forwarding policy rule is required to forward traffic from your Palo Alto PA Series device providing events to STRM.
To create a new forwarding policy, perform the following steps:
Step 1 On your Palo Alto device dashboard, click the Policies tab.
The Policies options menu is displayed.
Step 2 Select Policies > Policy Based Forwarding.
Step 3 Click New.
Step 4 Configure the following values:
• Name
• Source Zone
• Destination Zone
• Source Address
Configuring DSMs
501
• Destination Address
• Source User
• Application
• Service
• Action
• Forwarding
• Monitoring
• Schedule
For descriptions of the policy based forwarding values, see your Palo Alto Networks Administrator’s Guide.
You are now ready to configure the log source in STRM.
Configuring the LogSource in STRM
STRM automatically discovers and creates a log source for syslog events from Palo Alto PA Series devices. If you want to manually configure a log source STRM to receive Palo Alto events, you must configure a Palo Alto PA Series log source using syslog.
To manually configure a Palo Alto PA Series log source in STRM, perform the following steps:
Step 1 Log in to STRM.
Step 2 Click the Admin tab.
Step 3 In the navigation menu, click Data Sources.
The Data Sources panel is displayed.
Step 4 Click the Log Sources icon.
The Log Sources window is displayed.
Step 5 Click Add.
The Add a log source window is displayed.
Step 6 From the Log Source Type drop-down list box, select Palo Alto PA Series.
Step 7 From the Protocol Configuration drop-down list box, select Syslog.
Step 8 Configure the following values:
For more information on configuring log sources, see the STRM Log Sources Users Guide.
The Palo Alto PA Series configuration is complete.
Table 37-1 Palo Alto PA Series Syslog Configuration
Parameter Description
Log Source Identifier Type the IP address or hostname for the log source.
Configuring DSMs

67
PROFTPdSTRM can collect events from a ProFTP server through syslog. By default, ProFTPd logs authentication related messages to the local syslog using the auth (or authpriv) facility. All other logging is done using the daemon facility. To log ProFTPd messages to STRM, use the SyslogFacility directive to change the default facility.
Before you configure STRM to integrate with a ProFTPd device, you must:
Step 1 Open the /etc/proftd.conf file.
Step 2 Below the LogFormat directives add the following:
SyslogFacility <facility>
Where <facility> is one of the following options: AUTH (or AUTHPRIV), CRON, DAEMON, KERN, LPR, MAIL, NEWS, USER, UUCP, LOCAL0, LOCAL1, LOCAL2, LOCAL3, LOCAL4, LOCAL5, LOCAL6, or LOCAL7.
Step 3 Save the file and exit.
Step 4 Open the /etc/syslog.conf file
Step 5 Add the following line at the end of the file:
<facility> @<STRM host>
Where:
<facility> matches the facility chosen in Step 2. The facility must be typed in lower case.
<STRM host> is the IP address of your STRM.
Step 6 Restart syslog and ProFTPd:
/etc/init.d/syslog restart
/etc/init.d/proftpd restart
You are now ready to configure the log source in STRM.
To configure STRM to receive events from an ProFTPd device:
From the Log Source Type list box, select the ProFTPD server option.
For more information on configuring log sources, see the STRM Log Sources Users Guide.
Configuring DSMs


68
RADWARE DEFENSEPROThe Radware DefensePro DSM for STRM accepts events using syslog. Event traps can also be mirrored to a syslog server.
Before you configure STRM to integrate with a Radware DefensePro device, you must configure your Radware DefensePro device to forward syslog events to STRM. You must configure the appropriate information using the Device > Trap and SMTP option.
Any traps generated by the Radware device are mirrored to the specified syslog server. The current Radware Syslog server enables you to define the status and the event log server address.
You can also define additional notification criteria, such as Facility and Severity, which are expressed by numerical values:
• Facility is a user-defined value indicating the type of device used by the sender. This criteria is applied when the device sends syslog messages. The default value is 21, meaning Local Use 6.
• Severity indicates the importance or impact of the reported event. The Severity is determined dynamically by the device for each message sent.
In the Security Settings window, you must enable security reporting using the connect and protect/security settings. You must enable security reports to syslog and configure the severity (syslog risk).
You are now ready to configure the log source in STRM. To configure STRM to receive events from a Radware DefensePro device:
From the Log Source Type list box, select the Radware DefensePro option.
For more information on configuring log sources and protocols, see the STRM Log Sources Users Guide. For more information about the Radware DefensePro device, see your vendor documentation.
Configuring DSMs

69
REDBACK ASEThe Redback ASE DSM for STRM accepts events using syslog. The Redback ASE device can send log messages to the Redback device console or to a log server that is integrated with STRM to generate deployment specific reports. Before configuring a Redback ASE device in STRM, you must configure your device to forward syslog events.
To configure the device to send syslog events to STRM:
Step 1 Log in to your Redback ASE device user interface.
Step 2 Start the CLI configuration mode.
Step 3 In global configuration mode, configure the default settings for the security service:
asp security default
Step 4 In ASP security default configuration mode, configure the IP address of the log server and the optional transport protocol:
log server <IP address> transport udp port 9345
Where <IP address> is the IP address of the STRM.
Step 5 Configure the IP address that you want to use as the source IP address in the log messages:
log source <source IP address>
Where <source IP address> is the IP address of the loopback interface in context local.
Step 6 Commit the transaction.
For more information about Redback ASE device configuration, see your vendor documentation.
For example, if you want to configure:
• Log source server IP address 10.172.55.55
• Default transport protocol: UDP
• Default server port: 514
The source IP address used for log messages is 10.192.22.24. This address must be an IP address of a loopback interface in context local.
Configuring DSMs
508 REDBACK ASE
asp security defaultlog server 10.172.55.55 log source 10.192.22.24
You are now ready to configure the log sources STRM.
To configure STRM to receive events from a Redback ASE device:
From the Log Source Type list box, select the Redback ASE option.
For more information on configuring log sources, see the STRM Log Sources Users Guide.
Configuring DSMs
70
RSA AUTHENTICATION MANAGERAn RSA Authentication Manager DSM allows you to integrate STRM with an RSA Authentication Manager using syslog, or using the log file protocol. Before you configure STRM to integrate with RSA Authentication Manager, select your configuration preference:
• Configuring RSA Using Syslog
• Configuring RSA Using the Log File Protocol
NOTEYou must apply the most recent hot fix on RSA Authentication Manager 7.1 primary, replica, node, database and radius installations before configuring syslog.
Configuring RSA Using Syslog
The procedure to configure your RSA Authentication Manager using syslog depends on the operating system version for your RSA Authentication Manager or SecureID 3.0 appliance:
• If you are using RSA Authentication Manager on Linux, see Configuring Syslog on RSA Authentication Manager for Linux.
• If you are using RSA Authentication Manager on Windows, see Configuring Syslog on RSA Authentication Manager for Windows.
Configuring Syslogon RSA
AuthenticationManager for Linux
To configure RSA Authentication Manager for syslog:
Step 1 Log in to the RSA Security Console command-line interface (CLI).
Step 2 Open the following file for editing based on your operating system:
/usr/local/RSASecurity/RSAAuthenticationManager/utils/resources/ims.properties
Step 3 Add the following enteries to the ims.properties file:
ims.logging.audit.admin.syslog_host = <IP address>ims.logging.audit.admin.use_os_logger = trueims.logging.audit.runtime.syslog_host = <IP address>
Configuring DSMs
510 RSA AUTHENTICATION MANAGER
ims.logging.audit.runtime.use_os_logger = trueims.logging.system.syslog_host = <IP address>ims.logging.system.use_os_logger = true
Where <IP address> is the IP address or hostname of STRM.
Step 4 Save the ims.properties files.
Step 5 Open the following file for editing:
/etc/syslog.conf
Step 6 Type the following command to add STRM as a syslog entry:
*.* @<IP address>
Where <IP address> is the IP address or hostname of STRM.
Step 7 Type the following command to restart the syslog services for Linux.
service syslog restart
You are now ready to configure the log sources and protocol in STRM: To configure STRM to receive events from your RSA Authentication Manager:
From the Log Source Type list box, select the RSA Authentication Manager option.
For more information, see the STRM Log Sources Users Guide. For more information on configuring syslog forwarding, see your RSA Authentication Manager documentation.
Configuring Syslogon RSA
AuthenticationManager for
Windows
To configure RSA Authentication Manager for syslog using Microsoft Windows:
Step 1 Log in to the system hosting your RSA Security Console.
Step 2 Open the following file for editing based on your operating system:
/Program Files/RSASecurity/RSAAuthenticationManager/utils/resources/ims.properties
Step 3 Add the following enteries to the ims.properties file:
ims.logging.audit.admin.syslog_host = <IP address>ims.logging.audit.admin.use_os_logger = trueims.logging.audit.runtime.syslog_host = <IP address>ims.logging.audit.runtime.use_os_logger = trueims.logging.system.syslog_host = <IP address>ims.logging.system.use_os_logger = true
Where <IP address> is the IP address or hostname of STRM.
Configuring DSMs
Configuring RSA Using the Log File Protocol 511
Step 4 Save the ims.properties files.
Step 5 Restart RSA services.
You are now ready to configure the log source in STRM.
To configure STRM to receive events from your RSA Authentication Manager:
From the Log Source Type list box, select the RSA Authentication Manager option.
For more information, see the STRM Log Sources Users Guide. For more information on configuring syslog forwarding, see your RSA Authentication Manager documentation.
Configuring RSA Using the Log File Protocol
The log file protocol allows STRM to retrieve archived log files from a remote host. The RSA Authentication Manager DSM supports the bulk loading of log files using the log file protocol source.
The procedure to configure your RSA Authentication Manager using the log file protocol depends on the version of RSA Authentication Manager:
• If you are using RSA Authentication Manager v7.x, see Configuring RSA Authentication Manager 7.x.
• If you are using RSA Authentication Manager v6.x, see Configuring RSA Authentication Manager 6.x.
Configuring RSA Authentication Manager 7.x
To configure your RSA Authentication Manager v7.x device:
Step 1 Log in to the RSA Security Console.
Step 2 Click Administration > Log Management > Recurring Log Archive Jobs.
Step 3 In the Schedule section, configure values for the Job Starts, Frequency, Run Time, and Job Expires parameters.
Step 4 For the Operations field, select Export Only or Export and Purge for the following settings: Administration Log Settings, Runtime Log Settings, and System Log Settings.
NOTEThe Export and Purge operation exports log records from the database to the archive and then purges the logs form the database. The Export Only operation exports log records from the database to the archive and the records remain in the database.
Configuring DSMs
512 RSA AUTHENTICATION MANAGER
Step 5 For Administration, Runtime, and System, configure an Export Directory to which you want to export your archive files.
We recommend you make sure you can access the Administration Log, Runtime Log, and System Log using FTP before you continue.
Step 6 For Administration, Runtime, and System parameters, set the Days Kept Online parameter to 1. Logs older than 1 day are exported. If you selected Export and Purge, the logs are also purged from the database.
Step 7 Click Save.
You are now ready to configure the log sources and protocol within STRM:
Step 1 To configure STRM to receive events from a RSA device, you must select the RSA Authentication Manager option from the Log Source Type list box.
Step 2 To configure the log file protocol, you must select the Log File option from the Protocol Configuration list box.
For more information on configuring log sources and protocols, see the STRM Log Sources Users Guide.
Configuring RSA Authentication Manager 6.x
To configure your RSA Authentication Manager v6.x device:
Step 1 Log in to the RSA Security Console.
Step 2 Log in to the RSA Database Administration tool:
a Click the Advanced tool.
The system prompts you to login again.
b Click Database Administration.
For complete information on using SecurID, see your vendor documentation.
Step 3 From the Log list box, select Automate Log Maintenance.
The Automatic Log Maintenance window is displayed.
Step 4 Select the Enable Automatic Audit Log Maintenance check box.
Step 5 Select Delete and Archive.
Step 6 Select Replace files.
Step 7 Type an archive filename.
Step 8 In the Cycle Through Version(s) field, type a value.
For example, 1.
Step 9 Select Select all Logs.
Step 10 Select a frequency.
Step 11 Click OK.
Configuring DSMs
Configuring RSA Using the Log File Protocol 513
You are now ready to configure the log sources and protocol in STRM:
Step 1 To configure STRM to receive events from a RSA device, you must select the RSA Authentication Manager option from the Log Source Type list box.
Step 2 To configure the log file protocol, you must select the Log File option from the Protocol Configuration list box.
For more information on configuring log sources and protocols, see the STRM Log Sources Users Guide.
Configuring DSMs

514 RSA AUTHENTICATION MANAGER
Configuring DSMs
71
SAMHAIN LABSThe Samhain Labs Host-Based Intrusion Detection System (HIDS) monitors changes to files on the system. The Samhain HIDS DSM for STRM supports Samhain version 2.4 when used for File Integrity Monitoring (FIM).
You can configure the Samhain HIDS DSM to accept one of the following log types:
• Using Syslog
• Using JDBC
Using Syslog Before you configure STRM to integrate with Samhain HIDS using syslog, you must configure the Samhain HIDS system to forward logs to your STRM system.
NOTEThe following procedure is based on the default samhainrc file. If the samhainrc file has been modified, some values might be different, such as syslog facility,
To configure Samhain HIDS to forward logs using syslog to STRM:
Step 1 Log in to Samhain HIDS from the command-line interface.
Step 2 Open the following file:
/etc/samhainrc
Step 3 Remove the comment marker (#) from the following line:
SetLogServer=info
Step 4 Save and exit the file.
Alerts are sent to the local system using syslog.
Step 5 Open the following file:
/etc/syslog.conf
Step 6 Add the following line:
local2.* @<IP Address>
Where <IP Address> is the IP address of your STRM.
Step 7 Save and exit the file.
Configuring DSMs
516 SAMHAIN LABS
Step 8 Restart syslog:
/etc/init.d/syslog restart
Samhain sends logs using syslog to STRM. You are now ready to configure Samhain HIDS DSM in STRM.
To configure STRM to receive events from Samhain:
From the Log Source Type list box, select the Samhain HIDS option.
For more information on configuring log sources, see the STRM Log Sources Users Guide.
Using JDBC You can configure Samhain HIDS to send log alerts to a database. Oracle, PostgreSQL, and MySQL are natively supported by Samhain. You can also configure STRM to collect events from these databases using the JDBC protocol.
NOTESTRM Maintenance Release 3 and above do not include a MySQL driver for JDBC. If you are using a DSM or protocol that requires a MySQL JDBC driver, you must download and install the platform independent MySQL Connector/J from http://dev.mysql.com/downloads/connector/j/. For instruction on installing MySQL Connector/J for the JDBC protocol, see the STRM Log Sources Users Guide.
To configure STRM to access the Samhain HIDS database using the JDBC protocol:
Step 1 Log into STRM.
Step 2 Click the Admin tab.
Step 3 On the navigation menu, click Data Sources.
The Data Sources panel is displayed.
Step 4 Click the Log Sources icon.
The Log Sources window is displayed.
Step 5 Click Add.
The Add a log source window is displayed.
Step 6 From the Log Source Type list box, select the Samhain HIDS option.
Step 7 Using the Protocol Configuration list box, select JDBC.
The JDBC protocol configuration is displayed.
Step 8 Update the JDBC configuration to include the following values:
a Database Type: <Samhain Database Type>
b Database Name: <Samhain SetDBName>
c Table Name: <Samhain SetDBTable>
Configuring DSMs
Using JDBC 517
d Select List: *
e Compare Field: log_index
f IP or Hostname: <Samhain SetDBHost>
g Port: <Default Port>
h Username: <Samhain SetDBUser>
i Password: <Samhain SetDBPassword>
j Polling Interval: <Default Interval>
Where:
<Samhain Database Type> is the database type used by Samhain (see your Samhain system administrator).
<Samhain SetDBName> is the database name specified in the samhainrc file.
<Samhain SetDBTable> is the database table specified in the samhainrc file.
<Samhain SetDBHost> is the database host specified in the samhainrc file.
<Samhain SetDBUser> is the database user specified in the samhainrc file.
<Samhain SetDBPassword> is the database password specified in the samhainrc file.
You are now ready to configure the log source in STRM.
To configure STRM to receive events from Samhain:
From the Log Source Type list box, select the Samhain HIDS option.
For more information on configuring log sources, see the STRM Log Sources Users Guide. For more information about Samhain, see http://www.la-samhna.de/samhain/manual.
Configuring DSMs

72
SENTRIGO HEDGEHOGYou can integrate a Sentrigo Hedgehog device with STRM. A Sentrigo Hedgehog device accepts LEEF events using syslog. Before you configure STRM to integrate with a Sentrigo Hedgehog device, you must:
Step 1 Log in to the Sentrigo Hedgehog command-line interface (CLI).
Step 2 Open the following file for editing:
<Installation directory>/conf/sentrigo-custom.properties
Where <Installation directory> is the directory containing your Sentrigo Hedgehog installation.
Step 3 Add the following log.format entries to the custom properties file:
NOTEDepending on your Sentrigo Hedgehog configuration or installation, you might be required to replace or overwrite the existing log.format entry.
sentrigo.comm.ListenAddress=1996log.format.body.custom=usrName=$osUser:20$|duser=$execUser:20$|severity=$severity$|identHostName=$sourceHost$|src=$sourceIP$|dst=$agent.ip$|devTime=$logonTime$|devTimeFormat=EEE MMM dd HH:mm:ss z yyyy|cmdType=$cmdType$|externalId=$id$|execTime=$executionTime.time$|dstServiceName=$database.name:20$|srcHost=$sourceHost:30$|execProgram=$execProgram:20$|cmdType=$cmdType:15$|oper=$operation:225$|accessedObj=$accessedObjects.name:200$
log.format.header.custom=LEEF:1.0|Sentrigo|Hedgehog|$serverVersion$|$rules.name:150$|log.format.header.escaping.custom=\\|log.format.header.seperator.custom=,log.format.header.escape.char.custom=\\log.format.body.escaping.custom=\=log.format.body.escape.char.custom=\\log.format.body.seperator.custom=|log.format.empty.value.custom=NULLlog.format.length.value.custom=10000log.format.convert.newline.custom=true
Step 4 Save the custom properties file.
Configuring DSMs
520 SENTRIGO HEDGEHOG
Step 5 Stop and restart your Sentrigo Hedgehog service to implement the log.format changes.
You are now ready to configure the log source in STRM.
To configure STRM to receive events from a Sentrigo Hedgehog device:
From the Log Source Type list box, select the Sentrigo Hedgehog option.
For more information on configuring log sources, see the STRM Log Sources Users Guide. For more information about Sentrigo Hedgehog see your vendor documentation.
Configuring DSMs
73
SECURE COMPUTING SIDEWINDERThe Sidewinder DSM for STRM accepts Sidewinder events using syslog. STRM records and processes all Sidewinder events. Before you configure STRM to integrate with a Sidewinder device, you must configure syslog within your Sidewinder device. When configuring the Sidewinder device to forward syslog to STRM, make sure that the logs are exported in Sidewinder Export format (SEF).
For more information on configuring Sidewinder, see your vendor documentation.
After you configure syslog to forward events to STRM, you are ready to configure the log source in STRM.
To configure STRM to receive events from a Sidewinder device:
From the Log Source Type list box, select Sidewinder G2 Security Appliance option.
For more information on configuring log sources, see the STRM Log Sources Users Guide.
Configuring DSMs

74
SOLARWINDS ORIONThe SolarWinds Orion DSM for STRM supports SNMPv2 and SNMPv3 configured alerts from the SolarWinds Alert Manager. The events are sent to STRM using syslog. Before you can integrate STRM, you must configure the SolarWinds Alert Manager to create SNMP traps and forward syslog events.
To configure SNMP traps in the SolarWinds Orion Alert Manager:
Step 1 Select Start > All Programs > SolarWinds Orion > Alerting, Reporting, and Mapping > Advanced Alert Manager.
The Alert Manager Quick Start is displayed.
Step 2 Click Configure Alerts.
The Manage Alerts window is displayed.
Step 3 Select an existing alert and click Edit.
Step 4 Select the Triggered Actions tab.
Step 5 Click Add New Action.
The Select an Action window is displayed.
Step 6 Select Send an SNMP Trap and click OK.
Step 7 Configure the following values:
a SNMP Trap Definitions - Type the IP address of the STRM Console or Event Collector.
b Trap Template - Select ForwardSyslog.
c SNMP Version - Select the SNMP Version to use to forward the event. STRM supports SNMPv2c or SNMPv3.
- SNMPv2c - Type the SNMP Community String to use for SNMPv2c authentication. The default Community String value is public.
- SNMPv3 - Type the Username and select the Authentication Method to use for SNMPv3.
STRM supports MD5 or SH1 as methods of authentication and DES56 or AES128 bit encryption.
Configuring DSMs
524 SOLARWINDS ORION
Step 8 Click OK to save the SNMP trigger action.
The Manage Alerts window is displayed.
NOTETo verify that your SNMP trap is configured properly, select an alert you’ve edited and click Test. The action should trigger and forward the syslog event to STRM.
Step 9 Repeat Step 3 to Step 8 to configure the Alert Manager with all of the SNMP trap alerts you want to monitor in STRM.
You are now ready to configure the log source in STRM.
STRM automatically detects syslog events from properly configured SNMP trap alert triggers. However, if you want to manually configure STRM to receive events from SolarWinds Orion:
From the Log Source Type list box, select SolarWinds Orion.
For more information on configuring log sources, see the STRM Log Sources Users Guide.
Configuring DSMs
75
SONICWALLThe SonicWALL SonicOS DSM accepts events using syslog. STRM records all relevant syslog events forwarded from SonicWALL appliances using SonicOS firmware. Before you can integrate with a SonicWALL SonicOS device, you must configure syslog forwarding on your SonicWALL SonicOS appliance.
This section includes the following topics:
• Configuring SonicWALL to Forward Syslog Events
• Configuring a Log Source in STRM
ConfiguringSonicWALL to
Forward SyslogEvents
SonicWALL captures all SonicOS event activity. The events can be forwarded to STRM using SonicWALL’s default event format.
To configure SonicWALL to forward syslog events:
Step 1 Log in to your SonicWALL web interface.
Step 2 From the navigation menu, select Log > Automation.
The Automation window is displayed.
Step 3 From the Syslog Servers pane, click Add.
The Add Syslog Server window is displayed.
Step 4 In the Name or IP Address field, type the IP address of your STRM Console or Event Collector.
Step 5 In the Port field, type 514.
SonicWALL syslog forwarders send events to STRM using UDP port 514.
Step 6 Click OK.
The Automation window is displayed.
Step 7 From the Syslog Format list box, select Default.
Step 8 Click Apply.
Syslog events are forwarded to STRM. SonicWALL events forwarded to STRM are automatically discovered and log sources are created automatically. For more information on configuring your SonicWALL appliance or for information on specific events, see your vendor documentation.
Configuring DSMs
526 SONICWALL
Configuring a LogSource in STRM
STRM automatically discovers and creates a log source for syslog events from SonicWALL appliances. However, you can manually create a log source for STRM to receive syslog events. The configuration steps for creating a log source are optional.
To manually configure a log source for SonicWALL syslog events:
Step 1 Log in to STRM.
Step 2 Click the Admin tab.
Step 3 On the navigation menu, click Data Sources.
The Data Sources panel is displayed.
Step 4 Click the Log Sources icon.
The Log Sources window is displayed.
Step 5 Click Add.
The Add a log source window is displayed.
Step 6 In the Log Source Name field, type a name for your log source.
Step 7 In the Log Source Description field, type a description for the log source.
Step 8 From the Log Source Type list box, select SonicWALL SonicOS.
Step 9 Using the Protocol Configuration list box, select Syslog.
The syslog protocol configuration is displayed.
Step 10 Configure the following values:
Step 11 Click Save.
Step 12 On the Admin tab, click Deploy Changes.
The log source is added to STRM. Events forwarded to STRM by SonicWALL SonicOS appliances are displayed on the Log Activity tab. For more information, see the STRM Users Guide.
Table 46-1 Syslog Parameters
Parameter Description
Log Source Identifier Type the IP address or hostname for the log source as an identifier for events from SonicWALL appliances.
Each log source you create for your SonicWALL SonicOS appliance should include a unique identifier, such as an IP address or host name.
Configuring DSMs
76
SOPHOSThis section provides information on the following:
• Sophos Enterprise Console
• Sophos PureMessage
• Sophos Astaro Security Gateway
• Sophos Web Security Appliance
Sophos Enterprise Console
STRM has two options for gathering events from a Sophos Enterprise Console using JDBC. Select the method that best applies to your Sophos Enterprise Console installation:
• Configure STRM Using the Sophos Enterprise Console Protocol
• Configure STRM Using the JDBC Protocol
NOTETo use the Sophos Enterprise Console protocol, you must ensure that the Sophos Reporting Interface is installed with your Sophos Enterprise Console. If you do not have the Sophos Reporting Interface, you must configure STRM using the JDBC protocol. For information on installing the Sophos Reporting Interface, see your Sophos Enterprise Console documentation.
Configure STRMUsing the Sophos
Enterprise ConsoleProtocol
The Sophos Enterprise Console DSM for STRM accepts events using Java Database Connectivity (JDBC). The Sophos Enterprise Console DSM works in coordination with the Sophos Enterprise Console protocol to combine payload information from anti-virus, application control, device control, data control, tamper protection, and firewall logs in the vEventsCommonData table and provide these events to STRM. You must install the Sophos Enterprise Console protocol before configuring STRM.
Configure STRM to Receive Events
To configure STRM to access the Sophos database using the JDBC protocol:
Step 1 Log in to STRM.
Step 2 Click the Admin tab.
Configuring DSMs
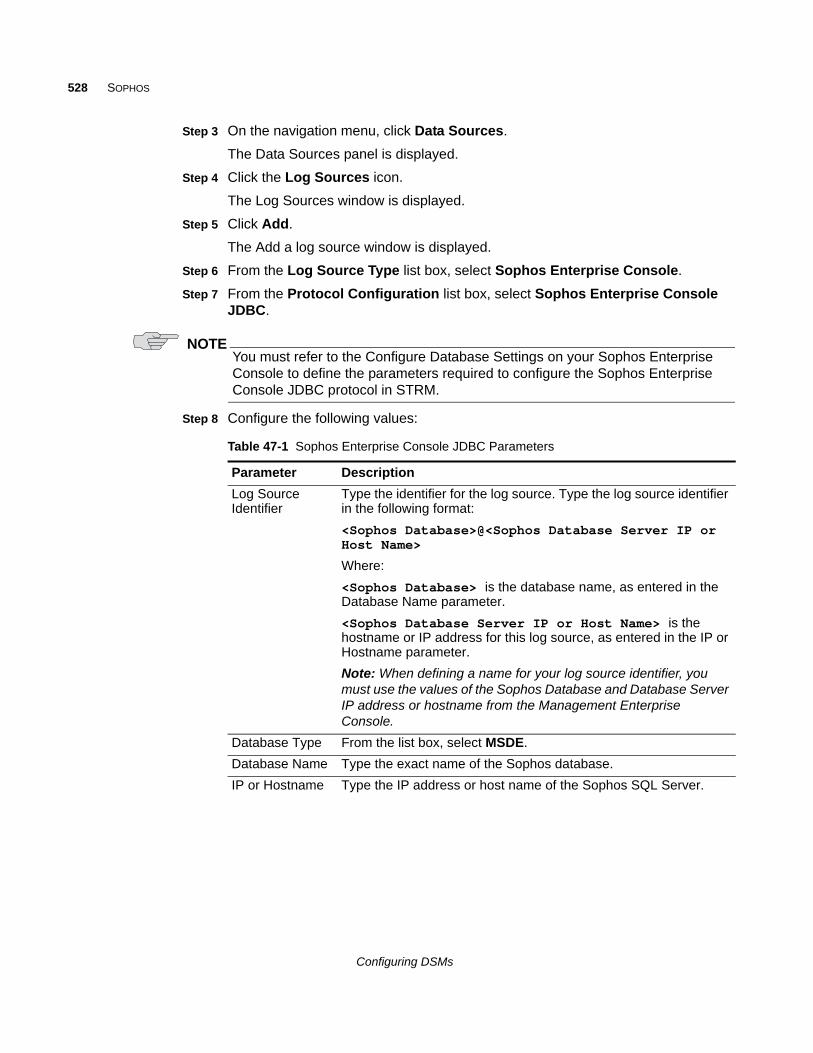
528 SOPHOS
Step 3 On the navigation menu, click Data Sources.
The Data Sources panel is displayed.
Step 4 Click the Log Sources icon.
The Log Sources window is displayed.
Step 5 Click Add.
The Add a log source window is displayed.
Step 6 From the Log Source Type list box, select Sophos Enterprise Console.
Step 7 From the Protocol Configuration list box, select Sophos Enterprise Console JDBC.
NOTEYou must refer to the Configure Database Settings on your Sophos Enterprise Console to define the parameters required to configure the Sophos Enterprise Console JDBC protocol in STRM.
Step 8 Configure the following values:
Table 47-1 Sophos Enterprise Console JDBC Parameters
Parameter Description
Log Source Identifier
Type the identifier for the log source. Type the log source identifier in the following format:
<Sophos Database>@<Sophos Database Server IP or Host Name>
Where:
<Sophos Database> is the database name, as entered in the Database Name parameter.
<Sophos Database Server IP or Host Name> is the hostname or IP address for this log source, as entered in the IP or Hostname parameter.
Note: When defining a name for your log source identifier, you must use the values of the Sophos Database and Database Server IP address or hostname from the Management Enterprise Console.
Database Type From the list box, select MSDE.
Database Name Type the exact name of the Sophos database.
IP or Hostname Type the IP address or host name of the Sophos SQL Server.
Configuring DSMs
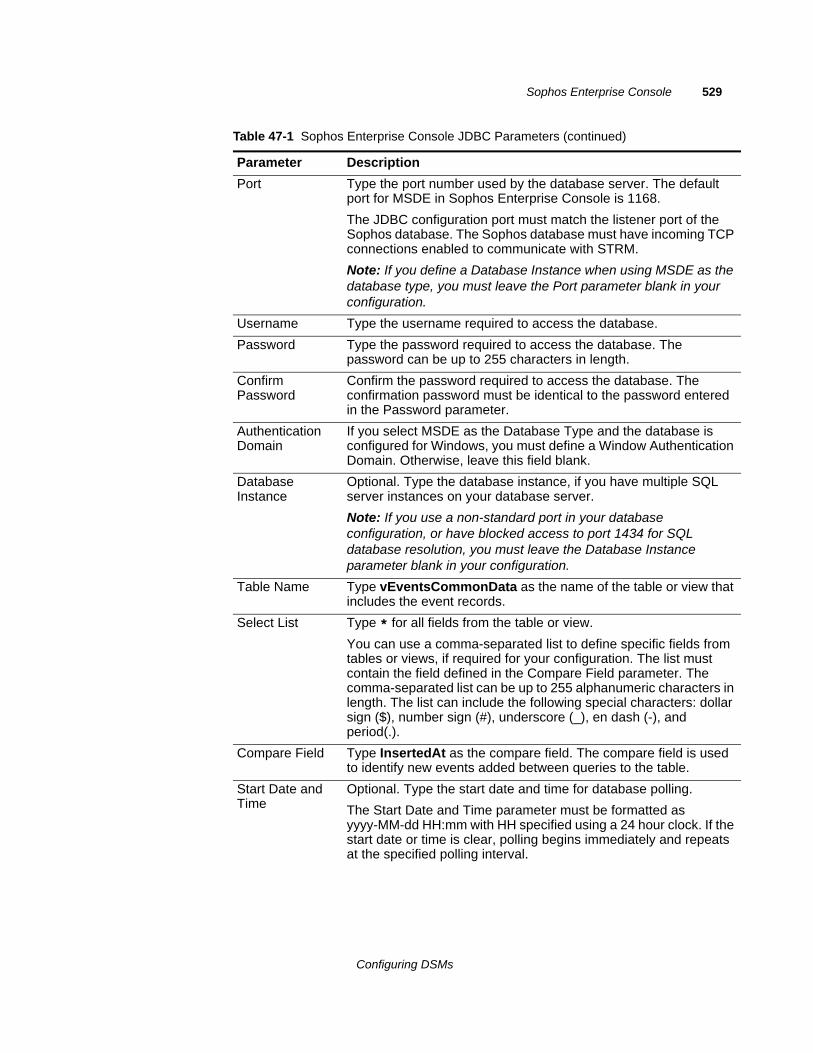
Sophos Enterprise Console 529
Port Type the port number used by the database server. The default port for MSDE in Sophos Enterprise Console is 1168.
The JDBC configuration port must match the listener port of the Sophos database. The Sophos database must have incoming TCP connections enabled to communicate with STRM.
Note: If you define a Database Instance when using MSDE as the database type, you must leave the Port parameter blank in your configuration.
Username Type the username required to access the database.
Password Type the password required to access the database. The password can be up to 255 characters in length.
Confirm Password
Confirm the password required to access the database. The confirmation password must be identical to the password entered in the Password parameter.
Authentication Domain
If you select MSDE as the Database Type and the database is configured for Windows, you must define a Window Authentication Domain. Otherwise, leave this field blank.
Database Instance
Optional. Type the database instance, if you have multiple SQL server instances on your database server.
Note: If you use a non-standard port in your database configuration, or have blocked access to port 1434 for SQL database resolution, you must leave the Database Instance parameter blank in your configuration.
Table Name Type vEventsCommonData as the name of the table or view that includes the event records.
Select List Type * for all fields from the table or view.
You can use a comma-separated list to define specific fields from tables or views, if required for your configuration. The list must contain the field defined in the Compare Field parameter. The comma-separated list can be up to 255 alphanumeric characters in length. The list can include the following special characters: dollar sign ($), number sign (#), underscore (_), en dash (-), and period(.).
Compare Field Type InsertedAt as the compare field. The compare field is used to identify new events added between queries to the table.
Start Date and Time
Optional. Type the start date and time for database polling.
The Start Date and Time parameter must be formatted as yyyy-MM-dd HH:mm with HH specified using a 24 hour clock. If the start date or time is clear, polling begins immediately and repeats at the specified polling interval.
Table 47-1 Sophos Enterprise Console JDBC Parameters (continued)
Parameter Description
Configuring DSMs
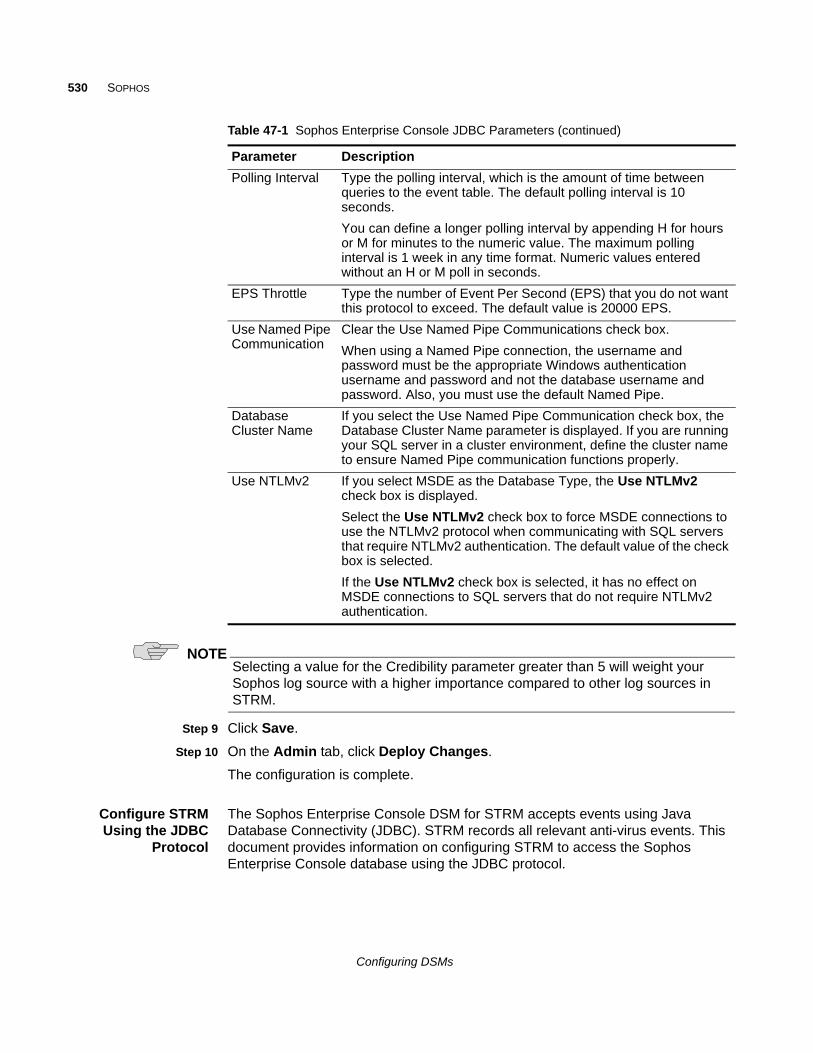
530 SOPHOS
NOTESelecting a value for the Credibility parameter greater than 5 will weight your Sophos log source with a higher importance compared to other log sources in STRM.
Step 9 Click Save.
Step 10 On the Admin tab, click Deploy Changes.
The configuration is complete.
Configure STRMUsing the JDBC
Protocol
The Sophos Enterprise Console DSM for STRM accepts events using Java Database Connectivity (JDBC). STRM records all relevant anti-virus events. This document provides information on configuring STRM to access the Sophos Enterprise Console database using the JDBC protocol.
Polling Interval Type the polling interval, which is the amount of time between queries to the event table. The default polling interval is 10 seconds.
You can define a longer polling interval by appending H for hours or M for minutes to the numeric value. The maximum polling interval is 1 week in any time format. Numeric values entered without an H or M poll in seconds.
EPS Throttle Type the number of Event Per Second (EPS) that you do not want this protocol to exceed. The default value is 20000 EPS.
Use Named Pipe Communication
Clear the Use Named Pipe Communications check box.
When using a Named Pipe connection, the username and password must be the appropriate Windows authentication username and password and not the database username and password. Also, you must use the default Named Pipe.
Database Cluster Name
If you select the Use Named Pipe Communication check box, the Database Cluster Name parameter is displayed. If you are running your SQL server in a cluster environment, define the cluster name to ensure Named Pipe communication functions properly.
Use NTLMv2 If you select MSDE as the Database Type, the Use NTLMv2 check box is displayed.
Select the Use NTLMv2 check box to force MSDE connections to use the NTLMv2 protocol when communicating with SQL servers that require NTLMv2 authentication. The default value of the check box is selected.
If the Use NTLMv2 check box is selected, it has no effect on MSDE connections to SQL servers that do not require NTLMv2 authentication.
Table 47-1 Sophos Enterprise Console JDBC Parameters (continued)
Parameter Description
Configuring DSMs
Sophos Enterprise Console 531
To integrate STRM with Sophos Enterprise Console:
Step 1 Log in to your Sophos Enterprise Console device command-line interface (CLI).
Step 2 Type the following command to create a custom view in your Sophos database to support STRM:
CREATE VIEW threats_view AS SELECT t.ThreatInstanceID, t.ThreatType, t.FirstDetectedAt, c.Name, c.LastLoggedOnUser, c.IPAddress, c.DomainName, c.OperatingSystem, c.ServicePack, t.ThreatSubType, t.Priority, t.ThreatLocalID, t.ThreatLocalIDSource, t.ThreatName, t.FullFilePathCheckSum, t.FullFilePath, t.FileNameOffset, t.FileVersion, t.CheckSum, t.ActionSubmittedAt, t.DealtWithAt, t.CleanUpable, t.IsFragment, t.IsRebootRequired, t.Outstanding, t.Status, InsertedAt FROM <Database Name>.dbo.ThreatInstancesAll t, <Database Name>.dbo.Computers c WHERE t.ComputerID = c.ID;
Where <Database Name> is the name of the Sophos database.
NOTEThe database name must not contain any spaces.
After you have created your custom view, you must configure STRM to receive event information using the JDBC protocol.
To configure the Sophos Enterprise Console DSM with STRM, see Configure STRM to Receive Events.
Configure STRM toReceive Events
To configure STRM to access the Sophos database using the JDBC protocol:
Step 1 Log in to STRM.
Step 2 Click the Admin tab.
Step 3 On the navigation menu, click Data Sources.
The Data Sources panel is displayed.
Step 4 Click the Log Sources icon.
The Log Sources window is displayed.
Step 5 Click Add.
The Add a log source window is displayed.
Step 6 Using the Log Source Type list box, select Sophos Enterprise Console.
Step 7 Using the Protocol Configuration list box, select JDBC.
NOTEYou must refer to the Configure Database Settings on your Sophos Enterprise Console to define the parameters required to configure the Sophos Enterprise Console DSM in STRM.
Configuring DSMs
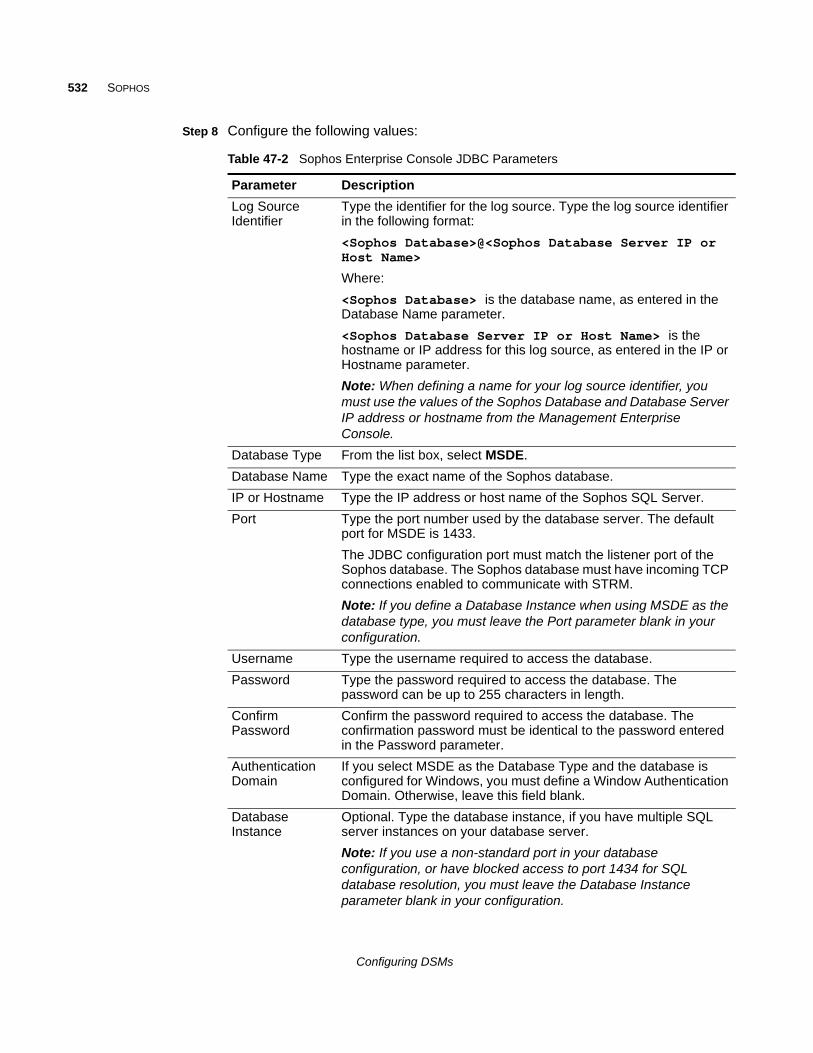
532 SOPHOS
Step 8 Configure the following values:
Table 47-2 Sophos Enterprise Console JDBC Parameters
Parameter Description
Log Source Identifier
Type the identifier for the log source. Type the log source identifier in the following format:
<Sophos Database>@<Sophos Database Server IP or Host Name>
Where:
<Sophos Database> is the database name, as entered in the Database Name parameter.
<Sophos Database Server IP or Host Name> is the hostname or IP address for this log source, as entered in the IP or Hostname parameter.
Note: When defining a name for your log source identifier, you must use the values of the Sophos Database and Database Server IP address or hostname from the Management Enterprise Console.
Database Type From the list box, select MSDE.
Database Name Type the exact name of the Sophos database.
IP or Hostname Type the IP address or host name of the Sophos SQL Server.
Port Type the port number used by the database server. The default port for MSDE is 1433.
The JDBC configuration port must match the listener port of the Sophos database. The Sophos database must have incoming TCP connections enabled to communicate with STRM.
Note: If you define a Database Instance when using MSDE as the database type, you must leave the Port parameter blank in your configuration.
Username Type the username required to access the database.
Password Type the password required to access the database. The password can be up to 255 characters in length.
Confirm Password
Confirm the password required to access the database. The confirmation password must be identical to the password entered in the Password parameter.
Authentication Domain
If you select MSDE as the Database Type and the database is configured for Windows, you must define a Window Authentication Domain. Otherwise, leave this field blank.
Database Instance
Optional. Type the database instance, if you have multiple SQL server instances on your database server.
Note: If you use a non-standard port in your database configuration, or have blocked access to port 1434 for SQL database resolution, you must leave the Database Instance parameter blank in your configuration.
Configuring DSMs
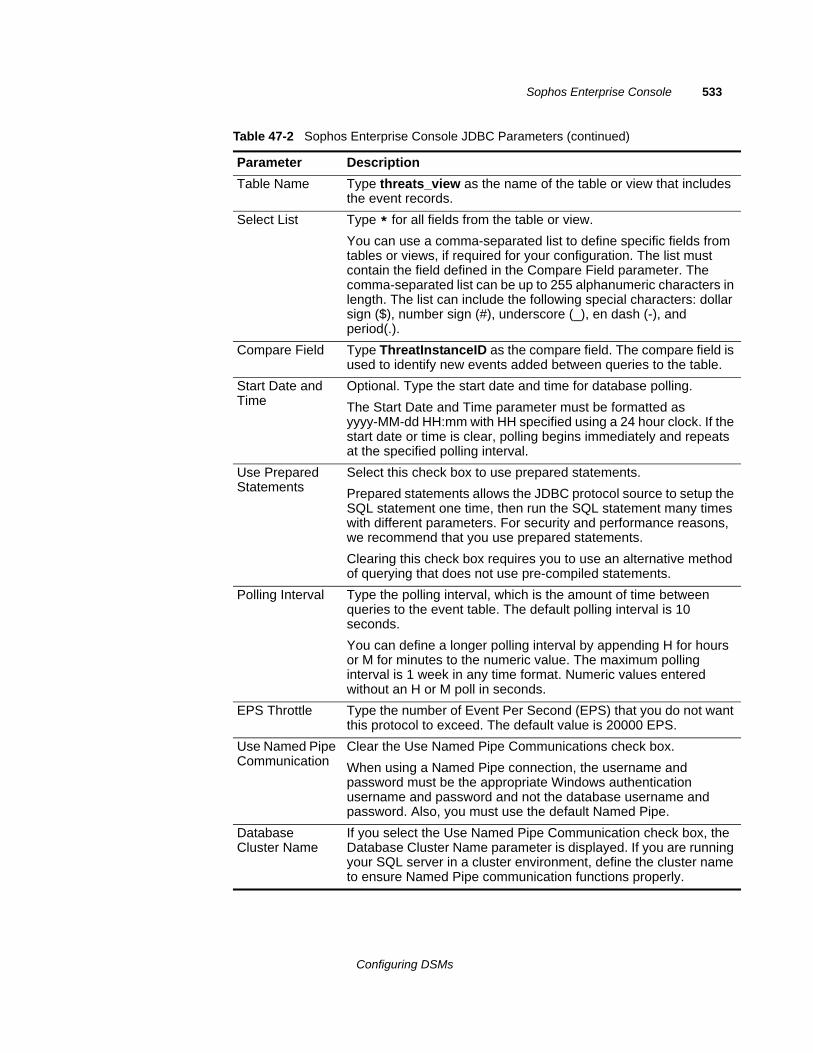
Sophos Enterprise Console 533
Table Name Type threats_view as the name of the table or view that includes the event records.
Select List Type * for all fields from the table or view.
You can use a comma-separated list to define specific fields from tables or views, if required for your configuration. The list must contain the field defined in the Compare Field parameter. The comma-separated list can be up to 255 alphanumeric characters in length. The list can include the following special characters: dollar sign ($), number sign (#), underscore (_), en dash (-), and period(.).
Compare Field Type ThreatInstanceID as the compare field. The compare field is used to identify new events added between queries to the table.
Start Date and Time
Optional. Type the start date and time for database polling.
The Start Date and Time parameter must be formatted as yyyy-MM-dd HH:mm with HH specified using a 24 hour clock. If the start date or time is clear, polling begins immediately and repeats at the specified polling interval.
Use Prepared Statements
Select this check box to use prepared statements.
Prepared statements allows the JDBC protocol source to setup the SQL statement one time, then run the SQL statement many times with different parameters. For security and performance reasons, we recommend that you use prepared statements.
Clearing this check box requires you to use an alternative method of querying that does not use pre-compiled statements.
Polling Interval Type the polling interval, which is the amount of time between queries to the event table. The default polling interval is 10 seconds.
You can define a longer polling interval by appending H for hours or M for minutes to the numeric value. The maximum polling interval is 1 week in any time format. Numeric values entered without an H or M poll in seconds.
EPS Throttle Type the number of Event Per Second (EPS) that you do not want this protocol to exceed. The default value is 20000 EPS.
Use Named Pipe Communication
Clear the Use Named Pipe Communications check box.
When using a Named Pipe connection, the username and password must be the appropriate Windows authentication username and password and not the database username and password. Also, you must use the default Named Pipe.
Database Cluster Name
If you select the Use Named Pipe Communication check box, the Database Cluster Name parameter is displayed. If you are running your SQL server in a cluster environment, define the cluster name to ensure Named Pipe communication functions properly.
Table 47-2 Sophos Enterprise Console JDBC Parameters (continued)
Parameter Description
Configuring DSMs
534 SOPHOS
NOTESelecting a value for the Credibility parameter greater than 5 will weight your Sophos log source with a higher importance compared to other log sources in STRM.
Step 9 Click Save.
Step 10 On the Admin tab, click Deploy Changes.
The configuration is complete.
For more information on configuring log sources, see the STRM Log Sources Users Guide.
Sophos PureMessage
The Sophos PureMessage DSM for STRM accepts events using Java Database Connectivity (JDBC). STRM records all relevant quarantined email events. This document provides information on configuring STRM to access the Sophos PureMessage database using the JDBC protocol.
STRM supports the following Sophos PureMessage versions:
• Sophos PureMessage for Microsoft Exchange - Stores events in a Microsoft SQL Server database specified as savexquar.
• Sophos PureMessage for Linux - Stores events in a PostgreSQL database specified as pmx_quarantine.
This section provides information on the following:
• Integrating STRM with Sophos PureMessage for Microsoft Exchange
• Integrating STRM with Sophos PureMessage for Linux
Integrating STRMwith Sophos
PureMessage forMicrosoft Exchange
To integrate STRM with Sophos PureMessage for Microsoft Exchange:
Step 1 Log in to the Microsoft SQL Server command-line interface (CLI):
osql -E -S localhost\sophos
Step 2 Type which database you want to integrate with STRM:
use savexquar;go
Step 3 Type the following command to create a SIEM view in your Sophos database to support STRM:
create view siem_view as select 'Windows PureMessage' as application, id, reason, timecreated, emailonly as sender, filesize, subject, messageid, filename from dbo.quaritems, dbo.quaraddresses where ItemID = ID and Field = 76;Go
Configuring DSMs
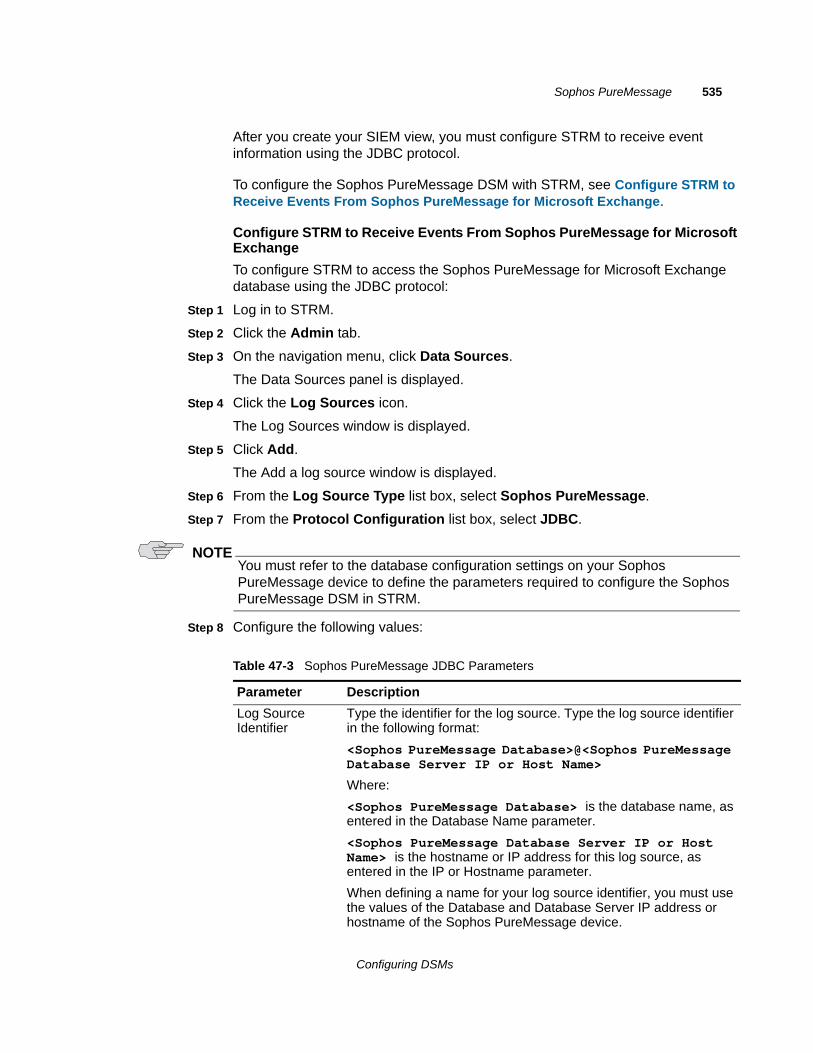
Sophos PureMessage 535
After you create your SIEM view, you must configure STRM to receive event information using the JDBC protocol.
To configure the Sophos PureMessage DSM with STRM, see Configure STRM to Receive Events From Sophos PureMessage for Microsoft Exchange.
Configure STRM to Receive Events From Sophos PureMessage for Microsoft Exchange
To configure STRM to access the Sophos PureMessage for Microsoft Exchange database using the JDBC protocol:
Step 1 Log in to STRM.
Step 2 Click the Admin tab.
Step 3 On the navigation menu, click Data Sources.
The Data Sources panel is displayed.
Step 4 Click the Log Sources icon.
The Log Sources window is displayed.
Step 5 Click Add.
The Add a log source window is displayed.
Step 6 From the Log Source Type list box, select Sophos PureMessage.
Step 7 From the Protocol Configuration list box, select JDBC.
NOTEYou must refer to the database configuration settings on your Sophos PureMessage device to define the parameters required to configure the Sophos PureMessage DSM in STRM.
Step 8 Configure the following values:
Table 47-3 Sophos PureMessage JDBC Parameters
Parameter Description
Log Source Identifier
Type the identifier for the log source. Type the log source identifier in the following format:
<Sophos PureMessage Database>@<Sophos PureMessage Database Server IP or Host Name>
Where:
<Sophos PureMessage Database> is the database name, as entered in the Database Name parameter.
<Sophos PureMessage Database Server IP or Host Name> is the hostname or IP address for this log source, as entered in the IP or Hostname parameter.
When defining a name for your log source identifier, you must use the values of the Database and Database Server IP address or hostname of the Sophos PureMessage device.
Configuring DSMs
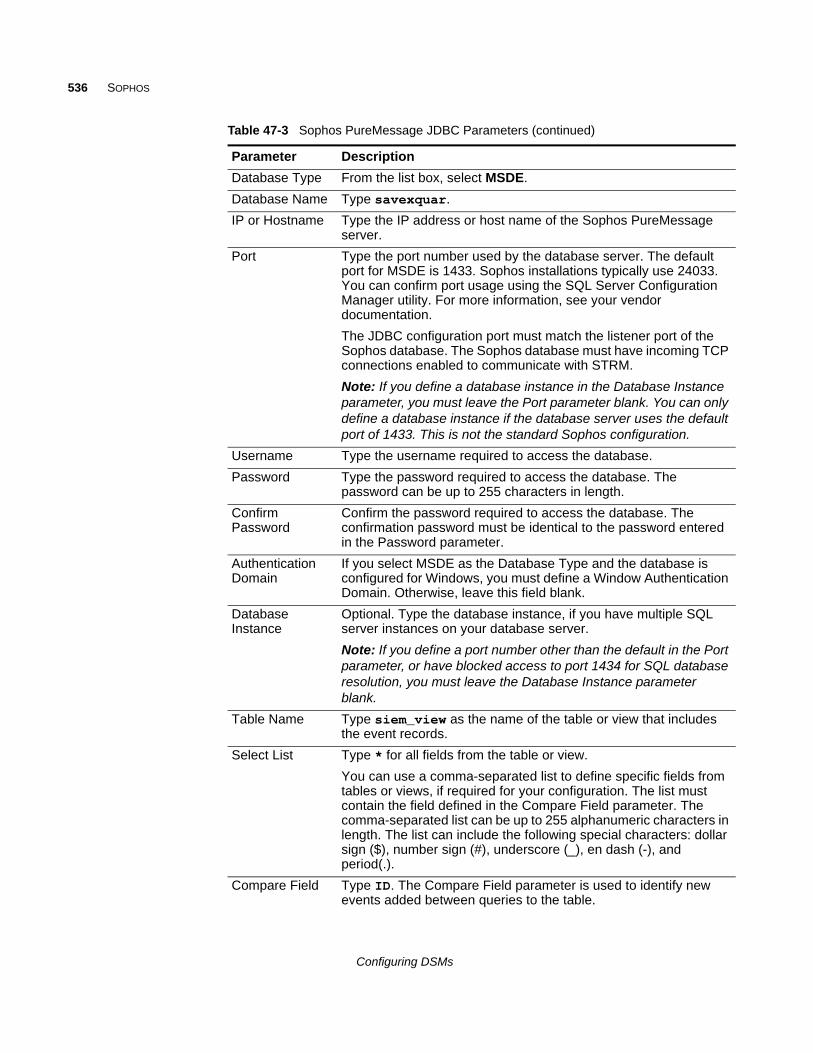
536 SOPHOS
Database Type From the list box, select MSDE.
Database Name Type savexquar.
IP or Hostname Type the IP address or host name of the Sophos PureMessage server.
Port Type the port number used by the database server. The default port for MSDE is 1433. Sophos installations typically use 24033. You can confirm port usage using the SQL Server Configuration Manager utility. For more information, see your vendor documentation.
The JDBC configuration port must match the listener port of the Sophos database. The Sophos database must have incoming TCP connections enabled to communicate with STRM.
Note: If you define a database instance in the Database Instance parameter, you must leave the Port parameter blank. You can only define a database instance if the database server uses the default port of 1433. This is not the standard Sophos configuration.
Username Type the username required to access the database.
Password Type the password required to access the database. The password can be up to 255 characters in length.
Confirm Password
Confirm the password required to access the database. The confirmation password must be identical to the password entered in the Password parameter.
Authentication Domain
If you select MSDE as the Database Type and the database is configured for Windows, you must define a Window Authentication Domain. Otherwise, leave this field blank.
Database Instance
Optional. Type the database instance, if you have multiple SQL server instances on your database server.
Note: If you define a port number other than the default in the Port parameter, or have blocked access to port 1434 for SQL database resolution, you must leave the Database Instance parameter blank.
Table Name Type siem_view as the name of the table or view that includes the event records.
Select List Type * for all fields from the table or view.
You can use a comma-separated list to define specific fields from tables or views, if required for your configuration. The list must contain the field defined in the Compare Field parameter. The comma-separated list can be up to 255 alphanumeric characters in length. The list can include the following special characters: dollar sign ($), number sign (#), underscore (_), en dash (-), and period(.).
Compare Field Type ID. The Compare Field parameter is used to identify new events added between queries to the table.
Table 47-3 Sophos PureMessage JDBC Parameters (continued)
Parameter Description
Configuring DSMs

Sophos PureMessage 537
NOTESelecting a value for the Credibility parameter greater than 5 will weight your Sophos PureMessage log source with a higher importance compared to other log sources in STRM.
Step 9 Click Save.
Step 10 On the Admin tab, click Deploy Changes.
For more information on configuring log sources, see the STRM Log Sources Users Guide.
Use Prepared Statements
Select this check box to use prepared statements.
Prepared statements allows the JDBC protocol source to set up the SQL statement one time, then run the SQL statement many times with different parameters. For security and performance reasons, we recommend that you use prepared statements.
Clearing this check box requires you to use an alternative method of querying that does not use pre-compiled statements.
Start Date and Time
Optional. Type the start date and time for database polling.
The Start Date and Time parameter must be formatted as yyyy-MM-dd HH:mm with HH specified using a 24-hour clock. If the Start Date and Time parameter is clear, polling begins immediately and repeats at the specified polling interval.
Polling Interval Type the polling interval, which is the amount of time between queries to the event table. The default polling interval is 10 seconds.
You can define a longer polling interval by appending H for hours or M for minutes to the numeric value. The maximum polling interval is 1 week in any time format. Numeric values entered without an H or M poll in seconds.
Use Named Pipe Communication
Clear the Use Named Pipe Communications check box.
When using a Named Pipe connection, the username and password must be the appropriate Windows authentication username and password and not the database username and password. Also, you must use the default Named Pipe.
Database Cluster Name
If you select the Use Named Pipe Communication check box, the Database Cluster Name parameter is displayed. If you are running your SQL server in a cluster environment, define the cluster name to ensure Named Pipe communication functions properly.
Table 47-3 Sophos PureMessage JDBC Parameters (continued)
Parameter Description
Configuring DSMs
538 SOPHOS
Integrating STRMwith Sophos
PureMessage forLinux
To integrate STRM with Sophos PureMessage for Linux:
Step 1 Navigate to your Sophos PureMessage PostgreSQL database directory:
cd /opt/pmx/postgres-8.3.3/bin
Step 2 Access the pmx_quarantine database SQL prompt:
./psql -d pmx_quarantine
Step 3 Type the following command to create a SIEM view in your Sophos database to support STRM:
create view siem_view as select 'Linux PureMessage' as application, id, b.name, m_date, h_from_local, h_from_domain, m_global_id, m_message_size, outbound, h_to, c_subject_utf8 from message a, m_reason b where a.reason_id = b.reason_id;
After you create your SIEM view, you must configure STRM to receive event information using the JDBC protocol.
To configure the Sophos PureMessage DSM with STRM, see Configure STRM to Receive Events From Sophos PureMessage for Microsoft Exchange.
Configure STRM to Receive Events From Sophos PureMessage for Microsoft Exchange
To configure STRM to access the Sophos PureMessage database using the JDBC protocol:
Step 1 Log in to STRM.
Step 2 Click the Admin tab.
Step 3 On the navigation menu, click Data Sources.
The Data Sources panel is displayed.
Step 4 Click the Log Sources icon.
The Log Sources window is displayed.
Step 5 Click Add.
The Add a log source window is displayed.
Step 6 From the Log Source Type list box, select Sophos PureMessage.
Step 7 From the Protocol Configuration list box, select JDBC.
NOTEYou must refer to the Configure Database Settings on your Sophos PureMessage to define the parameters required to configure the Sophos PureMessage DSM in STRM.
Configuring DSMs
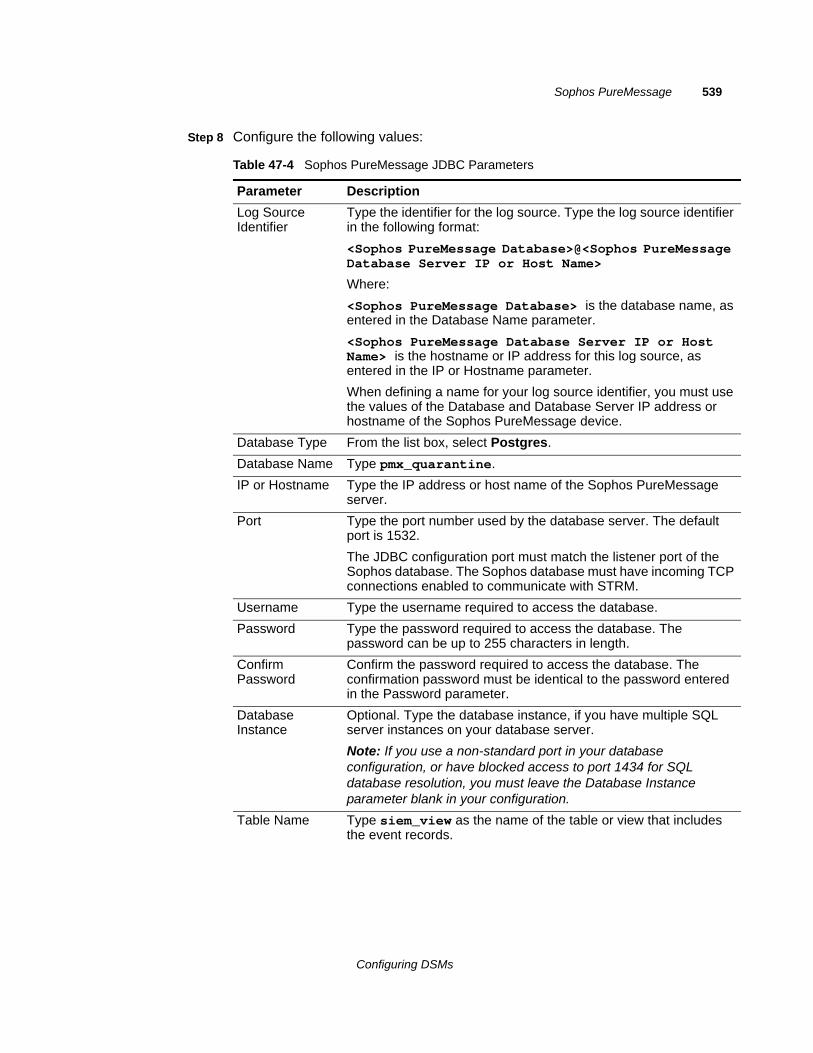
Sophos PureMessage 539
Step 8 Configure the following values:
Table 47-4 Sophos PureMessage JDBC Parameters
Parameter Description
Log Source Identifier
Type the identifier for the log source. Type the log source identifier in the following format:
<Sophos PureMessage Database>@<Sophos PureMessage Database Server IP or Host Name>
Where:
<Sophos PureMessage Database> is the database name, as entered in the Database Name parameter.
<Sophos PureMessage Database Server IP or Host Name> is the hostname or IP address for this log source, as entered in the IP or Hostname parameter.
When defining a name for your log source identifier, you must use the values of the Database and Database Server IP address or hostname of the Sophos PureMessage device.
Database Type From the list box, select Postgres.
Database Name Type pmx_quarantine.
IP or Hostname Type the IP address or host name of the Sophos PureMessage server.
Port Type the port number used by the database server. The default port is 1532.
The JDBC configuration port must match the listener port of the Sophos database. The Sophos database must have incoming TCP connections enabled to communicate with STRM.
Username Type the username required to access the database.
Password Type the password required to access the database. The password can be up to 255 characters in length.
Confirm Password
Confirm the password required to access the database. The confirmation password must be identical to the password entered in the Password parameter.
Database Instance
Optional. Type the database instance, if you have multiple SQL server instances on your database server.
Note: If you use a non-standard port in your database configuration, or have blocked access to port 1434 for SQL database resolution, you must leave the Database Instance parameter blank in your configuration.
Table Name Type siem_view as the name of the table or view that includes the event records.
Configuring DSMs
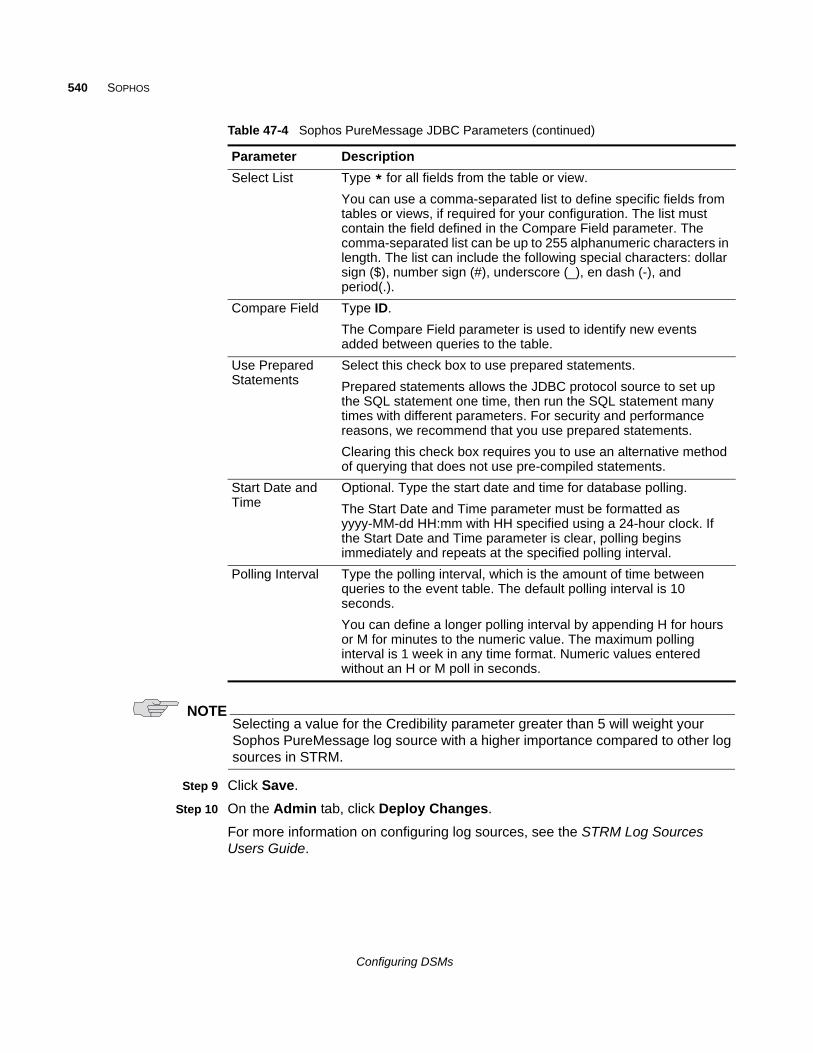
540 SOPHOS
NOTESelecting a value for the Credibility parameter greater than 5 will weight your Sophos PureMessage log source with a higher importance compared to other log sources in STRM.
Step 9 Click Save.
Step 10 On the Admin tab, click Deploy Changes.
For more information on configuring log sources, see the STRM Log Sources Users Guide.
Select List Type * for all fields from the table or view.
You can use a comma-separated list to define specific fields from tables or views, if required for your configuration. The list must contain the field defined in the Compare Field parameter. The comma-separated list can be up to 255 alphanumeric characters in length. The list can include the following special characters: dollar sign ($), number sign (#), underscore (_), en dash (-), and period(.).
Compare Field Type ID.
The Compare Field parameter is used to identify new events added between queries to the table.
Use Prepared Statements
Select this check box to use prepared statements.
Prepared statements allows the JDBC protocol source to set up the SQL statement one time, then run the SQL statement many times with different parameters. For security and performance reasons, we recommend that you use prepared statements.
Clearing this check box requires you to use an alternative method of querying that does not use pre-compiled statements.
Start Date and Time
Optional. Type the start date and time for database polling.
The Start Date and Time parameter must be formatted as yyyy-MM-dd HH:mm with HH specified using a 24-hour clock. If the Start Date and Time parameter is clear, polling begins immediately and repeats at the specified polling interval.
Polling Interval Type the polling interval, which is the amount of time between queries to the event table. The default polling interval is 10 seconds.
You can define a longer polling interval by appending H for hours or M for minutes to the numeric value. The maximum polling interval is 1 week in any time format. Numeric values entered without an H or M poll in seconds.
Table 47-4 Sophos PureMessage JDBC Parameters (continued)
Parameter Description
Configuring DSMs
Sophos Astaro Security Gateway 541
Sophos Astaro Security Gateway
The Sophos Astaro Security Gateway DSM for STRM accepts events using syslog, enabling STRM to record all relevant events. Before configuring STRM, you must configure your Sophos Astaro Security Gateway to forward syslog events.
To configure your Sophos Astaro Security Gateway, you must:
Step 1 Log in to the Sophos Astaro Security Gateway console.
Step 2 From the navigation menu, select Logging > Settings.
Step 3 Click the Remote Syslog Server tab.
The Remote Syslog Status window is displayed.
Step 4 From Syslog Servers panel, click the + icon.
The Add Syslog Server window is displayed.
Step 5 Configure the following parameters:
a Name - Type a name for the syslog server.
b Server - Click the folder icon to add a pre-defined host, or click + and type in new network definition.
c Port - Click the folder icon to add a pre-defined port, or click + and type in a new service definition.
By default, STRM communicates using the syslog protocol on UDP/TCP port 514.
Step 6 Click Save.
Step 7 From the Remote syslog log selection field, you must select check boxes for the following logs:
a POP3 Proxy - Select this check box.
b Packet Filter - Select this check box.
c Intrusion Prevention System - Select this check box.
d Content Filter(HTTPS) - Select this check box.
e High availability - Select this check box.
f FTP Proxy - Select this check box.
g SSL VPN - Select this check box.
h PPTP daemon- Select this check box.
i IPSEC VPN - Select this check box.
j HTTP daemon - Select this check box.
k User authentication daemon - Select this check box.
l SMTP proxy - Select this check box.
Step 8 Click Apply.
Configuring DSMs
542 SOPHOS
Step 9 From Remote syslog status section, click Enable.
Step 10 You are now ready to configure the log source in STRM.
To configure STRM to receive events from your Sophos Astaro Security Gateway device:
From the Log Source Type list box, select Sophos Astaro Security Gateway.
For more information on configuring log sources, see STRM Log Sources Users Guide.
Sophos Web Security Appliance
The Sophos Web Security Appliance (WSA) DSM for STRM accepts events using syslog. STRM records all relevant events forwarded from the transaction log of the Sophos Web Security Appliance. Before configuring STRM, you must configure your Sophos WSA appliance to forward syslog events.
To configure your Sophos Web Security Appliance to forward syslog events:
Step 1 Log in to your Sophos Web Security Appliance.
Step 2 From the menu, select Configuration > System > Alerts & Monitoring.
Step 3 Select the Syslog tab.
Step 4 Select the Enable syslog transfer of web traffic check box.
Step 5 In the Hostname/IP text box, type the IP address or hostname of STRM.
Step 6 In the Port text box, type 514.
Step 7 From the Protocol list box, select a protocol. The options are:
• TCP - The TCP protocol is supported with STRM on port 514.
• UDP - The UDP protocol is supported with STRM on port 514.
• TCP - Encrypted - TCP Encrypted is an unsupported protocol for STRM.
Step 8 Click Apply.
You are now ready to configure the Sophos Web Security Appliance DSM in STRM.
STRM automatically detects syslog data from a Sophos Web Security Appliance. To manually configure STRM to receive events from Sophos Web Security Appliance:
From the Log Source Type list box, select Sophos Web Security Appliance.
For more information on configuring log sources, see the STRM Log Sources Users Guide.
Configuring DSMs
77
SOURCEFIREThis section provides information on the following DSMs:
• Sourcefire Intrusion Sensor
• Sourcefire Defense Center (DC)
Sourcefire Intrusion Sensor
The Sourcefire Intrusion Sensor DSM for STRM accepts Snort based intrusion and prevention syslog events from Sourcefire devices. STRM records all relevant Sourcefire events. Before you configure STRM to integrate with a Sourcefire device, you must:
Step 1 Log in to your Sourcefire user interface.
Step 2 On the navigation menu, expand Detection.
Step 3 Under Policy, click Edit.
Step 4 In the list, select your active policy. Click Edit.
Step 5 Click Alerting.
The selected policy settings appear.
Step 6 For the State parameter, select the On option.
Step 7 In the Logging Host field, type the IP address of the STRM system hosting the Event Collector.
Step 8 Click Save.
You are now ready to configure the log source in STRM.
To configure STRM to receive events from a Sourcefire device
From the Log Source Type list box, select the Snort Open Source IDS option.
For more information on configuring log sources, see the STRM Log Sources Users Guide. For more information about Sourcefire, see the Sourcefire documentation, see http://www.sourcefire.com.
Configuring DSMs
544 SOURCEFIRE
Sourcefire Defense Center (DC)
The Sourcefire Defense Center DSM for STRM accepts Sourcefire Defense Center events using the eStreamer service, which streams event data to STRM. Integrating STRM with Sourcefire Defense Center requires you to create custom certificates in the Sourcefire Defense Center interface, then import the certificates to STRM. If you are using multiple Sourcefire Defense Center appliances, you must import the appropriate certificates and keys on each STRM Console or Event Collector that receives the eStreamer service data.
To integrate STRM with Sourcefire Defense Center, you must:
1 Create and import eStreamer Certificates. For more information, see Creating and Importing eStreamer Certificates.
2 Configure the Sourcefire Defense Center eStreamer protocol in STRM. For more information, see Configuring a Sourcefire Defense Center Log Source.
NOTEThe Sourcefire Defense Center DSM uses the same STRM identifiers (QID) information as the Snort DSM. We recommend you download and install the latest Snort DSM from the Juniper customer support website at www.juniper.net/support/ to access the QID descriptors for Sourcefire Defense Center.
Creating andImporting eStreamer
Certificates
The certificate process for Sourcefire Defense Center requires that you create the certificate as a pcks12 file, then copy the file to your STRM Console or Event Collector. The certificate file is then converted by a script included in the protocol installation, which creates a truststore and keystore file in the proper certificate directory.
Step 1 Log in to your Sourcefire Defense Center interface.
Step 2 Select Operations > Configuration > eStreamer.
Step 3 Select check boxes for the event types Sourcefire Defense Center provides to STRM.
a Click + Create Client located in the upper right-side of the interface.
b Type the IP address or hostname of your STRM Console.
- If you are using a remote Event Collector to collect eStreamer events, type the IP address or hostname for the remote Event Collector.
- If you are using HA, type the virtual IP address.
c Leave the password field blank.
d Click Save.
The new client is added to the Streamer Client list.
Step 4 From the Certificate Location column, click the client you created to save the pkcs12 certificate to a file location and click OK.
Configuring DSMs
Sourcefire Defense Center (DC) 545
Step 5 Using SSH, log in to your STRM Console or remote Event Collector.
NOTEYou must have root or su - root privileges to run the import script.
Step 6 Copy the pkcs12 certificate to the following directory:
/opt/qradar/bin/
Step 7 Type the following command and any additional option parameters to import your pkcs12 file:
/opt/qradar/bin/estreamer-cert-import.pl -f <file name> <options>
Where:
<file name> is the file name of the pkcs12 file created by your Sourcefire Defense Center device.
<options> are any additional import script parameters from Table 48-1.
For example,
/opt/qradar/bin/estreamer-cert-import.pl -f 192.168.0.1.pkcs12
The import script creates a keystore and truststore file in the following location:
/opt/qradar/conf/estreamer.keystore /opt/qradar/conf/estreamer.truststore
NOTEAny existing Sourcefire Defense Center certificates are renamed to estreamer.keystore.old and estreamer.truststore.old.
Table 48-1 Sourcefire Defense Center Import Script Parameters
Parameter Description
-f The -f parameter identifies the file name of the pkcs12 files to import. This parameter is required to import certificates.
-o The -o parameter allows you to overrides the default estreamer name for the keystore and truststore files. The -o parameter is required when using multiple Sourcefire Defense Center devices, as unique key file names are required. For example,
/opt/qradar/bin/estreamer-cert-import.pl -f <file name> -o 192.168.1.100
The import script creates the following files:
/opt/qradar/conf/192.168.0.100.keystore /opt/qradar/conf/192.168.0.100.truststore
-d The -d parameter allows you to enable verbose mode when using the import script. Verbose mode is intended to display error messages for troubleshooting purposes when pkcs12 files fail to import properly.
Configuring DSMs
546 SOURCEFIRE
You are now ready to configure the log source in STRM.
Configuring aSourcefire DefenseCenter Log Source
To configure STRM to receive events from a Sourcefire Defense Center device, you must:
Step 1 Log in to STRM.
Step 2 Click the Admin tab.
Step 3 On the navigation menu, click Data Sources.
The Data Sources panel is displayed.
Step 4 Click the Log Sources icon.
The Log Sources window is displayed.
Step 5 Click Add.
The Add a log source window is displayed.
Step 6 Select the Sourcefire Defense Center option from the Log Source Type list box.
Step 7 From the Protocol Configuration list box, select Sourcefire Defense Center Estreamer.
Step 8 Configure the following parameters:
-p The -p parameter allows you to specify a password if a password was accidently provided when generating the pcks12 file.
-v The -v parameter displays the version information for the import script.
-h The -h parameter displays a help message on using the import script.
Table 48-1 Sourcefire Defense Center Import Script Parameters (continued)
Parameter Description
Table 48-2 Sourcefire Defense Center Estreamer Parameters
Parameter Description
Log Source Identifier Type the IP address or hostname to identify the log source. The information in the Log Source Identifier field must be unique to the log source type.
Server Address Type the IP address or hostname of the Sourcefire Defense Center device.
Server Port Type the port number STRM uses to receive Sourcefire Defense Center Estreamer events. The default is 8302.
Configuring DSMs
Sourcefire Defense Center (DC) 547
For more information about Sourcefire, see the Sourcefire documentation, see http://www.sourcefire.com
Keystore Filename Type the directory path and file name for the keystore private key and associated certificate.
By default, the import script creates the keystore file in the following directory:
/opt/qradar/conf/estreamer.keystore
Truststore Filename Type the directory path and file name for the truststore files. The truststore file contain the certificates trusted by the client.
By default, the import script creates the truststore file in the following directory:
/opt/qradar/conf/estreamer.truststore
Table 48-2 Sourcefire Defense Center Estreamer Parameters (continued)
Parameter Description
Configuring DSMs

78
SQUID WEB PROXYThe Squid Web Proxy DSM for STRM accepts events using syslog. STRM records all cache and access log events.To integrate STRM with Squid Web Proxy, you must configure your Squid Web Proxy to forward your cache and access logs.
This section contains the following topics:
• Configuring Syslog Forwarding
• Creating a Log Source for Squid Events
Configuring SyslogForwarding
To configure Squid Web Proxy to forward your access and cache events using syslog:
Step 1 Using SSH, log in to the Squid device command-line interface (CLI).
Step 2 Open the following file:
/etc/rc3.d/S99local
Step 3 Add the following line:
tail -f /var/log/squid/access.log | logger -p <facility>.<priority> &
Where:
<facility> is any valid syslog facility (such as, authpriv, daemon, local0 to local7, or user) written in lowercase.
<priority> is any valid priority (such as, err, warning, notice, info, debug) written in lowercase.
Step 4 Save and close the file.
Logging begins the next time the system is rebooted.
Step 5 To begin logging immediately, type the following command:
nohup tail -f /var/log/squid/access.log | logger -p <facility>.<priority> &
Where <facility> and <priority> are the same values entered in Step 3.
Step 6 Open the following file:
/etc/squid/squid.conf
Configuring DSMs

550 SQUID WEB PROXY
Step 7 Add the following line to send the logs to the STRM:
<prioirty>.<facility> @<STRM_IP_address>
Where:
<priority> is the priority of your Squid messages
<facility> is the facility of your Squid messages
<STRM_IP_address> is the IP address or hostname of your STRM.
For example:
info.local4 @172.16.210.50
Step 8 Add the following line to squid.conf to turn off Squid httpd log emulation:
emulate_httpd_log off
Step 9 Save and close the file.
Step 10 Type the following command to restart the syslog daemon:
/etc/init.d/syslog restart
For more information on configuring Squid Web Proxy, consult your vendor documentation. After you configure syslog forwarding your cache and access logs, the configuration is complete. STRM can automatically discover syslog events forwarded from Squid Web Proxy.
Creating a LogSource for Squid
Events
STRM automatically discovers and creates a log source for syslog events forwarded from Squid Web Proxy appliances. However, you can manually create a log source for STRM to receive Squid Web Proxy events. These configuration steps for creating a log source are optional.
To manually configure a log source for Squid Web Proxy:
Step 1 Log in to STRM.
Step 2 Click the Admin tab.
Step 3 On the navigation menu, click Data Sources.
The Data Sources panel is displayed.
Step 4 Click the Log Sources icon.
The Log Sources window is displayed.
Step 5 Click Add.
The Add a log source window is displayed.
Step 6 In the Log Source Name field, type a name for the log source.
Step 7 In the Log Source Description field, type a description for the log source.
Step 8 From the Log Source Type list box, select Squid Web Proxy.
Step 9 From the Protocol Configuration list box, select Syslog.
The syslog protocol configuration is displayed.
Configuring DSMs
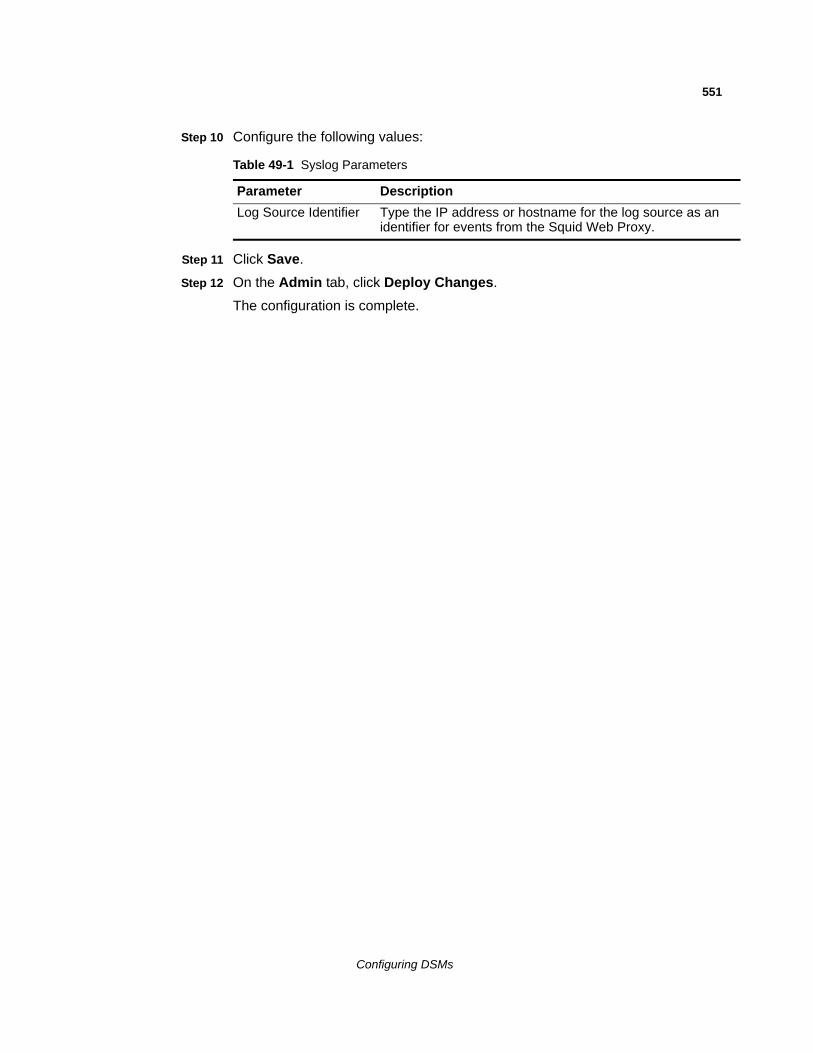
551
Step 10 Configure the following values:
Step 11 Click Save.
Step 12 On the Admin tab, click Deploy Changes.
The configuration is complete.
Table 49-1 Syslog Parameters
Parameter Description
Log Source Identifier Type the IP address or hostname for the log source as an identifier for events from the Squid Web Proxy.
Configuring DSMs

79
STARENT NETWORKSThe Starent Networks DSM for STRM accepts Event, Trace, Active, and Monitor events. Before configuring a Starent Networks device in STRM, you must configure your Starent Networks device to forward syslog events to STRM.
To configure the device to send syslog events to STRM:
Step 1 Log in to your Starent Networks device.
Step 2 Configure the syslog server:
logging syslog <IP address> [facility <facilities>] [<rate value>] [pdu-verbosity <pdu_level>] [pdu-data <format>] [event-verbosity <event_level>]
The following table provides the necessary parameters:
Table 50-1 Syslog Server Parameters
Parameter Description
syslog <IP address> Type the IP address of your STRM
facility <facilities> Type the local facility for which the logging options shall be applied. The options are:
• local0
• local1
• local2
• local3
• local4
• local5
• local6
• local7
The default is local7.
rate value Type the rate that you want log entries to be sent to the system log server. This value must be an integer from 0 to 100000. The default is 1000 events per second.
pdu-verbosity <pdu-level>
Type the level of verboseness you want to use in logging the Protocol Data Units (PDUs). The range is 1 to 5 where 5 is the most detailed. This parameter only affects protocol logs.
Configuring DSMs
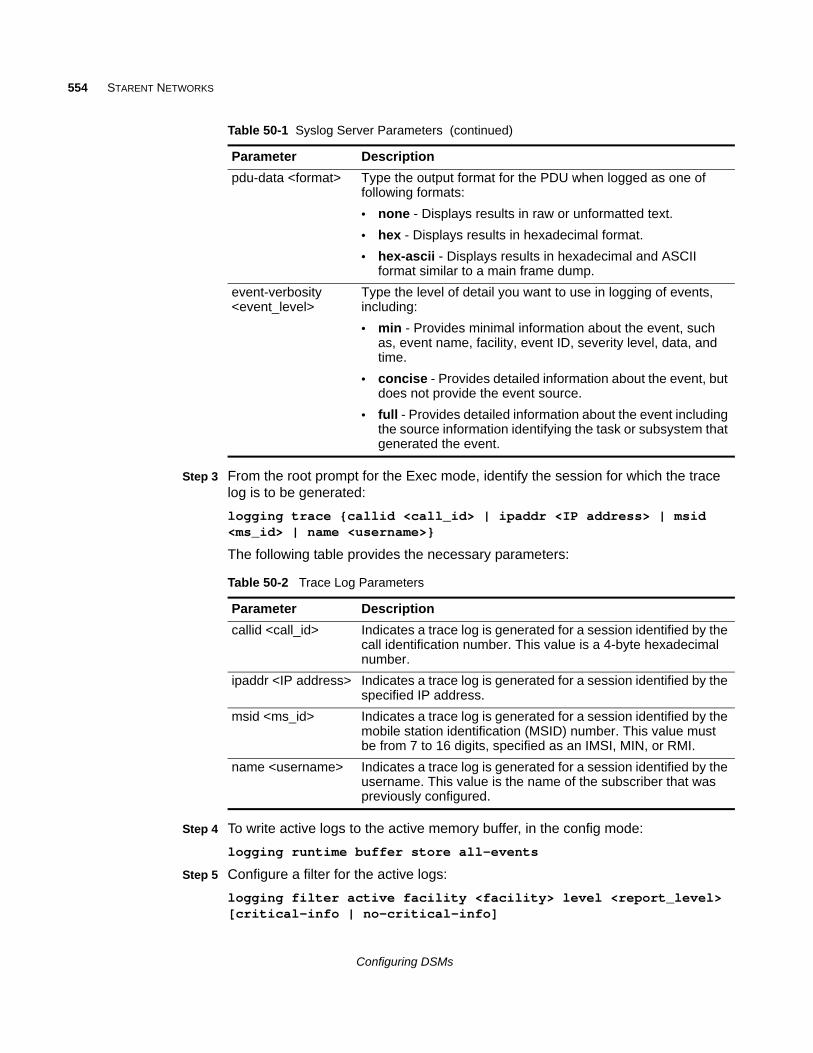
554 STARENT NETWORKS
Step 3 From the root prompt for the Exec mode, identify the session for which the trace log is to be generated:
logging trace {callid <call_id> | ipaddr <IP address> | msid <ms_id> | name <username>}
The following table provides the necessary parameters:
Step 4 To write active logs to the active memory buffer, in the config mode:
logging runtime buffer store all-events
Step 5 Configure a filter for the active logs:
logging filter active facility <facility> level <report_level> [critical-info | no-critical-info]
pdu-data <format> Type the output format for the PDU when logged as one of following formats:
• none - Displays results in raw or unformatted text.
• hex - Displays results in hexadecimal format.
• hex-ascii - Displays results in hexadecimal and ASCII format similar to a main frame dump.
event-verbosity <event_level>
Type the level of detail you want to use in logging of events, including:
• min - Provides minimal information about the event, such as, event name, facility, event ID, severity level, data, and time.
• concise - Provides detailed information about the event, but does not provide the event source.
• full - Provides detailed information about the event including the source information identifying the task or subsystem that generated the event.
Table 50-1 Syslog Server Parameters (continued)
Parameter Description
Table 50-2 Trace Log Parameters
Parameter Description
callid <call_id> Indicates a trace log is generated for a session identified by the call identification number. This value is a 4-byte hexadecimal number.
ipaddr <IP address> Indicates a trace log is generated for a session identified by the specified IP address.
msid <ms_id> Indicates a trace log is generated for a session identified by the mobile station identification (MSID) number. This value must be from 7 to 16 digits, specified as an IMSI, MIN, or RMI.
name <username> Indicates a trace log is generated for a session identified by the username. This value is the name of the subscriber that was previously configured.
Configuring DSMs
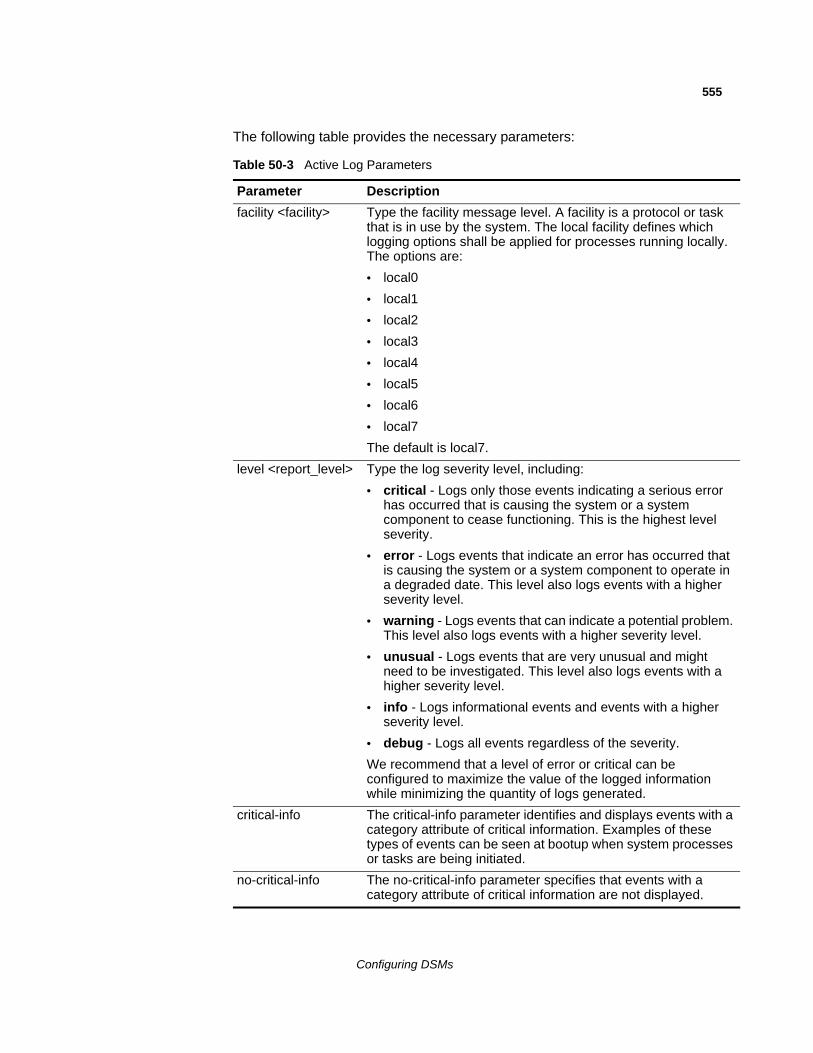
555
The following table provides the necessary parameters:
Table 50-3 Active Log Parameters
Parameter Description
facility <facility> Type the facility message level. A facility is a protocol or task that is in use by the system. The local facility defines which logging options shall be applied for processes running locally. The options are:
• local0
• local1
• local2
• local3
• local4
• local5
• local6
• local7
The default is local7.
level <report_level> Type the log severity level, including:
• critical - Logs only those events indicating a serious error has occurred that is causing the system or a system component to cease functioning. This is the highest level severity.
• error - Logs events that indicate an error has occurred that is causing the system or a system component to operate in a degraded date. This level also logs events with a higher severity level.
• warning - Logs events that can indicate a potential problem. This level also logs events with a higher severity level.
• unusual - Logs events that are very unusual and might need to be investigated. This level also logs events with a higher severity level.
• info - Logs informational events and events with a higher severity level.
• debug - Logs all events regardless of the severity.
We recommend that a level of error or critical can be configured to maximize the value of the logged information while minimizing the quantity of logs generated.
critical-info The critical-info parameter identifies and displays events with a category attribute of critical information. Examples of these types of events can be seen at bootup when system processes or tasks are being initiated.
no-critical-info The no-critical-info parameter specifies that events with a category attribute of critical information are not displayed.
Configuring DSMs
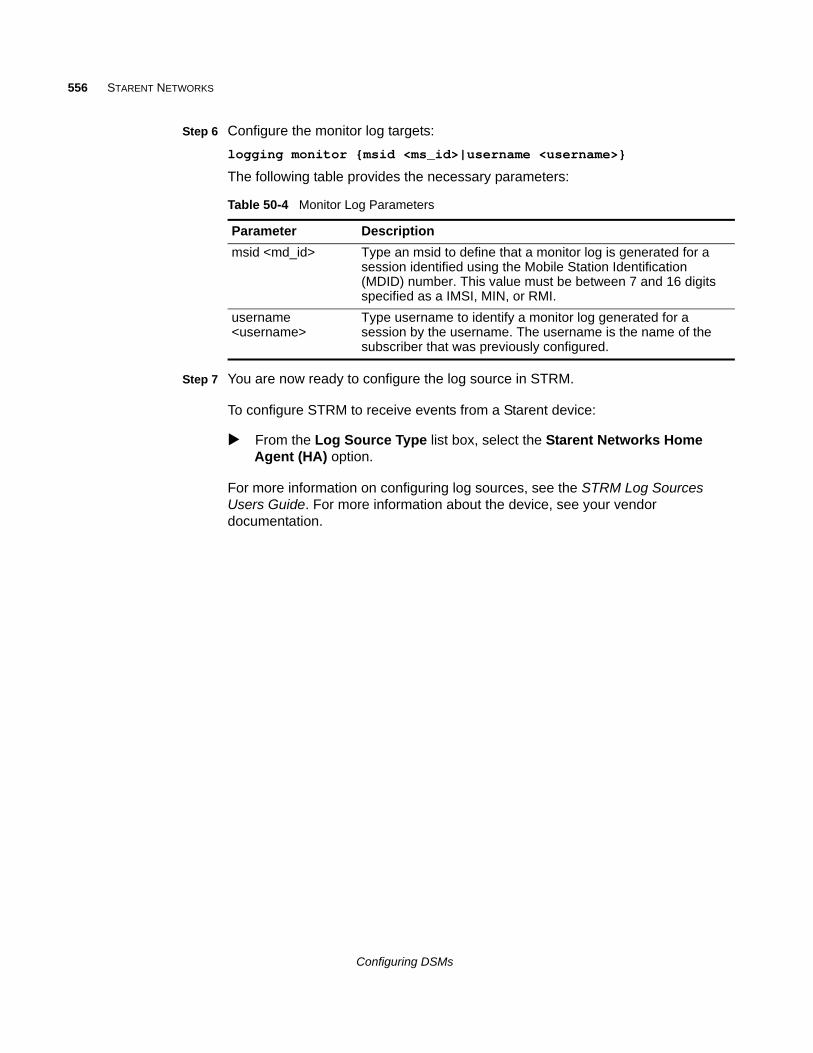
556 STARENT NETWORKS
Step 6 Configure the monitor log targets:
logging monitor {msid <ms_id>|username <username>}
The following table provides the necessary parameters:
Step 7 You are now ready to configure the log source in STRM.
To configure STRM to receive events from a Starent device:
From the Log Source Type list box, select the Starent Networks Home Agent (HA) option.
For more information on configuring log sources, see the STRM Log Sources Users Guide. For more information about the device, see your vendor documentation.
Table 50-4 Monitor Log Parameters
Parameter Description
msid <md_id> Type an msid to define that a monitor log is generated for a session identified using the Mobile Station Identification (MDID) number. This value must be between 7 and 16 digits specified as a IMSI, MIN, or RMI.
username <username>
Type username to identify a monitor log generated for a session by the username. The username is the name of the subscriber that was previously configured.
Configuring DSMs
80
STONESOFT MANAGEMENT CENTERThe Stonesoft Management Center DSM for STRM accepts events using syslog. STRM records all relevant LEEF formatted syslog events. Before configuring STRM, you must configure your Stonesoft Management Center to export LEEF formatted syslog events.
This document includes the steps required to edit LogServerConfiguration.txt file. Configuring the text file allows Stonesoft Management Center to export event data in LEEF format using syslog to STRM. For detailed configuration instructions, see the StoneGate Management Center Administrator’s Guide.
The following steps are required to integrate Stonesoft Management Center with STRM:
1 Configuring the Log Server
2 Configuring a Traffic Rule for Syslog
3 Configuring the Log Source in STRM
Configuring the LogServer
To configure Stonesoft Management Center:
Step 1 Log in to the appliance hosting your Stonesoft Management Center.
Step 2 Stop the Stonesoft Management Center Log Server:
• Windows - Select one of the following methods to stop the Log Server:
- Stop the Log Server in the Windows Services list.
- Run the batch file <installation path>/bin/sgStopLogSrv.bat.
• Linux - To stop the Log Server in Linux, run the script <installation path>/bin/sgStopLogSrv.sh.
Step 3 Edit the LogServerConfiguration.txt file. The configuration file is located in the following directory:
<installation path>/data/LogServerConfiguration.txt
Configuring DSMs
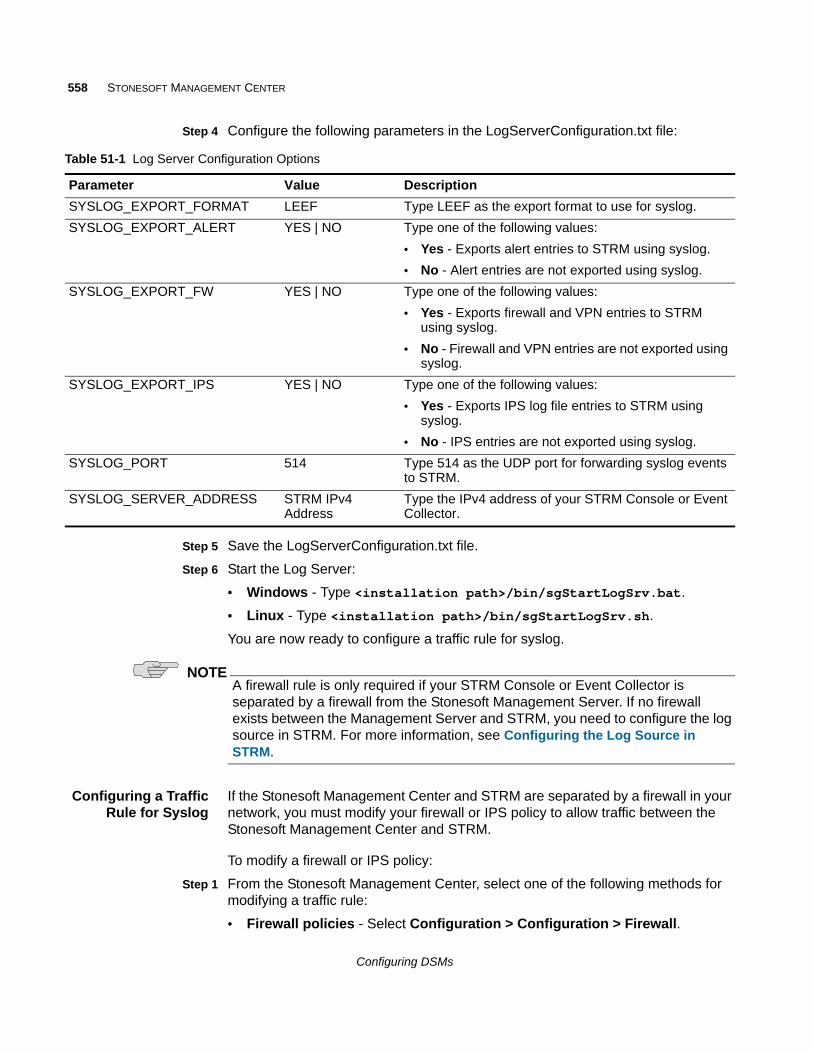
558 STONESOFT MANAGEMENT CENTER
Step 4 Configure the following parameters in the LogServerConfiguration.txt file:
Step 5 Save the LogServerConfiguration.txt file.
Step 6 Start the Log Server:
• Windows - Type <installation path>/bin/sgStartLogSrv.bat.
• Linux - Type <installation path>/bin/sgStartLogSrv.sh.
You are now ready to configure a traffic rule for syslog.
NOTEA firewall rule is only required if your STRM Console or Event Collector is separated by a firewall from the Stonesoft Management Server. If no firewall exists between the Management Server and STRM, you need to configure the log source in STRM. For more information, see Configuring the Log Source in STRM.
Configuring a TrafficRule for Syslog
If the Stonesoft Management Center and STRM are separated by a firewall in your network, you must modify your firewall or IPS policy to allow traffic between the Stonesoft Management Center and STRM.
To modify a firewall or IPS policy:
Step 1 From the Stonesoft Management Center, select one of the following methods for modifying a traffic rule:
• Firewall policies - Select Configuration > Configuration > Firewall.
Table 51-1 Log Server Configuration Options
Parameter Value Description
SYSLOG_EXPORT_FORMAT LEEF Type LEEF as the export format to use for syslog.
SYSLOG_EXPORT_ALERT YES | NO Type one of the following values:
• Yes - Exports alert entries to STRM using syslog.
• No - Alert entries are not exported using syslog.
SYSLOG_EXPORT_FW YES | NO Type one of the following values:
• Yes - Exports firewall and VPN entries to STRM using syslog.
• No - Firewall and VPN entries are not exported using syslog.
SYSLOG_EXPORT_IPS YES | NO Type one of the following values:
• Yes - Exports IPS log file entries to STRM using syslog.
• No - IPS entries are not exported using syslog.
SYSLOG_PORT 514 Type 514 as the UDP port for forwarding syslog events to STRM.
SYSLOG_SERVER_ADDRESS STRM IPv4 Address
Type the IPv4 address of your STRM Console or Event Collector.
Configuring DSMs
559
• IPS policies - Select Configuration > Configuration > IPS.
Step 2 Select the type of policy to modify:
• Firewall - Select Firewall Policies > Edit Firewall Policy.
• IPS - Select IPS Policies > Edit Firewall Policy.
Step 3 Add an IPv4 Access rule with the following values to the firewall policy:
a Source - Type the IPv4 address of your Stonesoft Management Center Log Server.
b Destination - Type the IPv4 address of your STRM Console or Event Collector.
c Service - Select Syslog (UDP).
d Action - Select Allow.
e Logging - Select None.
NOTEIn most cases, we recommend setting the logging value to None. Logging syslog connections without configuring a syslog filter can create a loop. For more information, see the StoneGate Management Center Administrator’s Guide.
Step 4 Save your changes and refresh the policy on the firewall or IPS.
You are now ready to configure the log source in STRM.
Configuring the LogSource in STRM
STRM automatically detects syslog events from the Stonesoft Management Center. However, if you want to manually configure STRM to receive events your from Stonesoft Management Center:
From the Log Source Type list box, select Stonesoft Management Center.
For more information on configuring log sources, see the STRM Log Sources Users Guide.
Configuring DSMs


81
SUN SOLARISThis section provides DSM configuration information on the following:
• Sun Solaris
• Sun Solaris DHCP
• Sun Solaris Sendmail
• Sun Solaris Basic Security Mode (BSM)
Sun Solaris The Sun Solaris DSM for accepts Solaris authentication events using syslog. STRM records all relevant events. Before you configure STRM to integrate with a Solaris server, you must:
Step 1 Log in to the Sun Solaris command-line interface.
Step 2 Open the /etc/syslog.conf file.
Step 3 To forward system authentication logs to STRM, add the following line to the file:
*.err;auth.notice;auth.info @<IP address>
Where <IP address> is the IP address of your STRM. Use tabs instead of spaces to format the line.
NOTEDepending on the version of Solaris you are running, you might need to add additional log types to the file. Contact your system administrator for more information.
Step 4 Save and exit the file.
Step 5 Type the following command:
kill -HUP ‘cat /etc/syslog.pid‘
You are now ready to configure the log source STRM.
To configure STRM to receive events from a Solaris device:
From the Log Source Type list box, select Solaris Operating System Authentication Messages.
Configuring DSMs
562 SUN SOLARIS
For more information on configuring log sources, see the STRM Log Sources Users Guide.
Sun Solaris DHCP The Sun Solaris DHCP DSM for STRM accepts Solaris DHCP events using syslog. STRM records all relevant events. Before you configure STRM to integrate with Solaris DHCP, you must:
Step 1 Log in to the Sun Solaris command-line interface.
Step 2 Open the /etc/default/dhcp file.
Step 3 Enable logging of DHCP transactions to syslog by adding the following line:
LOGGING_FACILITY=X
Where X is the number corresponding to a local syslog facility, for example, a number from 0 to 7.
Step 4 Save and exit the file.
Step 5 Open the /etc/syslog.conf file.
Step 6 To forward system authentication logs to STRM, add the following line to the file:
localX.notice @<IP address>
Where:
X is the logging facility number you specified in Step 3
<IP address> is the IP address of your STRM. Use tabs instead of spaces to format the line.
Step 7 Save and exit the file.
Step 8 Type the following command:
kill -HUP ‘cat /etc/syslog.pid‘
Step 9 You are now ready to configure the log source in STRM.
To configure STRM to receive events from a Solaris device:
From the Log Source Type list box, select the Solaris Operating System DHCP Logs option.
For more information on configuring log sources, see the STRM Log Sources Users Guide. For more information about Solaris, see your vendor documentation.
Sun Solaris Sendmail
The Sun Solaris Sendmail DSM for STRM accepts Solaris authentication events using syslog. STRM records all relevant sendmail events. Before you configure STRM to integrate with Solaris Sendmail, you must:
Step 1 Log in to the Sun Solaris command-line interface.
Configuring DSMs
Sun Solaris Basic Security Mode (BSM) 563
Step 2 Open the /etc/syslog.conf file.
Step 3 To forward system authentication logs to STRM, add the following line to the file:
mail.*; @<IP address>
Where <IP address> is the IP address of your STRM. Use tabs instead of spaces to format the line.
NOTEDepending on the version of Solaris you are running, you might need to add additional log types to the file. Contact your system administrator for more information.
Step 4 Save and exit the file.
Step 5 Type the following command:
kill -HUP ‘cat /etc/syslog.pid‘
Step 6 You are now ready to configure the log source STRM.
To configure STRM to receive events from a Solaris device:
From the Log Source Type list box, select Solaris Operating System Sendmail Logs.
For more information on configuring log sources, see the STRM Log Sources Users Guide. For more information about your Solaris, see your vendor documentation.
Sun Solaris Basic Security Mode (BSM)
Sun Solaris Basic Security Mode (BSM) is an audit tracking tool for system administrator to retrieve detailed auditing events from Sun Solaris systems. STRM retrieves Sun Solaris BSM events using the Log File protocol. Before you configure STRM to integrate with Solaris Basic Security Mode, you must:
1 Enable Solaris Basic Security Mode. For more information, see Enabling and Configuring Solaris Basic Security Mode.
2 Convert audit logs from binary to a human-readable format. For more information, see Converting Sun Solaris BSM Audit Logs.
3 Schedule cron to run the conversion script on a schedule. For more information, see Creating a Cron Job.
4 Collect Sun Solaris events in STRM using the Log File protocol. For more information, see Pulling Data Using the Log File Protocol.
Enabling andConfiguring Solaris
Basic Security Mode
To enable Solaris Basic Security Mode and configure the classes of events to log:
Step 1 Log in to your Solaris console as a superuser or root user.
Configuring DSMs
564 SUN SOLARIS
Step 2 Enable single-user mode on your Solaris console.
Step 3 Type the following command to run the bsmconv script and enable auditing:
/etc/security/bsmconv
The bsmconv script enables Solaris Basic Security Mode and starts the auditing service auditd.
Step 4 Type the following command to open the audit control log for editing:
vi /etc/security/audit_control
Step 5 Edit the audit control file to contain the following information:
dir:/var/auditflags:lo,ad,ex,-fw,-fc,-fd,-frnaflags:lo,ad
Step 6 Save the changes to the audit_control file, then reboot the Solaris console to start auditd.
Step 7 Type the following command to verify auditd has started:
/user/sbin/auditconfig -getcond
If the auditd process is started, the following string is returned:
audit condition = auditing
Step 8 You are now ready to convert the binary Solaris Basic Security Mode logs to a human-readable log format.
Converting SunSolaris BSM Audit
Logs
STRM cannot process binary files directly from Sun Solaris BSM and must convert the audit log from the existing binary format to a human-readable log format using praudit before the audit log data can be retrieved by STRM.
To convert the Solaris Basic Security Mode logs to a human-readable log format:
Step 1 Type the following command to create a new script on your Sun Solaris console:
vi /etc/security/newauditlog.sh
Step 2 Add the following information to the newauditlog.sh script:
#!/bin/bash## newauditlog.sh - Start a new audit file and expire the old logs#
AUDIT_EXPIRE=30AUDIT_DIR="/var/audit"LOG_DIR="/var/log/"
/usr/sbin/audit -n
cd $AUDIT_DIR # in case it is a link
Configuring DSMs
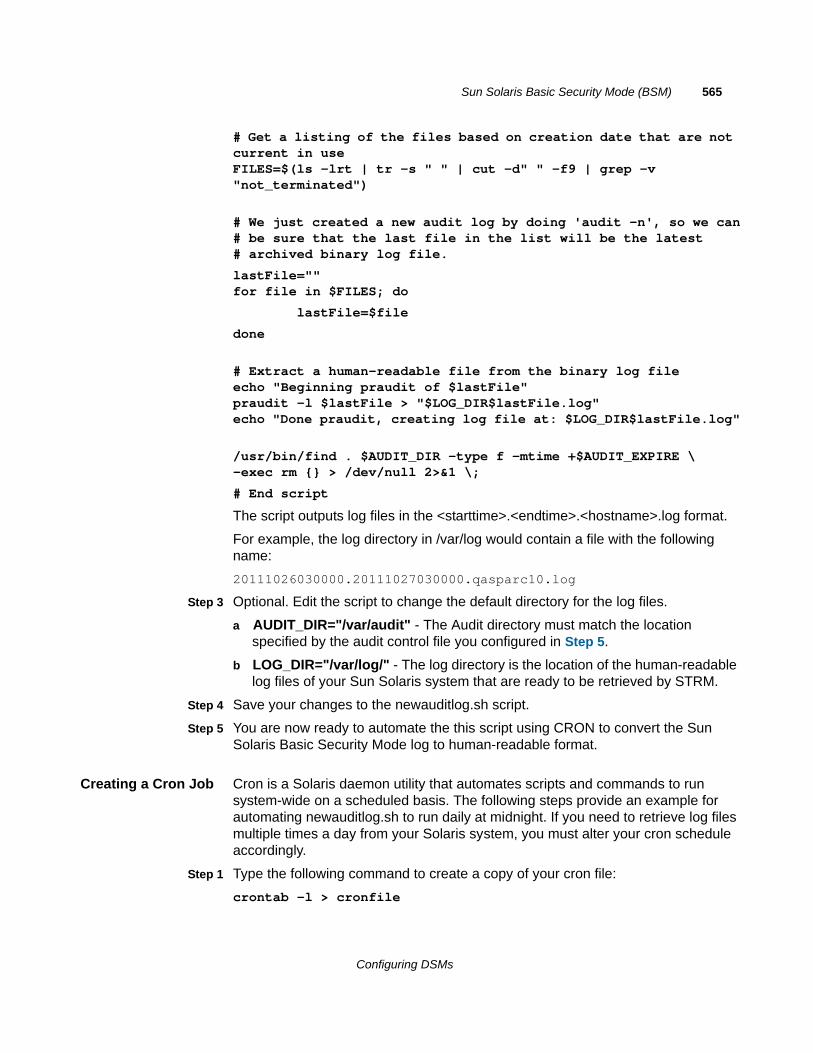
Sun Solaris Basic Security Mode (BSM) 565
# Get a listing of the files based on creation date that are not current in useFILES=$(ls -lrt | tr -s " " | cut -d" " -f9 | grep -v "not_terminated")
# We just created a new audit log by doing 'audit -n', so we can# be sure that the last file in the list will be the latest # archived binary log file.
lastFile=""for file in $FILES; do
lastFile=$file
done
# Extract a human-readable file from the binary log fileecho "Beginning praudit of $lastFile"praudit -l $lastFile > "$LOG_DIR$lastFile.log"echo "Done praudit, creating log file at: $LOG_DIR$lastFile.log"
/usr/bin/find . $AUDIT_DIR -type f -mtime +$AUDIT_EXPIRE \-exec rm {} > /dev/null 2>&1 \;
# End script
The script outputs log files in the <starttime>.<endtime>.<hostname>.log format.
For example, the log directory in /var/log would contain a file with the following name:
20111026030000.20111027030000.qasparc10.log
Step 3 Optional. Edit the script to change the default directory for the log files.
a AUDIT_DIR="/var/audit" - The Audit directory must match the location specified by the audit control file you configured in Step 5.
b LOG_DIR="/var/log/" - The log directory is the location of the human-readable log files of your Sun Solaris system that are ready to be retrieved by STRM.
Step 4 Save your changes to the newauditlog.sh script.
Step 5 You are now ready to automate the this script using CRON to convert the Sun Solaris Basic Security Mode log to human-readable format.
Creating a Cron Job Cron is a Solaris daemon utility that automates scripts and commands to run system-wide on a scheduled basis. The following steps provide an example for automating newauditlog.sh to run daily at midnight. If you need to retrieve log files multiple times a day from your Solaris system, you must alter your cron schedule accordingly.
Step 1 Type the following command to create a copy of your cron file:
crontab -l > cronfile
Configuring DSMs
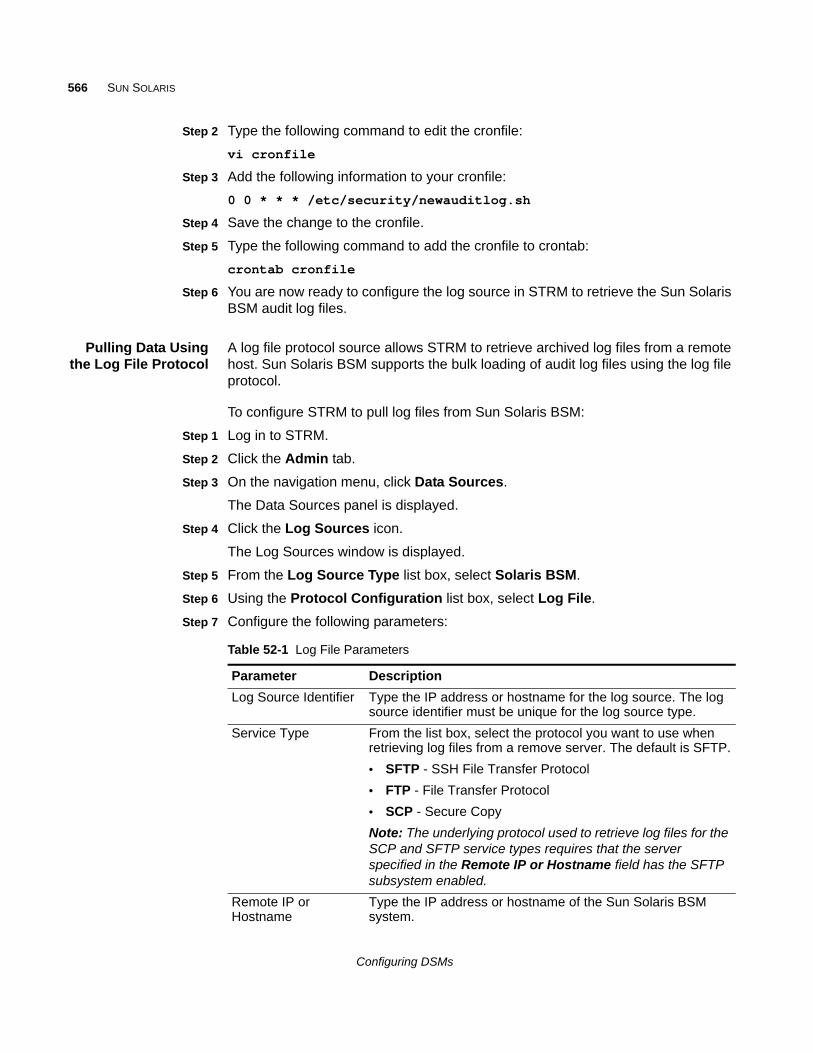
566 SUN SOLARIS
Step 2 Type the following command to edit the cronfile:
vi cronfile
Step 3 Add the following information to your cronfile:
0 0 * * * /etc/security/newauditlog.sh
Step 4 Save the change to the cronfile.
Step 5 Type the following command to add the cronfile to crontab:
crontab cronfile
Step 6 You are now ready to configure the log source in STRM to retrieve the Sun Solaris BSM audit log files.
Pulling Data Usingthe Log File Protocol
A log file protocol source allows STRM to retrieve archived log files from a remote host. Sun Solaris BSM supports the bulk loading of audit log files using the log file protocol.
To configure STRM to pull log files from Sun Solaris BSM:
Step 1 Log in to STRM.
Step 2 Click the Admin tab.
Step 3 On the navigation menu, click Data Sources.
The Data Sources panel is displayed.
Step 4 Click the Log Sources icon.
The Log Sources window is displayed.
Step 5 From the Log Source Type list box, select Solaris BSM.
Step 6 Using the Protocol Configuration list box, select Log File.
Step 7 Configure the following parameters:
Table 52-1 Log File Parameters
Parameter Description
Log Source Identifier Type the IP address or hostname for the log source. The log source identifier must be unique for the log source type.
Service Type From the list box, select the protocol you want to use when retrieving log files from a remove server. The default is SFTP.
• SFTP - SSH File Transfer Protocol
• FTP - File Transfer Protocol
• SCP - Secure Copy
Note: The underlying protocol used to retrieve log files for the SCP and SFTP service types requires that the server specified in the Remote IP or Hostname field has the SFTP subsystem enabled.
Remote IP or Hostname
Type the IP address or hostname of the Sun Solaris BSM system.
Configuring DSMs
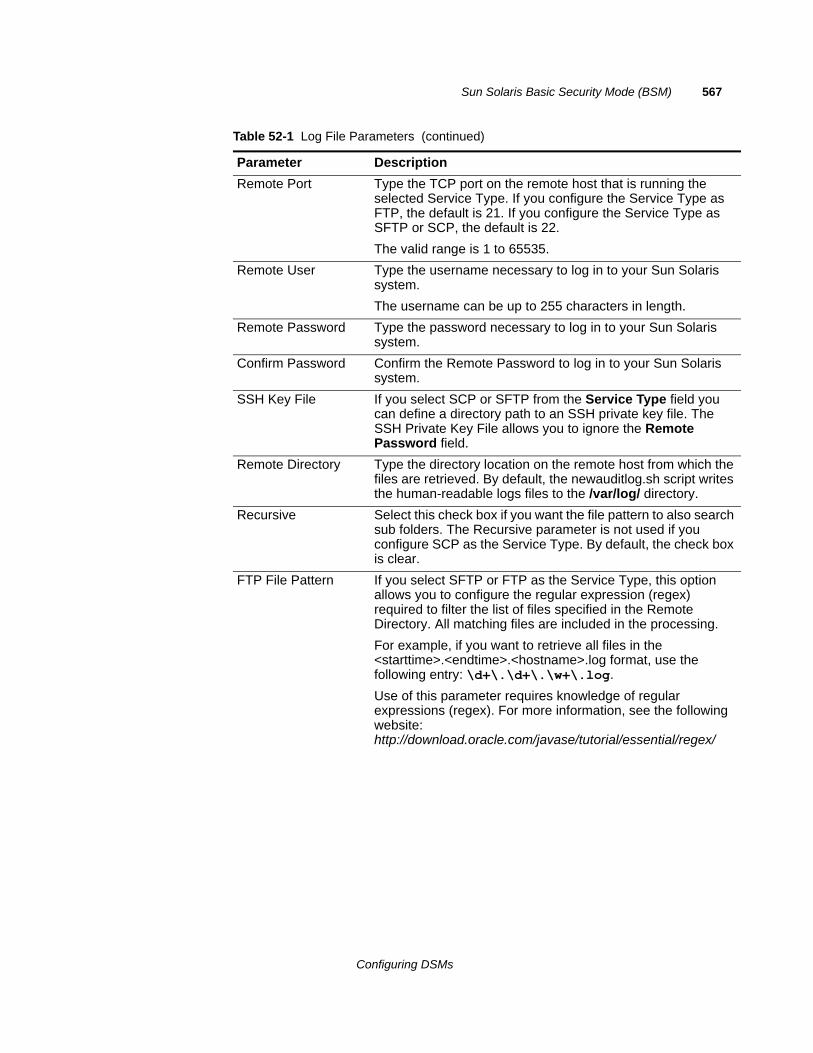
Sun Solaris Basic Security Mode (BSM) 567
Remote Port Type the TCP port on the remote host that is running the selected Service Type. If you configure the Service Type as FTP, the default is 21. If you configure the Service Type as SFTP or SCP, the default is 22.
The valid range is 1 to 65535.
Remote User Type the username necessary to log in to your Sun Solaris system.
The username can be up to 255 characters in length.
Remote Password Type the password necessary to log in to your Sun Solaris system.
Confirm Password Confirm the Remote Password to log in to your Sun Solaris system.
SSH Key File If you select SCP or SFTP from the Service Type field you can define a directory path to an SSH private key file. The SSH Private Key File allows you to ignore the Remote Password field.
Remote Directory Type the directory location on the remote host from which the files are retrieved. By default, the newauditlog.sh script writes the human-readable logs files to the /var/log/ directory.
Recursive Select this check box if you want the file pattern to also search sub folders. The Recursive parameter is not used if you configure SCP as the Service Type. By default, the check box is clear.
FTP File Pattern If you select SFTP or FTP as the Service Type, this option allows you to configure the regular expression (regex) required to filter the list of files specified in the Remote Directory. All matching files are included in the processing.
For example, if you want to retrieve all files in the <starttime>.<endtime>.<hostname>.log format, use the following entry: \d+\.\d+\.\w+\.log.
Use of this parameter requires knowledge of regular expressions (regex). For more information, see the following website: http://download.oracle.com/javase/tutorial/essential/regex/
Table 52-1 Log File Parameters (continued)
Parameter Description
Configuring DSMs

568 SUN SOLARIS
FTP Transfer Mode This option only appears if you select FTP as the Service Type. The FTP Transfer Mode parameter allows you to define the file transfer mode when retrieving log files over FTP.
From the list box, select the transfer mode you want to apply to this log source:
• Binary - Select Binary for log sources that require binary data files or compressed .zip, .gzip, .tar, or .tar+gzip archive files.
• ASCII - Select ASCII for log sources that require an ASCII FTP file transfer. You must select NONE for the Processor field and LINEBYLINE the Event Generator field when using ASCII as the transfer mode.
SCP Remote File If you select SCP as the Service Type, you must type the file name of the remote file.
Start Time Type the time of day you want the processing to begin. This parameter functions with the Recurrence value to establish when and how often the Remote Directory is scanned for files. Type the start time, based on a 24 hour clock, in the following format: HH:MM.
Recurrence Type the frequency, beginning at the Start Time, that you want the remote directory to be scanned. Type this value in hours (H), minutes (M), or days (D).
For example, type 2H if you want the directory to be scanned every 2 hours. The default is 1H.
Run On Save Select this check box if you want the log file protocol to run immediately after you click Save. After the Run On Save completes, the log file protocol follows your configured start time and recurrence schedule.
Selecting Run On Save clears the list of previously processed files for the Ignore Previously Processed File(s) parameter.
EPS Throttle Type the number of Events Per Second (EPS) that you do not want this protocol to exceed. The valid range is 100 to 5000.
Processor If the files located on the remote host are stored in a .zip, .gzip, .tar, or tar+gzip archive format, select the processor that allows the archives to be expanded and contents processed.
Ignore Previously Processed File(s)
Select this check box to track files that have already been processed and you do not want the files to be processed a second time. This only applies to FTP and SFTP Service Types.
Change Local Directory?
Select this check box to define the local directory on your STRM system that you want to use for storing downloaded files during processing. We recommend that you leave the check box clear. When the check box is selected, the Local Directory field is displayed, which allows you to configure the local directory to use for storing files.
Table 52-1 Log File Parameters (continued)
Parameter Description
Configuring DSMs
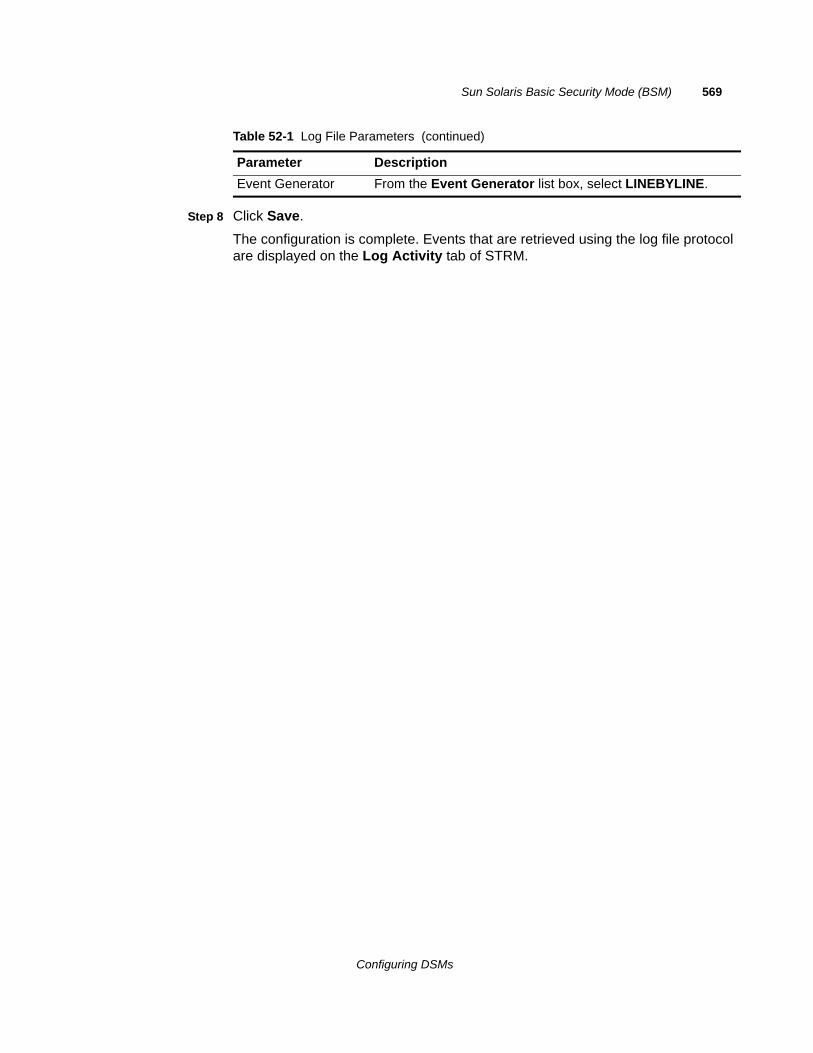
Sun Solaris Basic Security Mode (BSM) 569
Step 8 Click Save.
The configuration is complete. Events that are retrieved using the log file protocol are displayed on the Log Activity tab of STRM.
Event Generator From the Event Generator list box, select LINEBYLINE.
Table 52-1 Log File Parameters (continued)
Parameter Description
Configuring DSMs

82
SYBASE ASEYou can integrate a Sybase Adaptive Server Enterprise (ASE) device with STRM. A Sybase ASE accepts events using JDBC. Before you configure STRM to integrate with a Sybase ASE device, you must:
Step 1 Configure Sybase auditing.
For information about configuring Sybase auditing, see your Sybase documentation.
Step 2 Log in to the Sybase database as an sa user:
isql -Usa -P<password>
Where <password> is the password necessary to access the database.
Step 3 Switch to the security database:
use sybsecurity
go
Step 4 Create a view for STRM.
create view audit_view
as
select audit_event_name(event) as event_name, * from <audit_table_1>
union
select audit_event_name(event) as event_name, * from <audit_table_2>
go
Step 5 For each additional audit table in the audit configuration, make sure the union select parameter is repeated for each additional audit table.
For example, if you want to configure auditing with four audit tables (sysaudits_01, sysaudits_02,sysaudits_03, sysaudits_04), type the following:
create view audit_view as select audit_event_name(event) as event_name, * from sysaudits_01
union select audit_event_name(event) as event_name, * from sysaudits_02,
union select audit_event_name(event) as event_name, * from sysaudits_03,
Configuring DSMs
572 SYBASE ASE
union select audit_event_name(event) as event_name, * from sysaudits_04
You are now ready to configure the log source STRM.
To configure STRM to receive events from a Sybase ASE device:
Step 1 Log in to STRM.
Step 2 Click the Admin tab.
Step 3 On the navigation menu, click Data Sources.
The Data Sources panel is displayed.
Step 4 Click the Log Sources icon.
The Log Sources window is displayed.
Step 5 Click Add.
The Add a log source window is displayed.
Step 1 From the Log Source Type list box, select the Sybase ASE option.
Step 2 Using the Protocol Configuration list box, select JDBC.
The JDBC protocol configuration is displayed.
Step 3 Update the JDBC configuration to include the following values:
a Database Name: sybsecurity
b Port: 5000 (Default)
c Username: sa
d Table Name: audit_view
e Compare Field: eventtime
The Database Name and Table Name parameters are case sensitive.
For more information on configuring log sources and protocols, see the STRM Log Sources Users Guide. For more information about the Sybase ASE device, see your vendor documentation.
Configuring DSMs
83
SYMANTECThis section provides information on the following DSMs:
• Symantec Endpoint Protection
• Symantec SGS
• Symantec System Center
• Symantec Data Loss Prevention (DLP)
• Symantec PGP Universal Server
Symantec Endpoint Protection
The Symantec Endpoint Protection DSM for STRM accepts events using syslog. STRM records all Audit and Security log events. Before configuring a Symantec Endpoint Protection device in STRM, you must configure your device to forward syslog events.
To integrate a Symantec Endpoint Protection DSM with STRM:
Step 1 Log in to the Symantec Endpoint Protection Manager
Step 2 On the left panel, click the Admin icon.
The View Servers option is displayed.
Step 3 From the bottom of the View Servers panel, click Servers.
Step 4 From the View Servers panel, click Local Site.
Step 5 From the Tasks panel, click Configure External Logging.
Step 6 On the Generals tab:
a Select the Enable Transmission of Logs to a Syslog Server check box.
b In the Syslog Server field, type the IP address of your STRM you want to parse the logs.
c In the UDP Destination Port field, type 514.
d In the Log Facility field, type 6.
Step 7 In the Log Filter tab:
a Under the Management Server Logs, select the Audit Logs check box.
b Under the Client Log panel, select the Security Logs check box.
Configuring DSMs
574 SYMANTEC
c Under the Client Log panel, select the Risks check box.
Step 8 Click OK.
You are now ready to configure the log source in STRM.
To configure STRM to receive events from a Symantec Endpoint Protection device:
From the Log Source Type list box, select the Symantec Endpoint Protection option.
For more information on configuring log sources, see the STRM Log Sources Users Guide.
Symantec SGS The Symantec Gateway Security (SGS) Appliance DSM for STRM accepts SGS events using syslog. STRM records all relevant events from SGS. Before you configure STRM to integrate with an SGS, you must configure syslog within your SGS appliance. For more information on Symantec SGS, see your vendor documentation.
After you configure syslog to forward events to STRM, the configuration is complete. Events forward from Symantec SGS to STRM using syslog are automatically discovered. However, if you want to manually create a log source for Symantec SGS:
From the Log Source Type list box, select the Symantec Gateway Security (SGS) Appliance option.
For more information on configuring devices, see the STRM Log Sources Users Guide.
Symantec System Center
The Symantec System Center (SSC) DSM for STRM retrieves events from an SSC database using a custom view created for STRM. STRM records all SSC events. You must configure the SSC database with a user that has read and write privileges for the custom STRM view to be able to poll the view for information. Symantec System Center (SSC) only supports the JDBC protocol.
To integrate an SSC DSM with STRM:
Step 1 In the Microsoft SQL Server database used by the SSC device, configure a custom default view to support STRM:
The database name must not contain any spaces.
CREATE VIEW dbo.vw_qradar AS SELECT
dbo.alerts.Idx AS idx,
dbo.inventory.IP_Address AS ip,
Configuring DSMs
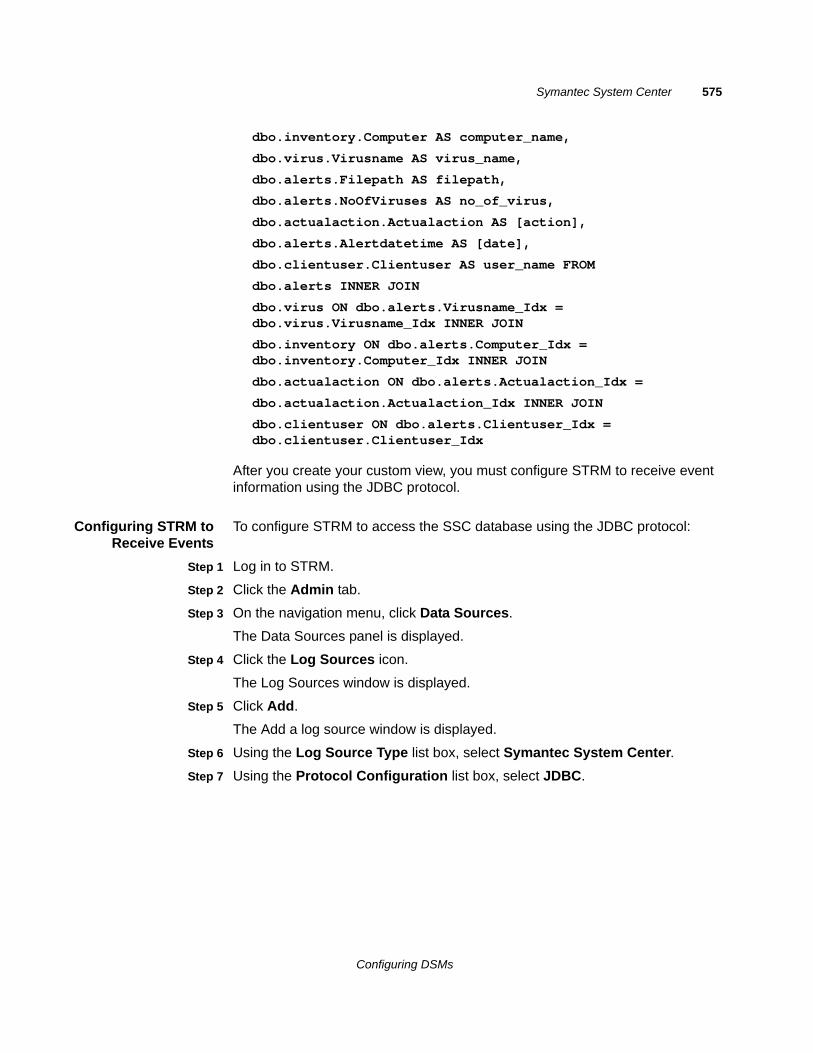
Symantec System Center 575
dbo.inventory.Computer AS computer_name,
dbo.virus.Virusname AS virus_name,
dbo.alerts.Filepath AS filepath,
dbo.alerts.NoOfViruses AS no_of_virus,
dbo.actualaction.Actualaction AS [action],
dbo.alerts.Alertdatetime AS [date],
dbo.clientuser.Clientuser AS user_name FROM
dbo.alerts INNER JOIN
dbo.virus ON dbo.alerts.Virusname_Idx = dbo.virus.Virusname_Idx INNER JOIN
dbo.inventory ON dbo.alerts.Computer_Idx = dbo.inventory.Computer_Idx INNER JOIN
dbo.actualaction ON dbo.alerts.Actualaction_Idx =
dbo.actualaction.Actualaction_Idx INNER JOIN
dbo.clientuser ON dbo.alerts.Clientuser_Idx = dbo.clientuser.Clientuser_Idx
After you create your custom view, you must configure STRM to receive event information using the JDBC protocol.
Configuring STRM toReceive Events
To configure STRM to access the SSC database using the JDBC protocol:
Step 1 Log in to STRM.
Step 2 Click the Admin tab.
Step 3 On the navigation menu, click Data Sources.
The Data Sources panel is displayed.
Step 4 Click the Log Sources icon.
The Log Sources window is displayed.
Step 5 Click Add.
The Add a log source window is displayed.
Step 6 Using the Log Source Type list box, select Symantec System Center.
Step 7 Using the Protocol Configuration list box, select JDBC.
Configuring DSMs
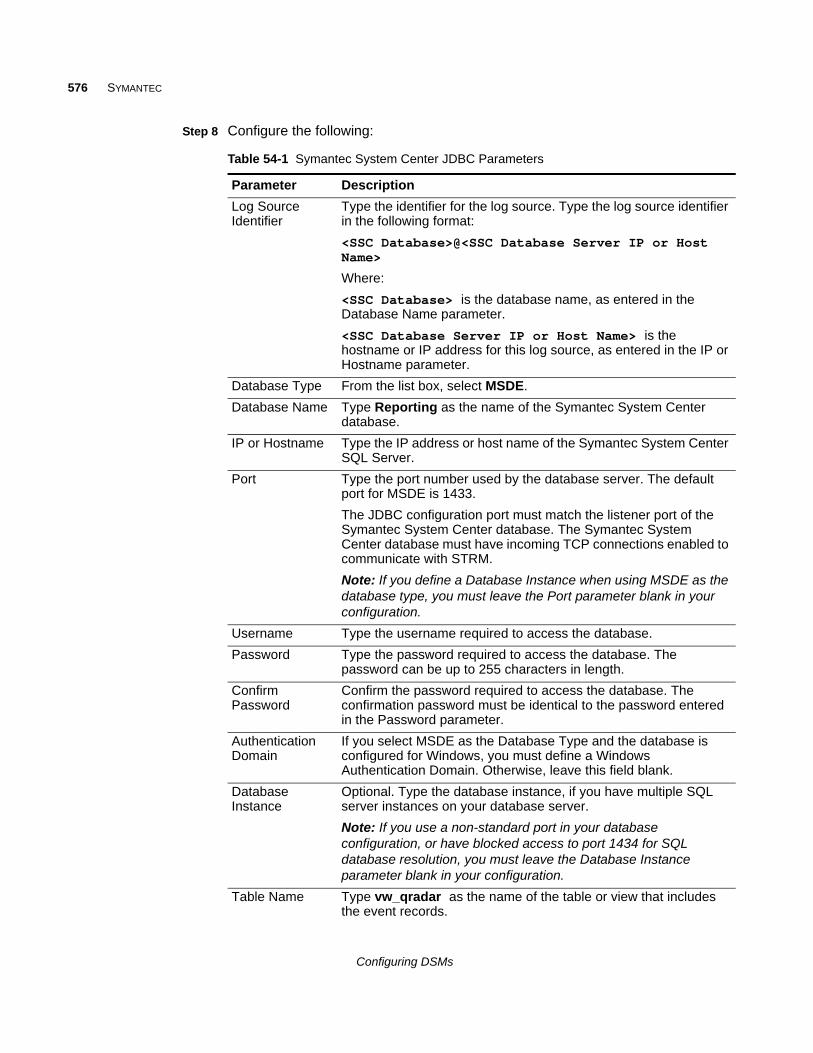
576 SYMANTEC
Step 8 Configure the following:
Table 54-1 Symantec System Center JDBC Parameters
Parameter Description
Log Source Identifier
Type the identifier for the log source. Type the log source identifier in the following format:
<SSC Database>@<SSC Database Server IP or Host Name>
Where:
<SSC Database> is the database name, as entered in the Database Name parameter.
<SSC Database Server IP or Host Name> is the hostname or IP address for this log source, as entered in the IP or Hostname parameter.
Database Type From the list box, select MSDE.
Database Name Type Reporting as the name of the Symantec System Center database.
IP or Hostname Type the IP address or host name of the Symantec System Center SQL Server.
Port Type the port number used by the database server. The default port for MSDE is 1433.
The JDBC configuration port must match the listener port of the Symantec System Center database. The Symantec System Center database must have incoming TCP connections enabled to communicate with STRM.
Note: If you define a Database Instance when using MSDE as the database type, you must leave the Port parameter blank in your configuration.
Username Type the username required to access the database.
Password Type the password required to access the database. The password can be up to 255 characters in length.
Confirm Password
Confirm the password required to access the database. The confirmation password must be identical to the password entered in the Password parameter.
Authentication Domain
If you select MSDE as the Database Type and the database is configured for Windows, you must define a Windows Authentication Domain. Otherwise, leave this field blank.
Database Instance
Optional. Type the database instance, if you have multiple SQL server instances on your database server.
Note: If you use a non-standard port in your database configuration, or have blocked access to port 1434 for SQL database resolution, you must leave the Database Instance parameter blank in your configuration.
Table Name Type vw_qradar as the name of the table or view that includes the event records.
Configuring DSMs
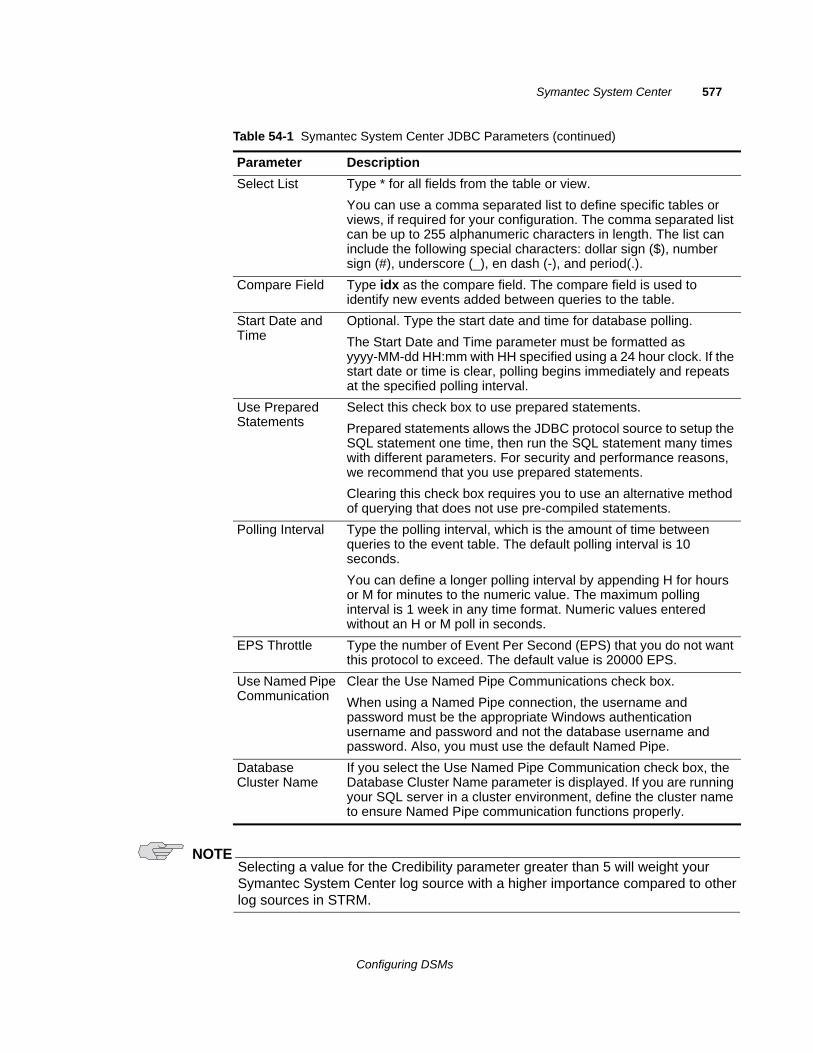
Symantec System Center 577
NOTESelecting a value for the Credibility parameter greater than 5 will weight your Symantec System Center log source with a higher importance compared to other log sources in STRM.
Select List Type * for all fields from the table or view.
You can use a comma separated list to define specific tables or views, if required for your configuration. The comma separated list can be up to 255 alphanumeric characters in length. The list can include the following special characters: dollar sign ($), number sign (#), underscore (_), en dash (-), and period(.).
Compare Field Type idx as the compare field. The compare field is used to identify new events added between queries to the table.
Start Date and Time
Optional. Type the start date and time for database polling.
The Start Date and Time parameter must be formatted as yyyy-MM-dd HH:mm with HH specified using a 24 hour clock. If the start date or time is clear, polling begins immediately and repeats at the specified polling interval.
Use Prepared Statements
Select this check box to use prepared statements.
Prepared statements allows the JDBC protocol source to setup the SQL statement one time, then run the SQL statement many times with different parameters. For security and performance reasons, we recommend that you use prepared statements.
Clearing this check box requires you to use an alternative method of querying that does not use pre-compiled statements.
Polling Interval Type the polling interval, which is the amount of time between queries to the event table. The default polling interval is 10 seconds.
You can define a longer polling interval by appending H for hours or M for minutes to the numeric value. The maximum polling interval is 1 week in any time format. Numeric values entered without an H or M poll in seconds.
EPS Throttle Type the number of Event Per Second (EPS) that you do not want this protocol to exceed. The default value is 20000 EPS.
Use Named Pipe Communication
Clear the Use Named Pipe Communications check box.
When using a Named Pipe connection, the username and password must be the appropriate Windows authentication username and password and not the database username and password. Also, you must use the default Named Pipe.
Database Cluster Name
If you select the Use Named Pipe Communication check box, the Database Cluster Name parameter is displayed. If you are running your SQL server in a cluster environment, define the cluster name to ensure Named Pipe communication functions properly.
Table 54-1 Symantec System Center JDBC Parameters (continued)
Parameter Description
Configuring DSMs
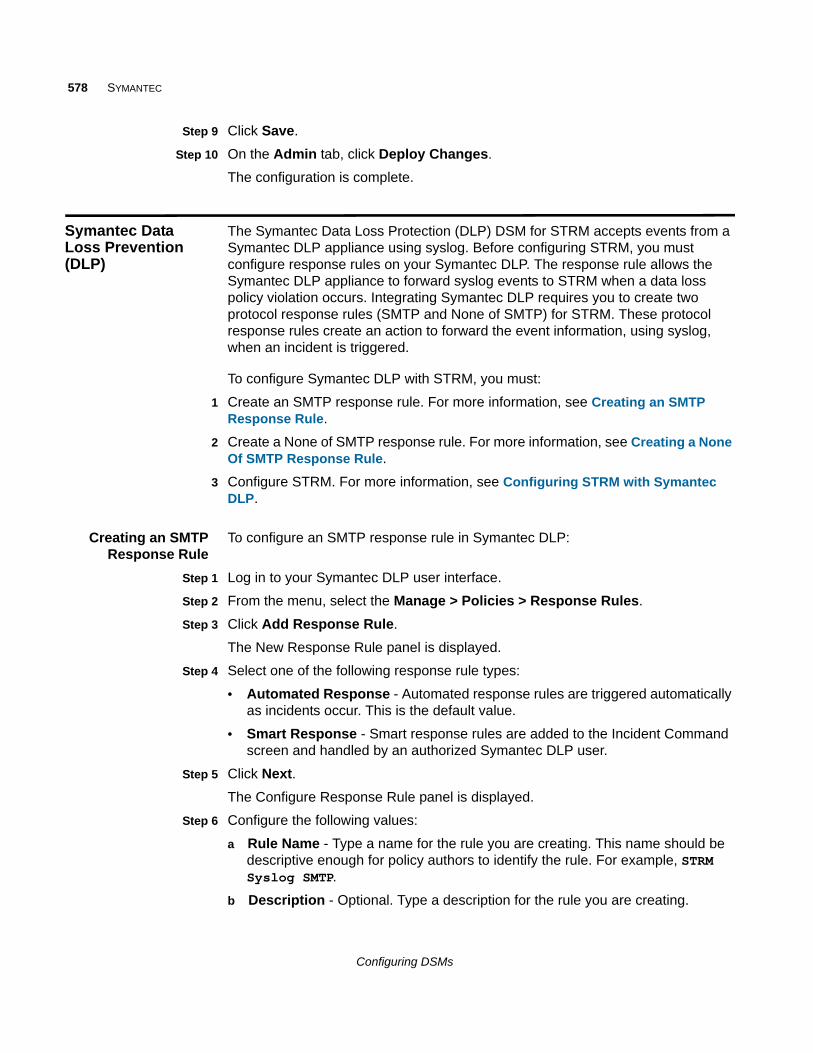
578 SYMANTEC
Step 9 Click Save.
Step 10 On the Admin tab, click Deploy Changes.
The configuration is complete.
Symantec Data Loss Prevention (DLP)
The Symantec Data Loss Protection (DLP) DSM for STRM accepts events from a Symantec DLP appliance using syslog. Before configuring STRM, you must configure response rules on your Symantec DLP. The response rule allows the Symantec DLP appliance to forward syslog events to STRM when a data loss policy violation occurs. Integrating Symantec DLP requires you to create two protocol response rules (SMTP and None of SMTP) for STRM. These protocol response rules create an action to forward the event information, using syslog, when an incident is triggered.
To configure Symantec DLP with STRM, you must:
1 Create an SMTP response rule. For more information, see Creating an SMTP Response Rule.
2 Create a None of SMTP response rule. For more information, see Creating a None Of SMTP Response Rule.
3 Configure STRM. For more information, see Configuring STRM with Symantec DLP.
Creating an SMTPResponse Rule
To configure an SMTP response rule in Symantec DLP:
Step 1 Log in to your Symantec DLP user interface.
Step 2 From the menu, select the Manage > Policies > Response Rules.
Step 3 Click Add Response Rule.
The New Response Rule panel is displayed.
Step 4 Select one of the following response rule types:
• Automated Response - Automated response rules are triggered automatically as incidents occur. This is the default value.
• Smart Response - Smart response rules are added to the Incident Command screen and handled by an authorized Symantec DLP user.
Step 5 Click Next.
The Configure Response Rule panel is displayed.
Step 6 Configure the following values:
a Rule Name - Type a name for the rule you are creating. This name should be descriptive enough for policy authors to identify the rule. For example, STRM Syslog SMTP.
b Description - Optional. Type a description for the rule you are creating.
Configuring DSMs
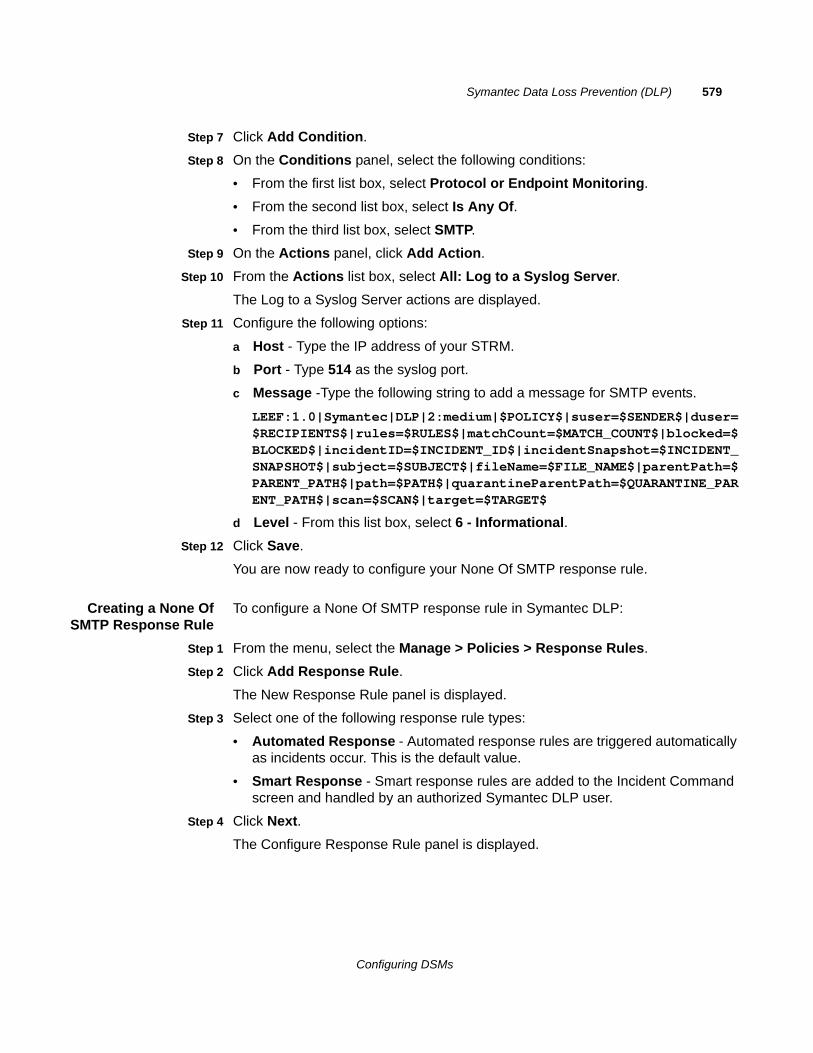
Symantec Data Loss Prevention (DLP) 579
Step 7 Click Add Condition.
Step 8 On the Conditions panel, select the following conditions:
• From the first list box, select Protocol or Endpoint Monitoring.
• From the second list box, select Is Any Of.
• From the third list box, select SMTP.
Step 9 On the Actions panel, click Add Action.
Step 10 From the Actions list box, select All: Log to a Syslog Server.
The Log to a Syslog Server actions are displayed.
Step 11 Configure the following options:
a Host - Type the IP address of your STRM.
b Port - Type 514 as the syslog port.
c Message -Type the following string to add a message for SMTP events.
LEEF:1.0|Symantec|DLP|2:medium|$POLICY$|suser=$SENDER$|duser=$RECIPIENTS$|rules=$RULES$|matchCount=$MATCH_COUNT$|blocked=$BLOCKED$|incidentID=$INCIDENT_ID$|incidentSnapshot=$INCIDENT_SNAPSHOT$|subject=$SUBJECT$|fileName=$FILE_NAME$|parentPath=$PARENT_PATH$|path=$PATH$|quarantineParentPath=$QUARANTINE_PARENT_PATH$|scan=$SCAN$|target=$TARGET$
d Level - From this list box, select 6 - Informational.
Step 12 Click Save.
You are now ready to configure your None Of SMTP response rule.
Creating a None OfSMTP Response Rule
To configure a None Of SMTP response rule in Symantec DLP:
Step 1 From the menu, select the Manage > Policies > Response Rules.
Step 2 Click Add Response Rule.
The New Response Rule panel is displayed.
Step 3 Select one of the following response rule types:
• Automated Response - Automated response rules are triggered automatically as incidents occur. This is the default value.
• Smart Response - Smart response rules are added to the Incident Command screen and handled by an authorized Symantec DLP user.
Step 4 Click Next.
The Configure Response Rule panel is displayed.
Configuring DSMs
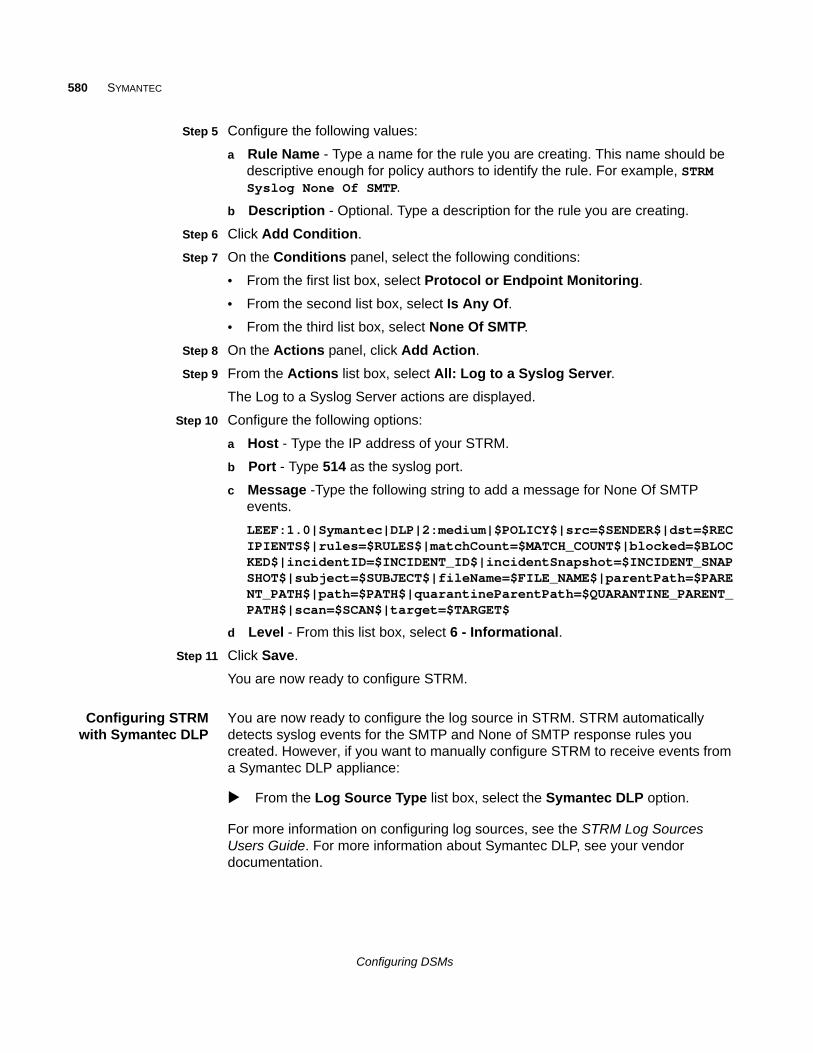
580 SYMANTEC
Step 5 Configure the following values:
a Rule Name - Type a name for the rule you are creating. This name should be descriptive enough for policy authors to identify the rule. For example, STRM Syslog None Of SMTP.
b Description - Optional. Type a description for the rule you are creating.
Step 6 Click Add Condition.
Step 7 On the Conditions panel, select the following conditions:
• From the first list box, select Protocol or Endpoint Monitoring.
• From the second list box, select Is Any Of.
• From the third list box, select None Of SMTP.
Step 8 On the Actions panel, click Add Action.
Step 9 From the Actions list box, select All: Log to a Syslog Server.
The Log to a Syslog Server actions are displayed.
Step 10 Configure the following options:
a Host - Type the IP address of your STRM.
b Port - Type 514 as the syslog port.
c Message -Type the following string to add a message for None Of SMTP events.
LEEF:1.0|Symantec|DLP|2:medium|$POLICY$|src=$SENDER$|dst=$RECIPIENTS$|rules=$RULES$|matchCount=$MATCH_COUNT$|blocked=$BLOCKED$|incidentID=$INCIDENT_ID$|incidentSnapshot=$INCIDENT_SNAPSHOT$|subject=$SUBJECT$|fileName=$FILE_NAME$|parentPath=$PARENT_PATH$|path=$PATH$|quarantineParentPath=$QUARANTINE_PARENT_PATH$|scan=$SCAN$|target=$TARGET$
d Level - From this list box, select 6 - Informational.
Step 11 Click Save.
You are now ready to configure STRM.
Configuring STRMwith Symantec DLP
You are now ready to configure the log source in STRM. STRM automatically detects syslog events for the SMTP and None of SMTP response rules you created. However, if you want to manually configure STRM to receive events from a Symantec DLP appliance:
From the Log Source Type list box, select the Symantec DLP option.
For more information on configuring log sources, see the STRM Log Sources Users Guide. For more information about Symantec DLP, see your vendor documentation.
Configuring DSMs
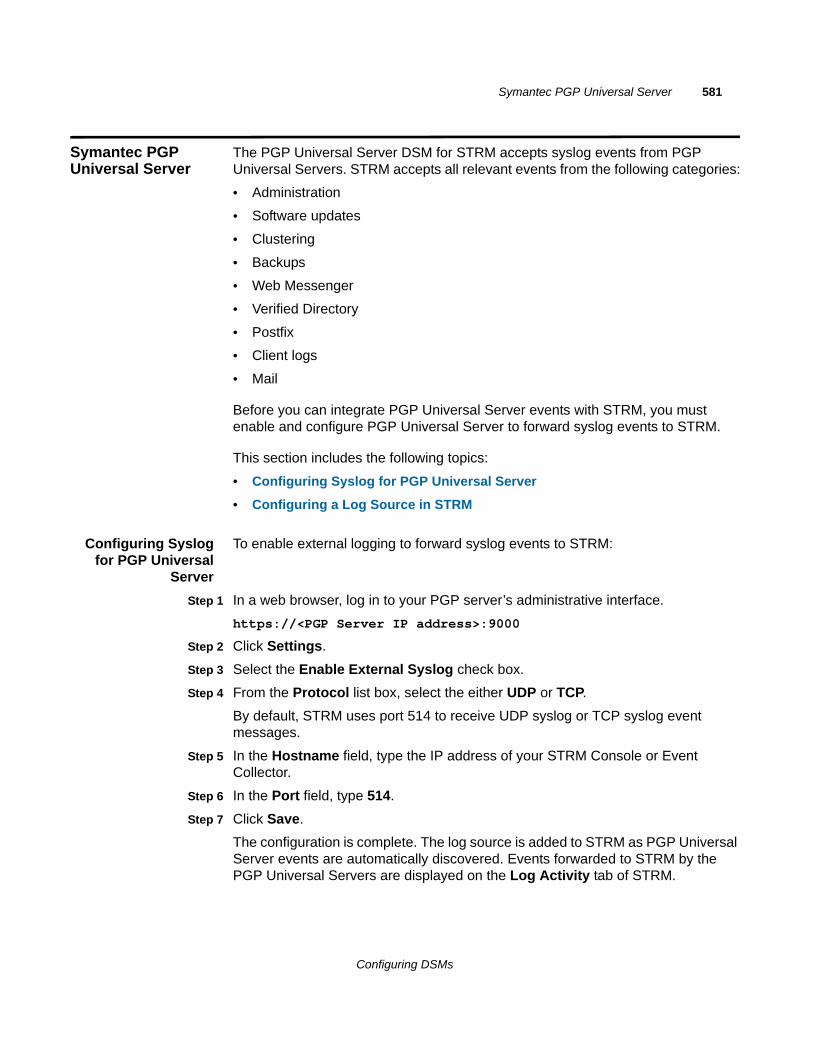
Symantec PGP Universal Server 581
Symantec PGP Universal Server
The PGP Universal Server DSM for STRM accepts syslog events from PGP Universal Servers. STRM accepts all relevant events from the following categories:
• Administration
• Software updates
• Clustering
• Backups
• Web Messenger
• Verified Directory
• Postfix
• Client logs
Before you can integrate PGP Universal Server events with STRM, you must enable and configure PGP Universal Server to forward syslog events to STRM.
This section includes the following topics:
• Configuring Syslog for PGP Universal Server
• Configuring a Log Source in STRM
Configuring Syslogfor PGP Universal
Server
To enable external logging to forward syslog events to STRM:
Step 1 In a web browser, log in to your PGP server’s administrative interface.
https://<PGP Server IP address>:9000
Step 2 Click Settings.
Step 3 Select the Enable External Syslog check box.
Step 4 From the Protocol list box, select the either UDP or TCP.
By default, STRM uses port 514 to receive UDP syslog or TCP syslog event messages.
Step 5 In the Hostname field, type the IP address of your STRM Console or Event Collector.
Step 6 In the Port field, type 514.
Step 7 Click Save.
The configuration is complete. The log source is added to STRM as PGP Universal Server events are automatically discovered. Events forwarded to STRM by the PGP Universal Servers are displayed on the Log Activity tab of STRM.
Configuring DSMs
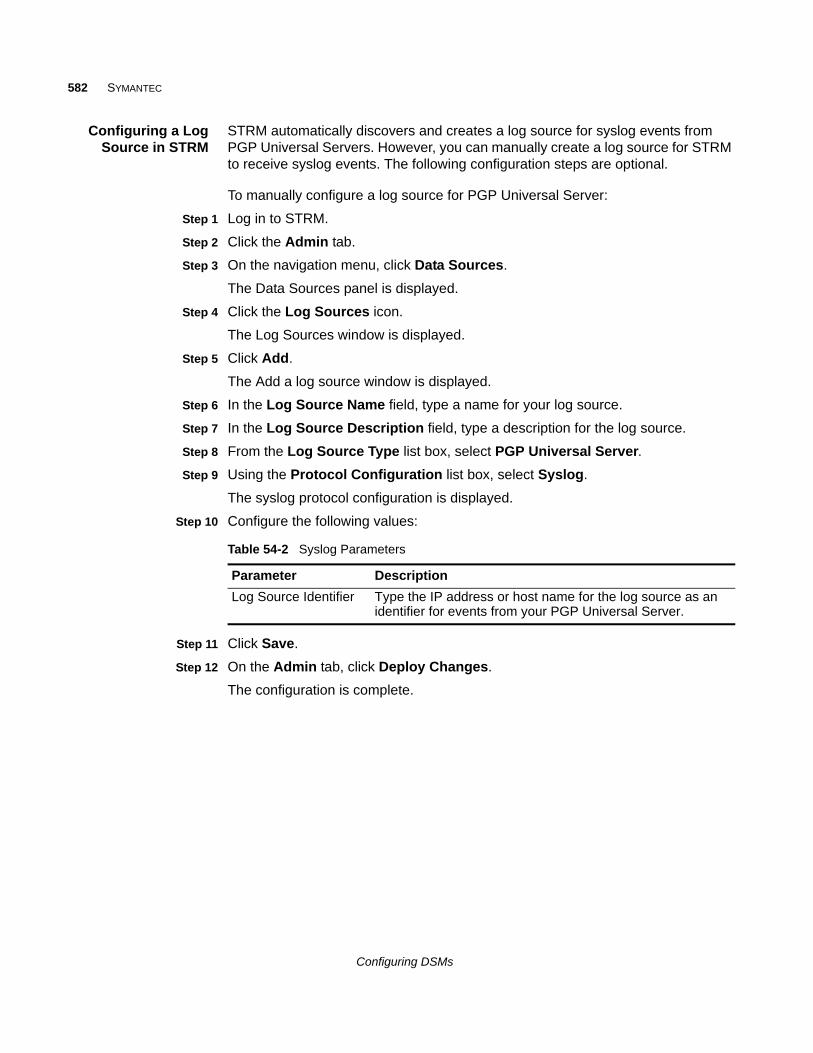
582 SYMANTEC
Configuring a LogSource in STRM
STRM automatically discovers and creates a log source for syslog events from PGP Universal Servers. However, you can manually create a log source for STRM to receive syslog events. The following configuration steps are optional.
To manually configure a log source for PGP Universal Server:
Step 1 Log in to STRM.
Step 2 Click the Admin tab.
Step 3 On the navigation menu, click Data Sources.
The Data Sources panel is displayed.
Step 4 Click the Log Sources icon.
The Log Sources window is displayed.
Step 5 Click Add.
The Add a log source window is displayed.
Step 6 In the Log Source Name field, type a name for your log source.
Step 7 In the Log Source Description field, type a description for the log source.
Step 8 From the Log Source Type list box, select PGP Universal Server.
Step 9 Using the Protocol Configuration list box, select Syslog.
The syslog protocol configuration is displayed.
Step 10 Configure the following values:
Step 11 Click Save.
Step 12 On the Admin tab, click Deploy Changes.
The configuration is complete.
Table 54-2 Syslog Parameters
Parameter Description
Log Source Identifier Type the IP address or host name for the log source as an identifier for events from your PGP Universal Server.
Configuring DSMs
84
SYMARKSymark PowerBroker logs all events to a multi-line format in a single event log file, which is viewed using Symark's pblog utility. PowerBroker pblogs must be re-formatted using a script and forwarded to STRM. This configuration requires you download and configure a script for your Symark PowerBroker appliance before you can forward events to STRM.
This section includes the following topics:
• Configuring Symark PowerBroker
• Manually Configuring a Symark Log Source
Configuring SymarkPowerBroker
To configure a Symark PowerBroker device to forward syslog to STRM:
Step 1 On the Juniper customer support website, download the following file:
pbforwarder.pl.gz
The script can be downloaded from the following link:
https://kb.juniper.net/InfoCenter/KB25652
Step 2 Copy the file to the device that hosts Symark PowerBroker.
NOTEPerl 5.8 must be installed on the device that hosts Symark PowerBroker.
Step 3 Type the following command to extract the file:
gzip -d pbforwarder.pl.gz
Step 4 Type the following command to set the script file permissions:
chmod +x pbforwarder.pl
Step 5 Using SSH, log in to the device that hosts Symark PowerBroker.
The credentials used to log in must have read, write, and execute permissions for the log file.
Configuring DSMs
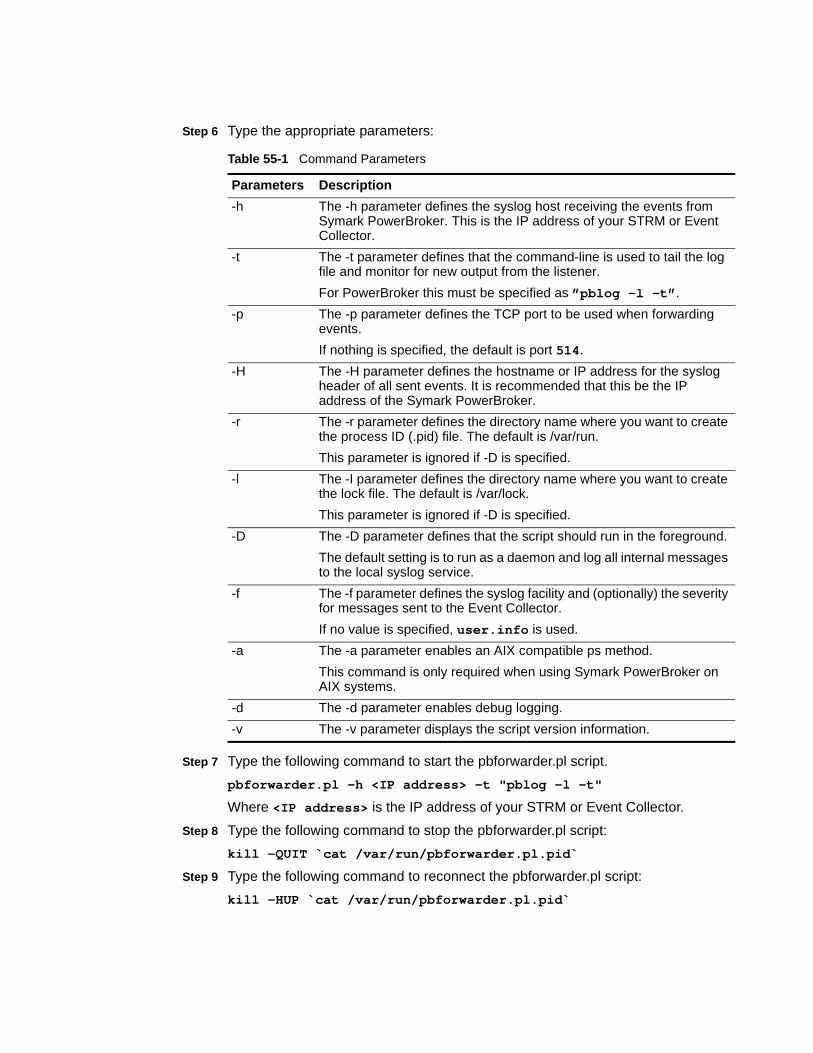
Step 6 Type the appropriate parameters:
Step 7 Type the following command to start the pbforwarder.pl script.
pbforwarder.pl -h <IP address> -t "pblog -l -t"
Where <IP address> is the IP address of your STRM or Event Collector.
Step 8 Type the following command to stop the pbforwarder.pl script:
kill -QUIT `cat /var/run/pbforwarder.pl.pid`
Step 9 Type the following command to reconnect the pbforwarder.pl script:
kill -HUP `cat /var/run/pbforwarder.pl.pid`
Table 55-1 Command Parameters
Parameters Description
-h The -h parameter defines the syslog host receiving the events from Symark PowerBroker. This is the IP address of your STRM or Event Collector.
-t The -t parameter defines that the command-line is used to tail the log file and monitor for new output from the listener.
For PowerBroker this must be specified as ”pblog -l -t”.
-p The -p parameter defines the TCP port to be used when forwarding events.
If nothing is specified, the default is port 514.
-H The -H parameter defines the hostname or IP address for the syslog header of all sent events. It is recommended that this be the IP address of the Symark PowerBroker.
-r The -r parameter defines the directory name where you want to create the process ID (.pid) file. The default is /var/run.
This parameter is ignored if -D is specified.
-l The -I parameter defines the directory name where you want to create the lock file. The default is /var/lock.
This parameter is ignored if -D is specified.
-D The -D parameter defines that the script should run in the foreground.
The default setting is to run as a daemon and log all internal messages to the local syslog service.
-f The -f parameter defines the syslog facility and (optionally) the severity for messages sent to the Event Collector.
If no value is specified, user.info is used.
-a The -a parameter enables an AIX compatible ps method.
This command is only required when using Symark PowerBroker on AIX systems.
-d The -d parameter enables debug logging.
-v The -v parameter displays the script version information.
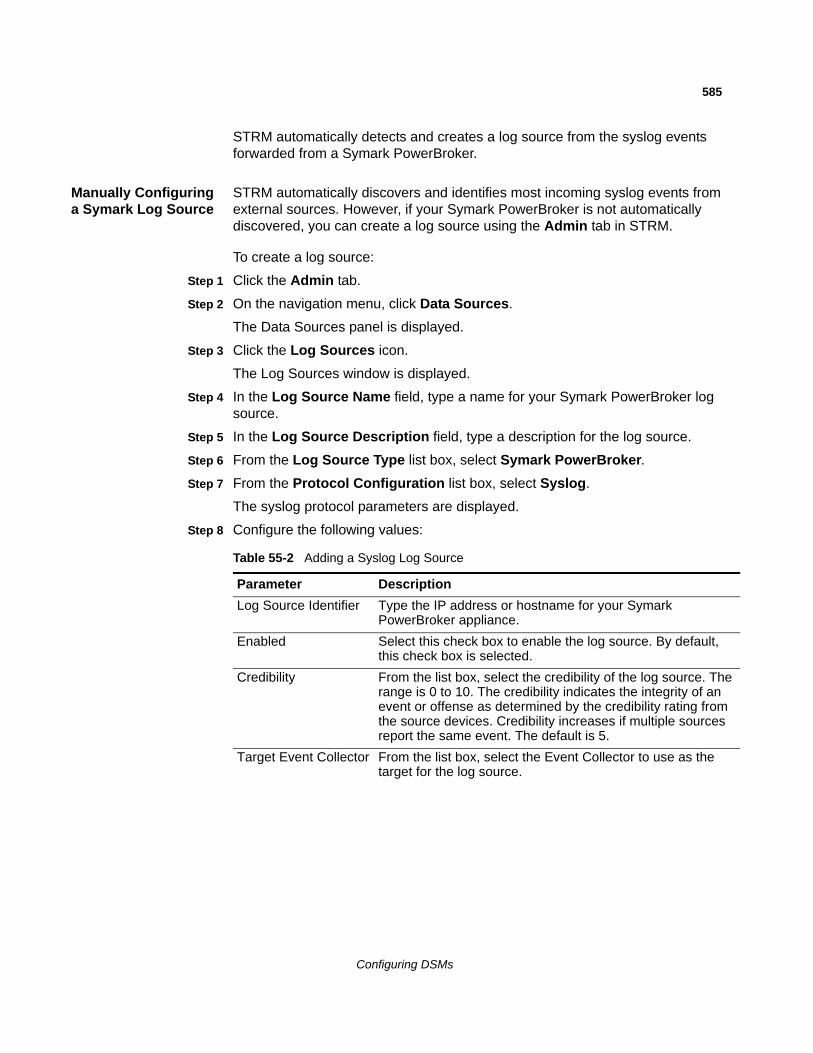
585
STRM automatically detects and creates a log source from the syslog events forwarded from a Symark PowerBroker.
Manually Configuringa Symark Log Source
STRM automatically discovers and identifies most incoming syslog events from external sources. However, if your Symark PowerBroker is not automatically discovered, you can create a log source using the Admin tab in STRM.
To create a log source:
Step 1 Click the Admin tab.
Step 2 On the navigation menu, click Data Sources.
The Data Sources panel is displayed.
Step 3 Click the Log Sources icon.
The Log Sources window is displayed.
Step 4 In the Log Source Name field, type a name for your Symark PowerBroker log source.
Step 5 In the Log Source Description field, type a description for the log source.
Step 6 From the Log Source Type list box, select Symark PowerBroker.
Step 7 From the Protocol Configuration list box, select Syslog.
The syslog protocol parameters are displayed.
Step 8 Configure the following values:
Table 55-2 Adding a Syslog Log Source
Parameter Description
Log Source Identifier Type the IP address or hostname for your Symark PowerBroker appliance.
Enabled Select this check box to enable the log source. By default, this check box is selected.
Credibility From the list box, select the credibility of the log source. The range is 0 to 10. The credibility indicates the integrity of an event or offense as determined by the credibility rating from the source devices. Credibility increases if multiple sources report the same event. The default is 5.
Target Event Collector From the list box, select the Event Collector to use as the target for the log source.
Configuring DSMs
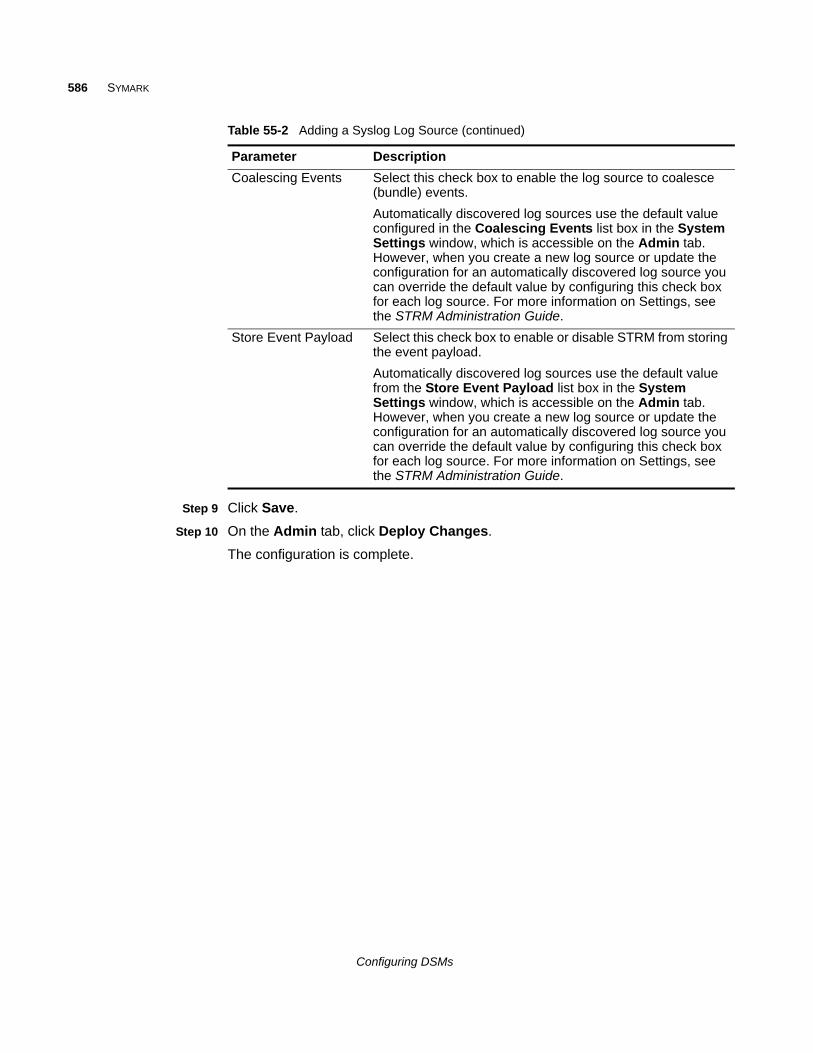
586 SYMARK
Step 9 Click Save.
Step 10 On the Admin tab, click Deploy Changes.
The configuration is complete.
Coalescing Events Select this check box to enable the log source to coalesce (bundle) events.
Automatically discovered log sources use the default value configured in the Coalescing Events list box in the System Settings window, which is accessible on the Admin tab. However, when you create a new log source or update the configuration for an automatically discovered log source you can override the default value by configuring this check box for each log source. For more information on Settings, see the STRM Administration Guide.
Store Event Payload Select this check box to enable or disable STRM from storing the event payload.
Automatically discovered log sources use the default value from the Store Event Payload list box in the System Settings window, which is accessible on the Admin tab. However, when you create a new log source or update the configuration for an automatically discovered log source you can override the default value by configuring this check box for each log source. For more information on Settings, see the STRM Administration Guide.
Table 55-2 Adding a Syslog Log Source (continued)
Parameter Description
Configuring DSMs
85
TIPPING POINTThis section provides information on the following DSMs:
• Tipping Point Intrusion Prevention System
• Tipping Point X505/X506 Device
Tipping Point Intrusion Prevention System
The Tipping Point Intrusion Prevention System (IPS) DSM for STRM accepts Tipping Point events using syslog. STRM records all relevant events from either a Local Security Management (LMS) device or multiple devices with a Security Management System (SMS).
Before you configure STRM to integrate with Tipping Point, you must configure your device based on type:
• If you are using an SMS, see Configuring SMS Remote Syslog for Events.
• If you are using an LSM, see Configuring the Notification Contacts for LSM.
Configuring SMSRemote Syslog for
Events
To configure Tipping Point for SMS, you must enable and configure your appliance to forward events to a remote host using syslog.
To configure your Tipping Point SMS:
Step 1 Log in to the Tipping Point system.
Step 2 On the Admin Navigation menu, select Server Properties.
Step 3 Select the Management tab.
Step 4 Click Add.
The Edit Syslog Notification window is displayed.
Step 5 Select the Enable check box.
Step 6 Configure the following values:
a Syslog Server - Type the IP address of the STRM to receive syslog event messages.
b Port - Type 514 as the port address.
c Log Type - Select SMS 2.0 / 2.1 Syslog format from the list box.
Configuring DSMs
588 TIPPING POINT
d Facility - Select Log Audit from the list box.
e Severity - Select Severity in Event from the list box.
f Delimiter - Select TAB as the delimiter for the generated logs.
g Include Timestamp in Header - Select Use original event timestamp.
Step 7 Select the Include SMS Hostname in Header check box.
Step 8 Click OK.
You are now ready to configure the log source in STRM.
To configure STRM to receive events from a Tipping Point device:
From the Log Source Type list box, select the Tipping Point Intrusion Prevention System (IPS) option.
For more information on configuring log sources, see the STRM Log Sources Users Guide. For more information about your Tipping Point device, see your vendor documentation.
Configuring theNotification Contacts
for LSM
To configure LSM notification contacts:
Step 1 Log in to the Tipping Point system.
Step 2 From the LSM menu, select IPS > Action Sets.
The IPS Profile - Action Sets window is displayed.
Step 3 Click the Notification Contacts tab.
Step 4 In the Contacts List, click Remote System Log.
The Edit Notification Contact page is displayed.
Step 5 Configure the following values:
a Syslog Server - Type the IP address of the STRM to receive syslog event messages.
b Port - Type 514 as the port address.
c Alert Facility - Select none or a numeric value 0-31 from the list box. Syslog uses these numbers to identify the message source.
d Block Facility - Select none or a numeric value 0-31 from the list box. Syslog uses these numbers to identify the message source.
e Delimiter - Select TAB from the list box.
Step 6 Click Add to table below.
Configuring DSMs
Tipping Point Intrusion Prevention System 589
Step 7 Configure a Remote system log aggregation period in minutes.
NOTEIf your STRM resides in a different subnet than your Tipping Point device, you might have to add static routes. For more information, see your vendor documentation.
Step 8 Click Save.
You are now ready to configure the action set for your LSM, see Configuring an Action Set for LSM.
Configuring anAction Set for LSM
To configure an action set for your LSM:
Step 1 Log in to the Tipping Point system.
Step 2 From the LSM menu, select IPS > Action Sets.
The IPS Profile - Action Sets window is displayed.
Step 3 Click Create Action Set.
The Create/Edit Action Set window is displayed.
Step 4 Type the Action Set Name.
Step 5 For Actions, select a flow control action setting:
• Permit - Allows traffic.
• Rate Limit - Limits the speed of traffic. If you select Rate Limit, you must also select the desired rate.
• Block - Does not permit traffic.
• TCP Reset - When used with the Block action, resets the source, destination, or both IP addresses of an attack. This option resets blocked TCP flows.
• Quarantine - When used with the Block action, blocks an IP address (source or destination) that triggers the filter.
Step 6 Select the Remote System Log check box for each action you have selected.
Step 7 Click Create.
Step 8 You are now ready to configure the log source in STRM.
To configure STRM to receive events from a Tipping Point device.
From the Log Source Type list box, select the Tipping Point Intrusion Prevention System (IPS) option.
For more information on configuring log sources, see the STRM Log Sources Users Guide. For more information about your Tipping Point device, see your vendor documentation.
Configuring DSMs
590 TIPPING POINT
Tipping Point X505/X506 Device
The Tipping Point X505/X506 DSM for STRM accepts events using syslog. STRM records all relevant system, audit, VPN, and firewall session events.
To configure your device to forward events to STRM:
Step 1 Log in to the Tipping Point X505/X506 device.
Step 2 From the LSM menu, select System > Configuration > Syslog Servers.
The Syslog Servers window is displayed.
Step 3 For each log type you want to forward, select a check box and type the IP address of your STRM.
NOTEIf your STRM resides in a different subnet than your Tipping Point device, you might have to add static routes. For more information, see your vendor documentation.
Step 4 You are now ready to configure the log source in STRM.
To configure STRM to receive events from a Tipping Point X505/X506 device:
From the Log Source Type list box, select the Tipping Point X Series Appliances option.
For more information on configuring log sources, see the STRM Log Sources Users Guide.
NOTEIf you have a previously configured Tipping Point X505/X506 DSM installed and configured on your STRM, the Tipping Point X Series Appliances option is still displayed in the Log Source Type list box. However, any new Tipping Point X505/X506 DSM you configure, you must select the Tipping Point Intrusion Prevention System (IPS) option.
Configuring DSMs
86
TOP LAYER IPSThe Top Layer IPS DSM for STRM accepts Top Layer IPS events using syslog. STRM records and processes Top Layer events. Before you configure STRM to integrate with a Top Layer device, you must configure syslog within your Top Layer IPS device. For more information on configuring Top Layer, see your Top Layer documentation.
The configuration is complete. The log source is added to STRM as Top Layer IPS events are automatically discovered. Events forwarded to STRM by Top Layer IPS are displayed on the Log Activity tab of STRM.
To configure STRM to receive events from a Top Layer IPS device:
From the Log Source Type list box, select the Top Layer Intrusion Prevention System (IPS) option.
For more information on configuring log sources, see the STRM Log Sources Users Guide. For more information about your Top Layer device, see your vendor documentation.
Configuring DSMs

87
TREND MICROThis section provides information on the following DSMs:
• Trend Micro InterScan VirusWall
• Trend Micro Control Manager
• Trend Micro Office Scan
• Trend Micro Deep Discovery
Trend Micro InterScan VirusWall
The Trend Micro InterScan VirusWall DSM for STRM accepts events using syslog. You can integrate InterScan VirusWall logs with STRM using the Adaptive Log Exporter. For more information on the Adaptive Log Exporter, see the STRM Adaptive Log Exporter Users Guide.
After you configure the Adaptive Log Exporter, the configuration is complete. The log source is added to STRM as Trend Micro InterScan VirusWall events are automatically discovered. Events forwarded to STRM by Trend Micro InterScan VirusWall are displayed on the Log Activity tab of STRM.
To manually configure STRM to receive events from an InterScan VirusWall device:
From the Log Source Type list box, select the Trend InterScan VirusWall option.
For more information on configuring devices, see the STRM Log Sources Users Guide. For more information about your Trend Micro InterScan VirusWall device, see your vendor documentation.
Trend Micro Control Manager
You can integrate a Trend Micro Control Manager device with STRM. A Trend Micro Control Manager accepts events using SNMPv1 or SNMPv2. Before you configure STRM to integrate with a Trend Micro Control Manager device, you must configure the SNMP trap settings for your Trend Micro Control Manager.
Configuring DSMs
594 TREND MICRO
This section includes the following topics:
• Configuring Trend Micro Control Manager
• Configuring a Log Source in STRM
Configuring TrendMicro Control
Manager
To configure SNMP traps for Trend Micro Control Manager:
NOTETrend Micro Control Manager v5.5 requires hotfix 1697 or hotfix 1713 after Service Pack 1 Patch 1 to provide correctly formatted SNMPv2c events. For more information, see your vendor documentation.
Step 1 Log in to the Trend Micro Control Manager device.
Step 2 Select Administration > Settings > Event Center Settings.
Step 3 Set the SNMP trap notifications:
a In the SNMP Trap Settings field, type the Community Name.
b Type the STRM server IP address.
Step 4 Click Save.
You are now ready to configure events in the Event Center.
Step 1 Select Administration > Event Center.
Step 2 From the Event Category list, expand Alert.
Step 3 Click Recipients for an alert.
Step 4 In Notification methods, select the SNMP Trap Notification check box.
Step 5 Click Save.
The Edit Recipients Result window is displayed.
Step 6 Click OK.
Step 7 Repeat Step 2 to Step 6 for every alert that requires an SNMP Trap Notification.
You are now ready to configure the log source in STRM.
Configuring a LogSource in STRM
STRM does not automatically discover SNMP events from Trend Micro Control Manager. You must configure an SNMP log source for your Trend Micro Control Manager to use the SNMPv1 or SNMPv2 protocol. SNMPv3 is not supported by Trend Micro Control Manager.
To manually configure a SNMP log source:
Step 1 Log in to STRM.
Step 2 Click the Admin tab.
Step 3 On the navigation menu, click Data Sources.
The Data Sources panel is displayed.
Configuring DSMs
Trend Micro Office Scan 595
Step 4 Click the Log Sources icon.
The Log Sources window is displayed.
Step 5 Click Add.
The Add a log source window is displayed.
Step 6 In the Log Source Name field, type a name for your log source.
Step 7 In the Log Source Description field, type a description for the log source.
Step 8 From the Log Source Type list box, select Trend Micro Control Manager.
Step 9 Using the Protocol Configuration list box, select SNMPv2.
SNMPv3 is not supported by Trend Micro Control Manager.
Step 10 Configure the following values:
Step 11 Click Save.
Step 12 On the Admin tab, click Deploy Changes.
The configuration is complete. Events from Trend Micro Control Manager are displayed on the Log Activity tab of STRM. For more information on Trend Micro Control Manager, see your vendor documentation.
Trend Micro Office Scan
A Trend Micro Office Scan DSM for STRM accepts events using SNMPv2. STRM records events relevant to virus and spyware events. Before configuring a Trend Micro device in STRM, you must configure your device to forward SNMPv2 events. STRM has two options for integrating to a Trend Micro device depending on your device version:
• Integrating a Trend Micro Office Scan 8.x Device
• Integrating a Trend Micro Office Scan 10.x Device
Table 58-1 SNMPv2 Parameters
Parameter Description
Log Source Identifier Type the IP address or host name for the log source as an identifier for events from your Trend Micro Control Manager appliance.
Community Type the SNMP community name required to access the system containing SNMP events. The default is Public.
Include OIDs in Event Payload
Clear the Include OIDs in Event Payload check box, if selected.
This options allows the SNMP event payload to be constructed using name-value pairs instead of the standard event payload format. Including OIDs in the event payload is required for processing SNMPv2 or SNMPv3 events from certain DSMs.
Configuring DSMs
596 TREND MICRO
Integrating a TrendMicro Office Scan 8.x
Device
To integrate a Trend Micro Office Scan 8.x device with STRM:
Step 1 Log in to the Office Scan Administration interface.
Step 2 Select Notifications.
Step 3 Configure the General Settings for SNMP Traps:
a In the Server IP Address field, type the IP address of the STRM.
NOTEDo not change the community trap information.
b Click Save.
Step 4 Configure the Standard Alert Notification:
a Select Standard Notifications.
b Click the SNMP Trap tab.
c Select the Enable notification via SNMP Trap for Virus/Malware Detections check box.
d Type the following message in the field (this should be the default):
Virus/Malware: %vComputer: %sDomain: %mFile: %pDate/Time: %yResult: %a
e Select the Enable notification via SNMP Trap for Spyware/Grayware Detections check box.
f Type the following message in the field (this should be the default):
Spyware/Grayware: %vComputer: %sDomain: %mDate/Time: %yResult: %a
Step 5 Click Save.
Step 6 Configure Outbreak Alert Notifications:
a Select Out Notifications.
b Click the SNMP Trap tab.
c Select the Enable notification via SNMP Trap for Virus/Malware Outbreaks check box.
d Type the following message in the field (this should be the default):
Number of viruses/malware: %CVNumber of computers: %CC
Configuring DSMs
Trend Micro Office Scan 597
Log Type Exceeded: %ANumber of firewall violation logs: %CNumber of shared folder sessions: %STime Period: %T
e Select the Enable notification via SNMP Trap for Spyware/Grayware Outbreaks check box.
f Type the following message in the field (this should be the default):
Number of spyware/grayware: %CVNumber of computers: %CCLog Type Exceeded: %ANumber of firewall violation logs: %CNumber of shared folder sessions: %STime Period: %T
g Click Save.
Step 7 You are now ready to configure the log sources in STRM.
To configure the Trend Micro Office Scan device:
Step 1 From the Log Source Type list box, select the Trend Micro Office Scan option.
Step 2 From the Protocol Configuration list box, select the SNMPv2 option.
For more information on configuring log sources, see the STRM Log Sources Users Guide.
Integrating a TrendMicro Office Scan
10.x Device
Before you configure STRM to integrate with a Trend Micro Office Scan 10.x device, you must:
1 Configure the SNMP settings for Trend Micro Office Scan 10.x. See Configuring General Settings.
2 Configure standard notifications. See Configuring Standard Notifications.
3 Configure outbreak criteria and alert notifications. See Configuring Outbreak Criteria and Alert Notifications.
Configuring General Settings
To integrate a Trend Micro Office Scan 10.x device with STRM:
Step 1 Log in to the Office Scan Administration interface.
Step 2 Select Notifications > Administrator Notifications > General Settings.
Step 3 Configure the General Settings for SNMP Traps:
a In the Server IP Address field, type the IP address of your STRM.
b Type a community name for your Trend Micro Office Scan device.
c Click Save.
You must now configure the Standard Notifications for Office Scan.
Configuring DSMs
598 TREND MICRO
Configuring Standard Notifications
To configure standard notifications:
Step 1 Select Notifications > Administrator Notifications > Standard Notifications.
Step 2 Define the Criteria settings.
a Click the Criteria tab.
b Select the option to alert administrators on the detection of virus/malware and spyware/grayware, or when the action on these security risks is unsuccessful.
Step 3 To enable notifications:
a Configure the SNMP Trap tab.
b Select the Enable notification via SNMP Trap check box.
c Type the following message in the field:
Virus/Malware: %vSpyware/Grayware: %TComputer: %sIP address: %iDomain: %mFile: %pDate/Time: %yResult: %aUser name: %n
Step 4 Click Save.
You must now configure Outbreak Notifications.
Configuring Outbreak Criteria and Alert Notifications
To configure outbreak criteria and alert notifications:
Step 1 Select Notifications > Administrator Notifications > Outbreak Notifications.
Step 2 Click the Criteria tab.
Step 3 Type the number of detections and detection period for each security risk.
Notification messages are sent to an administrator when the criteria exceeds the specified detection limit.
NOTETrend Micro recommends using the default values for the detection number and detection period.
Step 4 Select Shared Folder Session Link and enable Office Scan to monitor for firewall violations and shared folder sessions.
NOTETo view computers on the network with shared folders or computers currently browsing shared folders you can select the number link in the interface.
Configuring DSMs
Trend Micro Deep Discovery 599
Step 5 Click the SNMP Trap tab.
a Select the Enable notification via SNMP Trap check box.
b Type the following message in the field:
Number of viruses/malware: %CVNumber of computers: %CCLog Type Exceeded: %ANumber of firewall violation logs: %CNumber of shared folder sessions: %STime Period: %T
Step 6 Click Save.
Step 7 You are now ready to configure the log source in STRM.
To configure the Trend Micro Office Scan device:
Step 1 From the Log Source Type list box, select the Trend Micro Office Scan option.
Step 2 From the Protocol Configuration list box, select the SNMPv2 option.
For more information on configuring log sources, see the STRM Log Sources Users Guide.
Trend Micro Deep Discovery
The Trend Micro Deep Discovery DSM for STRM accepts syslog events using the Log Enhanced Event Format (LEEF). Before you can collect events in STRM, you must configure your Trend Micro Deep Discovery appliance to forward syslog events in LEEF format. STRM is capable of collecting events from the following categories in Trend Micro Deep Discovery:
• Malicious content events
• Malicious behavior events
• Suspicious behavior events
• Exploit events
• Grayware events
• Web reputation events
• Disruptive application events
• Sandbox events
• Correlation events
• System events
• Update events
Configuring DSMs
600 TREND MICRO
To configure Trend Micro Deep Discovery, you must:
1 Configure syslog events for Trend Micro Deep Discovery. For more information, see Configuring Trend Micro Deep Discovery.
2 Optional. Configure a Trend Micro Deep Discovery log source in STRM. For more information, see Configuring a Log Source for STRM.
Configuring TrendMicro Deep
Discovery
To configure Trend Micro Deep Discovery to forward syslog events:
Step 1 Log in to your Trend Micro Deep Discovery console.
Step 2 From the navigation menu, select Logs > Syslog Server Settings.
The Syslog Server Settings pane is displayed.
Step 3 Select the Enable Syslog Server check box.
Step 4 In the IP address field, type the IP address of your STRM.
Step 5 In the Port number field, type 514.
Port 514 is the default port for all syslog events forwarded to STRM.
Step 6 From the Syslog facility list box, select a local facility.
For example, local3.
Step 7 From the Syslog severity list box, select a severity level.
For example, Info. The severity level you select includes messages for the selected severity, plus any messages that are higher in severity.
Step 8 In the Syslog format field, select the LEEF option.
Step 9 In the Detections pane, select any check boxes for the events you want to forward to STRM.
NOTETo forward all possible detections to STRM, click the Select all check box.
Step 10 Click Save.
You are now ready to configure the log source in STRM.
Configuring a LogSource for STRM
STRM automatically discovers and creates a log source for LEEF formatted syslog events from Trend Micro Deep Discovery. However, you can manually create a log source for STRM to receive Trend Micro Deep Discovery events. The configuration steps for creating a log source are optional.
To manually create a log source for Trend Micro Deep Discovery:
Step 1 Log in to STRM.
Step 2 Click the Admin tab.
Configuring DSMs
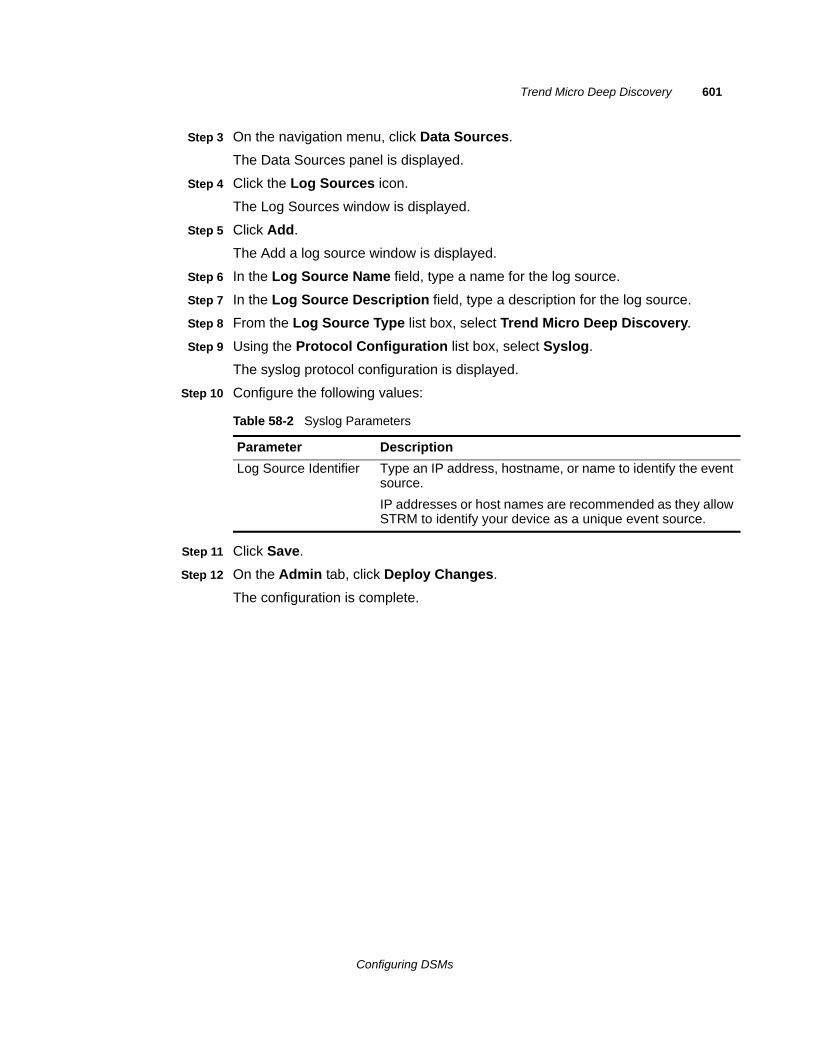
Trend Micro Deep Discovery 601
Step 3 On the navigation menu, click Data Sources.
The Data Sources panel is displayed.
Step 4 Click the Log Sources icon.
The Log Sources window is displayed.
Step 5 Click Add.
The Add a log source window is displayed.
Step 6 In the Log Source Name field, type a name for the log source.
Step 7 In the Log Source Description field, type a description for the log source.
Step 8 From the Log Source Type list box, select Trend Micro Deep Discovery.
Step 9 Using the Protocol Configuration list box, select Syslog.
The syslog protocol configuration is displayed.
Step 10 Configure the following values:
Step 11 Click Save.
Step 12 On the Admin tab, click Deploy Changes.
The configuration is complete.
Table 58-2 Syslog Parameters
Parameter Description
Log Source Identifier Type an IP address, hostname, or name to identify the event source.
IP addresses or host names are recommended as they allow STRM to identify your device as a unique event source.
Configuring DSMs

602 TREND MICRO
Configuring DSMs
88
TRIPWIREThe Tripwire DSM for STRM accepts resource additions, removal, and modification events using syslog. Before you configure STRM to integrate with Tripwire, you must:
Step 1 Log in to the Tripwire interface.
Step 2 On the left-hand navigation, click Actions.
Step 3 Click New Action.
A wizard is displayed allowing you to configure the syslog action.
Step 4 Configure the new action.
Step 5 Select Rules and click on the desired rule you wish to monitor.
Step 6 Select the Actions tab.
Step 7 Make sure the new action is selected.
Step 8 Click OK.
Step 9 Repeat Step 5 to Step 8 for each rule you want to monitor.
You are now ready to configure the log source in STRM.
To configure STRM to receive events from a Tripwire device:
From the Log Source Type list box, select the Tripwire Enterprise option.
For more information on configuring log sources, see the STRM Log Sources Users Guide. For more information about your Tripwire device, see your vendor documentation.
Configuring DSMs


89
TROPOS CONTROLThe Tropos Control DSM for STRM accepts events using syslog. STRM is capable of recording all fault management, login and logout events, provisioning events, and device image upload events. Before configuring STRM, you must configure your Tropos Control to forward syslog events.
To configure Tropos Control to forward logs using syslog to STRM:
Step 1 Using SSH, log in to your Tropos Control device as a root user.
Step 2 Open the following file for editing:
/opt/ControlServer/ems/conf/logging.properties
Step 3 To enable syslog, remove the comment marker (#) from the following line:
#log4j.category.syslog = INFO, syslog
Step 4 To configure the IP address for the syslog destination, edit the following line:
log4j.appender.syslog.SyslogHost = <IP address>
Where <IP address> is the IP address or hostname of STRM.
By default, Tropos Control uses a facility of USER and a default log level of INFO. These default settings are correct for syslog event collection from a Tropos Control device.
Step 5 Save and exit the file.
You are now ready to configure the Tropos Control DSM in STRM.
To configure STRM to receive events from Tropos Control:
From the Log Source Type list box, select Tropos Control.
For more information on configuring log sources, see the STRM Log Sources Users Guide.
Configuring DSMs

90
UNIVERSAL DSMSTRM collects and correlates events from network infrastructure and security devices. After the events are collected and before the correlation can begin. The individual events from your devices must be properly parsed to determine the event name, IP addresses, protocol, and ports. For common network devices, such as Cisco Firewalls, predefined DSMs have been engineered for STRM to properly parse and classify the event messages from the respective devices. After the events from a device have been parsed by the DSM, STRM can continue to correlate events into offenses.
If an enterprise network has one or more network or security devices that are not officially supported, where no specific DSM for the device exists, you can use the Universal DSM. The Universal DSM allows you to forward events and messages from unsupported devices and use the Universal DSM to categorize the events for STRM. STRM can integrate with virtually any device or any common protocol source using the Universal DSM.
For more information on the available protocols for retrieving events or logs from devices, see the STRM Log Sources Users Guide.
To configure the Universal DSM, you must use device extensions to associate a Universal DSM to devices. Before you define device extension information using the log sources window in the Admin tab, you must create an extensions document for the log source.
NOTEFor more information on writing and testing a Universal DSM, see our Juniper customer support forum at www.juniper.net/support/.
Configuring DSMs

91
UNIVERSAL LEEFThe Universal LEEF DSM for STRM can accept events from devices that produce events using the Log Event Extended Format (LEEF). The LEEF event format is a proprietary event format, which allows hardware manufacturers and software product manufacturers to read and map device events specifically designed for STRM integration.
LEEF formatted events sent to STRM outside of the partnership program require you to have installed the Universal LEEF DSM and manually identify each event forwarded to STRM by mapping unknown events. The Universal LEEF DSM can parse events forwarded from syslog or files containing events in the LEEF format polled from a device or directory using the Log File protocol.
To configure events in STRM using Universal LEEF, you must:
1 Configure a Universal LEEF log source in STRM. For more information, see Configuring a Universal LEEF Log Source.
2 Send LEEF formatted events from your device to STRM. For more information on forwarding events, see your vendor documentation.
3 Map unknown events to STRM Identifiers (QIDs). For more information, see Creating a Universal LEEF Event Map.
Configuring a Universal LEEF Log Source
Before you configure your device to send events to STRM, you must add a log source for the device providing LEEF events. STRM can receive events from a real-time source using syslog or files stored on a device or in a repository using the Log File protocol.
This section includes the following topics:
• Configuring Universal LEEF for Syslog
• Configuring Universal LEEF for the Log File Protocol
Configuring DSMs
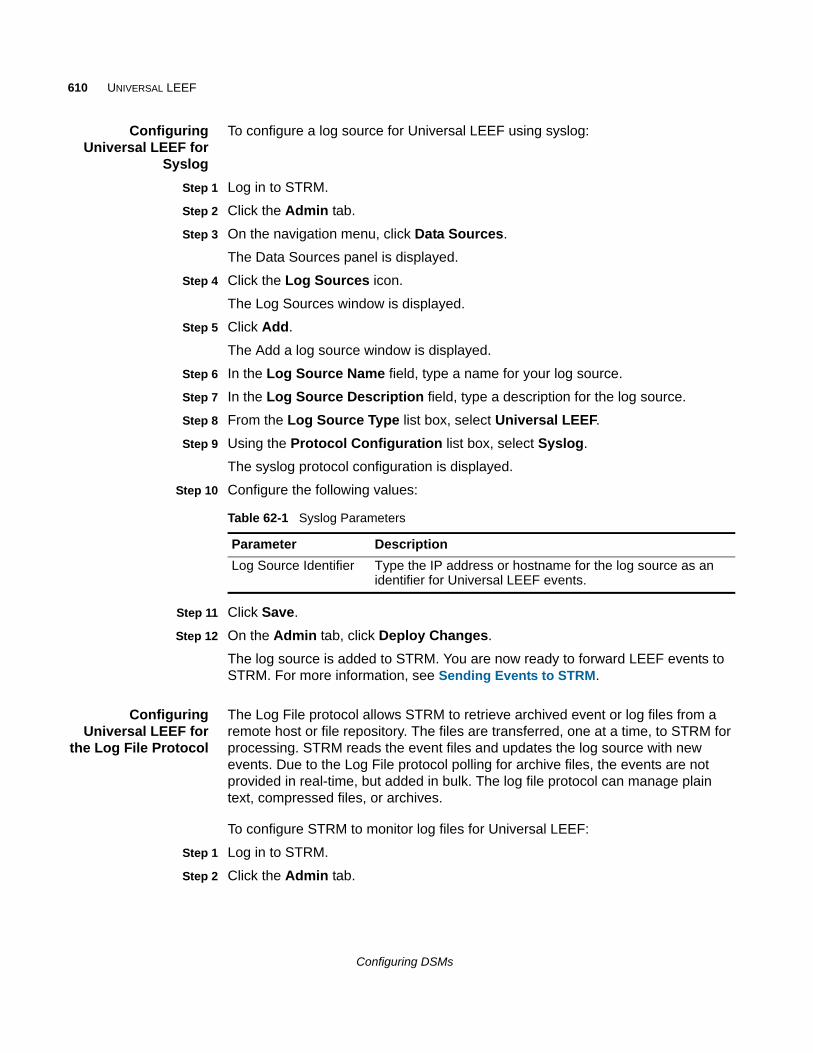
610 UNIVERSAL LEEF
ConfiguringUniversal LEEF for
Syslog
To configure a log source for Universal LEEF using syslog:
Step 1 Log in to STRM.
Step 2 Click the Admin tab.
Step 3 On the navigation menu, click Data Sources.
The Data Sources panel is displayed.
Step 4 Click the Log Sources icon.
The Log Sources window is displayed.
Step 5 Click Add.
The Add a log source window is displayed.
Step 6 In the Log Source Name field, type a name for your log source.
Step 7 In the Log Source Description field, type a description for the log source.
Step 8 From the Log Source Type list box, select Universal LEEF.
Step 9 Using the Protocol Configuration list box, select Syslog.
The syslog protocol configuration is displayed.
Step 10 Configure the following values:
Step 11 Click Save.
Step 12 On the Admin tab, click Deploy Changes.
The log source is added to STRM. You are now ready to forward LEEF events to STRM. For more information, see Sending Events to STRM.
ConfiguringUniversal LEEF for
the Log File Protocol
The Log File protocol allows STRM to retrieve archived event or log files from a remote host or file repository. The files are transferred, one at a time, to STRM for processing. STRM reads the event files and updates the log source with new events. Due to the Log File protocol polling for archive files, the events are not provided in real-time, but added in bulk. The log file protocol can manage plain text, compressed files, or archives.
To configure STRM to monitor log files for Universal LEEF:
Step 1 Log in to STRM.
Step 2 Click the Admin tab.
Table 62-1 Syslog Parameters
Parameter Description
Log Source Identifier Type the IP address or hostname for the log source as an identifier for Universal LEEF events.
Configuring DSMs
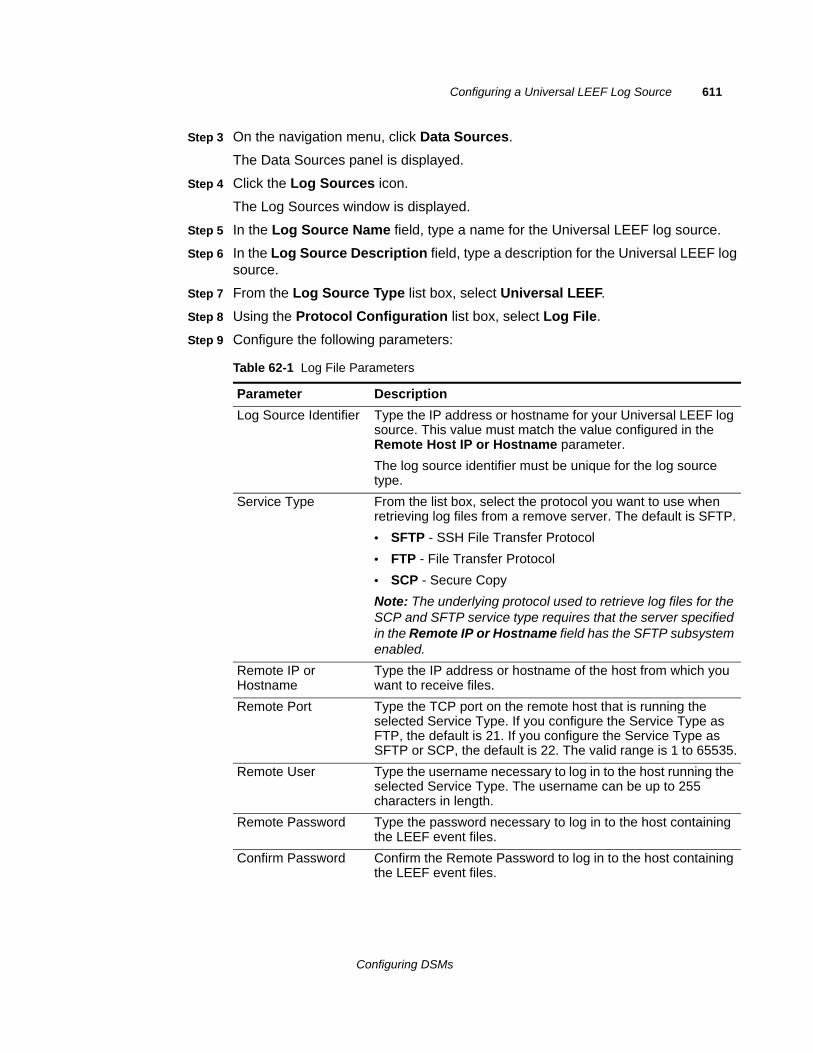
Configuring a Universal LEEF Log Source 611
Step 3 On the navigation menu, click Data Sources.
The Data Sources panel is displayed.
Step 4 Click the Log Sources icon.
The Log Sources window is displayed.
Step 5 In the Log Source Name field, type a name for the Universal LEEF log source.
Step 6 In the Log Source Description field, type a description for the Universal LEEF log source.
Step 7 From the Log Source Type list box, select Universal LEEF.
Step 8 Using the Protocol Configuration list box, select Log File.
Step 9 Configure the following parameters:
Table 62-1 Log File Parameters
Parameter Description
Log Source Identifier Type the IP address or hostname for your Universal LEEF log source. This value must match the value configured in the Remote Host IP or Hostname parameter.
The log source identifier must be unique for the log source type.
Service Type From the list box, select the protocol you want to use when retrieving log files from a remove server. The default is SFTP.
• SFTP - SSH File Transfer Protocol
• FTP - File Transfer Protocol
• SCP - Secure Copy
Note: The underlying protocol used to retrieve log files for the SCP and SFTP service type requires that the server specified in the Remote IP or Hostname field has the SFTP subsystem enabled.
Remote IP or Hostname
Type the IP address or hostname of the host from which you want to receive files.
Remote Port Type the TCP port on the remote host that is running the selected Service Type. If you configure the Service Type as FTP, the default is 21. If you configure the Service Type as SFTP or SCP, the default is 22. The valid range is 1 to 65535.
Remote User Type the username necessary to log in to the host running the selected Service Type. The username can be up to 255 characters in length.
Remote Password Type the password necessary to log in to the host containing the LEEF event files.
Confirm Password Confirm the Remote Password to log in to the host containing the LEEF event files.
Configuring DSMs
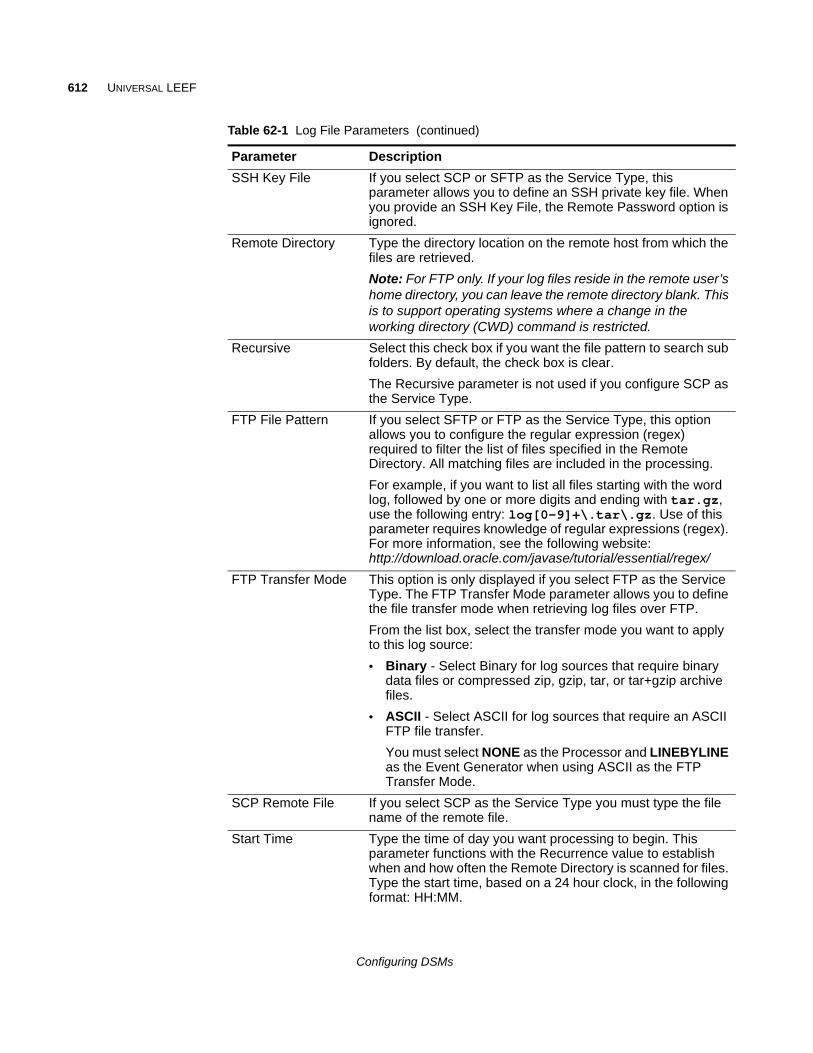
612 UNIVERSAL LEEF
SSH Key File If you select SCP or SFTP as the Service Type, this parameter allows you to define an SSH private key file. When you provide an SSH Key File, the Remote Password option is ignored.
Remote Directory Type the directory location on the remote host from which the files are retrieved.
Note: For FTP only. If your log files reside in the remote user’s home directory, you can leave the remote directory blank. This is to support operating systems where a change in the working directory (CWD) command is restricted.
Recursive Select this check box if you want the file pattern to search sub folders. By default, the check box is clear.
The Recursive parameter is not used if you configure SCP as the Service Type.
FTP File Pattern If you select SFTP or FTP as the Service Type, this option allows you to configure the regular expression (regex) required to filter the list of files specified in the Remote Directory. All matching files are included in the processing.
For example, if you want to list all files starting with the word log, followed by one or more digits and ending with tar.gz, use the following entry: log[0-9]+\.tar\.gz. Use of this parameter requires knowledge of regular expressions (regex). For more information, see the following website: http://download.oracle.com/javase/tutorial/essential/regex/
FTP Transfer Mode This option is only displayed if you select FTP as the Service Type. The FTP Transfer Mode parameter allows you to define the file transfer mode when retrieving log files over FTP.
From the list box, select the transfer mode you want to apply to this log source:
• Binary - Select Binary for log sources that require binary data files or compressed zip, gzip, tar, or tar+gzip archive files.
• ASCII - Select ASCII for log sources that require an ASCII FTP file transfer.
You must select NONE as the Processor and LINEBYLINE as the Event Generator when using ASCII as the FTP Transfer Mode.
SCP Remote File If you select SCP as the Service Type you must type the file name of the remote file.
Start Time Type the time of day you want processing to begin. This parameter functions with the Recurrence value to establish when and how often the Remote Directory is scanned for files. Type the start time, based on a 24 hour clock, in the following format: HH:MM.
Table 62-1 Log File Parameters (continued)
Parameter Description
Configuring DSMs

Sending Events to STRM 613
Step 10 Click Save.
Step 11 On the Admin tab, click Deploy Changes.
The log source is added to STRM. You are now ready to write LEEF events that can be retrieved using the Log File protocol. For more information, see Sending Events to STRM.
Sending Events to STRM
After you have created your log source, you are ready to forward or retrieve events for STRM. Forwarding events using syslog might require additional configuration from your network device.
Recurrence Type the frequency, beginning at the Start Time, that you want the remote directory to be scanned. Type this value in hours (H), minutes (M), or days (D).
For example, type 2H if you want the directory to be scanned every 2 hours. The default is 1H.
Run On Save Select this check box if you want the log file protocol to run immediately after you click Save. After the Run On Save completes, the log file protocol follows your configured start time and recurrence schedule.
Selecting Run On Save clears the list of previously processed files for the Ignore Previously Processed File parameter.
EPS Throttle Type the number of Events Per Second (EPS) that you do not want this protocol to exceed. The valid range is 100 to 5000.
Processor If the files located on the remote host are stored in a zip, gzip, tar, or tar+gzip archive format, select the processor that allows the archives to be expanded and contents processed.
Ignore Previously Processed File(s)
Select this check box to track files that have already been processed that you do not want to be processed a second time. This only applies to FTP and SFTP Service Types.
Change Local Directory?
Select this check box to define the local directory on your STRM system that you want to use for storing downloaded files during processing.
We recommend that you leave this check box clear. When the check box is selected, the Local Directory field is displayed, allowing you to configure the local directory to use for storing files.
Event Generator From the Event Generator list box, select LineByLine.
The Event Generator applies additional processing to the retrieved event files. The LineByLine option reads each line of the file as single event. For example, if a file has 10 lines of text, 10 separate events are created.
Table 62-1 Log File Parameters (continued)
Parameter Description
Configuring DSMs
614 UNIVERSAL LEEF
As events are discovered by STRM, either using syslog or polling for log files, events are displayed in the Log Activity tab. The events for your device forwarding LEEF events are identified by the name you typed in the Log Source Name field. The events for your log source are not categorized by default in STRM and require categorization. For more information on categorizing your Universal LEEF events, see Creating a Universal LEEF Event Map.
Creating a Universal LEEF Event Map
Event mapping is required for the Universal LEEF DSM, as Universal LEEF events do not contain a predefined STRM Identifier (QID) map to categorize security events. Members of the SIPP partner program have QID maps designed for their network devices, the configuration documented, and the QID maps tested by Juniper Networks
The Universal LEEF DSM requires that you individually map each event for your device to an event category in STRM. Mapping events allows STRM to identify, coalesce, and track reoccurring events from your network devices. Until you map an event, all events that are displayed in the Log Activity tab for the Universal LEEF DSM are categorized as unknown. Unknown events are easily identified as the Event Name column and Low Level Category columns display Unknown.
This section includes the following topics:
1 Searching for Unknown Universal LEEF Events
2 Modifying an Event Map
Searching forUnknown Universal
LEEF Events
As your device forwards events to STRM, it can take time to categorize all of the events for a device, as some events might not be generated immediately by the event source appliance or software. It is helpful to know how to quickly search for unknown events. When you know how to search for unknown events, we recommend you repeat this search until you are comfortable that you have identified the majority of your Universal LEEF events.
To quickly identify unknown Universal LEEF events:
Step 1 Log in to STRM.
Step 1 Click the Log Activity tab.
Step 2 Click Add Filter.
The Add Filter window is displayed.
Step 3 From the first list box, select Log Source.
The Log Source Group list box is displayed.
Step 4 From the Log Source Group list box, select the log source group or Other.
Log sources that are not assigned to a group are categorized as Other.
Step 5 From the Log Source list box, select your Universal LEEF log source.
Configuring DSMs
Creating a Universal LEEF Event Map 615
Step 6 Click Add Filter.
The Log Activity tab is displayed with a filter for your Universal LEEF DSM.
Step 7 From the View list box, select Last Hour.
Any events generated by your Universal LEEF DSM in the last hour are displayed. Events displayed as unknown in the Event Name column or Low Level Category column require event mapping in STRM.
NOTEYou can save your existing search filter by clicking Save Criteria.
You are now ready to modify the event map for your Universal LEEF DSM.
Modifying an EventMap
Modifying an event map allows you to manually categorize events to a STRM Identifier (QID) map. Any event categorized to a log source can be remapped to a new STRM Identifier (QID). By default, the Universal LEEF DSM categorizes all events as unknown.
NOTEEvents that do not have a defined log source cannot be mapped to an event. Events without a log source display SIM Generic Log in the Log Source column.
To modify event mapping for an unknown event:
Step 1 On the Event Name column, double-click an unknown event for your Universal LEEF DSM.
The detailed event information is displayed.
Step 2 Click Map Event.
The Log Source Event window is displayed.
Step 3 From the Browse for QID pane, select any of the following search options to narrow the event categories for a STRM Identifier (QID):
a From the High-Level Category list box, select a high-level event categorization.
For a full list of high-level and low-level event categories or category definitions, see the Event Categories section of the STRM Administration Guide.
b From the Low-Level Category list box, select a low-level event categorization.
c From the Log Source Type list box, select a log source type.
The Log Source Type list box allows you to search for QIDs from other individual log sources. Searching for QIDs by log source is useful when the events from your Universal LEEF DSM are similar to another existing network device. For example, if your Universal DSM provides firewall events, you might select Cisco ASA, as another firewall product that likely captures similar events.
Configuring DSMs
616 UNIVERSAL LEEF
d To search for a QID by name, type a name in the QID/Name field.
The QID/Name field allows you to filter the full list of QIDs for a specific word, for example, MySQL.
Step 4 Click Search.
A list of QIDs are displayed.
Step 5 Select the QID you want to associate to your unknown Universal LEEF DSM event.
Step 6 Click OK.
STRM maps any additional events forwarded from your device with the same QID that matches the event payload. The event count increases each time the event is forwarded and identified.
NOTEIf you update an event with a new STRM Identifier (QID) map, past events stored in STRM are not updated. Only new events are categorized with the new QID.
Configuring DSMs
92
VERDASYS DIGITAL GUARDIANThe Verdasys Digital Guardian DSM for STRM accepts syslog events from Verdasys Digital Guardian appliances. STRM records all relevant and available information from the event. Before configuring your Verdasys Digital Guardian to forward events, you must configure IPtables in STRM to allow ICMP requests from Verdasys Digital Guardian. For more information on configuring your Verdasys Digital Guardian, see your vendor documentation.
This section includes the following topics:
• Configuring IPtables Between Verdasys and STRM
• Configuring a Digital Guardian Data Export
• Scheduling a Job for Digital Guardian
• Configuring a Log Source in STRM
Configuring IPtablesBetween Verdasys
and STRM
To allow communication between STRM and Verdasys Digital Guardian:
Step 1 Using SSH, log in to STRM as the root user.
Login: root
Password: <password>
Step 2 Type the following command to edit the IPtables file:
vi /opt/qradar/conf/iptables.post
The IPtables configuration file is displayed.
Step 3 Type the following command to allow STRM to accept ICMP requests from Verdasys Digital Guardian:
-I QChain 1 -m icmp -p icmp --src <IP address> -j ACCEPT
Where <IP address> is the IP address of your Verdasys Digital Guardian appliance. For example,
-I QChain 1 -m icmp -p icmp --src 10.100.100.101 -j ACCEPT
Step 4 Save your IPtables configuration.
Configuring DSMs
618 VERDASYS DIGITAL GUARDIAN
Step 5 Type the following command to update IPtables in STRM:
./opt/qradar/bin/iptables_update.pl
Step 6 To verify STRM accepts ICMP traffic from your Verdasys Digital Guardian, type the following command:
iptables --list --line-numbers
The following output is displayed:
[root@Qradar bin]# iptables --list --line-numbersChain QChain (1 references)num target prot opt source destination1 ACCEPT icmp -- 10.100.100.101 anywhere icmp any2 ACCEPT tcp -- anywhere anywhere state NEW tcp dpt:https3 ACCEPT tcp -- anywhere anywhere state NEW tcp dpt:http
The IPtables configuration for STRM is complete.
Configuring a DigitalGuardian Data Export
To configure a data export for Verdasys Digital Guardian:
Step 1 Log in to the Digital Guardian Management Console.
Step 2 Select Workspace > Data Export > Create Export.
Step 3 From the Data Sources list box, select Alerts or Events as the data source.
Step 4 From the Export type list box, select Syslog.
Step 5 From the Type list box, select UDP or TCP as the transport protocol.
STRM can accept syslog events from either transport protocol.
Step 6 In the Server Name field, type the IP address of your STRM.
Step 7 In the Port field, type 514.
Step 8 From the Syslog Severity Level list box, select a severity level.
Step 9 Select the Is Active check box.
Step 10 Click Next.
Step 11 From the list of available fields, add the following Alert or Event fields for your data export:
• Agent Local Date
• Agent Local Time
• Application
• Computer Name
• User Name
• Operation
Configuring DSMs
619
• Policy
• Rule
• IP Address
• Was Blocked
• Was Classified
NOTEThe Operation field must be selected for all Verdasys Digital Guardian data exports.
Step 12 Select a Criteria for the fields in your data export and click Next.
By default, the Criteria is blank.
Step 13 Select a Group for the criteria and click Next.
By default, the Group is blank.
Step 14 Click Test Query.
A Test Query ensures the database runs properly.
Step 15 Click Next.
Step 16 Save the data export.
You are now ready to create a job schedule for your event export.
Scheduling a Job forDigital Guardian
Job schedules are responsible for exporting data from Verdasys Digital Guardian and forwarding the syslog events to STRM. Data is forwarded based on a job schedule and can be run automatically or manually from Verdasys Digital Guardian.
To configure a job schedule:
Step 1 Log in to the Digital Guardian Management Console.
Step 2 Select System > Job Scheduler > Export Data > Job Schedule.
Step 3 Create a job schedule for the data export.
Step 4 Click Save.
For more information on your Verdasys Digital Guardian appliance, see your vendor documentation.
Configuring a LogSource in STRM
STRM automatically discovers and creates a log source for syslog events from Verdasys Digital Guardian appliances. However, you can manually create a log source for STRM to receive syslog events. The following configuration steps for creating a log source are optional.
To manually configure a log source for Verdasys Digital Guardian syslog events:
Step 1 Log in to STRM.
Configuring DSMs
620 VERDASYS DIGITAL GUARDIAN
Step 2 Click the Admin tab.
Step 3 On the navigation menu, click Data Sources.
The Data Sources panel is displayed.
Step 4 Click the Log Sources icon.
The Log Sources window is displayed.
Step 5 Click Add.
The Add a log source window is displayed.
Step 6 In the Log Source Name field, type a name for your log source.
Step 7 In the Log Source Description field, type a description for the log source.
Step 8 From the Log Source Type list box, select Verdasys Digital Guardian.
Step 9 Using the Protocol Configuration list box, select Syslog.
The syslog protocol configuration is displayed.
Step 10 Configure the following values:
Step 11 Click Save.
Step 12 On the Admin tab, click Deploy Changes.
The log source is added to STRM. Events forwarded to STRM by Verdasys Digital Guardian are displayed on the Log Activity tab.
Table 63-1 Syslog Parameters
Parameter Description
Log Source Identifier Type the IP address or hostname for the log source as an identifier for events from Verdasys Digital Guardian appliance.
Configuring DSMs
93
VERICEPT CONTENT 360 DSMThe Vericept Content 360 DSM for STRM accepts Vericept events using syslog. STRM records all relevant and available information from the event. Before configuring a Vericept device in STRM, you must configure your device to forward syslog. For more information on configuring your Vericept device, consult your vendor documentation.
After you configure syslog to forward events to STRM the configuration is complete. The log source is added to STRM as Vericept Content 360 events are automatically discovered. Events forwarded to STRM by your Vericept Content 360 appliance are displayed on the Log Activity tab.
To manually configure a log source for STRM to receive events from a Vericept device:
From the Log Source Type list box, select the Vericept Content 360 option.
For more information on configuring devices, see the STRM Log Sources Users Guide.
Configuring DSMs

94
WEBSENSE V-SERIESThis section provides information on the following DSMs:
• Websense TRITON
• Websense V-Series Data Security Suite
• Websense V-Series Content Gateway
Websense TRITON The Websense V-Series Content Gateway DSM for STRM supports events for web content from several Websense TRITON solutions, including Web Security, Web Security Gateway, Web Security Gateway Anywhere, and V-Series™ appliances. Websense TRITON collects and streams event information to STRM using the Websense Multiplexer component. Before configuring STRM, you must configure the Websense TRITON solution to provide LEEF formatted syslog events.
This section includes the following topics:
• Before You Begin
• Configuring Websense TRITON to Forward Syslog Events
• Configuring a Log Source in STRM
Before You Begin Before you can configure Websense TRITON Web Security solutions to forward events to STRM, you must ensure your deployment contains a Websense Multiplexer. The Websense Multiplexer is supported on Windows, Linux, and on Websense V-Series appliances.
To configure a Websense Multiplexer on a Websense Triton or V-Series appliance:
Step 1 Install an instance of Websense Multiplexer for each Websense Policy Server component in your network.
• For Microsoft Windows - To install the Websense Multiplexer on Windows, use the TRITON Unified Installer. The Triton Unified Installer is available for download at http://www.mywebsense.com.
• For Linux - To install the Websense Multiplexer on Linux, use the Web Security Linux Installer. The Web Security Linux Installer is available for download at http://www.mywebsense.com.
Configuring DSMs
624 WEBSENSE V-SERIES
For information on adding a Websense Multiplexer to software installations, see your Websense Security Information Management (SIEM) Solutions documentation.
Step 2 Enable the Websense Multiplexer on a V-Series appliance configured as a full policy source or user directory and filtering appliance:
a Log in to your Websense TRITON Web Security Console or V-Series appliance.
b From the Appliance Manager, select Administration > Toolbox > Command Line Utility.
c Click the Websense Web Security tab.
d From the Command list box, select multiplexer, then use the enable command.
Step 3 Repeat Step 1 and Step 2 to enable one Multiplexer instance for each Policy Server instance in your network.
If more than one Multiplexer is installed for a Policy Server, only the last installed instance of the Websense Multiplexer is used. The configuration for each Websense Multiplexer instance is stored by its Policy Server.
You are now ready to configure your Websense TRITON appliance to forward syslog events in LEEF format to STRM.
ConfiguringWebsense TRITON to
Forward SyslogEvents
To configure syslog forwarding for Websense TRITON:
Step 1 Log in to your Websense TRITON Web Security Console.
Step 2 On the Settings tab, select General > SIEM Integration.
The SIEM Integration page is displayed.
Step 3 Select the Enable SIEM integration for this Policy Server check box.
Step 4 In the IP address or hostname field, type the IP address of your STRM.
Step 5 In the Port field, type 514.
Step 6 From the Transport protocol list box, select either the TCP or UDP protocol option.
STRM supports syslog events for TCP and UDP protocols on port 514.
Step 7 From the SIEM format list box, select syslog/LEEF (STRM).
Step 8 Click OK to cache any changes.
Step 9 Click Deploy to update your Websense Triton security components or V-Series appliances.
The Websense Multiplexer connects to Websense Filtering Service and ensures that event log information is provided to STRM.
Configuring DSMs
Websense TRITON 625
Configuring a LogSource in STRM
STRM automatically discovers and creates a log source for syslog events in LEEF format from Websense TRITON and V-Series appliances. However, you can manually create a log source for STRM to receive syslog events. Theconfiguration steps for creating a log source are optional.
To manually configure a log source for Websense TRITON syslog events:
Step 1 Log in to STRM.
Step 2 Click the Admin tab.
Step 3 On the navigation menu, click Data Sources.
The Data Sources panel is displayed.
Step 4 Click the Log Sources icon.
The Log Sources window is displayed.
Step 5 Click Add.
The Add a log source window is displayed.
Step 6 In the Log Source Name field, type a name for your log source.
Step 7 In the Log Source Description field, type a description for the log source.
Step 8 From the Log Source Type list box, select Websense V Series Content Gateway.
NOTEWebsense TRITON uses the Websense V Series Content Gateway DSM for parsing events. When you manually add a log source to STRM for Websense TRITON, you should select the Websense V Series Content Gateway.
Step 9 Using the Protocol Configuration list box, select Syslog.
The syslog protocol configuration is displayed.
Step 10 Configure the following values:
Step 11 Click Save.
Step 12 On the Admin tab, click Deploy Changes.
The log source is added to STRM.
Table 65-1 Syslog Parameters
Parameter Description
Log Source Identifier Type the IP address or hostname for the log source as an identifier for events from Websense TRITON or V-Series appliance.
Configuring DSMs
626 WEBSENSE V-SERIES
Websense V-Series Data Security Suite
The Websense V-Series Data Security Suite DSM for STRM supports Websense V-Series appliances and the Data Security Suite (DSS) software. The Websense V-Series Data Security Suite DSM accepts events using syslog. Before you can integrate STRM you, must enable the Websense V-Series appliance to forward syslog events in the Data Security Suite (DSS) Management Console.
To enable syslog forwarding in the DSS Management Console:
Step 1 Select Policies > Policy Components > Notification Templates.
Step 2 Select an existing Notification Template or create a new template.
Step 3 Click the General tab.
Step 4 Click Send Syslog Message.
Step 5 Select Options > Settings > Syslog to access the Syslog window.
The syslog window enables administrators to define the IP address/hostname and port number of the syslog in their organization. The defined syslog receives incident messages from the Websense Data Security Suite DSS Manager.
Step 6 The syslog is composed of the following fields:
DSS Incident|ID={value}|action={display value - max}|urgency= {coded}|policy categories={values,,,}|source={value-display name}|destinations={values...}|channel={display name}|matches= {value}|detaills={value}
• Max length for policy categories is 200 characters.
• Max length for destinations is 200 characters.
• Details and source are reduced to 30 characters.
Step 7 Click Test Connection to verify that your syslog is accessible.
You are now ready to configure the log source in STRM.
The configuration is complete. The log source is added to STRM as OSSEC events are automatically discovered. Events forwarded to STRM by OSSEC are displayed on the Log Activity tab of STRM.
Configuring a LogSource in STRM
STRM automatically discovers and creates a log source for syslog events from Websense V-Series Data Security Suite. However, you can manually create a log source for STRM to receive syslog events. The following configuration steps are optional.
To manually configure a log source for Websense V-Series Data Security Suite:
Step 1 Log in to STRM.
Step 2 Click the Admin tab.
Step 3 On the navigation menu, click Data Sources.
The Data Sources panel is displayed.
Configuring DSMs
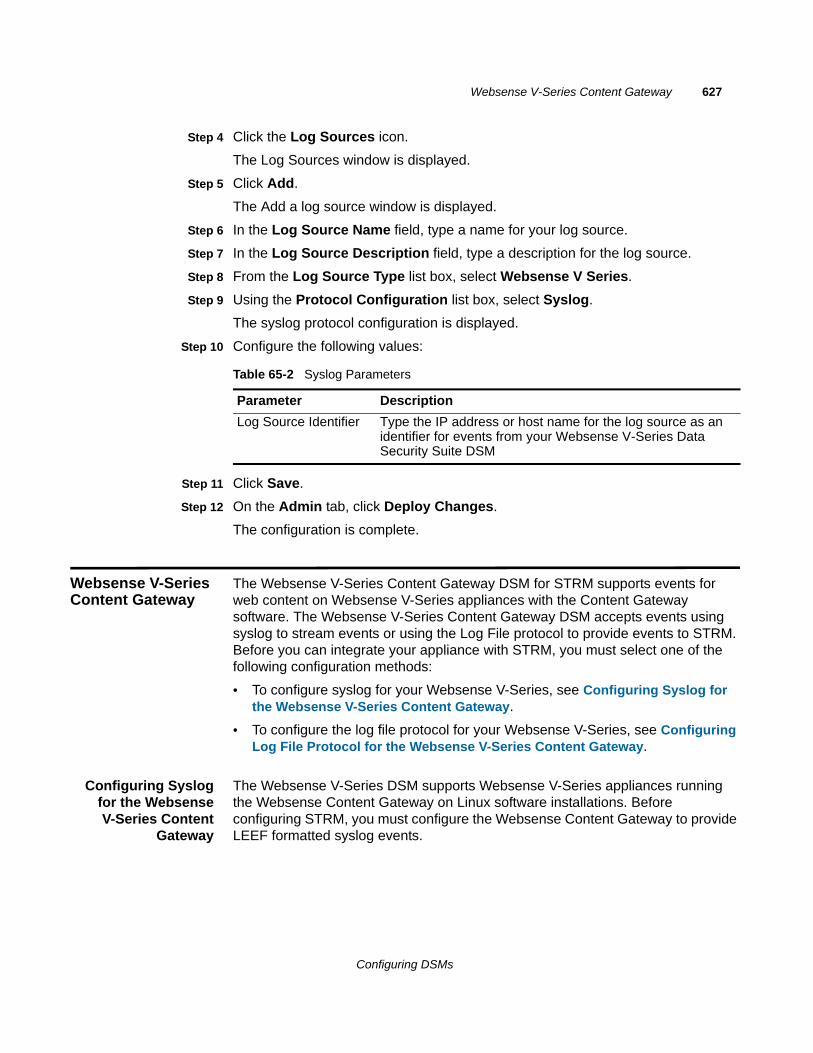
Websense V-Series Content Gateway 627
Step 4 Click the Log Sources icon.
The Log Sources window is displayed.
Step 5 Click Add.
The Add a log source window is displayed.
Step 6 In the Log Source Name field, type a name for your log source.
Step 7 In the Log Source Description field, type a description for the log source.
Step 8 From the Log Source Type list box, select Websense V Series.
Step 9 Using the Protocol Configuration list box, select Syslog.
The syslog protocol configuration is displayed.
Step 10 Configure the following values:
Step 11 Click Save.
Step 12 On the Admin tab, click Deploy Changes.
The configuration is complete.
Websense V-Series Content Gateway
The Websense V-Series Content Gateway DSM for STRM supports events for web content on Websense V-Series appliances with the Content Gateway software. The Websense V-Series Content Gateway DSM accepts events using syslog to stream events or using the Log File protocol to provide events to STRM. Before you can integrate your appliance with STRM, you must select one of the following configuration methods:
• To configure syslog for your Websense V-Series, see Configuring Syslog for the Websense V-Series Content Gateway.
• To configure the log file protocol for your Websense V-Series, see Configuring Log File Protocol for the Websense V-Series Content Gateway.
Configuring Syslogfor the WebsenseV-Series Content
Gateway
The Websense V-Series DSM supports Websense V-Series appliances running the Websense Content Gateway on Linux software installations. Before configuring STRM, you must configure the Websense Content Gateway to provide LEEF formatted syslog events.
Table 65-2 Syslog Parameters
Parameter Description
Log Source Identifier Type the IP address or host name for the log source as an identifier for events from your Websense V-Series Data Security Suite DSM
Configuring DSMs
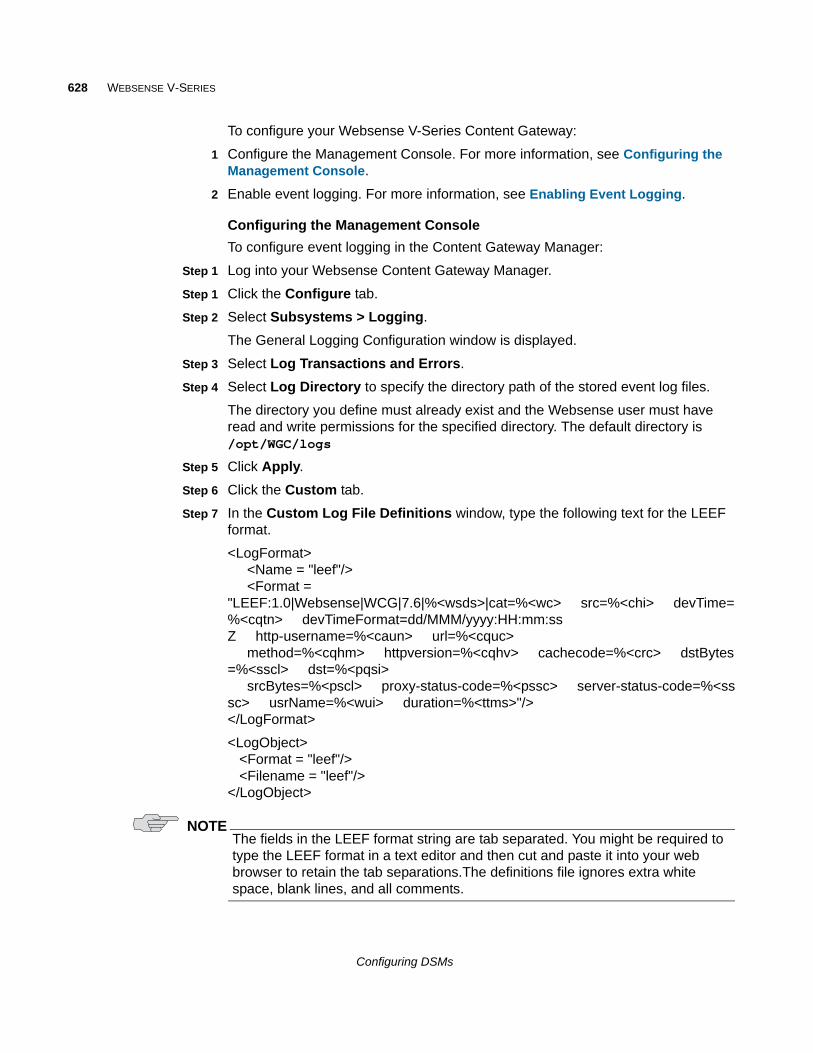
628 WEBSENSE V-SERIES
To configure your Websense V-Series Content Gateway:
1 Configure the Management Console. For more information, see Configuring the Management Console.
2 Enable event logging. For more information, see Enabling Event Logging.
Configuring the Management Console
To configure event logging in the Content Gateway Manager:
Step 1 Log into your Websense Content Gateway Manager.
Step 1 Click the Configure tab.
Step 2 Select Subsystems > Logging.
The General Logging Configuration window is displayed.
Step 3 Select Log Transactions and Errors.
Step 4 Select Log Directory to specify the directory path of the stored event log files.
The directory you define must already exist and the Websense user must have read and write permissions for the specified directory. The default directory is /opt/WGC/logs
Step 5 Click Apply.
Step 6 Click the Custom tab.
Step 7 In the Custom Log File Definitions window, type the following text for the LEEF format.
<LogFormat><Name = "leef"/><Format =
"LEEF:1.0|Websense|WCG|7.6|%<wsds>|cat=%<wc> src=%<chi> devTime=%<cqtn> devTimeFormat=dd/MMM/yyyy:HH:mm:ss Z http-username=%<caun> url=%<cquc>
method=%<cqhm> httpversion=%<cqhv> cachecode=%<crc> dstBytes=%<sscl> dst=%<pqsi>
srcBytes=%<pscl> proxy-status-code=%<pssc> server-status-code=%<sssc> usrName=%<wui> duration=%<ttms>"/></LogFormat>
<LogObject><Format = "leef"/><Filename = "leef"/>
</LogObject>
NOTEThe fields in the LEEF format string are tab separated. You might be required to type the LEEF format in a text editor and then cut and paste it into your web browser to retain the tab separations.The definitions file ignores extra white space, blank lines, and all comments.
Configuring DSMs

Websense V-Series Content Gateway 629
Step 8 Select Enabled to enable the custom logging definition.
Step 9 Click Apply.
You are now ready to enable event logging for your Websense Content Gateway.
Enabling Event Logging
If you are using a Websense V-Series appliance, you need to contact Websense Technical Support to enable this feature.
To enable event logging on a Websense Content Gateway:
Step 1 Log in to the command-line Interface (CLI) of the server running Websense Content Gateway.
Step 2 Add the following lines to the end of the /etc/rc.local file:
( while [ 1 ] ; dotail -n1000 -F /opt/WCG/logs/leef.log | nc <IP Address> 514sleep 1done ) &
Where <IP Address> is the IP address for STRM.
Step 3 To start logging immediately, type the following command:
nohup /bin/bash –c “while [ 1 ] ; do tail -F /opt/WCG/logs/leef.log | nc <IP Address> 514; sleep 1; done” &
NOTEYou might need to type the logging command in Step 3 or copy the command to a text editor to interpret the quotation marks.
The configuration is complete. The log source is added to STRM as syslog events from Websense V-Series Content Gateway are automatically discovered. Events forwarded by Websense V-Series Content Gateway are displayed on the Log Activity tab of STRM.
Configuring a LogSource in STRM
STRM automatically discovers and creates a log source for syslog events from Websense V-Series Content Gateway. However, you can manually create a log source for STRM to receive syslog events. The following configuration steps are optional.
To manually configure a log source for Websense V-Series Content Gateway:
Step 1 Log in to STRM.
Step 2 Click the Admin tab.
Step 3 On the navigation menu, click Data Sources.
The Data Sources panel is displayed.
Step 4 Click the Log Sources icon.
The Log Sources window is displayed.
Configuring DSMs
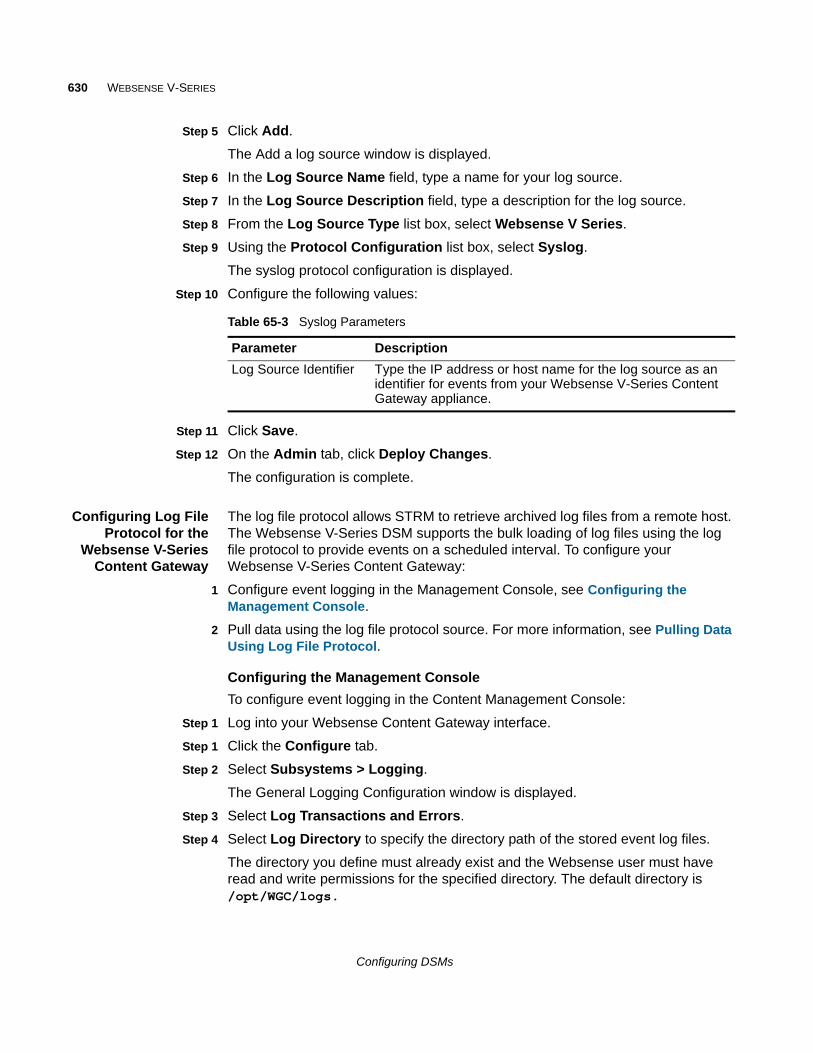
630 WEBSENSE V-SERIES
Step 5 Click Add.
The Add a log source window is displayed.
Step 6 In the Log Source Name field, type a name for your log source.
Step 7 In the Log Source Description field, type a description for the log source.
Step 8 From the Log Source Type list box, select Websense V Series.
Step 9 Using the Protocol Configuration list box, select Syslog.
The syslog protocol configuration is displayed.
Step 10 Configure the following values:
Step 11 Click Save.
Step 12 On the Admin tab, click Deploy Changes.
The configuration is complete.
Configuring Log FileProtocol for the
Websense V-SeriesContent Gateway
The log file protocol allows STRM to retrieve archived log files from a remote host. The Websense V-Series DSM supports the bulk loading of log files using the log file protocol to provide events on a scheduled interval. To configure your Websense V-Series Content Gateway:
1 Configure event logging in the Management Console, see Configuring the Management Console.
2 Pull data using the log file protocol source. For more information, see Pulling Data Using Log File Protocol.
Configuring the Management Console
To configure event logging in the Content Management Console:
Step 1 Log into your Websense Content Gateway interface.
Step 1 Click the Configure tab.
Step 2 Select Subsystems > Logging.
The General Logging Configuration window is displayed.
Step 3 Select Log Transactions and Errors.
Step 4 Select Log Directory to specify the directory path of the stored event log files.
The directory you define must already exist and the Websense user must have read and write permissions for the specified directory. The default directory is /opt/WGC/logs.
Table 65-3 Syslog Parameters
Parameter Description
Log Source Identifier Type the IP address or host name for the log source as an identifier for events from your Websense V-Series Content Gateway appliance.
Configuring DSMs
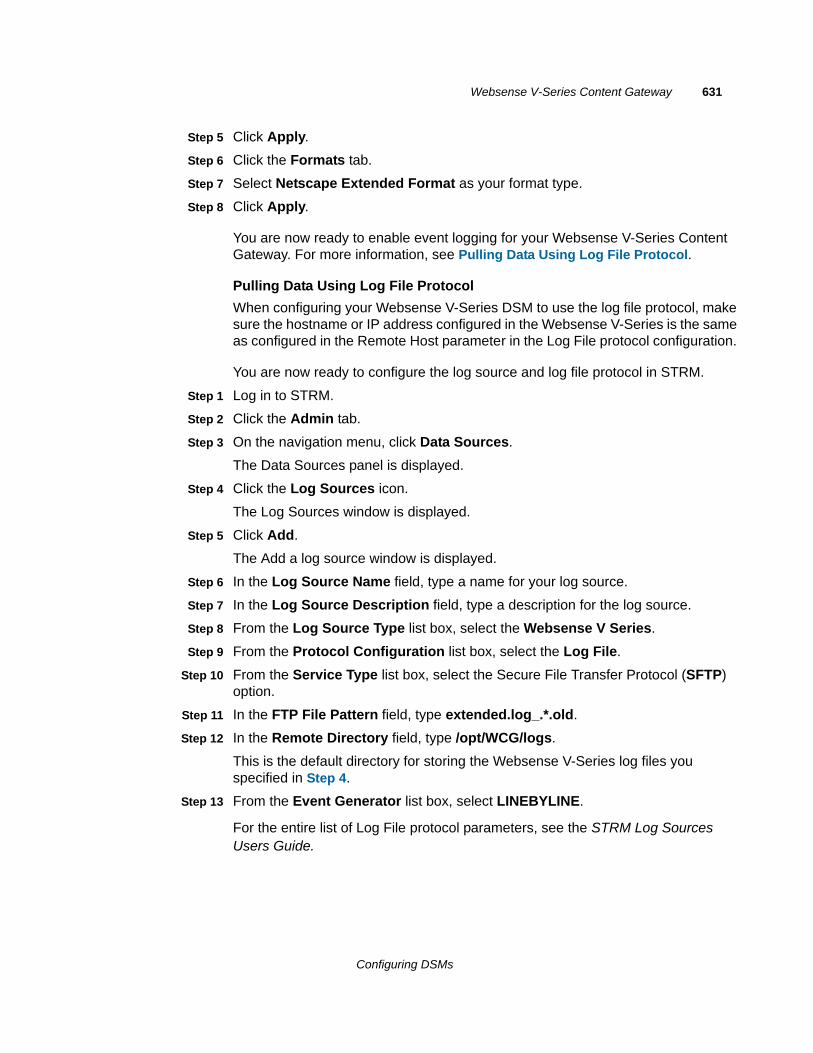
Websense V-Series Content Gateway 631
Step 5 Click Apply.
Step 6 Click the Formats tab.
Step 7 Select Netscape Extended Format as your format type.
Step 8 Click Apply.
You are now ready to enable event logging for your Websense V-Series Content Gateway. For more information, see Pulling Data Using Log File Protocol.
Pulling Data Using Log File Protocol
When configuring your Websense V-Series DSM to use the log file protocol, make sure the hostname or IP address configured in the Websense V-Series is the same as configured in the Remote Host parameter in the Log File protocol configuration.
You are now ready to configure the log source and log file protocol in STRM.
Step 1 Log in to STRM.
Step 2 Click the Admin tab.
Step 3 On the navigation menu, click Data Sources.
The Data Sources panel is displayed.
Step 4 Click the Log Sources icon.
The Log Sources window is displayed.
Step 5 Click Add.
The Add a log source window is displayed.
Step 6 In the Log Source Name field, type a name for your log source.
Step 7 In the Log Source Description field, type a description for the log source.
Step 8 From the Log Source Type list box, select the Websense V Series.
Step 9 From the Protocol Configuration list box, select the Log File.
Step 10 From the Service Type list box, select the Secure File Transfer Protocol (SFTP) option.
Step 11 In the FTP File Pattern field, type extended.log_.*.old.
Step 12 In the Remote Directory field, type /opt/WCG/logs.
This is the default directory for storing the Websense V-Series log files you specified in Step 4.
Step 13 From the Event Generator list box, select LINEBYLINE.
For the entire list of Log File protocol parameters, see the STRM Log Sources Users Guide.
Configuring DSMs

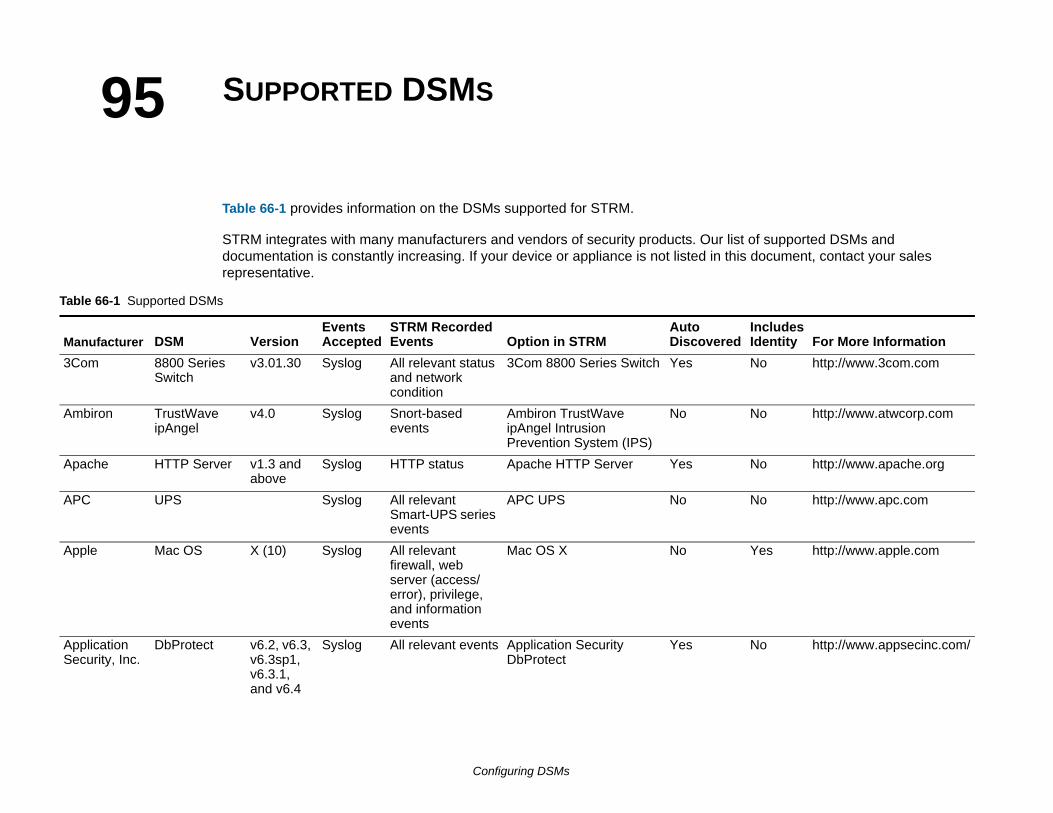
of supported DSMs and document, contact your sales
Ta
MIncludes Identity For More Information
3 No http://www.3com.com
A No http://www.atwcorp.com
A No http://www.apache.org
A No http://www.apc.com
A Yes http://www.apple.com
AS
No http://www.appsecinc.com/
95
ble 66-1 Supported DS
anufacturer DSM
Com 8800 SeSwitch
mbiron TrustWaipAngel
pache HTTP S
PC UPS
pple Mac OS
pplication ecurity, Inc.
DbProte
Configuring DSMs
SUPPORTED DSMS
Table 66-1 provides information on the DSMs supported for STRM.
STRM integrates with many manufacturers and vendors of security products. Our listdocumentation is constantly increasing. If your device or appliance is not listed in thisrepresentative.
Ms
VersionEvents Accepted
STRM Recorded Events Option in STRM
AutoDiscovered
ries v3.01.30 Syslog All relevant status and network condition
3Com 8800 Series Switch Yes
ve v4.0 Syslog Snort-based events
Ambiron TrustWave ipAngel Intrusion Prevention System (IPS)
No
erver v1.3 and above
Syslog HTTP status Apache HTTP Server Yes
Syslog All relevant Smart-UPS series events
APC UPS No
X (10) Syslog All relevant firewall, web server (access/ error), privilege, and information events
Mac OS X No
ct v6.2, v6.3, v6.3sp1, v6.3.1, and v6.4
Syslog All relevant events Application Security DbProtect
Yes
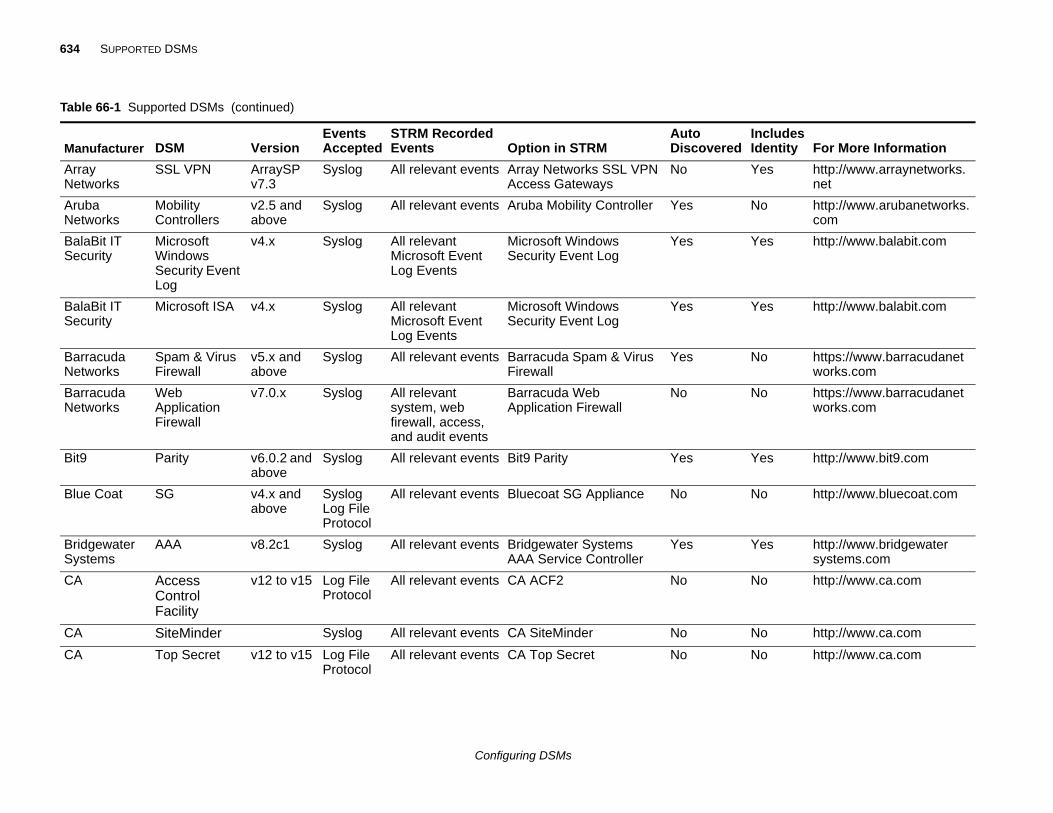
634 SUPPORTED DSMS
ArrayNetw
Yes http://www.arraynetworks.net
ArubNetw
No http://www.arubanetworks.com
BalaSecu
Yes http://www.balabit.com
BalaSecu
Yes http://www.balabit.com
BarraNetw
No https://www.barracudanetworks.com
BarraNetw
No https://www.barracudanetworks.com
Bit9 Yes http://www.bit9.com
Blue No http://www.bluecoat.com
BridgSyste
Yes http://www.bridgewatersystems.com
CA No http://www.ca.com
CA No http://www.ca.com
CA No http://www.ca.com
Table
ManuIncludes Identity For More Information
Configuring DSMs
orks
SSL VPN ArraySP v7.3
Syslog All relevant events Array Networks SSL VPN Access Gateways
No
a orks
Mobility Controllers
v2.5 and above
Syslog All relevant events Aruba Mobility Controller Yes
Bit IT rity
Microsoft Windows Security Event Log
v4.x Syslog All relevant Microsoft Event Log Events
Microsoft Windows Security Event Log
Yes
Bit IT rity
Microsoft ISA v4.x Syslog All relevant Microsoft Event Log Events
Microsoft Windows Security Event Log
Yes
cuda orks
Spam & Virus Firewall
v5.x and above
Syslog All relevant events Barracuda Spam & Virus Firewall
Yes
cuda orks
Web Application Firewall
v7.0.x Syslog All relevant system, web firewall, access, and audit events
Barracuda Web Application Firewall
No
Parity v6.0.2 and above
Syslog All relevant events Bit9 Parity Yes
Coat SG v4.x and above
SyslogLog File Protocol
All relevant events Bluecoat SG Appliance No
ewater ms
AAA v8.2c1 Syslog All relevant events Bridgewater Systems AAA Service Controller
Yes
Access Control Facility
v12 to v15 Log File Protocol
All relevant events CA ACF2 No
SiteMinder Syslog All relevant events CA SiteMinder No
Top Secret v12 to v15 Log File Protocol
All relevant events CA Top Secret No
66-1 Supported DSMs (continued)
facturer DSM VersionEvents Accepted
STRM Recorded Events Option in STRM
AutoDiscovered
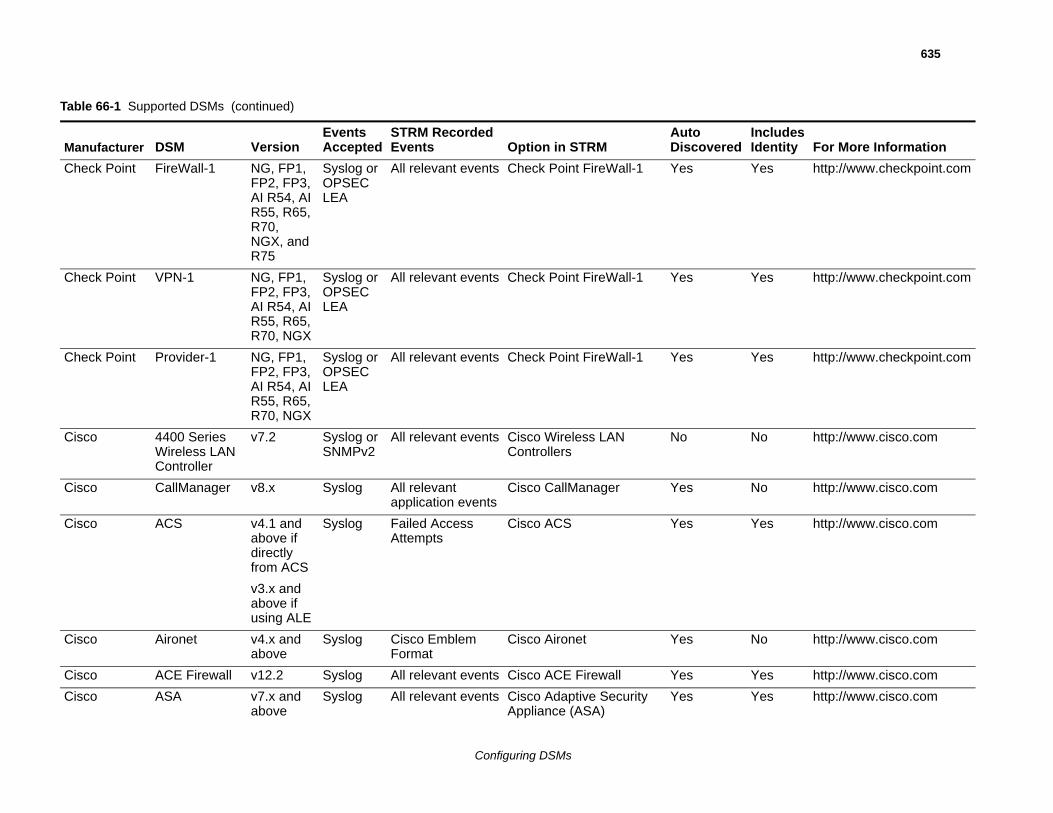
635
Chec Yes http://www.checkpoint.com
Chec Yes http://www.checkpoint.com
Chec Yes http://www.checkpoint.com
Cisco No http://www.cisco.com
Cisco No http://www.cisco.com
Cisco Yes http://www.cisco.com
Cisco No http://www.cisco.com
Cisco Yes http://www.cisco.com
Cisco Yes http://www.cisco.com
Table
ManuIncludes Identity For More Information
Configuring DSMs
k Point FireWall-1 NG, FP1, FP2, FP3, AI R54, AI R55, R65, R70, NGX, and R75
Syslog or OPSEC LEA
All relevant events Check Point FireWall-1 Yes
k Point VPN-1 NG, FP1, FP2, FP3, AI R54, AI R55, R65, R70, NGX
Syslog or OPSEC LEA
All relevant events Check Point FireWall-1 Yes
k Point Provider-1 NG, FP1, FP2, FP3, AI R54, AI R55, R65, R70, NGX
Syslog or OPSEC LEA
All relevant events Check Point FireWall-1 Yes
4400 Series Wireless LAN Controller
v7.2 Syslog or SNMPv2
All relevant events Cisco Wireless LAN Controllers
No
CallManager v8.x Syslog All relevant application events
Cisco CallManager Yes
ACS v4.1 and above if directly from ACS
v3.x and above if using ALE
Syslog Failed Access Attempts
Cisco ACS Yes
Aironet v4.x and above
Syslog Cisco Emblem Format
Cisco Aironet Yes
ACE Firewall v12.2 Syslog All relevant events Cisco ACE Firewall Yes
ASA v7.x and above
Syslog All relevant events Cisco Adaptive Security Appliance (ASA)
Yes
66-1 Supported DSMs (continued)
facturer DSM VersionEvents Accepted
STRM Recorded Events Option in STRM
AutoDiscovered
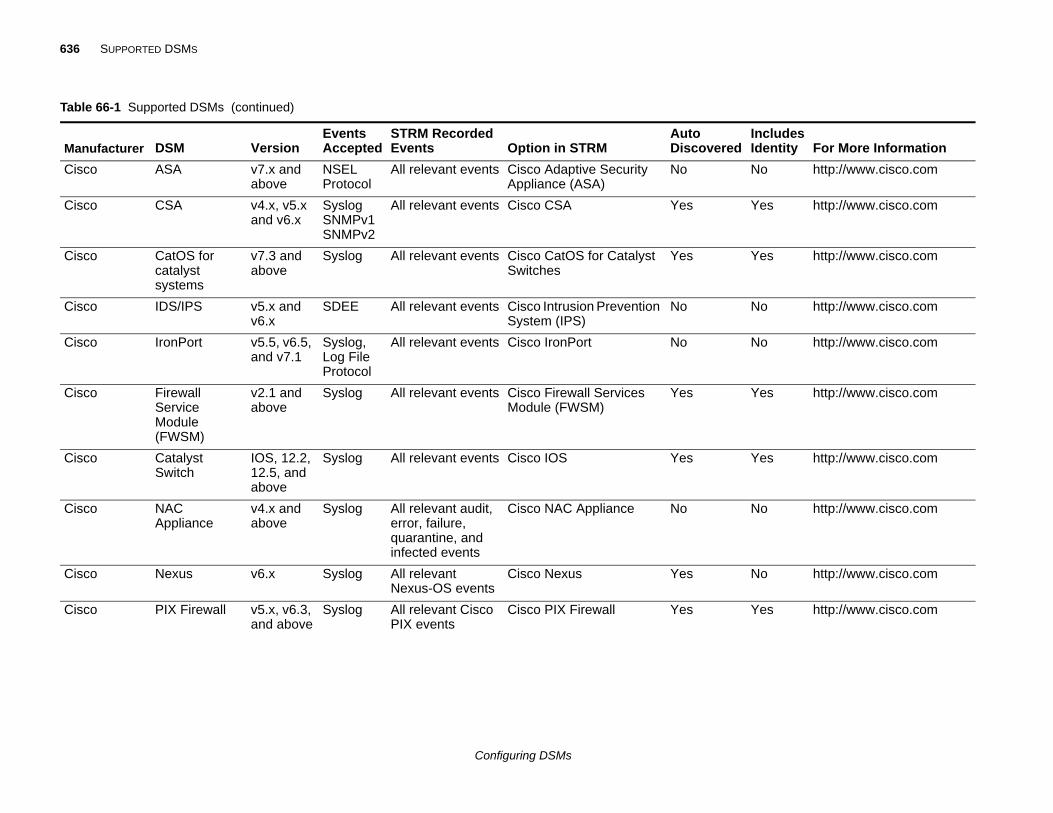
636 SUPPORTED DSMS
Cisco No http://www.cisco.com
Cisco Yes http://www.cisco.com
Cisco Yes http://www.cisco.com
Cisco No http://www.cisco.com
Cisco No http://www.cisco.com
Cisco Yes http://www.cisco.com
Cisco Yes http://www.cisco.com
Cisco No http://www.cisco.com
Cisco No http://www.cisco.com
Cisco Yes http://www.cisco.com
Table
ManuIncludes Identity For More Information
Configuring DSMs
ASA v7.x and above
NSEL Protocol
All relevant events Cisco Adaptive Security Appliance (ASA)
No
CSA v4.x, v5.x and v6.x
Syslog SNMPv1 SNMPv2
All relevant events Cisco CSA Yes
CatOS for catalyst systems
v7.3 and above
Syslog All relevant events Cisco CatOS for Catalyst Switches
Yes
IDS/IPS v5.x and v6.x
SDEE All relevant events Cisco Intrusion Prevention System (IPS)
No
IronPort v5.5, v6.5, and v7.1
Syslog, Log File Protocol
All relevant events Cisco IronPort No
Firewall Service Module (FWSM)
v2.1 and above
Syslog All relevant events Cisco Firewall Services Module (FWSM)
Yes
Catalyst Switch
IOS, 12.2, 12.5, and above
Syslog All relevant events Cisco IOS Yes
NAC Appliance
v4.x and above
Syslog All relevant audit, error, failure, quarantine, and infected events
Cisco NAC Appliance No
Nexus v6.x Syslog All relevant Nexus-OS events
Cisco Nexus Yes
PIX Firewall v5.x, v6.3, and above
Syslog All relevant Cisco PIX events
Cisco PIX Firewall Yes
66-1 Supported DSMs (continued)
facturer DSM VersionEvents Accepted
STRM Recorded Events Option in STRM
AutoDiscovered
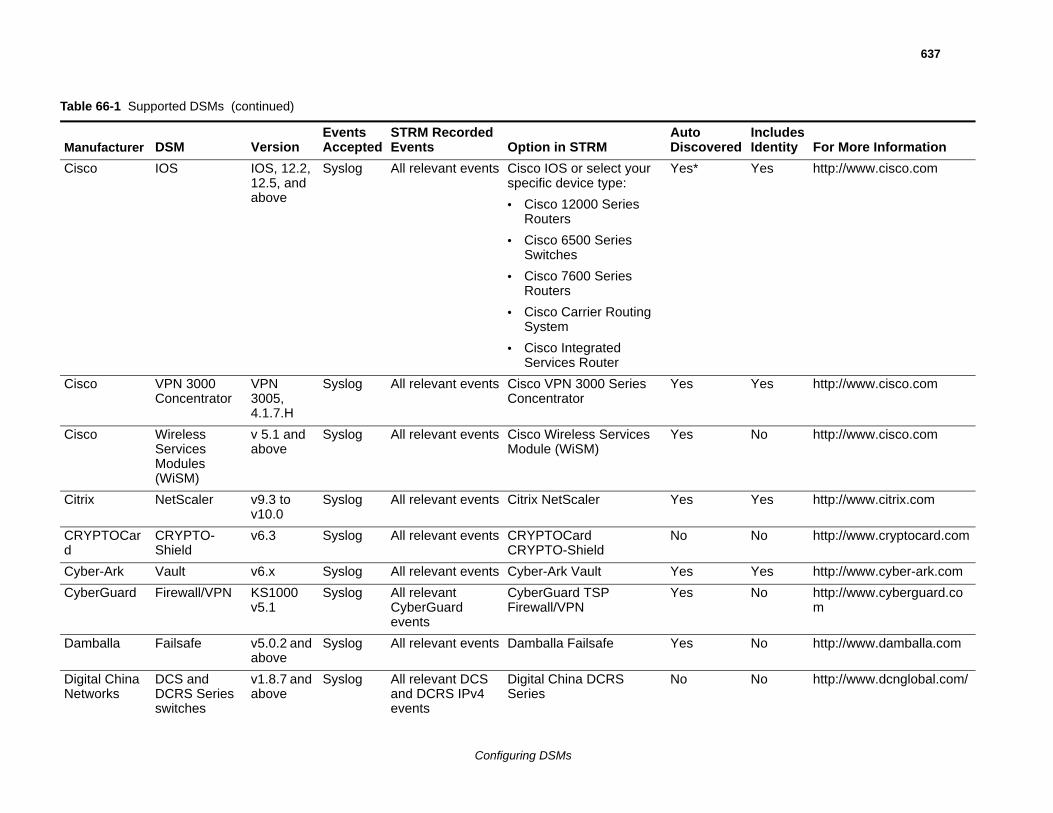
637
Cisco Yes http://www.cisco.com
Cisco Yes http://www.cisco.com
Cisco No http://www.cisco.com
Citrix Yes http://www.citrix.com
CRYd
No http://www.cryptocard.com
Cybe Yes http://www.cyber-ark.com
Cybe No http://www.cyberguard.com
Dam No http://www.damballa.com
DigitNetw
No http://www.dcnglobal.com/
Table
ManuIncludes Identity For More Information
Configuring DSMs
IOS IOS, 12.2, 12.5, and above
Syslog All relevant events Cisco IOS or select your specific device type:
• Cisco 12000 Series Routers
• Cisco 6500 Series Switches
• Cisco 7600 Series Routers
• Cisco Carrier Routing System
• Cisco Integrated Services Router
Yes*
VPN 3000 Concentrator
VPN 3005, 4.1.7.H
Syslog All relevant events Cisco VPN 3000 Series Concentrator
Yes
Wireless Services Modules (WiSM)
v 5.1 and above
Syslog All relevant events Cisco Wireless Services Module (WiSM)
Yes
NetScaler v9.3 to v10.0
Syslog All relevant events Citrix NetScaler Yes
PTOCar CRYPTO-Shield
v6.3 Syslog All relevant events CRYPTOCard CRYPTO-Shield
No
r-Ark Vault v6.x Syslog All relevant events Cyber-Ark Vault Yes
rGuard Firewall/VPN KS1000 v5.1
Syslog All relevant CyberGuard events
CyberGuard TSP Firewall/VPN
Yes
balla Failsafe v5.0.2 and above
Syslog All relevant events Damballa Failsafe Yes
al China orks
DCS and DCRS Series switches
v1.8.7 and above
Syslog All relevant DCS and DCRS IPv4 events
Digital China DCRS Series
No
66-1 Supported DSMs (continued)
facturer DSM VersionEvents Accepted
STRM Recorded Events Option in STRM
AutoDiscovered
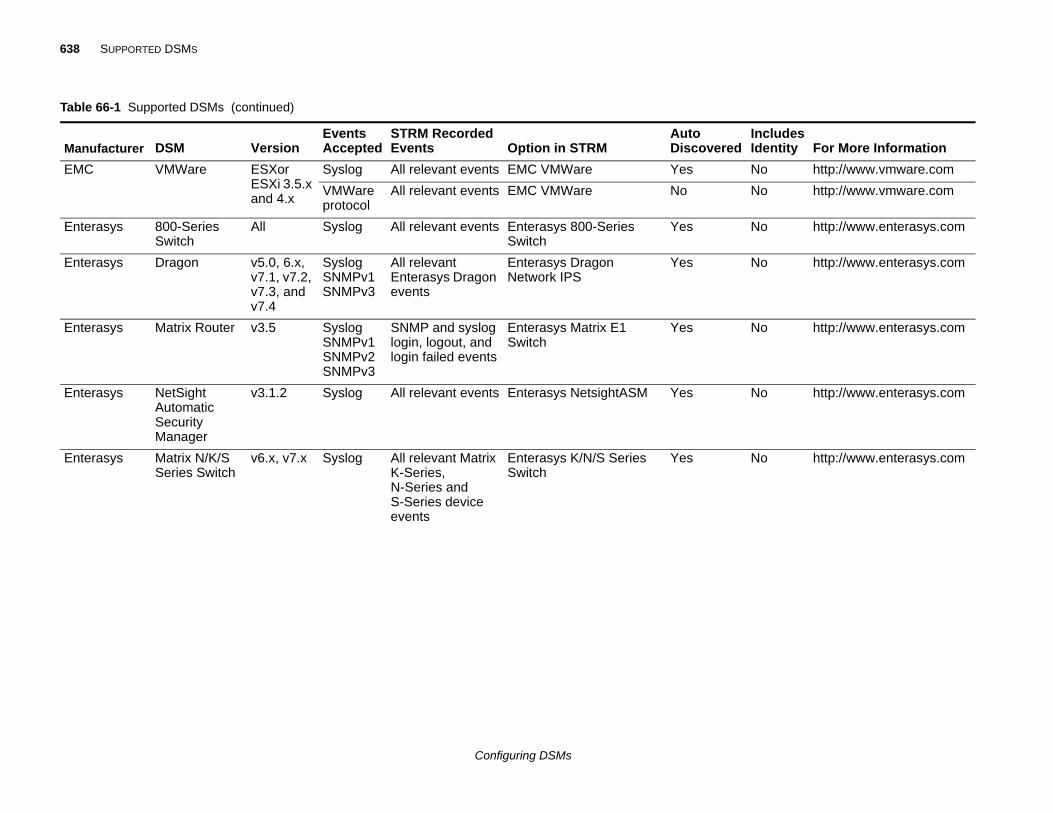
638 SUPPORTED DSMS
EMC No http://www.vmware.com
No http://www.vmware.com
Ente No http://www.enterasys.com
Ente No http://www.enterasys.com
Ente No http://www.enterasys.com
Ente No http://www.enterasys.com
Ente No http://www.enterasys.com
Table
ManuIncludes Identity For More Information
Configuring DSMs
VMWare ESXor ESXi 3.5.x and 4.x
Syslog All relevant events EMC VMWare Yes
VMWare protocol
All relevant events EMC VMWare No
rasys 800-Series Switch
All Syslog All relevant events Enterasys 800-Series Switch
Yes
rasys Dragon v5.0, 6.x, v7.1, v7.2, v7.3, and v7.4
Syslog SNMPv1 SNMPv3
All relevant Enterasys Dragon events
Enterasys Dragon Network IPS
Yes
rasys Matrix Router v3.5 Syslog SNMPv1 SNMPv2 SNMPv3
SNMP and syslog login, logout, and login failed events
Enterasys Matrix E1 Switch
Yes
rasys NetSight Automatic Security Manager
v3.1.2 Syslog All relevant events Enterasys NetsightASM Yes
rasys Matrix N/K/S Series Switch
v6.x, v7.x Syslog All relevant Matrix K-Series, N-Series and S-Series device events
Enterasys K/N/S Series Switch
Yes
66-1 Supported DSMs (continued)
facturer DSM VersionEvents Accepted
STRM Recorded Events Option in STRM
AutoDiscovered
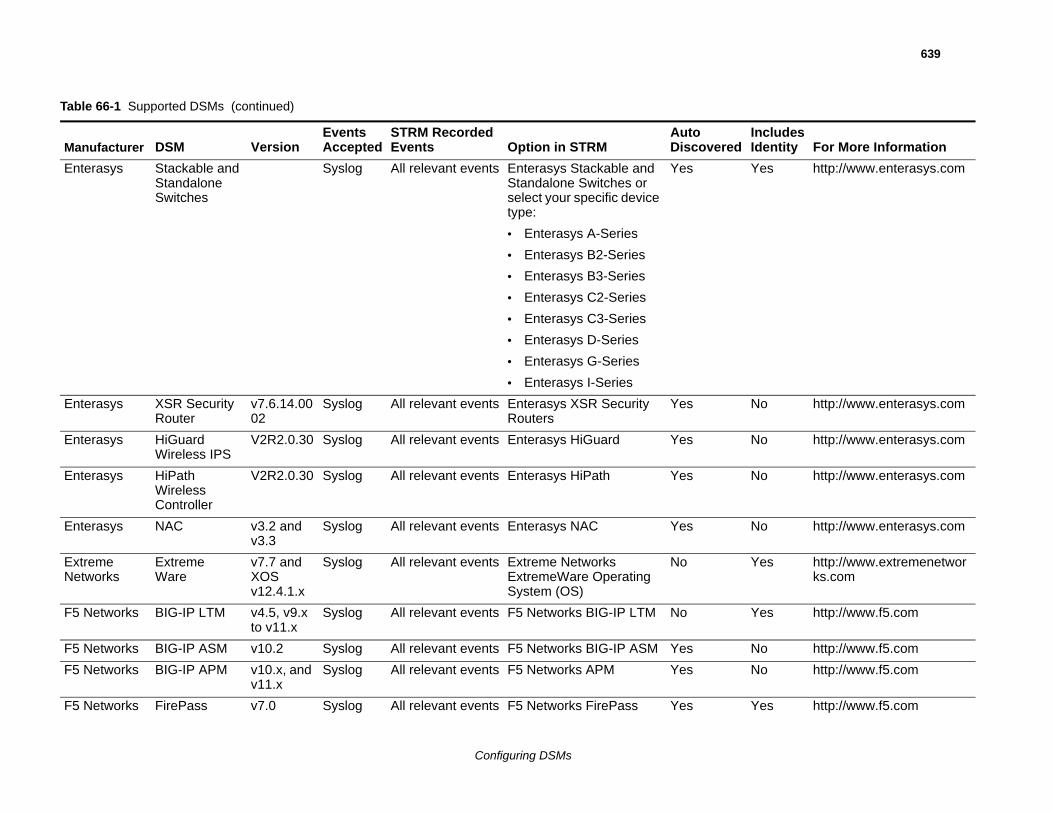
639
Ente Yes http://www.enterasys.com
Ente No http://www.enterasys.com
Ente No http://www.enterasys.com
Ente No http://www.enterasys.com
Ente No http://www.enterasys.com
ExtreNetw
Yes http://www.extremenetworks.com
F5 N Yes http://www.f5.com
F5 N No http://www.f5.com
F5 N No http://www.f5.com
F5 N Yes http://www.f5.com
Table
ManuIncludes Identity For More Information
Configuring DSMs
rasys Stackable and Standalone Switches
Syslog All relevant events Enterasys Stackable and Standalone Switches or select your specific device type:
• Enterasys A-Series
• Enterasys B2-Series
• Enterasys B3-Series
• Enterasys C2-Series
• Enterasys C3-Series
• Enterasys D-Series
• Enterasys G-Series
• Enterasys I-Series
Yes
rasys XSR Security Router
v7.6.14.0002
Syslog All relevant events Enterasys XSR Security Routers
Yes
rasys HiGuard Wireless IPS
V2R2.0.30 Syslog All relevant events Enterasys HiGuard Yes
rasys HiPath Wireless Controller
V2R2.0.30 Syslog All relevant events Enterasys HiPath Yes
rasys NAC v3.2 and v3.3
Syslog All relevant events Enterasys NAC Yes
me orks
ExtremeWare
v7.7 and XOS v12.4.1.x
Syslog All relevant events Extreme Networks ExtremeWare Operating System (OS)
No
etworks BIG-IP LTM v4.5, v9.x to v11.x
Syslog All relevant events F5 Networks BIG-IP LTM No
etworks BIG-IP ASM v10.2 Syslog All relevant events F5 Networks BIG-IP ASM Yes
etworks BIG-IP APM v10.x, and v11.x
Syslog All relevant events F5 Networks APM Yes
etworks FirePass v7.0 Syslog All relevant events F5 Networks FirePass Yes
66-1 Supported DSMs (continued)
facturer DSM VersionEvents Accepted
STRM Recorded Events Option in STRM
AutoDiscovered
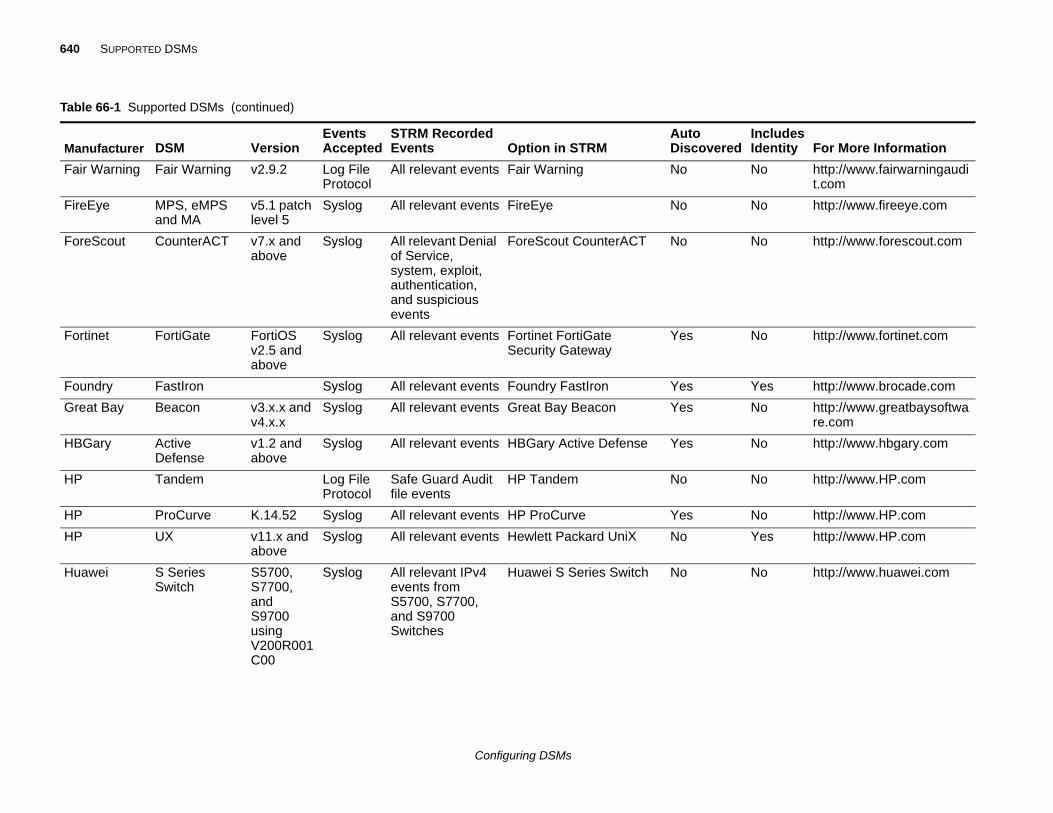
640 SUPPORTED DSMS
Fair No http://www.fairwarningaudit.com
FireE No http://www.fireeye.com
Fore No http://www.forescout.com
Forti No http://www.fortinet.com
Foun Yes http://www.brocade.com
Grea No http://www.greatbaysoftware.com
HBG No http://www.hbgary.com
HP No http://www.HP.com
HP No http://www.HP.com
HP Yes http://www.HP.com
Huaw No http://www.huawei.com
Table
ManuIncludes Identity For More Information
Configuring DSMs
Warning Fair Warning v2.9.2 Log File Protocol
All relevant events Fair Warning No
ye MPS, eMPS and MA
v5.1 patch level 5
Syslog All relevant events FireEye No
Scout CounterACT v7.x and above
Syslog All relevant Denial of Service, system, exploit, authentication, and suspicious events
ForeScout CounterACT No
net FortiGate FortiOS v2.5 and above
Syslog All relevant events Fortinet FortiGate Security Gateway
Yes
dry FastIron Syslog All relevant events Foundry FastIron Yes
t Bay Beacon v3.x.x and v4.x.x
Syslog All relevant events Great Bay Beacon Yes
ary Active Defense
v1.2 and above
Syslog All relevant events HBGary Active Defense Yes
Tandem Log File Protocol
Safe Guard Audit file events
HP Tandem No
ProCurve K.14.52 Syslog All relevant events HP ProCurve Yes
UX v11.x and above
Syslog All relevant events Hewlett Packard UniX No
ei S Series Switch
S5700, S7700, andS9700 using V200R001C00
Syslog All relevant IPv4 events from S5700, S7700, and S9700 Switches
Huawei S Series Switch No
66-1 Supported DSMs (continued)
facturer DSM VersionEvents Accepted
STRM Recorded Events Option in STRM
AutoDiscovered
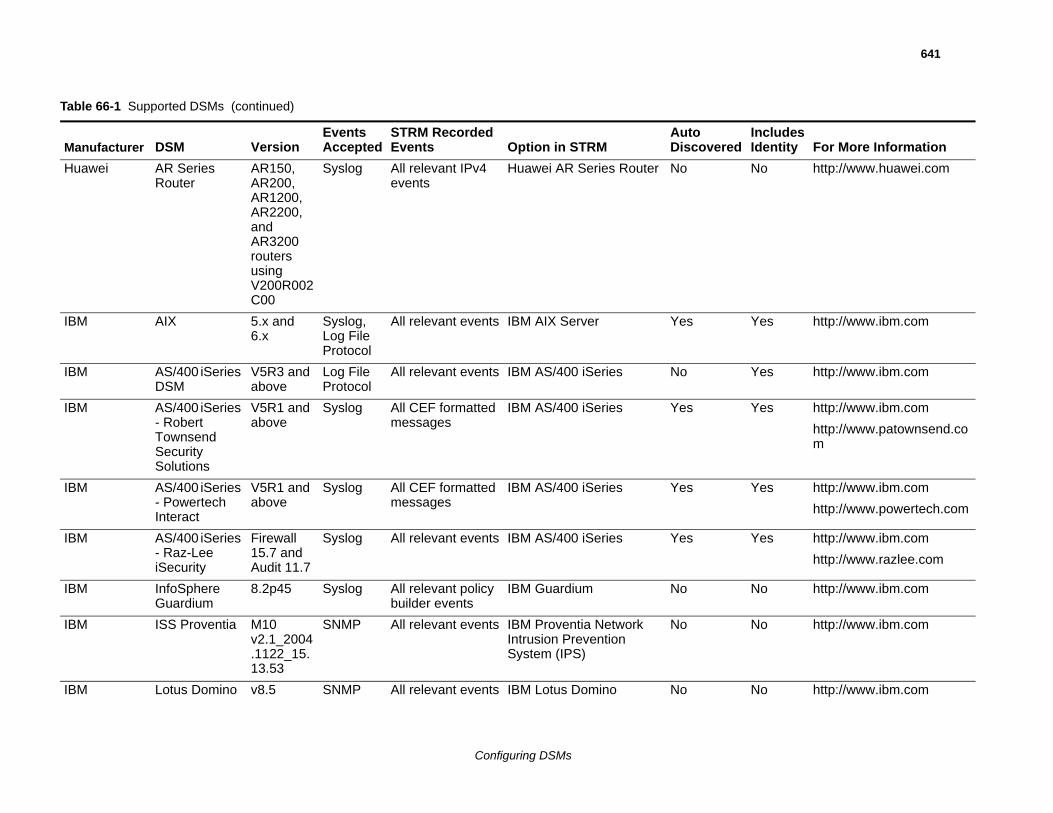
641
Huaw No http://www.huawei.com
IBM Yes http://www.ibm.com
IBM Yes http://www.ibm.com
IBM Yes http://www.ibm.com
http://www.patownsend.com
IBM Yes http://www.ibm.com
http://www.powertech.com
IBM Yes http://www.ibm.com
http://www.razlee.com
IBM No http://www.ibm.com
IBM No http://www.ibm.com
IBM No http://www.ibm.com
Table
ManuIncludes Identity For More Information
Configuring DSMs
ei AR Series Router
AR150, AR200, AR1200, AR2200, and AR3200 routers using V200R002C00
Syslog All relevant IPv4 events
Huawei AR Series Router No
AIX 5.x and 6.x
Syslog, Log File Protocol
All relevant events IBM AIX Server Yes
AS/400 iSeries DSM
V5R3 and above
Log File Protocol
All relevant events IBM AS/400 iSeries No
AS/400 iSeries - Robert Townsend Security Solutions
V5R1 and above
Syslog All CEF formatted messages
IBM AS/400 iSeries Yes
AS/400 iSeries - Powertech Interact
V5R1 and above
Syslog All CEF formatted messages
IBM AS/400 iSeries Yes
AS/400 iSeries - Raz-Lee iSecurity
Firewall 15.7 and Audit 11.7
Syslog All relevant events IBM AS/400 iSeries Yes
InfoSphere Guardium
8.2p45 Syslog All relevant policy builder events
IBM Guardium No
ISS Proventia M10 v2.1_2004.1122_15.13.53
SNMP All relevant events IBM Proventia Network Intrusion Prevention System (IPS)
No
Lotus Domino v8.5 SNMP All relevant events IBM Lotus Domino No
66-1 Supported DSMs (continued)
facturer DSM VersionEvents Accepted
STRM Recorded Events Option in STRM
AutoDiscovered
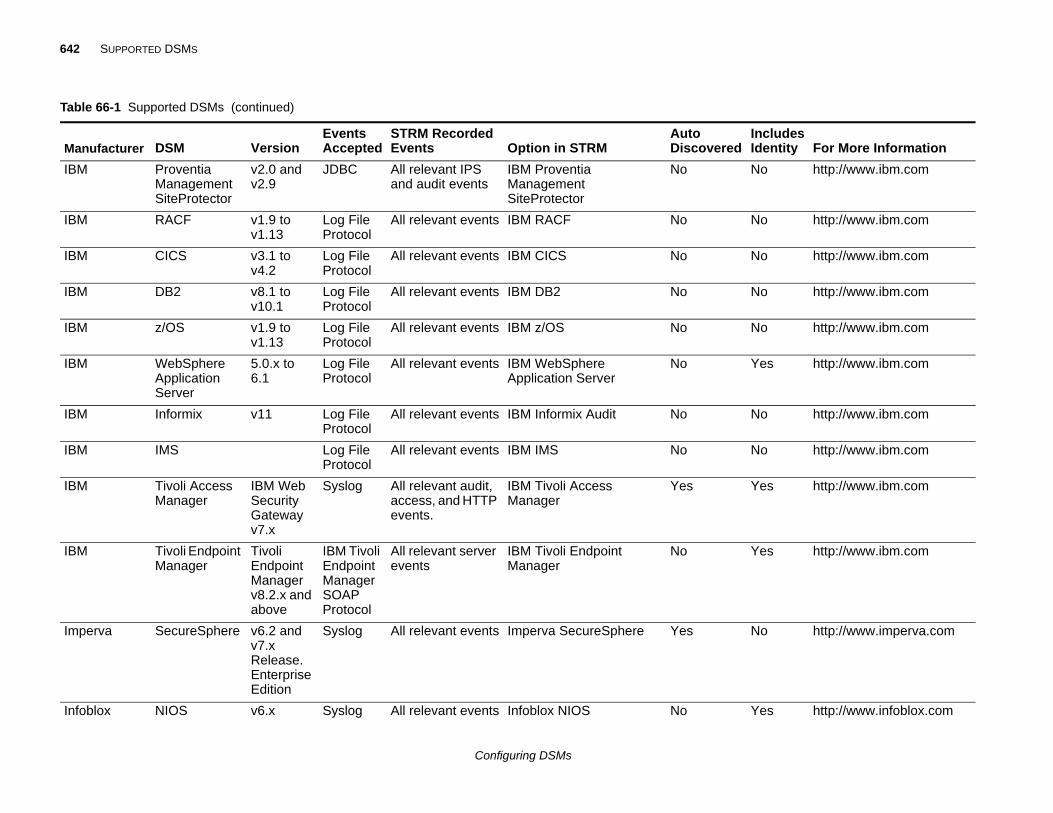
642 SUPPORTED DSMS
IBM No http://www.ibm.com
IBM No http://www.ibm.com
IBM No http://www.ibm.com
IBM No http://www.ibm.com
IBM No http://www.ibm.com
IBM Yes http://www.ibm.com
IBM No http://www.ibm.com
IBM No http://www.ibm.com
IBM Yes http://www.ibm.com
IBM Yes http://www.ibm.com
Impe No http://www.imperva.com
Infob Yes http://www.infoblox.com
Table
ManuIncludes Identity For More Information
Configuring DSMs
Proventia Management SiteProtector
v2.0 and v2.9
JDBC All relevant IPS and audit events
IBM Proventia Management SiteProtector
No
RACF v1.9 to v1.13
Log File Protocol
All relevant events IBM RACF No
CICS v3.1 to v4.2
Log File Protocol
All relevant events IBM CICS No
DB2 v8.1 to v10.1
Log File Protocol
All relevant events IBM DB2 No
z/OS v1.9 to v1.13
Log File Protocol
All relevant events IBM z/OS No
WebSphere Application Server
5.0.x to 6.1
Log File Protocol
All relevant events IBM WebSphere Application Server
No
Informix v11 Log File Protocol
All relevant events IBM Informix Audit No
IMS Log File Protocol
All relevant events IBM IMS No
Tivoli Access Manager
IBM Web Security Gateway v7.x
Syslog All relevant audit, access, and HTTP events.
IBM Tivoli Access Manager
Yes
Tivoli Endpoint Manager
Tivoli Endpoint Manager v8.2.x and above
IBM Tivoli Endpoint Manager SOAP Protocol
All relevant server events
IBM Tivoli Endpoint Manager
No
rva SecureSphere v6.2 and v7.x Release.Enterprise Edition
Syslog All relevant events Imperva SecureSphere Yes
lox NIOS v6.x Syslog All relevant events Infoblox NIOS No
66-1 Supported DSMs (continued)
facturer DSM VersionEvents Accepted
STRM Recorded Events Option in STRM
AutoDiscovered
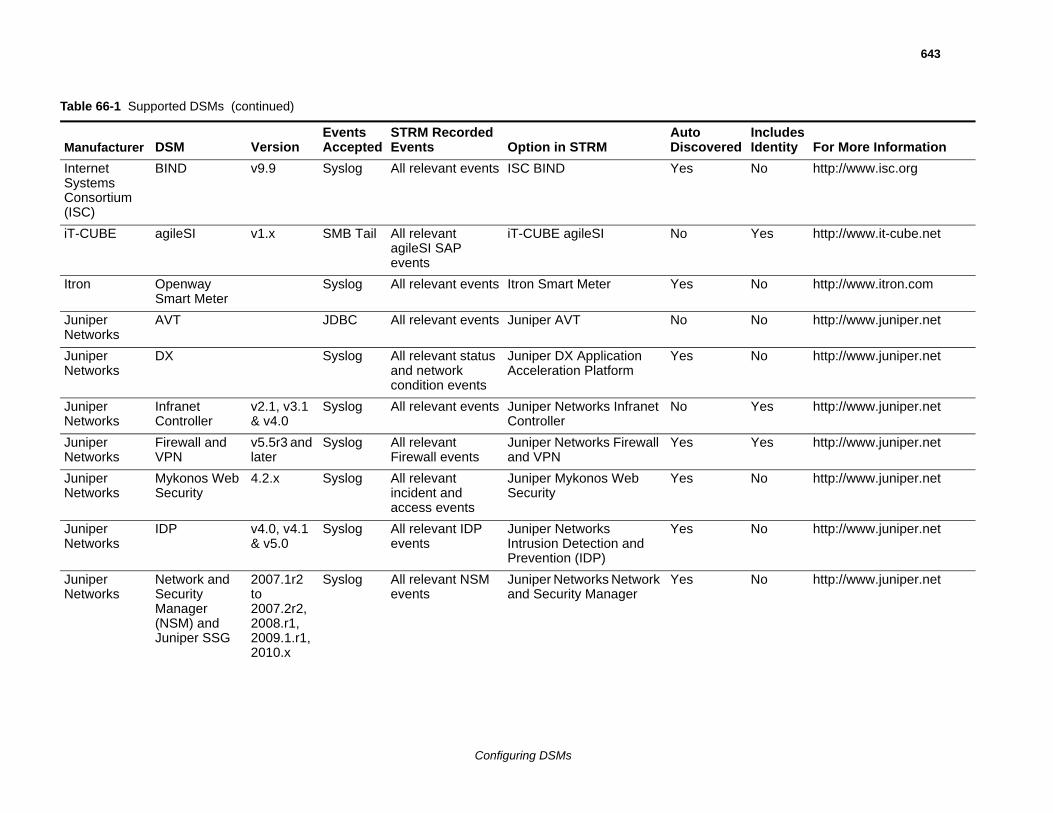
643
InterSysteCons(ISC
No http://www.isc.org
iT-CU Yes http://www.it-cube.net
Itron No http://www.itron.com
JunipNetw
No http://www.juniper.net
JunipNetw
No http://www.juniper.net
JunipNetw
Yes http://www.juniper.net
JunipNetw
Yes http://www.juniper.net
JunipNetw
No http://www.juniper.net
JunipNetw
No http://www.juniper.net
JunipNetw
No http://www.juniper.net
Table
ManuIncludes Identity For More Information
Configuring DSMs
net ms ortium
)
BIND v9.9 Syslog All relevant events ISC BIND Yes
BE agileSI v1.x SMB Tail All relevant agileSI SAP events
iT-CUBE agileSI No
Openway Smart Meter
Syslog All relevant events Itron Smart Meter Yes
er orks
AVT JDBC All relevant events Juniper AVT No
er orks
DX Syslog All relevant status and network condition events
Juniper DX Application Acceleration Platform
Yes
er orks
Infranet Controller
v2.1, v3.1 & v4.0
Syslog All relevant events Juniper Networks Infranet Controller
No
er orks
Firewall and VPN
v5.5r3 and later
Syslog All relevant Firewall events
Juniper Networks Firewall and VPN
Yes
er orks
Mykonos Web Security
4.2.x Syslog All relevant incident and access events
Juniper Mykonos Web Security
Yes
er orks
IDP v4.0, v4.1 & v5.0
Syslog All relevant IDP events
Juniper Networks Intrusion Detection and Prevention (IDP)
Yes
er orks
Network and Security Manager (NSM) and Juniper SSG
2007.1r2 to 2007.2r2, 2008.r1, 2009.1.r1, 2010.x
Syslog All relevant NSM events
Juniper Networks Network and Security Manager
Yes
66-1 Supported DSMs (continued)
facturer DSM VersionEvents Accepted
STRM Recorded Events Option in STRM
AutoDiscovered
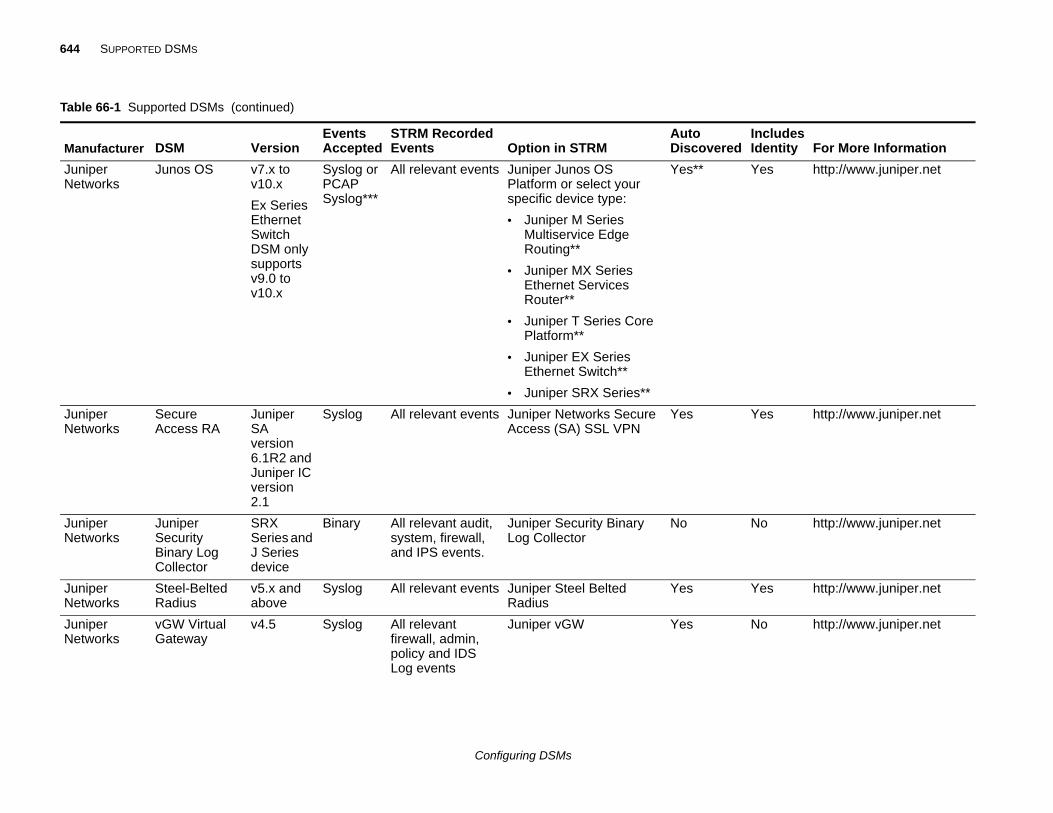
644 SUPPORTED DSMS
JunipNetw
Yes http://www.juniper.net
JunipNetw
Yes http://www.juniper.net
JunipNetw
No http://www.juniper.net
JunipNetw
Yes http://www.juniper.net
JunipNetw
No http://www.juniper.net
Table
ManuIncludes Identity For More Information
Configuring DSMs
er orks
Junos OS v7.x to v10.x
Ex Series Ethernet Switch DSM only supports v9.0 to v10.x
Syslog orPCAP Syslog***
All relevant events Juniper Junos OS Platform or select your specific device type:
• Juniper M Series Multiservice Edge Routing**
• Juniper MX Series Ethernet Services Router**
• Juniper T Series Core Platform**
• Juniper EX Series Ethernet Switch**
• Juniper SRX Series**
Yes**
er orks
Secure Access RA
Juniper SA version 6.1R2 and Juniper IC version 2.1
Syslog All relevant events Juniper Networks Secure Access (SA) SSL VPN
Yes
er orks
Juniper Security Binary Log Collector
SRX Series and J Series device
Binary All relevant audit, system, firewall, and IPS events.
Juniper Security Binary Log Collector
No
er orks
Steel-Belted Radius
v5.x and above
Syslog All relevant events Juniper Steel Belted Radius
Yes
er orks
vGW Virtual Gateway
v4.5 Syslog All relevant firewall, admin, policy and IDS Log events
Juniper vGW Yes
66-1 Supported DSMs (continued)
facturer DSM VersionEvents Accepted
STRM Recorded Events Option in STRM
AutoDiscovered
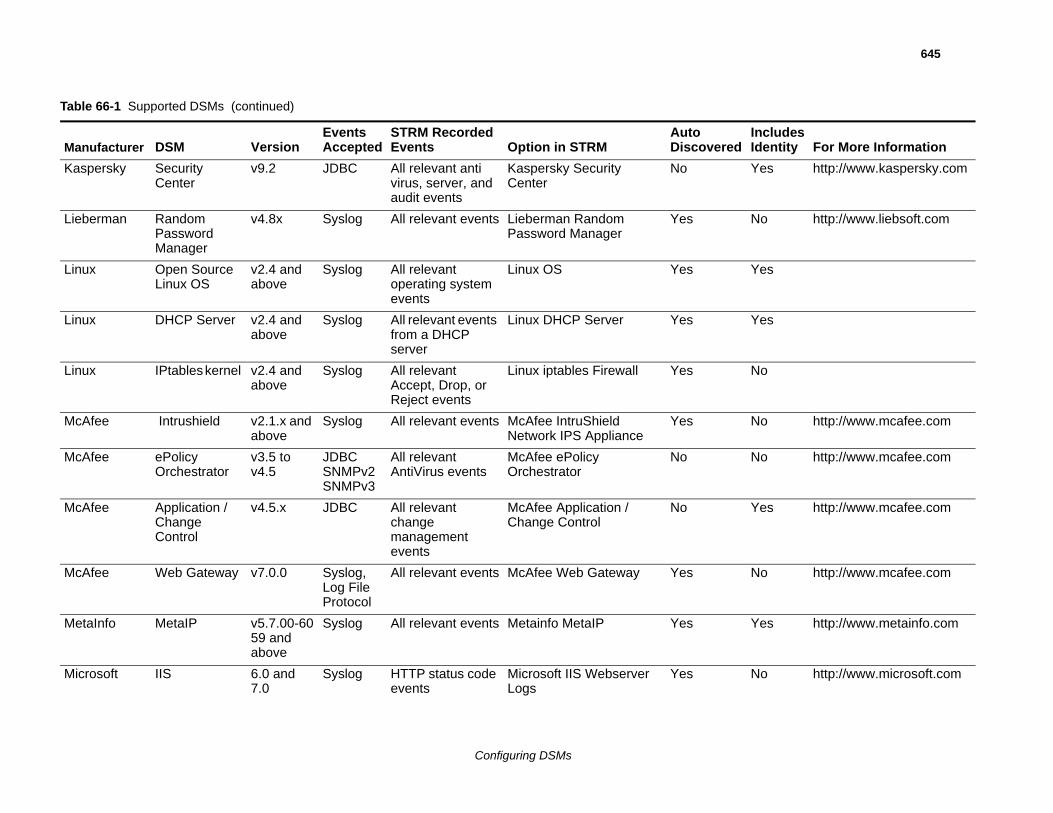
645
Kasp Yes http://www.kaspersky.com
Liebe No http://www.liebsoft.com
Linux Yes
Linux Yes
Linux No
McA No http://www.mcafee.com
McA No http://www.mcafee.com
McA Yes http://www.mcafee.com
McA No http://www.mcafee.com
Meta Yes http://www.metainfo.com
Micro No http://www.microsoft.com
Table
ManuIncludes Identity For More Information
Configuring DSMs
ersky Security Center
v9.2 JDBC All relevant anti virus, server, and audit events
Kaspersky Security Center
No
rman Random Password Manager
v4.8x Syslog All relevant events Lieberman Random Password Manager
Yes
Open Source Linux OS
v2.4 and above
Syslog All relevant operating system events
Linux OS Yes
DHCP Server v2.4 and above
Syslog All relevant events from a DHCP server
Linux DHCP Server Yes
IPtables kernel v2.4 and above
Syslog All relevant Accept, Drop, or Reject events
Linux iptables Firewall Yes
fee Intrushield v2.1.x and above
Syslog All relevant events McAfee IntruShield Network IPS Appliance
Yes
fee ePolicy Orchestrator
v3.5 to v4.5
JDBCSNMPv2SNMPv3
All relevant AntiVirus events
McAfee ePolicy Orchestrator
No
fee Application / Change Control
v4.5.x JDBC All relevant change management events
McAfee Application / Change Control
No
fee Web Gateway v7.0.0 Syslog, Log File Protocol
All relevant events McAfee Web Gateway Yes
Info MetaIP v5.7.00-6059 and above
Syslog All relevant events Metainfo MetaIP Yes
soft IIS 6.0 and 7.0
Syslog HTTP status code events
Microsoft IIS Webserver Logs
Yes
66-1 Supported DSMs (continued)
facturer DSM VersionEvents Accepted
STRM Recorded Events Option in STRM
AutoDiscovered
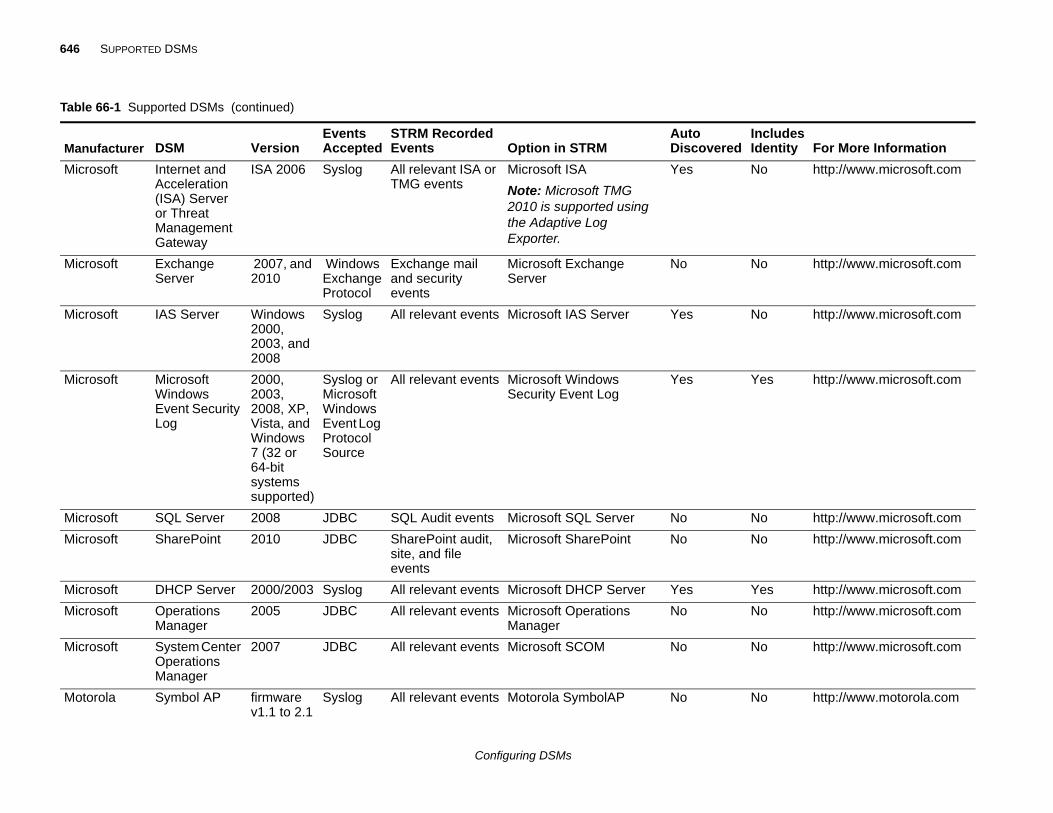
646 SUPPORTED DSMS
Micro No http://www.microsoft.com
Micro No http://www.microsoft.com
Micro No http://www.microsoft.com
Micro Yes http://www.microsoft.com
Micro No http://www.microsoft.com
Micro No http://www.microsoft.com
Micro Yes http://www.microsoft.com
Micro No http://www.microsoft.com
Micro No http://www.microsoft.com
Moto No http://www.motorola.com
Table
ManuIncludes Identity For More Information
Configuring DSMs
soft Internet and Acceleration (ISA) Server or Threat Management Gateway
ISA 2006 Syslog All relevant ISA or TMG events
Microsoft ISA
Note: Microsoft TMG 2010 is supported using the Adaptive Log Exporter.
Yes
soft Exchange Server
2007, and 2010
Windows Exchange Protocol
Exchange mail and security events
Microsoft Exchange Server
No
soft IAS Server Windows 2000, 2003, and 2008
Syslog All relevant events Microsoft IAS Server Yes
soft Microsoft Windows Event Security Log
2000, 2003, 2008, XP, Vista, and Windows 7 (32 or 64-bit systems supported)
Syslog or Microsoft Windows Event Log Protocol Source
All relevant events Microsoft Windows Security Event Log
Yes
soft SQL Server 2008 JDBC SQL Audit events Microsoft SQL Server No
soft SharePoint 2010 JDBC SharePoint audit, site, and file events
Microsoft SharePoint No
soft DHCP Server 2000/2003 Syslog All relevant events Microsoft DHCP Server Yes
soft Operations Manager
2005 JDBC All relevant events Microsoft Operations Manager
No
soft System Center Operations Manager
2007 JDBC All relevant events Microsoft SCOM No
rola Symbol AP firmware v1.1 to 2.1
Syslog All relevant events Motorola SymbolAP No
66-1 Supported DSMs (continued)
facturer DSM VersionEvents Accepted
STRM Recorded Events Option in STRM
AutoDiscovered
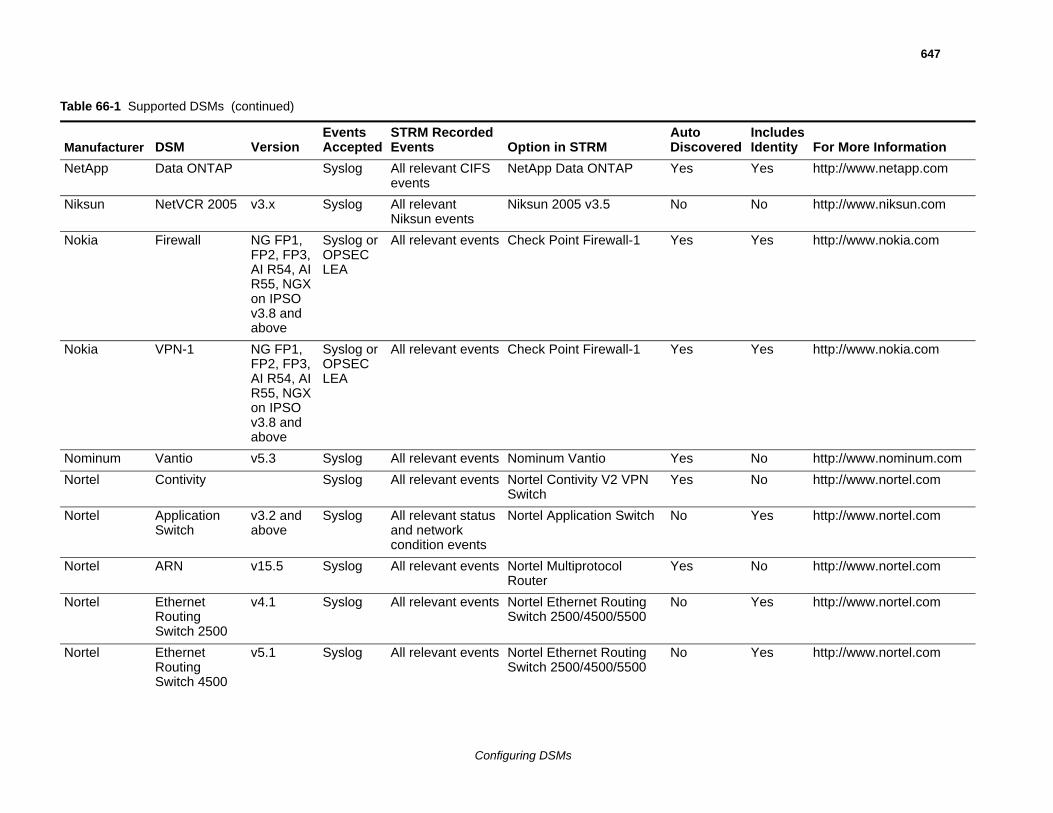
647
NetA Yes http://www.netapp.com
Niksu No http://www.niksun.com
Noki Yes http://www.nokia.com
Noki Yes http://www.nokia.com
Nom No http://www.nominum.com
Norte No http://www.nortel.com
Norte Yes http://www.nortel.com
Norte No http://www.nortel.com
Norte Yes http://www.nortel.com
Norte Yes http://www.nortel.com
Table
ManuIncludes Identity For More Information
Configuring DSMs
pp Data ONTAP Syslog All relevant CIFS events
NetApp Data ONTAP Yes
n NetVCR 2005 v3.x Syslog All relevant Niksun events
Niksun 2005 v3.5 No
a Firewall NG FP1, FP2, FP3, AI R54, AI R55, NGX on IPSO v3.8 and above
Syslog or OPSEC LEA
All relevant events Check Point Firewall-1 Yes
a VPN-1 NG FP1, FP2, FP3, AI R54, AI R55, NGX on IPSO v3.8 and above
Syslog or OPSEC LEA
All relevant events Check Point Firewall-1 Yes
inum Vantio v5.3 Syslog All relevant events Nominum Vantio Yes
l Contivity Syslog All relevant events Nortel Contivity V2 VPN Switch
Yes
l Application Switch
v3.2 and above
Syslog All relevant status and network condition events
Nortel Application Switch No
l ARN v15.5 Syslog All relevant events Nortel Multiprotocol Router
Yes
l Ethernet Routing Switch 2500
v4.1 Syslog All relevant events Nortel Ethernet Routing Switch 2500/4500/5500
No
l Ethernet Routing Switch 4500
v5.1 Syslog All relevant events Nortel Ethernet Routing Switch 2500/4500/5500
No
66-1 Supported DSMs (continued)
facturer DSM VersionEvents Accepted
STRM Recorded Events Option in STRM
AutoDiscovered
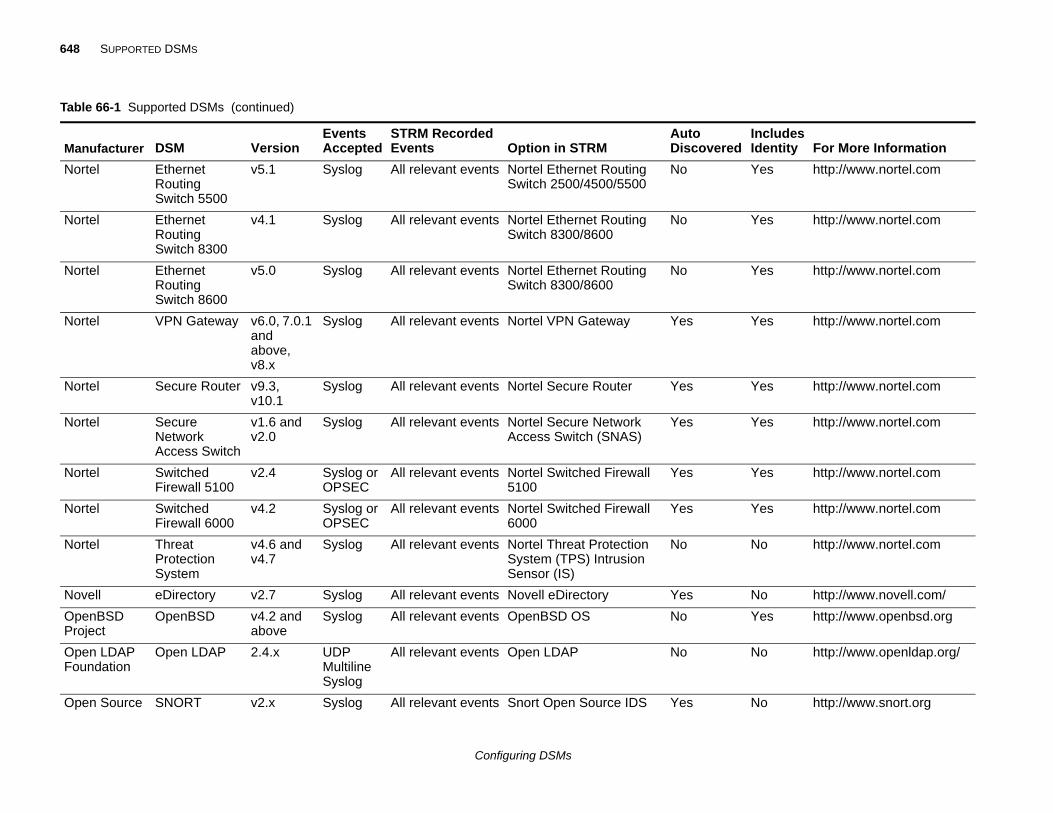
648 SUPPORTED DSMS
Norte Yes http://www.nortel.com
Norte Yes http://www.nortel.com
Norte Yes http://www.nortel.com
Norte Yes http://www.nortel.com
Norte Yes http://www.nortel.com
Norte Yes http://www.nortel.com
Norte Yes http://www.nortel.com
Norte Yes http://www.nortel.com
Norte No http://www.nortel.com
Nove No http://www.novell.com/
OpenProje
Yes http://www.openbsd.org
OpenFoun
No http://www.openldap.org/
Open No http://www.snort.org
Table
ManuIncludes Identity For More Information
Configuring DSMs
l Ethernet Routing Switch 5500
v5.1 Syslog All relevant events Nortel Ethernet Routing Switch 2500/4500/5500
No
l Ethernet Routing Switch 8300
v4.1 Syslog All relevant events Nortel Ethernet Routing Switch 8300/8600
No
l Ethernet Routing Switch 8600
v5.0 Syslog All relevant events Nortel Ethernet Routing Switch 8300/8600
No
l VPN Gateway v6.0, 7.0.1 and above, v8.x
Syslog All relevant events Nortel VPN Gateway Yes
l Secure Router v9.3, v10.1
Syslog All relevant events Nortel Secure Router Yes
l Secure Network Access Switch
v1.6 and v2.0
Syslog All relevant events Nortel Secure Network Access Switch (SNAS)
Yes
l Switched Firewall 5100
v2.4 Syslog or OPSEC
All relevant events Nortel Switched Firewall 5100
Yes
l Switched Firewall 6000
v4.2 Syslog or OPSEC
All relevant events Nortel Switched Firewall 6000
Yes
l Threat Protection System
v4.6 and v4.7
Syslog All relevant events Nortel Threat Protection System (TPS) Intrusion Sensor (IS)
No
ll eDirectory v2.7 Syslog All relevant events Novell eDirectory Yes
BSD ct
OpenBSD v4.2 and above
Syslog All relevant events OpenBSD OS No
LDAP dation
Open LDAP 2.4.x UDP Multiline Syslog
All relevant events Open LDAP No
Source SNORT v2.x Syslog All relevant events Snort Open Source IDS Yes
66-1 Supported DSMs (continued)
facturer DSM VersionEvents Accepted
STRM Recorded Events Option in STRM
AutoDiscovered
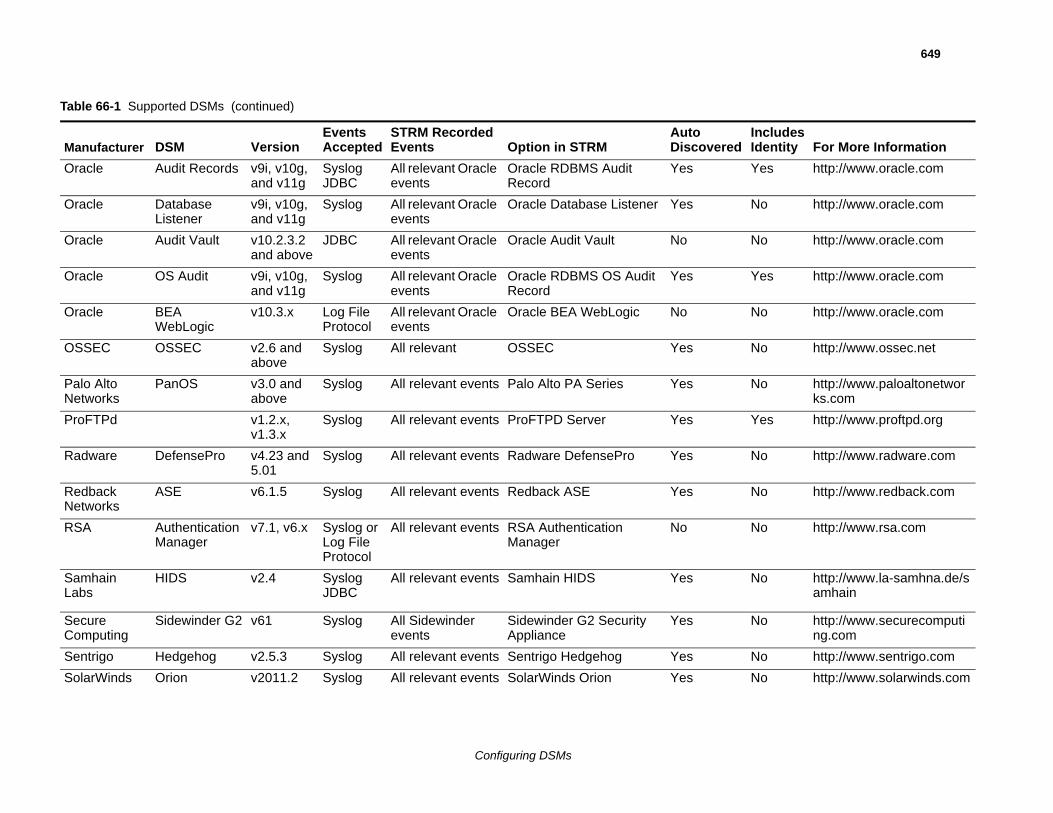
649
Orac Yes http://www.oracle.com
Orac No http://www.oracle.com
Orac No http://www.oracle.com
Orac Yes http://www.oracle.com
Orac No http://www.oracle.com
OSS No http://www.ossec.net
PaloNetw
No http://www.paloaltonetworks.com
ProF Yes http://www.proftpd.org
Radw No http://www.radware.com
RedbNetw
No http://www.redback.com
RSA No http://www.rsa.com
SamLabs
No http://www.la-samhna.de/samhain
SecuCom
No http://www.securecomputing.com
Sent No http://www.sentrigo.com
Sola No http://www.solarwinds.com
Table
ManuIncludes Identity For More Information
Configuring DSMs
le Audit Records v9i, v10g, and v11g
Syslog JDBC
All relevant Oracle events
Oracle RDBMS Audit Record
Yes
le Database Listener
v9i, v10g, and v11g
Syslog All relevant Oracle events
Oracle Database Listener Yes
le Audit Vault v10.2.3.2 and above
JDBC All relevant Oracle events
Oracle Audit Vault No
le OS Audit v9i, v10g, and v11g
Syslog All relevant Oracle events
Oracle RDBMS OS Audit Record
Yes
le BEA WebLogic
v10.3.x Log File Protocol
All relevant Oracle events
Oracle BEA WebLogic No
EC OSSEC v2.6 and above
Syslog All relevant OSSEC Yes
Alto orks
PanOS v3.0 and above
Syslog All relevant events Palo Alto PA Series Yes
TPd v1.2.x, v1.3.x
Syslog All relevant events ProFTPD Server Yes
are DefensePro v4.23 and 5.01
Syslog All relevant events Radware DefensePro Yes
ack orks
ASE v6.1.5 Syslog All relevant events Redback ASE Yes
Authentication Manager
v7.1, v6.x Syslog or Log File Protocol
All relevant events RSA Authentication Manager
No
hain HIDS v2.4 SyslogJDBC
All relevant events Samhain HIDS Yes
re puting
Sidewinder G2 v61 Syslog All Sidewinder events
Sidewinder G2 Security Appliance
Yes
rigo Hedgehog v2.5.3 Syslog All relevant events Sentrigo Hedgehog Yes
rWinds Orion v2011.2 Syslog All relevant events SolarWinds Orion Yes
66-1 Supported DSMs (continued)
facturer DSM VersionEvents Accepted
STRM Recorded Events Option in STRM
AutoDiscovered
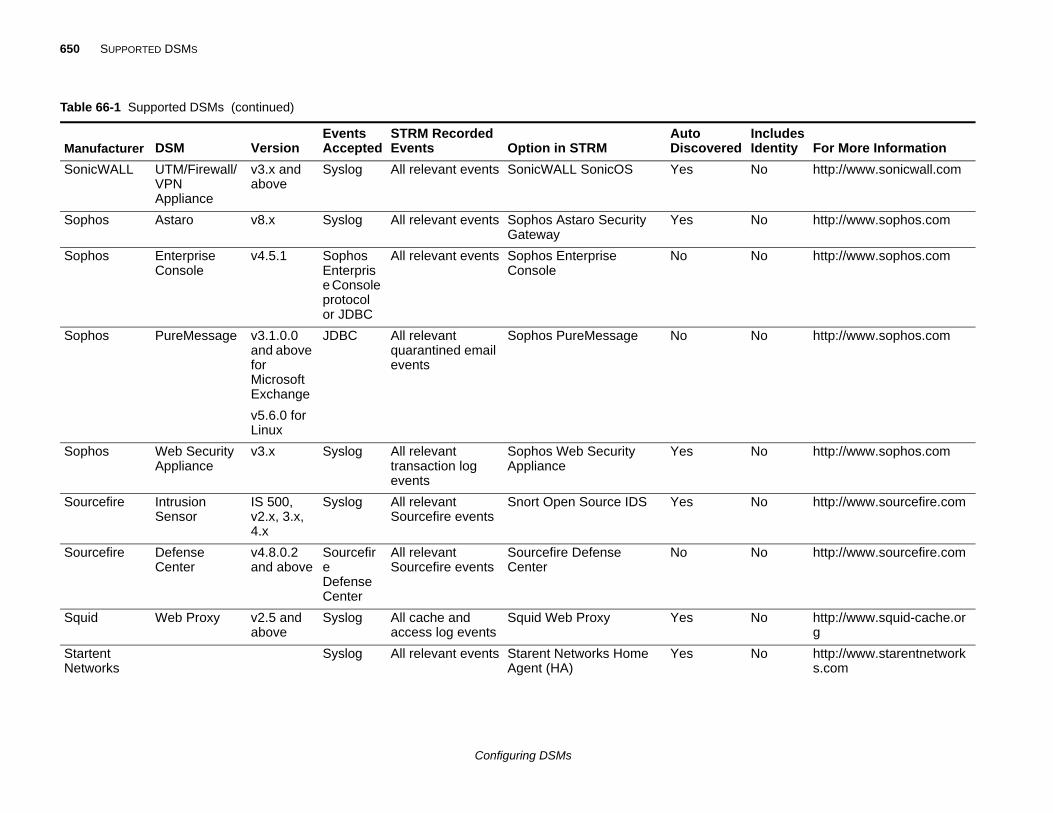
650 SUPPORTED DSMS
Soni No http://www.sonicwall.com
Soph No http://www.sophos.com
Soph No http://www.sophos.com
Soph No http://www.sophos.com
Soph No http://www.sophos.com
Sour No http://www.sourcefire.com
Sour No http://www.sourcefire.com
Squi No http://www.squid-cache.org
StartNetw
No http://www.starentnetworks.com
Table
ManuIncludes Identity For More Information
Configuring DSMs
cWALL UTM/Firewall/VPN Appliance
v3.x and above
Syslog All relevant events SonicWALL SonicOS Yes
os Astaro v8.x Syslog All relevant events Sophos Astaro Security Gateway
Yes
os Enterprise Console
v4.5.1 Sophos Enterprise Console protocol or JDBC
All relevant events Sophos Enterprise Console
No
os PureMessage v3.1.0.0 and above for Microsoft Exchange
v5.6.0 for Linux
JDBC All relevant quarantined email events
Sophos PureMessage No
os Web Security Appliance
v3.x Syslog All relevant transaction log events
Sophos Web Security Appliance
Yes
cefire Intrusion Sensor
IS 500, v2.x, 3.x, 4.x
Syslog All relevant Sourcefire events
Snort Open Source IDS Yes
cefire Defense Center
v4.8.0.2 and above
Sourcefire Defense Center
All relevant Sourcefire events
Sourcefire Defense Center
No
d Web Proxy v2.5 and above
Syslog All cache and access log events
Squid Web Proxy Yes
ent orks
Syslog All relevant events Starent Networks Home Agent (HA)
Yes
66-1 Supported DSMs (continued)
facturer DSM VersionEvents Accepted
STRM Recorded Events Option in STRM
AutoDiscovered
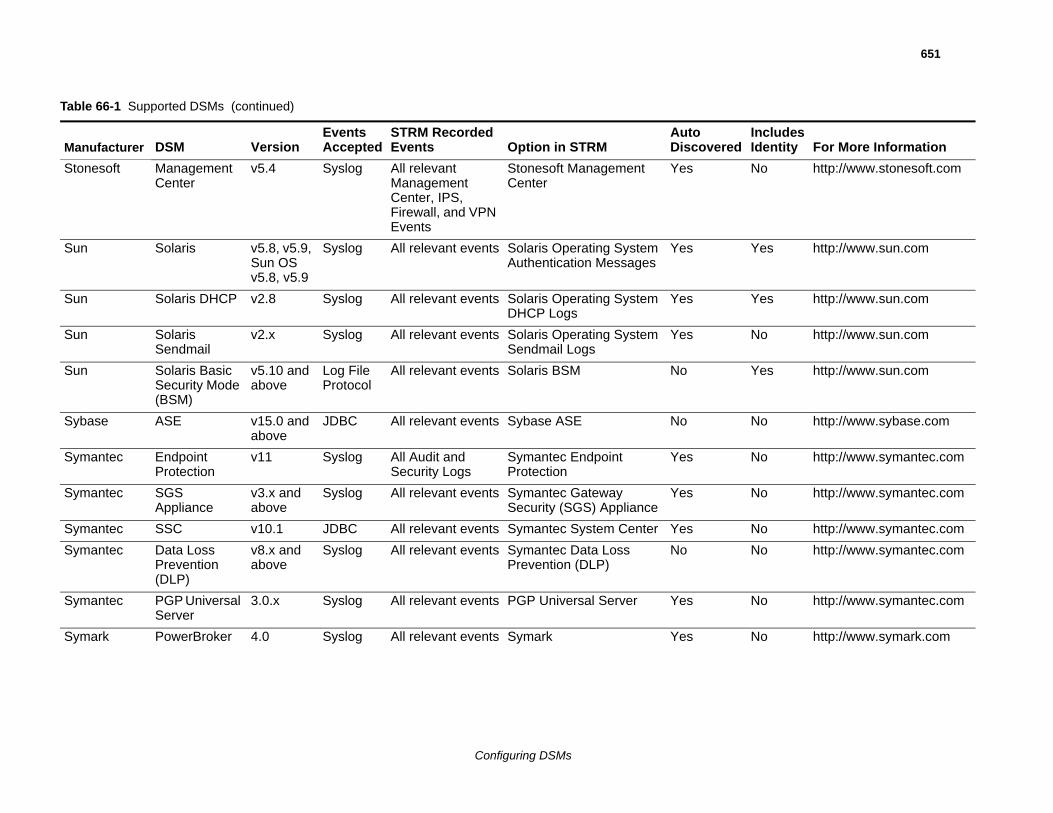
651
Ston No http://www.stonesoft.com
Sun Yes http://www.sun.com
Sun Yes http://www.sun.com
Sun No http://www.sun.com
Sun Yes http://www.sun.com
Syba No http://www.sybase.com
Sym No http://www.symantec.com
Sym No http://www.symantec.com
Sym No http://www.symantec.com
Sym No http://www.symantec.com
Sym No http://www.symantec.com
Sym No http://www.symark.com
Table
ManuIncludes Identity For More Information
Configuring DSMs
esoft Management Center
v5.4 Syslog All relevant Management Center, IPS, Firewall, and VPN Events
Stonesoft Management Center
Yes
Solaris v5.8, v5.9, Sun OS v5.8, v5.9
Syslog All relevant events Solaris Operating System Authentication Messages
Yes
Solaris DHCP v2.8 Syslog All relevant events Solaris Operating System DHCP Logs
Yes
Solaris Sendmail
v2.x Syslog All relevant events Solaris Operating System Sendmail Logs
Yes
Solaris Basic Security Mode (BSM)
v5.10 and above
Log File Protocol
All relevant events Solaris BSM No
se ASE v15.0 and above
JDBC All relevant events Sybase ASE No
antec Endpoint Protection
v11 Syslog All Audit and Security Logs
Symantec Endpoint Protection
Yes
antec SGS Appliance
v3.x and above
Syslog All relevant events Symantec Gateway Security (SGS) Appliance
Yes
antec SSC v10.1 JDBC All relevant events Symantec System Center Yes
antec Data Loss Prevention (DLP)
v8.x and above
Syslog All relevant events Symantec Data Loss Prevention (DLP)
No
antec PGP Universal Server
3.0.x Syslog All relevant events PGP Universal Server Yes
ark PowerBroker 4.0 Syslog All relevant events Symark Yes
66-1 Supported DSMs (continued)
facturer DSM VersionEvents Accepted
STRM Recorded Events Option in STRM
AutoDiscovered
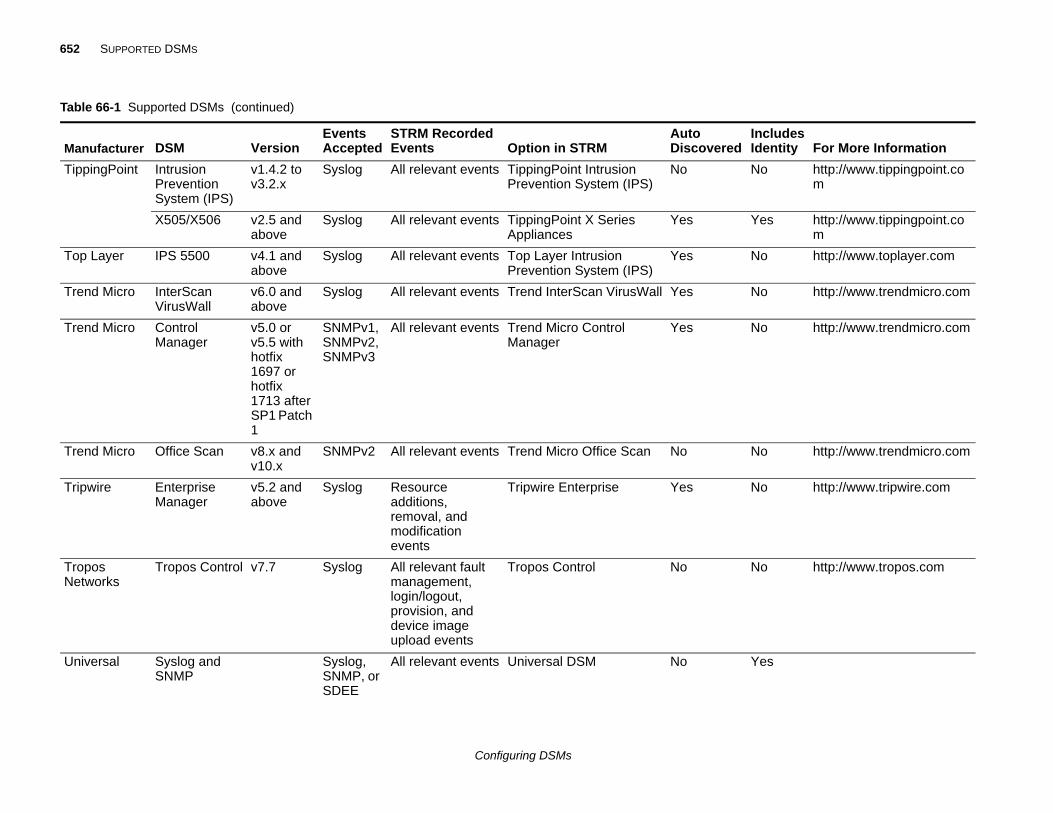
652 SUPPORTED DSMS
Tippi No http://www.tippingpoint.com
Yes http://www.tippingpoint.com
Top No http://www.toplayer.com
Tren No http://www.trendmicro.com
Tren No http://www.trendmicro.com
Tren No http://www.trendmicro.com
Tripw No http://www.tripwire.com
TropNetw
No http://www.tropos.com
Univ Yes
Table
ManuIncludes Identity For More Information
Configuring DSMs
ngPoint Intrusion Prevention System (IPS)
v1.4.2 to v3.2.x
Syslog All relevant events TippingPoint Intrusion Prevention System (IPS)
No
X505/X506 v2.5 and above
Syslog All relevant events TippingPoint X Series Appliances
Yes
Layer IPS 5500 v4.1 and above
Syslog All relevant events Top Layer Intrusion Prevention System (IPS)
Yes
d Micro InterScan VirusWall
v6.0 and above
Syslog All relevant events Trend InterScan VirusWall Yes
d Micro Control Manager
v5.0 or v5.5 with hotfix 1697 or hotfix 1713 after SP1 Patch 1
SNMPv1, SNMPv2, SNMPv3
All relevant events Trend Micro Control Manager
Yes
d Micro Office Scan v8.x and v10.x
SNMPv2 All relevant events Trend Micro Office Scan No
ire Enterprise Manager
v5.2 and above
Syslog Resource additions, removal, and modification events
Tripwire Enterprise Yes
os orks
Tropos Control v7.7 Syslog All relevant fault management, login/logout, provision, and device image upload events
Tropos Control No
ersal Syslog and SNMP
Syslog, SNMP, or SDEE
All relevant events Universal DSM No
66-1 Supported DSMs (continued)
facturer DSM VersionEvents Accepted
STRM Recorded Events Option in STRM
AutoDiscovered
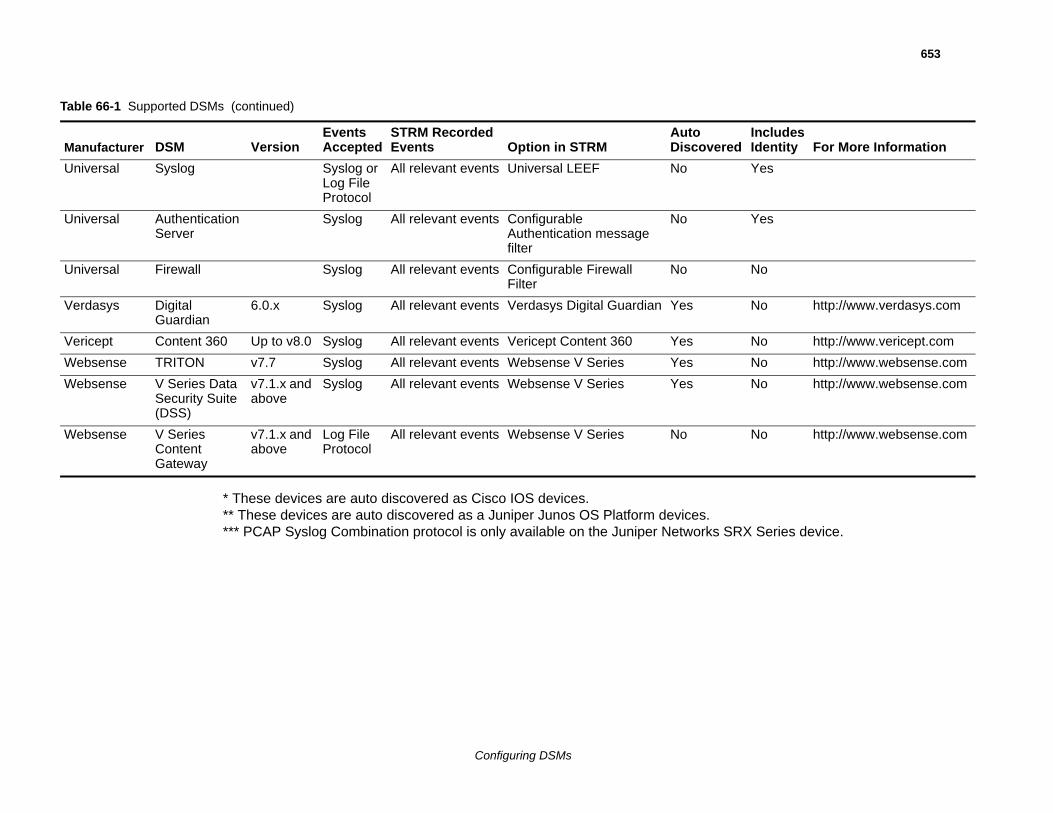
653
X Series device.
Univ Yes
Univ Yes
Univ No
Verd No http://www.verdasys.com
Veric No http://www.vericept.com
Web No http://www.websense.com
Web No http://www.websense.com
Web No http://www.websense.com
Table
ManuIncludes Identity For More Information
Configuring DSMs
* These devices are auto discovered as Cisco IOS devices. ** These devices are auto discovered as a Juniper Junos OS Platform devices. *** PCAP Syslog Combination protocol is only available on the Juniper Networks SR
ersal Syslog Syslog or Log File Protocol
All relevant events Universal LEEF No
ersal Authentication Server
Syslog All relevant events Configurable Authentication message filter
No
ersal Firewall Syslog All relevant events Configurable Firewall Filter
No
asys Digital Guardian
6.0.x Syslog All relevant events Verdasys Digital Guardian Yes
ept Content 360 Up to v8.0 Syslog All relevant events Vericept Content 360 Yes
sense TRITON v7.7 Syslog All relevant events Websense V Series Yes
sense V Series Data Security Suite (DSS)
v7.1.x and above
Syslog All relevant events Websense V Series Yes
sense V Series Content Gateway
v7.1.x and above
Log File Protocol
All relevant events Websense V Series No
66-1 Supported DSMs (continued)
facturer DSM VersionEvents Accepted
STRM Recorded Events Option in STRM
AutoDiscovered

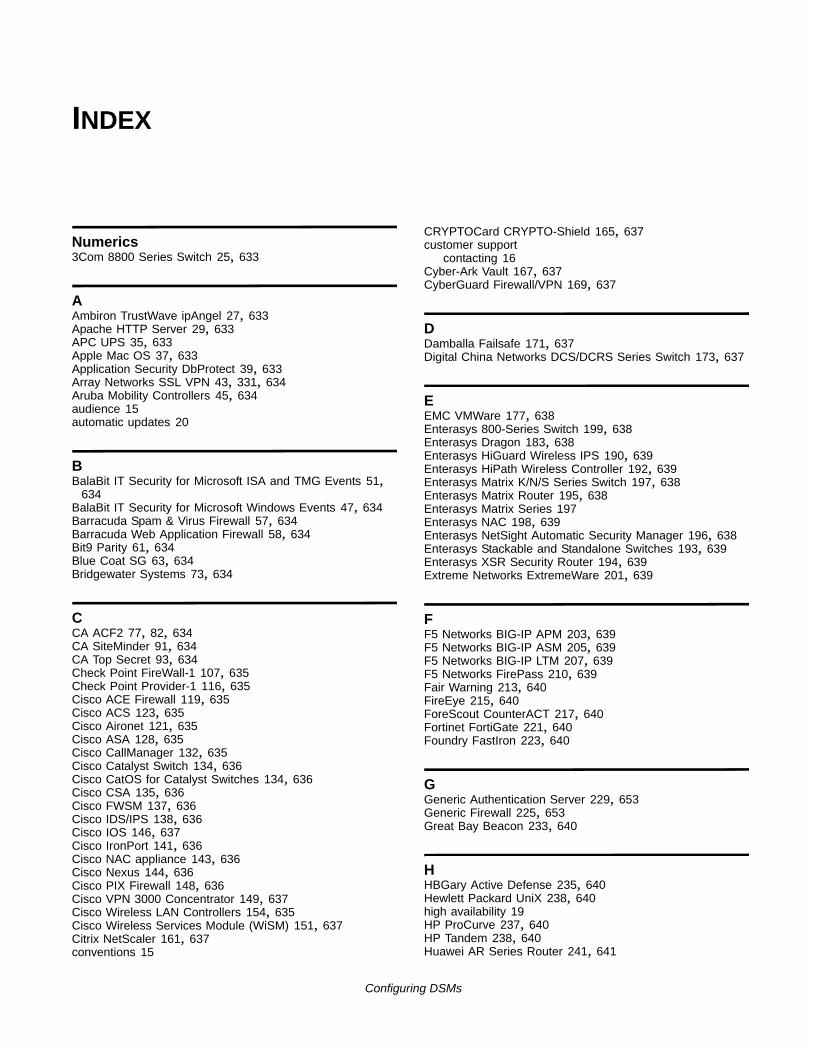
INDEX
Numerics3Com 8800 Series Switch 25, 633
AAmbiron TrustWave ipAngel 27, 633Apache HTTP Server 29, 633APC UPS 35, 633Apple Mac OS 37, 633Application Security DbProtect 39, 633Array Networks SSL VPN 43, 331, 634Aruba Mobility Controllers 45, 634audience 15automatic updates 20
BBalaBit IT Security for Microsoft ISA and TMG Events 51,
634BalaBit IT Security for Microsoft Windows Events 47, 634Barracuda Spam & Virus Firewall 57, 634Barracuda Web Application Firewall 58, 634Bit9 Parity 61, 634Blue Coat SG 63, 634Bridgewater Systems 73, 634
CCA ACF2 77, 82, 634CA SiteMinder 91, 634CA Top Secret 93, 634Check Point FireWall-1 107, 635Check Point Provider-1 116, 635Cisco ACE Firewall 119, 635Cisco ACS 123, 635Cisco Aironet 121, 635Cisco ASA 128, 635Cisco CallManager 132, 635Cisco Catalyst Switch 134, 636Cisco CatOS for Catalyst Switches 134, 636Cisco CSA 135, 636Cisco FWSM 137, 636Cisco IDS/IPS 138, 636Cisco IOS 146, 637Cisco IronPort 141, 636Cisco NAC appliance 143, 636Cisco Nexus 144, 636Cisco PIX Firewall 148, 636Cisco VPN 3000 Concentrator 149, 637Cisco Wireless LAN Controllers 154, 635Cisco Wireless Services Module (WiSM) 151, 637Citrix NetScaler 161, 637conventions 15
Configuri
CRYPTOCard CRYPTO-Shield 165, 637customer support
contacting 16Cyber-Ark Vault 167, 637CyberGuard Firewall/VPN 169, 637
DDamballa Failsafe 171, 637Digital China Networks DCS/DCRS Series Switch 173, 637
EEMC VMWare 177, 638Enterasys 800-Series Switch 199, 638Enterasys Dragon 183, 638Enterasys HiGuard Wireless IPS 190, 639Enterasys HiPath Wireless Controller 192, 639Enterasys Matrix K/N/S Series Switch 197, 638Enterasys Matrix Router 195, 638Enterasys Matrix Series 197Enterasys NAC 198, 639Enterasys NetSight Automatic Security Manager 196, 638Enterasys Stackable and Standalone Switches 193, 639Enterasys XSR Security Router 194, 639Extreme Networks ExtremeWare 201, 639
FF5 Networks BIG-IP APM 203, 639F5 Networks BIG-IP ASM 205, 639F5 Networks BIG-IP LTM 207, 639F5 Networks FirePass 210, 639Fair Warning 213, 640FireEye 215, 640ForeScout CounterACT 217, 640Fortinet FortiGate 221, 640Foundry FastIron 223, 640
GGeneric Authentication Server 229, 653Generic Firewall 225, 653Great Bay Beacon 233, 640
HHBGary Active Defense 235, 640Hewlett Packard UniX 238, 640high availability 19HP ProCurve 237, 640HP Tandem 238, 640Huawei AR Series Router 241, 641
ng DSMs
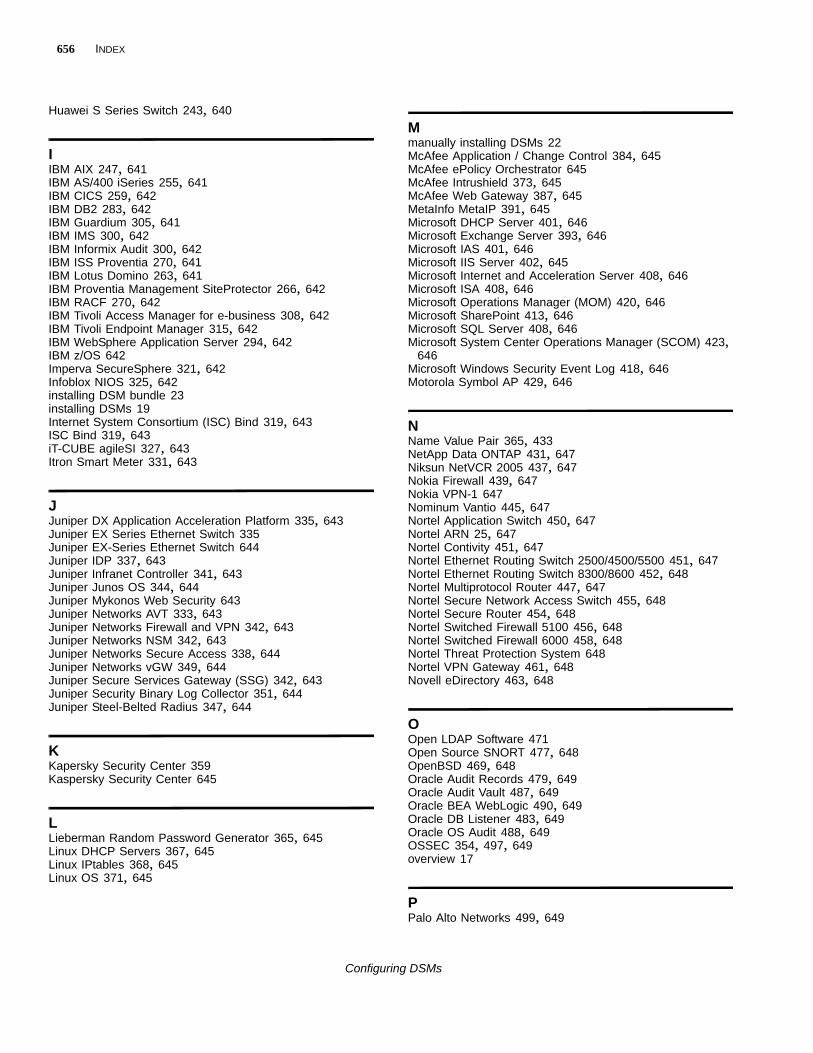
656 INDEX
Huawei S Series Switch 243, 640
IIBM AIX 247, 641IBM AS/400 iSeries 255, 641IBM CICS 259, 642IBM DB2 283, 642IBM Guardium 305, 641IBM IMS 300, 642IBM Informix Audit 300, 642IBM ISS Proventia 270, 641IBM Lotus Domino 263, 641IBM Proventia Management SiteProtector 266, 642IBM RACF 270, 642IBM Tivoli Access Manager for e-business 308, 642IBM Tivoli Endpoint Manager 315, 642IBM WebSphere Application Server 294, 642IBM z/OS 642Imperva SecureSphere 321, 642Infoblox NIOS 325, 642installing DSM bundle 23installing DSMs 19Internet System Consortium (ISC) Bind 319, 643ISC Bind 319, 643iT-CUBE agileSI 327, 643Itron Smart Meter 331, 643
JJuniper DX Application Acceleration Platform 335, 643Juniper EX Series Ethernet Switch 335Juniper EX-Series Ethernet Switch 644Juniper IDP 337, 643Juniper Infranet Controller 341, 643Juniper Junos OS 344, 644Juniper Mykonos Web Security 643Juniper Networks AVT 333, 643Juniper Networks Firewall and VPN 342, 643Juniper Networks NSM 342, 643Juniper Networks Secure Access 338, 644Juniper Networks vGW 349, 644Juniper Secure Services Gateway (SSG) 342, 643Juniper Security Binary Log Collector 351, 644Juniper Steel-Belted Radius 347, 644
KKapersky Security Center 359Kaspersky Security Center 645
LLieberman Random Password Generator 365, 645Linux DHCP Servers 367, 645Linux IPtables 368, 645Linux OS 371, 645
Configurin
Mmanually installing DSMs 22McAfee Application / Change Control 384, 645McAfee ePolicy Orchestrator 645McAfee Intrushield 373, 645McAfee Web Gateway 387, 645MetaInfo MetaIP 391, 645Microsoft DHCP Server 401, 646Microsoft Exchange Server 393, 646Microsoft IAS 401, 646Microsoft IIS Server 402, 645Microsoft Internet and Acceleration Server 408, 646Microsoft ISA 408, 646Microsoft Operations Manager (MOM) 420, 646Microsoft SharePoint 413, 646Microsoft SQL Server 408, 646Microsoft System Center Operations Manager (SCOM) 423,
646Microsoft Windows Security Event Log 418, 646Motorola Symbol AP 429, 646
NName Value Pair 365, 433NetApp Data ONTAP 431, 647Niksun NetVCR 2005 437, 647Nokia Firewall 439, 647Nokia VPN-1 647Nominum Vantio 445, 647Nortel Application Switch 450, 647Nortel ARN 25, 647Nortel Contivity 451, 647Nortel Ethernet Routing Switch 2500/4500/5500 451, 647Nortel Ethernet Routing Switch 8300/8600 452, 648Nortel Multiprotocol Router 447, 647Nortel Secure Network Access Switch 455, 648Nortel Secure Router 454, 648Nortel Switched Firewall 5100 456, 648Nortel Switched Firewall 6000 458, 648Nortel Threat Protection System 648Nortel VPN Gateway 461, 648Novell eDirectory 463, 648
OOpen LDAP Software 471Open Source SNORT 477, 648OpenBSD 469, 648Oracle Audit Records 479, 649Oracle Audit Vault 487, 649Oracle BEA WebLogic 490, 649Oracle DB Listener 483, 649Oracle OS Audit 488, 649OSSEC 354, 497, 649overview 17
PPalo Alto Networks 499, 649
g DSMs
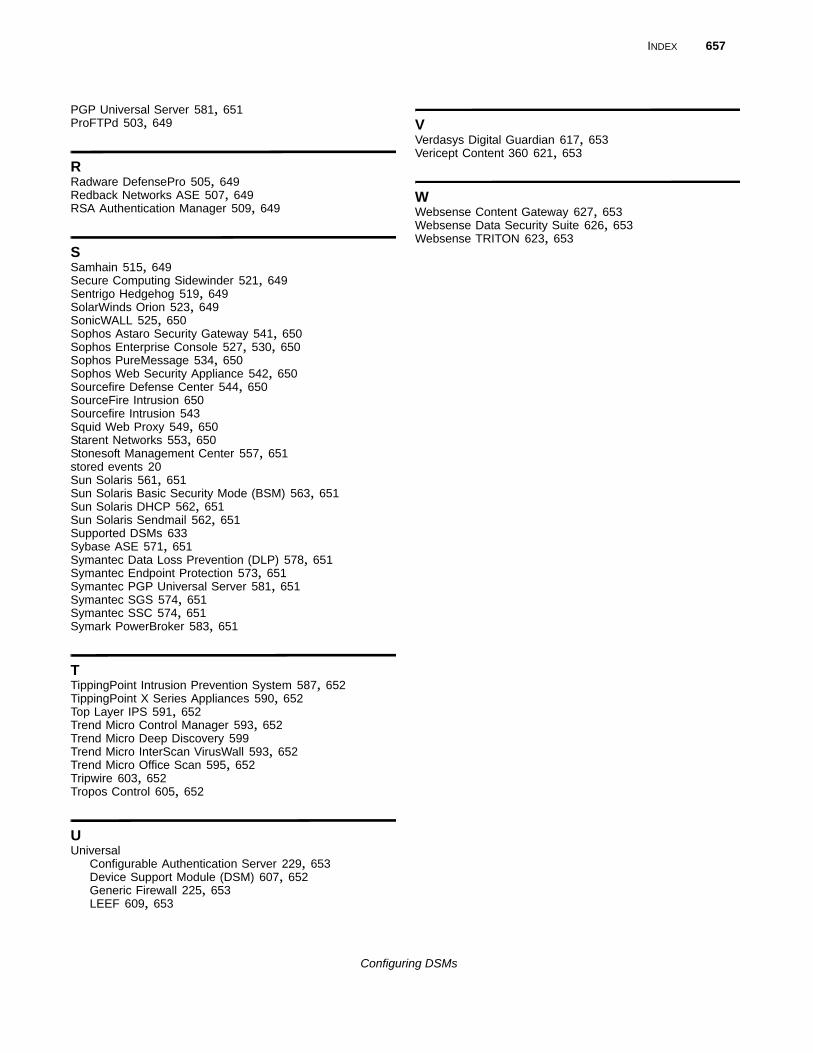
INDEX 657
PGP Universal Server 581, 651ProFTPd 503, 649
RRadware DefensePro 505, 649Redback Networks ASE 507, 649RSA Authentication Manager 509, 649
SSamhain 515, 649Secure Computing Sidewinder 521, 649Sentrigo Hedgehog 519, 649SolarWinds Orion 523, 649SonicWALL 525, 650Sophos Astaro Security Gateway 541, 650Sophos Enterprise Console 527, 530, 650Sophos PureMessage 534, 650Sophos Web Security Appliance 542, 650Sourcefire Defense Center 544, 650SourceFire Intrusion 650Sourcefire Intrusion 543Squid Web Proxy 549, 650Starent Networks 553, 650Stonesoft Management Center 557, 651stored events 20Sun Solaris 561, 651Sun Solaris Basic Security Mode (BSM) 563, 651Sun Solaris DHCP 562, 651Sun Solaris Sendmail 562, 651Supported DSMs 633Sybase ASE 571, 651Symantec Data Loss Prevention (DLP) 578, 651Symantec Endpoint Protection 573, 651Symantec PGP Universal Server 581, 651Symantec SGS 574, 651Symantec SSC 574, 651Symark PowerBroker 583, 651
TTippingPoint Intrusion Prevention System 587, 652TippingPoint X Series Appliances 590, 652Top Layer IPS 591, 652Trend Micro Control Manager 593, 652Trend Micro Deep Discovery 599Trend Micro InterScan VirusWall 593, 652Trend Micro Office Scan 595, 652Tripwire 603, 652Tropos Control 605, 652
UUniversal
Configurable Authentication Server 229, 653Device Support Module (DSM) 607, 652Generic Firewall 225, 653LEEF 609, 653
Configur
VVerdasys Digital Guardian 617, 653Vericept Content 360 621, 653
WWebsense Content Gateway 627, 653Websense Data Security Suite 626, 653Websense TRITON 623, 653
ing DSMs
Recommended