Estuarine, Coastal and Shelf Science 73 (2007) 835e843www.elsevier.com/locate/ecss
Comparison of bryozoan assemblages from two contrastingArctic shelf regions
Piotr Kuklinski a,*, Beate Bader b
a Institute of Oceanology, Polish Academy of Sciences, ul. Powstancow Warszawy 55, Sopot 81-712, Polandb University of Kiel, Institute of Geosciences, Ludewig Meyn Str 14, D-24118 Kiel, Germany
Received 26 January 2007; accepted 29 March 2007
Available online 17 May 2007
Abstract
The structure of bryozoan assemblages from two Arctic regions (East Greenland and West Spitsbergen shelf) was compared. Both areas arelocated at the same latitude and the samples were taken from similar depths; however, the regions differed in water temperature and oceanog-raphy. East Greenland, which has lower mean annual water temperatures, was found to be one third richer in taxa (86 species) than West Spits-bergen (59 species). Diversity (ShannoneWiener index e H0) and abundance were also higher on average in East Greenland (e.g. H0 ¼ 2.49)than West Spitsbergen (e.g. H0 ¼ 2.12). However for species richness, diversity and abundance there were no significant statistical differencesbetween means (ANOVA) from the two regions. In spite of these similarities the investigated assemblages differed to a large extent in bothspecies composition and dominance structure. There were 55 species that occurred only in East Greenland and 28 species that were presentonly in West Spitsbergen. There was higher proportion of species with an Arctic distribution in East Greenland (46%) than in West Spitsbergen(24%). Observed dissimilarities were concluded to be due to different hydrological conditions between the two regions.� 2007 Elsevier Ltd. All rights reserved.
Keywords: biodiversity; water masses; Bryozoa; Arctic; East Greenland; West Spitsbergen
1. Introduction
Arctic hydrology is influenced by a complex of watermasses of different origin, thus environmental conditionsacross the Arctic marine system are not homogenous. Usuallythese water masses differ in seawater temperature, which af-fects annual longevity of ice cover, glacier retreat, freshwaterwater inflow and sedimentation into the marine ecosystem(e.g. Peterson et al., 2002). The shallow Arctic shelf is influ-enced to a large extent by the inflow of waters both fromdeeper parts of the oceans and by terrigenous waters fromthe continent. Thus these areas are controlled by ongoingchanges in both the terrestrial and marine environment.
* Corresponding author. Current address: Natural History Museum, Crom-
well Road, London SW7 5BD, UK.
E-mail addresses: [email protected] (P. Kuklinski), [email protected].
de (B. Bader).
0272-7714/$ - see front matter � 2007 Elsevier Ltd. All rights reserved.
doi:10.1016/j.ecss.2007.03.024
Differences in physical conditions among Arctic localitiesare mirrored in the community structure of benthic faunal as-semblages. For instance, it was found that fish stocks of theBarents Sea follow fluctuations in seawater temperatures,with higher seawater temperatures favouring survival of thecritical early life stages of the fish (Ottersen et al., 2006).Analysis of annual photographs at a permanent rocky bottomstation on West Spitsbergen over a period of more than20 years revealed that diversity of the benthic biota is stronglylinked to sea water temperature e the higher the sea watertemperature the higher the biodiversity (Beuchel et al.,2006). On the other hand, there are examples where the pres-ence of warm water masses have an opposite effect on param-eters like richness or biodiversity of Arctic biota. Aninvestigation of soft-bottom benthos at two Arctic locationsdiffering in seawater temperature has shown that the ‘‘warmersite’’ had lower species richness and biodiversity thana ‘‘cooler’’ site (Wlodarska-Kowalczuk and Weslawski, 2001).
836 P. Kuklinski, B. Bader / Estuarine, Coastal and Shelf Science 73 (2007) 835e843
Several studies indicate that aquatic sessile organisms, bothindividually and collectively as assemblages, are good indica-tors of environmental conditions or long-term ecosystemchanges (Kroncke, 1995; Wlodarska-Kowalczuk and Weslaw-ski, 2001; Beuchel et al., 2006). In the Arctic, aquatic sessilecolonial invertebrates are one of the most diverse and abundantgroups among rocky bottom organisms (Gulliksen et al., 1999;Kuklinski and Bader, 2007). Their potential sensitivity tophysical parameters as well as high abundance make themgood candidates for comparative studies of locations differingin environmental conditions. This study focuses on bryozoanfaunal composition and assemblage structure on rocky sub-strates from two contrasting Arctic regions that differ in hy-drological conditions.
We conducted our investigation in two regions: East Green-land and West Spitsbergen shelf. Both have conspicuousoceanographic features. The East Greenland location is thelargest and most northernly Arctic Polynya (usually an open-water region within an otherwise ice-covered sea) influencedby the cold East Greenland Current. Thus this region can beconsidered as ‘‘cold Arctic’’, whereas West Spitsbergen isinfluenced by the Gulf Stream and has a milder climate com-pared to other areas of similar latitude, and may be consideredas ‘‘warmer Arctic’’ (Gammelsrod and Rudels, 1983; Loeng,1991; Bignami and Hopkins, 1997; Ritzrau, 1997). These re-gions provide a good model systems for testing hypothesesconcerning the influence of different water mass propertieson the Arctic biota.
The aim of the study was to investigate faunal structure anddifferences between assemblages of bryozoans from two sitesat similar latitude but differing in seawater temperature. Wepredict that these assemblages will differ in species composi-tion, richness, diversity and abundance. We also predict thatthe proportion of species of temperate origin or Arctic speciesthat range into warmer seas will be higher in ‘‘warm Arctic’’site. Our hypotheses are based on the assumption that differ-ences in seawater temperature or sea ice cover longevitybetween the sites should be mirrored in dissimilarities amongassemblage structure.
2. Materials and methods
2.1. Study area
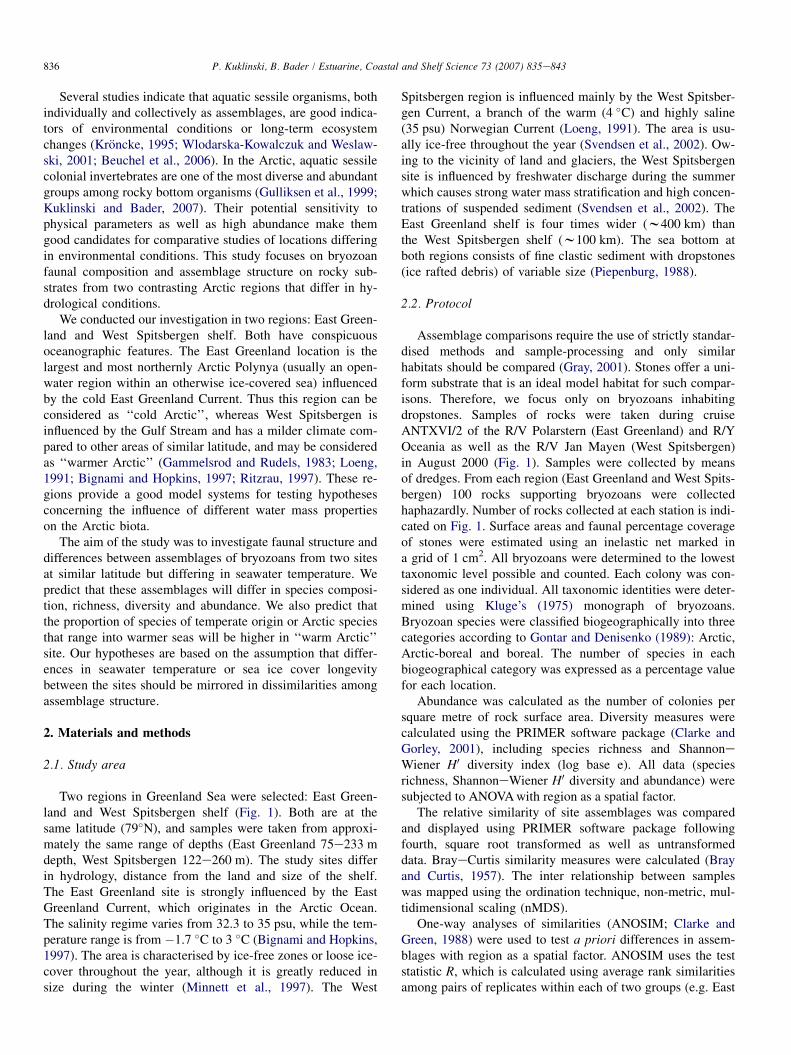
Two regions in Greenland Sea were selected: East Green-land and West Spitsbergen shelf (Fig. 1). Both are at thesame latitude (79�N), and samples were taken from approxi-mately the same range of depths (East Greenland 75e233 mdepth, West Spitsbergen 122e260 m). The study sites differin hydrology, distance from the land and size of the shelf.The East Greenland site is strongly influenced by the EastGreenland Current, which originates in the Arctic Ocean.The salinity regime varies from 32.3 to 35 psu, while the tem-perature range is from �1.7 �C to 3 �C (Bignami and Hopkins,1997). The area is characterised by ice-free zones or loose ice-cover throughout the year, although it is greatly reduced insize during the winter (Minnett et al., 1997). The West
Spitsbergen region is influenced mainly by the West Spitsber-gen Current, a branch of the warm (4 �C) and highly saline(35 psu) Norwegian Current (Loeng, 1991). The area is usu-ally ice-free throughout the year (Svendsen et al., 2002). Ow-ing to the vicinity of land and glaciers, the West Spitsbergensite is influenced by freshwater discharge during the summerwhich causes strong water mass stratification and high concen-trations of suspended sediment (Svendsen et al., 2002). TheEast Greenland shelf is four times wider (w400 km) thanthe West Spitsbergen shelf (w100 km). The sea bottom atboth regions consists of fine clastic sediment with dropstones(ice rafted debris) of variable size (Piepenburg, 1988).
2.2. Protocol
Assemblage comparisons require the use of strictly standar-dised methods and sample-processing and only similarhabitats should be compared (Gray, 2001). Stones offer a uni-form substrate that is an ideal model habitat for such compar-isons. Therefore, we focus only on bryozoans inhabitingdropstones. Samples of rocks were taken during cruiseANTXVI/2 of the R/V Polarstern (East Greenland) and R/YOceania as well as the R/V Jan Mayen (West Spitsbergen)in August 2000 (Fig. 1). Samples were collected by meansof dredges. From each region (East Greenland and West Spits-bergen) 100 rocks supporting bryozoans were collectedhaphazardly. Number of rocks collected at each station is indi-cated on Fig. 1. Surface areas and faunal percentage coverageof stones were estimated using an inelastic net marked ina grid of 1 cm2. All bryozoans were determined to the lowesttaxonomic level possible and counted. Each colony was con-sidered as one individual. All taxonomic identities were deter-mined using Kluge’s (1975) monograph of bryozoans.Bryozoan species were classified biogeographically into threecategories according to Gontar and Denisenko (1989): Arctic,Arctic-boreal and boreal. The number of species in eachbiogeographical category was expressed as a percentage valuefor each location.
Abundance was calculated as the number of colonies persquare metre of rock surface area. Diversity measures werecalculated using the PRIMER software package (Clarke andGorley, 2001), including species richness and ShannoneWiener H0 diversity index (log base e). All data (speciesrichness, ShannoneWiener H0 diversity and abundance) weresubjected to ANOVA with region as a spatial factor.
The relative similarity of site assemblages was comparedand displayed using PRIMER software package followingfourth, square root transformed as well as untransformeddata. BrayeCurtis similarity measures were calculated (Brayand Curtis, 1957). The inter relationship between sampleswas mapped using the ordination technique, non-metric, mul-tidimensional scaling (nMDS).
One-way analyses of similarities (ANOSIM; Clarke andGreen, 1988) were used to test a priori differences in assem-blages with region as a spatial factor. ANOSIM uses the teststatistic R, which is calculated using average rank similaritiesamong pairs of replicates within each of two groups (e.g. East
837P. Kuklinski, B. Bader / Estuarine, Coastal and Shelf Science 73 (2007) 835e843
Fig. 1. The study area with marked sampling sites and indication of currents directions (gray arrows e cold East Greenland Current, black arrows e warm Nor-
wegian Current, in brackets number of rocks collected at each of the sites).
GreenlandeWest Spitsbergen), minus the average rank simi-larity of replicates between groups, and is scaled to givea value between �1 and 1. Thus, R ¼ 1 when all similaritieswithin groups are less than any similarity between groups,R > 0.75 when the groups are well differentiated, R > 0.5when groups overlap but are clearly different, R < 0.25when groups are barely separable, and R ¼ 0 when replicateswithin and between groups are equally similar (Clarke andGorley, 2001).
3. Results
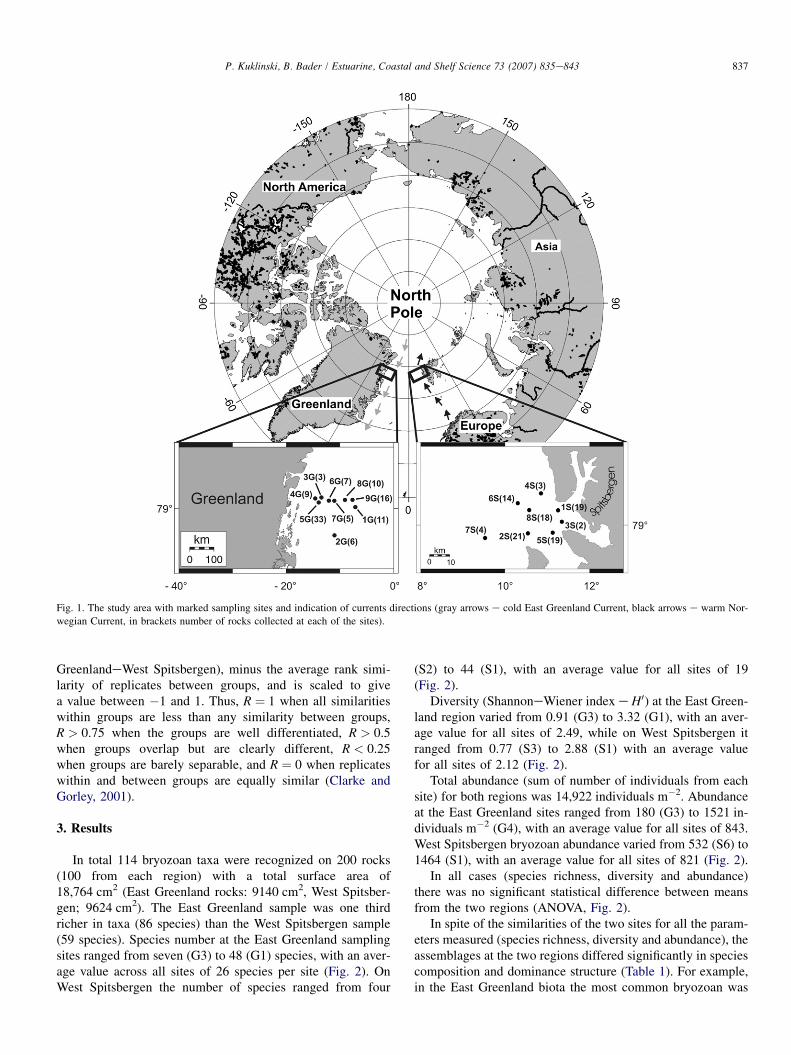
In total 114 bryozoan taxa were recognized on 200 rocks(100 from each region) with a total surface area of18,764 cm2 (East Greenland rocks: 9140 cm2, West Spitsber-gen; 9624 cm2). The East Greenland sample was one thirdricher in taxa (86 species) than the West Spitsbergen sample(59 species). Species number at the East Greenland samplingsites ranged from seven (G3) to 48 (G1) species, with an aver-age value across all sites of 26 species per site (Fig. 2). OnWest Spitsbergen the number of species ranged from four
(S2) to 44 (S1), with an average value for all sites of 19(Fig. 2).
Diversity (ShannoneWiener index e H0) at the East Green-land region varied from 0.91 (G3) to 3.32 (G1), with an aver-age value for all sites of 2.49, while on West Spitsbergen itranged from 0.77 (S3) to 2.88 (S1) with an average valuefor all sites of 2.12 (Fig. 2).
Total abundance (sum of number of individuals from eachsite) for both regions was 14,922 individuals m�2. Abundanceat the East Greenland sites ranged from 180 (G3) to 1521 in-dividuals m�2 (G4), with an average value for all sites of 843.West Spitsbergen bryozoan abundance varied from 532 (S6) to1464 (S1), with an average value for all sites of 821 (Fig. 2).
In all cases (species richness, diversity and abundance)there was no significant statistical difference between meansfrom the two regions (ANOVA, Fig. 2).
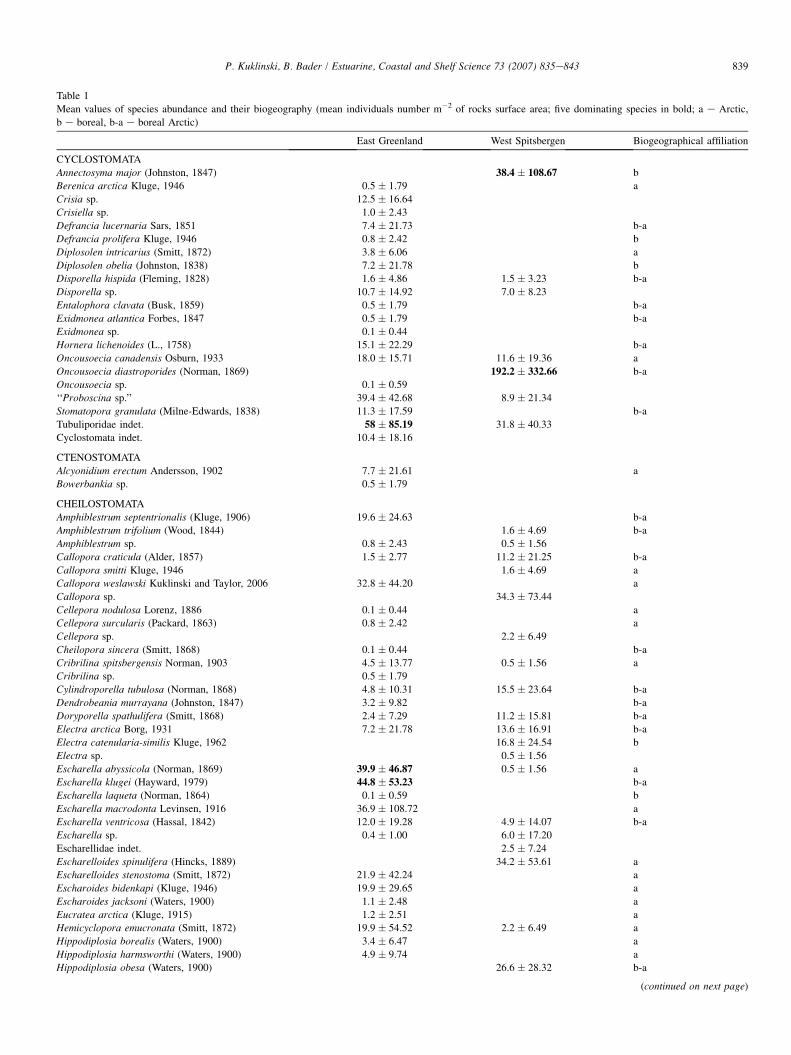
In spite of the similarities of the two sites for all the param-eters measured (species richness, diversity and abundance), theassemblages at the two regions differed significantly in speciescomposition and dominance structure (Table 1). For example,in the East Greenland biota the most common bryozoan was
838 P. Kuklinski, B. Bader / Estuarine, Coastal and Shelf Science 73 (2007) 835e843
the cheilostome bryozoan Smittina belli (Dawson) [8% of totalabundance], while the West Spitsbergen assemblage was dom-inated by the cyclostome bryozoan Oncousoecia diastoporides(Norman) [23% of total abundance] (Table 1). Fifty five spe-cies occurred only in East Greenland, and 28 species only inWest Spitsbergen site. Thirty one species occurred at both re-gions. A higher proportion of species with entirely Arctic
Fig. 2. Mean values � SE of species richness (A); diversity (B); and abun-
dance (C) for East Greenland (EG) and West Spitsbergen (WS) assemblages.
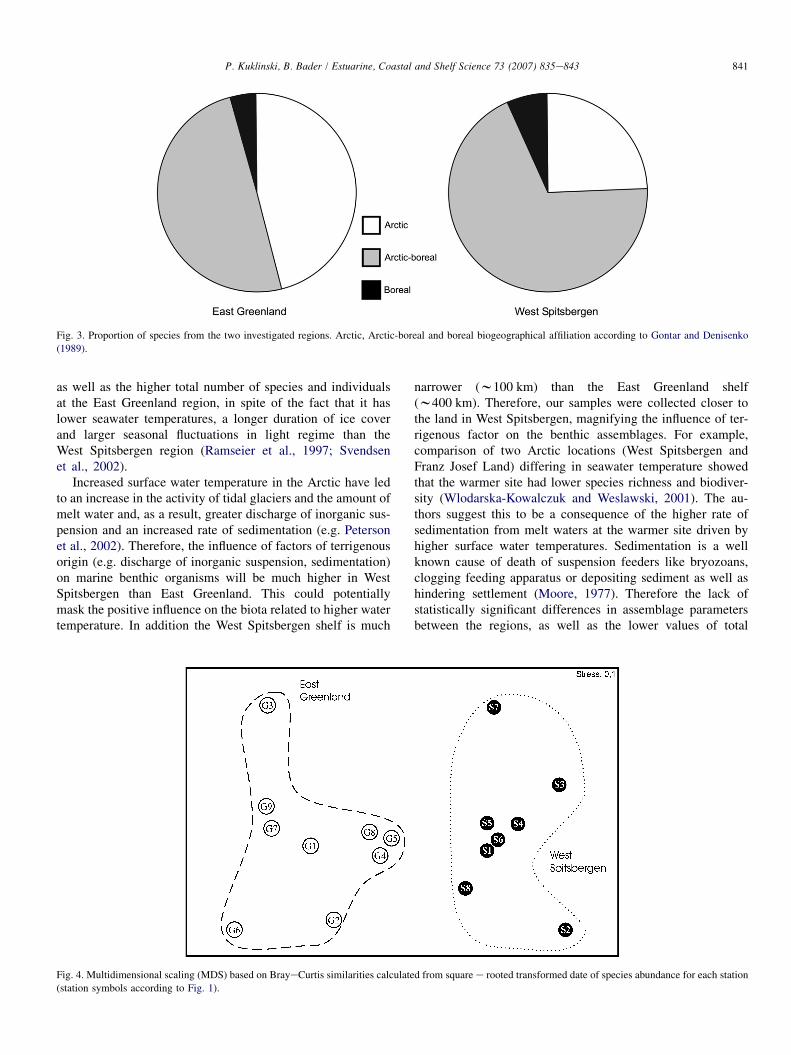
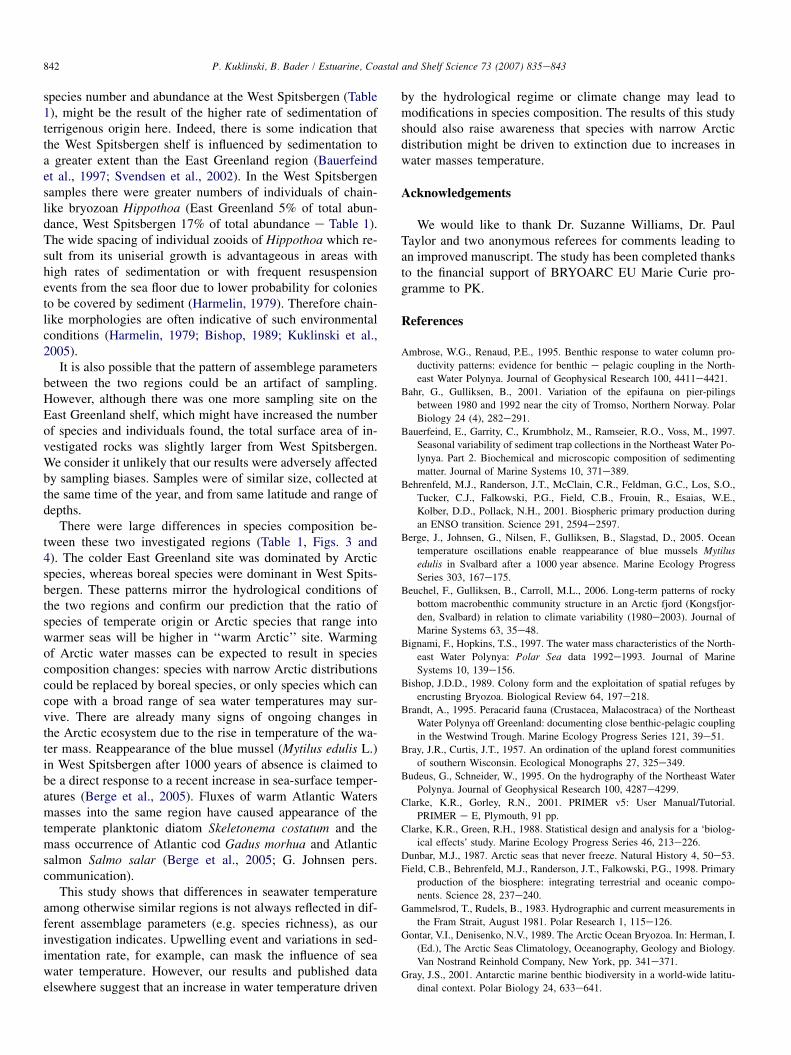
distributions was recorded in East Greenland (46%) thanWest Spitsbergen (24%) (Fig. 3). Quantitative differencesbetween bryozoan species composition were confirmed bymultivariate analysis (nMDS) showing sites to be clusteredinto two distinct groupings: East Greenland and West Spitsber-gen (Fig. 4). Multivariate analyses of untransformed, squareand fourth root transformed data showed the same splitbetween East Greenland and West Spitsbergen samples. Sim-ilarly the ANOSIM (R ¼ 0.677, p ¼ 0.001) statistic indicatesthat the East Greenland bryozoan biota is clearly differentfrom West Spitsbergen.
4. Discussion
Several Arctic studies have indicated that annual changesin temperature of water masses at one particular location ora number of locations influence diversity, biomass and abun-dance of benthic organisms (e.g. Bahr and Gulliksen, 2001;Beuchel et al., 2006). Analysis of annual photographs ata permanent rocky bottom station on West Spitsbergen overa period of more than 20 years revealed that diversity andabundance of the benthic biota fluctuated with the tempera-ture of the local water mass (Beuchel et al., 2006). A similartrend was observed by Bahr and Gulliksen (2001). Speciesrichness and diversity of benthic communities from northernNorway were higher during years with increased sea watertemperature. There are also examples where the abundanceof organisms increased in spite of decreasing sea water tem-perature (e.g. Hagberg and Tunberg, 2000). This pattern wasattributed to the influx of nutrients from cold bottom watermasses.
The current study has revealed no statistical significant dif-ferences in assemblage parameters, including mean values ofspecies richness, diversity and abundance, between two re-gions (‘‘cold Arctic’’ [East Greenland] and ‘‘warm Arctic’’[West Spitsbergen]) from the same latitude and with similardepths yet differing in sea water temperature and salinity(Fig. 2). Our prediction that species richness, diversity andabundance should differ between the two investigated regionswas not confirmed by our results. Additionally values of totalspecies number and total abundance were one third higher forthe colder East Greenland region (Table 1). These results sug-gest that higher sea water temperatures have no positive influ-ence on investigated bryozoan assemblage parameters.Therefore, factors other than temperature and salinity couldbe responsible for the observed patterns (similar assemblageparameters, species number and total abundance were onethird higher at the colder region).
The East Greenland region is part of a Polynya. This Po-lynya has a very complex hydrography and includes a numberof local gyres, loop currents and upwelling events (Budeusand Schneider, 1995). This results in well-mixed watermasses throughout the water column. Furthermore, upwell-ings are very often associated with high values of phyto-plankton productivity (Field et al., 1998; Behrenfeld et al.,2001) and indeed Polynyas show elevated levels of primaryproductivity in comparison to other polar regions (Stirling,
839P. Kuklinski, B. Bader / Estuarine, Coastal and Shelf Science 73 (2007) 835e843
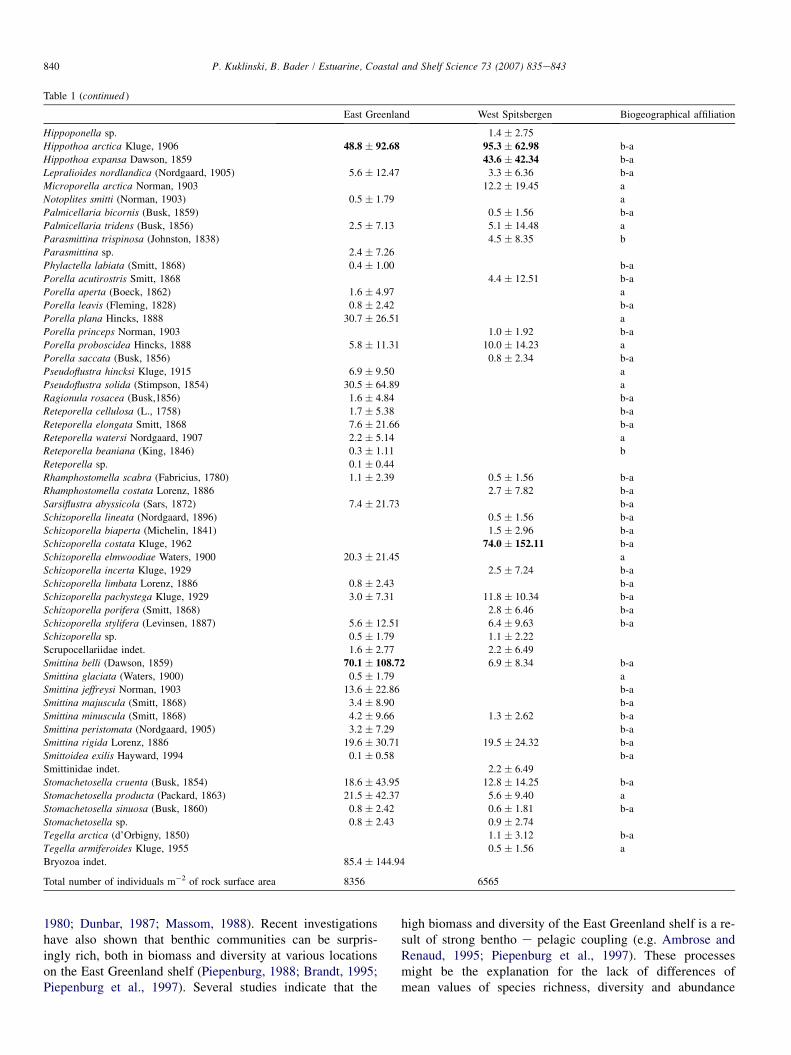
Table 1
Mean values of species abundance and their biogeography (mean individuals number m�2 of rocks surface area; five dominating species in bold; a e Arctic,
b e boreal, b-a e boreal Arctic)
East Greenland West Spitsbergen Biogeographical affiliation
CYCLOSTOMATA
Annectosyma major (Johnston, 1847) 38.4 � 108.67 b
Berenica arctica Kluge, 1946 0.5 � 1.79 a
Crisia sp. 12.5 � 16.64
Crisiella sp. 1.0 � 2.43
Defrancia lucernaria Sars, 1851 7.4 � 21.73 b-a
Defrancia prolifera Kluge, 1946 0.8 � 2.42 b
Diplosolen intricarius (Smitt, 1872) 3.8 � 6.06 a
Diplosolen obelia (Johnston, 1838) 7.2 � 21.78 b
Disporella hispida (Fleming, 1828) 1.6 � 4.86 1.5 � 3.23 b-a
Disporella sp. 10.7 � 14.92 7.0 � 8.23
Entalophora clavata (Busk, 1859) 0.5 � 1.79 b-a
Exidmonea atlantica Forbes, 1847 0.5 � 1.79 b-a
Exidmonea sp. 0.1 � 0.44
Hornera lichenoides (L., 1758) 15.1 � 22.29 b-a
Oncousoecia canadensis Osburn, 1933 18.0 � 15.71 11.6 � 19.36 a
Oncousoecia diastroporides (Norman, 1869) 192.2 � 332.66 b-a
Oncousoecia sp. 0.1 � 0.59
‘‘Proboscina sp.’’ 39.4 � 42.68 8.9 � 21.34
Stomatopora granulata (Milne-Edwards, 1838) 11.3 � 17.59 b-a
Tubuliporidae indet. 58 � 85.19 31.8 � 40.33
Cyclostomata indet. 10.4 � 18.16
CTENOSTOMATA
Alcyonidium erectum Andersson, 1902 7.7 � 21.61 a
Bowerbankia sp. 0.5 � 1.79
CHEILOSTOMATA
Amphiblestrum septentrionalis (Kluge, 1906) 19.6 � 24.63 b-a
Amphiblestrum trifolium (Wood, 1844) 1.6 � 4.69 b-a
Amphiblestrum sp. 0.8 � 2.43 0.5 � 1.56
Callopora craticula (Alder, 1857) 1.5 � 2.77 11.2 � 21.25 b-a
Callopora smitti Kluge, 1946 1.6 � 4.69 a
Callopora weslawski Kuklinski and Taylor, 2006 32.8 � 44.20 a
Callopora sp. 34.3 � 73.44
Cellepora nodulosa Lorenz, 1886 0.1 � 0.44 a
Cellepora surcularis (Packard, 1863) 0.8 � 2.42 a
Cellepora sp. 2.2 � 6.49
Cheilopora sincera (Smitt, 1868) 0.1 � 0.44 b-a
Cribrilina spitsbergensis Norman, 1903 4.5 � 13.77 0.5 � 1.56 a
Cribrilina sp. 0.5 � 1.79
Cylindroporella tubulosa (Norman, 1868) 4.8 � 10.31 15.5 � 23.64 b-a
Dendrobeania murrayana (Johnston, 1847) 3.2 � 9.82 b-a
Doryporella spathulifera (Smitt, 1868) 2.4 � 7.29 11.2 � 15.81 b-a
Electra arctica Borg, 1931 7.2 � 21.78 13.6 � 16.91 b-a
Electra catenularia-similis Kluge, 1962 16.8 � 24.54 b
Electra sp. 0.5 � 1.56
Escharella abyssicola (Norman, 1869) 39.9 � 46.87 0.5 � 1.56 a
Escharella klugei (Hayward, 1979) 44.8 � 53.23 b-a
Escharella laqueta (Norman, 1864) 0.1 � 0.59 b
Escharella macrodonta Levinsen, 1916 36.9 � 108.72 a
Escharella ventricosa (Hassal, 1842) 12.0 � 19.28 4.9 � 14.07 b-a
Escharella sp. 0.4 � 1.00 6.0 � 17.20
Escharellidae indet. 2.5 � 7.24
Escharelloides spinulifera (Hincks, 1889) 34.2 � 53.61 a
Escharelloides stenostoma (Smitt, 1872) 21.9 � 42.24 a
Escharoides bidenkapi (Kluge, 1946) 19.9 � 29.65 a
Escharoides jacksoni (Waters, 1900) 1.1 � 2.48 a
Eucratea arctica (Kluge, 1915) 1.2 � 2.51 a
Hemicyclopora emucronata (Smitt, 1872) 19.9 � 54.52 2.2 � 6.49 a
Hippodiplosia borealis (Waters, 1900) 3.4 � 6.47 a
Hippodiplosia harmsworthi (Waters, 1900) 4.9 � 9.74 a
Hippodiplosia obesa (Waters, 1900) 26.6 � 28.32 b-a
(continued on next page)
840 P. Kuklinski, B. Bader / Estuarine, Coastal and Shelf Science 73 (2007) 835e843
Table 1 (continued )
East Greenland West Spitsbergen Biogeographical affiliation
Hippoponella sp. 1.4 � 2.75
Hippothoa arctica Kluge, 1906 48.8 � 92.68 95.3 � 62.98 b-a
Hippothoa expansa Dawson, 1859 43.6 � 42.34 b-a
Lepralioides nordlandica (Nordgaard, 1905) 5.6 � 12.47 3.3 � 6.36 b-a
Microporella arctica Norman, 1903 12.2 � 19.45 a
Notoplites smitti (Norman, 1903) 0.5 � 1.79 a
Palmicellaria bicornis (Busk, 1859) 0.5 � 1.56 b-a
Palmicellaria tridens (Busk, 1856) 2.5 � 7.13 5.1 � 14.48 a
Parasmittina trispinosa (Johnston, 1838) 4.5 � 8.35 b
Parasmittina sp. 2.4 � 7.26
Phylactella labiata (Smitt, 1868) 0.4 � 1.00 b-a
Porella acutirostris Smitt, 1868 4.4 � 12.51 b-a
Porella aperta (Boeck, 1862) 1.6 � 4.97 a
Porella leavis (Fleming, 1828) 0.8 � 2.42 b-a
Porella plana Hincks, 1888 30.7 � 26.51 a
Porella princeps Norman, 1903 1.0 � 1.92 b-a
Porella proboscidea Hincks, 1888 5.8 � 11.31 10.0 � 14.23 a
Porella saccata (Busk, 1856) 0.8 � 2.34 b-a
Pseudoflustra hincksi Kluge, 1915 6.9 � 9.50 a
Pseudoflustra solida (Stimpson, 1854) 30.5 � 64.89 a
Ragionula rosacea (Busk,1856) 1.6 � 4.84 b-a
Reteporella cellulosa (L., 1758) 1.7 � 5.38 b-a
Reteporella elongata Smitt, 1868 7.6 � 21.66 b-a
Reteporella watersi Nordgaard, 1907 2.2 � 5.14 a
Reteporella beaniana (King, 1846) 0.3 � 1.11 b
Reteporella sp. 0.1 � 0.44
Rhamphostomella scabra (Fabricius, 1780) 1.1 � 2.39 0.5 � 1.56 b-a
Rhamphostomella costata Lorenz, 1886 2.7 � 7.82 b-a
Sarsiflustra abyssicola (Sars, 1872) 7.4 � 21.73 b-a
Schizoporella lineata (Nordgaard, 1896) 0.5 � 1.56 b-a
Schizoporella biaperta (Michelin, 1841) 1.5 � 2.96 b-a
Schizoporella costata Kluge, 1962 74.0 � 152.11 b-a
Schizoporella elmwoodiae Waters, 1900 20.3 � 21.45 a
Schizoporella incerta Kluge, 1929 2.5 � 7.24 b-a
Schizoporella limbata Lorenz, 1886 0.8 � 2.43 b-a
Schizoporella pachystega Kluge, 1929 3.0 � 7.31 11.8 � 10.34 b-a
Schizoporella porifera (Smitt, 1868) 2.8 � 6.46 b-a
Schizoporella stylifera (Levinsen, 1887) 5.6 � 12.51 6.4 � 9.63 b-a
Schizoporella sp. 0.5 � 1.79 1.1 � 2.22
Scrupocellariidae indet. 1.6 � 2.77 2.2 � 6.49
Smittina belli (Dawson, 1859) 70.1 � 108.72 6.9 � 8.34 b-a
Smittina glaciata (Waters, 1900) 0.5 � 1.79 a
Smittina jeffreysi Norman, 1903 13.6 � 22.86 b-a
Smittina majuscula (Smitt, 1868) 3.4 � 8.90 b-a
Smittina minuscula (Smitt, 1868) 4.2 � 9.66 1.3 � 2.62 b-a
Smittina peristomata (Nordgaard, 1905) 3.2 � 7.29 b-a
Smittina rigida Lorenz, 1886 19.6 � 30.71 19.5 � 24.32 b-a
Smittoidea exilis Hayward, 1994 0.1 � 0.58 b-a
Smittinidae indet. 2.2 � 6.49
Stomachetosella cruenta (Busk, 1854) 18.6 � 43.95 12.8 � 14.25 b-a
Stomachetosella producta (Packard, 1863) 21.5 � 42.37 5.6 � 9.40 a
Stomachetosella sinuosa (Busk, 1860) 0.8 � 2.42 0.6 � 1.81 b-a
Stomachetosella sp. 0.8 � 2.43 0.9 � 2.74
Tegella arctica (d’Orbigny, 1850) 1.1 � 3.12 b-a
Tegella armiferoides Kluge, 1955 0.5 � 1.56 a
Bryozoa indet. 85.4 � 144.94
Total number of individuals m�2 of rock surface area 8356 6565
1980; Dunbar, 1987; Massom, 1988). Recent investigationshave also shown that benthic communities can be surpris-ingly rich, both in biomass and diversity at various locationson the East Greenland shelf (Piepenburg, 1988; Brandt, 1995;Piepenburg et al., 1997). Several studies indicate that the
high biomass and diversity of the East Greenland shelf is a re-sult of strong bentho e pelagic coupling (e.g. Ambrose andRenaud, 1995; Piepenburg et al., 1997). These processesmight be the explanation for the lack of differences ofmean values of species richness, diversity and abundance
841P. Kuklinski, B. Bader / Estuarine, Coastal and Shelf Science 73 (2007) 835e843
Fig. 3. Proportion of species from the two investigated regions. Arctic, Arctic-boreal and boreal biogeographical affiliation according to Gontar and Denisenko
(1989).
as well as the higher total number of species and individualsat the East Greenland region, in spite of the fact that it haslower seawater temperatures, a longer duration of ice coverand larger seasonal fluctuations in light regime than theWest Spitsbergen region (Ramseier et al., 1997; Svendsenet al., 2002).
Increased surface water temperature in the Arctic have ledto an increase in the activity of tidal glaciers and the amount ofmelt water and, as a result, greater discharge of inorganic sus-pension and an increased rate of sedimentation (e.g. Petersonet al., 2002). Therefore, the influence of factors of terrigenousorigin (e.g. discharge of inorganic suspension, sedimentation)on marine benthic organisms will be much higher in WestSpitsbergen than East Greenland. This could potentiallymask the positive influence on the biota related to higher watertemperature. In addition the West Spitsbergen shelf is much
narrower (w100 km) than the East Greenland shelf(w400 km). Therefore, our samples were collected closer tothe land in West Spitsbergen, magnifying the influence of ter-rigenous factor on the benthic assemblages. For example,comparison of two Arctic locations (West Spitsbergen andFranz Josef Land) differing in seawater temperature showedthat the warmer site had lower species richness and biodiver-sity (Wlodarska-Kowalczuk and Weslawski, 2001). The au-thors suggest this to be a consequence of the higher rate ofsedimentation from melt waters at the warmer site driven byhigher surface water temperatures. Sedimentation is a wellknown cause of death of suspension feeders like bryozoans,clogging feeding apparatus or depositing sediment as well ashindering settlement (Moore, 1977). Therefore the lack ofstatistically significant differences in assemblage parametersbetween the regions, as well as the lower values of total
Fig. 4. Multidimensional scaling (MDS) based on BrayeCurtis similarities calculated from square e rooted transformed date of species abundance for each station
(station symbols according to Fig. 1).
842 P. Kuklinski, B. Bader / Estuarine, Coastal and Shelf Science 73 (2007) 835e843
species number and abundance at the West Spitsbergen (Table1), might be the result of the higher rate of sedimentation ofterrigenous origin here. Indeed, there is some indication thatthe West Spitsbergen shelf is influenced by sedimentation toa greater extent than the East Greenland region (Bauerfeindet al., 1997; Svendsen et al., 2002). In the West Spitsbergensamples there were greater numbers of individuals of chain-like bryozoan Hippothoa (East Greenland 5% of total abun-dance, West Spitsbergen 17% of total abundance e Table 1).The wide spacing of individual zooids of Hippothoa which re-sult from its uniserial growth is advantageous in areas withhigh rates of sedimentation or with frequent resuspensionevents from the sea floor due to lower probability for coloniesto be covered by sediment (Harmelin, 1979). Therefore chain-like morphologies are often indicative of such environmentalconditions (Harmelin, 1979; Bishop, 1989; Kuklinski et al.,2005).
It is also possible that the pattern of assemblege parametersbetween the two regions could be an artifact of sampling.However, although there was one more sampling site on theEast Greenland shelf, which might have increased the numberof species and individuals found, the total surface area of in-vestigated rocks was slightly larger from West Spitsbergen.We consider it unlikely that our results were adversely affectedby sampling biases. Samples were of similar size, collected atthe same time of the year, and from same latitude and range ofdepths.
There were large differences in species composition be-tween these two investigated regions (Table 1, Figs. 3 and4). The colder East Greenland site was dominated by Arcticspecies, whereas boreal species were dominant in West Spits-bergen. These patterns mirror the hydrological conditions ofthe two regions and confirm our prediction that the ratio ofspecies of temperate origin or Arctic species that range intowarmer seas will be higher in ‘‘warm Arctic’’ site. Warmingof Arctic water masses can be expected to result in speciescomposition changes: species with narrow Arctic distributionscould be replaced by boreal species, or only species which cancope with a broad range of sea water temperatures may sur-vive. There are already many signs of ongoing changes inthe Arctic ecosystem due to the rise in temperature of the wa-ter mass. Reappearance of the blue mussel (Mytilus edulis L.)in West Spitsbergen after 1000 years of absence is claimed tobe a direct response to a recent increase in sea-surface temper-atures (Berge et al., 2005). Fluxes of warm Atlantic Watersmasses into the same region have caused appearance of thetemperate planktonic diatom Skeletonema costatum and themass occurrence of Atlantic cod Gadus morhua and Atlanticsalmon Salmo salar (Berge et al., 2005; G. Johnsen pers.communication).
This study shows that differences in seawater temperatureamong otherwise similar regions is not always reflected in dif-ferent assemblage parameters (e.g. species richness), as ourinvestigation indicates. Upwelling event and variations in sed-imentation rate, for example, can mask the influence of seawater temperature. However, our results and published dataelsewhere suggest that an increase in water temperature driven
by the hydrological regime or climate change may lead tomodifications in species composition. The results of this studyshould also raise awareness that species with narrow Arcticdistribution might be driven to extinction due to increases inwater masses temperature.
Acknowledgements
We would like to thank Dr. Suzanne Williams, Dr. PaulTaylor and two anonymous referees for comments leading toan improved manuscript. The study has been completed thanksto the financial support of BRYOARC EU Marie Curie pro-gramme to PK.
References
Ambrose, W.G., Renaud, P.E., 1995. Benthic response to water column pro-
ductivity patterns: evidence for benthic e pelagic coupling in the North-
east Water Polynya. Journal of Geophysical Research 100, 4411e4421.
Bahr, G., Gulliksen, B., 2001. Variation of the epifauna on pier-pilings
between 1980 and 1992 near the city of Tromso, Northern Norway. Polar
Biology 24 (4), 282e291.
Bauerfeind, E., Garrity, C., Krumbholz, M., Ramseier, R.O., Voss, M., 1997.
Seasonal variability of sediment trap collections in the Northeast Water Po-
lynya. Part 2. Biochemical and microscopic composition of sedimenting
matter. Journal of Marine Systems 10, 371e389.
Behrenfeld, M.J., Randerson, J.T., McClain, C.R., Feldman, G.C., Los, S.O.,
Tucker, C.J., Falkowski, P.G., Field, C.B., Frouin, R., Esaias, W.E.,
Kolber, D.D., Pollack, N.H., 2001. Biospheric primary production during
an ENSO transition. Science 291, 2594e2597.
Berge, J., Johnsen, G., Nilsen, F., Gulliksen, B., Slagstad, D., 2005. Ocean
temperature oscillations enable reappearance of blue mussels Mytilus
edulis in Svalbard after a 1000 year absence. Marine Ecology Progress
Series 303, 167e175.
Beuchel, F., Gulliksen, B., Carroll, M.L., 2006. Long-term patterns of rocky
bottom macrobenthic community structure in an Arctic fjord (Kongsfjor-
den, Svalbard) in relation to climate variability (1980e2003). Journal of
Marine Systems 63, 35e48.
Bignami, F., Hopkins, T.S., 1997. The water mass characteristics of the North-
east Water Polynya: Polar Sea data 1992e1993. Journal of Marine
Systems 10, 139e156.
Bishop, J.D.D., 1989. Colony form and the exploitation of spatial refuges by
encrusting Bryozoa. Biological Review 64, 197e218.
Brandt, A., 1995. Peracarid fauna (Crustacea, Malacostraca) of the Northeast
Water Polynya off Greenland: documenting close benthic-pelagic coupling
in the Westwind Trough. Marine Ecology Progress Series 121, 39e51.
Bray, J.R., Curtis, J.T., 1957. An ordination of the upland forest communities
of southern Wisconsin. Ecological Monographs 27, 325e349.
Budeus, G., Schneider, W., 1995. On the hydrography of the Northeast Water
Polynya. Journal of Geophysical Research 100, 4287e4299.
Clarke, K.R., Gorley, R.N., 2001. PRIMER v5: User Manual/Tutorial.
PRIMER e E, Plymouth, 91 pp.
Clarke, K.R., Green, R.H., 1988. Statistical design and analysis for a ‘biolog-
ical effects’ study. Marine Ecology Progress Series 46, 213e226.
Dunbar, M.J., 1987. Arctic seas that never freeze. Natural History 4, 50e53.
Field, C.B., Behrenfeld, M.J., Randerson, J.T., Falkowski, P.G., 1998. Primary
production of the biosphere: integrating terrestrial and oceanic compo-
nents. Science 28, 237e240.
Gammelsrod, T., Rudels, B., 1983. Hydrographic and current measurements in
the Fram Strait, August 1981. Polar Research 1, 115e126.
Gontar, V.I., Denisenko, N.V., 1989. The Arctic Ocean Bryozoa. In: Herman, I.
(Ed.), The Arctic Seas Climatology, Oceanography, Geology and Biology.
Van Nostrand Reinhold Company, New York, pp. 341e371.
Gray, J.S., 2001. Antarctic marine benthic biodiversity in a world-wide latitu-
dinal context. Polar Biology 24, 633e641.
843P. Kuklinski, B. Bader / Estuarine, Coastal and Shelf Science 73 (2007) 835e843
Gulliksen, B., Palerud, R., Brattegaard, T., Sneli, J., 1999. Distribution of Ma-
rine Benthic Macroorganisms at Svalbard (Including Bear Island) and Jan
Mayen. Research Report for DN 1999 4. Directorate for Nature Manage-
ment, Trondheim, 148 pp.
Hagberg, J., Tunberg, B.G., 2000. Studies on the covariation between physical
factors and the long-term variation of the marine soft bottom macrofauna
in Western Sweden. Estuarine, Coastal and Shelf Science 50, 373e385.
Harmelin, J.G., 1979. On some Stomatoporiform species (Bryozoa Cyclosto-
mata) from the bathyal zone of the Northeastern Atlantic Ocean. In:
Larwood, G.P., Abott, M.B. (Eds.), Advances in Bryozoology. Systematics
Association Special, Volume No 13. Academic Press, London and New
York, pp. 403e422.
Kluge, G.A., 1975. Bryozoa of the Northern Seas of the USSR. Amerind Pub-
lishing Co. Pvt., New Delhi, 711 pp.
Kroncke, I., 1995. Long term changes in North Sea benthos. Senckenbergiana
Maritima 26 (1e2), 73e80.
Kuklinski, P., Bader, B., 2007. Diversity, structure and interactions of encrust-
ing lithophillic macrofaunal assemblages from Belgica Bank, East Green-
land. Polar Biology 30, 709e717.
Kuklinski, P., Gulliksen, B., Lønne, O.J., Weslawski, J.M., 2005. Composition
of bryozoan assemblages related to depth in Svalbard fjords and sounds.
Polar Biology 28, 619e630.
Loeng, H., 1991. Features of the physical oceanographic conditions of the
Barents Sea. In: Sakshaug, E., Hopkins, C.C.E., Oritsland, N.A. (Eds.),
Proceedings of the Pro Mare Symposium on Polar Marine Ecology, Trond-
heim, 12e16 May 1990, Polar Research 10, 5e18.
Massom, R.A., 1988. The biological significance of open water within the ice
cover of the polar regions. Endeavour New Series 12, 21e27.
Minnett, P.J., Bignami, F., Bohm, E., Budeus, G., Galbraith, P.S., Gudmandsen, P.,
Hopkins, T.S., Ingram, R.G., Johnson, M.A., Niebauer, H.J., Ramseier, R.O.,
Schneider, W., 1997. A summary of the formation and seasonal progression of
the Northeast Water Polynya. Journal of Marine Systems 10, 79e85.
Moore, P.G., 1977. Inorganic particulate suspensions in the sea and their
effects on marine animals. Oceanography and Marine Biology: an Annual
Review 15, 225e363.
Ottersen, G., Hjerman, D.O., Stenseth, N.C., 2006. Changes in spawning
stock structure strengthen the link between climate and recruitment in a
heavily fished cod (Gadus morhua) stock. Fisheries Oceanography 15,
230e243.
Peterson, B.J., Holmes, R.M., McClelland, J.W., Vorosmarty, C.J.,
Lammers, R.B., Shiklomanov, I.A., Rahmstorf, S., 2002. Increasing river
discharge to the Arctic Ocean. Science 298, 2171e2173.
Piepenburg, D., 1988. Zur Zusammensetzung der Bodenfauna in der westli-
chen Fram-Straße. Berichte Zur Polarforschung 52, 1e118.
Piepenburg, D., Ambrose, W.G., Brandt, A., Renaud, P.E., Ahrens, M.J.,
Jensen, P., 1997. Benthic community patterns reflect water column
processes in the Northeast Water polynya (Greenland). Journal of Marine
Systems 10, 467e482.
Ramseier, R.O., Bauerfeind, E., Garrity, C., Walsh, I.D., 1997. Seasonal variabil-
ity of sediment trap collections in the Northeast Water Polynya. Part 1. Sea e
ice parameters and particle flux. Journal of Marine Systems 10, 359e369.
Ritzrau, W., 1997. Pelagic microbial activity in the Northeast Water polynya,
summer 1992. Polar Biology 17, 259e267.
Stirling, I., 1980. The biological importance of Polynyas in the Canadian
Arctic. Arctic 33, 303e315.
Svendsen, H., Beszczynska-Møller, A., Hagen, J.O., Lefauconnier, B.,
Tverberg, V., Gerland, S., Ørbæk, J.B., Bischof, K., Papucci, C.,
Zajaczkowski, M., Azzolini, R., Bruland, O., Wiencke, C., Winther, J.G.,
Dallmann, W., 2002. The physical environment of Kongsfjorden-
Krossfjorden, an Arctic fjord system in Svalbard. Polar Research 21,
133e166.
Wlodarska-Kowalczuk, M., Weslawski, J.M., 2001. Impact of climate warm-
ing on Arctic benthic biodiversity: a case study of two Arctic glacial
bays. Climate Research 18, 127e132.
Recommended