Science of the Total Environment 497–498 (2014) 353–359
Contents lists available at ScienceDirect
Science of the Total Environment
j ourna l homepage: www.e lsev ie r .com/ locate /sc i totenv
Comparative study on PCDD/F pollution in soil from the Antarctic, Arcticand Tibetan Plateau
Shenglan Jia a, Qiang Wang b, Li Li a, Xuekun Fang a,c, Yehong Shi d, Weiguang Xu a, Jianxin Hu a,⁎a State Key Joint Laboratory of Environmental Simulation and Pollution Control, College of Environmental Sciences and Engineering, Collaborative Innovation Center for Regional Envi-ronmental Quality, Peking University, Beijing 100871, PR Chinab School of Chemistry and Chemical Engineering, Central South University, Changsha 410083, PR Chinac Norwegian Institute for Air Research, P.O. Box 100, 2027 Kjeller, Norwayd Beijing General Research Institute of Mining & Metallurgy, Beijing 100160, PR China
H I G H L I G H T S
• The level of PCDD/Fs in soil at the Three Poles was reported.• PCDD/F congener profiles in soil from the Three Poles were compared.• Potential local and regional PCDD/F sources were conducted by FLEXPART simulation.
⁎ Corresponding author. Tel.: +86 10 62756593.E-mail address: [email protected] (J. Hu).
http://dx.doi.org/10.1016/j.scitotenv.2014.07.1090048-9697/© 2014 Elsevier B.V. All rights reserved.
a b s t r a c t
a r t i c l e i n f oArticle history:Received 24 April 2014Received in revised form 21 July 2014Accepted 28 July 2014Available online xxxx
Editor: Adrian Covaci
Keywords:PCDD/FsSoilThree PolesFLEXPART model
The concentrations of polychlorinated dibenzo-p-dioxins (PCDDs) and dibenzofurans (PCDFs) in 35 soil samplescollected from Fildes Peninsula in the Antarctic, Ny-Ålesund in the Arctic, and Zhangmu-Nyalam in the TibetanPlateau were reported in this study. A comparison of the total concentration and TEQ of PCDD/Fs at the ThreePoles was conducted. Both the total concentration and TEQ of PCDD/Fs demonstrates a decreasing trend inthe order of Zhangmu-Nyalam (mean: 26.22 pg/g, 0.37 pg I-TEQ/g) N Ny-Ålesund (mean: 9.97 pg/g,0.33 pg I-TEQ/g) N Fildes Peninsula (mean: 2.18 pg/g, 0.015 pg I-TEQ/g) (p b 0.05). In all samples, the congenerand homologue profiles dominated with higher (seven and eight) chlorinated PCDD/Fs (more than 85% of thetotal mass percentage of PCDD/Fs) at the Three Poles. Finally, a FLEXPART backward simulation was used topreliminarily identify the potential local and regional anthropogenic sources of PCDD/Fs. The results implythat the air masses passing over surrounding regions with significant PCDD/F emissions might contribute tothe occurrence of PCDD/Fs in both the Arctic and Tibetan Plateau.
© 2014 Elsevier B.V. All rights reserved.
1. Introduction
Polychlorinated dibenzo-p-dioxins and polychlorinated dibenzo-furans (PCDD/Fs) are persistent organic pollutants (POPs) regulatedby the Stockholm Convention (http://chm.pops.int/TheConvention/ThePOPs/ListingofPOPs/tabid/2509/Default.aspx). They are uninten-tional byproducts of combustion and chlorinating processes duringboth natural and human activities, such as wildfire and waste incin-eration (USEPA, 2000). Among all 210 congeners, 17 PCDD/Fs withchlorines at the 2, 3, 7, and 8 positions are dioxin-toxic, and pose ahigh risk to ecological systems and human health due to severe ab-normality inductive, mutagenic, and carcinogenic effects (Wikoffet al., 2012). The Antarctic, the Arctic, and the Tibetan Plateau arecollectively referred to as “Three Poles” of the earth. They share the
common characteristics of extremely harsh climate and fragile eco-systems. With few anthropogenic activities, the Three Poles wereonce thought to be free from man-made chemical contamination.There have been few reports of PCDD/Fs at the Three Poles, due tothe extreme environment and the expense of sampling. However,the available data suggest that PCDD/Fs occur at the Three Poles:PCDD/Fs in soil (2.48–4.30 pg/g dry weight) from the eastern TibetanPlateau were reported by Pan et al. (2013); PCDD/Fs were detectedin the blubber of ringed seals from the Arctic (0.6–108.2 pg/g lipidweight) (Savinov et al., 2011); and PCDD/Fs in Antarctic penguinswere measured (7–72 pg/g wet weight) (Corsolini et al., 2007). Aslisted above, most available reports of PCDD/F levels were based onthe monitoring of biota and conducted to assess the ecological risk.However, because abiotic media are the transfer media and main re-ceptors of POPs, they can be used to investigate the potential sourcesand transportation pathways of POPs (Hale et al., 2006). Among thevarious abiotic environmental media, soil is one of the first points
354 S. Jia et al. / Science of the Total Environment 497–498 (2014) 353–359
of entry of PCDD/Fs into terrestrial ecological systems (Carballeiraet al., 2006). We therefore selected soil to monitor PCDD/Fs in theThree Poles in this study. And the investigation of PCDD/F levels in soilfrom these regions could provide fundamental data for a range of aca-demic applications, such as assessing the local ecological risk of PCDD/Fs, as well as the effects of human disturbances on the environment.
The identification of the potential PCDD/F sources of the Three Polesis essential for understanding the transport of PCDD/Fs. Previously,many studies have highlighted the importance of global long-rangetransport as the main source of POPs at the Three Poles (AMAP, 1998;Pienitz et al., 2004). For instance, Wania and his colleagues proposedthe theory of global fractionation, which posited that remote regionstended to accumulate POPs through long-range transfer (Wania andMackay, 1993;Wania, 2003). However, due to the increasing human ac-tivities at the Three Poles and the surrounding regions, the contribu-tions of those local and regional sources to the PCDD/F occurrencecan't be overlooked; thus, identifying the localized anthropogenicsources of PCDD/Fs at the Three Poles is needed. Simple backward tra-jectory models were often used to describe the neighboring sources ofPOPs at a simplified way (e.g., detailed atmospheric transport andchemical processes were ignored). The FLEXible PARTicle dispersionmodel (FLEXPART) considered not only atmospheric turbulence andconvection, but also chemical removal of POPs by hydroxyl (OH) radi-cals during the backward simulation. In the previous study, it has beensuccessfully applied in investigating the transport behavior ofpolychlorinated biphenyl (PCB) (Eckhardt et al., 2009).
The soil samples from Fildes Peninsula in the Antarctic, Ny-Ålesundin the Arctic and Zhangmu-Nyalam in the Tibetan Plateau were collect-ed in this study. The concentrations of PCDD/Fs and the congener profileat the Three Poles were compared to maximize spatial variation over aglobal geographic range. The potential local and regional anthropogenicsources of PCDD/Fs in the sampling sites were then investigated using aFLEXPART simulation.
2. Materials and methods
2.1. Sample collection
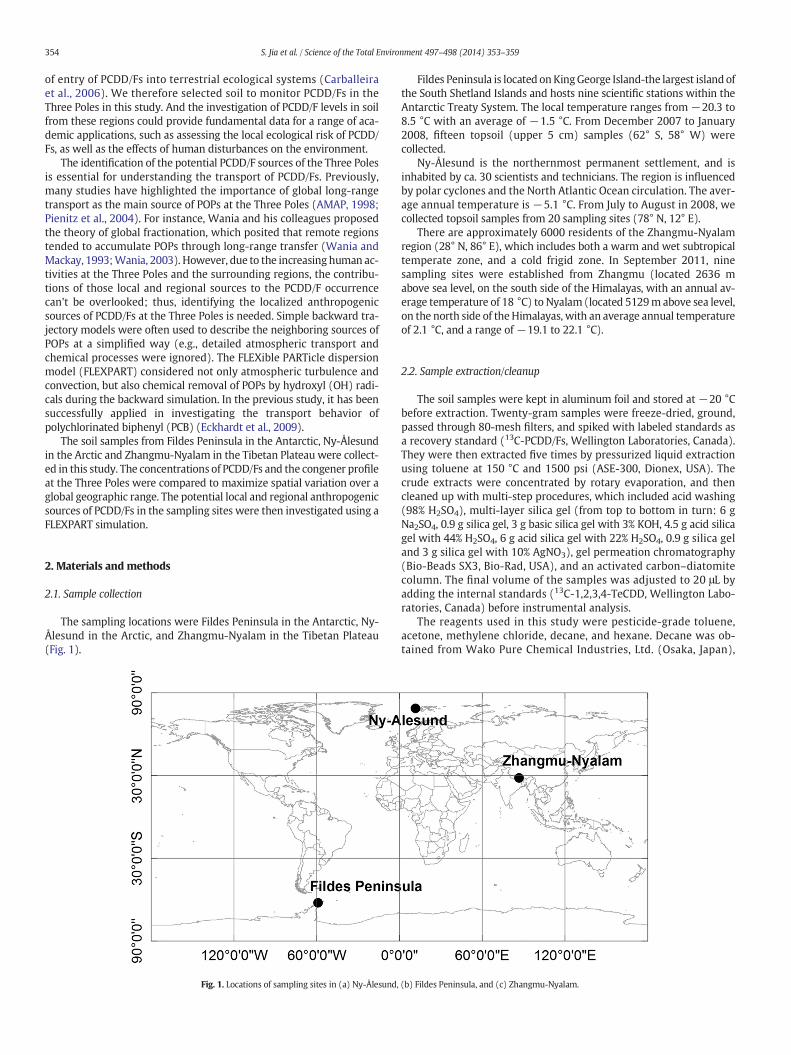
The sampling locations were Fildes Peninsula in the Antarctic, Ny-Ålesund in the Arctic, and Zhangmu-Nyalam in the Tibetan Plateau(Fig. 1).
Fig. 1. Locations of sampling sites in (a) Ny-Ålesund,
Fildes Peninsula is located onKingGeorge Island-the largest island ofthe South Shetland Islands and hosts nine scientific stations within theAntarctic Treaty System. The local temperature ranges from −20.3 to8.5 °C with an average of −1.5 °C. From December 2007 to January2008, fifteen topsoil (upper 5 cm) samples (62° S, 58° W) werecollected.
Ny-Ålesund is the northernmost permanent settlement, and isinhabited by ca. 30 scientists and technicians. The region is influencedby polar cyclones and the North Atlantic Ocean circulation. The aver-age annual temperature is −5.1 °C. From July to August in 2008, wecollected topsoil samples from 20 sampling sites (78° N, 12° E).
There are approximately 6000 residents of the Zhangmu-Nyalamregion (28° N, 86° E), which includes both a warm and wet subtropicaltemperate zone, and a cold frigid zone. In September 2011, ninesampling sites were established from Zhangmu (located 2636 mabove sea level, on the south side of the Himalayas, with an annual av-erage temperature of 18 °C) to Nyalam (located 5129m above sea level,on the north side of theHimalayas, with an average annual temperatureof 2.1 °C, and a range of −19.1 to 22.1 °C).
2.2. Sample extraction/cleanup
The soil samples were kept in aluminum foil and stored at −20 °Cbefore extraction. Twenty-gram samples were freeze-dried, ground,passed through 80-mesh filters, and spiked with labeled standards asa recovery standard (13C-PCDD/Fs, Wellington Laboratories, Canada).They were then extracted five times by pressurized liquid extractionusing toluene at 150 °C and 1500 psi (ASE-300, Dionex, USA). Thecrude extracts were concentrated by rotary evaporation, and thencleaned up with multi-step procedures, which included acid washing(98% H2SO4), multi-layer silica gel (from top to bottom in turn: 6 gNa2SO4, 0.9 g silica gel, 3 g basic silica gel with 3% KOH, 4.5 g acid silicagel with 44% H2SO4, 6 g acid silica gel with 22% H2SO4, 0.9 g silica geland 3 g silica gel with 10% AgNO3), gel permeation chromatography(Bio-Beads SX3, Bio-Rad, USA), and an activated carbon–diatomitecolumn. The final volume of the samples was adjusted to 20 μL byadding the internal standards (13C-1,2,3,4-TeCDD, Wellington Labo-ratories, Canada) before instrumental analysis.
The reagents used in this study were pesticide-grade toluene,acetone, methylene chloride, decane, and hexane. Decane was ob-tained from Wako Pure Chemical Industries, Ltd. (Osaka, Japan),
(b) Fildes Peninsula, and (c) Zhangmu-Nyalam.
355S. Jia et al. / Science of the Total Environment 497–498 (2014) 353–359
and the other reagents were purchased from Thermo Fisher Scientific(Waltham, MA, USA).
A high-resolution gas chromatography (HP6890, Agilent Tech-nologies, USA) coupled with a high-resolution mass spectrometer(JMS 700D, JEOL, Tokyo, Japan) was used, and was equipped with aDB-5MS column (60 m × 0.25 mm I.D., 0.25-μm thickness: J & WScientific, Folsom, CA, USA) for the determination of TeCDD/Fs toHxCDD/Fs [the inlet temperature was 260 °C. The column temperaturewas programmed from120 °C (1min) to 200 °C at 20 °C/min, 2 °C/minto 260 °C (10 min)]. A DB-17MS column (15m× 0.32mm I.D., 0.25-μmthickness: J &WScientific)was used for the determination of HpCDD/Fsand OCDD/Fs [the inlet temperature was 280 °C and the column tem-perature program: 100 °C (1 min), 20 °C/min to 280 °C (10 min)].The flow rate was 1.2 mL/min, and the injection volume was 2 μL. MSoperating conditionswere as follows: ionization energy, 38 eV; ion cur-rent, 600 μA; accelerating voltage, 7.0 kV; detection mode, single ionmonitoring (SIM); and mass resolution, 10,000.
2.3. QA/QC
One field blank and one method blank were analyzed for each batchof samples, andno background level higher than limit of detection (LOD)was recorded. The LODs of the congeners ranged from 0.02 to 0.40 pg/g.The recovery efficiencies ranged from 54.47% to 104.35%, which waswithin the requirement of US EPA Method 1613B (EPA, 1994).
2.4. Data analysis
Prior to statistical analysis, a Levene analysis (p N 0.05) was used todetermine the homogeneity of variance of the dataset. Kruskal–WallisH-tests were then used to evaluate datasets that did not conform to anormal distribution (p N 0.05). All statistical analyses were conductedusing IBM SPSS v-20.0. A value of p b 0.05 was taken to indicatestatistical significance.
The Lagrangian particle dispersion model FLEXPART v-9.02 (Stohlet al., 1998, 2005; http://www.flexpart.eu) was used to establish theatmospheric source–receptor (sampling areas) relationships. As the po-tential emission sources outnumbered the sampling areas (receptors),“backward simulation” instead of “forward simulation” was used inthis study. The backward model calculations were detailed by previousstudies (Stohl et al., 2003; Seibert and Frank, 2004). Briefly, thebackward simulation was driven with operational three-hourlymeteorological data of 1° × 1° horizontal resolution and 91 verticallevels, from the European Center for Medium Range Weather forecast(ECMWF). Forty thousand particles (not real particle maters, butso-called ideal tracer parcels) were released every 3 h at ca. 20 mabove model ground at each sampling site and traced backward fora twenty-day time to calculate the emission sensitivity (ES). Eachgrid cell has an ES value (in units of ns/kg). Providing a unit sourcestrength (1 kg/s) in each grid cell, the ES value equals to the simulatedconcentration that the cell would produce at the receptor. The higherthe ES value, the greater the contribution of the unit emission fluxdensity from the source to the concentration at the receptor.
FLEXPART is suitable for simulating atmospheric transport of POPsthat are not strongly adsorbed on airborne particles (log KOA b 11 andlog KAW N −5) (Meyer et al., 2005; Eckhardt et al., 2009). PCDD/Fs arepresent in both the gas phase and particle phase in the atmosphere.The four to five chlorinated PCDD/Fs are present mainly in the gasphase (N50%), and have the above properties (i.e., log KOA b 11 andlog KAW N−5). However, six to eight chlorinated congeners are mainlyin the particle phase (N50%) and have log KOA N 11 (Wagrowski andHites, 1998; Harner et al., 2000). Besides, for six to eight chlorinatedcongeners, primary emission sources are not the only effective sourcesto the atmosphere, and the secondary sources (six to eight chlorinatedcongeners contaminated soils, water, etc.) might also influencethe measurement locations. Thus, the FLEXPART simulation of the
source–receptor relationships is applicable for four to five chlorinat-ed PCDD/Fs, but not six to eight chlorinated PCDD/Fs. However, mostanthropogenic PCDD/F sources emit both four to five and six to eightchlorinated congeners (Table 2) (EPA, 1998); the identified local and re-gional emission areas for four to five chlorinated PCDD/Fs could be sim-ilar to primary emission sources for six to eight chlorinated PCDD/Fs.
In this study, an air tracer was used as the released parcel for thisbackward simulation. The outputs of the FLEXPART backward simula-tion were 0.5° × 0.5° 3-h ES maps for each sampling site. And the 3-hESs for each site were averaged over 1 year in this study. It should benoted that emission contributions were not calculated (multiplicationof the footprint ES with the emission flux densities derived from anemission inventory) because of the lack of appropriate emission profileinventories. Therefore, the ESmaps covered only the preliminary poten-tial emission sources that were identified. These ESs were derived bysimulating the atmospheric tracer concentrations above the ground ateach sampling site, instead of the concentration in the soil as reportedin this study. We assumed that the overall concentrations in the soilwere correlated with the overall atmospheric concentrations at thesesampling sites, as atmospheric transport and deposition were believedto be the main sources for POPs in surface soil at Pole regions (UNEP,2002; AMAP, 2004).
3. Result and discussion
3.1. PCDD/F levels in soil: statistical descriptions
The PCDD/F concentrations are presented in Table 1. The highestconcentration (26.22 pg/g dw; range 2.43–73.28 pg/g dw) was foundin the soil of Zhangmu-Nyalam, followed by Ny-Ålesund (9.97 pg/gdw; range 3.55–16.60 pg/g dw), and Fildes Peninsula (2.18 pg/g dw;range 0.49–6.72 pg/g dw) (p b 0.05). The International Toxic EquivalentQuantity (I-TEQ) decreased in the same order, Zhangmu-Nyalam(0.37 pg I-TEQ/g; range 0.062–0.65 pg I-TEQ/g) N Ny-Ålesund(0.33 pg I-TEQ/g; range 0.016–0.65 pg I-TEQ/g) N Fildes Peninsula(0.015 pg I-TEQ/g; range 0.00070–0.062 pg I-TEQ/g) (p b 0.05).The identical order was apparent for the reported atmospheric con-centrations of PCDD/F (both gas and particle phases) from the litera-ture: those in the Arctic (4.2–59 fg/m3) was higher than those in theAntarctic (0.14–1.07 fg/m3) (Hung et al., 2002; Piazza et al., 2013).
The PCDD/F concentrations in the soil of the Three Poles were com-pared with the literature data from various locations around the world(Table 1). The PCDD/F concentrations in this study were lowerthan those in remote or rural regions like Slovakia (Dömötörová et al.,2012), Australia (Gaus et al., 2001; Müller et al., 2004), Austrian (Weisset al., 2000), Norway (Offenthaler et al., 2009), Swiss (Schmid et al.,2005), Italy (Baderna et al., 2013), Norwegian (Hassanin et al., 2005),and the UK (Rose et al., 1997; Hassanin et al., 2005). It can be seen fromTable 1 that PCDD/F concentrations in soil collected from the Antarcticin this study were the lowest reported worldwide. The Arctic soil hadthe second-lowest PCDD/F levels, and the Tibetan Plateau the third low-est. This is consistent with a 1-year simulation of atmospheric dioxin de-position to land (Booth et al., 2013), which estimated that the depositionvalues in the Antarctic were the lowest worldwide (b1 pg TEQ/km2),lower than those in the Arctic (between 1 pg and 0.11 mg TEQ/km2)and the Tibetan Plateau (0.04–2.2 mg TEQ/km2) regions.
Themonitoring data in this study confirmed the PCDD/F pollution atthe Three Poles and provided key information regarding global dioxinpollution. Compared with PCDD/F concentrations elsewhere in theworld, the Three Poles remain relatively unpolluted, which provide anopportunity to monitor the background PCDD/F levels.
3.2. Homologue and congener profiles
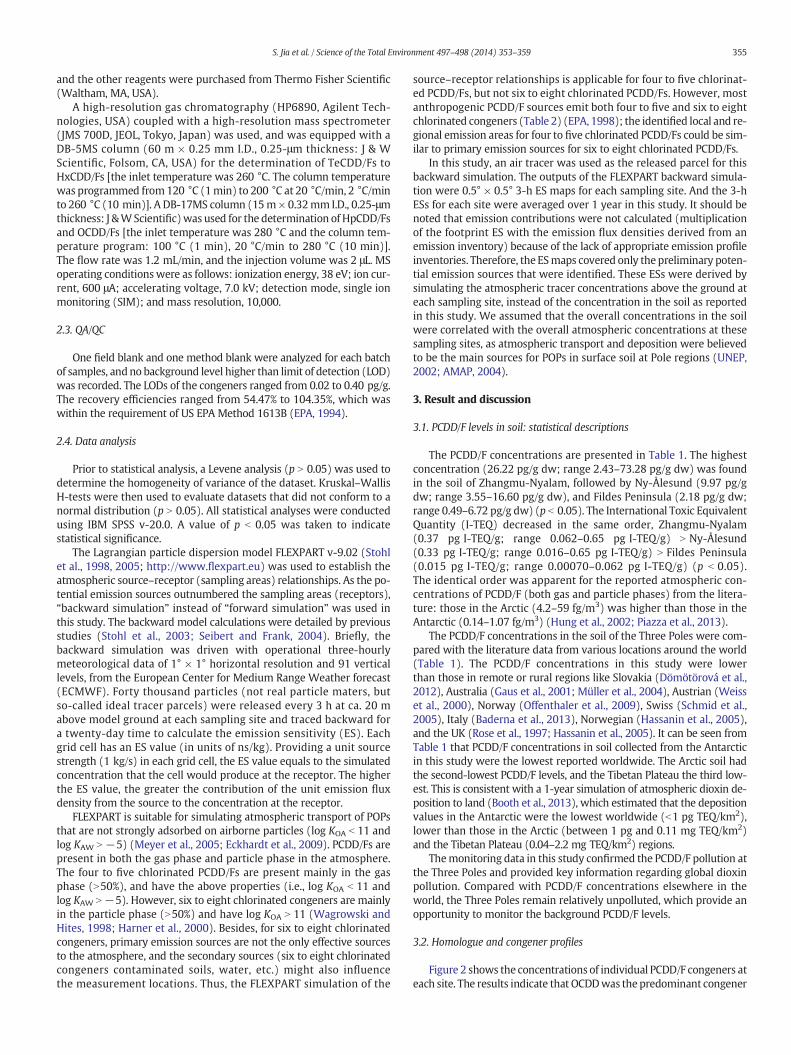
Figure 2 shows the concentrations of individual PCDD/F congeners ateach site. The results indicate that OCDDwas the predominant congener
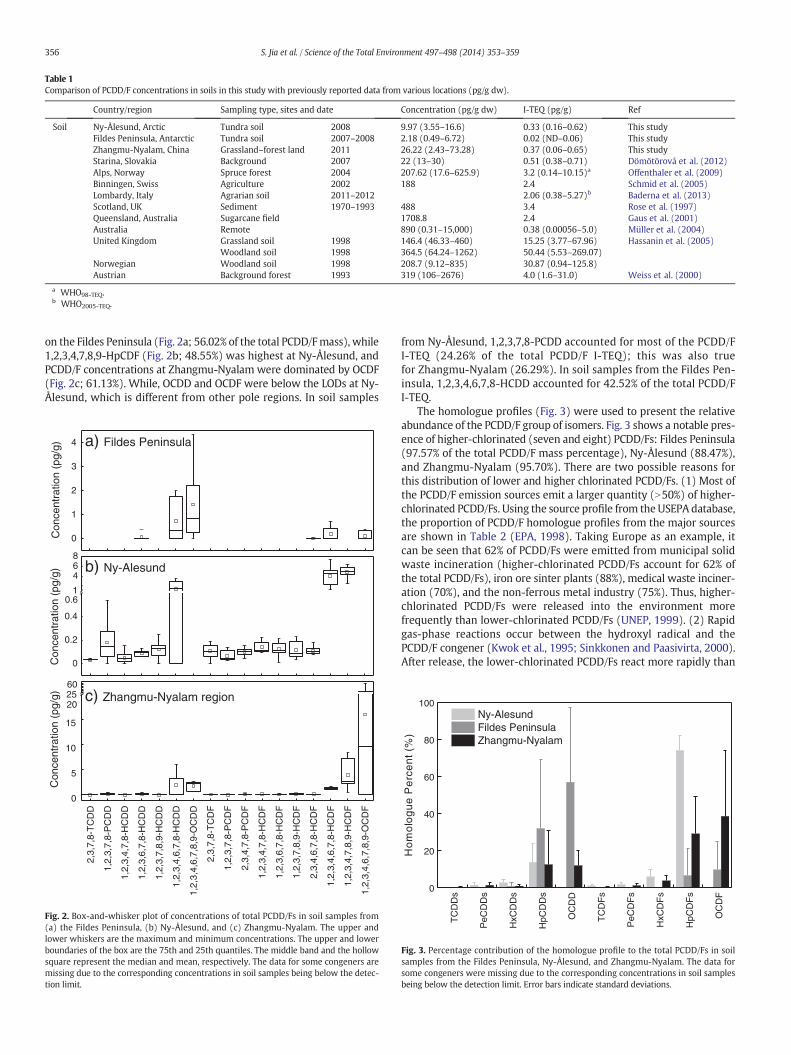
Table 1Comparison of PCDD/F concentrations in soils in this study with previously reported data from various locations (pg/g dw).
Country/region Sampling type, sites and date Concentration (pg/g dw) I-TEQ (pg/g) Ref
Soil Ny-Ålesund, Arctic Tundra soil 2008 9.97 (3.55–16.6) 0.33 (0.16–0.62) This studyFildes Peninsula, Antarctic Tundra soil 2007–2008 2.18 (0.49–6.72) 0.02 (ND–0.06) This studyZhangmu-Nyalam, China Grassland–forest land 2011 26.22 (2.43–73.28) 0.37 (0.06–0.65) This studyStarina, Slovakia Background 2007 22 (13–30) 0.51 (0.38–0.71) Dömötörová et al. (2012)Alps, Norway Spruce forest 2004 207.62 (17.6–625.9) 3.2 (0.14–10.15)a Offenthaler et al. (2009)Binningen, Swiss Agriculture 2002 188 2.4 Schmid et al. (2005)Lombardy, Italy Agrarian soil 2011–2012 2.06 (0.38–5.27)b Baderna et al. (2013)Scotland, UK Sediment 1970–1993 488 3.4 Rose et al. (1997)Queensland, Australia Sugarcane field 1708.8 2.4 Gaus et al. (2001)Australia Remote 890 (0.31–15,000) 0.38 (0.00056–5.0) Müller et al. (2004)United Kingdom Grassland soil 1998 146.4 (46.33–460) 15.25 (3.77–67.96) Hassanin et al. (2005)
Woodland soil 1998 364.5 (64.24–1262) 50.44 (5.53–269.07)Norwegian Woodland soil 1998 208.7 (9.12–835) 30.87 (0.94–125.8)Austrian Background forest 1993 319 (106–2676) 4.0 (1.6–31.0) Weiss et al. (2000)
a WHO98-TEQ.b WHO2005-TEQ.
356 S. Jia et al. / Science of the Total Environment 497–498 (2014) 353–359
on the Fildes Peninsula (Fig. 2a; 56.02% of the total PCDD/Fmass), while1,2,3,4,7,8,9-HpCDF (Fig. 2b; 48.55%) was highest at Ny-Ålesund, andPCDD/F concentrations at Zhangmu-Nyalam were dominated by OCDF(Fig. 2c; 61.13%). While, OCDD and OCDF were below the LODs at Ny-Ålesund, which is different from other pole regions. In soil samples
0.0
0.2
0.4
468
b) Ny-Alesund
1
Con
cent
ratio
n (p
g/g)
0.6
2,3,
7,8-
TC
DD
1,2,
3,7,
8-P
CD
D
1,2,
3,4,
7,8-
HC
DD
1,2,
3,6,
7,8-
HC
DD
1,2,
3,7,
8,9-
HC
DD
1,2,
3,4,
6,7,
8-H
CD
D
1,2,
3,4,
6,7,
8,9-
OC
DD
2,3,
7,8-
TC
DF
1,2,
3,7,
8-P
CD
F
2,3,
4,7,
8-P
CD
F
1,2,
3,4,
7,8-
HC
DF
1,2,
3,6,
7,8-
HC
DF
1,2,
3,7,
8,9-
HC
DF
2,3,
4,6,
7,8-
HC
DF
1,2,
3,4,
6,7,
8-H
CD
F
1,2,
3,4,
7,8,
9-H
CD
F
1,2,
3,4,
6,7,
8,9-
OC
DF
0
5
10
15
c) Zhangmu-Nyalam region
Con
cent
ratio
n (p
g/g)
602520
0
1
2
3
4 a) Fildes Peninsula
Con
cent
ratio
n (p
g/g)
Fig. 2. Box-and-whisker plot of concentrations of total PCDD/Fs in soil samples from(a) the Fildes Peninsula, (b) Ny-Ålesund, and (c) Zhangmu-Nyalam. The upper andlower whiskers are the maximum and minimum concentrations. The upper and lowerboundaries of the box are the 75th and 25th quantiles. The middle band and the hollowsquare represent the median and mean, respectively. The data for some congeners aremissing due to the corresponding concentrations in soil samples being below the detec-tion limit.
from Ny-Ålesund, 1,2,3,7,8-PCDD accounted for most of the PCDD/FI-TEQ (24.26% of the total PCDD/F I-TEQ); this was also truefor Zhangmu-Nyalam (26.29%). In soil samples from the Fildes Pen-insula, 1,2,3,4,6,7,8-HCDD accounted for 42.52% of the total PCDD/FI-TEQ.
The homologue profiles (Fig. 3) were used to present the relativeabundance of the PCDD/F group of isomers. Fig. 3 shows a notable pres-ence of higher-chlorinated (seven and eight) PCDD/Fs: Fildes Peninsula(97.57% of the total PCDD/F mass percentage), Ny-Ålesund (88.47%),and Zhangmu-Nyalam (95.70%). There are two possible reasons forthis distribution of lower and higher chlorinated PCDD/Fs. (1) Most ofthe PCDD/F emission sources emit a larger quantity (N50%) of higher-chlorinated PCDD/Fs. Using the source profile from the USEPA database,the proportion of PCDD/F homologue profiles from the major sourcesare shown in Table 2 (EPA, 1998). Taking Europe as an example, itcan be seen that 62% of PCDD/Fs were emitted from municipal solidwaste incineration (higher-chlorinated PCDD/Fs account for 62% ofthe total PCDD/Fs), iron ore sinter plants (88%), medical waste inciner-ation (70%), and the non-ferrous metal industry (75%). Thus, higher-chlorinated PCDD/Fs were released into the environment morefrequently than lower-chlorinated PCDD/Fs (UNEP, 1999). (2) Rapidgas-phase reactions occur between the hydroxyl radical and thePCDD/F congener (Kwok et al., 1995; Sinkkonen and Paasivirta, 2000).After release, the lower-chlorinated PCDD/Fs react more rapidly than
TC
DD
s
PeC
DD
s
HxC
DD
s
HpC
DD
s
OC
DD
TC
DF
s
PeC
DF
s
HxC
DF
s
HpC
DF
s
OC
DF
0
20
40
60
80
100
)%(
tn
ecre
Pe
ug
olo
mo
H
Ny-AlesundFildes PeninsulaZhangmu-Nyalam
Fig. 3. Percentage contribution of the homologue profile to the total PCDD/Fs in soilsamples from the Fildes Peninsula, Ny-Ålesund, and Zhangmu-Nyalam. The data forsome congeners were missing due to the corresponding concentrations in soil samplesbeing below the detection limit. Error bars indicate standard deviations.
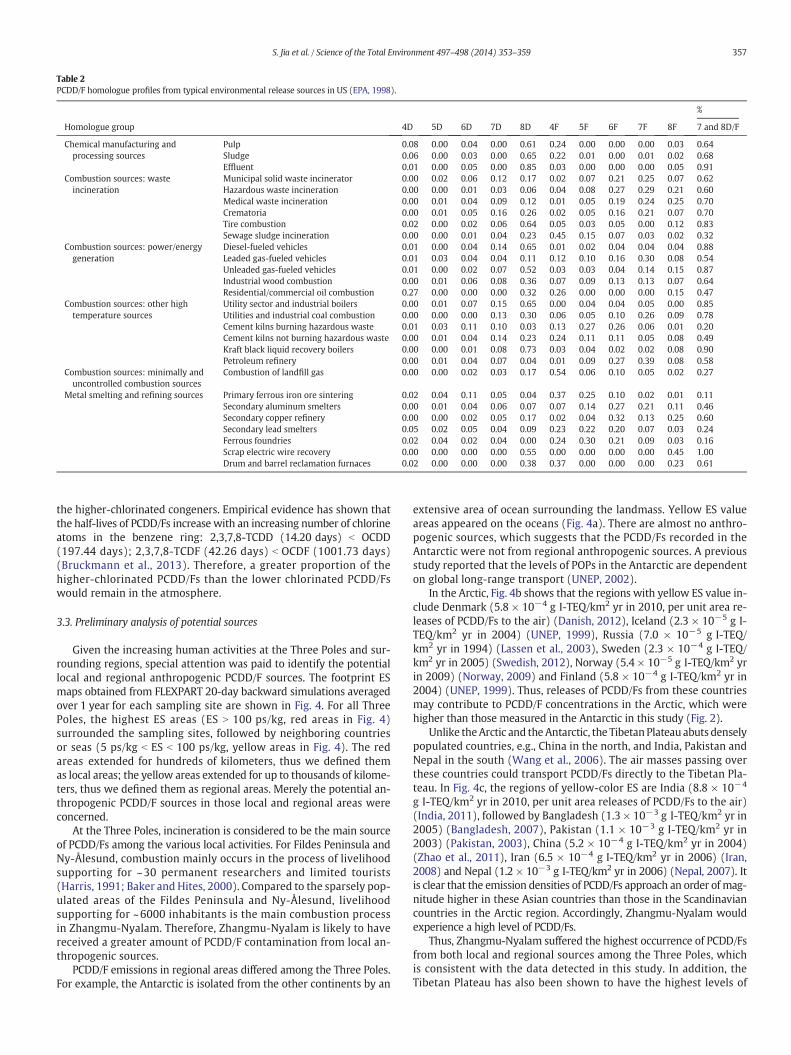
Table 2PCDD/F homologue profiles from typical environmental release sources in US (EPA, 1998).
%
Homologue group 4D 5D 6D 7D 8D 4F 5F 6F 7F 8F 7 and 8D/F
Chemical manufacturing andprocessing sources
Pulp 0.08 0.00 0.04 0.00 0.61 0.24 0.00 0.00 0.00 0.03 0.64Sludge 0.06 0.00 0.03 0.00 0.65 0.22 0.01 0.00 0.01 0.02 0.68Effluent 0.01 0.00 0.05 0.00 0.85 0.03 0.00 0.00 0.00 0.05 0.91
Combustion sources: wasteincineration
Municipal solid waste incinerator 0.00 0.02 0.06 0.12 0.17 0.02 0.07 0.21 0.25 0.07 0.62Hazardous waste incineration 0.00 0.00 0.01 0.03 0.06 0.04 0.08 0.27 0.29 0.21 0.60Medical waste incineration 0.00 0.01 0.04 0.09 0.12 0.01 0.05 0.19 0.24 0.25 0.70Crematoria 0.00 0.01 0.05 0.16 0.26 0.02 0.05 0.16 0.21 0.07 0.70Tire combustion 0.02 0.00 0.02 0.06 0.64 0.05 0.03 0.05 0.00 0.12 0.83Sewage sludge incineration 0.00 0.00 0.01 0.04 0.23 0.45 0.15 0.07 0.03 0.02 0.32
Combustion sources: power/energygeneration
Diesel-fueled vehicles 0.01 0.00 0.04 0.14 0.65 0.01 0.02 0.04 0.04 0.04 0.88Leaded gas-fueled vehicles 0.01 0.03 0.04 0.04 0.11 0.12 0.10 0.16 0.30 0.08 0.54Unleaded gas-fueled vehicles 0.01 0.00 0.02 0.07 0.52 0.03 0.03 0.04 0.14 0.15 0.87Industrial wood combustion 0.00 0.01 0.06 0.08 0.36 0.07 0.09 0.13 0.13 0.07 0.64Residential/commercial oil combustion 0.27 0.00 0.00 0.00 0.32 0.26 0.00 0.00 0.00 0.15 0.47
Combustion sources: other hightemperature sources
Utility sector and industrial boilers 0.00 0.01 0.07 0.15 0.65 0.00 0.04 0.04 0.05 0.00 0.85Utilities and industrial coal combustion 0.00 0.00 0.00 0.13 0.30 0.06 0.05 0.10 0.26 0.09 0.78Cement kilns burning hazardous waste 0.01 0.03 0.11 0.10 0.03 0.13 0.27 0.26 0.06 0.01 0.20Cement kilns not burning hazardous waste 0.00 0.01 0.04 0.14 0.23 0.24 0.11 0.11 0.05 0.08 0.49Kraft black liquid recovery boilers 0.00 0.00 0.01 0.08 0.73 0.03 0.04 0.02 0.02 0.08 0.90Petroleum refinery 0.00 0.01 0.04 0.07 0.04 0.01 0.09 0.27 0.39 0.08 0.58
Combustion sources: minimally anduncontrolled combustion sources
Combustion of landfill gas 0.00 0.00 0.02 0.03 0.17 0.54 0.06 0.10 0.05 0.02 0.27
Metal smelting and refining sources Primary ferrous iron ore sintering 0.02 0.04 0.11 0.05 0.04 0.37 0.25 0.10 0.02 0.01 0.11Secondary aluminum smelters 0.00 0.01 0.04 0.06 0.07 0.07 0.14 0.27 0.21 0.11 0.46Secondary copper refinery 0.00 0.00 0.02 0.05 0.17 0.02 0.04 0.32 0.13 0.25 0.60Secondary lead smelters 0.05 0.02 0.05 0.04 0.09 0.23 0.22 0.20 0.07 0.03 0.24Ferrous foundries 0.02 0.04 0.02 0.04 0.00 0.24 0.30 0.21 0.09 0.03 0.16Scrap electric wire recovery 0.00 0.00 0.00 0.00 0.55 0.00 0.00 0.00 0.00 0.45 1.00Drum and barrel reclamation furnaces 0.02 0.00 0.00 0.00 0.38 0.37 0.00 0.00 0.00 0.23 0.61
357S. Jia et al. / Science of the Total Environment 497–498 (2014) 353–359
the higher-chlorinated congeners. Empirical evidence has shown thatthe half-lives of PCDD/Fs increase with an increasing number of chlorineatoms in the benzene ring: 2,3,7,8-TCDD (14.20 days) b OCDD(197.44 days); 2,3,7,8-TCDF (42.26 days) b OCDF (1001.73 days)(Bruckmann et al., 2013). Therefore, a greater proportion of thehigher-chlorinated PCDD/Fs than the lower chlorinated PCDD/Fswould remain in the atmosphere.
3.3. Preliminary analysis of potential sources
Given the increasing human activities at the Three Poles and sur-rounding regions, special attention was paid to identify the potentiallocal and regional anthropogenic PCDD/F sources. The footprint ESmaps obtained from FLEXPART 20-day backward simulations averagedover 1 year for each sampling site are shown in Fig. 4. For all ThreePoles, the highest ES areas (ES N 100 ps/kg, red areas in Fig. 4)surrounded the sampling sites, followed by neighboring countriesor seas (5 ps/kg b ES b 100 ps/kg, yellow areas in Fig. 4). The redareas extended for hundreds of kilometers, thus we defined themas local areas; the yellow areas extended for up to thousands of kilome-ters, thus we defined them as regional areas. Merely the potential an-thropogenic PCDD/F sources in those local and regional areas wereconcerned.
At the Three Poles, incineration is considered to be the main sourceof PCDD/Fs among the various local activities. For Fildes Peninsula andNy-Ålesund, combustion mainly occurs in the process of livelihoodsupporting for ~30 permanent researchers and limited tourists(Harris, 1991; Baker and Hites, 2000). Compared to the sparsely pop-ulated areas of the Fildes Peninsula and Ny-Ålesund, livelihoodsupporting for ~6000 inhabitants is the main combustion processin Zhangmu-Nyalam. Therefore, Zhangmu-Nyalam is likely to havereceived a greater amount of PCDD/F contamination from local an-thropogenic sources.
PCDD/F emissions in regional areas differed among the Three Poles.For example, the Antarctic is isolated from the other continents by an
extensive area of ocean surrounding the landmass. Yellow ES valueareas appeared on the oceans (Fig. 4a). There are almost no anthro-pogenic sources, which suggests that the PCDD/Fs recorded in theAntarctic were not from regional anthropogenic sources. A previousstudy reported that the levels of POPs in the Antarctic are dependenton global long-range transport (UNEP, 2002).
In the Arctic, Fig. 4b shows that the regions with yellow ES value in-clude Denmark (5.8 × 10⁻⁴ g I-TEQ/km2 yr in 2010, per unit area re-leases of PCDD/Fs to the air) (Danish, 2012), Iceland (2.3 × 10⁻⁵ g I-TEQ/km2 yr in 2004) (UNEP, 1999), Russia (7.0 × 10⁻⁵ g I-TEQ/km2 yr in 1994) (Lassen et al., 2003), Sweden (2.3 × 10⁻⁴ g I-TEQ/km2 yr in 2005) (Swedish, 2012), Norway (5.4 × 10⁻⁵ g I-TEQ/km2 yrin 2009) (Norway, 2009) and Finland (5.8 × 10⁻⁴ g I-TEQ/km2 yr in2004) (UNEP, 1999). Thus, releases of PCDD/Fs from these countriesmay contribute to PCDD/F concentrations in the Arctic, which werehigher than those measured in the Antarctic in this study (Fig. 2).
Unlike theArctic and theAntarctic, the Tibetan Plateau abuts denselypopulated countries, e.g., China in the north, and India, Pakistan andNepal in the south (Wang et al., 2006). The air masses passing overthese countries could transport PCDD/Fs directly to the Tibetan Pla-teau. In Fig. 4c, the regions of yellow-color ES are India (8.8 × 10⁻⁴
g I-TEQ/km2 yr in 2010, per unit area releases of PCDD/Fs to the air)(India, 2011), followed by Bangladesh (1.3 × 10⁻³ g I-TEQ/km2 yr in2005) (Bangladesh, 2007), Pakistan (1.1 × 10⁻³ g I-TEQ/km2 yr in2003) (Pakistan, 2003), China (5.2 × 10⁻⁴ g I-TEQ/km2 yr in 2004)(Zhao et al., 2011), Iran (6.5 × 10⁻⁴ g I-TEQ/km2 yr in 2006) (Iran,2008) and Nepal (1.2 × 10⁻³ g I-TEQ/km2 yr in 2006) (Nepal, 2007). Itis clear that the emission densities of PCDD/Fs approach an order of mag-nitude higher in these Asian countries than those in the Scandinaviancountries in the Arctic region. Accordingly, Zhangmu-Nyalam wouldexperience a high level of PCDD/Fs.
Thus, Zhangmu-Nyalam suffered the highest occurrence of PCDD/Fsfrom both local and regional sources among the Three Poles, whichis consistent with the data detected in this study. In addition, theTibetan Plateau has also been shown to have the highest levels of
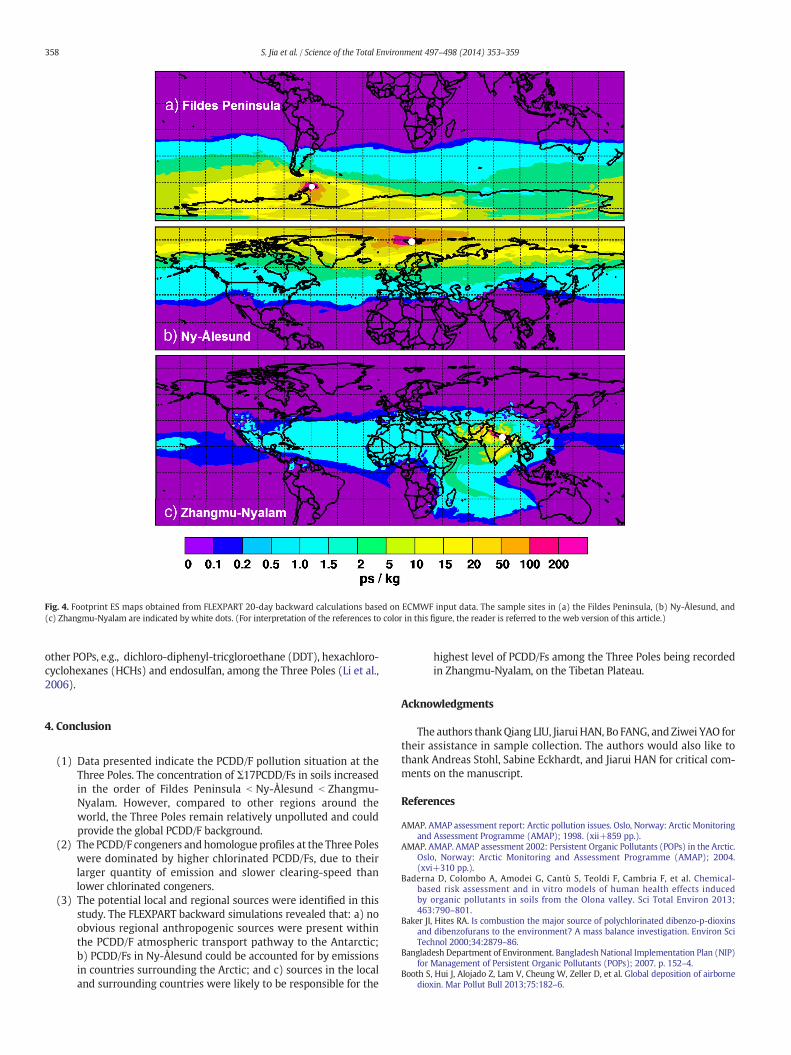
Fig. 4. Footprint ES maps obtained from FLEXPART 20-day backward calculations based on ECMWF input data. The sample sites in (a) the Fildes Peninsula, (b) Ny-Ålesund, and(c) Zhangmu-Nyalam are indicated by white dots. (For interpretation of the references to color in this figure, the reader is referred to the web version of this article.)
358 S. Jia et al. / Science of the Total Environment 497–498 (2014) 353–359
other POPs, e.g., dichloro-diphenyl-tricgloroethane (DDT), hexachloro-cyclohexanes (HCHs) and endosulfan, among the Three Poles (Li et al.,2006).
4. Conclusion
(1) Data presented indicate the PCDD/F pollution situation at theThree Poles. The concentration of Σ17PCDD/Fs in soils increasedin the order of Fildes Peninsula b Ny-Ålesund b Zhangmu-Nyalam. However, compared to other regions around theworld, the Three Poles remain relatively unpolluted and couldprovide the global PCDD/F background.
(2) The PCDD/F congeners and homologue profiles at the Three Poleswere dominated by higher chlorinated PCDD/Fs, due to theirlarger quantity of emission and slower clearing-speed thanlower chlorinated congeners.
(3) The potential local and regional sources were identified in thisstudy. The FLEXPART backward simulations revealed that: a) noobvious regional anthropogenic sources were present withinthe PCDD/F atmospheric transport pathway to the Antarctic;b) PCDD/Fs in Ny-Ålesund could be accounted for by emissionsin countries surrounding the Arctic; and c) sources in the localand surrounding countries were likely to be responsible for the
highest level of PCDD/Fs among the Three Poles being recordedin Zhangmu-Nyalam, on the Tibetan Plateau.
Acknowledgments
The authors thankQiang LIU, Jiarui HAN, Bo FANG, andZiwei YAO fortheir assistance in sample collection. The authors would also like tothank Andreas Stohl, Sabine Eckhardt, and Jiarui HAN for critical com-ments on the manuscript.
References
AMAP. AMAP assessment report: Arctic pollution issues. Oslo, Norway: Arctic Monitoringand Assessment Programme (AMAP); 1998. (xii+859 pp.).
AMAP. AMAP. AMAP assessment 2002: Persistent Organic Pollutants (POPs) in the Arctic.Oslo, Norway: Arctic Monitoring and Assessment Programme (AMAP); 2004.(xvi+310 pp.).
Baderna D, Colombo A, Amodei G, Cantù S, Teoldi F, Cambria F, et al. Chemical-based risk assessment and in vitro models of human health effects inducedby organic pollutants in soils from the Olona valley. Sci Total Environ 2013;463:790–801.
Baker JI, Hites RA. Is combustion the major source of polychlorinated dibenzo-p-dioxinsand dibenzofurans to the environment? A mass balance investigation. Environ SciTechnol 2000;34:2879–86.
Bangladesh Department of Environment. Bangladesh National Implementation Plan (NIP)for Management of Persistent Organic Pollutants (POPs); 2007. p. 152–4.
Booth S, Hui J, Alojado Z, Lam V, Cheung W, Zeller D, et al. Global deposition of airbornedioxin. Mar Pollut Bull 2013;75:182–6.
359S. Jia et al. / Science of the Total Environment 497–498 (2014) 353–359
Bruckmann P, Hiester E, Klees M, Zetzsch C. Trends of PCDD/F and PCB concentrations anddepositions in ambient air in Northwestern Germany. Chemosphere 2013;93:1471–8.
Carballeira A, Fernandez JA, Aboal JR, Real C, Couto JA. Moss: a powerful tool for dioxinmonitoring. Atmos Environ 2006;40:5776–86.
Corsolini S, Borghesi N, Schiamone A, Focardi S. Polybrominated diphenyl ethers,polychlorinated dibenzo-dioxins, -furans, and -biphenyls in three species of antarcticpenguins. Environ Sci Pollut Res 2007;14:421–9.
Danish EPA. Updated national implementation plan for the Stockholm Convention onpersistent organic pollutants, Danish EPA, Copenhagen K. Denmark; 2012. p. 58–9.
Dömötörová M, Stachová Sejáková Z, Kočan A, Čonka K, Chovancová J, Fabišiková A.PCDDs, PCDFs, dioxin-like PCBs and indicator PCBs in soil from five selected areasin Slovakia. Chemosphere 2012;89:480–5.
Eckhardt S, Breivik K, Li Y, Manø S, Stohl A. Source regions of some persistent organic pol-lutants measured in the atmosphere at Birkenes, Norway. Atmos Chem Phys 2009;9:6597–610.
EPA U.S. Database of sources of environmental releases of dioxin-like compounds in theUnited States. Washington, DC: The Office of Research and Development, U.S. Envi-ronmental Protection Agency; 1998.
EPA U.S. Tetra- through Octa-Chlorinated Dioxins and Furans by Isotope DilutionHRGC/HRMS. Washington, DC: The Office of Water Engineering and Analysis Di-vision, US Environmental Protection Agency; 1994.
Gaus C, Päpke O, Dennison N, Haynes D, Shaw GR, Connell DW, et al. Evidence for thepresence of a widespread PCDD source in coastal sediments and soils from Queens-land, Australia. Chemosphere 2001;43:549–58.
Hale RC, La Guardia MJ, Harvey E, Gaylor MO, Mainor TM. Brominated flame retardantconcentrations and trends in abiotic media. Chemosphere 2006;64:181–6.
Harner T, Green NJL, Jones KC. Measurements of octanol–air partition coefficients forPCDD/Fs: a tool in assessing air–soil equilibrium status. Environ Sci Technol 2000;34:3109–14.
Harris CM. Environmental effects of human activities on King George Island, SouthShetland Islands, Antarctica. Polar Rec. 1991;27:193–204.
Hassanin A, Lee RGM, Steinnes E, Jones KC. PCDD/Fs in Norwegian and U.K. Soils:implications for sources and environmental cycling. Environ Sci Technol 2005;39:4784–92.
http://chm.pops.int/TheConvention/ThePOPs/ListingofPOPs/tabid/2509/Default.aspx.[Stockholm Convention on Persistent Organic Pollutants].
Hung H, Blanchard P, Poole G, Thibert B, Chiu C. Measurement of particle-boundpolychlorinated dibenzo-p-dioxins and dibenzofurans (PCDD/Fs) in Arctic air atAlert, Nunavut, Canada. Atmos Environ 2002;36:1041–50.
India National Implementation Plan Development Team National Implementation PlanStockholm Convention on Persistent Organic Pollutants; 2011. p. 93–4.
Iran Department of the Environment. National Implementation Plan for the StockholmConvention on Persistent Organic Pollutants of Iran; 2008. p. 47–8.
Kwok ESC, Atkinson R, Arey J. Rate constants for the gas-phase reactions of the OH radicalwith dichlorobiphenyls, 1-chlorodibenzo-p-dioxin, 1,2-dimethoxybenzene, anddiphenyl ether — estimation of OH radical reaction-rate constants for PCBs, PCDDs,and PCDFs. Environ Sci Technol 1995;29:1591–8.
Lassen C, Hansen E, Jensen AA, Olendrzyński K, Kolsut W, Żurek J, et al. Survey of dioxinsources in the baltic region extended summary. Environ Sci Pollut Res 2003;10:49–56.
Li J, Zhu T,Wang F, Qiu X, LinW. Observation of organochlorine pesticides in the air of theMt. Everest region. Ecotoxicol Environ Saf 2006;63:33–41.
Meyer T, Wania F, Breivik K. Illustrating sensitivity and uncertainty in environmental fatemodels using partitioning maps. Environ Sci Technol 2005;39:3186–96.
Müller J, Muller R, Goudkamp K, Shaw M, Mortimer M, Haynes D, et al. Dioxins in soil inAustralia: part B. Australia: Department of the Environment and Heritage; 2004(Technical Report No. 5, 16 pp.).
Nepal Ministry of Environment, Science and Technology. Nepal National ImplementationPlan (NIP) for Stockholm Convention on Persistent Organic Pollutants (POPs). Nepal:Kathmandu; 2007. p. 52–3.
Norway Climate and Pollution Agency and Food Safety Authority. Norwegian Implemen-tation Plan for the Stockholm Convention on Persistent Organic Pollutants (POPs),Norway; 2009. p. 42–3.
Offenthaler I, Bassan R, Belis C, Jakobi G, Kirchner M, Krauchi N, et al. PCDD/F and PCB inspruce forests of the Alps. Environ Pollut 2009;157:3280–9.
Pakistan Ministry of Environment. National Implementation Plan (NIP) for phasing outand elimination of POPs from Pakistan under Stockholm Convention article 7 (a). Pa-kistan: Islamabad; 2003. p. 67–8.
Pan J, Yang Y, Zhu X, Yeung LWY, Taniyasu S, Miyake Y, et al. Altitudinal distributions ofPCDD/Fs, dioxin-like PCBs and PCNs in soil and yak samples from Wolong highmountain area, eastern Tibet-Qinghai Plateau, China. Sci Total Environ 2013;444:102–9.
Piazza R, Gambaro A, Argiriadis E, Vecchiato M, Zambon S, Cescon P, et al. Development ofa method for simultaneous analysis of PCDDs, PCDFs, PCBs, PBDEs, PCNs and PAHs inAntarctic air. Anal Bioanal Chem 2013;405:917–32.
Pienitz R, Douglas MS, Smol JP. Long-term environmental change in Arctic and Antarcticlakes. vol. 8. Dordrecht, Germany: Springer; 2004.
Rose CL, Rose NL, Harlock S, Fernandes A. An historical record of polychlorinated dibenzo-p-dioxin (PCDD) and polychlorinated dibenzofuran (PCDF) deposition to a remotelake site in north-west Scotland, UK. Sci Total Environ 1997;198:161–73.
Savinov V, Muir DCG, Svetochev V, Svetocheva O, Belikov S, Boltunov A, et al. Persistentorganic pollutants in ringed seals from the Russian Arctic. Sci Total Environ 2011;409:2734–45.
Schmid P, Gujer E, Zennegg M, Bucheli TD, Desaules A. Correlation of PCDD/F and PCBconcentrations in soil samples from the Swiss soil monitoring network (NABO) tospecific parameters of the observation sites. Chemosphere 2005;58:227–34.
Seibert P, Frank A. Source–receptor matrix calculation with a Lagrangian particle disper-sion model in backward mode. Atmos Chem Phys 2004;4:51–63.
Sinkkonen S, Paasivirta J. Degradation half-life times of PCDDs, PCDFs and PCBs forenvironmental fate modeling. Chemosphere 2000;40:943–9.
Stohl A, Hittenberger M, Wotawa G. Validation of the Lagrangian particle dispersionmodel FLEXPART against large-scale tracer experiment data. Atmos Environ 1998;32:4245–64.
Stohl A, Forster C, Eckhardt S, Spichtinger N, Huntrieser H, Heland J, et al. A backwardmodeling study of intercontinental pollution transport using aircraft measurements.J Geophys Res Atmos 2003;108:4370.
Stohl A, Forster C, Frank A, Seibert P, Wotawa G. Technical note: the Lagrangian particledispersion model FLEXPART version 6.2. Atmos Chem Phys 2005;5:2461–74.
Swedish Environmental Protection Agency. National Implementation Plan for theStockholm Convention on Persistent Organic Pollutants for Sweden. Sweden: Stock-holm; 2012. p. 68–9.
UNEP. Antarctic regional report: regionally based assessment of persistent toxic sub-stances, Global Environment Facility; 2002.
UNEP Chemicals. Dioxin and furan inventories: national and regional emissions of PCDD/PCDF. Switzerland: Geneva; 1999.
USEPA. Exposure and human health reassessment of 2,3,7,8-tetrachlorodibenzo-p-dioxinand related compounds. Draft final, Washington (DC): National Center for Environ-mental Assessment; 2000.
Wagrowski DM, Hites RA. Partitioning of polychlorinated dibenzo-p-dioxins and dibenzo-furans between the atmosphere and corn. Environ Sci Technol 1998;32:2389–93.
Wang X, Yao T, Cong Z, Yan X, Kang S, Zhang Y. Gradient distribution of persistent organiccontaminants along northern slope of central-Himalayas, China. Sci Total Environ2006;372:193–202.
Wania F. Assessing the potential of persistent organic chemicals for long-range transportand accumulation in Polar regions. Environ Sci Technol 2003;37:1344–51.
Wania F, Mackay D. Global fractionation and cold condensation of low volatility organo-chlorine compounds in Polar-regions. Ambio 1993;22:10–8.
Weiss P, Lorbeer G, Scharf S. Regional aspects and statistical characterisation of the loadwith semivolatile organic compounds at remote Austrian forest sites. Chemosphere2000;40:1159–71.
Wikoff D, Fitzgerald L, Birnbaum L. Persistent organic pollutants: an overview. Dioxinsand health. John Wiley & Sons, Inc.; 2012. p. 1–35.
Zhao B, Zheng M, Jiang G. Dioxin emissions and human exposure in China: a brief historyof policy and research. Environ Health Perspect 2011;119:a112–3.
Recommended