TOYOTA IN THE WORLD 20092
Company Outline
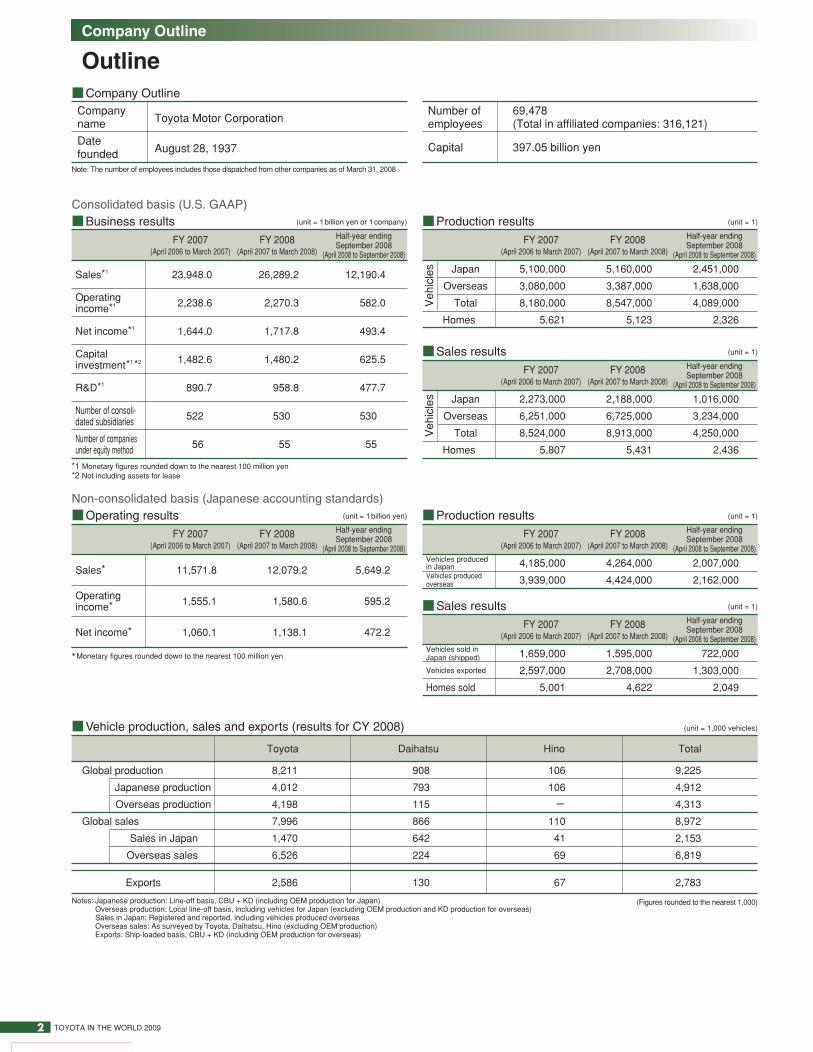
Outline■Company OutlineCompany
Toyota Motor CorporationnameDate
August 28, 1937founded
Consolidated basis (U.S. GAAP)■Business results
■Operating resultsNon-consolidated basis (Japanese accounting standards)
23,948.0
2,238.6
1,644.0
1,482.6
890.7
522
56
26,289.2
2,270.3
1,717.8
1,480.2
958.8
530
55
12,190.4
582.0
493.4
625.5
477.7
530
55
FY 2007(April 2006 to March 2007)
FY 2008(April 2007 to March 2008)
Half-year endingSeptember 2008
(April 2008 to September 2008)
Sales*1
Operatingincome*1
Net income*1
Capitalinvestment*1*2
R&D*1
Number of consoli-dated subsidiaries
Number of companies under equity method
11,571.8 12,079.2 5,649.2
1,555.1 1,580.6 595.2
1,060.1 1,138.1 472.2
FY 2007(April 2006 to March 2007)
FY 2008(April 2007 to March 2008)
Half-year endingSeptember 2008
(April 2008 to September 2008)
Sales*
Operatingincome*
Net income*
■Production results
5,100,000 5,160,000 2,451,000
3,080,000 3,387,000 1,638,000
8,180,000 8,547,000 4,089,000
5,621 5,123 2,326
FY 2007(April 2006 to March 2007)
FY 2008(April 2007 to March 2008)
Half-year endingSeptember 2008
(April 2008 to September 2008)
Japan
Overseas
TotalVehicles
Homes
(unit = 1billion yen or 1company) (unit = 1)
(unit = 1billion yen)
■Vehicle production, sales and exports (results for CY 2008) (unit = 1,000 vehicles)
Notes: Japanese production: Line-off basis, CBU + KD (including OEM production for Japan)Overseas production: Local line-off basis, including vehicles for Japan (excluding OEM production and KD production for overseas)Sales in Japan: Registered and reported, including vehicles produced overseasOverseas sales: As surveyed by Toyota, Daihatsu, Hino (excluding OEM production)Exports: Ship-loaded basis, CBU + KD (including OEM production for overseas)
Toyota Daihatsu Hino Total
8,211 908 106 9,225
4,012 793 106 4,912
4,198 115 ー 4,313
7,996 866 110 8,972
1,470 642 41 2,153
6,526 224 69 6,819
2,586 130 67 2,783Exports
Global production
Japanese production
Overseas production
Global sales
Sales in Japan
Overseas sales
■Production results
4,185,000 4,264,000 2,007,000
3,939,000 4,424,000 2,162,000
FY 2007(April 2006 to March 2007)
FY 2008(April 2007 to March 2008)
Half-year endingSeptember 2008
(April 2008 to September 2008)Vehicles producedin JapanVehicles producedoverseas
■Sales results
1,659,000 1,595,000 722,000
2,597,000 2,708,000 1,303,000
5,001 4,622 2,049
FY 2007(April 2006 to March 2007)
FY 2008(April 2007 to March 2008)
Half-year endingSeptember 2008
(April 2008 to September 2008)Vehicles sold inJapan (shipped)
Vehicles exported
Homes sold
■Sales results
2,273,000 2,188,000 1,016,000
6,251,000 6,725,000 3,234,000
8,524,000 8,913,000 4,250,000
5,807 5,431 2,436
FY 2007(April 2006 to March 2007)
FY 2008(April 2007 to March 2008)
Half-year endingSeptember 2008
(April 2008 to September 2008)
Japan
Overseas
TotalVehicles
Homes*1 Monetary figures rounded down to the nearest 100 million yen*2 Not including assets for lease
*Monetary figures rounded down to the nearest 100 million yen
Note: The number of employees includes those dispatched from other companies as of March 31, 2008
Number of 69,478employees (Total in affiliated companies: 316,121)
Capital 397.05 billion yen
(Figures rounded to the nearest 1,000)
(unit = 1)
(unit = 1)
(unit = 1)
Recommended