Lora D. Delwiche and Susan J. Slaughter
From the authors of The Little SAS® Book: A Primer, Fourth Edition
Coming to SAS® from
SPSS
A ProgrammingApproach
The correct bibliographic citation for this manual is as follows: Delwiche, Lora D., and Susan J. Slaughter. 2009. Coming to SAS® from SPSS: A Programming Approach. Cary, NC: SAS Institute Inc.
Coming to SAS® from SPSS: A Programming Approach
Copyright © 2009, SAS Institute Inc., Cary, NC, USA
ISBN 978-1-60764-036-3
All rights reserved. Produced in the United States of America.
For a hard-copy book: No part of this publication may be reproduced, stored in a retrieval system, or transmitted, in any form or by any means, electronic, mechanical, photocopying, or otherwise, without the prior written permission of the publisher, SAS Institute Inc.
For a Web download or e-book: Your use of this publication shall be governed by the terms established by the vendor at the time you acquire this publication.
U.S. Government Restricted Rights Notice: Use, duplication, or disclosure of this software and related documentation by the U.S. government is subject to the Agreement with SAS Institute and the restrictions set forth in FAR 52.227-19, Commercial Computer Software-Restricted Rights (June 1987).
SAS Institute Inc., SAS Campus Drive, Cary, North Carolina 27513.
1st electronic book, February 2009 SAS® Publishing provides a complete selection of books and electronic products to help customers use SAS software to its fullest potential. For more information about our e-books, e-learning products, CDs, and hard-copy books, visit the SAS Publishing Web site at support.sas.com/publishing or call 1-800-727-3228.
SAS® and all other SAS Institute Inc. product or service names are registered trademarks or trademarks of SAS Institute Inc. in the USA and other countries. ® indicates USA registration.
Other brand and product names are registered trademarks or trademarks of their respective companies.
"Coming to SAS from SPSS: A Programming Approach" published by SAS Institute Inc. Copyright © 2009, SAS Institute Inc., Cary, North Carolina, USA. All Rights Reserved. For additional SAS resources, visit support.sas.com/publishing.
Coming to SAS® from SPSS A Programming Approach
by Lora D. Delwiche and Susan J. Slaughter
From the authors of The Little SAS®
Book: A Primer, Fourth Edition
Table of Contents
Introduction 1 Terminology 2 Windows in SAS and SPSS 3 Syntax and Output in SAS and SPSS 5 Getting SPSS Data Files into SAS Using a LIBNAME Statement 11 Getting SPSS Data Files into SAS Using PROC IMPORT 13 Creating SAS User-Defined Formats 15 Grouping Data in Procedures with SAS User-Defined Formats 18 Using SAS Statements to Create Output in HTML, PDF, or RTF Format 19 Producing Statistical Analyses with Graphics 21 Example Code and Data 25
Introduction
More often than not, the first question asked by people who know SPSS and want to learn SAS is, “How do the two software packages compare?” No simple answer is possible since both products are continually evolving, with new releases introducing new capabilities. Nonetheless, general comparisons can be drawn.
SAS and SPSS are very similar. Compared to other statistical software, these two products are similar because they each offer a programming language. Compared to other computer languages such as C++, SAS and SPSS are similar because they both have powerful, built-in data handling and statistical capabilities.
Some SPSS users may not even know that SPSS has a programming language since many SPSS users use only the SPSS point-and-click interface. If you are one of these people, then you will be glad to know that SAS also has a point-and-click interface, named SAS Enterprise Guide. SAS Enterprise Guide is provided at no extra charge with Base SAS for Windows. You can write and run SAS programs in SAS Enterprise Guide. However, this document focuses on the use of SAS programs in the SAS windowing environment.
Despite their fundamental similarities, SAS and SPSS have different styles. SAS offers more features. Consider the fact that SPSS offers over 100 functions, SAS over 1,000. More features mean more power to get exactly what you want. People who do really complex programming find they can do things with SAS that would be impossible to do with SPSS.
2 Coming to SAS from SPSS: A Programming Approach
"Coming to SAS from SPSS: A Programming Approach" published by SAS Institute Inc. Copyright © 2009, SAS Institute Inc., Cary, North Carolina, USA. All Rights Reserved. For additional SAS resources, visit support.sas.com/publishing.
Terminology
Some vocabulary differences exist between SAS and SPSS. To help you translate from one language to the other, here is a brief dictionary of analogous terms:
SPSS term Analogous SAS term active file no analogous term in SAS programs no analogous term temporary SAS data set case observation command statement Data Editor window Viewtable window file handle libref function function input format informat numeric data numeric data output format format procedure procedure save file permanent SAS data set SPSS data file permanent SAS data set SPSS portable file SAS transport file SPSS Viewer window SAS Output and Log windows string data character data syntax programming statements or code Syntax Editor window Enhanced Editor window syntax file a program system file permanent SAS data set value label user-defined format variable variable variable label label no analogous term DATA step no analogous term PROC step
Active files The concept of an active file in SPSS has no precise equivalent in SAS programs. When you read data in an SPSS program, SPSS creates an active system file. This active file is similar to a temporary SAS data set because, by default, it exists only for the duration of the SPSS session, just as temporary SAS data sets exist only for the duration of a SAS session. However, SPSS has only one active file at a time, while SAS can have any number of temporary or permanent data sets. When you run an analysis in SPSS, the data must come from the active file. When you run an analysis in SAS, by default SAS will use the data set most recently created. But you can easily use any other SAS data set including the permanent SAS data set you created last year and haven't touched since. In SAS programs, all SAS data sets are always active.
DATA and PROC steps The SAS language has some concepts that have no parallel in SPSS, such as DATA and PROC steps. All SAS programs are divided into these two types of steps. Basically, DATA steps read and modify data while PROC (short for procedure) steps perform specific analyses or functions such as sorting, writing reports, or running statistical analyses. SPSS programs do the same types of operations but without distinct steps.
Coming to SAS from SPSS: A Programming Approach 3
"Coming to SAS from SPSS: A Programming Approach" published by SAS Institute Inc. Copyright © 2009, SAS Institute Inc., Cary, North Carolina, USA. All Rights Reserved. For additional SAS resources, visit support.sas.com/publishing.
Windows in SAS and SPSS
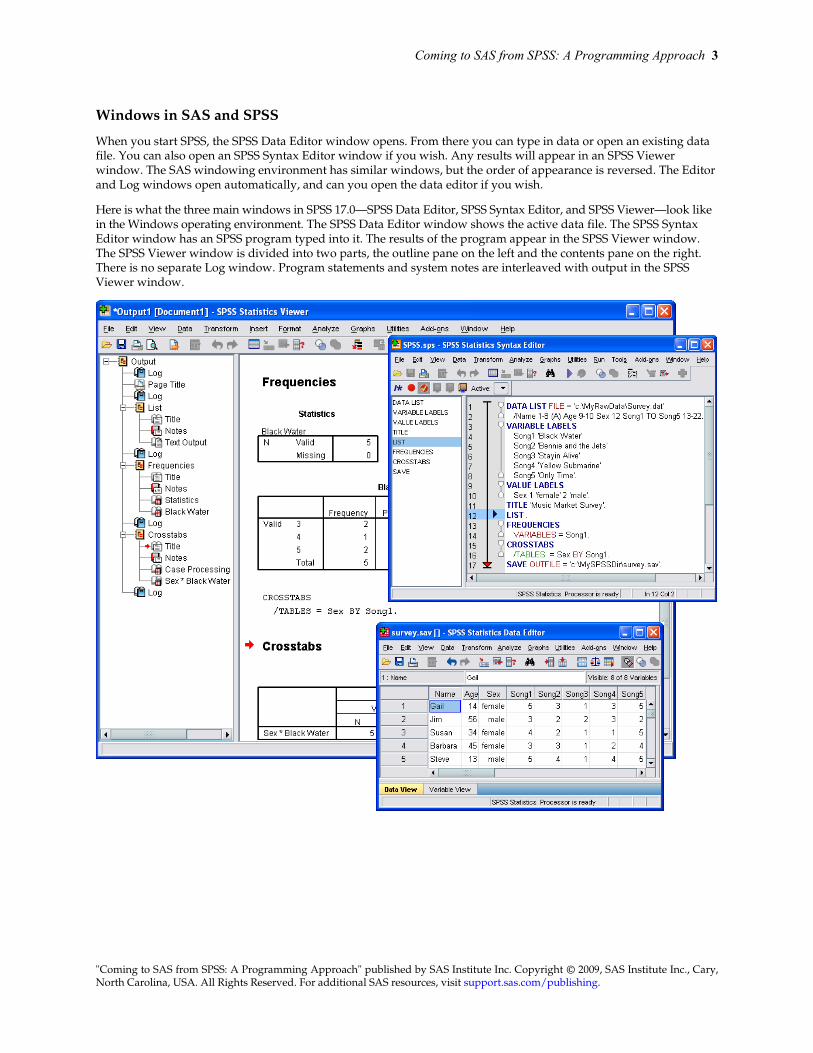
When you start SPSS, the SPSS Data Editor window opens. From there you can type in data or open an existing data file. You can also open an SPSS Syntax Editor window if you wish. Any results will appear in an SPSS Viewer window. The SAS windowing environment has similar windows, but the order of appearance is reversed. The Editor and Log windows open automatically, and can you open the data editor if you wish.
Here is what the three main windows in SPSS 17.0—SPSS Data Editor, SPSS Syntax Editor, and SPSS Viewer—look like in the Windows operating environment. The SPSS Data Editor window shows the active data file. The SPSS Syntax Editor window has an SPSS program typed into it. The results of the program appear in the SPSS Viewer window. The SPSS Viewer window is divided into two parts, the outline pane on the left and the contents pane on the right. There is no separate Log window. Program statements and system notes are interleaved with output in the SPSS Viewer window.
4 Coming to SAS from SPSS: A Programming Approach
"Coming to SAS from SPSS: A Programming Approach" published by SAS Institute Inc. Copyright © 2009, SAS Institute Inc., Cary, North Carolina, USA. All Rights Reserved. For additional SAS resources, visit support.sas.com/publishing.
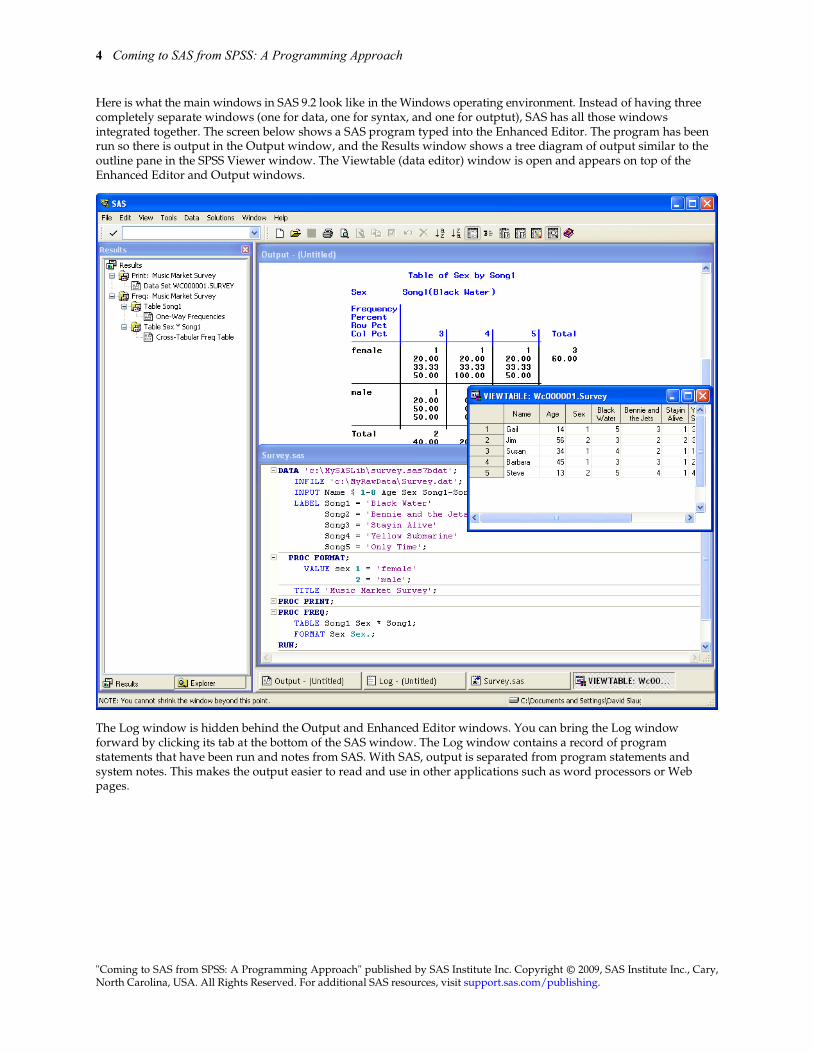
Here is what the main windows in SAS 9.2 look like in the Windows operating environment. Instead of having three completely separate windows (one for data, one for syntax, and one for outptut), SAS has all those windows integrated together. The screen below shows a SAS program typed into the Enhanced Editor. The program has been run so there is output in the Output window, and the Results window shows a tree diagram of output similar to the outline pane in the SPSS Viewer window. The Viewtable (data editor) window is open and appears on top of the Enhanced Editor and Output windows.
The Log window is hidden behind the Output and Enhanced Editor windows. You can bring the Log window forward by clicking its tab at the bottom of the SAS window. The Log window contains a record of program statements that have been run and notes from SAS. With SAS, output is separated from program statements and system notes. This makes the output easier to read and use in other applications such as word processors or Web pages.
Coming to SAS from SPSS: A Programming Approach 5
"Coming to SAS from SPSS: A Programming Approach" published by SAS Institute Inc. Copyright © 2009, SAS Institute Inc., Cary, North Carolina, USA. All Rights Reserved. For additional SAS resources, visit support.sas.com/publishing.
Syntax and Output in SAS and SPSS
For a comparison, we provide the following two programs that perform the same operations in SPSS and SAS. A radio station commissioned a market research company to survey listeners. Respondents were asked to listen to songs and rate them on a scale of 1 to 5, with 1 being “dislike very much” and 5 being “like very much.” Here is a sample of the raw data. The variables are first name, age, sex, and the ratings for five songs.
Gail 14 1 5 3 1 3 5 Jim 56 2 3 2 2 3 2 Susan 34 1 4 2 1 1 5 Barbara 45 1 3 3 1 2 4 Steve 13 2 5 4 1 4 5
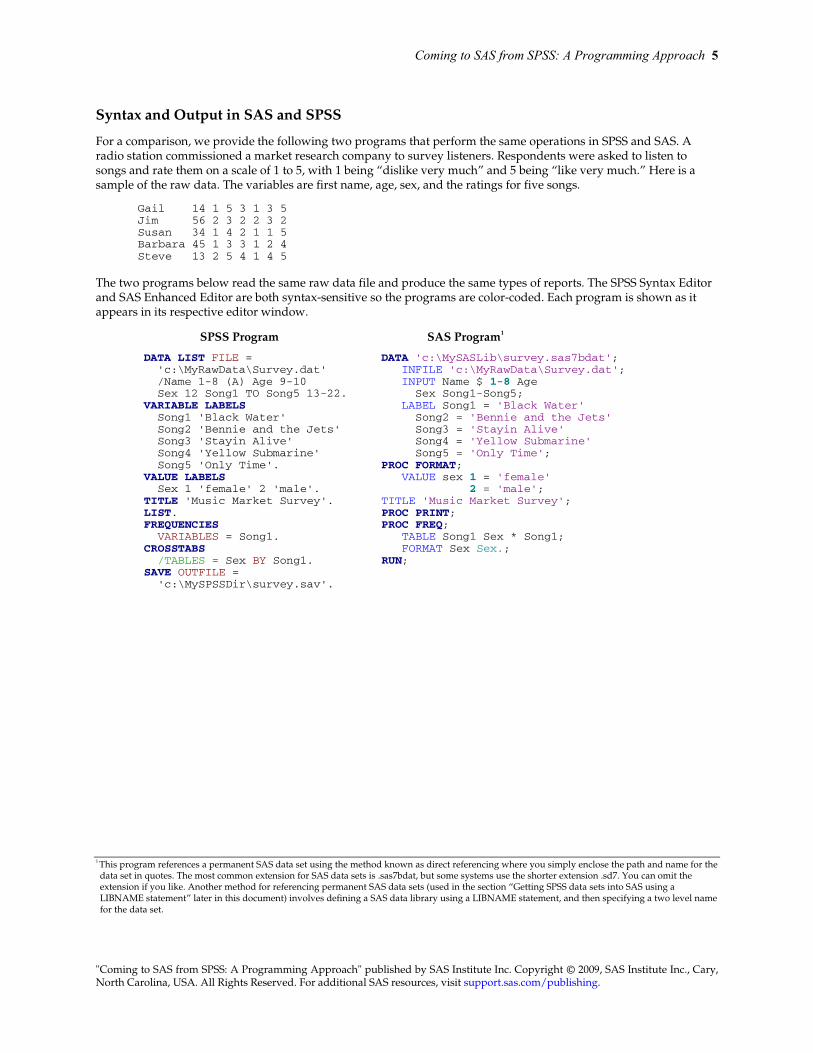
The two programs below read the same raw data file and produce the same types of reports. The SPSS Syntax Editor and SAS Enhanced Editor are both syntax-sensitive so the programs are color-coded. Each program is shown as it appears in its respective editor window.
SPSS Program SAS Program1
DATA LIST FILE = DATA 'c:\MySASLib\survey.sas7bdat'; 'c:\MyRawData\Survey.dat' INFILE 'c:\MyRawData\Survey.dat'; /Name 1-8 (A) Age 9-10 INPUT Name $ 1-8 Age Sex 12 Song1 TO Song5 13-22. Sex Song1-Song5; VARIABLE LABELS LABEL Song1 = 'Black Water' Song1 'Black Water' Song2 = 'Bennie and the Jets' Song2 'Bennie and the Jets' Song3 = 'Stayin Alive' Song3 'Stayin Alive' Song4 = 'Yellow Submarine' Song4 'Yellow Submarine' Song5 = 'Only Time'; Song5 'Only Time'. PROC FORMAT; VALUE LABELS VALUE sex 1 = 'female' Sex 1 'female' 2 'male'. 2 = 'male'; TITLE 'Music Market Survey'. TITLE 'Music Market Survey'; LIST. PROC PRINT; FREQUENCIES PROC FREQ; VARIABLES = Song1. TABLE Song1 Sex * Song1; CROSSTABS FORMAT Sex Sex.; /TABLES = Sex BY Song1. RUN; SAVE OUTFILE = 'c:\MySPSSDir\survey.sav'.
1 This program references a permanent SAS data set using the method known as direct referencing where you simply enclose the path and name for the data set in quotes. The most common extension for SAS data sets is .sas7bdat, but some systems use the shorter extension .sd7. You can omit the extension if you like. Another method for referencing permanent SAS data sets (used in the section “Getting SPSS data sets into SAS using a LIBNAME statement” later in this document) involves defining a SAS data library using a LIBNAME statement, and then specifying a two level name for the data set.
6 Coming to SAS from SPSS: A Programming Approach
"Coming to SAS from SPSS: A Programming Approach" published by SAS Institute Inc. Copyright © 2009, SAS Institute Inc., Cary, North Carolina, USA. All Rights Reserved. For additional SAS resources, visit support.sas.com/publishing.
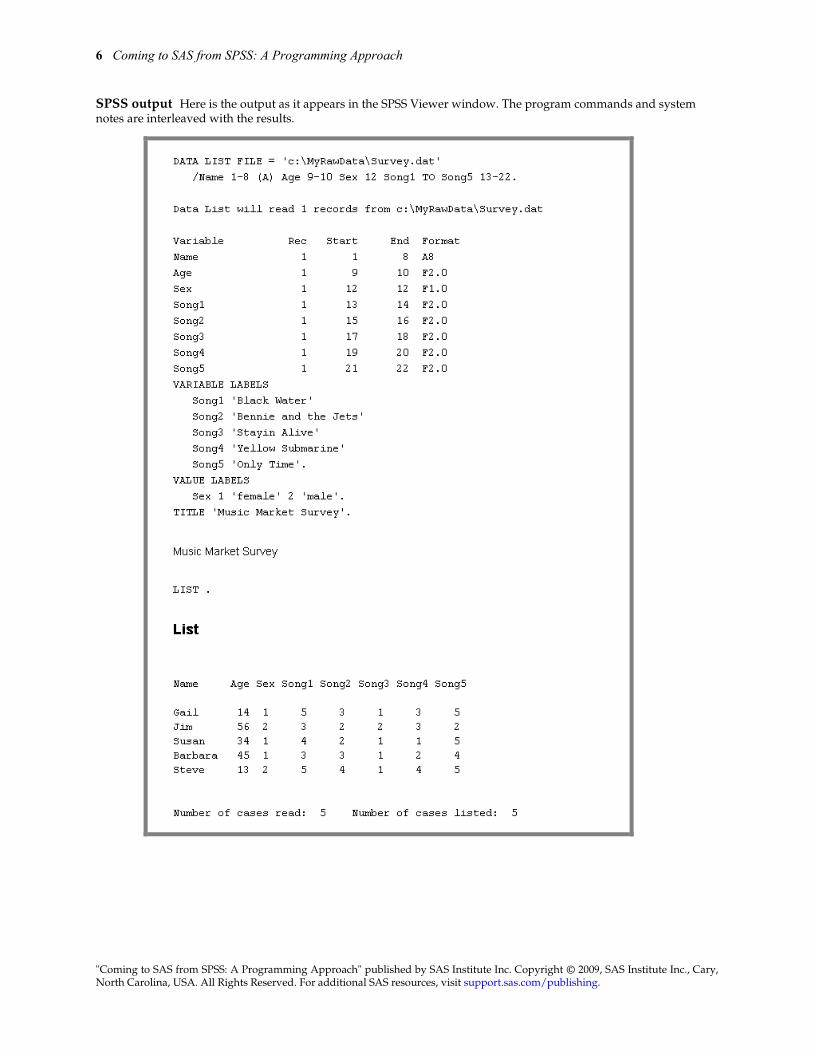
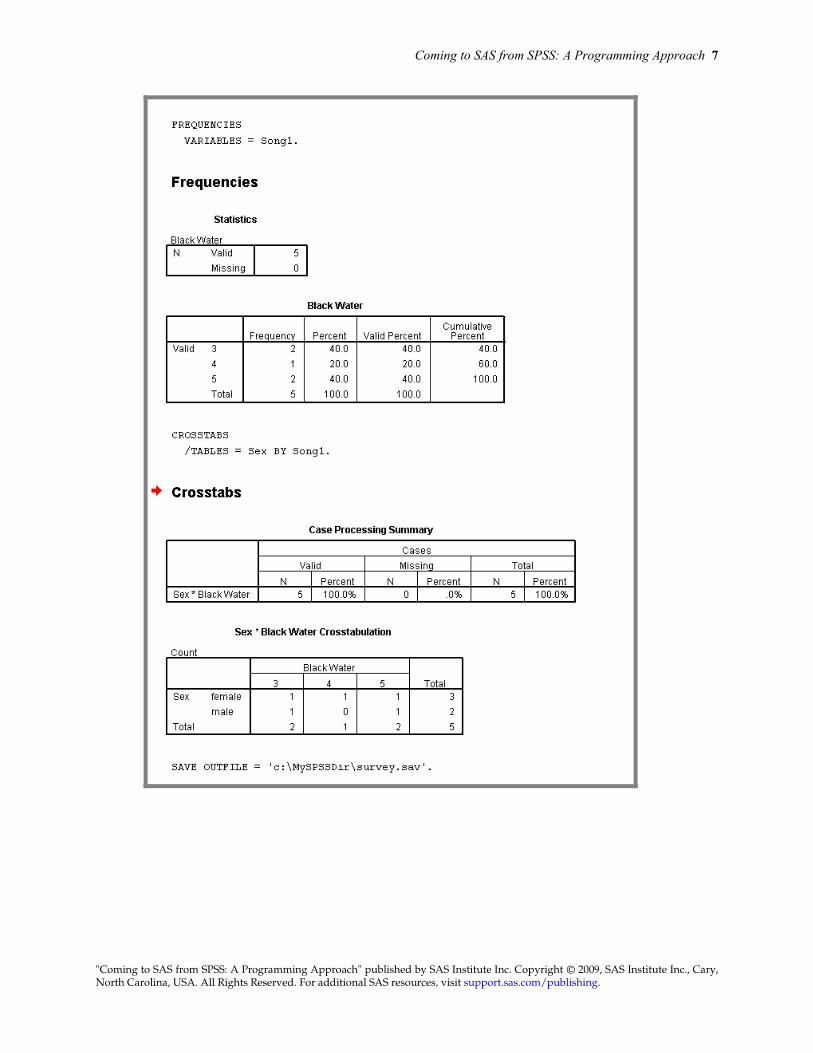
SPSS output Here is the output as it appears in the SPSS Viewer window. The program commands and system notes are interleaved with the results.
Coming to SAS from SPSS: A Programming Approach 7
"Coming to SAS from SPSS: A Programming Approach" published by SAS Institute Inc. Copyright © 2009, SAS Institute Inc., Cary, North Carolina, USA. All Rights Reserved. For additional SAS resources, visit support.sas.com/publishing.

8 Coming to SAS from SPSS: A Programming Approach
"Coming to SAS from SPSS: A Programming Approach" published by SAS Institute Inc. Copyright © 2009, SAS Institute Inc., Cary, North Carolina, USA. All Rights Reserved. For additional SAS resources, visit support.sas.com/publishing.
SAS output and log The SAS output looks similar to the SPSS output. One difference is that the results of SAS procedures appear in a separate window called the Output window while the program statements and notes from the computer appear in the Log window. That way you don’t have to wade through your syntax and notes to find your results. Here are the results as they appear in the Output window:
Coming to SAS from SPSS: A Programming Approach 9
"Coming to SAS from SPSS: A Programming Approach" published by SAS Institute Inc. Copyright © 2009, SAS Institute Inc., Cary, North Carolina, USA. All Rights Reserved. For additional SAS resources, visit support.sas.com/publishing.
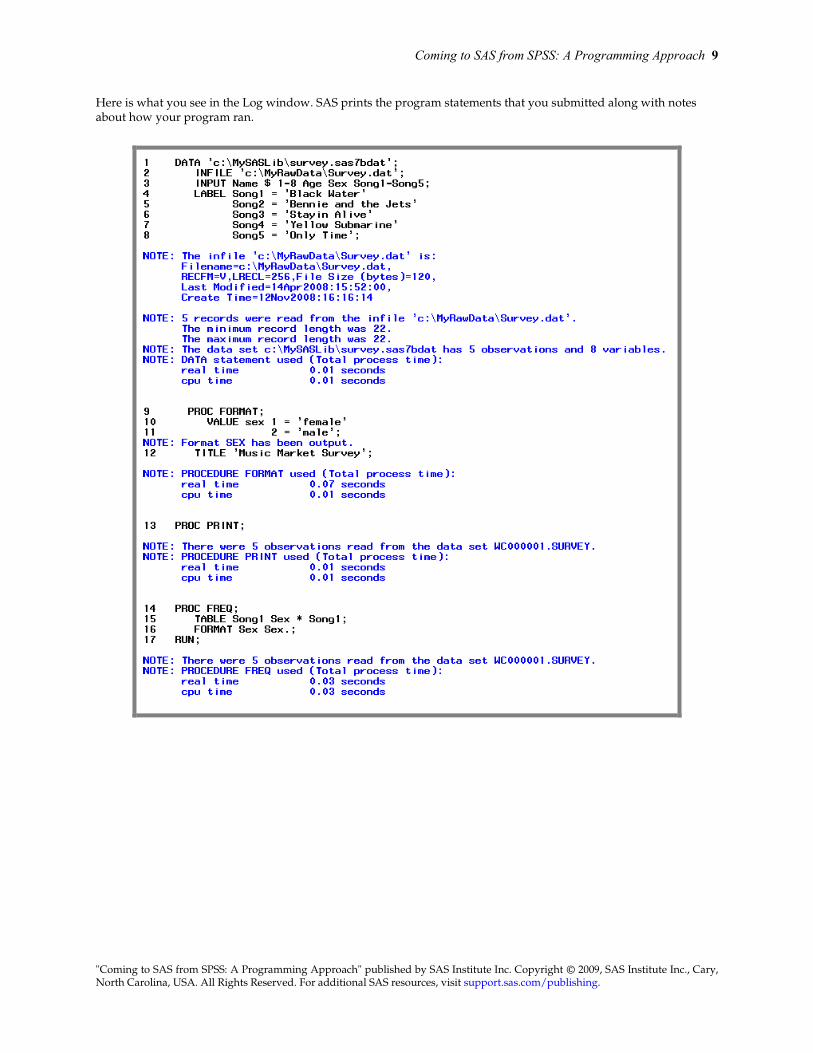
Here is what you see in the Log window. SAS prints the program statements that you submitted along with notes about how your program ran.
10 Coming to SAS from SPSS: A Programming Approach
"Coming to SAS from SPSS: A Programming Approach" published by SAS Institute Inc. Copyright © 2009, SAS Institute Inc., Cary, North Carolina, USA. All Rights Reserved. For additional SAS resources, visit support.sas.com/publishing.
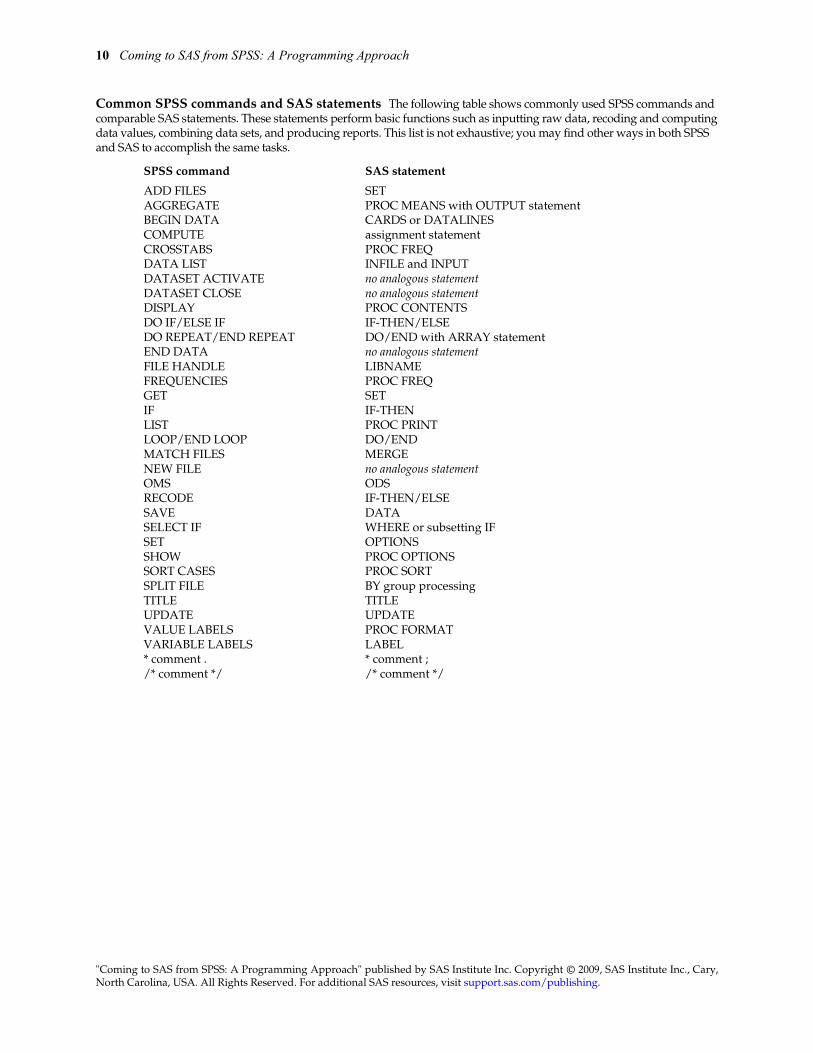
Common SPSS commands and SAS statements The following table shows commonly used SPSS commands and comparable SAS statements. These statements perform basic functions such as inputting raw data, recoding and computing data values, combining data sets, and producing reports. This list is not exhaustive; you may find other ways in both SPSS and SAS to accomplish the same tasks.
SPSS command SAS statement
ADD FILES SET AGGREGATE PROC MEANS with OUTPUT statement BEGIN DATA CARDS or DATALINES COMPUTE assignment statement CROSSTABS PROC FREQ DATA LIST INFILE and INPUT DATASET ACTIVATE no analogous statement DATASET CLOSE no analogous statement DISPLAY PROC CONTENTS DO IF/ELSE IF IF-THEN/ELSE DO REPEAT/END REPEAT DO/END with ARRAY statement END DATA no analogous statement FILE HANDLE LIBNAME FREQUENCIES PROC FREQ GET SET IF IF-THEN LIST PROC PRINT LOOP/END LOOP DO/END MATCH FILES MERGE NEW FILE no analogous statement OMS ODS RECODE IF-THEN/ELSE SAVE DATA SELECT IF WHERE or subsetting IF SET OPTIONS SHOW PROC OPTIONS SORT CASES PROC SORT SPLIT FILE BY group processing TITLE TITLE UPDATE UPDATE VALUE LABELS PROC FORMAT VARIABLE LABELS LABEL * comment . * comment ; /* comment */ /* comment */
Coming to SAS from SPSS: A Programming Approach 11
"Coming to SAS from SPSS: A Programming Approach" published by SAS Institute Inc. Copyright © 2009, SAS Institute Inc., Cary, North Carolina, USA. All Rights Reserved. For additional SAS resources, visit support.sas.com/publishing.
Getting SPSS Data Files into SAS Using a LIBNAME Statement
You can use a LIBNAME statement to read (but not write) SPSS data files. This method is part of Base SAS so you do not have to license any other products. The SPSS data must be in a portable file. To save a portable file in SPSS, open the SPSS data file in the SPSS Data Editor, select File-Save As, and then select SPSS Portable as the type of file to be saved. Variable names are limited to eight characters in SPSS portable files. If you have variable names longer than eight characters in length, SPSS will convert them to unique eight-character names.
In your SAS program, use a LIBNAME statement with this form:
LIBNAME libref SPSS 'SPSS-portable-file';
After the keyword LIBNAME, put the libref which is a nickname you make up for your file (similar to an SPSS file handle). Then put the option SPSS followed by the path and name for your SPSS portable file. The SPSS option tells SAS to use the SPSS data engine to read your data file.
When SAS reads SPSS files with a LIBNAME statement, variable names, variable labels, and output formats remain the same. However, SPSS value labels are not copied. The SAS equivalent of SPSS value labels are user-defined formats. User-defined formats are not stored in SAS data sets. If you want value labels, you can create user-defined formats with PROC FORMAT and then apply them with a FORMAT statement. See the section, “Creating SAS User-Defined Formats,” later in this document for an explanation of how to do this.
The SAS System has special missing values, but they work differently than SPSS user-defined missing values. Therefore, all SPSS missing values, both user-missing (defined in an SPSS MISSING statement) and system-missing, are converted to SAS system-missing values. If you have user-missing values in your SPSS data and want to retain the original values, then you need to clear (turn off) the user-missing values in the SPSS data file before importing.
Example The following SAS program reads the SPSS file created by the SPSS program in the preceding example. The SPSS file (named SURVEY.SAV) was saved as a portable file (SURVEY.POR) in the SPSS Data Editor using the Save As option on the File menu.
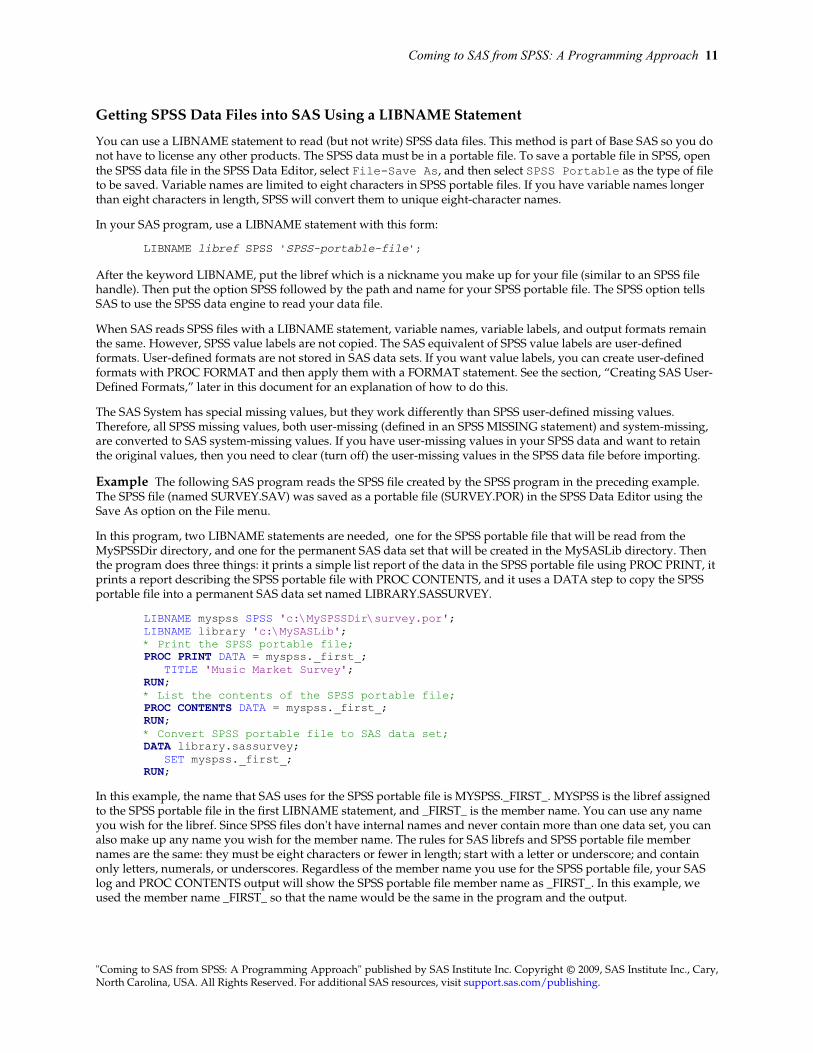
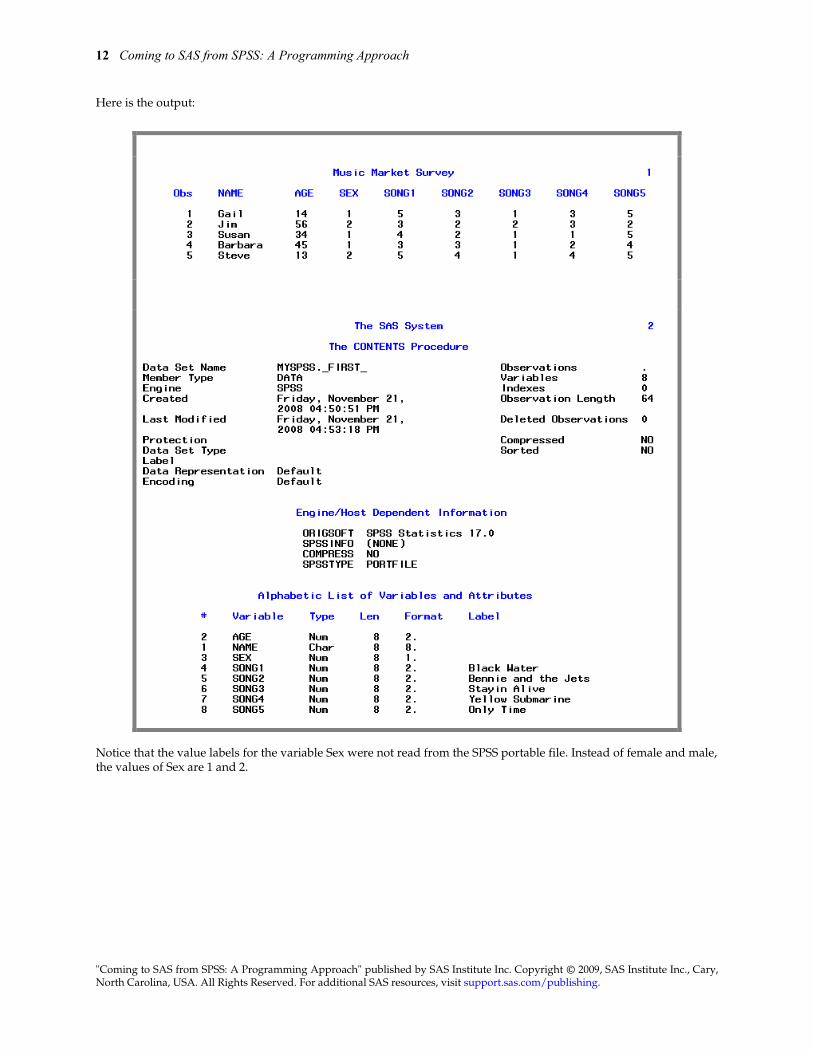
In this program, two LIBNAME statements are needed, one for the SPSS portable file that will be read from the MySPSSDir directory, and one for the permanent SAS data set that will be created in the MySASLib directory. Then the program does three things: it prints a simple list report of the data in the SPSS portable file using PROC PRINT, it prints a report describing the SPSS portable file with PROC CONTENTS, and it uses a DATA step to copy the SPSS portable file into a permanent SAS data set named LIBRARY.SASSURVEY.
LIBNAME myspss SPSS 'c:\MySPSSDir\survey.por'; LIBNAME library 'c:\MySASLib'; * Print the SPSS portable file; PROC PRINT DATA = myspss._first_; TITLE 'Music Market Survey'; RUN; * List the contents of the SPSS portable file; PROC CONTENTS DATA = myspss._first_; RUN; * Convert SPSS portable file to SAS data set; DATA library.sassurvey; SET myspss._first_; RUN;
In this example, the name that SAS uses for the SPSS portable file is MYSPSS._FIRST_. MYSPSS is the libref assigned to the SPSS portable file in the first LIBNAME statement, and _FIRST_ is the member name. You can use any name you wish for the libref. Since SPSS files don't have internal names and never contain more than one data set, you can also make up any name you wish for the member name. The rules for SAS librefs and SPSS portable file member names are the same: they must be eight characters or fewer in length; start with a letter or underscore; and contain only letters, numerals, or underscores. Regardless of the member name you use for the SPSS portable file, your SAS log and PROC CONTENTS output will show the SPSS portable file member name as _FIRST_. In this example, we used the member name _FIRST_ so that the name would be the same in the program and the output.
12 Coming to SAS from SPSS: A Programming Approach
"Coming to SAS from SPSS: A Programming Approach" published by SAS Institute Inc. Copyright © 2009, SAS Institute Inc., Cary, North Carolina, USA. All Rights Reserved. For additional SAS resources, visit support.sas.com/publishing.
Here is the output:
Notice that the value labels for the variable Sex were not read from the SPSS portable file. Instead of female and male, the values of Sex are 1 and 2.
Coming to SAS from SPSS: A Programming Approach 13
"Coming to SAS from SPSS: A Programming Approach" published by SAS Institute Inc. Copyright © 2009, SAS Institute Inc., Cary, North Carolina, USA. All Rights Reserved. For additional SAS resources, visit support.sas.com/publishing.
Getting SPSS Data Files into SAS Using PROC IMPORT
Starting with SAS 9.1.3 SP3 (Service Pack 3), you can use PROC IMPORT to read SPSS data files. You can also use PROC EXPORT to write SPSS data files, though this document covers only reading SPSS data files, not writing. Starting with SAS 9.2, you can use the IMPORT and EXPORT wizards for SPSS data files. (For more information about the IMPORT and EXPORT wizards and PROC EXPORT, see SAS Help and Documentation or The Little SAS Book: A Primer.) You must have SAS/ACCESS Interface to PC Files (which is licensed separately from Base SAS) in order to use these features.
PROC IMPORT can read data in standard SPSS format so you do not need to create an SPSS portable file. Here is the general form of the IMPORT procedure for reading SPSS data files:
PROC IMPORT DATAFILE = 'SPSS-data-file' OUT = SAS-data-set DBMS = SAV REPLACE; FMTLIB = user-defined-format-catalog;
When SAS uses PROC IMPORT to read SPSS files, variable names, variable labels, and output formats remain the same. SPSS numeric value labels are converted to SAS user-defined numeric formats. At the time this document was written, only numeric (not string) SPSS value labels were converted by PROC IMPORT. If you omit the FMTLIB= statement, PROC IMPORT will write any user-defined formats in the temporary SAS library, WORK. Any formats written in the WORK library will be lost when you exit SAS. In order to avoid losing your user-defined formats, use the FMTLIB= statement (available starting with SAS 9.2) to tell SAS where to save your formats.
The SAS System has special missing values, but they work differently than SPSS user-defined missing values. Therefore, all SPSS missing values, both user-missing (defined in an SPSS MISSING statement) and system-missing, are converted to SAS system-missing values. If you have user-missing values in your SPSS data and want to retain the original values, then you need to clear (turn off) the user-missing values in the SPSS data file before importing.
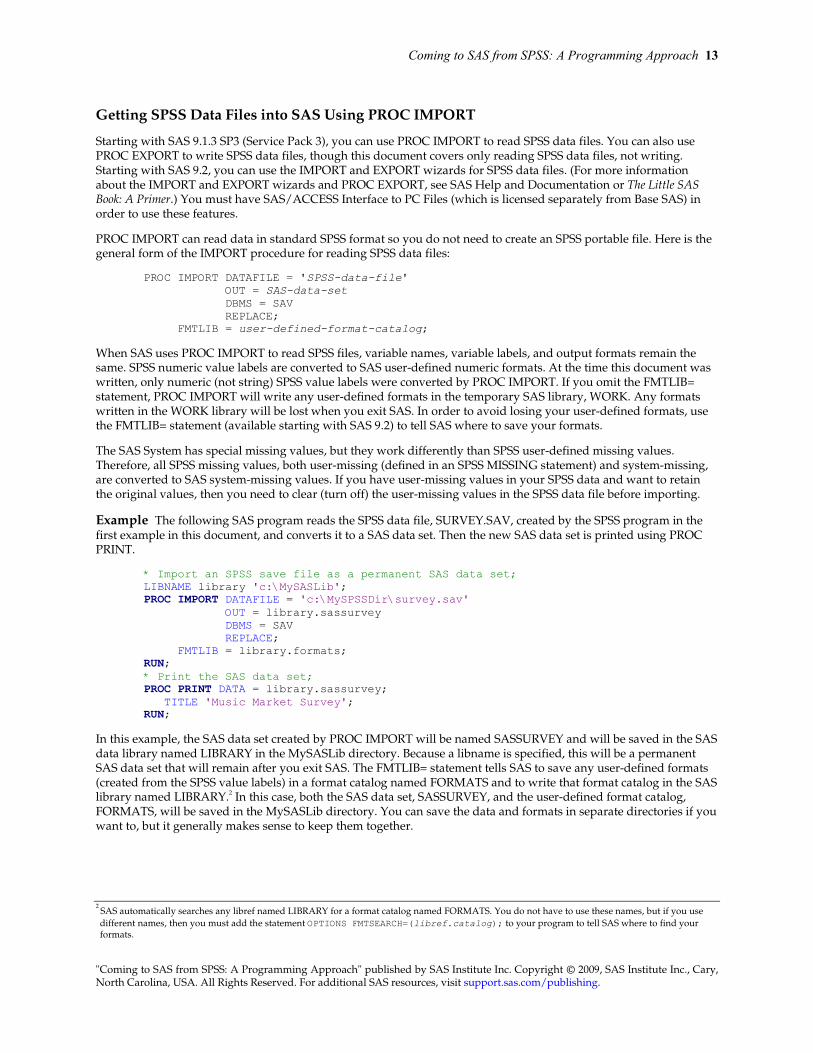
Example The following SAS program reads the SPSS data file, SURVEY.SAV, created by the SPSS program in the first example in this document, and converts it to a SAS data set. Then the new SAS data set is printed using PROC PRINT.
* Import an SPSS save file as a permanent SAS data set; LIBNAME library 'c:\MySASLib'; PROC IMPORT DATAFILE = 'c:\MySPSSDir\survey.sav' OUT = library.sassurvey DBMS = SAV REPLACE; FMTLIB = library.formats; RUN; * Print the SAS data set; PROC PRINT DATA = library.sassurvey; TITLE 'Music Market Survey'; RUN;
In this example, the SAS data set created by PROC IMPORT will be named SASSURVEY and will be saved in the SAS data library named LIBRARY in the MySASLib directory. Because a libname is specified, this will be a permanent SAS data set that will remain after you exit SAS. The FMTLIB= statement tells SAS to save any user-defined formats (created from the SPSS value labels) in a format catalog named FORMATS and to write that format catalog in the SAS library named LIBRARY.2 In this case, both the SAS data set, SASSURVEY, and the user-defined format catalog, FORMATS, will be saved in the MySASLib directory. You can save the data and formats in separate directories if you want to, but it generally makes sense to keep them together.
2 SAS automatically searches any libref named LIBRARY for a format catalog named FORMATS. You do not have to use these names, but if you use
different names, then you must add the statement OPTIONS FMTSEARCH=(libref.catalog); to your program to tell SAS where to find your formats.
14 Coming to SAS from SPSS: A Programming Approach
"Coming to SAS from SPSS: A Programming Approach" published by SAS Institute Inc. Copyright © 2009, SAS Institute Inc., Cary, North Carolina, USA. All Rights Reserved. For additional SAS resources, visit support.sas.com/publishing.
Here is the output:
Note that value labels from the SPSS data file have been applied to the variable SEX. The actual data values for SEX in this data set are 1 or 2. PROC IMPORT created a user-defined format from the SPSS value label, associated it with the variable, and automatically used it in printing the data.
Formats can be associated with variables either when a data set is created (such as in PROC IMPORT or a DATA step) or when a data set is used (as in PROC PRINT or PROC FREQ). If a format is associated with a variable when a data set is created, then the association (not the format) will be saved with the data set, and SAS will look for that format every time it reads that data.
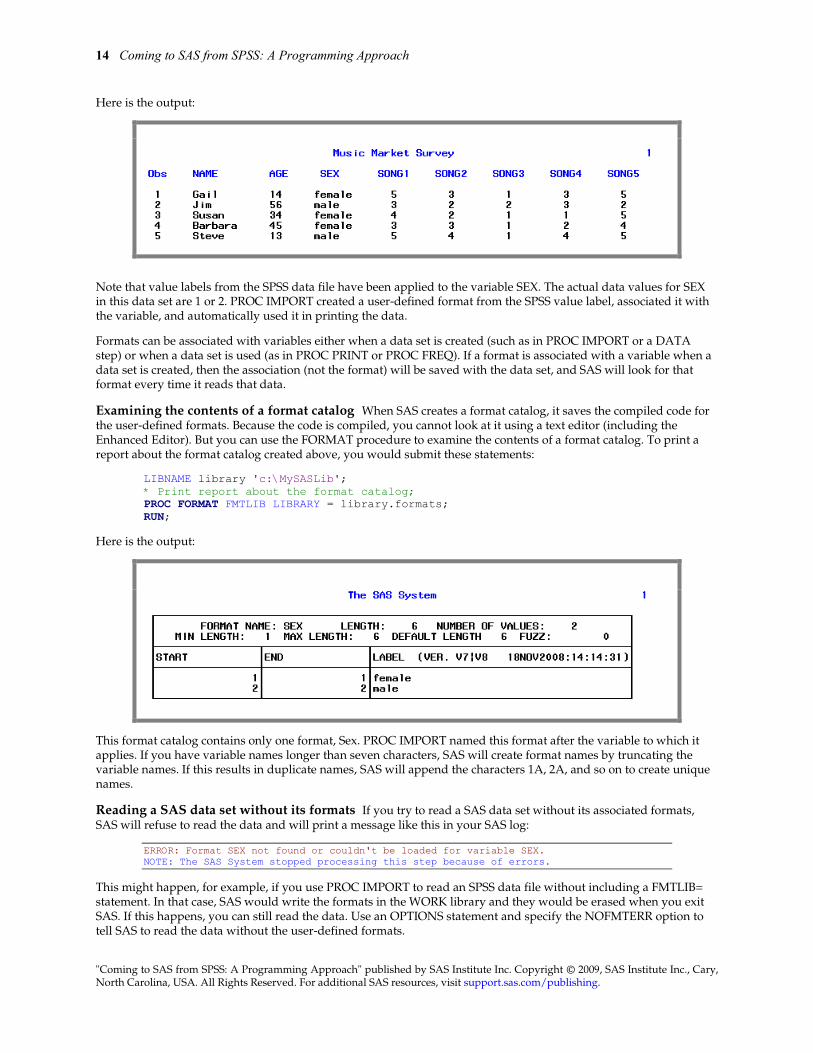
Examining the contents of a format catalog When SAS creates a format catalog, it saves the compiled code for the user-defined formats. Because the code is compiled, you cannot look at it using a text editor (including the Enhanced Editor). But you can use the FORMAT procedure to examine the contents of a format catalog. To print a report about the format catalog created above, you would submit these statements:
LIBNAME library 'c:\MySASLib'; * Print report about the format catalog; PROC FORMAT FMTLIB LIBRARY = library.formats; RUN;
Here is the output:
This format catalog contains only one format, Sex. PROC IMPORT named this format after the variable to which it applies. If you have variable names longer than seven characters, SAS will create format names by truncating the variable names. If this results in duplicate names, SAS will append the characters 1A, 2A, and so on to create unique names.
Reading a SAS data set without its formats If you try to read a SAS data set without its associated formats, SAS will refuse to read the data and will print a message like this in your SAS log:
ERROR: Format SEX not found or couldn't be loaded for variable SEX. NOTE: The SAS System stopped processing this step because of errors.
This might happen, for example, if you use PROC IMPORT to read an SPSS data file without including a FMTLIB= statement. In that case, SAS would write the formats in the WORK library and they would be erased when you exit SAS. If this happens, you can still read the data. Use an OPTIONS statement and specify the NOFMTERR option to tell SAS to read the data without the user-defined formats.
Coming to SAS from SPSS: A Programming Approach 15
"Coming to SAS from SPSS: A Programming Approach" published by SAS Institute Inc. Copyright © 2009, SAS Institute Inc., Cary, North Carolina, USA. All Rights Reserved. For additional SAS resources, visit support.sas.com/publishing.
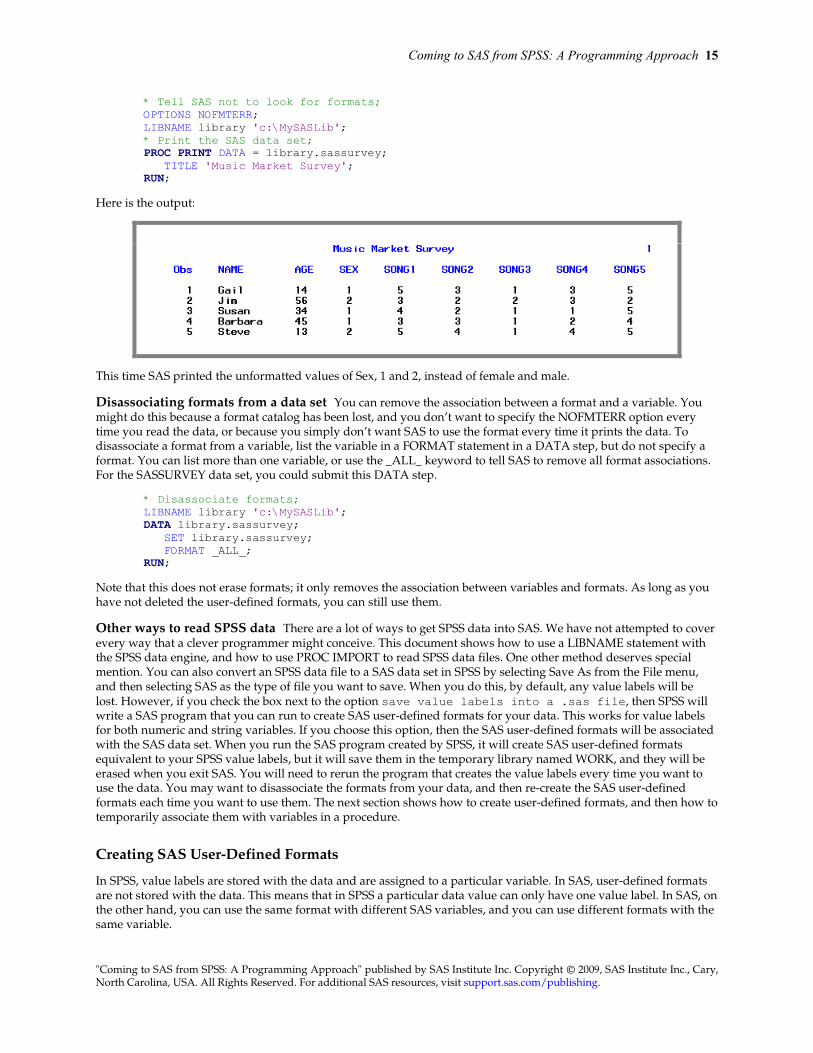
* Tell SAS not to look for formats; OPTIONS NOFMTERR; LIBNAME library 'c:\MySASLib'; * Print the SAS data set; PROC PRINT DATA = library.sassurvey; TITLE 'Music Market Survey'; RUN;
Here is the output:
This time SAS printed the unformatted values of Sex, 1 and 2, instead of female and male.
Disassociating formats from a data set You can remove the association between a format and a variable. You might do this because a format catalog has been lost, and you don’t want to specify the NOFMTERR option every time you read the data, or because you simply don’t want SAS to use the format every time it prints the data. To disassociate a format from a variable, list the variable in a FORMAT statement in a DATA step, but do not specify a format. You can list more than one variable, or use the _ALL_ keyword to tell SAS to remove all format associations. For the SASSURVEY data set, you could submit this DATA step.
* Disassociate formats; LIBNAME library 'c:\MySASLib'; DATA library.sassurvey; SET library.sassurvey; FORMAT _ALL_; RUN;
Note that this does not erase formats; it only removes the association between variables and formats. As long as you have not deleted the user-defined formats, you can still use them.
Other ways to read SPSS data There are a lot of ways to get SPSS data into SAS. We have not attempted to cover every way that a clever programmer might conceive. This document shows how to use a LIBNAME statement with the SPSS data engine, and how to use PROC IMPORT to read SPSS data files. One other method deserves special mention. You can also convert an SPSS data file to a SAS data set in SPSS by selecting Save As from the File menu, and then selecting SAS as the type of file you want to save. When you do this, by default, any value labels will be lost. However, if you check the box next to the option save value labels into a .sas file, then SPSS will write a SAS program that you can run to create SAS user-defined formats for your data. This works for value labels for both numeric and string variables. If you choose this option, then the SAS user-defined formats will be associated with the SAS data set. When you run the SAS program created by SPSS, it will create SAS user-defined formats equivalent to your SPSS value labels, but it will save them in the temporary library named WORK, and they will be erased when you exit SAS. You will need to rerun the program that creates the value labels every time you want to use the data. You may want to disassociate the formats from your data, and then re-create the SAS user-defined formats each time you want to use them. The next section shows how to create user-defined formats, and then how to temporarily associate them with variables in a procedure.
Creating SAS User-Defined Formats
In SPSS, value labels are stored with the data and are assigned to a particular variable. In SAS, user-defined formats are not stored with the data. This means that in SPSS a particular data value can only have one value label. In SAS, on the other hand, you can use the same format with different SAS variables, and you can use different formats with the same variable.
16 Coming to SAS from SPSS: A Programming Approach
"Coming to SAS from SPSS: A Programming Approach" published by SAS Institute Inc. Copyright © 2009, SAS Institute Inc., Cary, North Carolina, USA. All Rights Reserved. For additional SAS resources, visit support.sas.com/publishing.
Using formats in SAS is a two-step process. First you create the user-defined formats using the FORMAT procedure, and then you associate the formats with variables in a FORMAT statement. The FORMAT procedure starts with the statement PROC FORMAT and continues with one or more VALUE statements where you assign a value, or range of values, to a formatted text string. The FORMAT procedure is similar to the VALUE LABELS statement in SPSS. The form of the FORMAT procedure shown here creates temporary SAS formats which are deleted when you exit SAS. To use temporary formats you need to create them—by running the PROC FORMAT code—during each SAS session. It is also possible to store user-defined formats in a format catalog. For more information on storing SAS formats, see SAS Help and Documentation. Here is the general form of the FORMAT procedure:
PROC FORMAT; VALUE name range-1 = 'formatted-text-1' range-2 = 'formatted-text-2' . . . range-n = 'formatted-text-n';
The name in the VALUE statement is the name of the format you are creating. If the format is for character data, the name must start with a $. The name can’t be longer than 32 characters (including the $ for character data), it must not start or end with a number, and cannot contain any special characters except the underscore. In addition, the name can’t be the name of a standard SAS format. Each range is the value of a variable that is assigned to the text given in quotation marks on the right side of the equal sign. The text can be up to 32,767 characters long, but some procedures print only the first 8 or 16 characters. The following are examples of valid range specifications:
1 = 'Yes' 'A' = 'Asia' 1, 3, 5, 7, 9 = 'Odd' 500000 - HIGH = 'Not Affordable' 13 -< 20 = 'Teenager' 0 <- HIGH = 'Positive Non Zero' OTHER = 'Bad Data'
The keywords LOW and HIGH can be used in ranges to indicate the lowest and the highest non-missing value for the variable. You can also use the less than symbol (<) in ranges to exclude either end point of the range. The OTHER keyword can be used to assign a format to any values not listed in the VALUE statement.
Example To illustrate how SAS user-defined formats are independent from variables, consider the following survey data of college students where the type of housing (Dorm, Apartment, or Home) they live in is followed by the year of college, the number of hours they work in a week, and their major.
D 1 10 Biology D 3 5 Art History A 4 15 Engineering H 4 20 Physics A 2 0 English
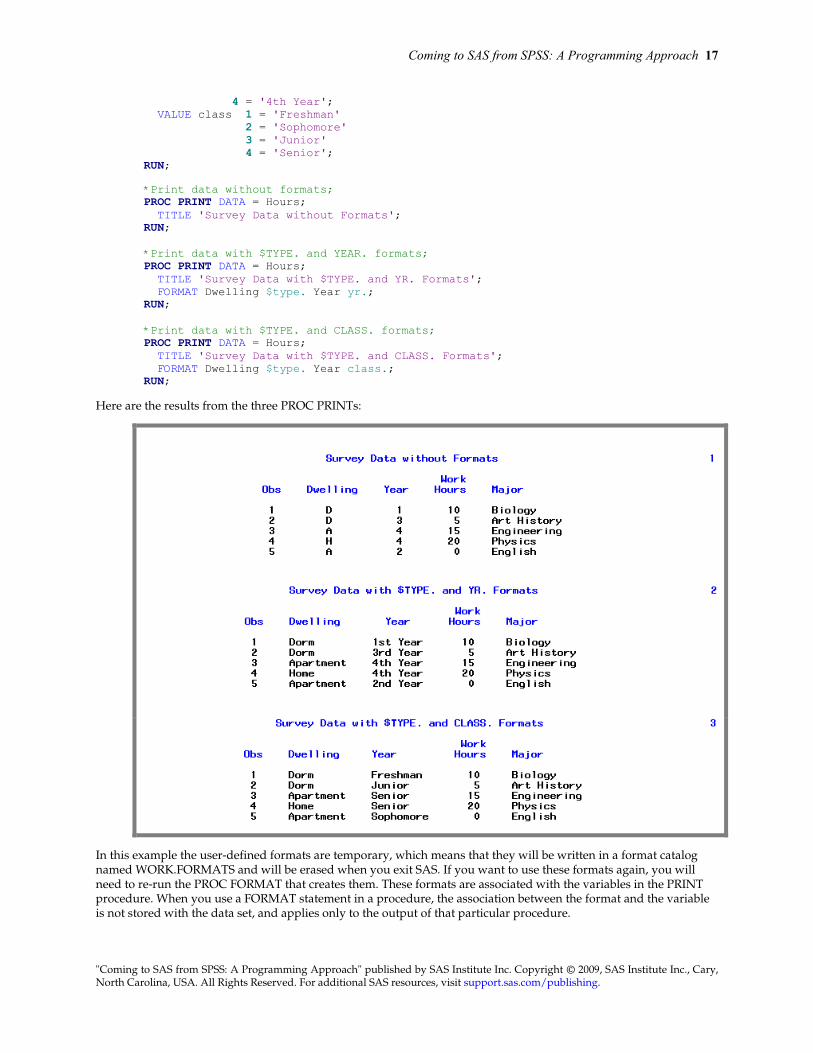
The following SAS program reads the raw data into a SAS data set in the DATA step, and then uses PROC FORMAT to create three formats: $TYPE., YR., and CLASS.. The first PROC PRINT lists the data without applying any formats. The second PROC PRINT contains a FORMAT statement that associates the $TYPE. format with the variable Dwelling and the YR. format with the variable Year. The last PROC PRINT also associates the $TYPE. format with the Dwelling variable, but this time the CLASS. format is applied to the Year variable in the FORMAT statement.
*Read raw data into SAS data set; DATA Hours; INFILE 'C:\MyRawData\WorkHours.dat' TRUNCOVER; INPUT Dwelling $ 1 Year 3 WorkHours 5-6 Major $ 8-18; RUN; *Create formats; PROC FORMAT; VALUE $type 'A' = 'Apartment' 'D' = 'Dorm' 'H' = 'Home'; VALUE yr 1 = '1st Year' 2 = '2nd Year' 3 = '3rd Year'
Coming to SAS from SPSS: A Programming Approach 17
"Coming to SAS from SPSS: A Programming Approach" published by SAS Institute Inc. Copyright © 2009, SAS Institute Inc., Cary, North Carolina, USA. All Rights Reserved. For additional SAS resources, visit support.sas.com/publishing.
4 = '4th Year'; VALUE class 1 = 'Freshman' 2 = 'Sophomore' 3 = 'Junior' 4 = 'Senior'; RUN;
*Print data without formats; PROC PRINT DATA = Hours; TITLE 'Survey Data without Formats'; RUN; *Print data with $TYPE. and YEAR. formats; PROC PRINT DATA = Hours; TITLE 'Survey Data with $TYPE. and YR. Formats'; FORMAT Dwelling $type. Year yr.; RUN; *Print data with $TYPE. and CLASS. formats; PROC PRINT DATA = Hours; TITLE 'Survey Data with $TYPE. and CLASS. Formats'; FORMAT Dwelling $type. Year class.; RUN;
Here are the results from the three PROC PRINTs:
In this example the user-defined formats are temporary, which means that they will be written in a format catalog named WORK.FORMATS and will be erased when you exit SAS. If you want to use these formats again, you will need to re-run the PROC FORMAT that creates them. These formats are associated with the variables in the PRINT procedure. When you use a FORMAT statement in a procedure, the association between the format and the variable is not stored with the data set, and applies only to the output of that particular procedure.
18 Coming to SAS from SPSS: A Programming Approach
"Coming to SAS from SPSS: A Programming Approach" published by SAS Institute Inc. Copyright © 2009, SAS Institute Inc., Cary, North Carolina, USA. All Rights Reserved. For additional SAS resources, visit support.sas.com/publishing.
Grouping Data in Procedures with SAS User-Defined Formats
Because SAS user-defined formats are independent from SAS variables, this allows you to do things in SAS that you could not do in SPSS. For example, with SAS user-defined formats you can group data in procedure output without creating a new variable. Using this method, it is easy to change the groupings by simply applying a new format to the variable. This method works for SAS procedures that group data such as PROC FREQ, PROC TABULATE, PROC MEANS with a CLASS statement, and PROC REPORT with GROUP or ACROSS variables.
Grouping data this way is a two-step process. First, use the FORMAT procedure to define a format that assigns all the values that you want to group together to a text string. Second, use the FORMAT statement in the procedure to assign the format to the variable to be grouped.
Example To illustrate using user-defined formats to group data, we will use the following data. The staff of the local library want to see the type of books people check out by age group. They have the age of the patron in years and the book type: fiction, mystery, science fiction, biography, non-fiction, and reference. Here are the data with nine observations per line:
17 sci 9 bio 28 fic 50 mys 13 fic 32 fic 67 fic 81 non 38 non 53 non 16 sci 15 bio 61 fic 52 ref 22 mys 76 bio 37 fic 86 fic 49 mys 78 non 45 sci 64 bio 8 fic 11 non 41 fic 46 ref 69 fic 34 fic 26 mys 23 sci 74 ref 15 sci 27 fic 23 mys 63 fic 78 non 40 bio 12 fic 29 fic 54 mys 67 fic 60 fic 38 sci 42 fic 80 fic
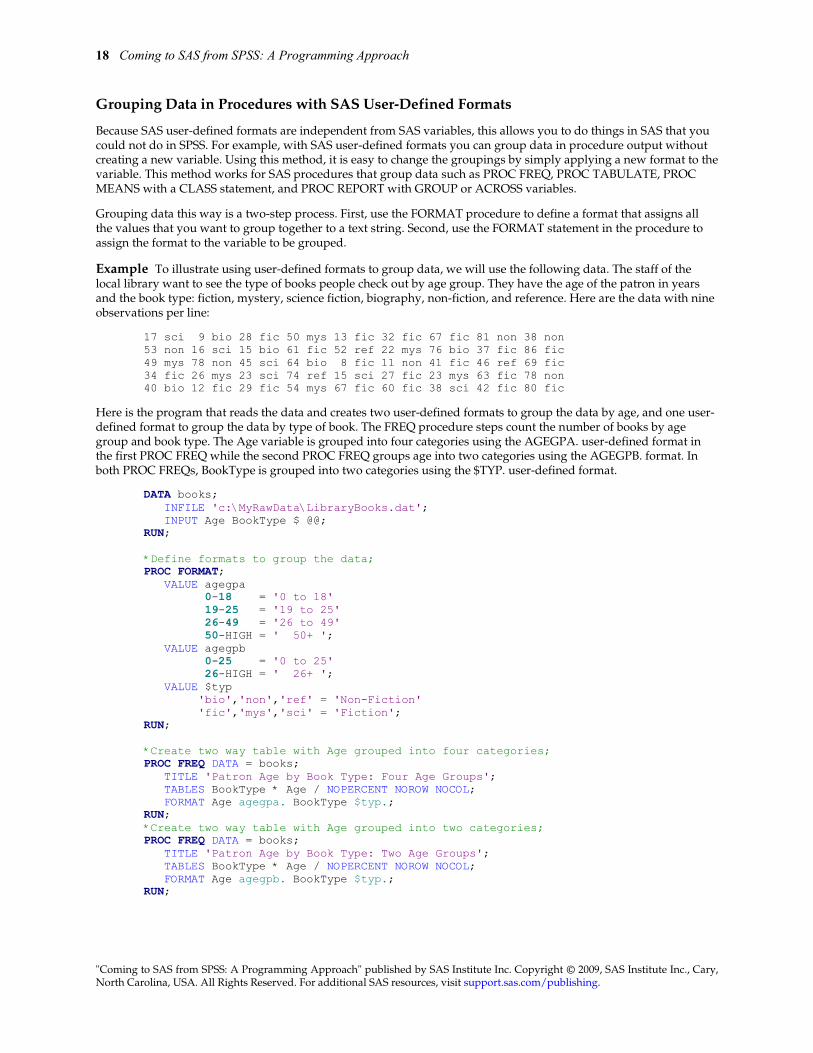
Here is the program that reads the data and creates two user-defined formats to group the data by age, and one user-defined format to group the data by type of book. The FREQ procedure steps count the number of books by age group and book type. The Age variable is grouped into four categories using the AGEGPA. user-defined format in the first PROC FREQ while the second PROC FREQ groups age into two categories using the AGEGPB. format. In both PROC FREQs, BookType is grouped into two categories using the $TYP. user-defined format.
DATA books; INFILE 'c:\MyRawData\LibraryBooks.dat'; INPUT Age BookType $ @@; RUN; *Define formats to group the data; PROC FORMAT; VALUE agegpa 0-18 = '0 to 18' 19-25 = '19 to 25' 26-49 = '26 to 49' 50-HIGH = ' 50+ '; VALUE agegpb 0-25 = '0 to 25' 26-HIGH = ' 26+ '; VALUE $typ 'bio','non','ref' = 'Non-Fiction' 'fic','mys','sci' = 'Fiction'; RUN; *Create two way table with Age grouped into four categories; PROC FREQ DATA = books; TITLE 'Patron Age by Book Type: Four Age Groups'; TABLES BookType * Age / NOPERCENT NOROW NOCOL; FORMAT Age agegpa. BookType $typ.; RUN; *Create two way table with Age grouped into two categories; PROC FREQ DATA = books; TITLE 'Patron Age by Book Type: Two Age Groups'; TABLES BookType * Age / NOPERCENT NOROW NOCOL; FORMAT Age agegpb. BookType $typ.; RUN;
Coming to SAS from SPSS: A Programming Approach 19
"Coming to SAS from SPSS: A Programming Approach" published by SAS Institute Inc. Copyright © 2009, SAS Institute Inc., Cary, North Carolina, USA. All Rights Reserved. For additional SAS resources, visit support.sas.com/publishing.
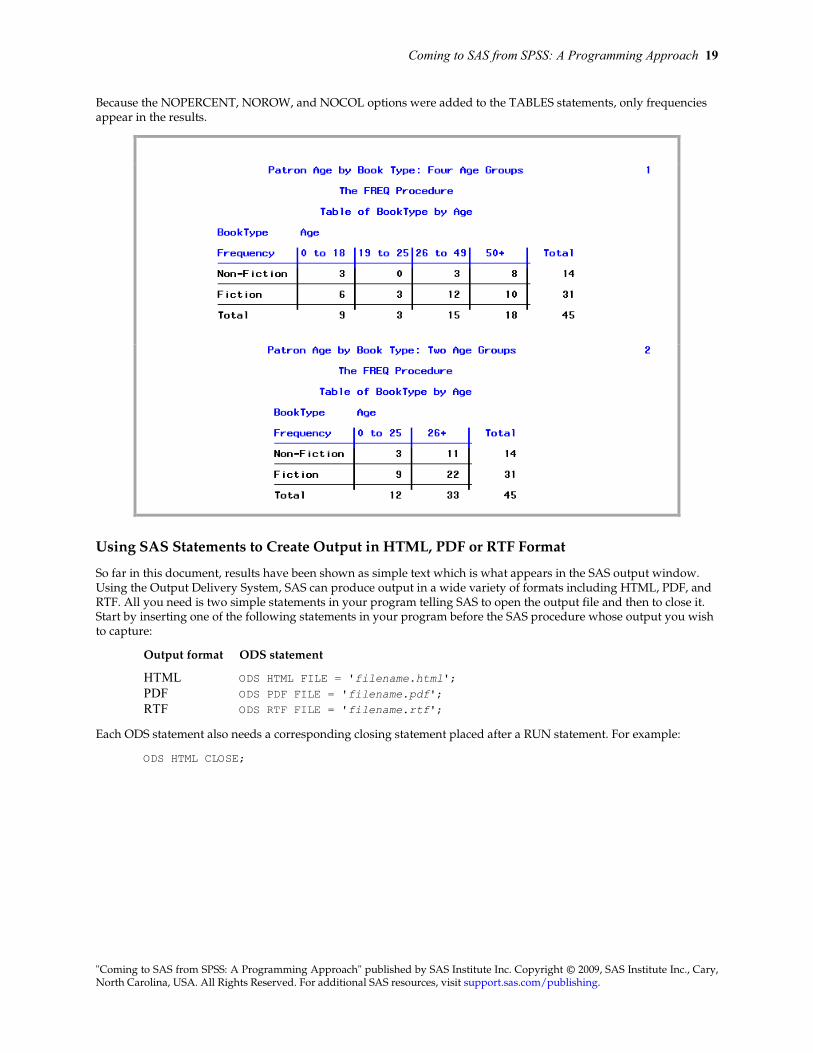
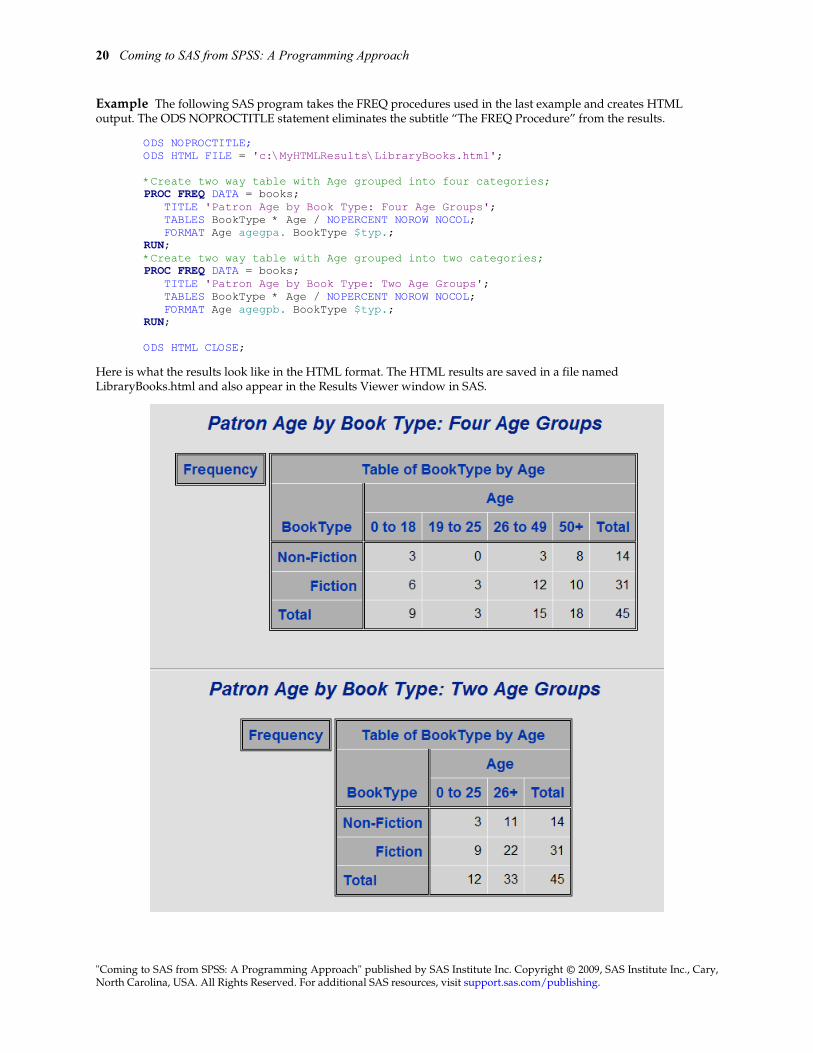
Because the NOPERCENT, NOROW, and NOCOL options were added to the TABLES statements, only frequencies appear in the results.
Using SAS Statements to Create Output in HTML, PDF or RTF Format
So far in this document, results have been shown as simple text which is what appears in the SAS output window. Using the Output Delivery System, SAS can produce output in a wide variety of formats including HTML, PDF, and RTF. All you need is two simple statements in your program telling SAS to open the output file and then to close it. Start by inserting one of the following statements in your program before the SAS procedure whose output you wish to capture:
Output format ODS statement
HTML ODS HTML FILE = 'filename.html'; PDF ODS PDF FILE = 'filename.pdf'; RTF ODS RTF FILE = 'filename.rtf';
Each ODS statement also needs a corresponding closing statement placed after a RUN statement. For example:
ODS HTML CLOSE;
20 Coming to SAS from SPSS: A Programming Approach
"Coming to SAS from SPSS: A Programming Approach" published by SAS Institute Inc. Copyright © 2009, SAS Institute Inc., Cary, North Carolina, USA. All Rights Reserved. For additional SAS resources, visit support.sas.com/publishing.
Example The following SAS program takes the FREQ procedures used in the last example and creates HTML output. The ODS NOPROCTITLE statement eliminates the subtitle “The FREQ Procedure” from the results.
ODS NOPROCTITLE; ODS HTML FILE = 'c:\MyHTMLResults\LibraryBooks.html'; *Create two way table with Age grouped into four categories; PROC FREQ DATA = books; TITLE 'Patron Age by Book Type: Four Age Groups'; TABLES BookType * Age / NOPERCENT NOROW NOCOL; FORMAT Age agegpa. BookType $typ.; RUN; *Create two way table with Age grouped into two categories; PROC FREQ DATA = books; TITLE 'Patron Age by Book Type: Two Age Groups'; TABLES BookType * Age / NOPERCENT NOROW NOCOL; FORMAT Age agegpb. BookType $typ.; RUN; ODS HTML CLOSE;
Here is what the results look like in the HTML format. The HTML results are saved in a file named LibraryBooks.html and also appear in the Results Viewer window in SAS.
Coming to SAS from SPSS: A Programming Approach 21
"Coming to SAS from SPSS: A Programming Approach" published by SAS Institute Inc. Copyright © 2009, SAS Institute Inc., Cary, North Carolina, USA. All Rights Reserved. For additional SAS resources, visit support.sas.com/publishing.
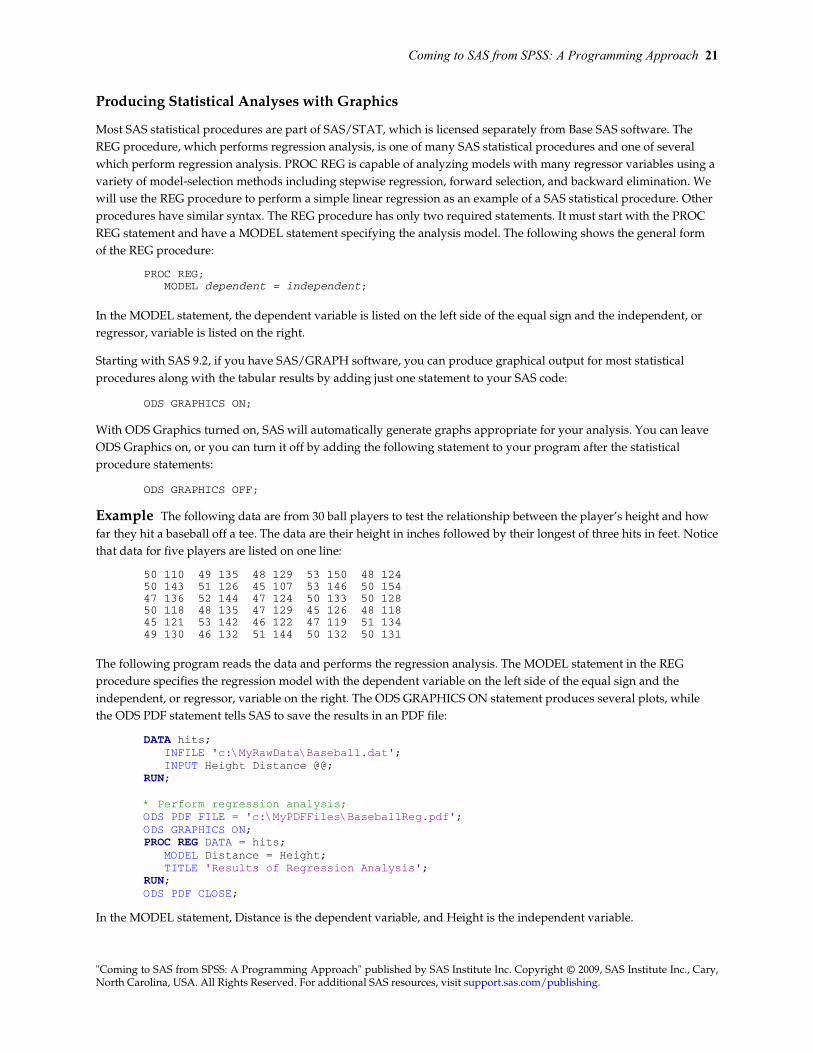
Producing Statistical Analyses with Graphics
Most SAS statistical procedures are part of SAS/STAT, which is licensed separately from Base SAS software. The REG procedure, which performs regression analysis, is one of many SAS statistical procedures and one of several which perform regression analysis. PROC REG is capable of analyzing models with many regressor variables using a variety of model-selection methods including stepwise regression, forward selection, and backward elimination. We will use the REG procedure to perform a simple linear regression as an example of a SAS statistical procedure. Other procedures have similar syntax. The REG procedure has only two required statements. It must start with the PROC REG statement and have a MODEL statement specifying the analysis model. The following shows the general form of the REG procedure:
PROC REG; MODEL dependent = independent;
In the MODEL statement, the dependent variable is listed on the left side of the equal sign and the independent, or regressor, variable is listed on the right.
Starting with SAS 9.2, if you have SAS/GRAPH software, you can produce graphical output for most statistical procedures along with the tabular results by adding just one statement to your SAS code:
ODS GRAPHICS ON;
With ODS Graphics turned on, SAS will automatically generate graphs appropriate for your analysis. You can leave ODS Graphics on, or you can turn it off by adding the following statement to your program after the statistical procedure statements:
ODS GRAPHICS OFF;
Example The following data are from 30 ball players to test the relationship between the player’s height and how far they hit a baseball off a tee. The data are their height in inches followed by their longest of three hits in feet. Notice that data for five players are listed on one line:
50 110 49 135 48 129 53 150 48 124 50 143 51 126 45 107 53 146 50 154 47 136 52 144 47 124 50 133 50 128 50 118 48 135 47 129 45 126 48 118 45 121 53 142 46 122 47 119 51 134 49 130 46 132 51 144 50 132 50 131
The following program reads the data and performs the regression analysis. The MODEL statement in the REG procedure specifies the regression model with the dependent variable on the left side of the equal sign and the independent, or regressor, variable on the right. The ODS GRAPHICS ON statement produces several plots, while the ODS PDF statement tells SAS to save the results in an PDF file:
DATA hits; INFILE 'c:\MyRawData\Baseball.dat'; INPUT Height Distance @@; RUN; * Perform regression analysis; ODS PDF FILE = 'c:\MyPDFFiles\BaseballReg.pdf'; ODS GRAPHICS ON; PROC REG DATA = hits; MODEL Distance = Height; TITLE 'Results of Regression Analysis'; RUN; ODS PDF CLOSE;
In the MODEL statement, Distance is the dependent variable, and Height is the independent variable.
22 Coming to SAS from SPSS: A Programming Approach
"Coming to SAS from SPSS: A Programming Approach" published by SAS Institute Inc. Copyright © 2009, SAS Institute Inc., Cary, North Carolina, USA. All Rights Reserved. For additional SAS resources, visit support.sas.com/publishing.
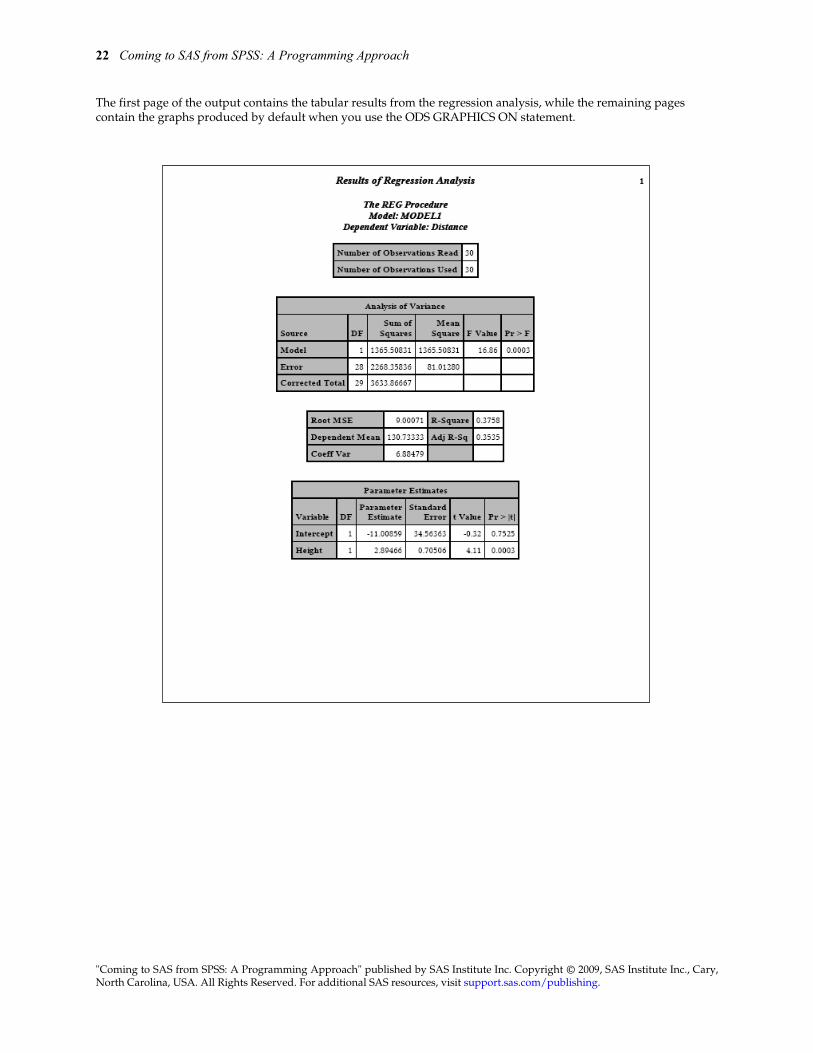
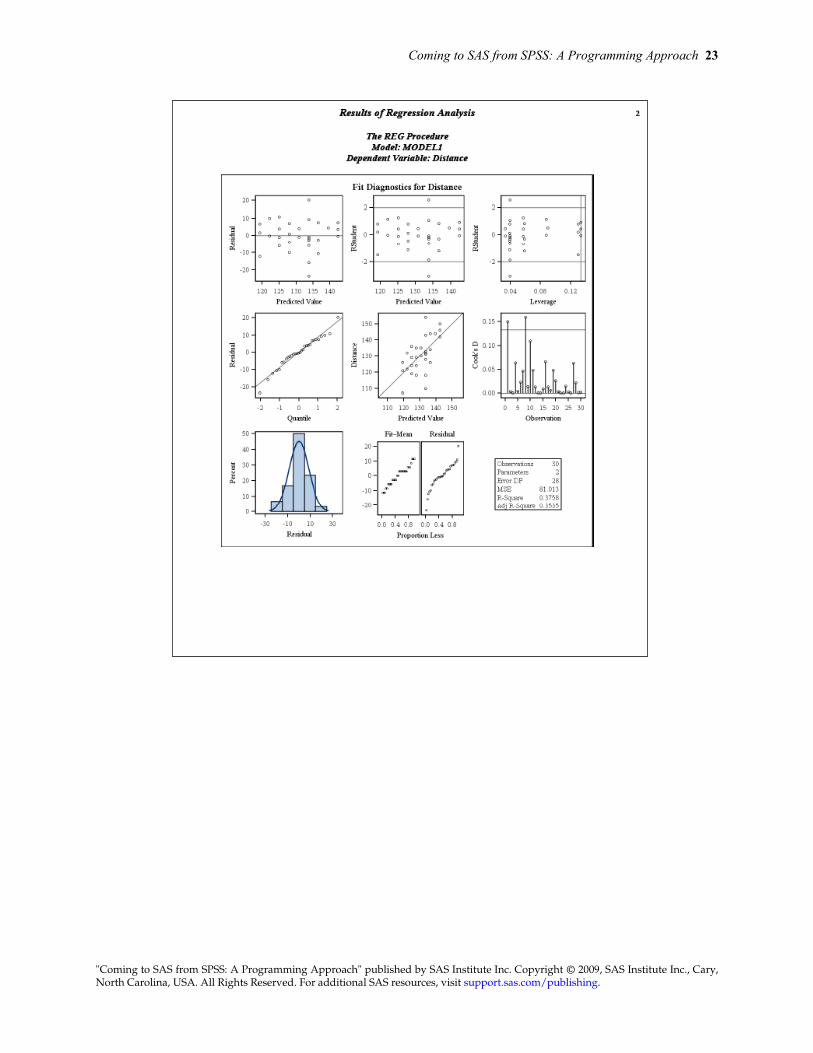
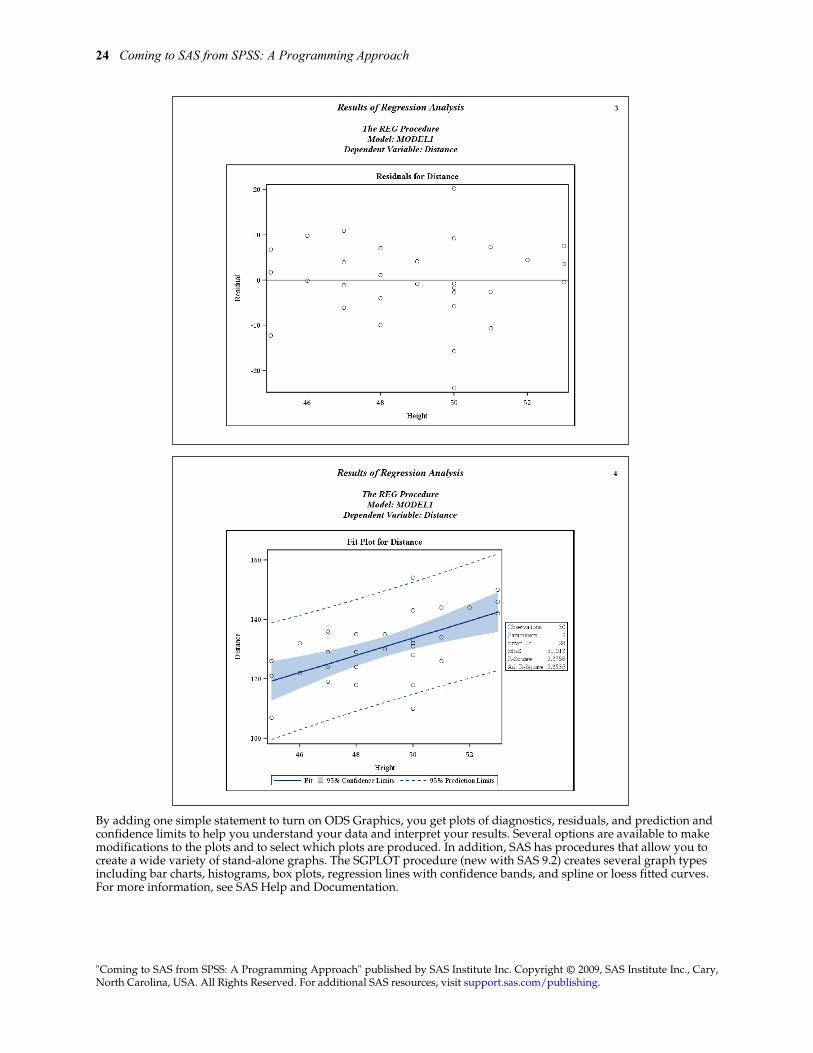
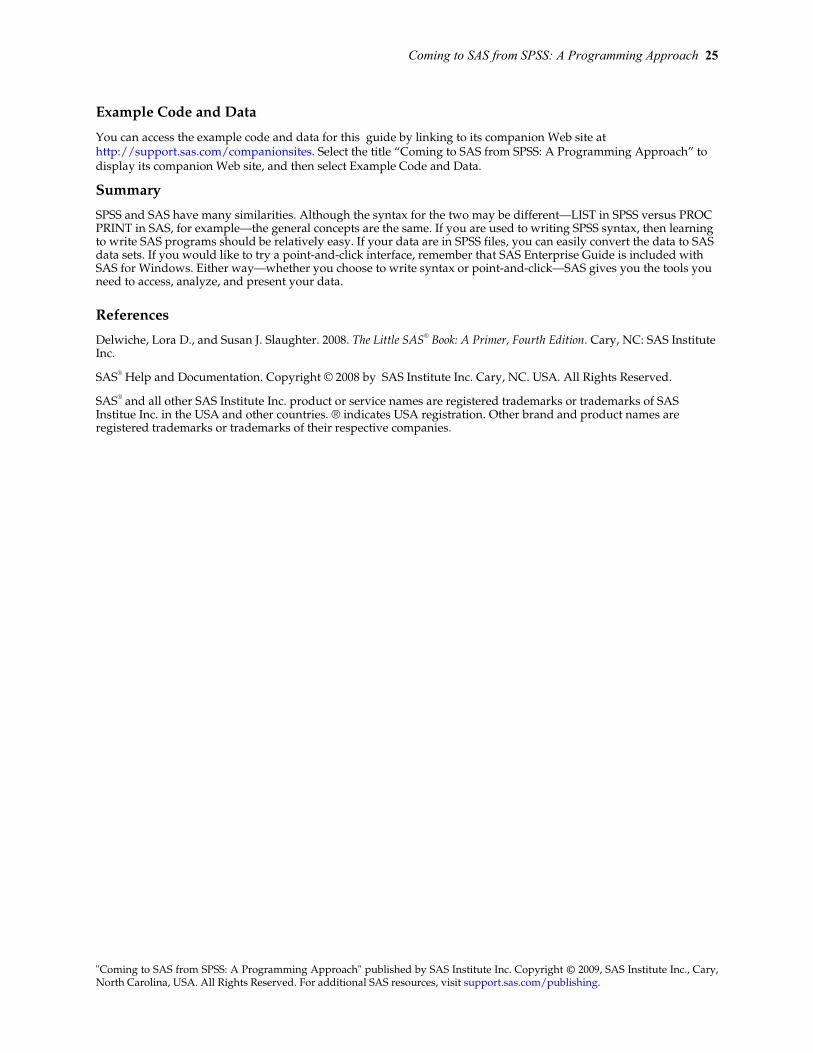
The first page of the output contains the tabular results from the regression analysis, while the remaining pages contain the graphs produced by default when you use the ODS GRAPHICS ON statement.
Coming to SAS from SPSS: A Programming Approach 23
"Coming to SAS from SPSS: A Programming Approach" published by SAS Institute Inc. Copyright © 2009, SAS Institute Inc., Cary, North Carolina, USA. All Rights Reserved. For additional SAS resources, visit support.sas.com/publishing.
24 Coming to SAS from SPSS: A Programming Approach
"Coming to SAS from SPSS: A Programming Approach" published by SAS Institute Inc. Copyright © 2009, SAS Institute Inc., Cary, North Carolina, USA. All Rights Reserved. For additional SAS resources, visit support.sas.com/publishing.
By adding one simple statement to turn on ODS Graphics, you get plots of diagnostics, residuals, and prediction and confidence limits to help you understand your data and interpret your results. Several options are available to make modifications to the plots and to select which plots are produced. In addition, SAS has procedures that allow you to create a wide variety of stand-alone graphs. The SGPLOT procedure (new with SAS 9.2) creates several graph types including bar charts, histograms, box plots, regression lines with confidence bands, and spline or loess fitted curves. For more information, see SAS Help and Documentation.
Coming to SAS from SPSS: A Programming Approach 25
"Coming to SAS from SPSS: A Programming Approach" published by SAS Institute Inc. Copyright © 2009, SAS Institute Inc., Cary, North Carolina, USA. All Rights Reserved. For additional SAS resources, visit support.sas.com/publishing.
Example Code and Data
You can access the example code and data for this guide by linking to its companion Web site at http://support.sas.com/companionsites. Select the title “Coming to SAS from SPSS: A Programming Approach” to display its companion Web site, and then select Example Code and Data.
Summary
SPSS and SAS have many similarities. Although the syntax for the two may be different—LIST in SPSS versus PROC PRINT in SAS, for example—the general concepts are the same. If you are used to writing SPSS syntax, then learning to write SAS programs should be relatively easy. If your data are in SPSS files, you can easily convert the data to SAS data sets. If you would like to try a point-and-click interface, remember that SAS Enterprise Guide is included with SAS for Windows. Either way—whether you choose to write syntax or point-and-click—SAS gives you the tools you need to access, analyze, and present your data.
References
Delwiche, Lora D., and Susan J. Slaughter. 2008. The Little SAS® Book: A Primer, Fourth Edition. Cary, NC: SAS Institute Inc.
SAS® Help and Documentation. Copyright © 2008 by SAS Institute Inc. Cary, NC. USA. All Rights Reserved.
SAS® and all other SAS Institute Inc. product or service names are registered trademarks or trademarks of SAS Institue Inc. in the USA and other countries. ® indicates USA registration. Other brand and product names are registered trademarks or trademarks of their respective companies.
Recommended