Rojas GR /et al/Colombia Médica - Vol. 46 Nº3 2015 (Jul-Sep)
109
AbstractIntroduction: The in vitro-in vivo pharmacokinetic correlation models (IVIVC) are a fundamental part of the drug discovery and development process. The ability to accurately predict the in vivo pharmacokinetic profile of a drug based on in vitro observations can have several applications during a successful development process. Objective: To develop a comprehensive model to predict the in vivo absorption of antiretroviral drugs based on permeability studies, in vitro and in vivo solubility and demonstrate its correlation with the pharmacokinetic profile in humans. Methods: Analytical tools to test the biopharmaceutical properties of stavudine, lamivudine y zidovudine were developed. The kinetics of dissolution, permeability in caco-2 cells and pharmacokinetics of absorption in rabbits and healthy volunteers were evaluated. Results: The cumulative areas under the curve (AUC) obtained in the permeability study with Caco-2 cells, the dissolution study and the pharmacokinetics in rabbits correlated with the cumulative AUC values in humans. These results demonstrated a direct relation between in vitro data and absorption, both in humans and in the in vivo model.Conclusions: The analytical methods and procedures applied to the development of an IVIVC model showed a strong correlation among themselves. These IVIVC models are proposed as alternative and cost/effective methods to evaluate the biopharmaceutical properties that determine the bioavailability of a drug and their application includes the development process, quality assurance, bioequivalence studies and pharmacosurveillance.
Article history:
Received: 09 July 2014Revised: 06 March 2015Accepted: 20 August 2015
Keywords:Antiretrovirals, permeability, dissolution, pharmacokinetics, bioavailability, correlation.
Palabras clave:antirretrovirales, permeabilidad, disolución, farmacocinética, biodisponibilidad, correlación.
Corresponding author:Ricardo Rojas Gómez. Centro Internacional de Entrenamiento e Investigaciones Médicas (CIDEIM), Carrera 125 No 19-225, AA 5390, Cali, Colombia. E-mail: [email protected].
ResumenIntroducción: Los modelos de correlación In vitro-in vivo (IVIVC) son parte integral del proceso de investigación y desarrollo de fármacos. La capacidad de predecir con exactitud el perfil in vivo a partir de las observaciones in vitro tiene diversas aplicaciones durante el desarrollo exitoso de una formulación. Objetivo: Desarrollar un modelo integral para predecir la absorción in vivo de fármacos antirretrovirales con base en estudios de permeabilidad, solubilidad in vitro e in vivo y demostrar su correlación con la farmacocinética en humanos.Métodos: Se desarrollaron y validaron las técnicas bioanalíticas para valorar las propiedades biofarmacéuticas de Estavudina, Lamivudina y Zidovudina. Se evaluó las cineticas de disolución, la permeabilidad en monocapas celulares Caco-2 y la farmacocinética de absorción in vivo en conejos y voluntarios sanos. Resultados: Los valores de AUC acumulados en el sistema de células Caco-2, en la disolución y en el modelo animal, fueron correlacionados con los valores de AUC acumulados en el humano. Con lo anterior se demostró una relación directamente proporcional entre los resultados in vitro con respecto a los obtenidos en la fase de absorción tanto en el humano como en el modelo animal. Conclusiones: Los métodos analíticos y procedimientos aplicados en la IVIVC demostraron las correspondencias directas entre sí, con altos niveles de correlación. Se proponen estos modelos IVIVC como métodos alternativos costo/efectivos para la valoración de las propiedades biofarmacéuticas que determinan la biodisponibilidad, en el desarrollo de productos, en el aseguramiento de la calidad y como pruebas de bioequivalencia en los programas de farmacovigilancia.
Original Article
In vitro-in vivo Pharmacokinetic correlation model for quality assurance of antiretroviral drugs
Modelo de correlación farmacocinético in vitro-in vivo para el aseguramiento de la calidad de medicamentos antirretrovirales
Ricardo Rojas Gómez, Piedad Restrepo Valencia
Centro Internacional de Entrenamiento e Investigaciones Médicas (CIDEIM), Cali, Colombia.
Rojas GR, Restrepo VP. In vitro-in vivo Pharmacokinetic correlation model for quality assurance of antiretroviral drugs. Colomb Med. 2015; 46(3): 109-16.
© 2015. Universidad del Valle. This is an Open Access article distributed under the terms of the Creative Commons Attribution License, which permits unrestricted use, distribution, and reproduction in any medium, provided the original author and source are credited.
Colombia Médicacolombiamedica.univalle.edu.co
Rojas GR /et al/Colombia Médica - Vol. 46 Nº3 2015 (Jul-Sep)
110
Introduction
The in vitro-in vivo pharmacokinetic correlation models (IVIVC) are a fundamental part of the drug discovery and development process. These models can accurately predict the in vivo behavior of drugs based on in vitro observations, and their applications include: pharmacokinetic properties testing, quality assurance, pharmacosurveillance and quality control during the development and scale up of a formulation. Correlation is defined, according to the United States Food and Drug Administration (FDA), as “a predictive mathematical model describing the relationship between an in vitro property of a dosage form and an in vivo response”. The property of solid dosage forms most commonly applied for in vitro development and quality control tests is the rate of dissolution of the drug and it is usually correlated with the concentration or amount of drug absorbed that reach the plasma circulation at certain time1. Therefore, an IVIVC model based on dissolution tests allows to predict the in vivo behavior of some drugs.
Even though the correlation between in vitro dissolution and in vivo absorption has been recognized, no many comprehensive models that include complementary properties to improve the predictive capacity have been developed. Comprehensive models are required taking into account the physical, chemical and biological factors involve in the dissolution and absorption of drugs. The physicochemical and biopharmaceutical properties of the drug and the physiology of the routes of absorption have to be taken into consideration.
The solubility is determined by factors like the percentage of ionized drug, which determines different properties of the compounds, depending on the pH at the site of dissolution. This is very relevant because the human body displays pH gradients, especially in the gastrointestinal tract (GI), this pH gradient leads to differences in the absorption profile depending on the in vivo pH2.
The goal of this study was to develop a comprehensive model to predict the in vivo pharmacokinetic behavior of antiretroviral drugs at the absorption phase, based on in vitro permeability and solubility measurements. The rationale behind this study is set in the current context where advances in the pharmaceutical sciences, the pharmaceutical industry and the government health agencies have consolidated the quality assessment of pharmaceutical products by in vivo bioavailability studies in humans. However, the financial and ethical implications of these studies require the development of alternatives that can substitute the use of humans. These alternatives should consider the physicochemical properties and permeability of the molecules, according to the Biopharmaceutics Classification System (BCS)3.
Materials and Methods
ReagentsThe analytical standards and dosage forms of stavudine (d4T), lamivudine (3TC) and zidovudine (AZT) were provided by Humax Pharmaceutical (Medellin, Colombia). Dulbecco’s modified Eagle’s medium (DMEM) supplemented with L-Glutamine, nonessential amino acids (NEA 100X), Hanks balanced salt solution (HBSS),
(N-[2-Hydroxyethyl]piperazine-N’-[2-ethanesulfonic acid]) sodium salt (HEPES), sodium bicarbonate and penicillin/streptomycin 100X were purchase form Sigma-Aldrich. Fetal bovine serum was purchased from Gibco and all the reagents were prepared in accordance with supplier instructions.
Dissolution The kinetics of in vitro dissolution were performed following the specifications of the United States Pharmacopeia, using the dissolution apparatus 2 (Pharma Aliance Group, Model TDT- 08L). The rotation was set at 50 rpm, the dissolution media was degassed water at a final volume of 900 mL and a temperature of 37° C ± 0.5. Samples were taken at 10, 20, 30, 45 y 60 min.
Caco-2 cells cultureCaco-2 cells (HTB-37) were obtained from the American Type Culture Collection (ATCC). Cells were used between 30 and 50 passes in high glucose (4.5 g/L) DMEM media supplemented with L-Glutamine, 10% fetal bovine serum, 1% nonessential amino acids and 1% penicillin/streptomycin. For the permeability test, 6x10⁴ cells/cm2 were seeded in transwell supports with polycarbonate membrane (0.4 µm, 1.12 cm2; Corning Costar). The integrity of the monolayers was tested by measuring the Transepithelial Electrical Resistance (TEER) before and after every experiment. Only monolayers with TEER higher than 200 Ω/cm2 were used.
The apparent permeability coefficient (Papp) was determined from the amount of drug transported per unit of time and was calculated using the following equation:
Where (ΔQ/Δt) is the accumulated concentration in the recipient compartment (µmol/sec) versus the change in time, A is the surface area of the support (cm2) and C0 is the initial concentration in the donor compartment (µM). The integrity of the system was evaluated using the permeability coefficient (P). The apparent permeability coefficient (Papp) is associated with the permeability coefficient.
Pharmacokinetics in animalsAll protocols and procedures were reviewed and approved by CIDEIM Institutional Review Board for research involving animals, in accordance with national and international guidelines for utmost respect and care of animals, recognizing their intrinsic value as living species, as well as deep reflection on the possibilities of replacement, reduction and refinement of techniques and procedures4-6. In every pharmacokinetic study 10 New Zeeland rabbits were included per group, their weights were between 2.5-3.2 kg. Rabbits were kept at the animal facility under all standard conditions for the handling (20-25° C; 30-70% relative humidity, natural cycle of light/dark), with access to water and food ad libitum up to 2 hours before the study and one hour after the administration of the drug as an oral aqueous suspension. Each group received a single dose of stavudine 8.9 mg/kg, lamivudine 20.8 mg/kg or zidovudine 41.7 mg/kg. Two milliliters blood samples were taken from the marginal ear vein, before the administration
Papp =(
ΔQ )
Δt
(AxCo)
P=(ΔQ ) x
(Recipient compartment concentrationTranswell support area)
Δt
Rojas GR /et al/Colombia Médica - Vol. 46 Nº3 2015 (Jul-Sep)
111
of the drug and up to 6 hours after administration, at the following time points for lamivudine and zidovudine: 0.0, 0.25, 0.5, 0.75, 1.0, 2.0, 3.0, 4.0 and 6.0 h. For stavudine, samples were collected up to 3 hours after the administration at 0.0, 0.08, 0.17, 0.25, 0.33, 0.5, 0.75, 1.0, 2.0 and 3 h. Samples were centrifuged at 1,500 rpm for 20 min and plasma was analyzed by high performance liquid chromatography (HPLC) for the quantification of each active pharmaceutical ingredient (API).
Pharmacokinetics in humans The study and the protocols were approved by CIDEIM Institutional Review Board for research, in accordance with the Declaration of Helsinki (October 2008), the International ethical guidelines for research involving human subjects of the Council for International Organizations of Medical Sciences (CIOMS) and the Colombian Ministry of Social Protection Resolution 2378 from 2008. This study was designed as a randomized, open-label, one-way, one sequence and single-dose study. The participants of the study were 18-35 yrs old males, between ±15% ideal weight, healthy according to the physical examination and the laboratory tests (serum biochemistry, hematology, hepatic function, renal function, thyroid function and urinalysis). After explanation of the study risk and procedures, voluntary, informed, signed consent was provided by each participant. Ten volunteers received a single capsule of stavudine 40 mg (Humax Pharmaceutical) and the second group of 9 volunteers received a single combined tablet of lamivudine 150 mg/zidovudine 300 mg (Humax pharmaceutical) with 240 mL of water. Blood samples (8 mL) were collected before and up to 12 h after the administration of the drug, from a catheter maintained with saline solution. The sampling intervals were: 0.0, 0.17, 0.33, 0.50, 0.75, 1.0, 1.5, 2.0, 2.5, 3.0, 4.0, 6.0, 9.0 and 12 h.
Sample analysisHuman and rabbit plasma samples were analyzed using a UPLC apparatus equipped with UV diode array detector (LaChrome Ultra, Hitachi). Samples were injected onto a Chromolith® Performance RP-18 column (100x4.6 mm, Merck), using a mobile phase containing 10 mM ammonium acetate buffer and acetonitrile (96:4, pH 6.0) at 35º C. The flow rate was 1.2 mL/min. Plasma proteins were precipitated with methanol and the procedure was validates according to FDA guidelines7.
Statistical analysisPharmacokinetic parameters were calculated using non-compartmental methods, with log transformation of concentration data. The elimination half-life (t½) was estimated from the linear regression of the concentration curve versus time. The area under the plasma concentration curve versus time was determined by the trapezoidal method using the PK Solutions Pharmacokinetics Data Non-compartmental Analysis® software (Summit Research Services, Windows 2.0.6 Excel 2002 Edition). Statgraphics® Plus
4.1. Professional Version (Statistical Graphics Corp) was used for the validation of bioanalytical methods and linearity calculations.
Results
Development and validation of bioanalytical methodsThe methods for identification and quantification of stavudine, lamivudine and zidovudine were developed in plasma for the pharmacokinetic studies and in HBSS for permeability tests. To validate the methods, calibration curves were made by preparing ten different dilutions of the standards (five replicates per concentration) in HBSS or drug free plasma. The linearity was evaluated in the range of 0.25 to 6.0 g/mL for d4T and 3TC, and 0.25 to 8.0 g/mL for AZT. The standards prepared in HBSS and plasma were stable for more than 90 days at -75° +/- 5° C. All methods met the criteria: linearity (R² ≥0.8), precision (CV <15%), accuracy (CV <15%) recovery (> 80%), lower limit of detection and quantification (Table 1).
Dissolution profileThe kinetics of dissolution were determined following pharmacopeia parameters at 10, 15, 20, 30, 45, 60 min in 12 independent tests. The mean value at every time point was used to calculate the logarithmic linear regression and the mathematical model of the dissolution profiles, where y is the percentage of dissolved drug and x is time:
Stavudine: y = 0.0097ln(x) + 3.6246 Lamivudine:y = 0.0345ln(x) + 5.0272 Zidovudine: y = 0.0975ln(x) + 5.6808
Similar interpolation accumulation periods in Caco-2 monolayers and cells accumulated area under the curve (AUC) pharmacokinetics in humans and rabbits was performed (Table 2).
Permeability assays in Caco-2 cellsThe parameters for the permeability assays in cell monolayers were standardized. In addition to test the integrity of the monolayers by TEER, markers for transcellular and paracelullar transport were used, Metoprolol (high permeability) and Mannitol (low permeability), respectively. The Papp of metoprolol was 47.2x10⁻⁶
cm/seg (SD ± 5.5x10⁻⁶, n= 5). On the other hand, it was not possible to determine the Papp for mannitol since the concentrations in the recipient compartment were below the limit of detection. The determination of the changes in concentration in the receiver compartment at 15, 30, 45, 60, 90 and 120 min in ten independent tests allowed us to evaluate the indicators of diffusion (Table 3). The data obtained from first order kinetics were adjusted by least squares regression, with a correlation coefficient >0.99, where y is the concentration (µg/mL) and x is the time (h):
ParameterHanks balanced salt solution Human plasma
Stavudine Lamivudine Zidovudine Stavudine Lamivudine Zidovudine
Linearityy= 1.061x+0.019 y= 0.971x-0.025 y= 0.814x+0.085 y= 1.055x-0.022 y= 0.942x-0.055 y= 0.567x-0.016
R²= 0.9990 R²= 0.999 R²= 0.9901 R²= 0.9958 R²= 0.995 R²= 0.9993Precision (Coefficient of variation %) 2.1 1.9 2.4 2.8 3.5 1.5Accuracy (Relative error %) 0.3 0.1 1.3 4.5 0.2 0.2Low limit of detection (µg/mL) 0.0 0.0 0.0 0.0 0.0 0.0Low limit of quantitation (µg/mL) 0.0 0.0 0.1 0.1 0.1 0.0Recovery (%) 99.1 99.9 97.1 95.6 99.2 99.7
Table 1. Bioanalytical methods validation.
Rojas GR /et al/Colombia Médica - Vol. 46 Nº3 2015 (Jul-Sep)
112
Stavudine: y = 0.9548Ln(x) + 2.1457 Lamivudine: y = 0.9655Ln(x) - 0.0574 Zidovudine: y = 0.8391Ln(x) + 1.6946
These equations were applied to the correlation with dissolution at one hour and the pharmacokinetics in humans and rabbits.
Pharmacokinetics in rabbits The doses administered to the animals (d4T 0.60 mg/Kg, 3TC 2.13 mg/Kg y AZT 4.14 mg/Kg) were normalized with respect to the doses for human volunteers, to calculate the proportionality between them (rabbit/human). These factors were: d4T 14, 3TC 9.78 y AZT 10.06. The plasma concentration results were used to evaluate the absorption and elimination phases in the logarithm of the concentration versus time curve, where y is the concentration of the drug in plasma and x is the sampling time, in the elimination phase (R² >0.97), then:
Stavudine: y = -0.6906x + 1.3588 Lamivudine: y = -0.7271x + 4.2558Zidovudine: y = -0.6206x + 2.9383
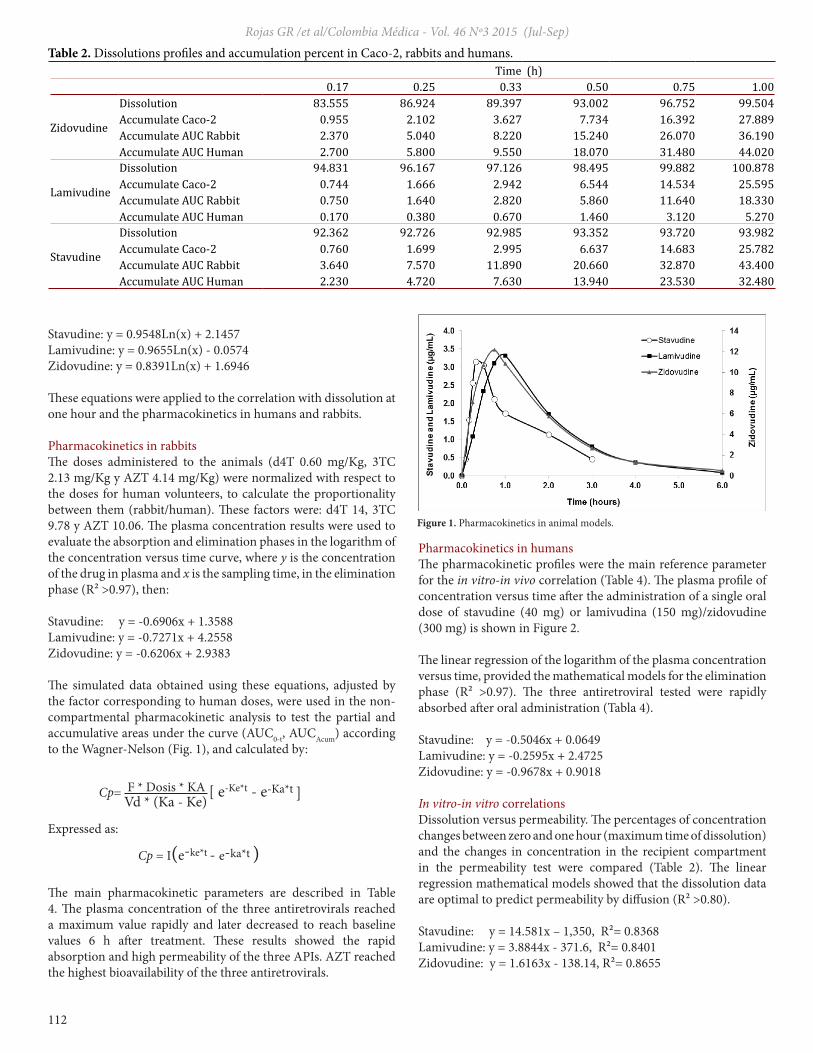
The simulated data obtained using these equations, adjusted by the factor corresponding to human doses, were used in the non-compartmental pharmacokinetic analysis to test the partial and accumulative areas under the curve (AUC0-t, AUCAcum) according to the Wagner-Nelson (Fig. 1), and calculated by:
Expressed as:
The main pharmacokinetic parameters are described in Table 4. The plasma concentration of the three antiretrovirals reached a maximum value rapidly and later decreased to reach baseline values 6 h after treatment. These results showed the rapid absorption and high permeability of the three APIs. AZT reached the highest bioavailability of the three antiretrovirals.
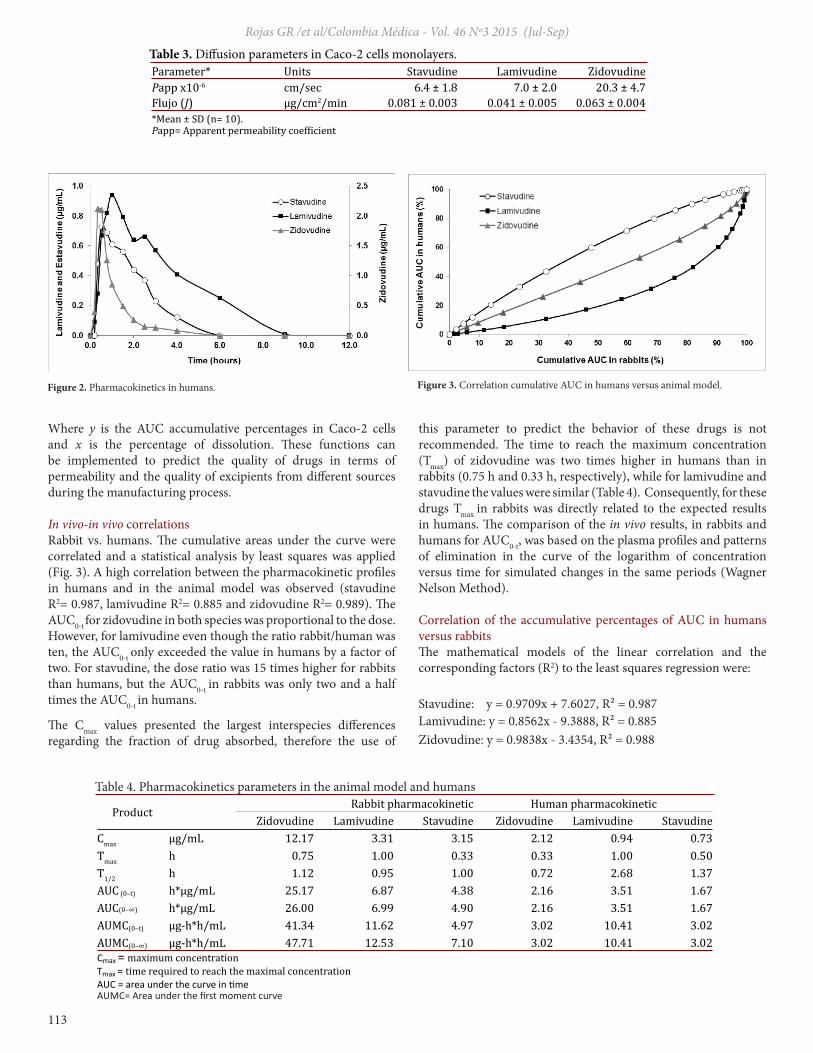
Pharmacokinetics in humans The pharmacokinetic profiles were the main reference parameter for the in vitro-in vivo correlation (Table 4). The plasma profile of concentration versus time after the administration of a single oral dose of stavudine (40 mg) or lamivudina (150 mg)/zidovudine (300 mg) is shown in Figure 2.
The linear regression of the logarithm of the plasma concentration versus time, provided the mathematical models for the elimination phase (R² >0.97). The three antiretroviral tested were rapidly absorbed after oral administration (Tabla 4).
Stavudine: y = -0.5046x + 0.0649Lamivudine: y = -0.2595x + 2.4725Zidovudine: y = -0.9678x + 0.9018
In vitro-in vitro correlationsDissolution versus permeability. The percentages of concentration changes between zero and one hour (maximum time of dissolution) and the changes in concentration in the recipient compartment in the permeability test were compared (Table 2). The linear regression mathematical models showed that the dissolution data are optimal to predict permeability by diffusion (R² >0.80).
Stavudine: y = 14.581x – 1,350, R²= 0.8368Lamivudine: y = 3.8844x - 371.6, R²= 0.8401Zidovudine: y = 1.6163x - 138.14, R²= 0.8655
Time (h)0.17 0.25 0.33 0.50 0.75 1.00
Zidovudine
Dissolution 83.555 86.924 89.397 93.002 96.752 99.504Accumulate Caco-2 0.955 2.102 3.627 7.734 16.392 27.889Accumulate AUC Rabbit 2.370 5.040 8.220 15.240 26.070 36.190Accumulate AUC Human 2.700 5.800 9.550 18.070 31.480 44.020
Lamivudine
Dissolution 94.831 96.167 97.126 98.495 99.882 100.878Accumulate Caco-2 0.744 1.666 2.942 6.544 14.534 25.595Accumulate AUC Rabbit 0.750 1.640 2.820 5.860 11.640 18.330Accumulate AUC Human 0.170 0.380 0.670 1.460 3.120 5.270
Stavudine
Dissolution 92.362 92.726 92.985 93.352 93.720 93.982Accumulate Caco-2 0.760 1.699 2.995 6.637 14.683 25.782Accumulate AUC Rabbit 3.640 7.570 11.890 20.660 32.870 43.400Accumulate AUC Human 2.230 4.720 7.630 13.940 23.530 32.480
Table 2. Dissolutions profiles and accumulation percent in Caco-2, rabbits and humans.
Figure 1. Pharmacokinetics in animal models.
Cp= F * Dosis * KA [ e-Ke*t - e-Ka*t ]
Vd * (Ka - Ke)
Cp = I(e-ke*t - e-ka*t )
Rojas GR /et al/Colombia Médica - Vol. 46 Nº3 2015 (Jul-Sep)
113
Where y is the AUC accumulative percentages in Caco-2 cells and x is the percentage of dissolution. These functions can be implemented to predict the quality of drugs in terms of permeability and the quality of excipients from different sources during the manufacturing process.
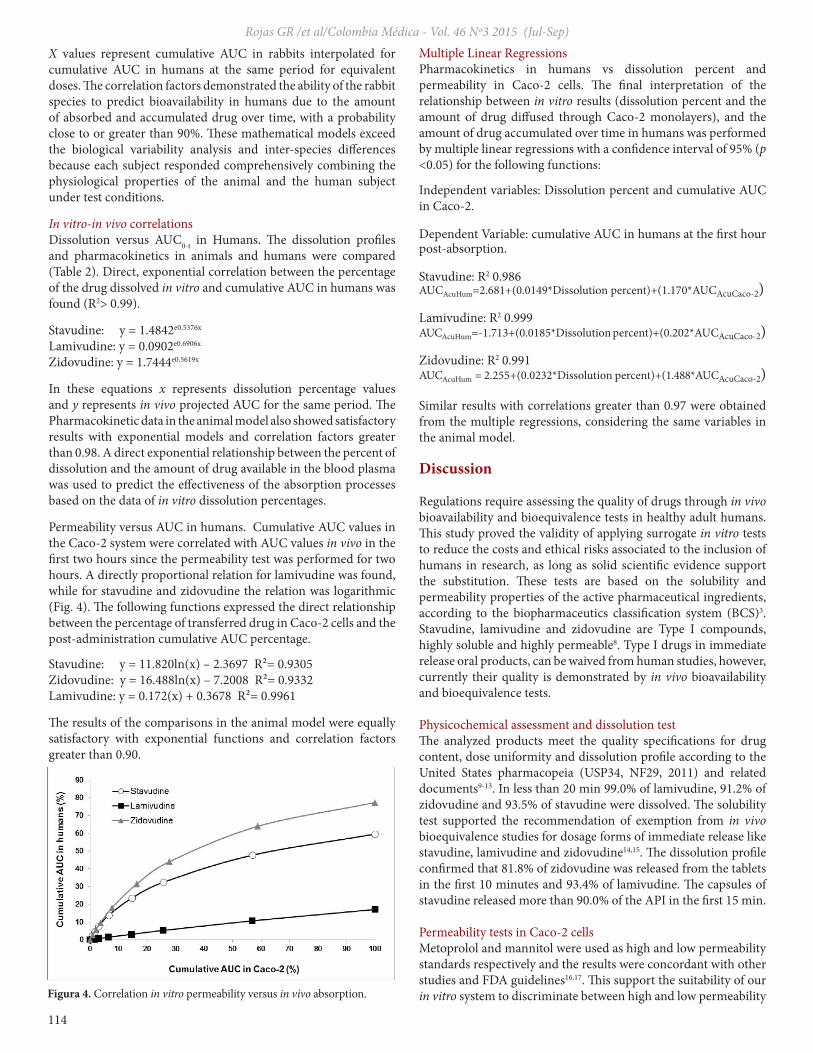
In vivo-in vivo correlationsRabbit vs. humans. The cumulative areas under the curve were correlated and a statistical analysis by least squares was applied (Fig. 3). A high correlation between the pharmacokinetic profiles in humans and in the animal model was observed (stavudine R2= 0.987, lamivudine R2= 0.885 and zidovudine R2= 0.989). The AUC0-t for zidovudine in both species was proportional to the dose. However, for lamivudine even though the ratio rabbit/human was ten, the AUC0-t only exceeded the value in humans by a factor of two. For stavudine, the dose ratio was 15 times higher for rabbits than humans, but the AUC0-t in rabbits was only two and a half times the AUC0-t in humans.
The Cmax values presented the largest interspecies differences regarding the fraction of drug absorbed, therefore the use of
this parameter to predict the behavior of these drugs is not recommended. The time to reach the maximum concentration (Tmax) of zidovudine was two times higher in humans than in rabbits (0.75 h and 0.33 h, respectively), while for lamivudine and stavudine the values were similar (Table 4). Consequently, for these drugs Tmax in rabbits was directly related to the expected results in humans. The comparison of the in vivo results, in rabbits and humans for AUC0-t, was based on the plasma profiles and patterns of elimination in the curve of the logarithm of concentration versus time for simulated changes in the same periods (Wagner Nelson Method).
Correlation of the accumulative percentages of AUC in humans versus rabbitsThe mathematical models of the linear correlation and the corresponding factors (R2) to the least squares regression were:
Stavudine: y = 0.9709x + 7.6027, R² = 0.987Lamivudine: y = 0.8562x - 9.3888, R² = 0.885Zidovudine: y = 0.9838x - 3.4354, R² = 0.988
Parameter* Units Stavudine Lamivudine ZidovudinePapp x10-6 cm/sec 6.4 ± 1.8 7.0 ± 2.0 20.3 ± 4.7Flujo (J) µg/cm2/min 0.081 ± 0.003 0.041 ± 0.005 0.063 ± 0.004*Mean ± SD (n= 10).Papp= Apparent permeability coefficient
Table 3. Diffusion parameters in Caco-2 cells monolayers.
ProductRabbit pharmacokinetic Human pharmacokinetic
Zidovudine Lamivudine Stavudine Zidovudine Lamivudine StavudineCmax µg/mL 12.17 3.31 3.15 2.12 0.94 0.73Tmax h 0.75 1.00 0.33 0.33 1.00 0.50T1/2 h 1.12 0.95 1.00 0.72 2.68 1.37AUC (0–t) h*µg/mL 25.17 6.87 4.38 2.16 3.51 1.67AUC(0–∞) h*µg/mL 26.00 6.99 4.90 2.16 3.51 1.67AUMC(0–t) µg-h*h/mL 41.34 11.62 4.97 3.02 10.41 3.02AUMC(0–∞) µg-h*h/mL 47.71 12.53 7.10 3.02 10.41 3.02Cmax = maximum concentrationTmax = time required to reach the maximal concentrationAUC = area under the curve in timeAUMC= Area under the first moment curve
Table 4. Pharmacokinetics parameters in the animal model and humans
Figure 2. Pharmacokinetics in humans. Figure 3. Correlation cumulative AUC in humans versus animal model.
Rojas GR /et al/Colombia Médica - Vol. 46 Nº3 2015 (Jul-Sep)
114
X values represent cumulative AUC in rabbits interpolated for cumulative AUC in humans at the same period for equivalent doses. The correlation factors demonstrated the ability of the rabbit species to predict bioavailability in humans due to the amount of absorbed and accumulated drug over time, with a probability close to or greater than 90%. These mathematical models exceed the biological variability analysis and inter-species differences because each subject responded comprehensively combining the physiological properties of the animal and the human subject under test conditions.
In vitro-in vivo correlationsDissolution versus AUC0-t in Humans. The dissolution profiles and pharmacokinetics in animals and humans were compared (Table 2). Direct, exponential correlation between the percentage of the drug dissolved in vitro and cumulative AUC in humans was found (R2> 0.99).
Stavudine: y = 1.4842e0.5376x
Lamivudine: y = 0.0902e0.6906x
Zidovudine: y = 1.7444e0.5619x
In these equations x represents dissolution percentage values and y represents in vivo projected AUC for the same period. The Pharmacokinetic data in the animal model also showed satisfactory results with exponential models and correlation factors greater than 0.98. A direct exponential relationship between the percent of dissolution and the amount of drug available in the blood plasma was used to predict the effectiveness of the absorption processes based on the data of in vitro dissolution percentages.
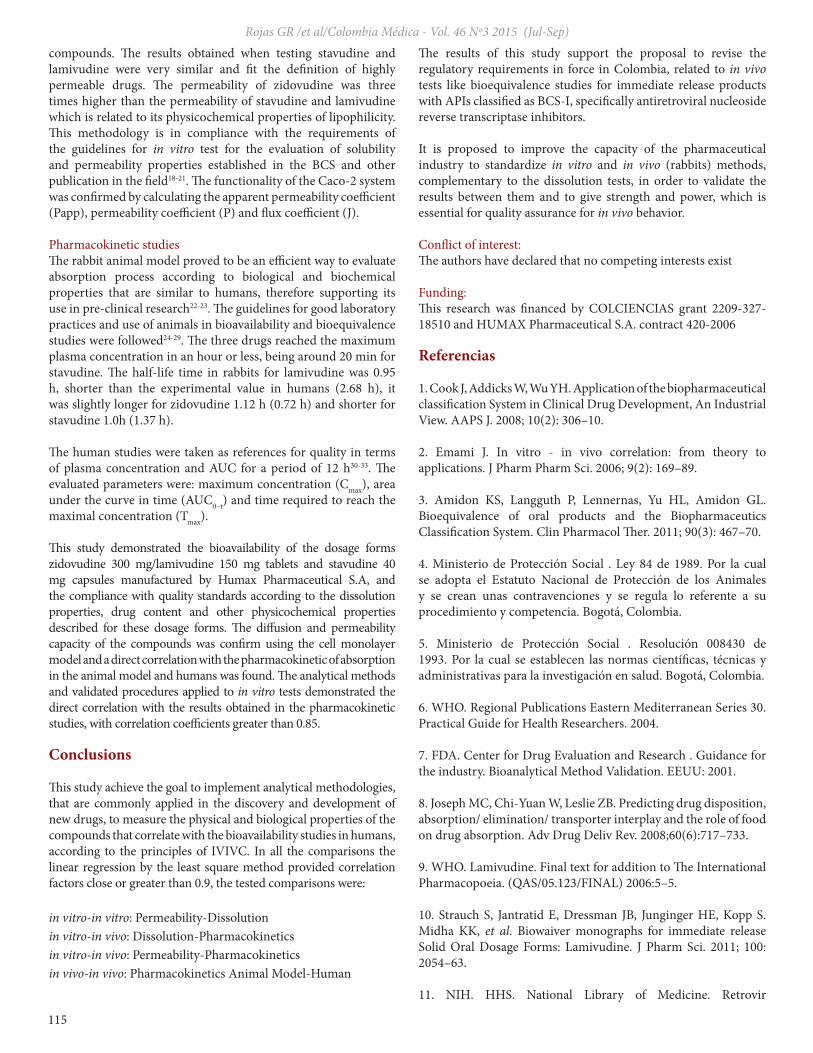
Permeability versus AUC in humans. Cumulative AUC values in the Caco-2 system were correlated with AUC values in vivo in the first two hours since the permeability test was performed for two hours. A directly proportional relation for lamivudine was found, while for stavudine and zidovudine the relation was logarithmic (Fig. 4). The following functions expressed the direct relationship between the percentage of transferred drug in Caco-2 cells and the post-administration cumulative AUC percentage.
Stavudine: y = 11.820ln(x) – 2.3697 R²= 0.9305Zidovudine: y = 16.488ln(x) – 7.2008 R²= 0.9332 Lamivudine: y = 0.172(x) + 0.3678 R²= 0.9961
The results of the comparisons in the animal model were equally satisfactory with exponential functions and correlation factors greater than 0.90.
Multiple Linear RegressionsPharmacokinetics in humans vs dissolution percent and permeability in Caco-2 cells. The final interpretation of the relationship between in vitro results (dissolution percent and the amount of drug diffused through Caco-2 monolayers), and the amount of drug accumulated over time in humans was performed by multiple linear regressions with a confidence interval of 95% (p <0.05) for the following functions: Independent variables: Dissolution percent and cumulative AUC in Caco-2.
Dependent Variable: cumulative AUC in humans at the first hour post-absorption.
Stavudine: R2 0.986AUCAcuHum=2.681+(0.0149*Dissolution percent)+(1.170*AUCAcuCaco-2)
Lamivudine: R2 0.999AUCAcuHum=-1.713+(0.0185*Dissolution percent)+(0.202*AUCAcuCaco-2)
Zidovudine: R2 0.991AUCAcuHum = 2.255+(0.0232*Dissolution percent)+(1.488*AUCAcuCaco-2)
Similar results with correlations greater than 0.97 were obtained from the multiple regressions, considering the same variables in the animal model.
Discussion
Regulations require assessing the quality of drugs through in vivo bioavailability and bioequivalence tests in healthy adult humans. This study proved the validity of applying surrogate in vitro tests to reduce the costs and ethical risks associated to the inclusion of humans in research, as long as solid scientific evidence support the substitution. These tests are based on the solubility and permeability properties of the active pharmaceutical ingredients, according to the biopharmaceutics classification system (BCS)3. Stavudine, lamivudine and zidovudine are Type I compounds, highly soluble and highly permeable8. Type I drugs in immediate release oral products, can be waived from human studies, however, currently their quality is demonstrated by in vivo bioavailability and bioequivalence tests.
Physicochemical assessment and dissolution testThe analyzed products meet the quality specifications for drug content, dose uniformity and dissolution profile according to the United States pharmacopeia (USP34, NF29, 2011) and related documents9-13. In less than 20 min 99.0% of lamivudine, 91.2% of zidovudine and 93.5% of stavudine were dissolved. The solubility test supported the recommendation of exemption from in vivo bioequivalence studies for dosage forms of immediate release like stavudine, lamivudine and zidovudine14,15. The dissolution profile confirmed that 81.8% of zidovudine was released from the tablets in the first 10 minutes and 93.4% of lamivudine. The capsules of stavudine released more than 90.0% of the API in the first 15 min.
Permeability tests in Caco-2 cellsMetoprolol and mannitol were used as high and low permeability standards respectively and the results were concordant with other studies and FDA guidelines16,17. This support the suitability of our in vitro system to discriminate between high and low permeability Figura 4. Correlation in vitro permeability versus in vivo absorption.
Rojas GR /et al/Colombia Médica - Vol. 46 Nº3 2015 (Jul-Sep)
115
compounds. The results obtained when testing stavudine and lamivudine were very similar and fit the definition of highly permeable drugs. The permeability of zidovudine was three times higher than the permeability of stavudine and lamivudine which is related to its physicochemical properties of lipophilicity. This methodology is in compliance with the requirements of the guidelines for in vitro test for the evaluation of solubility and permeability properties established in the BCS and other publication in the field18-21. The functionality of the Caco-2 system was confirmed by calculating the apparent permeability coefficient (Papp), permeability coefficient (P) and flux coefficient (J).
Pharmacokinetic studiesThe rabbit animal model proved to be an efficient way to evaluate absorption process according to biological and biochemical properties that are similar to humans, therefore supporting its use in pre-clinical research22-23. The guidelines for good laboratory practices and use of animals in bioavailability and bioequivalence studies were followed24-29. The three drugs reached the maximum plasma concentration in an hour or less, being around 20 min for stavudine. The half-life time in rabbits for lamivudine was 0.95 h, shorter than the experimental value in humans (2.68 h), it was slightly longer for zidovudine 1.12 h (0.72 h) and shorter for stavudine 1.0h (1.37 h).
The human studies were taken as references for quality in terms of plasma concentration and AUC for a period of 12 h30-33. The evaluated parameters were: maximum concentration (Cmax), area under the curve in time (AUC0–t) and time required to reach the maximal concentration (Tmax).
This study demonstrated the bioavailability of the dosage forms zidovudine 300 mg/lamivudine 150 mg tablets and stavudine 40 mg capsules manufactured by Humax Pharmaceutical S.A, and the compliance with quality standards according to the dissolution properties, drug content and other physicochemical properties described for these dosage forms. The diffusion and permeability capacity of the compounds was confirm using the cell monolayer model and a direct correlation with the pharmacokinetic of absorption in the animal model and humans was found. The analytical methods and validated procedures applied to in vitro tests demonstrated the direct correlation with the results obtained in the pharmacokinetic studies, with correlation coefficients greater than 0.85.
Conclusions
This study achieve the goal to implement analytical methodologies, that are commonly applied in the discovery and development of new drugs, to measure the physical and biological properties of the compounds that correlate with the bioavailability studies in humans, according to the principles of IVIVC. In all the comparisons the linear regression by the least square method provided correlation factors close or greater than 0.9, the tested comparisons were:
in vitro-in vitro: Permeability-Dissolutionin vitro-in vivo: Dissolution-Pharmacokineticsin vitro-in vivo: Permeability-Pharmacokineticsin vivo-in vivo: Pharmacokinetics Animal Model-Human
The results of this study support the proposal to revise the regulatory requirements in force in Colombia, related to in vivo tests like bioequivalence studies for immediate release products with APIs classified as BCS-I, specifically antiretroviral nucleoside reverse transcriptase inhibitors.
It is proposed to improve the capacity of the pharmaceutical industry to standardize in vitro and in vivo (rabbits) methods, complementary to the dissolution tests, in order to validate the results between them and to give strength and power, which is essential for quality assurance for in vivo behavior.
Conflict of interest:The authors have declared that no competing interests exist
Funding:This research was financed by COLCIENCIAS grant 2209-327-18510 and HUMAX Pharmaceutical S.A. contract 420-2006
Referencias
1. Cook J, Addicks W, Wu YH. Application of the biopharmaceutical classification System in Clinical Drug Development, An Industrial View. AAPS J. 2008; 10(2): 306–10.
2. Emami J. In vitro - in vivo correlation: from theory to applications. J Pharm Pharm Sci. 2006; 9(2): 169–89.
3. Amidon KS, Langguth P, Lennernas, Yu HL, Amidon GL. Bioequivalence of oral products and the Biopharmaceutics Classification System. Clin Pharmacol Ther. 2011; 90(3): 467–70.
4. Ministerio de Protección Social . Ley 84 de 1989. Por la cual se adopta el Estatuto Nacional de Protección de los Animales y se crean unas contravenciones y se regula lo referente a su procedimiento y competencia. Bogotá, Colombia.
5. Ministerio de Protección Social . Resolución 008430 de 1993. Por la cual se establecen las normas científicas, técnicas y administrativas para la investigación en salud. Bogotá, Colombia.
6. WHO. Regional Publications Eastern Mediterranean Series 30. Practical Guide for Health Researchers. 2004.
7. FDA. Center for Drug Evaluation and Research . Guidance for the industry. Bioanalytical Method Validation. EEUU: 2001.
8. Joseph MC, Chi-Yuan W, Leslie ZB. Predicting drug disposition, absorption/ elimination/ transporter interplay and the role of food on drug absorption. Adv Drug Deliv Rev. 2008;60(6):717–733.
9. WHO. Lamivudine. Final text for addition to The International Pharmacopoeia. (QAS/05.123/FINAL) 2006:5–5.
10. Strauch S, Jantratid E, Dressman JB, Junginger HE, Kopp S. Midha KK, et al. Biowaiver monographs for immediate release Solid Oral Dosage Forms: Lamivudine. J Pharm Sci. 2011; 100: 2054–63.
11. NIH. HHS. National Library of Medicine. Retrovir
Rojas GR /et al/Colombia Médica - Vol. 46 Nº3 2015 (Jul-Sep)
116
(zidovudine). Current Medication Information, Daily Med. EEUU: December . 2011.
12. NIH. HHS. National Library of Medicine . Stavudine capsule (Mylan Pharmaceuticals Inc). Current Medication Information, Daily Med. EEUU: January . 2012.
13. WHO . Forty-seventh report of the WHO Expert Committee on specifications for pharmaceutical preparations. Technical Report Series 981. WHO; 2013. pp. 202.
14. Department of Health and Human Services,FDA . Office of Generic Drugs Division of Bioequivalence Update Frequency: Quarterly. EEUU: January 11, . 2010.
15. Corti G, Maestrelli F, Cirri M, Zerrouk N, Mura P. Development and evaluation of an in vitro method for prediction of human drug absorption II. Demonstration of the method suitability. Eur J Pharm Sci. 2006;27(4):354–362.
16. Artursson P, Palm K, Luthman K. Caco-2 monolayers in experimental and theoretical predictions of drug transport. Adv Drug Deliv Rev. 2001;46(1-3):27–43.
17. Volpe DA. Application of method suitability for drug permeability classification. AAPS J. 2010;12(4):670–678.
18. Department of Health and Human.Services Food and Drug Administration Center for Drug Evaluation and Research (CDER) Waiver of in vivo bioavailability and bioequivalence studies for immediate-release solid oral dosage forms based on a biopharmaceutics classification system. EEUU: August . 2000.
19. European Medicines Agency, Committee for Medicinal Products for Human Use (CHMP) Guideline on the investigation of bioequivalence. CPMP/EWP/QWP/1401/98 Rev. 1/ Corr. London: January . 2010.
20. Polli JE, Abrahamsson BSI, Yu LX, Amidon GL. Baldoni JM, Cook JA, et al. Summary workshop report: bioequivalence, biopharmaceutics classification system, and beyond. AAPS J. 2008;10(2):373–379.
21. Kumar KV, Swathi Ki, Mamatha RB, Chandramouli R. Caco-2 Cell Lines in Drug Discovery - An Updated Perspective. J Basic Clin Pharm. 2010;1(2):63–69.
22. National Research Council (US) Committee to Update Science, Medicine, and Animals. Science, Medicine, and Animals. Washington (DC): National Academies Press (US); 2004. Committee to Update Science, Medicine, and Animals23. Department of Health and Human Services . ACPS Meeting
Achieving and demonstrating "Quality by Design" with respect to drug release/dissolution performance for conventional or immediate release solid oral dosage forms. EEUU: October . 2005.
24. WHO . Good Laboratory Practices Training Manual. UNDP/World Bank/WHO Special Programme for Research and Training in Tropical Disease (TDR); 2001. pp. 142.
25. Department of Health and Human Services.Food and Drug Administration. Center for Drug Evaluation and Research (CDER) Bioavailability and Bioequivalence Studies for Orally Administered Drug Products-General Considerations. 2003.
26. WHO Marketing Authorization of Pharmaceutical Products with Special Reference to Multisource (generics) Products. (WHO/DMP/RGS/98.5) 1998.
27. The European Agency for the Evaluation of Medicinal Products. Evaluation of Medicines for Human Use. 2000.
28. Políticas de la Asociación Médica Mundial. Declaración de la Asociación Médica Mundial sobre el Uso de Animales en la Investigación Biomédica. Hong Kong: 1989.
29. Tempelman RJ. Experimental design and statistical methods for classical and bioequivalence hypothesis testing with an application to dairy nutrition studies. J Anim Sci. 2004; 82 Suppl: E162–72.
30. Khandave SS, Onkar SV, Sawant SV, Joshi SS. Evaluation of performance of the truncated area under curve (AUC) as a primary pharmacokinetic parameter in bioequivalence studies. J Bioequiv Availab. 2010; 2(4): 77–80.
31. Shargel L, Wo-Pong S, Yub CA. Applied biopharmaceutics and pharmacokinetics. Fifth Edition. United States of America: McGraw Hill; 2005.
32. WHO Annex 8 Proposal to waive in vivo bioequivalence requirements for the WHO Model List of Essential Medicines immediate release, solid oral dosage forms. 2006: 391–437. Technical Report Series No 937.
33. Vacca GCP, Fitzgerald JF, Bermudez JAZ. Definicion de medicamento genérico: un fin o un medio. analisis de la regulacion en 14 paises de la region de las Américas. Rev Panam Salud Publica. 2006; 20(5): 314–23.
Colomb Med. 46(3):109-16
Recommended