Atmospheric Research 122 (2013) 270–283
Contents lists available at SciVerse ScienceDirect
Atmospheric Research
j ourna l homepage: www.e lsev ie r .com/ locate /atmos
Chemical composition of PM2.5 in an urban environment in Chengdu, China:Importance of springtime dust storms and biomass burning
Jun Tao a,b,⁎, Leiming Zhang b,c, Guenter Engling d,⁎⁎, Renjian Zhang b, Yihong Yang a, Junji Cao e,Chongshu Zhu e, Qiyuan Wang e, Lei Luo f
a South China Institute of Environmental Sciences, Ministry of Environmental Protection, Guangzhou, Chinab RCE-TEA, Institute of Atmospheric Physics, Chinese Academy of Sciences, Beijing, Chinac Air Quality Research Division, Science Technology Branch, Environment Canada, Toronto, Canadad Department of Biomedical Engineering and Environmental Sciences, National Tsing Hua University, Hsinchu, Taiwane Key Laboratory of Aerosol, SKLLQG, Institute of Earth Environment, Chinese Academy of Sciences, Xi'an, Chinaf Institute of Plateau Meteorology, China Meteorological Administration, Chengdu, China
a r t i c l e i n f o
⁎ Correspondence to: J Tao, South China Institute of EMinistry of Environmental Protection, Guangzhou, Chin⁎⁎ Corresponding author.
E-mail addresses: [email protected] (J. Tao), guente(G. Engling).
0169-8095/$ – see front matter © 2012 Elsevier B.V. Ahttp://dx.doi.org/10.1016/j.atmosres.2012.11.004
a b s t r a c t
Article history:Received 20 August 2012Received in revised form 15 November 2012Accepted 18 November 2012
Daily PM2.5 samples were collected in Chengdu, a megacity in southwest China, for a period ofone month in every season during 2009–2010. Mass concentrations of water-soluble inorganicions, organic carbon (OC), elemental carbon (EC), levoglucosan (LG), water soluble organiccarbon (WSOC), and elements were determined to identify the chemical characteristics andpotential sources of PM2.5. The data obtained in spring were discussed in detail to explore theimpacts of dust storms and biomass burning on the chemical aerosol properties. The dailyPM2.5 mass concentrations ranged from 49.2 to 425.0 μg m−3 with an annual average of165.1±85.1 μg m−3. The highest seasonal average of PM2.5 concentrations was observed inthe winter (225.5±73.2 μg m−3) and the lowest in the summer (113.5±39.3 μg m−3). Duststorm influence was observed only during the spring, while biomass burning activitiesoccurred frequently in late spring and early summer. In the spring season, water-soluble ions,total carbonaceous aerosols, and the sum of the dominant elements (Al, Si, Ca, Ti, Fe, Mn, Zn,Pb, and Cu) accounted for 30.0±9.3%, 38.6±11.4%, and 6.2±5.3%, respectively, of the totalPM2.5 mass. Crustal element levels evidently increased during the dust storm episode and LG,OC, WSOC, Cl− and K+ concentrations increased by a factor of 2-7 during biomass burningepisodes. Using the Positive Matrix Factorization (PMF) receptor model, four sources for springaerosols were identified, including secondary sulfate and nitrate, motor vehicle emissions, soildust, and biomass burning. The four sources were estimated to contribute 24.6%, 18.8%, 23.6%and 33.0%, respectively, to the total PM2.5 mass.
© 2012 Elsevier B.V. All rights reserved.
Keywords:Fine particlesInorganic ionsOrganic carbonLevoglucosanTrace elementsSource apportionment
1. Introduction
Fineparticulatematterwith aerodynamic diameters less than2.5 μm (PM2.5) has been found to adversely impact humanhealth (Dockery and Pope, 1994; Laden et al., 2000; Samet et al.,
nvironmental Sciences,a.
ll rights reserved.
2000; Pope and Dockery, 2006), visibility (Sisler and Malm,2000; Lowenthal and Kumar, 2005; Pitchford et al., 2007;Watson, 2002), and climate change (Jacob and Winner, 2009).To address these impacts, chemical composition, sources/sinks,and formation mechanisms of PM2.5 need to be understood atlocal, regional, and global scales (McMurry, 2000; Kaufman et al.,2002; Putaud, et al., 2004; Querol et al., 2004; Solomon et al.,2008). Numerous studies on various topics involving PM2.5 havebeen conducted around the world (e.g., Chan, et al., 1999; Leeand Kang, 2001; Lin, 2002; Ho et al., 2003; Putaud, et al., 2004;
271J. Tao et al. / Atmospheric Research 122 (2013) 270–283
Hueglin et al., 2005; Lonati et al., 2005). However, such studies inChina were still limited and were mostly conducted indeveloped regions during the past decade, e.g., the Beijingmetropolitan area, the Yangtze River Delta (YRD), and thePearl River Delta (PRD) (He et al., 2001; Ye et al., 2003;Andreae et al., 2008; Hu et al., 2008; Yang et al., 2011).
Chengdu is one of the biggest cities in China with apopulation of more than 10 million, located in the SichuanBasin of Southwest China. Air pollution is a serious problem inthis city due to the special topography surrounding the city.For example, Longquan Mountain to the east and QionglaiMountain to thewest of the city can render dispersion of locallyproduced pollutants to be ineffective and cause high levels ofpollution under certain weather conditions. To date, only a fewstudies have reported chemical speciation data for PM2.5 in theSichuan Basin (Wei et al., 1999; Cao et al., 2007; Zhao et al.,2010; Yang et al., 2012) and there has been no systematicinvestigation for the city of Chengdu. To fill this knowledge gap,chemically-resolved PM2.5 data were obtained at an urban sitein Chengdu for a period of one month in each season. Eightcarbon fractions, ninewater-soluble ions, water-soluble organiccarbon (WSOC), levoglucosan (LG), and 25 elements weredetermined. While the data from all four seasons are brieflydiscussed in this study, the spring data are discussed in moredetail focusing on the investigation of the impacts of spring duststorms and biomass burning on the chemical properties ofPM2.5.
Studies conducted in the northern regions of China suggestedthat dust storms and local biomass burning activities hadsignificant impacts on the chemical speciation of PM2.5 (Zhanget al., 2003a; Cao et al., 2005; Zhang et al., 2008; Chang et al.,2010; Zhang et al., 2012). There is evidence that dust stormsfrom the Gobi desert and regions in central Asia can reachChongqing (a neighboring city 270 km southeast of Chengdu),causing increased PM2.5 loadings (Zhao et al., 2010). Vast areas offarmland are located adjacent to the west, north, and southwestof Chengdu city. Following the spring harvest, local agriculturalwastes (e.g., rapeseed straw, wheat straw, and waste wood) arecommonly burned to remove unwanted biomass, control pests,and increase soil fertility. Some of the plant residues are also
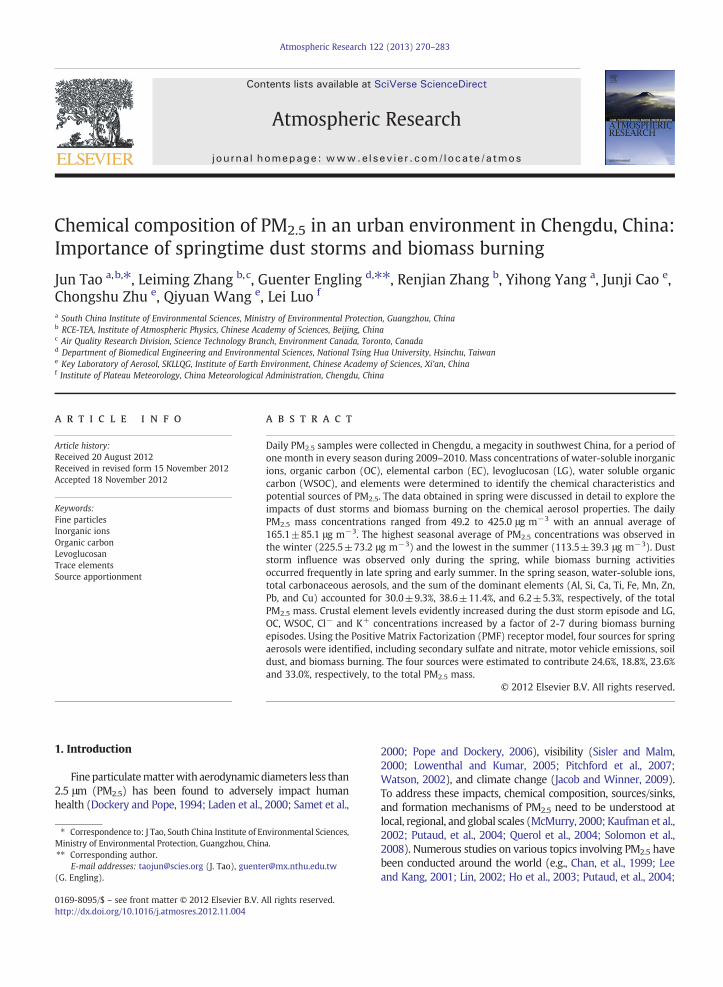
Fig. 1. Location of the sampling
utilized as fuel for cooking in the rural areas surrounding the city.Thus, both dust storms and biomass burning are expected tosignificantly aggravate the air quality of Chengdu. To comple-ment our discussion, routinely monitored PM10 data wereincluded in order to demonstrate the impact of dust storms inthe spring season. In addition, three sets of PM2.5 data obtainedfrom near-source biomass burningmeasurements are presentedfor comparison with the ambient urban PM2.5 data.
2. Methodology
2.1. Data collection
PM2.5 samples were collected at the Institute of PlateauMeteorology (IPM), China Meteorological Administration,located in the urban area of Chengdu (30°39′43″N, 104°00′56″E) (Fig. 1). The instruments used in this study were installed onthe roof (15 m above ground) of an office building of the IPM.The site was surrounded by several streets with typical citytraffic, representative of the urban environment in Chengdu.
The PM2.5 samples were collected using two low-flow airsamplers (MiniVol TAC, AirMetrics Corp., Eugene, OR, USA).Samples were collected at a flow rate of 5 L min−1 on twotypes of filters: 47 mm quartz fiber filters (Whatman QM-A)and 47 mm Teflon filters (Whatman PTFE). Quartz filters werepre-heated at 800 °C for 3 h prior to sampling. The exposedfilters were stored in a freezer at −18 °C before chemicalanalysis to minimize the evaporation of volatile components.Teflon filters were analyzed gravimetrically for particle massconcentrations using a Sartorius MC5 electronic microbalancewith a sensitivity of ±1 μg (Sartorius, Göttingen, Germany)after 24-h equilibration at a temperature between 20 °C and23 °C and a relative humidity (RH) between 35% and 45%. Eachfilter was weighed at least three times before and aftersampling, and the net mass was obtained by subtracting theaverage of the pre-sampling weights from the average of thepost-samplingweights. Differences among replicateweightingswere b10 μg for the blanks and b20 μg for the samples. Prior tothe start of the sampling campaign, the flow rate of the PM2.5
samplers was calibrated. Also, field blank filters were collected
site in Chengdu, China.
272 J. Tao et al. / Atmospheric Research 122 (2013) 270–283
and used to account for the positive artifacts caused byabsorption of volatile organic compounds (VOCs) and to correctfor background concentrations or influences from handling andtransport.
A total of 121 PM2.5 samples and 10 blank samples werecollected during the periods of 19 April to 17 May (represen-tative of spring), 6 July to 6 August (summer), 26 October to 26November (autumn) in 2009, and 1 to 31 January (winter) in2010. The collection duration for each samplewas 24 h (startingat 10:00 local time each day and ending at 10:00 the next day).
Biomass burning smoke particle samples were collected in awheat field in June, 2011 at Huangfeng town, Pengshan County,located 56 km south of Chengdu (30°10′N, 103°58′E) (Fig. 1).Therewas no obvious pollution sourcewithin a 10 kmcircle, andthe air quality was in a good range (air pollutant index, APIb50).A clear sky and calmwind conditions were also favorable for thecollection of pure smoke emissions from the biomass burningnear-source experiments. Three sets of PM2.5 samples werecollected within the biomass burning plumes by a low-flow airsampler (MiniVol TAC, AirMetrics Corp., Eugene, OR, USA)with asampling duration for each source sample of 45 min in theafternoon on 7 June, 2011. Two sets of field blank samples werealso collected, which were obtained by mounting the filters inthe sampler for 15 min without airflow. The samplers werecalibrated before sampling using a calibration orifice.
2.2. Chemical analysis of PM2.5 filter samples
A 0.5 cm2 punch from each quartz filter was analyzed foreight carbon fractions following the IMPROVE_A thermal/optical reflectance (TOR) protocol on a DRI model 2001 carbonanalyzer (Atmoslytic Inc., Calabasas, CA, USA) (Cao et al., 2003;Chow et al., 2007). This analysis produced four OC fractions(OC1, OC2, OC3, and OC4 at 140 °C, 280 °C, 480 °C, and 580 °C,respectively, in a helium [He] atmosphere); OP (a pyrolyzedcarbon fraction determined when transmitted laser lightattained its original intensity after oxygen [O2] was added tothe analysis atmosphere); and three EC fractions (EC1, EC2, andEC3 at 580 °C, 740 °C, and 840 °C, respectively, in a 2% O2/98%He atmosphere). IMPROVE_TOR OC is operationally defined asOC1+OC2+OC3+OC4+OP and EC is defined as EC1+EC2+EC3−OP (Chow et al., 2007). Inter-laboratory compar-ison of samples between IMPROVE_TOR protocol and the TMO(thermalmanganese dioxide oxidation) approach has shown adifference of b5% for TC and b10% for OC and EC (Cao et al.,2003). Average field blanks had OC and EC contents of 1.82 and0.10 μg m−3, respectively, which were subtracted from eachsample filter.
One-fourth of each quartz filter sample was used todetermine the water-soluble ion concentrations. Four anions(SO4
2−, NO3−, Cl−, and F−) and five cations (Na+, NH4
+, K+,Mg2+, and Ca2+) were determined in aqueous extracts of thefilters by ion chromatography (IC, Dionex DX-600, DionexCorp., Sunnyvale, CA, USA). The extraction of water-solublespecies from the quartz filters was achieved by placing the cutportion (1/4) of each filter into a separate 20 mL vial, followedby 10 mL distilled-deionized water (with a resistivity of>18 MΩ), and then subjected to ultrasonic agitation for 1 h,as well as additional shaking (using a mechanical shaker) for1 h, for complete extraction of the ionic compounds. The extractsolutions were filtered (0.25 μm, PTFE, Whatman, USA) and
stored at 4 °C in pre-cleaned tubes until analysis. Cation (Na+,NH4
+, K+,Mg2+, andCa2+) concentrationswere determined byusing a CS12A column (Dionex Corp.) with 20 mMMSA eluent.Anions (SO4
2−, NO3−, Cl−, and F−) were separated on an
AS11-HC column (Dionex Corp.), using 20 mM KOH as theeluent. A calibration was performed for each analyticalsequence. The detection limits (DLs) of Na+, NH4
+, K+, Mg2+,Ca2+, F−, Cl−, NO3
−, and SO42− were 0.0203, 0.0041, 0.0045,
0.0032, 0.0049, 0.0381, 0.0352, 0.1037 and 0.1094 μg m−3,respectively. Standard reference materials (SRMs) obtainedfrom the National Research Center for Certified ReferenceMaterials, China, were analyzed for quality assurance purposes.Procedural blank values were subtracted from sample concen-trations (Shen et al., 2009; Zhang et al., 2011).
A 2.0 cm2 punch from each quartz filter was extracted in15 mL of ultrapure water (Milli-Q Reference system) underultrasonic agitation for 1 h for determination of water-solubleorganic carbon (WSOC). The extracts were filtered through asyringe filter (0.25 μm, PTFE, Whatman, USA) to removeinsoluble materials. WSOC was measured by a Sievers 900 TOCanalyzer (GE Analytical, U.S.A.). The accuracy of the WSOCmethod for this data set, as determined by the average %recovery±one standard deviation of standard mixtures of KHP(potassium hydrogen phthalate), was 107±8%. All sampleswere corrected by laboratory blanks and subsequently by fieldblanks for WSOC contamination of filters, glassware, ultrapurewater, etc. A calibration was performed for each analyticalsequence. The DL ofWSOCwas 0.280 μg m−3. An average blankconcentration per filter area of 1.094 μg C m−3 was subtractedfrom each sample.
An additional portion of each filter (2.0 cm2 punch) wasextracted in 2 mL of ultrapure water under ultrasonic agitationfor 1 h. The extracts were filtered through a syringe filter(0.25 μm, PTFE, Whatman, USA) to remove insoluble materials.The anhydrosugar levoglucosan was measured by a DionexICS-3000 system consisting of SP (quaternary pump), DC(column compartment), and ED (electrochemical detector withgold working electrode) (Dionex Corp., Sunnyvale, CA, USA).Instrumental controls, data acquisition, and chromatographicintegration were performed using Dionex Chromeleon software.A calibrationwas performed for each analytical sequence. TheDLfor LGwas 0.024 μg m−3. A detailed description of the analyticalmethod can be found in Engling et al. (2006) and Iinuma et al.(2009).
Specific elements were quantified using X-ray fluorescenceanalysis (XRF, Epsilon5, PANalytical Company, Netherlands)on Teflon filters, including sodium (Na), magnesium (Mg),aluminum (Al), silica (Si), phosphor (P), sulfur (S), chlorine(Cl), potassium (K), calcium (Ca), titanium (Ti), zinc (Zn), iron(Fe), lead (Pb), manganese (Mn), copper (Cu), vanadium (V),arsenic (As), tin (Sn), bromide (Br), rubidium (Rb), nickel (Ni),selenium (Se), chromium (Cr), cobalt (Co), and strontium (Sr).Quality Assurance/Quality Control (QA/QC) procedures of theXRF analysis procedure were described in Xu et al. (2012).
2.3. Data analysis methods
To identify source regions of dust storms reaching Chengdu,three-day backward trajectories at 02:00 UTC (10:00 localtime) on every sampling day were calculated by the HYSPLIT 4trajectory model (http://ready.arl.noaa.gov/HYSPLIT.php) to
273J. Tao et al. / Atmospheric Research 122 (2013) 270–283
demonstrate the synoptic patterns and associated long-rangetransport routes of air masses. The model adopts meteorolog-ical data from FNL (Final Operational Global Analysis) as theinput. The aerosol index determined from TOMS on board ofNASA's Earth Probe satellite (available at http://toms.gsfc.nasa.gov/) was used to obtain the geographical distribution ofaerosols in the region of interest during the dust storm episode.
Source apportionment was conducted using EPA PMF 3.0Model (Norris et al., 2008). The uncertainties for the LG andWSOC data were based on the standard deviation of repeatedanalysis of standard reference materials, field blanks, andinstrumental detection limits. For the inorganic ions andcarbon fractions detected in the blanks and samples, theuncertainty was calculated from the square root of the sum ofthe squares of the standard deviation of the blanks and theanalytical uncertainty. The analytical uncertainty for eachcompound was calculated as the measured value timesthe relative uncertainty of the compound in the replicatemeasurements of the standard reference materials. Thedetected concentrations of the eight carbon fractions, eightwater-soluble ions (except Mg2+), water-soluble organiccarbon (WSOC), and LG were larger than their respective DLs.However, only 10 (Al, Si, Ca, Ti, Fe, Cr, Mn, Zn, Pb, and Cu) outof the 25 elements had the average concentrations higherthan the DLs. Therefore, we only used these 10 elements forthe PMF analysis. For the 10 selected elements, four out of the29 (or 13.8%) bulk PM2.5 samples had Cr concentrationslower than its DL. Thus, we assumed 1/2 DL concentrationand an uncertainty of 5/6 DL for Cr only for these foursamples following the suggestion of Polissar et al. (1998).Based on the magnitudes of the concentrations of thechemical species determined, a total of 22 dominant species(OC, EC, Na+, NH4
+, K+, Ca2+, F−, Cl−, NO3−, SO4
2−, WSOC, LG,Al, Si, Ca, Ti, Fe, Cr,Mn, Zn, Pb and Cu)were selected for the PMFanalyses. To obtain source identification, 29 (samples)×23(chemical species) was input into the PMF model.
According to the IMPROVE equations, the dry PM2.5 massconcentration can be reconstructed according to the IMPROVEReport V (2011):
½PM2:5� ¼ ½ðNH4Þ2SO4� þ ½NH4NO3� þ ½POM� þ ½LAC� þ ½Soil�
where [(NH4)2SO4]=1.375 [SO42−], [NH4NO3]=1.29 [NO3
−],[POM] is particulate organic matter ([POM]=2.0 [OC]) (Chenand Yu, 2007; Andreae et al., 2008), [LAC] is light absorbingcarbon, referred to as [EC], and [Soil] is soil concentration([Soil]=2.2 [Al]+2.49 [Si]+1.63 [Ca]+2.42 [Fe]+1.94 [Ti]).
3. Results and discussion
3.1. Overview of PM10 and PM2.5 mass concentrations
To identify the occurrence of dust storms and gain ageneral knowledge of the PM levels in Chengdu city, PM10
data in 2009 are first briefly evaluated. Daily PM10 concen-trations were available from the Caotang national environ-mental monitoring site (30°39′15″N, 104°01′43″E) (Fig. 1),located 1.5 km southeast of the IPM site. Meteorological datawere obtained from a national meteorological station (30°42′N, 103°50′E) located 18 km away from IPM (Fig. 1). Monthly
average PM10 data and several meteorological parameters areshown in Fig. 2.
Clear seasonal variations in PM10 concentrations wereobserved throughout the year, with the lowest concentra-tions in the summer and the highest in the winter and fall.The low concentrations in the summer were likely due to thefrequent rainfall since precipitation scavenging is an efficientway of removing particles from the atmosphere. In fact, 70%of the annual precipitation occurred during the three-monthperiod from July to September. High PM10 concentrations inthe winter and fall might be at least partly due to the lowermixing height and low wind speeds, both rendering disper-sion of pollutants less effective. The daily PM mass data(figure not shown) revealed the highest concentration(668 μg m−3) on 24 April, 2009. On this day, a dust stormevent was observed across a large area of northern China(Wang et al., 2011). It is plausible that the same dust eventalso affected Chengdu. In comparison, the second highestdaily concentration in Chengdu was only 372 μg m−3 on 18January, 2009.
The PM2.5 mass concentrations were derived from gravi-metric analyses of 121 sample filters. The daily PM2.5 massconcentrations ranged from 49.2 to 425.0 μg m−3 withan annual average of 165.1±85.1 μg m−3, exceeding theChinese National Ambient Air Quality Standards (GB3095-2012) (35 μg m−3) by a factor of ~4.7. This suggests that thePM2.5 pollution at Chengdu was serious and control measuresshould be undertaken to alleviate the PM2.5 loading. Theseasonal patterns in PM2.5 concentrations were similar tothose of PM10, with averages decreasing in the order of winter(225.5±73.2 μg m−3), autumn (188.0±106.9 μg m−3), spring(133.2±55.5 μg m−3), and summer (113.5±39.3 μg m−3).The spring PM2.5 level in Chengdu was evidently higher thanthose in many other megacities in China, such as Beijing(88.6 μg m−3) (He et al., 2001), Guangzhou (79.2 μg m−3)(Tao et al., 2009), and Shanghai (61.7 μg m−3) (Ye et al., 2003).
PM2.5 mass concentrations were reconstructed in fourseasons according to the IMPROVE equations presented inSection 2.3 (Fig. 3). The percentages of POM and Soil in PM2.5
were 31.1% and 15.0%, respectively, in the spring, which weresignificantly higher than in any other season. The correlationbetween OC and EC in the spring was much lower (R2=0.32)compared to other seasons (R2=0.69–0.88) (Fig. 4). Theseresults indicate that the sources for carbonaceous aerosolswere more complex in the spring than in the other seasons,and that dust storms and biomass burning played moreimportant roles during spring. Thus, in the following sections,the impacts of dust storms and biomass burning on PM2.5
characteristics were investigated in detail and major sourcescontributing to spring PM2.5 were explored using the PositiveMatrix Factorization (PMF) method.
3.2. Identification of dust storm and biomass burning episodes inspringtime
Crustal elements (Al, Si, Ca, Ti, and Fe) have been com-monly used as source tracers of dust storm influence (Zhanget al., 2003b). The anhydrosugar levoglucosan (LG), derivedfrom the thermal degradation of cellulose, has been widelyused as amolecular source tracer of biomass burning emissions(Engling et al., 2006; Zhang et al., 2008, 2010; Kundu et al.,
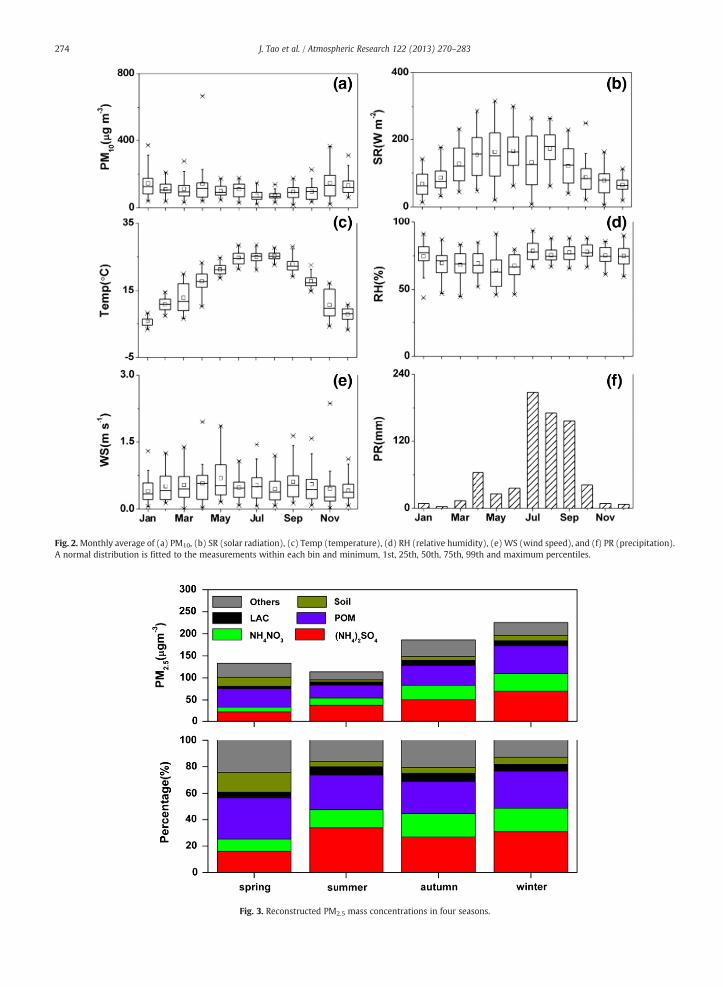
Fig. 2.Monthly average of (a) PM10, (b) SR (solar radiation), (c) Temp (temperature), (d) RH (relative humidity), (e) WS (wind speed), and (f) PR (precipitation).A normal distribution is fitted to the measurements within each bin and minimum, 1st, 25th, 50th, 75th, 99th and maximum percentiles.
Fig. 3. Reconstructed PM2.5 mass concentrations in four seasons.
274 J. Tao et al. / Atmospheric Research 122 (2013) 270–283
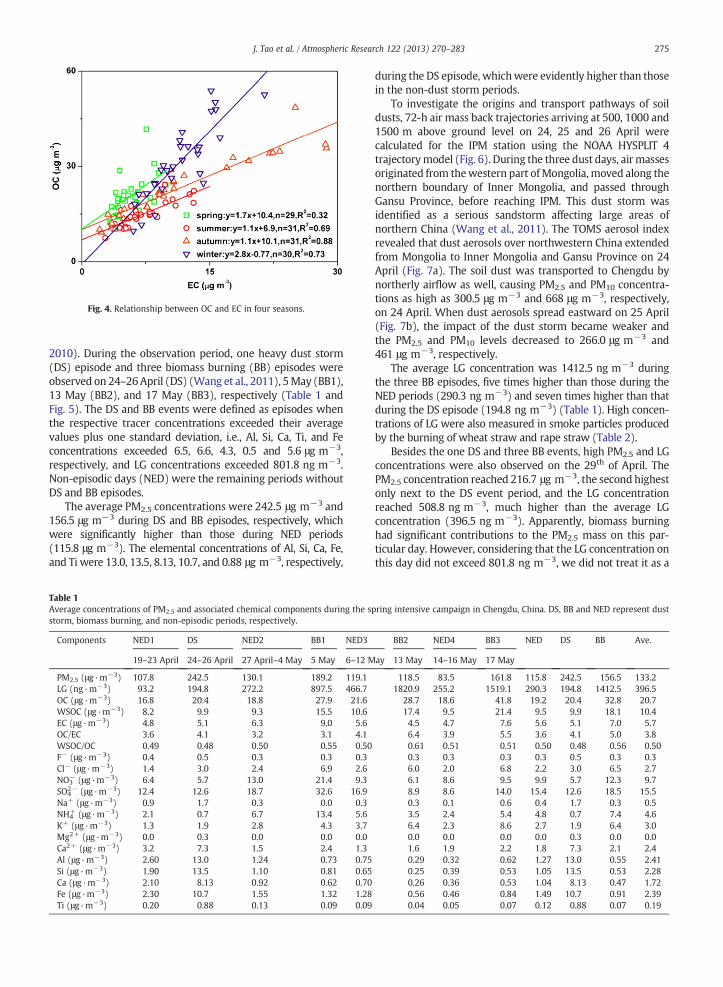
Fig. 4. Relationship between OC and EC in four seasons.
275J. Tao et al. / Atmospheric Research 122 (2013) 270–283
2010). During the observation period, one heavy dust storm(DS) episode and three biomass burning (BB) episodes wereobserved on 24–26April (DS) (Wang et al., 2011), 5May (BB1),13 May (BB2), and 17 May (BB3), respectively (Table 1 andFig. 5). The DS and BB events were defined as episodes whenthe respective tracer concentrations exceeded their averagevalues plus one standard deviation, i.e., Al, Si, Ca, Ti, and Feconcentrations exceeded 6.5, 6.6, 4.3, 0.5 and 5.6 μg m−3,respectively, and LG concentrations exceeded 801.8 ng m−3.Non-episodic days (NED) were the remaining periods withoutDS and BB episodes.
The average PM2.5 concentrations were 242.5 μg m−3 and156.5 μg m−3 during DS and BB episodes, respectively, whichwere significantly higher than those during NED periods(115.8 μg m−3). The elemental concentrations of Al, Si, Ca, Fe,and Ti were 13.0, 13.5, 8.13, 10.7, and 0.88 μg m−3, respectively,
Table 1Average concentrations of PM2.5 and associated chemical components during the sstorm, biomass burning, and non-episodic periods, respectively.
Components NED1 DS NED2 BB1 NED3
19–23 April 24–26 April 27 April–4 May 5 May 6–12 M
PM2.5 (μg·m−3) 107.8 242.5 130.1 189.2 119.1LG (ng·m−3) 93.2 194.8 272.2 897.5 466.7OC (μg·m−3) 16.8 20.4 18.8 27.9 21.6WSOC (μg·m−3) 8.2 9.9 9.3 15.5 10.6EC (μg·m−3) 4.8 5.1 6.3 9.0 5.6OC/EC 3.6 4.1 3.2 3.1 4.1WSOC/OC 0.49 0.48 0.50 0.55 0.50F− (μg·m−3) 0.4 0.5 0.3 0.3 0.3Cl− (μg·m−3) 1.4 3.0 2.4 6.9 2.6NO3
− (μg·m−3) 6.4 5.7 13.0 21.4 9.3SO4
2− (μg·m−3) 12.4 12.6 18.7 32.6 16.9Na+ (μg·m−3) 0.9 1.7 0.3 0.0 0.3NH4
+ (μg·m−3) 2.1 0.7 6.7 13.4 5.6K+ (μg·m−3) 1.3 1.9 2.8 4.3 3.7Mg2+ (μg·m−3) 0.0 0.3 0.0 0.0 0.0Ca2+ (μg·m−3) 3.2 7.3 1.5 2.4 1.3Al (μg·m−3) 2.60 13.0 1.24 0.73 0.75Si (μg·m−3) 1.90 13.5 1.10 0.81 0.65Ca (μg·m−3) 2.10 8.13 0.92 0.62 0.70Fe (μg·m−3) 2.30 10.7 1.55 1.32 1.28Ti (μg·m−3) 0.20 0.88 0.13 0.09 0.09
during the DS episode, whichwere evidently higher than thosein the non-dust storm periods.
To investigate the origins and transport pathways of soildusts, 72-h air mass back trajectories arriving at 500, 1000 and1500 m above ground level on 24, 25 and 26 April werecalculated for the IPM station using the NOAA HYSPLIT 4trajectorymodel (Fig. 6). During the three dust days, airmassesoriginated from thewestern part ofMongolia,moved along thenorthern boundary of Inner Mongolia, and passed throughGansu Province, before reaching IPM. This dust storm wasidentified as a serious sandstorm affecting large areas ofnorthern China (Wang et al., 2011). The TOMS aerosol indexrevealed that dust aerosols over northwestern China extendedfrom Mongolia to Inner Mongolia and Gansu Province on 24April (Fig. 7a). The soil dust was transported to Chengdu bynortherly airflow as well, causing PM2.5 and PM10 concentra-tions as high as 300.5 μg m−3 and 668 μg m−3, respectively,on 24 April. When dust aerosols spread eastward on 25 April(Fig. 7b), the impact of the dust storm became weaker andthe PM2.5 and PM10 levels decreased to 266.0 μg m−3 and461 μg m−3, respectively.
The average LG concentration was 1412.5 ng m−3 duringthe three BB episodes, five times higher than those during theNED periods (290.3 ng m−3) and seven times higher than thatduring the DS episode (194.8 ng m−3) (Table 1). High concen-trations of LG were also measured in smoke particles producedby the burning of wheat straw and rape straw (Table 2).
Besides the one DS and three BB events, high PM2.5 and LGconcentrations were also observed on the 29th of April. ThePM2.5 concentration reached 216.7 μg m−3, the second highestonly next to the DS event period, and the LG concentrationreached 508.8 ng m−3, much higher than the average LGconcentration (396.5 ng m−3). Apparently, biomass burninghad significant contributions to the PM2.5 mass on this par-ticular day. However, considering that the LG concentration onthis day did not exceed 801.8 ng m−3, we did not treat it as a
pring intensive campaign in Chengdu, China. DS, BB and NED represent dust
BB2 NED4 BB3 NED DS BB Ave.
ay 13 May 14–16 May 17 May
118.5 83.5 161.8 115.8 242.5 156.5 133.21820.9 255.2 1519.1 290.3 194.8 1412.5 396.5
28.7 18.6 41.8 19.2 20.4 32.8 20.717.4 9.5 21.4 9.5 9.9 18.1 10.44.5 4.7 7.6 5.6 5.1 7.0 5.76.4 3.9 5.5 3.6 4.1 5.0 3.80.61 0.51 0.51 0.50 0.48 0.56 0.500.3 0.3 0.3 0.3 0.5 0.3 0.36.0 2.0 6.8 2.2 3.0 6.5 2.76.1 8.6 9.5 9.9 5.7 12.3 9.78.9 8.6 14.0 15.4 12.6 18.5 15.50.3 0.1 0.6 0.4 1.7 0.3 0.53.5 2.4 5.4 4.8 0.7 7.4 4.66.4 2.3 8.6 2.7 1.9 6.4 3.00.0 0.0 0.0 0.0 0.3 0.0 0.01.6 1.9 2.2 1.8 7.3 2.1 2.40.29 0.32 0.62 1.27 13.0 0.55 2.410.25 0.39 0.53 1.05 13.5 0.53 2.280.26 0.36 0.53 1.04 8.13 0.47 1.720.56 0.46 0.84 1.49 10.7 0.91 2.390.04 0.05 0.07 0.12 0.88 0.07 0.19
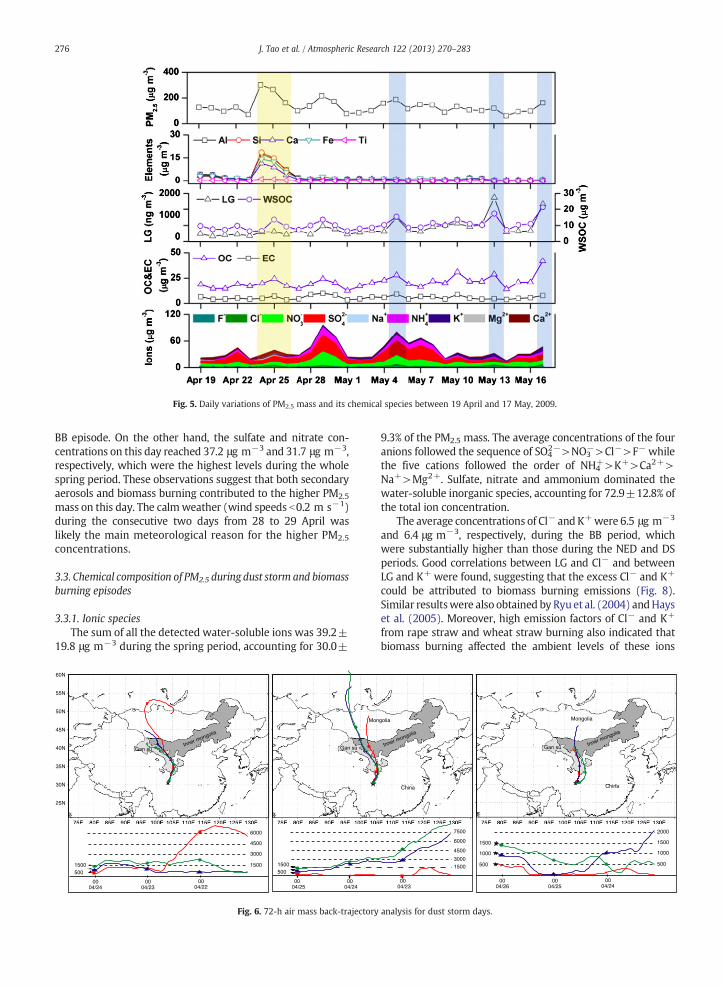
Fig. 5. Daily variations of PM2.5 mass and its chemical species between 19 April and 17 May, 2009.
276 J. Tao et al. / Atmospheric Research 122 (2013) 270–283
BB episode. On the other hand, the sulfate and nitrate con-centrations on this day reached 37.2 μg m−3 and 31.7 μg m−3,respectively, which were the highest levels during the wholespring period. These observations suggest that both secondaryaerosols and biomass burning contributed to the higher PM2.5
mass on this day. The calmweather (wind speeds b0.2 m s−1)during the consecutive two days from 28 to 29 April waslikely the main meteorological reason for the higher PM2.5
concentrations.
3.3. Chemical composition of PM2.5 during dust storm and biomassburning episodes
3.3.1. Ionic speciesThe sum of all the detected water-soluble ions was 39.2±
19.8 μg m−3 during the spring period, accounting for 30.0±
Inner mongolia
60N
55N
30N
35N
40N
45N
50N
25N
Gan su
1500500
0004/25
0004/24
Mon
1500
3000
4500
6000
1500500
0004/24
0004/23
0004/22
Gan su
Fig. 6. 72-h air mass back-trajectory
9.3% of the PM2.5 mass. The average concentrations of the fouranions followed the sequence of SO4
2−>NO3−>Cl−>F− while
the five cations followed the order of NH4+>K+>Ca2+>
Na+>Mg2+. Sulfate, nitrate and ammonium dominated thewater-soluble inorganic species, accounting for 72.9±12.8% ofthe total ion concentration.
The average concentrations of Cl− and K+were 6.5 μg m−3
and 6.4 μg m−3, respectively, during the BB period, whichwere substantially higher than those during the NED and DSperiods. Good correlations between LG and Cl− and betweenLG and K+ were found, suggesting that the excess Cl− and K+
could be attributed to biomass burning emissions (Fig. 8).Similar resultswere also obtained by Ryu et al. (2004) andHayset al. (2005). Moreover, high emission factors of Cl− and K+
from rape straw and wheat straw burning also indicated thatbiomass burning affected the ambient levels of these ions
Inner mongolia
15003000
4500
6000
0004/23
China
golia
7500
Inner mongolia
Gan su
500
1000
1500
2000
1500
500
0004/26
0004/25
0004/24
China
Mongolia
1000
analysis for dust storm days.
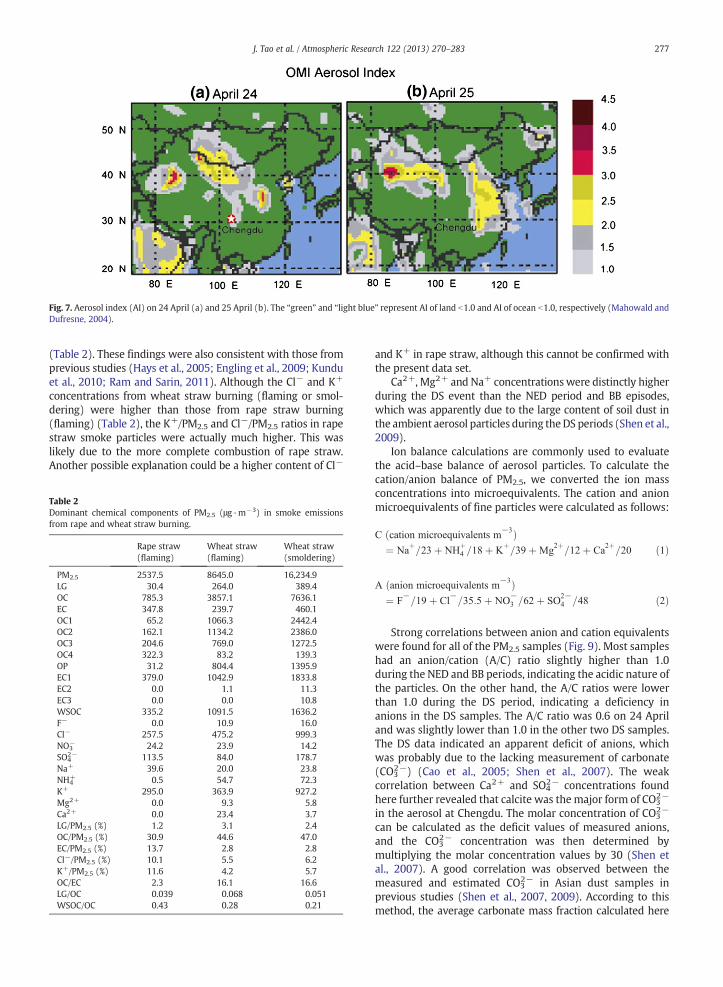
Fig. 7. Aerosol index (AI) on 24 April (a) and 25 April (b). The “green” and “light blue” represent AI of land b1.0 and AI of ocean b1.0, respectively (Mahowald andDufresne, 2004).
277J. Tao et al. / Atmospheric Research 122 (2013) 270–283
(Table 2). These findings were also consistent with those fromprevious studies (Hays et al., 2005; Engling et al., 2009; Kunduet al., 2010; Ram and Sarin, 2011). Although the Cl− and K+
concentrations from wheat straw burning (flaming or smol-dering) were higher than those from rape straw burning(flaming) (Table 2), the K+/PM2.5 and Cl−/PM2.5 ratios in rapestraw smoke particles were actually much higher. This waslikely due to the more complete combustion of rape straw.Another possible explanation could be a higher content of Cl−
Table 2Dominant chemical components of PM2.5 (μg·m−3) in smoke emissionsfrom rape and wheat straw burning.
Rape straw(flaming)
Wheat straw(flaming)
Wheat straw(smoldering)
PM2.5 2537.5 8645.0 16,234.9LG 30.4 264.0 389.4OC 785.3 3857.1 7636.1EC 347.8 239.7 460.1OC1 65.2 1066.3 2442.4OC2 162.1 1134.2 2386.0OC3 204.6 769.0 1272.5OC4 322.3 83.2 139.3OP 31.2 804.4 1395.9EC1 379.0 1042.9 1833.8EC2 0.0 1.1 11.3EC3 0.0 0.0 10.8WSOC 335.2 1091.5 1636.2F− 0.0 10.9 16.0Cl− 257.5 475.2 999.3NO3
− 24.2 23.9 14.2SO4
2− 113.5 84.0 178.7Na+ 39.6 20.0 23.8NH4
+ 0.5 54.7 72.3K+ 295.0 363.9 927.2Mg2+ 0.0 9.3 5.8Ca2+ 0.0 23.4 3.7LG/PM2.5 (%) 1.2 3.1 2.4OC/PM2.5 (%) 30.9 44.6 47.0EC/PM2.5 (%) 13.7 2.8 2.8Cl−/PM2.5 (%) 10.1 5.5 6.2K+/PM2.5 (%) 11.6 4.2 5.7OC/EC 2.3 16.1 16.6LG/OC 0.039 0.068 0.051WSOC/OC 0.43 0.28 0.21
and K+ in rape straw, although this cannot be confirmed withthe present data set.
Ca2+, Mg2+ and Na+ concentrationswere distinctly higherduring the DS event than the NED period and BB episodes,which was apparently due to the large content of soil dust inthe ambient aerosol particles during theDS periods (Shen et al.,2009).
Ion balance calculations are commonly used to evaluatethe acid–base balance of aerosol particles. To calculate thecation/anion balance of PM2.5, we converted the ion massconcentrations into microequivalents. The cation and anionmicroequivalents of fine particles were calculated as follows:
C ðcation microequivalents m−3Þ
¼ Naþ=23þ NH
þ4 =18þ K
þ=39 þMg
2þ=12þ Ca
2þ=20 ð1Þ
A ðanion microequivalents m−3Þ
¼ F−=19 þ Cl
−=35:5 þ NO
−3 =62 þ SO
2−4 =48 ð2Þ
Strong correlations between anion and cation equivalentswere found for all of the PM2.5 samples (Fig. 9). Most sampleshad an anion/cation (A/C) ratio slightly higher than 1.0during the NED and BB periods, indicating the acidic nature ofthe particles. On the other hand, the A/C ratios were lowerthan 1.0 during the DS period, indicating a deficiency inanions in the DS samples. The A/C ratio was 0.6 on 24 Apriland was slightly lower than 1.0 in the other two DS samples.The DS data indicated an apparent deficit of anions, whichwas probably due to the lacking measurement of carbonate(CO3
2−) (Cao et al., 2005; Shen et al., 2007). The weakcorrelation between Ca2+ and SO4
2− concentrations foundhere further revealed that calcite was the major form of CO3
2−
in the aerosol at Chengdu. The molar concentration of CO32−
can be calculated as the deficit values of measured anions,and the CO3
2− concentration was then determined bymultiplying the molar concentration values by 30 (Shen etal., 2007). A good correlation was observed between themeasured and estimated CO3
2− in Asian dust samples inprevious studies (Shen et al., 2007, 2009). According to thismethod, the average carbonate mass fraction calculated here
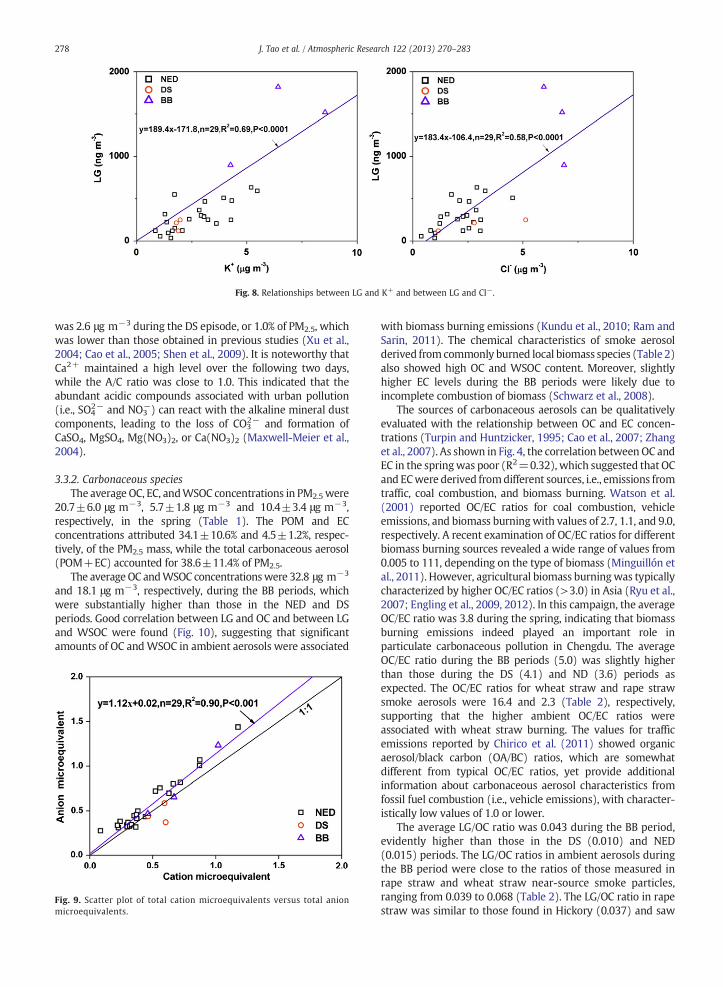
Fig. 8. Relationships between LG and K+ and between LG and Cl−.
278 J. Tao et al. / Atmospheric Research 122 (2013) 270–283
was 2.6 μg m−3 during the DS episode, or 1.0% of PM2.5, whichwas lower than those obtained in previous studies (Xu et al.,2004; Cao et al., 2005; Shen et al., 2009). It is noteworthy thatCa2+ maintained a high level over the following two days,while the A/C ratio was close to 1.0. This indicated that theabundant acidic compounds associated with urban pollution(i.e., SO4
2− and NO3−) can react with the alkaline mineral dust
components, leading to the loss of CO32− and formation of
CaSO4, MgSO4, Mg(NO3)2, or Ca(NO3)2 (Maxwell-Meier et al.,2004).
3.3.2. Carbonaceous speciesThe average OC, EC, andWSOC concentrations in PM2.5 were
20.7±6.0 μg m−3, 5.7±1.8 μg m−3 and 10.4±3.4 μg m−3,respectively, in the spring (Table 1). The POM and ECconcentrations attributed 34.1±10.6% and 4.5±1.2%, respec-tively, of the PM2.5 mass, while the total carbonaceous aerosol(POM+EC) accounted for 38.6±11.4% of PM2.5.
The average OC andWSOC concentrationswere 32.8 μg m−3
and 18.1 μg m−3, respectively, during the BB periods, whichwere substantially higher than those in the NED and DSperiods. Good correlation between LG and OC and between LGand WSOC were found (Fig. 10), suggesting that significantamounts of OC andWSOC in ambient aerosols were associated
Fig. 9. Scatter plot of total cation microequivalents versus total anionmicroequivalents.
with biomass burning emissions (Kundu et al., 2010; Ram andSarin, 2011). The chemical characteristics of smoke aerosolderived from commonly burned local biomass species (Table 2)also showed high OC and WSOC content. Moreover, slightlyhigher EC levels during the BB periods were likely due toincomplete combustion of biomass (Schwarz et al., 2008).
The sources of carbonaceous aerosols can be qualitativelyevaluated with the relationship between OC and EC concen-trations (Turpin and Huntzicker, 1995; Cao et al., 2007; Zhanget al., 2007). As shown in Fig. 4, the correlation betweenOC andEC in the springwas poor (R2=0.32), which suggested that OCand ECwere derived fromdifferent sources, i.e., emissions fromtraffic, coal combustion, and biomass burning. Watson et al.(2001) reported OC/EC ratios for coal combustion, vehicleemissions, and biomass burningwith values of 2.7, 1.1, and 9.0,respectively. A recent examination of OC/EC ratios for differentbiomass burning sources revealed a wide range of values from0.005 to 111, depending on the type of biomass (Minguillón etal., 2011). However, agricultural biomass burningwas typicallycharacterized by higher OC/EC ratios (>3.0) in Asia (Ryu et al.,2007; Engling et al., 2009, 2012). In this campaign, the averageOC/EC ratio was 3.8 during the spring, indicating that biomassburning emissions indeed played an important role inparticulate carbonaceous pollution in Chengdu. The averageOC/EC ratio during the BB periods (5.0) was slightly higherthan those during the DS (4.1) and ND (3.6) periods asexpected. The OC/EC ratios for wheat straw and rape strawsmoke aerosols were 16.4 and 2.3 (Table 2), respectively,supporting that the higher ambient OC/EC ratios wereassociated with wheat straw burning. The values for trafficemissions reported by Chirico et al. (2011) showed organicaerosol/black carbon (OA/BC) ratios, which are somewhatdifferent from typical OC/EC ratios, yet provide additionalinformation about carbonaceous aerosol characteristics fromfossil fuel combustion (i.e., vehicle emissions), with character-istically low values of 1.0 or lower.
The average LG/OC ratio was 0.043 during the BB period,evidently higher than those in the DS (0.010) and NED(0.015) periods. The LG/OC ratios in ambient aerosols duringthe BB period were close to the ratios of those measured inrape straw and wheat straw near-source smoke particles,ranging from 0.039 to 0.068 (Table 2). The LG/OC ratio in rapestraw was similar to those found in Hickory (0.037) and saw
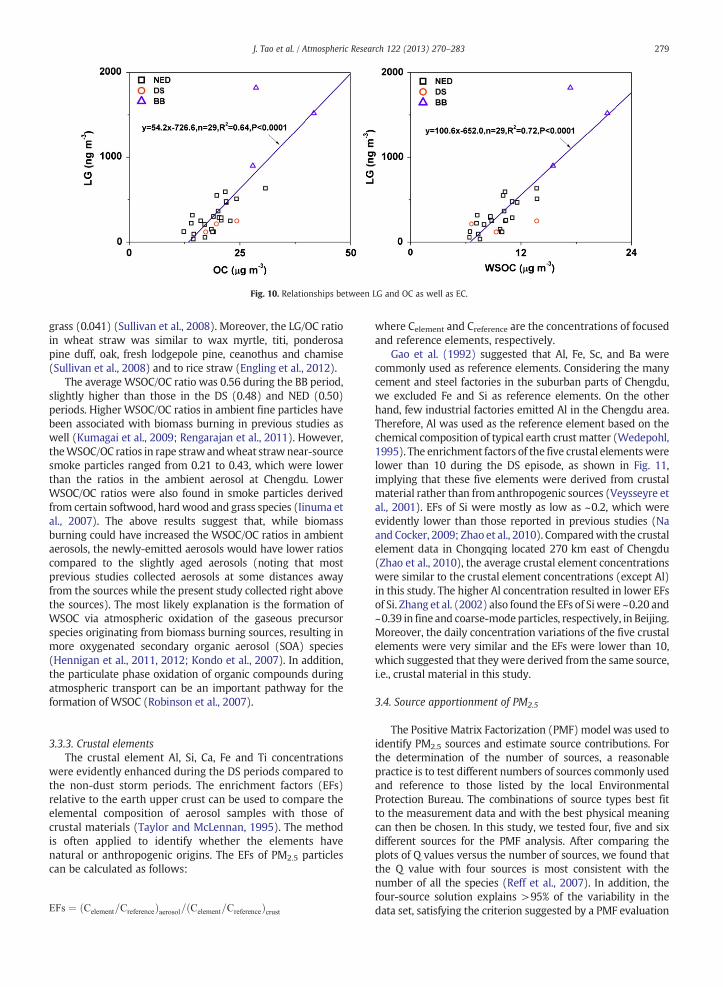
Fig. 10. Relationships between LG and OC as well as EC.
279J. Tao et al. / Atmospheric Research 122 (2013) 270–283
grass (0.041) (Sullivan et al., 2008). Moreover, the LG/OC ratioin wheat straw was similar to wax myrtle, titi, ponderosapine duff, oak, fresh lodgepole pine, ceanothus and chamise(Sullivan et al., 2008) and to rice straw (Engling et al., 2012).
The average WSOC/OC ratio was 0.56 during the BB period,slightly higher than those in the DS (0.48) and NED (0.50)periods. Higher WSOC/OC ratios in ambient fine particles havebeen associated with biomass burning in previous studies aswell (Kumagai et al., 2009; Rengarajan et al., 2011). However,theWSOC/OC ratios in rape strawandwheat strawnear-sourcesmoke particles ranged from 0.21 to 0.43, which were lowerthan the ratios in the ambient aerosol at Chengdu. LowerWSOC/OC ratios were also found in smoke particles derivedfrom certain softwood, hardwood and grass species (Iinuma etal., 2007). The above results suggest that, while biomassburning could have increased the WSOC/OC ratios in ambientaerosols, the newly-emitted aerosols would have lower ratioscompared to the slightly aged aerosols (noting that mostprevious studies collected aerosols at some distances awayfrom the sources while the present study collected right abovethe sources). The most likely explanation is the formation ofWSOC via atmospheric oxidation of the gaseous precursorspecies originating from biomass burning sources, resulting inmore oxygenated secondary organic aerosol (SOA) species(Hennigan et al., 2011, 2012; Kondo et al., 2007). In addition,the particulate phase oxidation of organic compounds duringatmospheric transport can be an important pathway for theformation of WSOC (Robinson et al., 2007).
3.3.3. Crustal elementsThe crustal element Al, Si, Ca, Fe and Ti concentrations
were evidently enhanced during the DS periods compared tothe non-dust storm periods. The enrichment factors (EFs)relative to the earth upper crust can be used to compare theelemental composition of aerosol samples with those ofcrustal materials (Taylor and McLennan, 1995). The methodis often applied to identify whether the elements havenatural or anthropogenic origins. The EFs of PM2.5 particlescan be calculated as follows:
EFs ¼ ðCelement=CreferenceÞaerosol=ðCelement=CreferenceÞcrust
where Celement and Creference are the concentrations of focusedand reference elements, respectively.
Gao et al. (1992) suggested that Al, Fe, Sc, and Ba werecommonly used as reference elements. Considering the manycement and steel factories in the suburban parts of Chengdu,we excluded Fe and Si as reference elements. On the otherhand, few industrial factories emitted Al in the Chengdu area.Therefore, Al was used as the reference element based on thechemical composition of typical earth crust matter (Wedepohl,1995). The enrichment factors of the five crustal elementswerelower than 10 during the DS episode, as shown in Fig. 11,implying that these five elements were derived from crustalmaterial rather than from anthropogenic sources (Veysseyre etal., 2001). EFs of Si were mostly as low as ~0.2, which wereevidently lower than those reported in previous studies (Naand Cocker, 2009; Zhao et al., 2010). Comparedwith the crustalelement data in Chongqing located 270 km east of Chengdu(Zhao et al., 2010), the average crustal element concentrationswere similar to the crustal element concentrations (except Al)in this study. The higher Al concentration resulted in lower EFsof Si. Zhang et al. (2002) also found the EFs of Siwere ~0.20 and~0.39 in fine and coarse-modeparticles, respectively, in Beijing.Moreover, the daily concentration variations of the five crustalelements were very similar and the EFs were lower than 10,which suggested that they were derived from the same source,i.e., crustal material in this study.
3.4. Source apportionment of PM2.5
The Positive Matrix Factorization (PMF) model was used toidentify PM2.5 sources and estimate source contributions. Forthe determination of the number of sources, a reasonablepractice is to test different numbers of sources commonly usedand reference to those listed by the local EnvironmentalProtection Bureau. The combinations of source types best fitto the measurement data and with the best physical meaningcan then be chosen. In this study, we tested four, five and sixdifferent sources for the PMF analysis. After comparing theplots of Q values versus the number of sources, we found thatthe Q value with four sources is most consistent with thenumber of all the species (Reff et al., 2007). In addition, thefour-source solution explains >95% of the variability in thedata set, satisfying the criterion suggested by a PMF evaluation
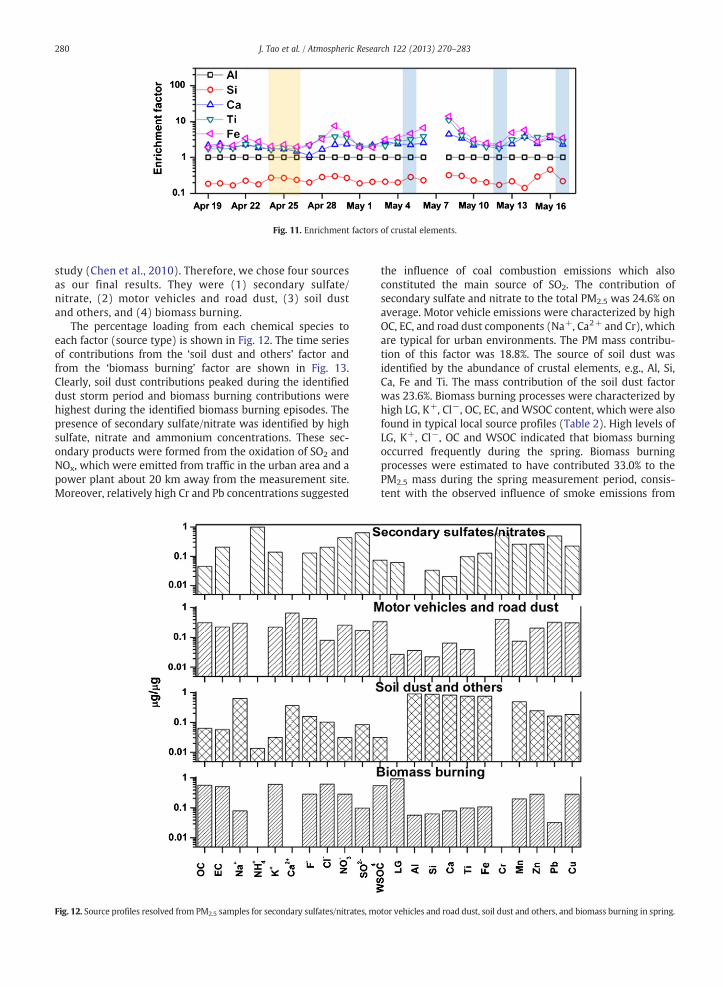
Fig. 11. Enrichment factors of crustal elements.
280 J. Tao et al. / Atmospheric Research 122 (2013) 270–283
study (Chen et al., 2010). Therefore, we chose four sourcesas our final results. They were (1) secondary sulfate/nitrate, (2) motor vehicles and road dust, (3) soil dustand others, and (4) biomass burning.
The percentage loading from each chemical species toeach factor (source type) is shown in Fig. 12. The time seriesof contributions from the ‘soil dust and others’ factor andfrom the ‘biomass burning’ factor are shown in Fig. 13.Clearly, soil dust contributions peaked during the identifieddust storm period and biomass burning contributions werehighest during the identified biomass burning episodes. Thepresence of secondary sulfate/nitrate was identified by highsulfate, nitrate and ammonium concentrations. These sec-ondary products were formed from the oxidation of SO2 andNOx, which were emitted from traffic in the urban area and apower plant about 20 km away from the measurement site.Moreover, relatively high Cr and Pb concentrations suggested
Fig. 12. Source profiles resolved from PM2.5 samples for secondary sulfates/nitrates, mo
the influence of coal combustion emissions which alsoconstituted the main source of SO2. The contribution ofsecondary sulfate and nitrate to the total PM2.5 was 24.6% onaverage. Motor vehicle emissions were characterized by highOC, EC, and road dust components (Na+, Ca2+ and Cr), whichare typical for urban environments. The PM mass contribu-tion of this factor was 18.8%. The source of soil dust wasidentified by the abundance of crustal elements, e.g., Al, Si,Ca, Fe and Ti. The mass contribution of the soil dust factorwas 23.6%. Biomass burning processes were characterized byhigh LG, K+, Cl−, OC, EC, and WSOC content, which were alsofound in typical local source profiles (Table 2). High levels ofLG, K+, Cl−, OC and WSOC indicated that biomass burningoccurred frequently during the spring. Biomass burningprocesses were estimated to have contributed 33.0% to thePM2.5 mass during the spring measurement period, consis-tent with the observed influence of smoke emissions from
tor vehicles and road dust, soil dust and others, and biomass burning in spring
.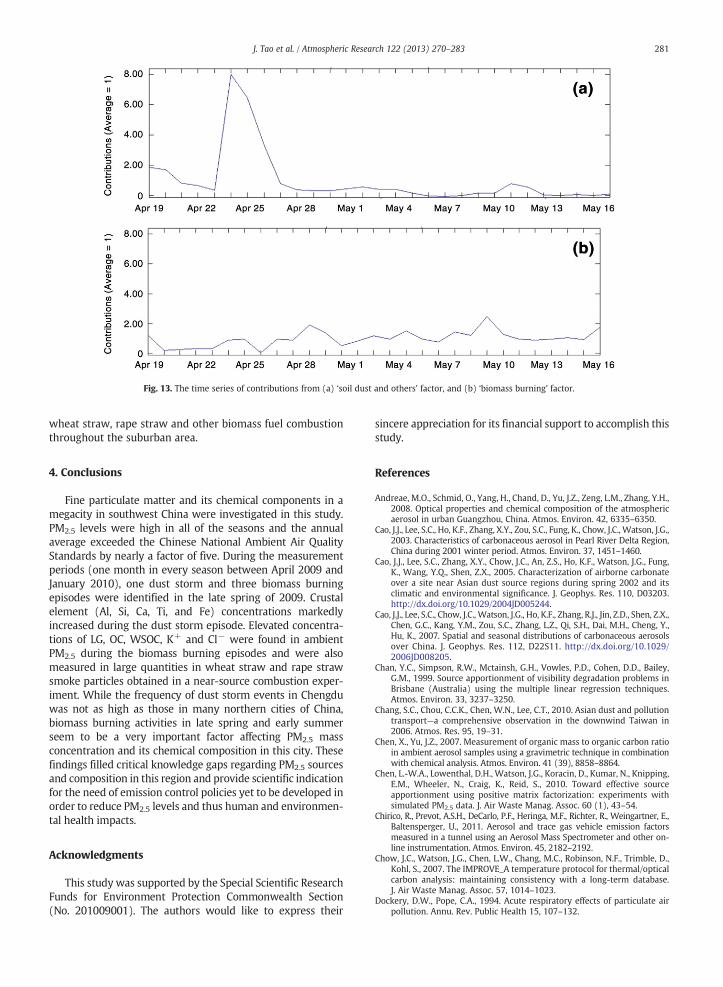
Fig. 13. The time series of contributions from (a) ‘soil dust and others’ factor, and (b) ‘biomass burning’ factor.
281J. Tao et al. / Atmospheric Research 122 (2013) 270–283
wheat straw, rape straw and other biomass fuel combustionthroughout the suburban area.
4. Conclusions
Fine particulate matter and its chemical components in amegacity in southwest China were investigated in this study.PM2.5 levels were high in all of the seasons and the annualaverage exceeded the Chinese National Ambient Air QualityStandards by nearly a factor of five. During the measurementperiods (one month in every season between April 2009 andJanuary 2010), one dust storm and three biomass burningepisodes were identified in the late spring of 2009. Crustalelement (Al, Si, Ca, Ti, and Fe) concentrations markedlyincreased during the dust storm episode. Elevated concentra-tions of LG, OC, WSOC, K+ and Cl− were found in ambientPM2.5 during the biomass burning episodes and were alsomeasured in large quantities in wheat straw and rape strawsmoke particles obtained in a near-source combustion exper-iment. While the frequency of dust storm events in Chengduwas not as high as those in many northern cities of China,biomass burning activities in late spring and early summerseem to be a very important factor affecting PM2.5 massconcentration and its chemical composition in this city. Thesefindings filled critical knowledge gaps regarding PM2.5 sourcesand composition in this region and provide scientific indicationfor the need of emission control policies yet to be developed inorder to reduce PM2.5 levels and thus human and environmen-tal health impacts.
Acknowledgments
This study was supported by the Special Scientific ResearchFunds for Environment Protection Commonwealth Section(No. 201009001). The authors would like to express their
sincere appreciation for its financial support to accomplish thisstudy.
References
Andreae, M.O., Schmid, O., Yang, H., Chand, D., Yu, J.Z., Zeng, L.M., Zhang, Y.H.,2008. Optical properties and chemical composition of the atmosphericaerosol in urban Guangzhou, China. Atmos. Environ. 42, 6335–6350.
Cao, J.J., Lee, S.C., Ho, K.F., Zhang, X.Y., Zou, S.C., Fung, K., Chow, J.C., Watson, J.G.,2003. Characteristics of carbonaceous aerosol in Pearl River Delta Region,China during 2001 winter period. Atmos. Environ. 37, 1451–1460.
Cao, J.J., Lee, S.C., Zhang, X.Y., Chow, J.C., An, Z.S., Ho, K.F., Watson, J.G., Fung,K., Wang, Y.Q., Shen, Z.X., 2005. Characterization of airborne carbonateover a site near Asian dust source regions during spring 2002 and itsclimatic and environmental significance. J. Geophys. Res. 110, D03203.http://dx.doi.org/10.1029/2004JD005244.
Cao, J.J., Lee, S.C., Chow, J.C., Watson, J.G., Ho, K.F., Zhang, R.J., Jin, Z.D., Shen, Z.X.,Chen, G.C., Kang, Y.M., Zou, S.C., Zhang, L.Z., Qi, S.H., Dai, M.H., Cheng, Y.,Hu, K., 2007. Spatial and seasonal distributions of carbonaceous aerosolsover China. J. Geophys. Res. 112, D22S11. http://dx.doi.org/10.1029/2006JD008205.
Chan, Y.C., Simpson, R.W., Mctainsh, G.H., Vowles, P.D., Cohen, D.D., Bailey,G.M., 1999. Source apportionment of visibility degradation problems inBrisbane (Australia) using the multiple linear regression techniques.Atmos. Environ. 33, 3237–3250.
Chang, S.C., Chou, C.C.K., Chen, W.N., Lee, C.T., 2010. Asian dust and pollutiontransport—a comprehensive observation in the downwind Taiwan in2006. Atmos. Res. 95, 19–31.
Chen, X., Yu, J.Z., 2007. Measurement of organic mass to organic carbon ratioin ambient aerosol samples using a gravimetric technique in combinationwith chemical analysis. Atmos. Environ. 41 (39), 8858–8864.
Chen, L.-W.A., Lowenthal, D.H., Watson, J.G., Koracin, D., Kumar, N., Knipping,E.M., Wheeler, N., Craig, K., Reid, S., 2010. Toward effective sourceapportionment using positive matrix factorization: experiments withsimulated PM2.5 data. J. Air Waste Manag. Assoc. 60 (1), 43–54.
Chirico, R., Prevot, A.S.H., DeCarlo, P.F., Heringa, M.F., Richter, R., Weingartner, E.,Baltensperger, U., 2011. Aerosol and trace gas vehicle emission factorsmeasured in a tunnel using an Aerosol Mass Spectrometer and other on-line instrumentation. Atmos. Environ. 45, 2182–2192.
Chow, J.C., Watson, J.G., Chen, L.W., Chang, M.C., Robinson, N.F., Trimble, D.,Kohl, S., 2007. The IMPROVE_A temperature protocol for thermal/opticalcarbon analysis: maintaining consistency with a long-term database.J. Air Waste Manag. Assoc. 57, 1014–1023.
Dockery, D.W., Pope, C.A., 1994. Acute respiratory effects of particulate airpollution. Annu. Rev. Public Health 15, 107–132.
282 J. Tao et al. / Atmospheric Research 122 (2013) 270–283
Engling, G., Carrico, C.M., Kreidenweis, S.M., Collett Jr., J.L., Day, D.E., Malm,W.C., Lincoln, E., Hao,W.M., Iinuma, Y., Herrmann, H., 2006. Determinationof levoglucosan in biomass combustion aerosol by high performance anionexchange chromatography with pulsed amperometric detection. Atmos.Environ. 40, S299–S311.
Engling, G., Lee, J.J., Tsai, Y.W., Lung, S.C.C., Chou, C.C.K., Chan, C.Y., 2009. Size-resolved anhydrosugar composition in smoke aerosol from controlled fieldburning of rice straw. Aerosol Sci. Technol. 43 (7), 662–672.
Engling, G., Lee, J.J., Sie, H.J., Wu, Y.C., Pole, I.Y., 2012. Anhydrosugarcharacteristics in biomass smoke aerosol — case study of environmentalinfluence on particle-size of rice straw burning aerosol. J. Aerosol Sci.http://dx.doi.org/10.1016/j.jaerosci.2012.10.001.
Gao, Y., Arimoto, R., Duce, R.A., Lee, D.S., Zhou, M.Y., 1992. Input ofatmospheric trace elements and mineral matter to the Yellow Seaduring the spring of a low-dust year. J. Geophys. Res. 97, 3767–3777.
Hays, M.D., Fine, P.M., Geron, C.D., Kleeman, M.J., Gullett, B.K., 2005. Openingburning of agricultural biomass: physical and chemical properties ofparticle-phase emissions. Atmos. Environ. 39, 6747–6764.
He, K.B., Yang, F.M., Ma, Y.L., Zhang, Q., Yao, X.H., Chan, C.K., Cadle, S., Chan,T., Mulawa, P., 2001. The characteristics of PM2.5 in Beijing, China. Atmos.Environ. 35, 4959–4970.
Hennigan, C.J., Miracolo, M.A., Engelhart, G.J., May, A.A., Presto, A.A., Lee, T.,Sullivan, A.P., McMeeking, G.R., Coe, H., Wold, C.E., Hao,W.-M., Gilman, J.B.,Kuster, W.C., de Gouw, J., Schichtel, B.A., Collett Jr., J.L., Kreidenweis, S.M.,Robinson, A.L., 2011. Chemical and physical transformations of organicaerosol from the photo-oxidation of open biomass burning emissions in anenvironmental chamber. Atmos. Chem. Phys. 11, 7669–7686.
Hennigan, C.J., Westervelt, M.W., Riipinen, I., Engelhart, G.J., Lee, T., Collett Jr., J.L.,Pandis, S.N., Adams, P.J., Robinson, A.L., 2012. New particle formation andgrowth in biomass burning plumes: an important source of cloudcondensation nuclei. J. Geophys. Res. 39, L09805. http://dx.doi.org/10.1029/2012GL050930.
Ho, K.F., Lee, S.C., Chan, C.K., Yu, J.C., Chow, J.C., Yao, X.H., 2003. Characteri-zation of chemical species in PM2.5 and PM10 aerosols in Hong Kong.Atmos. Environ. 37, 31–39.
Hu, M., Wu, Z.J., Slanina, J., Lin, P., Liu, S., Zeng, L.M., 2008. Acidic gases,ammonia and water-soluble ions in PM2.5 at a coastal site in the PearlRiver Delta, China. Atmos. Environ. 42, 6310–6320.
Hueglin, C., Gehrig, R., Baltensperger, U., Gysel, M., Monn, C., Vonmont, H., 2005.Chemical characterisation of PM2.5, PM10 and coarse particles at urban,near-city and rural sites in Switzerland. Atmos. Environ. 39, 637–651.
Iinuma, Y., Brüggemann, E., Gnauk, T., Müller, K., Andreae, M.O., Helas, G.,Parmar, R., Herrmann, H., 2007. Source characterization of biomassburning particles: the combustion of selected European conifers, Africanhardwood, savanna grass, and German and Indonesian peat. J. Geophys.Res. 112, D08209. http://dx.doi.org/10.1029/2006JD007120.
Iinuma, Y., Engling, G., Puxbaum, H., Herrmann, H., 2009. A highly resolvedanion-exchange chromatographic method for determination ofsaccharidic tracers for biomass combustion and primary bio-particlesin atmospheric aerosol. Atmos. Environ. 43, 1367–1371.
IMPROVE Report V, 2011. Spatial and seasonal patterns and temporalvariability of haze and its constituents in the United States. InteragencyMonitoring of Protected Visual Environments. Colorado State University.
Jacob, D.J., Winner, D.A., 2009. Effect of climate change on air quality. Atmos.Environ. 43, 51–63.
Kaufman, Y.J., Tanré, D., Boucher, O., 2002. A satellite view of aerosols in theclimate system. Nature 419 (6903), 215–223.
Kondo, Y., Miyazaki, Y., Takegawa, N., Miyakawa, T., Weber, R.J., Jimenez, J.L.,Zhang, Q., Worsnop, D.R., 2007. Oxygenated and water-soluble organicaerosols in Tokyo. J. Geophys. Res. 112, D01203. http://dx.doi.org/10.1029/2006JD007056.
Kumagai, K., Iijima, A., Tago, H., Tomioka, A., Kozawa, K., Sakamoto, K., 2009.Seasonal characteristics of water-soluble organic carbon in atmosphericparticles in the inland Kanto plain, Japan. Atmos. Environ. 43,3345–3351.
Kundu, S., Kawamura, K., Andreae, T.W., Hoffer, A., Andreae, M.O., 2010.Diurnal variation in the water-soluble inorganic ions, organic carbonand isotopic compositions of total carbon and nitrogen in biomassburning aerosols from the LBA-SMOCC campaign in Rondônia, Brazil.Aerosol Sci. 41, 118–133.
Laden, F., Neas, L.M., Dockery, D.W., Schwartz, J., 2000. Association of fineparticulate matter from different sources with daily mortality in six U.S.Cities. Environ. Heal. Perspect. 108 (10), 941–947.
Lee, H.S., Kang, B.W., 2001. Chemical characteristics of principal PM2.5
species in Chongju, South Korea. Atmos. Environ. 35, 739–746.Lin, J.J., 2002. Characterization of the major chemical species in PM2.5 in the
Kaohsiung City, Taiwan. Atmos. Environ. 36, 1911–1920.Lonati, G., Giugliano, M., Butelli, P., Romele, L., Tardivo, R., 2005. Major
chemical components of PM2.5 in Milan (Italy). Atmos. Environ. 39,1925–1934.
Lowenthal, D.H., Kumar, N., 2005. Variation of mass scattering efficiencies inIMPROVE. J. Air Waste Manag. Assoc. 54, 926–934.
Mahowald, N.M., Dufresne, J., 2004. Sensitivity of TOMS aerosol indexto boundary layer height: implications for detection of mineral aerosolsources. J. Geophys. Res. 31, L03103. http://dx.doi.org/10.1029/2003GL018865.
Maxwell-Meier, K., Weber, R., Song, C., Orsini, D., Ma, Y., 2004. Inorganiccomposition of fine particles in mixed mineral dust-pollution plumesobserved from airborne measurements during ACE-Asia. J. Geophys. Res.109, D19S07. http://dx.doi.org/10.1029/2003JD004464.
McMurry, P.H., 2000. A review of atmospheric aerosol measurements.Atmos. Environ. 34 (12–14), 1959–1999.
Minguillón, M.C., Perron, N., Querol, X., Szidat, S., Fahrni, S.M., Alastuey, A.,Jimenez, J.L., Mohr, C., Ortega, A.M., Day, D.A., Lanz, V.A., Wacker, L.,Reche, C., Cusack, M., Amato, F., Kiss, G., Hoffer, A., Decesari, S., Moretti,F., Hillamo, R., Teinilä, K., Seco, R., Peñuelas, J., Metzger, A., Schallhart, S.,Müller, M., Hansel, A., Burkhart, J.F., Baltensperger, U., Prévôt, A.S.H.,2011. Fossil versus contemporary sources of fine elemental and organiccarbonaceous particulate matter during the DAURE campaign inNortheast Spain. Atmos. Chem. Phys. 11, 12,067–12,084.
Na, K., Cocker III, D.R., 2009. Characterization and source identification oftrace elements in PM2.5 from Mira Loma, Southern California. Atmos.Res. 93, 793–800.
Norris, G., Vedantham, R., Wade, K., Brown, S., Prouty, J., Foley, C., 2008. EPAPositive Matrix Factorization (PMF) 3.0 Fundamentals & User Guide. U.S.Environmental Protection Agency, Office of Research and Development,Washington, DC.
Pitchford, M.L., Malm, W.C., Schichtel, B.A., et al., 2007. Revised formula forestimating light extinction from IMPROVE particle speciation data. J. AirWaste Manag. Assoc. 57, 1326–1336.
Polissar, A.V., Hopke, P.K., Paatero, P., Malm,W.C., Sisler, J.F., 1998. Atmosphericaerosol over Alaska: 2. Elemental composition and sources. J. Geophys. Res.103 (D15), 19,045–19,057.
Pope, C.A., Dockery, D.W., 2006. Health effects of fine particulate airpollution: lines that connect. J. Air Waste Manag. Assoc. 56, 709–742.
Putaud, J.P., Raes, F., Dingenen, R.V., Brüggemann, E., Facchini, M.C., Decesari, S.,Fuzzi, S., Gehrig, R., Hüglin, C., Laj, P., Lorbeer, G., Maenhaut, W.,Mihalopoulos, N., Müller, K., Querol, X., Rodriguez, S., Schneider, J.,Spindler, G., Brink, H., Tørseth, K., Wiedensohler, A., 2004. A Europeanaerosol phenomenology—2: chemical characteristics of particulate matterat kerbside, urban, rural and background sites in Europe. Atmos. Environ.38, 2579–2595.
Querol, X., Alastuey, A., Viana, M.M., Rodriguez, S., Artiñano, B., Salvador, P.,Garcia do Santos, S., Fernandez Pater, R., Ruiz, C.R., de la Rosa, J., Sanchezde la Campa, A., Menedez, M., Gil, J.I., 2004. Speciation and origin of PM10
and PM2.5 in Spain. J. Aerosol Sci. 35, 1151–1172.Ram, K., Sarin, M.M., 2011. Day–night variability of EC, OC, WSOC and
inorganic ions in urban environment of Indo-Gangetic Plain:implications to secondary aerosol formation. Atmos. Environ. 45,460–468.
Reff, A., Eberly, S.I., Bhave, P.V., 2007. Receptor modeling of ambientparticulate matter data using positive matrix factorization: review ofexisting methods. J. Air Waste Manag. Assoc. 57 (2), 146–154.
Rengarajan, R., Sudheer, A.K., Sarin, M.M., 2011. Wintertime PM2.5 and PM10
carbonaceous and inorganic constituents from urban site in westernIndia. Atmos. Res. 102, 420–431.
Robinson, A.L., Donahue, N.M., Shrivastava, M.K., Weitkamp, E.A., Sage, A.M.,Grieshop, A.P., Lane, T.E., Pierce, J.R., Pandis, S.N., 2007. Rethinkingorganic aerosols: semivolatile emissions and photochemical aging.Science 315, 1259–1262.
Ryu, S.Y., Kim, J.E., Zhuanshi, H., Kim, Y.J., Kang, G.U., 2004. Chemicalcomposition of post-harvest biomass burning aerosols in Gwangju,Korea. J. Air Waste Manag. Assoc. 54, 1124–1137.
Ryu, S.Y., Kwon, B.G., Kim, Y.J., Kim, H.H., Chun, K.J., 2007. Characteristics ofbiomass burning aerosol and its impact on regional air quality in thesummer of 2003 at Gwangju, Korea. Atmos. Res. 84, 362–373.
Samet, J.M., Dominici, F., Curriero, F.C., Coursac, I., Zeger, S.L., 2000. Fineparticulate air pollution and mortality in U.S. cities, 1987–1994. N. Engl.J. Med. 343 (24), 1742–1749.
Schwarz, J., Chi, X., Maenhaut, W., Civiš, M., Hovorka, J., Smolík, J., 2008.Elemental and organic carbon in atmospheric aerosols at downtown andsuburban sites in Prague. Atmos. Res. 90, 287–302.
Shen, Z.X., Cao, J.J., Arimoto, R., Zhang, R.J., Jie, D.M., Liu, S.X., 2007. Chemicalcomposition and source characterization of spring aerosol over Horqinsand land in northeastern China. J. Geophys. Res. 112, D14315. http://dx.doi.org/10.1029/2006JD007991.
Shen, Z.X., Cao, J.J., Arimoto, R., Han, Z.W., Zhang, R.J., Han, Y.M., Liu, S.X.,Okuda, T., Nakao, S., Tanaka, S., 2009. Ionic composition of TSP and PM2.5
during dust storms and air pollution episodes at Xi'an, China. Atmos.Environ. 43, 2911–2918.
283J. Tao et al. / Atmospheric Research 122 (2013) 270–283
Sisler, J.F., Malm, W.C., 2000. Interpretation of trends of PM2.5 andreconstructed visibility from the IMPROVE network. J. Air WasteManag. Assoc. 50, 775–789.
Solomon, P.A., Hopke, P.K., Froines, J., Scheffe, R., 2008. Key scientific findingsand policy- and health-relevant insights from the U.S. EnvironmentalProtection Agency's particulate matter supersites program and relatedstudies: an integration and synthesis of results. J. Air Waste Manag.Assoc. 58 (13 Suppl.), S3–S92.
Sullivan, A.P., Holden, A.S., Patterson, L.A., McMeeking, G.R., Kreidenweis,S.M., Malm, W.C., Hao, W.M., Wold, C.E., Collett, J.L., 2008. A method forsmokemarkermeasurements and its potential application for determiningthe contribution of biomass burning from wildfires and prescribed fires toambient PM2.5 organic carbon. J. Geophys. Res. 113, D22302. http://dx.doi.org/10.1029/2008JD010216.
Tao, J., Ho, K.F., Chen, L.G., Zhu, L.H., Han, J.L., Xu, Z.C., 2009. Effect of chemicalcomposition of PM2.5 on visibility in Guangzhou, China, 2007 spring.Particuology 7, 68–75.
Taylor, S.R., McLennan, S.M., 1995. The geochemical evolution of the continentalcrust. Rev. Geophys. 33, 241–265.
Turpin, B.J., Huntzicker, J.J., 1995. Identification of secondary aerosolepisodes and quantification of primary and secondary organic aerosolconcentrations during SCAQS. Atmos. Environ. 29, 3527–3544.
Veysseyre, A., Moutard, K., Ferrari, C., Van de Velde, K., Barbante, C., Cozzi, G.,Capodaglio, G., Boutron, C., 2001. Heavy metals in fresh snow collectedat different altitudes in the Chamonix and Maurienne valleys, FrenchAlps: initial results. Atmos. Environ. 35, 415–425.
Wang, G., Li, J., Cheng, C., Hu, S., Xie, M., Gao, S., Zhou, B., Dai, W., Cao, J., An,Z., 2011. Observation of atmospheric aerosols at Mt. Hua and Mt. Tai incentral and east China during spring 2009—part 1: EC, OC and inorganicions. Atmos. Chem. Phys. 11, 4221–4235.
Watson, J.G., 2002. Visibility: science and regulation. J. Air Waste Manag.Assoc. 52, 628–713.
Watson, J.G., Chow, J.C., Houck, J.E., 2001. PM2.5 chemical source profiles forvehicle exhaust, vegetative burning, geological material, and coal burningin Northwestern Colorado during 1995. Chemosphere 43, 1141–1151.
Wedepohl, H.K., 1995. The composition of the continental crust. Geochim.Cosmochim. Acta 59, 1217–1232.
Wei, F., Teng, E., Wu, G., Hu, W., Willson, W.E., Chapman, R.S., Pau, J.C.,Zhang, J., 1999. Ambient concentrations and elemental compositionsof PM10 and PM2.5 in four Chinese cities. Environ. Sci. Technol. 33 (23),4188–4193.
Xu, J., Bergin, M.H., Greenwald, R., Schauer, J.J., Shafer, M.M., Jaffrezo, J.L.,Aymoz, G., 2004. Aerosol chemical, physical, and radiative characteristicsnear a desert source region of northwest China during ACE-Asia.J. Geophys. Res. 109, D19S03. http://dx.doi.org/10.1029/2003JD004239.
Xu, H.M., Cao, J.J., Ho, K.F., Ding, H., Han, Y.M., Wang, G.H., Chow, J.C., Watson, J.G.,Khol, S.D., Qiang, J., Li, W.T., 2012. Lead concentrations in fine particulatematter after the phasing out of leaded gasoline in Xi'an, China. Atmos.Environ. 46, 217–224.
Yang, F., Tan, J., Zhao, Q., Du, Z., He, K., Ma, Y., Duan, F., Chen, G., Zhao, Q.,2011. Characteristics of PM2.5 speciation in representative megacitiesand across China. Atmos. Chem. Phys. 11, 5207–5219.
Yang, Y., Chan, C., Tao, J., Lin, M., Engling, G., Zhang, Z., Zhang, T., Su, L., 2012.Observation of elevated fungal tracers due to biomass burning in theSichuan Basin at Chengdu City, China. Sci. Total. Environ. 431, 68–77.
Ye, B.M., Ji, X.L., Yang, H.Z., Yao, X.H., Chan, C.K., Cadle, S.H., Chan, T., Mulawa,P.A., 2003. Concentration and chemical composition of PM2.5 in Shanghaifor a 1-year period. Atmos. Environ. 37, 499–510.
Zhang, R.J., Wang, M.X., Xia, X.A., 2002. Chemical composition of aerosol inwinter/spring in Beijing. J. Environ. Sci. 14 (1), 7–11.
Zhang, R.J., Wang, M.X., Zhang, X.Y., Zhu, G.H., 2003a. Analysis on thechemical and physical properties of particles in a dust storm in spring inBeijing. Powder Technol. 137, 77–82.
Zhang, X.Y., Gong, S.L., Shen, Z.X., Mei, F.M., Xi, X.X., Liu, L.C., Zhou, Z.J., Wang, D.,Wang, Y.Q., Cheng, Y., 2003b. Characterization of soil dust aerosol in Chinaand its transport and distribution during 2001 ACE-Asia: 1. Networkobservations. J. Geophys. Res. 108, 4261. http://dx.doi.org/10.1029/2002JD002632.
Zhang, R.J., Cao, J.J., Lee, S.C., Shen, Z.X., Ho, K.F., 2007. Carbonaceous aerosols inPM10 and pollution gases in winter in Beijing. J. Environ. Sci. 19, 564–571.
Zhang, T., Claeys, M., Cachier, H., Dong, S.P., Wamg, W., Maenhaut, W., Liu, X.D.,2008. Identification and estimation of the biomass burning contribution toBeijing aerosol using levoglucosan as a molecular marker. Atmos. Environ.42, 7013–7021.
Zhang, Z.S., Engling, G., Lin, C.Y., Chou, C.C.K., Lung, S.C.C., Chang, S.Y., Fan, S.J.,Chan, C.Y., Zhang, Y.H., 2010. Chemical speciation, transport and contribu-tion of biomass burning smoke to ambient aerosol in Guangzhou, a megacity of China. Atmos. Environ. 44, 3187–3195.
Zhang, T., Cao, J.J., Tie, X.X., Shen, Z.X., Liu, S.X., Ding, H., Han, Y.M., Wang,G.H., Ho, K.F., Qiang, J., Li, W.T., 2011. Water-soluble ions in atmosphericaerosols measured in Xi'an, China: seasonal variations and sources.Atmos. Res. 102, 110–119.
Zhang, R.J., Tao, J., Ho, K.F., Shen, Z., Cao, J., Liu, S., Zhang, L., Lee, S.C., 2012.Characterization of springtime atmospheric organic and elementalcarbon of PM2.5 in a typical semi-arid area of Northeastern China.Aerosol Air Qual. Res. 12, 792–802.
Zhao, Q., He, K., Rahn, K.A., Ma, Y., Jia, Y., Yang, F., Duan, F., Lei, Y., Chen, G.,Cheng, Y., Liu, H., Wang, S., 2010. Dust storms come to Central andSouthwestern China, too: implications from a major dust event inChongqing. Atmos. Chem. Phys. 10, 2615–2630.
Recommended