Authors: Adrian Biggs, Siwen Li, and Emily Sarah Wheeler (ENE Students)
Technical Adviser:
Terry Baxter (PE, Ph.D., Assoc. Professor)
Client: Alarick Reiboldt (EIT, M.Eng, Lecturer)
CENE 476 Capstone Prep
Nitrification Column Proposal Draft #2: Scope of Services
i
Table of Contents Table of Figures ............................................................................................................................................. ii
Table of Equations ......................................................................................... Error! Bookmark not defined.
Table of Tables .............................................................................................................................................. ii
1.0 Project Understanding ............................................................................................................................ 1
1.1 Project Purpose ................................................................................................................................... 1
1.2 Project Background ............................................................................................................................. 1
1.3 Technical Considerations .................................................................................................................... 3
1.4 Potential Challenges ........................................................................................................................... 6
1.5 Stakeholders ....................................................................................................................................... 6
2.0 Scope of Services..................................................................................................................................... 7
2.1 List of Deliverables .............................................................................................................................. 7
2.2 List of Tasks ......................................................................................................................................... 8
Task 1: Determination of Legality and Sanitation ................................................................................. 8
Task 2: Determination of Urine Samples .............................................................................................. 8
Task 3: Determination of Lab Analysis Procedures ............................................................................... 8
Task 4: Implementation of Lab Work .................................................................................................... 8
Task 5: Preincubated Cartridge Analysis ............................................................................................... 9
Task 6: Design Concept Generation and Selection ............................................................................... 9
Task 7: Conduction of Field Evaluation ................................................................................................. 9
Task 8: Conduction of Plant Evaluation ................................................................................................ 9
Task 9: Preformation of Design Calculations ........................................................................................ 9
Task 10: Determination of Final Design ................................................................................................ 9
Task 11: Construction of Model Structure .......................................................................................... 10
Task 12: Conduction of Final Testing .................................................................................................. 10
Task 13: Project Management ............................................................................................................ 10
2.3 List of Exclusions ............................................................................................................................... 10
Exclusion 1: Separation of Solid and Liquid Waste ............................................................................. 10
Exclusion 2: Design for Nutrient Collection ........................................................................................ 10
Exclusion 3: Utility Scale ...................................................................................................................... 10
Exclusion 4: Design Model .................................................................................................................. 10
3.0 Scheduling ............................................................................................................................................. 10
4.0 Staffing .................................................................................................................................................. 11
5.0 Appendix ............................................................................................................................................... 15
5.1 Gantt Chart ........................................................................................................................................ 15
5.2 Staffing Time Table ........................................................................................................................... 16
6.0 References ............................................................................................................................................ 19
ii
Table of Figures Figure 1: NAU Southern Greenhouse ........................................................................................................... 1
Figure 2: Flagstaff Climate Graph.................................................................................................................. 3
Figure 3: Network Diagram ......................................................................................................................... 11
Table of Tables Table 1: Standard Flagstaff Climate Conditions ............................................................................................ 2
Table 2: Average Flagstaff Climate Conditions ............................................................................................. 2
Table 3: Flagstaff Household Statistics ......................................................................................................... 3
Table 4: Preliminary Conditions Considered ................................................................................................. 4
Table 5: Preliminary Calculations Considered .............................................................................................. 5
Table 6: Composition of Urine Considered ................................................................................................... 5
Table 7: Stakeholders .................................................................................................................................... 7
Table 8: List of Future Deliverables ............................................................................................................... 8
Table 9: Services Classifications .................................................................................................................. 13
Table 10: Estimated Classification Required Work Time ............................................................................ 13
Table 11: Provided Billing Rate ................................................................................................................... 14
Table 12: Classification Labor Cost ............................................................................................................. 14
Table 13: Detailed Estimation Classification Required Work Time............................................................. 16
1
1.0 Project Understanding
1.1 Project Purpose Urine is an unsterile, nutrient-rich resource that can be used to fertilize plants. Human liquid waste
contains close to 88% nitrogen and 66% phosphorous, both of which is excerpted from the body.
Though urine is unsterile, it does not contain the same hazards, bacterial pathogens, which exist in the
solid waste [1]. Separating urine at the source is an effective approach to recover nutrients from liquid
waste. Taking full advantage of the benefits of urine is a good way of ‘closing the cycle’ in agriculture
nutrient flows. This system could also possibly reduce sewage costs, ecological consequences, as well as
improve sanitation in developing areas. It is surprising that the application of the benefits of urine for
the growing of crops is relatively rare.
This proposal will focus on the nitrogen recovery from liquid waste on the scale of a household-
nitrification column. Liquid waste is mostly in the form of ammonia species and must be oxidized to
nitrate before plants can take it up through their root systems. Nitrogen compounds are reduced and
are sequentially oxidized to nitrite and nitrate by nitrifying bacteria through nitrification process. The
main purpose of nitrification column is to convert nitrogen compounds in urine to a form that can be
used by plants directly. The nitrification column should provide suitable growth and living conditions for
all bacteria to effectively operate. This system should also have a nitrate removal assembly to remove
nitrate from water and provide that to plants.
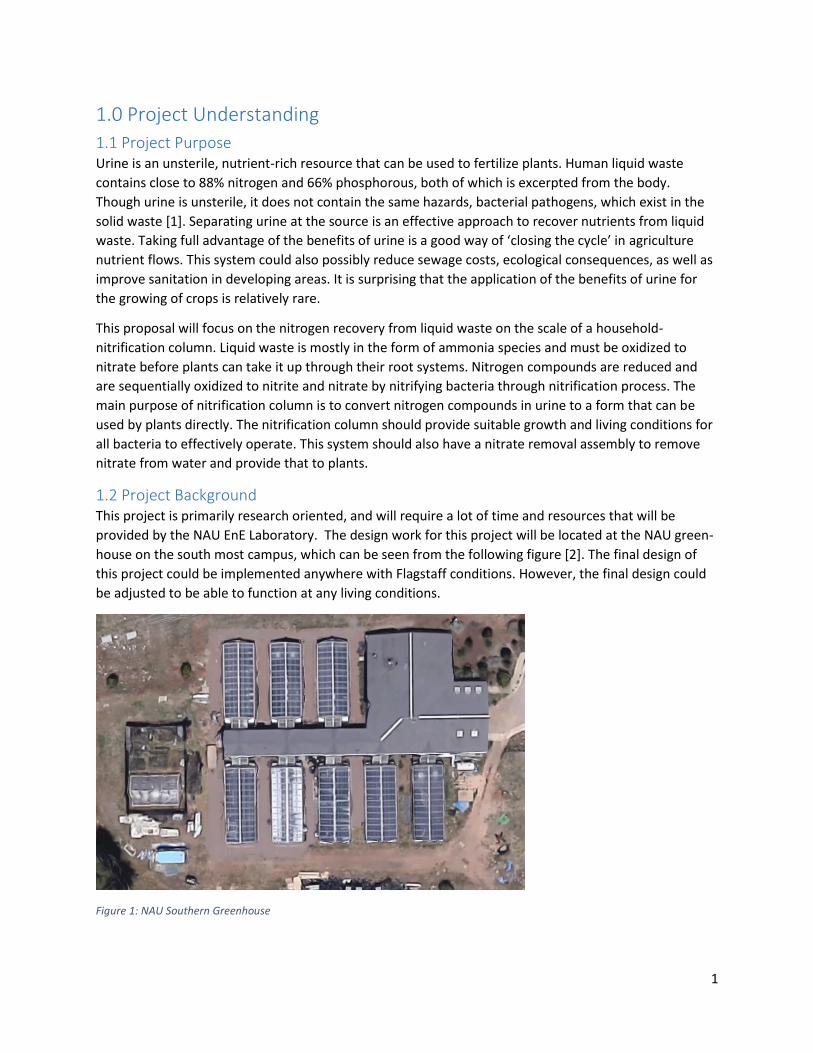
1.2 Project Background This project is primarily research oriented, and will require a lot of time and resources that will be
provided by the NAU EnE Laboratory. The design work for this project will be located at the NAU green-
house on the south most campus, which can be seen from the following figure [2]. The final design of
this project could be implemented anywhere with Flagstaff conditions. However, the final design could
be adjusted to be able to function at any living conditions.
Figure 1: NAU Southern Greenhouse
2
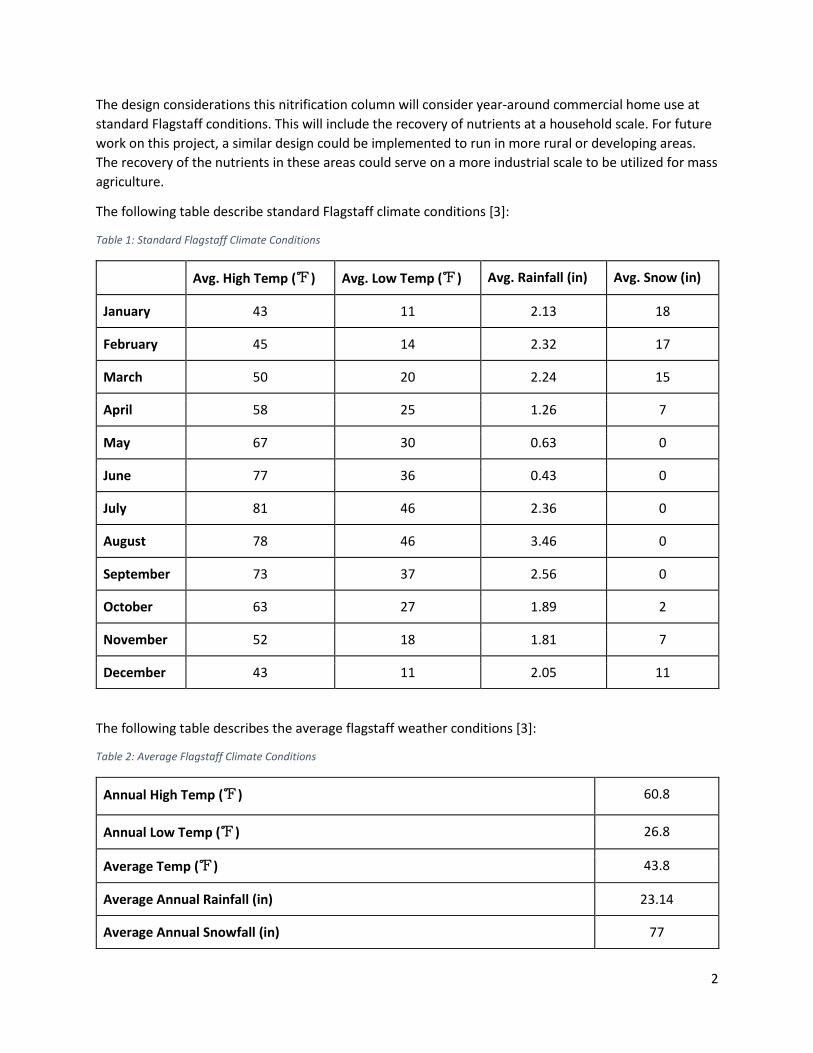
The design considerations this nitrification column will consider year-around commercial home use at
standard Flagstaff conditions. This will include the recovery of nutrients at a household scale. For future
work on this project, a similar design could be implemented to run in more rural or developing areas.
The recovery of the nutrients in these areas could serve on a more industrial scale to be utilized for mass
agriculture.
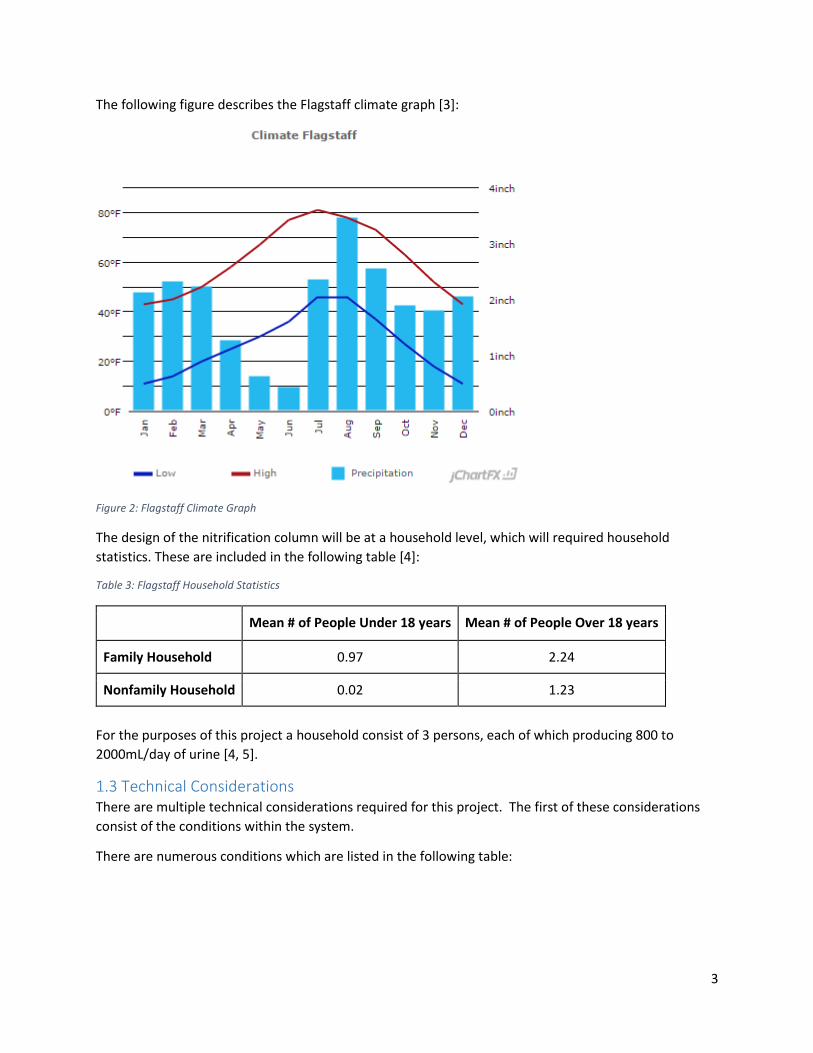
The following table describe standard Flagstaff climate conditions [3]:
Table 1: Standard Flagstaff Climate Conditions
Avg. High Temp (℉) Avg. Low Temp (℉) Avg. Rainfall (in) Avg. Snow (in)
January 43 11 2.13 18
February 45 14 2.32 17
March 50 20 2.24 15
April 58 25 1.26 7
May 67 30 0.63 0
June 77 36 0.43 0
July 81 46 2.36 0
August 78 46 3.46 0
September 73 37 2.56 0
October 63 27 1.89 2
November 52 18 1.81 7
December 43 11 2.05 11
The following table describes the average flagstaff weather conditions [3]:
Table 2: Average Flagstaff Climate Conditions
Annual High Temp (℉) 60.8
Annual Low Temp (℉) 26.8
Average Temp (℉) 43.8
Average Annual Rainfall (in) 23.14
Average Annual Snowfall (in) 77
3
The following figure describes the Flagstaff climate graph [3]:
Figure 2: Flagstaff Climate Graph
The design of the nitrification column will be at a household level, which will required household
statistics. These are included in the following table [4]:
Table 3: Flagstaff Household Statistics
Mean # of People Under 18 years Mean # of People Over 18 years
Family Household 0.97 2.24
Nonfamily Household 0.02 1.23
For the purposes of this project a household consist of 3 persons, each of which producing 800 to
2000mL/day of urine [4, 5].
1.3 Technical Considerations There are multiple technical considerations required for this project. The first of these considerations
consist of the conditions within the system.
There are numerous conditions which are listed in the following table:
4
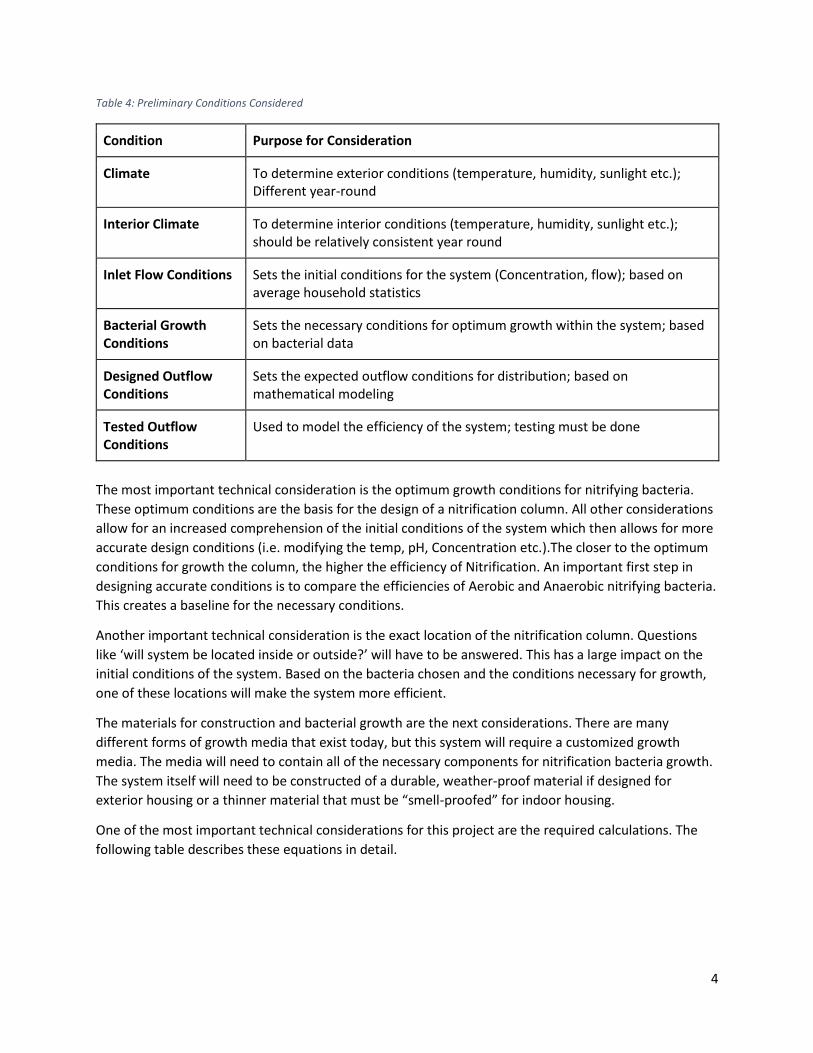
Table 4: Preliminary Conditions Considered
Condition Purpose for Consideration
Climate To determine exterior conditions (temperature, humidity, sunlight etc.); Different year-round
Interior Climate To determine interior conditions (temperature, humidity, sunlight etc.); should be relatively consistent year round
Inlet Flow Conditions Sets the initial conditions for the system (Concentration, flow); based on average household statistics
Bacterial Growth Conditions
Sets the necessary conditions for optimum growth within the system; based on bacterial data
Designed Outflow Conditions
Sets the expected outflow conditions for distribution; based on mathematical modeling
Tested Outflow Conditions
Used to model the efficiency of the system; testing must be done
The most important technical consideration is the optimum growth conditions for nitrifying bacteria.
These optimum conditions are the basis for the design of a nitrification column. All other considerations
allow for an increased comprehension of the initial conditions of the system which then allows for more
accurate design conditions (i.e. modifying the temp, pH, Concentration etc.).The closer to the optimum
conditions for growth the column, the higher the efficiency of Nitrification. An important first step in
designing accurate conditions is to compare the efficiencies of Aerobic and Anaerobic nitrifying bacteria.
This creates a baseline for the necessary conditions.
Another important technical consideration is the exact location of the nitrification column. Questions
like ‘will system be located inside or outside?’ will have to be answered. This has a large impact on the
initial conditions of the system. Based on the bacteria chosen and the conditions necessary for growth,
one of these locations will make the system more efficient.
The materials for construction and bacterial growth are the next considerations. There are many
different forms of growth media that exist today, but this system will require a customized growth
media. The media will need to contain all of the necessary components for nitrification bacteria growth.
The system itself will need to be constructed of a durable, weather-proof material if designed for
exterior housing or a thinner material that must be “smell-proofed” for indoor housing.
One of the most important technical considerations for this project are the required calculations. The
following table describes these equations in detail.
5
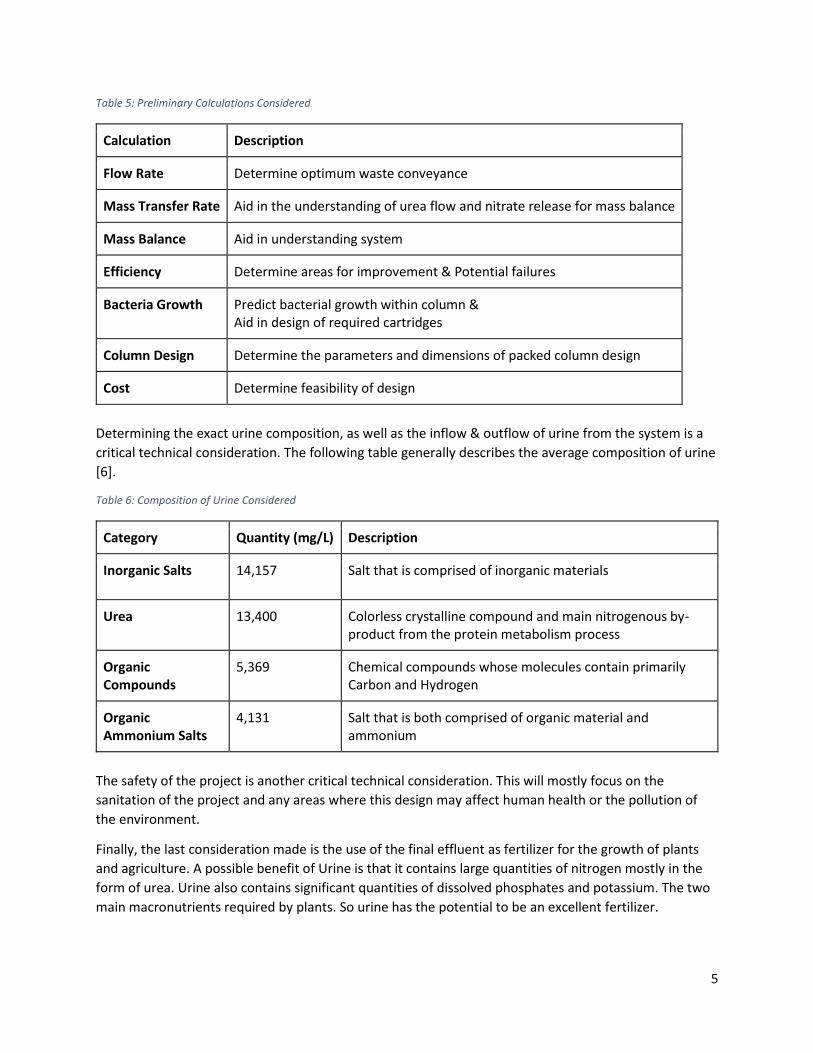
Table 5: Preliminary Calculations Considered
Calculation Description
Flow Rate Determine optimum waste conveyance
Mass Transfer Rate Aid in the understanding of urea flow and nitrate release for mass balance
Mass Balance Aid in understanding system
Efficiency Determine areas for improvement & Potential failures
Bacteria Growth Predict bacterial growth within column & Aid in design of required cartridges
Column Design Determine the parameters and dimensions of packed column design
Cost Determine feasibility of design
Determining the exact urine composition, as well as the inflow & outflow of urine from the system is a
critical technical consideration. The following table generally describes the average composition of urine
[6].
Table 6: Composition of Urine Considered
Category Quantity (mg/L) Description
Inorganic Salts 14,157 Salt that is comprised of inorganic materials
Urea 13,400 Colorless crystalline compound and main nitrogenous by- product from the protein metabolism process
Organic Compounds
5,369 Chemical compounds whose molecules contain primarily Carbon and Hydrogen
Organic Ammonium Salts
4,131 Salt that is both comprised of organic material and ammonium
The safety of the project is another critical technical consideration. This will mostly focus on the
sanitation of the project and any areas where this design may affect human health or the pollution of
the environment.
Finally, the last consideration made is the use of the final effluent as fertilizer for the growth of plants
and agriculture. A possible benefit of Urine is that it contains large quantities of nitrogen mostly in the
form of urea. Urine also contains significant quantities of dissolved phosphates and potassium. The two
main macronutrients required by plants. So urine has the potential to be an excellent fertilizer.
6
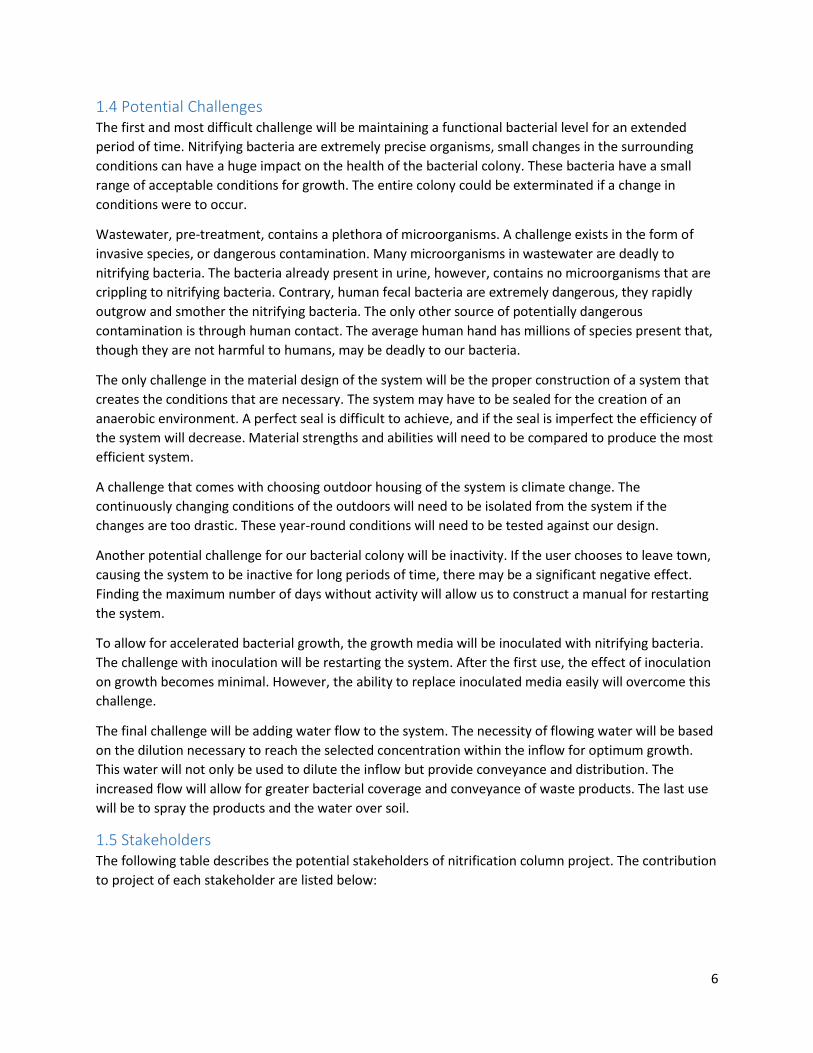
1.4 Potential Challenges The first and most difficult challenge will be maintaining a functional bacterial level for an extended
period of time. Nitrifying bacteria are extremely precise organisms, small changes in the surrounding
conditions can have a huge impact on the health of the bacterial colony. These bacteria have a small
range of acceptable conditions for growth. The entire colony could be exterminated if a change in
conditions were to occur.
Wastewater, pre-treatment, contains a plethora of microorganisms. A challenge exists in the form of
invasive species, or dangerous contamination. Many microorganisms in wastewater are deadly to
nitrifying bacteria. The bacteria already present in urine, however, contains no microorganisms that are
crippling to nitrifying bacteria. Contrary, human fecal bacteria are extremely dangerous, they rapidly
outgrow and smother the nitrifying bacteria. The only other source of potentially dangerous
contamination is through human contact. The average human hand has millions of species present that,
though they are not harmful to humans, may be deadly to our bacteria.
The only challenge in the material design of the system will be the proper construction of a system that
creates the conditions that are necessary. The system may have to be sealed for the creation of an
anaerobic environment. A perfect seal is difficult to achieve, and if the seal is imperfect the efficiency of
the system will decrease. Material strengths and abilities will need to be compared to produce the most
efficient system.
A challenge that comes with choosing outdoor housing of the system is climate change. The
continuously changing conditions of the outdoors will need to be isolated from the system if the
changes are too drastic. These year-round conditions will need to be tested against our design.
Another potential challenge for our bacterial colony will be inactivity. If the user chooses to leave town,
causing the system to be inactive for long periods of time, there may be a significant negative effect.
Finding the maximum number of days without activity will allow us to construct a manual for restarting
the system.
To allow for accelerated bacterial growth, the growth media will be inoculated with nitrifying bacteria.
The challenge with inoculation will be restarting the system. After the first use, the effect of inoculation
on growth becomes minimal. However, the ability to replace inoculated media easily will overcome this
challenge.
The final challenge will be adding water flow to the system. The necessity of flowing water will be based
on the dilution necessary to reach the selected concentration within the inflow for optimum growth.
This water will not only be used to dilute the inflow but provide conveyance and distribution. The
increased flow will allow for greater bacterial coverage and conveyance of waste products. The last use
will be to spray the products and the water over soil.
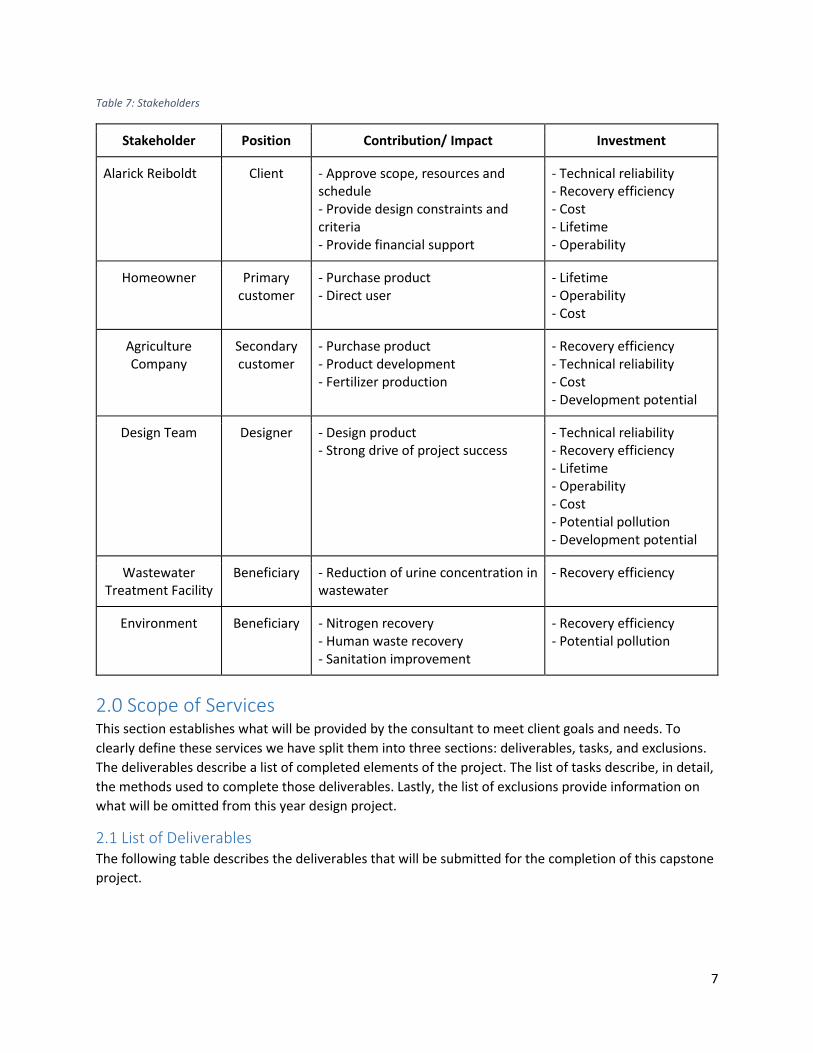
1.5 Stakeholders The following table describes the potential stakeholders of nitrification column project. The contribution
to project of each stakeholder are listed below:
7
Table 7: Stakeholders
Stakeholder Position Contribution/ Impact Investment
Alarick Reiboldt Client - Approve scope, resources and schedule - Provide design constraints and criteria - Provide financial support
- Technical reliability - Recovery efficiency - Cost - Lifetime - Operability
Homeowner Primary customer
- Purchase product - Direct user
- Lifetime - Operability - Cost
Agriculture Company
Secondary customer
- Purchase product - Product development - Fertilizer production
- Recovery efficiency - Technical reliability - Cost - Development potential
Design Team Designer - Design product - Strong drive of project success
- Technical reliability - Recovery efficiency - Lifetime - Operability - Cost - Potential pollution - Development potential
Wastewater Treatment Facility
Beneficiary - Reduction of urine concentration in wastewater
- Recovery efficiency
Environment Beneficiary - Nitrogen recovery - Human waste recovery - Sanitation improvement
- Recovery efficiency - Potential pollution
2.0 Scope of Services This section establishes what will be provided by the consultant to meet client goals and needs. To
clearly define these services we have split them into three sections: deliverables, tasks, and exclusions.
The deliverables describe a list of completed elements of the project. The list of tasks describe, in detail,
the methods used to complete those deliverables. Lastly, the list of exclusions provide information on
what will be omitted from this year design project.
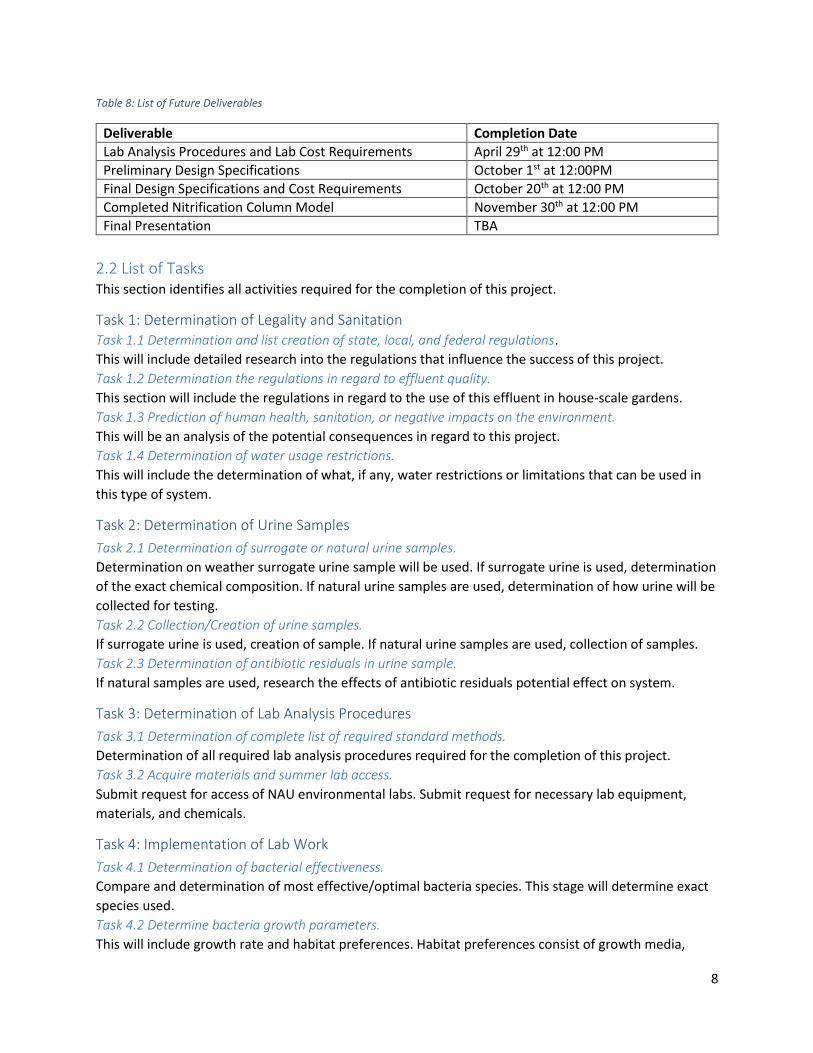
2.1 List of Deliverables The following table describes the deliverables that will be submitted for the completion of this capstone
project.
8
Table 8: List of Future Deliverables
Deliverable Completion Date
Lab Analysis Procedures and Lab Cost Requirements April 29th at 12:00 PM
Preliminary Design Specifications October 1st at 12:00PM
Final Design Specifications and Cost Requirements October 20th at 12:00 PM
Completed Nitrification Column Model November 30th at 12:00 PM
Final Presentation TBA
2.2 List of Tasks This section identifies all activities required for the completion of this project.
Task 1: Determination of Legality and Sanitation Task 1.1 Determination and list creation of state, local, and federal regulations.
This will include detailed research into the regulations that influence the success of this project.
Task 1.2 Determination the regulations in regard to effluent quality.
This section will include the regulations in regard to the use of this effluent in house-scale gardens.
Task 1.3 Prediction of human health, sanitation, or negative impacts on the environment.
This will be an analysis of the potential consequences in regard to this project.
Task 1.4 Determination of water usage restrictions.
This will include the determination of what, if any, water restrictions or limitations that can be used in
this type of system.
Task 2: Determination of Urine Samples
Task 2.1 Determination of surrogate or natural urine samples.
Determination on weather surrogate urine sample will be used. If surrogate urine is used, determination
of the exact chemical composition. If natural urine samples are used, determination of how urine will be
collected for testing.
Task 2.2 Collection/Creation of urine samples.
If surrogate urine is used, creation of sample. If natural urine samples are used, collection of samples.
Task 2.3 Determination of antibiotic residuals in urine sample.
If natural samples are used, research the effects of antibiotic residuals potential effect on system.
Task 3: Determination of Lab Analysis Procedures
Task 3.1 Determination of complete list of required standard methods.
Determination of all required lab analysis procedures required for the completion of this project.
Task 3.2 Acquire materials and summer lab access.
Submit request for access of NAU environmental labs. Submit request for necessary lab equipment,
materials, and chemicals.
Task 4: Implementation of Lab Work
Task 4.1 Determination of bacterial effectiveness.
Compare and determination of most effective/optimal bacteria species. This stage will determine exact
species used.
Task 4.2 Determine bacteria growth parameters.
This will include growth rate and habitat preferences. Habitat preferences consist of growth media,

9
inside verses outside, and anaerobic verses aerobic.
Task 4.3 Determination of antibiotics effect on bacterial growth if they exist in urine sample.
Record any effect antibiotics in urine samples will have on the success and effectiveness of the biological
system.
Task 5: Preincubated Cartridge Analysis Task 5.1 Determination of preincubated cartridge use.
This will include research on the feasibility, parameters, and requirements of the use of preincubated
cartridge in the system.
Task 5.2 Creation of preincubated cartridge design specifications.
Create design specifications of preincubated cartridge if determined to be feasible.
Task 5.3 Construction of preincubated cartridge.
This will include the construction of the preincubated cartridge.
Task 5.4 Testing of preincubated cartridge.
This will include initiating the beginning stages of ‘testing’ of the design. The preincubated cartridge will
be ‘set-up’ and running. All results from this will be recorded in detail.
Task 6: Design Concept Generation and Selection
Task 6.1 Design Concept Generation
Generation all multiple design alternatives.
Task 6.2 Design Selection
Follow the engineering design cycle and select design. Consideration of viability of growth media
composting. Consideration of effectiveness and feasibility of all alternatives.
Task 6.3 Submit preliminary design.
Submit preliminary design to client and technical advisor and request feedback.
Task 7: Conduction of Field Evaluation Conduction of analysis on environmental conditions of final design location.
Task 8: Conduction of Plant Evaluation Task 8.1 Determination of the feasibility of edible plants.
Research the effects this system could have on edible plants. Determine the feasibility of edible plants in
the system.
Task 8.2 Determination of the urine dilution required in system.
The system will require water dilution or the direct treated urine would burn plant roots, and be
counterproductive.
Task 9: Preformation of Design Calculations
Task 9.1 Determination of the physical dimensions of column design model.
Determination of optimum waste conveyance flow rate. Preformation of required mass transfer rate,
and mass balance calculations.
Task 9.2 Determine the overall efficiency of the system.
Task 10: Determination of Final Design Task 10.1 Determination of materials needed for column.
This will include all a list of all required materials and a cost analysis of those materials.
10
Task 10.2 Determination of column size and dimensions.
Considerations of previously determine environmental conditions, human sanitation and safety.
Task 10.3 Final design will be submittal to technical advisor and client.
This will include all information about the model aspect of the design, including final specifications and
cost.
Task 10.4 Feedback Consideration and Last Minute Adjustments
Consideration of feedback and preformation of minor adjustments to final design.
Task 11: Construction of Model Structure Construction of model structure based on final design specifications.
Task 12: Conduction of Final Testing Evaluation of effectiveness of final structure. Determination of the likelihood of salt buildup due to
evaporation.
Task 13: Project Management Project management will be completed throughout the entirety of project. This will include scheduling,
final report submittal, determination of possible future work and potential for design alternatives, final
presentation preparation, and website creation.
2.3 List of Exclusions This section identifies all aspects of this project that are excluded.
Exclusion 1: Separation of Solid and Liquid Waste The design of this system will only consider liquid waste fragments. This system will not consider any
solid waste fragments, or the separation of the two types of waste.
Exclusion 2: Design for Nutrient Collection The only nutrient that this system will be design to collect and utilize will be Nitrate.
Exclusion 3: Utility Scale The scale of this project will only be considered at a household with home gardens. This will exclude
utility scale projects and mass agriculture.
Exclusion 4: Design Model Though this project will be designing for a household scale system, the only construction that will take
place during the entirety of this project will be at a design model level.
3.0 Scheduling The schedule that was created to describe the task list with durations, start/end dates, and some
important milestones can be found in section 5.1 of the Appendix of this report. The figure describes the
GanttChart create to manage this project. The critical path is identified to establish the inter-task
relationships, this project includes the finish-to-start, start-to-start, and finish-to-finish relationships.
The schedule created is achievable. It does not overcommit or underperform resources. It
communicated in a clear a concise manner the timeline of evens that will be completed. This schedule
was designed to be flexible as well, to ensure the success of this project.
11
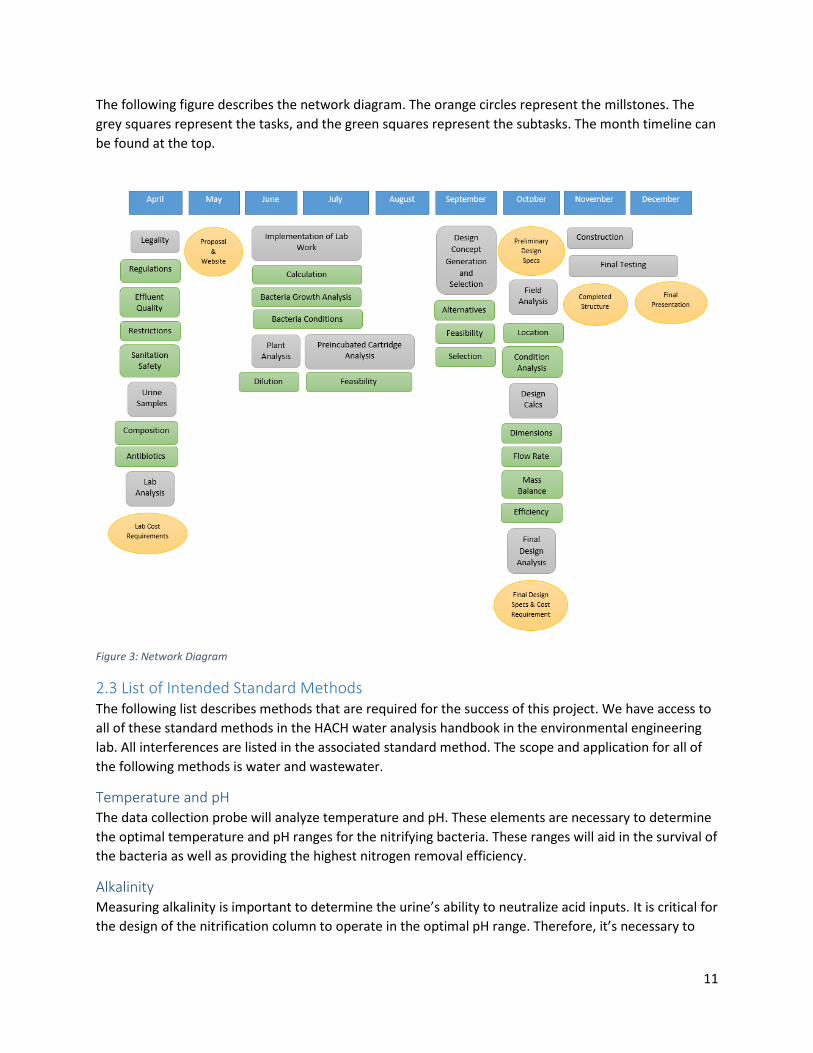
The following figure describes the network diagram. The orange circles represent the millstones. The
grey squares represent the tasks, and the green squares represent the subtasks. The month timeline can
be found at the top.
Figure 3: Network Diagram
2.3 List of Intended Standard Methods The following list describes methods that are required for the success of this project. We have access to
all of these standard methods in the HACH water analysis handbook in the environmental engineering
lab. All interferences are listed in the associated standard method. The scope and application for all of
the following methods is water and wastewater.
Temperature and pH The data collection probe will analyze temperature and pH. These elements are necessary to determine
the optimal temperature and pH ranges for the nitrifying bacteria. These ranges will aid in the survival of
the bacteria as well as providing the highest nitrogen removal efficiency.
Alkalinity Measuring alkalinity is important to determine the urine’s ability to neutralize acid inputs. It is critical for
the design of the nitrification column to operate in the optimal pH range. Therefore, it’s necessary to
12
determine the buffer range that all the nitrifying bacteria can keep alive. It is also necessary to
determine any possible pH fluctuations that can occur in the system.
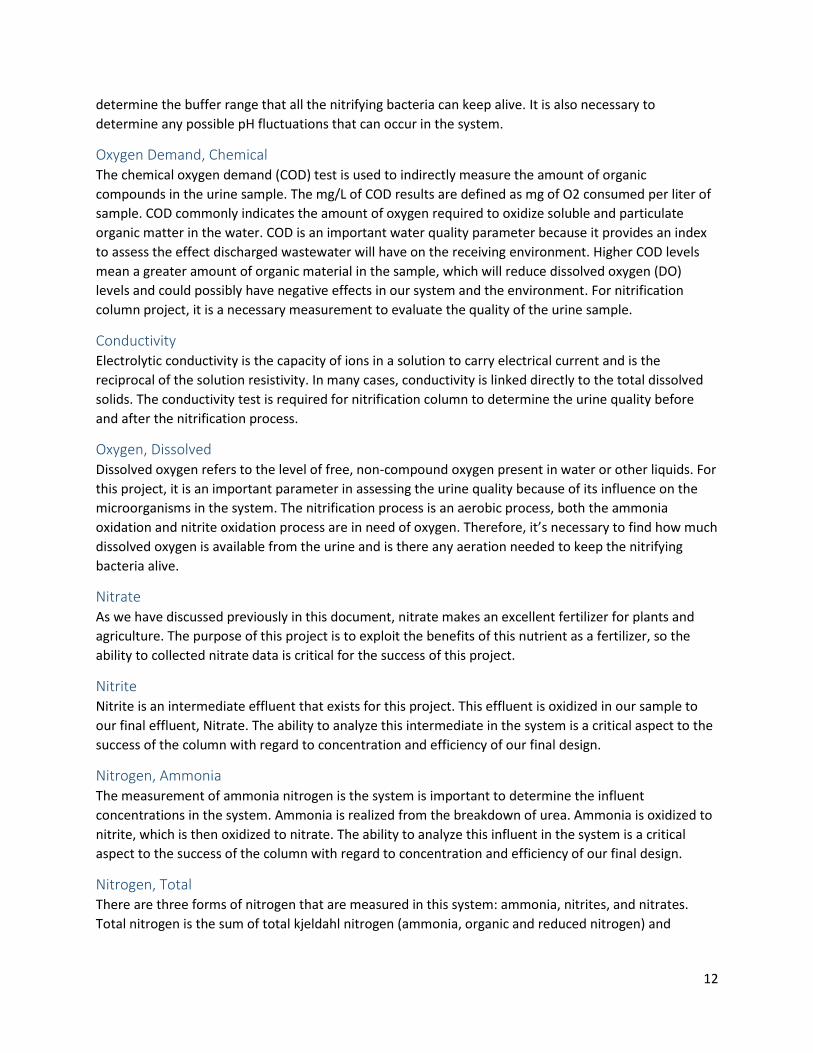
Oxygen Demand, Chemical The chemical oxygen demand (COD) test is used to indirectly measure the amount of organic
compounds in the urine sample. The mg/L of COD results are defined as mg of O2 consumed per liter of
sample. COD commonly indicates the amount of oxygen required to oxidize soluble and particulate
organic matter in the water. COD is an important water quality parameter because it provides an index
to assess the effect discharged wastewater will have on the receiving environment. Higher COD levels
mean a greater amount of organic material in the sample, which will reduce dissolved oxygen (DO)
levels and could possibly have negative effects in our system and the environment. For nitrification
column project, it is a necessary measurement to evaluate the quality of the urine sample.
Conductivity Electrolytic conductivity is the capacity of ions in a solution to carry electrical current and is the
reciprocal of the solution resistivity. In many cases, conductivity is linked directly to the total dissolved
solids. The conductivity test is required for nitrification column to determine the urine quality before
and after the nitrification process.
Oxygen, Dissolved Dissolved oxygen refers to the level of free, non-compound oxygen present in water or other liquids. For
this project, it is an important parameter in assessing the urine quality because of its influence on the
microorganisms in the system. The nitrification process is an aerobic process, both the ammonia
oxidation and nitrite oxidation process are in need of oxygen. Therefore, it’s necessary to find how much
dissolved oxygen is available from the urine and is there any aeration needed to keep the nitrifying
bacteria alive.
Nitrate As we have discussed previously in this document, nitrate makes an excellent fertilizer for plants and
agriculture. The purpose of this project is to exploit the benefits of this nutrient as a fertilizer, so the
ability to collected nitrate data is critical for the success of this project.
Nitrite Nitrite is an intermediate effluent that exists for this project. This effluent is oxidized in our sample to
our final effluent, Nitrate. The ability to analyze this intermediate in the system is a critical aspect to the
success of the column with regard to concentration and efficiency of our final design.
Nitrogen, Ammonia The measurement of ammonia nitrogen is the system is important to determine the influent
concentrations in the system. Ammonia is realized from the breakdown of urea. Ammonia is oxidized to
nitrite, which is then oxidized to nitrate. The ability to analyze this influent in the system is a critical
aspect to the success of the column with regard to concentration and efficiency of our final design.
Nitrogen, Total There are three forms of nitrogen that are measured in this system: ammonia, nitrites, and nitrates.
Total nitrogen is the sum of total kjeldahl nitrogen (ammonia, organic and reduced nitrogen) and
13
nitrate-nitrite. Because the design requires the application of nitrification, it is important to determine
the sum of the nitrogen in the system.
Phosphorus, Total This standard method is not critical for our project. This would be an optional method that would
provide insight into another nutrient, phosphorus that this system will produce.
Salinity Urine has a lot of dissolved salts in its composition. The exact measure of the concentration of these
salts will provide important information in regard to how this salt will build up in the system.
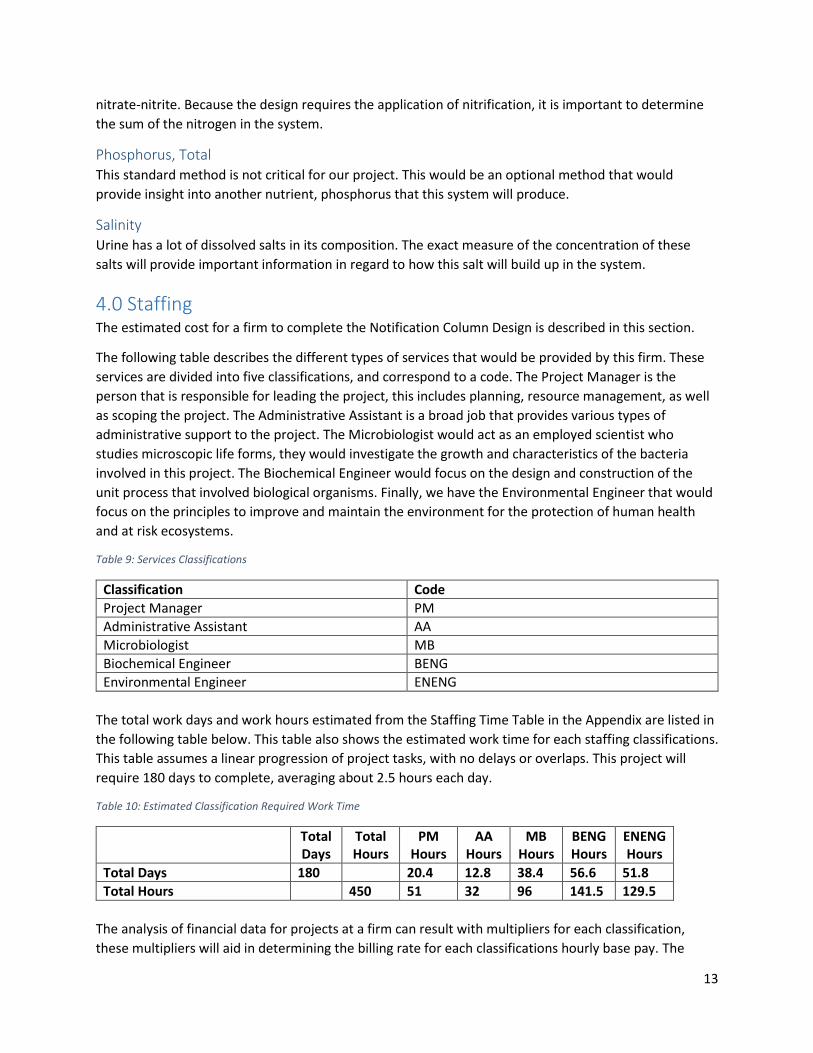
4.0 Staffing The estimated cost for a firm to complete the Notification Column Design is described in this section.
The following table describes the different types of services that would be provided by this firm. These
services are divided into five classifications, and correspond to a code. The Project Manager is the
person that is responsible for leading the project, this includes planning, resource management, as well
as scoping the project. The Administrative Assistant is a broad job that provides various types of
administrative support to the project. The Microbiologist would act as an employed scientist who
studies microscopic life forms, they would investigate the growth and characteristics of the bacteria
involved in this project. The Biochemical Engineer would focus on the design and construction of the
unit process that involved biological organisms. Finally, we have the Environmental Engineer that would
focus on the principles to improve and maintain the environment for the protection of human health
and at risk ecosystems.
Table 9: Services Classifications
Classification Code
Project Manager PM
Administrative Assistant AA
Microbiologist MB
Biochemical Engineer BENG
Environmental Engineer ENENG
The total work days and work hours estimated from the Staffing Time Table in the Appendix are listed in
the following table below. This table also shows the estimated work time for each staffing classifications.
This table assumes a linear progression of project tasks, with no delays or overlaps. This project will
require 180 days to complete, averaging about 2.5 hours each day.
Table 10: Estimated Classification Required Work Time
Total Days
Total Hours
PM Hours
AA Hours
MB Hours
BENG Hours
ENENG Hours
Total Days 180 20.4 12.8 38.4 56.6 51.8
Total Hours 450 51 32 96 141.5 129.5
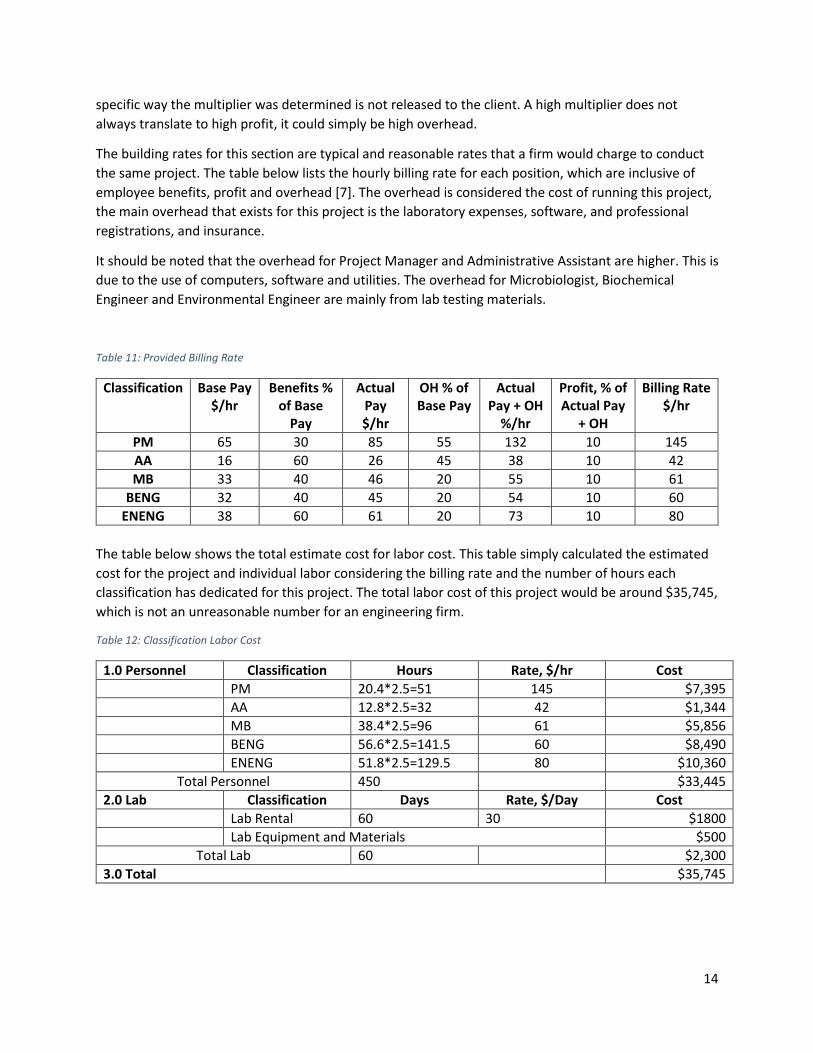
The analysis of financial data for projects at a firm can result with multipliers for each classification,
these multipliers will aid in determining the billing rate for each classifications hourly base pay. The
14
specific way the multiplier was determined is not released to the client. A high multiplier does not
always translate to high profit, it could simply be high overhead.
The building rates for this section are typical and reasonable rates that a firm would charge to conduct
the same project. The table below lists the hourly billing rate for each position, which are inclusive of
employee benefits, profit and overhead [7]. The overhead is considered the cost of running this project,
the main overhead that exists for this project is the laboratory expenses, software, and professional
registrations, and insurance.
It should be noted that the overhead for Project Manager and Administrative Assistant are higher. This is
due to the use of computers, software and utilities. The overhead for Microbiologist, Biochemical
Engineer and Environmental Engineer are mainly from lab testing materials.
Table 11: Provided Billing Rate
Classification Base Pay $/hr
Benefits % of Base
Pay
Actual Pay $/hr
OH % of Base Pay
Actual Pay + OH
%/hr
Profit, % of Actual Pay
+ OH
Billing Rate $/hr
PM 65 30 85 55 132 10 145
AA 16 60 26 45 38 10 42
MB 33 40 46 20 55 10 61
BENG 32 40 45 20 54 10 60
ENENG 38 60 61 20 73 10 80
The table below shows the total estimate cost for labor cost. This table simply calculated the estimated
cost for the project and individual labor considering the billing rate and the number of hours each
classification has dedicated for this project. The total labor cost of this project would be around $35,745,
which is not an unreasonable number for an engineering firm.
Table 12: Classification Labor Cost
1.0 Personnel Classification Hours Rate, $/hr Cost
PM 20.4*2.5=51 145 $7,395
AA 12.8*2.5=32 42 $1,344
MB 38.4*2.5=96 61 $5,856
BENG 56.6*2.5=141.5 60 $8,490
ENENG 51.8*2.5=129.5 80 $10,360
Total Personnel 450 $33,445
2.0 Lab Classification Days Rate, $/Day Cost
Lab Rental 60 30 $1800
Lab Equipment and Materials $500
Total Lab 60 $2,300
3.0 Total $35,745

15
5.0 Appendix
5.1 Gantt Chart *Please refer to the attached Project Manager document.
16
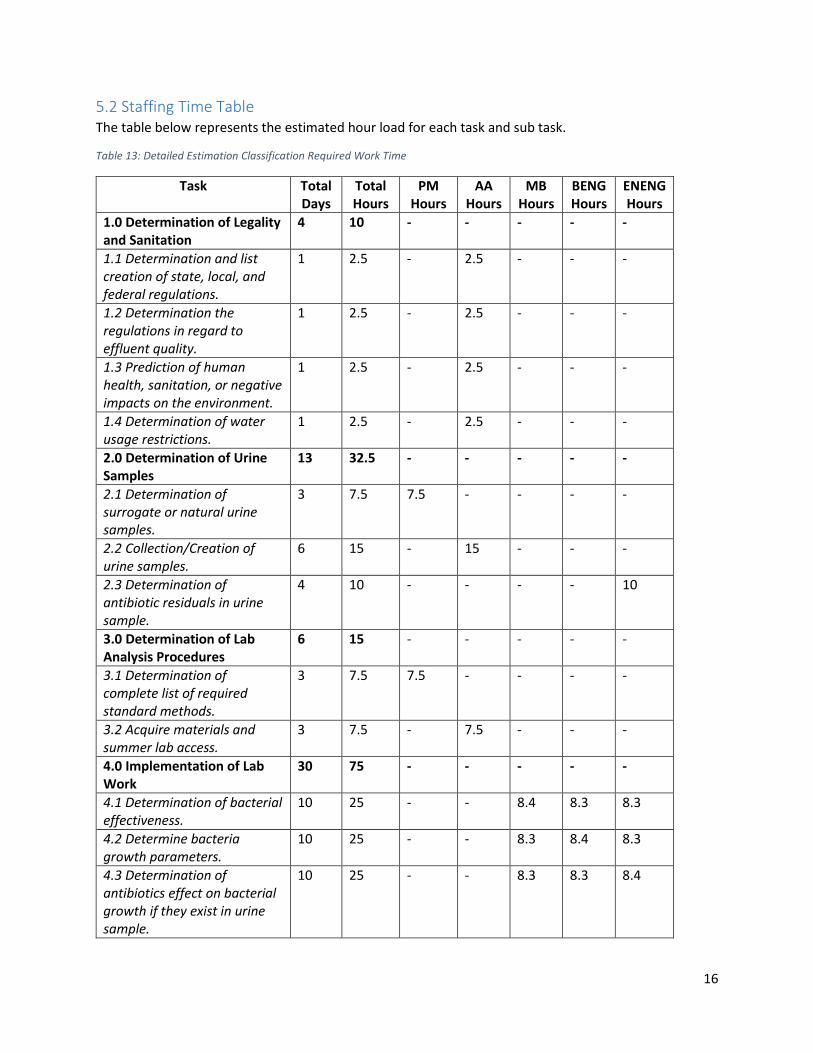
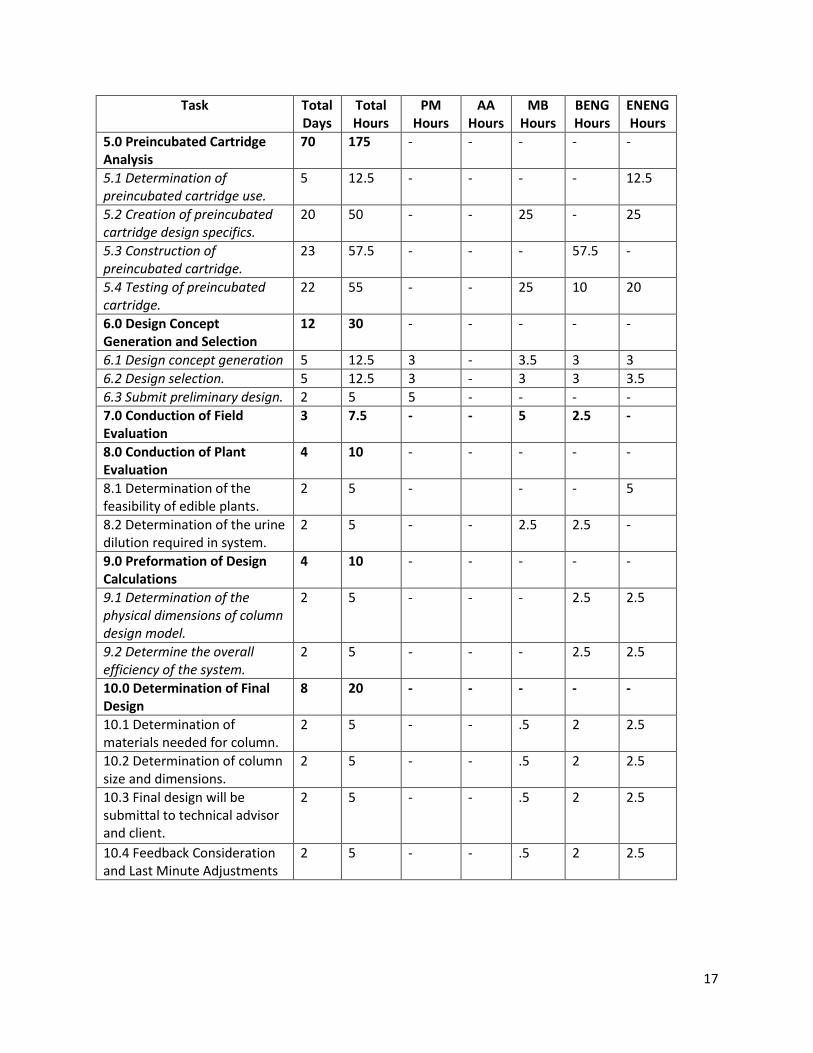
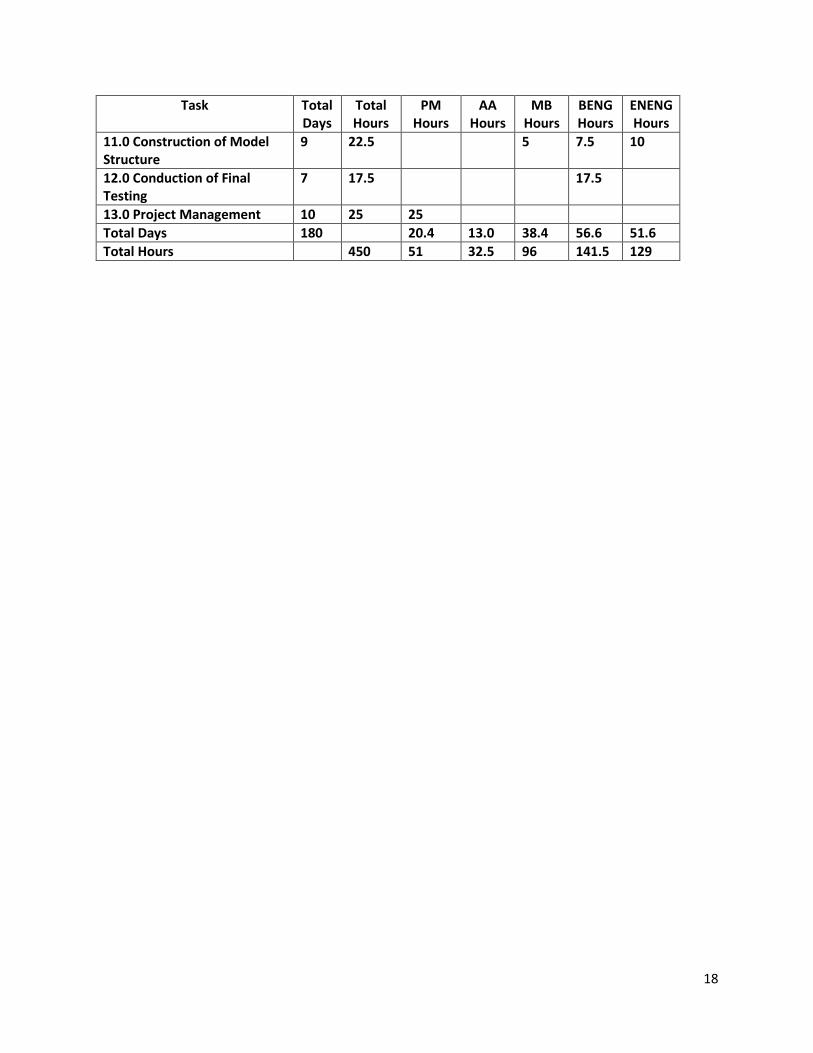
5.2 Staffing Time Table The table below represents the estimated hour load for each task and sub task.
Table 13: Detailed Estimation Classification Required Work Time
Task Total Days
Total Hours
PM Hours
AA Hours
MB Hours
BENG Hours
ENENG Hours
1.0 Determination of Legality and Sanitation
4 10 - - - - -
1.1 Determination and list creation of state, local, and federal regulations.
1 2.5 - 2.5 - - -
1.2 Determination the regulations in regard to effluent quality.
1 2.5 - 2.5 - - -
1.3 Prediction of human health, sanitation, or negative impacts on the environment.
1 2.5 - 2.5 - - -
1.4 Determination of water usage restrictions.
1 2.5 - 2.5 - - -
2.0 Determination of Urine Samples
13 32.5 - - - - -
2.1 Determination of surrogate or natural urine samples.
3 7.5 7.5 - - - -
2.2 Collection/Creation of urine samples.
6 15 - 15 - - -
2.3 Determination of antibiotic residuals in urine sample.
4 10 - - - - 10
3.0 Determination of Lab Analysis Procedures
6 15 - - - - -
3.1 Determination of complete list of required standard methods.
3 7.5 7.5 - - - -
3.2 Acquire materials and summer lab access.
3 7.5 - 7.5 - - -
4.0 Implementation of Lab Work
30 75 - - - - -
4.1 Determination of bacterial effectiveness.
10 25 - - 8.4 8.3 8.3
4.2 Determine bacteria growth parameters.
10 25 - - 8.3 8.4 8.3
4.3 Determination of antibiotics effect on bacterial growth if they exist in urine sample.
10 25 - - 8.3 8.3 8.4
17
Task Total Days
Total Hours
PM Hours
AA Hours
MB Hours
BENG Hours
ENENG Hours
5.0 Preincubated Cartridge Analysis
70 175 - - - - -
5.1 Determination of preincubated cartridge use.
5 12.5 - - - - 12.5
5.2 Creation of preincubated cartridge design specifics.
20 50 - - 25 - 25
5.3 Construction of preincubated cartridge.
23 57.5 - - - 57.5 -
5.4 Testing of preincubated cartridge.
22 55 - - 25 10 20
6.0 Design Concept Generation and Selection
12 30 - - - - -
6.1 Design concept generation 5 12.5 3 - 3.5 3 3
6.2 Design selection. 5 12.5 3 - 3 3 3.5
6.3 Submit preliminary design. 2 5 5 - - - -
7.0 Conduction of Field Evaluation
3 7.5 - - 5 2.5 -
8.0 Conduction of Plant Evaluation
4 10 - - - - -
8.1 Determination of the feasibility of edible plants.
2 5 - - - 5
8.2 Determination of the urine dilution required in system.
2 5 - - 2.5 2.5 -
9.0 Preformation of Design Calculations
4 10 - - - - -
9.1 Determination of the physical dimensions of column design model.
2 5 - - - 2.5 2.5
9.2 Determine the overall efficiency of the system.
2 5 - - - 2.5 2.5
10.0 Determination of Final Design
8 20 - - - - -
10.1 Determination of materials needed for column.
2 5 - - .5 2 2.5
10.2 Determination of column size and dimensions.
2 5 - - .5 2 2.5
10.3 Final design will be submittal to technical advisor and client.
2 5 - - .5 2 2.5
10.4 Feedback Consideration and Last Minute Adjustments
2 5 - - .5 2 2.5
18
Task Total Days
Total Hours
PM Hours
AA Hours
MB Hours
BENG Hours
ENENG Hours
11.0 Construction of Model Structure
9 22.5 5 7.5 10
12.0 Conduction of Final Testing
7 17.5 17.5
13.0 Project Management 10 25 25
Total Days 180 20.4 13.0 38.4 56.6 51.6
Total Hours 450 51 32.5 96 141.5 129
19
6.0 References [1] Fumasoli, A., Etter, B., Sterkele, B., Morgenroth, E., & Udert, K. M. (2016). Operating a pilot-scale
nitrification/distillation plant for complete nutrient recovery from urine.Water Science & Technology,
73(1), 215-222. doi:10.2166/wst.2015.485
[2] Google.com, "Google Maps", 2016. [Online]. Available:
https://www.google.com/maps/@35.1767654,-111.6524661,118m/data=!3m1!1e3. [Accessed: 16- Feb-
2016].
[3]U. Data, "Climate Flagstaff - Arizona and Weather averages Flagstaff", Usclimatedata.com, 2016.
[Online]. Available: http://www.usclimatedata.com/climate/flagstaff/arizona/united-states/usaz0068.
[Accessed: 16- Feb- 2016].
[4] Census.gov, 2016. [Online]. Available: https://www.census.gov/population/socdemo/hh-
fam/cps2002/tabAVG1.pdf. [Accessed: 09- Feb- 2016].
[5] a. Updated by: David C. Dugdale, "Urine 24-hour volume: MedlinePlus Medical Encyclopedia",
Nlm.nih.gov, 2016. [Online]. Available: https://www.nlm.nih.gov/medlineplus/ency/article/003425.htm.
[Accessed: 09- Feb- 2016].
[6] D. Putnam, "COMPOSITION AND CONCENTRATIVE PROPERTIES OF HUMAN URINE", NASA.gov, 2016.
[Online]. Available: http://ntrs.nasa.gov/archive/nasa/casi.ntrs.nasa.gov/19710023044.pdf. [Accessed:
09- Feb- 2016].
[7] United States Department of Labor, "May 2015 State Occupational Employment and Wage
Estimates," U.S. Bureau of Labor Statistics, 30 March 2016. [Online]. Available:
http://www.bls.gov/oes/current/oes_az.htm. [Accessed 31 March 2016].
Recommended